Attached files
| file | filename |
|---|---|
| EX-32.1 - EX-32.1 - Snap Inc | snap-ex321_6.htm |
| EX-31.2 - EX-31.2 - Snap Inc | snap-ex312_7.htm |
| EX-31.1 - EX-31.1 - Snap Inc | snap-ex311_8.htm |
| EX-23.1 - EX-23.1 - Snap Inc | snap-ex231_721.htm |
| EX-21.1 - EX-21.1 - Snap Inc | snap-ex211_556.htm |
| EX-10.29 - EX-10.29 - Snap Inc | snap-ex1029_720.htm |
| EX-10.28 - EX-10.28 - Snap Inc | snap-ex1028_719.htm |
| EX-10.26 - EX-10.26 - Snap Inc | snap-ex1026_798.htm |
UNITED STATES
SECURITIES AND EXCHANGE COMMISSION
Washington, D.C. 20549
FORM 10-K
(Mark One)
|
☒ |
ANNUAL REPORT PURSUANT TO SECTION 13 OR 15(d) OF THE SECURITIES EXCHANGE ACT OF 1934 |
For the fiscal year ended December 31, 2017
OR
|
☐ |
TRANSITION REPORT PURSUANT TO SECTION 13 OR 15(d) OF THE SECURITIES EXCHANGE ACT OF 1934 FOR THE TRANSITION PERIOD FROM TO |
Commission File Number 001-38017
SNAP INC.
(Exact name of registrant as specified in its charter)
|
Delaware |
45-5452795 |
|
(State or other jurisdiction of incorporation or organization) |
(I.R.S. Employer |
|
63 Market Street, Venice, California 90291 |
|
|
(Address of principal executive offices, including zip code) |
|
(310) 399-3339
(Registrant’s telephone number, including area code)
Securities registered pursuant to Section 12(b) of the Act:
|
Name of each exchange on which registered |
|
|
Class A Common Stock, par value $0.00001 per share |
New York Stock Exchange |
Securities registered pursuant to Section 12(g) of the Act: None
Indicate by check mark if the Registrant is a well-known seasoned issuer, as defined in Rule 405 of the Securities Act. YES ☐ NO ☒
Indicate by check mark if the Registrant is not required to file reports pursuant to Section 13 or 15(d) of the Act. YES ☐ NO ☒
Indicate by check mark whether the Registrant: (1) has filed all reports required to be filed by Section 13 or 15(d) of the Securities Exchange Act of 1934 during the preceding 12 months (or for such shorter period that the Registrant was required to file such reports), and (2) has been subject to such filing requirements for the past 90 days. YES ☒ NO ☐
Indicate by check mark whether the Registrant has submitted electronically and posted on its corporate Website, if any, every Interactive Data File required to be submitted and posted pursuant to Rule 405 of Regulation S-T (§232.405 of this chapter) during the preceding 12 months (or for such shorter period that the Registrant was required to submit and post such files). YES ☒ NO ☐
Indicate by check mark if disclosure of delinquent filers pursuant to Item 405 of Regulation S-K (§229.405) is not contained herein, and will not be contained, to the best of Registrant’s knowledge, in definitive proxy or information statements incorporated by reference in Part III of this Form 10-K or any amendment to this Form 10-K. ☐
Indicate by check mark whether the Registrant is a large accelerated filer, an accelerated filer, a non-accelerated filer, a smaller reporting company, or emerging growth company. See the definition of “large accelerated filer,” “accelerated filer,” “smaller reporting company” and “emerging growth company” in Rule 12b-2 of the Exchange Act. (Check one):
|
Large accelerated filer |
|
☐ |
|
Accelerated filer |
|
☐ |
|
|
|
|
|
|
|
|
|
Non-accelerated filer |
|
☒ (Do not check if a smaller reporting company) |
|
Smaller reporting company |
|
☐ |
|
|
|
|
|
|
|
|
|
|
|
|
|
Emerging growth company |
|
☒ |
If an emerging growth company, indicate by checkmark if the registrant has elected not to use the extended transition period for complying with any new or revised financial accounting standards provided pursuant to Section 13(a) of the Exchange Act. ☒
Indicate by check mark whether the Registrant is a shell company (as defined in Rule 12b-2 of the Exchange Act). YES ☐ NO ☒
The aggregate market value of the voting and non-voting common equity held by non-affiliates of the Registrant, based on the closing price of the shares of Class A common stock on The New York Stock Exchange on June 30, 2017, was $11,487,095,467.
As of January 31, 2018, the registrant had 887,610,964 shares of Class A common stock, 122,808,708 shares of Class B common stock, and 216,615,870 shares of Class C common stock outstanding.
|
|
|
|
|
Page |
|
|
1 |
|||
|
|
2 |
|||
|
|
|
|
|
|
|
|
|
|
|
|
|
Item 1. |
|
|
4 |
|
|
Item 1A. |
|
|
9 |
|
|
Item 1B. |
|
|
36 |
|
|
Item 2. |
|
|
36 |
|
|
Item 3. |
|
|
37 |
|
|
Item 4. |
|
|
37 |
|
|
|
|
|
|
|
|
|
|
|
|
|
|
Item 5. |
|
|
37 |
|
|
Item 6. |
|
|
39 |
|
|
Item 7. |
|
Management’s Discussion and Analysis of Financial Condition and Results of Operations |
|
42 |
|
Item 7A. |
|
|
62 |
|
|
Item 8. |
|
|
63 |
|
|
Item 9. |
|
Changes in and Disagreements With Accountants on Accounting and Financial Disclosure |
|
97 |
|
Item 9A. |
|
|
97 |
|
|
Item 9B. |
|
|
97 |
|
|
|
|
|
|
|
|
|
|
|
|
|
|
Item 10. |
|
|
98 |
|
|
Item 11. |
|
|
104 |
|
|
Item 12. |
|
Security Ownership of Certain Beneficial Owners and Management and Related Stockholder Matters |
|
116 |
|
Item 13. |
|
Certain Relationships and Related Transactions, and Director Independence |
|
118 |
|
Item 14. |
|
|
119 |
|
|
|
|
|
|
|
|
|
|
|
|
|
|
Item 15. |
|
|
120 |
|
|
|
|
|
123 |
|
i
NOTE REGARDING FORWARD-LOOKING STATEMENTS
The following discussion contains forward-looking statements within the meaning of Section 27A of the Securities Act of 1933, as amended, or the Securities Act, and Section 21E of the Securities Exchange Act of 1934, as amended, or the Exchange Act, about us and our industry that involve substantial risks and uncertainties. All statements other than statements of historical facts contained in this Annual Report on Form 10-K, including statements regarding our future results of operations or financial condition, business strategy and plans, and objectives of management for future operations, are forward-looking statements. In some cases, you can identify forward-looking statements because they contain words such as “anticipate,” “believe,” “contemplate,” “continue,” “could,” “estimate,” “expect,” “intend,” “may,” “plan,” “potential,” “predict,” “project,” “should,” “target,” “will,” or “would” or the negative of these words or other similar terms or expressions.
We have based these forward-looking statements largely on our current expectations and projections about future events and financial trends that we believe may affect our financial condition, results of operations, business strategy, and financial needs. These forward-looking statements are subject to known and unknown risks, uncertainties, and assumptions, including risks described in “Risk Factors” and elsewhere in this Annual Report on Form 10-K regarding, among other things:
|
|
• |
our financial performance, including our revenues, cost of revenues, operating expenses, and our ability to attain and sustain profitability; |
|
|
• |
our ability to attract and retain users; |
|
|
• |
our ability to attract and retain advertisers; |
|
|
• |
our ability to compete effectively with existing competitors and new market entrants; |
|
|
• |
our ability to successfully expand in our existing markets and penetrate new markets; |
|
|
• |
our ability to effectively manage our growth and future expenses; |
|
|
• |
our ability to maintain, protect, and enhance our intellectual property; |
|
|
• |
our ability to comply with modified or new laws and regulations applying to our business; |
|
|
• |
our ability to attract and retain qualified employees and key personnel; and |
|
|
• |
future acquisitions of or investments in complementary companies, products, services, or technologies. |
We caution you that the foregoing list may not contain all of the forward-looking statements made in this Annual Report on Form 10-K.
You should not rely on forward-looking statements as predictions of future events. We have based the forward-looking statements contained in this Annual Report on Form 10-K primarily on our current expectations and projections about future events and trends that we believe may affect our business, financial condition, results of operations, and prospects. The outcome of the events described in these forward-looking statements is subject to risks, uncertainties, and other factors described in “Risk Factors” and elsewhere in this Annual Report on Form 10-K. Moreover, we operate in a very competitive and rapidly changing environment. New risks and uncertainties emerge from time to time, and it is not possible for us to predict all risks and uncertainties that could have an impact on the forward-looking statements contained in this Annual Report on Form 10-K. The results, events, and circumstances reflected in the forward-looking statements may not be achieved or occur, and actual results, events, or circumstances could differ materially from those described in the forward-looking statements.
In addition, statements that “we believe” and similar statements reflect our beliefs and opinions on the relevant subject. These statements are based on information available to us as of the date of this Annual Report on Form 10-K. And while we believe that information provides a reasonable basis for these statements, that information may be limited or incomplete. Our statements should not be read to indicate that we have conducted an exhaustive inquiry into, or review of, all relevant information. These statements are inherently uncertain, and investors are cautioned not to unduly rely on these statements.
1
The forward-looking statements made in this Annual Report on Form 10-K relate only to events as of the date on which the statements are made. We undertake no obligation to update any forward-looking statements made in this Annual Report on Form 10-K to reflect events or circumstances after the date of this Annual Report on Form 10-K or to reflect new information or the occurrence of unanticipated events, except as required by law. We may not actually achieve the plans, intentions, or expectations disclosed in our forward-looking statements, and you should not place undue reliance on our forward-looking statements. Our forward-looking statements do not reflect the potential impact of any future acquisitions, mergers, dispositions, joint ventures, or investments.
Investors and others should note that we may announce material business and financial information to our investors using our investor relations website (investor.snap.com), SEC filings, webcasts, press releases, and conference calls. We use these mediums, including Snapchat and our website, to communicate with our members and the public about our company, our products, and other issues. It is possible that the information that we make available may be deemed to be material information. We therefore encourage investors and others interested in our company to review the information that we make available on our website.
NOTE REGARDING USER METRICS AND OTHER DATA
We define a Daily Active User, or DAU, as a registered Snapchat user who opens the Snapchat application at least once during a defined 24-hour period. We measure average Daily Active Users for a particular quarter by calculating the average Daily Active Users for that quarter. We also break out Daily Active Users by geography because certain markets have a greater revenue opportunity and lower bandwidth costs. We define average revenue per user, or ARPU, as quarterly revenue divided by the average Daily Active Users. For purposes of calculating ARPU, revenue by user geography is apportioned to each region based on our determination of the geographic location in which advertising impressions are delivered, as this approximates revenue based on user activity. This allocation differs from our revenue by geography disclosure in the notes to our consolidated financial statements, where revenue is based on the billing address of the advertising customer. For information concerning these metrics as measured by us, see “Management’s Discussion and Analysis of Financial Condition and Results of Operations.”
Unless otherwise stated, statistical information regarding our users and their activities is determined by calculating the daily average of the selected activity for the most recently completed quarter included in this report.
While these metrics are determined based on what we believe to be reasonable estimates of our user base for the applicable period of measurement, there are inherent challenges in measuring how our products are used across large populations globally. For example, there may be individuals who have multiple Snapchat accounts, even though we forbid that in our Terms of Service and implement measures to detect and suppress that behavior. We have not determined the number of such multiple accounts. Our user metrics are also affected by technology on certain mobile devices that automatically runs in the background of our Snapchat application when another phone function is used, and this activity can cause our system to miscount the user metrics associated with such account. Changes in our products, mobile operating systems, or metric tracking system, or the introduction of new products, may impact our ability to accurately determine Daily Active Users or other metrics and we may not determine such inaccuracies promptly. We believe that we don’t capture all data regarding all our Daily Active Users. For example, technical issues may not record data from every user’s application. While we believe this underreporting is generally immaterial, we are unable to precisely determine the level of underreporting and for some periods the underreporting may be material. We continually seek to address these technical issues and improve our accuracy, but given the complexity of the systems involved and the rapidly changing nature of mobile devices and systems, we expect underreporting to continue. We do not adjust our reported metrics to reflect this underreporting.
Some of our demographic data may be incomplete or inaccurate. For example, because users self-report their dates of birth, our age-demographic data may differ from our users’ actual ages. And because users who signed up for Snapchat before June 2013 were not asked to supply their date of birth, we exclude those users and estimate their ages based on a sample of the self-reported ages we do have. If our Daily Active Users provide us with incorrect or incomplete information regarding their age or other attributes, then our estimates may prove inaccurate and fail to meet investor expectations.
2
In the past we have relied on third-party analytics providers to calculate our metrics, but today we rely primarily on our analytics platform that we developed and operate. For example, before June 2015, we used a third party that counted a Daily Active User when the application was opened or a notification was received via the application on any device. We now use an analytics platform that we developed and operate and we count a Daily Active User only when a user opens the application and only once per user per day. We believe this methodology more accurately measures our user engagement. We have multiple pipelines of user data that we use to determine whether a user has opened the application during a particular day, and thus is a Daily Active User. This provides redundancy in the event one pipeline of data were to become unavailable for technical reasons, and also gives us redundant data to help measure how users interact with our application.
Additionally, to align our pre-June 2015 Daily Active Users with this new methodology, we reduced our pre-June 2015 Daily Active Users by 4.8%, the amount by which we estimated the data generated by the third party was overstated. As a result, our metrics may not be comparable to prior periods.
If we fail to maintain an effective analytics platform, our metrics calculations may be inaccurate. We regularly review, have adjusted in the past, and are likely in the future to adjust our processes for calculating our internal metrics to improve their accuracy. As a result of such adjustments, our Daily Active Users or other metrics may not be comparable to those in prior periods. Our measures of Daily Active Users may differ from estimates published by third parties or from similarly titled metrics of our competitors due to differences in methodology or data used.
3
Overview
Snap Inc. is a camera company. We believe that reinventing the camera represents our greatest opportunity to improve the way that people live and communicate. Our products empower people to express themselves, live in the moment, learn about the world, and have fun together.
Our flagship product, Snapchat, is a camera application that helps people communicate visually with friends and family through short videos and images called Snaps. Snaps are deleted by default, so there is a lot less pressure to look pretty or perfect when creating and sending images on Snapchat. By reducing the friction typically associated with creating and sharing content, Snapchat has already become one of the most-used cameras in the world. On average, 187 million people use Snapchat daily and create over 3.5 billion Snaps every day. According to InfoTrends, this is more than the total number of photographs taken on average across all phones, tablets, and digital cameras combined (excluding Snapchat) each day in 2017.
In the way that the flashing cursor became the starting point for most products on desktop computers, we believe that the camera screen will be the starting point for most products on smartphones. This is because images created by smartphone cameras contain more context and richer information than other forms of input like text entered on a keyboard. Given the magnitude of this opportunity, we invest heavily and take big risks in an attempt to create innovative and differentiated camera products that are better able to reflect and improve our life experiences.
Our Products
Camera: Snapchat opens directly into the Camera, making it easy to create a Snap and send it to friends. We offer a wide variety of creative tools, created by both us and our community, to make it easy for people to personalize and add context to their Snaps. Over one third of our Daily Active Users play with our augmented reality Lenses every day on average, and anyone can create their own Lens using our Lens Studio. Additionally, we also offer contextually relevant content and creative tools based on things like time, location, and objects.
Friends Page: The first version of our application was a chat service that made it easy to send Snaps back and forth with friends—hence the name “Snapchat.” Interacting with friends on Snapchat now includes creating and watching Stories, chatting with Groups, making voice and video calls, and communicating through a wide range of contextual stickers and Bitmojis. The content and ordering of the Friends page reflects the user’s relationships with their friends and family. This close friend network drives high frequency engagement and results in our community opening our application an average of 25 times per day.
Discover: With so many Snaps created every day around the world, Discover helps surface the most interesting Stories from publishers, creators, and the community, based on a user’s subscriptions and interests. With so much content to explore, our users spend an average of more than 30 minutes every day in our application.
Snap Map: Pinching on the camera screen brings you to a live map of your location, showing nearby friends, popular stories, and a heatmap of recent Snaps posted to Our Story. It’s a great way to see what your friends are doing and explore what is going on around the world.
Memories: Users can choose to save the Snaps they create in a searchable personal collection called Memories. Memories also lets users create Snaps and Stories from their saved Snaps as well as their camera roll.
Spectacles: One of the best ways to create Memories is by using Spectacles, our sunglasses that make Snaps. Spectacles connect seamlessly with Snapchat and capture video from a human perspective.
4
We generate revenue primarily through advertising.
Advertising Products: Our ad products are built on the same foundation that makes our consumer products successful. This means that we can take the things we learn while creating our consumer products and apply them to building innovative and engaging advertising products familiar to our community. Sponsored Lenses take advantage of the reach and scale of our augmented reality platform to create visually engaging 3D experiences. Sponsored Geofilters help users create and send contextual Snaps with their friends, like showing that they are at a particular store or restaurant. Snap Ads and Promoted Stories let advertisers tell their stories the same way our users do, using full screen videos with sound. Attachments allow advertisers to attach additional experiences and actions directly within these ad units, including watching a long-form video, visiting a website, or installing an app.
Campaign Management and Delivery: We are always working to improve the way ads are bought and delivered. We are investing heavily in our programmatic and self-service tools, which provide for automated, sophisticated, and scalable ad buying and campaign management. This helps advertisers increase their return on investment by taking advantage of more refined targeting capabilities, the ability to test and learn with different creatives or campaign attributes in real time, and the pricing dynamics of our auction. Additionally, our delivery framework continues to optimize relevance of ads across the entire platform by determining the best ad to show to any given user based on their real-time and historical attributes and activity. This decreases the number of wasted impressions while improving the effectiveness of the ads that are shown to our community.
Measuring Advertising Effectiveness: We offer a broad range of third-party and first-party solutions to provide analytics on campaign attributes like reach, frequency, demographics, and viewability; changes in perceptions like brand favorability or purchase intent; and lifts in actual behavior like purchases, foot traffic, app installs, and online purchases. We are constantly expanding our capabilities in this area to provide more transparency to advertisers. For example, through our acquisition of Placed, Inc., a location-based measurement services company, we offer omni-channel measurement of store visitation, so that advertisers can measure the performance of their entire budget across all platforms and campaigns as it relates to the more than 90% of retail transactions that still happen offline in the physical world.
Our Strategy
Our strategy is to invest in product innovation and take risks to improve our camera platform. We do this in an effort to drive user engagement, which we can then monetize through advertising. We use the revenue we generate to fund future product innovation to grow our business.
We believe that the best way to compete in a world of widely distributed mobile applications is innovating to create the most engaging products. New mobile software is available to everyone immediately, and usually for free. While not all of our investments will pay off in the long run, we are willing to take risks in an attempt to create the best and most differentiated products on the market.
Due to the nature of our products and business, our ability to succeed in any given country is largely dependent on its mobile infrastructure and its advertising market. These factors influence our product performance, hosting costs, and monetization opportunity in each market.
Visual communication and augmented reality requires intensive processing and generates high bandwidth consumption by our users. As a result, our existing users tend to come from developed countries with high-end mobile devices and high-speed cellular internet. These markets also tend to have cheaper bandwidth costs, meaning that it is less expensive to serve our community in these countries. As we continue to grow in more markets around the world, we are investing heavily in making our service and technology more performant on lower end devices and working with carriers and other infrastructure partners to provide our service at a lower cost to our community.
Substantially all of our revenue comes from advertising, so our ability to generate revenue in a particular country depends on the size of its advertising market. Global advertising spend—especially mobile advertising spend—is extremely concentrated among top markets, and we see a high correlation between markets with significant and developed advertising markets and those that have a deep penetration of high-end mobile devices and high-speed cellular internet access. As such, we benefit greatly from the fact that many of our users are in markets where we have the highest capital efficiency and monetization potential, allowing us to generate revenue and cash flow that we can then invest into future product innovation.
5
Our approach to privacy is simple: Be upfront, offer choices, and never forget that our community comes first.
We built Snapchat as an antidote to the context-less communication that has plagued “social media.” Not so long ago, a conversation among friends would be just that: a private communication in which you knew exactly who you were talking to, what you were talking about, and whether what you were saying was being memorialized for eternity. Somewhere along the way, social media—by prioritizing virality and permanence—sapped conversations of this valuable context and choice. When we began to communicate online, we lost some of what made communication great: spontaneity, emotion, honesty—the full range of human expression that makes us human in the first place.
We don’t think digital communication has to be this way. That’s why choice matters. We build products and services that emphasize the context of a conversation—who, when, what, and where something is being said. If you don’t have the autonomy to shape the context of a conversation, the conversation will simply be shaped by the permanent feeds that homogenize online conversations.
When you read our Privacy Policy, we hope that you’ll notice how much we care about the integrity of personal communication. For starters, we’ve written our Privacy Policy in plain language because we think it’s important that everyone understand exactly how we handle their information. Otherwise, it’s hard to make informed choices about how you communicate. We’ve also created a robust Privacy Center where we show that context and choice are more than talking points. There, we point out the many ways that users can control who sees their Snaps and Stories, we explain how long content will remain on our servers, and much more. You’ll also find there our Transparency Report. We’re proud that we published our first Transparency Report just a few years into the company’s existence, long before most companies take that important step.
We also understand that privacy policies—no matter how ambitious—are only as good as the people and practices behind those policies. When someone trusts us to transmit or store their information, we know we have a responsibility to protect that information and we work hard to keep it secure. New features go through an intense privacy-review process—we debate pros and cons, and we work hard to build products we’re proud of and that we’ll want to use. We use Snapchat constantly, both at work and in our personal lives, and we handle user information with the same care that we want for our family, our friends, and ourselves.
Competition
We compete with other companies in every aspect of our business, particularly with companies that focus on mobile engagement and advertising. Many of these companies, such as Apple, Facebook (including Instagram and WhatsApp), Google (including YouTube), and Twitter, have significantly greater financial and human resources and, in some cases, larger user bases. Given the breadth of our product offerings, we also compete with companies that develop products or otherwise operate in the mobile, camera, communication, media, and advertising industries. Our competitors span from internet technology companies and digital platforms to traditional companies in print, radio, and television sectors to underlying technologies like default smartphone cameras and messaging. Additionally, our competition for engagement varies by region. For instance, we face competition from companies like Kakao, LINE, Naver (including Snow), and Tencent in Asia.
We compete to attract and retain our users’ attention, both in terms of reach and engagement. Since our products and those of our competitors are typically free, we compete based on our brand and the quality and nature of our product offerings rather than on price. As such, we invest heavily in constantly improving and expanding our product lines.
We also compete with other companies to attract and retain partners and advertisers, which depends primarily on our reach and ability to deliver a strong return on investment.
Finally, we compete to attract and retain highly talented individuals, including software engineers, designers, and product managers. Our headquarters in Venice, California and our other principal offices in the Los Angeles area offer certain advantages, such as lower local recruiting competition from other companies and providing an enticing location to live, as well as certain disadvantages such as the increased need to recruit remotely and requiring employees to relocate to the Los Angeles area. In addition to providing competitive compensation packages, we compete for talent by fostering a culture of working hard to create great products and experiences and allowing our employees to have a direct meaningful contribution to new and exciting projects. We had 3,069 employees as of December 31, 2017.
6
Our research and development efforts focus on product development, advertising technology, and large-scale infrastructure.
Product Development: We work relentlessly and invest heavily to create and improve products for our community and our partners. We develop a wide range of products related to visual communication and storytelling that are powered by a variety of new technologies.
Advertising Technology: We constantly develop and expand our advertising products and technology. In an effort to provide a strong and scalable return on investment to our advertisers, our advertising technology roadmap centers around improving our delivery framework, measurement capabilities, and our self-service buying and creative tools.
Large-scale Infrastructure: We spend considerable resources and investment on the underlying architecture that powers our products, such as optimizing the delivery of billions of videos to hundreds of millions of people around the world every day. We currently partner with providers like Google and Amazon to support the infrastructure for our growing needs. These partnerships have allowed us to scale quickly without upfront infrastructure costs, letting us focus our efforts on product innovation.
Our research and development expenses were $1.5 billion, $183.7 million, and $82.2 million in 2017, 2016, and 2015, respectively. For information about our research and development expenses, see “Management's Discussion and Analysis of Financial Condition and Results of Operations—Results of Operations—Research and Development Expenses” of this Annual Report on Form 10-K.
Seasonality in Our Business
We have historically seen a high degree of seasonality in our business and financial results. Overall brand advertising spend tends to be strongest in the fourth quarter of the calendar year, and we have observed a similar pattern in our historical revenue. We have also experienced seasonality in our user engagement, generally seeing lower engagement during summer months. The rapid growth in our business and user engagement has generally masked these trends to date, and we expect the impact of seasonality to be more pronounced in the future.
Key Customers
No individual customer represented more than 10% of our revenues in 2017, 2016, or 2015.
Intellectual Property
Our success depends in part on our ability to protect our intellectual property and proprietary technologies. To protect our proprietary rights, we rely on a combination of intellectual property rights in the United States and other jurisdictions, including patents, trademarks, copyrights, trade secret laws, license agreements, internal procedures, and contractual provisions. We also enter into confidentiality and invention assignment agreements with our employees and contractors and sign confidentiality agreements with third parties. Our internal controls restrict access to proprietary technology.
As of December 31, 2017, we had 375 issued patents and approximately 514 filed patent applications in the United States and foreign countries relating to our camera platform and other technologies. Our issued patents will expire between 2018 and 2036. We may not be able to obtain protection for our intellectual property, and our existing and future patents, trademarks, and other intellectual property rights may not provide us with competitive advantages or distinguish our products and services from those of our competitors. Our patent applications may not result in the issuance of patents, and any resulting issued patents may have claims narrower than those in our patent applications. Additionally, our current and future patents, trademarks, and other intellectual property rights may be contested, circumvented, or found unenforceable or invalid, and we may not be able to prevent third parties from infringing them. Our internal controls and contractual provisions may not always be effective at preventing unauthorized parties from obtaining our intellectual property and proprietary technologies.
7
We license content, trademarks, technology, and other intellectual property from our partners, and rely on our license agreements with those partners to use the intellectual property. We also enter into licensing agreements with third parties to receive rights to patents and other know-how. Third parties may assert claims related to intellectual property rights against our partners or us.
Other companies and “non-practicing entities” that own patents, copyrights, trademarks, trade secrets, and other intellectual property rights related to the mobile, camera, communication, media, internet, and other technology-related industries frequently enter into litigation based on allegations of infringement, misappropriation, and other violations of intellectual property or other rights. Third parties, including our competitors and non-practicing entities, may make claims from time to time that we have infringed their patents, trademarks, copyrights, trade secrets, or other intellectual property rights. We are party to many agreements under which we are obligated to indemnify our customers, suppliers, and channel partners against such claims. As our business grows and competition increases, we will likely face more claims related to intellectual property and litigation matters. In addition, to the extent that we gain greater visibility and market exposure as a public company, we face a higher risk of being the subject of intellectual property infringement claims from third parties.
Government Regulation
We are subject to many U.S. federal and state and foreign laws and regulations, including those related to privacy, rights of publicity, data protection, content regulation, intellectual property, health and safety, competition, protection of minors, consumer protection, and taxation. These laws and regulations are constantly evolving and may be interpreted, applied, created, or amended in a manner that could harm our business.
In December 2014, the Federal Trade Commission resolved an investigation into some of our early practices by handing down a final order. That order requires, among other things, that we establish a robust privacy program to govern how we treat user data. During the 20-year lifespan of the order, we must complete bi-annual independent privacy audits. In June 2014, we entered into a 10-year assurance of discontinuance with the Attorney General of Maryland implementing similar practices, including measures to prevent minors from creating accounts and providing annual compliance reports. Violating existing or future regulatory orders or consent decrees could subject us to substantial monetary fines and other penalties that could negatively affect our financial condition and results of operations.
Furthermore, foreign data protection, privacy, consumer protection, content regulation, and other laws and regulations are often more restrictive than those in the United States. It is possible that certain governments may seek to block or limit our products or otherwise impose other restrictions that may affect the accessibility or usability of any or all our products for an extended period of time or indefinitely. For example, we have very limited access to the China market, as we have not yet established an operating presence in China to support Snapchat. Access to Google, which currently powers our infrastructure, is restricted in China. Additionally, not all our products are available in all locations, including Spectacles, and may not be due to such laws and regulations. We have a public policy team that monitors legal and regulatory developments in the United States, as well as many foreign countries, and communicates with policymakers and regulators in the United States and internationally.
Corporate Information
We were formed as Future Freshman, LLC, a California limited liability company, in 2010. We changed our name to Toyopa Group, LLC in 2011, incorporated as Snapchat, Inc., a Delaware corporation, in 2012, and changed our name to Snap Inc. in 2016. We completed our initial public offering in March 2017 and our Class A common stock is listed on the NYSE under the symbol “SNAP.”
Our principal executive offices are located at 63 Market Street, Venice, California 90291, and our telephone number is (310) 399-3339. Snap Inc., “Snapchat,” and our other registered and common-law trade names, trademarks, and service marks appearing in this Annual Report on Form 10-K are property of Snap Inc. or our subsidiaries.
Information about Segment and Geographic Revenue
Information about segment and geographic revenue is set forth in Notes 1 and 10 of our Notes to Consolidated Financial Statements included in “Financial Statements and Supplementary Data” of this Annual Report on Form 10-K.
8
Our website address is www.snap.com. Our Annual Report on Form 10-K, Quarterly Reports on Form 10-Q, Current Reports on Form 8-K, and amendments to these reports filed pursuant to Sections 13(a) and 15(d) of the Exchange Act are filed with the U.S. Securities and Exchange Commission, or the SEC. Such reports and other information filed by us with the SEC are available free of charge on our website at investor.snap.com when such reports are available on the SEC’s website. We use our website as a means of disclosing material non-public information and for complying with our disclosure obligations under Regulation FD.
Any person may read and copy any materials filed by us with the SEC at the SEC’s Public Reference Room at 100 F Street, N.E., Room 1580, Washington, DC 20549. You may obtain information on the operation of the Public Reference Room by calling the SEC at 1-800-SEC-0330. The SEC also maintains an internet site that contains reports, proxy and information statements, and other information regarding issuers, like us, that file electronically with the SEC. The address of that website is www.sec.gov.
Information contained in, or accessible through, of the websites referred to in this Annual Report on Form 10-K are not incorporated into this filing. Further, our references to website addresses are only as inactive textual references.
You should carefully consider the risks and uncertainties described below, together with all the other information in this Annual Report on Form 10-K, including “Management’s Discussion and Analysis of Financial Condition and Results of Operations” and the consolidated financial statements and the related notes. If any of the following risks actually occurs, our business, reputation, financial condition, results of operations, revenue, and future prospects could be seriously harmed. The risks and uncertainties described below are not the only ones we face. Additional risks and uncertainties that we are unaware of, or that we currently believe are not material, may also become important factors that adversely affect our business. Unless otherwise indicated, references to our business being seriously harmed in these risk factors will include harm to our business, reputation, financial condition, results of operations, revenue, and future prospects. In that event, the market price of our Class A common stock could decline, and you could lose part or all of your investment.
Risks Related to Our Business and Industry
Our ecosystem of users, advertisers, and partners depends on the engagement of our user base. We anticipate that the growth rate of our user base will decline over time. If we fail to retain current users or add new users, or if our users engage less with Snapchat, our business would be seriously harmed.
We had 187 million and 158 million Daily Active Users on average in the quarters ended December 31, 2017 and December 31, 2016, respectively, and we view Daily Active Users as a critical measure of our user engagement. Adding, maintaining, and engaging Daily Active Users have been and will continue to be necessary. We anticipate that our Daily Active Users growth rate will decline over time if the size of our active user base increases or we achieve higher market penetration rates. For example, if and when we achieve maximum market penetration rates among younger users in developed markets who use smartphones with iOS operating systems, future growth in Daily Active Users will need to come from older users, developing markets, or users with Android operating systems, which may not be possible or may be more difficult or time consuming for us to achieve. If our Daily Active Users growth rate slows, our financial performance will increasingly depend on our ability to elevate user engagement or increase our monetization of users. If current and potential users do not perceive our products to be fun, engaging, and useful, we may not be able to attract new users, retain existing users, or maintain or increase the frequency and duration of their engagement. In addition, because our products typically require high bandwidth data capabilities, the majority of our users live in countries with high-end mobile device penetration and high bandwidth capacity cellular networks with large coverage areas. We therefore do not expect to experience rapid user growth or engagement in countries with low smartphone penetration even if such countries have well-established and high bandwidth capacity cellular networks. We may also not experience rapid user growth or engagement in countries where, even though smartphone penetration is high, due to the lack of sufficient cellular based data networks, consumers rely heavily on Wi-Fi and may not access our products regularly.
9
Snapchat is free and easy to join, the barrier to entry for new entrants is low, and the switching costs to another platform are also low. Moreover, the majority of our users are 18-34 years old. This demographic may be less brand loyal and more likely to follow trends than other demographics. These factors may lead users to switch to another product, which would negatively affect our user retention, growth, and engagement. Snapchat also may not be able to penetrate other demographics in a meaningful manner. Falling user retention, growth, or engagement could make Snapchat less attractive to advertisers and partners, which may seriously harm our business. In addition, our Daily Active Users may not continue to grow. We measure our Daily Active Users by calculating the daily average of users across the entire quarter. This calculation may mask any individual months within the quarter that are significantly higher or lower than the average. There are many factors that could negatively affect user retention, growth, and engagement, including if:
|
|
• |
users increasingly engage with competing products instead of ours; |
|
|
• |
our competitors have and may continue to mimic our products and therefore harm our user engagement and growth; |
|
|
• |
we fail to introduce new and exciting products and services or those we introduce are poorly received; |
|
|
• |
our products fail to operate effectively on the iOS and Android mobile operating systems; |
|
|
• |
we are unable to continue to develop products that work with a variety of mobile operating systems, networks, and smartphones; |
|
|
• |
we do not provide a compelling user experience because of the decisions we make regarding the type and frequency of advertisements that we display; |
|
|
• |
we are unable to combat spam or other hostile or inappropriate usage on our products; |
|
|
• |
there are changes in user sentiment about the quality or usefulness of our existing products in the short term, long term, or both; |
|
|
• |
there are concerns about the privacy implications, safety, or security of our products; |
|
|
• |
our partners who provide content to Snapchat do not create content that is engaging, useful, or relevant to users; |
|
|
• |
our partners who provide content to Snapchat decide not to renew agreements or devote the resources to create engaging content or do not provide content exclusively to us; |
|
|
• |
advertisers display ads that are untrue, offensive, or otherwise fail to follow our guidelines; |
|
|
• |
there are changes in our products that are mandated by legislation, regulatory authorities, or litigation, including settlements or consent decrees that adversely affect the user experience; |
|
|
• |
there are changes to our Terms of Service that are implemented in connection with the General Data Protection Regulation, or GDPR, in Europe, which may decrease engagement or acceptance by our users; |
|
|
• |
technical or other problems frustrate the user experience, particularly if those problems prevent us from delivering our products in a fast and reliable manner; |
|
|
• |
we fail to provide adequate service to users, advertisers, or partners; |
|
|
• |
we, our partners, or other companies in our industry are the subject of adverse media reports or other negative publicity, some of which may be inaccurate or include confidential information that we are unable to correct or retract; |
|
|
• |
we do not maintain our brand image or our reputation is damaged; or |
|
|
• |
our current or future products reduce user activity on Snapchat by making it easier for our users to interact directly with partners. |
Any decrease to user retention, growth, or engagement could render our products less attractive to users, advertisers, or partners, and would seriously harm our business.
10
Snapchat depends on effectively operating with mobile operating systems, hardware, networks, regulations, and standards that we do not control. Changes in our products or to those operating systems, hardware, networks, regulations, or standards may seriously harm our user retention, growth, and engagement.
Because Snapchat is used primarily on mobile devices, the application must remain interoperable with popular mobile operating systems, Android and iOS, and related hardware, including but not limited to mobile-device cameras. The owners of such operating systems, Google and Apple, respectively, each provide consumers with products that compete with ours. Additionally, mobile devices, and mobile-device cameras, are manufactured by a wide array of companies. Those companies have no obligation to test the interoperability of new mobile devices with Snapchat, and may produce new products that are incompatible with or not optimal for Snapchat. We have no control over these operating systems or hardware, and any changes to these systems or hardware that degrade our products’ functionality, or give preferential treatment to competitive products, could seriously harm Snapchat usage on mobile devices. Our competitors that control the operating systems and related hardware our application runs on could make interoperability of our products with those mobile operating systems more difficult or display their competitive offerings more prominently than ours. We plan to continue to introduce new products regularly and have experienced that it takes time to optimize such products to function with these operating systems and hardware, impacting the popularity of such products, and we expect this trend to continue.
The majority of our user engagement is on smartphones with iOS operating systems. As a result, although our products work with Android mobile devices, we historically prioritized development of our products to operate with iOS operating systems rather than smartphones with Android operating systems. To continue growth in user engagement, we have and will continue to prioritize improving our products’ operability on smartphones with Android operating systems. If we are unable to improve operability of our products on smartphones with Android operating systems, and those smartphones become more popular and fewer people use smartphones with iOS operating systems, our business could be seriously harmed.
Moreover, our products require high-bandwidth data capabilities. If the costs of data usage increase or access to cellular networks is limited, our user retention, growth, and engagement may be seriously harmed. Additionally, to deliver high-quality video and other content over mobile cellular networks, our products must work well with a range of mobile technologies, systems, networks, regulations, and standards that we do not control. In particular, any future changes to the iOS or Android operating systems may impact the accessibility, speed, functionality, and other performance aspects of our products, which issues are likely to occur in the future from time to time. In addition, the adoption of any laws or regulations that adversely affect the growth, popularity, or use of the internet, including laws governing internet neutrality, could decrease the demand for our products and increase our cost of doing business. For example, in December 2017, the Federal Communications Commission, or FCC, voted to repeal the “open internet rules,” which prohibit mobile providers in the United States from impeding access to most content, or otherwise unfairly discriminating against content providers like us and also prohibit mobile providers from entering into arrangements with specific content providers for faster or better access over their data networks. While the FCC’s repeal of these net neutrality regulations has not yet taken effect, the future impact of such repeal and any challenges to the repeal remains uncertain and our business could be seriously harmed. The European Union similarly requires equal access to internet content. Additionally, as part of its Digital Single Market initiative, the European Union may impose network security, disability access, or 911-like obligations on “over-the-top” services such as those provided by us, which could increase our costs. If the FCC’s repeal of the open internet rules are allowed to take effect or the European Union modifies these open internet rules, mobile and internet providers may be able to limit our users’ ability to access Snapchat or make Snapchat a less attractive alternative to our competitors’ applications. Were that to happen, our business would be seriously harmed.
We may not successfully cultivate relationships with key industry participants or develop products that operate effectively with these technologies, systems, networks, regulations, or standards. If it becomes more difficult for our users to access and use Snapchat on their mobile devices, if our users choose not to access or use Snapchat on their mobile devices, or if our users choose to use mobile products that do not offer access to Snapchat, our user retention, growth, and engagement could be seriously harmed.
We rely on Google Cloud for the vast majority of our computing, storage, bandwidth, and other services. Any disruption of or interference with our use of the Google Cloud operation would negatively affect our operations and seriously harm our business.
Google provides a distributed computing infrastructure platform for business operations, or what is commonly referred to as a “cloud” computing service, and we currently run the vast majority of our computing on Google Cloud.
11
Any transition of the cloud services currently provided by Google Cloud to another cloud provider would be difficult to implement and will cause us to incur significant time and expense. We have committed to spend $2.0 billion with Google Cloud over five years (beginning January 2017) and have built our software and computer systems to use computing, storage capabilities, bandwidth, and other services provided by Google, some of which do not have an alternative in the market. Given this, any significant disruption of or interference with our use of Google Cloud would negatively impact our operations and our business would be seriously harmed. If our users or partners are not able to access Snapchat through Google Cloud or encounter difficulties in doing so, we may lose users, partners, or advertising revenue. The level of service provided by Google Cloud or similar providers may also impact the usage of and our users’, advertisers’, and partners’ satisfaction with Snapchat and could seriously harm our business and reputation. If Google Cloud or similar providers experience interruptions in service regularly or for a prolonged basis, or other similar issues, our business would be seriously harmed. Hosting costs also have and will continue to increase as our user base and user engagement grows and may seriously harm our business if we are unable to grow our revenues faster than the cost of utilizing the services of Google or similar providers.
In addition, Google may take actions beyond our control that could seriously harm our business, including:
|
|
• |
discontinuing or limiting our access to its Google Cloud platform; |
|
|
• |
increasing pricing terms; |
|
|
• |
terminating or seeking to terminate our contractual relationship altogether; |
|
|
• |
establishing more favorable relationships or pricing terms with one or more of our competitors; and |
|
|
• |
modifying or interpreting its terms of service or other policies in a manner that impacts our ability to run our business and operations. |
Google has broad discretion to change and interpret its terms of service and other policies with respect to us, and those actions may be unfavorable to us. Google may also alter how we are able to process data on the Google Cloud platform. If Google makes changes or interpretations that are unfavorable to us, our business would be seriously harmed.
We generate substantially all of our revenue from advertising. The failure to attract new advertisers, the loss of advertisers, or a reduction in how much they spend could seriously harm our business.
Substantially all of our revenue is generated from third parties advertising on Snapchat, a trend that we expect to continue. For the years ended December 31, 2017 and 2016, advertising revenue accounted for 97% and 96% of total revenue, respectively. Although we have and continue to try to establish longer-term advertising commitments with advertisers, most advertisers do not have long-term advertising commitments with us, and our efforts to establish long-term commitments may not succeed.
While no individual customer accounts for more than 10% of our revenue, many of our advertisers only recently started working with us and spend a relatively small portion of their overall advertising budget with us. In addition, advertisers may view some of our products as experimental and unproven. Advertisers will not continue to do business with us if we do not deliver advertisements in an effective manner, or if they do not believe that their investment in advertising with us will generate a competitive return relative to other alternatives. Moreover, we rely heavily on our ability to collect and disclose data and metrics to and for our advertisers to attract new advertisers and retain existing advertisers. Any restriction, whether by law, regulation, policy, or other reason, on our ability to collect and disclose data which our advertisers find useful would impede our ability to attract and retain advertisers. Our advertising revenue could be seriously harmed by many other factors, including:
|
|
• |
a decrease in the number of Daily Active Users on Snapchat; |
|
|
• |
a decrease in the amount of time spent on Snapchat or decreases in usage of our Creative Tools, Chat Service, or Storytelling Platform; |
|
|
• |
our inability to create new products that sustain or increase the value of our advertisements; |
|
|
• |
changes in our user demographics that make us less attractive to advertisers; |
|
|
• |
lack of ad creative availability by our advertising partners; |
|
|
• |
our partners who provide content to us may not renew agreements or devote the resources to create engaging content or do not provide content exclusively to us; |
12
|
|
• |
decreases in the perceived quantity, quality, usefulness, or relevance of the content provided by our users or partners; |
|
|
• |
changes in our analytics and measurement solutions that demonstrate the value of our advertisements and other commercial content; |
|
|
• |
competitive developments or advertiser perception of the value of our products that change the rates we can charge for advertising or the volume of advertising on Snapchat; |
|
|
• |
product changes or advertising inventory management decisions we may make that change the type, size, or frequency of advertisements displayed on Snapchat or the method used by advertisers to purchase advertisements; |
|
|
• |
adverse legal developments relating to advertising, including changes mandated by legislation, regulation, or litigation; |
|
|
• |
adverse media reports or other negative publicity involving us, our founders, our partners, or other companies in our industry; |
|
|
• |
advertiser or user perception that content published by us, our users, or our partners is objectionable; |
|
|
• |
the degree to which users skip advertisements and therefore diminish the value of those advertisements to advertisers; |
|
|
• |
changes in the way advertising is priced or its effectiveness is measured; |
|
|
• |
our inability to measure the effectiveness of our advertising or target the appropriate audience for advertisements; |
|
|
• |
our inability to collect and disclose data that new and existing advertisers may find useful; |
|
|
• |
difficulty and frustration from advertisers who may need to reformat or change their advertisements to comply with our guidelines; and |
|
|
• |
the macroeconomic climate and the status of the advertising industry in general. |
These and other factors could reduce demand for our advertising products, which may lower the prices we receive, or cause advertisers to stop advertising with us altogether. Either of these would seriously harm our business.
Our two co-founders have control over all stockholder decisions because they control a substantial majority of our voting stock.
As a result of the Class C common stock that they hold, Evan Spiegel, our co-founder and Chief Executive Officer, and Robert Murphy, our co-founder and Chief Technology Officer, are able to exercise voting rights with respect to an aggregate of 216,615,870 shares of Class C common stock, which represents approximately 94.6% of the voting power of our outstanding capital stock as of December 31, 2017. In addition, Mr. Spiegel was granted an RSU for 37,447,817 shares of Class C common stock on the closing of our initial public offering, or IPO. This RSU award vested immediately on the closing of our IPO in March 2017 and such shares are delivered to our CEO in quarterly installments over three years beginning in November 2017, following which Mr. Spiegel alone may be able to exercise voting control over our outstanding capital stock. The Class A common stock has no voting rights, the Class B common stock is entitled to one vote per share, and the Class C common stock is entitled to ten votes per share. As a result, Mr. Spiegel and Mr. Murphy, and potentially either one of them alone, have the ability to control the outcome of all matters submitted to our stockholders for approval, including the election, removal, and replacement of directors and any merger, consolidation, or sale of all or substantially all of our assets. If Mr. Spiegel’s or Mr. Murphy’s employment with us is terminated, they will continue to have the ability to exercise the same significant voting power and potentially control the outcome of all matters submitted to our stockholders for approval. Either of our co-founders’ shares of Class C common stock will automatically convert into Class B common stock, on a one-to-one basis, nine months following his death or on the date on which the number of outstanding shares of Class C common stock held by such holder represents less than 30% of the Class C common stock held by such holder on the closing of our IPO, or 32,383,178 shares of Class C common stock. Should either of our co-founders’ Class C common stock be converted to Class B common stock, the remaining co-founder will be able to exercise voting control over our outstanding capital stock.
13
In addition, in October 2016, we issued a dividend of one share of non-voting Class A common stock to all our equity holders, which will prolong our co-founders’ voting control. As a result of such dividend, our co-founders will be able to liquidate their holdings of non-voting Class A common stock without diminishing their voting control. In the future, our board of directors may, from time to time, decide to issue special or regular stock dividends in the form of Class A common stock, and if we do so, our co-founders’ control could be further prolonged. This concentrated control could delay, defer, or prevent a change of control, merger, consolidation, or sale of all or substantially all of our assets that our other stockholders support. Conversely, this concentrated control could allow our co-founders to consummate such a transaction that our other stockholders do not support. In addition, our co-founders may make long-term strategic investment decisions and take risks that may not be successful and may seriously harm our business.
As our CEO, Mr. Spiegel has control over our day-to-day management and the implementation of major strategic investments of our company, subject to authorization and oversight by our board of directors. As board members and officers, Mr. Spiegel and Mr. Murphy owe a fiduciary duty to our stockholders and must act in good faith in a manner they reasonably believe to be in the best interests of our stockholders. As stockholders, even controlling stockholders, Mr. Spiegel and Mr. Murphy are entitled to vote their shares, and shares over which they have voting control, in their own interests, which may not always be in the interests of our stockholders generally. We have not elected to take advantage of the “controlled company” exemption to the corporate governance rules for New York Stock Exchange, or NYSE, listed companies. Moreover, Mr. Spiegel and Mr. Murphy have entered into a proxy agreement under which each has granted a voting proxy with respect to all shares of our Class B common stock and Class C common stock that each may beneficially own from time to time or have voting control over. The proxy would become effective on either founder’s death or disability. Mr. Spiegel and Mr. Murphy have each initially designated the other as their respective proxies. Accordingly, on the death or incapacity of either Mr. Spiegel or Mr. Murphy, the other could individually control nearly all of the voting power of our outstanding capital stock.
If we do not develop successful new products or improve existing ones, our business will suffer. We also invest in new lines of business that could fail to attract or retain users or generate revenue.
Our ability to engage, retain, and increase our user base and to increase our revenue will depend heavily on our ability to successfully create new products, both independently and together with third parties. We may introduce significant changes to our existing products or develop and introduce new and unproven products and services, including technologies with which we have little or no prior development or operating experience. These new products and updates may fail to increase the engagement of our users, advertisers, or partners, and may even result in short-term or long-term decreases in such engagement by disrupting existing user, advertiser, or partner behavior, or by introducing performance and quality issues. For example, in 2017, we transitioned most of our Snap Ads sales to a programmatic model, which decreased average advertising prices. Additionally, we introduced a major redesign of the Snapchat application in December 2017 that rolled out more broadly in February 2018, which has received negative attention in the press and in app store reviews. The short- and long-term impact of any major change, like our recent redesign, is particularly difficult to predict. If new or enhanced products fail to engage our users, advertisers, or partners, we may fail to attract or retain users or to generate sufficient revenue, operating margin, or other value to justify our investments, any of which may seriously harm our business in the short term, long term, or both. Additionally, we frequently launch new products and the products that we launch may have technical issues that diminish the performance of our application. These performance issues or issues that we encounter in the future could impact our user engagement.
Because our products created new ways of communicating, they have often required users to learn new behaviors to use our products, or to use our products repeatedly to receive the most benefit. These new behaviors, such as swiping and tapping in the Snapchat application, are not always intuitive to users. This can create a lag in adoption of new products and new user additions related to new products. To date, this has not hindered our user growth or engagement, but that may be the result of a large portion of our user base being in a younger demographic and more willing to invest the time to learn to use our products most effectively. To the extent that future users, including those in older demographics, are less willing to invest the time to learn to use our products, and if we are unable to make our products easier to learn to use, our user growth or engagement could be affected, and our business could be harmed. We may develop new products that increase user engagement and costs without increasing revenue. For example, we introduced Memories in 2016, our cloud storage service for Snaps, which increases our storage costs.
In addition, we have invested and expect to continue to invest in new lines of business, new products, and other initiatives to generate revenue. The launch of Spectacles in late 2016, which has not and may not generate significant revenue for us, is a good example. We do not have significant experience with hardware products, and we have incurred Spectacles inventory-related charges and may incur increased costs in connection with the development, sale, and marketing of hardware
14
products. There is no guarantee that investing in new lines of business, new products, and other initiatives will succeed. If we do not successfully develop new approaches to monetization or meet the expectations of our users or partners, we may not be able to maintain or grow our revenue as anticipated or recover any associated development costs, and our business could be seriously harmed.
Our business is highly competitive. We face significant competition that we anticipate will continue to intensify. If we are not able to maintain or improve our market share, our business could suffer.
We face significant competition in almost every aspect of our business both domestically and internationally. This includes larger, more established companies such as Apple, Facebook (including Instagram and WhatsApp), Google (including YouTube), Twitter, Kakao, LINE, Naver (including Snow), and Tencent, which provide their users with a variety of products, services, content, and online advertising offerings, and smaller companies that offer products and services that may compete with specific Snapchat features. For example, Instagram, a subsidiary of Facebook, introduced a “stories” feature that largely mimics our Stories feature and may be directly competitive. We may also lose users to small companies that offer products and services that compete with specific Snapchat features because of the low cost for our users to switch to a different product or service. Moreover, in emerging international markets, where mobile devices often lack large storage capabilities, we may compete with other applications for the limited space available on a user’s mobile device. We also face competition from traditional and online media businesses for advertising budgets. We compete broadly with the social media offerings of Apple, Facebook, Google, and Twitter, and with other, largely regional, social media platforms that have strong positions in particular countries. As we introduce new products, as our existing products evolve, or as other companies introduce new products and services, we may become subject to additional competition. For example, in late 2016, we launched Spectacles, our first hardware product. While we view Spectacles as an extension of Snapchat, adding hardware products and services to our product portfolio subjects us to additional competition and new competitors.
Many of our current and potential competitors have significantly greater resources and broader global recognition and occupy stronger competitive positions in certain markets than we do. These factors may allow our competitors to respond to new or emerging technologies and changes in market requirements better than we can. Our competitors may also develop products, features, or services that are similar to ours or that achieve greater market acceptance. These products, features, and services may undertake more far-reaching and successful product development efforts or marketing campaigns, or may adopt more aggressive pricing policies. In addition, advertisers may use information that our users share through Snapchat to develop or work with competitors to develop products or features that compete with us. Certain competitors, including Apple, Facebook, and Google, could use strong or dominant positions in one or more markets to gain competitive advantages against us in areas where we operate, including by:
|
|
• |
integrating competing social media platforms or features into products they control such as search engines, web browsers, or mobile device operating systems; |
|
|
• |
making acquisitions for similar or complementary products or services; or |
|
|
• |
impeding Snapchat’s accessibility and usability by modifying existing hardware and software on which the Snapchat application operates. |
As a result, our competitors may acquire and engage users at the expense of our user growth or engagement, which may seriously harm our business.
We believe that our ability to compete effectively depends on many factors, many of which are beyond our control, including:
|
|
• |
the usefulness, novelty, performance, and reliability of our products compared to our competitors; |
|
|
• |
the number and demographics of our Daily Active Users; |
|
|
• |
the timing and market acceptance of our products, including developments and enhancements of our competitors’ products; |
|
|
• |
our ability to monetize our products; |
|
|
• |
the effectiveness of our advertising and sales teams; |
|
|
• |
the effectiveness of our advertising products; |
|
|
• |
our ability to establish and maintain advertisers’ and partners’ interest in using Snapchat; |
15
|
|
• |
the frequency, relative prominence, and type of advertisements displayed on our application or by our competitors; |
|
|
• |
the effectiveness of our customer service and support efforts; |
|
|
• |
the effectiveness of our marketing activities; |
|
|
• |
changes as a result of legislation, regulatory authorities, or litigation, including settlements and consent decrees, some of which may have a disproportionate effect on us; |
|
|
• |
acquisitions or consolidation within our industry; |
|
|
• |
our ability to attract, retain, and motivate talented employees, particularly engineers and sales personnel; |
|
|
• |
our ability to successfully acquire and integrate companies and assets; |
|
|
• |
our ability to cost-effectively manage and scale our rapidly growing operations; and |
|
|
• |
our reputation and brand strength relative to our competitors. |
If we cannot effectively compete, our user engagement may decrease, which could make us less attractive to users, advertisers, and partners and seriously harm our business.
We have incurred operating losses in the past, expect to incur operating losses in the future, and may never achieve or maintain profitability.
We began commercial operations in 2011 and for all of our history we have experienced net losses and negative cash flows from operations. As of December 31, 2017, we had an accumulated deficit of $4.7 billion and for the year ended December 31, 2017, we experienced a net loss of $3.4 billion. We expect our operating expenses to increase in the future as we expand our operations. If our revenue does not grow at a greater rate than our expenses, we will not be able to achieve and maintain profitability. We may incur significant losses in the future for many reasons, including without limitation the other risks and uncertainties described in this report. Additionally, we may encounter unforeseen expenses, operating delays, or other unknown factors that may result in losses in future periods. If our expenses exceed our revenue, our business may be seriously harmed and we may never achieve or maintain profitability.
The loss of one or more of our key personnel, or our failure to attract and retain other highly qualified personnel in the future, could seriously harm our business.
We depend on the continued services and performance of our key personnel, including Evan Spiegel and Robert Murphy. Although we have entered into employment agreements with Mr. Spiegel and Mr. Murphy, the agreements are at-will, which means that they may resign or could be terminated for any reason at any time. Mr. Spiegel and Mr. Murphy are high profile individuals who have received threats in the past and are likely to continue to receive threats in the future. While Mr. Spiegel, as CEO, has been responsible for our company’s strategic vision and Mr. Murphy, as CTO, developed the Snapchat application’s technical foundation, should either of them stop working for us for any reason, it is unlikely that the other co-founder would be able to fulfill the responsibilities of the departing co-founder. Nor is it likely that we would be able to immediately find a suitable replacement. The loss of key personnel, including members of management and key engineering, product development, marketing, and sales personnel, could disrupt our operations and seriously harm our business.
As we continue to grow, we cannot guarantee we will continue to attract and retain the personnel we need to maintain our competitive position. In particular, we intend to hire a significant number of engineering and sales personnel in the Los Angeles area, and we expect to face significant competition in hiring them and difficulties in attracting qualified personnel to move to the Los Angeles area.
As we mature, the incentives to attract, retain, and motivate employees provided by our equity awards or by future arrangements, such as through cash bonuses, may not be as effective as in the past. Additionally, we have many current employees whose equity ownership in our company gives them a substantial amount of personal wealth. Likewise, we have many current employees with fully vested equity awards who received substantial amounts of our capital stock on or after our IPO. Now that the lock-up period has expired, attrition may increase. Additionally, if we issue significant equity to attract and retain employees, we would incur substantial additional stock-based compensation expense and the ownership of our existing stockholders would be further diluted. As a result, it may be difficult for us to continue to retain and motivate these
16
employees, and this wealth could affect their decision about whether they continue to work for us. If we do not succeed in attracting, hiring, and integrating excellent personnel, or retaining and motivating existing personnel, we may be unable to grow effectively and our business could be seriously harmed.
We have a short operating history and a new business model, which makes it difficult to evaluate our prospects and future financial results and increases the risk that we will not be successful.
We began commercial operations in 2011 and began meaningfully monetizing Snapchat in 2015. We have a short operating history and a new business model, which makes it difficult to effectively assess our future prospects. Accordingly, we believe that investors’ future perceptions and expectations, which can be idiosyncratic and vary widely, and which we do not control, will affect our stock price. Our business model is based on reinventing the camera to improve the way that people live and communicate. You should consider our business and prospects in light of the challenges we face, including the ones discussed in this section.
If our security is compromised or if our platform is subjected to attacks that frustrate or thwart our users’ ability to access our products and services, our users, advertisers, and partners may cut back on or stop using our products and services altogether, which could seriously harm our business.
Our efforts to protect the information that our users have shared with us may be unsuccessful due to the actions of third parties, software bugs or other technical malfunctions, employee error or malfeasance, or other factors. In addition, third parties may attempt to fraudulently induce employees or users to disclose information to gain access to our data or our users’ data. If any of these events occur, our or our users’ information could be accessed or disclosed improperly. We have previously suffered the loss of employee information related to an employee error. Our Privacy Policy governs how we may use and share the information that our users have provided us. Some advertisers and partners may store information that we share with them. If these third parties fail to implement adequate data-security practices or fail to comply with our terms and policies, our users’ data may be improperly accessed or disclosed. And even if these third parties take all these steps, their networks may still suffer a breach, which could compromise our users’ data.
Any incidents where our users’ information is accessed without authorization, or is improperly used, or incidents that violate our Terms of Service or policies, could damage our reputation and our brand and diminish our competitive position. In addition, affected users or government authorities could initiate legal or regulatory action against us over those incidents, which could cause us to incur significant expense and liability or result in orders or consent decrees forcing us to modify our business practices. Maintaining the trust of our users is important to sustain our growth, retention, and user engagement. Concerns over our privacy practices, whether actual or unfounded, could damage our reputation and brand and deter users, advertisers, and partners from using our products and services. Any of these occurrences could seriously harm our business.
We are also subject to many federal, state, and foreign laws and regulations, including those related to privacy, rights of publicity, content, data protection, content regulation, intellectual property, health and safety, competition, protection of minors, consumer protection, employment, and taxation. These laws and regulations are constantly evolving and may be interpreted, applied, created, or amended in a manner that could seriously harm our business.
In addition, in December 2014, the U.S. Federal Trade Commission, or the FTC, resolved an investigation into some of our early practices by issuing a final order. That order requires, among other things, that we establish a robust privacy program to govern how we treat user data. During the 20-year term of the order, we must complete bi-annual independent privacy audits. In addition, in June 2014, we entered into a 10-year assurance of discontinuance with the Attorney General of Maryland implementing similar practices, including measures to prevent minors under the age of 13 from creating accounts and providing annual compliance reports. Violating existing or future regulatory orders or consent decrees could subject us to substantial monetary fines and other penalties that could seriously harm our business.
Our user metrics and other estimates are subject to inherent challenges in measurement, and real or perceived inaccuracies in those metrics may seriously harm and negatively affect our reputation and our business.
We regularly review metrics, including our Daily Active Users and ARPU metrics, to evaluate growth trends, measure our performance, and make strategic decisions. These metrics are calculated using internal company data and have not been validated by an independent third party. While these numbers are based on what we believe to be reasonable estimates of our user base for the applicable period of measurement, there are inherent challenges in measuring how our products are used across large populations globally. For example, we believe that there are individuals who have multiple Snapchat accounts, even though we forbid that in our Terms of Service and implement measures to detect and suppress that behavior. Our user metrics are also affected by technology on certain mobile devices that automatically runs in the background of our Snapchat application when another phone function is used, and this activity can cause our system to miscount the user metrics associated with such account.
17
Some of our demographic data may be incomplete or inaccurate. For example, because users self-report their dates of birth, our age-demographic data may differ from our users’ actual ages. And because users who signed up for Snapchat before June 2013 were not asked to supply their date of birth, we exclude those users and estimate their ages based on a sample of the self-reported ages we do have. If our Daily Active Users provide us with incorrect or incomplete information regarding their age or other attributes, then our estimates may prove inaccurate and fail to meet investor expectations.
In the past we have relied on third-party analytics providers to calculate our metrics, but today we rely primarily on our analytics platform that we developed and operate. For example, before June 2015, we used a third party that counted a Daily Active User when the application was opened or a notification was received via the application on any device. We now use an analytics platform that we developed and operate and we count a Daily Active User only when a user opens the application and only once per user per day. We believe this methodology more accurately measures our user engagement. We have multiple pipelines of user data that we use to determine whether a user has opened the application during a particular day, and thus is a Daily Active User. This provides redundancy in the event one pipeline of data were to become unavailable for technical reasons, and also gives us redundant data to help measure how users interact with our application.
Additionally, to align our pre-June 2015 Daily Active Users with this new methodology, we reduced our pre-June 2015 Daily Active Users by 4.8%, the amount by which we estimated the data generated by the third party was overstated. Since this adjustment is an estimate, the actual pre-June 2015 Daily Active Users may be higher or lower than our reported numbers. As a result, our metrics may not be comparable to prior periods.
Errors or inaccuracies in our metrics or data could result in incorrect business decisions and inefficiencies. For instance, if a significant understatement or overstatement of Daily Active Users were to occur, we may expend resources to implement unnecessary business measures or fail to take required actions to attract a sufficient number of users to satisfy our growth strategies. We believe that we do not capture all data regarding our Daily Active Users. This generally occurs because of technical issues, like when our systems do not record data from every user’s Snapchat application. We also seek to identify missed activity when data is lost or not captured, which may result in understated metrics. For example, a user may open the Snapchat application and contact our servers but not be recorded as a Daily Active User. We are continually seeking to address technical issues and improve our accuracy, such as comparing our Daily Active Users with data received from other pipelines, including data recorded by our servers and systems. But given the complexity of the systems involved and the rapidly changing nature of mobile devices and systems, we expect these issues to continue. If advertisers, partners, or investors do not perceive our user, geographic, or other demographic metrics to be accurate representations of our user base, or if we discover material inaccuracies in our user, geographic, or other demographic metrics, our reputation may be seriously harmed. And at the same time, advertisers and partners may be less willing to allocate their budgets or resources to Snapchat, which could seriously harm our business. In addition, we measure our Daily Active Users by calculating the daily average of users across the quarter. This calculation may mask any individual months within the quarter that are significantly higher or lower than the average.
Mobile malware, viruses, hacking and phishing attacks, spamming, and improper or illegal use of Snapchat could seriously harm our business and reputation.
Mobile malware, viruses, hacking, and phishing attacks have become more prevalent and sophisticated in our industry, have occurred on our systems in the past, and may occur on our systems in the future. Because of our prominence, we believe that we are an attractive target for these sorts of attacks. Although it is difficult to determine what, if any, harm may directly result from an interruption or attack, any failure to detect such attack and maintain performance, reliability, security, and availability of our products and technical infrastructure to the satisfaction of our users may seriously harm our reputation and our ability to retain existing users and attract new users.
In addition, spammers attempt to use our products to send targeted and untargeted spam messages to users, which may embarrass or annoy users and make our products less user friendly. We cannot be certain that the technologies that we have developed to repel spamming attacks will be able to eliminate all spam messages from our products. Our actions to combat spam may also require diversion of significant time and focus of our engineering team from improving our products. As a result of spamming activities, our users may use our products less or stop using them altogether, and result in continuing operational cost to us.
Similarly, terror and other criminal groups may use our products to promote their goals and encourage users to engage in terror and other illegal activities. We expect that as more people use our products, these groups will increasingly seek to misuse our products. Although we invest resources to combat these activities, including by suspending or terminating accounts we believe are violating our Terms of Service and Community Guidelines, we expect these groups will continue to
18
seek ways to act inappropriately and illegally on Snapchat. Combating these groups requires our engineering team to divert significant time and focus from improving our products. In addition, we may not be able to control or stop Snapchat from becoming the preferred application of use by these groups, which may become public knowledge and seriously harm our reputation or lead to lawsuits or attention from regulators. If these activities increase on Snapchat, our reputation, user growth and user engagement, and operational cost structure could be seriously harmed.
Because we store, process, and use data, some of which contains personal information, we are subject to complex and evolving federal, state, and foreign laws and regulations regarding privacy, data protection, content, and other matters. Many of these laws and regulations are subject to change and uncertain interpretation, and could result in investigations, claims, changes to our business practices, increased cost of operations, and declines in user growth, retention, or engagement, any of which could seriously harm our business.
We are subject to a variety of laws and regulations in the United States and other countries that involve matters central to our business, including user privacy, security, rights of publicity, data protection, content, intellectual property, distribution, electronic contracts and other communications, competition, protection of minors, consumer protection, taxation, and online-payment services. These laws can be particularly restrictive in countries outside the United States. Both in the United States and abroad, these laws and regulations constantly evolve and remain subject to significant change. In addition, the application and interpretation of these laws and regulations are often uncertain, particularly in the new and rapidly evolving industry in which we operate. Because we store, process, and use data, some of which contains personal information, we are subject to complex and evolving federal, state, and foreign laws and regulations regarding privacy, data protection, content, and other matters. Many of these laws and regulations are subject to change and uncertain interpretation, and could result in investigations, claims, changes to our business practices, increased cost of operations, and declines in user growth, retention, or engagement, any of which could seriously harm our business.
Several proposals have recently been adopted or are currently pending before federal, state, and foreign legislative and regulatory bodies that could significantly affect our business. The General Data Protection Regulation in the European Union, which will go into effect on May 25, 2018, may require us to change our policies and procedures and, if we are not compliant, may seriously harm our business.
Our financial condition and results of operations will fluctuate from quarter to quarter, which makes them difficult to predict.
Our quarterly results of operations have fluctuated in the past and will fluctuate in the future. Additionally, we have a limited operating history with the current scale of our business, which makes it difficult to forecast our future results. As a result, you should not rely on our past quarterly results of operations as indicators of future performance. You should take into account the risks and uncertainties frequently encountered by companies in rapidly evolving markets. Our financial condition and results of operations in any given quarter can be influenced by numerous factors, many of which we are unable to predict or are outside of our control, including:
|
|
• |
our ability to maintain and grow our user base and user engagement; |
|
|
• |
the development and introduction of new or redesigned products or services by us or our competitors; |
|
|
• |
the ability of our data service providers to scale effectively and timely provide the necessary technical infrastructure to offer our service; |
|
|
• |
our ability to attract and retain advertisers in a particular period; |
|
|
• |
seasonal fluctuations in spending by our advertisers and product usage by our users, each of which may change as our product offerings evolve or as our business grows; |
|
|
• |
the number of advertisements shown to users; |
|
|
• |
the pricing of our advertisements and other products; |
|
|
• |
our ability to demonstrate to advertisers the effectiveness of our advertisements; |
|
|
• |
the diversification and growth of revenue sources beyond current advertising; |
|
|
• |
increases in marketing, sales, and other operating expenses that we may incur to grow and expand our operations and to remain competitive; |
|
|
• |
our ability to maintain gross margins and operating margins; |
19
|
|
• |
our ability to accurately forecast consumer demand for our hardware products and adequately manage inventory; |
|
|
• |
system failures or breaches of security or privacy; |
|
|
• |
inaccessibility of Snapchat due to third-party actions; |
|
|
• |
stock-based compensation expense; |
|
|
• |
adverse litigation judgments, settlements, or other litigation-related costs; |
|
|
• |
changes in the legislative or regulatory environment, including with respect to privacy, or enforcement by government regulators, including fines, orders, or consent decrees; |
|
|
• |
fluctuations in currency exchange rates and changes in the proportion of our revenue and expenses denominated in foreign currencies; |
|
|
• |
fluctuations in the market values of our portfolio investments and interest rates; |
|
|
• |
changes in our effective tax rate; |
|
|
• |
announcements by competitors of significant new products or acquisitions; |
|
|
• |
our ability to make accurate accounting estimates and appropriately recognize revenue for our products for which there are no relevant comparable products; |
|
|
• |
changes in accounting standards, policies, guidance, interpretations, or principles; and |
|
|
• |
changes in business or macroeconomic conditions. |
If we are unable to successfully grow our user base and further monetize our products, our business will suffer.
We have made, and are continuing to make, investments to enable users and advertisers to create compelling content and deliver advertising to our users. Existing and prospective Snapchat users and advertisers may not be successful in creating content that leads to and maintains user engagement. We are continuously seeking to balance the objectives of our users and advertisers with our desire to provide an optimal user experience. We do not seek to monetize all of our products and we may not be successful in achieving a balance that continues to attract and retain users and advertisers. If we are not successful in our efforts to grow our user base or if we are unable to build and maintain good relations with our advertisers, our user growth and user engagement and our business may be seriously harmed. In addition, we may expend significant resources to launch new products that we are unable to monetize, which may seriously harm our business.
Additionally, we may not succeed in further monetizing Snapchat. We currently monetize Snapchat by displaying in the application advertisements that we sell and advertisements sold by our partners. As a result, our financial performance and ability to grow revenue could be seriously harmed if:
|
|
• |
we fail to increase or maintain Daily Active Users; |
|
|
• |
we fail to increase or maintain the amount of time spent on Snapchat or usage of our Creative Tools, Chat Service, or Storytelling Platform; |
|
|
• |
partners do not create engaging content for users or renew their agreements with us; |
|
|
• |
advertisers do not continue to introduce engaging advertisements; |
|
|
• |
advertisers reduce their advertising on Snapchat; |
|
|
• |
we fail to maintain good relationships with advertisers or attract new advertisers; or |
|
|
• |
the content on Snapchat does not maintain or gain popularity. |
We cannot assure you that we will effectively manage our growth.
Our employee headcount and the scope and complexity of our business have increased significantly, with the number of full-time employees increasing from 1,859 as of December 31, 2016 to 3,069 as of December 31, 2017. We expect headcount growth to continue for the foreseeable future. The growth and expansion of our business and products create significant challenges for our management, including managing multiple relationships with users, advertisers, partners, and other third parties, and constrain operational and financial resources. If our operations or the number of third-party
20
relationships continues to grow, our information-technology systems and our internal controls and procedures may not adequately support our operations. In addition, some members of our management do not have significant experience managing large global business operations, so our management may not be able to manage such growth effectively. To effectively manage our growth, we must continue to improve our operational, financial, and management processes and systems and effectively expand, train, and manage our employee base.
As our organization continues to grow and we are required to implement more complex organizational management structures, we may also find it increasingly difficult to maintain the benefits of our corporate culture, including our ability to quickly develop and launch new and innovative products. This could negatively affect our business performance and seriously harm our business.
Our costs are growing rapidly, which could seriously harm our business or increase our losses.
Providing our products to our users is costly, and we expect our expenses, including those related to people and hosting, to grow in the future. This expense growth will continue as we broaden our user base, as users increase the number of connections and amount of content they consume and share, as we develop and implement new product features that require more computing infrastructure, and as we hire additional employees to support potential future growth. Historically, our costs have increased each year due to these factors, and we expect to continue to incur increasing costs. Our costs are based on development and release of new products and the addition of users and may not be offset by a corresponding growth of our revenue. We will continue to invest in our global infrastructure to provide our products quickly and reliably to all users around the world, including in countries where we do not expect significant short-term monetization, if any. Our expenses may be greater than we anticipate, and our investments to make our business and our technical infrastructure more efficient may not succeed and may outpace monetization efforts. In addition, we expect to increase marketing, sales, and other operating expenses to grow and expand our operations and to remain competitive. Increases in our costs without a corresponding increase in our revenue would increase our losses and could seriously harm our business and financial performance.
Our business depends on our ability to maintain and scale our technology infrastructure. Any significant disruption to our service could damage our reputation, result in a potential loss of users and decrease in user engagement, and seriously harm our business.
Our reputation and ability to attract, retain, and serve users depends on the reliable performance of Snapchat and our underlying technology infrastructure. We have in the past experienced, and may in the future experience, interruptions in the availability or performance of our products and services from time to time. Our systems may not be adequately designed with the necessary reliability and redundancy to avoid performance delays or outages that could seriously harm our business. If Snapchat is unavailable when users attempt to access it, or if it does not load as quickly as they expect, users may not return to Snapchat as often in the future, or at all. As our user base and the volume and types of information shared on Snapchat continue to grow, we will need an increasing amount of technology infrastructure, including network capacity and computing power, to continue to satisfy our users’ needs. It is possible that we may fail to effectively scale and grow our technology infrastructure to accommodate these increased demands. In addition, our business is subject to interruptions, delays, and failures resulting from earthquakes, other natural disasters, terrorism, and other catastrophic events.
A substantial portion of our network infrastructure is provided by third parties. Any disruption or failure in the services we receive from these providers could harm our ability to handle existing or increased traffic and could seriously harm our business. Any financial or other difficulties these providers face may seriously harm our business. And because we exercise little control over these providers, we are vulnerable to problems with the services they provide.
Our business emphasizes rapid innovation and prioritizes long-term user engagement over short-term financial condition or results of operations. That strategy may yield results that sometimes don’t align with the market’s expectations. If that happens, our stock price may be negatively affected.
Our business is growing and becoming more complex, and our success depends on our ability to quickly develop and launch new and innovative products. We believe our culture fosters this goal. Our focus on complexity and quick reactions could result in unintended outcomes or decisions that are poorly received by our users, advertisers, or partners. We have made, and expect to continue to make, significant investments to develop and launch new products and services and we are not yet able to determine whether users will purchase or use new products and services in the future. Our culture also prioritizes our long-term user engagement over short-term financial condition or results of operations. We frequently make decisions that may reduce our short-term revenue or profitability if we believe that the decisions benefit the aggregate user
21
experience and will thereby improve our financial performance over the long term. For example, we monitor how advertising on Snapchat affects our users’ experiences to ensure we do not deliver too many advertisements to our users, and we may decide to decrease the number of advertisements to ensure our users’ satisfaction in the product. In addition, we improve Snapchat based on feedback provided by our users and partners. These decisions may not produce the long-term benefits that we expect, in which case our user growth and engagement, our relationships with advertisers and partners, and our business could be seriously harmed.
If we are unable to protect our intellectual property, the value of our brand and other intangible assets may be diminished, and our business may be seriously harmed. If we need to license or acquire new intellectual property, we may incur substantial costs.
We aim to protect our confidential proprietary information, in part, by entering into confidentiality agreements and invention assignment agreements with all our employees, consultants, advisors, and any third parties who access or contribute to our proprietary know-how, information, or technology. We also rely on trademark, copyright, patent, trade secret, and domain-name-protection laws to protect our proprietary rights. In the United States and internationally, we have filed various applications to protect aspects of our intellectual property, and we currently hold a number of issued patents in multiple jurisdictions. In the future, we may acquire additional patents or patent portfolios, which could require significant cash expenditures. However, third parties may knowingly or unknowingly infringe our proprietary rights, third parties may challenge proprietary rights held by us, and pending and future trademark and patent applications may not be approved. In addition, effective intellectual property protection may not be available in every country in which we operate or intend to operate our business. In any of these cases, we may be required to expend significant time and expense to prevent infringement or to enforce our rights. Although we have taken measures to protect our proprietary rights, there can be no assurance that others will not offer products or concepts that are substantially similar to ours and compete with our business. In addition, we regularly contribute software source code under open-source licenses and have made other technology we developed available under other open licenses, and we include open-source software in our products. From time to time, we may face claims from third parties claiming ownership of, or demanding release of, the open-source software or derivative works that we have developed using such software, which could include our proprietary source code, or otherwise seeking to enforce the terms of the applicable open-source license. These claims could result in litigation and could require us to make our software source code freely available, seek licenses from third parties to continue offering our products for certain uses, or cease offering the products associated with such software unless and until we can re-engineer them to avoid infringement, which may be very costly. For example, in January 2017, Vaporstream, Inc. filed a complaint against us in the U.S. District Court for the Central District of California. The complaint, which seeks injunctive relief among other remedies, alleges that certain Snapchat features infringe several Vaporstream patents. While we believe their claims are meritless, an unfavorable outcome in this litigation could seriously harm our business. If we are unable to protect our proprietary rights or prevent unauthorized use or appropriation by third parties, the value of our brand and other intangible assets may be diminished, and competitors may be able to more effectively mimic our service and methods of operations. Any of these events could seriously harm our business.
If our users do not continue to contribute content or their contributions are not perceived as valuable to other users, we may experience a decline in user growth, retention, and engagement on Snapchat, which could result in the loss of advertisers and revenue.
Our success depends on our ability to provide Snapchat users with engaging content, which in part depends on the content contributed by our users. If users, including influential users such as world leaders, government officials, celebrities, athletes, journalists, sports teams, media outlets, and brands, do not continue to contribute engaging content to Snapchat, our user growth, retention, and engagement may decline. That, in turn, may impair our ability to maintain good relationships with our advertisers or attract new advertisers, which may seriously harm our business.
Foreign government initiatives to restrict access to Snapchat in their countries could seriously harm our business.
Foreign data protection, privacy, consumer protection, content regulation, and other laws and regulations are often more restrictive than those in the United States. Foreign governments may censor Snapchat in their countries, restrict access to Snapchat from their countries entirely, impose laws on us that require data localization, or impose other restrictions that may affect their citizens’ ability to access Snapchat for an extended period of time or even indefinitely. If foreign governments think we are violating their laws, or for other reasons, they may seek to restrict access to Snapchat, which would give our competitors an opportunity to penetrate geographic markets that we cannot access. As a result, our user growth, retention, and engagement may be seriously harmed, and we may not be able to maintain or grow our revenue as anticipated and our business could be seriously harmed. For example, access to Google, which currently powers our infrastructure, is restricted in China, and we do not know if we will be able to enter the market in a manner acceptable to the Chinese government.
22
Our users may increasingly engage directly with our partners instead of through Snapchat, which may negatively affect our advertising revenue and seriously harm our business.
We allow partners to display their advertisements on Snapchat. Using our products, some partners not only can interact directly with our users, but can also direct our users to content on the partner’s website directly. When users visit a partner’s website, we do not deliver advertisements to these websites. So, if our partners’ websites draw users away from Snapchat, the sort of user activity that generates advertising opportunities may decline, which could negatively affect our advertising revenue. Although we believe that Snapchat reaps significant long-term benefits from increased user engagement on content on Snapchat provided by our partners, these benefits may not offset the possible loss of advertising revenue, in which case our business could be seriously harmed.
If events occur that damage our reputation and brand, our ability to expand our user base, advertisers, and partners may be impaired, and our business may be seriously harmed.
We have developed a brand that we believe has contributed to our success. We also believe that maintaining and enhancing our brand is critical to expanding our user base, advertisers, and partners. Because many of our users join Snapchat on the invitation or recommendation of a friend or family member, one of our primary focuses is on ensuring that our users continue to view Snapchat and our brand favorably so that these referrals continue. Maintaining and enhancing our brand will depend largely on our ability to continue to provide useful, novel, fun, reliable, trustworthy, and innovative products, which we may not do successfully. We may introduce new products, make changes to existing products and services, or require our users to agree to new terms of service related to new and existing products that users do not like, which may negatively affect our brand in the short term, long term, or both. Additionally, our partners’ actions may affect our brand if users do not appreciate what those partners do on Snapchat. In the past, we have experienced, and we expect that in the future we will continue to experience, media, legislative, and regulatory scrutiny of our decisions regarding user privacy or other issues, which may seriously harm our reputation and brand. We may also fail to adequately support the needs of our users, advertisers, or partners, which could erode confidence in our brand. Maintaining and enhancing our brand may require us to make substantial investments and these investments may not be successful. If we fail to successfully promote and maintain our brand or if we incur excessive expenses in this effort, our business may be seriously harmed.
Unfavorable media coverage could seriously harm our business.
We and our founders receive a high degree of media coverage globally. Unfavorable publicity regarding us, for example, our privacy practices, product changes, product quality, litigation, or regulatory activity, or regarding the actions of our partners or our users, could seriously harm our reputation. Such negative publicity could also adversely affect the size, demographics, engagement, and loyalty of our user base and result in decreased revenue, fewer app installs (or increased app un-installs), or slower user growth rates, any of which could seriously harm our business.
If we are not successful in expanding and operating our business in international markets, we may need to lay off employees in those markets, which may seriously harm our reputation and business.
We have rapidly expanded to new international markets, including areas where we do not yet understand the full scope of commerce and culture. In connection with this rapid international expansion we have also hired new employees in many of these markets. This rapid expansion may:
|
|
• |
impede our ability to continuously monitor the performance of our international employees; |
|
|
• |
result in hiring of employees who may not yet fully understand our business, products, and culture; or |
|
|
• |
cause us to expand in markets that may lack the culture and infrastructure needed to adopt our products. |
These issues may eventually lead to layoffs of employees in these markets and may harm our ability to grow our business in these markets.
We have spent and anticipate spending substantial funds in connection with the tax liabilities on the settlement of RSUs. The manner in which we fund these tax liabilities may have an adverse effect on our financial condition.
Given the large number of restricted stock units, or RSUs, that initially settled in connection with our IPO, we expended approximately $206.6 million in the three months ended March 31, 2017 to satisfy tax withholding and remittance obligations. To settle these RSUs, we net-settled the awards by delivering an aggregate of approximately 14.6 million shares of Class A common stock and Class B common stock to RSU holders and withholding an aggregate of approximately 12.1 million shares of Class A common stock and Class B common stock. For the year ended December 31, 2017, we expended approximately $394.2 million to satisfy tax withholding and remittance obligations. We withheld and remitted income taxes at applicable statutory rates based on the then-current value of the underlying shares.
23
To fund the withholding and remittance obligations in the future, we may sell equity securities on our behalf or on behalf of our employees near the applicable settlement dates in an amount that is substantially equivalent to the number of shares of common stock that we withhold in connection with these settlements, such that the newly issued shares should not be dilutive. However, in the event that we issue equity securities, we cannot assure you that we will be able to successfully match the proceeds to the amount of this tax liability. In addition, any such equity financing could result in a decline in our stock price. If we elect not to fully fund tax withholding and remittance obligations through the issuance of equity or we are unable to complete such an offering due to market conditions or otherwise, we may choose to borrow funds under our five-year senior unsecured revolving credit facility, or our Credit Facility, use a substantial portion of our existing cash, or rely on a combination of these alternatives. In the event that we elect to satisfy tax withholding and remittance obligations in whole or in part by drawing on our Credit Facility, our interest expense and principal repayment requirements could increase significantly, which could seriously harm our business.
Our products are highly technical and may contain undetected software bugs or hardware errors, which could manifest in ways that could seriously harm our reputation and our business.
Our products are highly technical and complex. Snapchat and Spectacles, or any other products we may introduce in the future, may contain undetected software bugs, hardware errors, and other vulnerabilities. These bugs and errors can manifest in any number of ways in our products, including through diminished performance, security vulnerabilities, malfunctions, or even permanently disabled products. We have a practice of rapidly updating our products and some errors in our products may be discovered only after a product has been shipped and used by users, and may in some cases be detected only under certain circumstances or after extended use. Spectacles, as an eyewear product, is regulated by the U.S. Food and Drug Administration, or the FDA, and may malfunction in a way that physically harms a user. We offer a limited one-year warranty in the United States and a limited two-year warranty in Europe, and any such defects discovered in our products after commercial release could result in a loss of sales and users, which could seriously harm our business. Any errors, bugs, or vulnerabilities discovered in our code after release could damage our reputation, drive away users, lower revenue, and expose us to damages claims, any of which could seriously harm our business.
We could also face claims for product liability, tort, or breach of warranty. In addition, our product contracts with users contain provisions relating to warranty disclaimers and liability limitations, which may not be upheld. Defending a lawsuit, regardless of its merit, is costly and may divert management’s attention and seriously harm our reputation and our business. In addition, if our liability insurance coverage proves inadequate or future coverage is unavailable on acceptable terms or at all, our business could be seriously harmed.
As our business expands, we may offer credit to our partners to stay competitive, and as a result we may be exposed to credit risk of some of our partners, which may seriously harm our business.
As our business continues to grow and expand, we may decide to engage in business with some of our partners on an open credit basis. While we may monitor individual partner payment capability when we grant open credit arrangements and maintain allowances we believe are adequate to cover exposure for doubtful accounts, we cannot assure investors these programs will be effective in managing our credit risks in the future, especially as we expand our business internationally and engage with partners that we may not be familiar with. If we are unable to adequately control these risks, our business could be seriously harmed.
We may be subject to regulatory investigations and proceedings in the future, which could cause us to incur substantial costs or require us to change our business practices in a way that could seriously harm our business.
It is possible that a regulatory inquiry might force us to change our policies or practices. And were we to violate existing or future regulatory orders or consent decrees, we might incur substantial monetary fines and other penalties that could seriously harm our business. In addition, it is possible that future orders issued by, or enforcement actions initiated by, regulatory authorities could cause us to incur substantial costs or require us to change our business practices in a way that could seriously harm our business.
For example, in December 2014, the FTC resolved an investigation into some of our early practices by issuing a final order. That order requires, among other things, that we establish a robust privacy program to govern how we treat user data. During the 20-year term of the order, we must complete bi-annual independent privacy audits. In addition, in June 2014, we entered into a 10-year assurance of discontinuance with the Attorney General of Maryland implementing similar practices, including measures to prevent minors under the age of 13 from creating accounts and providing annual compliance reports. Violating existing or future regulatory orders or consent decrees could subject us to substantial monetary fines and other penalties that could seriously harm our business. Similarly, we may be subject to additional general inquiries from time to time, which may seriously harm our business.
24
We are currently, and expect to be in the future, party to patent lawsuits and other intellectual property claims that are expensive and time-consuming. If resolved adversely, lawsuits and claims could seriously harm our business.
Companies in the mobile, camera, communication, media, internet, and other technology-related industries own large numbers of patents, copyrights, trademarks, trade secrets, and other intellectual property rights, and frequently enter into litigation based on allegations of infringement, misappropriation, or other violations of intellectual property or other rights. In addition, various “non-practicing entities” that own patents, copyrights, trademarks, trade secrets, and other intellectual property rights often attempt to aggressively assert their rights to extract value from technology companies. Furthermore, from time to time we may introduce new products or make other business changes, including in areas where we currently do not compete, which could increase our exposure to patent, copyright, trademark, trade secret, and other intellectual property rights claims from competitors and non-practicing entities. From time to time, we receive letters from patent holders alleging that some of our products infringe their patent rights and from trademark holders alleging infringement of their trademark rights. We have been subject to litigation with respect to third-party patents, trademarks, and other intellectual property and we expect to continue to be subject to intellectual property litigation.
We rely on a variety of statutory and common-law frameworks for the content we provide our users, including the Digital Millennium Copyright Act, or DMCA, the Communications Decency Act, or CDA, and the fair-use doctrine. The DMCA limits, but does not necessarily eliminate, our potential liability for caching, hosting, listing, or linking to third-party content that may include materials that infringe copyrights or other rights. The CDA further limits our potential liability for content uploaded onto Snapchat by third parties. And the fair-use doctrine (and related doctrines in other countries) limits our potential liability for featuring third-party intellectual property content produced by us for purposes such as reporting, commentary, and parody. However, each of these statutes and doctrines is subject to uncertain judicial interpretation and regulatory and legislative amendments. For example, there are currently efforts underway in Congress to amend the CDA in ways that could expose some Internet platforms to an increased risk of litigation. Moreover, some of these statutes and doctrines provide protection only or primarily in the United States. If the rules around these doctrines change, if international jurisdictions refuse to apply similar protections, or if a court were to disagree with our application of those rules to our service, we could incur liability and our business could be seriously harmed.
From time to time, we are involved in class-action lawsuits and other litigation matters that are expensive and time-consuming. If resolved adversely, lawsuits and other litigation matters could seriously harm our business.
We are involved in numerous lawsuits, including putative class-action lawsuits brought by users, many of which claim statutory damages. We anticipate that we will continue to be a target for lawsuits in the future. Because we have millions of users, the plaintiffs in class-action cases filed against us typically claim enormous monetary damages in the aggregate even if the alleged per-user harm is small or non-existent. For example, beginning on May 16, 2017, we, certain of our officers and directors, and the underwriters of our IPO were named as defendants in securities class actions purportedly brought on behalf of purchasers of our Class A common stock. Any litigation to which we are a party may result in an onerous or unfavorable judgment that may not be reversed on appeal, or we may decide to settle lawsuits on similarly unfavorable terms. Any such negative outcome could result in payments of substantial monetary damages or fines, or changes to our products or business practices, and accordingly our business could be seriously harmed. Although the results of lawsuits and claims cannot be predicted with certainty, management does not believe that the final outcome of those matters that we currently face will seriously harm our business. However, defending these claims is costly and can impose a significant burden on management and employees, and we may receive unfavorable preliminary, interim, or final rulings in the course of litigation, which could seriously harm our business.
We do not have manufacturing capabilities and depend on a single contract manufacturer. If we encounter problems with this contract manufacturer or if the manufacturing process stops or is delayed for any reason, we may not deliver our hardware products, such as Spectacles, to our customers on time, which may seriously harm our business.
We have limited manufacturing experience for our only physical product, Spectacles, and we do not have any internal manufacturing capabilities. Instead, we rely on one contract manufacturer to build Spectacles. Our contract manufacturer is vulnerable to capacity constraints and reduced component availability, and our control over delivery schedules, manufacturing yields, and costs, particularly when components are in short supply, or if we introduce a new product or feature, is limited. In addition, we have limited control over our manufacturer’s quality systems and controls, and therefore must rely on our manufacturer to manufacture our products to our quality and performance standards and specifications. Delays, component shortages, including custom components that are manufactured for us at our direction, and other manufacturing and supply problems could impair the distribution of our products and ultimately our brand. Furthermore, any adverse change in our contract manufacturer’s financial or business condition or our relationship with the contract manufacturer could disrupt our ability to supply our products to our retailers and distributors. If we are required to change our
25
contract manufacturer or assume internal manufacturing operations, we may lose revenue, incur increased costs, and damage our reputation and brand. Qualifying a new contract manufacturer and commencing production is expensive and time-consuming. In addition, if we experience increased demand for our products, we may need to increase our component purchases, contract-manufacturing capacity, and internal test and quality functions. The inability of our contract manufacturers to provide us with adequate supplies of high-quality products could delay our order fulfillment, and may require us to change the design of our products to meet this increased demand. Any redesign would require us to re-qualify our products with any applicable regulatory bodies, which would be costly and time-consuming. This may lead to unsatisfied customers and users and increase costs to us, which could seriously harm our business.
Components used in our products may fail as a result of a manufacturing, design, or other defect over which we have no control, and render our devices inoperable.
We rely on third-party component suppliers to provide some of the functionalities needed to operate and use our products, such as Spectacles. Any errors or defects in that third-party technology could result in errors in our products that could seriously harm our business. If these components have a manufacturing, design, or other defect, they can cause our products to fail and render them permanently inoperable. For example, the typical means by which our Spectacles product connects to mobile devices is by way of a Bluetooth transceiver located in the Spectacles product. If the Bluetooth transceiver in our Spectacles product were to fail, it would not be able to connect to a user’s mobile device and Spectacles would not be able to deliver any content to the mobile device and the Snapchat application. As a result, we would have to replace these products at our sole cost and expense. Should we have a widespread problem of this kind, the reputational damage and the cost of replacing these products could seriously harm our business.
The FDA and other state and foreign regulatory agencies regulate Spectacles. We may develop future products that are regulated as medical devices by the FDA. Government authorities, primarily the FDA and corresponding regulatory agencies, regulate the medical device industry. Unless there is an exemption, we must obtain regulatory approval from the FDA and corresponding agencies before we can market or sell a new regulated product or make a significant modification to an existing product. Obtaining regulatory clearances to market a medical device can be costly and time-consuming, and we may not be able to obtain these clearances or approvals on a timely basis, or at all, for future products. Any delay in, or failure to receive or maintain, clearance or approval for any medical device products under development could prevent us from launching new products. We could seriously harm our business and the ability to sell our products if we experience any product problems requiring FDA reporting, if we fail to comply with applicable FDA and other state or foreign agency regulations, or if we are subject to enforcement actions such as fines, civil penalties, injunctions, product recalls, or failure to obtain FDA or other regulatory clearances or approvals.
We may face inventory risk with respect to our Spectacles products.
We have been and may continue to be exposed to inventory risks related to Spectacles as a result of rapid changes in product cycles and pricing, defective merchandise, changes in consumer demand and consumer spending patterns, changes in consumer tastes with respect to Spectacles products, and other factors. We try to accurately predict these trends and avoid overstocking or understocking inventory. Demand for products, however, can change significantly between the time inventory or components are ordered and the date of sale. The acquisition of certain types of inventory or components may require significant lead-time and prepayment and they may not be returnable. Failure to manage our inventory, supplier commitments, or customer expectations could seriously harm our business.
Our offices are dispersed in various cities, and we do not have a designated headquarters office, which may negatively affect employee morale and could seriously harm our business.
We have many offices, both domestic and abroad, with our principal offices being located in the Los Angeles area. But we do not have one designated headquarters office; we instead have many office buildings that are dispersed throughout the area. This diffuse structure may prevent us from fostering positive employee morale and encouraging social interaction among our employees and different business units. Moreover, because our office buildings are dispersed throughout the area, we may be unable to adequately oversee employees and business functions. If we cannot compensate for these and other issues caused by this geographically dispersed office structure, we may lose employees, which could seriously harm our business.
26
We may face lawsuits or incur liability based on information retrieved from or transmitted over the internet and then posted to Snapchat.
We have faced, currently face, and will continue to face claims relating to information that is published or made available on Snapchat. In particular, the nature of our business exposes us to claims related to defamation, intellectual property rights, rights of publicity and privacy, and personal injury torts. For example, we do not monitor or edit the vast majority of content that appears on Snapchat. This risk is enhanced in certain jurisdictions outside the United States where our protection from liability for third-party actions may be unclear and where we may be less protected under local laws than we are in the United States. In addition, there have been various Congressional efforts to restrict the scope of the protections available to online platforms under Section 230 of the CDA, and our current protections from liability for third-party content in the United States could decrease or change. We could incur significant costs investigating and defending such claims and, if we are found liable, significant damages. We could also face fines or orders restricting or blocking our services in particular geographies as a result of content hosted on our services. For example, recently enacted legislation in Germany may impose significant fines for failure to comply with certain content removal and disclosure obligations. If any of these events occur, our business could be seriously harmed.
We plan to continue expanding our operations abroad where we have limited operating experience and may be subject to increased business and economic risks that could seriously harm our business.
We plan to continue expanding our business operations abroad and translating our products into other languages. Snapchat is currently available in more than 20 languages, and we have offices in more than ten countries. We plan to enter new international markets where we have limited or no experience in marketing, selling, and deploying our products. If we fail to deploy or manage our operations in international markets successfully, our business may suffer. In the future, as our international operations increase, or more of our expenses are denominated in currencies other than the U.S. dollar, our operating results may be more greatly affected by fluctuations in the exchange rates of the currencies in which we do business. In addition, we are subject to a variety of risks inherent in doing business internationally, including:
|
|
• |
political, social, and economic instability; |
|
|
• |
risks related to the legal and regulatory environment in foreign jurisdictions, including with respect to privacy, and unexpected changes in laws, regulatory requirements, and enforcement; |
|
|
• |
potential damage to our brand and reputation due to compliance with local laws, including potential censorship and requirements to provide user information to local authorities; |
|
|
• |
fluctuations in currency exchange rates; |
|
|
• |
higher levels of credit risk and payment fraud; |
|
|
• |
complying with tax requirements of multiple jurisdictions; |
|
|
• |
enhanced difficulties of integrating any foreign acquisitions; |
|
|
• |
complying with a variety of foreign laws, including certain employment laws requiring national collective bargaining agreements that set minimum salaries, benefits, working conditions, and termination requirements; |
|
|
• |
reduced protection for intellectual-property rights in some countries; |
|
|
• |
difficulties in staffing and managing global operations and the increased travel, infrastructure, and compliance costs associated with multiple international locations; |
|
|
• |
regulations that might add difficulties in repatriating cash earned outside the United States and otherwise preventing us from freely moving cash; |
|
|
• |
import and export restrictions and changes in trade regulation; |
|
|
• |
complying with statutory equity requirements; |
|
|
• |
complying with the U.S. Foreign Corrupt Practices Act, the U.K. Bribery Act, and similar laws in other jurisdictions; and |
|
|
• |
export controls and economic sanctions administered by the Department of Commerce Bureau of Industry and Security and the Treasury Department’s Office of Foreign Assets Control. |
27
If we are unable to expand internationally and manage the complexity of our global operations successfully, our business could be seriously harmed.
New legislation that would change U.S. or foreign taxation of international business activities or other tax-reform policies, including the imposition of tax based on gross income, could seriously harm our business.
Reforming the taxation of international businesses has been a priority for politicians, and a wide variety of potential changes have been proposed. Some proposals, several of which have been enacted, impose incremental taxes on gross revenue, regardless of profitability. Due to the large and expanding scale of our international business activities, any changes in the taxation of such activities may increase our worldwide effective tax rate and the amount of taxes we pay and seriously harm our business.
For example, the Tax Cuts and Jobs Act, or the Tax Act, was enacted on December 22, 2017 and significantly reforms the U.S. Internal Revenue Code of 1986, as amended, or the Code. The Tax Act lowers U.S. federal corporate income tax rates, changes the utilization of future net operating loss carryforwards, allows for the expensing of certain capital expenditures, and puts into effect sweeping changes to U.S. taxation of international business activities. As a result, our net U.S. deferred tax assets and corresponding valuation allowances will be revalued at the new U.S. corporate rate. We continue to examine the impact this tax reform legislation may have on our business. The impact of this tax reform on us and on holders of our common stock is uncertain and could seriously harm our business.
Exposure to United Kingdom political developments, including the outcome of the referendum on membership in the European Union, could be costly and difficult to comply with and could seriously harm our business.
In June 2016, a referendum was passed in the United Kingdom to leave the European Union, commonly referred to as “Brexit.” This decision creates an uncertain political and economic environment in the United Kingdom and other European Union countries, even though the formal process for leaving the European Union may take years to complete. This formal process began in March 2017, when the United Kingdom served notice to the European Council under Article 50 of the Treaty of Lisbon. We have licensed a portion of our intellectual property to one of our United Kingdom subsidiaries and have based a significant portion of our non-U.S. operations in the United Kingdom. The long-term nature of the United Kingdom’s relationship with the European Union is unclear and there is considerable uncertainty when any relationship will be agreed and implemented. The political and economic instability created by Brexit has caused and may continue to cause significant volatility in global financial markets and uncertainty regarding the regulation of data protection in the United Kingdom. In particular, it is unclear whether the United Kingdom will enact data protection laws or regulations designed to be consistent with the pending EU General Data Protection Regulation and how data transfers to and from the United Kingdom will be regulated. Brexit could also have the effect of disrupting the free movement of goods, services, and people between the United Kingdom, the European Union, and elsewhere. The full effect of Brexit is uncertain and depends on any agreements the United Kingdom may make to retain access to European Union markets. Consequently, no assurance can be given about the impact of the outcome and our business, including operational and tax policies, may be seriously harmed or require reassessment if our European operations or presence become a significant part of our business.
We plan to continue to make acquisitions and investments in privately held companies, which could require significant management attention, disrupt our business, dilute our stockholders, and seriously harm our business.
As part of our business strategy, we have made and intend to make acquisitions to add specialized employees and complementary companies, products, and technologies, as well as investments in privately held companies in furtherance of our strategic objectives. Our ability to acquire and successfully integrate larger or more complex companies, products, and technologies is unproven. In the future, we may not be able to find other suitable acquisition or investment candidates, and we may not be able to complete acquisitions or investments on favorable terms, if at all. Our previous and future acquisitions and investments may not achieve our goals, and any future acquisitions or investments we complete could be viewed negatively by users, advertisers, partners, or investors. In addition, if we fail to successfully close transactions or integrate new teams, or integrate the products and technologies associated with these acquisitions into our company, our business could be seriously harmed. Any integration process may require significant time and resources, and we may not be able to manage the process successfully. We may not successfully evaluate or use the acquired products, technology, and personnel, or accurately forecast the financial impact of an acquisition or investment transaction, including accounting charges. We may also incur unanticipated liabilities that we assume as a result of acquiring companies. We may have to pay cash, incur debt, or issue equity securities to pay for any acquisition or investment, any of which could seriously harm our business. Selling equity to finance any such acquisition or investment would also dilute our stockholders. Incurring debt would increase our fixed obligations and could also include covenants or other restrictions that would impede our ability to manage our operations.
28
In addition, on average, it has historically taken us approximately one year after the closing of an acquisition to finalize the purchase price allocation. Therefore, it is possible that our valuation of an acquisition may change and result in unanticipated write-offs or charges, impairment of our goodwill, or a material change to the fair value of the assets and liabilities associated with a particular acquisition, any of which could seriously harm our business.
Our acquisition and investment strategy may not succeed if we are unable to remain attractive to target companies or expeditiously close transactions. Issuing shares of Class A common stock to fund an acquisition or investment would cause economic dilution to existing stockholders but not voting dilution. If we develop a reputation for being a difficult acquirer or having an unfavorable work environment, or target companies view our non-voting Class A common stock unfavorably, we may be unable to consummate key acquisition transactions essential to our corporate strategy and our business may be seriously harmed.
If we default on our credit obligations, our operations may be interrupted and our business could be seriously harmed.
We have a Credit Facility that we may draw on to finance our operations, acquisitions, and other corporate purposes, such as funding our tax-withholding and remittance obligations in connection with settling RSUs. If we default on these credit obligations, our lenders may:
|
|
• |
require repayment of any outstanding amounts drawn on our Credit Facility; |
|
|
• |
terminate our Credit Facility; or |
|
|
• |
require us to pay significant damages. |
If any of these events occur, our operations may be interrupted and our ability to fund our operations or obligations, as well as our business, could be seriously harmed. In addition, our Credit Facility contains operating covenants, including customary limitations on the incurrence of certain indebtedness and liens, restrictions on certain intercompany transactions, and limitations on the amount of dividends and stock repurchases. Our ability to comply with these covenants may be affected by events beyond our control, and breaches of these covenants could result in a default under the Credit Facility and any future financial agreements into which we may enter. If not waived, defaults could cause our outstanding indebtedness under our Credit Facility and any future financing agreements that we may enter into to become immediately due and payable. For more information on our Credit Facility, see “Management’s Discussion and Analysis of Financial Condition and Results of Operations—Liquidity and Capital Resources.”
We may have exposure to greater-than-anticipated tax liabilities, which could seriously harm our business.
Our income tax obligations are based on our corporate operating structure and third-party and intercompany arrangements, including the manner in which we develop, value, and use our intellectual property and the valuations of our intercompany transactions. The tax laws applicable to our international business activities, including the laws of the United States and other jurisdictions, are subject to change and uncertain interpretation. The taxing authorities of the jurisdictions in which we operate may challenge our methodologies for valuing developed technology, intercompany arrangements, or transfer pricing, which could increase our worldwide effective tax rate and the amount of taxes we pay and seriously harm our business. Taxing authorities may also determine that the manner in which we operate our business is not consistent with how we report our income, which could increase our effective tax rate and the amount of taxes we pay and seriously harm our business. In addition, our future income taxes could fluctuate because of earnings being lower than anticipated in jurisdictions that have lower statutory tax rates and higher than anticipated in jurisdictions that have higher statutory tax rates, by changes in the valuation of our deferred tax assets and liabilities, or by changes in tax laws, regulations, or accounting principles. We are subject to regular review and audit by U.S. federal and state and foreign tax authorities. Any adverse outcome from a review or audit could seriously harm our business. In addition, determining our worldwide provision for income taxes and other tax liabilities requires significant judgment by management, and there are many transactions where the ultimate tax determination is uncertain. Although we believe that our estimates are reasonable, the ultimate tax outcome may differ from the amounts recorded in our financial statements for such period or periods and may seriously harm our business.
29
Our ability to use our net operating loss carryforwards and certain other tax attributes may be limited, each of which could seriously harm our business.
As of December 31, 2017, we had U.S. federal net operating loss carryforwards of approximately $1.6 billion and state net operating loss carryforwards of approximately $930.2 million. Under Sections 382 and 383 of the Internal Revenue Code of 1986, as amended, or the Code, if a corporation undergoes an “ownership change,” the corporation’s ability to use its pre-change net operating loss carryforwards and other pre-change tax attributes, such as research tax credits, to offset its post-change income and taxes may be limited. In general, an “ownership change” occurs if there is a cumulative change in our ownership by “5% shareholders” that exceeds 50 percentage points over a rolling three-year period. Similar rules may apply under state tax laws. In the event that it is determined that we have in the past experienced an ownership change, or if we experience one or more ownership changes as a result of future transactions in our stock, then we may be limited in our ability to use our net operating loss carryforwards and other tax assets to reduce taxes owed on the net taxable income that we earn. Any limitations on the ability to use our net operating loss carryforwards and other tax assets could seriously harm our business.
Additionally, the Tax Act, which was enacted on December 22, 2017, significantly reforms the Code, including changes to the rules governing net operating loss carryforwards. For net operating loss carryforwards arising in tax years beginning after December 31, 2017, the Tax Act limits a taxpayer’s ability to utilize such carryforwards to 80% of taxable income. In addition, net operating loss carryforwards arising in tax years ending after December 31, 2017 can be carried forward indefinitely, but carryback is generally prohibited. Net operating loss carryforwards generated by us before January 1, 2018 will not be subject to the taxable income limitation and will continue to have a twenty-year carryforward period. However, the changes in the carryforward and carryback periods as well as the new limitation on use of net operating losses may significantly impact our ability to use net operating loss carryforwards generated after December 31, 2017, as well as the timing of any such use, and could seriously harm our business.
If our goodwill or intangible assets become impaired, we may be required to record a significant charge to earnings, which could seriously harm our business.
Under U.S. generally accepted accounting principles, or GAAP, we review our intangible assets for impairment when events or changes in circumstances indicate the carrying value may not be recoverable. Goodwill is required to be tested for impairment at least annually. As of December 31, 2017, we had recorded a total of $806.4 million of goodwill and intangible assets, net related to our acquisitions. An adverse change in market conditions, particularly if such change has the effect of changing one of our critical assumptions or estimates, could result in a change to the estimation of fair value that could result in an impairment charge to our goodwill or intangible assets. Any such material charges may seriously harm our business.
We cannot be certain that additional financing will be available on reasonable terms when needed, or at all, which could seriously harm our business.
We have incurred net losses and negative cash flow from operations for all prior periods, and we may not achieve or maintain profitability. As a result, we may need additional financing. Our ability to obtain additional financing, if and when required, will depend on investor demand, our operating performance, the condition of the capital markets, and other factors. To the extent we use available funds or draw on our Credit Facility, we may need to raise additional funds and we cannot assure investors that additional financing will be available to us on favorable terms when required, or at all. If we raise additional funds through the issuance of equity, equity-linked, or debt securities, those securities may have rights, preferences, or privileges senior to the rights of our Class A common stock, and our existing stockholders may experience dilution. In the event that we are unable to obtain additional financing on favorable terms, our interest expense and principal repayment requirements could increase significantly, which could seriously harm our business.
Payment transactions using Snapcash or future products may subject us to additional regulatory requirements and other risks that could be costly and difficult to comply with and could seriously harm our business.
Our users can use Snapchat to send cash to other users using our Snapcash feature. Depending on how our Snapcash product evolves or whether we develop additional commerce products in the future, we may be subject to a variety of laws and regulations in the United States, Europe, and elsewhere, including those governing money transmission, gift cards, and other prepaid access instruments, electronic funds transfers, anti-money laundering, counter-terrorist financing, gambling, banking and lending, and import and export restrictions. Although we currently use the service of a third party to provide the Snapcash feature, these laws may apply to us in some jurisdictions. To increase flexibility in how our use of Snapcash may evolve and to mitigate regulatory uncertainty, we may be required to apply for certain money-transmitter licenses in the United States, which may generally require us to demonstrate compliance with many domestic laws in these areas. Our
30
efforts to comply with these laws and regulations could be costly and divert management’s time and effort and may still not guarantee compliance. If we are found to violate any of these legal or regulatory requirements, we may be subject to monetary fines or other penalties, such as a cease-and-desist order, or we may be required to make product changes, any of which could seriously harm our business. Moreover, the Snapcash product is not enabled on Snapchat by default, and our users must manually enable the feature within the application, which may prevent the Snapcash product from gaining traction with our users or becoming a material part of our business. We have not recognized revenue related to Snapcash to date.
In addition, we may be subject to a variety of additional risks as a result of Snapcash, including:
|
|
• |
increased costs and diversion of management time and effort and other resources to deal with bad transactions or customer disputes; |
|
|
• |
potential fraudulent or otherwise illegal activity by users or third parties; |
|
|
• |
restrictions on the investment of consumer funds used to make Snapcash transactions; and |
|
|
• |
additional disclosure and reporting requirements. |
If any of these risks occurs, our business may be seriously harmed.
Risks Related to Ownership of Our Class A Common Stock
Holders of Class A common stock have no voting rights. As a result, holders of Class A common stock will not have any ability to influence stockholder decisions.
Class A common stockholders have no voting rights, unless required by Delaware law. As a result, all matters submitted to stockholders will be decided by the vote of holders of Class B common stock and Class C common stock. As of December 31, 2017, Mr. Spiegel and Mr. Murphy control approximately 95.2% of our voting power, and potentially either one of them alone have the ability to control the outcome of all matters submitted to our stockholders for approval. In addition, because our Class A common stock carries no voting rights (except as required by Delaware law), the issuance of the Class A common stock in future offerings, in future stock-based acquisition transactions, or to fund employee equity incentive programs could prolong the duration of Mr. Spiegel’s and Mr. Murphy’s current relative ownership of our voting power and their ability to elect certain directors and to determine the outcome of all matters submitted to a vote of our stockholders. This concentrated control eliminates other stockholders’ ability to influence corporate matters and, as a result, we may take actions that our stockholders do not view as beneficial. As a result, the market price of our Class A common stock could be adversely affected.
We cannot predict the impact our capital structure and the concentrated control by our founders may have on our stock price or our business.
Although other U.S.-based companies have publicly traded classes of non-voting stock, to our knowledge, no other public company has listed only non-voting stock on a U.S. stock exchange. We cannot predict whether this structure, combined with the concentrated control by Mr. Spiegel and Mr. Murphy, will result in a lower trading price or greater fluctuations in the trading price of our Class A common stock, or will result in adverse publicity or other adverse consequences. In addition, some indexes are considering whether to exclude non-voting stock, like our Class A common stock, from their membership. For example, in July 2017, FTSE Russell, a provider of widely followed stock indexes, stated that it plans to require new constituents of its indexes to have at least five percent of their voting rights in the hands of public stockholders. In addition, in July 2017, S&P Dow Jones, another provider of widely followed stock indexes, stated that companies with multiple share classes will not be eligible for certain of their indexes. As a result, our Class A common stock will likely not be eligible for these stock indexes. We cannot assure you that other stock indexes will not take a similar approach to FTSE Russell or S&P Dow Jones in the future. Exclusion from indexes could make our Class A common stock less attractive to investors and, as a result, the market price of our Class A common stock could be adversely affected.
Because our Class A common stock is non-voting, we and our stockholders are exempt from certain provisions of U.S. securities laws. This may limit the information available to holders of our Class A common stock.
Because our Class A common stock is non-voting, significant holders of our common stock are exempt from the obligation to file reports under Sections 13(d), 13(g), and 16 of the Exchange Act. These provisions generally require periodic reporting of beneficial ownership by significant stockholders, including changes in that ownership. For example, in November 2017, Tencent Holdings Limited notified us that it, together with its affiliates, acquired 145,778,246 shares of our
31
non-voting Class A common stock via open market purchases. As a result of our capital structure, Tencent and Snap are not obligated to disclose changes in Tencent’s ownership of our Class A common stock, so there can be no assurance that you, or we, will be notified of any such changes. Our directors and officers are required to file reports under Section 16 of the Exchange Act. Our significant stockholders, other than directors and officers, are exempt from the “short-swing” profit recovery provisions of Section 16 of the Exchange Act and related rules with respect to their purchases and sales of our securities. As such, stockholders will be unable to bring derivative claims for disgorgement of profits for trades by significant stockholders under Section 16(b) of the Exchange Act unless the significant stockholders are also directors or officers.
Since our Class A common stock is our only class of stock registered under Section 12 of the Exchange Act and that class is non-voting, we are not required to file proxy statements or information statements under Section 14 of the Exchange Act, unless a vote of the Class A common stock is required by applicable law. Accordingly, legal causes of action and remedies under Section 14 of the Exchange Act for inadequate or misleading information in proxy statements may not be available to holders of our Class A common stock. If we do not deliver any proxy statements, information statements, annual reports, and other information and reports to the holders of our Class B common stock and Class C common stock, then we will similarly not provide any of this information to holders of our Class A common stock. Because we are not required to file proxy statements or information statements under Section 14 of the Exchange Act, any proxy statement, information statement, or notice of our annual meeting may not include all information under Section 14 of the Exchange Act that a public company with voting securities registered under Section 12 of the Exchange Act would be required to provide to its stockholders. Most of that information, however, will be reported in other public filings. For example, any disclosures required by Part III of Form 10-K as well as disclosures required by the NYSE for the year ended December 31, 2017 that are customarily included in a proxy statement are instead included in this Form 10-K, rather than a proxy statement. But some information required in a proxy statement or information statement is not required in any other public filing. For example, we will not be required to comply with the proxy access rules under Section 14 of the Exchange Act. If we take any action in an extraordinary meeting of stockholders where the holders of Class A common stock are not entitled to vote, we will not be required to provide the information required under Section 14 of the Exchange Act. Nor will we be required to file a preliminary proxy statement under Section 14 of the Exchange Act. Since that information is also not required in a Form 10-K, holders of Class A common stock may not receive the information required under Section 14 of the Exchange Act with respect to extraordinary meetings of stockholders. In addition, we are not subject to the “say-on-pay” and “say-on-frequency” provisions of the Dodd–Frank Act. As a result, our stockholders do not have an opportunity to provide a non-binding vote on the compensation of our executive officers. Moreover, holders of our Class A common stock will be unable to bring matters before our annual meeting of stockholders or nominate directors at such meeting, nor can they submit stockholder proposals under Rule 14a-8 of the Exchange Act.
The trading price of our Class A common stock has been and will likely continue to be volatile.
The trading price of our Class A common stock has been and is likely to continue to be volatile. Shares of Class A common stock were sold in our IPO in March 2017 at a price of $17.00 per share. Since then, the trading price of our Class A common stock has ranged from $11.28 to $29.44 through December 31, 2017. The market price of our Class A common stock may fluctuate or decline significantly in response to numerous factors, many of which are beyond our control, including:
|
|
• |
actual or anticipated fluctuations in our user growth, retention, engagement, revenue, or other operating results; |
|
|
• |
variations between our actual operating results and the expectations of securities analysts, investors, and the financial community; |
|
|
• |
our plans to not provide financial guidance or projections, which may increase the probability that our financial results are perceived as not in line with analysts’ expectations; |
|
|
• |
any forward-looking financial or operating information we may provide to the public or securities analysts, any changes in this information, or our failure to meet expectations based on this information; |
|
|
• |
actions of securities analysts who initiate or maintain coverage of us, changes in financial estimates by any securities analysts who follow our company, or our failure to meet these estimates or the expectations of investors; |
|
|
• |
whether investors or analysts view our capital structure unfavorably, particularly our non-voting Class A common stock and the significant voting control of our co-founders; |
|
|
• |
additional shares of our common stock being sold into the market by us or our existing stockholders, or the anticipation of such sales, including if we issue shares to satisfy RSU-related tax obligations; |
32
|
|
• |
announcements by us or our competitors of significant products or features, technical innovations, acquisitions, strategic partnerships, joint ventures, or capital commitments; |
|
|
• |
announcements by us or estimates by third parties of actual or anticipated changes in the size of our user base or the level of user engagement; |
|
|
• |
changes in operating performance and stock market valuations of technology companies in our industry, including our partners and competitors; |
|
|
• |
price and volume fluctuations in the overall stock market, including as a result of trends in the economy as a whole; |
|
|
• |
lawsuits threatened or filed against us; |
|
|
• |
developments in new legislation and pending lawsuits or regulatory actions, including interim or final rulings by judicial or regulatory bodies; and |
|
|
• |
other events or factors, including those resulting from war or incidents of terrorism, or responses to these events. |
In addition, extreme price and volume fluctuations in the stock markets have affected and continue to affect many technology companies’ stock prices. Often, their stock prices have fluctuated in ways unrelated or disproportionate to the companies’ operating performance. In the past, stockholders have filed securities class-action litigation following periods of market volatility. Beginning on May 16, 2017, we, certain of our officers and directors, and the underwriters for our IPO were named as defendants in securities class actions purportedly brought on behalf of purchasers of our Class A common stock. This litigation could subject us to substantial costs, divert resources and the attention of management from our business, and seriously harm our business.
Delaware law and provisions in our amended and restated certificate of incorporation and amended and restated bylaws could make a merger, tender offer, or proxy contest difficult, thereby depressing the trading price of our Class A common stock.
Our amended and restated certificate of incorporation and amended and restated bylaws contain provisions that could depress the trading price of our Class A common stock by acting to discourage, delay, or prevent a change of control of our company or changes in our management that the stockholders of our company may deem advantageous. These provisions include the following:
|
|
• |
our amended and restated certificate of incorporation provides for a tri-class capital structure. As a result of this structure, Mr. Spiegel and Mr. Murphy control all stockholder decisions. As a result of Mr. Spiegel’s RSU award, Mr. Spiegel alone may exercise voting control over our outstanding capital stock. If they vote together, they will have control over all stockholder matters. This includes the election of directors and significant corporate transactions, such as a merger or other sale of our company or our assets. This concentrated control could discourage others from initiating any potential merger, takeover, or other change-of-control transaction that other stockholders may view as beneficial. As noted above, the issuance of the Class A common stock dividend, and any future issuances of Class A common stock dividends, could have the effect of prolonging the influence of Mr. Spiegel and Mr. Murphy on the company; |
|
|
• |
our board of directors has the right to elect directors to fill a vacancy created by the expansion of the board of directors or the resignation, death, or removal of a director, which prevents stockholders from being able to fill vacancies on our board of directors; |
|
|
• |
our amended and restated certificate of incorporation prohibits cumulative voting in the election of directors. This limits the ability of minority stockholders to elect director candidates; and |
|
|
• |
our board of directors may issue, without stockholder approval, shares of undesignated preferred stock. The ability to issue undesignated preferred stock makes it possible for our board of directors to issue preferred stock with voting or other rights or preferences that could impede the success of any attempt to acquire us. |
Any provision of our amended and restated certificate of incorporation, amended and restated bylaws, or Delaware law that has the effect of delaying or deterring a change in control could limit the opportunity for our stockholders to receive a premium for their shares of our common stock, and could also affect the price that some investors are willing to pay for our Class A common stock.
33
An active trading market for our Class A common stock may not be sustained.
Our Class A common stock is listed on the NYSE under the symbol “SNAP.” However, we cannot assure you that an active trading market for our Class A common stock will be sustained or maintained. In addition, we cannot assure you that the liquidity of any trading market will provide stockholders the ability to sell shares of our Class A common stock when or at prices that they desire.
Future sales of shares by existing stockholders could cause our stock price to decline.
If our existing stockholders, including employees and service providers who obtain equity, sell, or indicate an intention to sell, substantial amounts of our Class A common stock in the public market, the trading price of our Class A common stock could decline. As of December 31, 2017, we had outstanding a total of 883.0 million shares of Class A common stock, 122.6 million shares of Class B common stock, and 216.6 million shares of Class C common stock. In addition, as of December 31, 2017, 180.3 million shares of Class A common stock, 21.0 million shares of Class B common stock, and 34.3 million shares of Class C common stock were subject to outstanding stock options and RSUs. All of our outstanding shares, other than approximately 50 million shares of Class A common stock issued in our IPO which are subject to one-year lock-up agreements with us, and 498.6 million shares (including options exercisable as of December 31, 2017) held by directors, executive officers, and other affiliates that are subject to volume limitations under Rule 144 of the Securities Act are eligible for sale in the public market. Our employees, other service providers, and directors are subject to our quarterly trading window closures.
The shares subject to outstanding stock options and RSUs will become eligible for sale in the public market to the extent permitted by the provisions of various vesting agreements and subject to Rule 144 limitations applicable to affiliates. We filed a registration statement on Form S-8 under the Securities Act covering all the shares of Class A common stock subject to outstanding stock options or otherwise reserved for issuance under our equity incentive plans, as well as shares of Class A common stock issuable on conversion of Class B common stock. Shares covered by the Form S-8 registration statement are eligible for sale in the public markets, subject to Rule 144 limitations applicable to affiliates. If these additional shares are sold, or if it is perceived that they will be sold in the public market, the trading price of our Class A common stock could decline.
If securities or industry analysts either do not publish research about us, or publish inaccurate or unfavorable research about us, our business, or our market, or if they change their recommendations regarding our common stock adversely, the trading price or trading volume of our Class A common stock could decline.
The trading market for our Class A common stock is influenced in part by the research and reports that securities or industry analysts may publish about us, our business, our market, or our competitors. If one or more of the analysts initiate research with an unfavorable rating or downgrade our Class A common stock, provide a more favorable recommendation about our competitors, or publish inaccurate or unfavorable research about our business, our Class A common stock price would likely decline. If any analyst who may cover us were to cease coverage of us or fail to regularly publish reports on us, we could lose visibility in the financial markets, which in turn could cause the trading price or trading volume to decline. Since we do not provide financial guidance or projections, this may increase the probability that our financial results are perceived as not in line with analysts’ expectations, and could cause volatility to our Class A common stock price.
We are an emerging growth company, and any decision on our part to comply only with certain reduced reporting and disclosure requirements applicable to emerging growth companies could make our Class A common stock less attractive to investors.
We are an emerging growth company, and, for as long as we continue to be an emerging growth company, we may choose to take advantage of exemptions from various reporting requirements applicable to other public companies but not to “emerging growth companies,” including:
|
|
• |
not being required to have our independent registered public accounting firm audit our internal control over financial reporting under Section 404 of the Sarbanes-Oxley Act; |
|
|
• |
reduced disclosure obligations regarding executive compensation in our periodic reports and annual report on Form 10-K; and |
|
|
• |
exemptions from the requirements of holding nonbinding advisory votes on executive compensation and stockholder approval of any golden parachute payments not previously approved. |
34
We can continue to be an emerging growth company, as defined in the JOBS Act, for up to five years following our IPO. We do not currently expect to continue to be an emerging growth company for five years and, therefore, do not expect to be able to take advantage of these various exemptions. However, so long as our Class A common stock remains both non-voting and our only publicly traded class of stock, we will not be subject to the requirements of holding nonbinding advisory votes on executive compensation and any golden parachute payments because we would not be subject to the provisions of the Dodd-Frank Wall Street Reform and Consumer Protection Act, or the Dodd-Frank Act, mandating advisory votes.
We cannot predict if investors will find our Class A common stock less attractive if we choose to rely on any of the exemptions afforded emerging growth companies. If some investors find our Class A common stock less attractive because we rely on any of these exemptions, there may be a less active trading market for our Class A common stock and the market price of our Class A common stock may be more volatile.
Under the JOBS Act, emerging growth companies can also delay adopting new or revised accounting standards until such time as those standards apply to private companies. We have irrevocably elected not to avail ourselves of this accommodation allowing for delayed adoption of new or revised accounting standards, and therefore, we will be subject to the same new or revised accounting standards as other public companies that are not emerging growth companies.
We do not intend to pay cash dividends for the foreseeable future.
We have never declared or paid cash dividends on our capital stock. We currently intend to retain any future earnings to finance the operation and expansion of our business, and we do not expect to declare or pay any cash dividends in the foreseeable future. As a result, you may only receive a return on your investment in our Class A common stock if the market price of our Class A common stock increases. In addition, our Credit Facility includes restrictions on our ability to pay cash dividends.
We have previously identified material weaknesses in our internal control over financial reporting, and if we are unable to implement and maintain effective internal control over financial reporting in the future, investors may lose confidence in the accuracy and completeness of our financial reports, and the market price of our Class A common stock may be seriously harmed.
We are required to maintain internal control over financial reporting and to report any material weaknesses in those internal controls, subject to any exemptions that we avail ourselves to under the JOBS Act. For example, in 2018 we are required to perform system and process evaluation and testing of our internal control over financial reporting to allow management to report on the effectiveness of our internal control over financial reporting, as required by Section 404 of the Sarbanes-Oxley Act. We are in the process of designing, implementing, and testing internal control over financial reporting required to comply with this obligation. That process is time-consuming, costly, and complicated.
We and our prior independent registered public accounting firm, PricewaterhouseCoopers LLP, identified material weaknesses in our internal control over financial reporting for the year ended December 31, 2014, related to the lack of sufficient qualified accounting personnel, which led to incorrect application of generally accepted accounting principles, insufficiently designed segregation of duties, and insufficiently designed controls over business processes, including the financial statement close and reporting processes with respect to the development of accounting policies, procedures, and estimates. After these material weaknesses were identified, management implemented a remediation plan that included hiring key accounting personnel, creating a formal month-end close process, and establishing more robust processes supporting internal controls over financial reporting, including accounting policies, procedures, and estimates. As of December 31, 2015, we have implemented controls sufficient to remediate the material weaknesses. Our remediation efforts are complete and we did not incur any material costs.
If we identify future material weaknesses in our internal control over financial reporting, if we are unable to comply with the requirements of Section 404 of the Sarbanes-Oxley Act in a timely manner or assert that our internal control over financial reporting is effective, or if our independent registered public accounting firm is unable to express an opinion or expresses a qualified or adverse opinion about the effectiveness of our internal control over financial reporting, investors may lose confidence in the accuracy and completeness of our financial reports and the market price of our Class A common stock could be negatively affected. In addition, we could become subject to investigations by the stock exchange on which our securities are listed, the SEC, and other regulatory authorities, which could require additional financial and management resources.
35
The requirements of being a public company may strain our resources, result in more litigation, and divert management’s attention.
We are subject to the reporting requirements of the Exchange Act, the Sarbanes-Oxley Act, the Dodd-Frank Act, the listing requirements of the NYSE, and other applicable securities rules and regulations. Complying with these rules and regulations will increase our legal and financial compliance costs, make some activities more difficult, time-consuming or costly, and increase demand on our systems and resources. The Exchange Act requires, among other things, that we file annual, quarterly, and current reports with respect to our business and operating results.
By complying with public disclosure requirements, our business and financial condition are more visible, which we believe may result in threatened or actual litigation, including by competitors and other third parties. For example, beginning on May 16, 2017, we, certain of our officers and directors, and the underwriters of our IPO were named as defendants in securities class actions purportedly brought on behalf of purchasers of our Class A common stock. Shareholder litigation can subject us to substantial costs and divert resources and the attention of management from our business. If those claims are successful, our business could be seriously harmed. Even if the claims do not result in litigation or are resolved in our favor, the time and resources needed to resolve them could divert our management’s resources and seriously harm our business.
Our amended and restated certificate of incorporation provides that the Court of Chancery of the State of Delaware and the federal district courts of the United States of America will be the exclusive forums for substantially all disputes between us and our stockholders, which could limit our stockholders’ ability to obtain a favorable judicial forum for disputes with us or our directors, officers, or employees.
Our amended and restated certificate of incorporation provides that the Court of Chancery of the State of Delaware is the exclusive forum for:
|
|
• |
any derivative action or proceeding brought on our behalf; |
|
|
• |
any action asserting a breach of fiduciary duty; |
|
|
• |
any action asserting a claim against us arising under the Delaware General Corporation Law, our amended and restated certificate of incorporation, or our amended and restated bylaws; and |
|
|
• |
any action asserting a claim against us that is governed by the internal-affairs doctrine. |
Our amended and restated certificate of incorporation further provides that the federal district courts of the United States of America will be the exclusive forum for resolving any complaint asserting a cause of action arising under the Securities Act.
These exclusive-forum provisions may limit a stockholder’s ability to bring a claim in a judicial forum that it finds favorable for disputes with us or our directors, officers, or other employees, which may discourage lawsuits against us and our directors, officers, and other employees. If a court were to find either exclusive-forum provision in our amended and restated certificate of incorporation to be inapplicable or unenforceable in an action, we may incur additional costs associated with resolving the dispute in other jurisdictions, which could seriously harm our business.
Item 1B. Unresolved Staff Comments
None.
Our corporate headquarters are located in and around Venice, California, where we hold approximately 690,000 square feet across several locations. As of December 31, 2017, our global facilities totaled an aggregate of approximately 1,144,000 square feet of office space of which about 1,135,500 was leased and 8,500 was owned. For approximately 77,000 square feet of our leased office space, we have assets recorded as buildings, as well as a corresponding long-term liability for our build-to-suit lease agreements where we are considered the deemed owner of these buildings, for accounting purposes. We also maintain offices in multiple locations in the United States and internationally in Europe, Asia, and Australia. We expect to add additional offices as we increase our headcount and expand our business to other continents and countries. We believe that our facilities are sufficient for our current needs and that, should it be needed, additional facilities will be available to accommodate the expansion of our business.
36
We are currently involved in, and may in the future be involved in, legal proceedings, claims, and investigations in the ordinary course of our business, including claims for infringing intellectual property rights related to our products and the content contributed by our users and partners. Although the results of these proceedings, claims, and investigations cannot be predicted with certainty, we do not believe that the final outcome of these matters is reasonably likely to have a material adverse effect on our business, financial condition, or results of operations. Regardless of final outcomes, however, any such proceedings, claims, and investigations may nonetheless impose a significant burden on management and employees and may come with costly defense costs or unfavorable preliminary and interim rulings.
Item 4. Mine Safety Disclosures.
Not applicable.
Item 5. Market for Registrant’s Common Equity, Related Stockholder Matters and Issuer Purchases of Equity Securities.
Market Information for Common Stock
Our Class A common stock has been listed on the NYSE under the symbol “SNAP” since March 2, 2017. Prior to that time, there was no public market for our stock. The following table sets forth for the indicated periods the high and low intra-day sales prices per share for our Class A common stock on the NYSE.
|
|
|
High |
|
|
Low |
|
||
|
First Quarter 2017 (from March 2, 2017) |
|
$ |
29.44 |
|
|
$ |
18.90 |
|
|
Second Quarter 2017 |
|
|
23.57 |
|
|
|
17.00 |
|
|
Third Quarter 2017 |
|
|
17.92 |
|
|
|
11.28 |
|
|
Fourth Quarter 2017 |
|
16.88 |
|
|
12.10 |
|
||
Our Class B common stock and Class C common stock are not listed nor traded on any stock exchange.
Holders of Record
As of December 31, 2017, there were 415 stockholders of record of our Class A common stock, not including shares of our Class A common stock held by brokers. The closing price of our Class A common stock was $14.61 per share as reported on the NYSE. As of December 31, 2017, there were 219 stockholders of record of our Class B common stock and two stockholders of record of our Class C common stock.
Dividend Policy
We have never declared or paid cash dividends on our capital stock. We intend to retain all available funds and future earnings, if any, to fund the development and expansion of our business, and we do not anticipate paying any cash dividends in the foreseeable future. The terms of our Credit Facility also restrict our ability to pay dividends, and we may also enter into credit agreements or other borrowing arrangements in the future that will restrict our ability to declare or pay cash dividends on our capital stock.
We have paid a stock dividend of our Class A common stock on our capital stock in the past and from time to time in the future may pay special or regular stock dividends in the form of Class A common stock, which per the terms of our amended and restated certificate of incorporation must be paid equally to all stockholders. Any future determination regarding the declaration and payment of dividends, if any, will be at the discretion of our board of directors and will depend on then-existing conditions, including our financial condition, operating results, contractual restrictions, capital requirements, business prospects, and other factors our board of directors may deem relevant.
37
Purchases of Equity Securities by the Issuer and Affiliated Purchasers
We had no repurchases of equity securities for the three months ended December 31, 2017.
Recent Sale of Unregistered Securities and Use of Proceeds
Recent Sale of Unregistered Securities
During the three months ended December 31, 2017, we issued or agreed to issue a total of 117,432 shares of our Class A common stock as partial consideration to the stockholders of an entity we acquired in December 2017, all in private transactions exempt from the registration requirements of the Securities Act pursuant to Section 4(2) or Regulation D under the Securities Act.
Use of Proceeds
On March 1, 2017, our Registration Statement on Form S-1 (File No. 333-215866) was declared effective by the SEC for our initial public offering of Class A common stock, pursuant to which we sold an aggregate of 160,349,765 shares of our Class A common stock at an initial public offering price of $17.00 per share. There has been no material change in the planned use of proceeds from our initial public offering as described in our Prospectus.
Stock Performance Graph
This performance graph shall not be deemed “filed” with the SEC for purposes of Section 18 of the Exchange Act, or incorporated by reference into any filing of Snap Inc. under the Securities Act.
The following graph shows a comparison from March 2, 2017 (the date our Class A common stock commenced trading on the NYSE) through December 31, 2017 of the cumulative total return for our Class A common stock, the Standard & Poor’s 500 Stock Index (S&P 500 Index) and the NYSE Composite. The graph assumes that $100 was invested at the market close on March 2, 2017 in our Class A common stock, the S&P 500 Index, and the NYSE Composite and data for the S&P 500 Index and the NYSE Composite assumes reinvestment of any dividends. The stock price performance of the following graph is not necessarily indicative of future stock price performance.
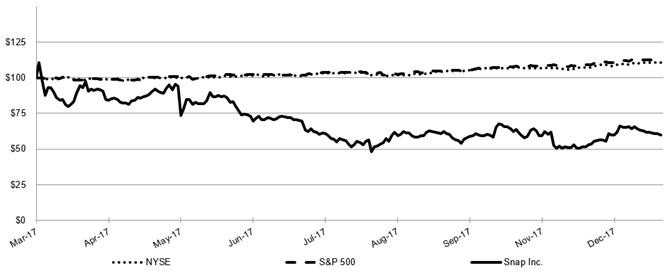
38
Item 6. Selected Financial Data.
The consolidated statements of operations data for each of the years ended December 31, 2017, 2016, and 2015 and the consolidated balance sheets data as of December 31, 2017 and 2016 are derived from our audited consolidated financial statements included in “Financial Statements and Supplementary Data” of this Annual Report on Form 10-K. Our historical results are not necessarily indicative of our results in any future period. You should read the following selected consolidated financial data together with “Management's Discussion and Analysis of Financial Condition and Results of Operations,” and our consolidated financial statements and the related notes included in “Financial Statements and Supplementary Data” of this Annual Report on Form 10-K. The selected consolidated financial data in this section are not intended to replace our consolidated financial statements and the related notes.
|
|
|
Year Ended December 31, |
|
|||||||||
|
|
|
2017 |
|
|
2016 |
|
|
2015 |
|
|||
|
|
|
(in thousands, except per share amounts) |
|
|||||||||
|
Consolidated Statements of Operations Data: |
|
|
|
|
|
|
|
|
|
|
|
|
|
Revenue |
|
$ |
824,949 |
|
|
$ |
404,482 |
|
|
$ |
58,663 |
|
|
Costs and expenses: |
|
|
|
|
|
|
|
|
|
|
|
|
|
Cost of revenue |
|
|
717,462 |
|
|
|
451,660 |
|
|
|
182,341 |
|
|
Research and development |
|
|
1,534,863 |
|
|
|
183,676 |
|
|
|
82,235 |
|
|
Sales and marketing |
|
|
522,605 |
|
|
|
124,371 |
|
|
|
27,216 |
|
|
General and administrative |
|
|
1,535,595 |
|
|
|
165,160 |
|
|
|
148,600 |
|
|
Total costs and expenses |
|
|
4,310,525 |
|
|
|
924,867 |
|
|
|
440,392 |
|
|
Loss from operations |
|
|
(3,485,576 |
) |
|
|
(520,385 |
) |
|
|
(381,729 |
) |
|
Interest income |
|
|
21,096 |
|
|
|
4,654 |
|
|
|
1,399 |
|
|
Interest expense |
|
|
(3,456 |
) |
|
|
(1,424 |
) |
|
|
— |
|
|
Other income (expense), net |
|
|
4,528 |
|
|
|
(4,568 |
) |
|
|
(152 |
) |
|
Loss before income taxes |
|
|
(3,463,408 |
) |
|
|
(521,723 |
) |
|
|
(380,482 |
) |
|
Income tax benefit (expense) |
|
|
18,342 |
|
|
|
7,080 |
|
|
|
7,589 |
|
|
Net loss |
|
$ |
(3,445,066 |
) |
|
$ |
(514,643 |
) |
|
$ |
(372,893 |
) |
|
Net loss per share attributable to Class A, Class B, and Class C common stockholders(1): |
|
|
|
|
|
|
|
|
|
|
|
|
|
Basic |
|
$ |
(2.95 |
) |
|
$ |
(0.64 |
) |
|
$ |
(0.51 |
) |
|
Diluted |
|
$ |
(2.95 |
) |
|
$ |
(0.64 |
) |
|
$ |
(0.51 |
) |
|
Adjusted EBITDA(2) |
|
$ |
(720,056 |
) |
|
$ |
(459,243 |
) |
|
$ |
(292,898 |
) |
|
(1) |
See Note 2 of the notes to our consolidated financial statements included in “Financial Statements and Supplementary Data” for a description of how we compute basic and diluted net loss per share attributable to Class A, Class B, and Class C common stockholders. |
|
(2) |
See “Selected Financial Data—Non-GAAP Financial Measures” below for more information and for a reconciliation of Adjusted EBITDA to net loss, the most directly comparable financial measure calculated and presented in accordance with GAAP. |
|
|
|
December 31, |
|
|||||
|
|
|
2017 |
|
|
2016 |
|
||
|
|
|
(in thousands) |
|
|||||
|
Consolidated Balance Sheet Data: |
|
|
|
|
|
|
|
|
|
Cash, cash equivalents, and marketable securities |
|
$ |
2,043,039 |
|
|
$ |
987,368 |
|
|
Working capital |
|
|
2,020,538 |
|
|
|
1,023,241 |
|
|
Total assets |
|
|
3,421,566 |
|
|
|
1,722,792 |
|
|
Total liabilities |
|
|
429,239 |
|
|
|
203,878 |
|
|
Additional paid-in capital |
|
|
7,634,825 |
|
|
|
2,728,823 |
|
|
Accumulated deficit |
|
|
(4,656,667 |
) |
|
|
(1,207,862 |
) |
|
Total stockholders' equity |
|
|
2,992,327 |
|
|
|
1,518,914 |
|
39
To supplement our consolidated financial statements, which are prepared and presented in accordance with GAAP, we use certain non-GAAP financial measures, as described below, to understand and evaluate our core operating performance. These non-GAAP financial measures, which may be different than similarly titled measures used by other companies, are presented to enhance investors’ overall understanding of our financial performance and should not be considered a substitute for, or superior to, the financial information prepared and presented in accordance with GAAP.
We use the non-GAAP financial measure of Adjusted EBITDA, which is defined as net income (loss); excluding interest income; interest expense; other income (expense), net; income tax benefit (expense); depreciation and amortization; and stock-based compensation expense and related payroll tax expense. We believe that Adjusted EBITDA helps identify underlying trends in our business that could otherwise be masked by the effect of the expenses that we exclude in Adjusted EBITDA.
We use the non-GAAP financial measure of Free Cash Flow, which is defined as net cash used in operating activities, reduced by purchases of property and equipment. We believe Free Cash Flow is an important liquidity measure of the cash that is available, after capital expenditures, for operational expenses and investment in our business and is a key financial indicator used by management. Additionally, we believe that Free Cash Flow is an important measure since we use third-party infrastructure partners to host our services and therefore we do not incur significant capital expenditures to support revenue generating activities. Free Cash Flow is useful to investors as a liquidity measure because it measures our ability to generate or use cash. Once our business needs and obligations are met, cash can be used to maintain a strong balance sheet and invest in future growth.
We believe that both Adjusted EBITDA and Free Cash Flow provide useful information about our financial performance, enhance the overall understanding of our past performance and future prospects, and allow for greater transparency with respect to key metrics used by our management for financial and operational decision-making. We are presenting the non-GAAP measures of Adjusted EBITDA and Free Cash Flow to assist investors in seeing our financial performance through the eyes of management, and because we believe that these measures provide an additional tool for investors to use in comparing our core financial performance over multiple periods with other companies in our industry.
These non-GAAP financial measures should not be considered in isolation from, or as substitutes for, financial information prepared in accordance with GAAP. There are a number of limitations related to the use of these non-GAAP financial measures compared to the closest comparable GAAP measure. Some of these limitations are that:
|
|
• |
Adjusted EBITDA excludes certain recurring, non-cash charges such as depreciation of fixed assets and amortization of acquired intangible assets and, although these are non-cash charges, the assets being depreciated and amortized may have to be replaced in the future; |
|
|
• |
Adjusted EBITDA excludes stock-based compensation expense and related payroll tax expense, which have been, and will continue to be for the foreseeable future, significant recurring expenses in our business and an important part of our compensation strategy; |
|
|
• |
Adjusted EBITDA does not reflect tax payments that reduce cash available to us; and |
|
|
• |
Free Cash Flow does not reflect our future contractual commitments. |
40
The following table presents a reconciliation of Adjusted EBITDA to net loss, the most comparable GAAP financial measure, for each of the periods presented:
|
|
|
Year Ended December 31, |
|
|||||||||
|
|
|
2017 |
|
|
2016 |
|
|
2015 |
|
|||
|
|
|
(in thousands) |
|
|||||||||
|
Adjusted EBITDA reconciliation: |
|
|
|
|
|
|
|
|
|
|
|
|
|
Net loss |
|
|
(3,445,066 |
) |
|
|
(514,643 |
) |
|
|
(372,893 |
) |
|
Add (deduct): |
|
|
|
|
|
|
|
|
|
|
|
|
|
Interest income |
|
|
(21,096 |
) |
|
|
(4,654 |
) |
|
|
(1,399 |
) |
|
Interest expense |
|
|
3,456 |
|
|
|
1,424 |
|
|
|
— |
|
|
Other (income) expense, net |
|
|
(4,528 |
) |
|
|
4,568 |
|
|
|
152 |
|
|
Income tax (benefit) expense |
|
|
(18,342 |
) |
|
|
(7,080 |
) |
|
|
(7,589 |
) |
|
Depreciation and amortization |
|
|
61,288 |
|
|
|
29,115 |
|
|
|
15,307 |
|
|
Stock-based compensation expense |
|
|
2,639,895 |
|
|
|
31,842 |
|
|
|
73,524 |
|
|
Payroll tax expense related to stock-based compensation |
|
|
24,470 |
|
|
|
185 |
|
|
|
— |
|
|
Spectacles inventory-related charges(1) |
|
|
39,867 |
|
|
|
— |
|
|
|
— |
|
|
Adjusted EBITDA |
|
$ |
(720,056 |
) |
|
$ |
(459,243 |
) |
|
$ |
(292,898 |
) |
|
(1) |
Spectacles inventory-related charges were primarily related to excess inventory reserves and inventory purchase commitment cancellation charges in the third quarter of 2017. These charges are non-recurring and not reflective of underlying trends in our business. |
The following table presents a reconciliation of Free Cash Flow to net cash used in operating activities, the most comparable GAAP financial measure, for each of the periods presented:
|
|
|
Year Ended December 31, |
|
|||||||||
|
|
|
2017 |
|
|
2016 |
|
|
2015 |
|
|||
|
|
|
(in thousands) |
|
|||||||||
|
Free Cash Flow reconciliation: |
|
|
|
|
|
|
|
|
|
|
|
|
|
Net cash used in operating activities |
|
$ |
(734,667 |
) |
|
$ |
(611,245 |
) |
|
$ |
(306,622 |
) |
|
Less: |
|
|
|
|
|
|
|
|
|
|
|
|
|
Purchases of property and equipment |
|
|
(84,518 |
) |
|
|
(66,441 |
) |
|
|
(19,205 |
) |
|
Free Cash Flow |
|
$ |
(819,185 |
) |
|
$ |
(677,686 |
) |
|
$ |
(325,827 |
) |
41
Item 7. Management’s Discussion and Analysis of Financial Condition and Results of Operations
The following discussion and analysis of our financial condition and results of operations should be read in conjunction with our consolidated financial statements and related notes included in “Financial Statements and Supplementary Data” of this Annual Report on Form 10-K. In addition to historical consolidated financial information, the following discussion contains forward-looking statements that reflect our plans, estimates, and beliefs that involve significant risks and uncertainties. Our actual results could differ materially from those discussed in the forward-looking statements. Factors that could cause or contribute to those differences include those discussed below and elsewhere in this Annual Report on Form 10-K, particularly in “Risk Factors,” “Note Regarding Forward-Looking Statements,” and “Note Regarding User Metrics and Other Data.”
Executive Overview of Full Year 2017 Results
Our key user metrics and financial results for the fiscal year 2017 are as follows:
User Metrics
|
|
• |
Daily Active Users, or DAUs, were 187 million in the fourth quarter of 2017, compared to 158 million in the fourth quarter of 2016, an increase of 28.8 million or 18% year-over-year. |
|
|
• |
Average revenue per user, or ARPU, was $1.53 in the fourth quarter of 2017, compared to $1.05 in the fourth quarter of 2016, an increase of 46% year-over-year. |
Financial Results
|
|
• |
Revenue was $824.9 million, an increase of 104% year-over-year. |
|
|
• |
Total costs and expenses were $4.3 billion, an increase of 84% year-over-year, excluding stock-based compensation expense and related payroll tax expense. |
|
|
• |
Loss from operations was $3.5 billion. |
|
|
• |
Net loss was $3.4 billion with diluted loss per share of $(2.95). |
|
|
• |
Adjusted EBITDA was $(720.1) million. |
|
|
• |
Cash used in operations was $734.7 million and Free Cash Flow was $(819.2) million. |
|
|
• |
Capital expenditures were $84.5 million. |
|
|
• |
Cash, cash equivalents, and marketable securities were $2.0 billion as of December 31, 2017. |
Overview
Snap Inc. is a camera company.
We believe that reinventing the camera represents our greatest opportunity to improve the way that people live and communicate. Our products empower people to express themselves, live in the moment, learn about the world, and have fun together.
Our flagship product, Snapchat, is a camera application that helps people communicate visually with friends and family through short videos and images called Snaps. On average, 187 million people use Snapchat daily and create over 3.5 billion Snaps every day.
42
User Engagement
We define a Daily Active User as a registered Snapchat user who opens the Snapchat application at least once during a defined 24-hour period. We measure average Daily Active Users for a particular quarter by calculating the average Daily Active Users for that quarter. We also break out Daily Active Users by geography because certain markets have a greater revenue opportunity and lower bandwidth costs. We had 187 million DAUs on average across the fourth quarter of 2017, compared to 158 million in the fourth quarter of 2016, an increase of 18%.
Quarterly Average Daily Active Users
(in millions)
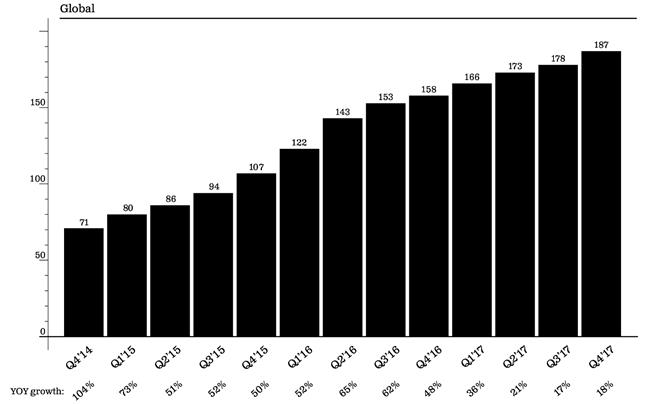
43
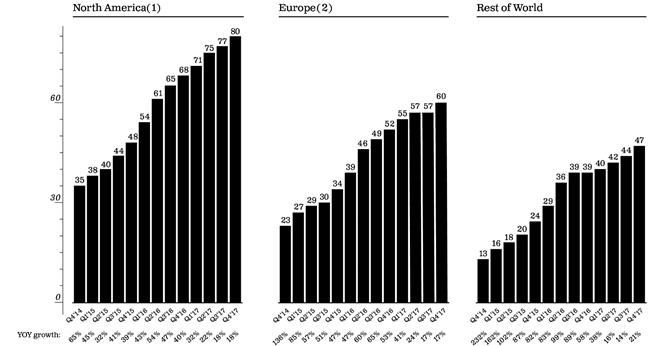
|
(1) |
North America includes Mexico and the Caribbean. |
|
(2) |
Europe includes Russia and Turkey. |
Monetization
We monetize our business primarily through advertising. Our advertising products include Snap Ads and Sponsored Creative Tools like Sponsored Lenses and Sponsored Geofilters. While our advertising business is still in its early stages, it has grown rapidly. In the year ended December 31, 2017, we recorded revenue of $824.9 million compared to revenue of $404.5 million for the year ended December 31, 2016, a 104% year-over-year increase.
We measure progress in our advertising business using ARPU because it helps us understand the rate at which we’re monetizing our daily user base. We define ARPU as quarterly revenue divided by the average Daily Active Users.
For purposes of calculating ARPU, revenue by user geography is apportioned to each region based on a determination of the geographic location in which advertising impressions are delivered, as this approximates revenue based on user activity. This differs from the presentation of our revenue by geography in the notes to our consolidated financial statements, where revenue is based on the billing address of the advertising customer.
44
Quarterly Average Revenue per User
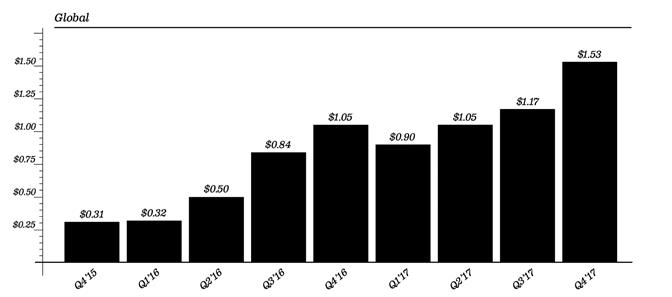

|
(1) |
North America includes Mexico and the Caribbean. |
|
(2) |
Europe includes Russia and Turkey. |
ARPU was $1.53 in the fourth quarter of 2017, up from $1.05 a year ago and $1.17 in the third quarter of 2017. In North America, ARPU was $2.75, 80% higher than our global average. We believe North America remains a leading indicator for the scale potential of our business.
45
Components of Results of Operations
Revenue
We generate substantially all of our revenue through the sale of our advertising products, which include Snap Ads and Sponsored Creative Tools, and measurement services, referred to as advertising revenue. We sell advertising directly to advertisers, referred to as Snap-sold revenue. Certain partners that provide content on Snapchat, or content partners, also sell directly to advertisers, referred to as partner-sold revenue. We report Snap-sold revenue on a gross basis and partner-sold revenue on a net basis. Currently, our Sponsored Creative Tools, which include Sponsored Lenses and Sponsored Geofilters, and our measurement services are only Snap-sold. For the year ended December 31, 2017 and 2016, approximately 94% and 91% of our advertising revenue was Snap-sold, respectively, and approximately 6% and 9% was partner-sold, respectively. Snap Ads, whether Snap-sold or partner-sold, may be subject to revenue sharing arrangements between us and the content partner.
We also generate revenue from sales of our hardware product, Spectacles. This revenue is reported net of allowances for returns.
Cost of Revenue
Cost of revenue consists primarily of payments to third-party infrastructure partners for hosting our products. Hosting costs primarily include expenses related to bandwidth, computing, and storage costs. Cost of revenue also includes revenue share payments to our content partners, content creation costs, which include personnel-related costs, and advertising measurement services. In addition, cost of revenue includes inventory costs for Spectacles and facilities and other supporting overhead costs, including depreciation and amortization.
Research and Development Expenses
Research and development expenses consist primarily of personnel-related costs, including salaries, benefits, and stock-based compensation expense for our engineers and other employees engaged in the research and development of our products. In addition, research and development expenses include facilities and other supporting overhead costs, including depreciation and amortization. Research and development costs are expensed as incurred.
Sales and Marketing Expenses
Sales and marketing expenses consist primarily of personnel-related costs, including salaries, benefits, commissions, and stock-based compensation expense for our employees engaged in sales and sales support, business development, media, marketing, corporate partnerships, communications, and customer service functions. Sales and marketing expenses also include costs incurred for indirect advertising, market research, tradeshows, branding, marketing, promotional expense, and public relations, as well as facilities and other supporting overhead costs, including depreciation and amortization.
General and Administrative Expenses
General and administrative expenses consist primarily of personnel-related costs, including salaries, benefits, and stock-based compensation expense for our executives, finance, legal, information technology, human resources, and other administrative teams, including facilities and supporting overhead costs, and depreciation and amortization. General and administrative expenses also include external professional services.
Interest Income
Interest income consists primarily of interest earned on our cash, cash equivalents, and marketable securities.
Interest Expense
Interest expense consists primarily of interest on build-to-suit lease financing obligations and commitment fees and amortization of financing costs related to our Credit Facility.
46
Other income (expense), net consists of realized gains and losses on sales of marketable securities, our portion of equity method investment income and losses, and foreign currency transaction gains and losses.
Income Tax Benefit (Expense)
We are subject to income taxes in the United States and numerous foreign jurisdictions. These foreign jurisdictions have different statutory tax rates than the United States. Additionally, certain of our foreign earnings may also be taxable in the United States. Accordingly, our effective tax rates will vary depending on the relative proportion of foreign to domestic income, use of foreign tax credits, changes in the valuation of our deferred tax assets and liabilities, and changes in tax laws.
Adjusted EBITDA
We define Adjusted EBITDA as net income (loss), excluding interest income; interest expense; other income (expense), net; income tax benefit (expense); depreciation and amortization; stock-based compensation expense and related payroll tax expense; and certain other non-cash or non-recurring items impacting net income (loss) from time to time. We consider the exclusion of certain non-cash and non-recurring expenses in calculating Adjusted EBITDA to provide a useful measure for period-to-period comparisons of our business and for investors and others to evaluate our operating results in the same manner as does our management. Additionally, we believe that Adjusted EBITDA is an important measure since we use third-party infrastructure partners to host our services and therefore we do not incur significant capital expenditures to support revenue-generating activities. See “Selected Financial Data—Non-GAAP Financial Measures” for additional information and a reconciliation of net loss to Adjusted EBITDA.
Discussion of Results of Operations
The following table sets forth our consolidated statements of operations data:
|
|
|
Year Ended December 31, |
|
|||||||||
|
|
|
2017 |
|
|
2016 |
|
|
2015 |
|
|||
|
|
|
(dollars in thousands) |
|
|||||||||
|
Consolidated Statements of Operations Data: |
|
|
|
|
|
|
|
|
|
|
|
|
|
Revenue |
|
$ |
824,949 |
|
|
$ |
404,482 |
|
|
$ |
58,663 |
|
|
Costs and expenses(1) (2): |
|
|
|
|
|
|
|
|
|
|
|
|
|
Cost of revenue |
|
|
717,462 |
|
|
|
451,660 |
|
|
|
182,341 |
|
|
Research and development |
|
|
1,534,863 |
|
|
|
183,676 |
|
|
|
82,235 |
|
|
Sales and marketing |
|
|
522,605 |
|
|
|
124,371 |
|
|
|
27,216 |
|
|
General and administrative |
|
|
1,535,595 |
|
|
|
165,160 |
|
|
|
148,600 |
|
|
Total costs and expenses |
|
|
4,310,525 |
|
|
|
924,867 |
|
|
|
440,392 |
|
|
Loss from operations |
|
|
(3,485,576 |
) |
|
|
(520,385 |
) |
|
|
(381,729 |
) |
|
Interest income |
|
|
21,096 |
|
|
|
4,654 |
|
|
|
1,399 |
|
|
Interest expense |
|
|
(3,456 |
) |
|
|
(1,424 |
) |
|
|
— |
|
|
Other income (expense), net |
|
|
4,528 |
|
|
|
(4,568 |
) |
|
|
(152 |
) |
|
Loss before income taxes |
|
|
(3,463,408 |
) |
|
|
(521,723 |
) |
|
|
(380,482 |
) |
|
Income tax benefit (expense) |
|
|
18,342 |
|
|
|
7,080 |
|
|
|
7,589 |
|
|
Net loss |
|
$ |
(3,445,066 |
) |
|
$ |
(514,643 |
) |
|
$ |
(372,893 |
) |
|
Adjusted EBITDA(3) |
|
$ |
(720,056 |
) |
|
$ |
(459,243 |
) |
|
$ |
(292,898 |
) |
|
(1) |
Stock-based compensation and related payroll tax expense included in above line items: |
47
|
|
|
Year Ended December 31, |
|
|||||||||
|
|
|
2017 |
|
|
2016 |
|
|
2015 |
|
|||
|
|
|
(dollars in thousands) |
|
|||||||||
|
Stock-based compensation and related payroll tax expense: |
|
|
|
|
|
|
|
|
|
|
|
|
|
Cost of revenue |
|
$ |
26,518 |
|
|
$ |
532 |
|
|
$ |
488 |
|
|
Research and development |
|
|
1,163,839 |
|
|
|
21,993 |
|
|
|
10,309 |
|
|
Sales and marketing |
|
|
238,827 |
|
|
|
3,967 |
|
|
|
3,534 |
|
|
General and administrative |
|
|
1,235,181 |
|
|
|
5,535 |
|
|
|
59,193 |
|
|
Total |
|
$ |
2,664,365 |
|
|
$ |
32,027 |
|
|
$ |
73,524 |
|
|
(2) |
Depreciation and amortization expense included in the above line items: |
|
|
|
Year Ended December 31, |
|
|||||||||
|
|
|
2017 |
|
|
2016 |
|
|
2015 |
|
|||
|
|
|
(dollars in thousands) |
|
|||||||||
|
Depreciation and amortization expense: |
|
|
|
|
|
|
|
|
|
|
|
|
|
Cost of revenue |
|
$ |
15,222 |
|
|
$ |
2,206 |
|
|
$ |
126 |
|
|
Research and development |
|
|
25,076 |
|
|
|
17,755 |
|
|
|
11,086 |
|
|
Sales and marketing |
|
|
10,450 |
|
|
|
3,175 |
|
|
|
289 |
|
|
General and administrative |
|
|
10,540 |
|
|
|
5,979 |
|
|
|
3,806 |
|
|
Total |
|
$ |
61,288 |
|
|
$ |
29,115 |
|
|
$ |
15,307 |
|
|
(3) |
See “Selected Financial Data—Non-GAAP Financial Measures” of this Annual Report on Form 10-K for more information and for a reconciliation of Adjusted EBITDA to net loss, the most directly comparable financial measure calculated and presented in accordance with GAAP. |
The following table sets forth the components of our consolidated statements of operations data for each of the periods presented as a percentage of revenue:
|
|
|
Year Ended December 31, |
|
|||||||||
|
|
|
2017 |
|
|
2016 |
|
|
2015 |
|
|||
|
Consolidated Statements of Operations Data: |
|
|
|
|
|
|
|
|
|
|
|
|
|
Revenue |
|
|
100 |
% |
|
|
100 |
% |
|
|
100 |
% |
|
Costs and expenses: |
|
|
|
|
|
|
|
|
|
|
|
|
|
Cost of revenue |
|
|
87 |
|
|
|
112 |
|
|
|
311 |
|
|
Research and development |
|
|
186 |
|
|
|
45 |
|
|
|
140 |
|
|
Sales and marketing |
|
|
63 |
|
|
|
31 |
|
|
|
46 |
|
|
General and administrative |
|
|
186 |
|
|
|
41 |
|
|
|
253 |
|
|
Total costs and expenses |
|
|
523 |
|
|
|
229 |
|
|
|
751 |
|
|
Loss from operations |
|
|
423 |
|
|
|
129 |
|
|
|
651 |
|
|
Interest income |
|
|
3 |
|
|
|
1 |
|
|
|
2 |
|
|
Interest expense |
|
|
— |
|
|
|
— |
|
|
|
— |
|
|
Other income (expense), net |
|
|
— |
|
|
|
1 |
|
|
|
— |
|
|
Loss before income taxes |
|
|
420 |
|
|
|
129 |
|
|
|
649 |
|
|
Income tax benefit (expense) |
|
|
2 |
|
|
|
2 |
|
|
|
13 |
|
|
Net loss |
|
|
418 |
% |
|
|
127 |
% |
|
|
636 |
% |
Revenue
|
|
|
Year Ended December 31, |
|
|
2017 vs 2016 Change |
|
|
2016 vs 2015 Change |
||||||||||||||||||
|
|
|
2017 |
|
|
2016 |
|
|
2015 |
|
|
$ |
|
|
% |
|
|
$ |
|
|
% |
||||||
|
|
|
(dollars in thousands) |
||||||||||||||||||||||||
|
|
|
(NM = Not Meaningful) |
||||||||||||||||||||||||
|
Revenue |
|
$ |
824,949 |
|
|
$ |
404,482 |
|
|
$ |
58,663 |
|
|
$ |
420,467 |
|
|
|
104 |
% |
|
$ |
345,819 |
|
|
NM |
48
2017 compared to 2016
Revenue for the year ended December 31, 2017 increased $420.5 million compared to the same period in 2016. The increase in revenue was primarily due to an increase in the number of advertisements delivered. The number of advertisements delivered increased between the periods primarily due to an increase in advertisers and demand across our product offerings, our growing sales efforts, and increased user engagement as measured by an 18% increase in DAUs. Additionally, there was incremental spend in advertisements sold through our advertising API which launched in November 2016, allowing advertisers access to additional inventory at a lower price than our direct sales channels. ARPU increased due to the growth in revenue as a result of the number of advertisements delivered, which outpaced DAU growth during the period.
Snap-sold revenue was $754.3 million and partner-sold revenue was $48.5 million during the year ended December 31, 2017, compared to $365.0 million for Snap-sold revenue and $34.9 million for partner-sold revenue during the year ended December 31, 2016. The increase in both Snap-sold revenue and partner-sold revenue was due to an increase in the number of advertisements delivered, and for partner-sold revenue, the number of partners.
2016 compared to 2015
Revenue for the year ended December 31, 2016 increased $345.8 million compared to the same period in 2015. Revenue grew between the periods primarily due to an increase in the number of advertisements delivered. The number of advertisements delivered increased between the periods primarily due to increased advertiser demand across our product offerings, our growing sales team, and increased user engagement as measured by a 48% increase in DAUs. ARPU increased due to the growth in revenue as a result of the number of advertisements delivered, which outpaced DAU growth during the period.
Snap-sold revenue was $365.0 million and partner-sold revenue was $34.9 million during the year ended December 31, 2016, compared to $50.9 million for Snap-sold revenue and $7.7 million for partner-sold revenue during the year ended December 31, 2015.
Quarterly discussion
Revenue for the three months ended December 31, 2017 was $285.7 million, compared to $207.9 million for the three months ended September 30, 2017. The increase was primarily due to an increase in the number of advertisements delivered, partially offset by an increase in advertising inventory sold through our API which tends to be at a lower price.
Cost of Revenue
|
|
|
Year Ended December 31, |
|
|
2017 vs 2016 Change |
|
|
2016 vs 2015 Change |
|
|||||||||||||||||||
|
|
|
2017 |
|
|
2016 |
|
|
2015 |
|
|
$ |
|
|
% |
|
|
$ |
|
|
% |
|
|||||||
|
|
|
(dollars in thousands) |
|
|||||||||||||||||||||||||
|
Cost of revenue |
|
$ |
717,462 |
|
|
$ |
451,660 |
|
|
$ |
182,341 |
|
|
$ |
265,802 |
|
|
|
59 |
% |
|
$ |
269,319 |
|
|
|
148 |
% |
2017 compared to 2016
Cost of revenue for the year ended December 31, 2017 increased $265.8 million, or 59%, compared to the same period in 2016. The increase in cost of revenue primarily consisted of $104.9 million related to increased hosting costs, in part attributable to DAU growth of 18% between the periods, $38.4 million related to increased revenue share payments to our partners consistent with our overall increase in revenue, $16.0 million related to increase measurement services consistent with overall increase in revenue, $15.2 million related to product costs for Spectacles, which launched in the fourth quarter of 2016, $39.9 million of Spectacles inventory-related charges in the third quarter of 2017, as described below, and $47.7 million related to increased measurement and content creation costs. Content creation costs include personnel-related costs, including $26.1 million primarily related to stock-based compensation expense primarily due to the recognition of expense related to RSUs with a performance condition satisfied on the effectiveness of the registration statement for our IPO in March 2017.
49
The $39.9 million of Spectacles inventory-related charges during the third quarter of 2017 were composed of $19.5 million of excess inventory reserves, $17.9 million of inventory purchase commitment cancellation charges, and $2.5 million of asset impairments. The charges were recorded based on management’s updated assessment in the third quarter. Our estimates related to the Spectacles inventory-related charges include judgments related to estimates of future sales, purchase commitment recoverability, and revised management assessments. These estimates were based on historical experience and various other assumptions that we believe to be reasonable under the circumstances. Our actual results could differ from these estimates.
2016 compared to 2015
Cost of revenue for the year ended December 31, 2016 increased $269.3 million, or 148%, compared to the same period in 2015. The increase in cost of revenue primarily consisted of $191.9 million related to increased hosting costs, in part attributable to DAU growth of 48% between the periods, $48.2 million related to increased revenue share payments to our partners consistent with our overall increase in revenue, and $13.3 million related to increased content creation costs, which include personnel-related costs.
Research and Development Expenses
|
|
|
Year Ended December 31, |
|
|
2017 vs 2016 Change |
|
2016 vs 2015 Change |
|
||||||||||||||||||
|
|
|
2017 |
|
|
2016 |
|
|
2015 |
|
|
$ |
|
|
% |
|
$ |
|
|
% |
|
||||||
|
|
|
(dollars in thousands) |
|
|||||||||||||||||||||||
|
|
|
(NM = Not Meaningful) |
|
|||||||||||||||||||||||
|
Research and Development Expenses |
|
$ |
1,534,863 |
|
|
$ |
183,676 |
|
|
$ |
82,235 |
|
|
$ |
1,351,187 |
|
|
NM |
|
$ |
101,441 |
|
|
|
123 |
% |
2017 compared to 2016
Research and development expenses for the year ended December 31, 2017 increased $1.4 billion compared to the same period in 2016. The increase was due to a $1.1 billion increase in stock-based compensation expense primarily due to the recognition of expense related to RSUs with a performance condition satisfied on the effectiveness of the registration statement for our IPO in March 2017. The increase was also driven by an increase in research and development headcount of approximately 84%. The investment in personnel supported our efforts to continue growing our user base and building and improving products for our users and advertisers.
2016 compared to 2015
Research and development expenses for the year ended December 31, 2016 increased $101.4 million, or 123%, compared to the same period in 2015. The increase was primarily due to an increase in research and development headcount, and the related salaries, benefits, and stock-based compensation expenses. The investment in personnel supported our efforts to continue growing our user base and building and improving products for our users and advertisers.
Sales and Marketing Expenses
|
|
|
Year Ended December 31, |
|
|
2017 vs 2016 Change |
|
|
2016 vs 2015 Change |
|
|||||||||||||||||||
|
|
|
2017 |
|
|
2016 |
|
|
2015 |
|
|
$ |
|
|
% |
|
|
$ |
|
|
% |
|
|||||||
|
|
|
(dollars in thousands) |
|
|||||||||||||||||||||||||
|
Sales and Marketing Expenses |
|
$ |
522,605 |
|
|
$ |
124,371 |
|
|
$ |
27,216 |
|
|
$ |
398,234 |
|
|
|
320 |
% |
|
$ |
97,155 |
|
|
|
357 |
% |
2017 compared to 2016
Sales and marketing expenses for the year ended December 31, 2017 increased $398.2 million compared to the same period in 2016. The increase was primarily due to a $232.5 million increase in stock-based compensation expense primarily due to the recognition of expense related to RSUs with a performance condition satisfied on the effectiveness of the registration statement for our IPO in March 2017. The increase for the year ended December 31, 2017 was also due to an increase in sales and marketing headcount of approximately 80% and an increase in marketing events and related expenses.
50
Sales and marketing expenses for the year ended December 31, 2016 increased $97.2 million, or 357%, compared to the same period in 2015. The increase was primarily due to an increase in sales and marketing headcount of approximately 340%. We also made marketing investments during the year ended December 31, 2016.
General and Administrative Expenses
|
|
|
Year Ended December 31, |
|
|
2017 vs 2016 Change |
|
2016 vs 2015 Change |
|
||||||||||||||||||
|
|
|
2017 |
|
|
2016 |
|
|
2015 |
|
|
$ |
|
|
% |
|
$ |
|
|
% |
|
||||||
|
|
|
(dollars in thousands) |
|
|||||||||||||||||||||||
|
|
|
(NM = Not Meaningful) |
|
|||||||||||||||||||||||
|
General and Administrative Expenses |
|
$ |
1,535,595 |
|
|
$ |
165,160 |
|
|
$ |
148,600 |
|
|
$ |
1,370,435 |
|
|
NM |
|
$ |
16,560 |
|
|
|
11 |
% |
2017 compared to 2016
General and administrative expenses for the year ended December 31, 2017 increased $1.4 billion compared to the same period in 2016. The increase was primarily due an increase in stock-based compensation expense of $1.2 billion, composed of an award granted to our CEO with an expense of $636.6 million and the remainder primarily related to the recognition of expense related to RSUs with a performance condition satisfied on the effectiveness of the registration statement for our IPO in March 2017. The increase for the year ended December 31, 2017 was also driven by increased personnel costs from an increase in general and administrative headcount of approximately 24%. Additionally, there was an increase in professional fees related to increased acquisition activity, legal, and general growth.
2016 compared to 2015
General and administrative expenses for the year ended December 31, 2016 increased $16.6 million, or 11%, compared to the same period in 2015. The increase was primarily due to increased personnel costs from an increase in general and administrative headcount of approximately 220%, partially offset by $43.6 million of stock-based compensation from the accelerated vesting of modified stock-based compensation awards for certain former employees in 2015.
Interest Income
|
|
|
Year Ended December 31, |
|
|
2017 vs 2016 Change |
|
|
2016 vs 2015 Change |
|
|||||||||||||||||||
|
|
|
2017 |
|
|
2016 |
|
|
2015 |
|
|
$ |
|
|
% |
|
|
$ |
|
|
% |
|
|||||||
|
|
|
(dollars in thousands) |
|
|||||||||||||||||||||||||
|
Interest Income |
|
$ |
21,096 |
|
|
$ |
4,654 |
|
|
$ |
1,399 |
|
|
$ |
16,442 |
|
|
|
353 |
% |
|
$ |
3,255 |
|
|
|
233 |
% |
2017 compared to 2016
Interest income for the year ended December 31, 2017 increased $16.4 million compared to the same period in 2016. The increase was primarily a result of a larger invested balance in marketable securities and higher interest rates on U.S. government-backed securities.
2016 compared to 2015
Interest income for the year ended December 31, 2016 increased $3.3 million, or 233%, compared to the same period in 2015. The increase was primarily a result of a larger invested balance in marketable securities, which returned a higher rate of interest.
51
|
|
|
Year Ended December 31, |
|
|
2017 vs 2016 Change |
|
|
2016 vs 2015 Change |
||||||||||||||||||
|
|
|
2017 |
|
|
2016 |
|
|
2015 |
|
|
$ |
|
|
% |
|
|
$ |
|
|
% |
||||||
|
|
|
(dollars in thousands) |
||||||||||||||||||||||||
|
|
|
(NM = Not Meaningful) |
||||||||||||||||||||||||
|
Interest Expense |
|
$ |
(3,456 |
) |
|
$ |
(1,424 |
) |
|
$ |
— |
|
|
$ |
(2,032 |
) |
|
|
143 |
% |
|
$ |
(1,424 |
) |
|
NM |
2017 compared to 2016
Interest expense for the year ended December 31, 2017 was $3.5 million, compared to $1.4 million in the same period in 2016. Interest expense was composed primarily of interest on financing obligations related to a build-to-suit lease placed into service in the third quarter of 2016 and commitment fees and amortization of costs related to our Credit Facility, which was executed in the third quarter of 2016.
2016 compared to 2015
Interest expense for the year ended December 31, 2016 was $1.4 million, compared to $0 in the same period in 2015. Interest expense was composed primarily of interest on build-to-suit lease financing obligations placed into service in the third quarter of 2016 and commitment fees and amortization of costs related to our Credit Facility, which was executed in the third quarter of 2016.
Other Income (Expense), Net
|
|
|
Year Ended December 31, |
|
|
2017 vs 2016 Change |
|
|
2016 vs 2015 Change |
||||||||||||||||||
|
|
|
2017 |
|
|
2016 |
|
|
2015 |
|
|
$ |
|
|
% |
|
|
$ |
|
|
% |
||||||
|
|
|
(dollars in thousands) |
||||||||||||||||||||||||
|
|
|
(NM = Not Meaningful) |
||||||||||||||||||||||||
|
Other Income (Expense), Net |
|
$ |
4,528 |
|
|
$ |
(4,568 |
) |
|
$ |
(152 |
) |
|
$ |
9,096 |
|
|
|
199 |
% |
|
$ |
(4,416 |
) |
|
NM |
2017 compared to 2016
Other income, net for the year ended December 31, 2017 was $4.5 million, compared to other expense, net of $4.6 million for the same period in 2016. The change from the comparative period was primarily a result of a decrease in our share of losses on equity method investments and an increase in foreign currency transaction gains.
2016 compared to 2015
Other expense, net for the year ended December 31, 2016 was $4.6 million. The increase in expense was primarily a result of an increase in our share of losses on equity method investments and an increase in foreign currency transaction losses, partially offset by gains on sales of marketable securities.
Income Tax Benefit (Expense)
|
|
|
Year Ended December 31, |
|
|
2017 vs 2016 Change |
|
|
2016 vs 2015 Change |
|
|||||||||||||||||||
|
|
|
2017 |
|
|
2016 |
|
|
2015 |
|
|
$ |
|
|
% |
|
|
$ |
|
|
% |
|
|||||||
|
|
|
(dollars in thousands) |
|
|||||||||||||||||||||||||
|
Income Tax Benefit (Expense) |
|
$ |
18,342 |
|
|
$ |
7,080 |
|
|
$ |
7,589 |
|
|
$ |
11,262 |
|
|
|
159 |
% |
|
$ |
(509 |
) |
|
|
-7 |
% |
|
Effective Tax Rate |
|
|
0.5 |
% |
|
|
1.4 |
% |
|
|
2.0 |
% |
|
|
|
|
|
|
|
|
|
|
|
|
|
|
|
|
52
Income tax benefit was $18.3 million for the year ended December 31, 2017 compared to $7.1 million for the same period in 2016. The income tax benefits in both periods were primarily from the partial releases of valuation allowances against our net deferred tax assets. The valuation allowance releases were the result of net deferred tax liabilities originating from acquisitions that were an available source of income to realize a portion of our deferred tax assets.
2016 compared to 2015
Income tax benefit was $7.1 million for the year ended December 31, 2016, compared to $7.6 million for the same period in 2015. The income tax benefits in both periods were primarily from the partial release of a valuation allowance against our net deferred tax assets. The valuation allowance release was the result of net deferred tax liabilities originating from acquisitions that were an available source of income to realize a portion of our deferred tax assets.
Our effective tax rate differs from the U.S. statutory tax rate primarily due to a valuation allowance on our deferred tax assets as it is more likely than not that some or all of our deferred tax assets will not be realized.
On December 22, 2017, the Tax Cuts and Jobs Act of 2017, or the Tax Act, was signed into law making significant changes to the Code. Changes include, but are not limited to, a corporate tax rate decrease to 21% effective for tax years beginning after December 31, 2017. This change in tax rate resulted in a reduction in our net U.S. deferred tax assets before valuation allowance by $396.2 million, which was fully offset by a reduction in our valuation allowance. The other provisions of the Tax Act, including the one-time transition tax on the mandatory deemed repatriation of cumulative foreign earnings, did not have a material impact on our financial statements as of December 31, 2017.
For additional discussion, see Note 8 to our consolidated financial statements included in “Financial Statements and Supplementary Data” in this Annual Report on Form 10-K.
Net Loss and Adjusted EBITDA
|
|
|
Year Ended December 31, |
|
|||||||||
|
|
|
2017 |
|
|
2016 |
|
|
2015 |
|
|||
|
|
|
(dollars in thousands) |
|
|||||||||
|
|
|
(NM = Not Meaningful) |
|
|||||||||
|
Net Loss |
|
$ |
(3,445,066 |
) |
|
$ |
(514,643 |
) |
|
$ |
(372,893 |
) |
|
Adjusted EBITDA |
|
$ |
(720,056 |
) |
|
$ |
(459,243 |
) |
|
$ |
(292,898 |
) |
2017 compared to 2016
Net loss for the year ended December 31, 2017 was $3.4 billion, compared to $514.6 million for the same period in 2016. Adjusted EBITDA loss for the year ended December 31, 2017 was $720.1 million, compared to $459.2 million for the same period in 2016. The increase in net loss for the period was driven by a $2.6 billion increase in stock-based compensation expense primarily related to an equity award granted to our CEO, or the CEO award, and the recognition of expense related to RSUs with a performance condition satisfied on the effectiveness of the registration statement for our IPO in March 2017. Additionally, the increase in net loss was also driven by $39.9 million of Spectacles inventory-related charges in the third quarter of 2017. The remaining increase in net loss and the increase in Adjusted EBITDA was driven by an increase in cost of revenue and operating expenses, which more than offset revenue growth during the period. The increase in cost of revenue was primarily related to higher hosting costs. The increase in operating expenses was primarily related to increased headcount.
2016 compared to 2015
Net loss for the year ended December 31, 2016 was $514.6 million, compared to $372.9 million for the same period in 2015. Adjusted EBITDA loss for the year ended December 31, 2016 was $459.4 million, compared to $292.9 million for the same period in 2015. The increase in net loss and Adjusted EBITDA loss was primarily a result of an increase in cost of revenue and operating expenses, which more than offset revenue growth during the period. The increase in cost of revenue was primarily related to higher hosting costs and revenue share payments to our partners for the year ended December 31, 2016. The increase in operating expenses was primarily related to increased headcount.
53
For a discussion of the limitations associated with using Adjusted EBITDA rather than GAAP measures and a reconciliation of this measure to net loss, see “Selected Financial Data—Non-GAAP Financial Measures.”
Unaudited Quarterly Results of Operations Data
The following table sets forth our unaudited quarterly consolidated results of operations for each of the eight quarters in the period ended December 31, 2017. These unaudited quarterly results of operations have been prepared on the same basis as our audited consolidated financial statements included in “Financial Statements and Supplementary Data” in this Annual Report on Form 10-K. In the opinion of management, the financial information reflects all normal recurring adjustments necessary for the fair statement of results of operations for these periods. This information should be read in conjunction with our consolidated financial statements and the related notes included in “Financial Statements and Supplementary Data” in this Annual Report on Form 10-K. The results of historical periods are not necessarily indicative of the results in any future period.
|
|
|
Three Months Ended |
|
|||||||||||||||||||||||||||||
|
|
|
March 31, 2016 |
|
|
June 30, 2016 |
|
|
September 30, 2016 |
|
|
December 31, 2016 |
|
|
March 31, 2017 |
|
|
June 30, 2017 |
|
|
September 30, 2017 |
|
|
December 31, 2017 |
|
||||||||
|
|
|
(in thousands) |
|
|||||||||||||||||||||||||||||
|
Consolidated Statements of Operations Data: |
|
|
|
|
|
|
|
|
|
|
|
|
|
|
|
|
|
|
|
|
|
|
|
|
|
|
|
|
|
|
|
|
|
Revenue |
|
$ |
38,798 |
|
|
$ |
71,798 |
|
|
$ |
128,204 |
|
|
$ |
165,682 |
|
|
$ |
149,648 |
|
|
$ |
181,671 |
|
|
$ |
207,937 |
|
|
$ |
285,693 |
|
|
Costs and expenses(1) (2): |
|
|
|
|
|
|
|
|
|
|
|
|
|
|
|
|
|
|
|
|
|
|
|
|
|
|
|
|
|
|
|
|
|
Cost of revenue |
|
|
75,773 |
|
|
|
94,757 |
|
|
|
127,780 |
|
|
|
153,350 |
|
|
|
163,358 |
|
|
|
152,148 |
|
|
|
210,710 |
|
|
|
191,246 |
|
|
Research and development |
|
|
28,098 |
|
|
|
36,052 |
|
|
|
54,562 |
|
|
|
64,964 |
|
|
|
805,848 |
|
|
|
255,735 |
|
|
|
239,442 |
|
|
|
233,838 |
|
|
Sales and marketing |
|
|
14,737 |
|
|
|
24,587 |
|
|
|
34,658 |
|
|
|
50,389 |
|
|
|
219,733 |
|
|
|
90,903 |
|
|
|
101,511 |
|
|
|
110,458 |
|
|
General and administrative |
|
|
24,011 |
|
|
|
32,261 |
|
|
|
42,172 |
|
|
|
66,716 |
|
|
|
1,174,476 |
|
|
|
131,903 |
|
|
|
118,101 |
|
|
|
111,115 |
|
|
Total costs and expenses |
|
|
142,619 |
|
|
|
187,657 |
|
|
|
259,172 |
|
|
|
335,419 |
|
|
|
2,363,415 |
|
|
|
630,689 |
|
|
|
669,764 |
|
|
|
646,657 |
|
|
Loss from operations |
|
|
(103,821 |
) |
|
|
(115,859 |
) |
|
|
(130,968 |
) |
|
|
(169,737 |
) |
|
|
(2,213,767 |
) |
|
|
(449,018 |
) |
|
|
(461,827 |
) |
|
|
(360,964 |
) |
|
Interest income |
|
|
359 |
|
|
|
871 |
|
|
|
1,938 |
|
|
|
1,486 |
|
|
|
2,424 |
|
|
|
6,349 |
|
|
|
6,253 |
|
|
|
6,070 |
|
|
Interest expense |
|
|
— |
|
|
|
— |
|
|
|
(648 |
) |
|
|
(776 |
) |
|
|
(695 |
) |
|
|
(998 |
) |
|
|
(887 |
) |
|
|
(876 |
) |
|
Other income (expense), net |
|
|
(993 |
) |
|
|
(939 |
) |
|
|
(1,421 |
) |
|
|
(1,215 |
) |
|
|
187 |
|
|
|
786 |
|
|
|
1,002 |
|
|
|
2,553 |
|
|
Loss before income taxes |
|
|
(104,455 |
) |
|
|
(115,927 |
) |
|
|
(131,099 |
) |
|
|
(170,242 |
) |
|
|
(2,211,851 |
) |
|
|
(442,881 |
) |
|
|
(455,459 |
) |
|
|
(353,217 |
) |
|
Income tax benefit (expense) |
|
|
(121 |
) |
|
|
33 |
|
|
|
6,871 |
|
|
|
297 |
|
|
|
3,014 |
|
|
|
(212 |
) |
|
|
12,300 |
|
|
|
3,240 |
|
|
Net loss |
|
$ |
(104,576 |
) |
|
$ |
(115,894 |
) |
|
$ |
(124,228 |
) |
|
$ |
(169,945 |
) |
|
$ |
(2,208,837 |
) |
|
$ |
(443,093 |
) |
|
$ |
(443,159 |
) |
|
$ |
(349,977 |
) |
|
(1) |
Stock-based compensation expense included in above line items: |
|
|
|
Three Months Ended |
|
|||||||||||||||||||||||||||||
|
|
|
March 31, 2016 |
|
|
June 30, 2016 |
|
|
September 30, 2016 |
|
|
December 31, 2016 |
|
|
March 31, 2017 |
|
|
June 30, 2017 |
|
|
September 30, 2017 |
|
|
December 31, 2017 |
|
||||||||
|
|
|
(in thousands) |
|
|||||||||||||||||||||||||||||
|
Stock-based compensation and related payroll tax expense: |
|
|
|
|
|
|
|
|
|
|
|
|
|
|
|
|
|
|
|
|
|
|
|
|
|
|
|
|
|
|
|
|
|
Cost of revenue |
|
$ |
154 |
|
|
$ |
128 |
|
|
$ |
128 |
|
|
$ |
122 |
|
|
$ |
20,026 |
|
|
$ |
2,223 |
|
|
$ |
2,039 |
|
|
$ |
2,230 |
|
|
Research and development |
|
|
2,648 |
|
|
|
2,700 |
|
|
|
12,143 |
|
|
|
4,449 |
|
|
|
722,129 |
|
|
|
163,848 |
|
|
|
146,531 |
|
|
|
131,331 |
|
|
Sales and marketing |
|
|
775 |
|
|
|
553 |
|
|
|
1,262 |
|
|
|
1,377 |
|
|
|
160,942 |
|
|
|
20,558 |
|
|
|
27,968 |
|
|
|
29,359 |
|
|
General and administrative |
|
|
1,961 |
|
|
|
1,361 |
|
|
|
1,394 |
|
|
|
819 |
|
|
|
1,109,977 |
|
|
|
55,814 |
|
|
|
49,054 |
|
|
|
20,336 |
|
|
Total |
|
$ |
5,538 |
|
|
$ |
4,742 |
|
|
$ |
14,927 |
|
|
$ |
6,767 |
|
|
$ |
2,013,074 |
|
|
$ |
242,443 |
|
|
$ |
225,592 |
|
|
$ |
183,256 |
|
|
(2) |
Depreciation and amortization expense included in above line items: |
54
|
|
|
Three Months Ended |
|
|||||||||||||||||||||||||||||
|
|
|
March 31, 2016 |
|
|
June 30, 2016 |
|
|
September 30, 2016 |
|
|
December 31, 2016 |
|
|
March 31, 2017 |
|
|
June 30, 2017 |
|
|
September 30, 2017 |
|
|
December 31, 2017 |
|
||||||||
|
|
|
(in thousands) |
|
|||||||||||||||||||||||||||||
|
Depreciation and amortization expense: |
|
|
|
|
|
|
|
|
|
|
|
|
|
|
|
|
|
|
|
|
|
|
|
|
|
|
|
|
|
|
|
|
|
Cost of revenue |
|
$ |
71 |
|
|
$ |
99 |
|
|
$ |
778 |
|
|
$ |
1,258 |
|
|
$ |
1,669 |
|
|
$ |
2,970 |
|
|
$ |
5,404 |
|
|
$ |
5,179 |
|
|
Research and development |
|
|
3,611 |
|
|
|
4,164 |
|
|
|
4,623 |
|
|
|
5,357 |
|
|
|
5,755 |
|
|
|
5,983 |
|
|
|
6,401 |
|
|
|
6,937 |
|
|
Sales and marketing |
|
|
150 |
|
|
|
236 |
|
|
|
394 |
|
|
|
2,395 |
|
|
|
2,600 |
|
|
|
1,589 |
|
|
|
2,820 |
|
|
|
3,441 |
|
|
General and administrative |
|
|
1,217 |
|
|
|
1,497 |
|
|
|
1,642 |
|
|
|
1,623 |
|
|
|
2,426 |
|
|
|
2,043 |
|
|
|
2,842 |
|
|
|
3,229 |
|
|
Total |
|
$ |
5,049 |
|
|
$ |
5,996 |
|
|
$ |
7,437 |
|
|
$ |
10,633 |
|
|
$ |
12,450 |
|
|
$ |
12,585 |
|
|
$ |
17,467 |
|
|
$ |
18,786 |
|
The following table presents a reconciliation of Adjusted EBITDA to net loss, the most comparable GAAP financial measure, for each of the periods presented:
|
|
|
Three Months Ended |
|
|||||||||||||||||||||||||||||
|
|
|
March 31, 2016 |
|
|
June 30, 2016 |
|
|
September 30, 2016 |
|
|
December 31, 2016 |
|
|
March 31, 2017 |
|
|
June 30, 2017 |
|
|
September 30, 2017 |
|
|
December 31, 2017 |
|
||||||||
|
|
|
(in thousands) |
|
|||||||||||||||||||||||||||||
|
Reconciliation of Adjusted EBITDA: |
|
|
|
|
|
|
|
|
|
|
|
|
|
|
|
|
|
|
|
|
|
|
|
|
|
|
|
|
|
|
|
|
|
Net loss |
|
$ |
(104,576 |
) |
|
$ |
(115,894 |
) |
|
$ |
(124,228 |
) |
|
$ |
(169,945 |
) |
|
$ |
(2,208,837 |
) |
|
$ |
(443,093 |
) |
|
$ |
(443,159 |
) |
|
$ |
(349,977 |
) |
|
Add (deduct): |
|
|
|
|
|
|
|
|
|
|
|
|
|
|
|
|
|
|
|
|
|
|
|
|
|
|
|
|
|
|
|
|
|
Interest income |
|
|
(359 |
) |
|
|
(871 |
) |
|
|
(1,938 |
) |
|
|
(1,486 |
) |
|
|
(2,424 |
) |
|
|
(6,349 |
) |
|
|
(6,253 |
) |
|
|
(6,070 |
) |
|
Interest expense |
|
|
— |
|
|
|
— |
|
|
|
648 |
|
|
|
776 |
|
|
|
695 |
|
|
|
998 |
|
|
|
887 |
|
|
|
876 |
|
|
Other (income) expense, net |
|
|
993 |
|
|
|
939 |
|
|
|
1,421 |
|
|
|
1,215 |
|
|
|
(187 |
) |
|
|
(786 |
) |
|
|
(1,002 |
) |
|
|
(2,553 |
) |
|
Income tax (benefit) expense |
|
|
121 |
|
|
|
(33 |
) |
|
|
(6,871 |
) |
|
|
(297 |
) |
|
|
(3,014 |
) |
|
|
212 |
|
|
|
(12,300 |
) |
|
|
(3,240 |
) |
|
Depreciation and amortization |
|
|
5,049 |
|
|
|
5,996 |
|
|
|
7,437 |
|
|
|
10,633 |
|
|
|
12,450 |
|
|
|
12,585 |
|
|
|
17,467 |
|
|
|
18,786 |
|
|
Stock-based compensation expense |
|
|
5,538 |
|
|
|
4,742 |
|
|
|
14,795 |
|
|
|
6,767 |
|
|
|
1,992,121 |
|
|
|
245,028 |
|
|
|
221,702 |
|
|
|
181,044 |
|
|
Payroll tax expense related to stock-based compensation |
|
|
— |
|
|
|
— |
|
|
|
132 |
|
|
|
53 |
|
|
|
20,953 |
|
|
|
(2,585 |
) |
|
|
3,890 |
|
|
|
2,212 |
|
|
Spectacles inventory-related charges |
|
|
— |
|
|
|
— |
|
|
|
— |
|
|
|
— |
|
|
|
— |
|
|
|
— |
|
|
|
39,867 |
|
|
|
— |
|
|
Adjusted EBITDA |
|
$ |
(93,234 |
) |
|
$ |
(105,121 |
) |
|
$ |
(108,604 |
) |
|
$ |
(152,284 |
) |
|
$ |
(188,243 |
) |
|
$ |
(193,990 |
) |
|
$ |
(178,901 |
) |
|
$ |
(158,922 |
) |
55
The following table presents a reconciliation of Free Cash Flow to net cash used in operating activities, the most comparable GAAP financial measure, for each of periods presented:
|
|
|
Three Months Ended |
|
|||||||||||||||||||||||||||||
|
|
|
March 31, 2016 |
|
|
June 30, 2016 |
|
|
September 30, 2016 |
|
|
December 31, 2016 |
|
|
March 31, 2017 |
|
|
June 30, 2017 |
|
|
September 30, 2017 |
|
|
December 31, 2017 |
|
||||||||
|
|
|
(in thousands) |
|
|||||||||||||||||||||||||||||
|
Reconciliation of Free Cash Flow: |
|
|
|
|
|
|
|
|
|
|
|
|
|
|
|
|
|
|
|
|
|
|
|
|
|
|
|
|
|
|
|
|
|
Net cash used in operating activities |
|
$ |
(92,541 |
) |
|
$ |
(134,110 |
) |
|
$ |
(216,866 |
) |
|
$ |
(167,728 |
) |
|
$ |
(154,997 |
) |
|
$ |
(209,574 |
) |
|
$ |
(194,013 |
) |
|
$ |
(176,083 |
) |
|
Less: |
|
|
|
|
|
|
|
|
|
|
|
|
|
|
|
|
|
|
|
|
|
|
|
|
|
|
|
|
|
|
|
|
|
Purchases of property and equipment |
|
|
(12,452 |
) |
|
|
(16,421 |
) |
|
|
(17,192 |
) |
|
|
(20,376 |
) |
|
|
(17,993 |
) |
|
|
(19,365 |
) |
|
|
(25,948 |
) |
|
|
(21,212 |
) |
|
Free Cash Flow |
|
$ |
(104,993 |
) |
|
$ |
(150,531 |
) |
|
$ |
(234,058 |
) |
|
$ |
(188,104 |
) |
|
$ |
(172,990 |
) |
|
$ |
(228,939 |
) |
|
$ |
(219,961 |
) |
|
$ |
(197,295 |
) |
The following table sets forth the components of our unaudited quarterly consolidated statements of operations for each of the periods presented as a percentage of revenue:
|
|
|
Three Months Ended |
|
|||||||||||||||||||||||||||||
|
|
|
March 31, 2016 |
|
|
June 30, 2016 |
|
|
September 30, 2016 |
|
|
December 31, 2016 |
|
|
March 31, 2017 |
|
|
June 30, 2017 |
|
|
September 30, 2017 |
|
|
December 31, 2017 |
|
||||||||
|
|
|
(in thousands) |
|
|||||||||||||||||||||||||||||
|
Consolidated Statements of Operations Data: |
|
|
|
|
|
|
|
|
|
|
|
|
|
|
|
|
|
|
|
|
|
|
|
|
|
|
|
|
|
|
|
|
|
Revenue |
|
|
100 |
% |
|
|
100 |
% |
|
|
100 |
% |
|
|
100 |
% |
|
|
100 |
% |
|
|
100 |
% |
|
|
100 |
% |
|
|
100 |
% |
|
Costs and expenses: |
|
|
|
|
|
|
|
|
|
|
|
|
|
|
|
|
|
|
|
|
|
|
|
|
|
|
|
|
|
|
|
|
|
Cost of revenue |
|
|
195 |
|
|
|
132 |
|
|
|
100 |
|
|
|
93 |
|
|
|
109 |
|
|
|
84 |
|
|
|
101 |
|
|
|
67 |
|
|
Research and development |
|
|
72 |
|
|
|
50 |
|
|
|
43 |
|
|
|
39 |
|
|
|
538 |
|
|
|
141 |
|
|
|
115 |
|
|
|
82 |
|
|
Sales and marketing |
|
|
38 |
|
|
|
34 |
|
|
|
27 |
|
|
|
30 |
|
|
|
147 |
|
|
|
50 |
|
|
|
49 |
|
|
|
39 |
|
|
General and administrative |
|
|
62 |
|
|
|
45 |
|
|
|
33 |
|
|
|
40 |
|
|
|
785 |
|
|
|
73 |
|
|
|
57 |
|
|
|
39 |
|
|
Total costs and expenses |
|
|
368 |
|
|
|
261 |
|
|
|
202 |
|
|
|
202 |
|
|
|
1,579 |
|
|
|
347 |
|
|
|
322 |
|
|
|
226 |
|
|
Loss from operations |
|
|
268 |
|
|
|
161 |
|
|
|
102 |
|
|
|
102 |
|
|
|
1,479 |
|
|
|
247 |
|
|
|
222 |
|
|
|
126 |
|
|
Interest income |
|
|
1 |
|
|
|
1 |
|
|
|
2 |
|
|
|
1 |
|
|
|
2 |
|
|
|
3 |
|
|
|
3 |
|
|
|
2 |
|
|
Interest expense |
|
|
— |
|
|
|
— |
|
|
|
1 |
|
|
|
1 |
|
|
|
— |
|
|
|
1 |
|
|
|
— |
|
|
|
— |
|
|
Other income (expense), net |
|
|
3 |
|
|
|
1 |
|
|
|
1 |
|
|
|
1 |
|
|
|
— |
|
|
|
— |
|
|
|
— |
|
|
|
1 |
|
|
Loss before income taxes |
|
|
269 |
|
|
|
161 |
|
|
|
102 |
|
|
|
103 |
|
|
|
1,478 |
|
|
|
244 |
|
|
|
219 |
|
|
|
124 |
|
|
Income tax benefit (expense) |
|
|
— |
|
|
|
— |
|
|
|
5 |
|
|
|
— |
|
|
|
2 |
|
|
|
— |
|
|
|
6 |
|
|
|
1 |
|
|
Net loss |
|
|
270 |
% |
|
|
161 |
% |
|
|
97 |
% |
|
|
103 |
% |
|
|
1476 |
% |
|
|
244 |
% |
|
|
213 |
% |
|
|
123 |
% |
Liquidity and Capital Resources
Cash, cash equivalents, and marketable securities were $2.0 billion as of December 31, 2017, primarily consisting of cash on deposit with banks and highly liquid investments in U.S. government and agency securities. Our primary source of liquidity is cash generated through financing activities. Our primary uses of cash include operating costs such as personnel-related expenses and the hosting costs of the Snapchat application, acquisitions and investments, and facility-related capital spending. Other than as noted below, there are no known material subsequent events that could have a material impact on our cash or liquidity. We may contemplate and engage in acquisition activity that could materially impact our liquidity and capital resource position.
56
In July 2016, we entered into the Credit Facility with lenders, some of which are affiliated with certain members of the underwriting syndicate for our IPO, that allows us to borrow up to $1.1 billion to fund working capital and general corporate-purpose expenditures. The loan bears interest at LIBOR plus 0.75%, as well as an annual commitment fee of 0.10% on the daily undrawn balance of the facility. No origination fees were incurred at the closing of the Credit Facility. Any amounts outstanding under this facility will be due and payable in July 2021. In December 2016, the amount we are permitted to borrow under the Credit Facility was increased to $1.2 billion. As of December 31, 2017, no amounts were outstanding under the Credit Facility. In February 2018, the amount we are permitted to borrow under the Credit Facility was increased to $1.25 billion.
We believe our existing cash balance is sufficient to fund our ongoing working capital, investing, and financing requirements for at least the next 12 months. Our future capital requirements will depend on many factors including our growth rate, headcount, sales and marketing activities, research and development efforts, the introduction of new features, products, and acquisitions, and continued user engagement.
As of December 31, 2017, approximately 5% of our cash, cash equivalents, and marketable securities was held outside the United States. These amounts were primarily held in the United Kingdom and are utilized to fund our foreign operations. We believe our existing cash balance in the United States is sufficient to fund our working capital needs.
RSU Settlement
In connection with the vesting of employee RSUs and to satisfy tax withholding and remittance obligations, we remitted approximately $394.2 million through December 31, 2017. We withheld and remitted income taxes at applicable statutory rates based on the then-current value of the underlying shares. Beginning in November 2017, for a majority of employee RSUs, we sold a portion of the shares that vested on behalf of employees to satisfy tax withholding and remittance obligations. We will continue to evaluate the method of settlement of RSUs that vest in the future.
The following table sets forth the major components of our consolidated statements of cash flows for the periods presented:
|
|
|
Year Ended December 31, |
|
|||||||||
|
|
|
2017 |
|
|
2016 |
|
|
2015 |
|
|||
|
|
|
(in thousands) |
|
|||||||||
|
Net cash used in operating activities |
|
$ |
(734,667 |
) |
|
$ |
(611,245 |
) |
|
$ |
(306,622 |
) |
|
Net cash used in investing activities |
|
|
(1,346,739 |
) |
|
|
(1,021,334 |
) |
|
|
(100,942 |
) |
|
Net cash provided by financing activities |
|
|
2,265,348 |
|
|
|
1,141,890 |
|
|
|
650,366 |
|
|
Net increase (decrease) in cash |
|
$ |
183,942 |
|
|
$ |
(490,689 |
) |
|
$ |
242,802 |
|
|
Free Cash Flow (1) |
|
$ |
(819,185 |
) |
|
$ |
(677,686 |
) |
|
$ |
(325,827 |
) |
|
(1) |
For information on how we define and calculate Free Cash Flow and a reconciliation to net cash used in operating activities to Free Cash Flow, see “Selected Financial Data—Non-GAAP Financial Measures.” |
Net Cash Used in Operating Activities
2017 compared to 2016
Net cash used in operating activities increased $123.4 million in the year ended December 31, 2017 compared to the same period in 2016. Net cash used in operating activities was $734.7 million for the year ended December 31, 2017, resulting primarily from net loss, adjusted for non-cash items, primarily stock-based compensation expense of $2.6 billion. Additionally, the increase was driven by a $104.4 million increase in accounts receivable related to an increase in advertising revenue, partially offset by a $101.0 million increase in accrued expenses and other liabilities primarily driven by an increase in accrued hosting costs and accrued compensation costs due to increased headcount.
2016 compared to 2015
Net cash used in operating activities increased $304.6 million in the year ended December 31, 2016 compared to the same period in 2015. Net cash used in operating activities was $611.2 million for the year ended December 31, 2016, resulting primarily from net loss, adjusted for non-cash items, and an increase in accounts receivable of $118.4 million related to an increase in advertising revenue.
57
Net Cash Used in Investing Activities
2017 compared to 2016
Net cash used in investing activities was $1.3 billion for the year ended December 31, 2017, an increase of $325.4 million compared to the same period in 2016, primarily due to the use of $3.9 billion for the purchase of marketable securities and cash paid for acquisitions of $386.0 million, partially offset by cash provided by the sales and maturities of marketable securities of $3.0 billion.
2016 compared to 2015
Net cash used in investing activities was $1.0 billion for the year ended December 31, 2016, an increase of $920.4 million compared to the prior period, primarily due to the use of $1.6 billion for the purchase of marketable securities and $104.0 million for business acquisitions, partially offset by cash provided by the sales and maturities of marketable securities of $728.6 million.
Net Cash Provided by Financing Activities
2017 compared to 2016
Net cash provided by financing activities was $2.3 billion and $1.1 billion for the years ended December 31, 2017 and 2016, respectively. Our financing activities in 2017 consisted of the issuance of Class A common stock in our IPO of $2.7 billion, net of underwriting commissions, partially offset by cash used for minimum tax withholdings on behalf of our employees of $394.2 million in connection with vesting RSUs during the year ended December 31, 2017.
2016 compared to 2015
Net cash provided by financing activities was $1.1 billion and $650.4 million for the years ended December 31, 2016 and 2015, respectively. Our financing activities primarily consisted of preferred stock issuances.
Free Cash Flow
2017 compared to 2016
Free Cash Flow was $(819.2) million and $(677.7) million for the years ended December 31, 2017 and 2016, respectively, and was composed of net cash used in operating activities, resulting primarily from net loss, adjusted for non-cash items and changes in working capital. Free Cash Flow also included purchases of property and equipment of $84.5 million and $66.4 million for the years ended December 31, 2017 and 2016, respectively.
2016 compared to 2015
Free Cash Flow was $(677.7) million and $(325.8) million for the years ended December 31, 2016 and 2015, respectively, and was composed of net cash used in operating activities, resulting primarily from net loss, adjusted for non-cash items and changes in working capital. Free Cash Flow also included purchases of property and equipment of $66.4 million and $19.2 million for the years ended December 31, 2016 and 2015, respectively.
Off-Balance Sheet Arrangements
We do not have any off-balance sheet arrangements for any of the periods presented.
Contingencies
We are involved in claims, lawsuits, indirect and other tax matters, government investigations, and proceedings arising in the ordinary course of our business. We record a provision for a liability when we believe that it is both probable that a liability has been incurred and the amount can be reasonably estimated. We also disclose material contingencies when we believe that a loss is not probable but reasonably possible. Significant judgment is required to determine both probability and the estimated amount. Such claims, suits, and proceedings are inherently unpredictable and subject to significant uncertainties, some of which are beyond our control. Many of these legal and tax contingencies can take years to resolve. Should any of these estimates and assumptions change or prove to be incorrect, it could have a material impact on our results of operations, financial position, and cash flows.
58
The following table summarizes our contractual obligations as of December 31, 2017:
|
|
|
Total |
|
|
1 Year (2018) |
|
|
2-4 Years (2019 and 2020) |
|
|
4-6 Years (2021 and 2022) |
|
|
After 6 Years (Thereafter) |
|
|||||
|
|
|
(in thousands) |
|
|||||||||||||||||
|
Operating leases |
|
$ |
420,002 |
|
|
$ |
49,649 |
|
|
$ |
119,989 |
|
|
$ |
105,924 |
|
|
$ |
144,440 |
|
|
Financing leases |
|
|
45,513 |
|
|
|
4,726 |
|
|
|
9,743 |
|
|
|
10,259 |
|
|
|
20,785 |
|
|
Hosting commitments |
|
|
2,577,139 |
|
|
|
518,806 |
|
|
|
1,275,000 |
|
|
|
783,333 |
|
|
|
— |
|
|
Other commitments |
|
|
19,380 |
|
|
|
14,898 |
|
|
|
4,482 |
|
|
|
— |
|
|
|
— |
|
|
Total contractual commitments |
|
$ |
3,062,034 |
|
|
$ |
588,079 |
|
|
$ |
1,409,214 |
|
|
$ |
899,516 |
|
|
$ |
165,225 |
|
For additional discussion on our operating and financing leases and data hosting and other purchase commitments, see Note 6 to our consolidated financial statements included in “Financial Statements and Supplementary Data” in this Annual Report on Form 10-K.
In 2018, we will exit various operating leases prior to the end of the contractual lease term, primarily as a result of moving to a centralized corporate office located in Santa Monica, California. As of December 31, 2017, these leases have a remaining contractual obligation of approximately $85.0 million. We expect to incur losses, which may be substantial, related to exiting these leases on our cease use date. We are pursuing options to mitigate our exit costs, including subleasing these properties.
In January 2017, we entered into the Google Cloud Platform License Agreement, which was amended in September 2017 and again in December 2017. Under the agreement, we were granted a license to access and use certain cloud services. The agreement has an initial term of five years and we are required to purchase at least $400.0 million of cloud services in each year of the agreement. For each of the first four years, up to 15% of this amount may be moved to a subsequent year. If we fail to meet the minimum purchase commitment during any year, we are required to pay the difference.
In March 2016, we entered into the AWS Enterprise Agreement for the use of cloud services from Amazon Web Services, Inc., or AWS, which was amended in March 2016 and again in February 2017. The agreement will continue indefinitely until terminated by either party. Under the February 2017 addendum to the agreement, we committed to spend $1.0 billion between January 2017 and December 2021 on AWS services ($50.0 million in 2017, $125.0 million in 2018, $200.0 million in 2019, $275.0 million in 2020, and $350.0 million in 2021). If we fail to meet the minimum purchase commitment during any year, we are required to pay the difference. Any such payment may be applied to future use of AWS services during the addendum term, although it will not count towards meeting the future minimum purchase commitments under the addendum.
We also have various other non-cancelable contractual commitments related to purchase agreements. During the third quarter of 2017, based on management’s updated assessment, we recorded $39.9 million of charges related to Spectacles inventory. The charges were primarily related to excess inventory reserves and inventory purchase commitment cancellation charges. As of December 31, 2017, there were no material hardware inventory commitments.
Critical Accounting Policies and Estimates
We prepare our financial statements in accordance with GAAP. Preparing these financial statements requires us to make estimates and assumptions that affect the reported amounts of assets, liabilities, revenue, expenses, and related disclosures. We evaluate our estimates and assumptions on an ongoing basis. Our estimates are based on historical experience and various other assumptions that we believe to be reasonable under the circumstances. Our actual results could differ from these estimates.
The critical accounting estimates, assumptions, and judgments that we believe to have the most significant impact on our consolidated financial statements are described below.
Revenue Recognition
We generate the majority of our revenue through the delivery of advertisements. Revenue is recognized when persuasive evidence of an arrangement exists, the services have been provided or delivered, the fees are fixed or determinable, and collectability of the related receivable is reasonably assured. These arrangements are either on a fixed-fee
59
basis over a period of time or based on the number of advertising impressions delivered. Revenue related to agreements based on the number of impressions delivered is recognized when the advertisement is displayed. Revenue related to fixed fee arrangements is recognized ratably over the service period, typically less than 30 days in duration, and such arrangements do not contain minimum impression guarantees.
Snap Ads may be subject to revenue sharing arrangements between us and the content partner. If a revenue share payment is owed to a content partner related to Snap-sold revenue, we recognize that payment as cost of revenue. Under revenue share arrangements with our content partners, we pay a portion of the advertising revenue generated from the display of Snap-sold advertisements in the content partner’s Publisher Stories. These arrangements generally do not contain minimum financial commitments to our publisher partners and are generally not tied to specific events or promotions.
Currently, our Sponsored Creative Tools are only Snap-sold and are not subject to revenue share arrangements. Snap-sold revenue is recognized based on the gross amount that we charge the advertiser. Partner-sold revenue is recognized based on the net amount of revenue we receive from the content partner.
There is significant judgment in accounting for these arrangements related to whether we should report revenue based on the gross amount that we charge the advertiser or the net amount of revenue received from the content partner. To determine if we should report revenue on a gross or net basis, we assess whether we are acting as the principal or agent in the transaction. If we are acting as the principal, we record revenue on a gross basis. If we are acting as the agent, we record revenue on a net basis. We evaluate all of the indicators in the guidance to make this determination. While no one indicator is determinative, we place the most weight on the analysis of whether we are the primary obligor.
We report Snap-sold revenue on a gross basis predominantly because we are the primary obligor responsible for fulfilling the advertisement delivery and maintaining the relationship with the advertiser, including the acceptability of the services delivered. We also establish pricing with the advertiser and have discretion in supplier selection given we can choose where to place the advertisement on available inventory across our platform. We report partner-sold revenue on a net basis predominantly because the content partner is the primary obligor responsible for fulfillment and maintaining the relationship with the advertiser, including the acceptability of the services delivered. The content partner also has latitude in establishing the selling price with the advertiser and has discretion in supplier selection.
Stock-Based Compensation
In the year ended December 31, 2017, total stock-based compensation expense recognized was $2.6 billion. We have granted stock-based awards consisting primarily of RSUs, and to a lesser extent, stock options, to employees, members of our board of directors, and non-employee advisors. The substantial majority of our stock-based awards have been made to employees. RSUs granted before January 1, 2017, or Pre-2017 RSUs, included both service-based and performance conditions to vest in the underlying common stock. The service-based condition for the majority of these awards is satisfied over four years. The performance condition related to these awards was satisfied on the effectiveness of the registration statement for our IPO, which occurred in March 2017. On the effectiveness of the registration statement for our IPO, we recognized $1.3 billion in stock-based compensation expense. All RSUs granted after December 31, 2016, or Post-2017 RSUs, vest on the satisfaction of only service-based conditions.
We account for stock-based employee compensation under the fair value recognition and measurement provisions, in accordance with applicable accounting standards, which requires stock-based awards to be measured based on the grant date fair value. Stock-based compensation expense is recorded net of estimated forfeitures in our consolidated statements of operations. Accordingly, stock-based compensation expense is only recorded for those stock-based awards that we expect to vest. We estimate the forfeiture rate based on historical forfeitures of equity awards and adjust the rate to reflect changes in facts and circumstances, if any. We will revise our estimated forfeiture rate if actual forfeitures differ from our initial estimates. A modification of the terms of a stock-based award is treated as an exchange of the original award for a new award with total compensation cost equal to the grant-date fair value of the original award plus the incremental value of the modification to the award.
Restricted Stock Units
As of December 31, 2017, we have approximately $620.0 million of unrecognized stock-based compensation expense related to Pre-2017 RSUs to be recognized over a weighted-average period of approximately 2.5 years. Total unrecognized compensation cost related to Post-2017 RSUs was $809.5 million as of December 31, 2017 and is expected to be recognized over a weighted-average period of 4.2 years.
60
In addition, on the closing of the IPO, our CEO received the CEO award for 37.4 million shares of Series FP preferred stock, which automatically converted into an equivalent number of shares of Class C common stock on the closing of the IPO. The CEO award represented 3.0% of all outstanding shares on the closing of the IPO, including shares sold by us in the IPO and vested stock options and RSUs on the closing of the IPO, net of shares withheld to satisfy tax withholding obligations. The CEO award vested immediately on the closing of the IPO, and such shares will be delivered to the CEO in equal quarterly installments over three years beginning in November 2017. In November 2017, 3,120,651 shares subject to the CEO award were delivered to the CEO, and 2,392,629 of such shares were sold on his behalf to cover tax withholding obligations. In the three months ended March 31, 2017, the stock-based compensation expense recognized related to the CEO award was $636.6 million, which is based on the vesting of 37.4 million shares of Class C common stock, at the initial public offering price of $17.00 per share.
Stock Options
Total unrecognized compensation cost related to stock options was $35.7 million and $48.6 million as of December 31, 2017 and December 31, 2016, respectively. Stock-based compensation expense for stock options granted to employees is recognized on a straight-line basis over the requisite service period, based on the estimated grant-date fair value, calculated under the Black-Scholes option pricing model.
The Black-Scholes model includes subjective assumptions, including the fair value of our common stock, expected term of the option, expected volatility, risk free rate, and expected dividend yield. These assumptions involve inherent uncertainties and the application of management’s judgment. If factors change and different assumptions are used, our stock-based compensation expense could be materially different in the future.
In the year ended December 31, 2017, we granted and assumed options with an aggregate grant date fair value of $41.1 million. The weighted-average assumptions used to determine the fair value of employee stock options granted and assumed during the year ended December 31, 2017 were as follows:
|
Expected term from grant date (in years) |
|
|
3.0 |
|
|
Risk-free interest rate |
|
|
1.9 |
% |
|
Expected volatility |
|
|
51 |
% |
|
Dividend yield |
|
|
0 |
% |
|
Strike price |
|
$ |
13.62 |
|
The weighted-average fair value of employee stock options granted and assumed during the year ended December 31, 2017 was $5.84 per share.
Business Combinations and Valuation of Goodwill and Other Acquired Intangible Assets
We estimate the fair value of assets acquired and liabilities assumed in a business combination. Goodwill as of the acquisition date is measured as the excess of consideration transferred over the net of the acquisition date fair values of the assets acquired and the liabilities assumed. While we use our best estimates and assumptions to accurately value assets acquired and liabilities assumed at the acquisition date, our estimates are inherently uncertain and subject to refinement.
Significant estimates in valuing certain intangible assets include, but are not limited to, future expected cash flows from acquired technology, useful lives, and discount rates. Although we believe the assumptions and estimates we have made in the past have been reasonable and appropriate, they are based in part on historical experience and information obtained from the management of the acquired companies and are inherently uncertain. During the measurement period, which may be up to one year from the acquisition date, we record adjustments to the assets acquired and liabilities assumed with the corresponding offset to goodwill. On the conclusion of the measurement period or final determination of the values of assets acquired or liabilities assumed, whichever comes first, any subsequent adjustments are recorded to our consolidated statements of operations.
Income Taxes
We are subject to income taxes in the United States and numerous foreign jurisdictions. Significant judgment is required in determining our uncertain tax positions.
61
We recognize tax benefits from uncertain tax positions only if we believe that it is more likely than not that the tax position will be sustained on examination by the taxing authorities based on the technical merits of the position. Although we believe that we have adequately reserved for our uncertain tax positions, we can provide no assurance that the final tax outcome of these matters will not be materially different. We make adjustments to these reserves when facts and circumstances change, such as the closing of a tax audit or the refinement of an estimate. To the extent that the final tax outcome of these matters is different than the amounts recorded, such differences may affect the provision for income taxes in the period in which such determination is made and could have a material impact on our financial condition and results of operations.
Recent Accounting Pronouncements
See Note 1 to our consolidated financial statements included in “Financial Statements and Supplementary Data” in this Annual Report on Form 10-K for recently adopted accounting pronouncements and recently issued accounting pronouncements not yet adopted as of the date of this Annual Report on Form 10-K.
Item 7A. Quantitative and Qualitative Disclosures About Market Risk.
We are exposed to market risks in the ordinary course of our business. These risks primarily include interest rate risk and foreign currency risk as follows:
Interest Rate Risk
We had cash and cash equivalents totaling $334.1 million and $150.1 million at December 31, 2017 and December 31, 2016, respectively. We had marketable securities totaling $1.7 billion and $837.2 million at December 31, 2017 and December 31, 2016, respectively. Our cash and cash equivalents consist of cash in bank accounts and marketable securities consist of U.S. government debt and agency securities. The primary objectives of our investment activities are to preserve principal and provide liquidity without significantly increasing risk. We do not enter into investments for trading or speculative purposes. Due to the relatively short-term nature of our investment portfolio, a hypothetical 100 basis point change in interest rates would not have a material effect on the fair value of our portfolio for the periods presented.
Foreign Currency Risk
For all periods presented, the majority of our sales and operating expenses were denominated in U.S. dollars. We therefore have not had material foreign currency risk associated with sales and cost-based activities. The functional currency of our material operating entities is the U.S. dollar. For the periods presented, our operations outside of the United States are not considered material and incur a majority of their operating expenses in foreign currencies. Therefore, our results of operations and cash flows are minimally subject to fluctuations from changes in foreign currency rates. We believe the exposure to foreign currency fluctuation from operating expenses is immaterial at this time as the related costs do not constitute a significant portion of our total expenses. As we grow operations, our exposure to foreign currency risk will likely become more significant. For any of the periods presented, we did not enter into any foreign currency exchange contracts. We do, however, anticipate entering into foreign currency exchange contracts for purposes of hedging foreign exchange rate fluctuations on our business operations in future operating periods as our exposures are deemed to be material. For additional discussion on foreign currency risk, see “Risk Factors” in this Annual Report on Form 10-K.
62
Item 8. Financial Statements and Supplementary Data.
SNAP INC.
INDEX TO CONSOLIDATED FINANCIAL STATEMENTS
|
|
64 |
|
|
|
|
|
|
Consolidated Financial Statements: |
|
|
|
|
65 |
|
|
|
|
|
|
|
66 |
|
|
|
|
|
|
|
67 |
|
|
|
|
|
|
|
68 |
|
|
|
|
|
|
|
70 |
|
|
|
|
|
|
|
71 |
The supplementary financial information required by this Item 8 is included in “Management’s Discussion and Analysis of Financial Condition and Results of Operations—Unaudited Quarterly Results of Operations Data,” which is incorporated herein by reference.
63
Report of Independent Registered Public Accounting Firm
To the Stockholders and the Board of Directors of Snap Inc.
Opinion on the Financial Statements
We have audited the accompanying consolidated balance sheets of Snap Inc. (the Company) as of December 31, 2017 and 2016, and the related consolidated statements of operations, comprehensive income (loss), stockholders’ equity, and cash flows for each of the three years in the period ended December 31, 2017, and the related notes (collectively referred to as the “financial statements”). In our opinion, the financial statements present fairly, in all material respects, the consolidated financial position of the Company at December 31, 2017 and 2016, and the consolidated results of its operations and its cash flows for each of the three years in the period ended December 31, 2017, in conformity with U.S. generally accepted accounting principles.
Basis for Opinion
These financial statements are the responsibility of the Company's management. Our responsibility is to express an opinion on the Company’s financial statements based on our audits. We are a public accounting firm registered with the Public Company Accounting Oversight Board (United States) (PCAOB) and are required to be independent with respect to the Company in accordance with the U.S. federal securities laws and the applicable rules and regulations of the Securities and Exchange Commission and the PCAOB.
We conducted our audits in accordance with the standards of the PCAOB. Those standards require that we plan and perform the audit to obtain reasonable assurance about whether the financial statements are free of material misstatement, whether due to error or fraud. The Company is not required to have, nor were we engaged to perform, an audit of its internal control over financial reporting. As part of our audits we are required to obtain an understanding of internal control over financial reporting but not for the purpose of expressing an opinion on the effectiveness of the Company’s internal control over financial reporting. Accordingly, we express no such opinion.
Our audits included performing procedures to assess the risks of material misstatement of the financial statements, whether due to error or fraud, and performing procedures that respond to those risks. Such procedures included examining, on a test basis, evidence regarding the amounts and disclosures in the financial statements. Our audits also included evaluating the accounting principles used and significant estimates made by management, as well as evaluating the overall presentation of the financial statements. We believe that our audits provide a reasonable basis for our opinion.
/s/ Ernst & Young LLP
We have served as the Company’s auditor since 2016.
Los Angeles, California
February 21, 2018
64
(in thousands, except per share amounts)
|
|
|
December 31, |
|
|||||
|
|
|
2017 |
|
|
2016 |
|
||
|
Assets |
|
|
|
|
|
|
|
|
|
Current assets |
|
|
|
|
|
|
|
|
|
Cash and cash equivalents |
|
$ |
334,063 |
|
|
$ |
150,121 |
|
|
Marketable securities |
|
|
1,708,976 |
|
|
|
837,247 |
|
|
Accounts receivable, net of allowance |
|
|
279,473 |
|
|
|
162,659 |
|
|
Prepaid expenses and other current assets |
|
|
44,282 |
|
|
|
29,958 |
|
|
Total current assets |
|
|
2,366,794 |
|
|
|
1,179,985 |
|
|
Property and equipment, net |
|
|
166,762 |
|
|
|
100,585 |
|
|
Intangible assets, net |
|
|
166,473 |
|
|
|
75,982 |
|
|
Goodwill |
|
|
639,882 |
|
|
|
319,137 |
|
|
Other assets |
|
|
81,655 |
|
|
|
47,103 |
|
|
Total assets |
|
$ |
3,421,566 |
|
|
$ |
1,722,792 |
|
|
Liabilities and Stockholders’ Equity |
|
|
|
|
|
|
|
|
|
Current liabilities |
|
|
|
|
|
|
|
|
|
Accounts payable |
|
$ |
71,194 |
|
|
$ |
8,419 |
|
|
Accrued expenses and other current liabilities |
|
|
275,062 |
|
|
|
148,325 |
|
|
Total current liabilities |
|
|
346,256 |
|
|
|
156,744 |
|
|
Other liabilities |
|
|
82,983 |
|
|
|
47,134 |
|
|
Total liabilities |
|
|
429,239 |
|
|
|
203,878 |
|
|
Commitments and contingencies (Note 6) |
|
|
|
|
|
|
|
|
|
Stockholders’ equity |
|
|
|
|
|
|
|
|
|
Convertible voting preferred stock, Series A, A-1, and B, $0.00001 par value. No shares and 146,962 shares authorized, issued, and outstanding at December 31, 2017 and December 31, 2016, respectively. Liquidation preference of $95,175 at December 31, 2016. |
|
|
— |
|
|
1 |
|
|
|
Convertible non-voting preferred stock, Series C, $0.00001 par value. No shares and 16,000 shares authorized, issued, and outstanding at December 31, 2017 and December 31, 2016, respectively. Liquidation preference of $54,543 at December 31, 2016. |
|
|
— |
|
|
|
— |
|
|
Convertible non-voting preferred stock, Series D, E, and F, $0.00001 par value. No shares and 83,851 shares authorized, issued, and outstanding at December 31, 2017 and December 31, 2016, respectively. |
|
|
— |
|
|
|
2 |
|
|
Series FP convertible voting preferred stock, $0.00001 par value. No shares and 260,888 shares authorized at December 31, 2017 and December 31, 2016, respectively. No shares and 215,888 shares issued and outstanding at December 31, 2017 and December 31, 2016, respectively. |
|
|
— |
|
|
|
2 |
|
|
Class A non-voting common stock, $0.00001 par value. 3,000,000 shares authorized, 883,022 shares issued and outstanding at December 31, 2017, and 1,500,000 shares authorized, 504,902 shares issued and outstanding at December 31, 2016. |
|
|
9 |
|
|
|
5 |
|
|
Class B voting common stock, $0.00001 par value. 700,000 shares authorized, 122,564 shares issued and outstanding at December 31, 2017, and 1,500,000 shares authorized, 31,469 shares issued and outstanding at December 31, 2016. |
|
|
1 |
|
|
|
— |
|
|
Class C voting common stock, $0.00001 par value. 260,888 shares authorized, 216,616 shares issued and outstanding at December 31, 2017, and 260,888 shares authorized and no shares issued and outstanding at December 31, 2016. |
|
|
2 |
|
|
|
— |
|
|
Additional paid-in capital |
|
|
7,634,825 |
|
|
|
2,728,823 |
|
|
Accumulated other comprehensive income (loss) |
|
|
14,157 |
|
|
|
(2,057 |
) |
|
Accumulated deficit |
|
|
(4,656,667 |
) |
|
|
(1,207,862 |
) |
|
Total stockholders’ equity |
|
|
2,992,327 |
|
|
|
1,518,914 |
|
|
Total liabilities and stockholders’ equity |
|
$ |
3,421,566 |
|
|
$ |
1,722,792 |
|
See Notes to Consolidated Financial Statements.
65
Consolidated Statements of Operations
(in thousands, except per share amounts)
|
|
|
Year Ended December 31, |
|
|||||||||
|
|
|
2017 |
|
|
2016 |
|
|
2015 |
|
|||
|
Revenue |
|
$ |
824,949 |
|
|
$ |
404,482 |
|
|
$ |
58,663 |
|
|
Costs and expenses: |
|
|
|
|
|
|
|
|
|
|
|
|
|
Cost of revenue |
|
|
717,462 |
|
|
|
451,660 |
|
|
|
182,341 |
|
|
Research and development |
|
|
1,534,863 |
|
|
|
183,676 |
|
|
|
82,235 |
|
|
Sales and marketing |
|
|
522,605 |
|
|
|
124,371 |
|
|
|
27,216 |
|
|
General and administrative |
|
|
1,535,595 |
|
|
|
165,160 |
|
|
|
148,600 |
|
|
Total costs and expenses |
|
|
4,310,525 |
|
|
|
924,867 |
|
|
|
440,392 |
|
|
Loss from operations |
|
|
(3,485,576 |
) |
|
|
(520,385 |
) |
|
|
(381,729 |
) |
|
Interest income |
|
|
21,096 |
|
|
|
4,654 |
|
|
|
1,399 |
|
|
Interest expense |
|
|
(3,456 |
) |
|
|
(1,424 |
) |
|
|
— |
|
|
Other income (expense), net |
|
|
4,528 |
|
|
|
(4,568 |
) |
|
|
(152 |
) |
|
Loss before income taxes |
|
|
(3,463,408 |
) |
|
|
(521,723 |
) |
|
|
(380,482 |
) |
|
Income tax benefit (expense) |
|
|
18,342 |
|
|
|
7,080 |
|
|
|
7,589 |
|
|
Net loss |
|
$ |
(3,445,066 |
) |
|
$ |
(514,643 |
) |
|
$ |
(372,893 |
) |
|
Net loss per share attributable to Class A, Class B, and Class C common stockholders (Note 2): |
|
|
|
|
|
|
|
|
|
|
|
|
|
Basic |
|
$ |
(2.95 |
) |
|
$ |
(0.64 |
) |
|
$ |
(0.51 |
) |
|
Diluted |
|
$ |
(2.95 |
) |
|
$ |
(0.64 |
) |
|
$ |
(0.51 |
) |
See Notes to Consolidated Financial Statements.
66
Consolidated Statements of Comprehensive Income (Loss)
(in thousands)
|
|
|
Year Ended December 31, |
|
|||||||||
|
|
|
2017 |
|
|
2016 |
|
|
2015 |
|
|||
|
Net loss |
|
$ |
(3,445,066 |
) |
|
$ |
(514,643 |
) |
|
$ |
(372,893 |
) |
|
Other comprehensive income (loss), net of tax: |
|
|
|
|
|
|
|
|
|
|
|
|
|
Unrealized gain (loss) on marketable securities, net of tax |
|
|
(1,122 |
) |
|
|
44 |
|
|
|
— |
|
|
Foreign currency translation |
|
|
17,336 |
|
|
|
(2,101 |
) |
|
|
— |
|
|
Total other comprehensive income (loss), net of tax |
|
|
16,214 |
|
|
|
(2,057 |
) |
|
|
— |
|
|
Total comprehensive income (loss) |
|
$ |
(3,428,852 |
) |
|
$ |
(516,700 |
) |
|
$ |
(372,893 |
) |
See Notes to Consolidated Financial Statements.
67
Consolidated Statements of Stockholders’ Equity
(in thousands)
|
|
|
Year Ended December 31, |
|
|||||||||||||||||||||
|
|
|
2017 |
|
|
2016 |
|
|
2015 |
|
|||||||||||||||
|
|
|
Shares |
|
|
Amount |
|
|
Shares |
|
|
Amount |
|
|
Shares |
|
|
Amount |
|
||||||
|
Convertible voting preferred stock—Series A, A-1, and B |
|
|
|
|
|
|
|
|
|
|
|
|
|
|
|
|
|
|
|
|
|
|
|
|
|
Balance, beginning of period |
|
|
146,962 |
|
|
$ |
1 |
|
|
|
146,962 |
|
|
$ |
1 |
|
|
|
146,962 |
|
|
$ |
1 |
|
|
Conversion of Series A, A-1, and B to Class B voting common stock |
|
|
(146,962 |
) |
|
|
(1 |
) |
|
|
— |
|
|
|
— |
|
|
|
— |
|
|
|
— |
|
|
Balance, end of period |
|
|
— |
|
|
|
— |
|
|
|
146,962 |
|
|
|
1 |
|
|
|
146,962 |
|
|
|
1 |
|
|
Convertible non-voting preferred stock—Series C |
|
|
|
|
|
|
|
|
|
|
|
|
|
|
|
|
|
|
|
|
|
|
|
|
|
Balance, beginning of period |
|
|
16,000 |
|
|
|
— |
|
|
|
16,000 |
|
|
|
— |
|
|
|
16,000 |
|
|
|
— |
|
|
Conversion of Series C to Class B voting common stock |
|
|
(16,000 |
) |
|
|
— |
|
|
|
— |
|
|
|
— |
|
|
|
— |
|
|
|
— |
|
|
Balance, end of period |
|
|
— |
|
|
|
— |
|
|
|
16,000 |
|
|
|
— |
|
|
|
16,000 |
|
|
|
— |
|
|
Convertible non-voting preferred stock—Series D, E, and F |
|
|
|
|
|
|
|
|
|
|
|
|
|
|
|
|
|
|
|
|
|
|
|
|
|
Balance, beginning of period |
|
|
83,851 |
|
|
|
2 |
|
|
|
44,555 |
|
|
|
1 |
|
|
|
23,351 |
|
|
|
— |
|
|
Issuance of Series F non-voting preferred stock, net of issuance costs |
|
|
— |
|
|
|
— |
|
|
|
37,668 |
|
|
|
1 |
|
|
|
21,204 |
|
|
|
1 |
|
|
Exchange of Series FP voting preferred stock for Series F non-voting preferred stock |
|
|
— |
|
|
|
— |
|
|
|
1,628 |
|
|
|
— |
|
|
|
— |
|
|
|
— |
|
|
Conversion of Series D, E, and F to Class B voting common stock |
|
|
(83,851 |
) |
|
|
(2 |
) |
|
|
— |
|
|
|
— |
|
|
|
— |
|
|
|
— |
|
|
Balance, end of period |
|
|
— |
|
|
|
— |
|
|
|
83,851 |
|
|
|
2 |
|
|
|
44,555 |
|
|
|
1 |
|
|
Convertible voting preferred stock—Series FP |
|
|
|
|
|
|
|
|
|
|
|
|
|
|
|
|
|
|
|
|
|
|
|
|
|
Balance, beginning of period |
|
|
215,887 |
|
|
|
2 |
|
|
|
217,767 |
|
|
|
2 |
|
|
|
217,767 |
|
|
|
2 |
|
|
Repurchase of Series FP voting preferred stock |
|
|
— |
|
|
|
— |
|
|
|
(252 |
) |
|
|
— |
|
|
|
— |
|
|
|
— |
|
|
Exchange of Series FP voting preferred stock for Series F non-voting preferred stock |
|
|
— |
|
|
|
— |
|
|
|
(1,628 |
) |
|
|
— |
|
|
|
— |
|
|
|
— |
|
|
Conversion of Series FP to Class C voting common stock |
|
|
(215,887 |
) |
|
|
(2 |
) |
|
|
— |
|
|
|
— |
|
|
|
— |
|
|
|
— |
|
|
Balance, end of period |
|
|
— |
|
|
|
— |
|
|
|
215,887 |
|
|
|
2 |
|
|
|
217,767 |
|
|
|
2 |
|
|
Class A non-voting common stock |
|
|
|
|
|
|
|
|
|
|
|
|
|
|
|
|
|
|
|
|
|
|
|
|
|
Balance, beginning of period |
|
|
504,902 |
|
|
|
5 |
|
|
|
460,655 |
|
|
|
5 |
|
|
|
437,363 |
|
|
|
5 |
|
|
Impact of Class A stock split related to Series F non-voting preferred stock (Note 1) |
|
|
— |
|
|
|
— |
|
|
|
37,668 |
|
|
|
— |
|
|
|
21,204 |
|
|
|
— |
|
|
Impact of Class A stock split related to Class B voting common stock (Note 1) |
|
|
— |
|
|
|
— |
|
|
|
538 |
|
|
|
— |
|
|
|
183 |
|
|
|
— |
|
|
Impact of Class A stock split related to repurchase of Series FP voting preferred stock (Note 1) |
|
|
— |
|
|
|
— |
|
|
|
(252 |
) |
|
|
— |
|
|
|
— |
|
|
|
— |
|
|
Shares issued in connection with exercise of stock options under stock-based compensation plans |
|
|
9,928 |
|
|
|
— |
|
|
|
— |
|
|
|
— |
|
|
|
2 |
|
|
|
— |
|
|
Shares issued in connection with exercise of stock options, converted from Class B voting common stock and subsequently sold |
|
|
4,923 |
|
|
|
— |
|
|
|
— |
|
|
|
— |
|
|
|
— |
|
|
|
— |
|
|
Issuance of Class A non-voting common stock in connection with acquisitions |
|
|
1,854 |
|
|
|
— |
|
|
|
6,293 |
|
|
|
— |
|
|
|
1,903 |
|
|
|
— |
|
|
Issuance of Class A non-voting common stock for vesting of restricted stock units |
|
|
40,922 |
|
|
|
— |
|
|
|
— |
|
|
|
— |
|
|
|
— |
|
|
|
— |
|
|
Issuance of Class A non-voting common stock upon initial public offering, net of issuance costs |
|
|
160,350 |
|
|
|
2 |
|
|
|
— |
|
|
|
— |
|
|
|
— |
|
|
|
— |
|
|
Conversion of Class B voting common stock to Class A non-voting common stock |
|
|
169,800 |
|
|
|
2 |
|
|
|
— |
|
|
|
— |
|
|
|
— |
|
|
|
— |
|
|
Stock repurchases from employees for tax withholdings |
|
|
(16,867 |
) |
|
|
— |
|
|
|
— |
|
|
|
— |
|
|
|
— |
|
|
|
— |
|
|
Class A non-voting common stock sold on behalf of employees to cover taxes |
|
|
7,210 |
|
|
|
— |
|
|
|
— |
|
|
|
— |
|
|
|
— |
|
|
|
— |
|
|
Balance, end of period |
|
|
883,022 |
|
|
$ |
9 |
|
|
|
504,902 |
|
|
$ |
5 |
|
|
|
460,655 |
|
|
$ |
5 |
|
See Notes to Consolidated Financial Statements.
68
Consolidated Statements of Stockholders’ Equity (Continued)
(in thousands)
|
|
|
Year Ended December 31, |
|
|||||||||||||||||||||
|
|
|
2017 |
|
|
2016 |
|
|
2015 |
|
|||||||||||||||
|
|
|
Shares |
|
|
Amount |
|
|
Shares |
|
|
Amount |
|
|
Shares |
|
|
Amount |
|
||||||
|
Class B voting common stock |
|
|
|
|
|
|
|
|
|
|
|
|
|
|
|
|
|
|
|
|
|
|
|
|
|
Balance, beginning of period |
|
|
31,469 |
|
|
$ |
— |
|
|
|
30,931 |
|
|
$ |
— |
|
|
|
30,748 |
|
|
$ |
— |
|
|
Conversion of Series A-F preferred to Class B voting common stock |
|
|
246,813 |
|
|
|
2 |
|
|
|
686 |
|
|
|
— |
|
|
|
59 |
|
|
|
— |
|
|
Shares issued in connection with exercise of stock options under stock-based compensation plans |
|
|
9,396 |
|
|
|
— |
|
|
|
— |
|
|
|
— |
|
|
|
— |
|
|
|
— |
|
|
Shares issued in connection with exercise of stock options, converted to Class A non-voting common stock and subsequently sold |
|
|
(4,923 |
) |
|
|
— |
|
|
|
(536 |
) |
|
|
— |
|
|
|
(32 |
) |
|
|
— |
|
|
Repurchase of Class B voting common stock |
|
|
— |
|
|
|
— |
|
|
|
388 |
|
|
|
— |
|
|
|
156 |
|
|
|
— |
|
|
Issuance of Class B voting common stock for vesting of restricted stock units |
|
|
18,906 |
|
|
|
1 |
|
|
|
— |
|
|
|
— |
|
|
|
— |
|
|
|
— |
|
|
Conversion of Class B voting common stock to Class A non-voting common stock |
|
|
(169,800 |
) |
|
|
(2 |
) |
|
|
— |
|
|
|
— |
|
|
|
— |
|
|
|
— |
|
|
Stock repurchases from employees for tax withholdings |
|
|
(8,390 |
) |
|
|
— |
|
|
|
— |
|
|
|
— |
|
|
|
— |
|
|
|
— |
|
|
Shares converted to Class A non-voting common stock and subsequently sold on behalf of employees to cover taxes |
|
|
(907 |
) |
|
|
— |
|
|
|
— |
|
|
|
— |
|
|
|
— |
|
|
|
— |
|
|
Balance, end of period |
|
|
122,564 |
|
|
|
1 |
|
|
|
31,469 |
|
|
|
— |
|
|
|
30,931 |
|
|
|
— |
|
|
Class C voting common stock |
|
|
|
|
|
|
|
|
|
|
|
|
|
|
|
|
|
|
|
|
|
|
|
|
|
Balance, beginning of period |
|
|
— |
|
|
|
— |
|
|
|
— |
|
|
|
— |
|
|
|
— |
|
|
|
— |
|
|
Conversion of Series FP preferred stock to Class C voting common stock |
|
|
215,887 |
|
|
|
2 |
|
|
|
— |
|
|
|
— |
|
|
|
— |
|
|
|
— |
|
|
Issuance of Class C voting common stock for vesting of restricted stock awards |
|
|
3,122 |
|
|
|
— |
|
|
|
— |
|
|
|
— |
|
|
|
— |
|
|
|
— |
|
|
Shares converted to Class A non-voting common stock and subsequently sold on behalf of employees to cover taxes |
|
|
(2,393 |
) |
|
|
— |
|
|
|
— |
|
|
|
— |
|
|
|
— |
|
|
|
— |
|
|
Balance, end of period |
|
|
216,616 |
|
|
|
2 |
|
|
|
— |
|
|
|
— |
|
|
|
— |
|
|
|
— |
|
|
Additional paid-in capital |
|
|
|
|
|
|
|
|
|
|
|
|
|
|
|
|
|
|
|
|
|
|
|
|
|
Balance, beginning of period |
|
|
— |
|
|
|
2,728,823 |
|
|
|
— |
|
|
|
1,467,355 |
|
|
|
— |
|
|
|
711,978 |
|
|
Stock-based compensation expense |
|
|
— |
|
|
|
2,639,895 |
|
|
|
— |
|
|
|
31,842 |
|
|
|
— |
|
|
|
73,524 |
|
|
Shares issued in connection with exercise of stock options under stock-based compensation plans |
|
|
— |
|
|
|
11,379 |
|
|
|
— |
|
|
|
698 |
|
|
|
— |
|
|
|
60 |
|
|
Vesting of shares related to early exercise of Class A non-voting common stock options |
|
|
— |
|
|
|
— |
|
|
|
— |
|
|
|
49 |
|
|
|
— |
|
|
|
2,218 |
|
|
Issuance of Series F non-voting preferred stock, net of issuance costs |
|
|
— |
|
|
|
— |
|
|
|
— |
|
|
|
1,157,146 |
|
|
|
— |
|
|
|
651,305 |
|
|
Issuance of Class A non-voting common stock in connection with acquisitions |
|
|
— |
|
|
|
6,406 |
|
|
|
— |
|
|
|
96,145 |
|
|
|
— |
|
|
|
— |
|
|
Issuance of Class B voting common stock in connection with acquisitions |
|
|
— |
|
|
|
— |
|
|
|
— |
|
|
|
— |
|
|
|
— |
|
|
|
29,270 |
|
|
Repurchase of Class B voting common stock |
|
|
— |
|
|
|
— |
|
|
|
— |
|
|
|
(8,013 |
) |
|
|
— |
|
|
|
(1,000 |
) |
|
Repurchase of Series FP voting preferred stock |
|
|
— |
|
|
|
— |
|
|
|
— |
|
|
|
(16,180 |
) |
|
|
— |
|
|
|
— |
|
|
Settlement of restricted stock units |
|
|
— |
|
|
|
— |
|
|
|
— |
|
|
|
(219 |
) |
|
|
— |
|
|
|
— |
|
|
Issuance of common stock upon initial public offering, net of issuance costs |
|
|
— |
|
|
|
2,642,729 |
|
|
|
— |
|
|
|
— |
|
|
|
— |
|
|
|
— |
|
|
Stock repurchases from employees for tax withholdings |
|
|
— |
|
|
|
(394,407 |
) |
|
|
— |
|
|
|
— |
|
|
|
— |
|
|
|
— |
|
|
Balance, end of period |
|
|
— |
|
|
|
7,634,825 |
|
|
|
— |
|
|
|
2,728,823 |
|
|
|
— |
|
|
|
1,467,355 |
|
|
Accumulated deficit |
|
|
|
|
|
|
|
|
|
|
|
|
|
|
|
|
|
|
|
|
|
|
|
|
|
Balance, beginning of period |
|
|
— |
|
|
|
(1,207,862 |
) |
|
|
— |
|
|
|
(693,219 |
) |
|
|
— |
|
|
|
(320,326 |
) |
|
Cumulative-effect adjustment from adoption of ASU 2016-16 |
|
|
— |
|
|
|
(3,739 |
) |
|
|
— |
|
|
|
— |
|
|
|
— |
|
|
|
— |
|
|
Net loss |
|
|
— |
|
|
|
(3,445,066 |
) |
|
|
— |
|
|
|
(514,643 |
) |
|
|
— |
|
|
|
(372,893 |
) |
|
Balance, end of period |
|
|
— |
|
|
|
(4,656,667 |
) |
|
|
— |
|
|
|
(1,207,862 |
) |
|
|
— |
|
|
|
(693,219 |
) |
|
Notes receivable from officers/stockholders |
|
|
|
|
|
|
|
|
|
|
|
|
|
|
|
|
|
|
|
|
|
|
|
|
|
Balance, beginning of period |
|
|
— |
|
|
|
— |
|
|
|
— |
|
|
|
(10,000 |
) |
|
|
— |
|
|
|
(2,500 |
) |
|
Issuance of notes receivable from officers/stockholders |
|
|
— |
|
|
|
— |
|
|
|
— |
|
|
|
(15,000 |
) |
|
|
— |
|
|
|
(7,500 |
) |
|
Repayment of notes receivable from officers/stockholders |
|
|
— |
|
|
|
— |
|
|
|
— |
|
|
|
25,000 |
|
|
|
— |
|
|
|
— |
|
|
Balance, end of period |
|
|
— |
|
|
|
— |
|
|
|
— |
|
|
|
— |
|
|
|
— |
|
|
|
(10,000 |
) |
|
Accumulated other comprehensive income (loss) |
|
|
|
|
|
|
|
|
|
|
|
|
|
|
|
|
|
|
|
|
|
|
|
|
|
Balance, beginning of period |
|
|
— |
|
|
|
(2,057 |
) |
|
|
— |
|
|
|
— |
|
|
|
— |
|
|
|
— |
|
|
Other comprehensive income (loss) |
|
|
— |
|
|
|
16,214 |
|
|
|
— |
|
|
|
(2,057 |
) |
|
|
— |
|
|
|
— |
|
|
Balance, end of period |
|
|
— |
|
|
|
14,157 |
|
|
|
— |
|
|
|
(2,057 |
) |
|
|
— |
|
|
|
— |
|
|
Total stockholders’ equity |
|
|
1,222,202 |
|
|
$ |
2,992,327 |
|
|
|
999,071 |
|
|
$ |
1,518,914 |
|
|
|
916,870 |
|
|
$ |
764,145 |
|
See Notes to Consolidated Financial Statements.
69
Consolidated Statements of Cash Flows
(in thousands)
|
|
|
Year Ended December 31, |
|
|||||||||
|
|
|
2017 |
|
|
2016 |
|
|
2015 |
|
|||
|
Cash flows from operating activities |
|
|
|
|
|
|
|
|
|
|
|
|
|
Net loss |
|
$ |
(3,445,066 |
) |
|
$ |
(514,643 |
) |
|
$ |
(372,893 |
) |
|
Adjustments to reconcile net loss to net cash used in operating activities: |
|
|
|
|
|
|
|
|
|
|
|
|
|
Depreciation and amortization |
|
|
61,288 |
|
|
|
29,115 |
|
|
|
15,307 |
|
|
Stock-based compensation |
|
|
2,639,895 |
|
|
|
31,842 |
|
|
|
73,524 |
|
|
Deferred income taxes |
|
|
(17,490 |
) |
|
|
(7,952 |
) |
|
|
(7,700 |
) |
|
Excess inventory reserve and related asset impairment |
|
|
21,997 |
|
|
|
— |
|
|
|
— |
|
|
Other |
|
|
(6,356 |
) |
|
|
889 |
|
|
|
626 |
|
|
Change in operating assets and liabilities, net of effect of acquisitions: |
|
|
|
|
|
|
|
|
|
|
|
|
|
Accounts receivable, net of allowance |
|
|
(104,357 |
) |
|
|
(118,434 |
) |
|
|
(41,905 |
) |
|
Prepaid expenses and other current assets |
|
|
(39,783 |
) |
|
|
(20,521 |
) |
|
|
(6,590 |
) |
|
Other assets |
|
|
(4,771 |
) |
|
|
(5,064 |
) |
|
|
(4,451 |
) |
|
Accounts payable |
|
|
49,696 |
|
|
|
6,486 |
|
|
|
(6,724 |
) |
|
Accrued expenses and other current liabilities |
|
|
100,988 |
|
|
|
(19,728 |
) |
|
|
40,026 |
|
|
Other liabilities |
|
|
9,292 |
|
|
|
6,765 |
|
|
|
4,158 |
|
|
Net cash used in operating activities |
|
|
(734,667 |
) |
|
|
(611,245 |
) |
|
|
(306,622 |
) |
|
Cash flows from investing activities |
|
|
|
|
|
|
|
|
|
|
|
|
|
Purchases of property and equipment |
|
|
(84,518 |
) |
|
|
(66,441 |
) |
|
|
(19,205 |
) |
|
Purchases of intangible assets |
|
|
(8,107 |
) |
|
|
(572 |
) |
|
|
(9,100 |
) |
|
Non-marketable investments |
|
|
(10,030 |
) |
|
|
(6,513 |
) |
|
|
(9,551 |
) |
|
Cash paid for acquisitions, net of cash acquired |
|
|
(386,011 |
) |
|
|
(104,001 |
) |
|
|
(48,730 |
) |
|
Issuance of notes receivable from officers/stockholders |
|
|
— |
|
|
|
(15,000 |
) |
|
|
(7,500 |
) |
|
Repayment of notes receivables from officers/stockholders |
|
|
— |
|
|
|
15,000 |
|
|
|
— |
|
|
Purchases of marketable securities |
|
|
(3,862,637 |
) |
|
|
(1,565,347 |
) |
|
|
— |
|
|
Sales of marketable securities |
|
|
511,068 |
|
|
|
195,898 |
|
|
|
— |
|
|
Maturities of marketable securities |
|
|
2,483,225 |
|
|
|
532,690 |
|
|
|
— |
|
|
Change in restricted cash |
|
|
10,271 |
|
|
|
(7,048 |
) |
|
|
(1,856 |
) |
|
Other investing activities |
|
|
— |
|
|
|
— |
|
|
|
(5,000 |
) |
|
Net cash used in investing activities |
|
|
(1,346,739 |
) |
|
|
(1,021,334 |
) |
|
|
(100,942 |
) |
|
Cash flows from financing activities |
|
|
|
|
|
|
|
|
|
|
|
|
|
Proceeds from the exercise of stock options |
|
|
11,379 |
|
|
|
731 |
|
|
|
60 |
|
|
Stock repurchases from employees for tax withholdings |
|
|
(394,156 |
) |
|
|
— |
|
|
|
— |
|
|
Proceeds from issuance of Class A common stock in initial public offering, net of underwriting commissions |
|
|
2,657,797 |
|
|
|
— |
|
|
|
— |
|
|
Repurchase of Class B voting common stock and Series FP voting preferred stock |
|
|
— |
|
|
|
(10,593 |
) |
|
|
(1,000 |
) |
|
Proceeds from issuances of preferred stock, net of issuance costs |
|
|
— |
|
|
|
1,157,147 |
|
|
|
651,306 |
|
|
Borrowings from revolving credit facility |
|
|
— |
|
|
|
5,000 |
|
|
|
— |
|
|
Principal payments on revolving credit facility |
|
|
— |
|
|
|
(5,000 |
) |
|
|
— |
|
|
Payments of initial public offering costs |
|
|
(9,672 |
) |
|
|
(5,395 |
) |
|
|
— |
|
|
Net cash provided by financing activities |
|
|
2,265,348 |
|
|
|
1,141,890 |
|
|
|
650,366 |
|
|
Change in cash and cash equivalents |
|
|
183,942 |
|
|
|
(490,689 |
) |
|
|
242,802 |
|
|
Cash and cash equivalents, beginning of period |
|
|
150,121 |
|
|
|
640,810 |
|
|
|
398,008 |
|
|
Cash and cash equivalents, end of period |
|
$ |
334,063 |
|
|
$ |
150,121 |
|
|
$ |
640,810 |
|
|
Supplemental disclosures |
|
|
|
|
|
|
|
|
|
|
|
|
|
Cash paid for income taxes |
|
$ |
6,226 |
|
|
$ |
1,686 |
|
|
$ |
3 |
|
|
Supplemental disclosures of non-cash activities |
|
|
|
|
|
|
|
|
|
|
|
|
|
Issuance of Class B voting common stock related to acquisitions |
|
$ |
— |
|
|
$ |
96,145 |
|
|
$ |
29,270 |
|
|
Assumed equity awards in acquisitions |
|
$ |
3,911 |
|
|
$ |
— |
|
|
$ |
— |
|
|
Purchase consideration liabilities related to acquisitions |
|
$ |
16,486 |
|
|
$ |
21,085 |
|
|
$ |
— |
|
|
Repurchase of Class B voting common stock and Series FP voting preferred stock in exchange for notes receivable from officers/stockholders |
|
$ |
— |
|
|
$ |
13,500 |
|
|
$ |
— |
|
|
Construction in progress related to financing lease obligations |
|
$ |
1,451 |
|
|
$ |
1,789 |
|
|
$ |
6,305 |
|
|
Net change in accounts payable and accrued expenses and other current liabilities related to property and equipment additions |
|
$ |
13,139 |
|
|
$ |
2,084 |
|
|
$ |
3,174 |
|
|
Deferred offering costs accrued, unpaid |
|
$ |
— |
|
|
$ |
1,739 |
|
|
$ |
— |
|
See Notes to Consolidated Financial Statements.
70
Notes to Consolidated Financial Statements
1. Summary of Significant Accounting Policies
Snap Inc. is a camera company.
Snap Inc. (“we,” “our,” or “us”) was formed as Future Freshman, LLC, a California limited liability company, in 2010. We changed our name to Toyopa Group, LLC in 2011, incorporated as Snapchat, Inc., a Delaware corporation, in 2012, and changed our name to Snap Inc. in 2016. Snap Inc. is headquartered in Venice, California. Our flagship product, Snapchat, is a camera application that was created to help people communicate through short videos and images called “Snaps.”
Basis of Presentation
Our consolidated financial statements are prepared in accordance with U.S. generally accepted accounting principles (“GAAP”). Our consolidated financial statements include the accounts of Snap Inc. and our wholly owned subsidiaries. All intercompany transactions and balances have been eliminated in consolidation. Our fiscal year ends on December 31.
Stock Split Effected in the Form of a Stock Dividend
On October 26, 2016, our board of directors approved a distribution of shares of Class A common stock as a dividend to the holders of all preferred stock and common stock outstanding on October 31, 2016. One share of Class A common stock was distributed for each share of preferred stock and common stock outstanding (the “Stock Split”). As a result of the Stock Split, each outstanding equity award was adjusted to entitle the award holder to receive one share of Class A common stock for each outstanding restricted stock award or stock option to acquire a share of either Class A common stock or Class B common stock. Share and per share amounts for Class A common stock disclosed for all prior periods have been retroactively adjusted to reflect the effects of the Stock Split.
Initial Public Offering
In March 2017, we completed our initial public offering (“IPO”) in which we issued and sold 160.3 million shares of Class A common stock, inclusive of the over-allotment, at an initial public offering price of $17.00 per share and excluding shares sold in the IPO by certain of our existing stockholders. We received net proceeds of $2.6 billion after deducting underwriting discounts and commissions of $68.1 million and other offering expenses of $14.7 million. On the closing of the IPO, all shares of our then-outstanding convertible preferred stock other than Series FP preferred stock automatically converted into an aggregate of 246.8 million shares of Class B common stock and all outstanding shares of Series FP preferred stock automatically converted into 215.9 million shares of Class C common stock. Following the IPO, we have three classes of authorized common stock – Class A common stock, Class B common stock, and Class C common stock.
Restricted stock units (“RSUs”) granted to employees before January 1, 2017 (“Pre-2017 RSUs”) included both service-based and performance conditions to vest in the underlying common stock. The performance condition related to these awards was satisfied on the effectiveness of the registration statement for our IPO, which occurred in March 2017. On the effectiveness of the registration statement for our IPO, we recognized $1.3 billion of stock-based compensation expense for Pre-2017 RSUs. To meet the related tax withholding requirements, we withheld 12.1 million of the 26.7 million shares of common stock issued. Based on the initial public offering price of $17.00 per share, the tax withholding obligation for these vested Pre-2017 RSUs was $206.6 million.
In addition, on the closing of the IPO, our Chief Executive Officer (“CEO”) received an RSU award (“CEO award”) for 37.4 million shares of Series FP preferred stock, which automatically converted into an equivalent number of shares of Class C common stock on the closing of the IPO. The CEO award represented 3.0% of all outstanding shares on the closing of the IPO, including shares sold by us in the IPO and vested stock options and RSUs, net of shares withheld to satisfy tax withholding obligations, on the closing of the IPO. The CEO award vested immediately on the closing of the IPO, and such shares will be delivered to the CEO in equal quarterly installments over three years beginning in November 2017. There is no continuing service requirement for our CEO. The stock-based compensation expense recognized related to the CEO award was $636.6 million, which is based on the vesting of 37.4 million shares of Class C common stock on the closing of the IPO, at the initial public offering price of $17.00 per share. For the year ended December 31, 2017, in accordance with terms of the CEO award, 3.1 million shares of Class C common stock were issued, and 34.3 million shares of Class C common stock are to be issued in future periods in equal quarterly installments through 2020.
71
The future tax benefits on settlement of the above RSUs is not expected to be material as currently we have established valuation allowances to reduce our net deferred tax assets to the amount that is more likely than not to be realized. The majority of the future tax benefits that arise on settlement of the above RSUs are in jurisdictions for which our net deferred tax assets have a full valuation allowance.
Use of Estimates
The preparation of our consolidated financial statements in conformity with GAAP requires management to make estimates and assumptions that affect the reported amounts in the consolidated financial statements. Management’s estimates are based on historical information available as of the date of the consolidated financial statements and various other assumptions that we believe are reasonable under the circumstances. Actual results could differ from those estimates.
Key estimates relate primarily to determining the fair value of assets and liabilities assumed in business combinations, evaluation of contingencies, uncertain tax positions, excess inventory reserves, and the fair value of stock-based awards. On an ongoing basis, management evaluates our estimates compared to historical experience and trends, which form the basis for making judgments about the carrying value of assets and liabilities.
Concentrations of Business Risk
We currently use Google cloud services for substantially all of our hosting requirements. A disruption or loss of service from this partner could seriously harm our ability to operate. Although we believe there are other qualified providers that can provide these services, a transition to a new provider could create a significant disruption to our business and negatively impact our consolidated financial statements.
Concentrations of Credit Risk
Financial instruments that potentially subject us to significant concentrations of credit risk consist principally of cash, cash equivalents, marketable securities, and accounts receivable. We maintain cash deposits, cash equivalent balances, and marketable securities with several financial institutions. Cash and cash equivalents may be withdrawn or redeemed on demand. We believe that the financial institutions that hold our cash and cash equivalents are financially sound and, accordingly, minimal credit risk exists with respect to these balances. We also maintain investments in U.S. government debt and agency securities that carry high credit ratings and accordingly, minimal credit risk exists with respect to these balances.
We extend credit to our customers based on an evaluation of their ability to pay amounts due under contractual arrangement and generally do not obtain or require collateral.
Revenue Recognition
We generate substantially all of our revenues by offering various advertising products on Snapchat, including Snap Ads, which are vertical full screen video advertisements, and Sponsored Creative Tools, which include Geofilters and Lenses. Sponsored Geofilters allow users to interact with an advertiser’s brand by enabling stylized brand artwork to be overlaid on a Snap. Sponsored Lenses allow users to interact with an advertiser’s brand by enabling branded interactive experiences.
Revenue from our advertising products is recognized when persuasive evidence of an arrangement exists with our customers, the services have been provided or delivered, the fees are fixed or determinable, and collectability of the related receivable is reasonably assured. The majority of advertising revenue is generated from the display of advertisements on Snapchat through contractual agreements, that are either on a fixed fee basis over a period of time or based on the number of advertising impressions delivered. Revenue related to agreements based on the number of impressions delivered is recognized when the advertisement is displayed. Revenue related to fixed fee arrangements is recognized ratably over the service period, typically less than 30 days in duration, and such arrangements do not contain minimum impression guarantees. In determining whether an arrangement exists, we ensure that an agreement, such as an insertion order, has been fully executed. We determine collectability by performing ongoing credit evaluations and monitoring customer accounts receivable balances. Sales tax is excluded from reported revenue.
72
We sell advertising directly to advertisers (“Snap-sold” revenue) and certain partners that provide content on Snapchat (“content partners”) also sell directly to advertisers (“partner-sold” revenue). Snap Ads may be subject to revenue sharing agreements between us and our content partners. Our Sponsored Creative Tools are only Snap-sold and are not subject to revenue sharing arrangements. Snap-sold revenue is recognized based on the gross amount that we charge the advertiser. Partner-sold revenue is recognized based on the net amount of revenue received from the content partners. For the years ended December 31, 2017, 2016, and 2015 approximately 94%, 91%, and 87% of our advertising revenue was Snap-sold and approximately 6%, 9%, and 13% of our advertising revenue was partner-sold, respectively.
We report Snap-sold revenue on a gross basis predominately because we are the primary obligor responsible for fulfilling advertisement delivery, including the acceptability of the services delivered. For Snap-sold advertising, we enter into contractual arrangements directly with advertisers. We are directly responsible for the fulfillment of the contractual terms and any remedy for issues with such fulfillment. For Snap-sold revenue, we also have latitude in establishing the selling price with the advertiser, as we sell advertisements at a rate determined at our sole discretion.
We report revenue related to transactions sold by our content partners on a net basis predominately because the content partner, and not Snap Inc., is the primary obligor responsible for fulfillment, including the acceptability of the services delivered. In partner-sold advertising arrangements, the content partner has a direct contractual relationship with the advertiser. There is no contractual relationship between us and the advertiser for partner-sold transactions. When a content partner sells advertisements, the content partner is responsible for fulfilling the advertisements, and accordingly, we have determined the content partner is the primary obligor. Additionally, we do not have any latitude in establishing the price with the advertiser for partner-sold advertising. The content partner may sell advertisements at a rate determined at its sole discretion.
We also generate revenue from sales of our hardware product, Spectacles. Revenue from sales of Spectacles is recognized when delivered, risk of loss has transferred to the customer, and no significant obligations remain. We offer customers limited rights to return products and we record reductions to revenue for expected future product returns. For the periods presented, revenue from the sales of Spectacles was not material.
Cost of Revenue
Cost of revenue includes payments made by us based on revenue share arrangements with our content partners. Under these arrangements, we pay a portion of the fees we receive from the advertisers for Snap Ads that are displayed within partner content on Snapchat. Such revenue-share costs were $96.3 million, $57.8 million, and $9.6 million for the years ended December 31, 2017, 2016, and 2015, respectively.
In addition, cost of revenue consists of expenses associated with hosting costs of the Snapchat mobile application and content creation, which includes personnel-related costs and advertising measurement services. In addition, cost of revenue includes inventory costs for our Spectacles hardware product and facilities and other supporting overhead costs, including depreciation and amortization.
Advertising
Advertising costs are expensed as incurred and were $10.9 million, $9.4 million, and $2.7 million for the years ended December 31, 2017, 2016, and 2015 respectively.
Stock-based Compensation
We measure and recognize compensation expense for stock-based payment awards, including stock options and RSUs granted to employees and advisors, based on the grant date fair value of the awards. Awards granted to non-employees are marked-to-market each quarter. The grant date fair value of stock options is estimated using a Black-Scholes option pricing model. The fair value of stock-based compensation for stock options is recognized on a straight-line basis, net of estimated forfeitures, over the period during which services are provided in exchange for the award. The grant date fair value of RSUs is estimated based on the fair value of our underlying common stock.
Pre-2017 RSUs contained both service-based and performance conditions to vest in the underlying common stock. The service-based condition criteria is generally met 10% after the first year of service, 20% over the second year, 30% over the third year, and 40% over the fourth year. The performance condition related to these awards was satisfied on the effectiveness of the registration statement for our IPO, which occurred in March 2017. Awards which contain both service-based and performance conditions are recognized using the accelerated attribution method once the performance condition is probable of occurring.
73
All RSUs granted after December 31, 2016 vest on the satisfaction of only a service-based condition (“Post-2017 RSUs”). The service condition is generally satisfied over four years, 10% after the first year of service, 20% over the second year, 30% over the third year, and 40% over the fourth year. In limited instances, we have issued Post-2017 RSUs with vesting periods in excess of four years. For these awards, we recognize stock-based compensation expense on a straight-line basis over the vesting period.
Stock option and RSU awards issued to non-employees are accounted for at fair value. The fair value of each non-employee stock-based compensation award is re-measured each period until the earlier of the date at which the non-employee’s performance is complete or a performance commitment date is reached, which is generally the vesting date. Stock-based compensation expense for non-employee stock awards is recognized on a straight-line basis in our consolidated statements of operations.
Stock-based compensation expense recognized in the Consolidated Statements of Operations for all periods presented is based on awards that are expected to vest less estimated forfeitures. We estimate the forfeiture rate of our stock-based awards based on an analysis of actual forfeitures, employee turnover, and other factors. A modification of the terms of a stock-based award is treated as an exchange of the original award for a new award with total compensation cost equal to the grant-date fair value of the original award plus the incremental value of the modification to the award.
Income Taxes
We are subject to income taxes in the United States and numerous foreign jurisdictions. Deferred tax assets and liabilities are determined based on differences between the financial reporting and tax basis of assets and liabilities and are measured using the enacted tax rates and laws that will be in effect when the deferred tax asset or liability is expected to be realized or settled.
In evaluating our ability to recover deferred tax assets, we consider all available positive and negative evidence, including historical operating results, ongoing tax planning, and forecasts of future taxable income on a jurisdiction-by-jurisdiction basis. Based on the level of historical losses, we have established a valuation allowance to reduce our net deferred tax assets to the amount that is more likely than not to be realized.
We recognize a tax benefit from an uncertain tax position only if it is more likely than not that the tax position will be sustained on examination by the taxing authorities, based on the technical merits of the position. The tax benefits recognized in our consolidated financial statements from such positions are measured based on the largest benefit that has a greater than 50% likelihood of being realized. We recognize interest and penalties associated with tax matters as part of the income tax provision and include accrued interest and penalties with the related income tax liability on our consolidated balance sheets.
Currency Translation and Remeasurement
The functional currency of the majority of our foreign subsidiaries is the U.S. dollar. Monetary assets and liabilities denominated in a foreign currency are remeasured into U.S. dollars at the exchange rate on the balance sheet date. Revenue and expenses are remeasured at the average exchange rates during the period. Equity transactions and other non-monetary assets are remeasured using historical exchange rates. Foreign currency transaction gains and losses are recorded in other income (expense), net on our consolidated statement of operations. For those foreign subsidiaries where the local currency is the functional currency, adjustments to translate those statements into U.S. dollars are recorded in accumulated other comprehensive income (loss) in stockholders’ equity.
Cash and Cash Equivalents
Cash and cash equivalents consist of highly liquid investments with original maturities of 90 days or less from the date of purchase.
Restricted Cash
We are required to maintain restricted cash deposits to back letters of credit for certain property leases. These funds are restricted and have been classified in other assets on our consolidated balance sheets due to the nature of restriction. At December 31, 2017 and 2016, we maintained restricted cash totaling $2.9 million and $13.2 million, respectively.
74
We hold investments in marketable securities consisting of U.S. government securities and U.S. government agency securities. We classify our marketable securities as available-for-sale investments in our current assets because they represent investments available for current operations. Our available-for-sale investments are carried at fair value with any unrealized gains and losses, net of taxes, included in accumulated other comprehensive (loss) income in stockholders’ equity. We determine gains or losses on the sale or maturities of marketable securities using the specific identification method and these gains or losses are recorded in other income (expense), net in our consolidated statements of operations. Unrealized losses are recorded in other income (expense), net when a decline in fair value is determined to be other than temporary.
Inventory
Prepaid expenses and other current assets include our Spectacles inventory, which consists of finished goods purchased from contract manufacturers. Inventory is stated at the lower of cost or market on a weighted-average cost basis. Inventories are written down for estimated obsolescence or excess inventory equal to the difference between the cost of inventory and estimated market value. Adjustments to reduce inventory to net realizable value are recognized in cost of revenue.
Excess Inventory and Related Charges
During the third quarter of 2017, based on management’s updated assessment, we recorded $39.9 million of charges related to Spectacles inventory. The charges were composed of $19.5 million of excess inventory reserves, $17.9 million of inventory purchase commitment cancellation charges, and $2.5 million of asset impairments. As of December 31, 2017, Spectacles inventory included in prepaid expenses and other current assets was not material.
Non-Marketable Investments
We account for non-marketable investments under the cost method when we are not able to exercise significant influence over the investee. When we exercise significant influence over, but do not control the investee, such non-marketable investments are accounted for using the equity method. Under the equity method of accounting, we record our share of the results of the investments within other income (expense), net in our consolidated statements of operations.
Fair Value Measurements
Certain financial instruments are required to be recorded at fair value. Other financial instruments, including cash and cash equivalents and restricted cash, are recorded at cost, which approximates fair value. Additionally, accounts receivable, accounts payable and accrued expenses approximate fair value because of the short-term nature of these financial instruments.
Accounts Receivable and Allowance for Doubtful Accounts
Accounts receivable are recorded at the invoiced amount less any allowance for doubtful accounts to reserve for potentially uncollectible receivables. To determine the amount of the allowance, we make judgments about the creditworthiness of customers based on ongoing credit evaluation and historical experience. At December 31, 2017 and 2016, the allowance for doubtful accounts was immaterial.
Property and Equipment
Property and equipment are stated at cost, less accumulated depreciation. We compute depreciation using the straight-line method over the estimated useful lives of the assets, which is generally three years for computer hardware and software, five years for furniture and equipment, and over the shorter of lease term or useful life of the assets for leasehold improvements. Buildings are depreciated over a useful life ranging from 25 to 45 years. Maintenance and repairs are expensed as incurred.
Build-to-Suit Leases
We capitalize construction in progress and record a corresponding long-term liability for build-to-suit lease agreements where we are considered the owner, for accounting purposes, during the construction period. For buildings under build-to-suit lease arrangements where we have taken occupancy, which do not qualify for sales recognition under the sale-leaseback accounting guidance, we determined that we continue to be the deemed owner of these buildings. This is principally due to our significant investment in tenant improvements. As a result, the buildings are being depreciated over the shorter of their
75
useful lives or the related lease term. At occupancy, the long-term construction obligations are considered long-term finance lease obligations and are recorded as other liabilities with amounts payable during the next 12 months recorded as accrued expenses and other current liabilities on the consolidated balance sheets. Assets capitalized under build-to-suit leases were $54.0 million and $47.7 million as of December 31, 2017 and 2016, respectively. A portion of the assets were placed into service during the year ended December 31, 2016, resulting in an immaterial amount of depreciation expense for the year ended December 31, 2016. Depreciation expense for assets capitalized under build-to-suit leases was $2.6 million for the year ended December 31, 2017.
Software Development Costs
Software development costs include costs to develop software to be used to meet internal needs and applications used to deliver our services. We capitalize development costs related to these software applications once the preliminary project stage is complete and it is probable that the project will be completed and the software will be used to perform the function intended. Costs capitalized for developing such software applications were not material for the periods presented.
Segments
Our CEO is our chief operating decision maker. Our CEO reviews financial information presented on a consolidated basis, accompanied by disaggregated information about revenue by geographic region. There are no segment managers who are held accountable by the chief operating decision maker for operations, operating results, and planning for levels or components below the consolidated unit level. We therefore have determined we have a single operating segment.
Business Combinations
We include the results of operations of the businesses that we acquire from the date of acquisition. We determine the fair value of the assets acquired and liabilities assumed based on their estimated fair values as of the respective date of acquisition. The excess purchase price over the fair values of identifiable assets and liabilities is recorded as goodwill. Determining the fair value of assets acquired and liabilities assumed requires management to use significant judgment and estimates including the selection of valuation methodologies, estimates of future revenue and cash flows, discount rates and selection of comparable companies. Our estimates of fair value are based on assumptions believed to be reasonable, but which are inherently uncertain and unpredictable and, as a result, actual results may differ from estimates. During the measurement period, not to exceed one year from the date of acquisition, we may record adjustments to the assets acquired and liabilities assumed, with a corresponding offset to goodwill. At the conclusion of the measurement period, any subsequent adjustments are reflected in the consolidated statements of operations.
When we issue payments or grants of equity to selling shareholders in connection with an acquisition, we evaluate whether the payments or awards are compensatory. This evaluation includes whether cash payments or stock award vesting is contingent on the continued employment of the selling stockholder beyond the acquisition date. If continued employment is required for the cash to be paid or stock awards to vest, the award is treated as compensation for post-acquisition services and is recognized as compensation expense.
Transaction costs associated with business combinations are expensed as incurred, and are included in general and administrative expenses in our consolidated statements of operations.
Goodwill
Goodwill represents the excess of the purchase price over the fair value of net assets acquired in a business combination. We test goodwill for impairment at least annually, in the fourth quarter, or whenever events or changes in circumstances indicate that goodwill might be impaired. For all periods presented, we had a single operating segment and reporting unit structure.
In testing for goodwill impairment, we first assess qualitative factors to determine whether the existence of events or circumstances leads to a determination that it is more likely than not that the fair value of a reporting unit is less than its carrying amount. If, after assessing the totality of events or circumstances, we determine it is not more likely than not that the fair value of a reporting unit is less than its carrying amount, then additional impairment testing is not required. However, if we conclude otherwise, we perform the first of a two-step impairment test.
76
The first step compares the estimated fair value of a reporting unit to its book value, including goodwill. If the estimated fair value exceeds book value, goodwill is considered not to be impaired and no additional steps are necessary. However, if the fair value of the reporting unit is less than book value, then under the second step the carrying amount of the goodwill is compared to its implied fair value. There were no impairment charges in any of the periods presented.
Intangible Assets
Intangible assets are carried at cost and amortized on a straight-line basis over their estimated useful lives. We determine the appropriate useful life of our intangible assets by measuring the expected cash flows of acquired assets. The estimated useful lives of intangible assets are as follows:
|
Intangible Asset |
|
Estimated Useful Life |
|
Domain names |
|
5 Years |
|
Trademarks |
|
1 to 5 Years |
|
Non-compete agreements |
|
1 to 3 Years |
|
Acquired developed technology |
|
5 to 7 Years |
|
Customer relationships |
|
2 to 5 Years |
|
Patents |
|
3 to 11 Years |
Impairment of Long-Lived Assets
We evaluate recoverability of our property and equipment and intangible assets, excluding goodwill, when events or changes indicate the carrying amount of an asset may not be recoverable. Events and changes in circumstances considered in determining whether the carrying value of long-lived assets may not be recoverable include: significant changes in performance relative to expected operating results; significant changes in asset use; and significant negative industry or economic trends and changes in our business strategy. Recoverability of these assets is measured by comparison of their carrying amount to future undiscounted cash flows to be generated. If impairment is indicated based on a comparison of the assets’ carrying values and the undiscounted cash flows, the impairment loss is measured as the amount by which the carrying amount of the assets exceeds the fair value of the assets. We determined that there were no events or changes in circumstances that indicated our long-lived assets were impaired during any of the periods presented.
Legal Contingencies
For legal contingencies, we accrue a liability for an estimated loss if the potential loss from any claim or legal proceeding is considered probable, and the amount can be reasonably estimated. Note 6 provides additional information regarding our legal contingencies.
Recent Accounting Pronouncements
In January 2017, the Financial Accounting Standards Board (“FASB”) issued an Accounting Standards Update (“ASU”) 2017-01, Business Combinations (Topic 805) Clarifying the Definition of a Business. The amendments in this update clarify the definition of a business with the objective of adding guidance to assist entities with evaluating whether transactions should be accounted for as acquisitions or disposals of assets or businesses. The definition of a business affects many areas of accounting including acquisitions, disposals, goodwill, and consolidation. The guidance is effective for interim and annual periods beginning after December 15, 2017 and should be applied prospectively on or after the effective date, with early adoption permitted. We adopted ASU 2017-01 effective January 1, 2018.
In November 2016, the FASB issued ASU 2016-18, Statement of Cash Flows (Topic 230): Restricted Cash, which requires restricted cash to be presented with cash and cash equivalents on the statement of cash flows and disclosure of how the statement of cash flows reconciles to the balance sheet if restricted cash is shown separately from cash and cash equivalents on the balance sheet. ASU 2016-18 is effective for interim and annual periods beginning after December 15, 2017, with early adoption permitted. We adopted ASU 2016-18 effective January 1, 2018 and we do not expect a significant impact on our consolidated financial statements.
In October 2016, the FASB issued ASU 2016-16, Income Taxes (Topic 740): Intra-Entity Transfer of Assets Other than Inventory, which requires the recognition of the income tax consequences of an intra-entity transfer of an asset, other than inventory, when the transfer occurs. ASU 2016-16 is effective for interim and annual periods beginning after December 15, 2018, with early adoption permitted. We adopted ASU 2016-16 on January 1, 2017 and the adoption did not have a material impact on our consolidated financial statements due to a valuation allowance on our net deferred tax assets.
77
In August 2016, the FASB issued ASU 2016-15, Statement of Cash Flows (Topic 230), Classification of Certain Cash Receipts and Cash Payments. ASU 2016-15 provides guidance for targeted changes with respect to how cash receipts and cash payments are classified in the statements of cash flows, with the objective of reducing diversity in practice. ASU 2016-15 is effective for interim and annual periods beginning after December 15, 2017, with early adoption permitted. We adopted ASU 2016-15 effective January 1, 2018 and do not expect a significant impact on our consolidated financial statements.
In February 2016, the FASB issued ASU 2016-02, Leases (Topic 842). ASU 2016-02 requires lessees to recognize lease assets and lease liabilities on the balance sheet and requires expanded disclosures about leasing arrangements. ASU 2016-02 is effective for fiscal years beginning after December 15, 2018 and interim periods in fiscal years beginning after December 15, 2018, with early adoption permitted. We are in the process of evaluating the impact of this accounting standards update on our consolidated financial statements, which will consist primarily of including lease assets and lease liabilities on our consolidated balance sheet.
In May 2014, the FASB issued ASU 2014-09, Revenue from Contracts with Customers (Topic 606). Topic 606 supersedes the revenue recognition requirements in ASU Topic 605, Revenue Recognition, and requires the recognition of revenue when promised goods or services are transferred to customers in an amount that reflects the consideration to which the entity expects to be entitled to in exchange for those goods or services. Topic 606 is effective for fiscal years beginning after December 15, 2017, including interim periods within that reporting period, with early adoption permitted for annual reporting periods beginning after December 15, 2016. The standard permits the use of either the retrospective or modified retrospective (cumulative effect) transition method.
The most significant aspect of our evaluation of Topic 606 related to ASU No. 2016-08, Revenue from Contracts with Customers (Topic 606): Principal versus Agent Considerations (Reporting Revenue Gross versus Net). This implementation guidance discusses principal versus agent considerations and gross versus net revenue reporting, including specific indicators to assist in the determination of whether we control a specified good or service before it is transferred to the customer. Through our evaluation, we have concluded Snap-sold revenue will be reported on a gross basis and partner-sold revenue will be reported on a net basis, which is consistent with our current revenue recognition policies. We concluded that we control the Snap-sold advertising campaign before it is transferred to the customer because we provide the advertising campaign on Snapchat and have discretion in establishing the price of the advertisements. We concluded that the partner controls significant aspects of the partner-sold advertising campaign before it is transferred to the customer and the partner has discretion in establishing price with the advertiser.
We adopted Topic 606 effective January 1, 2018 using the modified retrospective transition method. The adoption did not have a material impact on our consolidated financial statements.
2. Net Loss per Share
We compute net loss per share using the two-class method required for multiple classes of common stock and participating securities. Our participating securities include any shares issued on the early exercise of stock options subject to repurchase because holders of such shares have non-forfeitable dividend rights in the event a dividend is paid on common stock. Before the IPO, our participating securities also included Series D, E, F, and FP preferred stock and Series A, A-1, B, and C convertible preferred stock. The rights, including the liquidation and dividend rights, of the Class A common stock and Class B common stock, and the Series D, E, F, and FP preferred stock were substantially identical, other than voting rights. Accordingly, the Class A common stock, Class B common stock, and the Series D, E, F, and FP preferred stock shared equally in our net losses. The holders of early exercised shares subject to repurchase and the holders of Series A, A-1, B, and C convertible preferred stock did not have a contractual obligation to share in our losses, and as a result our net losses were not allocated to these participating securities.
In connection with our IPO, our Series D, E, and F preferred stock converted on a one-to-one basis into Class B common stock, and our Series FP preferred stock converted on a one-to-one basis into Class C common stock. The liquidation and dividend rights of the aforementioned preferred series are substantially identical to the rights of the common classes into which they converted. Accordingly, we have presented the Series D, E, and F preferred stock outstanding before the IPO together with the Class B common stock, and the Series FP preferred stock outstanding before the IPO together with the Class C common stock for purposes of calculating net loss per share. The prior period presentation has been adjusted to conform to our current period presentation.
78
Also in connection with our IPO, our Series A, A-1, B, and C preferred stock converted on a one-to-one basis into Class B common stock. The shares of Class B common stock that resulted from the conversion of the Series A, A-1, B, and C preferred stock are weighted in the denominator of net loss per share for Class B common stock for the portion of the time outstanding subsequent to our IPO.
Basic net loss per share is computed by dividing net loss attributable to each class of stockholders by the weighted-average number of shares of stock outstanding during the period. Vested RSUs that have not been settled, including the vested CEO award, have been included in the appropriate common share class used to calculate basic net loss per share.
For the calculation of diluted net loss per share, net loss per share attributable to common stockholders for basic net loss per share is adjusted by the effect of dilutive securities, including awards under our equity compensation plans. Diluted net loss per share attributable to common stockholders is computed by dividing the resulting net loss attributable to common stockholders by the weighted-average number of fully diluted common shares outstanding. In the years ended December 31, 2017 and 2016 our potential dilutive shares relating to stock options, RSUs, and common stock subject to repurchase, and, for the 2016 periods, shares of Series A, A-1, B, and C convertible preferred stock were not included in the computation of diluted net loss per share as the effect of including these shares in the calculation would have been anti-dilutive.
The numerators and denominators of the basic and diluted net loss per share computations for our common stock are calculated as follows for the years ended December 31, 2017, 2016, and 2015:
|
|
Year Ended December 31, |
|
|||||||||||||||||||||||||||||||||
|
|
2017 |
|
|
2016 |
|
|
2015 |
|
|||||||||||||||||||||||||||
|
|
Class A Common(1) |
|
|
Class B Common(2) |
|
|
Class C Common(3) |
|
|
Class A Common |
|
|
Class B Common(2) |
|
|
Class C Common(3) |
|
|
Class A Common |
|
|
Class B Common(2) |
|
|
Class C Common(3) |
|
|||||||||
|
Numerator: |
|
|
|
|
|
|
|
|
|
|
|
|
|
|
|
|
|
|
|
|
|
|
|
|
|
|
|
|
|
|
|
|
|
|
|
|
Net loss |
$ |
(2,169,120 |
) |
|
$ |
(548,098 |
) |
|
$ |
(727,848 |
) |
|
$ |
(311,523 |
) |
|
$ |
(65,174 |
) |
|
$ |
(137,946 |
) |
|
$ |
(228,933 |
) |
|
$ |
(33,054 |
) |
|
$ |
(110,906 |
) |
|
Net loss attributable to common stockholders |
$ |
(2,169,120 |
) |
|
$ |
(548,098 |
) |
|
$ |
(727,848 |
) |
|
$ |
(311,523 |
) |
|
$ |
(65,174 |
) |
|
$ |
(137,946 |
) |
|
$ |
(228,933 |
) |
|
$ |
(33,054 |
) |
|
$ |
(110,906 |
) |
|
Denominator: |
|
|
|
|
|
|
|
|
|
|
|
|
|
|
|
|
|
|
|
|
|
|
|
|
|
|
|
|
|
|
|
|
|
|
|
|
Basic shares: |
|
|
|
|
|
|
|
|
|
|
|
|
|
|
|
|
|
|
|
|
|
|
|
|
|
|
|
|
|
|
|
|
|
|
|
|
Weighted-average common shares - Basic |
|
734,203 |
|
|
|
185,520 |
|
|
|
246,362 |
|
|
|
489,019 |
|
|
|
102,309 |
|
|
|
216,543 |
|
|
|
449,516 |
|
|
|
64,901 |
|
|
|
217,767 |
|
|
Diluted shares: |
|
|
|
|
|
|
|
|
|
|
|
|
|
|
|
|
|
|
|
|
|
|
|
|
|
|
|
|
|
|
|
|
|
|
|
|
Weighted-average common shares - Diluted |
|
734,203 |
|
|
|
185,520 |
|
|
|
246,362 |
|
|
|
489,019 |
|
|
|
102,309 |
|
|
|
216,543 |
|
|
|
449,516 |
|
|
|
64,901 |
|
|
|
217,767 |
|
|
Net loss per share attributable to common stockholders: |
|
|
|
|
|
|
|
|
|
|
|
|
|
|
|
|
|
|
|
|
|
|
|
|
|
|
|
|
|
|
|
|
|
|
|
|
Basic |
$ |
(2.95 |
) |
|
$ |
(2.95 |
) |
|
$ |
(2.95 |
) |
|
$ |
(0.64 |
) |
|
$ |
(0.64 |
) |
|
$ |
(0.64 |
) |
|
$ |
(0.51 |
) |
|
$ |
(0.51 |
) |
|
$ |
(0.51 |
) |
|
Diluted |
$ |
(2.95 |
) |
|
$ |
(2.95 |
) |
|
$ |
(2.95 |
) |
|
$ |
(0.64 |
) |
|
$ |
(0.64 |
) |
|
$ |
(0.64 |
) |
|
$ |
(0.51 |
) |
|
$ |
(0.51 |
) |
|
$ |
(0.51 |
) |
|
(1) |
Class A common stock includes the issuance of 160.3 million shares of Class A common stock issued by us in connection with our IPO. |
|
(2) |
Included in the Class B common stock, for all periods presented, is Series D, E, and F preferred stock, which automatically converted to Class B common stock on the closing of the IPO. Series A, A-1, B, and C preferred stock are included in Class B common stock on the automatic conversion of such shares to 163.0 million shares of Class B common stock on the closing of the IPO. |
|
(3) |
Included in the Class C common stock, for all periods presented, is Series FP preferred stock which automatically converted to Class C common stock on the closing of the IPO. Additionally, 37.4 million shares of Class C common stock related to the CEO award are included in Class C common stock on the closing of the IPO. |
79
The following potentially dilutive shares were excluded from the calculation of diluted net loss per share because their effect would have been anti-dilutive for the periods presented:
|
|
Year Ended December 31, |
|
|||||||||
|
|
2017 |
|
|
2016 |
|
|
2015 |
|
|||
|
|
(in thousands) |
|
|||||||||
|
Convertible voting preferred stock, Series A, A-1 and B |
|
— |
|
|
|
146,962 |
|
|
|
146,962 |
|
|
Convertible non-voting preferred stock, Series C |
|
— |
|
|
|
16,000 |
|
|
|
16,000 |
|
|
Stock options |
|
32,596 |
|
|
|
44,904 |
|
|
|
43,896 |
|
|
Unvested RSUs not subject to a performance condition |
|
163,796 |
|
|
|
150 |
|
|
|
404 |
|
|
Shares subject to repurchase |
|
— |
|
|
|
185 |
|
|
|
4,984 |
|
3. Stockholders’ Equity
Common Stock
As of December 31, 2017, we are authorized to issue 3,000,000,000 shares of Class A nonvoting common stock, 700,000,000 shares of Class B voting common stock, and 260,887,848 shares of Class C voting common stock, each with a par value of $0.00001 per share. Class A common stock has no voting rights, Class B common stock is entitled to one vote per share, and Class C common stock is entitled to ten votes per share. Shares of our Class B common stock are convertible into an equivalent number of shares of our Class A common stock and generally convert into shares of our Class A common stock upon transfer. Shares of our Class C common stock are convertible into an equivalent number of shares of our Class B common stock and generally convert into shares of our Class B common stock upon transfer. Any dividends paid to the holders of the Class A common stock, Class B common stock, and Class C common stock will be paid on a pro rata basis. For the year ended December 31, 2017, we did not declare any dividends. On a liquidation event, as defined in our amended and restated certificate of incorporation, any distribution to common stockholders is made on a pro rata basis to the holders of the Class A common stock, Class B common stock, and Class C common stock.
As of December 31, 2017, there were 883,021,991 shares, 122,563,920 shares, and 216,615,870 shares of Class A common stock, Class B common stock, and Class C common stock, respectively, issued and outstanding.
Stock-based Compensation Plans
We maintain three share-based employee compensation plans: the 2017 Equity Incentive Plan (“2017 Plan”), the 2014 Equity Incentive Plan (“2014 Plan”), and the 2012 Equity Incentive Plan (“2012 Plan”, and collectively with the 2017 Plan and the 2014 Plan, the “Stock Plans”). In January 2017, our board of directors adopted the 2017 Plan, and in February 2017 our stockholders approved the 2017 Plan, effective on March 1, 2017, which serves as the successor to the 2014 Plan and 2012 Plan and provides for the grant of incentive stock options to employees, including employees of any parent or subsidiary, and for the grant of nonstatutory stock options, stock appreciation rights, restricted stock awards, restricted stock unit awards, performance stock awards, performance cash awards, and other forms of stock awards to employees, directors, and consultants, including employees and consultants of our affiliates. We do not expect to grant any additional awards under the 2014 Plan or 2012 Plan as of the effective date of the 2017 Plan, other than awards for up to 2,500,000 shares of Class A common stock to our employees and consultants in France under the 2014 Plan. Outstanding awards under the 2014 Plan and 2012 Plan continue to be subject to the terms and conditions of the 2014 Plan and 2012 Plan, respectively. Shares available for grant under the 2014 Plan and 2012 Plan, which were reserved but not issued or subject to outstanding awards under the 2014 Plan or 2012 Plan, respectively, as of the effective date of the 2017 Plan, were added to the reserves of the 2017 Plan.
We initially reserved 87,270,108 shares of our Class A common stock for future issuance under the 2017 Plan. An additional number of shares of Class A common stock will be added to the 2017 Plan equal to (i) 96,993,064 shares of Class A common stock reserved for future issuance pursuant to outstanding stock options and unvested RSUs under the 2014 Plan, (ii) 37,228,865 shares of Class A common stock issuable on conversion of Class B common stock underlying stock options and unvested RSUs outstanding the 2012 Plan, (iii) 17,858,235 shares of Class A common stock that were reserved for issuance under the 2014 Plan as of the date the 2017 Plan became effective, (iv) 11,004,580 shares of Class A common stock issuable on conversion Class B common stock that were reserved for issuance under the 2012 Plan as of the date the 2017 Plan became effective, and (v) a maximum of 86,737,997 shares of Class A common stock that will be added pursuant to the following sentence. With respect to each share that returns to the 2017 Plan pursuant to (i) and (ii) of the prior sentence that was associated with an award that was outstanding under the 2014 Plan and 2012 Plan as of October 31, 2016, an additional share of Class A common stock will be added to the share reserve of the 2017 Plan, up to a maximum of 86,737,997 shares. The number of shares reserved for issuance under the 2017 Plan will increase automatically on the first
80
day of January of each of 2018 through 2027 by the lesser of (i) 5% of the total number of shares of our capital stock outstanding on December 31st of the immediately preceding calendar year and (ii) a number determined by our board of directors. The maximum term for stock options granted under the 2017 Plan may not exceed ten years from the date of grant. The 2017 Plan will terminate ten years from the date our board of directors approved the plan, unless it is terminated earlier by our board of directors.
In July 2017, we acquired Placed, Inc. (“Placed”), a location-based measurement services company. See Note 4 for additional information. In connection with the Placed acquisition, we assumed certain outstanding stock options under Placed, Inc.’s 2011 Equity Incentive Plan, as amended. Additionally, we granted shares of restricted stock, which were not issued under any existing Placed equity incentive plans or the Stock Plans, and that will settle in shares of Class A common stock.
2017 Employee Stock Purchase Plan
In January 2017, our board of directors adopted the 2017 Employee Stock Purchase Plan (“2017 ESPP”). Our stockholders approved the 2017 ESPP in February 2017. The 2017 ESPP became effective in connection with the IPO. A total of 16,484,690 shares of Class A common stock were initially reserved for issuance under the 2017 ESPP. No shares of our Class A common stock have been purchased under the 2017 ESPP. The number of shares of our Class A common stock reserved for issuance will automatically increase on January 1st of each calendar year, beginning on January 1, 2018 through January 1, 2027, by the lesser of (1) 1.0% of the total number of shares of our common stock outstanding on the last day of the calendar month before the date of the automatic increase, and (2) 15,000,000 shares; provided that before the date of any such increase, our board of directors may determine that such increase will be less than the amount set forth in clauses (1) and (2).
Restricted Stock
The following table summarizes the restricted stock activity during the year ended December 31, 2017:
|
|
|
Class A Outstanding Restricted Stock |
|
|
Class B Outstanding Restricted Stock |
|
|
Weighted- Average Grant Date Fair Value per Restricted Stock |
|
|||
|
|
|
(in thousands, except per share data) |
|
|||||||||
|
Unvested at December 31, 2016 |
|
|
152,114 |
|
|
|
28,581 |
|
|
$ |
15.50 |
|
|
Granted(1) |
|
|
66,762 |
|
|
|
— |
|
|
$ |
16.37 |
|
|
Vested |
|
|
(45,026 |
) |
|
|
(18,912 |
) |
|
$ |
15.08 |
|
|
Forfeited |
|
|
(17,845 |
) |
|
|
(1,878 |
) |
|
$ |
16.59 |
|
|
Unvested at December 31, 2017 |
|
|
156,005 |
|
|
|
7,791 |
|
|
$ |
15.89 |
|
|
(1) |
Includes 1.5 million restricted stock granted in connection with acquisitions. |
The total fair value of RSUs vested during the years ended December 31, 2017, 2016, and 2015 was $967.6 million, $11.8 million, and $4.4 million, respectively.
Total unrecognized compensation cost related to Pre-2017 RSUs was $620.0 million as of December 31, 2017 and is expected to be recognized over a weighted-average period of 2.5 years. Total unrecognized compensation cost related to Post-2017 RSUs, including awards granted in connection with the Placed acquisition, was $809.5 million as of December 31, 2017 and is expected to be recognized over a weighted-average period of 4.2 years.
For the year ended December 31, 2017, for RSUs issued to employees, we withheld 25.3 million shares of common stock by net settlement and remitted $394.2 million in cash to meet the related tax withholding requirements on behalf of our employees. Beginning in November 2017, in connection with the vesting of a majority of employee RSUs, we sold a portion of the shares that vested on behalf of employees to satisfy tax withholding and remittance obligations. We will continue to evaluate the method of settlement of RSUs that vest in the future.
81
The following table summarizes the stock option award activity under the Stock Plans during the year ended December 31, 2017:
|
|
|
Class A Number of Shares |
|
|
Class B Number of Shares |
|
|
Weighted- Average Exercise Price |
|
|
Weighted- Average Remaining Contractual Term (in years) |
|
|
Aggregate Intrinsic Value(1) |
|
|||||
|
|
|
(in thousands, except per share data) |
|
|||||||||||||||||
|
Outstanding at December 31, 2016 |
|
|
23,718 |
|
|
|
21,186 |
|
|
$ |
1.13 |
|
|
|
6.97 |
|
|
$ |
682,565 |
|
|
Granted and assumed(2) |
|
|
7,027 |
|
|
|
— |
|
|
$ |
13.62 |
|
|
|
— |
|
|
$ |
— |
|
|
Exercised |
|
|
(9,928 |
) |
|
|
(9,396 |
) |
|
$ |
0.59 |
|
|
|
— |
|
|
$ |
— |
|
|
Forfeited |
|
|
(10 |
) |
|
|
— |
|
|
$ |
0.77 |
|
|
|
— |
|
|
$ |
— |
|
|
Outstanding at December 31, 2017 |
|
|
20,807 |
|
|
|
11,790 |
|
|
$ |
4.10 |
|
|
|
4.99 |
|
|
$ |
343,110 |
|
|
Exercisable at December 31, 2017 |
|
|
17,326 |
|
|
|
11,302 |
|
|
$ |
4.10 |
|
|
|
4.54 |
|
|
$ |
301,587 |
|
|
Vested and expected to vest at December 31, 2017 |
|
|
20,798 |
|
|
|
11,787 |
|
|
$ |
4.10 |
|
|
|
4.98 |
|
|
$ |
343,077 |
|
|
(1) |
The aggregate intrinsic value is calculated as the difference between the exercise price of the underlying stock option awards and the assessed fair value of our common stock as of December 31, 2016 or the closing market price of our Class A common stock as of December 31, 2017. |
|
(2) |
Amount includes assumed options from Placed, Inc.’s 2011 Equity Incentive Plan, as amended. |
The weighted-average fair value of employee stock options granted and assumed during the years ended December 31, 2017 and 2016 was $5.84 and $15.10 per share, respectively which reflects the post-Stock Split per share value.
Total unrecognized compensation cost related to unvested stock options was $35.7 million as of December 31, 2017 and is expected to be recognized over a weighted-average period of 2.3 years.
We did not grant any stock options in 2015. The total grant date fair value of stock options that vested in the years ended December 31, 2017, 2016, and 2015 was $58.6 million, $15.5 million, and $24.6 million respectively. The intrinsic value of stock options exercised in the years ended December 31, 2017, 2016, and 2015 was $276.5 million, $21.6 million, and $1.8 million, respectively.
Stock-based compensation expense for stock options granted to employees and non-employees is estimated based on the option’s fair value as calculated by the Black-Scholes option pricing model. The Black-Scholes model requires various assumptions, including the fair value of our common stock, expected life, expected dividend yield and expected volatility. If any of the assumptions used in the Black-Scholes model change significantly, stock-based compensation expense may differ materially in the future from that recorded in the current period. The expected term of options represents the period that our stock-based awards are expected to be outstanding. The risk-free interest rate is based on the implied yield currently available on U.S. treasury notes with terms approximately equal to the expected life of the option. The expected dividend rate is zero as we currently have no history or expectation of declaring cash dividends on our common stock.
The weighted-average assumptions used to determine the fair value of employee stock options granted and assumed during the year ended December 31, 2017 were as follows:
|
Expected term from grant date (in years) |
|
|
3.0 |
|
|
Risk-free interest rate |
|
|
1.9 |
% |
|
Expected volatility |
|
|
51 |
% |
|
Dividend yield |
|
|
0 |
% |
|
Strike price |
|
$ |
13.62 |
|
82
Stock-Based Compensation Expense
Total stock-based compensation expense by function is as follows:
|
|
|
Year Ended December 31, |
|
|||||||||
|
|
|
2017 |
|
|
2016 |
|
|
2015 |
|
|||
|
|
|
(in thousands) |
|
|||||||||
|
Cost of revenue |
|
$ |
26,071 |
|
|
$ |
532 |
|
|
$ |
488 |
|
|
Research and development |
|
|
1,154,430 |
|
|
|
21,935 |
|
|
|
10,309 |
|
|
Sales and marketing |
|
|
236,474 |
|
|
|
3,956 |
|
|
|
3,534 |
|
|
General and administrative |
|
|
1,222,920 |
|
|
|
5,419 |
|
|
|
59,193 |
|
|
Total |
|
$ |
2,639,895 |
|
|
$ |
31,842 |
|
|
$ |
73,524 |
|
4. Business Acquisitions
2017 Acquisitions
Placed, Inc.
In July 2017, we acquired Placed, Inc. (“Placed”), a location-based measurement services company. The purpose of the acquisition was to enhance our measurement capabilities. The total consideration was $185.9 million, of which $139.6 million represents purchase consideration and includes $135.2 million in cash paid to sellers, $3.9 million for the fair value of assumed options, and $0.5 million of liabilities due to the sellers. The remaining $46.3 million of total consideration transferred represents compensation for future employment services. The allocation of purchase price is preliminary and is subject to additional information related to the liabilities that existed as of the acquisition date.
The preliminary allocation of the total purchase consideration for this acquisition is estimated as follows:
|
|
|
Total |
|
|
|
|
|
(in thousands) |
|
|
|
Cash |
|
$ |
6,919 |
|
|
Trademarks |
|
|
2,700 |
|
|
Technology |
|
|
22,400 |
|
|
Customer relationships |
|
|
11,800 |
|
|
Goodwill |
|
|
103,995 |
|
|
Net deferred tax liability |
|
|
(13,520 |
) |
|
Other assets acquired and liabilities assumed, net |
|
|
5,296 |
|
|
Total |
|
$ |
139,590 |
|
The goodwill amount represents synergies related to our existing platform expected to be realized from this business combination and assembled workforce. The associated goodwill and intangible assets are not deductible for tax purposes.
Zenly SAS
In May 2017, we acquired Zenly SAS, a company that develops a location-based application that allows users to see where their friends are on a map. The purpose of the acquisition was to enhance the functionality of our platform. The total consideration paid was $213.3 million in cash, of which $196.1 million represents purchase consideration and includes $186.8 million in cash paid to the sellers and $9.3 million of liabilities due to the sellers. The remaining $17.2 million of total consideration transferred represents compensation for future employment services.
83
The allocation of the total purchase consideration for this acquisition is estimated as follows:
|
|
|
Total |
|
|
|
|
|
(in thousands) |
|
|
|
Cash |
|
$ |
22,610 |
|
|
Technology |
|
|
23,000 |
|
|
Goodwill |
|
|
154,353 |
|
|
Net deferred tax liability |
|
|
(2,418 |
) |
|
Other assets acquired and liabilities assumed, net |
|
|
(1,428 |
) |
|
Total |
|
$ |
196,117 |
|
The goodwill amount represents synergies related to our existing platform expected to be realized from this business combination and assembled workforce. The associated goodwill and intangible assets are not deductible for tax purposes.
Other Acquisitions
In March 2017, we acquired all outstanding shares of a company that operates a cloud hosted platform for building content online. The company was acquired to enhance the functionality of our platform. In June 2017, we acquired a component of a business from a social advertising software company that was integrated with our existing advertising platform and adds advertising tools to our advertising customers. In the fourth quarter 2017, we acquired several companies to enhance our existing platform, technology, and workforce. The total purchase consideration for these other acquisitions was $101.9 million, which included $95.3 million in cash and $6.6 million recorded in other liabilities on the consolidated balance sheets.
The preliminary allocation of the total purchase consideration for the above other acquisitions is as follows:
|
|
|
Total |
|
|
|
|
|
(in thousands) |
|
|
|
Cash |
|
$ |
1,701 |
|
|
Technology |
|
|
49,325 |
|
|
Customer relationships |
|
|
2,100 |
|
|
Goodwill |
|
|
48,408 |
|
|
Net deferred tax liability |
|
|
(1,976 |
) |
|
Other assets acquired and liabilities assumed, net |
|
|
2,382 |
|
|
Total |
|
$ |
101,940 |
|
The goodwill amount represents synergies related to our existing platform expected to be realized from these business combinations and assembled workforce. Of the technology intangible assets, customer relationships, and goodwill in the above table, $40.1 million, $1.6 million, and $30.3 million, is deductible for tax purposes, respectively.
Additional Information on 2017 Acquisitions
For all acquisitions in 2017, we provided for a combined $171.1 million in the form of RSUs to certain continuing employees of the companies in exchange for future service.
In addition, unaudited pro forma results of operations assuming the above acquisitions had taken place at the beginning of each period are not provided because the historical operating results of the acquired entities were not material and pro forma results would not be materially different from reported results for the periods presented.
2016 Acquisitions
Bitstrips
In March 2016, we acquired all outstanding shares of Bitstrips Inc. (“Bitstrips”), a web and mobile application that allows users to create a personal avatar. The total purchase consideration was $64.2 million, which includes $46.6 million in cash and $11.6 million in shares of our non-voting Class A common stock. Of the total purchase consideration, $6.0 million was recorded in accrued expenses and other current liabilities on the consolidated balance sheet.
84
The allocation of the total purchase consideration for the acquisition of Bitstrips is as follows:
|
|
|
Total |
|
|
|
|
|
(in thousands) |
|
|
|
Technology |
|
$ |
15,700 |
|
|
Customer relationships |
|
|
1,600 |
|
|
Goodwill |
|
|
52,671 |
|
|
Net deferred tax liability |
|
|
(4,585 |
) |
|
Other assets acquired and liabilities assumed, net |
|
|
(1,162 |
) |
|
Total |
|
$ |
64,224 |
|
The goodwill amount represents synergies related to our existing platform expected to be realized from this business combination and assembled workforce. The associated goodwill and intangible assets are not deductible for tax purposes.
Other Acquisitions
In August 2016, we acquired all outstanding shares of a mobile search company. The total purchase consideration was $114.5 million, which includes $21.0 million in cash and $83.0 million in shares of our non-voting Class A common stock. Of the total purchase consideration, $10.5 million was recorded in other liabilities on the consolidated balance sheet.
The allocation of the total purchase consideration for the acquisition is as follows:
|
|
|
Total |
|
|
|
|
|
(in thousands) |
|
|
|
Technology |
|
$ |
19,400 |
|
|
Goodwill |
|
|
98,826 |
|
|
Net deferred tax liability |
|
|
(7,112 |
) |
|
Other assets acquired and liabilities assumed, net |
|
|
3,421 |
|
|
Total |
|
$ |
114,535 |
|
The goodwill amount represents synergies related to our existing platform expected to be realized from this business combination and assembled workforce. The associated goodwill and intangible assets are not deductible for tax purposes.
In addition, in 2016, we acquired all outstanding shares of a research and development-driven computer vision software company and substantially all of the assets of various companies that specialize in the areas of software and advertising technologies. Each of the acquisitions constituted a business. The total consideration transferred for these acquisitions was $47.0 million. Of the total purchase consideration, $4.6 million was recorded in other liabilities on the consolidated balance sheet. The allocation of the total purchase consideration for the above mentioned acquisitions is as follows:
|
|
|
Total |
|
|
|
|
|
(in thousands) |
|
|
|
Technology |
|
$ |
12,300 |
|
|
Goodwill |
|
|
35,266 |
|
|
Net deferred tax liability |
|
|
(500 |
) |
|
Other assets acquired and liabilities assumed, net |
|
|
(97 |
) |
|
Total |
|
$ |
46,969 |
|
The goodwill amount represents synergies related to our existing platform expected to be realized from these business combinations and assembled workforce. Of the technology intangible assets and goodwill in the above table, $9.8 million and $30.7 million is deductible for tax purposes, respectively.
Additional Information on 2016 Acquisitions
In connection with the acquisitions completed during the year ended December 31, 2016, we also agreed to provide additional consideration of $255.2 million, in both stock and cash, to certain employees of the acquired entities contingent on their continued employment with us.
85
Looksery
In April 2015, we acquired Looksery, Inc. (“Looksery”). Looksery is a mobile video communication company that specializes in creating lenses for use within applications and was acquired to enhance the functionality of our platform. The total purchase consideration was $79.4 million. In addition to the purchase consideration, we provided for an additional $71.2 million, of which $43.6 million is in the form of restricted stock units to employees for future services. The remaining $27.6 million relates to cash payments, a portion of which was paid at the acquisition close and the remainder will be paid to employees for future services over the four years after the transaction. We also incurred $16.4 million in transaction-related costs, which are included in general and administrative expense in the consolidated statement of operations for the year ended December 31, 2015.
The allocation of the total purchase consideration for the acquisition of Looksery is as follows:
|
|
|
Total |
|
|
|
|
|
(in thousands) |
|
|
|
Technology |
|
$ |
18,800 |
|
|
Customer relationships |
|
|
2,200 |
|
|
Goodwill |
|
|
64,433 |
|
|
Net deferred tax liability |
|
|
(7,700 |
) |
|
Other assets acquired and liabilities assumed, net |
|
|
1,692 |
|
|
Total |
|
$ |
79,425 |
|
The goodwill amount represents synergies related to our existing platform expected to be realized from this business combination and assembled workforce. The associated goodwill and intangible assets are not deductible for tax purposes.
5. Goodwill and Intangible Assets
The changes in the carrying amount of goodwill for the years ended December 31, 2017 and 2016 were as follows:
|
|
|
Goodwill |
|
|
|
|
|
(in thousands) |
|
|
|
Balance as of December 31, 2015 |
|
$ |
133,944 |
|
|
Goodwill acquired |
|
|
186,763 |
|
|
Foreign currency translation |
|
|
(1,570 |
) |
|
Balance as of December 31, 2016 |
|
$ |
319,137 |
|
|
Goodwill acquired |
|
|
306,756 |
|
|
Foreign currency translation |
|
|
13,989 |
|
|
Balance as of December 31, 2017 |
|
$ |
639,882 |
|
Intangible assets consisted of the following:
|
|
|
December 31, 2017 |
|
|||||||||||||
|
|
|
Weighted- Average Remaining Useful Life - Years |
|
|
Gross Carrying Amount |
|
|
Accumulated Amortization |
|
|
Net |
|
||||
|
|
|
(in thousands except years) |
|
|||||||||||||
|
Domain names |
|
|
2.1 |
|
|
$ |
5,418 |
|
|
$ |
3,210 |
|
|
$ |
2,208 |
|
|
Trademarks |
|
|
2.3 |
|
|
|
5,772 |
|
|
|
2,701 |
|
|
|
3,071 |
|
|
Acquired developed technology |
|
|
4.7 |
|
|
|
180,396 |
|
|
|
45,435 |
|
|
|
134,961 |
|
|
Customer relationships |
|
|
2.6 |
|
|
|
15,558 |
|
|
|
3,506 |
|
|
|
12,052 |
|
|
Patents |
|
|
7.8 |
|
|
|
17,150 |
|
|
|
2,969 |
|
|
|
14,181 |
|
|
|
|
|
|
|
|
$ |
224,294 |
|
|
$ |
57,821 |
|
|
$ |
166,473 |
|
86
|
|
|
December 31, 2016 |
|
|||||||||||||
|
|
|
Weighted- Average Remaining Useful Life - Years |
|
|
Gross Carrying Amount |
|
|
Accumulated Amortization |
|
|
Net |
|
||||
|
|
|
(in thousands except years) |
|
|||||||||||||
|
Domain names |
|
|
3.0 |
|
|
$ |
5,000 |
|
|
$ |
2,157 |
|
|
$ |
2,843 |
|
|
Trademarks |
|
|
2.6 |
|
|
|
3,072 |
|
|
|
1,829 |
|
|
|
1,243 |
|
|
Non-compete agreements |
|
|
0.3 |
|
|
|
243 |
|
|
|
226 |
|
|
|
17 |
|
|
Acquired developed technology |
|
|
4.1 |
|
|
|
83,137 |
|
|
|
20,569 |
|
|
|
62,568 |
|
|
Customer relationships |
|
|
1.0 |
|
|
|
3,752 |
|
|
|
2,569 |
|
|
|
1,183 |
|
|
Patents |
|
|
9.2 |
|
|
|
9,450 |
|
|
|
1,322 |
|
|
|
8,128 |
|
|
|
|
|
|
|
|
$ |
104,654 |
|
|
$ |
28,672 |
|
|
$ |
75,982 |
|
Amortization of intangible assets for the years ended December 31, 2017, 2016, and 2015 was $31.5 million, $16.2 million, and $9.5 million, respectively.
As of December 31, 2017, the estimated intangible asset amortization expense for the next five years and thereafter is as follows:
|
|
|
Estimated Amortization |
|
|
|
|
|
(in thousands) |
|
|
|
Year ending December 31, |
|
|
|
|
|
2018 |
|
$ |
42,420 |
|
|
2019 |
|
|
38,488 |
|
|
2020 |
|
|
31,999 |
|
|
2021 |
|
|
24,967 |
|
|
2022 |
|
|
15,134 |
|
|
Thereafter |
|
|
13,465 |
|
|
Total |
|
$ |
166,473 |
|
6. Commitments and Contingencies
Commitments
Leases
We entered into various non-cancelable lease agreements for certain of our offices with original lease periods expiring between 2017 and 2027. Certain of the arrangements have free rent periods or escalating rent payment provisions. We recognize rent expense under such arrangements on a straight-line basis.
Our future minimum lease payments required under these non-cancelable operating lease obligations as of December 31, 2017, are as follows:
|
|
|
Operating Leases |
|
|
|
|
|
(in thousands) |
|
|
|
Year ending December 31, |
|
|
|
|
|
2018 |
|
$ |
49,649 |
|
|
2019 |
|
|
59,860 |
|
|
2020 |
|
|
60,129 |
|
|
2021 |
|
|
58,552 |
|
|
2022 |
|
|
47,372 |
|
|
Thereafter |
|
|
144,440 |
|
|
Total minimum lease payments |
|
$ |
420,002 |
|
87
Operating lease expenses for the years ended December 31, 2017, 2016, and 2015 were $53.2 million, $26.9 million, and $11.3 million, respectively.
We have several lease agreements where we are deemed the owner under build-to-suit lease accounting. The value of the leased property and corresponding financing obligations are included in property and equipment, net and other liabilities, respectively, on our consolidated balance sheets as of December 31, 2017. Our future minimum lease payments required under non-cancelable financing lease obligations, which exclusively relate to our build-to-suit leases, as of December 31, 2017, are as follows:
|
|
|
Financing Leases |
|
|
|
|
|
(in thousands) |
|
|
|
Year ending December 31, |
|
|
|
|
|
2018 |
|
$ |
4,726 |
|
|
2019 |
|
|
4,796 |
|
|
2020 |
|
|
4,947 |
|
|
2021 |
|
|
5,092 |
|
|
2022 |
|
|
5,167 |
|
|
Thereafter |
|
|
20,785 |
|
|
Total minimum lease payments |
|
$ |
45,513 |
|
We recognize an increase in value of the asset as additional building costs are incurred during the construction period and a corresponding increase in the lease financing obligation for any construction costs to be reimbursed by the landlord. As of December 31, 2017, $16.0 million of lease financing obligations are included in other liabilities on our consolidated balance sheets.
Contractual Commitments
We have non-cancelable contractual agreements related to the hosting of our data storage processing, storage, and other computing services.
In January 2017, we entered into the Google Cloud Platform License Agreement, which was amended in September 2017 and again in December 2017. Under the agreement, we were granted a license to access and use certain cloud services. The agreement has an initial term of five years and we are required to purchase at least $400.0 million of cloud services in each year of the agreement. For each of the first four years, up to 15% of this amount may be moved to a subsequent year. If we fail to meet the minimum purchase commitment during any year, we are required to pay the difference.
In March 2016, we entered into the AWS Enterprise Agreement for the use of cloud services from Amazon Web Services, Inc. (“AWS”), which was amended in March 2016 and again in February 2017. The agreement will continue indefinitely until terminated by either party. Under the February 2017 addendum to the agreement, we committed to spend $1.0 billion between January 2017 and December 2021 on AWS services ($50.0 million in 2017, $125.0 million in 2018, $200.0 million in 2019, $275.0 million in 2020, and $350.0 million in 2021). If we fail to meet the minimum purchase commitment during any year, we are required to pay the difference. Any such payment may be applied to future use of AWS services during the addendum term, although it will not count towards meeting the future minimum purchase commitments under the addendum.
We also have various other non-cancelable contractual commitments related to purchase agreements. During the third quarter of 2017, based on management’s updated assessment, we recorded $39.9 million of charges related to Spectacles inventory. The charges were primarily related to excess inventory reserves and inventory purchase commitment cancellation charges. As of December 31, 2017, there are no material hardware inventory commitments.
88
The future minimum contractual commitment including commitments less than one year, as of December 31, 2017 for each of the next five years are as follows:
|
|
|
Minimum Commitment |
|
|
|
|
|
(in thousands) |
|
|
|
Year ending December 31, |
|
|
|
|
|
2018 |
|
$ |
533,704 |
|
|
2019 |
|
|
604,427 |
|
|
2020 |
|
|
675,055 |
|
|
2021 |
|
|
750,000 |
|
|
2022 |
|
|
33,333 |
|
|
Thereafter |
|
|
— |
|
|
Total minimum lease payments |
|
$ |
2,596,519 |
|
Contingencies
We record a loss contingency when it is probable that a liability has been incurred and the amount of the loss can be reasonably estimated. We also disclose material contingencies when we believe a loss is not probable but reasonably possible. Accounting for contingencies requires us to use judgment related to both the likelihood of a loss and the estimate of the amount or range of loss. Many legal and tax contingencies can take years to be resolved.
Pending Matters
Beginning in May 2017, we, certain of our officers and directors, and the underwriters for our IPO were named as defendants in securities class actions purportedly brought on behalf of purchasers of our Class A common stock, alleging violation of securities laws in connection with our IPO. Management believes these lawsuits are without merit and intends to vigorously defend them. Based on the preliminary nature of the proceedings in this case, the outcome of this matter remains uncertain.
The outcomes of our legal proceedings are inherently unpredictable, subject to significant uncertainties, and could be material to our financial condition, results of operations, and cash flows for a particular period. For the pending matter described above, it is not possible to estimate the reasonably possible loss or range of loss.
We are subject to various other legal proceedings and claims in the ordinary course of business, including certain patent, trademark, and privacy matters. Although occasional adverse decisions or settlements may occur, we do not believe that the final disposition of any of our other pending matters will seriously harm our business, financial condition, results of operations, and cash flows.
Settlement
In September 2014, two individuals filed a lawsuit against us and our two founders in the Superior Court of California for Los Angeles County. The complaint alleged two causes of action—common-law right of publicity and statutory right of publicity—based on allegations that the defendants improperly used the plaintiffs’ images in promoting Snapchat for Android. In May 2017, the parties entered into a settlement agreement that resolved all claims among the parties. The settlement was not material. In June 2017, the parties filed a stipulation of dismissal with the court.
Indemnifications
In the ordinary course of business, we may provide indemnifications of varying scope and terms to customers, vendors, lessors, investors, directors, officers, employees, and other parties with respect to certain matters. Indemnification may include losses from our breach of such agreements, services we provide, or third party intellectual property infringement claims. These indemnifications may survive termination of the underlying agreement and the maximum potential amount of future indemnification payments may not be subject to a cap. We have not incurred material costs to defend lawsuits or settle claims related to these indemnifications as of December 31, 2017. We believe the fair value of these liabilities is immaterial and accordingly have no liabilities recorded for these agreements at December 31, 2017.
89
Assets and liabilities measured at fair value are classified into the following categories:
|
|
• |
Level 1: Quoted market prices in active markets for identical assets or liabilities. |
|
|
• |
Level 2: Observable market-based inputs or unobservable inputs that are corroborated by market data. |
|
|
• |
Level 3: Unobservable inputs reflecting the reporting entity’s own assumptions or external inputs from inactive markets. |
We classify our marketable securities within Level 1 because we use quoted market prices to determine their fair value. We recognize transfers between levels within the fair value hierarchy, if any, at the end of each period. There were no transfers between levels during the periods presented.
We determine the fair value of our marketable securities using quoted market prices. The following table sets forth our financial assets as of December 31, 2017 and 2016 that are measured at fair value on a recurring basis during the period:
|
|
|
Fair Value |
|
|||||
|
|
|
December 31, 2017 |
|
|
December 31, 2016 |
|
||
|
|
|
(in thousands) |
|
|||||
|
Cash and cash equivalents |
|
|
|
|
|
|
|
|
|
Cash |
|
$ |
267,715 |
|
|
$ |
150,121 |
|
|
U.S. government securities |
|
|
25,861 |
|
|
|
— |
|
|
U.S. government agency securities |
|
|
40,487 |
|
|
|
— |
|
|
Total cash and cash equivalents |
|
$ |
334,063 |
|
|
$ |
150,121 |
|
|
Marketable securities |
|
|
|
|
|
|
|
|
|
U.S. government securities |
|
$ |
1,350,581 |
|
|
$ |
505,333 |
|
|
U.S. government agency securities |
|
|
358,395 |
|
|
|
331,914 |
|
|
Total marketable securities |
|
$ |
1,708,976 |
|
|
$ |
837,247 |
|
The amortized cost of U.S. government securities with maturities less than one year was $1.4 billion and $502.4 million as of December 31, 2017 and 2016, respectively. The amortized cost of U.S. government securities with maturities between one and five years was zero and $3.0 million as of December 31, 2017 and 2016, respectively. The amortized cost of U.S. government agency securities with maturities of less than a year was $358.6 million and $284.7 million as of December 31, 2017 and 2016, respectively. The amortized cost of U.S. government agency securities with maturities between one and five years was zero and $47.2 million as of December 31, 2017 and 2016, respectively. Gross unrealized gains and losses for cash equivalents and marketable securities were not material as of December 31, 2017 and 2016.
8. Income Taxes
The domestic and foreign components of pre-tax loss were as follows:
|
|
|
Year Ended December 31, |
|
|||||||||
|
|
|
2017 |
|
|
2016 |
|
|
2015 |
|
|||
|
|
|
(in thousands) |
|
|||||||||
|
Domestic |
|
$ |
(3,027,580 |
) |
|
$ |
(520,482 |
) |
|
$ |
(380,216 |
) |
|
Foreign |
|
|
(435,828 |
) |
|
|
(1,241 |
) |
|
|
(266 |
) |
|
Loss before income taxes |
|
$ |
(3,463,408 |
) |
|
$ |
(521,723 |
) |
|
$ |
(380,482 |
) |
90
The components of our income tax (benefit) expense were as follows:
|
|
|
Year Ended December 31, |
|
|||||||||
|
|
|
2017 |
|
|
2016 |
|
|
2015 |
|
|||
|
|
|
(in thousands) |
|
|||||||||
|
Current: |
|
|
|
|
|
|
|
|
|
|
|
|
|
Federal |
|
$ |
— |
|
|
$ |
— |
|
|
$ |
— |
|
|
State |
|
|
(1,784 |
) |
|
|
3 |
|
|
|
3 |
|
|
Foreign |
|
|
932 |
|
|
|
869 |
|
|
|
108 |
|
|
Total current income tax (benefit) expense |
|
|
(852 |
) |
|
|
872 |
|
|
|
111 |
|
|
Deferred: |
|
|
|
|
|
|
|
|
|
|
|
|
|
Federal |
|
|
(12,287 |
) |
|
|
(6,364 |
) |
|
|
(7,141 |
) |
|
State |
|
|
303 |
|
|
|
(780 |
) |
|
|
(559 |
) |
|
Foreign |
|
|
(5,506 |
) |
|
|
(808 |
) |
|
|
— |
|
|
Total deferred income tax (benefit) expense |
|
|
(17,490 |
) |
|
|
(7,952 |
) |
|
|
(7,700 |
) |
|
Income tax (benefit) expense |
|
$ |
(18,342 |
) |
|
$ |
(7,080 |
) |
|
$ |
(7,589 |
) |
The following is a reconciliation of the statutory federal income tax rate to our effective tax rate:
|
|
|
Year Ended December 31, |
|
|||||||||
|
|
|
2017 |
|
|
2016 |
|
|
2015 |
|
|||
|
Tax benefit (expense) computed at the federal statutory rate |
|
|
34.0 |
% |
|
|
34.0 |
% |
|
|
34.0 |
% |
|
State tax benefit (expense), net of federal benefit |
|
|
3.0 |
|
|
|
1.3 |
|
|
|
2.3 |
|
|
Change in valuation allowance |
|
|
(25.4 |
) |
|
|
(34.6 |
) |
|
|
(31.0 |
) |
|
U.S. corporate tax rate reduction |
|
|
(11.4 |
) |
|
|
— |
|
|
|
— |
|
|
Differences between U.S. and foreign tax rates on foreign income |
|
|
(2.4 |
) |
|
|
— |
|
|
|
— |
|
|
Stock-based compensation benefit (expense) |
|
|
1.1 |
|
|
|
(0.4 |
) |
|
|
(4.2 |
) |
|
Federal research & development credit benefit |
|
|
1.4 |
|
|
|
1.2 |
|
|
|
0.5 |
|
|
Other benefits (expenses) |
|
|
0.2 |
|
|
|
(0.1 |
) |
|
|
0.4 |
|
|
Total income tax benefit (expense) |
|
|
0.5 |
% |
|
|
1.4 |
% |
|
|
2.0 |
% |
The significant components of net deferred tax balances were as follows:
|
|
|
Year Ended December 31, |
|
|||||
|
|
|
2017 |
|
|
2016 |
|
||
|
|
|
(in thousands) |
|
|||||
|
Deferred tax assets: |
|
|
|
|
|
|
|
|
|
Accrued expenses |
|
$ |
10,534 |
|
|
$ |
10,864 |
|
|
Deferred revenue |
|
|
2,142 |
|
|
|
1,900 |
|
|
Intangible assets |
|
|
140,771 |
|
|
|
24,089 |
|
|
Stock-based compensation |
|
|
396,604 |
|
|
|
21,111 |
|
|
Net operating losses |
|
|
473,110 |
|
|
|
33,276 |
|
|
Tax credit carryforwards |
|
|
124,078 |
|
|
|
15,854 |
|
|
Other |
|
|
2,015 |
|
|
|
1,469 |
|
|
Total deferred tax assets |
|
$ |
1,149,254 |
|
|
$ |
108,563 |
|
|
Deferred tax liabilities: |
|
|
|
|
|
|
|
|
|
Property and equipment |
|
$ |
(5,883 |
) |
|
$ |
(167 |
) |
|
Total deferred tax liabilities |
|
|
(5,883 |
) |
|
|
(167 |
) |
|
Total net deferred tax assets before valuation allowance |
|
|
1,143,371 |
|
|
|
108,396 |
|
|
Valuation allowance |
|
|
(1,144,543 |
) |
|
|
(108,872 |
) |
|
Net deferred taxes |
|
$ |
(1,172 |
) |
|
$ |
(476 |
) |
91
Income tax benefit was $18.3 million and $7.1 million for the years ended December 31, 2017 and 2016, respectively. The effective income tax rate was 0.5% and 1.4% for the years ended December 31, 2017 and 2016, respectively. The income tax benefits for the years ended December 31, 2017 and 2016 were primarily due to discrete tax benefits of $15.5 million and $7.1 million, respectively, as a result of partial releases of valuation allowances against net deferred tax assets related to acquisitions. The net deferred tax liabilities originating from acquisitions during the periods were considered as an available source of income to realize a portion of our deferred tax assets.
On December 22, 2017, the Tax Cuts and Jobs Act of 2017 (“Tax Act”) was signed into law making significant changes to the Internal Revenue Code. Changes include, but are not limited to, a corporate tax rate decrease to 21% effective for tax years beginning after December 31, 2017. This change in tax rate resulted in a reduction in our net U.S. deferred tax assets before valuation allowance by $396.2 million, which was fully offset by a reduction in our valuation allowance. The other provisions of the Tax Act, including the one-time transition tax on the mandatory deemed repatriation of cumulative foreign earnings, did not have a material impact on our financial statements as of December 31, 2017.
In December 2017, the SEC staff issued Staff Accounting Bulletin No. 118, Income Tax Accounting Implications of the Tax Cuts and Jobs Act (SAB 118), which allows us to record provisional amounts during a measurement period not to extend beyond one year of the enactment date. The impact of the change in tax rate is based on estimates of our net U.S. deferred tax assets before valuation allowance as of December 31, 2017. Additionally, potential further guidance may be forthcoming from the Financial Accounting Standards Board and the Securities and Exchange Commission, as well as regulations, interpretations and rulings from federal and state tax agencies, which could result in additional impacts.
As of December 31, 2017, we had an immaterial amount of unremitted earnings related to certain foreign subsidiaries. We intend to continue to reinvest our foreign earnings indefinitely and do not expect to incur any significant taxes related to such amounts.
As of December 31, 2017, we had accumulated federal and state net operating loss carry-forwards of $1.6 billion and $930.2 million, respectively. The U.S. federal and state net operating loss carry-forwards will begin to expire in 2031 and 2026, respectively. As of December 31, 2017, we had $521.7 million of U.K. net operating loss carry-forwards that can be carried over indefinitely. As of December 31, 2017, we had accumulated U.S. federal and state research tax credits of $90.1 million and $39.9 million, respectively. The U.S. federal research tax credits will begin to expire in 2032. The U.S. state research tax credits do not expire.
Available net operating losses may be subject to annual limitations due to ownership change limitations provided by the Internal Revenue Code of 1986, as amended (“Code”), and similar state provisions. Under Section 382 of the Code, substantial changes in our ownership and the ownership of acquired companies may limit the amount of net operating loss carry-forwards that are available to offset taxable income. The annual limitation would not automatically result in the loss of net operating loss carry-forwards but may limit the amount available in any given future period. Additional limitations on the use of these tax attributes could occur in the event of possible disputes arising in examination from various taxing authorities.
We recognize valuation allowances on deferred tax assets if it is more likely than not that some or all of the deferred tax assets will not be realized. We had valuation allowances against net deferred tax assets of $1.1 billion and $108.9 million as of December 31, 2017 and 2016, respectively. In 2017, the change in the valuation allowance was primarily attributable to a net increase in our deferred tax assets resulting from the loss from operations.
92
The following table summarizes the activity related to our gross unrecognized tax benefits during the years ended December 31, 2017 and 2016:
|
|
|
Year Ended December 31, |
|
|||||
|
|
|
2017 |
|
|
2016 |
|
||
|
|
|
(in thousands) |
|
|||||
|
Beginning balance of unrecognized tax benefits |
|
$ |
243,862 |
|
|
$ |
— |
|
|
Additions for current year tax positions |
|
|
42,209 |
|
|
|
243,862 |
|
|
Additions for prior year tax positions |
|
|
2,158 |
|
|
|
— |
|
|
Reductions for prior year tax positions |
|
|
(568 |
) |
|
|
— |
|
|
Changes due to foreign currency translation adjustments |
|
|
163 |
|
|
|
— |
|
|
Remeasurement of uncertain tax positions due to the Tax Act |
|
|
(84,647 |
) |
|
|
— |
|
|
Ending balance of unrecognized tax benefits (excluding interest and penalties) |
|
$ |
203,177 |
|
|
$ |
243,862 |
|
|
Interest and penalties associated with unrecognized tax benefits |
|
|
80 |
|
|
|
— |
|
|
Ending balance of unrecognized tax benefits (including interest and penalties) |
|
$ |
203,257 |
|
|
$ |
243,862 |
|
The total amount of gross unrecognized tax benefits, including related interest and penalties, was $203.3 million and $243.9 million as of December 31, 2017 and 2016, respectively. Substantially all of the unrecognized tax benefit was recorded as a reduction in our gross deferred tax assets, offset by a reduction in our valuation allowance. We have net unrecognized tax benefits of $2.1 million and $3.6 million that is included in other liabilities on our consolidated balance sheet as of December 31, 2017 and 2016, respectively. Assuming there continues to be a valuation allowance against deferred tax assets in future periods when gross unrecognized tax benefits are realized, this would result in a tax benefit of $2.8 million within our provision of income taxes at such time.
Our policy is to recognize interest and penalties associated with tax matters as part of the income tax provision and include accrued interest and penalties with the related income tax liability on our consolidated balance sheet. During the year ended December 31, 2017, interest expense we recorded related to uncertain tax positions was not material. Any changes to unrecognized tax benefits recorded as of December 31, 2017 that are reasonably possible to occur within the next 12 months are not expected to be material.
The income taxes we pay are subject to review by taxing jurisdictions globally. Our estimate of the potential outcome of any uncertain tax position is subject to management’s assessment of relevant risks, facts, and circumstances existing at that time. We believe that our estimate has adequately provided for these matters. However, our future results may include adjustments to estimates in the period the audits are resolved, which may impact our effective tax rate.
Tax years ending on or after December 31, 2012 are subject to examination by federal, state, and various foreign jurisdictions.
93
9. Accumulated Other Comprehensive Income (Loss)
The table below presents the changes in accumulated other comprehensive income (loss) (“AOCI”) by component and the reclassifications out of AOCI:
|
|
|
Changes in Accumulated Other Comprehensive Income (Loss) by Component |
|
|||||||||
|
|
|
Marketable Securities |
|
|
Foreign Currency Translation |
|
|
Total |
|
|||
|
|
|
(in thousands) |
|
|||||||||
|
Balance at December 31, 2016 |
|
$ |
44 |
|
|
$ |
(2,101 |
) |
|
$ |
(2,057 |
) |
|
OCI before reclassifications (1) |
|
|
(1,137 |
) |
|
|
17,336 |
|
|
|
16,199 |
|
|
Amounts reclassified from AOCI (2) |
|
|
15 |
|
|
|
— |
|
|
|
15 |
|
|
Net current period OCI |
|
|
(1,122 |
) |
|
|
17,336 |
|
|
|
16,214 |
|
|
Balance at December 31, 2017 |
|
$ |
(1,078 |
) |
|
$ |
15,235 |
|
|
$ |
14,157 |
|
|
(1) |
The associated income tax effects for gains / losses on marketable securities were not material. |
|
(2) |
Realized gains and losses on marketable securities are reclassified from AOCI into other income (expense), net in the consolidated statements of operations. |
10. Geographic Information
Revenue by geography is based on the billing address of the advertiser. The following tables list revenue and property and equipment, net by geographic area:
|
|
|
Year Ended December 31, |
|
|||||||||
|
|
|
2017 |
|
|
2016 |
|
|
2015 |
|
|||
|
|
|
(in thousands) |
|
|||||||||
|
Revenue: |
|
|
|
|
|
|
|
|
|
|
|
|
|
United States |
|
$ |
642,971 |
|
|
$ |
355,252 |
|
|
$ |
56,253 |
|
|
Rest of the world (1) |
|
|
181,978 |
|
|
|
49,230 |
|
|
|
2,410 |
|
|
Total revenue |
|
$ |
824,949 |
|
|
$ |
404,482 |
|
|
$ |
58,663 |
|
|
(1) |
No individual country exceeded 10% of our total revenue for any period presented. |
|
|
|
As of December 31, |
|
|||||
|
|
|
2017 |
|
|
2016 |
|
||
|
|
|
(in thousands) |
|
|||||
|
Property and equipment, net: |
|
|
|
|
|
|
|
|
|
United States |
|
$ |
146,862 |
|
|
$ |
98,254 |
|
|
Rest of the world (1) |
|
|
19,900 |
|
|
|
2,331 |
|
|
Total property and equipment, net |
|
$ |
166,762 |
|
|
$ |
100,585 |
|
|
(1) |
No individual country exceeded 10% of our total property and equipment, net for any period presented. |
94
11. Property and Equipment, Net
Property and equipment, net, consisted of the following:
|
|
|
As of December 31, |
|
|||||
|
|
|
2017 |
|
|
2016 |
|
||
|
|
|
(in thousands) |
|
|||||
|
Computer hardware and software |
|
$ |
28,685 |
|
|
$ |
22,606 |
|
|
Buildings |
|
|
59,530 |
|
|
|
36,854 |
|
|
Leasehold improvements |
|
|
52,252 |
|
|
|
13,166 |
|
|
Land |
|
|
4,630 |
|
|
|
4,630 |
|
|
Furniture and equipment |
|
|
49,587 |
|
|
|
20,349 |
|
|
Construction in progress |
|
|
9,841 |
|
|
|
20,790 |
|
|
Total |
|
|
204,525 |
|
|
|
118,395 |
|
|
Less: accumulated depreciation and amortization |
|
|
(37,763 |
) |
|
|
(17,810 |
) |
|
Property and equipment, net |
|
$ |
166,762 |
|
|
$ |
100,585 |
|
Depreciation and amortization expense on property and equipment was $29.8 million, $12.9 million, and $5.8 million for the years ended December 31, 2017, 2016, and 2015 respectively.
12. Balance Sheet Components
Accrued expenses and other current liabilities at December 31, 2017 and 2016 consisted of the following:
|
|
|
As of December 31, |
|
|||||
|
|
|
2017 |
|
|
2016 |
|
||
|
|
|
(in thousands) |
|
|||||
|
Accrued infrastructure costs |
|
$ |
96,468 |
|
|
$ |
43,529 |
|
|
Accrued compensation and related expenses |
|
|
37,648 |
|
|
|
23,447 |
|
|
Partner revenue share liability |
|
|
31,878 |
|
|
|
22,821 |
|
|
Acquisition purchase consideration liability |
|
|
28,696 |
|
|
|
6,000 |
|
|
Accrued professional fees |
|
|
15,783 |
|
|
|
11,157 |
|
|
Accrued tax liability |
|
|
10,339 |
|
|
|
9,252 |
|
|
Other |
|
|
54,250 |
|
|
|
32,119 |
|
|
Total accrued expenses and other current liabilities |
|
$ |
275,062 |
|
|
$ |
148,325 |
|
Other liabilities at December 31, 2017 and 2016 consisted of the following:
|
|
|
As of December 31, |
|
|||||
|
|
|
2017 |
|
|
2016 |
|
||
|
|
|
(in thousands) |
|
|||||
|
Lease incentive liability |
|
$ |
28,114 |
|
|
$ |
1,541 |
|
|
Deferred rent |
|
|
22,763 |
|
|
|
8,525 |
|
|
Build-to-suit financing obligations |
|
|
16,033 |
|
|
|
15,140 |
|
|
Acquisition purchase consideration liability |
|
|
10,300 |
|
|
|
15,944 |
|
|
Other |
|
|
5,773 |
|
|
|
5,984 |
|
|
Total other liabilities |
|
$ |
82,983 |
|
|
$ |
47,134 |
|
95
In July 2016, we entered into a five-year senior unsecured revolving credit facility (“Credit Facility”) with lenders, some of which are affiliated with certain members of the underwriting syndicate for our IPO, that allows us to borrow up to $1.1 billion to fund working capital and general corporate-purpose expenditures. The loan bears interest at LIBOR plus 0.75%, as well as an annual commitment fee of 0.10% on the daily undrawn balance of the facility. No origination fees were incurred at the closing of the Credit Facility. Any amounts outstanding under this facility will be due and payable in July 2021. In December 2016, the amount we are permitted to borrow under the Credit Facility was increased to $1.2 billion. As of December 31, 2017, no amounts were outstanding under the Credit Facility. In February 2018, the amount we are permitted to borrow under the Credit Facility was increased to $1.25 billion.
14. Non-Marketable Investments
We held investments in privately held companies with a carrying value of $22.7 million and $11.8 million as of December 31, 2017 and 2016, respectively. Our share of gains and losses in equity method investments was a net gain of $1.0 million and net losses of $3.9 million and $0.5 million for the years ended December 31, 2017, 2016, and 2015, respectively, which is included in other income (expense), net in our consolidated statements of operations. Non-marketable investments are included within other assets on the consolidated balance sheet. Such investments are reviewed periodically for impairments. No impairments were recorded in any period presented.
15. Employee Benefit Plans
We have a defined contribution 401(k) plan (the “401(k) Plan”) for our U.S.-based employees. The 401(k) Plan is for all full-time employees who meet certain eligibility requirements. Eligible employees may contribute up to 100% of their annual compensation, but are limited to the maximum annual dollar amount allowable under the Internal Revenue Code. Beginning in 2016, we match 100% of each participant’s contribution up to a maximum of 3% of the participant’s base salary, bonus, and commissions paid during the period, and we match 50% of each participant’s contribution between 3% and 5% of the participant’s base salary, bonus, and commissions paid during the period. During the years ended December 31, 2017, and 2016, we recognized expense of $12.4 million and $4.2 million, respectively, related to matching contributions. For the year ended December 31, 2015, we did not make any matching contributions.
96
Item 9. Changes in and Disagreements with Accountants on Accounting and Financial Disclosure.
None.
Item 9A. Controls and Procedures.
Evaluation of Disclosure Controls and Procedures
Our management, with the participation of our Chief Executive Officer and Chief Financial Officer, has evaluated the effectiveness of our disclosure controls and procedures (as defined in Rules 13a-15(e) and 15d-15(e) under the Exchange Act), as of the end of the period covered by this Annual Report on Form 10-K. Based on such evaluation, our Chief Executive Officer and Chief Financial Officer have concluded that as of December 31, 2017, our disclosure controls and procedures were effective to provide reasonable assurance that the information required to be disclosed by us in this Annual Report on Form 10-K was (a) reported within the time periods specified by SEC rules and regulations, and (b) communicated to our management, including our Chief Executive Officer and Chief Financial Officer, to allow timely decisions regarding any required disclosure.
Changes in Internal Control
There were no changes in our internal control over financial reporting identified in management’s evaluation pursuant to Rules 13a-15(d) or 15d-15(d) of the Exchange Act during the period covered by this Annual Report on Form 10-K that materially affected, or are reasonably likely to materially affect, our internal control over financial reporting.
Limitations on Effectiveness of Controls and Procedures
In designing and evaluating the disclosure controls and procedures, management recognizes that any controls and procedures, no matter how well designed and operated, can provide only reasonable assurance of achieving the desired control objectives. In addition, the design of disclosure controls and procedures must reflect the fact that there are resource constraints and that management is required to apply judgment in evaluating the benefits of possible controls and procedures relative to their costs.
Management’s Annual Report on Internal Controls
This Annual Report on Form 10-K does not include a report of management's assessment regarding internal control over financial reporting or an attestation report of our registered public accounting firm due to a transition period established by rules of the Securities and Exchange Commission for newly public companies
Increase to Revolving Credit Facility
On February 20, 2018, we entered into a joinder agreement, or the Joinder, to our Revolving Credit Agreement, dated July 29, 2016 by and among us, Morgan Stanley Senior Funding, Inc., as administrative agent, the lenders from time to time party thereto, and the issuing banks from time to time party thereto, or the Credit Agreement.
The Joinder adds Silicon Valley Bank as a lender to provide a $50.0 million commitment through the accordion feature in the Credit Agreement, increasing the total commitment under the Credit Agreement to $1.25 billion. There were no other amendments to the terms of the Credit Agreement.
We are including this disclosure in this Annual Report on Form 10-K rather than filing a Current Report on Form 8-K under Items 1.01 and 2.03 at a later date. The foregoing description is only a summary of the provisions of the Joinder and the Credit Agreement and is qualified in its entirety by the underlying agreements. The full text of the Joinder is filed as Exhibit 10.29 and incorporated by reference herein.
97
Item 10. Directors, Executive Officers and Corporate Governance
The following table sets forth information for our directors and executive officers, and their ages as of December 31, 2017.
|
Name |
|
Age |
|
Position |
|
Executive Officers |
|
|
|
|
|
Evan Spiegel |
|
27 |
|
Co-Founder, Chief Executive Officer, and Director |
|
Robert Murphy |
|
29 |
|
Co-Founder, Chief Technology Officer, and Director |
|
Imran Khan |
|
40 |
|
Chief Strategy Officer |
|
Andrew Vollero |
|
51 |
|
Chief Financial Officer |
|
Michael O’Sullivan |
|
52 |
|
General Counsel |
|
Lara Sweet |
|
43 |
|
Chief Accounting Officer |
|
Steven Horowitz |
|
50 |
|
Vice President of Technology |
|
Non-Employee Directors |
|
|
|
|
|
Michael Lynton(1)(2) |
|
58 |
|
Director and Chairman of the Board |
|
Joanna Coles(2) |
|
55 |
|
Director |
|
A.G Lafley(1)(2) |
|
70 |
|
Director |
|
Mitchell Lasky |
|
55 |
|
Director |
|
Stanley Meresman(3) |
|
71 |
|
Director |
|
Scott D. Miller(1)(3) |
|
65 |
|
Director |
|
Christopher Young(3) |
|
45 |
|
Director |
|
(2) |
Member of the nominating and corporate governance committee. |
|
(3) |
Member of the audit committee. |
Executive Officers
Evan Spiegel. Mr. Spiegel is our co-founder and has served as our Chief Executive Officer and a member of our board of directors since May 2012. We believe that Mr. Spiegel is qualified to serve as a member of our board based on the perspective and experience he brings as our co-founder and Chief Executive Officer.
Robert Murphy. Mr. Murphy is our co-founder and has served as our Chief Technology Officer and a member of our board of directors since May 2012. Mr. Murphy holds a B.S. in Mathematical and Computational Science from Stanford University. We believe that Mr. Murphy is qualified to serve as a member of our board of directors based on the perspective and experience he brings as our co-founder and Chief Technology Officer.
Imran Khan. Mr. Khan has served as our Chief Strategy Officer since January 2015. From May 2011 to January 2015, Mr. Khan served as a Managing Director in the Investment Banking Division at Credit Suisse. From March 2004 to May 2011, Mr. Khan was an Equity Analyst at J.P. Morgan Securities Inc. Mr. Khan holds a B.S.B.A. in Finance and Economics from the University of Denver.
Andrew Vollero. Mr. Vollero has served as our Chief Financial Officer since February 2016 and previously served as our Vice President, Finance since August 2015. From September 2000 to August 2015, Mr. Vollero was employed at Mattel, Inc., a toy manufacturing company, where he served as the Senior Vice President, Corporate Strategy, Development & Investor Relations from September 2005 to August 2015 and Division CFO, Senior Vice President, Finance and Strategy from September 2000 to September 2005. Mr. Vollero holds a B.A. in Mathematics and Economics from Yale University and a Master of Science in Management from Oxford University.
Michael O’Sullivan. Mr. O’Sullivan has served as our General Counsel since July 2017. From 1992 to July 2017, Mr. O’Sullivan was a lawyer in private practice. He served since 1996 as a lawyer at the law firm of Munger, Tolles & Olson LLP in Los Angeles, California, where he focused his practice on advising companies, their boards of directors, and founders on corporate transactions, governance matters, and significant disputes. Mr. O’Sullivan holds a J.D. from University of Southern California’s Gould School of Law and a B.A. from University of Pennsylvania.
98
Lara Sweet. Ms. Sweet has served as our Chief Accounting Officer since October 2017 and previously served as our Controller since June 2016. From November 2014 to June 2016, Ms. Sweet served as Controller and Chief Accounting Officer at AOL, Inc., and previously served there as Vice President, Internal Audit from April 2014 to November 2014, and Vice President, Assistant Controller from August 2011 to April 2014. Ms. Sweet holds a B.S. in Accounting from George Mason University.
Steven Horowitz. Mr. Horowitz has served as our Vice President of Technology since August 2017, and previously served as our Vice President of Hardware from January to August 2017 and our Vice President of Engineering from January 2015 to December 2016. Prior to joining Snap Inc., Mr. Horowitz served as Senior Vice President of Software Engineering at Motorola Mobility, LLC, formerly a Google company, from December 2012 through January 2015. From January 2009 through November 2012, Mr. Horowitz served as Chief Technology Officer for Quotient Technology, Inc., a consumer technologies company. Prior to that he worked at Google, Microsoft, and Apple. Mr. Horowitz holds a B.A. from the University of Michigan, Ann Arbor. Mr. Horowitz is also a member of the board of directors of Quotient Technology, Inc.
Non-Employee Directors
Michael Lynton. Mr. Lynton has served on our board of directors since April 2013 and has been Chairman of our board of directors since September 2016. Mr. Lynton served as Chief Executive Officer or Co-Chief Executive Officer of Sony Entertainment Inc., an international entertainment company, from April 2012 until August 2017, as Chairman and Chief Executive Officer of Sony Pictures Entertainment Inc. from January 2004 until May 2017, and as CEO of Sony Corporation of America from March 2012 to August 2017. Mr. Lynton has also served as a member of the board of directors of Ares Management, L.P. since 2014, of Pandora Media Inc. since August 2017, and of Pearson since February 2018. Mr. Lynton holds a B.A. in History and Literature from Harvard College and an M.B.A. from Harvard Business School. We believe that Mr. Lynton is qualified to serve as a member of our board of directors and Chairman due to his extensive leadership experience.
Joanna Coles. Ms. Coles has served on our board of directors since December 2015. Ms. Coles was appointed Chief Content Officer of Hearst Magazines in September 2016, overseeing editorial for Hearst’s 300 titles globally. Prior to that she was Editor-in-Chief of Cosmopolitan, a role she started in September 2012. She edited Marie Claire magazine from April 2006 to September 2012. Ms. Coles worked for The Times of London from September 1998 to September 2001 and served as New York Bureau Chief for The Guardian from 1997 to 1998. She is on the board of Women Entrepreneurs New York City, an initiative to encourage female entrepreneurship, with a focus on underserved communities. Ms. Coles holds a B.A. in English and American literature from the University of East Anglia. We believe that Ms. Coles is qualified to serve as a member of our board of directors due to her extensive experience working with content providers and advertisers.
A.G. Lafley. Mr. Lafley has served on our board of directors since July 2016. Mr. Lafley has held various positions within The Procter & Gamble Company since 1977 and served as its President, Chief Executive Officer, and as a member of the board of directors from June 2000 until June 2009 and again from May 2013 to October 2015. He also served as Chairman of the Board from July 2002 through February 2010 and again from May 2013 through June 2016. From April 2010 to May 2013, Mr. Lafley served as a consultant and as a Senior Adviser at Clayton, Dubilier & Rice, LLC, a private equity firm. Mr. Lafley holds a B.A. from Hamilton College and an M.B.A. from Harvard Business School. We believe that Mr. Lafley is qualified to serve as a member of our board of directors due to his extensive leadership experience.
Mitchell Lasky. Mr. Lasky has served on our board of directors since December 2012. Mr. Lasky has been a partner at Benchmark, a venture capital firm, since April 2007. From November 2000 to February 2006, Mr. Lasky served as Chief Executive Officer of JAMDAT Mobile, Inc., a publicly traded mobile games company, and served as Executive Vice President, Mobile & Online at Electronic Arts, a video game company, after it acquired JAMDAT in February 2006, until April 2007. Mr. Lasky holds a B.A. in History and Literature from Harvard College and a J.D. from the University of Virginia School of Law. We believe Mr. Lasky is qualified to serve as a member of our board of directors due to his extensive experience with social media and technology companies, as well as his experience as a venture capitalist investing in technology companies.
Stanley Meresman. Mr. Meresman has served on our board of directors since July 2015. During the last ten years, Mr. Meresman has served on the boards of directors of various public and private companies, including service as chair of the audit committee for some of these companies. He currently serves on the board of directors, and as chair of the audit committee, of Palo Alto Networks, Inc. He served as a member of the board of directors of LinkedIn Corporation from October 2010 to December 2016, Zynga Inc. from June 2011 to June 2015, Meru Networks, Inc. from September 2010 to May 2013, and Riverbed Technology, Inc. from March 2005 to May 2012. From January 2004 to December 2004,
99
Mr. Meresman was a Venture Partner with Technology Crossover Ventures, a private equity firm, and was General Partner and Chief Operating Officer of Technology Crossover Ventures from November 2001 to December 2003. During the four years before joining Technology Crossover Ventures, Mr. Meresman was a private investor and board member and advisor to several technology companies. From 1989 to 1997, Mr. Meresman served as the Senior Vice President and Chief Financial Officer of Silicon Graphics, Inc. Mr. Meresman holds a B.S. in Industrial Engineering and Operations Research from the University of California, Berkeley and an M.B.A. from the Stanford Graduate School of Business. We believe that Mr. Meresman is qualified to serve as a member of our board of directors and chair of our audit committee due to his background as a member of the board and chair of the audit committee of other public companies and his financial and accounting expertise from his prior extensive experience as chief financial officer of two publicly traded companies.
Scott D. Miller. Mr. Miller has served on our board of directors since October 2016. Mr. Miller is a founder and Chief Executive Officer of G100 Companies, which operates G100 Network and SSA & Company. Before joining G100 Companies in March 2004, Mr. Miller was employed at Hyatt Hotels Corporation, a global hospitality company, where he served as non-executive vice chairman from August 2003 to December 2004, president from January 1999 to August 2003, and executive vice president from September 1997 to July 2003. Mr. Miller currently serves on the board of directors of QTS Realty Trust, Inc. and served on the boards of Affinion Group, Inc. from 2011 to 2013, AXA Equitable Life Insurance Company from 2002 to 2012, Orbitz Worldwide, Inc. from 2003 to 2004, and NAVTEQ corporation from 2002 to 2006. He also serves on several private company boards. Mr. Miller holds a B.S. in Human Biology from Stanford University and an M.B.A. from the University of Chicago. We believe that Mr. Miller is qualified to serve as a member of our board of directors due to his extensive leadership experience.
Christopher Young. Mr. Young has served on our board of directors since October 2016. Since April 2017, Mr. Young has served as Chief Executive Officer of McAfee, LLC. From October 2014 until April 2017, Mr. Young served as Senior Vice President and General Manager, Intel Security Group at Intel Corporation, a multinational technology company, until the McAfee division was spun out. From November 2011 to September 2014, Mr. Young served as Senior Vice President, Security & Government Group at Cisco Systems, Inc. a technology networking company. From August 2010 to October 2011, Mr. Young served as Senior Vice President & General Manager, End User Computing at VMware, Inc., a software company. From January 2011 to August 2016, Mr. Young served on the board of directors of Rapid7, Inc., a security software company. Mr. Young holds a B.A. in Public Policy from Princeton University and an M.B.A. from Harvard Business School. We believe that Mr. Young is qualified to serve as a member of our board of directors due to his extensive experience with technology companies.
There are no family relationships among any of the directors or executive officers.
Independent Chairman
Our board of directors appointed Mr. Lynton to serve as our independent Chairman of our board of directors in September 2016. As Chairman of our board of directors, Mr. Lynton presides over meetings of our independent directors without management present. Mr. Lynton also performs such additional duties as our board of directors may otherwise determine and delegate. Mr. Lynton is an independent director and satisfies the independence requirements under NYSE listing standards.
Composition of Our Board of Directors
Certain members of our board of directors were elected under the provisions of a voting agreement. Under the terms of this voting agreement, the stockholders who were party to the voting agreement agreed to vote their respective shares to elect: (1) one director designated by Benchmark Capital Partners (Mr. Lasky); (2) two directors designated by the holders of the Series FP preferred stock (Mr. Spiegel and Mr. Murphy); and (3) one individual designated by the other members of the board of directors (Mr. Lynton). The voting agreement terminated on the closing of our initial public offering in March 2017. Following our initial public offering, no stockholder has any special rights regarding the election or designation of members of our board of directors. There is no contractual arrangement by which Ms. Coles, Mr. Lafley, Mr. Meresman, Mr. Miller, and Mr. Young were appointed to our board of directors. Our current directors will continue to serve as directors until our 2018 annual meeting of stockholders and until their successor is duly elected, or until their earlier resignation or removal.
Our board of directors may establish the authorized number of directors from time to time by resolution. Our board of directors consists of nine members.
100
So long as any shares of our Class C common stock are outstanding, we will not have a classified board of directors, and all directors will be elected for annual terms.
Following the conversion of all of our Class C common stock to Class B common stock, and subsequent conversion of all of our Class B common stock to Class A common stock, we will have a classified board of directors consisting of three classes. Each class will be approximately equal in size, with each director serving staggered three-year terms. Directors will be assigned to a class by the then-current board of directors.
When our board of directors is classified, we expect that any additional directorships resulting from an increase in the number of directors will be distributed among the three classes so that, as nearly as possible, each class will consist of one-third of the directors. The division of our board of directors into three classes with staggered three-year terms may delay or prevent a change of our management or a change in control.
Our board of directors held five meetings during 2017. No member of our board of directors attended fewer than 75% of the aggregate of (i) the total number of meetings of the board of directors (held during the period for which he or she was a director) and (ii) the total number of meetings held by all committees of the board of directors on which such director served (held during the period that such director served). Members of our board of directors are invited and encouraged to attend our annual meeting of stockholders.
Executive Sessions of Independent Directors
In order to promote open discussion among non-management directors, and as required under applicable NYSE rules, our board of directors conducts executive sessions of non-management directors during each regularly scheduled board meeting and at such other times if requested by a non-management director. The non-management directors provide feedback to executive management, as needed, promptly after the executive session. Neither Mr. Spiegel nor Mr. Murphy participates in such sessions. In addition, we hold executive sessions including only independent directors at least once a year. As Chairman of our board of directors, Mr. Lynton presides over meetings of our independent directors without management present.
Committees of Our Board of Directors
Our board of directors has established an audit committee, a compensation committee, and a nominating and corporate governance committee. The composition and responsibilities of each of the committees of our board of directors are described below. Members serve on these committees until their resignation or until otherwise determined by our board of directors. Our board of directors may establish other committees as it deems necessary or appropriate from time to time.
Audit Committee
Our audit committee consists of Mr. Lynton, Mr. Meresman, and Mr. Miller, each of whom our board of directors has determined satisfies the independence requirements under NYSE listing standards and Rule 10A-3(b)(1) of the Exchange Act. Mr. Young was a member of the audit committee until January 2018, and Mr. Lynton joined the audit committee in January 2018. The chair of our audit committee is Mr. Meresman, who our board of directors has determined is an “audit committee financial expert” within the meaning of SEC regulations. Each member of our audit committee can read and understand fundamental financial statements in accordance with applicable requirements. In arriving at these determinations, the board of directors has examined each audit committee member’s scope of experience and the nature of their employment in the corporate finance sector. During 2017, the audit committee met six times. No member of the audit committee simultaneously serves on the audit committees of more than three public companies. Our board of directors has adopted a written charter for the audit committee, which is available on our website at www.snap.com.
The primary purpose of the audit committee is to discharge the responsibilities of our board of directors with respect to our corporate accounting and financial reporting processes, systems of internal control, and financial-statement audits, and to oversee our independent registered accounting firm. Specific responsibilities of our audit committee include:
|
|
• |
helping our board of directors oversee our corporate accounting and financial reporting processes; |
|
|
• |
managing the selection, engagement, qualifications, independence, and performance of a qualified firm to serve as the independent registered public accounting firm to audit our financial statements; |
101
|
|
• |
developing procedures for employees to submit concerns anonymously about questionable accounting or audit matters; |
|
|
• |
reviewing related person transactions; |
|
|
• |
obtaining and reviewing a report by the independent registered public accounting firm at least annually, that describes our internal quality control procedures, any material issues with such procedures, and any steps taken to deal with such issues when required by applicable law; and |
|
|
• |
approving, or, as permitted, pre-approving, audit and permissible non-audit services to be performed by the independent registered public accounting firm. |
Compensation Committee
Our compensation committee consists of Mr. Lafley, Mr. Lynton, and Mr. Miller. Our board of directors has determined that Mr. Lafley, Mr. Lynton, and Mr. Miller are each independent under NYSE listing standards, a “non-employee director” as defined in Rule 16b-3 promulgated under the Exchange Act, and an “outside director” as that term is defined in Section 162(m) of the Code. The chair of our compensation committee is Mr. Lynton. During 2017, the compensation committee met six times. Our board of directors has adopted a written charter for the compensation committee, which is available on our website at www.snap.com.
The primary purpose of our compensation committee is to discharge the responsibilities of our board of directors in overseeing our compensation policies, plans, and programs and to review and determine the compensation to be paid to our executive officers, directors, and other senior management, as appropriate. Specific responsibilities of our compensation committee include:
|
|
• |
reviewing and approving the compensation of our chief executive officer, other executive officers, and senior management; |
|
|
• |
reviewing and recommending to our board of directors the compensation paid to our directors; |
|
|
• |
reviewing and approving the compensation arrangements with our executive officers and other senior management; |
|
|
• |
administering our equity incentive plans and other benefit programs; |
|
|
• |
reviewing, adopting, amending, and terminating incentive compensation and equity plans, severance agreements, profit sharing plans, bonus plans, change-of-control protections, and any other compensatory arrangements for our executive officers and other senior management; |
|
|
• |
reviewing, evaluating, and recommending to our board of directors succession plans for our executive officers; and |
|
|
• |
reviewing and establishing general policies relating to compensation and benefits of our employees, including our overall compensation philosophy. |
Nominating and Corporate Governance Committee
Our nominating and corporate governance committee consists of Ms. Coles, Mr. Lafley, and Mr. Lynton. The chair of our nominating and corporate governance committee is Mr. Lafley. Our board of directors has determined that each member of the nominating and corporate governance committee is independent under the NYSE listing standards, a non-employee director, and free from any relationship that would interfere with the exercise of his or her independent judgment. During 2017, the nominating and corporate governance committee met four times. Our board of directors has adopted a written charter for the nominating and corporate governance committee, which is available on our website at www.snap.com.
102
Specific responsibilities of our nominating and corporate governance committee include:
|
|
• |
identifying and evaluating candidates, including the nomination of incumbent directors for reelection and nominees recommended by stockholders, to serve on our board of directors; |
|
|
• |
considering and making recommendations to our board of directors regarding the composition and chairmanship of the committees of our board of directors; |
|
|
• |
instituting plans or programs for the continuing education of our board of directors and orientation of new directors; |
|
|
• |
developing and making recommendations to our board of directors regarding corporate governance guidelines and matters; and |
|
|
• |
overseeing periodic evaluations of the board of directors’ performance, including committees of the board of directors and management. |
We have adopted a Code of Conduct that applies to all our employees, officers, and directors. This includes our principal executive officer, principal financial officer, and principal accounting officer or controller, or persons performing similar functions. The full text of our Code of Conduct is available on our website at www.snap.com. We intend to disclose on our website any future amendments of our Code of Conduct or waivers that exempt any principal executive officer, principal financial officer, principal accounting officer or controller, persons performing similar functions, or our directors from provisions in the Code of Conduct. You can request a copy of our Code of Conduct by writing to our Secretary at Snap Inc., 63 Market Street, Venice, CA 90291.
Our board of directors believes that good corporate governance is important to ensure that the company is managed for the long-term benefit of our stockholders. The full text of our corporate governance guidelines is also available on our website at www.snap.com.
Procedures by Which Stockholders May Nominate Directors
The nominating and corporate governance committee and our board of directors will review and evaluate candidates proposed by stockholders. The nominating and corporate governance committee and our board of directors will apply the same criteria, and follow substantially the same process in considering the candidates, as they do in considering other candidates. The factors generally considered by the nominating and corporate governance committee and our board of directors are set out in our Corporate Governance Guidelines, which are available on our website at www.snap.com. If a stockholder who is eligible to vote at the 2018 annual meeting of stockholders wishes to nominate a candidate to be considered for election as a director, it must comply with the procedures set forth in our by-laws and give timely notice of the nomination in writing to our Secretary. All stockholder proposals should be marked for the attention of our Secretary at Snap Inc., 63 Market Street, Venice, CA 90291.
Any stockholder, including a holder of Class A common stock, may contact our board of directors regarding genuine issues or questions about us by sending a letter to the board of directors at: Snap Inc., c/o Secretary, 63 Market Street, Venice, CA 90291, Attention: Board of Directors. Each communication should specify the person sending the communication, the general topic of the communication, and the class and number of shares of our stock that are owned of record (if a record holder) or beneficially (if not a record holder). If any stockholder, including a holder of Class A common stock, wants to contact the independent members of the board of directors, the stockholder should address the communication to the attention of the Chairman (c/o Secretary) of the board of directors at the address above. Our legal department will review communications before forwarding them to the recipient, and will not forward a communication that is unrelated to the duties and responsibilities of the board of directors, irrelevant, primarily commercial in nature, addressed already on our website or in other filings, or is unduly hostile, threatening, illegal, or similarly unsuitable. Any communication that is not forwarded will be made available to any director on request.
103
Section 16(a) Beneficial Ownership Reporting Compliance
Section 16(a) of the Exchange Act requires our executive officers and directors to file initial reports of ownership and reports of changes in ownership with the SEC and to furnish us with copies of all Section 16(a) forms they file. Because our Class A common stock is non-voting, significant holders of our common stock are exempt from the obligation to file reports under Section 16 of the Exchange Act. For more information, see “Risk Factors—Because our Class A common stock is non-voting, we and our stockholders are exempt from certain provisions of U.S. securities laws. This may limit the information available to holders of our Class A common stock.”
To our knowledge, based solely on our review of the copies of such reports furnished to us or written representations from such persons, we believe that, with respect to the fiscal year ended December 31, 2017, such persons complied with all such filing requirements, except that a statement of changes in beneficial ownership of securities was filed late on August 10, 2017 on behalf of Michael Lynton, reporting two prior conversions of our Class B common stock into Class A common stock.
Item 11. Executive Compensation
Summary Compensation Table
Our named executive officers as of December 31, 2017 were:
|
|
• |
Evan Spiegel, Co-Founder and Chief Executive Officer; |
|
|
• |
Imran Khan, Chief Strategy Officer |
|
|
• |
Michael O’Sullivan, General Counsel; and |
|
|
• |
Chris Handman, former General Counsel. |
The following table presents all of the compensation awarded to or earned by or paid to our named executive officers during the fiscal years ended December 31, 2016 and 2017.
|
Name and Principal Position |
|
Year |
|
Salary |
|
|
Bonus(1) |
|
|
Stock Awards(2) |
|
All Other Compensation(3) |
|
Total |
|
|||||||||
|
Evan Spiegel |
|
2017 |
|
$ |
98,078 |
|
|
$ |
— |
|
|
$ |
636,612,889 |
|
(6) |
|
$ |
1,079,925 |
|
(8) |
|
$ |
637,790,892 |
|
|
Co-Founder and Chief Executive Officer |
|
2016 |
|
|
503,205 |
|
|
|
1,000,000 |
|
|
|
— |
|
|
|
|
901,635 |
|
|
|
|
2,404,840 |
|
|
Imran Khan |
|
2017 |
|
|
441,923 |
|
|
|
— |
|
|
100,061,275 |
|
(7) |
|
|
69,728 |
|
(9) |
|
|
100,572,926 |
|
|
|
Chief Strategy Officer |
|
2016 |
|
|
241,539 |
|
|
|
5,239,460 |
|
|
|
— |
|
|
|
|
14,658 |
|
|
|
|
5,495,657 |
|
|
Michael O’Sullivan(4) |
|
2017 |
|
|
201,923 |
|
|
|
200,000 |
|
|
|
16,343,006 |
|
|
|
|
8,894 |
|
|
|
|
16,753,823 |
|
|
General Counsel |
|
|
|
|
|
|
|
|
|
|
|
|
|
|
|
|
|
|
|
|
|
|
|
|
|
Chris Handman(5) |
|
2017 |
|
|
286,827 |
|
|
|
— |
|
|
|
53,803,861 |
|
|
|
|
326,457 |
|
(10) |
|
|
54,417,145 |
|
|
Former General Counsel |
|
|
|
|
|
|
|
|
|
|
|
|
|
|
|
|
|
|
|
|
|
|
|
|
|
(2) |
Amounts reported represent the aggregate grant date fair value of RSUs without regard to forfeitures granted to our named executive officers under our 2017 Plan or our 2014 Plan, computed in accordance with ASC Topic 718. The valuation assumptions used in calculating the fair value of the RSUs is set forth in “Management’s Discussion and Analysis of Financial Condition and Results of Operations—Critical Accounting Policies and Estimates—Stock-Based Compensation.” This amount does not reflect the actual economic value that may be realized by the named executive officer. |
|
(3) |
Amounts reported include 401(k) contributions, life insurance premiums, and membership fees for a concierge medical service paid by us on behalf of the named executive officer. |
|
(4) |
Mr. O’Sullivan joined us as General Counsel effective July 31, 2017. |
|
(5) |
Mr. Handman stepped down as General Counsel and ceased to be an employee effective August 1, 2017. Following August 1, 2017, Mr. Handman provided advisory services to us. |
|
(6) |
Amount reported represents a one-time performance award granted to Mr. Spiegel in connection with our initial public offering in March 2017. |
|
(7) |
Amount reported represents a one-time performance award granted to Mr. Khan in January 2017. The award vests over a period of eleven years from the grant date. |
104
|
(9) |
Amount reported includes (a) $55,386 in accrued vacation as of May 31, 2017, which amount was paid out as a result of our transition to a flexible vacation policy, (b) relocation expenses paid by us on behalf of Mr. Khan, and (c) tax “gross up” payments paid to Mr. Khan to cover the imputed income associated with the relocation expenses. |
|
(10) |
Amount reported includes (a) $58,463 in accrued vacation as of May 31, 2017, which amount was paid out as a result of our transition to a flexible vacation policy, (b) $10,000 for COBRA premiums paid by us on behalf of Mr. Handman, (c) $22,798 for travel expenses paid by us for Mr. Handman, and (d) $221,500 in advisor fees paid by us to Mr. Handman. |
Outstanding Equity Awards as of December 31, 2017
The following table presents information regarding outstanding equity awards held by our named executive officers as of December 31, 2017. Other than awards granted to Mr. Spiegel, all awards were granted under our 2012 Plan, 2014 Plan, or 2017 Plan, as noted below. None of our named executive officers held options as of December 31, 2017.
|
|
|
|
|
Stock Awards |
|
||||||
|
Name |
|
Grant Date |
|
Number of Shares or Units of Stock That Have Not Vested (#)(1) |
|
Market Value of Shares or Units of Stock That Have Not Vested ($)(2) |
|
||||
|
Evan Spiegel |
|
03/07/2017 |
|
|
— |
|
(3) |
|
|
— |
|
|
Imran Khan |
|
04/16/2015 |
|
4,493,084 |
|
(4)(5) |
|
|
65,643,957 |
|
|
|
|
|
01/27/2017 |
|
6,127,451 |
|
(6) |
|
|
89,522,059 |
|
|
|
Michael O’Sullivan |
|
09/08/2017 |
|
1,038,750 |
|
(4)(7) |
|
|
15,176,138 |
|
|
|
Chris Handman |
|
05/06/2014 |
|
383,334 |
|
(4)(8) |
|
|
5,600,510 |
|
|
|
|
|
04/16/2015 |
|
306,668 |
|
(4)(9) |
|
|
4,480,419 |
|
|
|
|
|
05/05/2017 |
|
2,204,126 |
|
(4)(10) |
|
|
31,210,424 |
|
|
|
(1) |
Except as indicated below, each of our named executive officers, other than Mr. Spiegel, holds RSUs that only vest and settle on the satisfaction of both (i) a service-based vesting condition and (ii) a performance condition. The performance condition was satisfied on the effective date of the registration statement in connection with our initial public offering in March 2017. The service-based vesting condition for each of our named executive officers is further described below. |
|
(2) |
The market price for our Class A common stock or Class B common stock, as applicable, is based on $14.61, our closing market price on December 29, 2017, as reported by The New York Stock Exchange. This value assumes that the fair market values of the Class B common stock and Class C common stock underlying the RSUs, which are not listed or approved for trading on or with any securities exchange or association, are equal to the fair market value of our Class A common stock. Each share of Class C common stock is convertible into one share of Class B common stock, and each share of Class B common stock is convertible into one share of Class A common stock, in each case at any time at the option of the holder or on certain transfers of such shares. |
|
(3) |
Mr. Spiegel was granted an award of RSUs for 34,447,817 shares of Class C common stock, as described in the section titled “—Employment, Severance, and Change in Control Agreements—Offer Letters—Evan Spiegel.” These RSUs were fully vested on the closing of our initial public offering and will be delivered to Mr. Spiegel in equal quarterly installments over three years beginning November 30, 2017. As of December 31, 2017, 3,120,651 shares underlying the RSUs had been delivered to Mr. Spiegel. This RSU grant was a one-time performance award granted to Mr. Spiegel in connection with our initial public offering in March 2017. |
|
(4) |
The unvested shares subject to these RSUs are subject to accelerated vesting as described in the section titled “—Employment, Severance, and Change in Control Agreements.” |
105
|
(6) |
These RSUs represent shares of Class A common stock granted under our 2014 Plan. The service-based condition was satisfied for no shares underlying the RSUs on December 31, 2017. The service-based condition will be satisfied as follows: 2.5% of the RSUs will have the service-based condition satisfied on April 16, 2018, and the remainder of the RSUs will have the service-based condition satisfied in 39 equal quarterly installments thereafter. This RSU grant does not have a performance condition. This RSU grant was a one-time performance award granted to Mr. Khan in January 2017. |
|
(7) |
These RSUs represent shares of Class A common stock granted under our 2017 Plan. The service-based condition was satisfied for 26,365 shares underlying the RSUs on December 31, 2017. The service-based condition will be satisfied as follows: 2.5% of the RSUs will have the service-based condition satisfied on each of February 15, 2018, May 15, 2018, and August 15, 2018, 20% of the RSUs will have the service-based condition satisfied in equal quarterly installments during the 12-month period following August 15, 2018, 30% of the RSUs will have the service-based condition satisfied in equal quarterly installments during the 12-month period following August 15, 2019, and 40% of the RSUs will have the service-based condition satisfied in equal quarterly installments during the 12-month period following August 15, 2020. This RSU grant does not have a performance condition. |
|
(8) |
These RSUs represent 191,667 shares of shares of Class A common stock and 191,667 shares of shares of Class B common stock granted under our 2012 Plan. The service-based condition was satisfied for 1,916,666 shares underlying the RSUs on December 31, 2017. The service-based condition will be satisfied as follows: 3.3% of the RSUs will have the service-based condition satisfied on each of January 1, 2018, February 1, 2018, March 1, 2018, April 1, 2018, and May 1, 2018. |
|
(9) |
These RSUs represent 153,334 shares of shares of Class A common stock and 153,334 shares of shares of Class B common stock granted under our 2014 Plan. The service-based condition was satisfied for 1,533,332 shares underlying the RSUs on December 31, 2017. The service-based condition will be satisfied as follows: 3.3% of the RSUs will have the service-based condition satisfied on each of January 1, 2018, February 1, 2018, March 1, 2018, April 1, 2018, and May 1, 2018. |
|
(10) |
These RSUs represent shares of Class A common stock granted under our 2017 Plan. The service-based condition was satisfied for 116,006 shares underlying the RSUs on December 31, 2017. The service-based condition will be satisfied as follows: 2.5% of the RSUs will have the service-based condition satisfied on February 15, 2018, and the remainder of the RSUs will have the service-based condition satisfied in 37 equal quarterly installments thereafter. This RSU grant does not have a performance condition. This RSU grant was a one-time performance award granted to Mr. Handman in May 2017. |
Emerging Growth Company Status
We are an “emerging growth company,” as defined in the JOBS Act. As an emerging growth company, we are exempt from certain requirements related to executive compensation, including the requirements to hold nonbinding advisory votes on executive compensation and to provide information relating to the ratio of total compensation of our Chief Executive Officer to the median of the annual total compensation of all of our employees, each as required by the Investor Protection and Securities Reform Act of 2010, which is part of the Dodd-Frank Act.
Hart-Scott-Rodino Antitrust Improvement Act of 1976 Filing Fees
The Hart-Scott-Rodino Antitrust Improvement Act of 1976, as amended, or the HSR Act, generally requires certain individuals who hold more than a certain amount of value in our stock to make a filing under the HSR Act, unless an exception applies. The net settlement of the first quarterly installment of the CEO award previously granted to Mr. Spiegel triggered an HSR Act filing requirement for both Mr. Spiegel and us. After deliberation, and in consideration of the fact that the filing was triggered by the CEO award that we had granted to Mr. Spiegel, the compensation committee of our board of directors approved our direct payment to the government of the HSR Act filing fee that otherwise would have been payable by Mr. Spiegel, including any associated legal fees payable by Mr. Spiegel as a result of the HSR Act filing. Additionally, we provided a tax “gross up” payment to Mr. Spiegel to cover the imputed income associated with this payment.
106
Our named executive officers did not participate in, or otherwise receive any benefits under, any pension or retirement plan sponsored by us during the fiscal year ended December 31, 2017.
Non-qualified Deferred Compensation
Our named executive officers did not participate in, or earn any benefits under, a non-qualified deferred compensation plan sponsored by us during the fiscal year ended December 31, 2017.
Employment, Severance, and Change in Control Agreements
Offer Letters
We have offer letters with each of our executive officers. The offer letters generally provide for at-will employment and set forth the executive officer’s initial base salary, eligibility for employee benefits, and confirmation of the terms of previously issued equity grants, including in some cases severance benefits on a qualifying termination of employment. If an executive officer dies, all outstanding RSUs will be deemed to satisfy the service-based vesting requirement. In addition, each of our named executive officers has executed our standard proprietary information and inventions agreement. The key terms of employment with our executive officers are described below.
Evan Spiegel
In October 2016, we entered into an amended and restated offer letter agreement with Evan Spiegel, our co-founder and Chief Executive Officer, with respect to his continuing employment with us. The offer letter provides for an annual base salary of $500,000, which was reduced to $1 on the effective date of the registration statement in connection with our initial public offering in March 2017, and an annual cash bonus of $1,000,000 based on achievement of performance criteria to be mutually agreed on by Mr. Spiegel and our board of directors. Mr. Spiegel waived any bonus for the period from July 31, 2016 through our initial public offering. Following our initial public offering, Mr. Spiegel is not entitled to any bonus except as may be determined by our board of directors. Under the terms of his offer letter, Mr. Spiegel was granted an award of RSUs for 34,447,817 shares of Class C common stock, which represented 3.0% of our outstanding capital stock on an as-converted basis on the closing of our initial public offering in March 2017. These RSUs were fully vested on the closing of our initial public offering and are being delivered to Mr. Spiegel in equal quarterly installments over three years beginning November 30, 2017. Our board of directors approved the award to Mr. Spiegel in July 2015 to motivate him to continue growing our business and improving our financial results so that we could undertake an initial public offering, which we regard as an important milestone that provided liquidity to our stockholders and employees.
Robert Murphy
In October 2016, we entered into an amended and restated offer letter agreement with Robert Murphy, our co-founder and Chief Technology Officer, with respect to his continuing employment with us. Mr. Murphy’s annual base salary as of December 31, 2017 was $250,000. Mr. Murphy’s salary was reduced to $1 in January 2018.
Imran Khan
In October 2016, we entered into an amended and restated offer letter agreement with Imran Khan, our Chief Strategy Officer, with respect to his continuing employment with us. Mr. Khan’s annual base salary as of December 31, 2017 was $450,000.
If Mr. Khan’s employment is terminated without cause or he terminates his employment for good reason, within 12 months following a change in control, then, with respect to the grant of RSUs made to Mr. Khan in 2015 only, in addition to the RSUs that have satisfied the service-based vesting requirement, an additional 50% of the then-outstanding RSUs will be deemed to satisfy the service-based vesting requirement. Mr. Khan must sign a release of claims agreement as a pre-condition of receiving this termination benefit.
107
In October 2016, we entered into an amended and restated offer letter agreement with Andrew Vollero, our Chief Financial Officer, with respect to his continuing employment with us. Mr. Vollero’s annual base salary as of December 31, 2017 was $450,000. Under the terms of his amended and restated offer letter, Mr. Vollero received an annual supplemental payment of $200,000 during the first two years of his employment.
If Mr. Vollero’s employment is terminated without cause or he terminates his employment for good reason, within 12 months following a change in control, then (a) with respect to the grant of RSUs made to Mr. Vollero in 2015 only, in addition to the RSUs that have satisfied the service-based vesting requirement, an additional 50% of the then-outstanding RSUs will be deemed to satisfy the service-based vesting requirement and (b) with respect to the grant of RSUs made to Mr. Vollero in 2017 only, the service-based vesting requirement will be deemed satisfied with respect to 1/16th of the RSUs for each completed quarter of service since the vesting commencement date. Mr. Vollero must sign a release of claims agreement as a pre-condition of receiving this termination benefit.
Michael O’Sullivan
In July 2017, we entered into an offer letter agreement with Michael O’Sullivan, our general counsel, with respect to his employment with us. Mr. O’Sullivan’s annual base salary as of December 31, 2017 was $500,000. Under the terms of his offer letter agreement, Mr. O’Sullivan received a one-time hiring bonus of $200,000.
If Mr. O’Sullivan’s employment is terminated without cause or he terminates his employment for good reason, within 12 months following a change in control, then the service-based vesting requirement will be deemed satisfied with respect to 1/16th of the RSUs for each completed quarter of service since the vesting commencement date. Mr. O’Sullivan must sign a release of claims agreement as a pre-condition of receiving this termination benefit.
Lara Sweet
In November 2017, we entered into an amended and restated offer letter agreement with Lara Sweet, our chief accounting officer, with respect to her continuing employment with us. Ms. Sweet’s annual base salary as of December 31, 2017 was $315,000.
If Ms. Sweet’s employment is terminated without cause or she terminates her employment for good reason, within 12 months following a change in control, then the service-based vesting requirement will be deemed satisfied with respect to 1/16th of the RSUs for each completed quarter of service since the vesting commencement date. Ms. Sweet must sign a release of claims agreement as a pre-condition of receiving this termination benefit.
Steven Horowitz
In October 2016, we entered into an amended and restated offer letter agreement with Steven Horowitz, our Vice President of Engineering. Mr. Horowitz’s annual base salary as of December 31, 2017 was $309,000.
Advisor Agreement
In July 2017, we entered into an advisor agreement with Chris Handman, our former general counsel. Mr. Handman’s monthly advisor fee as of December 31, 2017 was $55,500.
If Mr. Handman’s advisor agreement is terminated by us in the absence of a material breach by him of certain provisions of the agreement, then the service-based vesting requirement will be deemed satisfied with respect to all RSUs that were scheduled to vest through August 16, 2018.
Employee Benefit Plans
We believe that our ability to grant equity-based awards is a valuable and necessary compensation tool that aligns the long-term financial interests of our employees, consultants, and directors with the financial interests of our stockholders. In addition, we believe that our ability to grant options and other equity-based awards helps us to attract, retain, and motivate employees, consultants, and directors, and encourages them to devote their best efforts to our business and financial success. The principal features of our equity incentive plans and our 401(k) plan are summarized below. These summaries are qualified in their entirety by reference to the actual text of the plans.
108
Our board of directors adopted our 2017 Equity Incentive Plan, or our 2017 Plan, in January 2017, and our stockholders approved our 2017 Plan in February 2017. Our 2017 Plan became effective once the registration statement in connection with our initial public offering was declared effective. Our 2017 Plan provides for the grant of incentive stock options to employees, including employees of any parent or subsidiary, and for the grant of nonstatutory stock options, stock appreciation rights, restricted stock awards, restricted stock unit awards, performance stock awards, performance cash awards, and other forms of stock awards to employees, directors, and consultants, including employees and consultants of our affiliates. The 2017 Plan is the successor to our 2012 Equity Incentive Plan and 2014 Equity Incentive Plan, each of which is described below, or, together, the Prior Plans.
Authorized Shares. The maximum number of shares of our Class A common stock that may be issued under our 2017 Plan as of December 31, 2017 is 95,735,623. The number of shares of our Class A common stock reserved for issuance under our 2017 Plan will automatically increase on January 1st of each calendar year, starting on January 1, 2018 through January 1, 2027, in an amount equal to 5.0% of the total number of shares of our capital stock outstanding on the last day of the calendar month before the date of each automatic increase, or a lesser number of shares determined by our board of directors. The maximum number of shares of our Class A common stock that may be issued on the exercise of incentive stock options under our 2017 Plan is 287,206,869.
Shares subject to stock awards granted under our 2017 Plan that expire or terminate without being exercised in full, or that are paid out in cash rather than in shares, do not reduce the number of shares available for issuance under our 2017 Plan. Additionally, shares become available for future grant under our 2017 Plan if they were issued under stock awards under our 2017 Plan and if we repurchase them or they are forfeited. This includes shares used to pay the exercise price of a stock award or to satisfy the tax withholding obligations related to a stock award.
Corporate Transactions. Our 2017 Plan provides that in the event of certain specified significant corporate transactions, including: (1) a sale of all or substantially all of our assets, (2) the sale or disposition of more than 50% of our outstanding securities, (3) the consummation of a merger or consolidation where we do not survive the transaction, and (4) the consummation of a merger or consolidation where we do survive the transaction but the shares of our common stock outstanding before such transaction are converted or exchanged into other property by virtue of the transaction, unless otherwise provided in an award agreement or other written agreement between us and the award holder, the administrator may take one or more of the following actions with respect to such stock awards:
|
|
• |
arrange for the assumption, continuation, or substitution of a stock award by a successor corporation; |
|
|
• |
arrange for the assignment of any reacquisition or repurchase rights held by us to a successor corporation; |
|
|
• |
accelerate the vesting, in whole or in part, of the stock award and provide for its termination before the transaction; |
|
|
• |
arrange for the lapse, in whole or in part, of any reacquisition or repurchase rights held by us; |
|
|
• |
cancel or arrange for the cancellation of the stock award before the transaction in exchange for a cash payment, or no payment, as determined by the board; or |
|
|
• |
make a payment, in the form determined by our board of directors, equal to the excess, if any, of the value of the property the participant would have received on exercise of the awards before the transaction over any exercise price payable by the participant in connection with the exercise. |
The plan administrator is not obligated to treat all stock awards or portions of stock awards, even those that are of the same type, in the same manner and is not obligated to treat all participants in the same manner.
In the event of a change in control, awards granted under the 2017 Plan will not receive automatic acceleration of vesting and exercisability, although this treatment may be provided for in an award agreement. Under the 2017 Plan, a change in control is defined to include (1) the acquisition by any person or company of more than 50% of the combined voting power of our then outstanding stock, (2) a merger, consolidation, or similar transaction in which our stockholders immediately before the transaction do not own, directly or indirectly, more than 50% of the combined voting power of the surviving entity (or the parent of the surviving entity), (3) a sale, lease, exclusive license, or other disposition of all or substantially all of our assets other than to an entity more than 50% of the combined voting power of which is owned by our stockholders, and (4) an unapproved change in the majority of the board of directors.
109
Plan Amendment or Termination. Our board of directors has the authority to amend, suspend, or terminate our 2017 Plan, provided that such action does not materially impair the existing rights of any participant without such participant’s written consent. Certain material amendments also require the approval of our stockholders. No incentive stock options may be granted after the tenth anniversary of the date our board of directors adopted our 2017 Plan. No stock awards may be granted under our 2017 Plan while it is suspended or after it is terminated.
2014 Equity Incentive Plan
Our board of directors adopted, and our stockholders approved, our 2014 Equity Incentive Plan, or our 2014 Plan, in September 2014. Our 2014 Plan was amended most recently in October 2016. Our 2014 Plan allows for the grant of incentive stock options to employees, including employees of any parent or subsidiary, and for the grant of nonstatutory stock options, stock appreciation rights, restricted stock awards, and restricted stock units to employees, directors, and consultants, including employees and consultants of our affiliates.
Our 2017 Plan became effective on the execution of the underwriting agreement related to our initial public offering. As a result, we do not expect to grant any additional awards under the 2014 Plan following that date, other than awards for up to 2,500,000 shares of Class A common stock to our employees and consultants in France. Any awards granted under the 2014 Plan will remain subject to the terms of our 2014 Plan and applicable award agreements.
Authorized Shares. The maximum number of shares of our Class A common stock that may be issued under our 2014 Plan is 166,164,100, minus the number of shares of our Class B common stock issued after September 4, 2014 under our 2012 Plan. In addition to the share reserve, an additional 53,357,397 shares of Class A common stock are reserved under the 2014 Plan in connection with the Class A Dividend, one share of which will be issued if and when a share from the share reserve is issued in connection with the settlement or exercise of a stock award that was outstanding as of October 31, 2016. The maximum number of shares of Class A common stock that may be issued on the exercise of incentive stock options under our 2014 Plan is three times such maximum number of shares. Shares subject to stock awards granted under our 2014 Plan that expire, are forfeited, or terminate without being exercised in full or are settled in cash do not reduce the number of shares available for issuance under our 2014 Plan. Additionally, shares used to pay the exercise price of a stock award or to satisfy the tax withholding obligations related to a stock award become available for future grant under our 2014 Plan, although such shares may not be subsequently issued pursuant to the exercise of an incentive stock option.
Corporate Transactions. Our 2014 Plan provides that in the event of certain specified significant corporate transactions, generally including: (1) a sale of all or substantially all of our assets, (2) the sale or disposition of at least 90% of our outstanding securities, (3) the consummation of a merger or consolidation where we do not survive the transaction, and (4) the consummation of a merger or consolidation where we do survive the transaction but the shares of common stock outstanding before such transaction are converted or exchanged into other property by virtue of the transaction, unless otherwise provided in an award agreement or other written agreement between us and the award holder, the administrator may take one or more of the following actions with respect to such stock awards: (1) arrange for the assumption, continuation or substitution of a stock award by a successor corporation, (2) arrange for the assignment of any reacquisition or repurchase rights held by us to a successor corporation, (3) accelerate the vesting, in whole or in part, of the stock award and provide for its termination before the transaction, (4) arrange for the lapse, in whole or in part, of any reacquisition or repurchase rights held by us, (5) cancel or arrange for the cancellation of the stock award before the transaction in exchange for a cash payment, if any, determined by the board of directors, or (6) make a payment, in the form determined by the board of directors, equal to the excess, if any, of the value of the property the participant would have received on exercise of the stock award before the transaction over any exercise price payable by the participant in connection with the exercise. The plan administrator is not obligated to treat all stock awards, even those that are of the same type, or all participants, in the same manner.
In the event of a change in control, awards granted under the 2014 Plan will not receive automatic acceleration of vesting and exercisability, although the board of directors may provide for this treatment in an award agreement. Under the 2014 Plan, a change in control is defined to include (1) the acquisition by any person of more than 50% of the combined voting power of our then outstanding stock, (2) a merger, consolidation, or similar transaction in which our stockholders immediately before the transaction do not own, directly or indirectly, more than 50% of the combined voting power of the surviving entity (or the parent of the surviving entity), (3) our stockholders approve or our board of directors approves a plan of complete dissolution or liquidation or a complete dissolution or liquidation otherwise occurs except for a liquidation into a parent corporation, and (4) a sale, lease, exclusive license, or other disposition of all or substantially all of the assets to an entity that did not previously hold more than 50% of the voting power of our stock.
110
Plan Amendment or Termination. Our board of directors has the authority to amend, suspend, or terminate our 2014 Plan, although certain material amendments require the approval of our stockholders, and amendments that would impair the rights of any participant require the consent of that participant.
2012 Equity Incentive Plan
Our board of directors adopted our 2012 Equity Incentive Plan, or our 2012 Plan, in May 2012, and our stockholders approved our 2012 Plan in August 2012. Our 2012 Plan was amended most recently in October 2016. Our 2012 Plan allows for the grant of incentive stock options to employees, including employees of any parent or subsidiary, and for the grant of nonstatutory stock options, stock appreciation rights, restricted stock awards, and restricted stock units to our employees, directors, and consultants, including employees and consultants of our affiliates.
Our 2017 Plan became effective once the registration statement in connection with our initial public offering was declared effective. As a result, we do not expect to grant any additional awards under the 2012 Plan following that date. Any awards granted under the 2012 Plan will remain subject to the terms of our 2012 Plan and applicable award agreements.
Authorized Shares. The maximum number of shares of our Class B common stock that may be issued under our 2012 Plan is 91,292,140, minus the number of shares of our Class A common stock issued after September 4, 2014 under our 2014 Plan. In addition to the share reserve, an additional 50,022,362 shares of Class A common stock are reserved under the 2012 Plan in connection with the Class A Dividend, one share of which will be issued if and when a share from the share reserve is issued in connection with the settlement or exercise of a stock award that was outstanding as of October 31, 2016. The maximum number of shares of Class B common stock that may be issued on the exercise of incentive stock options under our 2012 Plan is such maximum number of shares. Shares subject to stock awards granted under our 2012 Plan that expire, are forfeited, or terminate without being exercised in full or are settled in cash do not reduce the number of shares available for issuance under our 2012 Plan. Additionally, shares used to pay the exercise price of a stock award or to satisfy the tax withholding obligations related to a stock award become available for future grant under our 2012 Plan, although such shares may not be subsequently issued pursuant to the exercise of an incentive stock option.
Corporate Transactions. Our 2012 Plan provides that in the event of certain specified significant corporate transactions, generally including: (1) a sale of all or substantially all of our assets, (2) the sale or disposition of at least 90% of our outstanding securities, (3) the consummation of a merger or consolidation where we do not survive the transaction, and (4) the consummation of a merger or consolidation where we do survive the transaction but the shares of common stock outstanding before such transaction are converted or exchanged into other property by virtue of the transaction, unless otherwise provided in an award agreement or other written agreement between us and the award holder, the administrator may take one or more of the following actions with respect to such stock awards: (1) arrange for the assumption, continuation, or substitution of a stock award by a successor corporation, (2) arrange for the assignment of any reacquisition or repurchase rights held by us to a successor corporation, (3) accelerate the vesting, in whole or in part, of the stock award and provide for its termination before the transaction, (4) arrange for the lapse, in whole or in part, of any reacquisition or repurchase rights held by us, (5) cancel or arrange for the cancellation of the stock award before the transaction in exchange for a cash payment, if any, determined by the board of directors, or (6) make a payment, in the form determined by the board of directors, equal to the excess, if any, of the value of the property the participant would have received on exercise of the stock award before the transaction over any exercise price payable by the participant in connection with the exercise. The plan administrator is not obligated to treat all stock awards, even those that are of the same type, or all participants, in the same manner.
In the event of a change in control, awards granted under the 2012 Plan will not receive automatic acceleration of vesting and exercisability, although the board of directors may provide for this treatment in an award agreement. Under the 2012 Plan, a change in control is defined to include (1) the acquisition by any person of more than 50% of the combined voting power of our then outstanding stock, (2) a merger, consolidation, or similar transaction in which our stockholders immediately before the transaction do not own, directly or indirectly, more than 50% of the combined voting power of the surviving entity (or the parent of the surviving entity), (3) our stockholders approve or our board of directors approves a plan of complete dissolution or liquidation or a complete dissolution or liquidation otherwise occurs except for a liquidation into a parent corporation, and (4) a sale, lease, exclusive license, or other disposition of all or substantially all of the assets to an entity that did not previously hold more than 50% of the voting power of our stock.
Plan Amendment or Termination. Our board of directors has the authority to amend, suspend, or terminate our 2012 Plan, although certain material amendments require the approval of our stockholders, and amendments that would impair the rights of any participant require the consent of that participant.
111
2017 Employee Stock Purchase Plan
Our board of directors adopted our 2017 Employee Stock Purchase Plan, or ESPP, in January 2017 and our stockholders approved our ESPP in February 2017. Our ESPP became effective when the registration statement in connection with our initial public offering was declared effective. The purpose of the ESPP is to secure the services of new employees, to retain the services of existing employees, and to provide incentives for such individuals to exert maximum efforts toward our success and that of our affiliates. The ESPP is intended to qualify as an “employee stock purchase plan” within the meaning of Section 423 of the Code for U.S. employees. In addition, the ESPP authorizes grants of purchase rights that do not comply with Section 423 of the Code under a separate non-423 component. In particular, where such purchase rights are granted to employees who are foreign nationals or employed or located outside the United States, our board of directors may adopt rules that are beyond the scope of Section 423 of the Code.
Share Reserve. The ESPP authorizes the issuance of 16,484,690 shares of our Class A common stock under purchase rights granted to our employees or to employees of any of our designated affiliates. The number of shares of our Class A common stock reserved for issuance will automatically increase on January 1st of each calendar year, beginning on January 1, 2018 through January 1, 2027, by the lesser of (1) 1.0% of the total number of shares of our common stock outstanding on the last day of the calendar month before the date of the automatic increase, and (2) 15,000,000 shares; provided that before the date of any such increase, our board of directors may determine that such increase will be less than the amount set forth in clauses (1) and (2). As of December 31, 2017, no shares of our Class A common stock have been purchased under the ESPP.
Corporate Transactions. In the event of certain significant corporate transactions, including: (1) a sale of all or substantially all of our assets, (2) the sale or disposition of 90% of our outstanding securities, (3) the consummation of a merger or consolidation where we do not survive the transaction, and (4) the consummation of a merger or consolidation where we do survive the transaction but the shares of our common stock outstanding immediately before such transaction are converted or exchanged into other property by virtue of the transaction, any then-outstanding rights to purchase our stock under the ESPP may be assumed, continued, or substituted for by any surviving or acquiring entity (or its parent company). If the surviving or acquiring entity (or its parent company) elects not to assume, continue, or substitute for such purchase rights, then the participants’ accumulated payroll contributions will be used to purchase shares of our common stock within ten business days before such corporate transaction, and such purchase rights will terminate immediately.
ESPP Amendment or Termination. Our board of directors has the authority to amend or terminate our ESPP, provided that except in certain circumstances such amendment or termination may not materially impair any outstanding purchase rights without the holder’s consent. We will obtain stockholder approval of any amendment to our ESPP as required by applicable law or listing requirements.
401(k) Plan and Similar Plans
We maintain a safe harbor 401(k) plan that provides eligible U.S. employees with an opportunity to save for retirement on a tax advantaged basis. Eligible employees are able to defer eligible compensation up to certain Code limits, which are updated annually. We have the ability to make matching and discretionary contributions to the 401(k) plan. Currently, we make a match of each participant’s contribution up to a maximum of 3% of the participant’s base salary, bonus, and commissions paid during the period, and we make match of 50% of each participant’s contribution between 3% and 5% of the participant’s base salary, bonus, and commissions paid during the period. Contributions are allocated to each participant’s individual account and are then invested in selected investment alternatives according to the participants’ directions. Employees are immediately and fully vested in their own contributions and our contributions. The 401(k) plan is intended to be qualified under Section 401(a) of the Code, with the related trust intended to be tax exempt under Section 501(a) of the Code. As a tax-qualified retirement plan, contributions to the 401(k) plan are deductible by us when made, and contributions and earnings on those amounts are not taxable to the employees until withdrawn or distributed from the 401(k) plan.
Similar plans outside the United States, some of which are government mandated, cover employees of certain of our international subsidiaries. Several of these plans allow us to match, on a voluntary basis, a portion of the employee contributions.
112
Limitations on Liability and Indemnification Matters
Our amended and restated certificate of incorporation contains provisions that limit the liability of our current and former directors for monetary damages to the fullest extent permitted by Delaware law. Delaware law provides that directors of a corporation will not be personally liable for monetary damages for any breach of fiduciary duties as directors, except liability for:
|
|
• |
any breach of the director’s duty of loyalty to the corporation or its stockholders; |
|
|
• |
any act or omission not in good faith or that involves intentional misconduct or a knowing violation of law; |
|
|
• |
unlawful payments of dividends or unlawful stock repurchases or redemptions; or |
|
|
• |
any transaction from which the director derived an improper personal benefit. |
Such limitation of liability does not apply to liabilities arising under federal securities laws and does not affect the availability of equitable remedies such as injunctive relief or rescission.
Our amended and restated certificate of incorporation authorizes us to indemnify our directors, officers, employees, and other agents to the fullest extent permitted by Delaware law. Our amended and restated bylaws provide that we are required to indemnify our directors and officers to the fullest extent permitted by Delaware law and may indemnify our other employees and agents. Our amended and restated bylaws also provide that, on satisfaction of certain conditions, we will advance expenses incurred by a director or officer in advance of the final disposition of any action or proceeding, and permit us to secure insurance on behalf of any officer, director, employee, or other agent for any liability arising out of his or her actions in that capacity regardless of whether we would otherwise be permitted to indemnify him or her under the provisions of Delaware law. We have entered and expect to continue to enter into agreements to indemnify our directors, executive officers, and other employees as determined by the board of directors. With certain exceptions, these agreements provide for indemnification for related expenses including attorneys’ fees, judgments, fines, and settlement amounts incurred by any of these individuals in any action or proceeding. We believe that these amended and restated certificate of incorporation and amended and restated bylaw provisions and indemnification agreements are necessary to attract and retain qualified persons as directors and officers. We also maintain customary directors’ and officers’ liability insurance.
The limitation of liability and indemnification provisions in our amended and restated certificate of incorporation and amended and restated bylaws may discourage stockholders from bringing a lawsuit against our directors for breach of their fiduciary duty. They may also reduce the likelihood of derivative litigation against our directors and officers, even though an action, if successful, might benefit us and other stockholders. Further, a stockholder’s investment may be adversely affected to the extent that we pay the costs of settlement and damage awards against directors and officers as required by these indemnification provisions.
Insofar as indemnification for liabilities arising under the Securities Act may be permitted for directors, executive officers, or persons controlling us, we have been informed that, in the opinion of the SEC, such indemnification is against public policy as expressed in the Securities Act and is therefore unenforceable.
Rule 10b5-1 Sales Plans
Our directors and officers may adopt written plans, known as Rule 10b5-1 plans, in which they will contract with a broker to buy or sell shares of our Class A common stock, Class B common stock, or Class C common stock on a periodic basis. Under a Rule 10b5-1 plan, a broker executes trades under parameters established by the director or officer when entering into the plan, without further direction from them. The director or officer may amend a Rule 10b5-1 plan in some circumstances and may terminate a plan at any time. Our directors and executive officers may also buy or sell additional shares outside of a Rule 10b5-1 plan when they do not possess of material nonpublic information, subject to compliance with the terms of our insider trading policy.
113
The following table sets forth information concerning the compensation paid to our directors who are not named executive officers during the fiscal year ended December 31, 2017. The compensation received by Mr. Spiegel as an employee of the company is presented in “Executive Compensation—Summary Compensation Table.” Except as set forth in the footnotes below, Ms. Coles, Mr. Lafley, Mr. Meresman, Mr. Miller, and Mr. Young hold RSUs that vest and are settled on the satisfaction of both (i) a service-based vesting condition and (ii) a performance condition. The performance condition was satisfied on the effective date of the registration statement for our initial public offering. The service-based vesting requirement for each of Ms. Coles, Mr. Lafley, Mr. Meresman, Mr. Miller, and Mr. Young are further described below. Except as described in the footnotes to the table below, we do not generally provide cash compensation to our non-employee directors.
|
Name |
|
Stock Awards(1) |
|
|
Other |
|
|
Total |
|
|||
|
Michael Lynton |
|
$ |
— |
|
|
$ |
— |
|
|
$ |
— |
|
|
Joanna Coles(2) |
|
|
861,179 |
|
|
|
35,000 |
|
|
|
896,179 |
|
|
A.G. Lafley(3) |
|
|
— |
|
|
|
200,000 |
|
|
|
200,000 |
|
|
Mitchell Lasky |
|
|
— |
|
|
|
— |
|
|
|
— |
|
|
Stanley Meresman(4) |
|
|
— |
|
|
|
— |
|
|
|
— |
|
|
Scott D. Miller(5) |
|
|
— |
|
|
|
35,000 |
|
|
|
35,000 |
|
|
Robert Murphy(6) |
|
|
— |
|
|
|
302,247 |
|
|
|
302,247 |
|
|
Christopher Young(7) |
|
|
— |
|
|
|
35,000 |
|
|
|
35,000 |
|
|
(1) |
Amounts reported represent the aggregate grant date fair value of RSUs without regard to forfeitures granted to the non-employee members of our board of directors during 2017 under our 2014 Plan, computed in accordance with ASC Topic 718. The valuation assumptions used in calculating the fair value of the RSUs is set forth in “Management’s Discussion and Analysis of Financial Condition and Results of Operations—Critical Accounting Policies and Estimates—Stock-Based Compensation.” These amounts do not reflect the actual economic value that may be realized by the director. |
|
(2) |
Ms. Coles joined our board of directors in December 2015. In connection with Ms. Coles’ service on our board of directors, we agreed to pay her a $35,000 annual cash retainer, paid on a quarterly basis after completion of each full quarter. In January 2017, we granted Ms. Coles RSUs for 52,736 shares of Class A common stock under our 2014 Plan and 35,158 of these RSUs were outstanding on December 31, 2017. This grant includes only a service-based vesting condition, which will be satisfied as follows: 16.67% of the RSUs vested on June 4, 2017, and 83.33% of the RSUs vest in equal monthly installments during the 30-month period following June 4, 2017. In the event of a change in control, the RSUs will vest in full immediately before the closing of such change in control. |
|
(3) |
Mr. Lafley joined our board of directors in July 2016. In connection with Mr. Lafley’s service on our board of directors, we agreed to pay him a $200,000 annual cash retainer to cover the costs of his travel to our meetings and events, paid on a quarterly basis after completion of each full quarter. In July 2016, we granted Mr. Lafley RSUs for 162,762 shares of Class A common stock under our 2014 Plan and 105,118 of these RSUs were outstanding on December 31, 2017. The service-based vesting condition will be satisfied in equal monthly installments over four years of service commencing on July 15, 2016. In the event of a change in control, the service-based vesting condition of the RSUs will be deemed satisfied for 100% of the RSUs that have not yet satisfied the service-based vesting requirement, immediately before the closing of such change in control. |
|
(4) |
Mr. Meresman joined our board of directors in July 2015. In July 2015, we granted Mr. Meresman RSUs for 162,762 shares of Class A common stock under our 2014 Plan and 71,210 of these RSUs were outstanding as of December 31, 2017. The service-based vesting condition will be satisfied in equal quarterly installments over four years of service commencing on July 17, 2015. In the event of a change in control, the service-based vesting condition of the RSUs will be deemed satisfied for 100% of the RSUs that have not yet satisfied the service-based vesting condition, immediately before the closing of such change in control. |
|
(5) |
Mr. Miller joined our board of directors in October 2016. In connection with Mr. Miller’s service on our board of directors, we agreed to pay him a $35,000 annual cash retainer, paid on a quarterly basis after completion of each full quarter. In October 2016, we granted Mr. Miller RSUs for 65,106 shares of Class A common stock under our 2014 Plan and 46,118 of these RSUS were outstanding as of December 31, 2017. The service-based vesting condition will be satisfied in equal monthly installments over four years of service commencing on October 26, 2016. In the event of a change in control, the service-based vesting condition of the RSUs will be deemed satisfied for 100% of the RSUs that have not yet satisfied the service-based vesting condition, immediately before the closing of such change in control. |
114
|
service paid by us on behalf of Mr. Murphy, and (v) $40,546 in accrued vacation as of May 31, 2017, which amount was paid out as a result of our transition to a flexible vacation policy. Mr. Murphy’s salary was reduced to $1 in January 2018. |
|
(7) |
Mr. Young joined our board of directors in October 2016. In connection with Mr. Young’s service on our board of directors, we agreed to pay him a $35,000 annual cash retainer, paid on a quarterly basis after completion of each full quarter. In October 2016, we granted Mr. Young RSUs for 65,106 shares of Class A common stock under our 2014 Plan and 46,118 of these RSUS were outstanding as of December 31, 2017. The service-based vesting condition will be satisfied in equal monthly installments over four years of service commencing on October 26, 2016. In the event of a change in control, the service-based vesting condition of the RSUs will be deemed satisfied for 100% of the RSUs that have not yet satisfied the service-based vesting condition, immediately before the closing of such change in control. |
Non-Employee Director Compensation Policy
The compensation committee of our board of directors is responsible for reviewing and recommending to our board of directors the compensation policy for our non-employee directors. At the recommendation of our compensation committee, our board of directors adopted a non-employee director compensation policy under which our non-employee directors will receive an annual retainer for service on our board of directors, to be effective at our 2018 annual meeting of stockholders. An additional retainer will also be provided to individuals who serve as chair of a committee or the board of directors.
We also currently reimburse our directors for their reasonable out-of-pocket expenses in connection with attending board of directors and committee meetings, other than Mr. Lafley, whose travel expense retainer is described above.
Effective on our 2018 annual meeting of stockholders, our non-employee director compensation policy provides that each non-employee director will receive the following compensation for board of directors and committee services:
|
|
• |
an annual retainer for board of director membership of $75,000, paid in cash; |
|
|
• |
an annual retainer of $75,000 for chairing the board of directors, paid in cash; |
|
|
• |
an annual retainer of $25,000 for chairing the audit committee, $20,000 for chairing the compensation committee, and $10,000 for chairing the nominating and corporate governance committee, each paid in cash; and |
|
|
• |
an annual grant of equity with a fair market value as of the date of grant of $250,000, comprised of 50% in RSUs vesting after one year, and 50% in stock options vesting after one year. |
All annual cash retainers will be paid quarterly in arrears. Additionally, in the event of a change to the designated chair for a committee, the annual cash retainer for chairing such committee will be prorated based on the number of days the chair held the position. The annual grants of equity described above will be subject to pro-rata acceleration on a director’s discontinued service on our board of directors and automatic full acceleration in the event of a change in control, as defined in the 2017 Plan.
Non-employee directors are also encouraged to accumulate stock ownership equal in value to five times the annual retainer for board of director membership within the later of five years from the effective date of the non-employee director compensation policy or each non-employee director’s initial election to serve on the board of directors. Previously owned and vested stock and shares held in trust for the benefit of the non-employee director or his or her immediate family members are counted for purposes of determining stock ownership.
Compensation Committee Interlocks and Insider Participation
None of the members of the compensation committee is currently, or has been at any time, one of our officers or employees. None of our executive officers currently serves, or has served during the last year, as a member of the board of directors or compensation committee of any entity that has one or more executive officers serving as a member of our board of directors or compensation committee.
115
Item 12. Security Ownership of Certain Beneficial Owners and Management and Related Stockholder Matters
The following table sets forth information with respect to the beneficial ownership of our shares as of December 31, 2017 by:
|
|
• |
each named executive officer; |
|
|
• |
each of our directors; |
|
|
• |
our directors and executive officers as a group; and |
|
|
• |
each person or entity known by us to own beneficially more than 5% of our Class B common stock and Class C common stock (by number or by voting power). |
Because our Class A common stock is non-voting, significant holders of our Class A common stock are exempt from the obligation to file reports under Sections 13(d), 13(g), and 16 of the Exchange Act. These provisions generally require significant stockholders to publicly report their ownership, including changes in that ownership. As a result, those stockholders and we are not obligated to disclose ownership of our Class A common stock, so there can be no assurance that you, or we, will be notified of such ownership or changes in such ownership.
We have determined beneficial ownership in accordance with the rules and regulations of the SEC, and the information is not necessarily indicative of beneficial ownership for any other purpose. Except as indicated by the footnotes below, we believe, based on information furnished to us, that the persons and entities named in the table below have sole voting and sole investment power with respect to all shares that they beneficially own, subject to applicable community property laws.
Applicable percentage ownership is based on 122,563,920 shares of Class B common stock and 216,615,870 shares of Class C common stock outstanding as of December 31, 2017. In computing the number of shares beneficially owned by a person and the percentage ownership of such person, we deemed to be outstanding all shares subject to options and RSUs held by the person that are currently exercisable, or exercisable or would vest based on service-based vesting conditions within 60 days of December 31, 2017. However, except as described above, we did not deem such shares outstanding for the purpose of computing the percentage ownership of any other person.
Unless otherwise indicated, the address for each beneficial owner listed in the table below is c/o Snap Inc., 63 Market Street, Venice, CA 90291.
|
|
|
Class B Common Stock |
|
|
Class C Common Stock |
|
|
% of Total Voting Power |
|
|||||||||||
|
Name of Beneficial Owner |
|
Shares |
|
|
% |
|
|
Shares |
|
|
% |
|
|
|
|
|
||||
|
Directors and Named Executive Officers: |
|
|
|
|
|
|
|
|
|
|
|
|
|
|
|
|
|
|
|
|
|
Evan Spiegel(1) |
|
|
5,862,410 |
|
|
|
4.8 |
|
|
|
111,792,597 |
|
|
|
50.9 |
|
|
|
48.4 |
|
|
Robert Murphy(2) |
|
|
5,862,410 |
|
|
|
4.8 |
|
|
|
107,943,924 |
|
|
|
49.8 |
|
|
|
47.4 |
|
|
Imran Khan |
|
|
— |
|
|
* |
|
|
|
— |
|
|
* |
|
|
* |
|
|||
|
Michael O’Sullivan |
|
|
— |
|
|
* |
|
|
|
— |
|
|
* |
|
|
* |
|
|||
|
Chris Handman(3) |
|
|
702,735 |
|
|
* |
|
|
|
— |
|
|
* |
|
|
* |
|
|||
|
Michael Lynton |
|
|
— |
|
|
* |
|
|
|
— |
|
|
* |
|
|
* |
|
|||
|
Joanna Coles |
|
|
— |
|
|
* |
|
|
|
— |
|
|
* |
|
|
* |
|
|||
|
A.G. Lafley |
|
|
— |
|
|
* |
|
|
|
— |
|
|
* |
|
|
* |
|
|||
|
Mitchell Lasky(4) |
|
|
65,799,720 |
|
|
|
53.7 |
|
|
|
— |
|
|
* |
|
|
|
2.9 |
|
|
|
Stanley Meresman |
|
|
— |
|
|
* |
|
|
|
— |
|
|
* |
|
|
* |
|
|||
|
Scott D. Miller |
|
|
— |
|
|
* |
|
|
|
— |
|
|
* |
|
|
* |
|
|||
|
Christopher Young |
|
|
— |
|
|
* |
|
|
|
— |
|
|
* |
|
|
* |
|
|||
|
All directors and executive officers as a group (15 persons)(5) |
|
|
79,006,355 |
|
|
|
64.5 |
|
|
|
250,943,036 |
|
|
|
100.0 |
|
|
|
98.3 |
|
|
5% Stockholders: |
|
|
|
|
|
|
|
|
|
|
|
|
|
|
|
|
|
|
|
|
|
Benchmark Capital Partners VII, L.P.(4) |
|
|
65,799,720 |
|
|
|
53.7 |
|
|
|
— |
|
|
* |
|
|
|
2.9 |
|
|
|
* |
Represents beneficial ownership of less than 1%. |
116
|
(2) |
Consists of 5,862,410 shares of Class B common stock held in trust for which Mr. Murphy is trustee and holds voting and dispositive power, and 107,943,924 shares of Class C common stock held by Mr. Murphy individually. |
|
(3) |
Consists of 495,735 shares of Class B common stock held by Mr. Handman individually. Mr. Handman holds RSUs for 207,000 shares of Class B common stock, for which the service-based vesting condition would be satisfied within 60 days of December 31, 2017. |
|
(4) |
Consists of (i) 52,294,720 shares of Class B common stock held by Benchmark Capital Partners VII, L.P. (“BCP VII”), (ii) 5,807,780 shares of Class B Common Stock held by Benchmark Founders’ Fund VII, L.P. (“BFF VII”), and (iii) 7,697,220 shares of Class B Common Stock held by Benchmark Founders’ Fund VII-B, L.P. (“BFF VII-B”). Benchmark Capital Management Co. VII, L.L.C., the general partner of BCP VII, BFF VII, and BFF VII-B, may be deemed to have sole power to vote these shares, and Matthew R. Cohler, Bruce W. Dunlevie, Peter H. Fenton, J. William Gurley, Kevin R. Harvey, Mr. Lasky, Steven M. Spurlock, and Erica Vishria, the managing members of Benchmark Capital Management Co. VII, L.L.C., may be deemed to have shared power to vote these shares. Benchmark Capital Partners VII, L.P. owns 53.7% of our outstanding Class B common stock and has 2.9% of the total voting power. The address for BCP VII, BFF VII, and BFF VII-B is 2965 Woodside Road, Woodside, CA 94062. This information is based on a Schedule 13G filed with the SEC by BCP VII on February 5, 2018. |
|
(5) |
Consists of (i) 79,006,355 shares of Class B common stock, (ii) 216,615,870 shares of Class C common stock held by our current directors and executive officers, (iii) RSUs for 465,978 shares of Class B common stock, for which the service-based vesting condition would be satisfied within 60 days of December 31, 2017, and (iv) RSUs for 34,327,166 shares of Class C common stock that are fully vested and will be settled to shares which will be delivered in equal quarterly installments over three years beginning in November 2017. |
Securities Authorized for Issuance under Equity Incentive Plans
The table set forth below provides information concerning the awards that may be issued under our 2012 Plan, 2014 Plan, and 2017 Plan as of December 31, 2017:
|
Plan Category |
|
Number of securities to be issued upon exercise of outstanding options, warrants and rights (a) |
|
|
Weighted-average exercise price of outstanding options, warrants and rights(1) (b) |
|
|
Number of securities remaining available for issuance under equity compensation plans (excluding securities reflected in column (a)) (c) |
|
|||
|
Equity compensation plans approved by security holders(2) |
|
|
195,875,617 |
|
|
$ |
4.16 |
|
|
$ |
95,735,623 |
|
|
Equity compensation plans not approved by security holders(3) |
|
|
34,844,012 |
|
|
$ |
0.63 |
|
|
N/A |
|
|
|
Total |
|
|
230,719,629 |
|
|
$ |
4.10 |
|
|
$ |
95,735,623 |
|
|
(1) |
The weighted-average exercise price does not reflect that shares that will be issued in connection with the settlement of RSUs, since RSUs have no exercise price. |
|
(2) |
Prior to our initial public offering, we granted awards under our 2012 Plan and our 2014 Plan. Following our initial public offering, we granted awards under our 2017 Plan, other than awards to our employees and consultants in France, which were granted under our 2014 Plan. |
|
(3) |
Consists of (a) 34,327,166 shares of Class C common stock issuable upon settlement of the CEO award granted to Mr. Spiegel and (b) 516,846 shares of Class A common stock issuable upon exercise of assumed options from Placed, Inc.’s 2011 Equity Incentive Plan, as amended, which options we assumed in connection with our acquisition of Placed, Inc. |
117
Item 13. Certain Relationships and Related Transactions, and Director Independence
Other than compensation arrangements for our directors and executive officers, which are described elsewhere in this Annual Report on Form 10-K, below we describe transactions since January 1, 2017 to which we were a party or will be a party, in which:
|
|
• |
the amounts involved exceeded or will exceed $120,000; and |
|
|
• |
any of our directors, executive officers, or holders of more than 5% of our capital stock, or any member of the immediate family of, or person sharing the household with, the foregoing persons, had or will have a direct or indirect material interest. |
Investor Rights Agreement
In November 2013, we entered into an amended and restated investor rights agreement, or IRA, which was amended in October 2016, with our founders and certain holders of our preferred stock, including Lynton Asset LP and entities affiliated with Benchmark Capital Partners and Lightspeed Venture Partners, with certain registration rights, including the right to demand that we file a registration statement or request that their shares be covered by a registration statement that we are otherwise filing. Michael Lynton and Mitchell Lasky, members of our board of directors, are affiliated with Lynton Asset LP and Benchmark Capital Partners, respectively. The holders of up to an aggregate of 485,054,352 shares of our Class A common stock (including shares issuable on conversion of Class B common stock and Class C common stock) are entitled to rights with respect to the registration of their shares of Class B common stock or Class C common stock, respectively, under the Securities Act under this agreement.
Munger, Tolles & Olson LLP Services
We have in the past engaged the law firm Munger, Tolles & Olson LLP, or Munger, to provide certain legal services to us, and may do so in the future. Mr. Spiegel’s father, John Spiegel, is a partner at Munger, although John Spiegel has not personally provided any material legal services to us. We paid Munger $14,241.63 on behalf of Mr. Spiegel for legal fees incurred by him in connection with the HSR Act filings, as described in described in “Executive Compensation—Hart-Scott-Rodino Antitrust Improvement Act of 1976 Filing Fees.”
Our general counsel, Michael O’Sullivan, is a former attorney at Munger.
Indemnification Agreements
Our amended and restated certificate of incorporation contains provisions limiting the liability of directors, and our amended and restated bylaws provide that we will indemnify each of our directors and officers to the fullest extent permitted under Delaware law. Our amended and restated certificate of incorporation and amended and restated bylaws also provide our board of directors with discretion to indemnify our employees and other agents when determined appropriate by the board. In addition, we have entered into an indemnification agreement with each of our directors and executive officers, which requires us to indemnify them.
Policies and Procedures for Transactions with Related Persons
In July 2016, we entered into a policy that our executive officers, directors, nominees for election as a director, beneficial owners of more than 5% of any class of our common stock, and any members of the immediate family of any of the foregoing persons are not permitted to enter into a related person transaction with us without the approval or ratification of our board of directors or our audit committee. Any request for us to enter into a transaction with an executive officer, director, nominee for election as a director, beneficial owner of more than 5% of any class of our common stock, or any member of the immediate family of any of the foregoing persons, in which the amount involved exceeds $50,000 and such person would have a direct or indirect interest, must be presented to our board of directors or our audit committee for review, consideration, and approval. In approving or rejecting any such proposal, our board of directors or our audit committee is to consider the material facts of the transaction, including whether the transaction is on terms no less favorable than terms generally available to an unaffiliated third party under the same or similar circumstances and the extent of the related person’s interest in the transaction. During the year ended December 31, 2017, there were no transactions where our policy was not followed.
118
Our board of directors has undertaken a review of the independence of each director. Based on information provided by each director concerning his or her background, employment, and affiliations, our board of directors has determined that Ms. Coles, Mr. Lafley, Mr. Lasky, Mr. Lynton, Mr. Meresman, Mr. Miller, and Mr. Young do not have relationships that would interfere with the exercise of independent judgment in carrying out the responsibilities of a director and that each of these directors is “independent” as that term is defined under the listing standards. In making these determinations, our board of directors considered the current and prior relationships that each non-employee director has with our company and all other facts and circumstances our board of directors deemed relevant in determining their independence, including the beneficial ownership of our shares by each non-employee director and the transactions described above.
Item 14. Principal Accountant Fees and Services
The following table sets forth the aggregate fees for professional service provided by our independent registered public accounting firm, Ernst & Young LLP, for the years ended December 31, 2017 and 2016:
|
|
|
Year Ended December 31, |
|
|||||
|
|
|
2017 |
|
|
2016 |
|
||
|
|
|
(in thousands) |
|
|||||
|
Audit Fees(1) |
|
$ |
6,286 |
|
|
$ |
4,862 |
|
|
Audit-Related Fees |
|
|
— |
|
|
|
— |
|
|
Tax Fees(2) |
|
|
1,653 |
|
|
|
2,208 |
|
|
All Other Fees(3) |
|
|
3 |
|
|
|
2 |
|
|
Total |
|
$ |
7,942 |
|
|
$ |
7,072 |
|
|
(1) |
Audit fees consist of the fees for professional services rendered for the audit of our annual financial statements, review of our quarterly financial statements, filing of our registration statements, including our Registration Statement on Form S-1 related to our initial public offering, accounting consultations, and audits provided in connection with other statutory filings for which we have engaged Ernst & Young LLP. |
|
(2) |
Tax fees consist of the fees for professional services rendered in connection with tax compliance, tax advisory, and tax planning. |
|
(3) |
All other fees consist of fees for professional services other than the services reported in audit fees, audit-related fees, and tax fees. |
The audit committee has adopted a pre-approval policy under which the audit committee approves in advance all audit and permissible non-audit services to be performed by the independent accountants (subject to a de minimis exception). These services may include audit services, audit-related services, tax services, and other non-audit services. As part of its pre-approval policy, the audit committee considers whether the provision of any proposed non-audit services is consistent with the SEC’s rules on auditor independence. In accordance with its pre-approval policy, the audit committee has pre-approved certain specified audit and non-audit services to be provided by our independent auditor. If there are any additional services to be provided, a request for pre-approval must be submitted to the audit committee for its consideration under the policy. The audit committee generally pre-approves particular services or categories of services on a case-by-case basis. Finally, in accordance with the pre-approval policy, the audit committee has delegated pre-approval authority to the chair of the audit committee. The chair must report any pre-approval decisions to the audit committee at its next meeting.
All of the services of Ernst & Young LLP for 2017 and 2016 described above were in accordance with the audit committee pre-approval policy.
119
Item 15. Exhibits, Financial Statement Schedules.
We have filed the following documents as part of this Annual Report on Form 10-K:
|
|
1. |
Consolidated Financial Statements and Schedules |
See Index to Financial Statements and Supplemental Data on page 63.
|
|
2. |
Exhibits |
The documents set forth below are filed herewith or incorporated herein by reference to the location indicated.
|
|
|
|
|
Incorporated by Reference |
||||||
|
Exhibit Number |
|
Description |
|
Schedule Form |
|
File Number |
|
Exhibit |
|
Filing Date |
|
|
|
|
|
|
|
|
|
|
|
|
|
3.1 |
|
Amended and Restated Certificate of Incorporation of Snap Inc. |
|
S-1 |
|
333-215866 |
|
3.2 |
|
February 2, 2017 |
|
|
|
|
|
|
|
|
|
|
|
|
|
3.2 |
|
|
S-1 |
|
333-215866 |
|
3.4 |
|
February 2, 2017 |
|
|
|
|
|
|
|
|
|
|
|
|
|
|
4.1 |
|
|
S-1 |
|
333-215866 |
|
4.1 |
|
February 2, 2017 |
|
|
|
|
|
|
|
|
|
|
|
|
|
|
4.2 |
|
|
S-8 |
|
333-216495 |
|
4.6 |
|
March 7, 2017 |
|
|
|
|
|
|
|
|
|
|
|
|
|
|
4.3 |
|
|
S-8 |
|
333-216495 |
|
4.7 |
|
March 7, 2017 |
|
|
|
|
|
|
|
|
|
|
|
|
|
|
10.1+ |
|
|
S-1 |
|
333-215866 |
|
10.2 |
|
February 2, 2017 |
|
|
|
|
|
|
|
|
|
|
|
|
|
|
10.2+ |
|
|
S-1 |
|
333-215866 |
|
10.3 |
|
February 2, 2017 |
|
|
|
|
|
|
|
|
|
|
|
|
|
|
10.3+ |
|
|
S-1 |
|
333-215866 |
|
10.4 |
|
February 2, 2017 |
|
|
|
|
|
|
|
|
|
|
|
|
|
|
10.4+ |
|
|
S-1 |
|
333-215866 |
|
10.5 |
|
February 2, 2017 |
|
|
|
|
|
|
|
|
|
|
|
|
|
|
10.5+ |
|
|
S-1 |
|
333-215866 |
|
10.6 |
|
February 2, 2017 |
|
|
|
|
|
|
|
|
|
|
|
|
|
|
10.6+ |
|
|
S-1 |
|
333-215866 |
|
10.7 |
|
February 2, 2017 |
|
|
|
|
|
|
|
|
|
|
|
|
|
|
10.7+ |
|
|
S-8 |
|
333-216495 |
|
99.7 |
|
March 7, 2017 |
|
|
|
|
|
|
|
|
|
|
|
|
|
|
10.8+ |
|
|
S-1 |
|
333-215866 |
|
10.9 |
|
February 2, 2017 |
|
|
|
|
|
|
|
|
|
|
|
|
|
|
10.9+ |
|
|
S-8 |
|
333-219899 |
|
10.1 |
|
August 10, 2017 |
|
|
|
|
|
|
|
|
|
|
|
|
|
|
10.10+ |
|
|
S-1 |
|
333-215866 |
|
10.11 |
|
February 2, 2017 |
|
|
|
|
|
|
|
|
|
|
|
|
|
|
10.11+ |
|
|
S-1 |
|
333-215866 |
|
10.12 |
|
February 2, 2017 |
|
120
|
|
|
|
|
Incorporated by Reference |
||||||
|
Exhibit Number |
|
Description |
|
Schedule Form |
|
File Number |
|
Exhibit |
|
Filing Date |
|
|
|
|
|
|
|
|
|
|
|
|
|
10.12+ |
|
Amended and Restated Offer Letter, by and between Snap Inc. and Evan Spiegel, dated October 27, 2016 |
|
S-1 |
|
333-215866 |
|
10.13 |
|
February 2, 2017 |
|
|
|
|
|
|
|
|
|
|
|
|
|
10.13+ |
|
|
S-1 |
|
333-215866 |
|
10.14 |
|
February 2, 2017 |
|
|
|
|
|
|
|
|
|
|
|
|
|
|
10.14+ |
|
|
S-1 |
|
333-215866 |
|
10.15 |
|
February 2, 2017 |
|
|
|
|
|
|
|
|
|
|
|
|
|
|
10.15+ |
|
Amended and Restated Offer Letter, by and between Snap Inc. and Imran Khan, dated October 27, 2016 |
|
S-1 |
|
333-215866 |
|
10.16 |
|
February 2, 2017 |
|
|
|
|
|
|
|
|
|
|
|
|
|
10.16+ |
|
|
S-1 |
|
333-215866 |
|
10.17 |
|
February 2, 2017 |
|
|
|
|
|
|
|
|
|
|
|
|
|
|
10.17+ |
|
Amended and Restated Offer Letter, by and between Snap Inc. and Timothy Sehn, dated October 27, 2016 |
|
S-1 |
|
333-215866 |
|
10.18 |
|
February 2, 2017 |
|
|
|
|
|
|
|
|
|
|
|
|
|
10.18+ |
|
|
S-1 |
|
333-215866 |
|
10.19 |
|
February 2, 2017 |
|
|
|
|
|
|
|
|
|
|
|
|
|
|
10.19+ |
|
Offer Letter, by and between Snap Inc. and Michael O’Sullivan, dated July 24, 2017 |
|
10-Q |
|
001-38017 |
|
10.1 |
|
November 8, 2017 |
|
|
|
|
|
|
|
|
|
|
|
|
|
10.20+ |
|
Amended and Restated Offer Letter, by and between Snap Inc. and Lara Sweet, dated November 6, 2017 |
|
10-Q |
|
001-38017 |
|
10.7 |
|
November 8, 2017 |
|
|
|
|
|
|
|
|
|
|
|
|
|
10.21+ |
|
Advisor Agreement, by and between Snap Inc. and Christopher T. Handman, dated July 20, 2017 |
|
10-Q |
|
001-38017 |
|
10.2 |
|
November 8, 2017 |
|
|
|
|
|
|
|
|
|
|
|
|
|
10.22+ |
|
Option Agreement Amendment, by and between Snap Inc. and Tim Sehn, dated November 7, 2017 |
|
10-Q |
|
001-38017 |
|
10.6 |
|
November 8, 2017 |
|
|
|
|
|
|
|
|
|
|
|
|
|
10.23# |
|
|
S-1 |
|
333-215866 |
|
10.20 |
|
February 2, 2017 |
|
|
|
|
|
|
|
|
|
|
|
|
|
|
10.24# |
|
|
10-Q |
|
001-38017 |
|
10.3 |
|
November 8, 2017 |
|
|
|
|
|
|
|
|
|
|
|
|
|
|
10.25# |
|
|
10-Q |
|
001-38017 |
|
10.4 |
|
November 8, 2017 |
|
|
|
|
|
|
|
|
|
|
|
|
|
|
10.26# |
|
|
|
|
|
|
|
|
|
|
|
|
|
|
|
|
|
|
|
|
|
|
|
10.27 |
|
|
S-1 |
|
333-215866 |
|
10.21 |
|
February 2, 2017 |
|
|
|
|
|
|
|
|
|
|
|
|
|
|
10.28 |
|
|
|
|
|
|
|
|
|
|
|
|
|
|
|
|
|
|
|
|
|
|
|
10.29 |
|
|
|
|
|
|
|
|
|
|
|
|
|
|
|
|
|
|
|
|
|
|
|
21.1 |
|
|
|
|
|
|
|
|
|
|
121
|
|
|
|
|
Incorporated by Reference |
||||||
|
Exhibit Number |
|
Description |
|
Schedule Form |
|
File Number |
|
Exhibit |
|
Filing Date |
|
|
|
|
|
|
|
|
|
|
|
|
|
23.1 |
|
Consent of Ernst & Young, LLP, independent registered public accounting firm |
|
|
|
|
|
|
|
|
|
|
|
|
|
|
|
|
|
|
|
|
|
31.1 |
|
|
|
|
|
|
|
|
|
|
|
|
|
|
|
|
|
|
|
|
|
|
|
31.2 |
|
|
|
|
|
|
|
|
|
|
|
|
|
|
|
|
|
|
|
|
|
|
|
32.1* |
|
|
|
|
|
|
|
|
|
|
|
|
|
|
|
|
|
|
|
|
|
|
|
101.INS |
|
XBRL Instance Document |
|
|
|
|
|
|
|
|
|
|
|
|
|
|
|
|
|
|
|
|
|
101.SCH |
|
XBRL Taxonomy Extension Schema Document |
|
|
|
|
|
|
|
|
|
|
|
|
|
|
|
|
|
|
|
|
|
101.CAL |
|
XBRL Taxonomy Extension Calculation Linkbase Document |
|
|
|
|
|
|
|
|
|
|
|
|
|
|
|
|
|
|
|
|
|
101.DEF |
|
XBRL Taxonomy Definition Linkbase Document |
|
|
|
|
|
|
|
|
|
|
|
|
|
|
|
|
|
|
|
|
|
101.LAB |
|
XBRL Taxonomy Extension Labels Linkbase Document |
|
|
|
|
|
|
|
|
|
|
|
|
|
|
|
|
|
|
|
|
|
101.PRE |
|
XBRL Taxonomy Extension Presentation Linkbase Document |
|
|
|
|
|
|
|
|
|
+ |
Indicates management contract or compensatory plan. |
|
# |
Confidential treatment has been requested for portions of this exhibit. |
|
* |
The certifications furnished in Exhibit 32.1 hereto are deemed to accompany this Annual Report on Form 10-K and will not be deemed “filed” for purposes of Section 18 of the Securities Exchange Act of 1934, as amended, except to the extent that the registrant specifically incorporates it by reference. |
122
Pursuant to the requirements of Section 13 or 15(d) of the Securities Exchange Act of 1934, as amended, the Registrant has duly caused this Report to be signed on its behalf by the undersigned, thereunto duly authorized.
|
|
|
SNAP INC. |
|
|
|
|
|
|
|
Date: February 21, 2018 |
|
|
/s/ Andrew Vollero |
|
|
|
|
Andrew Vollero Chief Financial Officer (Principal Financial Officer) |
Pursuant to the requirements of the Securities Exchange Act of 1934, as amended, this Report has been signed below by the following persons on behalf of the Registrant in the capacities and on the dates indicated.
|
Name |
|
Title |
|
Date |
|
|
|
|
|
|
|
/s/ Evan Spiegel |
|
Chief Executive Officer and Director |
|
February 21, 2018 |
|
Evan Spiegel |
|
(Principal Executive Officer) |
|
|
|
|
|
|
|
|
|
/s/ Robert Murphy |
|
Director and Chief Technology Officer |
|
February 21, 2018 |
|
Robert Murphy |
|
|
|
|
|
|
|
|
|
|
|
/s/ Andrew Vollero |
|
Chief Financial Officer |
|
February 21, 2018 |
|
Andrew Vollero |
|
(Principal Financial Officer) |
|
|
|
|
|
|
|
|
|
/s/ Lara Sweet |
|
Chief Accounting Officer |
|
February 21, 2018 |
|
Lara Sweet |
|
(Principal Accounting Officer) |
|
|
|
|
|
|
|
|
|
/s/ Joanna Coles |
|
Director |
|
February 21, 2018 |
|
Joanna Coles |
|
|
|
|
|
|
|
|
|
|
|
/s/ A.G. Lafley |
|
Director |
|
February 21, 2018 |
|
A.G. Lafley |
|
|
|
|
|
|
|
|
|
|
|
/s/ Mitchell Lasky |
|
Director |
|
February 21, 2018 |
|
Mitchell Lasky |
|
|
|
|
|
|
|
|
|
|
|
/s/ Michael Lynton |
|
Director |
|
February 21, 2018 |
|
Michael Lynton |
|
|
|
|
|
|
|
|
|
|
|
/s/ Stanley Meresman |
|
Director |
|
February 21, 2018 |
|
Stanley Meresman |
|
|
|
|
|
|
|
|
|
|
|
/s/ Scott D. Miller |
|
Director |
|
February 21, 2018 |
|
Scott D. Miller |
|
|
|
|
|
|
|
|
|
|
|
/s/ Christopher Young |
|
Director |
|
February 21, 2018 |
|
Christopher Young |
|
|
|
|
123