Attached files
| file | filename |
|---|---|
| 8-K - 8-K - FEB 2018 INVESTOR PRESENTATION - SCHWEITZER MAUDUIT INTERNATIONAL INC | feb18investorpre8-k.htm |
© 2018 Schweitzer-Mauduit International, Inc. Confidential
SWM INVESTOR PRESENTATION
February 2018
© 2018 Schweitzer-Mauduit International, Inc. Confidential 2
Forward Looking Statements, Non-
GAAP Disclosure, & Definitions
This presentation may contain “forward-looking statements” within the meaning of the Private Securities
Litigation Reform Act of 1995 and other federal securities laws that are subject to the safe harbor created by such laws and other legal
protections. Caution should be taken not to place undue reliance on any such forward-looking statements because actual results may differ
materially from the results suggested by these statements. These forward-looking statements are made only as of the date of this presentation.
We undertake no obligation, except as may be required by law, to publicly update or revise any forward-looking statements, whether as a result
of new information, future events or otherwise. In addition, forward-looking statements are subject to certain risks and uncertainties that could
cause actual results to differ materially from our historical experience and present expectations or projections. These risks and uncertainties
include, but are not limited to, those described in Part I, “Item 1A. Risk Factors” and elsewhere in our Annual Report on Form 10-K for the
period ended December 31, 2016 and those described from time to time in our periodic and other reports filed with the Securities and Exchange
Commission
Certain financial measures and comments contained in this presentation are “non-
GAAP” financial measures, specifically measures which exclude one or more of the following: restructuring and impairment
expenses, depreciation and amortization, interest expense, tax provision (benefit), capital spending, capitalized software expenditures,
purchase accounting adjustments, and tax valuation adjustments. We believe that investors’ understanding is enhanced by disclosing these
non-GAAP financial measures as a reasonable basis for comparison of our ongoing results of operations. All non-GAAP (Adjusted) figures are
reconciled to closest GAAP measure in the appendix. All financial metrics are presented on a continuing operations basis unless noted
otherwise; all per share metrics are on a diluted basis
The following terms/abbreviations are used throughout the presentation and are defined as follows:
EP - Engineered Papers segment, AMS - Advanced Materials & Structures segment, OCF – operating cash flow, FCF - free cash flow, OP -
operating profit, EBITDA - earnings before interest taxes depreciation and amortization, LIP - low ignition propensity, RTL - reconstituted
tobacco leaf, W&B - wrapper and binder, RO - reverse osmosis, TPU - thermoplastic polyurethane
© 2018 Schweitzer-Mauduit International, Inc. Confidential 3
Overview
Engineered Papers (EP)
Advanced Materials & Structures (AMS)
Financial Overview, Outlook
© 2018 Schweitzer-Mauduit International, Inc. Confidential 4
A Specialty Materials Company
Delivering high performance critical components for demanding applications
GROWING ADVANCED MATERIALS & STRUCTURES SEGMENT
• GDP+ organic sales growth in diversified end-markets
• Margin expansion from synergies and integration
• Platform for future acquisitions
MATURE HIGH MARGIN ENGINEERED PAPERS SEGMENT
• Tobacco industry concentration
• Attractive margins and cash flow, focus on costs and market share
STRONG CASH FLOW & ATTRACTIVE DIVIDEND
• $131 million OCF, $90 million of FCF
• Track record for dividend growth
• Balanced capital allocation: M&A, internal investments, and dividends
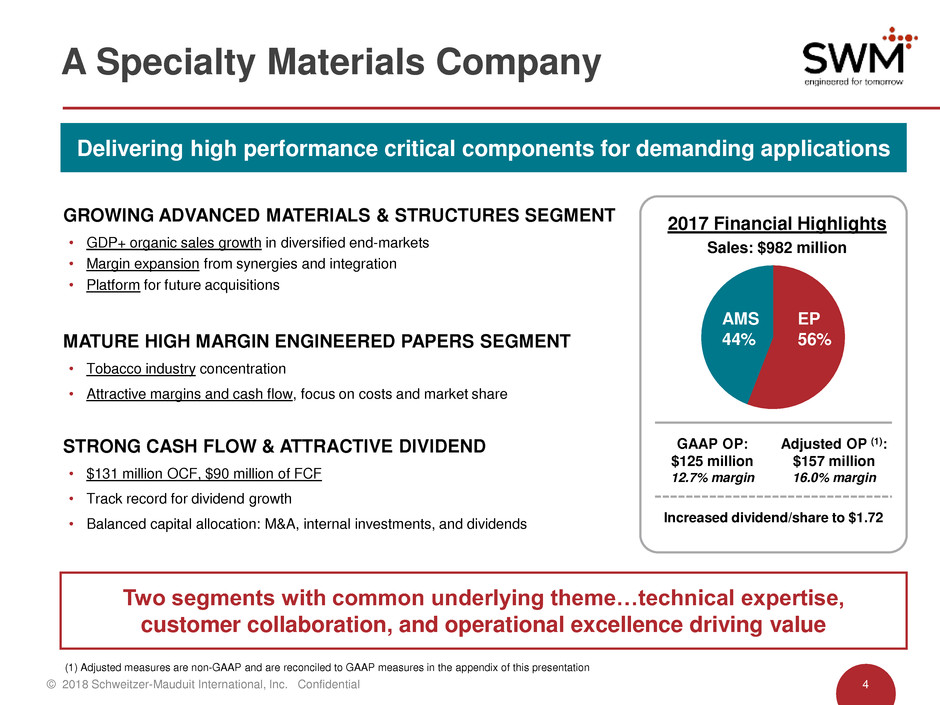
2017 Financial Highlights
Sales: $982 million
AMS
44%
EP
56%
GAAP OP:
$125 million
12.7% margin
(1) Adjusted measures are non-GAAP and are reconciled to GAAP measures in the appendix of this presentation
Increased dividend/share to $1.72
Adjusted OP (1):
$157 million
16.0% margin
Two segments with common underlying theme…technical expertise,
customer collaboration, and operational excellence driving value
© 2018 Schweitzer-Mauduit International, Inc. Confidential 5
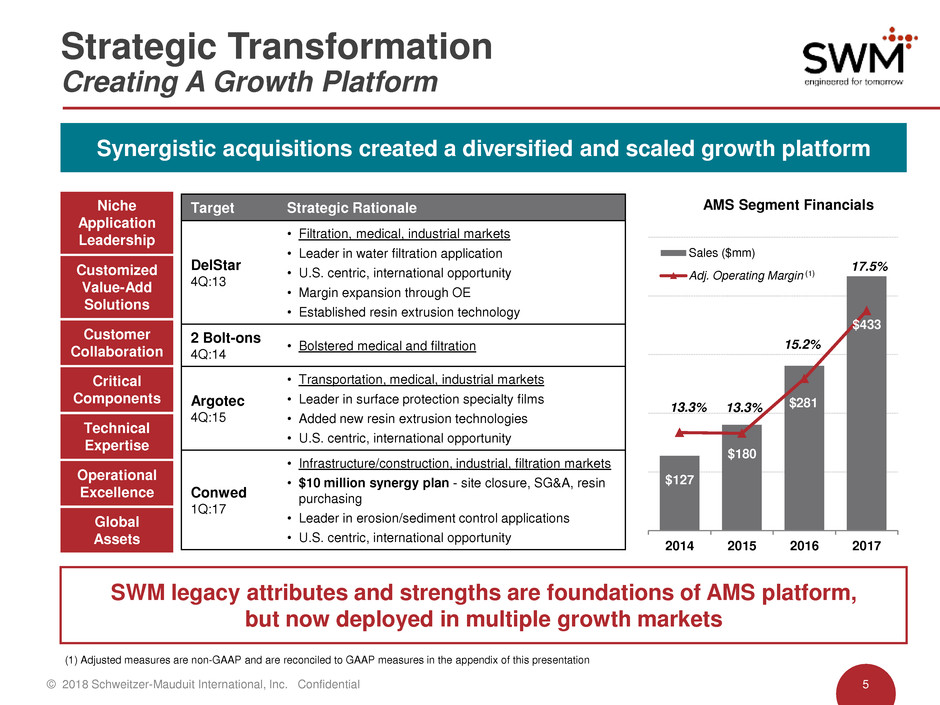
SWM legacy attributes and strengths are foundations of AMS platform,
but now deployed in multiple growth markets
Strategic Transformation
Creating A Growth Platform
Synergistic acquisitions created a diversified and scaled growth platform
$127
$180
$281
$433
13.3% 13.3%
15.2%
17.5%
10%
12%
14%
16%
18%
20%
$0
$100
$200
$300
$400
$500
2014 2015 2016 2017
Sales ($mm)
Adj. Operating MarginCustomized
Value-Add
Solutions
Customer
Collaboration
Operational
Excellence
Technical
Expertise
Niche
Application
Leadership
Global
Assets
Critical
Components
Target Strategic Rationale
DelStar
4Q:13
• Filtration, medical, industrial markets
• Leader in water filtration application
• U.S. centric, international opportunity
• Margin expansion through OE
• Established resin extrusion technology
2 Bolt-ons
4Q:14
• Bolstered medical and filtration
Argotec
4Q:15
• Transportation, medical, industrial markets
• Leader in surface protection specialty films
• Added new resin extrusion technologies
• U.S. centric, international opportunity
Conwed
1Q:17
• Infrastructure/construction, industrial, filtration markets
• $10 million synergy plan - site closure, SG&A, resin
purchasing
• Leader in erosion/sediment control applications
• U.S. centric, international opportunity
AMS Segment Financials
(1) Adjusted measures are non-GAAP and are reconciled to GAAP measures in the appendix of this presentation
(1)
© 2018 Schweitzer-Mauduit International, Inc. Confidential 6
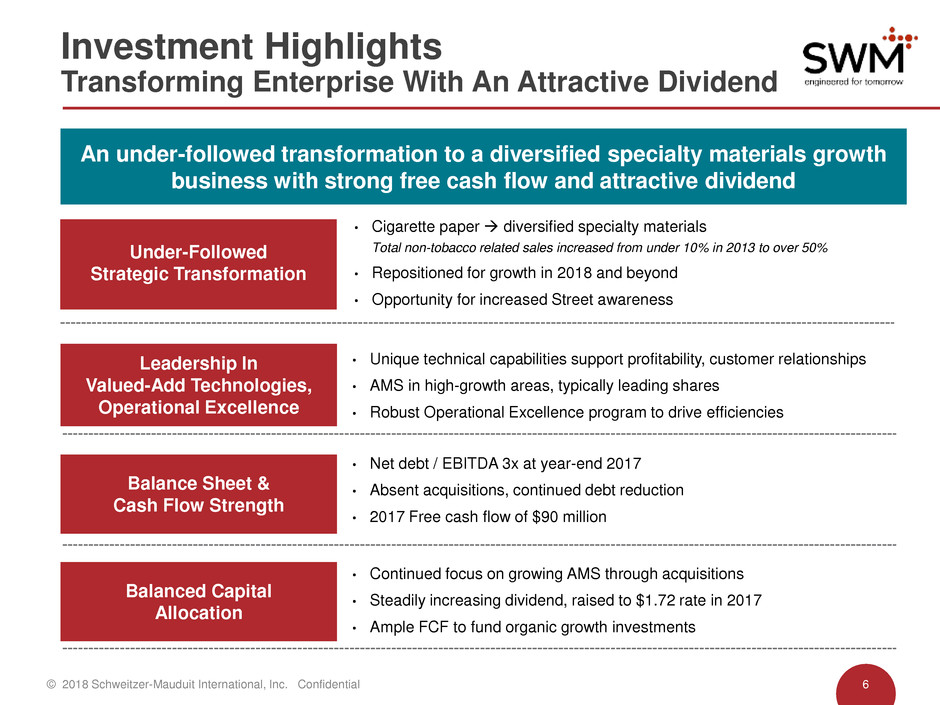
Investment Highlights
Transforming Enterprise With An Attractive Dividend
An under-followed transformation to a diversified specialty materials growth
business with strong free cash flow and attractive dividend
Under-Followed
Strategic Transformation
• Cigarette paper diversified specialty materials
Total non-tobacco related sales increased from under 10% in 2013 to over 50%
• Repositioned for growth in 2018 and beyond
• Opportunity for increased Street awareness
Balanced Capital
Allocation
Leadership In
Valued-Add Technologies,
Operational Excellence
Balance Sheet &
Cash Flow Strength
• Unique technical capabilities support profitability, customer relationships
• AMS in high-growth areas, typically leading shares
• Robust Operational Excellence program to drive efficiencies
• Net debt / EBITDA 3x at year-end 2017
• Absent acquisitions, continued debt reduction
• 2017 Free cash flow of $90 million
• Continued focus on growing AMS through acquisitions
• Steadily increasing dividend, raised to $1.72 rate in 2017
• Ample FCF to fund organic growth investments
© 2018 Schweitzer-Mauduit International, Inc. Confidential 7
Overview
Engineered Papers (EP)
Advanced Materials & Structures (AMS)
Financial Overview, Outlook
© 2018 Schweitzer-Mauduit International, Inc. Confidential 8
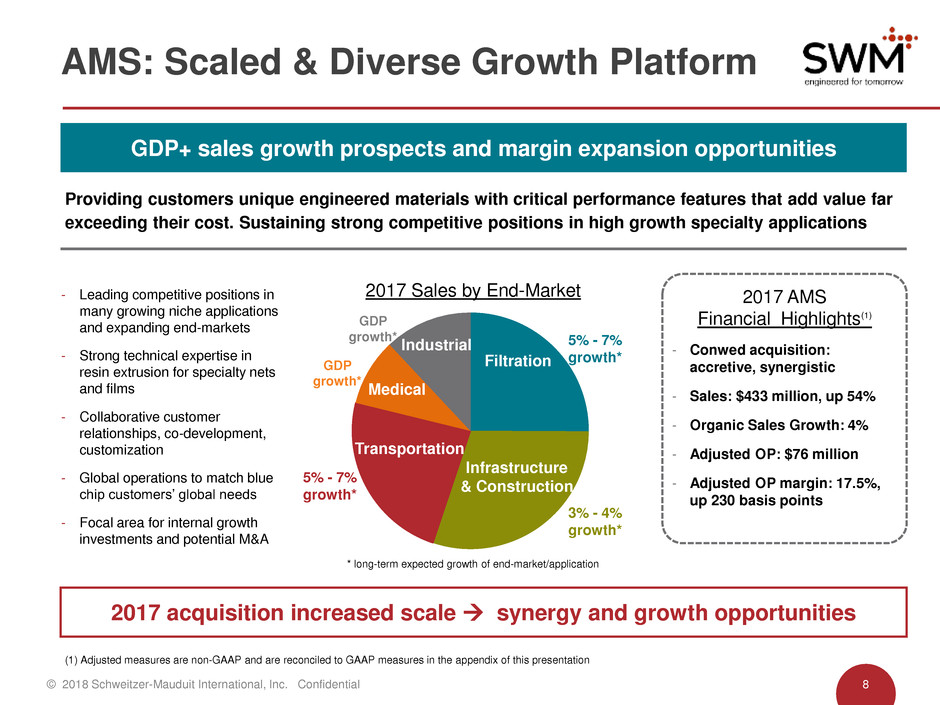
AMS: Scaled & Diverse Growth Platform
Providing customers unique engineered materials with critical performance features that add value far
exceeding their cost. Sustaining strong competitive positions in high growth specialty applications
GDP+ sales growth prospects and margin expansion opportunities
Infrastructure
& Construction
Transportation
5% - 7%
growth*
3% - 4%
growth*
5% - 7%
growth*
GDP
growth*
* long-term expected growth of end-market/application
GDP
growth*
Medical
Industrial
Filtration
2017 AMS
Financial Highlights(1)
- Conwed acquisition:
accretive, synergistic
- Sales: $433 million, up 54%
- Organic Sales Growth: 4%
- Adjusted OP: $76 million
- Adjusted OP margin: 17.5%,
up 230 basis points
2017 acquisition increased scale synergy and growth opportunities
2017 Sales by End-Market
(1) Adjusted measures are non-GAAP and are reconciled to GAAP measures in the appendix of this presentation
- Leading competitive positions in
many growing niche applications
and expanding end-markets
- Strong technical expertise in
resin extrusion for specialty nets
and films
- Collaborative customer
relationships, co-development,
customization
- Global operations to match blue
chip customers’ global needs
- Focal area for internal growth
investments and potential M&A
© 2018 Schweitzer-Mauduit International, Inc. Confidential 9
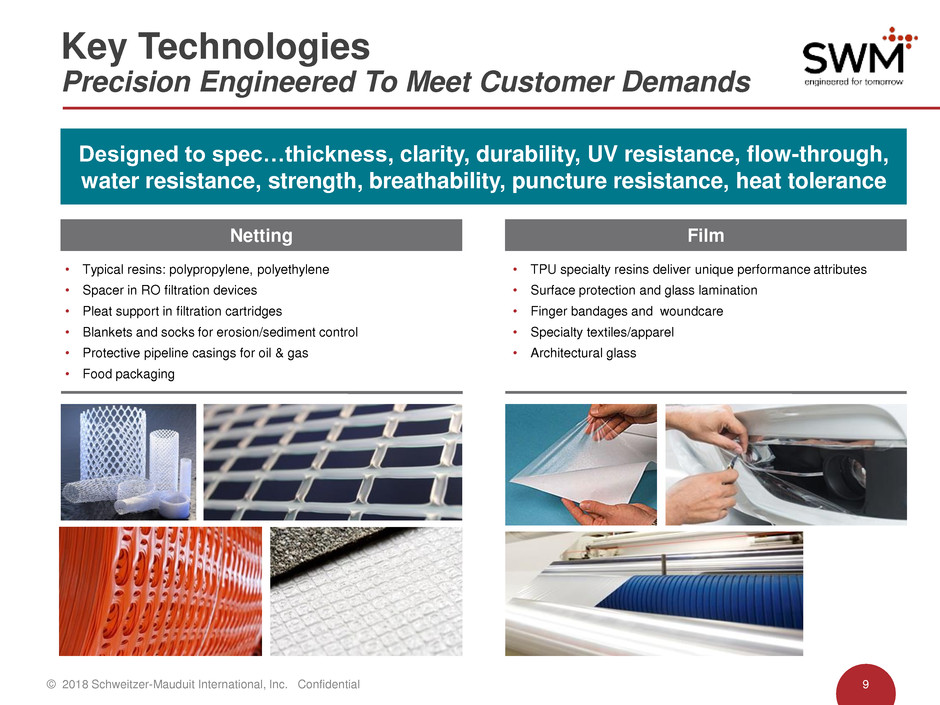
Key Technologies
Precision Engineered To Meet Customer Demands
Designed to spec…thickness, clarity, durability, UV resistance, flow-through,
water resistance, strength, breathability, puncture resistance, heat tolerance
• Typical resins: polypropylene, polyethylene
• Spacer in RO filtration devices
• Pleat support in filtration cartridges
• Blankets and socks for erosion/sediment control
• Protective pipeline casings for oil & gas
• Food packaging
• TPU specialty resins deliver unique performance attributes
• Surface protection and glass lamination
• Finger bandages and woundcare
• Specialty textiles/apparel
• Architectural glass
Film Netting
© 2018 Schweitzer-Mauduit International, Inc. Confidential 10
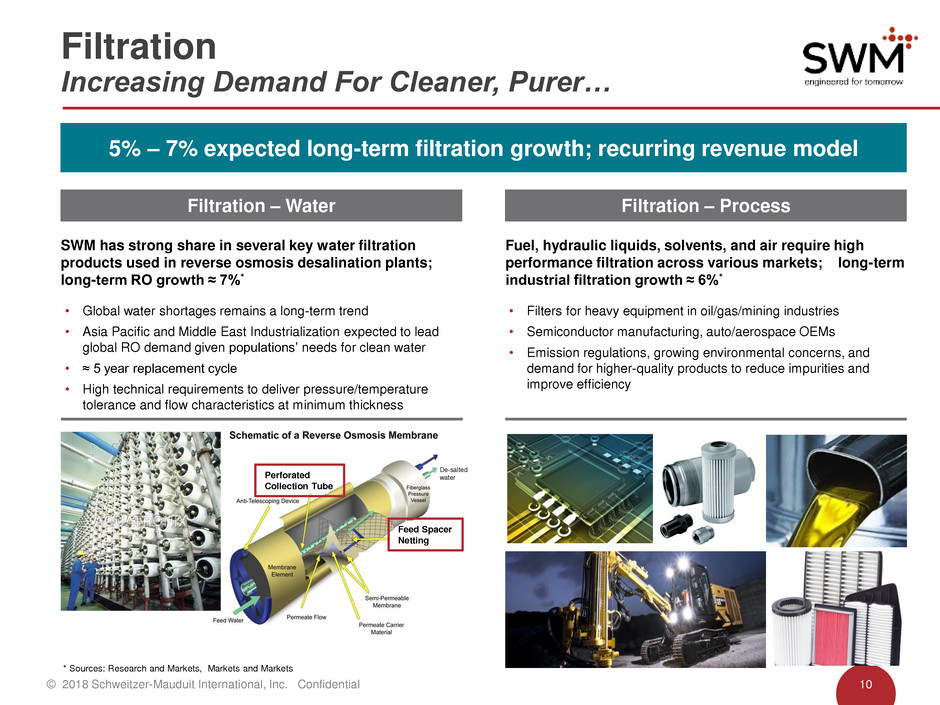
Filtration
Increasing Demand For Cleaner, Purer…
Fuel, hydraulic liquids, solvents, and air require high
performance filtration across various markets; long-term
industrial filtration growth ≈ 6%*
• Filters for heavy equipment in oil/gas/mining industries
• Semiconductor manufacturing, auto/aerospace OEMs
• Emission regulations, growing environmental concerns, and
demand for higher-quality products to reduce impurities and
improve efficiency
* Sources: Research and Markets, Markets and Markets
Filtration – Process
5% – 7% expected long-term filtration growth; recurring revenue model
SWM has strong share in several key water filtration
products used in reverse osmosis desalination plants;
long-term RO growth ≈ 7%*
• Global water shortages remains a long-term trend
• Asia Pacific and Middle East Industrialization expected to lead
global RO demand given populations’ needs for clean water
• ≈ 5 year replacement cycle
• High technical requirements to deliver pressure/temperature
tolerance and flow characteristics at minimum thickness
Filtration – Water
De-salted
water
Feed Spacer
Netting
Perforated
Collection Tube
© 2018 Schweitzer-Mauduit International, Inc. Confidential 11
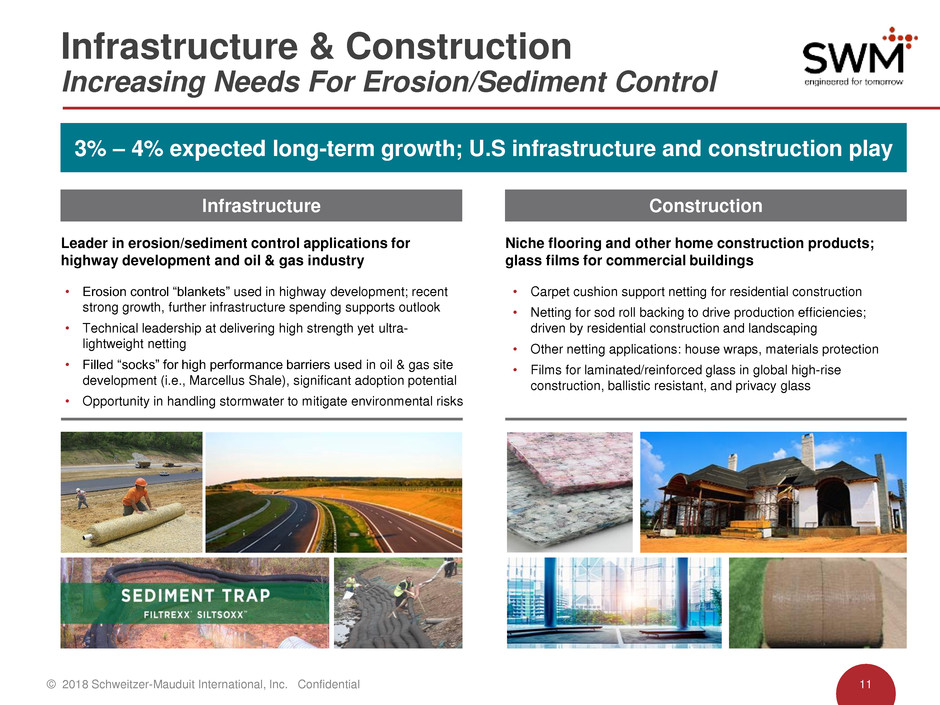
Infrastructure & Construction
Increasing Needs For Erosion/Sediment Control
Leader in erosion/sediment control applications for
highway development and oil & gas industry
• Erosion control “blankets” used in highway development; recent
strong growth, further infrastructure spending supports outlook
• Technical leadership at delivering high strength yet ultra-
lightweight netting
• Filled “socks” for high performance barriers used in oil & gas site
development (i.e., Marcellus Shale), significant adoption potential
• Opportunity in handling stormwater to mitigate environmental risks
Niche flooring and other home construction products;
glass films for commercial buildings
• Carpet cushion support netting for residential construction
• Netting for sod roll backing to drive production efficiencies;
driven by residential construction and landscaping
• Other netting applications: house wraps, materials protection
• Films for laminated/reinforced glass in global high-rise
construction, ballistic resistant, and privacy glass
3% – 4% expected long-term growth; U.S infrastructure and construction play
Construction Infrastructure
© 2018 Schweitzer-Mauduit International, Inc. Confidential 12
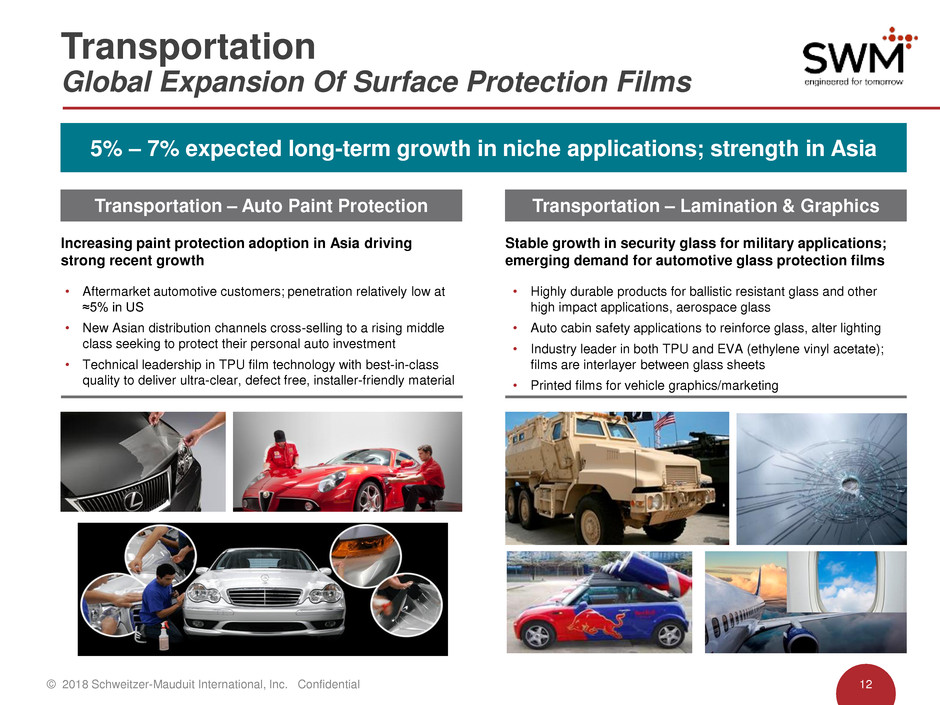
Transportation
Global Expansion Of Surface Protection Films
5% – 7% expected long-term growth in niche applications; strength in Asia
Increasing paint protection adoption in Asia driving
strong recent growth
• Aftermarket automotive customers; penetration relatively low at
≈5% in US
• New Asian distribution channels cross-selling to a rising middle
class seeking to protect their personal auto investment
• Technical leadership in TPU film technology with best-in-class
quality to deliver ultra-clear, defect free, installer-friendly material
Stable growth in security glass for military applications;
emerging demand for automotive glass protection films
• Highly durable products for ballistic resistant glass and other
high impact applications, aerospace glass
• Auto cabin safety applications to reinforce glass, alter lighting
• Industry leader in both TPU and EVA (ethylene vinyl acetate);
films are interlayer between glass sheets
• Printed films for vehicle graphics/marketing
Transportation – Lamination & Graphics Transportation – Auto Paint Protection
© 2018 Schweitzer-Mauduit International, Inc. Confidential 13
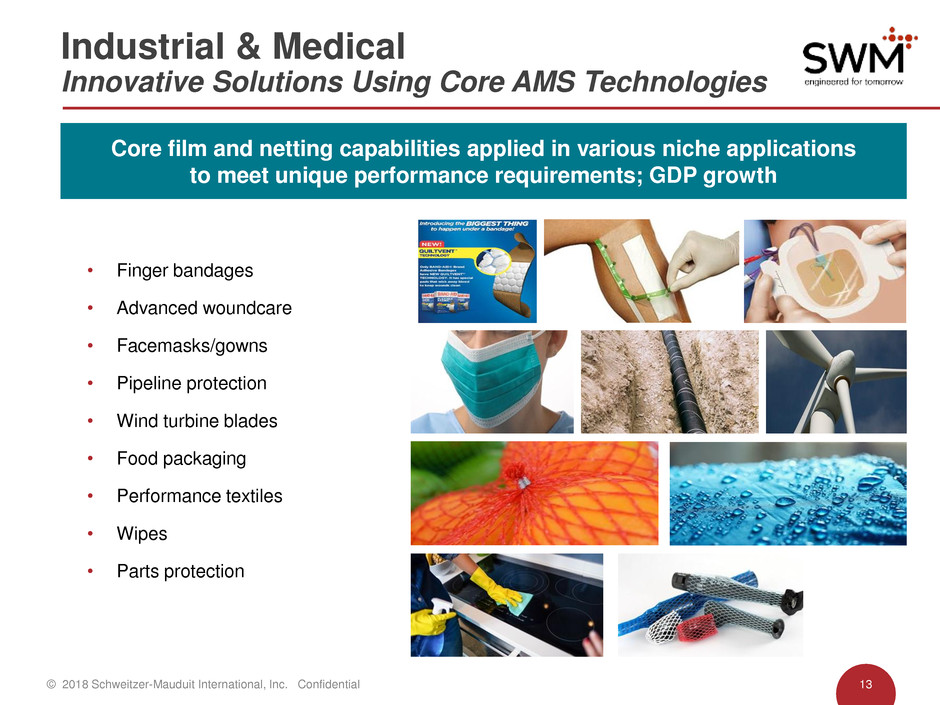
• Finger bandages
• Advanced woundcare
• Facemasks/gowns
• Pipeline protection
• Wind turbine blades
• Food packaging
• Performance textiles
• Wipes
• Parts protection
Industrial & Medical
Innovative Solutions Using Core AMS Technologies
Core film and netting capabilities applied in various niche applications
to meet unique performance requirements; GDP growth
© 2018 Schweitzer-Mauduit International, Inc. Confidential 14
Overview
Engineered Papers (EP)
Advanced Materials & Structures (AMS)
Financial Overview, Outlook
© 2018 Schweitzer-Mauduit International, Inc. Confidential 15
- Patented LIP paper a key profit
driver; fire safety product
- Reconstituted tobacco (“Recon”)
another key profit driver
- Influenced by US/EU (15%* of global
demand) smoking attrition,
historically ≈ 3%*
- Opportunity to further ramp up HnB
sales and expand non-tobacco
papers
- Cigarette papers highly engineered
to spec…air flow, burn rate, taste
- Paper and Recon JVs in China
(44%* of global demand)
JVs not included in EP segment
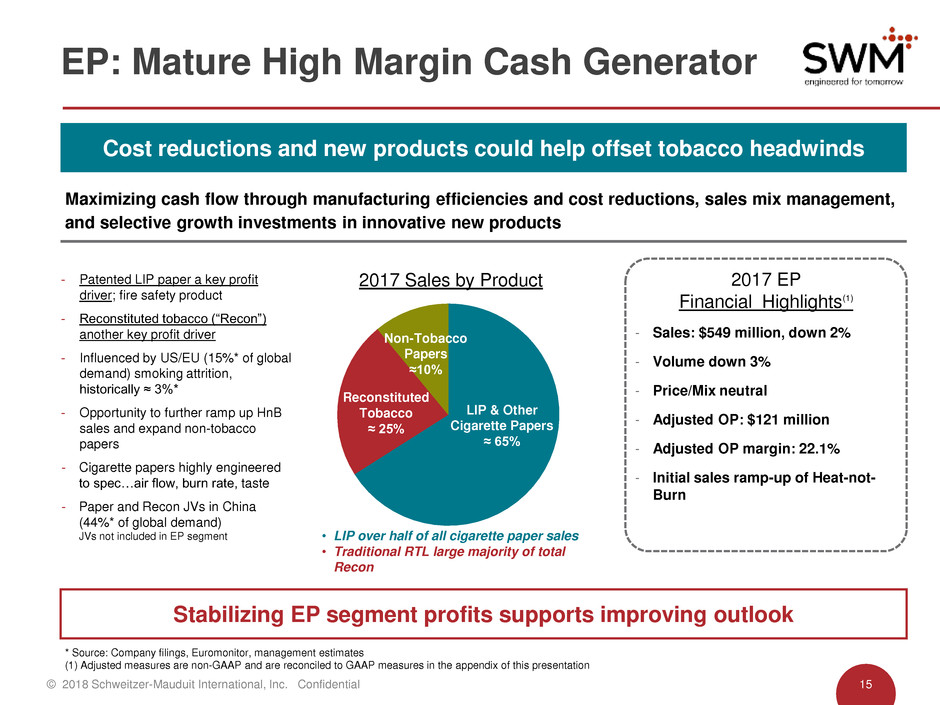
EP: Mature High Margin Cash Generator
Cost reductions and new products could help offset tobacco headwinds
Stabilizing EP segment profits supports improving outlook
2017 EP
Financial Highlights(1)
- Sales: $549 million, down 2%
- Volume down 3%
- Price/Mix neutral
- Adjusted OP: $121 million
- Adjusted OP margin: 22.1%
- Initial sales ramp-up of Heat-not-
Burn
Maximizing cash flow through manufacturing efficiencies and cost reductions, sales mix management,
and selective growth investments in innovative new products
* Source: Company filings, Euromonitor, management estimates
(1) Adjusted measures are non-GAAP and are reconciled to GAAP measures in the appendix of this presentation
2017 Sales by Product
• LIP over half of all cigarette paper sales
• Traditional RTL large majority of total
Recon
Reconstituted
Tobacco
≈ 25%
Non-Tobacco
Papers
≈10%
LIP & Other
Cigarette Papers
≈ 65%
© 2018 Schweitzer-Mauduit International, Inc. Confidential 16
SWM a global LIP leader
• SWM has vast majority share in North America…
• …40%+ share in EU with another 40%+ under license/royalty with
competitors
LIP a premium product in paper portfolio
• LIP price compression through product life cycle, still good margins
• SWM has delivered solid long-term share performance
Extensive Patent Portfolio
• Royalty income from top competitor ends in 2022 when key LIP
patents expire
• Successful patent litigation in 2017
LIP is 100% mandated in U.S. and EU
• Adoption in 2010 – 2011
• ~16% of global consumption under LIP regulation
• Opportunities driven by government regulation, no imminent
adoptions expected
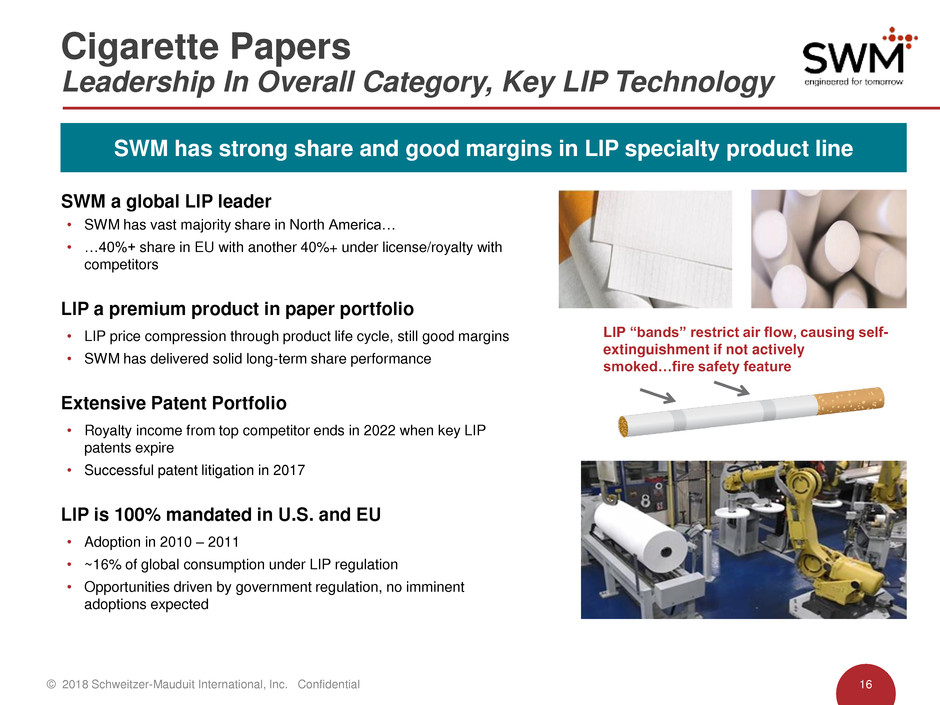
LIP “bands” restrict air flow, causing self-
extinguishment if not actively
smoked…fire safety feature
Cigarette Papers
Leadership In Overall Category, Key LIP Technology
SWM has strong share and good margins in LIP specialty product line
© 2018 Schweitzer-Mauduit International, Inc. Confidential 17
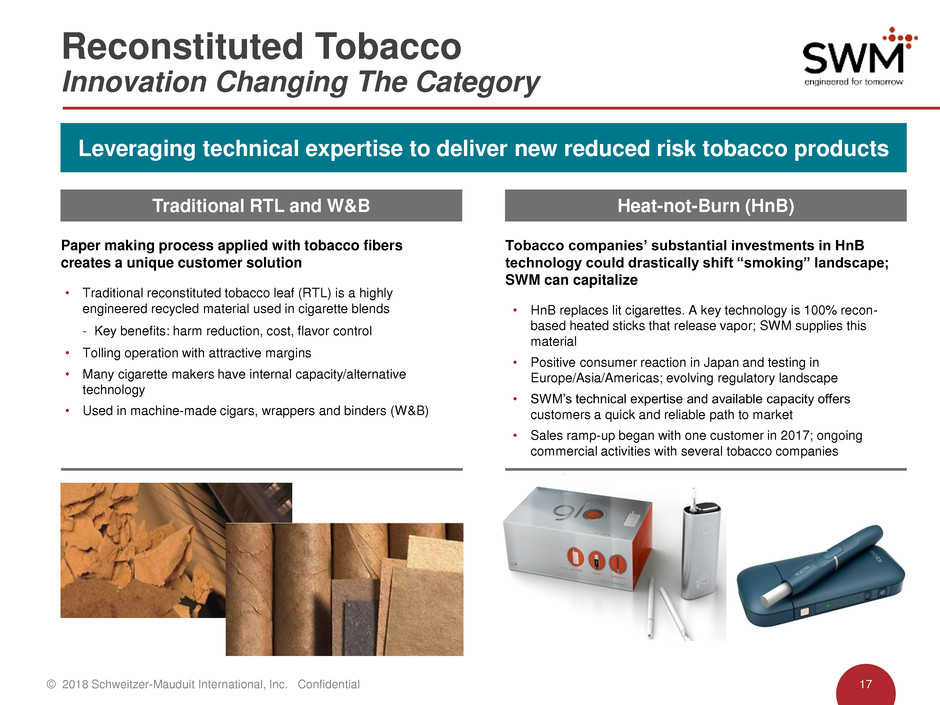
Reconstituted Tobacco
Innovation Changing The Category
Heat-not-Burn (HnB) Traditional RTL and W&B
• Traditional reconstituted tobacco leaf (RTL) is a highly
engineered recycled material used in cigarette blends
- Key benefits: harm reduction, cost, flavor control
• Tolling operation with attractive margins
• Many cigarette makers have internal capacity/alternative
technology
• Used in machine-made cigars, wrappers and binders (W&B)
• HnB replaces lit cigarettes. A key technology is 100% recon-
based heated sticks that release vapor; SWM supplies this
material
• Positive consumer reaction in Japan and testing in
Europe/Asia/Americas; evolving regulatory landscape
• SWM’s technical expertise and available capacity offers
customers a quick and reliable path to market
• Sales ramp-up began with one customer in 2017; ongoing
commercial activities with several tobacco companies
Paper making process applied with tobacco fibers
creates a unique customer solution
Tobacco companies’ substantial investments in HnB
technology could drastically shift “smoking” landscape;
SWM can capitalize
Leveraging technical expertise to deliver new reduced risk tobacco products
© 2018 Schweitzer-Mauduit International, Inc. Confidential 18
Overview
Engineered Papers (EP)
Advanced Materials & Structures (AMS)
Financial Overview, Outlook
© 2018 Schweitzer-Mauduit International, Inc. Confidential 19
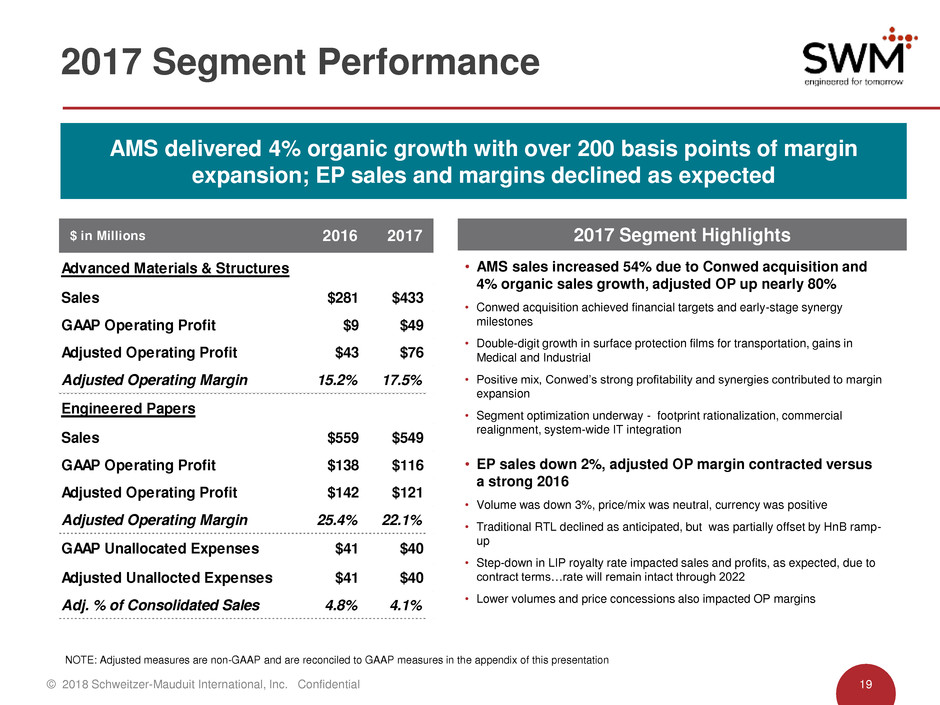
2017 Segment Performance
AMS delivered 4% organic growth with over 200 basis points of margin
expansion; EP sales and margins declined as expected
$ in Millions 2016 2017
Sales $281 $433
GAAP Operating Profit $9 $49
Adjusted Operating Profit $43 $76
Adjusted Operating Margin 15.2% 17.5%
Engineered Papers
Sales $559 $549
GAAP Operating Profit $138 $116
Adjusted Operating Profit $142 $121
Adjusted Operating Margin 25.4% 22.1%
GAAP Unallocated Expenses $41 $40
Adjusted Unallocted Expenses $41 $40
Adj. % of Consolidated Sales 4.8% 4.1%
Advanced Materials & Structures
• AMS sales increased 54% due to Conwed acquisition and
4% organic sales growth, adjusted OP up nearly 80%
• Conwed acquisition achieved financial targets and early-stage synergy
milestones
• Double-digit growth in surface protection films for transportation, gains in
Medical and Industrial
• Positive mix, Conwed’s strong profitability and synergies contributed to margin
expansion
• Segment optimization underway - footprint rationalization, commercial
realignment, system-wide IT integration
• EP sales down 2%, adjusted OP margin contracted versus
a strong 2016
• Volume was down 3%, price/mix was neutral, currency was positive
• Traditional RTL declined as anticipated, but was partially offset by HnB ramp-
up
• Step-down in LIP royalty rate impacted sales and profits, as expected, due to
contract terms…rate will remain intact through 2022
• Lower volumes and price concessions also impacted OP margins
2017 Segment Highlights
NOTE: Adjusted measures are non-GAAP and are reconciled to GAAP measures in the appendix of this presentation
© 2018 Schweitzer-Mauduit International, Inc. Confidential 20
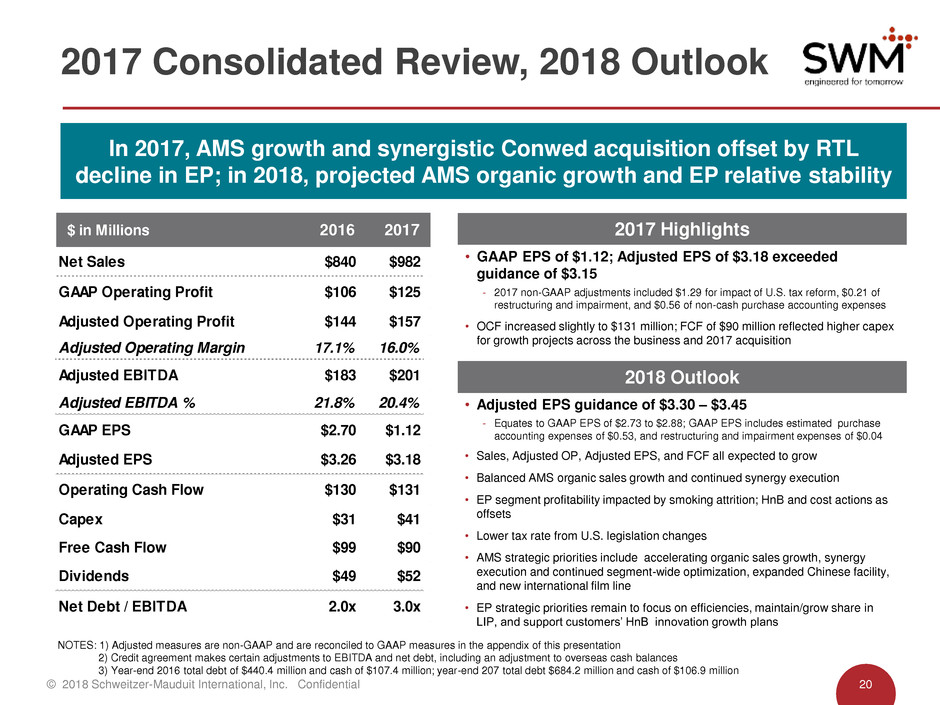
2017 Consolidated Review, 2018 Outlook
$ in Millions 2016 2017
Net Sales $840 $982
GAAP Operating Profit $106 $125
Adjusted Operating Profit $144 $157
Adjusted Operating Margin 17.1% 16.0%
Adjusted EBITDA $183 $201
Adjusted EBITDA % 21.8% 20.4%
GAAP EPS $2.70 $1.12
Adjusted EPS $3.26 $3.18
Operating Cash Flow $130 $131
Capex $31 $41
Free Cash Flow $99 $90
Dividends $49 $52
Net Debt / EBITDA 2.0x 3.0x
2017 Highlights
• GAAP EPS of $1.12; Adjusted EPS of $3.18 exceeded
guidance of $3.15
- 2017 non-GAAP adjustments included $1.29 for impact of U.S. tax reform, $0.21 of
restructuring and impairment, and $0.56 of non-cash purchase accounting expenses
• OCF increased slightly to $131 million; FCF of $90 million reflected higher capex
for growth projects across the business and 2017 acquisition
In 2017, AMS growth and synergistic Conwed acquisition offset by RTL
decline in EP; in 2018, projected AMS organic growth and EP relative stability
2018 Outlook
• Adjusted EPS guidance of $3.30 – $3.45
- Equates to GAAP EPS of $2.73 to $2.88; GAAP EPS includes estimated purchase
accounting expenses of $0.53, and restructuring and impairment expenses of $0.04
• Sales, Adjusted OP, Adjusted EPS, and FCF all expected to grow
• Balanced AMS organic sales growth and continued synergy execution
• EP segment profitability impacted by smoking attrition; HnB and cost actions as
offsets
• Lower tax rate from U.S. legislation changes
• AMS strategic priorities include accelerating organic sales growth, synergy
execution and continued segment-wide optimization, expanded Chinese facility,
and new international film line
• EP strategic priorities remain to focus on efficiencies, maintain/grow share in
LIP, and support customers’ HnB innovation growth plans
NOTES: 1) Adjusted measures are non-GAAP and are reconciled to GAAP measures in the appendix of this presentation
2) Credit agreement makes certain adjustments to EBITDA and net debt, including an adjustment to overseas cash balances
3) Year-end 2016 total debt of $440.4 million and cash of $107.4 million; year-end 207 total debt $684.2 million and cash of $106.9 million
© 2018 Schweitzer-Mauduit International, Inc. Confidential 21
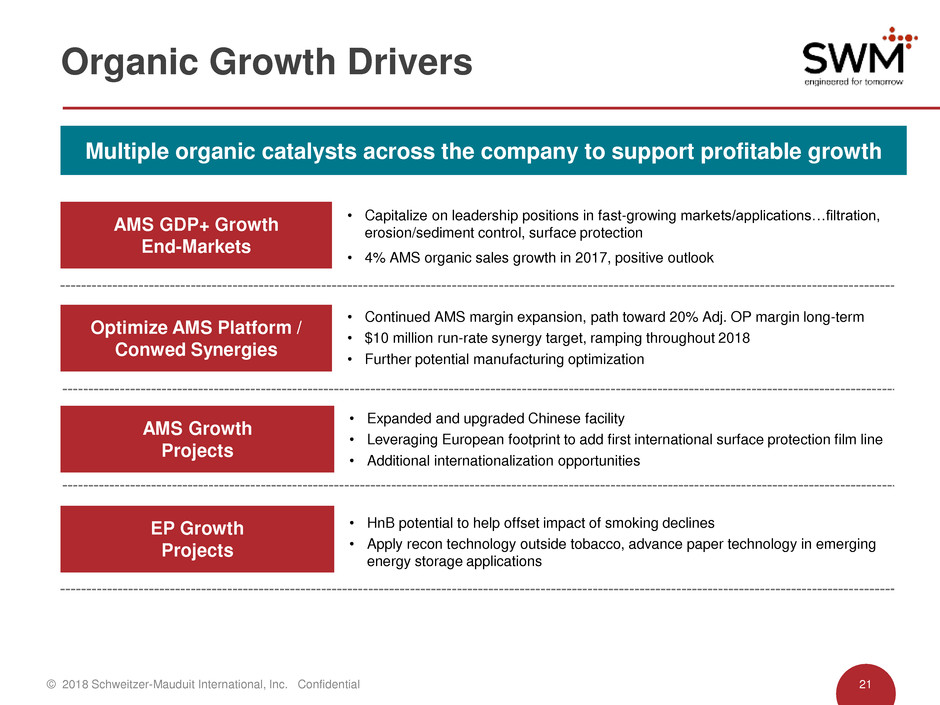
Multiple organic catalysts across the company to support profitable growth
Organic Growth Drivers
• Continued AMS margin expansion, path toward 20% Adj. OP margin long-term
• $10 million run-rate synergy target, ramping throughout 2018
• Further potential manufacturing optimization
Optimize AMS Platform /
Conwed Synergies
• Capitalize on leadership positions in fast-growing markets/applications…filtration,
erosion/sediment control, surface protection
• 4% AMS organic sales growth in 2017, positive outlook
AMS GDP+ Growth
End-Markets
• Expanded and upgraded Chinese facility
• Leveraging European footprint to add first international surface protection film line
• Additional internationalization opportunities
AMS Growth
Projects
• HnB potential to help offset impact of smoking declines
• Apply recon technology outside tobacco, advance paper technology in emerging
energy storage applications
EP Growth
Projects
© 2018 Schweitzer-Mauduit International, Inc. Confidential 22
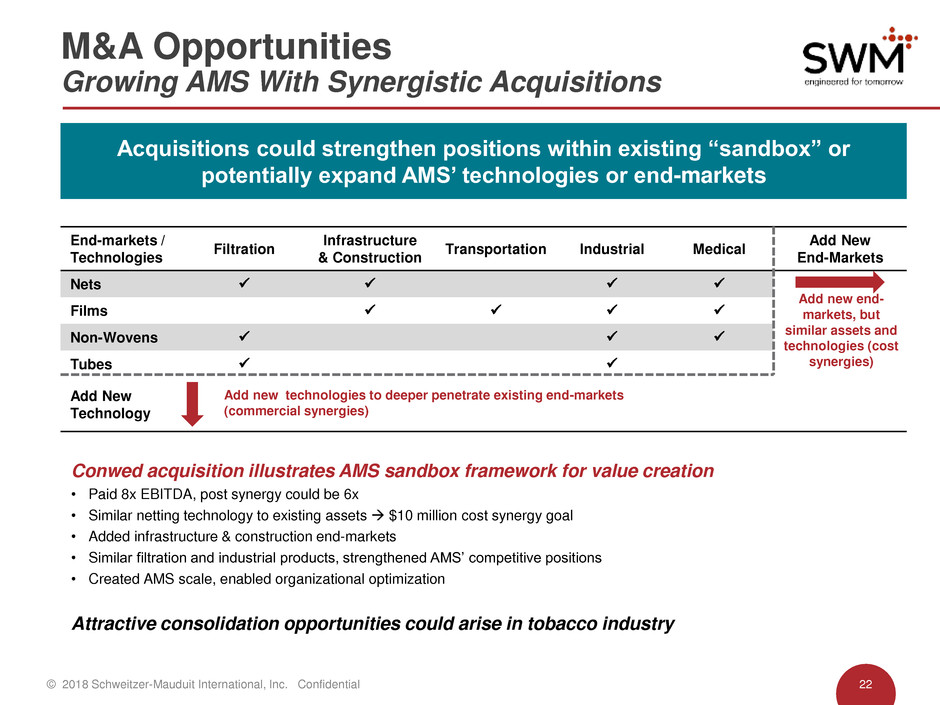
Acquisitions could strengthen positions within existing “sandbox” or
potentially expand AMS’ technologies or end-markets
M&A Opportunities
Growing AMS With Synergistic Acquisitions
End-markets /
Technologies
Filtration
Infrastructure
& Construction
Transportation Industrial Medical
Add New
End-Markets
Nets
Films
Non-Wovens
Tubes
Add New
Technology
Add new end-
markets, but
similar assets and
technologies (cost
synergies)
Add new technologies to deeper penetrate existing end-markets
(commercial synergies)
Conwed acquisition illustrates AMS sandbox framework for value creation
• Paid 8x EBITDA, post synergy could be 6x
• Similar netting technology to existing assets $10 million cost synergy goal
• Added infrastructure & construction end-markets
• Similar filtration and industrial products, strengthened AMS’ competitive positions
• Created AMS scale, enabled organizational optimization
Attractive consolidation opportunities could arise in tobacco industry
© 2018 Schweitzer-Mauduit International, Inc. Confidential 23
APPENDIX
Non-GAAP Reconciliations & Supplemental Data
Historical Segment Financials
© 2018 Schweitzer-Mauduit International, Inc. Confidential 24
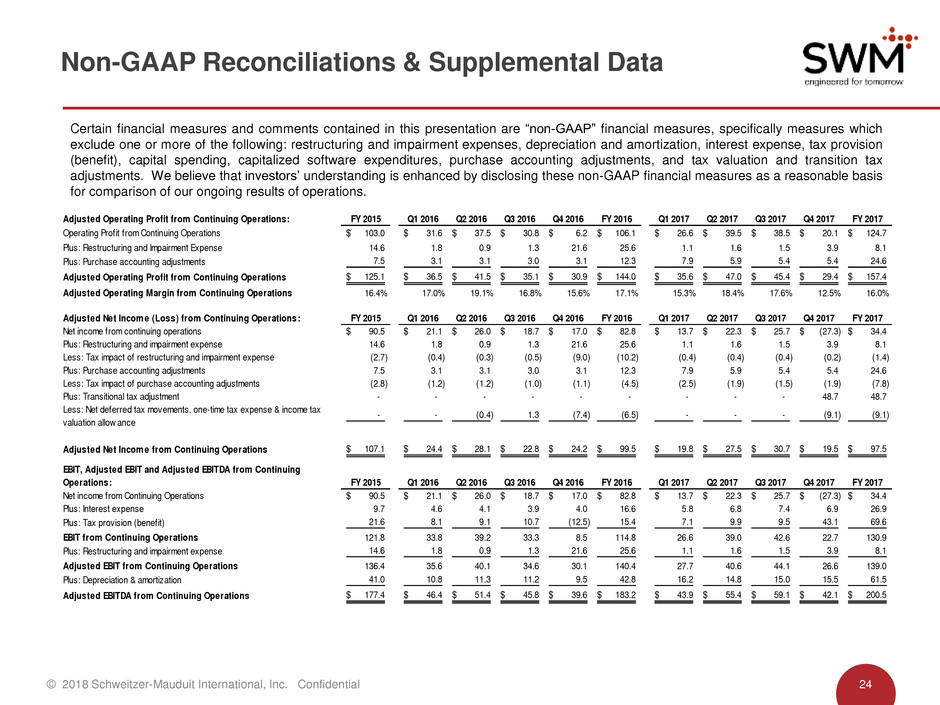
Non-GAAP Reconciliations & Supplemental Data
Certain financial measures and comments contained in this presentation are “non-GAAP” financial measures, specifically measures which
exclude one or more of the following: restructuring and impairment expenses, depreciation and amortization, interest expense, tax provision
(benefit), capital spending, capitalized software expenditures, purchase accounting adjustments, and tax valuation and transition tax
adjustments. We believe that investors’ understanding is enhanced by disclosing these non-GAAP financial measures as a reasonable basis
for comparison of our ongoing results of operations.
Adjusted Operating Profit from Continuing Operations: FY 2015 Q1 2016 Q2 2016 Q3 2016 Q4 2016 FY 2016 Q1 2017 Q2 2017 Q3 2017 Q4 2017 FY 2017
Operating Profit from Continuing Operations 103.0$ 31.6$ 37.5$ 30.8$ 6.2$ 106.1$ 26.6$ 39.5$ 38.5$ 20.1$ 124.7$
Plus: Restructuring and Impairment Expense 14.6 1.8 0.9 1.3 21.6 25.6 1.1 1.6 1.5 3.9 8.1
Plus: Purchase accounting adjustments 7.5 3.1 3.1 3.0 3.1 12.3 7.9 5.9 5.4 5.4 24.6
Adjusted Operating Profit from Continuing Operations 125.1$ 36.5$ 41.5$ 35.1$ 30.9$ 144.0$ 35.6$ 47.0$ 45.4$ 29.4$ 157.4$
Adjusted Operating Margin from Continuing Operations 16.4% 17.0% 19.1% 16.8% 15.6% 17.1% 15.3% 18.4% 17.6% 12.5% 16.0%
Adjusted Net Income (Loss) from Continuing Operations: FY 2015 Q1 2016 Q2 2016 Q3 2016 Q4 2016 FY 2016 Q1 2017 Q2 2017 Q3 2017 Q4 2017 FY 2017
Net income from continuing operations 90.5$ 21.1$ 26.0$ 18.7$ 17.0$ 82.8$ 13.7$ 22.3$ 25.7$ (27.3)$ 34.4$
Plus: Restructuring and impairment expense 14.6 1.8 0.9 1.3 21.6 25.6 1.1 1.6 1.5 3.9 8.1
Less: Tax impact of restructuring and impairment expense (2.7) (0.4) (0.3) (0.5) (9.0) (10.2) (0.4) (0.4) (0.4) (0.2) (1.4)
Plus: Purchase accounting adjustments 7.5 3.1 3.1 3.0 3.1 12.3 7.9 5.9 5.4 5.4 24.6
Less: Tax impact of purchase accounting adjustments (2.8) (1.2) (1.2) (1.0) (1.1) (4.5) (2.5) (1.9) (1.5) (1.9) (7.8)
Plus: Transitional tax adjustment - - - - - - - - - 48.7 48.7
Less: Net deferred tax movements, one-time tax expense & income tax
valuation allow ance
- - (0.4) 1.3 (7.4) (6.5) - - - (9.1) (9.1)
Adjusted Net Income from Continuing Operations 107.1$ 24.4$ 28.1$ 22.8$ 24.2$ 99.5$ 19.8$ 27.5$ 30.7$ 19.5$ 97.5$
EBIT, Adjusted EBIT and Adjusted EBITDA from Continuing
Operations: FY 2015 Q1 2016 Q2 2016 Q3 2016 Q4 2016 FY 2016 Q1 2017 Q2 2017 Q3 2017 Q4 2017 FY 2017
Net income from Continuing Operations 90.5$ 21.1$ 26.0$ 18.7$ 17.0$ 82.8$ 13.7$ 22.3$ 25.7$ (27.3)$ 34.4$
Plus: Int t e p se 9.7 4.6 4.1 3.9 4.0 16.6 5.8 6.8 7.4 6.9 26.9
Plus: Tax provision (benefit) 21.6 8.1 9.1 10.7 (12.5) 15.4 7.1 9.9 9.5 43.1 69.6
EBIT from Continuing Operations 121.8 33.8 39.2 33.3 8.5 114.8 26.6 39.0 42.6 22.7 130.9
Plus: Restructuring and impairment expense 14.6 1.8 0.9 1.3 21.6 25.6 1.1 1.6 1.5 3.9 8.1
Adjusted EBIT from Continuing Operations 136.4 35.6 40.1 34.6 30.1 140.4 27.7 40.6 44.1 26.6 139.0
Plus: Depreciation & amortization 41.0 10.8 11.3 11.2 9.5 42.8 16.2 14.8 15.0 15.5 61.5
Adjusted EBITDA from Continuing Operations 177.4$ 46.4$ 51.4$ 45.8$ 39.6$ 183.2$ 43.9$ 55.4$ 59.1$ 42.1$ 200.5$
© 2018 Schweitzer-Mauduit International, Inc. Confidential 25
Non-GAAP Reconciliations & Supplemental Data
Certain financial measures and comments contained in this presentation are “non-GAAP” financial measures, specifically measures which
exclude one or more of the following: restructuring and impairment expenses, depreciation and amortization, interest expense, tax provision
(benefit), capital spending, capitalized software expenditures, purchase accounting adjustments, and tax valuation and transition tax
adjustments. We believe that investors’ understanding is enhanced by disclosing these non-GAAP financial measures as a reasonable basis
for comparison of our ongoing results of operations.
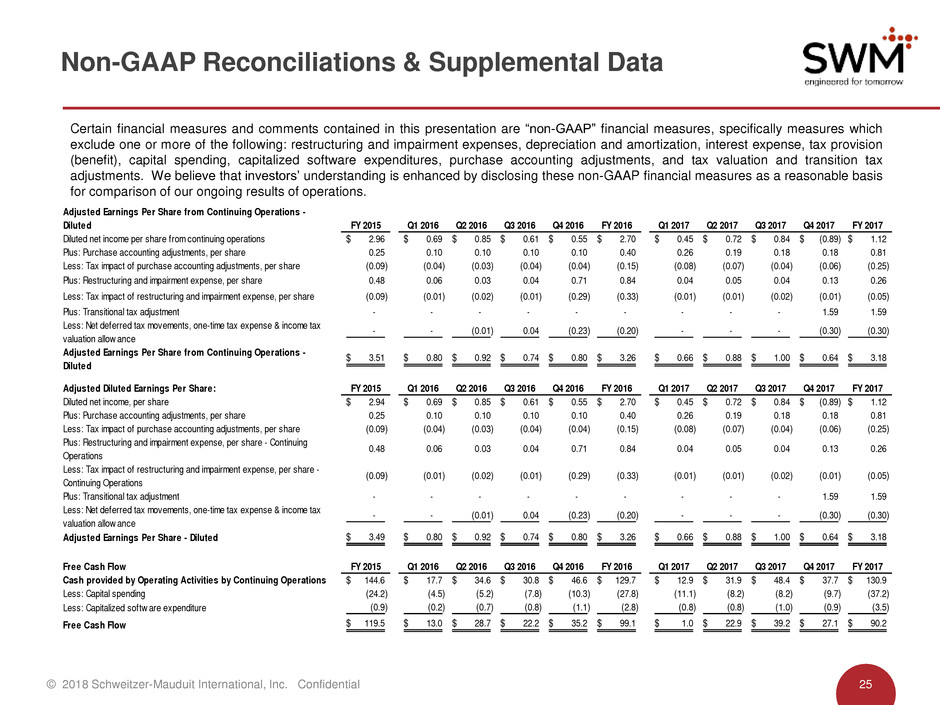
Adjusted Earnings Per Share from Continuing Operations -
Diluted FY 2015 Q1 2016 Q2 2016 Q3 2016 Q4 2016 FY 2016 Q1 2017 Q2 2017 Q3 2017 Q4 2017 FY 2017
Diluted net income per share from continuing operations 2.96$ 0.69$ 0.85$ 0.61$ 0.55$ 2.70$ 0.45$ 0.72$ 0.84$ (0.89)$ 1.12$
Plus: Purchase accounting adjustments, per share 0.25 0.10 0.10 0.10 0.10 0.40 0.26 0.19 0.18 0.18 0.81
Less: Tax impact of purchase accounting adjustments, per share (0.09) (0.04) (0.03) (0.04) (0.04) (0.15) (0.08) (0.07) (0.04) (0.06) (0.25)
Plus: Restructuring and impairment expense, per share 0.48 0.06 0.03 0.04 0.71 0.84 0.04 0.05 0.04 0.13 0.26
Less: Tax impact of restructuring and impairment expense, per share (0.09) (0.01) (0.02) (0.01) (0.29) (0.33) (0.01) (0.01) (0.02) (0.01) (0.05)
Plus: Transitional tax adjustment - - - - - - - - - 1.59 1.59
Less: Net deferred tax movements, one-time tax expense & income tax
valuation allow ance
- - (0.01) 0.04 (0.23) (0.20) - - - (0.30) (0.30)
Adjusted Earnings Per Share from Continuing Operations -
Diluted
3.51$ 0.80$ 0.92$ 0.74$ 0.80$ 3.26$ 0.66$ 0.88$ 1.00$ 0.64$ 3.18$
Adjusted Diluted Earnings Per Share: FY 2015 Q1 2016 Q2 2016 Q3 2016 Q4 2016 FY 2016 Q1 2017 Q2 2017 Q3 2017 Q4 2017 FY 2017
Diluted net income, per share 2.94$ 0.69$ 0.85$ 0.61$ 0.55$ 2.70$ 0.45$ 0.72$ 0.84$ (0.89)$ 1.12$
Plus: Purchase accounting adjustments, per share 0.25 0.10 0.10 0.10 0.10 0.40 0.26 0.19 0.18 0.18 0.81
Less: Tax impact of purchase accounting adjustments, per share (0.09) (0.04) (0.03) (0.04) (0.04) (0.15) (0.08) (0.07) (0.04) (0.06) (0.25)
Plus: Restructuring and impairment expense, per share - Continuing
Operations
0.48 0.06 0.03 0.04 0.71 0.84 0.04 0.05 0.04 0.13 0.26
Less: Tax impact of restructuring and impairment expense, per share -
Continuing Operations
(0.09) (0.01) (0.02) (0.01) (0.29) (0.33) (0.01) (0.01) (0.02) (0.01) (0.05)
Plus: Transitional tax adjustment - - - - - - - - - 1.59 1.59
Less: Net deferred tax movements, one-time tax expense & income tax
valuation allow ance
- - (0.01) 0.04 (0.23) (0.20) - - - (0.30) (0.30)
Adju t E rn gs Per Share - Diluted 3.49$ 0.80$ 0.92$ 0.74$ 0.80$ 3.26$ 0.66$ 0.88$ 1.00$ 0.64$ 3.18$
Free Cash Flow FY 2015 Q1 2016 Q2 2016 Q3 2016 Q4 2016 FY 2016 Q1 2017 Q2 2017 Q3 2017 Q4 2017 FY 2017
Cash provided by Operating Activities by Continuing Operations 144.6$ 17.7$ 34.6$ 30.8$ 46.6$ 129.7$ 12.9$ 31.9$ 48.4$ 37.7$ 130.9$
Less: Capital spending (24.2) (4.5) (5.2) (7.8) (10.3) (27.8) (11.1) (8.2) (8.2) (9.7) (37.2)
Less: Capitalized softw are expenditure (0.9) (0.2) (0.7) (0.8) (1.1) (2.8) (0.8) (0.8) (1.0) (0.9) (3.5)
Free Cash Flow 119.5$ 13.0$ 28.7$ 22.2$ 35.2$ 99.1$ 1.0$ 22.9$ 39.2$ 27.1$ 90.2$
© 2018 Schweitzer-Mauduit International, Inc. Confidential 26
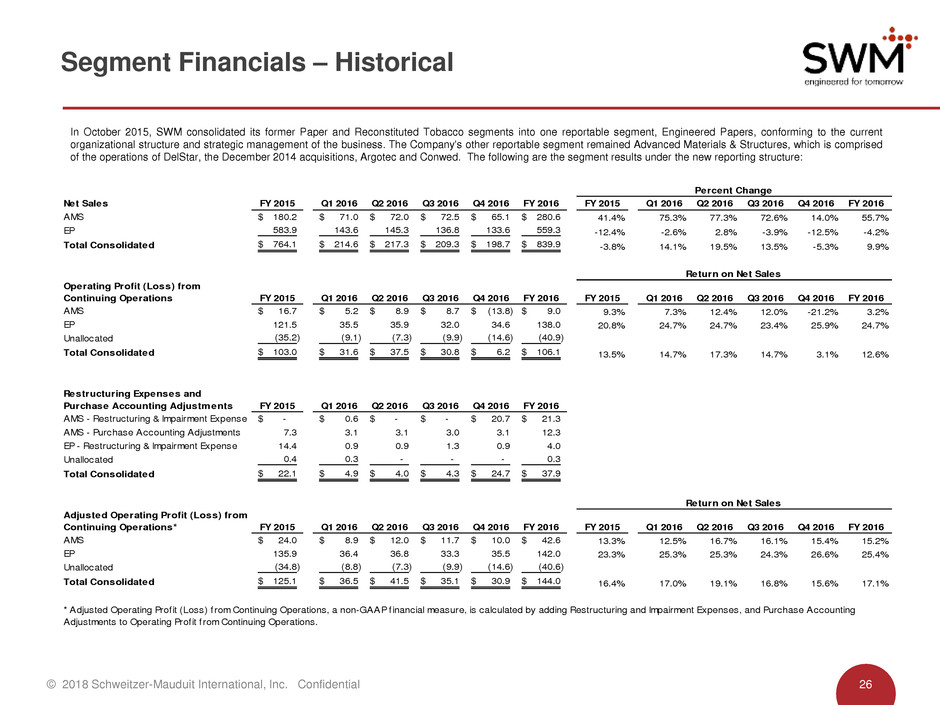
Segment Financials – Historical
In October 2015, SWM consolidated its former Paper and Reconstituted Tobacco segments into one reportable segment, Engineered Papers, conforming to the current
organizational structure and strategic management of the business. The Company's other reportable segment remained Advanced Materials & Structures, which is comprised
of the operations of DelStar, the December 2014 acquisitions, Argotec and Conwed. The following are the segment results under the new reporting structure:
Net Sales FY 2015 Q1 2016 Q2 2016 Q3 2016 Q4 2016 FY 2016 FY 2015 Q1 2016 Q2 2016 Q3 2016 Q4 2016 FY 2016
AMS 180.2$ 71.0$ 72.0$ 72.5$ 65.1$ 280.6$ 41.4% 75.3% 77.3% 72.6% 14.0% 55.7%
EP 583.9 143.6 145.3 136.8 133.6 559.3 -12.4% -2.6% 2.8% -3.9% -12.5% -4.2%
Total Consolidated 764.1$ 214.6$ 217.3$ 209.3$ 198.7$ 839.9$ -3.8% 14.1% 19.5% 13.5% -5.3% 9.9%
Operating Profit (Loss) from
Continuing Operations FY 2015 Q1 2016 Q2 2016 Q3 2016 Q4 2016 FY 2016 FY 2015 Q1 2016 Q2 2016 Q3 2016 Q4 2016 FY 2016
AMS 16.7$ 5.2$ 8.9$ 8.7$ (13.8)$ 9.0$ 9.3% 7.3% 12.4% 12.0% -21.2% 3.2%
EP 121.5 35.5 35.9 32.0 34.6 138.0 20.8% 24.7% 24.7% 23.4% 25.9% 24.7%
Unallocated (35.2) (9.1) (7.3) (9.9) (14.6) (40.9)
Total Consolidated 103.0$ 31.6$ 37.5$ 30.8$ 6.2$ 106.1$ 13.5% 14.7% 17.3% 14.7% 3.1% 12.6%
Restructuring Expenses and
Purchase Accounting Adjustments FY 2015 Q1 2016 Q2 2016 Q3 2016 Q4 2016 FY 2016
AMS - Restructuring & Impairment Expense -$ 0.6$ -$ -$ 20.7$ 21.3$
AMS - Purchase Accounting Adjustments 7.3 3.1 3.1 3.0 3.1 12.3
EP - Restructuring & Impairment Expense 14.4 0.9 0.9 1.3 0.9 4.0
Unallocated 0.4 0.3 - - - 0.3
Total Consolidated 22.1$ 4.9$ 4.0$ 4.3$ 24.7$ 37.9$
Adjusted Operating Profit (Loss) from
Continuing Operations* FY 2015 Q1 2016 Q2 2016 Q3 2016 Q4 2016 FY 2016 FY 2015 Q1 2016 Q2 2016 Q3 2016 Q4 2016 FY 2016
AMS 24.0$ 8.9$ 12.0$ 11.7$ 10.0$ 42.6$ 13.3% 12.5% 16.7% 16.1% 15.4% 15.2%
EP 135.9 36.4 36.8 33.3 35.5 142.0 23.3% 25.3% 25.3% 24.3% 26.6% 25.4%
Unallocated (34.8) (8.8) (7.3) (9.9) (14.6) (40.6)
Total Consolidated 125.1$ 36.5$ 41.5$ 35.1$ 30.9$ 144.0$ 16.4% 17.0% 19.1% 16.8% 15.6% 17.1%
Percent Change
Return on Net Sales
* Adjusted Operating Profit (Loss) from Continuing Operations, a non-GAAP financial measure, is calculated by adding Restructuring and Impairment Expenses, and Purchase Accounting
Adjustments to Operating Profit from Continuing Operations.
Return on Net Sales
© 2018 Schweitzer-Mauduit International, Inc. Confidential 27
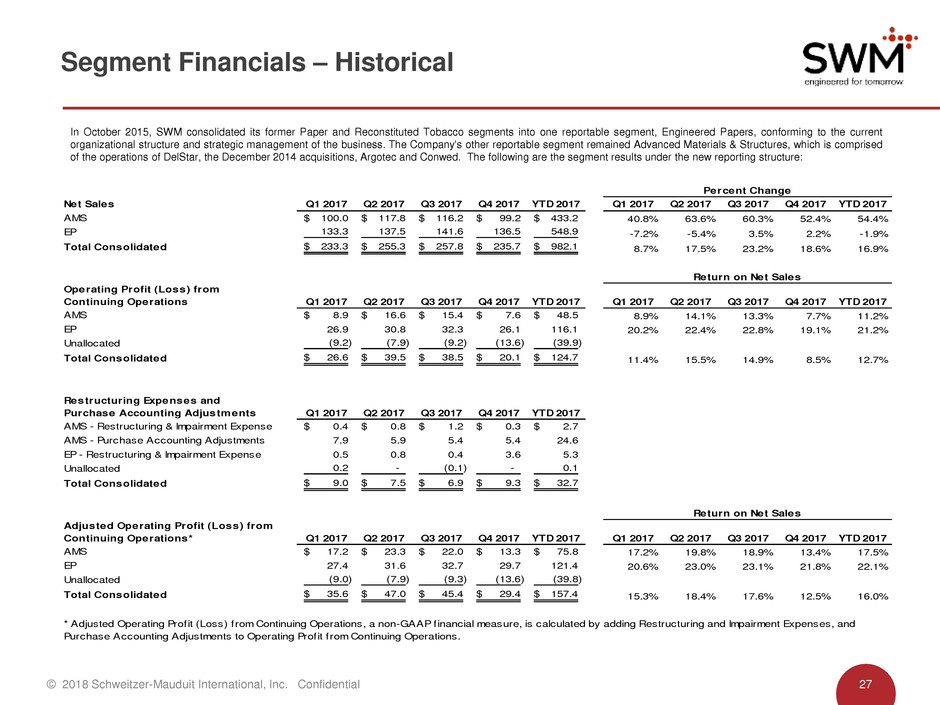
Segment Financials – Historical
In October 2015, SWM consolidated its former Paper and Reconstituted Tobacco segments into one reportable segment, Engineered Papers, conforming to the current
organizational structure and strategic management of the business. The Company's other reportable segment remained Advanced Materials & Structures, which is comprised
of the operations of DelStar, the December 2014 acquisitions, Argotec and Conwed. The following are the segment results under the new reporting structure:
Net Sales Q1 2017 Q2 2017 Q3 2017 Q4 2017 YTD 2017 Q1 2017 Q2 2017 Q3 2017 Q4 2017 YTD 2017
AMS 100.0$ 117.8$ 116.2$ 99.2$ 433.2$ 40.8% 63.6% 60.3% 52.4% 54.4%
EP 133.3 137.5 141.6 136.5 548.9 -7.2% -5.4% 3.5% 2.2% -1.9%
Total Consolidated 233.3$ 255.3$ 257.8$ 235.7$ 982.1$ 8.7% 17.5% 23.2% 18.6% 16.9%
Operating Profit (Loss) from
Continuing Operations Q1 2017 Q2 2017 Q3 2017 Q4 2017 YTD 2017 Q1 2017 Q2 2017 Q3 2017 Q4 2017 YTD 2017
AMS 8.9$ 16.6$ 15.4$ 7.6$ 48.5$ 8.9% 14.1% 13.3% 7.7% 11.2%
EP 26.9 30.8 32.3 26.1 116.1 20.2% 22.4% 22.8% 19.1% 21.2%
Unallocated (9.2) (7.9) (9.2) (13.6) (39.9)
Total Consolidated 26.6$ 39.5$ 38.5$ 20.1$ 124.7$ 11.4% 15.5% 14.9% 8.5% 12.7%
Restructuring Expenses and
Purchase Accounting Adjustments Q1 2017 Q2 2017 Q3 2017 Q4 2017 YTD 2017
AMS - Restructuring & Impairment Expense 0.4$ 0.8$ 1.2$ 0.3$ 2.7$
AMS - Purchase Accounting Adjustments 7.9 5.9 5.4 5.4 24.6
EP - Restructuring & Impairment Expense 0.5 0.8 0.4 3.6 5.3
Unallocated 0.2 - (0.1) - 0.1
Total Consolidated 9.0$ 7.5$ 6.9$ 9.3$ 32.7$
Adjusted Operating Profit (Loss) from
Continuing Operations* Q1 2017 Q2 2017 Q3 2017 Q4 2017 YTD 2017 Q1 2017 Q2 2017 Q3 2017 Q4 2017 YTD 2017
AMS 17.2$ 23.3$ 22.0$ 13.3$ 75.8$ 17.2% 19.8% 18.9% 13.4% 17.5%
EP 27.4 31.6 32.7 29.7 121.4 20.6% 23.0% 23.1% 21.8% 22.1%
Unallocated (9.0) (7.9) (9.3) (13.6) (39.8)
Total Consolidated 35.6$ 47.0$ 45.4$ 29.4$ 157.4$ 15.3% 18.4% 17.6% 12.5% 16.0%
Percent Change
Return on Net Sales
Return on Net Sales
* Adjusted Operating Profit (Loss) from Continuing Operations, a non-GAAP financial measure, is calculated by adding Restructuring and Impairment Expenses, and
Purchase Accounting Adjustments to Operating Profit from Continuing Operations.
