Attached files
| file | filename |
|---|---|
| EX-32.2 - EXHIBIT 32.2 - MULESOFT, INC | mule10-k12312017exx322.htm |
| EX-32.1 - EXHIBIT 32.1 - MULESOFT, INC | mule10-k12312017exx321.htm |
| EX-31.2 - EXHIBIT 31.2 - MULESOFT, INC | mule10-k12312017exx312.htm |
| EX-31.1 - EXHIBIT 31.1 - MULESOFT, INC | mule10-k12312017exx311.htm |
| EX-23.1 - EXHIBIT 23.1 - MULESOFT, INC | mule10-k12312017exx231.htm |
| EX-21.1 - EXHIBIT 21.1 - MULESOFT, INC | mule10-k12312017exx211.htm |
| EX-10.3 - EXHIBIT 10.3 - MULESOFT, INC | mule10-k12312017exx103.htm |
UNITED STATES
SECURITIES AND EXCHANGE COMMISSION
Washington, D.C. 20549
FORM 10-K
(Mark One)
☒ | ANNUAL REPORT PURSUANT TO SECTION 13 OR 15(d) OF THE SECURITIES EXCHANGE ACT OF 1934 |
For the fiscal year ended December 31, 2017
OR
☐ | TRANSITION REPORT PURSUANT TO SECTION 13 OR 15(d) OF THE SECURITIES EXCHANGE ACT OF 1934 |
For the transition period from
to
Commission File Number 001-38031
MuleSoft, Inc. (Exact name of Registrant as specified in its Charter) |
Delaware | 20-5158650 | |
(State or other jurisdiction of incorporation or organization) | (I.R.S. Employer Identification No.) | |
77 Geary Street, Suite 400
San Francisco, California 94108
(Address of principal executive offices including zip code)
Registrant’s telephone number, including area code: (415) 229-2009
Securities registered pursuant to Section 12(b) of the Act:
Title of each class | Name of each exchange on which registered | |
Class A common stock, par value $0.000025 per share | New York Stock Exchange | |
Securities registered pursuant to Section 12(g) of the Act: None
Indicate by check mark if the Registrant is a well-known seasoned issuer, as defined in Rule 405 of the Securities Act. YES ☐ NO ☒
Indicate by check mark if the Registrant is not required to file reports pursuant to Section 13 or 15(d) of the Act. YES ☐ NO ☒
Indicate by check mark whether the Registrant: (1) has filed all reports required to be filed by Section 13 or 15(d) of the Securities Exchange Act of 1934 during the preceding 12 months (or for such shorter period that the Registrant was required to file such reports), and (2) has been subject to such filing requirements for the past 90 days. YES ☒ NO ☐
Indicate by check mark whether the Registrant has submitted electronically and posted on its corporate Web site, if any, every Interactive Data File required to be submitted and posted pursuant to Rule 405 of Regulation S-T (§232.405 of this chapter) during the preceding 12 months (or for such shorter period that the Registrant was required to submit and post such files). YES ☒ NO ☐
Indicate by check mark if disclosure of delinquent filers pursuant to Item 405 of Regulation S-K (§229.405 of this chapter) is not contained herein, and will not be contained to the best of registrant’s knowledge, in definitive proxy or information statements incorporated by reference in Part III of this Form 10-K or any amendment to this Form 10-K. ☒
1
Indicate by check mark whether the Registrant is a large accelerated filer, an accelerated filer, a non-accelerated filer, or a smaller reporting company. See the definition of “large accelerated filer”, “accelerated filer”, and “smaller reporting company” in Rule 12b-2 of the Exchange Act. (Check one):
Large accelerated filer | ☐ | Accelerated filer | ☐ |
Non-accelerated filer | ☒ (Do not check if a small reporting company) | Small reporting company | ☐ |
Emerging growth company | ☒ | ||
If an emerging growth company, indicate by check mark if the registrant has elected not to use the extended transition period for complying with any new or revised financial accounting standards provided pursuant to Section 13(a) of the Exchange Act. ☒
The aggregate market value of the voting and non-voting common equity held by non-affiliates of the Registrant, based on the closing price of the shares of Class A common stock on the New York Stock Exchange on June 30, 2017, was approximately $2.1 billion.
Indicate by check mark whether the Registrant is a shell company (as defined in Rule 12b-2 of the Exchange Act). YES ☐ NO ☒
As of January 31, 2018, the number of outstanding shares of the Registrant’s Class A Common Stock was 88,896,679 and the number of outstanding shares of the Registrant’s Class B Common Stock was 42,604,261.
Portions of the Registrant’s Definitive Proxy Statement relating to the Annual Meeting of Stockholders, which will be filed with the Securities and Exchange Commission no later than 120 days after the Registrant’s fiscal year ended on December 31, 2017, are incorporated by reference into Part III of this Annual Report on Form 10-K.
2
Table of Contents
Page | ||
3
SPECIAL NOTE REGARDING FORWARD-LOOKING STATEMENTS
This Annual Report on Form 10-K contains forward-looking statements within the meaning of the federal securities laws, which statements involve substantial risks and uncertainties. Forward-looking statements generally relate to future events or our future financial or operating performance. In some cases, you can identify forward-looking statements because they contain words such as “may,” “will,” “should,” “expects,” “plans,” “anticipates,” “could,” “intends,” “target,” “projects,” “contemplates,” “believes,” “estimates,” “predicts,” “potential” or “continue” or the negative of these words or other similar terms or expressions that concern our expectations, strategy, plans or intentions. Forward-looking statements contained in this Annual Report on Form 10-K include, but are not limited to, statements about:
• | our ability to attract and retain customers, including larger organizations; |
• | our ability to deepen our relationships with existing customers; |
• | our expectations regarding our customer growth rate; |
• | our business plan and beliefs and objectives for future operations; |
• | trends associated with our industry and potential market, including the adoption of application networks; |
• | benefits associated with use of our platform and services; |
• | our ability to develop or acquire new products and services, improve our platform and services and increase the value of our platform and services; |
• | our ability to compete successfully against current and future competitors; |
• | the network effects associated with our business; |
• | our ability to further develop strategic relationships; |
• | our ability to achieve positive returns on investments; |
• | our plans to further invest in and grow our business, and our ability to effectively manage our growth and associated investments; |
• | our ability to timely and effectively scale and adapt our existing technology; |
• | our ability to increase our revenue, our revenue growth rate and our gross margin; |
• | our future financial performance, including trends in revenue, cost of revenue, operating expenses, other income and expenses, income taxes, billings, customers and dollar-based net retention rate; |
• | the sufficiency of our cash and cash equivalents and cash generated from operations to meet our working capital and capital expenditure requirements; |
• | our ability to attract, train, and retain qualified employees and key personnel; |
• | our ability to maintain and benefit from our corporate culture; |
• | our ability to successfully identify, acquire and integrate companies and assets; |
• | our ability to successfully enter new markets and manage our international expansion; and |
• | our ability to maintain, protect and enhance our intellectual property and not infringe upon others’ intellectual property. |
We caution you that the foregoing list may not contain all of the forward-looking statements made in this Annual Report on Form 10-K.
You should not rely upon forward-looking statements as predictions of future events. We have based the forward-looking statements contained in this Annual Report on Form 10-K primarily on our current expectations and projections about future events and trends that we believe may affect our business, financial condition, results of operations and prospects. The outcome of the events described in these forward-looking statements is subject to risks, uncertainties and other factors described in the section titled “Risk Factors” and elsewhere in this Annual Report on Form 10-K. Moreover, we operate in a very competitive and rapidly changing environment. New risks and uncertainties emerge from time to time and it is not possible for us to predict all risks and uncertainties that could have an impact on the forward-looking statements contained in this Annual Report on Form 10-K. We cannot assure you that the results, events and circumstances reflected in the forward-looking statements will be achieved or occur, and actual results, events or circumstances could differ materially from those described in the forward-looking statements.
The forward-looking statements made in this Annual Report on Form 10-K relate only to events as of the date on which the statements are made. We undertake no obligation to update any forward-looking statements made in this Annual Report on Form 10-K to reflect events or circumstances after the date of this Annual Report on Form 10-K or to reflect new information or the occurrence of unanticipated events, except as required by law. We may not actually achieve the plans, intentions or expectations disclosed in our forward-looking statements and you should not place undue reliance on our forward-looking statements. Our forward-looking statements do not reflect the potential impact of any future acquisitions, mergers, dispositions, joint ventures or investments we may make.
4
PART I
Item 1. Business
Overview
Our mission is to help organizations change and innovate faster by making it easy to connect the world’s applications, data and devices.
We are entering a new era of business with the rise of the composable enterprise. Competitive advantage is no longer primarily determined by the physical assets organizations own and control, but rather by how they connect and orchestrate a multitude of physical and technology assets, employees, customers, and suppliers. In this new era, winning organizations are composable enterprises that can quickly and effectively adopt new technologies and rapidly connect these assets to drive competitive advantage. To become composable enterprises, organizations must redefine their technology operating models by migrating from heavy and hardwired architectures to a lighter, more agile approach, using building blocks that can be rapidly connected to compose more innovative applications.
The convergence of major technology forces, such as mobile, social, software-as-a-service (SaaS), cloud, big data, and Internet of Things (IoT), is driving the shift to composability and creating disruption across almost every industry. Organizations are investing heavily in these new technologies to create differentiated customer experiences, new revenue channels, and entirely new business models. This is creating a massive need to connect these increasingly distributed new technologies. For example, a new mobile banking app will not only draw data from existing customer and financial systems but also from payments engines, location-based services, mobile security services, and dozens of other systems and data sources. Similarly, in healthcare, patient outcomes depend on real-time connectivity to patient profiles and portals, electronic medical record systems, prescription records, wearable devices, laboratory data, and mobile wellness applications.
These new technology trends are placing unrelenting demands on a legacy technology operating model that already has limited capacity to deliver new projects. IT organizations have typically delivered one-off custom projects built with tightly coupled point-to-point connections that are inflexible, costly, difficult to manage, and unable to be reused and adapted to ever-changing business requirements. As a result, technology infrastructure has become the bottleneck to transformation rather than the enabler.
We are enabling a fundamental shift in organizations’ technology operating models by equipping them to create composable, agile infrastructures. Composability is a design principle that involves assembling, combining, and orchestrating IT assets as components to create new or modified applications. Our customers use our Anypoint Platform to connect their applications, data and devices into an “application network” where systems are pluggable instead of glued together with custom integration code. The application network enables a self-serve infrastructure through discoverable building blocks, or nodes, that can be used and reused to rapidly compose applications. With an application network built with Anypoint Platform, organizations can transform into composable enterprises.
Anypoint Platform enables our customers to change and innovate faster by resolving the IT bottleneck. It speeds innovation by empowering developers to experiment and prototype new solutions, and freeing IT from writing manual integrations. Our platform does not require customers to uninstall or replace any existing IT investments. Instead, customers can connect existing investments as nodes on the application network for continued reuse, which can dramatically increase the longevity of, and return on, these assets. Our flexible architecture and universal connectivity are designed to ensure that, as new technologies are developed, organizations can easily integrate those new technologies into their application networks, which protects our customers from technology obsolescence and competitive disruption. The application network increases in value as new nodes are added. Each node is reusable for new services applications, resulting in network effects that drive speed and agility and lower costs.
Anypoint Platform is a single, unified platform that includes the key technology components required for IT architects, developers, and systems administrators to easily build and rapidly scale their application networks. It includes a universal connectivity model, end-to-end API lifecycle capabilities, a resilient and scalable runtime engine, enterprise-grade governance and security, and a collaborative engagement exchange for self-serve discovery and reuse of IT assets. Anypoint Platform facilitates continual change and seamlessly connects and orchestrates an ever-increasing volume of applications, data and devices, whether they are owned and on-premises, provided by partners, or delivered as cloud services. Built for ease of use in a hybrid-cloud environment, our platform offers our customers the same capabilities whether deployed on-premises or in the cloud.
5
As of December 31, 2017, we had over 1,200 customers located in over 60 countries across every major industry. Although our platform can be adopted by organizations of nearly any size, we focus our sales efforts on the largest global organizations. Our direct sales force targets CIOs, IT architects, and other business leaders, who are driving digital transformation in their organizations. We also partner with system integrators (SIs) and independent software vendors (ISVs), which enhances our sales leverage by sourcing new prospects and providing systems integration services on implementations of our platform.
We have grown rapidly in recent periods. Our revenue for 2017, 2016, and 2015 was $296.5 million, $187.7 million, and $110.3 million, respectively, representing a growth rate of 58% and 70%, respectively. We incurred net losses of $80.0 million, $49.6 million, and $65.4 million in 2017, 2016, and 2015, respectively.
Our Growth Strategies
We intend to pursue the following growth strategies:
Extend Our Technology Leadership
We have a strong history of innovation. We intend to continue to invest in our platform and new features and technologies that drive more robust developer engagement, increase consumption and reuse of IT assets, and extend the reach of Anypoint Platform. We also intend to invest in technology areas that leverage the strategic position of the application network to expand our market opportunity. For example, we are making substantial investments in analytics and API security.
Drive New Customer Acquisition
We currently have over 1,200 customers, which we believe represents only a fraction of our total addressable customer base. We have expanded our platform to address a broader range of use cases, which has enabled us to become a more strategic partner to our customers. We plan to continue to invest in research and development, and sales and marketing to grow our customer base.
Expand Existing Customer Relationships
Our platform approach creates a sustainable land and expand business model. Over time our customers expand the use of our platform in two ways. First, they deploy additional capacity as the usage of applications built on our platform increases. Second, as they address additional use cases with their application network, their usage of our platform further increases. Our customers’ expanded use of our platform is evidenced by our high dollar-based net retention rate.
Cultivate Our Developer Community
We have attracted a growing community of over 235,000 developers. We believe that our engagement of developers increases our brand awareness and helps us target new customer opportunities. Our developer community is passionate about the capabilities of our platform to deliver the benefits of the application network, leading them to recommend our platform to others within their organizations and outside their organizations. We have critical mass and traction within the developer community, and we plan to expand our developer relations function to continue to cultivate our developer community.
Extend Our Partner Ecosystem
We have an extensive partner ecosystem of SIs and value added resellers, or VARs. Our partner ecosystem provides us with significant synergies including lead generation, new customer acquisition, accelerated deployment, and customer support. We intend to continue to develop and enhance these relationships to expand our market presence and drive channel leverage, and we expect to invest in new distribution channels and technology partners to continue to expand our distribution footprint.
Continue to Expand Internationally
Our platform addresses customer pain points that lack geographic borders. We have made substantial investments in building our global sales and marketing, service delivery, and customer support capabilities. In 2017, 38% of our revenue was generated outside of the United States, and we intend to continue to drive adoption of our platform globally.
6
Our Technology
We architected Anypoint Platform around a software design principle we have championed called “declarative modularity.” In this approach, components, or modules, of the system are built with contract-based interfaces, where interaction with the modules follows prescribed rules and outputs from that module carrying predictable properties and outcomes. Each module is built by declaring a single well-defined goal rather than being built as a programming construct that carries out a specific series of steps. In this approach, complex problems are broken down into simpler modules that are loosely coupled, which optimizes for change rather than just solving the original problem. Declarative modularity maintains the overall simplicity of the system even as the use cases become more complex over time, and the modules themselves can evolve without central coordination, driven by teams working independently. As long as the interfaces follow declaratively modular principles, changes to any of the modules will still yield predictable results based on the intent of each component.
The core integration engine of Anypoint Platform was built with a declaratively modular architecture, reducing the complex problem of integration to a small number of standardized building blocks that can be combined and orchestrated to solve any integration use case. Furthermore, declarative modularity allows our customers to deploy multiple integration use cases as a distributed network of containers rather than as a single complex hub. This results in a highly performant, massively scalable, yet easily managed architecture.
The declaratively modular architecture of the core engine allows the surrounding tools and modules to be loosely coupled as well, and therefore, they can be updated or changed without impacting or redesigning any of the other modules. As a result, we have been able to confidently drive multiple innovations on Anypoint Platform in parallel without fear of interference across the modules and their development teams. For example, declarative modularity has enabled us to decouple the core runtime engine, management, and design from infrastructural modules. This has allowed us to adapt the platform to run flexibly in on-premises datacenters, virtualized and private-cloud environments, multiple public clouds, and hybrid environments. It is also the basis of our universal connectivity model: connectivity to a new application or protocol simply means creating a module that “speaks the right language” and plugging it into the platform. Finally, the declarative modularity of the core runtime engine has enabled us to continually improve the surrounding developer tooling, make the user experience ever easier and more powerful over time, including two-way graphical editing, a new domain-specific language, or DSL, for data integration called DataWeave, and seamless integration with popular third-party development tools such as Eclipse, Maven, and Jenkins.
With declarative modularity, we are able to continually evolve our platform to deliver increasing value to our customers. We believe this design principal provides us with a competitive advantage and enables us to innovate faster than our competitors.
Key modules of Anypoint Platform include:
Anypoint Design Center
Anypoint Design Center provides intuitive, low-friction development tools that make it easy to design and test APIs, implement integration flows, and build connectors. The following are the core components of Anypoint Design Center:
• | Anypoint API Designer enables developers to create and share API designs by leveraging the widely used RESTful API Modeling Language, or RAML, which optimizes for ease of consumption. Anypoint API Designer’s features allow API developers and prospective consumers to iterate and improve the API design without having to implement the API. |
• | Anypoint Studio is a unified graphical design environment with a user-friendly drag-and-drop interface for implementing and composing the API building blocks for the application network. It features two-way graphical to XML configuration, visual debugging capabilities, and integration with the most popular open source development tools (e.g., Eclipse, Maven, Ant, SVN, Git, Jenkins). AnyPoint Studio includes: |
▪ | DataWeave, a simple, powerful tool to query and transform a wide variety of data formats (e.g., JSON, EDI, XML, COBOL Copybook). With DataWeave, users can do real-time integration, batch tasks such as data ingestion or synchronization, and filter, aggregate, and sort data to manage big data use cases. |
▪ | DataSense, a capability that aids in the discovery of the metadata of third-party APIs to simplify data integration of those applications. |
7
▪ | APIKit, a toolkit that facilitates API implementation using the RAML and WSDL programming standards. |
▪ | MUnit, our application testing framework that provides support to unit and integration testing on API building blocks. |
• | Connector DevKit is a software development kit with code templates and automatically generated test cases that enables users to build and package their own reusable connectors for any applications that do not already have Anypoint Connectors available out of the box. |
Anypoint Management Center
Anypoint Management Center provides a set of management capabilities accessible through a single interface, with real-time visibility into and control over API building blocks on the application network. The following are the core components of the Management Center:
• | Anypoint Runtime Manager provides a single interface for managing and monitoring deployments in the cloud, on-premises, or in hybrid environments. With Runtime Manager, users can deploy applications, upgrade to new versions of those applications, group servers into clusters, view performance metrics across environments, and connect to third party monitoring and operations tools already in use by the customer. |
• | Anypoint API Manager provides a single interface to manage API users, monitor API traffic, and secure APIs by provisioning access and enforcing policies. Users can manage existing APIs or new APIs that are developed on Anypoint Platform. |
• | Anypoint Analytics enables users to track key metrics on API usage, traffic volume and performance across the application network, as well as gain visibility into business transactions flowing across the network. Armed with this insight, customers can understand usage patterns, improve application network performance, and continually improve the quality of the nodes themselves. |
Anypoint Exchange
Anypoint Exchange is the engagement and collaboration exchange for developers both within and outside the enterprise and serves as the primary place for discovery and reuse of API-enabled IT assets. It houses the complete listing of connectors, templates, examples, and APIs available to users of the platform, as well as internal collaboration artifacts such as connectivity assets, documentation and ideas. Users can collaborate on Anypoint Exchange to provide feedback and drive continual improvement of the nodes, as well as contribute new assets to the application network for further reuse.
Mule Runtime Engine
Mule is the runtime engine at the core of Anypoint Platform, combining real-time application integration and orchestration with robust data integration capabilities, both real-time and batch. Mule can be deployed on-premises, in the cloud or consumed as service in CloudHub, MuleSoft's hosted iPaaS (Integration Platform as a Service) service. It is light enough to run on a laptop, but scales to support millions of transactions across an organization’s application network.
Anypoint Connectors
Anypoint Platform’s universal connectivity model provides quick connectivity to almost anything, including thousands of APIs as well as other protocols and all types of data formats. Developers can also build their own connectors using the Anypoint Connector DevKit, as well as use connectors that have been built and shared by other developers.
Runtime Services
We provide a range of platform services to speed, scale, and secure Anypoint Platform:
• | Anypoint MQ is the cloud-based multi-tenant messaging service for Anypoint Platform. It performs advanced asynchronous messaging scenarios such as queueing and publish-subscribe as a hosted and managed cloud service. |
8
• | Anypoint Fabric is designed to provide application uptime and zero message loss for integrations and APIs, whether on-premises or in the cloud. An in-memory data grid enables sharing of workloads between application instances while maintaining the state of information, as well as allowing for vertical or horizontal scalability. |
• | Anypoint Enterprise Security blocks unauthorized access to systems, prevents exposure of sensitive data, and prevents attacks through proactive threat management and integration. Organizations can restrict data access based on client IP addresses through simple drag-and-drop interfaces to apply policies and filters. Access credentials, confidential messages, and data can be encrypted and protected with digital signatures. Our platform utilizes federated identity to protect access to APIs and endpoints. |
• | Anypoint Virtual Private Cloud securely connects corporate data centers and on-premises applications to the cloud as though they were all part of a single private network. Networks can be secured at the hardware or software levels with industry-standard encryption procedures. Organizations can create tiered security levels within the cloud, create a secure connection between data centers and the cloud via a virtual private cloud gateway, and create secure connections with other clouds and cloud services. |
Multi-Modal Deployment
Anypoint Platform was built with the hybrid cloud in mind. Our platform includes multi-modal deployment capabilities, enabling our customers to flexibly deploy nodes on-premises, in our public cloud, in their own cloud, or in some combination. For customers who opt to leverage the public cloud option, CloudHub is the iPaaS component of Anypoint Platform, providing a managed, multi-tenant, globally available, and secure cloud platform for integration. With CloudHub, customers have no hardware to acquire, operate, or manage, and we manage operations and maintenance. As our customers’ cloud strategies evolve, their application networks built on Anypoint Platform can evolve with them without needing to rewrite their existing applications.
Competition
We believe that we are the pioneer in the market for application networks because we provide the only complete offering for building application networks. However, there are many other companies addressing various aspects of this market. As a result, the competitive landscape is fragmented and evolving. We compete against in-house or custom development efforts and a variety of legacy integration software vendors, such as IBM, Oracle, and TIBCO. We also compete with smaller specialized companies, such as Apigee, which is owned by Alphabet, and Dell Boomi. Larger and more established companies may offer integration and API solutions that directly compete with us. Smaller companies could also launch competing or new products and services.
We believe the principal competitive factors in our market are:
• | product features and functionality; |
• | ease of deployment and use; |
• | deployment options and flexibility; |
• | professional services and customer support; |
• | brand awareness and reputation; |
• | total cost of ownership; |
• | global reach; and |
• | capability for customization, configurability, integration, security, scalability, and reliability. |
We believe we compete favorably on the basis of the above factors. Some of our competitors have advantages over us, such as greater financial, technical, marketing, research and development or other resources, stronger brand and business user recognition, larger installed customer bases, larger intellectual property portfolios, and broader global distribution and presence.
Geographic Information
For a description of our revenue and long-lived assets by geographic location, see Note 9 of the notes to our consolidated financial statements included elsewhere in this Annual Report on Form 10-K.
9
Employees
As of December 31, 2017, we had a total of 1,188 employees. None of our employees are represented by a labor union with respect to his or her employment with us. Our employees in certain European countries have the benefits of collective bargaining agreements at the national level. We have not experienced any work stoppages, and we consider our relations with our employees to be good.
Facilities
Our corporate headquarters occupy approximately 43,000 square feet in San Francisco, California under a lease that expires in August 2021. As of December 31, 2017, we also lease offices for sales and marketing in the following U.S. cities: Alpharetta (GA), Chicago (IL), Denver (CO), New York (NY), and Vienna (VA). Additionally we lease international offices for sales and marketing in the following locations: Cologne, Hong Kong, London, the Netherlands, Singapore, Sweden, Sydney, and Toronto. We have development centers in Buenos Aires, Mountain View (CA), Naperville (IL), and San Francisco (CA). While we believe our facilities are sufficient and suitable for the operations of our business today, we are closely monitoring the need to add new facilities and grow our existing facilities as we add employees and expand into additional markets.
Sales & Marketing
Our go-to-market approach is driven by the strength and innovation of Anypoint Platform, as well as user demand. We offer Anypoint Platform on a subscription basis. The breadth of our platform allows us to market to every level of an organization. We can engage developers on day-to-day challenges and the CIO on large, strategic transformations. Anypoint Platform can be used for stand-alone integration projects and for large, transformative efforts. Even where customers engage us for smaller projects, they typically grow their usage of our platform for their existing use cases, expand to use additional elements of our platform, and apply them to new use cases. We support that process by proactively guiding our customers to realize other use cases that are more strategic and transformative in nature than the initial proposed use case. Our platform has natural network effects that help it spread through word-of-mouth across teams and departments.
Our marketing efforts focus on driving customer success, generating broader awareness, and cultivating our developer community and partner ecosystem of SIs and VARs, which are important lead generation channels for us. We invest in brand and product promotion and demand generation through direct marketing and advertising. We also leverage insights gathered from our customers and partners to improve our targeting and ultimately the return-on-investment from our marketing activities.
As of December 31, 2017, we had 527 employees in our sales and marketing organizations.
Research & Development
We have a proven research and development culture that rapidly and consistently delivers high-quality products. Our research and development organization is primarily responsible for design, development, testing, and delivery of our products and platform.
As a company, we invest substantial resources in research and development to drive core technology innovation and bring new products to market. As of December 31, 2017, we had 275 employees involved in research and development activities, including 159 employees in Argentina.
Intellectual Property
Our success depends in part upon our ability to protect our core technology and intellectual property. To accomplish this, we rely on a combination of intellectual property rights, including patents, trade secrets, copyrights and trademarks, as well as customary contractual protections.
As of December 31, 2017, in the United States, we had one issued patent, which expires in 2034, and had three patent applications pending. In addition, we have registered “MuleSoft” as a trademark in the United States, Argentina, Canada, Hong Kong, Australia, New Zealand, Singapore, and the European Union. We cannot assure you that any of our patent applications will result in the issuance of a patent or whether the examination process will require us to narrow our claims. Furthermore, even if a patent issues, we cannot assure you that such patent will be adequate to protect our business. We also license software from third parties for integration into our solutions, including open source software and other software available on commercially reasonable terms.
10
We control access to and use of our proprietary technology and other confidential information through the use of internal and external controls, including contractual protections with employees, contractors, customers and partners, and our software is protected by U.S. and international copyright laws. Despite our efforts to protect our technology and proprietary rights through intellectual property rights, licenses and confidentiality agreements, unauthorized parties may still copy or otherwise obtain and use our software and other technology. In addition, we intend to expand our international operations, and effective patent, copyright, trademark, and trade secret protection may not be available or may be limited in foreign countries.
Our industry is characterized by the existence of a large number of patents and claims and related litigation regarding patent and other intellectual property rights. In particular, leading companies in our markets have extensive patent portfolios and are regularly involved in litigation. From time to time, third parties, including certain of these leading companies, may assert patent, copyright, trade secret, and other intellectual property rights against us, our channel partners or our customers. Our standard license and other agreements may obligate us to indemnify our channel partners and customers against such claims. Successful claims of infringement by a third party could prevent us from continuing to offer our solution or performing certain services, require us to expend time and money to develop non-infringing solutions, or force us to pay substantial damages, including treble damages if we are found to have willfully infringed patents or copyrights, royalties or other fees. Competitors may also be more likely to claim that our solutions infringe their proprietary rights and seek an injunction against us from continuing to offer our platform. We cannot assure you that we do not currently infringe, or that we will not in the future infringe, upon any third-party patents or other proprietary rights.
Corporate Information
We were incorporated in the state of Delaware in April 2006 as Azechi, Inc., and in July 2006, we changed our name to MuleSource, Inc. In August 2009, we changed our name to MuleSoft, Inc. Our principal executive offices are located at 77 Geary Street, Suite 400, San Francisco, California 94108, and our telephone number is (415) 229-2009. Our website address is www.mulesoft.com. Information contained on, or that can be accessed through, our website does not constitute part of this Annual Report on Form 10-K.
Available Information
Our Annual Report on Form 10-K, Quarterly Reports on Form 10-Q, Current Reports on Form 8-K, and other filings with the SEC, and all amendments to these filings, are available free of charge from our website at https://investors.mulesoft.com/sec-filings as soon as reasonably practicable following our filing of any of these reports with the SEC. The public may read and copy any materials filed with the SEC at the SEC’s Public Reference Room at 100 F Street, NE, Room 1580, Washington, DC 20549. The public may obtain information on the operation of the Public Reference Room by calling the SEC at 1-800-SEC-0330. The SEC maintains an Internet site at http://www.sec.gov that contains reports, proxy and information statements and other information regarding MuleSoft and other companies that file materials electronically with the SEC. The contents of these websites are not intended to be incorporated into this Annual Report on Form 10-K or in any other report or document we file.
Item 1A. Risk Factors
Investing in our Class A common stock involves a high degree of risk. You should carefully consider the following risks, together with all of the other information contained in our consolidated financial statements and related notes, before making a decision to invest in our Class A common stock. Any of the following risks could have an adverse effect on our business, results of operations, financial condition and prospects, and could cause the trading price of our Class A common stock to decline, which would cause you to lose all or part of your investment. Our business, results of operations, financial condition, or prospects could also be harmed by risks and uncertainties not currently known to us or that we currently do not believe are material.
11
Risks Related to Our Business and Industry
We have a history of losses, and as our costs increase, we may not be able to generate sufficient revenue to achieve and sustain profitability.
We have incurred net losses in each period since our inception, including net losses of $80.0 million, $49.6 million, and $65.4 million for the years ended December 31, 2017, 2016, and 2015, respectively. As a result, we had an accumulated deficit of $316.2 million as of December 31, 2017. We expect our operating expenses to increase significantly as we increase our sales and marketing efforts, continue to invest heavily in research and development, and expand our operations and infrastructure, both domestically and internationally. In addition, we have incurred and expect to continue to incur significant additional legal, accounting, and other expenses related to being a public company. While our revenue has grown in recent years, if our revenue declines or fails to grow at a rate faster than these increases in our operating expenses, we will not be able to achieve and maintain profitability in future periods. As a result, we may continue to generate losses. We cannot assure you that we will achieve profitability in the future or that, if we do become profitable, we will be able to sustain profitability.
We have experienced rapid growth in recent periods. If we fail to continue to grow and to manage our growth effectively, we may be unable to execute our business plan, increase our revenue, improve our results of operations, maintain high levels of service, or adequately address competitive challenges.
We have recently experienced a period of rapid growth in our business, operations, and employee headcount. For the years ended December 31, 2017, 2016, and 2015, our revenue was $296.5 million, $187.7 million, and $110.3 million, respectively, representing a 58% and 70% growth rate. We have also significantly increased the size of our customer base from 1,071 and 839 customers as of December 31, 2016 and 2015, respectively, to over 1,200 customers as of December 31, 2017. We grew from 841 and 603 employees as of December 31, 2016 and 2015, respectively, to 1,188 employees as of December 31, 2017. We expect to continue to expand our operations and employee headcount in the near term. Our success will depend in part on our ability to continue to grow and to manage this growth effectively.
Our recent growth has placed, and future growth will continue to place, a significant strain on our management, administrative, operational, and financial infrastructure. We will need to continue to improve our operational, financial, and management controls, and our reporting systems and procedures to manage the expected growth of our operations and personnel, which will require significant capital expenditures and allocation of valuable management and employee resources. If we fail to implement these infrastructure improvements effectively, our ability to ensure uninterrupted operation of key business systems and comply with the rules and regulations that are applicable to public reporting companies will be impaired. Further, if we do not effectively manage the growth of our business and operations, the quality of our platform and services could suffer, and we may not be able to adequately address competitive challenges. This could impair our ability to attract new customers, retain existing customers and expand their use of our platform, all of which would adversely affect our brand, overall business, results of operations and financial condition.
We currently derive substantially all of our revenue and cash flows from Anypoint Platform, and any failure of this platform to satisfy customer demands or to achieve increased market acceptance would adversely affect our business, results of operations, financial condition, and growth prospects.
We derive substantially all of our revenue and cash flows from subscriptions for, and services related to, Anypoint Platform. Demand for Anypoint Platform is affected by a number of factors beyond our control, including increased market acceptance of our platform by existing customers and potential new customers, the extension of our platform for use cases, the timing of development and release of new products by our competitors and additional capabilities and functionality by us, technological change, and growth or contraction of the market in which we compete. In addition, we cannot assure you that our platform and future enhancements to our platform will be able to address future advances in technology or requirements of existing customers or potential new customers. For example, our platform may not be able to be used to build application networks that can scale with the massive proliferation of applications, data and devices that reside on-premises and in the cloud. If we are unable to continue to meet customer demands or to achieve more widespread market acceptance of our platform, our business, results of operations, financial condition and growth prospects will be adversely affected.
We began selling Anypoint Platform in 2014. Due to our limited experience selling the platform, it may be difficult to forecast our future results of operations and subjects us to a number of uncertainties, including the pace and degree of customer adoption of our platform. We have encountered and will continue to encounter risks and uncertainties frequently experienced by growing companies operating in new or developing markets. If our assumptions regarding these uncertainties, which we use to plan our business, are incorrect or change in reaction to changes in our markets, or if we do not address these risks successfully, our results of operations and financial condition could differ materially from our expectations and our business could suffer.
12
The market for application networks and our platform is new and unproven.
We introduced Anypoint Platform in 2014 to address the developing need to connect applications, data, and devices within and between the organization and its external ecosystems. While we believe that, over time, the concept of an application network will become fundamental to an organization’s core operations, the market for application networks is largely unproven and is subject to a number of risks and uncertainties, including:
• | organizations may determine that they only need point-to-point products to address their software integration needs; |
• | organizations may decide that the investments needed to construct an application network are too significant or that such investments are better spent on other strategic initiatives within the organization; and |
• | organizations may not understand the benefits that can be achieved with an application network. |
Moreover, even if the market for application networks develops, we may not be able to differentiate the benefits of Anypoint Platform from other products that may be developed to address the demand for application networks. Our ability to successfully market and sell Anypoint Platform will depend on a number of factors, including:
• | our ability to support our customers as they build application networks that increase the speed at which they operate and innovate; |
• | our ability to include technologies for the broadening diversity of use cases and respond to the rapid evolution of new technologies; |
• | our ability to design and engineer our platform for ease-of-use across an organization; and |
• | our ability to enable customers to successfully adopt and deploy our platform in their organizations. |
The market for application networks and our platform is still new, and therefore, it is difficult to predict the size and growth rate of this market, whether and how rapidly customers will adopt our platform, whether we will be able to retain such customers and expand their usage of our platform, and the impact of competitive products and services. If the market for application networks and Anypoint Platform does not achieve significant growth or there is a reduction in demand for solutions in our market for any reason, it could result in reduced customer adoption of our platform, decreased customer retention, or weaker customer expansion with respect to the use of our platform, any of which would adversely affect our business, results of operations, and financial condition.
Our business and results of operations depend substantially on our customers renewing their subscriptions with us and expanding their use of our platform. Any decline in our customer renewals or failure to convince our customers to broaden their use of our platform would harm our business, results of operations, and financial condition.
Subscriptions to our platform are term-based and are typically one year in duration. In order for us to maintain or improve our results of operations, it is important that our customers renew their subscriptions with us when the existing subscription term expires. While our customers are not entitled to maintain the applications developed using Anypoint Platform after the termination of a subscription, they have no obligation to renew their subscriptions upon expiration. Based on our relatively limited experience selling and marketing Anypoint Platform, we may not be able to accurately predict customer renewal rates. In addition, the growth of our business depends in part on our customers expanding their use of our platform. We utilize our dollar-based net retention rate to measure our ability to retain customers and expand their use of our platform. Although our dollar-based net retention rate has historically been strong, some of our customers have elected not to renew their subscriptions with us in the past for a variety of reasons, including as a result of changes in their strategic IT priorities. Our dollar-based net retention rate may also decline or fluctuate as a result of a number of other factors, including our customers’ satisfaction or dissatisfaction with our platform, the increase in the dollar value of subscription and support contracts from new customers, the effectiveness of our customer support services, our pricing, the prices of competing products or services, mergers and acquisitions affecting our customer base, global economic conditions, and the other risk factors included herein. As a result, we cannot assure you that customers will renew subscriptions or increase their usage of our platform. If our customers do not renew their subscriptions or renew on less favorable terms, or if we are unable to expand our customers’ use of our platform, our business, results of operations, and financial condition may be adversely affected.
If we were unable to attract new customers in a manner that is cost-effective and assures customer success, we would not be able to grow our business, which would adversely affect our results of operations, and financial condition.
In order to grow our business, we must continue to attract new customers in a cost-effective manner and enable such customers to realize the benefits associated with an application network. We may not be able to attract new customers to our platform for a variety of reasons, including as a result of their use of traditional approaches to technology integration, such as
13
manual project-by-project integrations and the use of legacy point-to-point software integration products, their internal timing, budget, or structural constraints that hinder their ability to build application networks, or the pricing of our platform compared to products and services offered by our competitors. After a customer makes a purchasing decision, we often must also help them successfully deploy our platform in their organization, a process that can last several months. Even if we do attract customers, the cost of new customer acquisition or ongoing customer support may prove so high as to prevent us from achieving or sustaining profitability. For example, for 2017 and 2016, total sales and marketing expense represented 62% and 65% of revenue, respectively. We intend to continue to hire additional sales personnel, increase our marketing activities to help educate the market about the benefits of application networks and our platform, grow our domestic and international operations, and build brand awareness. We also intend to continue to cultivate the MuleSoft developer community and our partner ecosystem of SIs and ISVs. If the costs of these sales and marketing efforts increase dramatically, if we do not experience a substantial increase in leverage from our partner ecosystem, or if our sales and marketing efforts do not result in substantial increases in revenue, our business, results of operations, and financial condition may be adversely affected. In addition, we expect to continue to invest in our professional services organization to accelerate our customers’ ability to adopt our platform and ultimately create and expand the size of their application network over time. We cannot assure you that any of these investments will lead to the cost-effective acquisition of additional customers.
We face a number of risks in our strategy to target larger organizations for sales of our platform, and if we do not manage these efforts effectively, our business and results of operations could be adversely affected.
We are increasingly focusing our sales and marketing efforts on larger organizations. As a result, we face a number of risks with respect to this strategy. For example, we expect to incur higher costs and longer sales cycles for larger organizations, and we may be less effective at predicting when we will complete these sales. In this market segment, the decision to invest in our platform may require a greater number of product evaluations and multiple approvals within a potential customer’s organization, which may require us to invest more time educating these potential customers. In addition, larger organizations may demand more features and professional services. As a result, these sales opportunities would likely lengthen our typical sales cycle and may require us to devote greater research and development, sales, support, and professional services resources to individual customers. This could strain our resources and result in increased costs. Moreover, larger customers may demand discounts in pricing, which could lower the amount of revenue we generate from any particular subscription. If an expected transaction is delayed until a subsequent period, or if we are unable to close one or more expected significant transactions with larger customers or potential new customers in a particular period, our results of operations for that period, and for any future periods in which revenue from such transaction would otherwise have been recognized, may be adversely affected. Our investments in marketing and selling to large organizations may not be successful, which could harm our results of operations and our overall ability to grow our customer base.
Interruptions or performance problems associated with our technology and infrastructure may adversely affect our business, results of operations, and financial condition.
Our continued growth depends in part on the ability of our existing customers and new customers to access our platform, particularly our cloud-based deployments, at any time and within an acceptable amount of time. We have experienced, and may in the future experience service disruptions, outages and other performance problems due to a variety of factors, including infrastructure changes, human or software errors or capacity constraints. In some instances, we may not be able to identify the cause or causes of these performance problems within an acceptable period of time. It may become increasingly difficult to maintain and improve our performance as our platform becomes more complex. If our platform is unavailable or if our customers are unable to access features of our platform within a reasonable amount of time or at all, our business would be negatively affected. In addition, our infrastructure does not currently include the real-time mirroring of data. Therefore, in the event of any of the factors described above or other failures, customer data and other important information may be permanently lost.
We outsource our cloud infrastructure to Amazon Web Services, or AWS, which hosts our platform. Our customers need to be able to access our platform at any time, without interruption or degradation of performance. AWS runs its own platform that we access, and we are, therefore, vulnerable to service interruptions at AWS. We have experienced, and expect that in the future we may experience interruptions, delays and outages in service and availability from time to time due to a variety of factors, including infrastructure changes, human or software errors, website hosting disruptions and capacity constraints. Capacity constraints could be due to a number of potential causes including technical failures, natural disasters, fraud or security attacks. In addition, if our security, or that of AWS, is compromised, and our platform is unavailable or our customers are unable to use our platform within a reasonable amount of time or at all, then our business, results of operations and financial condition could be adversely affected. In some instances, we may not be able to identify the cause or causes of these performance problems within a period of time acceptable to our customers. It may become increasingly difficult to maintain and improve our platform performance, especially during peak usage times, as the features of our platform become more complex and the usage of our platform increases. Any of the above circumstances or events may harm our reputation, cause customers to stop using our platform,
14
impair our ability to increase revenue from existing customers, impair our ability to grow our customer base, subject us to financial penalties and liabilities under our service level agreements and otherwise harm our business, results of operations, and financial condition.
To the extent that we do not effectively anticipate capacity demands, upgrade our systems as needed, and continually develop our technology and network architecture to accommodate actual and anticipated changes in technology, our business and results of operations may be adversely affected. Moreover, our customer agreements include warranties and service level agreements that obligate us to provide future credits for customers of our cloud offerings in the event of a significant disruption in our platform. Any unscheduled downtime that exceeds such service level commitments could adversely affect our results of operations, financial condition, business, and reputation, which in turn could harm our ability to acquire new customers and expand relationships with existing customers.
Incorrect or improper implementation or use of our platform could result in customer dissatisfaction and negatively affect our business, results of operations, financial condition, and growth prospects.
Our platform is deployed in a wide variety of technology environments, both on-premises and in the cloud. Increasingly, our platform has been deployed in large scale, complex technology environments, and we believe our future success will depend on our ability to increase sales of our platform for use in such deployments. We must often assist our customers in achieving successful implementations of our platform, which we do through our professional services organization. The time required to implement our platform can range from three months for smaller deployments to six months or more for larger deployments. If our customers are unable to implement our platform successfully, or unable to do so in a timely manner, customer perceptions of our platform may be harmed, our reputation and brand may suffer, and customers may choose to cease usage of our platform or not to expand their use of our platform. Our customers and third-party partners may need training in the proper use of and the variety of benefits that can be derived from our platform to maximize its benefits. If our platform is not effectively implemented or used correctly or as intended, or if we fail to adequately train customers on how to efficiently and effectively use our platform, our customers may not be able to build application networks or otherwise achieve satisfactory outcomes. This could result in negative publicity and legal claims against us, which may cause us to generate fewer sales to new customers and reductions in renewals or expansions of the use of our platform with existing customers, any of which would harm our business and results of operations.
If our security measures are breached or unauthorized access to private or proprietary data is otherwise obtained, our platform may be perceived as not being secure, customers may reduce the use of or stop using our platform, and we may incur significant liabilities.
Because our platform allows customers to store and transmit data, there exists an inherent risk that an unauthorized third party could conduct a security breach, resulting in the loss of this data, which could lead to litigation, indemnity obligations, and other liability. While we have taken steps to protect the confidential information to which we have access, we do not have the ability to monitor or review the content that our customers store or transmit through our platform. Therefore, if customers use our software for the transmission or storage of personally identifiable information and our security measures are breached as a result of third-party action, employee error, malfeasance or otherwise, our reputation could be damaged, our business may suffer, and we could incur significant liability. Because techniques used to obtain unauthorized access or sabotage systems change frequently and generally are not identified until they are launched against a target, we may be unable to anticipate these techniques or to implement adequate preventative measures. Any or all of these issues could negatively impact our ability to attract new customers and increase engagement by existing customers, cause existing customers to elect not to renew their subscriptions, or subject us to third-party lawsuits, regulatory fines or other action or liability, thereby adversely affecting our financial results.
If we fail to adapt and respond effectively to rapidly changing technology, evolving industry standards, changing regulations and changing customer needs, requirements or preferences, our products may become less competitive.
The market in which we compete is relatively new and subject to rapid technological change, evolving industry standards and changing regulations, as well as changing customer needs, requirements and preferences. The success of our business will depend, in part, on our ability to adapt and respond effectively to these changes on a timely basis. If we were unable to enhance our platform or develop new solutions that keep pace with rapid technological and industry change, our business, results of operations, and financial condition could be adversely affected. If new technologies emerge that are able to deliver competitive products and services at lower prices, more efficiently, more conveniently or more securely, such technologies could adversely impact our ability to compete effectively. For example, Anypoint Platform was architected to connect and orchestrate applications, data and devices through the use of APIs. If new technologies emerge that displace the use of APIs, we may not be able to adapt our platform to such new technologies on a timely basis.
15
Our success also depends on the interoperability of our platform with third-party applications, data and devices that we have not developed and do not control. Any changes in such applications, data or devices that degrade the functionality of our platform or give preferential treatment to competitive software could adversely affect the adoption and usage of our platform. We may not be successful in adapting our platform to operate effectively with these applications, data or devices. If it is difficult for our customers to access and use our platform, or if our platform cannot connect a broadening range of applications, data and devices, then our customer growth and retention may be harmed, and our business and results of operations could be adversely affected.
Our future quarterly results may fluctuate significantly, and if we fail to meet the expectations of analysts or investors, our stock price and the value of your investment could decline substantially.
Our results of operations, including our revenue, operating expenses and cash flows have fluctuated from quarter to quarter in the past and may continue to fluctuate as a result of a variety of factors, many of which are outside of our control, may be difficult to predict and may or may not fully reflect the underlying performance of our business. Some of the factors that may cause our results of operations to fluctuate from quarter to quarter include:
• | the mix of revenue and associated costs attributable to subscriptions and support and professional services, which may impact our gross margins and operating income; |
• | our ability to attract new customers; |
• | our ability to retain customers and expand their usage of our platform, particularly for our largest customers; |
• | delays in closing sales, including the timing of renewals, which may result in revenue being pushed into the next quarter, particularly because a large portion of our sales occur toward the end of each quarter; |
• | the timing of revenue recognition; |
• | the mix of revenue attributable to larger transactions as opposed to smaller transactions; |
• | changes in customers’ budgets and in the timing of their purchasing decisions; |
• | potential customers opting for alternative products, including developing their own in-house solutions; |
• | our ability to control costs, including our operating expenses; |
• | the timing and success of new products, features and services by us and our competitors or any other change in the competitive dynamics of our industry, including consolidation among competitors, customers or strategic partners; |
• | significant security breaches of, technical difficulties with, or interruptions to, the delivery and use of our platform; |
• | the collectability of receivables from customers and resellers, which may be hindered or delayed if these customers or resellers experience financial distress; |
• | general economic conditions, both domestically and internationally, as well as economic conditions specifically affecting industries in which our customers participate; |
• | sales tax and other tax determinations by authorities in the jurisdictions in which we conduct business; |
• | the impact of new accounting pronouncements; and |
• | fluctuations in stock-based compensation expense. |
The occurrence of one or more of the foregoing and other factors may cause our results of operations to vary significantly. We also intend to continue to invest significantly to grow our business in the near future rather than optimizing for profitability or cash flows. Accordingly, our results of operations in any one quarter may not be meaningful and should not be relied upon as indicative of future performance. Additionally, if our quarterly results of operations fall below the expectations of investors or securities analysts who follow our stock, the price of our Class A common stock could decline substantially, and we could face costly lawsuits, including securities class action suits.
We may not be able to compete successfully against current and future competitors.
We believe that we are the pioneer in the market for application networks because we provide the only complete offering for building application networks. However, there are many other companies addressing various aspects of this market. As a result, the competitive landscape is fragmented, intense and characterized by rapid changes in technology, customer requirements, and industry standards and by frequent new product introductions and improvements. We are likely to face continued challenges from current competitors, which include:
• | manual integration efforts, which are either conducted in-house or through custom integration services providers; |
• | legacy integration software vendors such as IBM, Oracle, and TIBCO; and |
• | smaller specialized companies such as Apigee (owned by Alphabet) and Dell Boomi, which are focused on various niches in integration and API management. |
16
Many of our principal competitors have substantially longer operating histories, greater financial, technical, marketing or other resources, stronger brand and customer recognition, larger intellectual property portfolios and broader global distribution and presence. Our competitors may be able to offer products or functionality similar to ours at a more attractive price than we can by integrating or bundling such products with their other product offerings. Acquisitions and consolidation in our industry may provide our competitors even more resources or may increase the likelihood of our competitors offering bundled or integrated products with which we cannot effectively compete. In addition, we face potential competition from participants in adjacent markets that may enter our markets by leveraging related technologies and partnering with or acquiring other companies, or providing alternative approaches to provide similar results, particularly as organizations are increasingly choosing to deploy applications on cloud platforms such as those offered by AWS, Microsoft Azure, and Google Cloud Platform. New innovative start-ups and existing large companies that are making significant investments in research and development could also launch new products and services, delivered either on-premises or in the cloud, that we do not offer and that could gain market acceptance quickly. If we were unable to anticipate or react to these competitive challenges, our competitive position would weaken, which would adversely affect our business and results of operations.
Real or perceived errors, failures or bugs in our software could adversely affect our business, results of operations, financial condition, and growth prospects.
Our platform is complex, and therefore, undetected errors, failures or bugs may occur. Our platform may be used in IT environments with different operating systems, system management software, applications, devices, databases and equipment and networking configurations, which may cause errors or failures of our platform or other aspects of the IT environment into which it is deployed. Despite testing by us, errors, failures or bugs may not be found until our platform is used by our customers. Real or perceived errors, failures or bugs in our products could result in negative publicity, loss of or delay in market acceptance of our platform, weakening of our competitive position, claims by customers for losses sustained by them or failure to meet the stated service level commitments in our customer agreements. In such an event, we may be required, or may choose, for customer relations or other reasons, to expend significant additional resources in order to help correct the problem. We have experienced from time to time errors, failures and bugs in our platform that have resulted in customer downtime. While we were able to remedy these situations, we cannot assure you that we will be able to mitigate future errors, failures or bugs in a quick or cost-effective manner. Any errors, failures or bugs in our platform could impair our ability to attract new customers, retain existing customers or expand their use of our platform, which would adversely affect our business, results of operations, and financial condition.
Our sales cycle is long and unpredictable, and our sales efforts require considerable time and expense.
The timing of our sales and related revenue recognition is difficult to predict because of the length and unpredictability of the sales cycle for our platform before a sale. We are often required to spend significant time and resources to better educate and familiarize potential customers with the value proposition of our platform. Customers often view the subscription to our platform as a strategic decision and significant investment and, as a result, frequently require considerable time to evaluate, test and qualify our platform prior to entering into or expanding a subscription. During the sales cycle, we expend significant time and money on sales and marketing and contract negotiation activities, which may not result in a sale. Additional factors that may influence the length and variability of our sales cycle include:
• | the discretionary nature of purchasing and budget cycles and decisions; |
• | lengthy purchasing approval processes; |
• | the evaluation of competing products during the purchasing process; |
• | announcements or planned introductions of new products, features or functionality by us or our competitors; and |
• | evolving functionality demands. |
As we have focused our business on selling into larger customer accounts, we have experienced an increase in our average sales cycle from two to three quarters. As a result, it is difficult to predict whether and when a sale will be completed, and when revenue from a sale will be recognized. If our sales cycles continue to lengthen, our revenue could be lower than expected, which would have an adverse effect on our business, results of operations and financial condition.
We recognize a majority of our revenue over the term of our customer contracts. Consequently, increases or decreases in new sales may not be immediately reflected in our results of operations and may be difficult to discern.
We recognize subscription revenue from customers ratably over the terms of their subscriptions and a substantial majority of our revenue is derived from subscriptions that have terms of at least one year. As a result, a portion of the revenue we report in each quarter is derived from the recognition of deferred revenue relating to subscriptions entered into during previous quarters. Consequently, a decline in new or renewed subscriptions in any single quarter may have a small impact on the revenue that we recognize for that quarter. However, such a decline will negatively affect our revenue in future quarters. Accordingly, the
17
effect of significant downturns in sales and potential changes in our pricing policies or rate of customer expansion or retention, may not be fully reflected in our results of operations until future periods. In addition, a significant majority of our costs are expensed as incurred, while revenue is recognized over the life of the subscription agreement. As a result, growth in the number of customers could continue to result in our recognition of higher costs and lower revenue in the earlier periods of our subscription agreements. Finally, our subscription-based revenue model also makes it difficult for us to rapidly increase our revenue through additional sales in any period, as revenue from new customers and significant increases in the size of subscriptions with existing customers must be recognized over the applicable subscription term.
If we do not effectively expand our sales and marketing organization, we may be unable to add new customers or increase sales to our existing customers.
Increasing our customer base and achieving broader market acceptance of our platform will depend, to a significant extent, on our ability to effectively expand our sales and marketing operations and activities. We are substantially dependent on our direct sales force and our online marketing efforts to obtain new customers. We plan to continue to expand our sales and marketing organization both domestically and internationally. We believe that there is significant competition for experienced sales professionals with the sales skills and technical knowledge that we require, particularly as we continue to target larger organizations. Our ability to achieve significant revenue growth in the future will depend, in part, on our success in recruiting, training and retaining a sufficient number of experienced sales professionals. New hires require significant training and time before they achieve full productivity, particularly in new sales segments and territories. Our recent hires and planned hires may not become as productive as quickly as we expect, and we may be unable to hire or retain sufficient numbers of qualified individuals in the future in the markets where we do business. Because of our limited operating history, we cannot predict whether, or to what extent, our sales will increase as we expand our sales and marketing organization or how long it will take for sales personnel to become productive. Our business and results of operations will be harmed if the expansion of our sales and marketing organization does not generate a significant increase in revenue.
We depend on highly skilled personnel to grow and operate our business, and if we are unable to hire, retain, train and motivate our personnel, we may not be able to effectively grow our business and improve our results of operations.
We depend on highly skilled personnel, including our senior management, to grow and operate our business. Our future success will depend upon our continued ability to identify and hire skilled personnel, including senior management, engineers, product managers and sales and marketing personnel, which will require significant time, expense and attention. We have aggressive hiring objectives across the organization, which we may not be able to achieve. In addition to hiring new employees, we must continue to focus on training, motivating, and retaining our best employees, substantially all of whom are at-will employees, which means they may terminate their employment relationship with us at any time. Many of our employees may be able to receive significant proceeds from sales of our Class A common stock in the public markets, which may reduce their motivation to continue to work for us. Conversely, employees may be more likely to leave us if the exercise prices of the stock options that they hold are significantly above the market price of our Class A common stock. Competition for highly skilled personnel is intense, particularly in the San Francisco Bay Area, where our headquarters are located. We may need to invest significant amounts of cash and equity to attract and retain new employees, and we may never realize returns on these investments. If we are not able to fulfill our hiring objectives and retain employees, our ability to achieve our strategic objectives would be adversely impacted, and our business and results of operations would be harmed.
Our corporate culture has contributed to our success, and if we cannot maintain this culture as we grow, we could lose the innovation, creativity and teamwork fostered by our culture, which could harm our business.
We believe that our culture has been and will continue to be a key contributor to our success. Since December 31, 2015, we have increased the size of our workforce by over 500 employees, and we expect to continue to hire aggressively as we expand. If we do not continue to maintain our corporate culture as we grow, we may be unable to foster the innovation, creativity, and teamwork we believe we need to support our growth. Moreover, many of our employees may be able to receive significant proceeds from sales of our Class A common stock in the public markets, which could lead to disparities of wealth among our employees that adversely affects relations among employees and our culture in general.
If we were not able to introduce new features, solutions or services successfully and to make enhancements to our platform or services, our business and results of operations could be adversely affected.
Our ability to attract new customers and increase revenue from existing customers depends in large part on our ability to enhance and improve our platform and to introduce new features, solutions, and services. To grow our business and remain competitive, we must enhance our platform and develop features and solutions that reflect the constantly evolving nature of technology and our customers’ needs. The success of these and any other enhancements or developments depend on several factors,
18
including timely introduction and completion, sufficient demand and cost effectiveness. In addition, because our platform is designed to operate with a variety of systems, applications, data and devices, we will need to continuously modify and enhance our platform to keep pace with changes in such systems. We may not be successful in developing these modifications and enhancements. Furthermore, the addition of features and solutions to our platform will increase our research and development expenses. Any new features or solutions that we develop may not be introduced in a timely or cost-effective manner or may not achieve the market acceptance necessary to generate sufficient revenue to justify the related expenses. It is difficult to predict customer adoption of new features or solutions. Such uncertainty limits our ability to forecast our future results of operations and subjects us to a number of challenges, including our ability to plan for and model future growth. If we cannot address such uncertainties successfully and are unable to successfully develop new features or solutions, enhance our platform or otherwise overcome technological challenges and competing technologies, our business and results of operations could be adversely affected. We also offer professional services for the implementation of, and training on, our platform and must continually adapt to assist our customers in deploying our platform and building an application network in accordance with their specific IT strategy. If we cannot introduce new services or enhance our existing services to keep pace with changes in our customers’ deployment strategies, we may not be able to attract new customers, retain existing customers and expand their use of our platform, which could adversely affect our business, results of operations and financial condition.
We expect to continue to derive a significant portion of our revenue from professional services, which carry a lower gross margin than our subscription and support revenue.
We generally offer professional services associated with implementing our platform and training customers on the use of our platform, and our professional services carry a significantly lower gross margin than subscriptions for our platform. We price our professional services to be attractive to customers because we believe that our professional services help ensure customer success on our platform, which assists us in retaining customers and expanding our relationships with them. Further, we generally recognize revenue from professional services as such services are rendered. Costs associated with maintaining a professional services organization are fixed while professional services revenue is dependent on the amount of work actually billed to customers in a period, the combination of which may result in variability in our gross profit. In addition, the timing of the recognition of professional services revenue is dependent on several factors outside our control. If a customer deploys our platform and utilizes our services more slowly than we expect, we may not be able to recognize the related revenue as quickly as we anticipated, which may adversely affect our gross profit and other results of operations. We also work with SIs to provide our customers with professional services associated with implementing our platform, and we plan to continue to expand these partner relationships to supplement our own resources. If we are not able to adequately grow these channel partner relationships, we will continue to directly provide a significant majority of these services to our customers.
Any failure to offer high-quality customer support may adversely affect our relationships with our customers and our financial results.
We typically bundle customer support with subscriptions for our platform. In deploying and using our platform, our customers typically require the assistance of our support teams to resolve complex technical and operational issues. We may be unable to modify the nature, scope and delivery of our customer support to compete with changes in product support services provided by our competitors. Increased customer demand for support, without corresponding revenue, could increase costs and adversely affect our results of operations. We may also be unable to respond quickly enough to accommodate short-term increases in customer demand for support. Our sales are highly dependent on our reputation and on positive recommendations from our existing customers. Any failure to maintain high-quality customer support, or a market perception that we do not maintain high-quality product support, could adversely affect our reputation, and our ability to sell subscriptions to our platform to existing customers and new customers.
Future changes in market conditions or customer demand could require changes to our prices or pricing model, which could adversely affect our business, results of operations, and financial condition.
We price subscriptions to our platform based on the amount of computing capacity on which our customers run our software, as well as the tier of support services, and subscriptions to our platform are typically one year in duration. We have limited experience with respect to determining the optimal prices and pricing model for our platform and services. As the market for our platform matures, or as new competitors introduce new products or services that compete with ours, we may be unable to attract new customers at the same price or based on the same pricing models as we have used historically. For example, from time to time, customers request pricing that dynamically scales up or down based on actual usage, which is different than our 12-month capacity-based pricing. If this customer demand becomes more prevalent, we may be forced to adjust our pricing model. Any future changes in our pricing model could result in decreased revenue or interfere with the predictability of our business. Moreover, larger organizations, which are a primary focus of our sales efforts, may demand substantial price concessions. As a result, in the
19
future we may be required to reduce our prices, which could adversely affect our business, results of operations and financial condition.
If we are not able to maintain and enhance our brand, our business and results of operations may be adversely affected.
We believe that maintaining and enhancing our reputation as a pioneer and leader in the market for application networks is critical to our relationship with our existing customers and partners and our ability to attract new customers and partners. The successful promotion of our brand attributes will depend on a number of factors, including our marketing efforts, our ability to continue to develop high-quality features and solutions for our platform and our ability to successfully differentiate our platform from competitive products and services. Our brand promotion activities may not be successful or yield increased revenue. In addition, independent industry analysts often provide reviews of our platform, as well as products and services of our competitors, and perception of our platform in the marketplace may be significantly influenced by these reviews. If these reviews are negative, or less positive as compared to those of our competitors’ products and services, our brand may be adversely affected. Additionally, the performance of our channel partners may affect our brand and reputation if customers do not have a positive experience with our partners’ services. The promotion of our brand requires us to make substantial expenditures, and we anticipate that the expenditures will increase as our market becomes more competitive, as we expand into new markets, and as more sales are generated through our channel partners. To the extent that these activities yield increased revenue, this revenue may not offset the increased expenses we incur. If we do not successfully maintain and enhance our brand, our business may not grow, we may have reduced pricing power relative to competitors, and we could lose customers or fail to attract potential customers, all of which would adversely affect our business, results of operations and financial condition.
Our business and growth depend in part on the success of our relationships with our channel partners.
In addition to our direct sales force, we use SIs and VARs. We derive a significant portion of our revenue from sales through our channel network, particularly internationally. We expect that sales through channel partners will continue to grow for the foreseeable future.
Our agreements with our channel partners are generally non-exclusive, meaning our channel partners may offer customers the products of several different companies, including products that compete with our platform. If our channel partners do not effectively market and sell subscriptions to our platform, choose to use greater efforts to market and sell their own products or those of our competitors, or fail to meet the needs of our customers, our ability to grow our business and sell subscriptions to our platform may be adversely affected. Our channel partners may cease marketing our platform with limited or no notice and with little or no penalty. The loss of a substantial number of our channel partners, our possible inability to replace them, or the failure to recruit additional channel partners could adversely affect our business, results of operations and financial condition.
We depend in part on our ecosystem of SIs and developers to create solutions that will work in conjunction with our platform.
We depend in part on our partner ecosystem of SIs and developers to create solutions that will work in conjunction with our platform. This presents certain risks to our business, including:
• | we cannot provide any assurance that these solutions meet the same quality standards that we apply to our own development efforts, and to the extent that they contain bugs or defects, they may create disruptions in our customers’ use of our services or negatively affect our brand; |
• | we do not typically provide technical support for solutions developed by our partner ecosystem, and customers may be left without support and potentially cease using our services if these SIs and developers do not provide adequate support for those solutions; and |
• | these SIs and developers may not possess the appropriate intellectual property rights to develop and share their solutions. |
Many of these risks are not within our control to prevent, and our brand may be damaged if these solutions do not perform to our customers’ satisfaction and that dissatisfaction is attributed to us, which would adversely affect our business and results of operations.
Our corporate structure and intercompany arrangements are subject to the tax laws of various jurisdictions, and we could be obligated to pay additional taxes, which would harm our results of operations.
Based on our current corporate structure, we may be subject to taxation in several jurisdictions around the world with increasingly complex tax laws, the application of which can be uncertain. The amount of taxes we pay in these jurisdictions could increase substantially as a result of changes in the applicable tax principles, including increased tax rates, new tax laws or revised
20
interpretations of existing tax laws and precedents. In addition, the authorities in these jurisdictions could challenge our methodologies for valuing developed technology or intercompany arrangements, including our transfer pricing. The relevant taxing authorities may determine that the manner in which we operate our business does not achieve the intended tax consequences. If such a disagreement were to occur, and our position were not sustained, we could be required to pay additional taxes, and interest and penalties. Such authorities could claim that various withholding requirements apply to us or our subsidiaries or assert that benefits of tax treaties are not available to us or our subsidiaries. Any increase in the amount of taxes we pay or that are imposed on us could increase our worldwide effective tax rate and harm our business and results of operations.
Changes in U.S. tax laws could have a material adverse effect on our business, cash flow, results of operations or financial conditions.
On December 22, 2017, the Tax Cut and Jobs Act ("the Act") was signed into law, which enacts significant changes to U.S. tax and related laws. Some of the provisions of the new tax law affecting corporations include, but are not limited to a reduction of the federal corporate income tax rate from 35% to 21%, limiting the interest expense deduction, expensing of cost of acquired qualified property and elimination of the domestic production activities deduction. In addition, changes have been made regarding the taxation of undistributed foreign earnings. We have analyzed the potential impacts of the Act and due to the federal rate reduction, we have recorded a reduction in our federal deferred tax assets of $29.4 million which was offset by a change in our valuation allowance; both changes are reflected in our financial statements for the year ended December 31, 2017. Going forward, we will consider the impact of these changes as we evaluate our future intentions regarding the reinvestment of our undistributed foreign earnings.
We could incur substantial costs in protecting or defending our intellectual property rights, and any failure to protect our intellectual property rights could reduce the value of our platform and brand.
Our success and ability to compete depend in part upon our intellectual property rights. We currently have one issued patent and three patent applications, which may not result in issued patents. We primarily rely on copyright, trademark laws, trade secret protection and confidentiality or other contractual arrangements with our employees, customers, partners and others to protect our intellectual property rights. However, the steps we take to protect our intellectual property rights may not be adequate. In order to protect our intellectual property rights, we may be required to spend significant resources to set-up, monitor and enforce such rights. Litigation brought to enforce our intellectual property rights could be costly, time-consuming and distracting to management and could be met with defenses, counterclaims and countersuits attacking the validity and enforceability of our intellectual property rights, which may result in the impairment or loss of portions of our intellectual property. The laws of some foreign countries do not protect our intellectual property rights to the same extent as the laws of the United States, and effective intellectual property protection and mechanisms may not be available in those jurisdictions. We may need to expend additional resources to defend our intellectual property in these countries, and our inability to do so could impair our business or adversely affect our international expansion. Even if we are able to secure our intellectual property rights, there can be no assurances that such rights will provide us with competitive advantages or distinguish our products and services from those of our competitors or that our competitors will not independently develop similar technology.
We may be subject to intellectual property rights claims by third parties, which may be costly to defend, could require us to pay significant damages and could limit our ability to use certain technologies.
Companies in the software and technology industries, including some of our current and potential competitors, own large numbers of patents, copyrights, trademarks and trade secrets and frequently enter into litigation based on allegations of infringement or other violations of intellectual property rights. We have in the past and may in the future be subject to notices that claim we have misappropriated, misused or infringed the intellectual property rights of our competitors or other third parties, including patent holding companies whose sole business is to assert such claims. To the extent we increase our visibility in the market, we face a higher risk of being the subject of intellectual property infringement claims. Additionally, we do not have a significant patent portfolio, which could prevent us from deterring patent infringement claims through our own patent portfolio, and our competitors and others may now and in the future have significantly larger and more mature patent portfolios than we have.
Any intellectual property claims, with or without merit, could be very time-consuming and expensive and could divert our management’s attention and other resources. These claims could also subject us to significant liability for damages, potentially including treble damages if we are found to have willfully infringed patents or copyrights. These claims could also result in our having to stop using technology found to be in violation of a third party’s rights. We might be required to seek a license for the intellectual property, which may not be available on reasonable terms or at all. Even if a license is available, we could be required to pay significant royalties, which would increase our operating expenses. As a result, we may be required to develop alternative non-infringing technology, which could require significant effort and expense. If we cannot license or develop technology for any
21
aspect of our business that may ultimately be determined to infringe on the intellectual property rights of another party, we could be forced to limit or stop sales of subscriptions to our platform and may be unable to compete effectively. Any of these results would adversely affect our business, results of operations and financial condition.
Some of our technology incorporates “open source” software, and we license some of our software through open source projects, which could negatively affect our ability to sell our platform and subject us to possible litigation.
Some aspects of our platform are built using open source software, and we intend to continue to use open source software in the future. From time to time, we contribute software source code to open source projects under open source licenses or release internal software projects under open source licenses, and anticipate doing so in the future. The terms of certain open source licenses to which we are subject have not been interpreted by U.S. or foreign courts, and there is a risk that open source software licenses could be construed in a manner that imposes unanticipated conditions or restrictions on our ability to monetize our platform. Additionally, we may from time to time face claims from third parties claiming ownership of, or demanding release of, the open source software or derivative works that we developed using such software, which could include our proprietary source code, or otherwise seeking to enforce the terms of the applicable open source license. These claims could result in litigation and could require us to make our software source code freely available, purchase a costly license or cease offering the implicated services unless and until we can re-engineer them to avoid infringement. This re-engineering process could require significant additional research and development resources, and we may not be able to complete it successfully. In addition to risks related to license requirements, use of certain open source software can lead to greater risks than use of third-party commercial software, as open source licensors generally do not provide warranties or controls on the origin of software. Additionally, because any software source code we contribute to open source projects is publicly available, our ability to protect our intellectual property rights with respect to such software source code may be limited or lost entirely, and we may be unable to prevent our competitors or others from using such contributed software source code. Any of these risks could be difficult to eliminate or manage, and if not addressed, could have a negative effect on our business, results of operations and financial condition.
We use third-party licensed software in or with our platform, and the inability to maintain these licenses or errors in the software we license could result in increased costs or reduced service levels, which would adversely affect our business.
Our platform incorporates certain third-party software obtained under licenses from other companies. We anticipate that we will continue to rely on such third-party software and development tools in the future. Such third-party companies may discontinue their products, go out of business or otherwise cease to make support available for such third-party software. Although we believe that there are commercially reasonable alternatives to the third-party software we currently license, this may not always be the case, or it may be difficult or costly to replace. In addition, integration of the software used in our platform with new third-party software may require significant work and substantial investment of our time and resources. Also, to the extent that our platform depends upon the successful operation of third-party software in conjunction with our software, any undetected errors or defects in such third-party software could prevent the deployment or impair the functionality of our platform, delay new feature introductions, result in a failure of our platform and injure our reputation. Our use of additional or alternative third-party software would require us to enter into license agreements with third parties. In the event that we are not able to maintain our licenses to third-party software, or cannot obtain licenses to new software on commercially reasonable terms as needed to enhance our platform, our business and results of operations may be adversely affected.
Indemnity provisions in various agreements potentially expose us to substantial liability for intellectual property infringement and other losses.
Our agreements with customers and other third parties may include indemnification provisions under which we agree to indemnify them for losses suffered or incurred as a result of claims of intellectual property infringement, damages caused by us to property or persons, or other liabilities relating to or arising from our platform, services or other contractual obligations. Some of these indemnity agreements provide for uncapped liability for which we would be responsible, and some indemnity provisions survive termination or expiration of the applicable agreement. Large indemnity payments could harm our business, results of operations and financial condition. Although we normally contractually limit our liability with respect to such obligations, we may still incur substantial liability related to them. Any dispute with a customer with respect to such obligations could have adverse effects on our relationship with that customer and other existing customers and new customers and harm our business and results of operations.
Our international sales and international operations subject us to additional risks that can adversely affect our results of operations and financial condition.
For both 2017 and 2016, we derived approximately 38% of our revenue from customers located outside the United States. We are continuing to expand our international operations as part of our growth strategy. We currently have a significant
22
portion of our research and development personnel in Argentina and have a significant portion of our sales personnel and customer support operations in Europe, Asia, Australia and South America. However, our sales organization outside the United States is smaller than our sales organization in the United States, and we rely more on resellers for non-U.S. sales. Our ability to convince customers to adopt our platform and to expand usage of our platform often requires our direct engagement with customers. To the extent we are unable to engage with non-U.S. customers, we may struggle to grow sales in international markets.
Our international operations subject us to a variety of risks and challenges, including:
• | political and economic uncertainty in the locations in which we operate, particularly in Argentina, where we have a development center, including the potential for significant inflation, labor unrest and currency devaluation; |
• | increased management, travel, infrastructure and legal compliance costs associated with having operations in multiple jurisdictions; |
• | greater challenges in hiring, training, motivating, and retaining high-quality personnel; |
• | increased difficulties in maintaining our unique corporate culture as we continue to expand globally; |
• | reliance on channel partners; |
• | longer sales cycle and more time required to educate customers on the benefits of our platform outside of the United States; |
• | more challenges in enabling our sales force to reach larger organizations outside of the United States; |
• | longer payment cycles and difficulties in collecting accounts receivable, especially in emerging markets; |
• | increased financial accounting and reporting burdens and complexities; |
• | compliance with U.S. laws and regulations for foreign operations, including the Foreign Corrupt Practices Act, or FCPA, the U.K. Bribery Act, import and export control laws, tariffs, trade barriers, economic sanctions and other regulatory or contractual limitations on our ability to sell subscriptions to our software in certain foreign markets, and the risks and costs of non-compliance; |
• | heightened risks of unfair or corrupt business practices in certain geographies and of improper or fraudulent sales arrangements that may impact results of operations and result in restatements of our consolidated financial statements and irregularities in our consolidated financial statements; |
• | fluctuations in currency exchange rates, particularly in Argentina, and the related effect on our results of operations; |
• | difficulties in repatriating or transferring funds from or converting currencies in certain countries; |
• | the need for localized software and licensing programs; |
• | reduced protection for intellectual property rights in some countries and practical difficulties of enforcing intellectual property and contract rights abroad; |
• | compliance with the laws of numerous foreign taxing jurisdictions and overlapping of different tax regimes including withholding obligations; and |
• | difficulties associated with delivering support, training and documentation in languages other than English. |
Any of the above risks could adversely affect our international operations, reduce our revenue from customers outside of the United States or increase our operating costs, each of which could adversely affect our business, results of operations, financial condition and growth prospects. In addition, compliance with laws and regulations applicable to our international operations increases our cost of doing business in foreign jurisdictions. We may be unable to keep current with changes in foreign government requirements and laws as they change from time to time. Failure to comply with these laws and regulations could have adverse effects on our business. In many foreign countries it is common for others to engage in business practices that are prohibited by our internal policies and procedures or U.S. regulations applicable to us. Although we have implemented policies and procedures designed to ensure compliance with these laws and policies, there can be no assurance that all of our employees, contractors, channel partners and agents will comply with these laws and policies. Violations of laws or key control policies by our employees, contractors, channel partners or agents could result in delays in revenue recognition, financial reporting misstatements, fines, penalties or the prohibition of the importation or exportation of our software and services and could have an adverse effect on our business, results of operations and financial condition.
A significant number of our research and development employees are located in Argentina and any favorable or unfavorable developments in Argentina could have an impact on our results of operations.
A significant number of our research and development employees are located in Argentina, and therefore, a portion of our operating expenses are denominated in Argentine pesos. As of December 31, 2017, we had a total of 225 employees located in Argentina, of which 159 were engaged in research and development activities. If the peso strengthens against the U.S. dollar, it could have a negative impact on our results of operations as it would increase our operating expenses. Our business activities in Argentina also subject us to risks associated with changes in and interpretations of Argentine law, including laws related to employment, the protection and ownership of intellectual property and U.S. ownership of Argentine operations. Furthermore, if
23
we had to scale down or close our Argentine operations, there would be significant time and cost required to relocate those operations elsewhere, which could have an adverse impact on our overall cost structure.
The Argentine government has historically exercised significant influence over the country’s economy. Additionally, the country’s legal and regulatory frameworks have at times suffered radical changes, due to political influence and significant political uncertainties. In the past, government policies in Argentina included expropriation, nationalization, forced renegotiation or modification of existing contracts, suspension of the enforcement of creditors’ rights, new taxation policies, including royalty and tax increases and retroactive tax claims, and changes in laws and policies affecting foreign trade and investment. Such policies could destabilize the country and adversely affect our business and operating expenses.
In addition, Argentina has experienced labor unrest over wages and benefits paid to workers. In the past, the Argentine government has passed laws, regulations, and decrees requiring companies in the private sector to maintain minimum wage levels and provide specified benefits to employees and may do so again in the future. Employers have also experienced significant pressure from their employees and labor organizations to increase wages and to provide additional employee benefits. Any disruptions, labor unrest, or increased personnel-related expenses in Argentina could have a material and adverse effect on our business and operating expenses.
If currency exchange rates fluctuate substantially in the future, our financial results, which are reported in U.S. dollars, could be adversely affected.
As we continue to expand our international operations, we become more exposed to the effects of fluctuations in currency exchange rates. Our sales contracts are denominated primarily in U.S. dollars, and therefore the majority of our revenue is not subject to foreign currency risk. However, a strengthening of the U.S. dollar could increase the real cost of our platform and services to our customers outside of the United States, adversely affecting our business, results of operations and financial condition. We incur expenses for employee compensation and other operating expenses at our non-U.S. locations in the local currency. Fluctuations in the exchange rates between the U.S. dollar and other currencies, such as the Argentine peso, could result in the dollar equivalent of such expenses being higher. This could have a negative impact on our reported results of operations. To date, we have not engaged in any hedging strategies, and any such strategies, such as forward contracts, options and foreign exchange swaps related to transaction exposures that we may implement in the future to mitigate this risk may not eliminate our exposure to foreign exchange fluctuations. Moreover, the use of hedging instruments may introduce additional risks if we are unable to structure effective hedges with such instruments.
Unfavorable conditions in our industry or the global economy or reductions in information technology spending could limit our ability to grow our business and negatively affect our results of operations.
Our results of operations may vary based on the impact of changes in our industry or the global economy on us or our customers. The revenue growth and potential profitability of our business depend on demand for integration software and services generally and for our platform in particular. Current or future economic uncertainties or downturns could adversely affect our business and results of operations. Negative conditions in the general economy both in the United States and abroad, including conditions resulting from changes in gross domestic product growth, financial and credit market fluctuations, political turmoil, natural catastrophes, warfare and terrorist attacks on the United States, Europe, the Asia Pacific region or elsewhere, could cause a decrease in business investments, including spending on information technology, and negatively affect the growth of our business. To the extent our platform is perceived by customers and potential customers as discretionary, our revenue may be disproportionately affected by delays or reductions in general information technology spending. Also, customers may choose to develop in-house software as an alternative to using our platform. Moreover, competitors may respond to market conditions by lowering prices and attempting to lure away our customers. In addition, the increased pace of consolidation in certain industries may result in reduced overall spending on our platform. We cannot predict the timing, strength or duration of any economic slowdown, instability or recovery, generally or within any particular industry. If the economic conditions of the general economy or markets in which we operate do not improve, or worsen from present levels, our business, results of operations and financial condition could be adversely affected.
We are subject to governmental export and import controls that could impair our ability to compete in international markets due to licensing requirements and subject us to liability if we are not in compliance with applicable laws.
Our platform is subject to export controls, including the U.S. Department of Commerce’s Export Administration Regulations and various economic and trade sanctions regulations administered by the U.S. Treasury Department’s Office of Foreign Assets Controls. The U.S. export control laws and U.S. economic sanctions laws include prohibitions on the sale or supply of certain products and services to U.S. embargoed or sanctioned countries, governments, persons and entities and also require authorization for the export of encryption items. In addition, various countries regulate the import of certain encryption technology,
24
including through import permitting and licensing requirements, and have enacted laws that could limit our ability to distribute our platform or could limit our customers’ ability to implement our platform in those countries. Although we take precautions to prevent our platform from being provided or deployed in violation of such laws, our platform may have been in the past, and could in the future be, provided inadvertently in violation of such laws, despite the precautions we take. For example, in September 2016, we filed a voluntary self-disclosure regarding our past failure to seek and receive an export license prior to distribution of encrypted software. In response to this voluntary self-disclosure, we received a written warning from the U.S. Department of Commerce’s Bureau of Industry and Security. If we fail to comply with these laws, we and our employees could be subject to civil or criminal penalties, including the possible loss of export privileges, monetary penalties, and, in extreme cases, imprisonment of responsible employees for knowing and willful violations of these laws. We may also be adversely affected through penalties, reputational harm, loss of access to certain markets, or otherwise.
Changes in our platform, or changes in export, sanctions and import laws, may delay the introduction and sale of subscriptions to our platform in international markets, prevent our customers with international operations from deploying our platform or, in some cases, prevent the provision of our platform to certain countries, governments, persons or entities altogether. Any change in export or import regulations, economic sanctions or related laws, shift in the enforcement or scope of existing regulations, or change in the countries, governments, persons or technologies targeted by such regulations, could result in decreased use of our platform, or in our decreased ability to export or sell subscriptions to our platform to existing customers or potential new customers with international operations. Any decreased use of our platform or limitation on our ability to export or sell subscriptions to our platform could adversely affect our business, results of operations and financial condition.
Failure to comply with anti-bribery, anti-corruption, and anti-money laundering laws could subject us to penalties and other adverse consequences.
We are subject to the FCPA, the U.K. Bribery Act and other anti-corruption, anti-bribery and anti-money laundering laws in various jurisdictions both domestic and abroad. We leverage third parties, including channel partners, to sell subscriptions to our platform and conduct our business abroad. We and our third-party intermediaries may have direct or indirect interactions with officials and employees of government agencies or state-owned or affiliated entities and may be held liable for the corrupt or other illegal activities of these third-party business partners and intermediaries, our employees, representatives, contractors, channel partners, and agents, even if we do not explicitly authorize such activities. While we have policies and procedures to address compliance with such laws, we cannot assure you that all of our employees and agents will not take actions in violation of our policies and applicable law, for which we may be ultimately held responsible. Any violation of the FCPA or other applicable anti-bribery, anti-corruption laws, and anti-money laundering laws could result in whistleblower complaints, adverse media coverage, investigations, loss of export privileges, severe criminal or civil sanctions, or suspension or debarment from U.S. government contracts, all of which may have an adverse effect on our reputation, business, operating results and prospects.
If we were not able to satisfy data protection, security, privacy and other government-and industry-specific requirements, our business, results of operations, and financial condition could be harmed.
Personal privacy has become a significant issue in the United States and in many other countries where we offer our platform. The regulatory framework for privacy issues worldwide is rapidly evolving and is likely to remain uncertain for the foreseeable future. Many federal, state and foreign government bodies and agencies have adopted or are considering adopting laws and regulations regarding the collection, use, disclosure, and protection of personal information. In the United States, these include, among others, rules and regulations promulgated under the authority of the Federal Trade Commission, the Health Insurance Portability and Accountability Act (HIPAA) of 1996 and state breach notification laws. Internationally, many of the jurisdictions in which we operate have established their own data security, data protection, and privacy legal frameworks with which we or our customers must comply. These privacy, data protection and information security laws and regulations may result in ever-increasing regulatory and public scrutiny and escalating levels of enforcement and sanctions. Additionally, new laws and regulations relating to privacy, data protection, and information security continue to be proposed and enacted. For example, the European Union has adopted a General Data Protection Regulation (GDPR), to supersede the Data Protection Directive. This regulation, which will take full effect on May 25, 2018, will cause EU data protection requirements to be more stringent and provide for greater penalties. Noncompliance with the GDPR can trigger fines of up to €20 million or 4% of global annual revenue, whichever is higher.
The privacy, data protection, and information security laws and regulations we must comply with also are subject to change. For example, in June 2016, United Kingdom voters approved an exit from the European Union, commonly referred to as “Brexit,” which could also lead to further legislative and regulatory changes. In March 2017, the United Kingdom began the process to leave the EU by April 2019. A Data Protection Bill has been introduced to the United Kingdom’s House of Lords that proposes to substantially implement the GDPR. Nevertheless, the Data Protection Bill must complete the legislative process, so it remains unclear what modifications will be made to the final legislation. Additionally, an October 2015 ruling of the Court of Justice of the European Union invalidated the U.S.-EU Safe Harbor Framework as a method of compliance with European
25
restrictions regarding the transfer of personal data outside of the European Economic Area, or EEA. Additionally, U.S. and EU authorities reached a political agreement in February 2016 regarding a new means for legitimizing personal data transfers from the EEA to the U.S., the EU-U.S. Privacy Shield Framework, and we have joined the EU-U.S. Privacy Shield Framework and a related program, the Swiss-U.S. Privacy Shield Framework. The EU-U.S. Privacy Shield is subject to legal challenge, however, and it or the Swiss-U.S. Privacy Shield may be modified or invalidated. We may be unsuccessful in maintaining legitimate means for our transfer and receipt of personal data from the EEA or Switzerland. We may experience reluctance or refusal by current or prospective European customers to use our products, and we may find it necessary or desirable to make further changes to our handling of personal data of European residents.
In addition to government regulation, privacy advocates and industry groups may propose new and different self-regulatory obligations or industry standards that may legally or contractually apply to us. The interpretation and application of privacy, data protection, and information security laws, regulations, and other obligations are uncertain and subject to change, and it is possible that current or future laws, regulations, and other obligations may be interpreted and applied in a manner that is inconsistent with our existing or future practices or the features of our software. If so, in addition to the possibility of regulatory investigations, fines, lawsuits and other claims, we could be required to fundamentally change our business activities and practices or modify our software or our practices, which could have an adverse effect on our business. Additionally, any inability to adequately address privacy, data protection, or information security concerns, even if unfounded, or comply with applicable privacy, data protection, or information security laws, regulations and policies, could result in additional cost and liability to us, damage our reputation, inhibit sales and adversely affect our business, results of operation, and financial condition.
Furthermore, the costs of compliance with, and other burdens imposed by, the laws, regulations and policies that are applicable to the businesses of our customers may limit the use and adoption of, and reduce the overall demand for, our software. Privacy, data protection, and information security concerns, whether valid or not valid, may inhibit market adoption of our platform particularly in certain industries and foreign countries.
The nature of our business requires the application of complex revenue and expense recognition rules and the current legislative and regulatory environment affecting GAAP is uncertain. Significant changes in current principles could affect our consolidated financial statements going forward and changes in financial accounting standards or practices may cause adverse, unexpected financial reporting fluctuations and harm our results of operations.
The accounting rules and regulations that we must comply with are complex and subject to interpretation by the FASB, the SEC, and various bodies formed to promulgate and interpret appropriate accounting principles. In addition, many companies’ accounting disclosures are being subjected to heightened scrutiny by regulators and the public. Further, the accounting rules and regulations are continually changing in ways that could impact our financial statements. For example, in May 2014, FASB issued new accounting guidance on revenue recognition, Accounting Standards Update No. 2014-09, Revenue from Contracts with Customers (Topic 606), that became effective for us on January 1, 2018. The standard permits the use of either a retrospective or cumulative effect transition method. In addition, we have also considered the impact of the guidance in Accounting Standards Codification (ASC) 340-40, Other Assets and Deferred Costs; Contracts with Customers, under ASU 2014-09.
We will apply the standard retrospectively to each prior period presented. The application of this new guidance could have an adverse effect on our net income or loss. In Note 2 of the notes to our consolidated financial statements included elsewhere in this Annual Report on Form 10-K, we disclose quantitative ranges as estimates of the expected effects of our adoption of ASU 2014-09. Changes to accounting principles or our accounting policies on our financial statements going forward are difficult to predict and could have a significant effect on our reported financial results, and could affect the reporting of transactions completed before the announcement of the change. In addition, were we to change our critical accounting estimates, including the timing of recognition of license revenue and other revenue sources, our results of operations could be significantly impacted.
If we fail to maintain an effective system of disclosure controls and internal control over financial reporting, our ability to produce timely and accurate financial statements or comply with applicable regulations could be impaired.
As a public company, we are subject to the reporting requirements of the Securities Exchange Act of 1934, as amended, or the Exchange Act, the Sarbanes-Oxley Act, and the rules and regulations of the applicable listing standards of the New York Stock Exchange. We expect that the requirements of these rules and regulations will continue to increase our legal, accounting and financial compliance costs, make some activities more difficult, time-consuming and costly, and place significant strain on our personnel, systems and resources.
The Sarbanes-Oxley Act requires, among other things, that we maintain effective disclosure controls and procedures and internal control over financial reporting. We are continuing to develop and refine our disclosure controls and other procedures that are designed to ensure that information required to be disclosed by us in the reports that we will file with the SEC is recorded,
26
processed, summarized and reported within the time periods specified in SEC rules and forms and that information required to be disclosed in reports under the Exchange Act is accumulated and communicated to our principal executive and financial officers. We are also continuing to improve our internal control over financial reporting. In order to maintain and improve the effectiveness of our disclosure controls and procedures and internal control over financial reporting, we have expended, and anticipate that we will continue to expend, significant resources, including accounting-related costs and significant management oversight.
Our current controls and any new controls that we develop may become inadequate because of changes in conditions in our business. Further, weaknesses in our disclosure controls and internal control over financial reporting may be discovered in the future. Any failure to develop or maintain effective controls or any difficulties encountered in their implementation or improvement could harm our results of operations or cause us to fail to meet our reporting obligations and may result in a restatement of our financial statements for prior periods. Any failure to implement and maintain effective internal control over financial reporting also could adversely affect the results of periodic management evaluations and annual independent registered public accounting firm attestation reports regarding the effectiveness of our internal control over financial reporting that we will eventually be required to include in our periodic reports that will be filed with the SEC. Ineffective disclosure controls and procedures and internal control over financial reporting could also cause investors to lose confidence in our reported financial and other information, which would likely have a negative effect on the trading price of our Class A common stock. In addition, if we are unable to continue to meet these requirements, we may not be able to remain listed on the New York Stock Exchange. We are not currently required to comply with the SEC rules that implement Section 404 of the Sarbanes-Oxley Act and are therefore not required to make a formal assessment of the effectiveness of our internal control over financial reporting for that purpose. As a public company, we may be required to provide an annual management report on the effectiveness of our internal control over financial reporting commencing with our second annual report on Form 10-K.
Our independent registered public accounting firm is not required to formally attest to the effectiveness of our internal control over financial reporting until after we are no longer an “emerging growth company” as defined in the JOBS Act. At such time, our independent registered public accounting firm may issue a report that is adverse in the event it is not satisfied with the level at which our internal control over financial reporting is documented, designed or operating. Any failure to maintain effective disclosure controls and internal control over financial reporting could have an adverse effect on our business and results of operations and could cause a decline in the price of our Class A common stock.
Our business depends, in part, on sales to the public sector, and significant changes in the contracting or fiscal policies of the public sector could have an adverse effect on our business.
We derive a portion of our revenue from sales of subscriptions to our platform and related services to federal, state, local and foreign governments, and we believe that the success and growth of our business will continue to depend in part on our successful procurement of government contracts. Factors that could impede our ability to maintain or increase the amount of revenue derived from government contracts, include:
• | changes in fiscal or contracting policies; |
• | decreases in available government funding; |
• | changes in government programs or applicable requirements; |
• | the adoption of new laws or regulations or changes to existing laws or regulations; and |
• | potential delays or changes in the government appropriations or other funding authorization processes. |
The occurrence of any of the foregoing could cause governments and governmental agencies to delay or refrain from purchasing subscriptions to our platform and related services in the future or otherwise have an adverse effect on our business, results of operations and financial condition.
Certain of our results of operations and financial metrics may be difficult to predict as a result of seasonality.
Although we have not historically experienced significant seasonality with respect to our revenue throughout the year, we have seen seasonality in our sales cycle as a large percentage of our customers make their purchases late in the fourth quarter of a given year and pay us in the first quarter of the subsequent year. We may be affected by seasonal trends in the future, particularly as our business matures. Such seasonality may result from a number of factors, including a slowdown in our customers’ procurement process during certain times of the year, both domestically and internationally, and customers choosing to spend remaining budgets shortly before the end of their fiscal years. These effects may become more pronounced as we target larger organizations, and their larger budgets for sales of our platform. Additionally, this seasonality may be reflected to a much lesser extent, and sometimes may not be immediately apparent, in our revenue, due to the fact that we recognize subscription revenue over the term of the applicable subscription agreement. To the extent we experience this seasonality, it may cause fluctuations in our results of operations and financial metrics, and make forecasting our future results of operations and financial metrics more difficult.
27
We may require additional capital to support our operations or the growth of our business, and we cannot be certain that this capital will be available on reasonable terms when required, or at all.
We have funded our operations since inception primarily through equity financings and payments by our customers for use of our platform and services. We cannot be certain when or if our operations will generate sufficient cash to fund our ongoing operations or the growth of our business.
In the future, we may require additional capital to support such activities or to respond to other business opportunities, challenges, acquisitions, or unforeseen circumstances. Our ability to obtain additional financing, if and when required, will depend on investor and lender demand, our operating performance, the condition of the capital markets and other factors. We cannot be certain that additional financing will be available to us on favorable terms when required, or at all. If we raise additional funds through future issuances of equity or convertible debt securities, our existing stockholders could suffer significant dilution, and any new equity securities we issue could have rights, preferences and privileges superior to those of holders of our Class A common stock and Class B common stock. Any debt financing that we may secure in the future could involve restrictive covenants relating to our capital raising activities and other financial and operational matters, which may make it more difficult for us to obtain additional capital and to pursue business opportunities, including potential acquisitions. If we were unable to obtain adequate financing or financing on terms satisfactory to us when we require it, our ability to continue to support our business growth and to respond to business challenges could be significantly impaired.
Taxing authorities may successfully assert that we should have collected or in the future should collect sales and use, value added or similar taxes, and we could be subject to liability with respect to past or future sales, which could adversely affect our financial results.
We do not collect sales and use, value added and similar taxes in all jurisdictions in which we have sales, based on our belief that such taxes are not applicable. Sales and use, value added and similar tax laws and rates vary greatly by jurisdiction. Certain jurisdictions in which we do not collect such taxes may assert that such taxes are applicable, which could result in tax assessments, penalties and interest, and we may be required to collect such taxes in the future. Such tax assessments, penalties and interest or future requirements may adversely affect our results of operations. Additionally, the application of federal, state, local and international tax laws to solutions provided digitally are continuously evolving. Income, sales, use or other tax laws, statutes, rules, regulations or ordinances could be enacted or amended at any time, possibly with retroactive effect, which could increase our taxes and ultimately result in a negative impact on our results of operations and cash flows.
Our ability to use our net operating losses to offset future taxable income may be subject to certain limitations.
As of December 31, 2017, we had net operating loss carryforwards, or NOLs, for federal, California and other state income tax purposes of approximately $231.8 million, $63.1 million and $88.8 million, respectively, which may be available to offset tax income in the future. In general, under Section 382 of the Internal Revenue Code of 1986, as amended, or the Code, a corporation that undergoes an “ownership change” is subject to limitations on its ability to utilize its pre-change NOLs to offset future taxable income. We have undergone ownership changes in the past, which has resulted in some limitations on our ability to utilize our NOLs, and if we undergo an ownership change, our ability to utilize NOLs could be further limited by Section 382 of the Code. Future changes in our stock ownership, some of which are outside of our control, could result in an ownership change under Section 382 of the Code. Furthermore, our ability to utilize NOLs of companies that we have acquired or may acquire in the future may be subject to limitations. There is also a risk that due to regulatory changes, such as suspensions on the use of NOLs or other unforeseen reasons, our existing NOLs could expire or otherwise be unavailable to offset future income tax liabilities, including for state tax purposes. For these reasons, we may not be able to utilize a material portion of the NOLs reflected on our balance sheet, even if we attain profitability.
We may acquire or invest in companies, which may divert our management’s attention and result in additional dilution to our stockholders. We may be unable to integrate acquired businesses and technologies successfully or achieve the expected benefits of such acquisitions.
Our success will depend, in part, on our ability to expand our platform and services and grow our business in response to changing technologies, customer demands and competitive pressures. In some circumstances, we may choose to do so through the acquisition of complementary businesses and technologies rather than through internal development. The identification of suitable acquisition candidates can be difficult, time-consuming and costly, and we may not be able to successfully complete identified acquisitions. The risks we face in connection with acquisitions include:
• | an acquisition may negatively affect our results of operations because it may require us to incur charges or assume substantial debt or other liabilities, may cause adverse tax consequences or unfavorable accounting treatment, may |
28
expose us to claims and disputes by stockholders and third parties, including intellectual property claims and disputes, or may not generate sufficient financial return to offset additional costs and expenses related to the acquisition;
• | we may encounter difficulties or unforeseen expenditures in integrating the business, technologies, products, personnel or operations of any company that we acquire, particularly if key personnel of the acquired company decide not to work for us; |
• | an acquisition may disrupt our ongoing business, divert resources, increase our expenses and distract our management; |
• | an acquisition may result in a delay or reduction of customer purchases for both us and the company acquired due to customer uncertainty about continuity and effectiveness of service from either company; |
• | we may encounter difficulties in, or may be unable to, successfully sell any acquired products; |
• | our use of cash to pay for acquisitions would limit other potential uses for our cash; |
• | if we incur debt to fund any acquisitions, such debt may subject us to material restrictions on our ability to conduct our business financial maintenance covenants; and |
• | if we issue a significant amount of equity securities in connection with future acquisitions, existing stockholders may be diluted and earnings per share may decrease. |
The occurrence of any of these risks could have an adverse effect on our business, results of operations and financial condition.
We depend and rely upon SaaS technologies from third parties to operate our business, and interruptions or performance problems with these technologies may adversely affect our business and results of operations.
We rely on hosted SaaS applications from third parties in order to operate critical functions of our business, including enterprise resource planning, order management, billing, cybersecurity, project management, and accounting and reporting all financial activity. If these services become unavailable due to extended outages, interruptions or because they are no longer available on commercially reasonable terms, our expenses could increase, our ability to manage finances could be interrupted and our processes for managing sales of our platform and supporting our customers could be impaired until equivalent services, if available, are identified, obtained and implemented, all of which could adversely affect our business.
We are an “emerging growth company,” and our election to comply with the reduced disclosure requirements as a public company may make our Class A common stock less attractive to investors.
For so long as we remain an “emerging growth company,” as defined in the JOBS Act, we may take advantage of certain exemptions from various requirements that are applicable to public companies that are not “emerging growth companies,” including not being required to comply with the independent auditor attestation requirements of Section 404 of the Sarbanes-Oxley Act, reduced disclosure obligations regarding executive compensation in our periodic reports and proxy statements, and exemptions from the requirements of holding a non-binding advisory vote on executive compensation and stockholder approval of any golden parachute payments not previously approved. We will remain an “emerging growth company” until the earliest of (i) December 31, 2022 (ii) the last day of the first fiscal year in which our annual gross revenue is $1.07 billion or more, (iii) the date on which we have, during the previous rolling three-year period, issued more than $1 billion in non-convertible debt securities or (iv) the date on which we are deemed to be a “large accelerated filer” as defined in the Exchange Act. We cannot predict if investors will find our Class A common stock less attractive because we may rely on these exemptions. If some investors find our Class A common stock less attractive as a result, there may be a less active trading market for our Class A common stock, and our stock price may be more volatile and may decline.
In addition, the JOBS Act also provides that an “emerging growth company” can take advantage of an extended transition period for complying with new or revised accounting standards. However, we have chosen to “opt out” of such extended transition period, and as a result, we will comply with new or revised accounting standards on the relevant dates on which adoption of such standards is required for non-emerging growth companies. Our decision to opt out of the extended transition period for complying with new or revised accounting standards is irrevocable.
29
Our business is subject to the risks of earthquakes, fire, floods and other natural catastrophic events, and to interruption by man-made problems such as power disruptions, computer viruses, data security breaches or terrorism.
Our corporate headquarters are located in the San Francisco Bay Area, a region known for seismic activity. A significant natural disaster, such as an earthquake, fire or a flood, occurring at our headquarters, at one of our other facilities or where a business partner is located could adversely affect our business, results of operations and financial condition. Further, if a natural disaster or man-made problem were to affect data centers used by AWS, this could adversely affect the ability of our customers to use our platform. In addition, natural disasters and acts of terrorism could cause disruptions in our or our customers’ businesses, national economies or the world economy as a whole. We also rely on our network and third-party infrastructure and enterprise applications and internal technology systems for our engineering, sales and marketing and operations activities. Although we maintain incident management and disaster response plans, in the event of a major disruption caused by a natural disaster or man-made problem, we may be unable to continue our operations and may endure system interruptions, reputational harm, delays in our development activities, lengthy interruptions in service, breaches of data security and loss of critical data, any of which could adversely affect our business, results of operations and financial condition.
In addition, computer malware, viruses and computer hacking, fraudulent use attempts and phishing attacks have become more prevalent in our industry, have occurred on our platform in the past and may occur on our platform in the future. Though it is difficult to determine what, if any, harm may directly result from any specific interruption or attack, any failure to maintain performance, reliability, security and availability of our platform and technical infrastructure to the satisfaction of our users may harm our reputation and our ability to retain existing customers and attract new customers.
Risks Related to Ownership of Our Class A Common Stock
The dual class structure of our common stock has the effect of concentrating voting control with those stockholders who held our capital stock prior to the completion of our initial public offering, including our executive officers, employees and directors and their affiliates, which limits your ability to influence the outcome of important transactions, including a change in control.
Our Class B common stock has 10 votes per share, and our Class A common stock has one vote per share. As of December 31, 2017, outstanding shares of Class B common stock represented approximately 84.7% of the voting power of our outstanding capital stock, and outstanding shares of Class B common stock held by our directors, executive officers, and each of our stockholders who beneficially owns greater than 10% of our outstanding capital stock, and their affiliates, represented approximately 77.3% of the voting power of our outstanding capital stock. Because of the 10-to-1 voting ratio between our Class B common stock and Class A common stock, the holders of our Class B common stock will collectively continue to control a majority of the combined voting power of our capital stock and therefore will be able to control all matters submitted to our stockholders for approval even when the shares of Class B common stock represent a small minority of all outstanding shares of our Class A common stock and Class B common stock. These holders of our Class B common stock may also have interests that differ from yours and may vote in a way with which you disagree and which may be adverse to your interests. This concentrated control may have the effect of delaying, preventing or deterring a change in control of our company, could deprive our stockholders of an opportunity to receive a premium for their capital stock as part of a sale of our company and might ultimately affect the market price of our Class A common stock.
Future transfers by holders of our Class B common stock will generally result in those shares converting into shares of our Class A common stock, subject to limited exceptions, such as certain transfers effected for tax or estate planning purposes. The conversion of shares of our Class B common stock into shares of our Class A common stock will have the effect, over time, of increasing the relative voting power of those holders of Class B common stock who retain their shares in the long term. If, for example, Messrs. Schott and Mason retain a significant portion of their holdings of our Class B common stock for an extended period of time, they could control a significant portion of the voting power of our capital stock for the foreseeable future. As a board member, Mr. Schott owes a fiduciary duty to our stockholders and must act in good faith and in a manner he reasonably believes to be in the best interests of our stockholders. As stockholders, Messrs. Schott and Mason are entitled to vote their shares in their own interests, which may not always be in the interests of our stockholders generally.
The trading price of our Class A common stock could be volatile, which could cause the value of your investment to decline.
Technology stocks have historically experienced high levels of volatility. The trading price of our Class A common stock has fluctuated since our initial public offering and may fluctuate substantially in the future depending on many factors, some of which are beyond our control and may not be related to our operating performance. Factors that could cause fluctuations in the trading price of our Class A common stock include the following:
30
• | announcements of new products or technologies, commercial relationships, acquisitions or other events by us or our competitors; |
• | changes in how customers perceive the benefits of our platform; |
• | departures of key personnel; |
• | price and volume fluctuations in the overall stock market from time to time; |
• | fluctuations in the trading volume of our shares or the size of our public float; |
• | sales of large blocks of our Class A common stock; |
• | actual or anticipated changes or fluctuations in our results of operations; |
• | whether our results of operations meet the expectations of securities analysts or investors; |
• | changes in actual or future expectations of investors or securities analysts; |
• | litigation involving us, our industry, or both; |
• | regulatory developments in the United States, foreign countries or both; |
• | general economic conditions and trends; |
• | major catastrophic events in our domestic and foreign markets; and |
• | “flash crashes,” “freeze flashes” or other glitches that disrupt trading on the securities exchange on which we are listed. |
In addition, if the market for technology stocks or the stock market in general experiences a loss of investor confidence, the trading price of our Class A common stock could decline for reasons unrelated to our business, results of operations or financial condition. The trading price of our Class A common stock might also decline in reaction to events that affect other companies in our industry even if these events do not directly affect us. In the past, following periods of volatility in the trading price of a company’s securities, securities class action litigation has often been brought against that company. If our stock price is volatile, we may become the target of securities litigation. Securities litigation could result in substantial costs and divert our management’s attention and resources from our business. This could have an adverse effect on our business, results of operations and financial condition.
If securities analysts or industry analysts were to downgrade our stock, publish negative research or reports or fail to publish reports about our business, our competitive position could suffer, and our stock price and trading volume could decline.
The trading market for our Class A common stock will, to some extent, depend on the research and reports that securities or industry analysts publish about us or our business. We do not have any control over these analysts. If one or more of the analysts who cover us should downgrade our stock or publish negative research or reports, cease coverage of our company or fail to regularly publish reports about our business, our competitive position could suffer, and our stock price and trading volume could decline.
Sales of substantial amounts of our Class A common stock in the public markets, or the perception that such sales could occur, could reduce the price that our Class A common stock might otherwise attain.
Sales of a substantial number of shares of our Class A common stock in the public market in the near future, or the perception that such sales could occur, could adversely affect the market price of our Class A common stock and may make it more difficult for you to sell your Class A common stock at a time and price that you deem appropriate. As of December 31, 2017, we had 131,337,767 shares of capital stock outstanding, all of which are freely tradable, unless such shares are held by “affiliates,” as that term is defined in Rule 144 of the Securities Act.
As of December 31, 2017, a significant portion of our outstanding capital stock have rights, subject to certain conditions, to require us to file registration statements covering the sale of their shares or to include their shares in registration statements that we may file for ourselves or other stockholders. We have also registered the offer and sale of all shares of capital stock that we may issue under our equity compensation plans. As a result, subject to the satisfaction of applicable vesting periods, the shares of our capital stock issued upon exercise or settlement of outstanding equity awards under our equity compensation plans will be available for immediate resale in the United States in the open market.
Our issuance of additional capital stock in connection with financings, acquisitions, investments, our stock incentive plans or otherwise will dilute all other stockholders.
We expect to issue additional capital stock in the future that will result in dilution to all other stockholders. We expect to grant equity awards to employees, directors and consultants under our stock incentive plans. We may also raise capital through equity financings in the future. As part of our business strategy, we may acquire or make investments in complementary companies, products or technologies and issue equity securities to pay for any such acquisition or investment. Any such issuances of additional
31
capital stock may cause stockholders to experience significant dilution of their ownership interests and the per share value of our Class A common stock to decline.
We do not intend to pay dividends on our Class A common stock and, consequently, your ability to achieve a return on your investment will depend on appreciation in the price of our Class A common stock.
We have never declared or paid any dividends on our capital stock. We intend to retain any earnings to finance the operation and expansion of our business, and we do not anticipate paying any cash dividends in the foreseeable future. As a result, you may only receive a return on your investment in our Class A common stock if the market price of our Class A common stock increases.
Delaware law and our corporate charter and bylaws contain anti-takeover provisions that could delay or discourage takeover attempts that stockholders may consider favorable.
Our amended and restated certificate of incorporation and amended and restated bylaws contain provisions that could delay or prevent a change in control of our company. These provisions could also make it difficult for stockholders to elect directors who are not nominated by the current members of our board of directors or take other corporate actions, including effecting changes in our management. These provisions include:
• | a classified board of directors with three-year staggered terms, which could delay the ability of stockholders to change the membership of a majority of our board of directors; |
• | the ability of our board of directors to issue shares of preferred stock and to determine the price and other terms of those shares, including preferences and voting rights, without stockholder approval, which could be used to significantly dilute the ownership of a hostile acquirer; |
• | the exclusive right of our board of directors to elect a director to fill a vacancy created by the expansion of our board of directors or the resignation, death or removal of a director, which prevents stockholders from being able to fill vacancies on our board of directors; |
• | a prohibition on stockholder action by written consent, which forces stockholder action to be taken at an annual or special meeting of our stockholders; |
• | the requirement that a special meeting of stockholders may be called only by our board of directors, the chairperson of our board of directors, our Chief Executive Officer or our President (in the absence of a Chief Executive Officer), which could delay the ability of our stockholders to force consideration of a proposal or to take action, including the removal of directors; |
• | the requirement for the affirmative vote of holders of at least 66 2/3% of the voting power of all of the then outstanding shares of the voting stock, voting together as a single class, to amend the provisions of our amended and restated certificate of incorporation relating to the management of our business (including our classified board structure) or certain provisions of our amended and restated bylaws, which may inhibit the ability of an acquirer to effect such amendments to facilitate an unsolicited takeover attempt; |
• | the ability of our board of directors to amend the bylaws, which may allow our board of directors to take additional actions to prevent an unsolicited takeover and inhibit the ability of an acquirer to amend the bylaws to facilitate an unsolicited takeover attempt; |
• | advance notice procedures with which stockholders must comply to nominate candidates to our board of directors or to propose matters to be acted upon at a stockholders’ meeting, which may discourage or deter a potential acquirer from conducting a solicitation of proxies to elect the acquirer’s own slate of directors or otherwise attempting to obtain control of us; and |
• | the authorization of two classes of common stock, as discussed above. |
In addition, as a Delaware corporation, we are subject to Section 203 of the Delaware General Corporation Law, which may prohibit large stockholders, in particular those owning 15% or more of our outstanding voting stock, from merging or combining with us for a specified period of time.
Item 1B. Unresolved Staff Comments
None.
Item 2. Properties
Our corporate headquarters is located in San Francisco, California at 77 Geary Street. We occupy approximately 43,000 square feet under a lease that expires in August 2021.
32
In addition to our headquarters, we also lease offices for sales and marketing in the following U.S. cities: Alpharetta (GA), Chicago (IL), Denver (CO), New York (NY), and Vienna (VA). Additionally, we lease international offices for sales and marketing in the following locations: Cologne, Hong Kong, London, the Netherlands, Singapore, Sweden, Sydney, and Toronto. We have development centers in Buenos Aires, Mountain View (CA), Naperville (IL), and San Francisco (CA).
We lease all of our facilities and do not own any real property. While we believe our facilities are sufficient and suitable for the operations of our business today, we are closely monitoring the need to add new facilities and grow our existing facilities as we add employees and expand into additional markets.
Item 3. Legal Proceedings
The information set forth under Legal Proceedings in Note 6 contained in the "Notes to Consolidated Financial Statements" is incorporated herein by reference.
Item 4. Mine Safety Disclosures
Not applicable.
33
PART II
Item 5. Market for Registrant's Common Equity, Related Stockholder Matters and Issuer Purchases of Equity Securities
Market Information for Common Stock
Our Class A common stock began trading on the New York Stock Exchange under the symbol ”MULE” on March 17, 2017. Prior to that date, there was no public trading market for any of our common stock.
The following table sets forth the high and low sales prices of our Class A common stock as reported by the New York Stock Exchange for the periods indicated:
High | Low | ||||||
Year Ended December 31, 2017: | |||||||
First Quarter | $ | 24.75 | $ | 22.43 | |||
Second Quarter | $ | 28.38 | $ | 21.69 | |||
Third Quarter | $ | 26.70 | $ | 19.54 | |||
Fourth Quarter | $ | 23.98 | $ | 20.03 | |||
Our Class B common stock is not listed or traded on any stock exchange.
Dividend Policy
We have never declared or paid any cash dividends on our capital stock. We currently intend to retain all available funds and any future earnings for use in the operation of our business and do not expect to pay any dividends on our capital stock in the foreseeable future. Any future determination to declare dividends will be made at the discretion of our board of directors, subject to applicable laws, and will depend on a number of factors, including our financial condition, results of operations, capital requirements, contractual restrictions, general business conditions and other factors that our board of directors may deem relevant.
Stockholders
As of December 31, 2017 there were 215 registered stockholders of record of our common stock, including The Depository Trust Company, which holds shares of our common stock on behalf of indeterminate number of beneficial owners.
34
Stock Performance Graph
This performance graph shall not be deemed "soliciting material" or to be "filed" with the SEC for purposes of Section 18 of the Securities Exchange Act of 1934, as amended (Exchange Act), or otherwise subject to the liabilities under that Section, and shall not be deemed to be incorporated by reference into any filing MuleSoft, Inc. under the Securities Act or the Exchange Act.
We have presented below the cumulative total return to our stockholders between March 17, 2017 (the date our Class A common stock commenced trading on the NYSE) and December 31, 2017. Our cumulative total return is presented in comparison to the NYSE Composite Index and Standard & Poor Systems MidCap 400 Information Technology Index. All values assume a $100 initial investment and data for the NYSE Composite Index and Standard & Poor Systems MidCap 400 Information Technology Index assume reinvestment of dividends. The comparisons are based on historical data and are not indicative of, nor intended to forecast, future performance of our common stock.
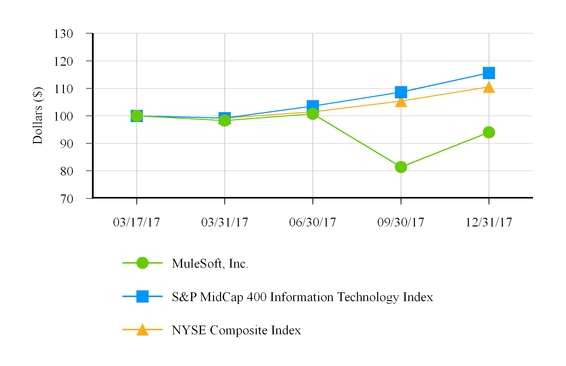
Recent Sales of Unregistered Securities and Use of Proceeds from Registered Securities
(a) Sales of Unregistered Securities
None.
(b) Use of Proceeds
On March 16, 2017, the Registration Statement on Form S-1 (File No. 333-216130) for our initial public offering of our Class A common stock was declared effective by the SEC. Shares of our Class A common stock began trading on the New York Stock Exchange on March 17, 2017.
The underwriters of our initial public offering were Goldman Sachs & Co. LLC, J.P. Morgan Securities LLC, Merrill Lynch, Pierce, Fenner & Smith Incorporated, Allen & Company LLC, Barclays Capital Inc., Jefferies LLC, Canaccord Genuity Inc., Piper Jaffray & Co., and William Blair & Company, L.L.C. We paid to the underwriters of our initial public offering an underwriting discount totaling approximately $17.8 million. In addition, we incurred expenses of approximately $3.7 million which, when added to the underwriting discount, amount to total expenses of approximately $21.5 million. Thus, the net offering proceeds, after deducting underwriting discounts and offering expenses, were approximately $232.7 million. No payments were made to our directors or officers or their associates, holders of 10% or more of any class of our equity securities or any affiliates.
35
There has been no material change in the planned use of proceeds from the initial public offering from that described in the final prospectus filed with the SEC pursuant to Rule 424(b)(4) under the Securities Act on March 17, 2017.
Item 6. Selected Consolidated Financial and Other Data
The consolidated statements of operations data for the fiscal years ended December 31, 2017, 2016, and 2015, and the consolidated balance sheet data as of December 31, 2017 and 2016, have been derived from our audited consolidated financial statements and are included in this Annual Report on Form 10-K. Our historical results are not necessarily indicative of the results that may be expected in the future. You should read the consolidated financial and other data set forth below in conjunction with the section titled “Management’s Discussion and Analysis of Financial Condition and Results of Operations” and our consolidated financial statements and related notes included elsewhere in this Annual Report on Form 10-K.
Year Ended December 31, | ||||||||||||
2017 | 2016 | 2015 | ||||||||||
(in thousands, except share and per share data) | ||||||||||||
Consolidated Statements of Operations Data: | ||||||||||||
Revenue: | ||||||||||||
Subscription and support | $ | 237,980 | $ | 152,843 | $ | 88,096 | ||||||
Professional services and other | 58,476 | 34,904 | 22,156 | |||||||||
Total revenue | 296,456 | 187,747 | 110,252 | |||||||||
Cost of revenue: | ||||||||||||
Subscription and support(1) | 20,001 | 13,722 | 7,525 | |||||||||
Professional services and other(1) | 61,269 | 35,341 | 24,645 | |||||||||
Total cost of revenue | 81,270 | 49,063 | 32,170 | |||||||||
Gross profit | 215,186 | 138,684 | 78,082 | |||||||||
Operating expenses: | ||||||||||||
Research and development(1) | 64,585 | 32,862 | 24,725 | |||||||||
Sales and marketing(1) | 184,583 | 122,630 | 93,057 | |||||||||
General and administrative(1) | 45,813 | 31,577 | 24,368 | |||||||||
Total operating expenses | 294,981 | 187,069 | 142,150 | |||||||||
Loss from operations | (79,795 | ) | (48,385 | ) | (64,068 | ) | ||||||
Interest income | 2,483 | 465 | 220 | |||||||||
Other expense, net | (1,015 | ) | (340 | ) | (729 | ) | ||||||
Net loss before provision for income taxes | (78,327 | ) | (48,260 | ) | (64,577 | ) | ||||||
Provision for income taxes | 1,653 | 1,339 | 862 | |||||||||
Net loss | $ | (79,980 | ) | $ | (49,599 | ) | $ | (65,439 | ) | |||
Net loss attributable to common stockholders | $ | (79,980 | ) | $ | (59,035 | ) | $ | (65,439 | ) | |||
Net loss per share attributable to common stockholders, basic and diluted | $ | (0.75 | ) | $ | (2.73 | ) | $ | (3.57 | ) | |||
Shares used to compute net loss per share attributable to common stockholders, basic and diluted | 106,742,923 | 21,623,610 | 18,324,048 | |||||||||
(1) | Includes stock-based compensation expense and other compensation expense related to the 2015 Common Stock Repurchase and 2016 Tender Offer as follows (in thousands): |
Year Ended December 31, | ||||||||||||
2017 | 2016 | 2015 | ||||||||||
Cost of revenue—subscription and support | $ | 945 | $ | 255 | $ | 146 | ||||||
Cost of revenue—professional services and other | 3,442 | 675 | 324 | |||||||||
Research and development | 6,994 | 2,831 | 2,506 | |||||||||
Sales and marketing | 12,646 | 8,619 | 4,891 | |||||||||
General and administrative | 4,043 | 4,120 | 4,542 | |||||||||
Total stock-based and other compensation expense | $ | 28,070 | $ | 16,500 | $ | 12,409 | ||||||
36
See Note 7, "Stockholder's Equity" for further information about the 2015 Common Stock Repurchase and 2016 Tender Offer.
As of December 31, | ||||||||
2017 | 2016 | |||||||
(In thousands) | ||||||||
Consolidated Balance Sheet Data: | ||||||||
Cash, cash equivalents, and investments | $ | 347,279 | $ | 102,613 | ||||
Working capital | 87,603 | 33,550 | ||||||
Total assets | 492,596 | 202,938 | ||||||
Deferred revenue, current and non-current | 211,432 | 135,614 | ||||||
Convertible preferred stock | — | 255,946 | ||||||
Total stockholders’ equity | 232,947 | 40,103 | ||||||
Key Metrics
We monitor the following key metrics to help us evaluate our business, identify trends affecting our business, formulate business plans, and make strategic decisions.
December 31, | ||||||||||||
2017 | 2016 | 2015 | ||||||||||
Customers (as of end of period) | 1,286 | 1,071 | 839 | |||||||||
Average subscription and support revenue per customer (in thousands) | $ | 185 | $ | 143 | $ | 105 | ||||||
Dollar-based net retention rate | 119 | % | 117 | % | 121 | % | ||||||
For a discussion of our key metrics, see the section titled “Management’s Discussion and Analysis of Financial Condition and Results of Operations—Key Metrics.”
Item 7. Management's Discussion and Analysis of Financial Condition and Result of Operations
You should read the following discussion and analysis of our financial condition and results of operations together with the section titled “Selected Consolidated Financial and Other Data” and the consolidated financial statements and related notes that are included elsewhere in this Annual Report on Form 10-K. This discussion contains forward-looking statements that involve risks and uncertainties. Our actual results may differ materially from those anticipated in these forward-looking statements as a result of various factors, including, but not limited to, those set forth in the section titled “Risk Factors” and in other parts of this Annual Report on Form 10-K.
Overview
We are enabling a fundamental shift in organizations’ technology operating models by equipping them to create composable, agile infrastructures. Our customers use our Anypoint Platform to connect their applications, data and devices into an application network where IT assets are pluggable instead of glued together with custom integration code. The application network enables a self-serve infrastructure through discoverable building blocks that can be used and reused to rapidly compose applications. As a result, the IT organization delivers projects faster and lines of business are able to innovate and respond more rapidly. With an application network built with Anypoint Platform, organizations can transform into composable enterprises.
We generate revenue primarily from sales of software subscriptions to our platform. Our subscription pricing is based primarily on the amount of computing capacity on which our customers run our software. We offer the same capacity-based pricing model regardless of whether customers choose to deploy our platform on-premises or in the cloud. Our subscriptions are term-based, and we recognize revenue from subscriptions ratably over the subscription term. The substantial majority of our subscription and support revenue is derived from subscriptions that are one year in duration and invoiced upfront, although a growing number of our customers are entering into multi-year subscriptions that are invoiced annually. When we enter into a multi-year subscription, we typically invoice the customer on an annual basis.
37
We also generate revenue from professional services, which consist primarily of fees associated with consulting and training services. Revenue derived from professional services is generally recognized ratably as the services are rendered. We will continue to invest in our professional services organization because we believe it plays an important role in accelerating our customers’ realization of the benefits of the platform, which helps to drive customer retention and expansion. A significant percentage of our customers purchase our professional services when they enter into new or expanded subscriptions.
As of December 31, 2017, we had over 1,200 customers located in over 60 countries across every major industry. We sell to organizations worldwide primarily through our direct sales efforts. Although our platform can be adopted by organizations of nearly any size, we focus our sales efforts on the largest global organizations. Our sales efforts are targeted towards CIOs, chief IT architects, and line of business leaders, who are driving digital transformation. We also partner with SIs that enhance our sales leverage by sourcing new prospects and providing systems integration services on implementations of our platform. Historically, customers have expanded their spend with us over time as they realize the benefits of speed and innovation that come with our platform. Our customers expand the use of our platform in two ways. First, they deploy additional capacity as the usage of applications built on our platform increases. Second, as they address additional use cases with their application network, their usage of our platform further increases. The expanded use of our platform by our customers is evidenced by our high dollar-based net retention rate.
We have grown rapidly in recent periods. Our revenue for the years ended December 31, 2017, 2016, and 2015 was $296.5 million, $187.7 million, and $110.3 million, respectively, representing a growth rate of 58% and 70%, respectively. We incurred net losses of $80.0 million, $49.6 million, and $65.4 million in the years ended December 31, 2017, 2016, and 2015, respectively. We have made substantial investments in developing our platform, expanding our sales, services, and marketing capabilities, and providing general and administrative resources to support our growth. Specifically, we have increased our headcount from 841 employees as of December 31, 2016 to 1,188 employees as of December 31, 2017. We intend to continue to invest heavily to grow our business to take advantage of our expansive market opportunity rather than optimizing for profitability or cash flow in the near future.
Key Metrics
We monitor the following key metrics to help us evaluate our business, identify trends affecting our business, formulate business plans, and make strategic decisions. We believe the following metrics are useful in evaluating our business.
Customers. We believe that the number of customers is a key metric because our ability to attract new customers and grow our customer base helps drive our success and is an important contributor to the growth in our revenue. We have successfully demonstrated a history of growing both our customer base and spend per customer through increased use of our platform. As our sales force continues to focus on selling Anypoint Platform to large organizations, we expect the rate of increase in customer growth to decline, but we expect our sales model will drive higher average subscription and support revenue per customer.
We define the number of customers at the end of any particular period as the number of parties or organizations that have entered into a subscription contract with us for which the term has not ended, or with which we are negotiating a renewal contract. Each party with which we have entered into a subscription contract is considered a unique customer, and in some cases, there may be more than one customer within a single organization. Although customers can elect not to renew their subscriptions by providing prior written notice to us, our subscription contracts typically have automatic renewal provisions that become effective on the expiration of a subscription contract. To the extent that we are negotiating a renewal with a customer after the expiration of the subscription contract, we continue to count such organization as a customer for a period of four months if we are actively in discussion with such organization for a new subscription contract or a contract renewal, or until such organization notifies us that it is not renewing its subscription contract, if earlier.
The following table sets forth the number of customers:
As of December 31, | |||||||||
2017 | 2016 | 2015 | |||||||
Customers | 1,286 | 1,071 | 839 | ||||||
Average Subscription and Support Revenue per Customer. We believe that average subscription and support revenue per customer is a key metric because it is a reflection of our customers’ growing commitment to our platform and our sales force’s productivity.
38
We define average subscription and support revenue per customer as subscription and support revenue for a trailing 12-month period divided by the number of customers as of the end of the period.
The following table sets forth the average subscription and support revenue per customer:
Year Ended December 31, | ||||||||||||
2017 | 2016 | 2015 | ||||||||||
(In thousands) | ||||||||||||
Average subscription and support revenue per customer | $ | 185 | $ | 143 | $ | 105 | ||||||
Dollar-Based Net Retention Rate. We believe that dollar-based net retention rate is a key metric to measure the long-term value of our customer relationships and is driven by our ability to retain and expand the subscription and support revenue generated from our existing customers. Our dollar-based net retention rate compares our subscription and support revenue from the same set of customers across comparable periods.
We calculate our dollar-based net retention rate for all periods on a trailing four-quarter basis. To calculate our dollar-based net retention rate, we first calculate the subscription and support revenue in one quarter from a cohort of customers that were customers at the beginning of the same quarter in the prior fiscal year, or Cohort Customers. We repeat this calculation for each quarter in the trailing four-quarter period. The numerator for dollar-based net retention rate is the sum of subscription and support revenue from Cohort Customers for the four most recent quarters, or Numerator Period, and the denominator is the sum of subscription and support revenue from Cohort Customers for the four quarters preceding the Numerator Period.
Dollar-based net retention rate is the quotient obtained by dividing the numerator by the denominator. Our dollar-based net retention rate may fluctuate as a result of a number of factors, including our customers’ satisfaction or dissatisfaction with our platform, the increase in the contract value of subscription and support contracts from new customers, and the other risk factors included in this Annual Report on Form 10-K.
The following table sets forth the dollar-based net retention rates:
Year Ended December 31, | |||||||||
2017 | 2016 | 2015 | |||||||
Dollar-based net retention rate | 119 | % | 117 | % | 121 | % | |||
Components of Results of Operations
Revenue. We generate revenue from the following sources: (i) subscription and support revenue, which is comprised of subscription fees from customers accessing our cloud-hosted software and from term-based licenses of our software and support services; and (ii) professional services and other revenue, which consists primarily of fees associated with consulting and training services related to the implementation and configuration of our platform.
We recognize subscription and support revenue from our cloud-hosted software ratably over the term of the arrangement. Term-based licenses are sold with support services and are recognized ratably over the life of the license or support period. Our subscriptions are typically one year in duration, although a growing number of our customers are entering into multi-year subscriptions. We generally invoice our customers in annual installments at the beginning of each year in the subscription period. Amounts that have been invoiced are initially recorded as deferred revenue and are recognized ratably over the subscription period.
Professional services and other revenue is generally recognized as the services are rendered for time-and-material contracts or on a proportional performance basis for fixed-price contracts. Revenue from professional services sold exclusively with term-based licenses is recognized over the term of the subscription. We will continue to invest in our professional services because we believe that it plays an important role in enabling our customers to achieve success on our platform and accelerate their realization of its benefits, which helps to drive retention of, and expansion with, our customers.
Cost of Revenue. Cost of revenue for subscription and support consists primarily of cloud-hosting costs and personnel-related costs of our customer support organization, including salaries, bonuses, benefits, stock-based compensation,
39
commissions, and other compensation related to the equity transactions described below, as well as contractor costs to supplement our staff levels, third-party software royalties, and allocated overhead.
Cost of revenue for professional services and other revenue consists primarily of personnel-related costs of our consulting and training departments, including salaries, bonuses, benefits, stock-based compensation, commissions, and other compensation related to the equity transactions described below, as well as contractor costs to supplement our staff levels, and allocated overhead.
Gross Profit and Gross Margin. Gross profit, or total revenue less total cost of revenue, and gross margin, or gross profit as a percentage of total revenue, has been and will continue to be affected by various factors, including the mix among our subscription and support and professional services and other revenue, the costs associated with third-party hosting services for our cloud-based subscriptions, and the extent to which we expand our customer support and professional services organizations. Our gross margin on subscription and support revenue is significantly higher than our gross margin on professional services and other revenue. We expect our gross margin will fluctuate from period to period depending on the interplay of these various factors.
Operating Expenses. Our operating expenses consist of research and development, sales and marketing, and general and administrative expenses. The most significant component of each of our operating expense categories is personnel-related costs, including salaries, bonuses, benefits, stock-based compensation, and other compensation related to the equity transactions described below, and with respect to sales and marketing, sales commissions and incentives.
Research and Development Expenses. Research and development expenses consist primarily of personnel-related costs for the design and development of our platform and technologies, contractor costs to supplement our staff levels, third-party web services, consulting services, costs associated with our company-wide meeting, and allocated overhead. We expense research and development expenses as they are incurred. Historically, a significant percentage of our research and development has been conducted by our personnel in Argentina, which has provided a substantial cost-advantage in research and development expenses. We expect our research and development expenses to increase in absolute dollars and may fluctuate as a percentage of our total revenue from period to period, as we expand our research and development team to develop new products and product enhancements.
Sales and Marketing Expenses. Our sales and marketing expenses consist primarily of personnel-related costs for our sales and marketing employees, marketing programs including trade shows, costs associated with our company-wide meeting, and allocated overhead. We expect that our sales and marketing expenses will increase in absolute dollars and may fluctuate as a percentage of our total revenue from period to period as we hire additional sales and marketing personnel, increase our marketing activities, grow our domestic and international operations, and build brand awareness.
General and Administrative Expenses. Our general and administrative expenses consist primarily of personnel-related costs for executive, finance, legal, human resources, recruiting and administrative personnel, as well as professional fees for external legal, accounting, recruiting and other consulting services, costs associated with our company-wide meeting, and allocated overhead. We expect to continue to incur additional general and administrative expenses as a result of operating as a public company, including expenses related to compliance with the rules and regulations of the SEC and listing standards of the New York Stock Exchange, additional insurance expenses, investor relations activities and other administrative and professional services. We also expect to increase the size of our general and administrative function to support the growth of our business. As a result, we expect that our general and administrative expenses will increase in absolute dollars and may fluctuate as a percentage of our total revenue from period to period.
Interest Income. Interest income consists primarily of income earned on our cash equivalents and investments in marketable securities.
Other Expense, Net. Other expense, net consists primarily of foreign currency transaction gains and losses related to the impact of transactions denominated in a foreign currency other than the functional currencies of our legal entities. As we have expanded our international operations, our exposure to fluctuations in foreign currencies has increased, and we expect this to continue.
Income Tax Expense. Provision for income taxes consists primarily of income taxes in certain foreign jurisdictions in which we conduct business. As we have expanded our international operations, we have incurred increased foreign tax expense, and we expect this to continue. We have a full valuation allowance for net deferred tax assets, including net operating loss carryforwards, and tax credits related primarily to research and development for our operations in the United States. We expect
40
to maintain this full valuation allowance for the foreseeable future. We also have deferred tax assets or liabilities in certain of our foreign subsidiaries including in the United Kingdom, Argentina and Australia.
Equity Transactions. In the third quarter of 2015, following our Series G convertible preferred stock financing, we repurchased shares from certain of our eligible employees and board members (the "2015 Common Stock Repurchase"). A total of 2,224,222 shares of common stock were tendered for a total purchase price of $25.0 million. The price paid up to the fair value of our common stock, totaling $15.9 million, was accounted for as a reduction to equity. The premium that we paid over the fair value of the shares, totaling $9.1 million, was recorded as other compensation expense.
In the third quarter of 2016, certain of our eligible employees, board members and funds affiliated with board members sold shares to third-party investors (the "2016 Tender Offer"). A total of 4,346,203 shares of common stock were tendered for a total purchase price of $61.6 million. The premium over the fair value of the shares of common stock that was paid by third parties to eligible employees and board members, totaling $9.9 million, was recorded as other compensation expense. The excess of the sale price of the shares of convertible preferred stock sold by funds affiliated with board members over the fair value of our common stock, totaling $9.4 million, was recorded as a deemed dividend within additional paid-in capital.
Results of Operations
The following table sets forth our results of operations for the periods indicated:
Year Ended December 31, | ||||||||||||
2017 | 2016 | 2015 | ||||||||||
(In thousands) | ||||||||||||
Consolidated Statements of Operations Data: | ||||||||||||
Revenue: | ||||||||||||
Subscription and support | $ | 237,980 | $ | 152,843 | $ | 88,096 | ||||||
Professional services and other | 58,476 | 34,904 | 22,156 | |||||||||
Total revenue | 296,456 | 187,747 | 110,252 | |||||||||
Cost of revenue: | ||||||||||||
Subscription and support(1)(2) | 20,001 | 13,722 | 7,525 | |||||||||
Professional services and other(1)(2) | 61,269 | 35,341 | 24,645 | |||||||||
Total cost of revenue | 81,270 | 49,063 | 32,170 | |||||||||
Gross profit | 215,186 | 138,684 | 78,082 | |||||||||
Operating expenses: | ||||||||||||
Research and development(1)(2) | 64,585 | 32,862 | 24,725 | |||||||||
Sales and marketing(1)(2) | 184,583 | 122,630 | 93,057 | |||||||||
General and administrative(1)(2) | 45,813 | 31,577 | 24,368 | |||||||||
Total operating expenses | 294,981 | 187,069 | 142,150 | |||||||||
Loss from operations | (79,795 | ) | (48,385 | ) | (64,068 | ) | ||||||
Interest income | 2,483 | 465 | 220 | |||||||||
Other expense, net | (1,015 | ) | (340 | ) | (729 | ) | ||||||
Net loss before provision for income taxes | (78,327 | ) | (48,260 | ) | (64,577 | ) | ||||||
Provision for income taxes | 1,653 | 1,339 | 862 | |||||||||
Net loss | $ | (79,980 | ) | $ | (49,599 | ) | $ | (65,439 | ) | |||
41
(1) | Includes stock-based compensation expense as follows (in thousands): |
Year Ended December 31, | ||||||||||||
2017 | 2016 | 2015 | ||||||||||
Cost of revenue—subscription and support | $ | 945 | $ | 231 | $ | 83 | ||||||
Cost of revenue—professional services and other | 3,442 | 567 | 262 | |||||||||
Research and development | 6,994 | 1,677 | 579 | |||||||||
Sales and marketing | 12,646 | 2,691 | 1,548 | |||||||||
General and administrative | 4,043 | 1,386 | 846 | |||||||||
Total stock-based compensation expense | $ | 28,070 | $ | 6,552 | $ | 3,318 | ||||||
(2) | Includes other compensation expense related to the 2015 Common Stock Repurchase and 2016 Tender Offer as follows (in thousands): |
Year Ended December 31, | ||||||||||||
2017 | 2016 | 2015 | ||||||||||
Cost of revenue—subscription and support | $ | — | $ | 24 | $ | 63 | ||||||
Cost of revenue—professional services and other | — | 108 | 62 | |||||||||
Research and development | — | 1,154 | 1,927 | |||||||||
Sales and marketing | — | 5,928 | 3,343 | |||||||||
General and administrative | — | 2,734 | 3,696 | |||||||||
Total other compensation expense | $ | — | $ | 9,948 | $ | 9,091 | ||||||
The following table sets forth the consolidated statements of operations data for each of the periods presented as a percentage of total revenue:
Year Ended December 31, | |||||||||
2017 | 2016 | 2015 | |||||||
Consolidated Statements of Operations, as a percentage of revenue: | |||||||||
Revenue: | |||||||||
Subscription and support | 80 | % | 81 | % | 80 | % | |||
Professional services and other | 20 | 19 | 20 | ||||||
Total revenue | 100 | 100 | 100 | ||||||
Cost of revenue: | |||||||||
Subscription and support | 7 | 7 | 7 | ||||||
Professional services and other | 21 | 19 | 22 | ||||||
Total cost of revenue | 27 | 26 | 29 | ||||||
Gross profit | 73 | 74 | 71 | ||||||
Operating expenses: | |||||||||
Research and development | 22 | 18 | 22 | ||||||
Sales and marketing | 62 | 65 | 84 | ||||||
General and administrative | 15 | 17 | 22 | ||||||
Total operating expenses | 100 | 100 | 129 | ||||||
Loss from operations | (27 | ) | (26 | ) | (58 | ) | |||
Interest income | 1 | — | — | ||||||
Other expense, net | — | — | (1 | ) | |||||
Net loss before provision for income taxes | (26 | ) | (26 | ) | (59 | ) | |||
Provision for income taxes | 1 | 1 | 1 | ||||||
Net loss | (27 | )% | (26 | )% | (59 | )% | |||
42
Comparison of the Years Ended December 31, 2017 and 2016
Revenue
Year Ended December 31, | Change | ||||||||||||||
2017 | 2016 | Amount | % | ||||||||||||
(In thousands, except percentages) | |||||||||||||||
Subscription and support | $ | 237,980 | $ | 152,843 | $ | 85,137 | 56 | % | |||||||
Professional services and other | 58,476 | 34,904 | 23,572 | 68 | % | ||||||||||
Total revenue | $ | 296,456 | $ | 187,747 | $ | 108,709 | 58 | % | |||||||
Subscription and support revenue increased by $85.1 million, or 56%, to $238.0 million during 2017, from $152.8 million during 2016. The increase was attributable to increased sales of subscriptions to new customers and expanded use of our platform by existing customers. Our total number of customers increased from 1,071 as of December 31, 2016 to 1,286 as of December 31, 2017.
Professional services and other revenue increased by $23.6 million, or 68%, to $58.5 million during 2017, from $34.9 million during 2016. The increase was primarily attributable to the increase in consulting services to support our larger customer base.
Cost of Revenue and Gross Margin
Year Ended December 31, | Change | ||||||||||||||
2017 | 2016 | Amount | % | ||||||||||||
(In thousands, except percentages) | |||||||||||||||
Subscription and support | $ | 20,001 | $ | 13,722 | $ | 6,279 | 46 | % | |||||||
Professional services and other | 61,269 | 35,341 | 25,928 | 73 | % | ||||||||||
Total cost of revenue | $ | 81,270 | $ | 49,063 | $ | 32,207 | 66 | % | |||||||
Subscription and support gross margin | 92 | % | 91 | % | |||||||||||
Professional services and other gross margin | (5 | )% | (1 | )% | |||||||||||
Gross margin | 73 | % | 74 | % | |||||||||||
Cost of revenue for subscription and support increased by $6.3 million or 46%, to $20.0 million during 2017, from $13.7 million during 2016. The increase was primarily due to an increase of $2.9 million in personnel-related expenses, which included an increase in headcount and an increase of $0.7 of related stock-based compensation expense. In addition, there was also an increase of $2.1 million in third-party cloud hosting costs, an increase of $0.8 million in facility and IT related expenses, an increase of $0.7 million for software subscriptions, an increase in direct cost of goods of $0.6 million and an increase of $0.3 million in depreciation of fixed assets and the amortization of intangibles, partially offset by a decrease of $1.1 million in contractor costs.
Cost of revenue for professional services and other increased by $25.9 million, or 73%, to $61.3 million during 2017, from $35.3 million during 2016. The increase was primarily due to an increase in personnel-related costs of $12.2 million, which included an increase in headcount and an increase in stock-based compensation expense of $2.9 million, partially offset by a decrease of other compensation expense of $0.1 million related to the 2016 Tender Offer. In addition, there was also an increase of $9.1 million in contractor costs to supplement our staffing, an increase in of $2.4 million in facility and IT related expenses, an increase of $1.8 million in travel and related expenses and an increase of $0.2 million for software subscriptions.
43
Operating Expenses
Year Ended December 31, | Change | ||||||||||||||
2017 | 2016 | Amount | % | ||||||||||||
(In thousands, except percentages) | |||||||||||||||
Research and development | $ | 64,585 | $ | 32,862 | $ | 31,723 | 97 | % | |||||||
Sales and marketing | 184,583 | 122,630 | 61,953 | 51 | % | ||||||||||
General and administrative | 45,813 | 31,577 | 14,236 | 45 | % | ||||||||||
Total operating expenses | $ | 294,981 | $ | 187,069 | $ | 107,912 | 58 | % | |||||||
Research and Development
Research and development expenses increased by $31.7 million, or 97%, to $64.6 million during 2017, from $32.9 million during 2016. The increase was primarily attributable to an increase in personnel-related costs of $17.8 million, which included an increase in headcount and an increase of $5.3 million of related stock-based compensation expense, partially offset by a decrease in other compensation expense of $1.2 million related to the 2016 Tender Offer. In addition, there was also an increase of $6.3 million in contractor costs, an increase of $4.1 million in facility and IT related expenses, an increase of $2.7 million in third-party cloud-hosting costs for internal use, an increase of $0.5 million for software subscriptions and an increase of $0.3 million in costs incurred for the company-wide meeting held during the first half of 2017 and other expenses.
Sales and Marketing
Sales and marketing expenses increased by $62.0 million, or 51%, to $184.6 million during 2017 from $122.6 million during 2016. The increase was primarily attributable to an increase in personnel-related costs of $42.1 million, which included an increase in headcount and an increase of $9.9 million of related stock-based compensation expense, partially offset by a decrease in other compensation expense of $5.9 million related to the 2016 Tender Offer. In addition, there was also an increase of $7.8 million in facility and IT related expenses, an increase of $5.3 million in marketing programs costs, an increase of $3.5 million in travel and related expenses, an increase of $1.4 million for software subscriptions, an increase of $0.9 million in costs incurred for the company-wide meeting in the first half of 2017 and other internal meetings and an increase of $0.8 million in contractor costs.
General and Administrative
General and administrative expenses increased by $14.2 million, or 45%, to $45.8 million during 2017 from $31.6 million during 2016. The increase was primarily attributable to an increase in personnel-related costs of $10.7 million, which included an increase in headcount and an increase of $2.8 million of related stock-based compensation expense, partially offset by a decrease in other compensation expense of $2.7 million related to the 2016 Tender Offer. In addition, there was an increase of $2.7 million in contractor costs to supplement our staffing.
Interest Income
Year Ended December 31, | Change | ||||||||||||||
2017 | 2016 | Amount | % | ||||||||||||
(In thousands, except percentage) | |||||||||||||||
Interest income | $ | 2,483 | $ | 465 | $ | 2,018 | 434 | % | |||||||
Interest income was $2.5 million in 2017 compared to $0.5 million in 2016. The increase was primarily related to the increase in interest rates beginning in December 31, 2016, resulting in increased interest income earned from our investments in U.S. Treasuries. In addition, we had more cash, cash equivalents, and investments as a result of the IPO which led to increased interest income in 2017 compared to 2016.
44
Other Expense, Net
Year Ended December 31, | Change | ||||||||||||||
2017 | 2016 | Amount | % | ||||||||||||
(In thousands, except percentage) | |||||||||||||||
Other expense, net | $ | (1,015 | ) | $ | (340 | ) | $ | (675 | ) | 199 | % | ||||
Other expense, net was $1.0 million in 2017 compared to $0.3 million in 2016. The change was primarily related to foreign currency fluctuations.
Provision for Income Taxes
Year Ended December 31, | Change | ||||||||||||||
2017 | 2016 | Amount | % | ||||||||||||
(In thousands, except percentage) | |||||||||||||||
Provision for income taxes | $ | 1,653 | $ | 1,339 | $ | 314 | 23 | % | |||||||
Provision for income taxes for each period was primarily attributable to foreign taxes incurred by certain non-U.S. subsidiaries and foreign withholding taxes.
Comparison of the Years Ended December 31, 2016 and 2015
Revenue
Year Ended December 31, | Change | ||||||||||||||
2016 | 2015 | Amount | % | ||||||||||||
(In thousands, except percentages) | |||||||||||||||
Subscription and support | $ | 152,843 | $ | 88,096 | $ | 64,747 | 73 | % | |||||||
Professional services and other | 34,904 | 22,156 | 12,748 | 58 | % | ||||||||||
Total revenue | $ | 187,747 | $ | 110,252 | $ | 77,495 | 70 | % | |||||||
Subscription and support revenue increased by $64.7 million, or 73%, to $152.8 million during 2016, from $88.1 million during 2015. Approximately 60% of the increase was attributable to the expanded use of our platform by existing customers, and the remainder was attributable to sales of subscriptions to new customers. Our total number of customers increased from 839 as of December 31, 2015 to 1,071 as of December 31, 2016.
Professional services and other revenue increased by $12.7 million, or 58%, to $34.9 million during 2016, from $22.2 million during 2015. The increase was primarily attributable to the increase in consulting services to support our larger customer base.
45
Cost of Revenue and Gross Margin
Year Ended December 31, | Change | ||||||||||||||
2016 | 2015 | Amount | % | ||||||||||||
(In thousands, except percentages) | |||||||||||||||
Subscription and support | $ | 13,722 | $ | 7,525 | $ | 6,197 | 82 | % | |||||||
Professional services and other | 35,341 | 24,645 | 10,696 | 43 | % | ||||||||||
Total cost of revenue | $ | 49,063 | $ | 32,170 | $ | 16,893 | 53 | % | |||||||
Subscription and support gross margin | 91 | % | 91 | % | |||||||||||
Professional services and other gross margin | (1 | )% | (11 | )% | |||||||||||
Gross margin | 74 | % | 71 | % | |||||||||||
Cost of revenue for subscription and support increased by $6.2 million, or 82%, to $13.7 million during 2016, from $7.5 million during 2015. The increase was primarily due to an increase of $2.2 million in third-party cloud-hosting costs, an increase of $1.5 million in personnel-related expenses, primarily due to an increase in headcount, as well as an increase of $1.4 million in contractor costs and an increase of $0.3 million in royalty costs.
Cost of revenue for professional services and other increased by $10.7 million, or 43%, to $35.3 million during 2016, from $24.6 million during 2015. The increase was primarily due to an increase in personnel-related costs of $5.8 million, primarily due to an increase in headcount, as well as an increase of $2.9 million in contractor costs to supplement our staffing and an increase in travel costs of $1.0 million.
Gross margin improved during 2016, as we experienced increased leverage from our professional services organization and, to a lesser extent, an increase in subscription and support revenue, which carries a higher gross margin than professional services.
Operating Expenses
Year Ended December 31, | Change | ||||||||||||||
2016 | 2015 | Amount | % | ||||||||||||
(In thousands, except percentages) | |||||||||||||||
Research and development | $ | 32,862 | $ | 24,725 | $ | 8,137 | 33 | % | |||||||
Sales and marketing | 122,630 | 93,057 | 29,573 | 32 | % | ||||||||||
General and administrative | 31,577 | 24,368 | 7,209 | 30 | % | ||||||||||
Total operating expenses | $ | 187,069 | $ | 142,150 | $ | 44,919 | 32 | % | |||||||
Research and Development
Research and development expenses increased by $8.1 million, or 33%, to $32.9 million during 2016, from $24.7 million during 2015. The increase was primarily attributable to an increase in personnel-related costs of $4.7 million, primarily due to an increase in headcount. These costs included an increase of $1.1 million of stock-based compensation expense offset by a reduction of $0.8 million in other compensation expense from the equity transactions described above. In addition, there was also an increase of $1.5 million in third-party cloud-hosting costs for internal use, an increase of $0.6 million in outside contractor costs, and $0.4 million in costs incurred for the company-wide meeting held in February 2016.
Sales and Marketing
Sales and marketing expenses increased by $29.6 million, or 32%, to $122.6 million during 2016 from $93.1 million during 2015. The increase was primarily attributable to an increase in personnel-related costs of $22.2 million, primarily due to an increase in headcount, including an increase of $8.2 million in commissions. These costs included an increase of $2.6 million in other compensation expense from the equity transactions described above and an increase of $1.1 million in stock-
46
based compensation expense. In addition, there was also an increase of $3.2 million in marketing costs related to advertising, and domestic and international tradeshows, $1.4 million in travel and entertainment costs, and $1.0 million in costs incurred for the company-wide meeting held in 2016.
General and Administrative
General and administrative expenses increased by $7.2 million, or 30%, to $31.6 million during 2016 from $24.4 million during 2015. The increase was primarily attributable to an increase in personnel-related costs of $3.2 million, primarily due to an increase in headcount. These costs included an increase of $0.5 million in stock-based compensation expense offset by a $1.0 million reduction in other compensation expense from the equity transactions described above. The increase was also attributable to an increase of $1.0 million in professional services for legal and accounting services, $0.9 million in recruiting costs as we hired additional staff to support our growth, $0.5 million in costs incurred for the company-wide meeting held in 2016, and an increase of $0.4 million in software subscription costs for our operations.
Interest Income
Year Ended December 31, | Change | ||||||||||||||
2016 | 2015 | Amount | % | ||||||||||||
(In thousands, except percentage) | |||||||||||||||
Interest income | $ | 465 | $ | 220 | $ | 245 | 111 | % | |||||||
Interest income was $0.5 million in 2016 compared to $0.2 million in 2015. The increase was primarily related to an increase in our invested funds due to the proceeds from the Series G preferred stock financing completed in May 2015.
Other Expense, Net
Year Ended December 31, | Change | ||||||||||||||
2016 | 2015 | Amount | % | ||||||||||||
(In thousands, except percentages) | |||||||||||||||
Other expense, net | $ | (340 | ) | $ | (729 | ) | $ | 389 | (53 | )% | |||||
Other expense, net was $0.3 million in 2016 compared to $0.7 million in 2015. The change was primarily related to foreign currency fluctuations.
Provision for Income Taxes
Year Ended December 31, | Change | ||||||||||||||
2016 | 2015 | Amount | % | ||||||||||||
(In thousands, except percentages) | |||||||||||||||
Provision for income taxes | $ | 1,339 | $ | 862 | $ | 477 | 55 | % | |||||||
Provision for income taxes for each period was primarily attributable to foreign taxes incurred by certain non-U.S. subsidiaries and foreign withholding taxes. In 2015, we sold the non-U.S. rights to certain intellectual property to one of our non-U.S. subsidiaries. The resulting tax gain in our U.S. entity was offset by current year net operating losses and thus resulted in no current tax liability. Further, this transaction had no net impact on our 2015 deferred taxes or effective tax rate given our full valuation allowance on the net operating losses used to offset the gain. Our decision to move certain intellectual property outside of the United States is not expected to materially impact our effective tax rate for the foreseeable future as we continue to generate net operating losses in the United States and the non-U.S. subsidiary to which we sold certain intellectual property.
Quarterly Results of Operations
47
The following tables set forth our unaudited quarterly consolidated statements of operations data for each of the quarters indicated, as well as the percentage that each line item represents of our total revenue for each quarter presented. The information for each quarter has been prepared on a basis consistent with our audited consolidated financial statements included in this Annual Report on Form 10-K, and reflect, in the opinion of management, all adjustments of a normal, recurring nature that are necessary for a fair presentation of the financial information contained in those statements. Our historical results are not necessarily indicative of the results that may be expected in the future. The following quarterly financial data should be read in conjunction with our consolidated financial statements included elsewhere in this Annual Report on Form 10-K.
Three Months Ended, | ||||||||||||||||||||||||||||||||
Dec. 31, 2017 | Sept. 30, 2017 | June 30, 2017 | Mar. 31, 2017 | Dec. 31, 2016 | Sept. 30, 2016 | June 30, 2016 | Mar. 31, 2016 | |||||||||||||||||||||||||
(in thousands, except share and per share data) | ||||||||||||||||||||||||||||||||
Consolidated Statements of Operations: | ||||||||||||||||||||||||||||||||
Revenue: | ||||||||||||||||||||||||||||||||
Subscription and support | $ | 70,605 | $ | 61,704 | $ | 55,077 | $ | 50,594 | $ | 45,006 | $ | 40,937 | $ | 35,649 | $ | 31,251 | ||||||||||||||||
Professional services and other | 18,109 | 15,900 | 14,156 | 10,311 | 10,347 | 8,432 | 8,345 | 7,780 | ||||||||||||||||||||||||
Total revenue | 88,714 | 77,604 | 69,233 | 60,905 | 55,353 | 49,369 | 43,994 | 39,031 | ||||||||||||||||||||||||
Cost of revenue: (1)(2) | ||||||||||||||||||||||||||||||||
Subscription and support | 6,062 | 5,242 | 4,649 | 4,048 | 4,182 | 3,589 | 3,371 | 2,580 | ||||||||||||||||||||||||
Professional services and other | 19,521 | 16,858 | 13,699 | 11,191 | 10,952 | 8,756 | 8,461 | 7,172 | ||||||||||||||||||||||||
Total cost of revenue | 25,583 | 22,100 | 18,348 | 15,239 | 15,134 | 12,345 | 11,832 | 9,752 | ||||||||||||||||||||||||
Gross profit | 63,131 | 55,504 | 50,885 | 45,666 | 40,219 | 37,024 | 32,162 | 29,279 | ||||||||||||||||||||||||
Operating expenses: (1)(2) | ||||||||||||||||||||||||||||||||
Research and development | 18,608 | 18,048 | 15,140 | 12,789 | 9,969 | 8,701 | 7,332 | 6,860 | ||||||||||||||||||||||||
Sales and marketing | 56,933 | 50,707 | 43,817 | 33,126 | 35,190 | 33,920 | 29,815 | 23,705 | ||||||||||||||||||||||||
General and administrative | 13,058 | 12,144 | 10,950 | 9,661 | 7,896 | 9,555 | 6,843 | 7,283 | ||||||||||||||||||||||||
Total operating expenses | 88,599 | 80,899 | 69,907 | 55,576 | 53,055 | 52,176 | 43,990 | 37,848 | ||||||||||||||||||||||||
Loss from operations | (25,468 | ) | (25,395 | ) | (19,022 | ) | (9,910 | ) | (12,836 | ) | (15,152 | ) | (11,828 | ) | (8,569 | ) | ||||||||||||||||
Interest income | 1,000 | 968 | 357 | 158 | 151 | 110 | 107 | 97 | ||||||||||||||||||||||||
Other income (expense), net | (394 | ) | (354 | ) | (191 | ) | (76 | ) | 8 | (242 | ) | (107 | ) | 1 | ||||||||||||||||||
Net loss before provision for income taxes | (24,862 | ) | (24,781 | ) | (18,856 | ) | (9,828 | ) | (12,677 | ) | (15,284 | ) | (11,828 | ) | (8,471 | ) | ||||||||||||||||
Provision for income taxes | 226 | 335 | 779 | 313 | 414 | 377 | 268 | 280 | ||||||||||||||||||||||||
Net loss | $ | (25,088 | ) | $ | (25,116 | ) | $ | (19,635 | ) | $ | (10,141 | ) | $ | (13,091 | ) | $ | (15,661 | ) | $ | (12,096 | ) | $ | (8,751 | ) | ||||||||
Net loss attributable to common stockholders | $ | (25,088 | ) | $ | (25,116 | ) | $ | (19,635 | ) | $ | (10,141 | ) | $ | (13,091 | ) | $ | (25,097 | ) | $ | (12,096 | ) | $ | (8,751 | ) | ||||||||
Net loss per share attributable to common stockholders, basic and diluted | $ | (0.19 | ) | $ | (0.19 | ) | $ | (0.15 | ) | $ | (0.27 | ) | $ | (0.52 | ) | $ | (1.15 | ) | $ | (0.60 | ) | $ | (0.45 | ) | ||||||||
Weighted-average shares used in computing net loss per share, basic and diluted | 130,423,175 | 129,044,913 | 128,825,841 | 37,410,235 | 25,364,224 | 21,733,456 | 19,995,314 | 19,361,543 | ||||||||||||||||||||||||
48
(1) Includes stock-based compensation expense as follows (in thousands):
Three Months Ended, | ||||||||||||||||||||||||||||||||
Dec. 31, 2017 | Sept. 30, 2017 | June 30, 2017 | Mar. 31, 2017 | Dec. 31, 2016 | Sept. 30, 2016 | June 30, 2016 | Mar. 31, 2016 | |||||||||||||||||||||||||
Cost of revenue—subscription and support | $ | 320 | $ | 288 | $ | 236 | $ | 101 | $ | 90 | $ | 53 | $ | 55 | $ | 33 | ||||||||||||||||
Cost of revenue—professional services and other | 1,172 | 1,110 | 847 | 313 | 188 | 168 | 119 | 92 | ||||||||||||||||||||||||
Research and development | 2,428 | 2,121 | 1,529 | 916 | 625 | 514 | 329 | 209 | ||||||||||||||||||||||||
Sales and marketing | 4,166 | 3,827 | 3,229 | 1,424 | 844 | 753 | 586 | 508 | ||||||||||||||||||||||||
General and administrative | 1,352 | 1,123 | 1,039 | 529 | 457 | 402 | 327 | 200 | ||||||||||||||||||||||||
Total stock-based compensation expense | $ | 9,438 | $ | 8,469 | $ | 6,880 | $ | 3,283 | $ | 2,204 | $ | 1,890 | $ | 1,416 | $ | 1,042 | ||||||||||||||||
(2) Includes other compensation expense as follows (in thousands):
Three Months Ended, | ||||||||||||||||||||||||||||||||
Dec. 31, 2017 | Sept. 30, 2017 | June 30, 2017 | Mar. 31, 2017 | Dec. 31, 2016 | Sept. 30, 2016 | June 30, 2016 | Mar. 31, 2016 | |||||||||||||||||||||||||
Cost of revenue—subscription and support | $ | — | $ | — | $ | — | $ | — | $ | — | $ | 24 | $ | — | $ | — | ||||||||||||||||
Cost of revenue—professional services and other | — | — | — | — | — | 108 | — | — | ||||||||||||||||||||||||
Research and development | — | — | — | — | — | 1,154 | — | — | ||||||||||||||||||||||||
Sales and marketing | — | — | — | — | — | 5,928 | — | — | ||||||||||||||||||||||||
General and administrative | — | — | — | — | — | 2,734 | — | — | ||||||||||||||||||||||||
Total other compensation expense | $ | — | $ | — | $ | — | $ | — | $ | — | $ | 9,948 | $ | — | $ | — | ||||||||||||||||
Three Months Ended, | ||||||||||||||||||||||||||||||||
Dec. 31, 2017 | Sept. 30, 2017 | June 30, 2017 | Mar. 31, 2017 | Dec. 31, 2016 | Sept. 30, 2016 | June 30, 2016 | Mar. 31, 2016 | |||||||||||||||||||||||||
Consolidated Statements of Operations as a percentage of revenue: | ||||||||||||||||||||||||||||||||
Revenue: | ||||||||||||||||||||||||||||||||
Subscription and support | 80 | % | 80 | % | 80 | % | 83 | % | 81 | % | 83 | % | 81 | % | 80 | % | ||||||||||||||||
Professional services and other | 20 | 20 | 20 | 17 | 19 | 17 | 19 | 20 | ||||||||||||||||||||||||
Total revenue | 100 | 100 | 100 | 100 | 100 | 100 | 100 | 100 | ||||||||||||||||||||||||
Cost of revenue: | ||||||||||||||||||||||||||||||||
Subscription and support | 7 | 7 | 7 | 7 | 8 | 7 | 8 | 7 | ||||||||||||||||||||||||
Professional services and other | 22 | 22 | 20 | 18 | 20 | 18 | 19 | 18 | ||||||||||||||||||||||||
Total cost of revenue | 29 | 28 | 27 | 25 | 27 | 25 | 27 | 25 | ||||||||||||||||||||||||
Gross profit | 71 | 72 | 73 | 75 | 73 | 75 | 73 | 75 | ||||||||||||||||||||||||
Operating expenses: | ||||||||||||||||||||||||||||||||
Research and development | 21 | 23 | 22 | 21 | 18 | 18 | 17 | 18 | ||||||||||||||||||||||||
Sales and marketing | 64 | 65 | 63 | 54 | 64 | 69 | 68 | 61 | ||||||||||||||||||||||||
General and administrative | 15 | 16 | 16 | 16 | 14 | 19 | 16 | 19 | ||||||||||||||||||||||||
Total operating expenses | 100 | 104 | 101 | 91 | 96 | 106 | 100 | 97 | ||||||||||||||||||||||||
Loss from operations | (29 | ) | (33 | ) | (27 | ) | (16 | ) | (23 | ) | (31 | ) | (27 | ) | (22 | ) | ||||||||||||||||
Interest income | 1 | 1 | 1 | — | — | — | — | — | ||||||||||||||||||||||||
Other income (expense), net | — | — | — | — | — | — | — | — | ||||||||||||||||||||||||
Net loss before provision for income taxes | (28 | ) | (32 | ) | (27 | ) | (16 | ) | (23 | ) | (31 | ) | (27 | ) | (22 | ) | ||||||||||||||||
Provision for income taxes | — | — | 1 | 1 | 1 | 1 | 1 | 1 | ||||||||||||||||||||||||
Net loss | (28 | )% | (32 | )% | (28 | )% | (17 | )% | (24 | )% | (32 | )% | (27 | )% | (22 | )% | ||||||||||||||||
Dec. 31, 2017 | Sept. 30, 2017 | June 30, 2017 | Mar. 31, 2017 | Dec. 31, 2016 | Sept. 30, 2016 | June 30, 2016 | Mar. 31, 2016 | |||||||||||||||||||||||||
Customers (1) | 1,286 | 1,217 | 1,170 | 1,131 | 1,071 | 994 | 946 | 892 | ||||||||||||||||||||||||
Average subscription and support revenue per customer (in thousands) (1) | $ | 185 | $ | 175 | $ | 164 | $ | 152 | $ | 143 | $ | 136 | $ | 125 | $ | 115 | ||||||||||||||||
Dollar-based net retention rate (1) | 119 | % | 116 | % | 116 | % | 116 | % | 117 | % | 120 | % | 122 | % | 125 | % | ||||||||||||||||
49
(1) | See the section titled “—Key Metrics” for additional information about our key metrics. |
Liquidity and Capital Resources
To date, our principal sources of liquidity have been the net proceeds we received through the sale of our Class A common stock in our initial public offering, private sales of equity securities, as well as payments received from customers using our platform and services. As of December 31, 2017, we had cash, cash equivalents, and investments totaling $347.3 million, which we intend to use for working capital, operating expenses, and capital expenditures. We may also use a portion of these funds to acquire complementary businesses, products, services, or technologies. Our cash equivalents are comprised primarily of bank deposits and money market funds, and our investments are comprised of marketable securities such as commercial paper, corporate bonds, foreign bonds and U.S. Treasury securities. We believe that our existing cash, cash equivalents, and investments will be sufficient to satisfy our anticipated cash needs for working capital and capital expenditures for at least the next 12 months. We plan to continue to finance our operations from customers paying for our platform and services. However, our liquidity assumptions may prove to be incorrect, and we could utilize our available financial resources sooner than we currently expect. Our future capital requirements and the adequacy of available funds will depend on many factors, including those set forth in the section of this Annual Report on Form 10-K titled “Risk Factors.” We cannot assure you that we will be able to raise additional capital on acceptable terms or at all. In addition, if we fail to meet our operating plan during the next 12 months, our liquidity and ability to operate our business could be adversely affected.
Cash Flows
The following table summarizes our cash flows for the periods indicated (in thousands):
Year Ended December 31, | ||||||||||||
2017 | 2016 | 2015 | ||||||||||
Cash provided by (used in) operating activities | $ | 1,981 | $ | (2,381 | ) | $ | (46,980 | ) | ||||
Cash provided by (used in) investing activities | (207,217 | ) | 17,471 | (93,245 | ) | |||||||
Cash provided by (used in) financing activities | 249,566 | (657 | ) | 112,309 | ||||||||
Effect of exchange rate changes on cash | 250 | (1,044 | ) | (322 | ) | |||||||
Net increase (decrease) in cash and cash equivalents | $ | 44,580 | $ | 13,389 | $ | (28,238 | ) | |||||
Cash Flows from Operating Activities
During 2017, cash provided by operating activities was $2.0 million, which consisted of a net loss of $80.0 million, adjusted by non-cash charges of $32.9 million and a net change of $49.1 million in our net operating assets and liabilities. The non-cash charges are primarily comprised of stock based-based compensation of $28.1 million, depreciation and amortization of $3.8 million and amortization of investment premiums of $0.8 million. The change in our net operating assets and liabilities was primarily due to an increase in deferred revenue of $76.0 million due to the timing of billings in advance of revenue recognition primarily for subscription and support, an increase in accrued compensation of $12.8 million due to higher commissions payable at year end, an increase in accounts payable and accrued expenses of $5.0 million due to an increase in operating expenses and timing of payments and an increase in other liabilities of $1.6 million, partially offset by an increase in accounts receivable of $39.7 million due to the timing of receipts of payments from customers and an increase in prepaid expenses and other assets of $6.7 million due to payments for software subscriptions to our cloud infrastructure provider.
During 2016, cash used in operating activities was $2.4 million, which consisted of a net loss of $49.6 million, adjusted by non-cash charges of $19.6 million and a net change of $27.7 million in our net operating assets and liabilities. The non-cash charges are primarily comprised of other compensation expense related to the 2016 Tender Offer of $9.9 million, stock based-based compensation of $6.6 million, depreciation and amortization of $1.9 million, amortization of investment premiums of $0.6 million, tax benefits from employee stock plans of $0.3 million and provision for doubtful accounts of $0.2 million. The change in our net operating assets and liabilities was primarily due to an increase in deferred revenue of $51.9 million due to the timing of billings and cash received in advance of revenue recognition primarily for subscription and support services, an increase in accrued compensation of $4.7 million due to higher commissions payable at year end, an increase in accounts payable and accrued expenses of $2.2 million due to an increase in operating expenses and timing of payments and an increase in other liabilities of $1.1 million due to an increase in deferred rent, partially offset by an increase in accounts receivable of $25.1 million due to the timing of receipts of payments from customers and an increase in prepaid expenses and other current assets of $6.8 million due to payments for software subscriptions to our cloud infrastructure provider.
50
During 2015, cash used in operating activities was $47.0 million, which consisted of a net loss of $65.4 million, adjusted by non-cash charges of $5.4 million and a change of $13.0 million in our net operating assets and liabilities. The non-cash charges were primarily comprised of stock-based compensation of $3.3 million, depreciation and amortization of $1.2 million, amortization of investment premiums of $0.6 million, tax benefits from employee stock plans of $0.2 million and a loss on disposal of property and equipment for $0.2 million. The change in our net operating assets and liabilities was primarily due to an increase in deferred revenue of $35.6 million due to the timing of billings and cash received in advance of revenue recognition primarily for subscription and support, an increase in accrued compensation and related expenses of $5.0 million due to an increase in headcount and revenue in 2015, and an increase in accrued expenses of $1.6 million, partially offset by an increase in trade receivables of $21.1 million due to an increase in the number of customers invoiced during the period, an increase in prepaid expenses and other current assets of $6.5 million, and a decrease in accounts payable of $1.3 million due to the timing of invoices from vendors and related payments.
Cash Flows from Investing Activities
During 2017, cash used in investing activities was $207.2 million, primarily consisting of purchases of investments of $319.7 million and payments for purchases of property and equipment of $4.8 million, consisting primarily of leasehold improvements and, to a lesser extent, the purchase of computers for personnel, partially offset by sales and maturities of investments of $117.4 million.
During 2016, cash provided by investing activities was $17.5 million, primarily consisting of sales and maturities of investments of $64.2 million, partially offset by purchases of investments of $41.2 million, purchases of property and equipment of $4.5 million, consisting primarily of leasehold improvements and, to a lesser extent, the purchase of computers for personnel, and $1.0 million used for the acquisition of Express Service Gateway (ESG).
During 2015, cash used in investing activities was $93.2 million, primarily consisting of purchases of investments of $106.2 million and purchases of property and equipment of $1.5 million. These outflows were partially offset by sales and maturities of investments of $14.5 million.
Cash Flows from Financing Activities
During 2017, cash provided by financing activities was $249.6 million which consisted of proceeds from the issuance of common stock in connection with our initial public offering of $236.4 million, proceeds from the issuance of common stock upon exercise of stock options and warrants of $8.0 million and proceeds from our 2017 Employee Stock Purchase Plan of $7.0 million, partially offset by $1.8 million of costs related to the initial public offering.
During 2016, cash used in financing activities was $0.7 million consisting of $3.2 million in cash used for the repurchase of common stock and $1.7 million in payments of deferred offering costs partially offset by proceeds from the issuance of common stock upon exercise of stock options of $4.3 million.
During 2015, cash provided by financing activities was $112.3 million consisting of net proceeds of $126.3 million from the issuance of Series G preferred stock and proceeds of $1.9 million from the issuance of common stock upon the exercise of stock options and warrants, partially offset by $15.9 million for the repurchase of common stock.
Off-Balance Sheet Arrangements
We have not entered into any off-balance sheet arrangements and do not have any holdings in variable interest entities.
Contractual Obligations
The following table summarizes our non-cancellable contractual obligations as of December 31, 2017 (in thousands):
Payments Due by Period | ||||||||||||||||||||
Less Than 1 Year | 1 to 3 Years | 3 to 5 Years | More Than 5 Years | Total | ||||||||||||||||
Operating leases | $ | 9,212 | $ | 14,584 | $ | 6,653 | $ | 3,239 | $ | 33,688 | ||||||||||
Purchase obligations(1) | 7,650 | — | — | — | 7,650 | |||||||||||||||
Total | $ | 16,862 | $ | 14,584 | $ | 6,653 | $ | 3,239 | $ | 41,338 | ||||||||||
51
(1) | Purchase obligations represent total future minimum payments under our contract with our cloud infrastructure provider. |
Item 7A. Quantitative and Qualitative Disclosures About Market Risk
We are exposed to financial market risks, primarily in interest rates and currency exchange rate fluctuations and to a lesser extent inflation.
Interest Rate Risk
We had cash and cash equivalents of $79.6 million and $35.1 million as of December 31, 2017 and 2016, respectively. Our cash and cash equivalents are held in bank deposits and money market funds. Due to the short-term nature of these instruments, we do not believe that we have any material exposure to changes in the fair value of our investment portfolio as a result of changes in interest rates. Declines in interest rates, however, would reduce our future interest income.
We had current investments in marketable securities of $124.6 million and $63.4 million as of December 31, 2017 and 2016, respectively. The primary objective of our investment activities is to preserve principal while maximizing yields without significantly increasing risk. This objective is accomplished by making investments consisting only of corporate bonds and U.S. Treasury securities. During 2017 and 2016, the effect of a hypothetical 10% increase or decrease in interest rates would not have had a material impact on our historical consolidated financial statements for any periods presented.
Foreign Currency Exchange Risk
As of December 31, 2017 and 2016, our cash and cash equivalents included $13.2 million and $6.4 million, respectively, held by our foreign subsidiaries, of which $3.1 million and $1.0 million, respectively, was denominated in Argentine pesos, $8.0 million and $2.7 million, respectively, was denominated in U.K. pounds sterling, and $0.9 million and $1.4 million, respectively, was denominated in Australian dollars.
Our results of operations and cash flows are subject to fluctuations due to changes in foreign currency exchange rates. Substantially all of our revenue is generated in U.S. dollars. Our expenses are generally denominated in the currencies of the jurisdictions in which we conduct our operations, which are primarily in the United States and Argentina, Europe and Asia. Our results of operations and cash flows are, therefore, subject to fluctuations due to changes in foreign currency exchange rates and may be adversely affected in the future due to changes in foreign exchange rates. During 2017 and 2016, the effect of a hypothetical 10% change in foreign currency exchange rates applicable to our business would not have a material impact on our historical consolidated financial statements for any period presented. To date, we have not engaged in any hedging strategies. As our international operations grow, we will continue to reassess our approach to manage our risk relating to fluctuations in currency rates.
Inflation Risk
We do not believe that inflation has had a material effect on our business, financial condition or results of operations in 2017, 2016, and 2015, because our sales are denominated in U.S. dollars and our operating expenses that are denominated in currencies other than U.S. dollars have not been subject to material currency inflation.
Critical Accounting Policies and Estimates
Our consolidated financial statements are prepared in accordance with generally accepted accounting principles in the United States, or U.S. GAAP. The preparation of these financial statements requires our management to make estimates and assumptions that affect the reported amounts of assets, liabilities, revenue, costs, and expenses and related disclosures. Our estimates are based on our historical experience and on various other factors that we believe are reasonable under the circumstances, the results of which form the basis for making judgments about the carrying value of assets and liabilities that are not readily apparent from other sources. Actual results may differ from these judgments and estimates under different assumptions or conditions and any such differences may be material. To the extent that there are differences between our estimates and actual results, our future financial statement presentation, financial condition, results of operations and cash flows will be effected.
We believe that the accounting policies associated with revenue recognition, share-based compensation and income taxes are most significant areas involving management's judgments and estimates. Therefore, these are considered to be our critical accounting policies and estimates. For further information on all of our significant accounting policies, see Note 2 of our accompanying Notes to Consolidated Financial Statements included in Part II, Item 8 of this Annual Report on Form 10-K.
52
JOBS Act Accounting Election
We are an emerging growth company, as defined in the JOBS Act. Under the JOBS Act, emerging growth companies can delay adopting new or revised accounting standards issued subsequent to the enactment of the JOBS Act until such time as those standards apply to private companies. We have irrevocably elected not to avail ourselves of this exemption from new or revised accounting standards and, therefore, are subject to the same new or revised accounting standards as other public companies that are not emerging growth companies.
Recently Issued Accounting Standards, Not Yet Adopted
In May 2014, the FASB issued Accounting Standards Update (ASU) No. 2014-09, Revenue from Contracts with Customers (Topic 606) (ASU 2014-09). This standard establishes a principle for recognizing revenue upon the transfer of promised goods or services to customers, in an amount that reflects the expected consideration received in exchange for those goods or services. The standard also provides guidance on the recognition of costs related to obtaining and fulfilling customer contracts. ASU 2014-09 became effective for us the first quarter of fiscal 2018.
We will adopt the standard using the full retrospective method and restate each reporting period presented.
In regards to our term-based software licenses, revenue is currently recorded ratably over the subscription term, as we have not established vendor-specific objective evidence (VSOE) for such offerings. Under the new standard, the requirement to have VSOE for undelivered elements is eliminated. As a result, under the new standard we will recognize a portion of our revenue related to our term-based on-premise software products when delivered. In addition, some deferred revenue recorded in accordance with the current revenue standard will be reduced upon adoption of the new revenue standard.
The timing of the revenue recognized attributable to professional services will also be impacted by the standard, for we will no longer be limited to recognizing services revenue based upon the amount of services billed to the customer.
We have also considered the impact of the guidance in Accounting Standards Codification (ASC) 340-40, Other Assets and Deferred Costs; Contracts with Customers, under ASU 2014-09. Under ASC 340-40, we would be required to capitalize and amortize certain sales commission costs. Under our current accounting policy, we do not capitalize sales commission costs and recognize these costs when they are incurred. Upon adoption we will be capitalizing certain commission costs and recording the expense over the period in which we expect to benefit from the sales efforts.
In February 2016, the FASB issued ASU 2016-02, Leases (Topic 842) (ASU 2016-02), which requires lessees to record most leases on their balance sheets but recognize the expenses on their income statements in a manner similar to current practice. ASU 2016-02 states that a lessee would recognize a lease liability for the obligation to make lease payments and a right-to-use asset for the right to use the underlying asset for the lease term. The new standard is effective for interim and annual periods beginning after December 15, 2018 and early adoption is permitted. While we are currently evaluating the impact of the adoption of this standard on our consolidated financial statements, we currently anticipate that the adoption of this standard will have a material impact on our consolidated balance sheets given that we had operating lease commitments of approximately $33.7 million as of December 31, 2017. However, we do not anticipate that the adoption of this standard will have a material impact on our consolidated statements of comprehensive loss since the expense recognition under this new standard will be similar to current practice.
In August 2016, the FASB issued ASU No. 2016-15, Statement of Cash Flows (Topic 230): Classification of Certain Cash Receipts and Cash Payments. ASU 2016-15 identifies how certain cash receipts and cash payments are presented and classified in the Statement of Cash Flows. The standard is effective for our fiscal year beginning January 1, 2018. The standard should be applied retrospectively. Upon adoption, we do not expect this pronouncement to have a material effect on our financial position, results of operations, or liquidity. This pronouncement will be considered for future periods.
In October 2016, the FASB issued ASU 2016-16, Income Taxes (Topic 740) Intra-Entity Transfers of Assets other than Inventory which amends the guidance used in the recognition of current and deferred income taxes for an intra-entity transfer. The guidance requires an entity recognize the income tax consequences of an intra-entity transfer of an asset other than inventory at the time of transfer. The standard is effective for our fiscal year beginning January 1, 2018. Upon adoption, we do not expect this pronouncement to have a material effect on our financial position, results of operations, or liquidity. This pronouncement will be considered for future periods.
In January 2017, the FASB issued ASU 2017-01, Business Combinations (Topic 805) Clarifying the Definition of a Business, which amends the guidance used in evaluating whether a set of acquired assets and activities represents a business. The
53
guidance requires an entity to evaluate if substantially all of the fair value of the gross assets acquired is concentrated in a single identifiable asset or a group of similar identifiable assets; if so, the set of transferred assets and activities is not considered a business. Application of ASU 2017-01 is expected to result in more acquisitions to be accounted for as asset acquisitions as opposed to business combinations. As a result, acquisition fees and expenses will be capitalized to the cost basis of the property acquired, and the tangible and intangible components acquired will be recorded based on their relative fair values as of the acquisition date. The standard is effective for our fiscal year beginning January 1, 2018. Upon adoption, we do not expect this pronouncement to have a material effect on our financial position, results of operations, or liquidity. This pronouncement will be considered for future periods.
In May 2017, the FASB issued ASU 2017-09, Stock Compensation (Topic 718) Scope of Modification Accounting, which amends the guidance used in modification accounting for share-based payment awards. The guidance specifies that any change to the terms or conditions of a share-based payment award should be treated as modification unless all three requirements are met. These requirements are that the fair value of the modified award, the vesting conditions of the modified award, and the classification of the modified award are all the same as the original award immediately before the modification. The standard is effective for our fiscal year beginning January 1, 2018. Upon adoption, we do not expect this pronouncement to have a material effect on our financial position, results of operations, or liquidity. This pronouncement will be considered for future periods.
Item 8. Financial Statements and Supplementary Data
MuleSoft, Inc.
Index to Consolidated Financial Statements
Page | |
54
Report of Independent Registered Public Accounting Firm
To the stockholders and board of directors
MuleSoft, Inc.:
Opinion on the Consolidated Financial Statements
We have audited the accompanying consolidated balance sheets of MuleSoft, Inc. and subsidiaries (the “Company”) as of December 31, 2017 and 2016, the related consolidated statements of operations, comprehensive loss, stockholders’ equity, and cash flows for each of the years in the three‑year period ended December 31, 2017, and the related notes (collectively, the “consolidated financial statements”). In our opinion, the consolidated financial statements present fairly, in all material respects, the financial position of the Company as of December 31, 2017 and 2016, and the results of its operations and its cash flows for each of the years in the three‑year period ended December 31, 2017, in conformity with U.S. generally accepted accounting principles.
Basis for Opinion
These consolidated financial statements are the responsibility of the Company’s management. Our responsibility is to express an opinion on these consolidated financial statements based on our audits. We are a public accounting firm registered with the Public Company Accounting Oversight Board (United States) (“PCAOB”) and are required to be independent with respect to the Company in accordance with the U.S. federal securities laws and the applicable rules and regulations of the Securities and Exchange Commission and the PCAOB.
We conducted our audits in accordance with the standards of the PCAOB. Those standards require that we plan and perform the audit to obtain reasonable assurance about whether the consolidated financial statements are free of material misstatement, whether due to error or fraud. Our audits included performing procedures to assess the risks of material misstatement of the consolidated financial statements, whether due to error or fraud, and performing procedures that respond to those risks. Such procedures included examining, on a test basis, evidence regarding the amounts and disclosures in the consolidated financial statements. Our audits also included evaluating the accounting principles used and significant estimates made by management, as well as evaluating the overall presentation of the consolidated financial statements. We believe that our audits provide a reasonable basis for our opinion.
/s/ KPMG LLP
We have served as the Company’s auditor since 2008.
Santa Clara, California
February 22, 2018
55
MULESOFT, INC.
Consolidated Balance Sheets
(In thousands, except share and per share data)
December 31, | |||||||
2017 | 2016 | ||||||
ASSETS | |||||||
CURRENT ASSETS: | |||||||
Cash and cash equivalents | $ | 79,568 | $ | 35,101 | |||
Investments | 124,603 | 63,361 | |||||
Trade receivables, net of allowance for doubtful accounts of $527 and $446 as of December 31, 2017 and December 31, 2016 | 111,863 | 72,324 | |||||
Prepaid expenses and other current assets | 18,987 | 18,854 | |||||
Total current assets | 335,021 | 189,640 | |||||
Investments, noncurrent | 143,108 | 4,151 | |||||
Property and equipment, net | 6,791 | 5,231 | |||||
Restricted cash | 784 | 671 | |||||
Goodwill | 814 | 787 | |||||
Intangible assets, net | 789 | 1,797 | |||||
Other assets | 5,289 | 661 | |||||
TOTAL ASSETS | $ | 492,596 | $ | 202,938 | |||
LIABILITIES AND STOCKHOLDERS’ EQUITY | |||||||
CURRENT LIABILITIES: | |||||||
Accounts payable | $ | 2,219 | $ | 1,879 | |||
Accrued expenses | 12,158 | 7,797 | |||||
Accrued compensation and related expenses | 31,065 | 16,369 | |||||
Deferred revenue, current | 201,976 | 130,045 | |||||
Total current liabilities | 247,418 | 156,090 | |||||
Deferred revenue, noncurrent | 9,456 | 5,569 | |||||
Other liabilities | 2,775 | 1,176 | |||||
TOTAL LIABILITIES | 259,649 | 162,835 | |||||
Commitments and contingencies | |||||||
STOCKHOLDERS’ EQUITY: | |||||||
Convertible preferred stock, $0.000025 par value per share: | |||||||
Authorized shares 100,000,000 and 90,296,190 as of December 31, 2017 and 2016; Issued and outstanding shares none and 86,030,961 as of December 31, 2017 and 2016; aggregate liquidation preference of none and $258.4 million as of December 31, 2017 and 2016 | — | 255,946 | |||||
Common stock, $0.000025 par value per share: | |||||||
Authorized shares 1,200,000,000 as of December 31, 2017 and 2016; Issued and outstanding shares 131,337,767 and 26,960,616 as of December 31, 2017 and 2016 | 3 | 1 | |||||
Additional paid-in capital | 552,260 | 22,241 | |||||
Accumulated deficit | (316,218 | ) | (236,230 | ) | |||
Accumulated other comprehensive loss | (3,098 | ) | (1,855 | ) | |||
TOTAL STOCKHOLDERS’ EQUITY | 232,947 | 40,103 | |||||
TOTAL LIABILITIES AND STOCKHOLDERS’ EQUITY | $ | 492,596 | $ | 202,938 | |||
See accompanying notes to consolidated financial statements.
56
MULESOFT, INC.
Consolidated Statements of Operations
(In thousands, except share and per share data)
Year Ended December 31, | |||||||||||
2017 | 2016 | 2015 | |||||||||
Revenue: | |||||||||||
Subscription and support | $ | 237,980 | $ | 152,843 | $ | 88,096 | |||||
Professional services and other | 58,476 | 34,904 | 22,156 | ||||||||
Total revenue | 296,456 | 187,747 | 110,252 | ||||||||
Cost of revenue: | |||||||||||
Subscription and support | 20,001 | 13,722 | 7,525 | ||||||||
Professional services and other | 61,269 | 35,341 | 24,645 | ||||||||
Total cost of revenue | 81,270 | 49,063 | 32,170 | ||||||||
Gross profit | 215,186 | 138,684 | 78,082 | ||||||||
Operating expenses: | |||||||||||
Research and development | 64,585 | 32,862 | 24,725 | ||||||||
Sales and marketing | 184,583 | 122,630 | 93,057 | ||||||||
General and administrative | 45,813 | 31,577 | 24,368 | ||||||||
Total operating expenses | 294,981 | 187,069 | 142,150 | ||||||||
Loss from operations | (79,795 | ) | (48,385 | ) | (64,068 | ) | |||||
Interest income | 2,483 | 465 | 220 | ||||||||
Other expense, net | (1,015 | ) | (340 | ) | (729 | ) | |||||
Net loss before provision for income taxes | (78,327 | ) | (48,260 | ) | (64,577 | ) | |||||
Provision for income taxes | 1,653 | 1,339 | 862 | ||||||||
Net loss | $ | (79,980 | ) | $ | (49,599 | ) | $ | (65,439 | ) | ||
Net loss attributable to common stockholders | $ | (79,980 | ) | $ | (59,035 | ) | $ | (65,439 | ) | ||
Net loss per share attributable to common stockholders, basic and diluted | $ | (0.75 | ) | $ | (2.73 | ) | $ | (3.57 | ) | ||
Weighted-average shares used in computing net loss per share attributable to common stockholders, basic and diluted | 106,742,923 | 21,623,610 | 18,324,048 | ||||||||
See accompanying notes to consolidated financial statements.
57
MULESOFT, INC.
Consolidated Statements of Comprehensive Loss
(In thousands)
Year Ended December 31, | |||||||||||
2017 | 2016 | 2015 | |||||||||
Net loss | $ | (79,980 | ) | $ | (49,599 | ) | $ | (65,439 | ) | ||
Other comprehensive loss: | |||||||||||
Foreign currency translation adjustments, net | 67 | (1,112 | ) | (355 | ) | ||||||
Unrealized gains (losses) on investments | (1,310 | ) | 250 | (308 | ) | ||||||
Other comprehensive loss | (1,243 | ) | (862 | ) | (663 | ) | |||||
Comprehensive loss | $ | (81,223 | ) | $ | (50,461 | ) | $ | (66,102 | ) | ||
See accompanying notes to consolidated financial statements.
58
MULESOFT, INC.
Consolidated Statements of Stockholders’ Equity
(In thousands, except share data)
Convertible Preferred Stock | Class A Common Stock | Class B Common Stock | Additional Paid-In Capital | Accumulated Deficit | Accumulated Other Comprehensive Loss | Total Stockholders’ Equity | |||||||||||||||||||||||||||||||
Shares | Amount | Shares | Amount | Shares | Amount | ||||||||||||||||||||||||||||||||
Balance-December 31, 2014 | 78,834,737 | 130,577 | — | — | 16,832,919 | 1 | 2,733 | (109,990 | ) | (330 | ) | 22,991 | |||||||||||||||||||||||||
Series G financing, net of issuance costs of $1,974 | 11,427,533 | 126,326 | — | — | — | — | — | — | — | 126,326 | |||||||||||||||||||||||||||
Repurchase of common stock | — | — | — | — | (2,140,174 | ) | — | (4,699 | ) | (11,202 | ) | — | (15,901 | ) | |||||||||||||||||||||||
Issuance of common stock upon exercise of options | — | — | — | — | 4,118,570 | — | 1,873 | — | — | 1,873 | |||||||||||||||||||||||||||
Issuance of common stock upon exercise of warrants | — | — | — | — | 16,480 | — | 11 | — | — | 11 | |||||||||||||||||||||||||||
Stock-based compensation expense | — | — | — | — | — | 3,318 | — | — | 3,318 | ||||||||||||||||||||||||||||
Tax benefits from employee stock plans | — | — | — | — | — | — | 154 | — | — | 154 | |||||||||||||||||||||||||||
Net loss | — | — | — | — | — | — | — | (65,439 | ) | — | (65,439 | ) | |||||||||||||||||||||||||
Other comprehensive loss | — | — | — | — | — | — | — | — | (663 | ) | (663 | ) | |||||||||||||||||||||||||
Balance-December 31, 2015 | 90,262,270 | 256,903 | — | — | 18,827,795 | 1 | 3,390 | (186,631 | ) | (993 | ) | 72,670 | |||||||||||||||||||||||||
Conversion of Series A convertible preferred stock into common stock in 2016 Tender Offer | (2,115,655 | ) | (479 | ) | — | — | 2,115,655 | — | 479 | — | — | — | |||||||||||||||||||||||||
Conversion of Series A convertible preferred stock into common stock | (2,115,654 | ) | (478 | ) | — | — | 2,115,654 | — | 478 | — | — | — | |||||||||||||||||||||||||
Repurchase of common stock | — | — | — | — | (339,285 | ) | — | (3,208 | ) | — | — | (3,208 | ) | ||||||||||||||||||||||||
Issuance of common stock upon exercise of options | — | — | — | — | 4,240,797 | — | 4,281 | — | — | 4,281 | |||||||||||||||||||||||||||
Other compensation expense relating to the 2016 Tender Offer | — | — | — | — | — | — | 9,948 | — | — | 9,948 | |||||||||||||||||||||||||||
Stock-based compensation expense | — | — | — | — | — | — | 6,552 | — | — | 6,552 | |||||||||||||||||||||||||||
Tax benefits from employee stock plans | — | — | — | — | — | — | 321 | — | — | 321 | |||||||||||||||||||||||||||
Net loss | — | — | — | — | — | — | — | (49,599 | ) | — | (49,599 | ) | |||||||||||||||||||||||||
Other comprehensive loss | — | — | — | — | — | — | — | — | (862 | ) | (862 | ) | |||||||||||||||||||||||||
Balance-December 31, 2016 | 86,030,961 | $ | 255,946 | — | — | 26,960,616 | $ | 1 | $ | 22,241 | $ | (236,230 | ) | $ | (1,855 | ) | $ | 40,103 | |||||||||||||||||||
Conversion of convertible preferred stock to common stock in connection with the initial public offering | (86,030,961 | ) | (255,946 | ) | — | — | 86,030,961 | 2 | 255,944 | — | — | — | |||||||||||||||||||||||||
Issuance of common stock in connection with the initial public offering, net of underwriting discounts | — | — | 14,950,000 | — | — | — | 236,360 | — | — | 236,360 | |||||||||||||||||||||||||||
59
Class A common stock issuance cost related to the initial public offering | — | — | — | — | — | — | (3,553 | ) | — | — | (3,553 | ) | |||||||||||||||||||||||||
Issuance of common stock upon exercise of options and warrants | — | — | 1,841,752 | — | 1,134,432 | — | 8,103 | — | — | 8,103 | |||||||||||||||||||||||||||
Issuance of common stock for settlement of restricted stock units | — | — | 67,428 | — | — | — | — | — | — | — | |||||||||||||||||||||||||||
Issuance of common stock related to employee stock purchase plan | — | — | 352,578 | — | — | 1 | — | 5,095 | — | — | 5,095 | ||||||||||||||||||||||||||
Conversion of shares of Class B common stock into share of Class A common stock | — | — | 67,287,540 | 2 | (67,287,540 | ) | (2 | ) | — | — | — | — | |||||||||||||||||||||||||
Stock-based compensation expense | — | — | — | — | — | — | 28,062 | — | — | 28,062 | |||||||||||||||||||||||||||
Cumulative-effect adjustment from adoption of ASU 2016-09 | — | — | — | — | — | — | 8 | (8 | ) | — | — | ||||||||||||||||||||||||||
Net loss | — | — | — | — | — | — | — | (79,980 | ) | — | (79,980 | ) | |||||||||||||||||||||||||
Other comprehensive loss | — | — | — | — | — | — | — | — | (1,243 | ) | (1,243 | ) | |||||||||||||||||||||||||
Balance—December 31, 2017 | — | — | 84,499,298 | $ | 2 | 46,838,469 | 1 | 552,260 | (316,218 | ) | (3,098 | ) | 232,947 | ||||||||||||||||||||||||
See accompanying notes to consolidated financial statements.
60
MULESOFT, INC.
Consolidated Statements of Cash Flows
(In thousands, except per share data)
Year Ended December 31, | |||||||||||
2017 | 2016 | 2015 | |||||||||
CASH FLOWS FROM OPERATING ACTIVITIES: | |||||||||||
Net loss | $ | (79,980 | ) | $ | (49,599 | ) | $ | (65,439 | ) | ||
Adjustments to reconcile net loss to net cash provided by (used in) operating activities: | |||||||||||
Stock-based compensation expense | 28,070 | 6,552 | 3,318 | ||||||||
Other non-cash compensation related to 2016 Tender Offer | — | 9,948 | — | ||||||||
Depreciation and amortization | 3,833 | 1,949 | 1,221 | ||||||||
Amortization of investment premiums | 766 | 559 | 562 | ||||||||
Provision for doubtful accounts | 81 | 206 | (17 | ) | |||||||
Tax benefits from employee stock plans | — | 321 | 154 | ||||||||
Loss on disposal of property and equipment | 134 | 6 | 177 | ||||||||
Other | — | 13 | — | ||||||||
Changes in assets and liabilities: | |||||||||||
Trade receivables | (39,658 | ) | (25,106 | ) | (21,143 | ) | |||||
Prepaid expenses and other current assets | (2,024 | ) | (6,836 | ) | (6,455 | ) | |||||
Other assets | (4,628 | ) | (343 | ) | (217 | ) | |||||
Accounts payable | 380 | 1,090 | (1,286 | ) | |||||||
Accrued expenses | 4,637 | 1,127 | 1,619 | ||||||||
Accrued compensation and related expenses | 12,759 | 4,705 | 5,011 | ||||||||
Other liabilities | 1,599 | 1,096 | (80 | ) | |||||||
Deferred revenue | 76,012 | 51,931 | 35,595 | ||||||||
Net cash provided by (used in) operating activities | 1,981 | (2,381 | ) | (46,980 | ) | ||||||
CASH FLOWS FROM INVESTING ACTIVITIES: | |||||||||||
Purchases of investments | (319,709 | ) | (41,214 | ) | (106,164 | ) | |||||
Sales of investments | 42,476 | 24,536 | 5,000 | ||||||||
Maturities of investments | 74,957 | 39,650 | 9,500 | ||||||||
Purchase of intangible assets | — | — | (75 | ) | |||||||
Purchases of property and equipment | (4,835 | ) | (4,501 | ) | (1,506 | ) | |||||
Cash paid for acquisition | (106 | ) | (1,000 | ) | — | ||||||
Net cash provided by (used in) investing activities | (207,217 | ) | 17,471 | (93,245 | ) | ||||||
CASH FLOWS FROM FINANCING ACTIVITIES: | |||||||||||
Net proceeds from issuance of common stock in initial public offering | 236,360 | — | — | ||||||||
Net proceeds from issuance of preferred stock | — | — | 126,326 | ||||||||
Proceeds from employee stock purchase plan | 7,031 | — | — | ||||||||
Repurchase of common shares | — | (3,208 | ) | (15,901 | ) | ||||||
Proceeds from issuance of common stock upon exercise of options and warrants | 7,998 | 4,281 | 1,884 | ||||||||
Payment of costs related to initial public offering | (1,823 | ) | (1,730 | ) | — | ||||||
Net cash provided by (used in) financing activities | 249,566 | (657 | ) | 112,309 | |||||||
Impact of foreign exchange on cash and cash equivalents | 250 | (1,044 | ) | (322 | ) | ||||||
Net increase (decrease) in cash and cash equivalents | 44,580 | 13,389 | (28,238 | ) | |||||||
Cash, cash equivalents, and restricted cash, Beginning of year | 35,772 | 22,383 | 50,621 | ||||||||
Cash, cash equivalents, and restricted cash, End of year | $ | 80,352 | $ | 35,772 | $ | 22,383 | |||||
SUPPLEMENTAL DISCLOSURES OF CASH FLOW INFORMATION: | |||||||||||
Cash paid for income taxes | $ | 1,084 | $ | 764 | $ | 895 | |||||
SUPPLEMENTAL DISCLOSURES OF NON-CASH INVESTING AND FINANCING INFORMATION: | |||||||||||
Deemed dividends on preferred stock | $ | — | $ | 9,436 | $ | — | |||||
Costs related to initial public offering, accrued but unpaid | $ | — | $ | 266 | $ | — | |||||
Liability for purchase of property and equipment | $ | 41 | $ | 91 | $ | 72 | |||||
See accompanying notes to consolidated financial statements
61
MuleSoft, Inc.
Notes to Consolidated Financial Statements
1. Organization and Description of Business
MuleSoft, Inc. (“we” or “our”) was incorporated in the state of Delaware on April 12, 2006. We provide a single, unified platform that allows customers to connect their applications, data and devices and to enable a self-serve infrastructure through discoverable building blocks that can be used and reused to rapidly compose applications. Our customers use these building blocks to connect their SaaS applications, on-premises applications, cloud deployments, mobile devices and data into an “application network.” With an application network built with Anypoint Platform, organizations can transform into composable enterprises. We are the sole owner of the MuleSoft source code and all MuleSoft trademarks.
We have subsidiaries in Argentina, Australia, Canada, Germany, Hong Kong, India, the Netherlands, New Zealand, Singapore, and the United Kingdom.
Initial Public Offering
On March 16, 2017, our Registration Statement on Form S-1 (File No. 333-216130) relating to the initial public offering (“IPO”) of our Class A common stock was declared effective by the Securities and Exchange Commission (“SEC”). Pursuant to such Registration Statement, we sold 14,950,000 shares of our Class A common stock at an initial public offering price of $17.00 per share for net proceeds of $232.7 million, net of underwriting discounts and commissions and offering costs. Immediately prior to the closing of the initial public offering, all 86,030,961 shares of our then-outstanding convertible preferred stock were automatically converted and reclassified into Class B common stock, and all 27,685,793 shares of our then-outstanding common stock were automatically reclassified into Class B common stock.
2. Summary of Significant Accounting Policies
Basis of Presentation
The consolidated financial statements have been prepared in accordance with generally accepted accounting principles in the United States of America ("GAAP"), and include our accounts and those of our wholly owned subsidiaries. All intercompany balances and transactions have been eliminated upon consolidation.
Use of Estimates
The preparation of consolidated financial statements in conformity with GAAP requires management to make estimates and assumptions that affect the reported amounts of assets and liabilities and disclosure of contingent assets and liabilities at the date of the financial statements and the reported amounts of revenue and expenses during the reporting period. Management periodically evaluates such estimates and assumptions for continued reasonableness. In particular, we make estimates with respect to the fair value allocation of multiple elements in revenue recognition, the uncollectible accounts receivable, valuation of long-lived assets, stock-based compensation expense and income taxes. Appropriate adjustments, if any, to the estimates used are made prospectively based upon such periodic evaluation. Actual results could differ from those estimates.
Segments
We operate as one operating segment. Operating segments are defined as components of an enterprise for which separate financial information is evaluated regularly by the chief operating decision maker, who is the Chief Executive Officer, in deciding how to allocate resources and assessing performance. While we have offerings in multiple market segments, our business operates in one operating segment because our chief operating decision maker evaluates our financial information and resources and assesses the performance of these resources on a consolidated basis. Since we operate in one operating segment, all required financial segment information can be found in the consolidated financial statements.
62
Foreign Currency Translation
The functional currency of our non-U.S. subsidiaries is the local currency. Asset and liability balances denominated in non-U.S. dollar currencies are translated into U.S. dollars using period-end exchange rates, while revenue and expenses are based upon the exchange rate at the time of the transaction, if known, or at the average rate for the period. Differences are included in stockholders’ equity as a component of accumulated other comprehensive loss. Financial assets and liabilities denominated in currencies other than the functional currency are recorded at the exchange rate at the time of the transaction and subsequent gains and losses related to changes in the foreign currency are included in other income (expense), net in the accompanying consolidated statements of operations.
Cash and Cash Equivalents
We consider all highly liquid investments with an original maturity of three months or less from date of purchase to be cash equivalents.
Restricted Cash
Restricted cash at December 31, 2017 and 2016 includes $784,000 and $308,000, respectively, which is used as collateral for letters of credit and bank guarantees issued in relation to certain leases and $0 and $364,000, respectively, of collateral used to secure credit cards which may not be used or transferred until the restriction is released by the issuing bank.
Fair Value of Financial Instruments
Assets and liabilities recorded at fair value in the financial statements are categorized based upon the level of judgment associated with the inputs used to measure their fair value. Hierarchical levels which are directly related to the amount of subjectivity associated with the inputs to the valuation of these assets or liabilities are as follows:
• | Level 1: Observable inputs that reflect quoted prices (unadjusted) for identical assets or liabilities in active markets. |
• | Level 2: Observable inputs, other than Level 1 prices, such as quoted prices for similar assets or liabilities, quoted prices in markets that are not active or other inputs that are observable or can be corroborated by observable market data for substantially the full term of the assets or liabilities. |
• | Level 3: Unobservable inputs reflecting our own assumptions incorporated in valuation techniques used to determine fair value. These assumptions are required to be consistent with market participant assumptions that are reasonably available. |
For certain financial instruments, including cash and cash equivalents, accounts receivable and payable, as well as certain accrued liabilities, the recorded amount approximates estimated fair value due to their relatively short maturity period.
Short-term investments consist of investments in marketable equity securities that are classified as available-for-sale and recognized at fair value using Level 1 and Level 2 inputs.
Concentration of Credit and Other Risks
Financial instruments that potentially subject us to concentration of credit risk consist principally of trade receivables. Our trade receivables mainly result from subscription to our software products and professional services provided to our customers that are located primarily in the United States and Western Europe. We review the need for allowances for potential losses from these trade receivables. At December 31, 2017 and 2016, the allowance for doubtful accounts was $527,000 and $446,000, respectively. For all periods presented, the allowance for doubtful accounts activity was not significant. No single customer accounted for ten percent or more of trade receivables as of December 31, 2017 and 2016. No single customer accounted for ten percent or more of total revenue for the years ended December 31, 2017, 2016, and 2015.
We are dependent upon third parties, such as AWS, in order to meet the uptime and performance requirements of our customers.
63
Property and Equipment, Net
Property and equipment are stated at cost, net of accumulated depreciation and amortization. Depreciation and amortization are computed using the straight-line method based on the estimated useful lives of three years for assets other than leasehold improvements. Leasehold improvements are amortized on a straight-line basis over the shorter of the lease term or estimated useful life of the assets; generally three years.
Goodwill and Intangible Assets
Goodwill is measured as the excess of consideration transferred and the fair value of net assets acquired and liabilities assumed in a business combination.
Goodwill is not amortized, but is tested for impairment at least annually or as circumstances indicate that its value may no longer be recoverable. To assess if goodwill is impaired, we first perform a qualitative assessment to determine whether further impairment testing is necessary. If, as a result of the qualitative assessment, we consider it more likely than not that the fair value of a reporting unit is less than its carrying amount, we perform a quantitative impairment test.
We perform our goodwill impairment test annually in the fourth fiscal quarter, and the last impairment test was completed for the year ended December 31, 2017 and it was determined that the fair value was significantly in excess of the carrying value.
The guidance for goodwill and other intangible assets requires impairment testing based on reporting units. We periodically reevaluate the business and determined that we continue to operate in one segment, which is also considered the sole reporting unit. Therefore, goodwill was tested and will continue to be tested for impairment at the consolidated level. To date, we have determined that there has been no impairment of goodwill.
Impairment of Long-Lived Assets
Our long-lived assets, such as property and equipment and intangibles, are reviewed for impairment whenever events or changes in circumstances indicate that the carrying amount of an asset or asset group may not be recoverable. Recoverability of assets to be held and used is measured by comparison of the carrying amount of an asset group to estimated undiscounted future cash flows expected to be generated by the asset group. If the carrying amount of an asset group exceeds its estimated future cash flows, an impairment charge is recognized in the amount by which the carrying amount of the asset group exceeds the fair value of the asset group. There were no impairment charges for any of the periods presented.
Software Development Costs
Development costs included in the research and development of new software products are expensed as incurred until technological feasibility of the product has been established. Software development costs incurred after technological feasibility has been established are capitalized up to the time the product is available for general release to customers. For the years ended December 31, 2017 and 2016, there were no amounts capitalized as our current development process is essentially completed concurrent with the establishment of technological feasibility.
We incur costs related to software acquired, developed or modified solely to meet our internal requirements. Costs incurred during the preliminary planning and evaluation stage of the project and during the post implementation operational stage are expensed as incurred. Costs incurred during the application development stage of the project are capitalized. We define the design, configuration, and coding process as the application development stage. We did not capitalize any costs related to computer software developed for internal use during the years ended December 31, 2017, 2016, and 2015.
Revenue Recognition
We recognize revenue from the following sources: (1) subscription and support revenue, which is comprised of subscription fees from customers accessing our cloud-hosted software and from term-based licenses of our software and support services; (2) professional services and other revenue, which consists primarily of fees associated with consulting and training services related to the implementation and configuration of our platform and (3) royalty revenue from customers incorporating our software in their products.
On sales through our channel partners, we recognize revenue on a “sell in” basis as our contractual relationships with our channel partners do not depend on the sale of our products and services to their customers and payment from the channel
64
partner is not contingent on receiving payment from the end customer. The contractual relationships with our channel partners do not allow returns, rebates, or price concessions.
We recognize revenue net of sales taxes and other applicable taxes when all of the following criteria are met: there is persuasive evidence of an arrangement, delivery has occurred or service has been performed, the fee is fixed or determinable, and collectability is probable.
Subscription Revenue from Cloud-Hosted Software
Subscription revenue from cloud-hosted software is recognized ratably over the subscription period.
Subscription and Support Revenue from Software Licenses
Software licenses for our enterprise software are sold with support services and are generally offered with one-year base subscription periods. The base license subscription generally entitles the end user to the technology itself and post-contract customer support consisting of a specified level of customer support bug fixes, functionality enhancements to the technology, and upgrades to new versions of the technologies, each on a when-and-if available basis, during the term of the subscription. Revenue is recorded ratably over the subscription term as we have not established VSOE for such offerings.
Professional Services and Other Revenue
Professional services and other revenue is comprised of revenue earned for consulting and training services related to the implementation and configuration of our platform and royalty revenue. Professional services revenue is generally recognized as the services are rendered for time and material contracts, or on a proportional performance basis for fixed price contracts. The majority of our professional services contracts are on a time and materials basis and have standalone value. For professional services that are part of a multiple-element software arrangement, where VSOE of fair value does not exist for all undelivered elements, the professional services revenue is recognized over the term of the subscription.
We classify reimbursements received from customers for out-of-pocket expenses as a component of revenue.
Royalty revenue is comprised of royalty fees received from customers who have our products incorporated in their own products. Revenue is recognized when the sale to the end customer is reported to us.
Multiple-Element Arrangements
For multiple-element arrangements containing cloud hosted subscription and non-software services, we: (1) determine whether each element constitutes a separate unit of accounting; (2) determine the fair value of each element using the selling price hierarchy of VSOE of selling price, third party evidence (TPE) of selling price or best estimated selling price (BESP), as applicable; and (3) allocate the total non-contingent fee to each separate unit of accounting based on the relative selling price method. An element constitutes a separate unit of accounting when the delivered item has standalone value and delivery of the undelivered element is probable and within our control. As we have been unable to establish VSOE or TPE for the elements of our arrangements, we determine BESP by considering overall pricing objectives and market conditions. Significant pricing practices taken into consideration include our discounting practices, the size and volume of our transactions, our price lists, our go-to-market strategy, historical standalone sales, and contract prices. As our go-to-market strategies evolve, the pricing practices may be modified in the future, which could result in changes in relative selling prices, including BESP, and therefore, the allocation of the selling price to an element. The consideration allocated to subscription and support is recognized as revenue over the contract period commencing when the subscription service is made available to the customer. The consideration allocated to professional services is recognized as revenue using the proportional performance method or as services are delivered for time and material contracts. The total arrangement fee for a multiple element arrangement is allocated based on the relative BESP of each element. However, since the professional services are generally completed prior to completion of delivery of subscription and support services, the revenue recognized for professional services in a given reporting period does not include fees subject to delivery of subscription and support services. This results in the recognition of revenue for professional services that is generally no greater than the contractual fees for those professional services.
For multiple-element arrangements that include only software licenses and software related post-contract support, training, and/or consulting, we allocate and defer revenue for each undelivered element of these arrangements based on VSOE. As we have not yet established VSOE of fair value for our software licenses and support, we recognize revenue for these arrangements on a ratable basis over the term of the subscription product with which it is bundled.
65
We have certain multiple element transactions that include both non-software and software elements. For these types of transactions, we allocate the total price to each separate unit of accounting based on the relative selling price method described above. For non-software elements, the revenue is recognized when revenue recognition criteria are met for each element. For subscription elements, we recognize revenue over the subscription term when revenue recognition criteria have been met.
Deferred Revenue
Deferred revenue consists of billing or payments received in advance of revenue recognition generated from subscription to our cloud hosted software, software licenses, and support as well as payments for unused training and consulting services. Software licenses and subscription to cloud hosted software, support, training, and consulting services are generally paid for in full 30 to 60 days after the invoice date.
Cost of Revenue
Cost of revenue for subscription and support revenue consists primarily of cloud-hosting costs and personnel-related costs of our customer support organization, including salaries, commissions, benefits, bonuses and stock-based compensation, as well as contractor costs to supplement our staff levels, third-party software royalties and allocated overhead.
Cost of revenue for professional services and other revenue consists primarily of personnel-related costs of our professional services and training departments, including salaries, commissions, benefits, bonuses and stock-based compensation, contractor costs to supplement our staff levels and allocated overhead.
Research and Development
Research and development costs are expensed as incurred. Research and development expenses consist primarily of personnel-related costs for the design and development of our platform and technologies, contractor costs to supplement our staff levels, third-party web services, consulting services, and allocated overhead.
Advertising Expenses
Advertising costs are expensed when incurred and are included in operating expenses in the accompanying consolidated statements of operations. Advertising expense was $11.8 million, $7.3 million, and $4.9 million for the years ended December 31, 2017, 2016, and 2015, respectively.
Stock-Based Compensation
We measure stock-based compensation cost for equity instruments granted to employees based upon the estimated fair value of the award at the date of grant. We estimate the fair value of stock options, shares under our employee stock purchase plan and employee stock purchase rights using the Black-Scholes option-pricing model, which requires us to estimate expected term, expected volatility, risk-free interest rate, and dividend yield. For stock options and shares under our employee stock purchase plan, we use the simplified method in developing an estimate of the expected term of the stock options, which is calculated as the average of the time to vesting and the contractual life of the options. The expected term of employee stock purchase rights represents the contractual term of the underlying program. We compute the expected volatility assumption based on blended volatility of our peer companies. Due to the short period that our stock has been publicly traded, we believe our peer company volatility is more representative of our future stock price trends than our historical volatility. The risk-free interest rate is based on the average interest rate for U.S. Treasury instruments whose term is consistent with the expected term. As we have not declared dividends for any period presented, and do not anticipate doing so in the future, the dividend yield is estimated at 0%.
For restricted stock units, fair value is based on the closing price of our common stock on the grant date.
Compensation cost resulting from this valuation for restricted stock units is recognized in the consolidated statement of operations on a straight-line basis over the period during which an employee provides the requisite service in exchange for the award. Compensation cost resulting from this valuation for shares under our employee stock purchase plan is recognized on an accelerated basis.
66
Income Taxes
Income taxes are accounted for using the asset and liability method. Deferred tax assets and liabilities are recognized for the future tax consequences attributable to differences between the financial statement carrying amounts or existing assets and liabilities and their respective tax bases. Deferred tax assets and liabilities are measured using the enacted tax rates expected to apply to taxable income in the years in which those temporary differences are expected to be recovered or settled. The effect on deferred tax assets and liabilities of a change in tax rates is recognized in income in the period of enactment. We record a valuation allowance to reduce deferred tax assets to an amount for which realization is more likely than not.
We measure and recognize tax benefits from uncertain tax positions only if it is more likely than not that the tax position will be sustained on examination by the tax authorities, based on the merits of the position.
Net Loss Per Share Attributable to Common Stockholders
For the year ended December 31, 2017, our basic net loss per share attributable to common stockholders is calculated by dividing the net loss attributable to common stockholders by the weighted-average number of shares of common stock outstanding for the period, without consideration of potentially dilutive securities. Diluted net loss per share is the same as basic net loss per share since the effect of potentially dilutive securities is anti-dilutive. The rights of the holders of Class A and Class B common stock are identical, except with respect to voting and conversion. Each share of Class A common stock is entitled to one vote per share and each share of Class B common stock is entitled to ten votes per share. Shares of Class B common stock may be converted into Class A common stock at any time at the option of the stockholder on a one-for-one basis, and are automatically converted into Class A common stock upon sale or transfer, subject to certain limited exceptions. Shares of Class A common stock are not convertible. Net loss attributable to common stockholders for the year ended December 31, 2016 is calculated as net loss for the period plus the deemed dividend on common stock related to shares of convertible preferred stock that was sold by holders following conversion to common stock. The deemed dividend represents the excess of the sale price of the converted preferred stock over the fair value of our common stock. For the year ended December 31, 2015, our basic net loss per share attributable to common stockholders is calculated by dividing the net loss attributable to common stockholders by the weighted-average number of shares of common stock outstanding for the period, without consideration of potentially dilutive securities.
Commitments and Contingencies
Liabilities for loss contingencies arising from claims, assessments, litigation, fines and penalties and other sources are recorded when it is probable that a liability has been or will be incurred and the amount of the liability can be reasonably estimated. Legal costs incurred in connection with loss contingencies are expensed as incurred.
Recently Adopted Accounting Standards
In November 2016, the Financial Accounting Standards Board (FASB) issued ASU No. 2016-18, Statement of Cash Flows (Topic 230): Restricted Cash. ASU 2016-18 requires that the statement of cash flows explains the change during the period in the total cash, cash equivalents, and restricted cash. The standard is effective for fiscal years beginning after December 15, 2017, and interim periods within those years. We have early adopted ASU 2016-18 and, accordingly, amounts generally described as restricted cash are included with cash and cash equivalents when reconciling the beginning-of-period and end-of-period total amounts shown on the accompanying consolidated statements of cash flows. We have adopted ASU 2016-18 retrospectively and have revised the prior period cash flow from investing activities, beginning cash balance, and ending cash balance to reflect the change in presentation of restricted cash. Other than the change in presentation in the accompanying consolidated statements of cash flows, the adoption of this pronouncement had no effect on our financial position, results of operations, or liquidity.
In March 2016, the FASB issued ASU 2016-09, Compensation—Stock Compensation (Topic 718): Improvements to Employee Share - Based Payment Accounting, which simplifies the accounting and reporting of share-based payment transactions, including adjustments to how excess tax benefits and a company’s payments for tax withholdings should be classified. The new standard is effective for annual periods beginning after December 15, 2016. Other than the change in presentation in the accompanying consolidated statements of cash flows, the adoption of this pronouncement had no material effect on our financial position, results of operations, or liquidity.
In January 2017, the FASB issued ASU 2017-04, Intangibles (Topic 350) Simplifying the Test for Goodwill Impairment, which amends the guidance used in evaluating impairment of goodwill. The guidance eliminates Step 2 from the goodwill impairment test. An entity should now perform its annual, or interim, goodwill impairment test by comparing the fair value of a reporting unit with its carrying amount. An impairment charge should be recognized for the amount that the carrying amount
67
exceeds the fair value. Any reporting units with a zero or negative carrying amount no longer are required to perform qualitative assessments for goodwill impairment. Application of ASU 2017-04 is expected to reduce the cost and complexity of evaluating goodwill for impairment. We have adopted ASU 2017-04 for fiscal year ended December 31, 2017. The adoption of this pronouncement had no effect on our financial position, results of operations, or liquidity.
Accounting Standards Update No. 2014-09: Revenue from Contracts with Customers, Not Yet Adopted
In May 2014, the FASB issued Accounting Standards Update (ASU) No. 2014-09, Revenue from Contracts with Customers (Topic 606, or ASC 606) (ASU 2014-09). This standard establishes a principle for recognizing revenue upon the transfer of promised goods or services to customers, in an amount that reflects the expected consideration received in exchange for those goods or services. The standard also provides guidance on the recognition of costs related to obtaining and fulfilling customer contracts. ASU 2014-09 is effective for us the first quarter of fiscal 2018.
We have also considered the impact of the guidance in Accounting Standards Codification (ASC) 340-40, Other Assets and Deferred Costs; Contracts with Customers, under ASU 2014-09. Under our current accounting policy, we do not capitalize sales commission costs and recognize these costs when they are incurred. Under ASC 340-40, we will be required to capitalize and amortize certain sales commission costs by recording the expense over 4 years, the period in which we expect to benefit from the sales efforts.
The guidance permits two methods of adoption: retrospectively to each prior reporting period presented (full retrospective method), or retrospectively with the cumulative effect of initially applying the guidance recognized at the date of initial application (modified retrospective method). We will adopt the standard using the full retrospective method and restate each period presented.
In preparation for adoption of the standard, we are in the process of implementing certain internal controls and key system functionality to enable the preparation of financial information and have reached conclusions on key accounting assessments related to the standard.
The most significant impact of the standard relates to our accounting for term-based software license revenue related to certain products where we do not provide a hosting service. Under the standard we will recognize revenue related to the software license at delivery rather than ratably over the subscription term.
The timing of the revenue recognized attributable to professional services will also be impacted by the standard, for we will no longer be limited to recognizing services revenue based upon the amount of services billed to the customer.
We pay commissions to our sales representatives as compensation for obtaining subscription and support contracts as well as professional services contracts. Under ASC 606, we will be required to capitalize all commission costs which are considered an incremental cost of obtaining the contracts and amortize those costs over the expected period of benefit. These capitalized costs will be periodically reviewed for impairment.
We continue to evaluate the impact of related disclosures required upon adoption. The quantitative ranges provided below are estimates of the expected effects of our adoption of ASC 606 and its impact on our accounting for commission costs under ASC 340-40. These ranges represent our best estimates of the effects of adopting ASC 606 at the time of the preparation of this Annual Report on Form 10-K. The actual impact is subject to change from these reasonable estimates.
Consolidated Statement of Operations
Total revenue
Under the new guidance, we expect that revenue previously reported will be reduced between 1% and 4% for the year ended December 31, 2017 and the impact will be nominal for the year ended December 31, 2016, primarily due to the recognition of revenue related to the software license at the time the license is delivered instead of ratably over the subscription period.
68
Sales and marketing expenses
Under the new guidance, we expect that our previously reported sales and marketing expense will be reduced between 12% and 15% for the years ended December 31, 2017 and 2016, primarily due to the capitalization of commission expense. As discussed above, under ASC 606 certain commissions costs are required to be capitalized and the resulting asset is amortized to expense as we transfer the related services to the customer. These assets will be periodically assessed for impairment.
3. Investments
Marketable Securities
The following table summarizes our available-for-sale investments at December 31, 2017 and 2016.
December 31, 2017 | |||||||||||||||
Amortized Cost | Unrealized Gains | Unrealized Losses | Fair Value | ||||||||||||
(In thousands) | |||||||||||||||
Corporate bonds | $ | 79,406 | $ | — | $ | (527 | ) | $ | 78,879 | ||||||
U.S. Treasury securities | 141,496 | — | (591 | ) | 140,905 | ||||||||||
Agency securities | 44,462 | $ | — | (201 | ) | 44,261 | |||||||||
Foreign bonds | 3,714 | $ | — | (48 | ) | 3,666 | |||||||||
Total marketable securities | $ | 269,078 | $ | — | $ | (1,367 | ) | $ | 267,711 | ||||||
December 31, 2016 | |||||||||||||||
Amortized Cost | Unrealized Gains | Unrealized Losses | Fair Value | ||||||||||||
(In thousands) | |||||||||||||||
Corporate bonds | $ | 24,027 | $ | — | $ | (33 | ) | $ | 23,994 | ||||||
U.S. Treasury securities | 40,548 | — | (20 | ) | 40,528 | ||||||||||
Foreign bonds | 2,995 | — | (5 | ) | 2,990 | ||||||||||
Total marketable securities | $ | 67,570 | $ | — | $ | (58 | ) | $ | 67,512 | ||||||
The duration of the investments classified as marketable securities is as follows (in thousands):
December 31, 2017 | December 31, 2016 | ||||||
Short-term (due in one year or less) | $ | 124,603 | $ | 63,361 | |||
Long-term (due after one year) | 143,108 | 4,151 | |||||
Total marketable securities | $ | 267,711 | $ | 67,512 | |||
As of December 31, 2017, the following marketable securities were in an unrealized loss position (in thousands):
Less than 12 months | Greater than 12 months | Total | |||||||||||||||||||||
Fair Value | Unrealized Losses | Fair Value | Unrealized Losses | Fair Value | Unrealized Losses | ||||||||||||||||||
Corporate bonds | $ | 78,879 | $ | (527 | ) | $ | — | $ | — | $ | 78,879 | $ | (527 | ) | |||||||||
U.S. Treasury securities | 140,905 | (591 | ) | — | — | 140,905 | (591 | ) | |||||||||||||||
Agency securities | 44,261 | (201 | ) | — | — | 44,261 | (201 | ) | |||||||||||||||
Foreign bonds | 3,666 | (48 | ) | — | — | 3,666 | (48 | ) | |||||||||||||||
Total marketable securities | $ | 267,711 | $ | (1,367 | ) | $ | — | $ | — | $ | 267,711 | $ | (1,367 | ) | |||||||||
69
As of December 31, 2016, the following marketable securities were in an unrealized loss position (in thousands):
Less than 12 months | Greater than 12 months | Total | |||||||||||||||||||||
Fair Value | Unrealized Losses | Fair Value | Unrealized Losses | Fair Value | Unrealized Losses | ||||||||||||||||||
Corporate bonds | $ | 22,342 | $ | (31 | ) | $ | 1,652 | $ | (2 | ) | $ | 23,994 | $ | (33 | ) | ||||||||
U.S. Treasury securities | 38,029 | (20 | ) | 2,499 | — | 40,528 | (20 | ) | |||||||||||||||
Foreign bonds | $ | 2,990 | $ | (5 | ) | $ | — | $ | — | $ | 2,990 | $ | (5 | ) | |||||||||
Total marketable securities | $ | 63,361 | $ | (56 | ) | $ | 4,151 | $ | (2 | ) | $ | 67,512 | $ | (58 | ) | ||||||||
We do not believe any of the unrealized losses represent an other-than-temporary impairment based on our evaluation of available evidence as of December 31, 2017 and 2016. We expect to receive the full principal and interest on all of these marketable securities.
Fair Value Measurement
The following table presents information about our assets that are measured at fair value and indicates the fair value hierarchy of the valuation (in thousands):
As of December 31, 2017 | |||||||||||||||
Aggregate Fair Value | Level 1 | Level 2 | Level 3 | ||||||||||||
Assets: | |||||||||||||||
Money market | $ | 8,413 | $ | 8,413 | $ | — | $ | — | |||||||
Corporate bonds | 78,879 | — | 78,879 | — | |||||||||||
U.S. Treasury securities | 140,905 | — | 140,905 | — | |||||||||||
Commercial paper | 7,442 | — | 7,442 | — | |||||||||||
Agency securities | 44,261 | — | 44,261 | — | |||||||||||
Foreign bonds | 3,666 | — | 3,666 | — | |||||||||||
$ | 283,566 | $ | 8,413 | $ | 275,153 | $ | — | ||||||||
Reported as: | |||||||||||||||
Cash equivalents (1) | $ | 15,855 | |||||||||||||
Investments, current | 124,603 | ||||||||||||||
Investments, noncurrent | 143,108 | ||||||||||||||
Total | $ | 283,566 | |||||||||||||
As of December 31, 2016 | |||||||||||||||
Aggregate Fair Value | Level 1 | Level 2 | Level 3 | ||||||||||||
Assets: | |||||||||||||||
Money market | $ | 3,133 | $ | 3,133 | $ | — | $ | — | |||||||
Corporate bonds | 23,994 | — | 23,994 | — | |||||||||||
U.S. Treasury securities | 40,528 | — | 40,528 | — | |||||||||||
Foreign bonds | 2,990 | — | 2,990 | — | |||||||||||
$ | 70,645 | $ | 3,133 | $ | 67,512 | $ | — | ||||||||
Reported As: | |||||||||||||||
Cash equivalents(1) | $ | 3,133 | |||||||||||||
Investments, current | 63,361 | ||||||||||||||
Investments, noncurrent | 4,151 | ||||||||||||||
Total | $ | 70,645 | |||||||||||||
70
(1) | Included in “cash and cash equivalents” in the accompanying consolidated balance sheet as of December 31, 2017 and 2016, in addition to $63.7 million and $32.0 million of cash, respectively. |
4. Property and Equipment
The cost and accumulated depreciation and amortization of property and equipment are as follows (in thousands):
December 31, | |||||||
2017 | 2016 | ||||||
Computers and equipment | $ | 5,442 | $ | 3,753 | |||
Office furniture, fixtures and equipment | 725 | 313 | |||||
Software | 478 | 457 | |||||
Leasehold improvements | 5,790 | 3,037 | |||||
Construction-in-progress | 355 | 1,596 | |||||
Property and equipment, gross | 12,790 | 9,156 | |||||
Less: accumulated depreciation and amortization | (5,999 | ) | (3,925 | ) | |||
Total property and equipment, net | $ | 6,791 | $ | 5,231 | |||
Depreciation expense was $3.3 million, $1.7 million, and $1.2 million for the years ended December 31, 2017, 2016, and 2015, respectively.
5. Intangible Assets
Total cost and amortization of intangible assets comprised of the following (in thousands):
December 31, | |||||||
2017 | 2016 | ||||||
Purchased intangibles | $ | 1,720 | $ | 2,176 | |||
Less: accumulated amortization | (931 | ) | (379 | ) | |||
Total intangible assets, net | $ | 789 | $ | 1,797 | |||
The amortization expense of the intangible assets was $511,000, $236,000, and $56,000 for the years ended December 31, 2017, 2016, and 2015, respectively.
The total estimated future amortization expense of these intangible assets as of December 31, 2017 is as follows (in thousands):
Amount | |||
Year ending: | |||
2018 | $ | 459 | |
2019 | 195 | ||
2020 | 135 | ||
Total intangible assets, net | $ | 789 | |
6. Commitments and Contingencies
Operating Leases
As of December 31, 2017, we leased office space in Argentina, Australia, Canada, Germany, Hong Kong, the Netherlands, Sweden, Singapore, the United Kingdom, and the United States under noncancelable operating leases with various expiration dates through 2027. During the year ended December 31, 2017, we entered into various new office leases, including
71
a new lease agreement to rent additional office space in Buenos Aires, Argentina and a new lease agreement at 77 Maiden Lane, San Francisco, California to expand our corporate headquarters.
We recognize rent expense on a straight-line basis over the noncancelable lease period and record the difference between cash rent payments and the recognition of rent expense as a deferred rent liability. Where leases contain escalation clauses, rent abatements and/or concessions, such as rent holidays and landlord or tenant incentives or allowances, we apply them in the determination of straight-line rent expense over the lease period. Rent expense for the years ended December 31, 2017, 2016, and 2015 was $7.6 million, $4.4 million, and $2.9 million, respectively.
Our future minimum lease payments are as follows as of December 31, 2017 (in thousands):
Amount | |||
2018 | $ | 9,212 | |
2019 | 7,585 | ||
2020 | 6,999 | ||
2021 | 5,107 | ||
2022 | 1,546 | ||
Thereafter | 3,239 | ||
Total future minimum lease payments | $ | 33,688 | |
Purchase Obligation
In October 2016, we entered into an addendum to an agreement with our cloud infrastructure provider, AWS, for a two-year period ending in September 2018. In connection with the addendum, we must incur charges of at least $1.4 million each quarter and $9.0 million in each contract year.
Litigation
We are involved from time to time in claims that arise in the normal course of business. While it is not feasible to predict or determine the ultimate outcome of these matters, we are not currently subject to any proceeding that we believe is required to be accrued for in our consolidated financial position or consolidated results of operations.
Indemnification Arrangements
In the ordinary course of business, we enter into contractual arrangements under which we agree to provide indemnification of varying scope and terms to customers, business partners and other parties with respect to certain matters, including, losses arising out of the breach of such agreements, intellectual property infringement claims made by third parties, and other liabilities with respect to our products and services and its business. In these circumstances, payment may be conditional on the other party making a claim pursuant to the procedures specified in the particular contract.
We include service level commitments to our cloud customers warranting certain levels of uptime reliability and performance and permitting those customers to receive credits in the event that we fail to meet those levels. To date, we have not incurred any material costs as a result of these commitments and we expect the time between any potential claims and issuance of the credits to be short. As a result, we have not accrued any liabilities related to these commitments in our consolidated financial statements.
In addition, we have indemnification agreements with our directors and our executive officers that require us, among other things, to indemnify them against certain liabilities that may arise by reason of their status or service as directors or officers.
7. Stockholders’ Equity
Convertible Preferred Stock
72
Immediately prior to the completion of the initial public offering, all shares of convertible preferred stock were automatically converted into 86,030,961 shares of common stock on a one to one basis and reclassified as shares of Class B common stock.
Convertible preferred stock as of December 31, 2016 consisted of the following (in thousands, except share and per share amounts):
Convertible Preferred Stock | Date Issued | Original Issue Price | Shares Authorized | Shares Issued and Outstanding | Liquidation Preference | Net Proceeds after Issuance Costs | Dividend Rate Per Share | |||||||||||||||||
Series A | August 2006 | $ | 0.23 | 17,914,408 | 13,683,099 | $ | 3,093 | $ | 3,058 | $ | 0.02 | |||||||||||||
Series B | May 2007 | 0.76 | 16,400,000 | 16,366,080 | 12,500 | 12,420 | 0.06 | |||||||||||||||||
Series C | March 2010 | 0.78 | 15,484,092 | 15,484,092 | 12,000 | 11,901 | 0.06 | |||||||||||||||||
Series D | February 2012 | 1.58 | 9,481,804 | 9,481,804 | 15,000 | 14,944 | 0.13 | |||||||||||||||||
Series E | February and March 2013 | 3.12 | 11,851,905 | 11,851,905 | 37,000 | 36,882 | 0.25 | |||||||||||||||||
Series F | March 2014 | 6.53 | 7,736,448 | 7,736,448 | 50,550 | 50,415 | 0.52 | |||||||||||||||||
Series G | May 2015 | 11.23 | 11,427,533 | 11,427,533 | 128,300 | 126,326 | 0.90 | |||||||||||||||||
90,296,190 | 86,030,961 | $ | 258,443 | $ | 255,946 | |||||||||||||||||||
Warrants
On March 5, 2008, in conjunction with equipment financing, we issued a warrant in favor of Comerica Bank N.A. In April 2017, we issued and sold to Comerica Bank N.A. an aggregate of 19,640 shares of our Class B common stock upon the net exercise of the warrant with an aggregate exercise price of $15,000.
Common Stock
As of December 31, 2017, there were 84,499,298 shares of Class A common stock and 46,838,469 shares of Class B common stock outstanding. The rights of the holders of Class A common stock and Class B common stock are identical, except with respect to voting and conversion. Each share of Class A common stock is entitled to one vote per share and each share of Class B common stock is entitled to ten votes per share. Each share of Class B common stock can be converted into a share of Class A common stock at any time at the option of the holder. All of our Class B common stock will convert to Class A shares upon the date, or happening of an event, specified by affirmative vote of the holders of at least 66-2/3% of then outstanding Class B common stock. All outstanding shares of Class B common stock will automatically convert into Class A common stock on the earlier of (i) the five-year anniversary of the completion of the IPO or (ii) when the outstanding shares of Class B common stock represent less than 15% of our total outstanding capital stock. Once transferred and converted into a share of our Class A common stock, the converted share of our Class B common stock will not be reissued. In addition, following the conversion of all outstanding shares of our Class B common stock into Class A common stock, no further shares of our Class B common stock will be issued.
The holders of common stock are also entitled to receive dividends whenever funds are legally available and when declared by the Board of Directors, subject to the prior rights of holders of all classes of stock outstanding having priority rights as to dividends. No dividends have been declared by the Board of Directors from inception through December 31, 2017.
73
2015 Common Stock Repurchase
In 2015, in connection with the Series G convertible preferred stock financing, we offered to purchase from eligible stockholders shares of our common stock at a specified purchase price, in cash, without interest and less any option exercise price and applicable withholding taxes (the "2015 Common Stock Repurchase"). To participate in the 2015 Common Stock Repurchase, an employee, executive, or member of our Board of Directors must have been with us for a minimum of a year, be a resident of Argentina, Australia, Germany, Singapore, the United Kingdom, or the United States, and hold shares of vested common stock and/or vested options to purchase shares of common stock. An eligible employee who participated in the offer could sell up to 25% of their total vested holdings. An eligible executive who participated in the offer could elect sell up to 20% of their total vested holdings. The agreed upon purchase price was $11.23 per share, which was above the fair value price of $7.14 per share. The total number of repurchased shares was 2,224,222 for a total purchase price of $25 million. The price paid up to the fair value of our common stock of $15.9 million was accounted for as a reduction to equity. The premium that we paid over the fair value of the shares, totaling $9.1 million, was recorded as other compensation expense.
2016 Common Stock Repurchase
In 2016, we exercised our right of first refusal to repurchase 339,285 shares of our common stock from former employees for $3.7 million in cash, which included $0.5 million paid in excess of the fair value. The shares have been retired.
2016 Tender Offer
In July 2016, we announced a tender offer (the "2016 Tender Offer") to our employees, executives, members of the Board of Directors and preferred stockholders whereby eligible participants may sell their shares of our common stock to third party investors. The agreed-upon sale price was $14.18 per share, which was higher than the fair value of our common stock of $9.72 per share. To participate in the 2016 Tender Offer, an employee, executive, or member of the Board of Directors must have been with us for a minimum of a year, be a resident of Argentina, Australia, Germany, Hong Kong, the Netherlands, Singapore, the United Kingdom, or the United States, and hold shares of vested common stock and/or vested options to purchase shares of common stock. Preferred stockholders were also eligible to participate subject to the same criteria with the exception of the one-year service requirement. An eligible employee who participated in the offer could elect to sell up to 25% of their total vested holdings. An eligible executive, other than the Chief Executive Officer (“CEO”) or founder, eligible member of the Board of Directors, or preferred stockholder who participated in the offer could elect to sell up to 20% of their total vested holdings. The CEO or eligible founder could sell up to 10% of their total vested holdings. Any vested stock options or preferred stock sold as part of the 2016 Tender Offer were first exercised or converted into shares of our common stock based on their original terms and the common stock was subsequently sold to the investors. The total number of tendered shares was 4,346,203 for a total purchase price of $61.6 million. The premium that was paid by the third parties over the fair value of the shares, totaling $9.9 million, was recorded as other compensation expense. The excess of the sale price of the converted preferred shares over the fair value of our common stock was $9.4 million and was recorded as a deemed dividend within additional paid-in capital.
Other Compensation Expense
Other compensation expense related to the 2015 Common Stock Repurchase and 2016 Tender Offer was as follows (in thousands):
Year Ended December 31, | |||||||||||
2017 | 2016 | 2015 | |||||||||
Cost of subscription and support revenue | $ | — | $ | 24 | $ | 63 | |||||
Cost of professional services and other revenue | — | 108 | 62 | ||||||||
Research and development | — | 1,154 | 1,927 | ||||||||
Sales and marketing | — | 5,928 | 3,343 | ||||||||
General and administrative | — | 2,734 | 3,696 | ||||||||
Total other compensation expense | $ | — | $ | 9,948 | $ | 9,091 | |||||
74
8. Stock Compensation Plans
Equity Incentive Plans
In August 2006, we adopted the 2006 Stock Option Plan (the "2006 Plan"), which was subsequently amended. The exercise price per share of the stock options granted under the Plan was equal to the fair value per share of our common stock on the date of grant. The stock options which have been granted under the 2006 Plan expire ten years from the date of grant and generally vest over a period of four years. The 2006 Plan terminated in 2016 and no further equity awards may be granted under the 2006 Plan.
In May 2016, we adopted the 2016 Stock Option Plan (the "2016 Plan"). The exercise price of options granted under the 2016 Plan was equal to the fair value of our common stock on the date of grant. The stock options which have been granted under the 2016 Plan generally expire ten years from the date of grant and generally vest over a period of four years. The 2016 Plan terminated in connection with the initial public offering in 2017 and no further equity awards may be granted under the 2016 Plan.
In March 2017, our Board of Directors adopted and our stockholders approved our 2017 Equity Incentive Plan (the "2017 Plan"). The 2017 Plan became effective on March 15, 2017. Any shares remaining available for issuance under the 2016 Plan were transferred to the 2017 Plan. Our 2017 Plan provides for the grant of incentive stock options, nonstatutory stock options, stock appreciation rights, restricted stock, restricted stock units, performance units and performance shares to our employees, directors and consultants. The exercise price of options granted under the 2017 Plan must at least be equal to the fair value of our common stock on the date of grant. The stock options which have been granted under the 2017 Plan generally expire ten years from the date of grant and generally vest over a period of four years. The restricted stock units which have been granted under the 2017 Plan generally vest over a period ranging from two to four- years. The number of shares of our Class A common stock available for issuance under our 2017 Plan will include an annual increase on the first day of each year beginning on January 1, 2018, equal to the least of (a) 15,840,000 shares of our Class A common stock; (b) 5% of the outstanding shares of our Class A common stock and Class B common stock as of the last day of the immediately preceding year; or (c) any other amount determined by our Board of Directors.
As of December 31, 2017 and 2016, 15,233,110 and 3,758,287 shares, respectively, were available for issuance under the applicable incentive stock plan.
Stock Options
A summary of our stock option activity under the 2006 Plan, 2016 Plan, and 2017 Plan is as follows:
Options Outstanding | ||||||||||||
Options Outstanding | Weighted- Average Exercise Price | Remaining Contractual Term | Aggregate Intrinsic Value | |||||||||
(Per Share) | (Years) | (In thousands) | ||||||||||
Balance—December 31, 2016 | 21,915,624 | $ | 4.54 | 7.85 | $ | 158,277 | ||||||
Granted | 1,434,985 | 18.39 | ||||||||||
Exercised | (2,958,474 | ) | 2.75 | $ | 51,887 | |||||||
Forfeited and Cancelled | (1,020,911 | ) | 6.78 | |||||||||
Balance—December 31, 2017 | 19,371,224 | $ | 5.72 | 7.21 | $ | 339,826 | ||||||
Exercisable—December 31, 2017 | 10,248,754 | $ | 3.30 | 6.25 | $ | 204,589 | ||||||
Vested and expected to vest— December 31, 2017 | 19,371,224 | $ | 5.72 | 7.21 | $ | 339,826 | ||||||
The total intrinsic value of options exercised was $51.9 million, $34.2 million, and $20.8 million during the years ended December 31, 2017, 2016, and 2015, respectively.
During the years ended December 31, 2017, 2016, and 2015, we granted to our employees stock options to purchase 1,434,985, 8,772,082, and 6,754,311 shares of common stock, respectively, with a weighted-average grant date fair value of $6.77, $3.05, and $1.89 per share, respectively. The fair value of each option grant was estimated on the date of grant using the following assumptions:
75
Year Ended December 31, | |||||
2017 | 2016 | 2015 | |||
Fair value of common stock | $12.53 - 23.73 | $7.06 – 11.76 | $2.60 – 7.93 | ||
Volatility | 31.25% - 34.81% | 34.75% – 35.86% | 35.97% – 46.18% | ||
Risk-free interest rate | 1.8% - 2.3% | 1.3% – 2.2% | 1.4% – 2.0% | ||
Expected term (in years) | 5.6 - 6.5 | 5.9 – 6.2 | 5.5 – 6.6 | ||
Expected dividends | —% | —% | —% | ||
Restricted Stock Units (RSUs):
A summary of our RSU award activity is as follows:
Number of RSUs outstanding | Remaining Contractual Term | Aggregate Intrinsic Value | ||||||
(Years) | (In thousands) | |||||||
Balance—December 31, 2016 | — | |||||||
Granted | 3,372,368 | |||||||
Vested and Released | (70,617 | ) | ||||||
Forfeited | (59,141 | ) | ||||||
Balance—December 31, 2017 | 3,242,610 | 3.37 | $ | 75,423 | ||||
Expected to vest — December 31, 2017 | 3,242,610 | 3.37 | $ | 75,423 | ||||
During the year ended December 31, 2017, we granted to our employees RSUs with a weighted-average grant date fair value of $21.81 per share.We did not grant any RSUs during the years ended December 31, 2016 and 2015. The total fair value of RSUs that vested during the year ended December 31, 2017 was $1.5 million.
Employee Stock Purchase Plan (ESPP)
In March 2017, our Board of Directors adopted and our stockholders approved our 2017 Employee Stock Purchase Plan (the "ESPP"). The ESPP became effective on March 17, 2017, the first trading day after the date our registration statement was declared effective by the SEC. The ESPP provides for 24-month offering periods. The offering periods are scheduled to start on the first trading day on or after May 10 and November 10 (the enrollment date) of each year, except for the first offering period, which commenced on April 1, 2017 and will end on the first trading day on or after May 10, 2019. Each offering period is comprised of four purchase periods of approximately six months in length.
The ESPP permits participants to purchase shares of our Class A common stock through payroll deductions of up to 15% of their eligible compensation. A participant may purchase a maximum of 5,000 shares of our Class A common stock during a purchase period. Amounts deducted and accumulated by the participant are used to purchase shares of our Class A common stock at the end of each six-month purchase period (the purchase date). The purchase price of the shares will be 85% of the lower of the fair market value of our Class A common stock as of the enrollment date or the purchase date. If the fair market value of our Class A common stock on the purchase date is less than the fair value on the enrollment date, participants will automatically be withdrawn from the current offering period following their purchase of shares and will be re-enrolled in a new offering period.
The number of shares of our Class A common stock available for sale under the ESPP will include an annual increase on the first day of each fiscal year beginning in fiscal 2018, equal to the least of (a) 5,070,000 shares of our Class A common stock; (b) 2% of the outstanding shares of our Class A common stock and Class B common stock as of the last day of the immediately preceding year; or (c) such other amount as our Board of Directors may determine. As of December 31, 2017, 2,187,422 shares of our Class A common stock were available to be issued under the ESPP.
Participation in the ESPP began on April 1, 2017. During the year ended December 31, 2017, a total of 352,578 shares were purchased at an average per share price of $14.45.
76
The weighted-average fair value per share of employee stock purchase rights granted during the year ended December 31, 2017 was $10.19, and was estimated on the grant date using the Black-Scholes option valuation model based on the following assumptions: 30.41% - 37.77% volatility, 0.94% - 1.66% risk-free interest rate, 0.50 - 2.10 years expected term and 0% dividend yield.
Stock-based Compensation Expense
Stock-based compensation expense recognized was as follows (in thousands):
Year Ended December 31, | |||||||||||
2017 | 2016 | 2015 | |||||||||
Cost of subscription and support revenue | $ | 945 | $ | 231 | $ | 83 | |||||
Cost of professional services and other revenue | 3,442 | 567 | 262 | ||||||||
Research and development | 6,994 | 1,677 | 579 | ||||||||
Sales and marketing | 12,646 | 2,691 | 1,548 | ||||||||
General and administrative | 4,043 | 1,386 | 846 | ||||||||
Total stock-based compensation expense | $ | 28,070 | $ | 6,552 | $ | 3,318 | |||||
As of December 31, 2017, there was $90.7 million of total unrecognized compensation cost related to nonvested options and RSUs that are expected to vest. The cost is expected to be recognized over a weighted average period of 3.2 years. As of December 31, 2017, total unrecognized compensation cost related to the ESPP was $6.6 million, which will be amortized over a weighted-average period of 1.0 years.
9. Geographic Information
Revenue by country from customers, based on the customer’s shipping address at the time of sale, was as follows (in thousands):
Year Ended December 31, | |||||||||||
2017 | 2016 | 2015 | |||||||||
United States | $ | 182,321 | $ | 116,193 | $ | 69,139 | |||||
United Kingdom | 38,481 | 25,439 | 13,808 | ||||||||
Others | 75,654 | 46,115 | 27,305 | ||||||||
Total revenue | $ | 296,456 | $ | 187,747 | $ | 110,252 | |||||
Long-lived assets by country were as follows (in thousands):
December 31, | |||||||
2017 | 2016 | ||||||
United States | $ | 4,923 | $ | 4,974 | |||
Argentina | 1,935 | 1,784 | |||||
Others | 1,536 | 1,057 | |||||
Total long-lived assets | $ | 8,394 | $ | 7,815 | |||
10. Income Taxes
The provision for income taxes for the years ended December 31, 2017, 2016, and 2015 is related to the profits generated in certain foreign jurisdictions by our consolidated subsidiaries.
The following table presents loss before provision for income taxes as follows (in thousands):
77
Year Ended December 31, | |||||||||||
2017 | 2016 | 2015 | |||||||||
Domestic | $ | (58,569 | ) | $ | (41,915 | ) | $ | (67,484 | ) | ||
Foreign | (19,758 | ) | (6,345 | ) | 2,907 | ||||||
Total loss before provision for income taxes | $ | (78,327 | ) | $ | (48,260 | ) | $ | (64,577 | ) | ||
The provision for income taxes consisted of (in thousands):
Year Ended December 31, | |||||||||||
2017 | 2016 | 2015 | |||||||||
Current: | |||||||||||
Federal | $ | — | $ | — | $ | — | |||||
State | 99 | 14 | 20 | ||||||||
Foreign | 2,288 | 1,410 | 834 | ||||||||
Total current tax expense | 2,387 | 1,424 | 854 | ||||||||
Deferred: | |||||||||||
Federal | (39 | ) | 14 | 14 | |||||||
State | 2 | 2 | 1 | ||||||||
Foreign | (697 | ) | (101 | ) | (7 | ) | |||||
Total deferred tax expense (benefit) | (734 | ) | (85 | ) | 8 | ||||||
Total provision for income taxes | $ | 1,653 | $ | 1,339 | $ | 862 | |||||
The differences in the total provision for (benefit from) income taxes that would result from applying the 34% federal statutory income tax rate to loss before provision for (benefit from) income taxes and the reported provision for (benefit from) income tax were as follows:
Year Ended December 31, | ||||||||
2017 | 2016 | 2015 | ||||||
Tax provision (benefit) at U.S. statutory rate | (34.00 | )% | (34.00 | )% | (34.00 | )% | ||
State income taxes, net of federal benefit | 0.10 | 0.02 | 0.02 | |||||
Foreign income and withholding taxes | 10.59 | 7.17 | (0.31 | ) | ||||
Change in valuation allowance | (8.21 | ) | 24.18 | 1.88 | ||||
Gain from intercompany sale of intellectual property | — | — | 15.80 | |||||
Uncertain tax positions | 0.40 | 0.87 | 17.46 | |||||
Stock-based compensation expense | (3.04 | ) | 6.18 | 0.96 | ||||
Impact of US Tax Reform | 37.51 | — | — | |||||
Other | (1.24 | ) | (1.65 | ) | (0.48 | ) | ||
Provision for income taxes | 2.11 | % | 2.77 | % | 1.33 | % | ||
78
The tax effects of temporary differences that give rise to significant components of our deferred tax assets consist of (in thousands):
December 31, | |||||||
2017 | 2016 | ||||||
Deferred tax assets: | |||||||
Accruals and reserves | $ | 2,353 | $ | 1,825 | |||
Deferred revenue | 1,411 | 1,408 | |||||
Net operating loss | 50,679 | 48,759 | |||||
Depreciation and amortization | 542 | 468 | |||||
Research and development credits and other credits | 6,325 | 4,367 | |||||
Stock-based compensation | 3,381 | 1,170 | |||||
Others | 33 | 22 | |||||
Gross deferred tax assets | 64,724 | 58,019 | |||||
Less valuation allowance | (63,673 | ) | (57,750 | ) | |||
Total deferred tax assets | 1,051 | 269 | |||||
Deferred tax liabilities: | |||||||
Goodwill | (44 | ) | (51 | ) | |||
Gross deferred tax liabilities | (44 | ) | (51 | ) | |||
Net deferred tax assets | $ | 1,007 | $ | 218 | |||
In assessing the realizability of deferred tax assets, we evaluate all available positive and negative evidence by considering whether it is more likely than not that some portion or all of the deferred tax assets will not be recognized. The ultimate realization of deferred tax assets is dependent upon future taxable income, future reversals of existing taxable temporary difference, taxable income in carryback years and tax-planning strategies. We believe it is more likely than not that the deferred tax assets in the U.S. will not be realized; accordingly, a valuation allowance has been established against our U.S. deferred tax assets. The net change in the valuation allowance for the years ended December 31, 2017 and 2016 was an increase of $5.9 million and $3.5 million, respectively.
As of December 31, 2017, we had NOL carryforwards for Federal, California and other state income tax purposes of approximately $231.8 million, $63.1 million, and $88.8 million, respectively, which will begin to expire in the year 2026, 2028, and 2025, respectively, if not utilized. As of December 31, 2016, we had net operating loss (NOL) carryforwards for Federal, California and other state income tax purposes of approximately $181.9 million, $56.9 million and $59.0 million, respectively.
As of December 31, 2017, we had Federal and California research credit carryforward of approximately $4.6 million and $3.9 million, respectively. The Federal research credits will begin to expire in 2030 while the California research credits have no expiration date. In addition, we have California enterprise zone credits of approximately $0.7 million, which begin to expire in the year 2023 if not utilized.
Generally, utilization of the NOL carryforwards and credits may be subject to a substantial annual limitation due to the ownership change limitations provided by Section 382, which discusses limitations on NOL carryforwards and certain built-in losses following ownership changes, and Section 383, which discusses, special limitations on certain excess credits, etc., of the Internal Revenue Code (IRC) of 1986, as amended and similar state provisions. Accordingly, our ability to utilize NOL carryforwards may be limited as the result of such an “ownership change”. A formal Section 382 study was performed through October 31, 2015 and concluded that we have undergone two “ownership changes” on August 8, 2006 and March 23, 2010, which resulted in the loss of $0.3 million Federal and $0.3 million California NOL, respectively, before their expiration due to the limitation, which have not been included in the above NOL carryover. A formal Section 382 study was performed through November 30, 2017 and concluded that we did not experience an "ownership change" between November 1, 2015 through November 30, 2017.
On December 22, 2017, the Tax Cuts and Jobs Acts ("the Act") was enacted into law. The new tax legislation contains several key tax provisions including the reduction of the corporate income tax rate to 21%, effective January 1, 2018, as well as a variety of other changes including the limitation of the tax deductibility of interest expense, acceleration of expensing of certain business assets and reductions in the amount of executive pay that could qualify as a tax deduction. Additionally, the Act introduced a territorial-style system for taxing foreign source income of domestic multinational corporations. We have
79
analyzed the potential impacts of the Act and due to the federal rate reduction we are expecting a reduction in our federal deferred tax assets by $29.4 million with an offset to our valuation allowance, which has been reflected in our financial statements for the year ended December 31, 2017. Additionally, on December 22, 2017, the SEC staff issued Staff Accounting Bulletin No. 118 ("SAB 118") to address the application of U.S. GAAP in situations when a registrant does not have the necessary information available, prepared, or analyzed (including computations) in reasonable detail to complete the accounting for certain income tax effects of the Act. We have recognized the tax impacts related to the revaluation of deferred tax assets, offset by the valuation allowance, and included these amounts in our consolidated financial statements for the year ended December 31, 2017, as the information related to the change in tax rate was readily available and analyzed as of year-end.
We continue to evaluate the impacts of the Act as we interpret the legislation, including the newly enacted global intangible low-taxed income ("GILTI") provisions which, effective in 2018, may subject our foreign earnings in the future to a minimum level of tax. Recent FASB guidance indicates that an accounting policy election can allow accounting for GILTI either as part of deferred taxes or as a period cost. Because of the complexities of the new legislation, we have not elected an accounting policy for GILTI at this time.
We have not provided U.S. income taxes for the unremitted earnings of foreign subsidiaries because such earnings are intended to be indefinitely reinvested in the foreign jurisdictions. As of December 31, 2017, we have unremitted earnings from our foreign subsidiaries of $1.0 million. Furthermore, as a result of the Act, we have accumulated deficits such that no US tax is expected to be due upon newly enacted IRC 965. Lastly, given the move to a territorial system beginning in 2018, the Act includes two new U.S. base erosion provisions, GILTI provisions and the base-erosion and anti-abuse tax ("BEAT") provisions. We are not subject to BEAT as we are below the applicable revenue threshold requirement and we do not believe GILTI applies as of December 31, 2017 given our foreign subsidiaries sum to a net loss.
We recognize the tax benefit of an uncertain tax position only if it is more likely than not that the position is sustainable upon examination by the taxing authority, based on the technical merits. We use a two-step approach to recognize and measure uncertain tax positions. During the year ended December 31, 2017, we recorded a tax reserve of $0.6 million as a reduction of the net operating loss and research credit carryover.
The following table summarizes the activity related to our unrecognized benefits (in thousands):
Year Ended December 31, | |||||||
2017 | 2016 | ||||||
Beginning balance | $ | 13,647 | $ | 12,603 | |||
Increases/(Decreases) related to tax positions taken during a prior year | (78 | ) | 531 | ||||
Increases related to tax positions taken during the current year | 655 | 513 | |||||
Decreases related to change in US tax rate | $ | (4,251 | ) | $ | — | ||
Ending balance | $ | 9,973 | $ | 13,647 | |||
At December 31, 2017, the unrecognized tax benefits for uncertain tax positions were offset against the deferred tax assets and would not affect the income tax rate if recognized due to our being in a valuation allowance position. Our policy is to include interest and penalties related to unrecognized tax benefits, if any, within the provision for taxes in the consolidated statements of operations. We did not accrue any interest or penalties for the years ended December 31, 2017 and 2016. We do not have any tax positions for interest or penalties for the years ended December 31, 2017, 2016, and 2015. We do not have any tax positions for which it is reasonably possible that the total amount of gross unrecognized tax benefits will significantly change within 12 months of December 31, 2017.
We file federal, state and foreign income tax returns in jurisdictions with varying statutes of limitations. Due to our NOL carryforwards, our income tax returns generally remain subject to examination by federal and most state tax authorities. In most of our significant foreign jurisdictions, the 2012 through 2017 tax years remain subject to examination by their respective tax authorities.
80
11. Net Loss Per Share Attributable to Common Stockholders
The following table sets forth the calculation of basic and diluted net loss per share attributable to common stockholders during the periods presented (in thousands, except share and per share data):
Year Ended December 31, | |||||||||||
2017 | 2016 | 2015 | |||||||||
Numerator: | |||||||||||
Net loss | $ | (79,980 | ) | $ | (49,599 | ) | $ | (65,439 | ) | ||
Deemed dividend to preferred stockholders from the 2016 Tender Offer | — | (9,436 | ) | — | |||||||
Net loss attributable to common stockholders | $ | (79,980 | ) | $ | (59,035 | ) | $ | (65,439 | ) | ||
Denominator: | |||||||||||
Weighted-average shares used in computing net loss attributable to common stockholders, basic and diluted | 106,742,923 | 21,623,610 | 18,324,048 | ||||||||
Net loss per share attributable to common stockholders, basic and diluted | $ | (0.75 | ) | $ | (2.73 | ) | $ | (3.57 | ) | ||
The following outstanding shares of common stock equivalents were excluded from the computation of the diluted net loss per share attributable to common stockholders for the periods presented because their effect would have been anti-dilutive:
As of December 31, | ||||||||
2017 | 2016 | 2015 | ||||||
Convertible preferred stock on an as-if converted basis | — | 86,030,961 | 90,262,270 | |||||
Stock options to purchase common stock | 19,371,224 | 21,915,624 | 19,090,117 | |||||
RSUs issued and outstanding | 3,242,610 | — | — | |||||
Common stock reserved for issuance under 2017 ESPP | 1,150,455 | — | — | |||||
Convertible preferred stock warrants | — | 19,640 | 19,640 | |||||
Total | 23,764,289 | 107,966,225 | 109,372,027 | |||||
Item 9. Changes in and Disagreements with Accountants on Accounting and Financial Disclosure
None.
Item 9A. Controls and Procedures
Evaluation of Disclosure Controls and Procedures
Our management, with the participation of our Chief Executive Officer and our Chief Financial Officer, have evaluated our disclosure controls and procedures (as defined in Rules 13a-15(e) and 15d-15(e) under Exchange Act) as of the end of the period covered by this Annual Report on Form 10-K. Based on that evaluation, our Chief Executive Officer and our Chief Financial Officer have concluded that, as of the end of the period covered by this Annual Report on Form 10-K, our disclosure controls and procedures are designed at a reasonable assurance level and are effective to provide reasonable assurance that information we are required to disclose in reports that we file or submit under the Exchange Act is recorded, processed, summarized, and reported within the time periods specified in SEC rules and forms, and that such information is accumulated and communicated to our management, including our Chief Executive Officer and Chief Financial Officer, as appropriate, to allow timely decisions regarding required disclosure.
Management's Annual Report on Internal Control Over Financial Reporting
This Annual Report on Form 10-K does not include a report of management's assessment regarding internal control over financial reporting or an attestation report of our registered public accounting firm as permitted in this transition period under the rules of the SEC for newly public companies.
Changes in Internal Control over Financial Reporting
81
There were no changes in our internal control over financial reporting identified in connection with the evaluation required by Rule 13a-15(d) and 15d-15(d) of the Exchange Act during the three months ended December 31, 2017 that have materially affected, or are reasonably likely to materially affect, our internal control over financial reporting.
Inherent Limitations on Effectiveness of Controls
The effectiveness of any system of internal control over financial reporting, including ours, is subject to inherent limitations, including the exercise of judgment in designing, implementing, operating, and evaluating the controls and procedures, and the inability to eliminate misconduct completely. Accordingly, any system of internal control over financial reporting, including ours, no matter how well designed and operated, can only provide reasonable, not absolute assurances. In addition, projections of any evaluation of effectiveness to future periods are subject to the risk that controls may become inadequate because of changes in conditions, or that the degree of compliance with the policies or procedures may deteriorate. We intend to continue to monitor and upgrade our internal controls as necessary or appropriate for our business, but cannot assure you that such improvements will be sufficient to provide us with effective internal control over financial reporting.
Item 9B. Other Information
None.
PART III
Item 10. Directors, Executive Officers and Corporate Governance
The information required by this item will be contained in our definitive proxy statement to be filed with the Securities and Exchange Commission in connection with our 2017 annual meeting of stockholders (the “Proxy Statement”), which is expected to be filed not later than 120 days after the end of our fiscal year ended December 31, 2017, and is incorporated in this report by reference.
Code of Business Conduct and Ethics
Our board of directors has adopted a code of business conduct and ethics that applies to all of our employees, officers and directors, including our Chief Executive Officer, Chief Financial Officer and other executive and senior financial officers. The full text of our code of business conduct and ethics is posted on the investor relations page on our website. We intend to disclose any amendments to our code of business conduct and ethics, or waivers of its requirements, on our website or in filings under the Exchange Act.
Item 11. Executive Compensation
The information required by this item will be set forth in the Proxy Statement and is incorporated herein by reference.
Item 12. Security Ownership of Certain Beneficial Owners and Management and Related Stockholder Matters
The information required by this item will be set forth in the Proxy Statement and is incorporated herein by reference.
Securities Authorized for Issuance under Equity Compensation Plans
The information required by this item will be set forth in the Proxy Statement and is incorporated herein by reference.
Item 13. Certain Relationships and Related Transactions, and Director Independence
The information required by this item will be set forth in the Proxy Statement and is incorporated herein by reference.
Item 14. Principal Accountant Fees and Services
For the fiscal years ended December 31, 2017 and 2016, audit fees paid to KPMG LLP for professional audit services rendered to us were $1.4 million and $2.2 million, respectively. Audit fees include fees for (a) professional services rendered for the annual audit of the 2017 and 2016 consolidated financial statements, (b) review of the interim consolidated financial statements and (c) services that are typically provided by an independent registered public accounting firm in connection with
82
statutory and regulatory filings or engagements. No audit related, tax, or other services were rendered to us by KPMG LLP for the fiscal years ended December 31, 2017 and 2016.
PART IV
Item 15. Exhibits and Financial Statement Schedules
Documents filed as part of this Annual Report on Form 10-K are as follows:
1. | Consolidated Financial Statements: Our Consolidated Financial Statements are incorporated by reference to the section titled “Index to Consolidated Financial Statements” Under Part II, Item 8 of this Annual Report on Form 10-K. |
2. | Financial Statement Schedules: Financial statement schedules not listed have been omitted because they are not applicable or the required information is shown in the Consolidated Financial Statements or Notes thereto. |
3. | Exhibits: The documents listed in the Exhibit Index of this report are incorporated by reference or are filed with Annual Report on Form 10-K. |
Item 16. 10-K Summary
None.
83
EXHIBIT INDEX
Incorporated by Reference | |||||||||||
Exhibit Number | Description | Form | File No. | Exhibit | Filing Date | ||||||
Amended and Restated Certificate of Incorporation of the Registrant. | 10-Q | 001-38031 | 3.1 | 5/10/2017 | |||||||
Amended and Restated Bylaws of the Registrant. | S-1/A | 333-216130 | 3.4 | 3/6/2017 | |||||||
Form of common stock certificate of the Registrant | S-1/A | 333-216130 | 4.1 | 3/6/2017 | |||||||
Form of Indemnification Agreement between the Registrant and each of its directors and executive officers. | S-1 | 333-216130 | 10.1 | 2/17/2017 | |||||||
MuleSoft, Inc. 2017 Equity Incentive Plan and related form agreements. | S-1/A | 333-216130 | 10.2 | 3/6/2017 | |||||||
Amended and Restated MuleSoft, Inc. 2017 Employee Stock Purchase Plan and related form agreements. | |||||||||||
MuleSoft, Inc. Executive Incentive Compensation Plan. | S-1 | 333-216130 | 10.6 | 2/17/2017 | |||||||
MuleSoft, Inc. Severance Policy. | S-1 | 333-216130 | 10.7 | 2/17/2017 | |||||||
Offer Letter between the Registrant and Greg Schott, dated as of February 17, 2017. | S-1 | 333-216130 | 10.8 | 2/17/2017 | |||||||
Offer Letter between the Registrant and Mark Dao, dated as of February 17, 2017. | S-1 | 333-216130 | 10.9 | 2/17/2017 | |||||||
Offer Letter between the Registrant and Rob Horton, dated as of February 17, 2017. | S-1 | 333-216130 | 10.10 | 2/17/2017 | |||||||
Offer Letter between the Registrant and Matt Langdon, dated as of February 17, 2017. | S-1 | 333-216130 | 10.11 | 2/17/2017 | |||||||
Offer Letter between the Registrant and Simon Parmett, dated as of February 17, 2017. | S-1 | 333-216130 | 10.12 | 2/17/2017 | |||||||
Sixth Amended and Restated Investors’ Rights Agreement among the Registrant and certain holders of its capital stock, dated as of May 13, 2015. | S-1 | 333-216130 | 10.16 | 2/17/2017 | |||||||
84
Lease between G&G Partners, L.P. and the Registrant, dated as of March 13, 2012, as amended. | S-1 | 333-216130 | 10.18 | 2/17/2017 | |||||||
Lease Agreement between Landmark Investors S.R.L and MuleSoft Argentina S.R.L., dated as of August 1, 2016, as amended. | S-1 | 333-216130 | 10.19 | 2/17/2017 | |||||||
MuleSoft, Inc. Outside Director Compensation Policy. | S-1/A | 333-216130 | 10.20 | 3/6/2017 | |||||||
List of significant subsidiaries of the Registrant | |||||||||||
Consent of KPMG LLP, Independent Registered Public Accounting Firm | |||||||||||
Power of Attorney (incorporated by reference from the signature page of this Annual Report on Form 10-K) | |||||||||||
Certification of Principal Executive Officer Pursuant to Rules 13a-14(a) and 15d-14(a) under the Securities Exchange Act of 1934, as Adopted Pursuant to Section 302 of the Sarbanes-Oxley Act of 2002. | |||||||||||
Certification of Principal Financial Officer Pursuant to Rules 13a-14(a) and 15d-14(a) under the Securities Exchange Act of 1934, as Adopted Pursuant to Section 302 of the Sarbanes-Oxley Act of 2002. | |||||||||||
Certification of Principal Executive Officer Pursuant to 18 U.S.C. Section 1350, as Adopted Pursuant to Section 906 of the Sarbanes-Oxley Act of 2002. | |||||||||||
Certification of Principal Financial Officer Pursuant to 18 U.S.C. Section 1350, as Adopted Pursuant to Section 906 of the Sarbanes-Oxley Act of 2002. | |||||||||||
101.INS | XBRL Instance Document | ||||||||||
101.SCH | XBRL Taxonomy Extension Schema Document | ||||||||||
101.CAL | XBRL Taxonomy Extension Calculation Linkbase Document | ||||||||||
101.DEF | XBRL Taxonomy Extension Definition Linkbase Document | ||||||||||
101.LAB | XBRL Taxonomy Extension Label Linkbase Document | ||||||||||
101.PRE | XBRL Taxonomy Extension Presentation Linkbase Document | ||||||||||
* | Furnished herewith. The certifications attached as Exhibit 32.1 and Exhibit 32.2 that accompany this Annual Report on Form 10-K are deemed furnished and not filed with the Securities and Exchange Commission and are not to be incorporated by reference into any filing of MuleSoft, Inc. under the Securities Act of 1933, as amended, or the Securities Exchange Act of 1934, as amended, whether made before or after the date of this Annual Report on Form 10-K, irrespective of any general incorporation language contained in such filing. |
85
SIGNATURES
Pursuant to the requirements of Section 13 or 15(d) of the Securities Exchange Act of 1934, the registrant has duly caused this report to be signed on its behalf by the undersigned thereunto duly authorized.
Dated: February 22, 2018
MULESOFT, INC. | |
By: | /s/ Greg Schott |
Greg Schott | |
Chairman and Chief Executive Officer | |
POWER OF ATTORNEY
KNOW ALL BY THESE PRESENTS, that each person whose signature appears below constitutes and appoints Greg Schott, Matt Langdon, and Rob Horton, and each of them, as his or her true and lawful attorneys-in-fact and agents, each with the full power of substitution, for him or her and in his or her name, place or stead, in any and all capacities, to sign any and all amendments to this report, and to file the same, with exhibits thereto and other documents in connection therewith, with the Securities and Exchange Commission, granting unto said attorneys-in-fact and agents, and each of them, full power and authority to do and perform each and every act and thing requisite and necessary to be done in and about the premises, as fully to all intents and purposes as he or she might or could do in person, hereby ratifying and confirming all that said attorneys-in-fact and agents, or their or his or her substitute or substitutes, may lawfully do or cause to be done by virtue hereof.
Signature | Title | Date | ||
/s/ Greg Schott | Chairman and Chief Executive Officer | February 22, 2018 | ||
Greg Schott | (Principal Executive Officer) | |||
/s/ Matt Langdon | Chief Financial Officer | February 22, 2018 | ||
Matt Langdon | (Principal Accounting and Financial Officer) | |||
/s/ Mark Burton | Director | February 22, 2018 | ||
Mark Burton | ||||
/s/ Michael Capellas | Director | February 22, 2018 | ||
Michael Capellas | ||||
/s/ Steven Collins | Director | February 22, 2018 | ||
Steven Collins | ||||
86
/s/ Gary Little | Director | February 22, 2018 | ||
Gary Little | ||||
/s/ Ravi Mhatre | Director | February 22, 2018 | ||
Ravi Mhatre | ||||
/s/ Marcus Ryu | Director | February 22, 2018 | ||
Marcus Ryu | ||||
/s/ Yvonne Wassenaar | Director | February 22, 2018 | ||
Yvonne Wassenaar | ||||
/s/ Ann Winblad | Director | February 22, 2018 | ||
Ann Winblad | ||||
87