Attached files
| file | filename |
|---|---|
| 8-K - FORM 8-K - Stagwell Inc | tv486541_8-k.htm |
| EX-99.1 - EXHIBIT 99.1 - Stagwell Inc | tv486541_ex99-1.htm |
Exhibit 99.2

February 22, 2018 Management Presentation Fourth Quarter 2017 Results

1 FORWARD LOOKING STATEMENTS & OTHER INFORMATION This presentation, including our “ 2018 Financial Outlook”, contains forward - looking statements . The Company’s representatives may also make forward - looking statements orally from time to time . Statements in this presentation that are not historical facts, including statements about the Company’s beliefs and expectations, earnings guidance, recent business and economic trends, potential acquisitions, and estimates of amounts for redeemable noncontrolling interests and deferred acquisition consideration, constitute forward - looking statements . These statements are based on current plans, estimates and projections, and are subject to change based on a number of factors, including those outlined below . Forward - looking statements speak only as of the date they are made, and the Company undertakes no obligation to update publicly any of them in light of new information or future events, if any . Forward - looking statements involve inherent risks and uncertainties . A number of important factors could cause actual results to differ materially from those contained in any forward - looking statements . Such risk factors include, but are not limited to, the following : • risks associated with severe effects of international, national and regional economic conditions ; • the Company’s ability to attract new clients and retain existing clients; • the spending patterns and financial success of the Company’s clients; • the Company’s ability to retain and attract key employees; • the Company’s ability to remain in compliance with its debt agreements and the Company’s ability to finance its contingent pa yme nt obligations when due and payable, including but not limited to those relating to redeemable noncontrolling interests and deferred acquisition consideration; • the successful completion and integration of acquisitions which compliment and expand the Company’s business capabilities; • foreign currency fluctuations; and • risks associated with the ongoing Canadian class litigation claim. The Company’s business strategy includes ongoing efforts to engage in acquisitions of ownership interests in entities in the marketing communications services industry . The Company intends to finance these acquisitions by using available cash from operations and through incurrence of bridge or other debt financing, either of which may increase the Company’s leverage ratios, or by issuing equity, which may have a dilutive impact on existing shareholders proportionate ownership . At any given time the Company may be engaged in a number of discussions that may result in one or more acquisitions . These opportunities require confidentiality and may involve negotiations that require quick responses by the Company . Although there is uncertainty that any of these discussions will result in definitive agreements or the completion of any transactions, the announcement of any such transaction may lead to increased volatility in the trading price of the Company’s securities . Investors should carefully consider these risk factors and the additional risk factors outlined in more detail in the Annual Report on Form 10 - K under the caption “Risk Factors” and in the Company’s other SEC filings .

2 SUMMARY » Year of significant progress operationally and financially – delivered on key targets with industry - leading performance » Best - in - class organic revenue growth with broad - based gains across agencies, in key verticals such as CPG, and continued double - digit growth internationally » Increases in Adjusted EBITDA and Adjusted EBITDA margin driven by: growth of business; yields from investments made in emerging areas such as international and data analytics; leveraging cost structure » Superior industry recognition… Assembly named “Media Agency of the Year”; Anomaly and 72andSunny earned spots on the A - List; CP+B recognized as an “Agency Standout” » Deferred acquisition consideration liability and noncontrolling interests at new 6 ½ year low » Strengthened financial position, including reduction of net leverage by 1.0x turns on a net debt/Adjusted EBITDA basis to 4.2x Note: See appendix for definitions of non - GAAP measures

3 » Revenue increased 3.2% to $402.7 million from $390.4 million » Organic revenue growth of 3.3%, including a 50 basis points benefit from increased billable pass - through costs » Net income attributable to MDC Partners common shareholders increased to $220.7 million from $9.1 million last year 1 » Net income benefitted by a combined $206 million of non - cash tax - related benefits as a result of enactment of the Tax Cuts and Jobs Act of 2017 and reversal of the remainder of our U.S. valuation allowance that was not reversed as part of tax reform » Adjusted EBITDA increased 19.9% to $66.8 million from $55.7 million, with margins expanding 230 basis points to 16.6% » Net new business wins of $10.2 million FOURTH QUARTER 2017 FINANCIAL HIGHLIGHTS 1 Revised due to the correction of prior period financial statements relating to the Company’s deferred tax liability and incom e t ax expense. Note: See appendix for definitions of non - GAAP measures

4 » Revenue increased 9.2% to $1.51 billion from $1.39 billion » Organic revenue growth of 7.0%, including a 160 basis points benefit from increased billable pass - through costs » Net income attributable to MDC Partners common shareholders increased to $235.5 million from a loss of ($45.8) million last year 1 » Net income benefitted by a combined $206 million of non - cash tax - related benefits as a result of enactment of the Tax Cuts and Jobs Act of 2017 and reversal of the remainder of our U.S. valuation allowance that was not reversed as part of tax reform » Adjusted EBITDA increased 15.2% to $203.5 million from $176.7 million, with margins expanding 60 basis points to 13.4% » Net new business wins of $87.4 million FULL YEAR FINANCIAL HIGHLIGHTS 1 Revised due to the correction of prior period financial statements relating to the Company’s deferred tax liability and incom e t ax expense. Note: See appendix for definitions of non - GAAP measures

5 CONSOLIDATED REVENUE AND EARNINGS 1 Revised due to the correction of prior period financial statements relating to the Company’s deferred tax liability and incom e t ax expense. Note: Actuals may not foot due to rounding. (US$ in millions, except percentages) 2017 2016 (1) 2017 (1) 2016 (1) Revenue 402.7$ 390.4$ 3.2 % 1,513.8$ 1,385.8$ 9.2 % Operating expenses Cost of services sold 268.7 260.2 3.3 % 1,023.5 936.1 9.3 % Office and general expenses 59.1 72.4 (18.3) % 310.5 306.3 1.4 % Depreciation and amortization 10.6 12.4 (14.7) % 43.5 46.4 (6.4) % Goodwill impairment and other asset impairment 4.4 18.9 (76.6) % 4.4 48.5 (90.9) % Operating profit 60.0 26.6 125.7 % 132.0 48.4 172.5 % Other, net 1.7 (9.3) 19.5 0.2 Interest expense and finance charges (16.3) (16.6) (65.1) (65.9) Loss on redemption of notes - - - (33.3) Interest income 0.2 0.2 0.8 0.8 Income tax benefit 185.7 10.6 168.1 9.4 Equity (loss) in earnings of non-consolidated affiliates 0.2 (0.3) 2.1 (0.3) Net income (loss) 231.5 11.1 257.2 (40.6) Net income attributable to non-controlling interests (8.8) (2.0) (15.4) (5.2) Accretion on convertible preference shares (2.0) - (6.4) - Net income (loss) attributable to MDC Partners Inc. common shareholders 220.7$ 9.1$ 235.5$ (45.8)$ % Change Three Months Ended December 31, Twelve Months Ended December 31, % Change

6 » Organic revenue growth of 7.0% for the full year, favorably impacted by 160 basis points from increased billable pass - through costs incurred on clients’ behalf REVENUE SUMMARY 1 Non - GAAP Acquisitions (Dispositions), net consists of $6.1 million of Dispositions for the three months ended December 31, 2017, and $41.0 million of Acquisitions and $10.6 million of Dispositions for the twelve months ended December 31, 2017. Note: Actuals may not foot due to rounding. (US$ in millions, except percentages) Revenue $ % Change Revenue $ % Change December 31, 2016 $390.4 $1,385.8 Organic Revenue Growth (Decline) 12.8 3.3% 96.4 7.0% Non-GAAP Acquisitions (Dispositions), net (1) (6.1) (1.6%) 30.4 2.2% Foreign Exchange impact, net 5.6 1.4% 1.2 0.1% Total Change 12.3 3.2% 128.0 9.2% December 31, 2017 $402.7 $1,513.8 Three Months Ended Twelve Months Ended
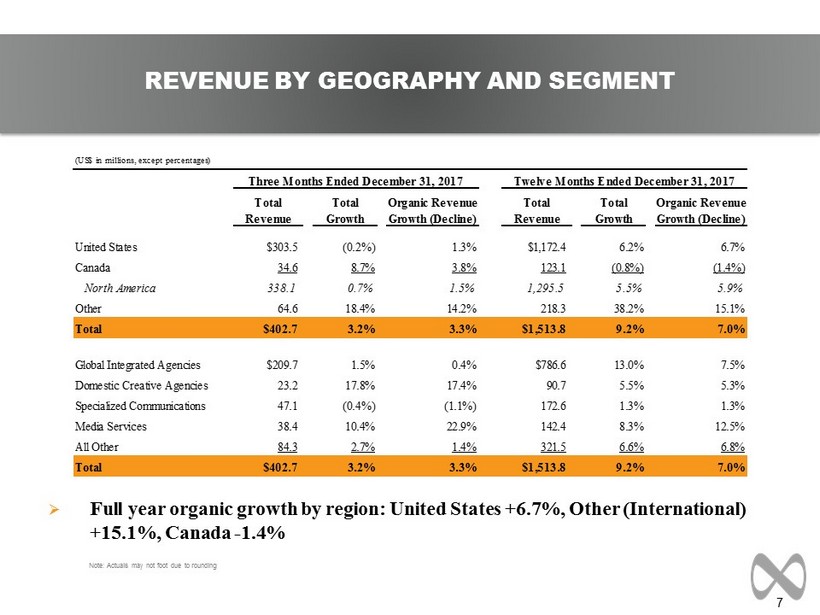
7 REVENUE BY GEOGRAPHY AND SEGMENT » Full year organic growth by region: United States +6.7%, Other (International) +15.1%, Canada - 1.4% Note: Actuals may not foot due to rounding (US$ in millions, except percentages) Total Total Organic Revenue Total Total Organic Revenue Revenue Growth Growth (Decline) Revenue Growth Growth (Decline) United States $303.5 (0.2%) 1.3% $1,172.4 6.2% 6.7% Canada 34.6 8.7% 3.8% 123.1 (0.8%) (1.4%) North America 338.1 0.7% 1.5% 1,295.5 5.5% 5.9% Other 64.6 18.4% 14.2% 218.3 38.2% 15.1% Total $402.7 3.2% 3.3% $1,513.8 9.2% 7.0% Global Integrated Agencies $209.7 1.5% 0.4% $786.6 13.0% 7.5% Domestic Creative Agencies 23.2 17.8% 17.4% 90.7 5.5% 5.3% Specialized Communications 47.1 (0.4%) (1.1%) 172.6 1.3% 1.3% Media Services 38.4 10.4% 22.9% 142.4 8.3% 12.5% All Other 84.3 2.7% 1.4% 321.5 6.6% 6.8% Total $402.7 3.2% 3.3% $1,513.8 9.2% 7.0% Three Months Ended December 31, 2017 Twelve Months Ended December 31, 2017

8 Year - over - Year Growth by Category » Best performing sectors: Communications, Financials, Consumer Products » Top 10 clients increased to 22.9% of revenue vs 22.7% a year ago (largest <4%) REVENUE BY CLIENT INDUSTRY Q4 2017 2017 Above 10% Communications, Financials, Consumer Products Communications, Financials, Food & Beverage, Consumer Products 0% to 10% Healthcare, Food & Beverage Healthcare Below 0% Transportation & Travel, Technology, Automotive, Retail Automotive, Transportation & Travel, Retail, Technology Note: Actuals may not foot due to rounding. Year - over - year category growth shown on a reported basis. Q4 2017 Mix

9 » Margin expansion of 230 basis points in Q4 and 60 basis points for the full year ADJUSTED EBITDA 1 Adjusted EBITDA is a non - GAAP measure. See appendix for the definition. Note: Actuals may not foot due to rounding. (US$ in millions, except percentages) 2017 2016 2017 2016 Advertising and Communications Group 74.2$ 64.6$ 14.9 % 235.9$ 213.5$ 10.5 % Global Integrated Agencies 44.6 35.2 26.5 % 118.5 104.8 13.1 % Domestic Creative Agencies 4.1 2.3 82.4 % 19.6 18.6 5.5 % Specialized Communications 8.0 7.3 10.4 % 28.1 25.9 8.3 % Media Services 3.9 3.7 6.2 % 16.4 12.7 28.6 % All Other 13.5 16.1 (16.2) % 53.3 51.5 3.4 % Corporate Group (7.3) (8.8) (17.1) % (32.4) (36.8) (12.1) % Adjusted EBITDA (1) 66.8$ 55.7$ 19.9 % 203.5$ 176.7$ 15.2 % margin 16.6% 14.3% 13.4% 12.8% % Change Three Months Ended December 31, Twelve Months Ended December 31, % Change

10 SUMMARY OF CASH FLOW Note: Actuals may not foot due to rounding (US$ in millions) 2017 2016 Net cash provided by (used in) operating activities $115.3 ($1.2) Net cash used in investing activities ($20.9) ($25.2) Net cash used in provided by financing activities ($75.4) ($9.3) Effect of exchange rate changes on cash and cash equivalents ($0.8) $2.1 Net increase (decrease) in cash and cash equivalents $18.3 ($33.5) Twelve Months Ended December 31,

11 2018 FINANCIAL OUTLOOK Organic Revenue Adjusted EBITDA Margin Note: The Company has excluded a quantitative reconciliation with respect to the Company’s 2018 guidance under the “unreasona ble efforts” exception in item 10(e)(1)( i )(B) of Regulation S - K. Note: See appendix for definitions of non - GAAP measures approximately 4% growth approximately 20 basis points increase 2018 Guidance

12 APPENDIX
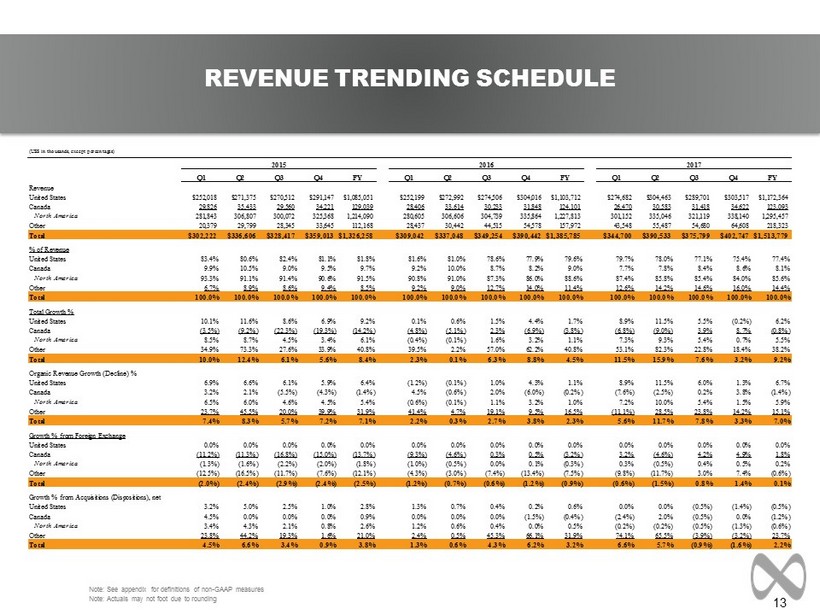
13 REVENUE TRENDING SCHEDULE Note: See appendix for definitions of non - GAAP measures Note: Actuals may not foot due to rounding (US$ in thousands, except percentages) Q1 Q2 Q3 Q4 FY Q1 Q2 Q3 Q4 FY Q1 Q2 Q3 Q4 FY Revenue United States $252,018 $271,375 $270,512 $291,147 $1,085,051 $252,199 $272,992 $274,506 $304,016 $1,103,712 $274,682 $304,463 $289,701 $303,517 $1,172,364 Canada 29,826 35,433 29,560 34,221 129,039 28,406 33,614 30,233 31,848 124,101 26,470 30,583 31,418 34,622 123,093 North America 281,843 306,807 300,072 325,368 1,214,090 280,605 306,606 304,739 335,864 1,227,813 301,152 335,046 321,119 338,140 1,295,457 Other 20,379 29,799 28,345 33,645 112,168 28,437 30,442 44,515 54,578 157,972 43,548 55,487 54,680 64,608 218,323 Total $302,222 $336,606 $328,417 $359,013 $1,326,258 $309,042 $337,048 $349,254 $390,442 $1,385,785 $344,700 $390,533 $375,799 $402,747 $1,513,779 % of Revenue United States 83.4% 80.6% 82.4% 81.1% 81.8% 81.6% 81.0% 78.6% 77.9% 79.6% 79.7% 78.0% 77.1% 75.4% 77.4% Canada 9.9% 10.5% 9.0% 9.5% 9.7% 9.2% 10.0% 8.7% 8.2% 9.0% 7.7% 7.8% 8.4% 8.6% 8.1% North America 93.3% 91.1% 91.4% 90.6% 91.5% 90.8% 91.0% 87.3% 86.0% 88.6% 87.4% 85.8% 85.4% 84.0% 85.6% Other 6.7% 8.9% 8.6% 9.4% 8.5% 9.2% 9.0% 12.7% 14.0% 11.4% 12.6% 14.2% 14.6% 16.0% 14.4% Total 100.0% 100.0% 100.0% 100.0% 100.0% 100.0% 100.0% 100.0% 100.0% 100.0% 100.0% 100.0% 100.0% 100.0% 100.0% Total Growth % United States 10.1% 11.6% 8.6% 6.9% 9.2% 0.1% 0.6% 1.5% 4.4% 1.7% 8.9% 11.5% 5.5% (0.2%) 6.2% Canada (3.5%) (9.2%) (22.3%) (19.3%) (14.2%) (4.8%) (5.1%) 2.3% (6.9%) (3.8%) (6.8%) (9.0%) 3.9% 8.7% (0.8%) North America 8.5% 8.7% 4.5% 3.4% 6.1% (0.4%) (0.1%) 1.6% 3.2% 1.1% 7.3% 9.3% 5.4% 0.7% 5.5% Other 34.9% 73.3% 27.6% 33.9% 40.8% 39.5% 2.2% 57.0% 62.2% 40.8% 53.1% 82.3% 22.8% 18.4% 38.2% Total 10.0% 12.4% 6.1% 5.6% 8.4% 2.3% 0.1% 6.3% 8.8% 4.5% 11.5% 15.9% 7.6% 3.2% 9.2% Organic Revenue Growth (Decline) % United States 6.9% 6.6% 6.1% 5.9% 6.4% (1.2%) (0.1%) 1.0% 4.3% 1.1% 8.9% 11.5% 6.0% 1.3% 6.7% Canada 3.2% 2.1% (5.5%) (4.3%) (1.4%) 4.5% (0.6%) 2.0% (6.0%) (0.2%) (7.6%) (2.5%) 0.2% 3.8% (1.4%) North America 6.5% 6.0% 4.6% 4.5% 5.4% (0.6%) (0.1%) 1.1% 3.2% 1.0% 7.2% 10.0% 5.4% 1.5% 5.9% Other 23.7% 45.5% 20.0% 39.9% 31.9% 41.4% 4.7% 19.1% 9.5% 16.5% (11.1%) 28.5% 23.8% 14.2% 15.1% Total 7.4% 8.3% 5.7% 7.2% 7.1% 2.2% 0.3% 2.7% 3.8% 2.3% 5.6% 11.7% 7.8% 3.3% 7.0% Growth % from Foreign Exchange United States 0.0% 0.0% 0.0% 0.0% 0.0% 0.0% 0.0% 0.0% 0.0% 0.0% 0.0% 0.0% 0.0% 0.0% 0.0% Canada (11.2%) (11.3%) (16.8%) (15.0%) (13.7%) (9.3%) (4.6%) 0.3% 0.5% (3.2%) 3.2% (4.6%) 4.2% 4.9% 1.8% North America (1.3%) (1.6%) (2.2%) (2.0%) (1.8%) (1.0%) (0.5%) 0.0% 0.1% (0.3%) 0.3% (0.5%) 0.4% 0.5% 0.2% Other (12.5%) (16.5%) (11.7%) (7.6%) (12.1%) (4.3%) (3.0%) (7.4%) (13.4%) (7.5%) (9.8%) (11.7%) 3.0% 7.4% (0.6%) Total (2.0%) (2.4%) (2.9%) (2.4%) (2.5%) (1.2%) (0.7%) (0.6%) (1.2%) (0.9%) (0.6%) (1.5%) 0.8% 1.4% 0.1% Growth % from Acquisitions (Dispositions), net United States 3.2% 5.0% 2.5% 1.0% 2.8% 1.3% 0.7% 0.4% 0.2% 0.6% 0.0% 0.0% (0.5%) (1.4%) (0.5%) Canada 4.5% 0.0% 0.0% 0.0% 0.9% 0.0% 0.0% 0.0% (1.5%) (0.4%) (2.4%) 2.0% (0.5%) 0.0% (1.2%) North America 3.4% 4.3% 2.1% 0.8% 2.6% 1.2% 0.6% 0.4% 0.0% 0.5% (0.2%) (0.2%) (0.5%) (1.3%) (0.6%) Other 23.8% 44.2% 19.3% 1.6% 21.0% 2.4% 0.5% 45.3% 66.1% 31.9% 74.1% 65.5% (3.9%) (3.2%) 23.7% Total 4.5% 6.6% 3.4% 0.9% 3.8% 1.3% 0.6% 4.3% 6.2% 3.2% 6.6% 5.7% (0.9%) (1.6%) 2.2% 2015 2016 2017

14 ADJUSTED EBITDA TRENDING SCHEDULE 1 Adjusted EBITDA is a non - GAAP measure. See appendix for the definition 2 Prior to 2017, Adjusted EBITDA included an additional adjustment for acquisition deal costs. Beginning with 2017, on a prospe cti ve basis we no longer include the acquisition deal cost adjustment but we continue to disclose this metric for your reference. Note: Actuals may not foot due to rounding. (US$ in thousands, except percentages) Q1 Q2 Q3 Q4 FY Q1 Q2 Q3 Q4 FY Q1 Q2 Q3 Q4 FY ADVERTISING AND COMMUNICATIONS GROUP Revenue $302,222 $336,606 $328,415 $359,013 $1,326,256 $309,042 $337,047 $349,254 $390,442 $1,385,785 $344,700 $390,532 $375,800 $402,747 $1,513,779 Operating profit (loss) 26,013 54,372 43,419 13,478 137,282 21,678 36,868 (3,700) 37,703 92,549 16,969 36,069 47,944 71,833 172,815 Depreciation and amortization 11,854 13,554 12,749 12,292 50,449 10,823 10,926 11,053 12,059 44,861 10,588 10,467 10,997 10,324 42,376 Goodwill and other asset impairment - - - - - - - 29,631 18,893 48,524 - - - 3,238 3,238 Stock-based compensation 3,500 4,863 2,660 4,033 15,056 3,881 4,880 4,623 5,094 18,478 4,345 5,023 5,903 6,945 22,216 Acquisition deal costs (2) 284 255 108 58 704 65 402 639 31 1,137 - - - - - Deferred acquisition consideration adjustments 2,248 (12,741) 4,927 41,913 36,347 6,327 (299) 11,152 (9,211) 7,969 11,431 4,306 (2,462) (18,173) (4,898) Distributions from non-consolidated affiliates 334 176 67 102 679 - - - - - - 105 - - 105 Adjusted EBITDA (1) $44,233 $60,479 $63,930 $71,876 $240,517 $42,774 $52,777 $53,398 $64,569 $213,518 $43,334 $55,969 $62,382 $74,167 $235,852 CORPORATE GROUP Revenue $0 $0 $0 $0 $0 $0 $0 $0 $0 $0 $0 $0 $0 $0 $0 Operating loss (20,818) (9,890) (19,801) (14,663) (65,172) (13,130) (12,801) (7,051) (11,136) (44,118) (8,570) (9,688) (10,724) (11,874) (40,856) Depreciation and amortization 446 453 337 538 1,774 397 510 359 319 1,585 310 299 255 234 1,098 Goodwill and other asset impairment - - - - - - - - - - - - - 1,177 1,177 Stock-based compensation 945 451 606 738 2,740 804 650 605 466 2,525 605 517 477 535 2,134 Acquisition deal costs (2) 590 587 620 411 2,208 488 505 167 343 1,503 - - - - - Distributions from non-consolidated affiliates 8 112 30 7,122 7,272 - - 1,247 802 2,049 - - 1,118 2,716 3,834 Other items, net 5,762 (4,718) 7,751 (468) 8,327 1,486 252 (2,463) 371 (354) 135 (100) 330 (112) 253 Adjusted EBITDA (1) ($13,067) ($13,005) ($10,457) ($6,322) ($42,851) ($9,955) ($10,884) ($7,136) ($8,835) ($36,810) ($7,521) ($8,971) ($8,544) ($7,324) ($32,360) TOTAL Revenue $302,222 $336,606 $328,415 $359,013 $1,326,256 $309,042 $337,047 $349,254 $390,442 $1,385,785 $344,700 $390,532 $375,800 $402,747 $1,513,779 Operating profit (loss) 5,195 44,482 23,618 (1,185) 72,110 8,548 24,067 (10,751) 26,567 48,431 8,399 26,381 37,220 59,959 131,959 Depreciation and amortization 12,300 14,007 13,086 12,830 52,223 11,220 11,436 11,412 12,378 46,446 10,898 10,766 11,252 10,558 43,474 Goodwill and other asset impairment - - - - - - - 29,631 18,893 48,524 - - - 4,415 4,415 Stock-based compensation 4,445 5,314 3,266 4,771 17,796 4,685 5,530 5,228 5,560 21,003 4,950 5,540 6,380 7,480 24,350 Acquisition deal costs (2) 874 842 728 469 2,912 553 907 806 374 2,640 - - - - - Deferred acquisition consideration adjustments 2,248 (12,741) 4,927 41,913 36,347 6,327 (299) 11,152 (9,211) 7,969 11,431 4,306 (2,462) (18,173) (4,898) Distributions from non-consolidated affiliates 342 288 97 7,224 7,951 - - 1,247 802 2,049 - 105 1,118 2,716 3,939 Other items, net 5,762 (4,718) 7,751 (468) 8,327 1,486 252 (2,463) 371 (354) 135 (100) 330 (112) 253 Adjusted EBITDA (1) $31,166 $47,474 $53,473 $65,554 $197,666 $32,819 $41,893 $46,262 $55,734 $176,708 $35,813 $46,998 $53,838 $66,843 $203,492 2015 2016 2017

15 ACQUISITION REVENUE DETAIL 1 For the twelve months ended December 31, 2017, revenue from acquisitions was comprised of $43.5 million from 2016 acquisition s. 2 Contributions to organic revenue growth (decline) represents the change in revenue, measured on a constant currency basis, re lat ive to the comparable pre - acquisition period for acquired businesses that is included in the Company’s organic revenue growth (decline) calculation. Note: Actuals may not foot due to rounding Reconciliation of Non - GAAP Acquisitions (Dispositions), net to Revenue in the Statement of Operations (US$ in millions) 2015 FY Q1 Q2 Q3 Q4 FY Q1 Q2 Q3 Q4 FY Revenue from acquisitions (dispositions), net (1) 45.8$ 6.6$ 2.8$ 17.1$ 24.7$ 51.1$ 18.6$ 25.0$ -$ -$ 43.5$ Foreign exchange impact 1.3 0.0 0.0 0.1 1.3 1.5 1.0 1.3 - - 2.4 Contribution to organic revenue (growth) decline (2) (0.8) (2.8) (0.9) (3.1) (3.3) (10.1) 1.5 (6.4) - - (4.9) Prior year revenue from dispositions - - - - (0.5) (0.5) (0.7) (0.7) (3.2) (6.1) (10.6) Non-GAAP acquisitions (dispositions), net 46.3$ 3.8$ 1.9$ 14.1$ 22.2$ 42.0$ 20.4$ 19.3$ (3.2)$ (6.1)$ 30.4$ 2016 2017

16 RECONCILIATIONS * GAAP revenue from prior year acquisitions for 2017 and 2016 relates to acquisitions which occurred in 2016 and 2015, respe cti vely. ** Contributions to organic revenue growth (decline) represents the change in revenue, measured on a constant currency basis , r elative to the comparable pre - acquisition period for acquired businesses that is included in the Company's organic revenue growth (decline) calculation *** Prior year revenue from dispositions reflects the incremental impact on revenue for the comparable period after the Comp any 's disposition of such disposed business, plus revenue from each business disposed of by the Company in the previous year through the twelve month anniversary of the disposition. Note: Actuals may not foot due to rounding (US$ in millions) Q1 Q2 Q3 Q4 FY Q1 Q2 Q3 Q4 FY Q1 Q2 Q3 Q4 FY Non-GAAP acquisitions (dispositions), net GAAP revenue from prior year acquisitions * n/a n/a n/a n/a n/a 6,556$ 2,817$ 17,083$ 24,657$ 51,113$ 18,552$ 24,983$ -$ -$ 43,535$ Foreign exchange impact n/a n/a n/a n/a n/a 39 7 113 1,343 1,502 1,046 1,341 - - 2,387 Contribution to organic revenue (growth) decline ** n/a n/a n/a n/a n/a (2,783) (896) (3,142) (3,300) (10,121) 1,470 (6,399) - - (4,929) Prior year revenue from dispositions *** n/a n/a n/a n/a n/a - - - (499) (499) (691) (660) (3,153) (6,103) (10,607) Non-GAAP acquisitions (dispositions), net n/a n/a n/a n/a n/a 3,812$ 1,928$ 14,054$ 22,201$ 41,995$ 20,377$ 19,265$ (3,153)$ (6,103)$ 30,386$ Other items, net SEC investigation and class action litigation expenses 5,762$ 3,882$ 2,722$ 1,340$ 13,706$ 1,486$ 1,359$ 767$ 454$ 4,066$ 339$ 382$ 330$ 287$ 1,338$ SEC final settlement payment - - - - - - - - 1,500 1,500 - - - - - D&O insurance proceeds - - - (1,000) (1,000) - (1,107) (3,230) (1,583) (5,920) (204) (482) - (399) (1,085) CEO repayment for certain perquisites and expenses - (8,600) (1,877) (808) (11,285) - - - - - - - - - - CEO and CAO termination related expenses - - 6,906 - 6,906 - - - - - - - - - - Total other items, net 5,762$ (4,718)$ 7,751$ (468)$ 8,327$ 1,486$ 252$ (2,463)$ 371$ (354)$ 135$ (100)$ 330$ (112)$ 253$ Cash interest, net & other Cash interest paid (367)$ (25,401)$ (590)$ (26,308)$ (52,666)$ (25,703)$ (1,212)$ (1,063)$ (36,692)$ (64,670)$ (999)$ (30,567)$ (758)$ (30,571)$ (62,895)$ Bond interest accrual adjustment (12,403) 12,403 (12,403) 12,403 - 11,995 (15,680) (14,625) 20,800 2,490 (14,625) 14,625 (14,625) 14,625 - Adjusted cash interest paid (12,770) (12,998) (12,993) (13,905) (52,666) (13,708) (16,892) (15,688) (15,892) (62,180) (15,624) (15,942) (15,383) (15,946) (62,895) Interest income 119 105 114 129 467 178 203 218 209 808 227 178 145 209 759 Other - - - - - - - - - - - - - - Total cash interest, net & other (12,651)$ (12,893)$ (12,879)$ (13,776)$ (52,199)$ (13,530)$ (16,689)$ (15,470)$ (15,683)$ (61,372)$ (15,397)$ (15,764)$ (15,238)$ (15,737)$ (62,136)$ Capital expenditures, net Capital expenditures (5,656)$ (3,848)$ (8,161)$ (5,910)$ (23,575)$ (5,539)$ (7,909)$ (6,275)$ (9,709)$ (29,432)$ (9,413)$ (11,743)$ (7,149)$ (4,653)$ (32,958)$ Landlord reimbursements 356 36 1,259 805 2,456 - 871 248 3,651 4,770 75 3,146 1,357 1,858 6,436 Total capital expenditures, net (5,300)$ (3,812)$ (6,902)$ (5,105)$ (21,119)$ (5,539)$ (7,038)$ (6,027)$ (6,058)$ (24,662)$ (9,338)$ (8,597)$ (5,792)$ (2,795)$ (26,522)$ Miscellaneous other disclosures Net income attributable to the noncontrolling interests 2,380$ 2,841$ 2,122$ 1,711$ 9,054$ 859$ 1,254$ 1,059$ 2,046$ 5,218$ 883$ 2,214$ 3,491$ 8,787$ 15,375$ Cash taxes 540$ 175$ 685$ 487$ 1,887$ 143$ 664$ 1,991$ 97$ 2,895$ 1,293$ 2,130$ 3,486$ 1,191$ 8,100$ Acquisition deal costs 874$ 842$ 728$ 469$ 2,913$ 553$ 907$ 806$ 374$ 2,640$ 234$ 242$ 216$ 185$ 877$ 2015 2016 2017

17 AVAILABLE LIQUIDITY 1 1 Subject to available borrowings under the Credit Facility. Note: Actuals may not foot due to rounding (US$ in millions) December 31, 2017 December 31, 2016 Commitment Under Facility $325.0 $325.0 Drawn 0.0 54.4 26.7$ Undrawn Letters of Credit 5.1 4.4 Undrawn Commitments Under Facility $319.9 $266.2 Total Cash & Cash Equivalents 46.2 27.9 Liquidity $366.1 $294.1

18 CURRENT CREDIT PICTURE 1 These ratios and measures are not based on generally accepted accounting principles and are not presented as alternatives mea sur es of operating performance or liquidity. Some of these ratios and measures include, among other things, proforma adjustments for acquisitions, one - time charges, and other items, as defined in the Credit Agreement. They are presented here to demonstrate compliance with the covenants in the Credit Agreement, as non - compliance with such covenants could have a material adverse effect on the Company. 2 Covenant EBITDA is a measure that includes pro forma adjustments for acquisitions, one - time charges, and other items, as defined in the Credit Agreement. 3 Total Senior Leverage is a measure that includes borrowings under the Credit Agreement, outstanding letters of credit, less c ash held in depository accounts, as defined in the Credit Agreement 4 Net Debt is a measure that includes borrowings under the Credit Agreement, the Senior Notes, other outstanding debt and lette rs of credit, less cash held in depository accounts, as defined in the Credit Agreement. Net Debt does not include Deferred Acquisition Consideration with the exception of certain fixed components ($2.9 million as of December 31, 2017 and $2.8 million as of December 31, 2016), and it does not include minority interest. 5 Based on borrowings as of December 31, 2017. Excludes capital leases, other outstanding debt and letters of credit, and Defer red Acquisition Consideration. Note: Actuals may not foot due to rounding Current Debt Maturity Profile (5) $325 million Credit Facility Covenants (1) (US$ in millions) December 31, December 31, 2017 2016 Covenants I. Total Senior Leverage Ratio (0.0) 0.3 Maximum per covenant 2.0 2.0 II. Total Leverage Ratio 4.3 5.0 Maximum per covenant 5.5 5.5 III. Fixed Charges Ratio 2.5 2.0 Minimum per covenant 1.0 1.0 IV. Covenant EBITDA (2) $208.2 $190.4 Minimum per covenant $105.0 $105.0 Debt Calculation Total Senior Leverage, net (3) ($2.4) $53.7 Net Debt (4) $901.2 $956.9 Twelve Months Ended

19 TEMPORAL PUT OBLIGATIONS AND IMPACT ON ADJUSTED EBITDA 1 This amount is in addition to ( i ) $41.7 million of opti ons to purchase only exercisable upon termination not within the control of the Company, or death, and (ii) the excess of the in itial redemption value recorded in Redeemable Noncontrolling Interests over the amount the Company would be required to pay to the holders sho uld the Company acquire the remaining ownership interests. Note: Actuals may not foot due to rounding Incremental (US$ in millions) Cash Stock Total Income in Period 2018 $4.1 $0.0 $4.1 $2.4 2019 2.8 0.1 2.9 0.0 2020 5.0 0.1 5.1 1.5 2021 1.9 0.0 1.9 0.0 Thereafter 1.8 0.0 1.8 0.5 Total $15.6 $0.2 $15.8(1) $4.4 Effective Multiple 3.6x Estimated Put Impact at December 31, 2017 Payment Consideration

20 RECONCILIATION OF ADJUSTED NON - GAAP RESULTS: IMPACT OF TAX ITEMS 1 Reflects a net benefit of $100.5 million as a result of the enactment of the Tax Cuts and Jobs Act, which was comprised of a $34 .1 million net benefit from the remeasurement of deferred tax assets, liabilities and valuation allowance under the new tax rates. In addition, a $66.4 million benefit from the reversal of a valuation allowance was due to favorable tax law changes. 2 Reflects a benefit of $105.5 million from the reversal of a valuation allowance on our remaining deferred tax assets, primari ly based on our current and historical taxable income and our expectations of future taxable income. (US$ in millions) Net Impact of Valuation As Tax Cuts and Allowance Adjusted Reported Jobs Act (1) Reversals (2) Results Three Months Ended December 31, 2017 Income (loss) before income taxes and equity in earnings of non-consolidated affiliates 45.6$ 45.6$ Income tax benefit 185.7 (100.5) (105.5) (20.2) Equity in earnings of non-consolidated affiliates 0.2 0.2 Net income (loss) 231.5 25.5 Net income attributable to the noncontrolling interests (8.8) (8.8) Accretion on convertible preference shares (2.0) (2.0) Net income (loss) attributable to MDC Partners Inc. common shareholders 220.7$ (100.5)$ (105.5)$ 14.7$ Income (loss) per common share - Diluted 3.30$ (1.50)$ (1.58)$ 0.22$ Weighted average number of common shares outstanding - Diluted 56.8 56.8 Twelve Months Ended December 31, 2017 Income (loss) before income taxes and equity in earnings of non-consolidated affiliates 87.1$ 87.1$ Income tax benefit 168.1 (100.5) (105.5) (37.9) Equity in earnings of non-consolidated affiliates 2.1 2.1 Net income (loss) 257.2 51.2 Net income attributable to the noncontrolling interests (15.4) (15.4) Accretion on convertible preference shares (6.4) (6.4) Net income (loss) attributable to MDC Partners Inc. common shareholders 235.5$ (100.5)$ (105.5)$ 29.5$ Income (loss) per common share - Diluted 3.71$ (1.58)$ (1.66)$ 0.46$ Weighted average number of common shares outstanding - Diluted 55.5 55.5
21 DEFINITION OF NON - GAAP MEASURES In addition to its reported results, MDC Partners has included in its earnings release and supplemental management presentati on certain financial results that the Securities and Exchange Commission defines as "non - GAAP financial measures." Management believes that such non - GAAP financial m easures, when read in conjunction with the Company's reported results, can provide useful supplemental information for investors analyzing period t o p eriod comparisons of the Company's results. Such non - GAAP financial measures include the following: Organic Revenue: Organic Revenue: “Organic revenue growth” and “organic revenue decline” refer to the positive or negative results, respective l y, of subtracting both the foreign exchange and acquisition (disposition) components from total revenue growth. The acquisition (disposition) c omp onent is calculated by aggregating prior period revenue for any acquired businesses, less the prior period revenue of any businesses that were dispo sed of during the current period. The organic revenue growth (decline) component reflects the constant currency impact of (a) the change in revenue of the partner fir ms which the Company has held throughout each of the comparable periods presented, and (b) “non - GAAP acquisitions (dispositions), net”. Non - GAAP acquisitions (dispositions), net consists of ( i ) for acquisitions during the current year, the revenue effect from such acquisition as if the acquisition had been owned durin g t he equivalent period in the prior year and (ii) for acquisitions during the previous year, the revenue effect from such acquisitions as if they had been owned durin g t hat entire year (or same period as the current reportable period), taking into account their respective pre - acquisition revenues for the applicable periods, and (iii) for dispositions, the revenue effect from such disposition as if they had been disposed of during the equivalent period in the prior year. Net New Business: Estimate of annualized revenue for new wins less annualized revenue for losses incurred in the period. Adjusted EBITDA: Adjusted EBITDA is a non - GAAP measure that represents operating profit (loss) plus depreciation and amortization, stock - based compensation, deferred acquisition consideration adjustments, distributions from non - consolidated affiliates, and other items. P rior to 2017, Adjusted EBITDA included an additional adjustment for acquisition deal costs. Beginning with 2017, on a prospective basis we no longer includ e t he acquisition deal cost adjustment but we continue to disclose this metric for your reference. Included in the Company’s earnings release and supplemental management presentation are tables reconciling MDC Partners’ repo rte d results to arrive at certain of these non - GAAP financial measures. We are unable to reconcile our projected 2017 organic revenue growth to the corresponding GAAP measure because we are unable to predict the 2017 impact of foreign exchange due to the unpredictability of future changes in foreign exchange r ate s and because we are unable to predict the occurrence or impact of any acquisitions, divestitures or other potential changes. We are unable to reconcile ou r p rojected 2017 increase in Adjusted EBITDA margin to the corresponding GAAP measure because the amount and timing of many future charges that impact these measur es (such as amortization of future acquired intangible assets, foreign exchange transaction gains or losses, impairment charges, and provision or benefit fo r income taxes) are variable, uncertain, or out of our control and therefore cannot be reasonably predicted without unreasonable effort, if at all. As a re sul t, we are unable to provide reconciliations of these measures. In addition, we believe such reconciliations could imply a degree of precision that might be confusing or misleading to investors. Note: A reconciliation of non - GAAP to US GAAP reported results has been provided by the Company in the tables included in the earnings release issued on February 22, 2018.

MDC Partners Innovation Center 745 Fifth Avenue, Floor 19 New York, NY 10151 646 - 429 - 1800 www.mdc - partners.com