Attached files
| file | filename |
|---|---|
| 8-K - FORM 8-K - Gogo Inc. | d543450d8k.htm |
| EX-99.1 - EX-99.1 - Gogo Inc. | d543450dex991.htm |
4th Quarter 2017 Earnings Results Michael Small – Chief Executive Officer John Wade – Chief Operating Officer Barry Rowan – Chief Financial Officer February 22, 2018 Exhibit 99.2
Safe harbor statement Safe Harbor Statement This presentation contains “forward-looking statements” within the meaning of Section 27A of the Securities Act of 1933 and Section 21E of the Securities Exchange Act of 1934 that are based on management’s beliefs and assumptions and on information currently available to management. Most forward-looking statements contain words that identify them as forward-looking, such as “anticipates,” “believes,” “continues,” “could,” “seeks,” “estimates,” “expects,” “intends,” “may,” “plans,” “potential,” “predicts,” “projects,” “should,” “will,” “would” or similar expressions and the negatives of those terms that relate to future events. Forward-looking statements involve known and unknown risks, uncertainties and other factors that may cause Gogo’s actual results, performance or achievements to be materially different from any projected results, performance or achievements expressed or implied by the forward-looking statements. Forward-looking statements represent the beliefs and assumptions of Gogo only as of the date of this presentation and Gogo undertakes no obligation to update or revise publicly any such forward-looking statements, whether as a result of new information, future events or otherwise. As such, Gogo’s future results may vary from any expectations or goals expressed in, or implied by, the forward-looking statements included in this presentation, possibly to a material degree. Gogo cannot assure you that the assumptions made in preparing any of the forward-looking statements will prove accurate or that any long-term financial or operational goals and targets will be realized. In particular, the availability and performance of certain technology solutions yet to be implemented by the Company set forth in this presentation represent aspirational long-term goals based on current expectations. For a discussion of some of the important factors that could cause Gogo’s results to differ materially from those expressed in, or implied by, the forward-looking statements included in this presentation, investors should refer to the disclosures contained under the headings “Risk Factors” and “Cautionary Note Regarding Forward-Looking Statements” in the Company’s Annual Report on Form 10-K and Quarterly Reports on Form 10-Q. Note to Certain Operating and Financial Data In addition to disclosing financial results that are determined in accordance with U.S. generally accepted accounting principles (“GAAP”), Gogo also discloses in this presentation certain non-GAAP financial information, including Adjusted EBITDA, Adjusted EBITDA margin and Cash CAPEX. These financial measures are not recognized measures under GAAP, and when analyzing our performance or liquidity, as applicable, investors should (i) use Adjusted EBITDA and Adjusted EBITDA margin in addition to, and not as an alternative to, net loss attributable to common stock as a measure of operating results, and (ii) use Cash CAPEX in addition to, and not as an alternative to, consolidated capital expenditures when evaluating our liquidity. See the Appendix for a reconciliation of each of Adjusted EBITDA and Cash CAPEX to the comparable GAAP measure. No reconciliation of the forecasted range for Adjusted EBITDA for fiscal 2018 is included in this release because we are unable to quantify certain amounts that would be required to be included in the respective corresponding GAAP measure without unreasonable efforts and we believe such reconciliations would imply a degree of precision that would be confusing or misleading to investors. In particular, we are not able to provide a reconciliation for the forecasted range of Adjusted EBITDA for 2018 due to variability in the timing of aircraft installations and de-installations impacting depreciation expense and amortization of deferred airborne leasing proceeds. In addition, this presentation contains various customer metrics and operating data, including numbers of aircraft or units online, that are based on internal company data, as well as information relating to the commercial and business aviation market, and our position within those markets. While management believes such information and data are reliable, they have not been verified by an independent source and there are inherent challenges and limitations involved in compiling data across various geographies and from various sources.
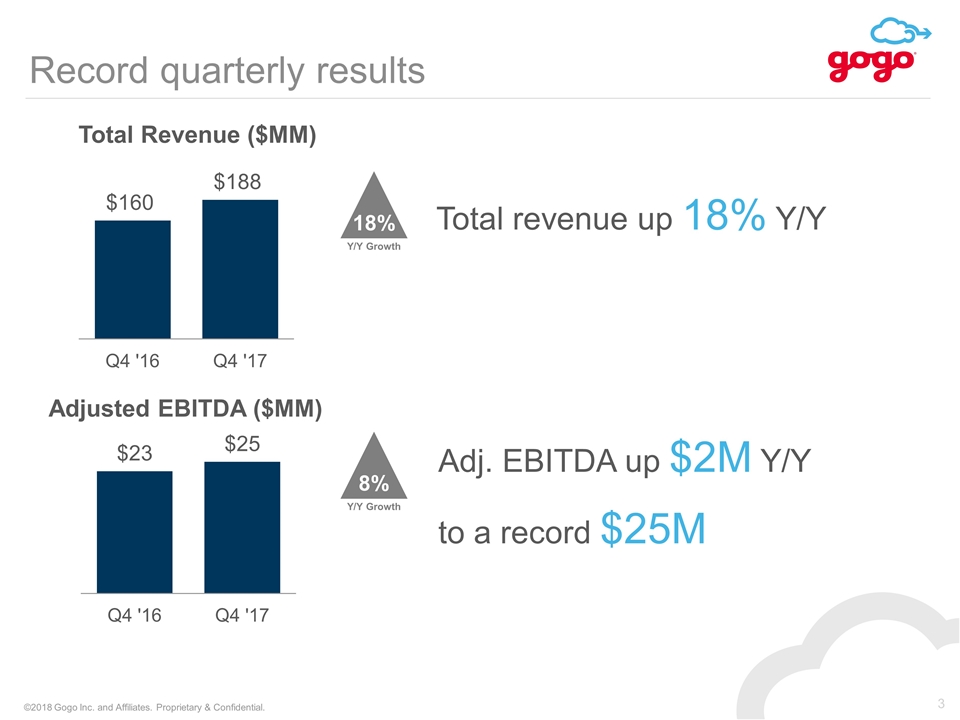
Record quarterly results 18% Y/Y Growth Total Revenue ($MM) Total revenue up 18% Y/Y Adjusted EBITDA ($MM) Adj. EBITDA up $2M Y/Y to a record $25M 8% Y/Y Growth
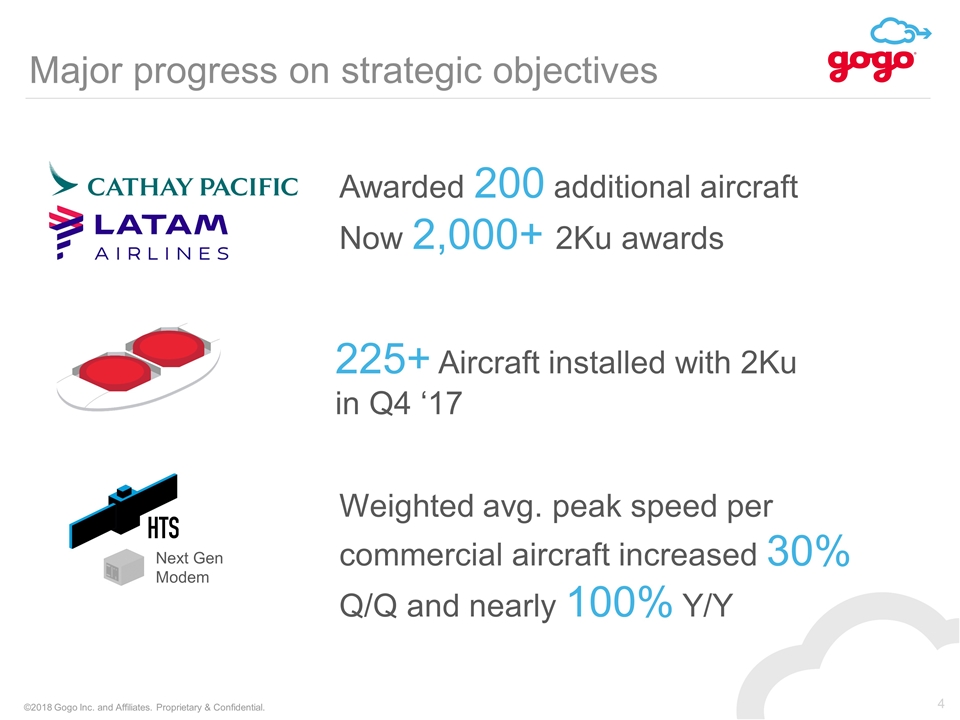
Major progress on strategic objectives 4 Weighted avg. peak speed per commercial aircraft increased 30% Q/Q and nearly 100% Y/Y Awarded 200 additional aircraft Now 2,000+ 2Ku awards 225+ Aircraft installed with 2Ku in Q4 ‘17 Next Gen Modem
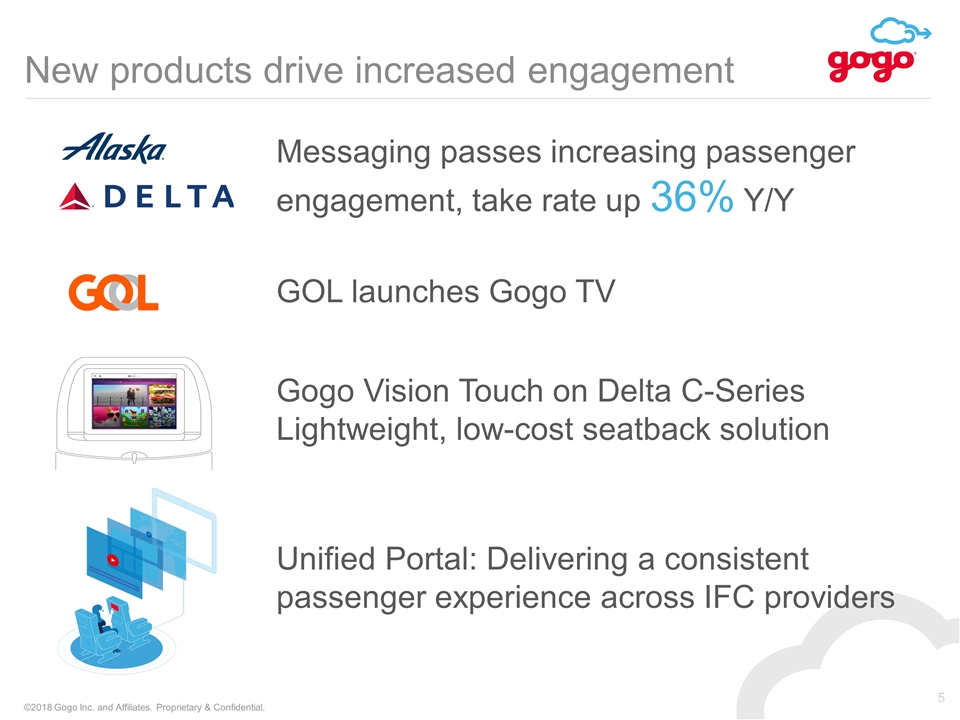
New products drive increased engagement Messaging passes increasing passenger engagement, take rate up 36% Y/Y GOL launches Gogo TV Gogo Vision Touch on Delta C-Series Lightweight, low-cost seatback solution Unified Portal: Delivering a consistent passenger experience across IFC providers
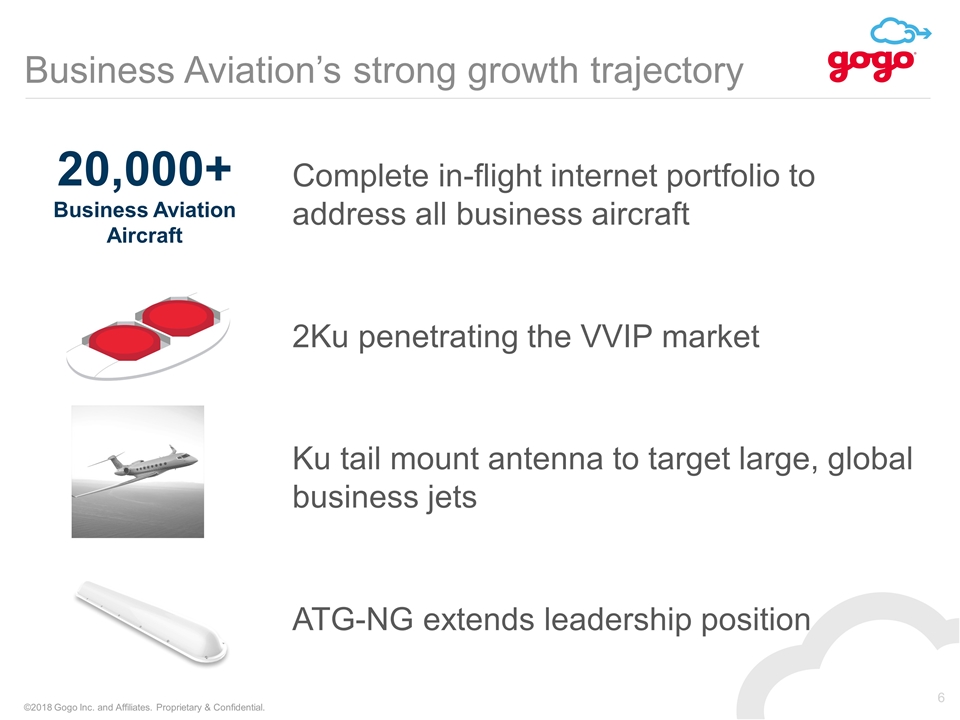
Business Aviation’s strong growth trajectory 20,000+ Business Aviation Aircraft Complete in-flight internet portfolio to address all business aircraft Ku tail mount antenna to target large, global business jets ATG-NG extends leadership position 2Ku penetrating the VVIP market
Looking ahead to 2018 More bandwidth will drive aircraft awards and ARPA 2Ku installs, modem upgrades, HTS satellites & launch of ATG-NG Bandwidth Growth Win Aircraft Grow ARPA BA: Continued Growth Strong revenue and profitability growth
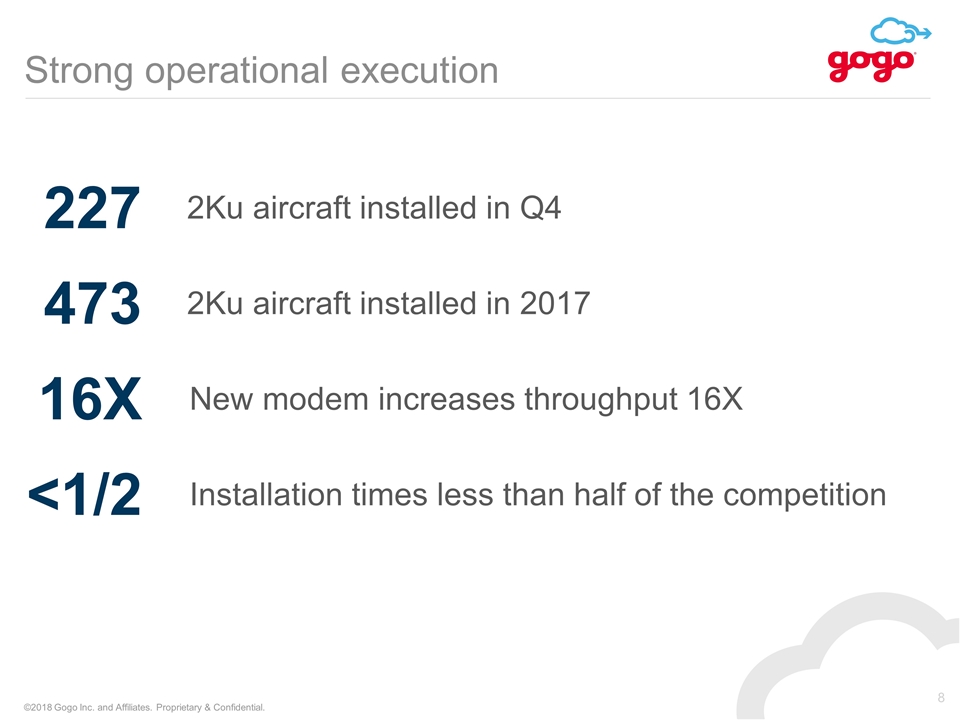
Strong operational execution 2Ku aircraft installed in Q4 227 New modem increases throughput 16X 16X Installation times less than half of the competition <1/2 2Ku aircraft installed in 2017 473
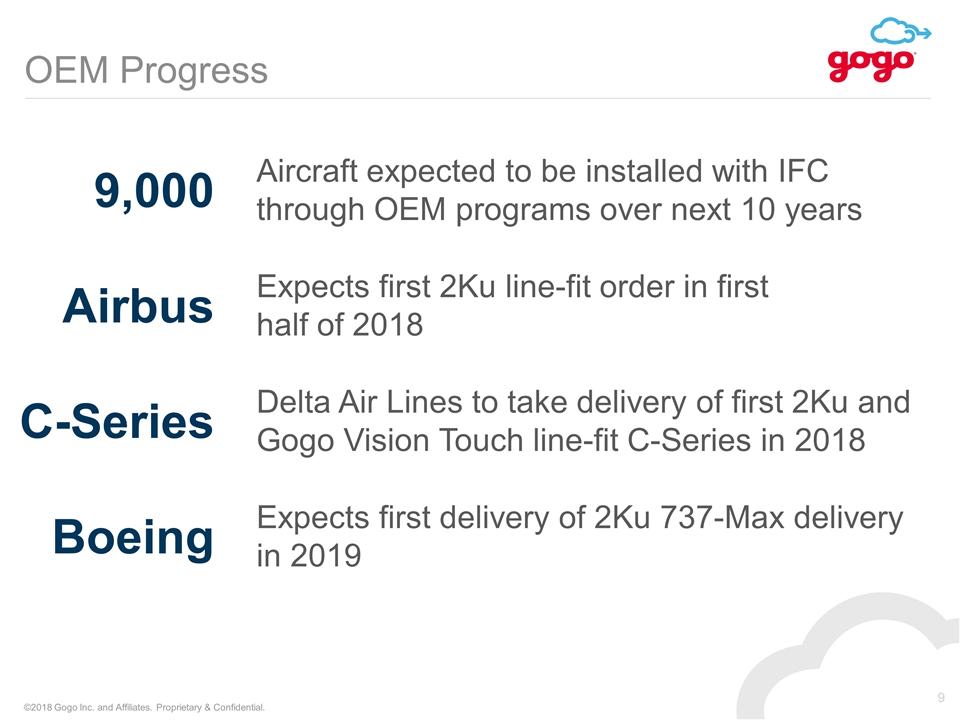
OEM Progress 9,000 Aircraft expected to be installed with IFC through OEM programs over next 10 years Airbus Expects first 2Ku line-fit order in first half of 2018 Delta Air Lines to take delivery of first 2Ku and Gogo Vision Touch line-fit C-Series in 2018 C-Series Boeing Expects first delivery of 2Ku 737-Max delivery in 2019
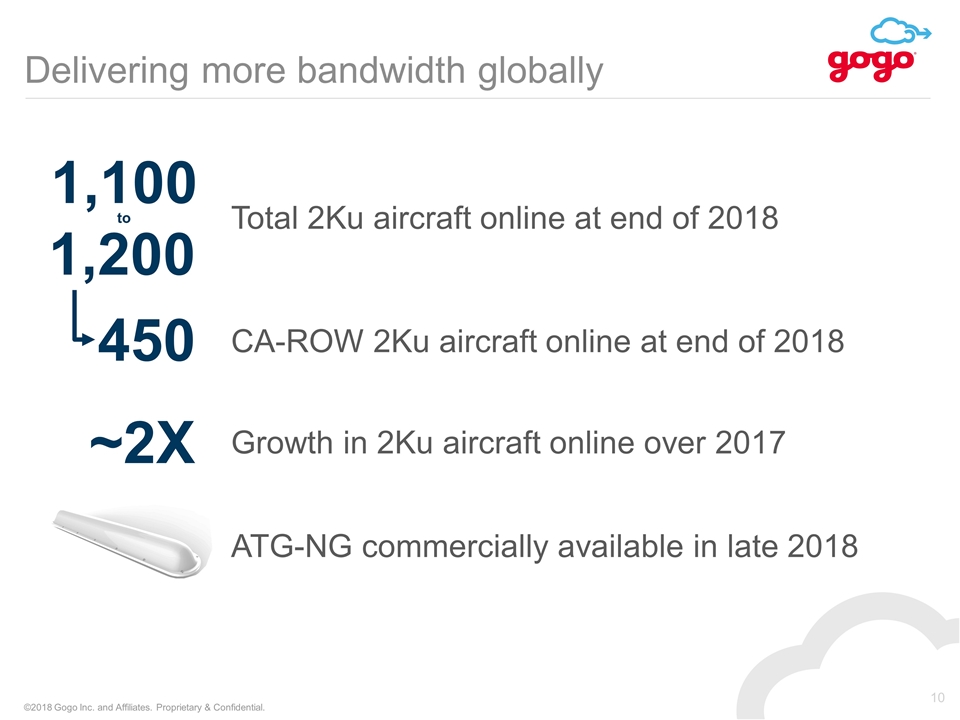
Delivering more bandwidth globally Total 2Ku aircraft online at end of 2018 1,200 1,100 to CA-ROW 2Ku aircraft online at end of 2018 450 Growth in 2Ku aircraft online over 2017 ~2X ATG-NG commercially available in late 2018
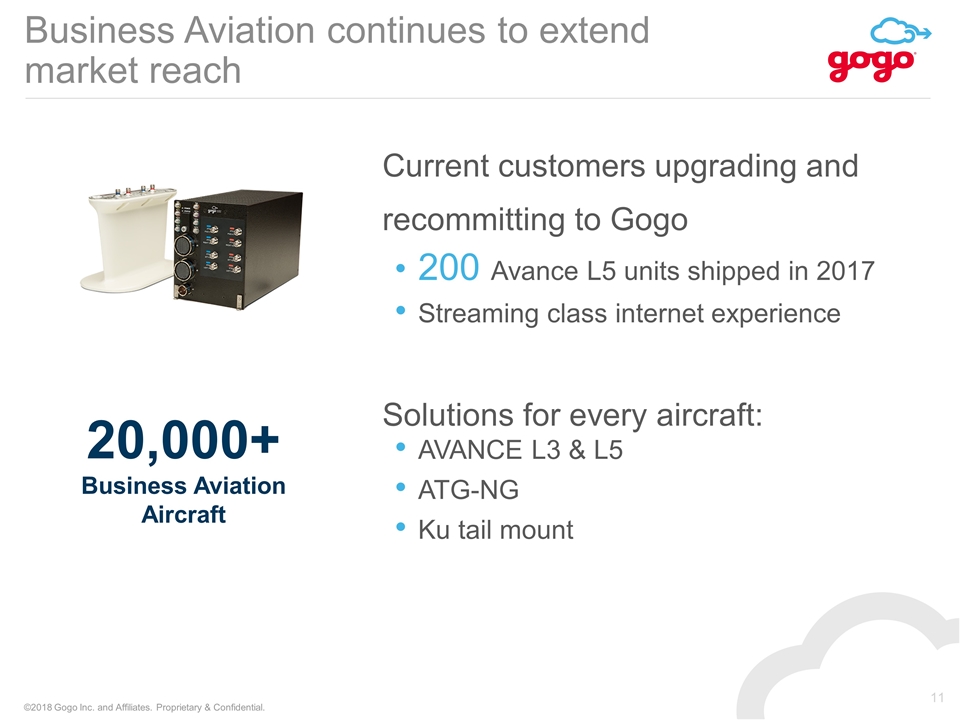
Business Aviation continues to extend market reach Solutions for every aircraft: AVANCE L3 & L5 ATG-NG Ku tail mount Current customers upgrading and recommitting to Gogo 200 Avance L5 units shipped in 2017 Streaming class internet experience 20,000+ Business Aviation Aircraft
Key takeaways - COO Relationships built on over 25 years of experience Continually enhancing our capabilities Business Aviation set for a strong 2018 and to capitalize on long-term growth opportunities
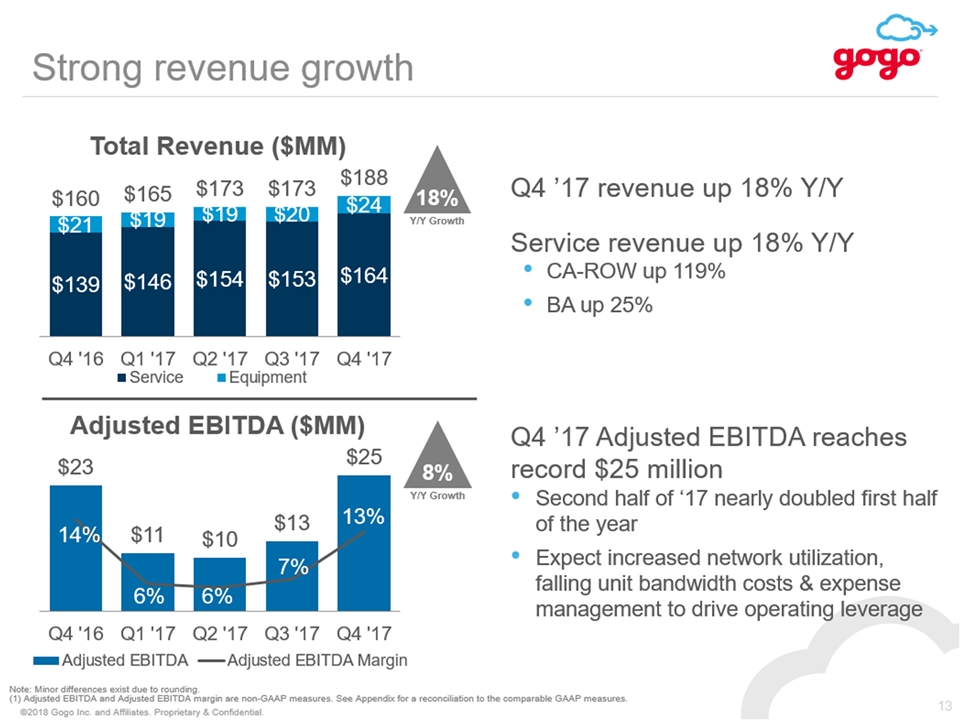
3 Strong revenue growth 18% Y/Y Growth Q4 ’17 Adjusted EBITDA reaches record $25 million Second half of ‘17 nearly doubled first half of the year Expect increased network utilization, falling unit bandwidth costs & expense management to drive operating leverage Note: Minor differences exist due to rounding. (1) Adjusted EBITDA and Adjusted EBITDA margin are non-GAAP measures. See Appendix for a reconciliation to the comparable GAAP measures. 8% Y/Y Growth Q4 ’17 revenue up 18% Y/Y Service revenue up 18% Y/Y CA-ROW up 119% BA up 25%
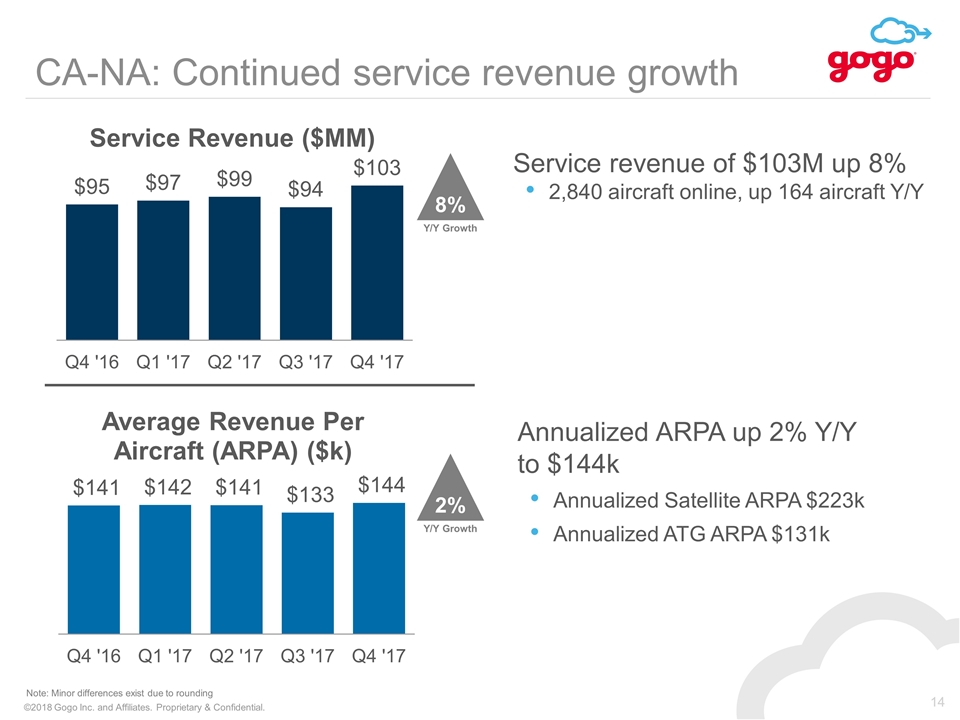
CA-NA: Continued service revenue growth 8% Y/Y Growth Service revenue of $103M up 8% 2,840 aircraft online, up 164 aircraft Y/Y Note: Minor differences exist due to rounding Annualized ARPA up 2% Y/Y to $144k Annualized Satellite ARPA $223k Annualized ATG ARPA $131k 2% Y/Y Growth
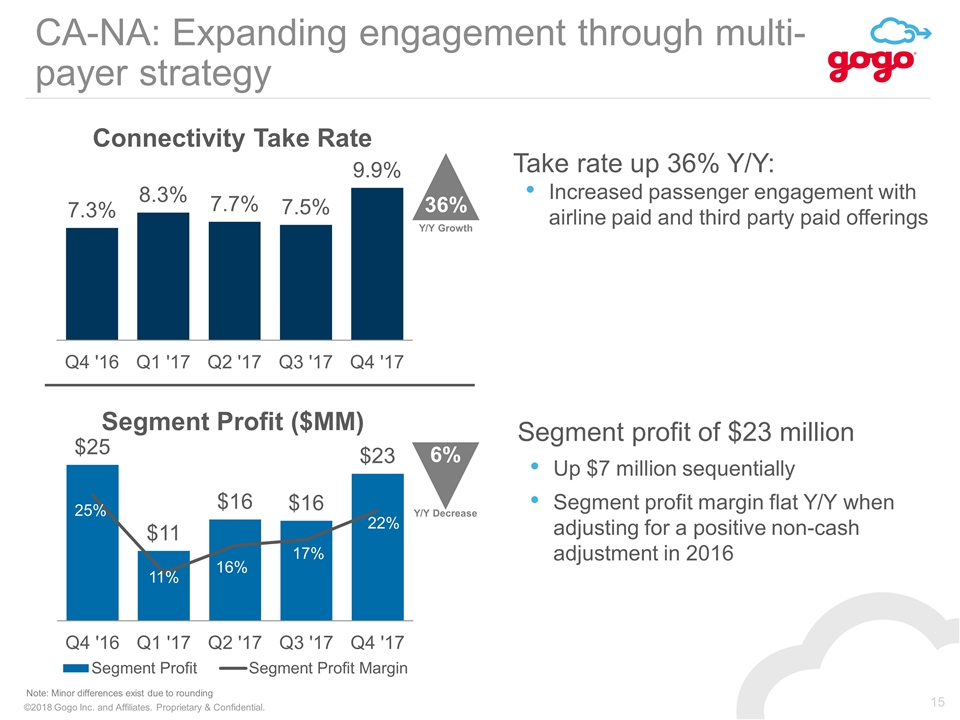
15 CA-NA: Expanding engagement through multi-payer strategy 36% Y/Y Growth Take rate up 36% Y/Y: Increased passenger engagement with airline paid and third party paid offerings Note: Minor differences exist due to rounding Segment profit of $23 million Up $7 million sequentially Segment profit margin flat Y/Y when adjusting for a positive non-cash adjustment in 2016 6% Y/Y Decrease
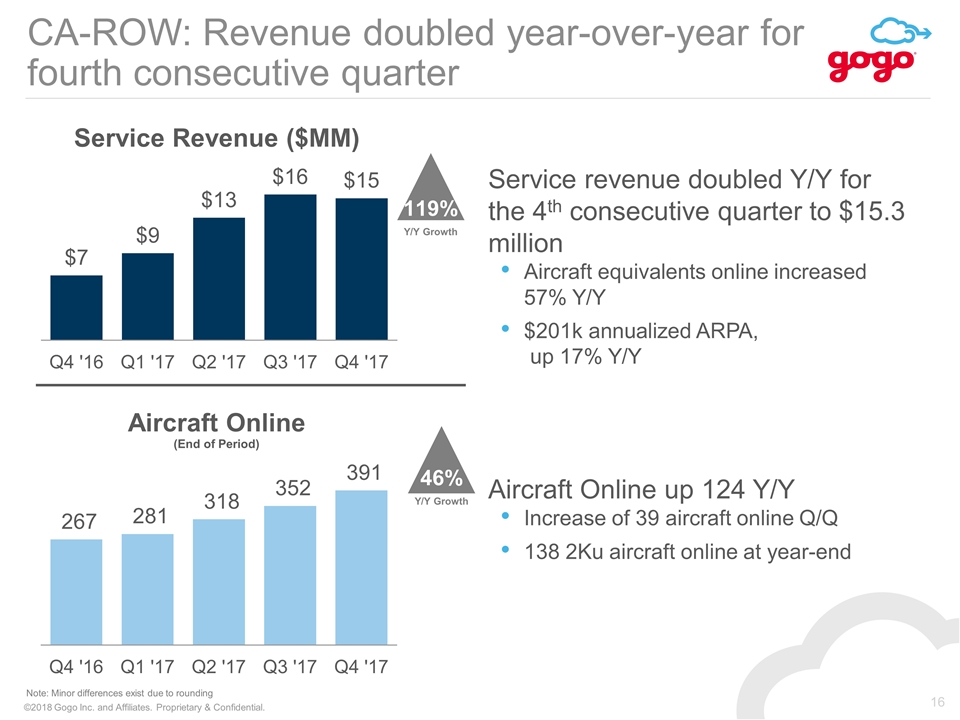
CA-ROW: Revenue doubled year-over-year for fourth consecutive quarter 119% Y/Y Growth Note: Minor differences exist due to rounding Service revenue doubled Y/Y for the 4th consecutive quarter to $15.3 million Aircraft equivalents online increased 57% Y/Y $201k annualized ARPA, up 17% Y/Y Aircraft Online up 124 Y/Y Increase of 39 aircraft online Q/Q 138 2Ku aircraft online at year-end 46% Y/Y Growth
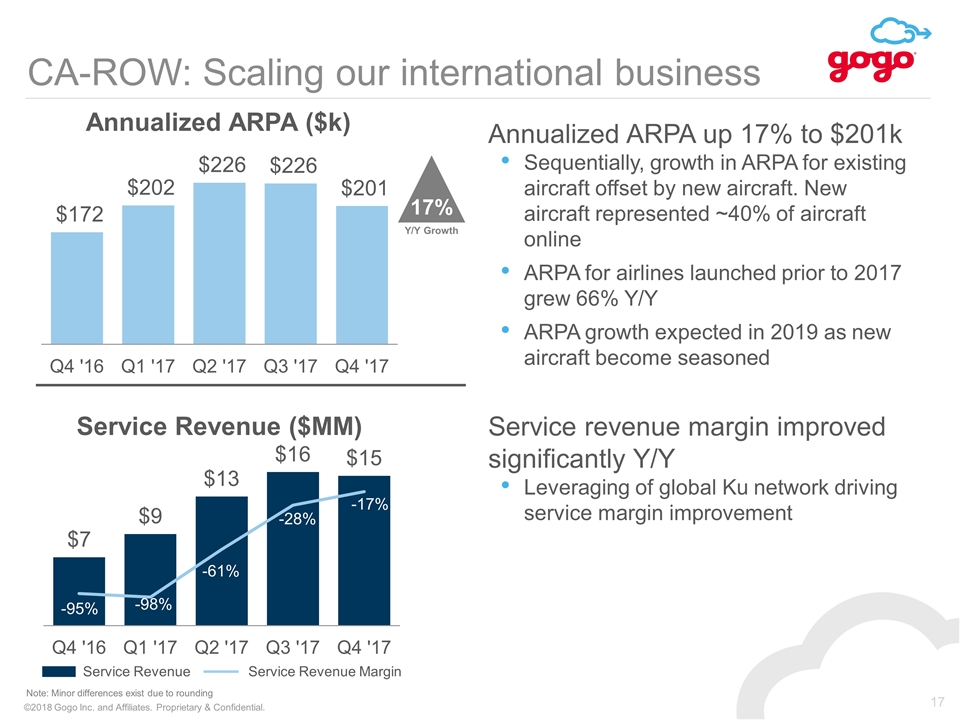
CA-ROW: Scaling our international business 17 Note: Minor differences exist due to rounding Annualized ARPA up 17% to $201k Sequentially, growth in ARPA for existing aircraft offset by new aircraft. New aircraft represented ~40% of aircraft online ARPA for airlines launched prior to 2017 grew 66% Y/Y ARPA growth expected in 2019 as new aircraft become seasoned Service revenue margin improved significantly Y/Y Leveraging of global Ku network driving service margin improvement 17% Y/Y Growth Service Revenue Service Revenue Margin
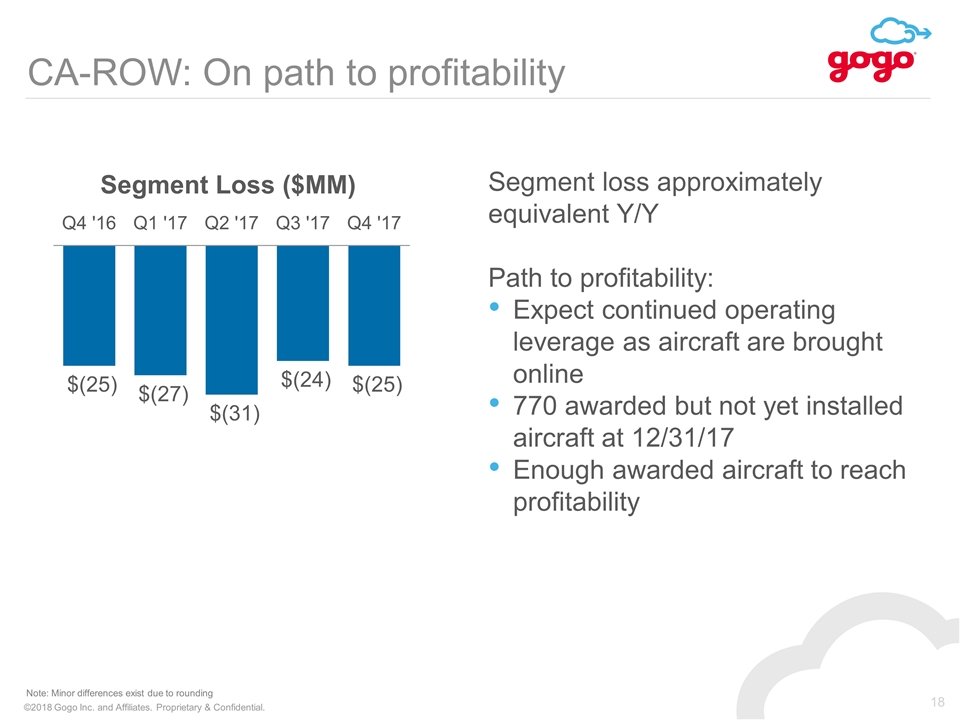
CA-ROW: On path to profitability 18 Note: Minor differences exist due to rounding Segment loss approximately equivalent Y/Y Path to profitability: Expect continued operating leverage as aircraft are brought online 770 awarded but not yet installed aircraft at 12/31/17 Enough awarded aircraft to reach profitability
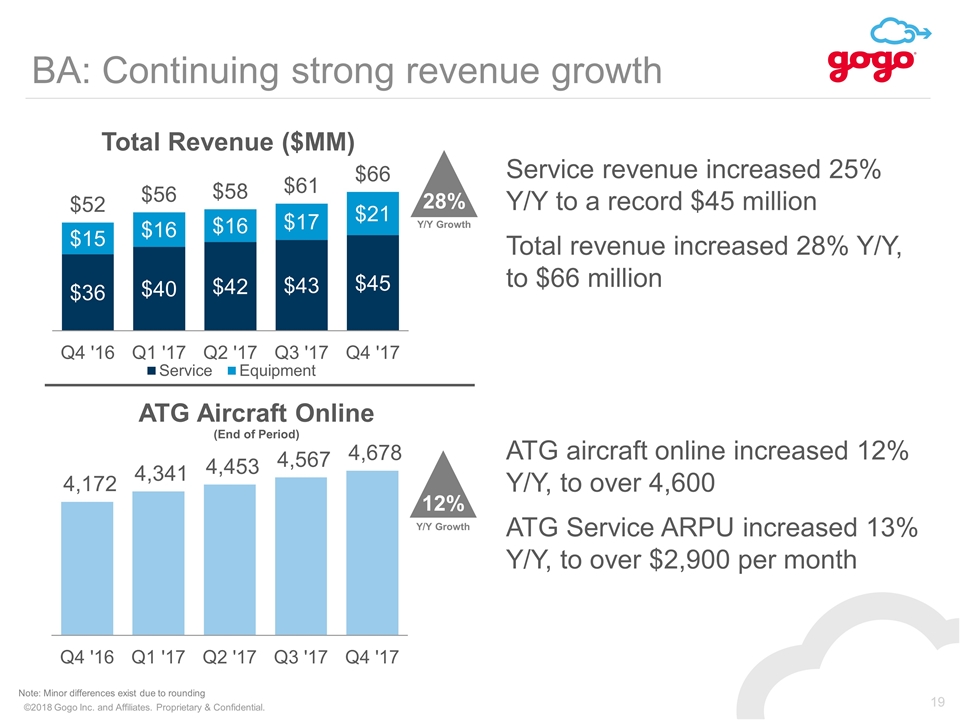
BA: Continuing strong revenue growth Service revenue increased 25% Y/Y to a record $45 million Total revenue increased 28% Y/Y, to $66 million ATG aircraft online increased 12% Y/Y, to over 4,600 ATG Service ARPU increased 13% Y/Y, to over $2,900 per month Note: Minor differences exist due to rounding 12% Y/Y Growth 28% Y/Y Growth
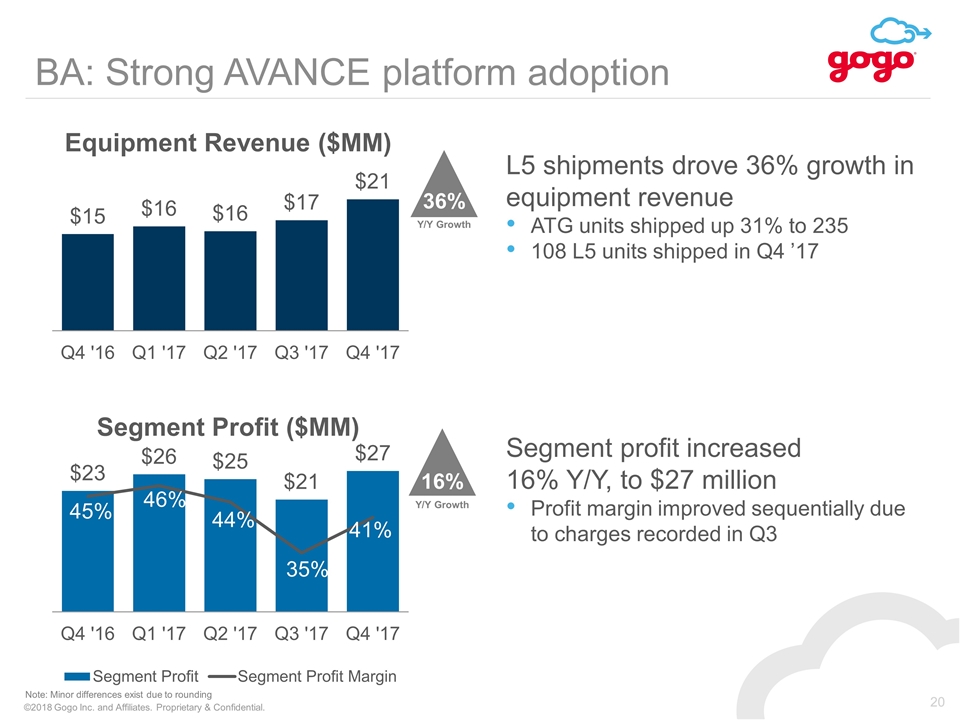
BA: Strong AVANCE platform adoption Segment profit increased 16% Y/Y, to $27 million Profit margin improved sequentially due to charges recorded in Q3 Note: Minor differences exist due to rounding 16% Y/Y Growth L5 shipments drove 36% growth in equipment revenue ATG units shipped up 31% to 235 108 L5 units shipped in Q4 ’17 36% Y/Y Growth Equipment Revenue ($MM)
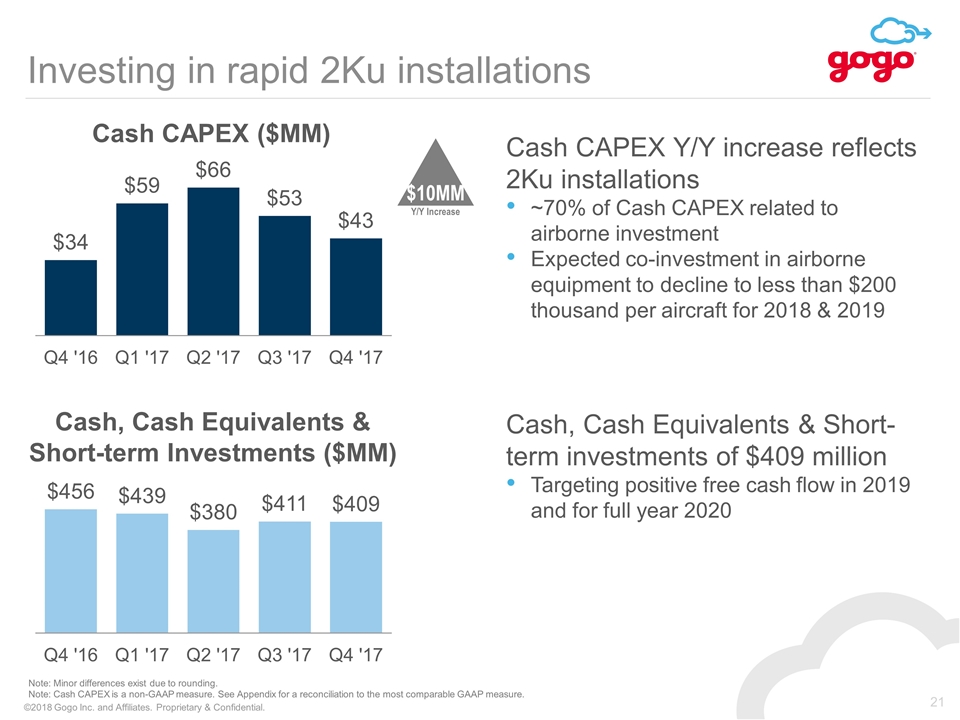
21 Investing in rapid 2Ku installations Note: Minor differences exist due to rounding. Note: Cash CAPEX is a non-GAAP measure. See Appendix for a reconciliation to the most comparable GAAP measure. $10MM Y/Y Increase Cash CAPEX Y/Y increase reflects 2Ku installations ~70% of Cash CAPEX related to airborne investment Expected co-investment in airborne equipment to decline to less than $200 thousand per aircraft for 2018 & 2019 Cash, Cash Equivalents & Short-term Investments ($MM) Cash, Cash Equivalents & Short-term investments of $409 million Targeting positive free cash flow in 2019 and for full year 2020
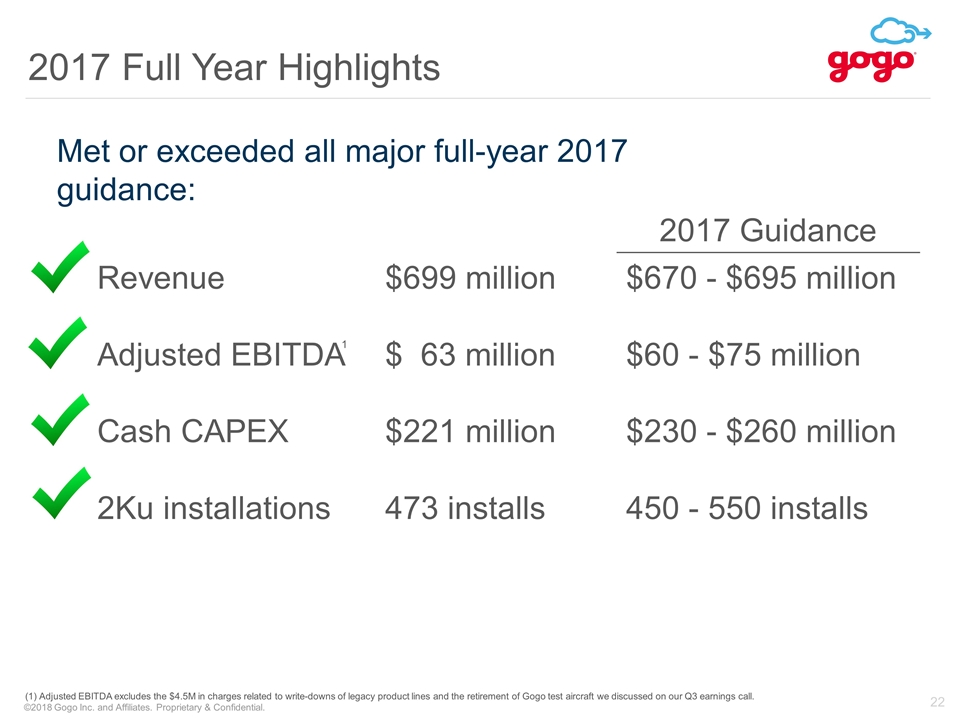
2017 Full Year Highlights Met or exceeded all major full-year 2017 guidance: Revenue$699 million Adjusted EBITDA$ 63 million Cash CAPEX$221 million 2Ku installations473 installs (1) Adjusted EBITDA excludes the $4.5M in charges related to write-downs of legacy product lines and the retirement of Gogo test aircraft we discussed on our Q3 earnings call. $670 - $695 million $60 - $75 million $230 - $260 million 450 - 550 installs 2017 Guidance 1
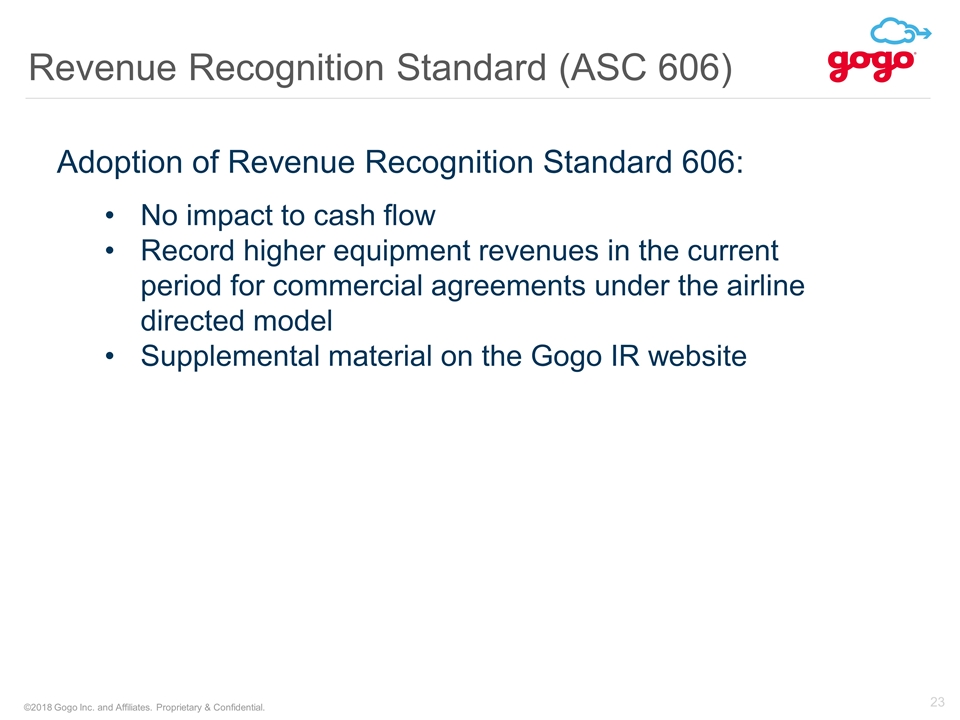
Revenue Recognition Standard (ASC 606) Adoption of Revenue Recognition Standard 606: No impact to cash flow Record higher equipment revenues in the current period for commercial agreements under the airline directed model Supplemental material on the Gogo IR website
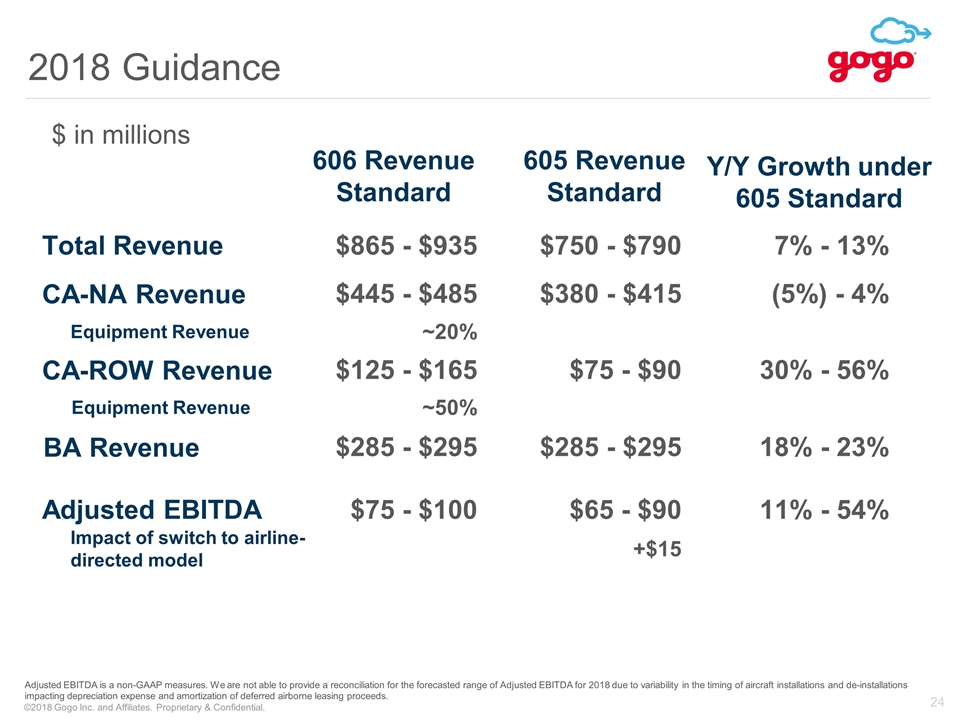
2018 Guidance 24 606 Revenue Standard 605 Revenue Standard Y/Y Growth under 605 Standard Total Revenue $865 - $935 $750 - $790 7% - 13% CA-NA Revenue $445 - $485 $380 - $415 (5%) - 4% CA-ROW Revenue $125 - $165 $75 - $90 30% - 56% BA Revenue $285 - $295 $285 - $295 18% - 23% Adjusted EBITDA $75 - $100 $65 - $90 11% - 54% Adjusted EBITDA is a non-GAAP measures. We are not able to provide a reconciliation for the forecasted range of Adjusted EBITDA for 2018 due to variability in the timing of aircraft installations and de-installations impacting depreciation expense and amortization of deferred airborne leasing proceeds. $ in millions Equipment Revenue ~20% Equipment Revenue ~50% Impact of switch to airline-directed model +$15
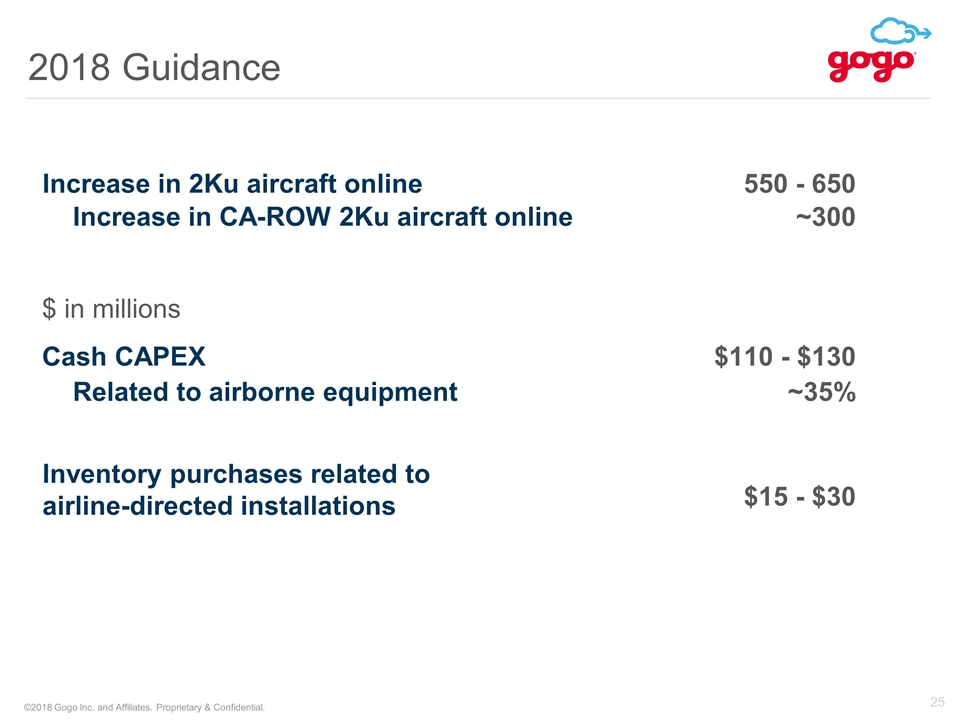
2018 Guidance Cash CAPEX $110 - $130 ~35% Related to airborne equipment $15 - $30 Inventory purchases related to airline-directed installations Increase in 2Ku aircraft online 550 - 650 Increase in CA-ROW 2Ku aircraft online ~300 $ in millions

Q&A

Appendix
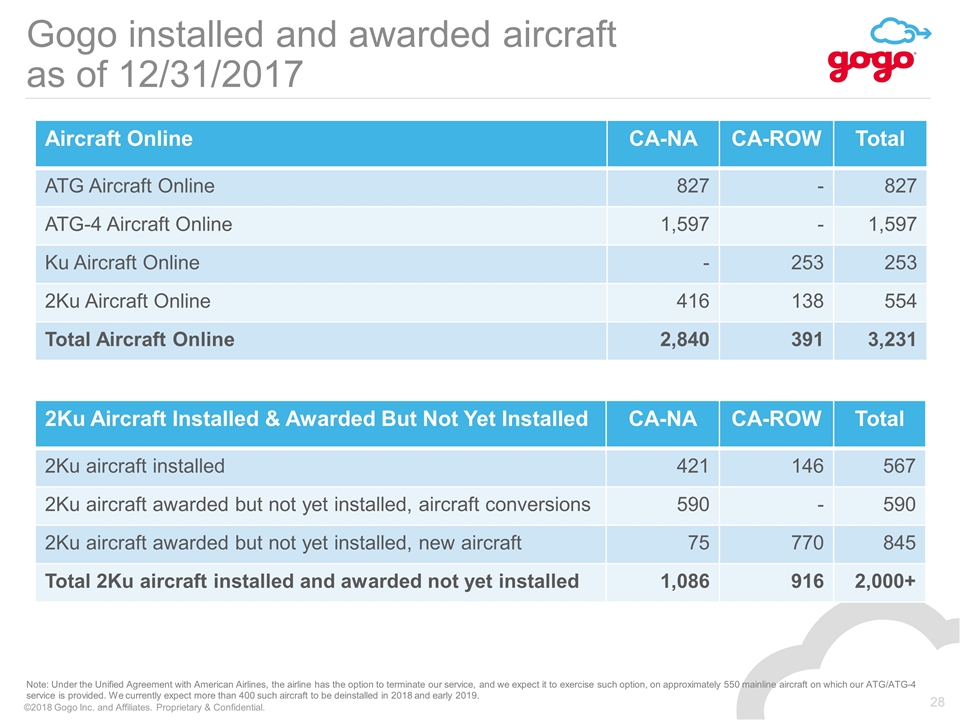
28 Gogo installed and awarded aircraft as of 12/31/2017 Note: Under the Unified Agreement with American Airlines, the airline has the option to terminate our service, and we expect it to exercise such option, on approximately 550 mainline aircraft on which our ATG/ATG-4 service is provided. We currently expect more than 400 such aircraft to be deinstalled in 2018 and early 2019. Aircraft Online CA-NA CA-ROW Total ATG Aircraft Online 827 - 827 ATG-4 Aircraft Online 1,597 - 1,597 Ku Aircraft Online - 253 253 2Ku Aircraft Online 416 138 554 Total Aircraft Online 2,840 391 3,231 2Ku Aircraft Installed & Awarded But Not Yet Installed CA-NA CA-ROW Total 2Ku aircraft installed 421 146 567 2Ku aircraft awarded but not yet installed, aircraft conversions 590 - 590 2Ku aircraft awarded but not yet installed, new aircraft 75 770 845 Total 2Ku aircraft installed and awarded not yet installed 1,086 916 2,000+
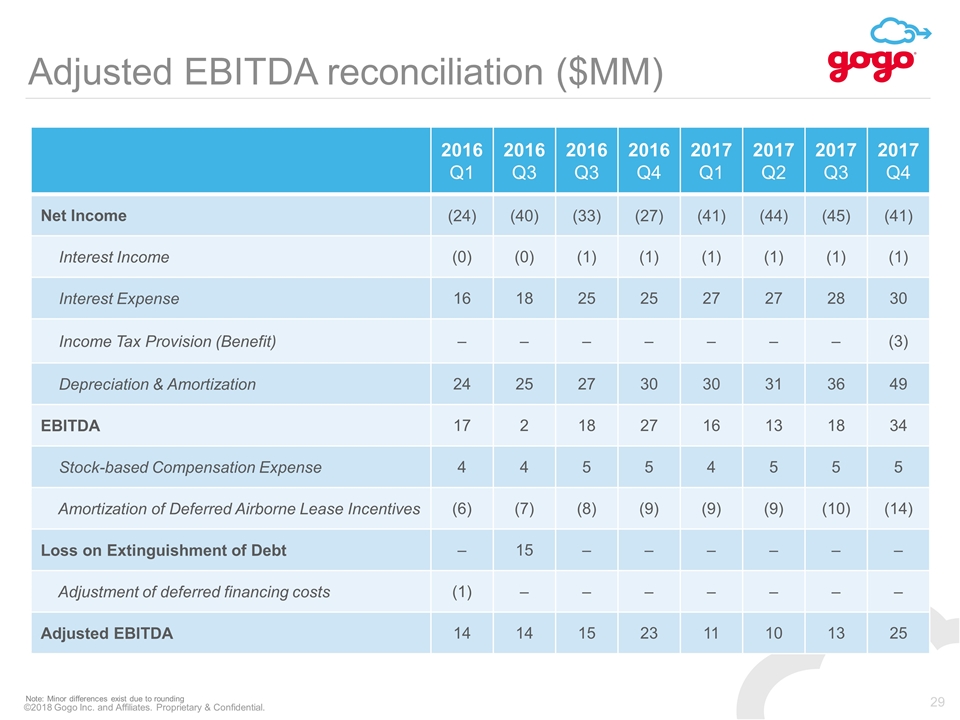
Adjusted EBITDA reconciliation ($MM) 2016 Q1 2016 Q3 2016 Q3 2016 Q4 2017 Q1 2017 Q2 2017 Q3 2017 Q4 Net Income (24) (40) (33) (27) (41) (44) (45) (41) Interest Income (0) (0) (1) (1) (1) (1) (1) (1) Interest Expense 16 18 25 25 27 27 28 30 Income Tax Provision (Benefit) – – – – – – – (3) Depreciation & Amortization 24 25 27 30 30 31 36 49 EBITDA 17 2 18 27 16 13 18 34 Stock-based Compensation Expense 4 4 5 5 4 5 5 5 Amortization of Deferred Airborne Lease Incentives (6) (7) (8) (9) (9) (9) (10) (14) Loss on Extinguishment of Debt – 15 – – – – – – Adjustment of deferred financing costs (1) – – – – – – – Adjusted EBITDA 14 14 15 23 11 10 13 25 Note: Minor differences exist due to rounding
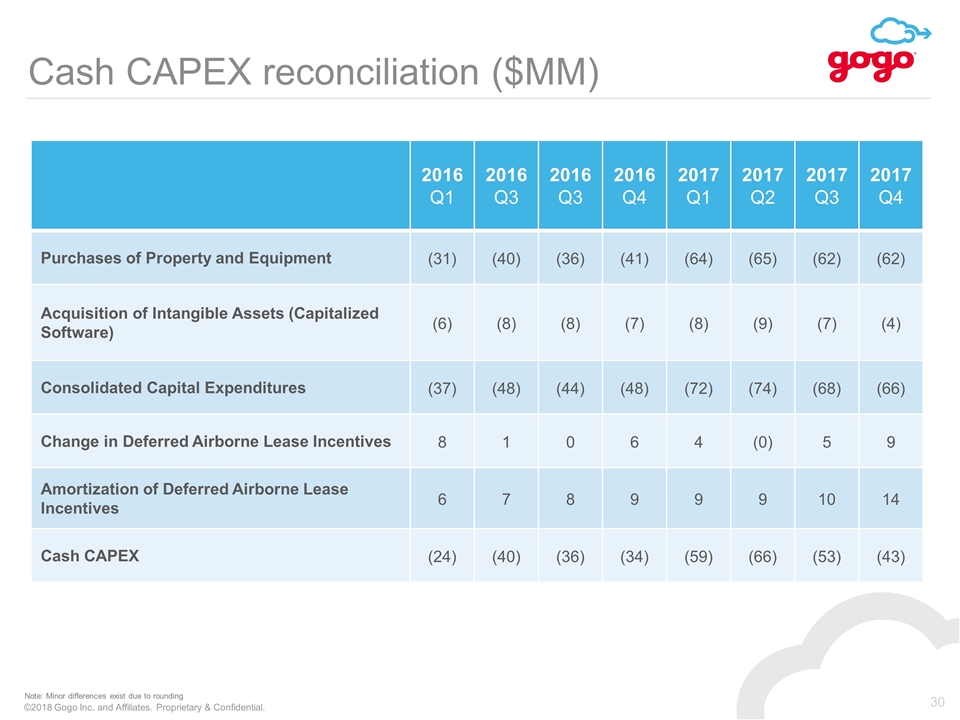
Cash CAPEX reconciliation ($MM) 2016 Q1 2016 Q3 2016 Q3 2016 Q4 2017 Q1 2017 Q2 2017 Q3 2017 Q4 Purchases of Property and Equipment (31) (40) (36) (41) (64) (65) (62) (62) Acquisition of Intangible Assets (Capitalized Software) (6) (8) (8) (7) (8) (9) (7) (4) Consolidated Capital Expenditures (37) (48) (44) (48) (72) (74) (68) (66) Change in Deferred Airborne Lease Incentives 8 1 0 6 4 (0) 5 9 Amortization of Deferred Airborne Lease Incentives 6 7 8 9 9 9 10 14 Cash CAPEX (24) (40) (36) (34) (59) (66) (53) (43) Note: Minor differences exist due to rounding
