Attached files
| file | filename |
|---|---|
| EX-32 - SECTION 906 CEO AND CFO CERTIFICATION - GLACIER BANCORP, INC. | gbci-12312017xex32.htm |
| EX-31.2 - SECTION 302 CFO CERTIFICATION - GLACIER BANCORP, INC. | gbci-12312017xex312.htm |
| EX-31.1 - SECTION 302 CEO CERTIFICATION - GLACIER BANCORP, INC. | gbci-12312017xex311.htm |
| EX-23 - CONSENT OF INDEPENDENT REGISTERED PUBLIC ACCOUNTING FIRM - GLACIER BANCORP, INC. | gbci-12312017xex23.htm |
UNITED STATES
SECURITIES AND EXCHANGE COMMISSION
Washington, D.C. 20549
______________________________________________________________________
FORM 10-K
______________________________________________________________________
ý ANNUAL REPORT PURSUANT TO SECTION 13 OR 15(d) OF THE SECURITIES EXCHANGE ACT OF 1934
For the fiscal year ended December 31, 2017 or
¨ TRANSITION REPORT PURSUANT TO SECTION 13 OR 15(d) OF THE SECURITIES EXCHANGE ACT OF 1934
For the transition period from __________ to __________
Commission file number 000-18911
______________________________________________________________________
GLACIER BANCORP, INC.
(Exact name of registrant as specified in its charter)
______________________________________________________________________
MONTANA | 81-0519541 |
(State or other jurisdiction of incorporation or organization) | (IRS Employer Identification No.) |
49 Commons Loop, Kalispell, Montana | 59901 |
(Address of principal executive offices) | (Zip Code) |
(406) 756-4200 | |
(Registrant’s telephone number, including area code) | |
Securities registered pursuant to Section 12(b) of the Act:
Common Stock, $0.01 par value per share | NASDAQ Global Select Market |
(Title of each class) | (Name of each exchange on which registered) |
Securities registered pursuant to Section 12(g) of the Act: NONE
Indicate by check mark if the registrant is a well-known seasoned issuer, as defined in Rule 405 of the Securities Act. ý Yes ¨ No
Indicate by check mark if the registrant is not required to file reports pursuant to Section 13 or Section 15(d) of the Act. ¨ Yes ý No
Indicate by check mark whether the registrant (1) has filed all reports required to be filed by Section 13 or 15(d) of the Securities Exchange Act of 1934 during the preceding 12 months (or for such shorter period that the registrant was required to file such reports), and (2) has been subject to such filing requirements for the past 90 days. ý Yes ¨ No
Indicate by check mark whether the registrant has submitted electronically and posted on its corporate Website, if any, every Interactive Data File required to be submitted and posted pursuant to Rule 405 of Regulation S-T during the preceding 12 months. ý Yes ¨ No
Indicate by check mark if disclosure of delinquent filers pursuant to item 405 of regulation S-K is not contained herein, and will not be contained, to the best of registrant’s knowledge, in definitive proxy or information statements incorporated by reference in Part III of this Form 10-K or any amendment to this Form 10-K. ý
Indicate by check mark whether the Registrant is a large accelerated filer, an accelerated filer, a non-accelerated filer, smaller reporting company, or an emerging growth company. See the definitions of “large accelerated filer,” “accelerated filer,” “smaller reporting company,” and “emerging growth company” in Rule 12b-2 of the Exchange Act.
Large accelerated filer | ý | Accelerated filer | o | |
Non-accelerated filer | o | (Do not check if a smaller reporting company) | Smaller reporting company | o |
Emerging growth company | o | |||
If an emerging growth company, indicate by check mark if the registrant has elected not to use the extended transition period for complying with any new or revised financial accounting standards provided pursuant to Section 13(a) of the Exchange Act. ¨
Indicate by check mark whether the registrant is a shell company (as defined in Rule 12b-2 of the Exchange Act). ¨ Yes ý No
The aggregate market value of the voting common equity held by non-affiliates of the Registrant at June 30, 2017 (the last business day of the most recent second quarter), was $2,837,602,927 (based on the average bid and ask price as quoted on the NASDAQ Global Select Market at the close of business on that date).
The number of shares of Registrant’s common stock outstanding on February 5, 2018 was 79,785,733. No preferred shares are issued or outstanding.
Document Incorporated by Reference
Portions of the 2018 Annual Meeting Proxy Statement dated on or about March 15, 2018 are incorporated by reference into Parts I and III of this Form 10-K.
TABLE OF CONTENTS
Page | ||
PART I | ||
Item 1 | ||
Item 1A | ||
Item 1B | ||
Item 2 | ||
Item 3 | ||
Item 4 | ||
PART II | ||
Item 5 | ||
Item 6 | ||
Item 7 | ||
Item 7A | ||
Item 8 | ||
Item 9 | ||
Item 9A | ||
Item 9B | ||
PART III | ||
Item 10 | ||
Item 11 | ||
Item 12 | ||
Item 13 | ||
Item 14 | ||
PART IV | ||
Item 15 | ||
Item 16 | ||
SIGNATURES | ||
ABBREVIATIONS/ACRONYMS
ALCO – Asset Liability Committee | GLBA – Gramm-Leach-Bliley Financial Services |
ALLL or allowance – allowance for loan and lease losses | Modernization Act of 1999 |
ASC – Accounting Standards CodificationTM | Interstate Act – Riegle-Neal Interstate Banking and Branching |
ATM – automated teller machine | Efficiency Act of 1994 |
Bank – Glacier Bank | IRS – Internal Revenue Service |
Basel III – third installment of the Basel Accords | LIBOR – London Interbank Offered Rate |
BHCA – Bank Holding Company Act of 1956, as amended | LIHTC – Low-Income Housing Tax Credit |
Board – Glacier Bancorp, Inc.’s Board of Directors | NII – net interest income |
bp or bps – basis point(s) | NMTC – New Markets Tax Credits |
BSA – Bank Secrecy Act | NOW – negotiable order of withdrawal |
CCP – Core Consolidation Project | NRSRO – Nationally Recognized Statistical Rating Organizations |
CDE – Certified Development Entity | OCI – other comprehensive income |
CDFI Fund – Community Development Financial Institutions Fund | OREO – other real estate owned |
CEO – Chief Executive Officer | Patriot Act – Uniting and Strengthening America by Providing Appropriate |
CFO – Chief Financial Officer | Tools Required to Intercept and Obstruct Terrorism Act of 2001 |
CFPB – Consumer Financial Protection Bureau | PCAOB – Public Company Accounting Oversight Board (United States) |
Collegiate – Columbine Capital Corp. and its subsidiary, | Proxy Statement – the 2018 Annual Meeting Proxy Statement |
Collegiate Peaks Bank | Repurchase agreements – securities sold under agreements |
Company – Glacier Bancorp, Inc. | to repurchase |
COSO – Committee of Sponsoring Organizations of the | S&P – Standard and Poor’s |
Treadway Commission | SAB – SEC Staff Accounting Bulletin |
CRA – Community Reinvestment Act of 1977 | SEC – United States Securities and Exchange Commission |
DDA – demand deposit account | SERP – Supplemental Executive Retirement Plan |
DIF – federal Deposit Insurance Fund | SOX Act – Sarbanes-Oxley Act of 2002 |
DFAST – Dodd-Frank Act stress test | Tax Act – The Tax Cuts and Jobs Act |
Dodd-Frank Act – Dodd-Frank Wall Street Reform and | TSB – Treasure State Bank |
Consumer Protection Act of 2010 | TDR – troubled debt restructuring |
EVE – economic value of equity | VIE – variable interest entity |
Fannie Mae – Federal National Mortgage Association | |
FASB – Financial Accounting Standards Board | |
FDIC – Federal Deposit Insurance Corporation | |
FHLB – Federal Home Loan Bank | |
Final Rules – final rules implemented by the federal banking | |
agencies that amended regulatory risk-based capital rules | |
Foothills – TFB Bancorp, Inc. and its subsidiary, | |
The Foothills Bank | |
FRB – Federal Reserve Bank | |
Freddie Mac – Federal Home Loan Mortgage Corporation | |
FSB – Inter-Mountain Bancorp., Inc., and its subsidiary, | |
First Security Bank | |
GAAP – accounting principles generally accepted in the | |
United States of America | |
Ginnie Mae – Government National Mortgage Association | |
PART I
Item 1. Business
Glacier Bancorp, Inc. (“Company”), headquartered in Kalispell, Montana, is a Montana corporation incorporated in 2004 as a successor corporation to the Delaware corporation originally incorporated in 1990. The Company is a publicly-traded company and its common stock trades on the NASDAQ Global Select Market under the symbol GBCI. The Company provides commercial banking services from 145 locations in Montana, Idaho, Utah, Washington, Wyoming, Colorado, and Arizona through its wholly-owned bank subsidiary, Glacier Bank (“Bank”). The Company offers a wide range of banking products and services, including: 1) retail banking; 2) business banking; 3) real estate, commercial, agriculture and consumer loans; and 4) mortgage origination services. The Company serves individuals, small to medium-sized businesses, community organizations and public entities. For information regarding the Company’s lending, investment and funding activities, see “Item 7. Management’s Discussion and Analysis of Financial Condition and Results of Operations.”
Subsidiaries
The Company includes the parent holding company and the Bank. As of December 31, 2017, the Bank consists of fourteen bank divisions, a treasury division, an information technology division and a centralized mortgage division. The Bank divisions operate under separate names, management teams and advisory directors. and include the following:
• | Glacier Bank (Kalispell, Montana) with operations in Montana; |
• | First Security Bank of Missoula (Missoula, Montana) with operations in Montana; |
• | Valley Bank of Helena (Helena, Montana) with operations in Montana; |
• | Big Sky Western Bank (Bozeman, Montana) with operations in Montana; |
• | Western Security Bank (Billings, Montana) with operations in Montana; |
• | First Bank of Montana (Lewistown, Montana) with operations in Montana; |
• | Mountain West Bank (Coeur d’Alene, Idaho) with operations in Idaho, Utah and Washington; |
• | Citizens Community Bank (Pocatello, Idaho) with operations in Idaho; |
• | 1st Bank (Evanston, Wyoming) with operations in Wyoming and Utah; |
• | First Bank of Wyoming (Powell, Wyoming) with operations in Wyoming; |
• | First State Bank (Wheatland, Wyoming) with operations in Wyoming; |
• | North Cascades Bank (Chelan, Washington) with operations in Washington; |
• | Bank of the San Juans (Durango, Colorado) with operations in Colorado; and |
• | The Foothills Bank (Yuma, Arizona) with operations in Arizona. |
In January 2018, the Company combined the 1st Bank and First Bank of Wyoming divisions into one Bank division and named it First Bank. The combination was the result of the Company’s assessment of local market areas and determination that the Bank divisions would be more efficiently operated under one division. The treasury division includes the Bank’s investment portfolio and wholesale borrowings, the information technology division includes the Bank’s internal data processing, and the centralized mortgage division includes mortgage loan servicing and secondary market originations and sales. The Company considers the Bank to be its sole operating segment.
The Bank has subsidiary interests in variable interest entities (“VIE”) for which the Bank has both the power to direct the VIE’s significant activities and the obligation to absorb losses or right to receive benefits of the VIE that could potentially be significant to the VIE. These subsidiary interests are included in the Company’s consolidated financial statements. The Bank also has subsidiary interests in VIEs for which the Bank does not have a controlling financial interest and is not the primary beneficiary. These subsidiary interests are not included in the Company’s consolidated financial statements.
The parent holding company owns non-bank subsidiaries that have issued trust preferred securities as Tier 1 capital instruments. The trust subsidiaries are not included in the Company’s consolidated financial statements. The Company's investments in the trust subsidiaries are included in non-marketable equity securities on the Company's statements of financial condition.
As of December 31, 2017, the Company and its subsidiaries were not engaged in any operations in foreign countries.
4
Recent and Pending Acquisitions
The Company’s strategy is to profitably grow its business through internal growth and selective acquisitions. The Company continues to look for profitable expansion opportunities primarily in existing and new markets in the Rocky Mountain states. The Company has completed the following acquisitions during the last five years:
(Dollars in thousands) | Date | Total Assets | Gross Loans | Total Deposits | |||||||
TFB Bancorp, Inc. and its subsidiary, The Foothills Bank (collectively, “Foothills”) | April 30, 2017 | $ | 385,839 | 292,529 | 296,760 | ||||||
Treasure State Bank (“TSB”) | August 31, 2016 | 76,165 | 51,875 | 58,364 | |||||||
Cañon Bank Corporation and its subsidiary, Cañon National Bank | October 31, 2015 | 270,121 | 159,759 | 237,326 | |||||||
Montana Community Banks, Inc. and its subsidiary, Community Bank | February 28, 2015 | 175,774 | 84,689 | 237,326 | |||||||
FNBR Holding Corporation and its subsidiary, First National Bank of the Rockies | August 31, 2014 | 349,167 | 137,488 | 309,641 | |||||||
North Cascades Bancshares, Inc. and its subsidiary, North Cascades National Bank | July 31, 2013 | 330,028 | 215,986 | 294,980 | |||||||
Wheatland Bankshares, Inc. and its subsidiary, First State Bank | May 31, 2013 | 300,541 | 171,199 | 255,197 | |||||||
In January 2018, the Company acquired the outstanding common stock of Columbine Capital Corp., and its wholly-owned subsidiary, Collegiate Peaks Bank, a community bank based in Buena Vista, Colorado (collectively, “Collegiate”). Collegiate provides banking services to businesses and individuals in the Mountain and Front Range communities of Colorado, with banking offices located in Aurora, Buena Vista, Denver and Salida. As of December 31, 2017, Collegiate had total assets of $533 million, gross loans of $346 million and total deposits of $464 million. Collegiate operates as a division of the Bank under the name “Collegiate Peaks Bank, division of Glacier Bank.”
In October 2017, the Company announced the signing of a definitive agreement to acquire Inter-Mountain Bancorp., Inc., and its wholly-owned subsidiary, First Security Bank, a community bank based in Bozeman, Montana (collectively, “FSB”). FSB provides banking services to businesses and individuals throughout Montana, with banking offices located in Bozeman, Belgrade, Big Sky, Choteau, Fairfield, Fort Benton, Three Forks, Vaughn and West Yellowstone. As of December 31, 2017, FSB had total assets of $1.028 billion, gross loans of $640 million and total deposits of $891 million. The acquisition has received the required regulatory approvals, is subject to other customary conditions of closing and is expected to be completed in February 2018. Upon closing of the transaction, FSB will be merged into the Bank and will operate as a separate bank division under its existing name. Big Sky Western Bank, the Bank’s existing Bozeman-based division, will combine with the new FSB division. The agriculture-focused northern branches of FSB, located in the area known as the Golden Triangle, will combine with the Bank’s First Bank of Montana division.
See Notes 22 and 23 in the Consolidated Financial Statements in “Item 8. Financial Statements and Supplementary Data” for additional information regarding these acquisitions.
Market Area
The Company and the Bank have 145 locations, of which 9 are loan or administration offices, in 51 counties within 7 states including Montana, Idaho, Utah, Washington, Wyoming, Colorado, and Arizona. The Company and the Bank have 59 locations in Montana, 28 locations in Idaho, 4 locations in Utah, 13 locations in Washington, 16 locations in Wyoming, 20 locations in Colorado, and 5 locations in Arizona.
The market area’s economic base primarily focuses on tourism, construction, mining, energy, manufacturing, agriculture, service industry, and health care. The tourism industry is highly influenced by national parks, ski resorts, significant lakes and rural scenic areas.
Competition
Commercial banking is a highly competitive business and operates in a rapidly changing environment. There are a large number of depository institutions including savings and loans, commercial banks, and credit unions in the markets in which the Company has offices. Competition is also increasing for deposit and lending services from internet-based competitors. Non-depository financial service institutions, primarily in the securities, insurance and retail industries, have also become competitors for retail savings, investment funds and lending activities. In addition to offering competitive interest rates, the principal methods used by the Bank to attract deposits include the offering of a variety of services including on-line banking, mobile banking and convenient office locations and business hours. The primary factors in competing for loans are interest rates and rate adjustment provisions, loan maturities, loan fees, and the quality of service to borrowers and brokers.
5
Based on the Federal Deposit Insurance Corporation (“FDIC”) summary of deposits survey as of June 30, 2017, the Bank has approximately 24 percent of the total FDIC insured deposits in the 13 counties that it services in Montana. In Idaho, the Bank has approximately 7 percent of the deposits in the 9 counties that it services. In Utah, the Bank has 11 percent of the deposits in the 3 counties it services. In Washington, the Bank has 4 percent of the deposits in the 6 counties it services. In Wyoming, the Bank has 24 percent of the deposits in the 8 counties it services. In Colorado, the Bank has 5 percent of the deposits in the 9 counties it services. In Arizona, the Bank has 4 percent of the deposits in the 3 counties it services.
Employees
As of December 31, 2017, the Company and the Bank employed 2,354 persons, 2,179 of whom were employed full time and none of whom were represented by a collective bargaining group. The Company and the Bank provide their qualifying employees with a comprehensive benefit program, including health, dental and vision insurance, life and accident insurance, short- and long-term disability coverage, vacation and sick leave, 401(k) plan, profit sharing plan, stock-based compensation plan, deferred compensation plans, and a supplemental executive retirement plan. The Company considers its employee relations to be excellent. See Note 13 in the Consolidated Financial Statements in “Item 8. Financial Statements and Supplementary Data” for detailed information regarding employee benefit plans and eligibility requirements.
Board of Directors and Committees
The Company’s Board of Directors (“Board”) has the ultimate authority and responsibility for overseeing risk management at the Company. Some aspects of risk oversight are fulfilled at the Board level, and the Board delegates other aspects of its risk oversight function to its committees. The Board has established, among others, an Audit Committee, a Compensation Committee, a Nominating/Corporate Governance Committee, a Compliance Committee, and a Risk Oversight Committee. Additional information regarding Board committees is set forth under the heading “Meetings and Committees of the Board of Directors - Committee Membership” in the Company’s 2018 Annual Meeting Proxy Statement (“Proxy Statement”) and is incorporated herein by reference.
Website Access
Copies of the Company’s Annual Report on Form 10-K, Quarterly Reports on Form 10-Q, Current Reports on Form 8-K and amendments to those reports filed or furnished pursuant to Section 13(a) or 15(d) of the Securities Exchange Act of 1934 are available free of charge through the Company’s website (www.glacierbancorp.com) as soon as reasonably practicable after the Company has filed the material with, or furnished it to, the United States Securities and Exchange Commission (“SEC”). Copies can also be obtained by accessing the SEC’s website (www.sec.gov).
Supervision and Regulation
The Company and the Bank are subject to extensive regulation under federal and state laws. This section provides a general overview of the federal and state regulatory framework applicable to the Company and the Bank. In general, this regulatory framework is designed to protect depositors, the federal Deposit Insurance Fund (“DIF”), and the federal and state banking system as a whole, rather than specifically for the protection of shareholders. Note that this section is not intended to summarize all laws and regulations applicable to the Company and the Bank. Descriptions of statutory or regulatory provisions do not purport to be complete and are qualified by reference to those provisions.
These statutes and regulations, as well as related policies, continue to be subject to change by Congress, state legislatures, and federal and state regulators. Changes in statutes, regulations, or regulatory policies applicable to the Company and the Bank (including their interpretation or implementation) cannot be predicted and could have a material effect on the Company’s and the Bank’s business and operations. Numerous changes to the statutes, regulations, and regulatory policies applicable to the Company and the Bank have been made or proposed in recent years. Continued efforts to monitor and comply with new regulatory requirements add to the complexity and cost of the Company’s and the Bank's business and operations.
The Company is subject to regulation and supervision by the Federal Reserve (as a bank holding company) and regulation by the State of Montana (as a Montana corporation). The Company is also subject to the disclosure and regulatory requirements of the Securities Act of 1933, as amended, and the Securities Exchange Act of 1934, as amended, both as administered by the SEC. The Bank is subject to regulation and supervision by the FDIC, the Montana Department of Administration's Banking and Financial Institutions Division, and, with respect to Bank branches outside of the State of Montana, the respective regulators in those states.
6
Federal Bank Holding Company Regulation
General. The Company is a bank holding company under the Bank Holding Company Act of 1956, as amended (“BHCA”), due to its ownership of and control over the Bank. As a bank holding company, the Company is subject to regulation, supervision, and examination by the Federal Reserve. In general, the BHCA limits the business of a bank holding company to owning or controlling banks and engaging in other activities closely related to the business of banking. In addition, the Company must also file reports with and provide additional information to the Federal Reserve.
Holding Company Bank Ownership. The BHCA requires every bank holding company to obtain the prior approval of the Federal Reserve before: 1) acquiring, directly or indirectly, ownership or control of any voting shares of another bank or bank holding company if, after such acquisition, it would own or control more than 5 percent of such shares; 2) acquiring all or substantially all of the assets of another bank or bank holding company; or 3) merging or consolidating with another bank holding company.
Holding Company Control of Non-banks. With some exceptions, the BHCA prohibits a bank holding company from acquiring or retaining direct or indirect ownership or control of more than 5 percent of the voting shares of any company that is not a bank or bank holding company, or from engaging directly or indirectly in activities other than those of banking, managing or controlling banks, or providing services for its subsidiaries. The principal exceptions to these prohibitions involve certain non-bank activities that, by federal statute, agency regulation, or order, have been identified as activities closely related to the business of banking or of managing or controlling banks.
Transactions with Affiliates. Bank subsidiaries of a bank holding company are subject to restrictions imposed by the Federal Reserve Act on extensions of credit to the holding company or its subsidiaries, on investments in securities, and on the use of securities as collateral for loans to any borrower. The Dodd-Frank Wall Street Reform and Consumer Protection Act of 2010 (“Dodd-Frank Act”) further extended the definition of an “affiliate” and treats credit exposure arising from derivative transactions, securities lending, and borrowing transactions as covered transactions under the regulations. It also 1) expands the scope of covered transactions required to be collateralized; 2) requires collateral to be maintained at all times for covered transactions required to be collateralized; and 3) places limits on acceptable collateral. These regulations and restrictions may limit the Company’s ability to obtain funds from the Bank for its cash needs, including funds for payments of dividends, interest, and operational expenses.
Tying Arrangements. The Company is prohibited from engaging in certain tie-in arrangements in connection with any extension of credit, sale or lease of property, or furnishing of services. For example, with certain exceptions, neither the Company nor the Bank may condition an extension of credit to a customer on either 1) a requirement that the customer obtain additional services provided by the Company or the Bank; or 2) an agreement by the customer to refrain from obtaining other services from a competitor.
Support of Bank Subsidiaries. Under Federal Reserve policy and the Dodd-Frank Act, the Company is required to act as a source of financial and managerial strength to the Bank. This means that the Company is required to commit, as necessary, capital and resources to support the Bank, including at times when the Company may not be in a financial position to provide such resources or when it may not be in the Company's or its shareholders' best interests to do so. Any capital loans a bank holding company makes to its bank subsidiaries are subordinate to deposits and to certain other indebtedness of the bank subsidiaries.
State Law Restrictions. As a Montana corporation, the Company is subject to certain limitations and restrictions under applicable Montana corporate law. For example, Montana corporate law includes limitations and restrictions relating to indemnification of directors, distributions to shareholders, transactions involving directors, officers, or interested shareholders, maintenance of books, records, and minutes, and observance of certain corporate formalities.
Federal and State Regulation of the Bank
General. Deposits in the Bank, a Montana state-chartered bank with branches in Montana, Idaho, Utah, Washington, Wyoming, Colorado and Arizona, are insured by the FDIC. The Bank is subject to primary supervision, periodic examination, and regulation of the FDIC and the Montana Department of Administration's Banking and Financial Institutions Division. These agencies have the authority to prohibit the Bank from engaging in what they believe constitutes unsafe or unsound banking practices. The federal laws that apply to the Bank regulate, among other things, the scope of its business, its investments, its reserves against deposits, the timing of the availability of deposited funds, and the nature, amount of, and collateral for loans. Federal laws also regulate community reinvestment and insider credit transactions and impose safety and soundness standards. In addition to federal law and the laws of the State of Montana, with respect to the Bank's branches in Idaho, Utah, Washington, Wyoming, Colorado and Arizona, the Bank is also subject to the various laws and regulations governing its activities in those states.
7
Consumer Protection. The Bank is subject to a variety of federal and state consumer protection laws and regulations that govern its relationships and interactions with consumers, including laws and regulations that impose certain disclosure requirements and that govern the manner in which the Bank takes deposits, makes and collects loans, and provides other services. In recent years, examination and enforcement by federal and state banking agencies for non-compliance with consumer protection laws and regulations have increased and become more intense. Failure to comply with these laws and regulations may subject the Bank to various penalties, including but not limited to enforcement actions, injunctions, fines, civil monetary penalties, criminal penalties, punitive damages, and the loss of certain contractual rights. The Bank has established a comprehensive compliance system to ensure consumer protection.
Community Reinvestment. The Community Reinvestment Act of 1977 (“CRA”) requires that, in connection with examinations of financial institutions within their jurisdiction, federal bank regulators evaluate the record of financial institutions in meeting the credit needs of its local communities, including low and moderate-income neighborhoods, consistent with the safe and sound operation of those institutions. A bank’s community reinvestment record is also considered by the applicable banking agencies in evaluating mergers, acquisitions, and applications to open a branch or facility. In some cases, a bank's failure to comply with the CRA or CRA protests filed by interested parties during applicable comment periods can result in the denial or delay of such transactions. The Bank received a “satisfactory” rating in its most recent CRA examination.
Insider Credit Transactions. Banks are subject to certain restrictions on extensions of credit to executive officers, directors, principal shareholders, and their related interests. Extensions of credit 1) must be made on substantially the same terms (including interest rates and collateral) and follow credit underwriting procedures that are at least as stringent as those prevailing at the time for comparable transactions with persons not related to the lending bank; and 2) must not involve more than the normal risk of repayment or present other unfavorable features. Banks are also subject to certain lending limits and restrictions on overdrafts to insiders. A violation of these restrictions may result in the assessment of substantial civil monetary penalties, regulatory enforcement actions, and other regulatory sanctions. The Dodd-Frank Act and federal regulations place additional restrictions on loans to insiders and generally prohibit loans to senior officers other than for certain specified purposes.
Regulation of Management. Federal law 1) sets forth circumstances under which officers or directors of a bank may be removed by the bank's federal supervisory agency; 2) as discussed above, places restraints on lending by a bank to its executive officers, directors, principal shareholders, and their related interests; and 3) generally prohibits management personnel of a bank from serving as directors or in other management positions of another financial institution whose assets exceed a specified amount or which has an office within a specified geographic area.
Safety and Soundness Standards. Certain non-capital safety and soundness standards are also imposed upon banks. These standards cover, among other things, internal controls, information systems and internal audit systems, loan documentation, credit underwriting, interest rate exposure, asset growth, compensation, fees and benefits, such other operational and managerial standards as the agency determines to be appropriate, and standards for asset quality, earnings, and stock valuation. In addition, each insured depository institution must implement a comprehensive written information security program that includes administrative, technical, and physical safeguards appropriate to the institution’s size and complexity and the nature and scope of its activities. The information security program must be designed to ensure the security and confidentiality of customer information, protect against unauthorized access to or use of such information, and ensure the proper disposal of customer and consumer information. An institution that fails to meet these standards may be required to submit a compliance plan, or be subject to regulatory sanctions, including restrictions on growth. The Bank has established comprehensive policies and risk management procedures to ensure the safety and soundness of the Bank.
Interstate Banking and Branching
The Dodd-Frank Act eliminated interstate branching restrictions that were implemented as part of the Riegle-Neal Interstate Banking and Branching Efficiency Act of 1994 ("Interstate Act"), and removed many restrictions on de novo interstate branching by state and federally chartered banks. Federal regulators now have authority to approve applications by such banks to establish de novo branches in states other than the bank's home state if the host state's banks could establish a branch at the same location. The Interstate Act requires regulators to consult with community organizations before permitting an interstate institution to close a branch in a low-income area. Federal bank regulations prohibit banks from using their interstate branches primarily for deposit production and federal bank regulatory agencies have implemented a loan-to-deposit ratio screen to ensure compliance with this prohibition.
8
Dividends
A principal source of the Company’s cash is from dividends received from the Bank, which are subject to regulation and limitation. As a general rule, regulatory authorities may prohibit banks and bank holding companies from paying dividends in a manner that would constitute an unsafe or unsound banking practice. For example, regulators have stated that paying dividends that deplete an institution's capital base to an inadequate level would be an unsafe and unsound banking practice and that an institution should generally pay dividends only out of current operating earnings. In addition, a bank may not pay cash dividends if that payment could reduce the amount of its capital below that necessary to meet minimum applicable regulatory capital requirements. Current guidance from the Federal Reserve provides, among other things, that dividends per share on the Company’s common stock generally should not exceed earnings per share, measured over the previous four fiscal quarters. Under Montana law, the Bank may not declare a dividend greater than the previous two years' net earnings without providing notice to the Montana Department of Administration's Banking and Financial Institutions Division.
Rules adopted in accordance with the third installment of the Basel Accords (“Basel III”) also impose limitations on the Bank's ability to pay dividends. In general, these rules limit the Bank's ability to pay dividends unless the Bank's common equity conservation buffer exceeds the minimum required capital ratio by at least 2.5 percent of risk-weighted assets.
The Federal Reserve has also issued a policy statement on the payment of cash dividends by bank holding companies. In general, the policy statement expresses the view that although no specific regulations restrict dividend payments by bank holding companies other than state corporate laws, a bank holding company should not pay cash dividends unless the bank holding company’s earnings for the past year are sufficient to cover both the cash dividends and a prospective rate of earnings retention that is consistent with the bank holding company’s capital needs, asset quality, and overall financial condition. A bank holding company's ability to pay dividends may also be restricted if a subsidiary bank becomes under-capitalized. These various regulatory policies may affect the Company's and the Bank's ability to pay dividends or otherwise engage in capital distributions.
The Dodd-Frank Act
General. The Dodd-Frank Act was signed into law in July 2010. The Dodd-Frank Act significantly changed the bank regulatory structure and is affecting the lending, deposit, investment, trading, and operating activities of banks and bank holding companies, including the Bank and the Company. Some of the provisions of the Dodd-Frank Act that may impact the Company's and the Bank's business and operations are summarized below. There has been recent discussion of providing some relief from certain provisions of the Dodd-Frank Act for smaller financial institutions. For example, a bipartisan Senate bill has been introduced in an effort to roll back key provisions of the Dodd-Frank Act. However, at this time it is too early to predict the likelihood, timing, and scope of any such amendments.
Corporate Governance. The Dodd-Frank Act requires publicly traded companies to provide their shareholders with 1) a non-binding shareholder vote on executive compensation; 2) a non-binding shareholder vote on the frequency of such vote; 3) disclosure of “golden parachute” arrangements in connection with specified change in control transactions; and 4) a non-binding shareholder vote on golden parachute arrangements in connection with these change in control transactions. In August 2015, the SEC adopted a rule mandated by the Dodd-Frank Act that requires a public company to disclose the ratio of the compensation of its Chief Executive Officer (“CEO”) to the median compensation of its employees. This rule is intended to provide shareholders with information that they can use to evaluate a CEO’s compensation.
Prohibition Against Charter Conversions of Financial Institutions. The Dodd-Frank Act generally prohibits a depository institution from converting from a state to federal charter, or vice versa, while it is the subject to an enforcement action unless the depository institution seeks prior approval from its primary regulator and complies with specified procedures to ensure compliance with the enforcement action.
Repeal of Demand Deposit Interest Prohibition. The Dodd-Frank Act repeals the federal prohibitions on the payment of interest on demand deposits, thereby permitting depository institutions to pay interest on business transaction and other accounts.
9
Consumer Financial Protection Bureau. The Dodd-Frank Act established the Consumer Financial Protection Bureau (the “CFPB”) and empowered it to exercise broad rulemaking, supervision, and enforcement authority for a wide range of consumer protection laws. Since the Company's total consolidated assets exceeded $10 billion during the first quarter of 2018, the Company will now be subject to the direct supervision of the CFPB. The CFPB has issued and continues to issue numerous regulations under which the Company and the Bank will continue to incur additional expense in connection with its ongoing compliance obligations. Significant recent CFPB developments that may affect operations and compliance costs include:
• | positions taken by the CFPB on fair lending, including applying the disparate impact theory which could make it more difficult for lenders to charge different rates or to apply different terms to loans to different customers; |
• | the CFPB's final rule amending Regulation C, which implements the Home Mortgage Disclosure Act, requiring most lenders to report expanded information in order for the CFPB to more effectively monitor fair lending concerns and other information shortcomings identified by the CFPB; |
• | positions taken by the CFPB regarding the Electronic Fund Transfer Act and Regulation E, which require companies to obtain consumer authorizations before automatically debiting a consumer’s account for pre-authorized electronic funds transfers; and |
• | focused efforts on enforcing certain compliance obligations the CFPB deems a priority, such as automobile loan servicing, debt collection, mortgage origination and servicing, remittances, and fair lending, among others. |
Stress Testing
As required by the Dodd-Frank Act, the Federal Reserve and the FDIC published final rules regarding company-run stress testing (“DFAST”). These rules require bank holding companies and banks with average total consolidated assets of $10 billion or more to conduct an annual company-run stress test of capital, consolidated earnings, and losses under one base and at least two stress scenarios provided by federal regulators. Regulators may then consider the results of those stress tests in determining and evaluating capital adequacy, proposed acquisitions, and the safety and soundness of proposed dividends or stock repurchases. The Company exceeded $10 billion in total consolidated assets in the first quarter of 2018. The Company has analyzed these requirements and is developing systems, action plans, policies, procedures and monitoring protocols to ensure that it complies with these stress testing rules.
Interchange Fees
Under the Durbin Amendment to the Dodd-Frank Act, the Federal Reserve adopted rules establishing standards for assessing whether the interchange fees that may be charged with respect to certain electronic transactions are "reasonable and proportional" to the costs incurred by issuers for processing such transactions. Notably, the Federal Reserve's rules set a maximum permissible interchange fee, among other requirements.
As of December 31, 2017, the Company and the Bank qualified for the small issuer exemption from the Federal Reserve's interchange fee cap, which applies to any debit card issuer that has total consolidated assets of less than $10 billion as of the end of the previous calendar year. In the first quarter of 2018, the Company exceeded $10 billion in total consolidated assets and will now be subject to this interchange fee cap. Effective in 2019, the interchange fee cap is expected to have a $13 - $16 million pre-tax annual impact to the Company's earnings.
Capital Adequacy
Banks and bank holding companies are subject to various regulatory capital requirements administered by state and federal regulatory agencies, which involve quantitative measures of assets, liabilities, and certain off-balance sheet items calculated under regulatory guidelines. Capital amounts and classifications are also subject to qualitative judgments by regulators about components, risk weighting, and other factors. The capital requirements are intended to ensure that institutions have adequate capital given the risk levels of assets and off-balance sheet financial instruments and are applied separately to the Company and the Bank.
Federal regulations require insured depository institutions and bank holding companies to meet several minimum capital standards, including: 1) a common equity Tier 1 capital to risk-based assets ratio of 4.5 percent; 2) a Tier 1 capital to risk-based assets ratio of 6 percent; 3) a total capital to risk-based assets ratio of 8 percent; and 4) a 4 percent Tier 1 capital to total assets leverage ratio. These minimum capital requirements became effective in January 2015 and were the result of final rules implementing certain regulatory amendments based on the recommendation of the Basel Committee on Banking Supervision and certain requirements of the Dodd-Frank Act ("Final Rules").
The Final Rules also require a new capital conservation buffer designed to absorb losses during periods of economic stress. The Bank is required to meet this new buffer requirement by 2019 in order to avoid constraints on capital distributions (e.g., dividends, equity repurchases, and certain bonus compensation for executive officers). The Final Rules change the risk-weights of certain assets for purposes of the risk-based capital ratios and phase out certain instruments as qualifying capital.
10
The Final Rules also contain revisions to the prompt corrective action framework, which is designed to place restrictions on an insured depository institution if its capital levels begin to show signs of weakness. Under the prompt corrective action requirements, which are designed to complement the capital conservation buffer, insured depository institutions will be required to meet the following increased capital level requirements to qualify as “well capitalized”: 1) a Tier 1 common equity capital ratio of at least 6.5 percent; 2) a Tier 1 capital ratio of at least 8 percent; 3) a total capital ratio of at least 10 percent; 4) a Tier 1 leverage ratio of at least 5 percent; and 5) not be subject to any order or written directive requiring a specific capital level. The FDIC’s rules (as amended by the Final Rules) contain other capital classification categories, such as “adequately capitalized,” “undercapitalized,” “significantly undercapitalized,” and “critically undercapitalized,” each of which are based on certain capital ratios. An institution may be downgraded to a category lower than indicated by its capital ratios if it is determined to be in an unsafe or unsound condition, or if the institution receives an unsatisfactory examination rating.
The application of the Final Rules may result in lower returns on invested capital, require the raising of additional capital or require regulatory action if the Bank were unable to comply with such requirements. In addition, management may be required to modify its business strategy due to the changes to the asset risk-weights for risk-based capital calculations and the requirement to meet the capital conservation buffers. The imposition of liquidity requirements in connection with these rules could also cause the Bank to increase its holdings of liquid assets, change its business strategy, and make other changes to the terms of its funding. Management believes that, as of December 31, 2017, the Company would meet all capital adequacy requirements under these capital rules on a fully phased-in basis as if all such requirements were currently in effect.
Regulatory Oversight and Examination
Inspections. The Federal Reserve conducts periodic inspections of bank holding companies, such as the Company. In general, the objectives of the Federal Reserve's inspection program are to ascertain whether the financial strength of a bank holding company is maintained on an ongoing basis and to determine the effects or consequences of transactions between a bank holding company or its non-banking subsidiaries and its bank subsidiaries. The inspection type and frequency typically varies depending on asset size, complexity of the organization, and the bank holding company’s rating at its last inspection.
Examinations. Banks are subject to periodic examinations by their primary regulators. In assessing a bank's condition, bank examinations have evolved from reliance on transaction testing to a risk-focused approach. These examinations are extensive and cover the entire breadth of the operations of a bank. Generally, safety and soundness examinations occur on an 18-month cycle for banks under $500 million in total assets that are well capitalized and without regulatory issues, and 12-months otherwise. Examinations alternate between the federal and state bank regulatory agencies, and in some cases they may occur on a combined schedule. The frequency of consumer compliance and CRA examinations is linked to the size of the institution and its compliance and CRA ratings at its most recent examinations. However, the examination authority of the Federal Reserve and the FDIC allows them to examine supervised institutions as frequently as deemed necessary based on the condition of the institution or as a result of certain triggering events. The Company exceeded $10 billion in total consolidated assets in the first quarter of 2018; therefore, the Company will now be subject to the direct supervision of the CFPB.
Commercial Real Estate Ratios. The federal banking regulators recently issued guidance reminding financial institutions to reexamine the existing regulations regarding concentrations in commercial real estate lending. The purpose of the guidance is to guide banks in developing risk management practices and capital levels commensurate with the level and nature of real estate concentrations. The banking regulators are directed to examine each bank’s exposure to commercial real estate loans that are dependent on cash flow from the real estate held as collateral and to focus their supervisory resources on institutions that may have significant commercial real estate loan concentration risk. The guidance provides that the strength of an institution’s lending and risk management practices with respect to such concentrations will be taken into account in evaluating capital adequacy and does not specifically limit a bank’s commercial real estate lending to a specified concentration level.
Corporate Governance and Accounting
The Sarbanes-Oxley Act of 2002 (“SOX Act”) addresses, among other things, corporate governance, auditing and accounting, enhanced and timely disclosure of corporate information, and penalties for non-compliance. In general, the SOX Act 1) requires chief executive officers and chief financial officers to certify to the accuracy of periodic reports filed with the SEC; 2) imposes specific and enhanced corporate disclosure requirements; 3) accelerates the time frame for reporting insider transactions and periodic disclosures by public companies; 4) requires companies to adopt and disclose information about corporate governance practices, including whether or not they have adopted a code of ethics for senior financial officers and whether the audit committee includes at least one “audit committee financial expert”; and 5) requires the SEC, based on certain enumerated factors, to regularly and systematically review corporate filings. As a publicly reporting company, the Company is subject to the requirements of the SOX Act and related rules and regulations issued by the SEC and NASDAQ.
11
Anti-Money Laundering and Anti-Terrorism
The Bank Secrecy Act (“BSA”) requires all financial institutions to establish a risk-based system of internal controls reasonably designed to prevent money laundering and the financing of terrorism. The BSA also sets forth various recordkeeping and reporting requirements (such as reporting suspicious activities that might signal criminal activity) and certain due diligence and "know your customer" documentation requirements.
The Uniting and Strengthening America by Providing Appropriate Tools Required to Intercept and Obstruct Terrorism Act of 2001 (“Patriot Act”), intended to combat terrorism, was renewed with certain amendments in 2006. In relevant part, the Patriot Act 1) prohibits banks from providing correspondent accounts directly to foreign shell banks; 2) imposes due diligence requirements on banks opening or holding accounts for foreign financial institutions or wealthy foreign individuals; 3) requires financial institutions to establish an anti-money laundering compliance program; and 4) eliminates civil liability for persons who file suspicious activity reports. The Patriot Act also includes provisions providing the government with power to investigate terrorism, including expanded government access to bank account records. Regulators are directed to consider a bank holding company’s and a bank’s effectiveness in combating money laundering when reviewing and ruling on applications under the BHCA and the Bank Merger Act. The Company and the Bank have established comprehensive compliance programs designed to comply with the requirements of the BSA and Patriot Act.
Financial Services Modernization
The Gramm-Leach-Bliley Financial Services Modernization Act of 1999 (“GLBA”) brought about significant changes to the laws affecting banks and bank holding companies. Generally, the GLBA 1) repeals historical restrictions on preventing banks from affiliating with securities firms; 2) provides a uniform framework for the activities of banks, savings institutions, and their holding companies; 3) broadens the activities that may be conducted by national banks and banking subsidiaries of bank holding companies; 4) provides an enhanced framework for protecting the privacy of consumer information and requires notification to consumers of bank privacy policies; and 5) addresses a variety of other legal and regulatory issues affecting both day-to-day operations and long-term activities of financial institutions. The Bank is subject to FDIC regulations implementing the privacy provisions of the GLBA. These regulations require a bank to disclose its privacy policy, including informing consumers of the bank's information sharing practices and their right to opt out of certain practices.
Deposit Insurance
FDIC Insured Deposits. The Bank's deposits are insured under the Federal Deposit Insurance Act, up to the maximum applicable limits and are subject to deposit insurance assessments by the FDIC, which are designed to tie what banks pay for deposit insurance to the risks they pose. The Dodd-Frank Act redefined the assessment base used for calculating deposit insurance assessments by requiring the FDIC to determine assessments based on assets instead of deposits. Assessments are now based on the average consolidated total assets less average tangible equity capital of a financial institution. In addition, the Dodd-Frank Act 1) raised the minimum designated reserve ratio (the FDIC is required to set the reserve ratio each year) of the DIF from 1.15 percent to 1.35 percent; 2) required that the DIF reserve ratio meet 1.35 percent by 2020; and 3) eliminated the requirement that the FDIC pay dividends to insured depository institutions when the reserve ratio exceeds certain thresholds. The Dodd-Frank Act made banks with $10 billion or more in total assets, which threshold the Bank exceeded in the first quarter of 2018, responsible for the increase from 1.15 percent to 1.35 percent. No institution may pay a dividend if it is in default on its federal deposit insurance assessment. The FDIC may also prohibit any insured institution from engaging in any activity determined by regulation or order to pose a serious risk to the DIF.
Safety and Soundness. The FDIC may terminate the deposit insurance of any insured depository institution if the FDIC determines after a hearing that the institution has engaged or is engaging in unsafe or unsound practices, is in an unsafe or unsound condition to continue operations, or has violated any applicable law, regulation, order, or any condition imposed by an agreement with the FDIC. Management is not aware of any existing circumstances that would result in termination of the Bank's deposit insurance.
Insurance of Deposit Accounts. The Dodd-Frank Act permanently increased FDIC deposit insurance from $100,000 to $250,000 per depositor. The FDIC insurance coverage limit applies per depositor, per insured depository institution for each account ownership category.
Recent and Proposed Legislation
The economic and political environment of the past several years has led to a number of proposed legislative, governmental, and regulatory initiatives that may significantly impact the banking industry. Other regulatory initiatives by federal and state agencies may also significantly impact the Company's and the Bank’s business. The Company and the Bank cannot predict whether these or any other proposals will be enacted or the ultimate impact of any such initiatives on its operations, competitive situation, financial conditions, or results of operations. While recent history has demonstrated that new legislation or changes to existing laws or regulations typically result in a greater compliance burden (and therefore increase the general costs of doing business), the current administration has expressed an attempt to reduce these regulatory burdens.
12
On December 22, 2017, a law commonly known as the Tax Cuts and Jobs Act (“Tax Act”) was signed into law by President Donald Trump. Among other provisions, the Tax Act reduced the federal corporate tax rate to 21 percent from the existing maximum rate of 35 percent. As a result of the Tax Act, the effective tax rate for the Company is expected to be reduced to a range of 17 to 18 percent. The Tax Act also limits the ability of financial institutions with assets of $10 billion or more to deduct insurance premiums paid to the FDIC. While the Company has evaluated the impact of the Tax Act with respect to the tax rate, it is too early to determine other potential impacts of the Tax Act on the Company.
Effects of Federal Government Monetary Policy
The Company’s earnings and growth are affected not only by general economic conditions, but also by the fiscal and monetary policies of the federal government, particularly the Federal Reserve. The Federal Reserve implements national monetary policy to promote maximum employment, stable prices, and moderate long-term interest rates. Through its open market operations in U.S. government securities, control of the discount rate applicable to borrowings, establishment of reserve requirements against certain deposits, and control of the interest rate applicable to excess reserve balances and reverse repurchase agreements, the Federal Reserve influences the availability and cost of money and credit and, ultimately, a range of economic variables including employment, output, and the prices of goods and services. The nature and impact of future changes in monetary policies and their impact on the Company and the Bank cannot be predicted with certainty.
Heightened Requirements for Bank Holding Companies with $10 Billion or More in Assets
Various federal banking laws and regulations impose heightened requirements on certain large banks and bank holding companies. Most of these rules apply primarily to banks and bank holding companies with at least $50 billion in total consolidated assets, but certain rules also apply to banks and bank holding companies with at least $10 billion in total consolidated assets. For example, because the Company exceeded this $10 billion threshold in the first quarter of 2018, it will be required to, among other requirements:
• | perform annual stress tests; |
• | maintain a dedicated risk committee responsible for overseeing enterprise-wide risk management policies; |
• | calculate its FDIC deposit assessment base using a performance score and a loss-severity score system; and |
• | be examined for compliance with federal consumer protection laws primarily by the CFPB. |
The Company has analyzed these heightened requirements to ensure that it will comply with these rules.
Item 1A. Risk Factors
The following is a discussion of what the Company believes are the most significant risks and uncertainties that may affect the Company’s business, financial condition and future results.
Economic conditions in the market areas the Bank serves may adversely impact its earnings and could increase the credit risk associated with its loan portfolio and the value of its investment portfolio.
Substantially all of the Bank’s loans are to businesses and individuals in Montana, Idaho, Utah, Washington, Wyoming, Colorado and Arizona, and a softening of the economies in these market areas could have a material adverse effect on its business, financial condition, results of operations and prospects. Any future deterioration in economic conditions in the markets the Bank serves could result in the following consequences, any of which could have an adverse impact, which could be material, on the Company’s business, financial condition, results of operations and prospects:
• | loan delinquencies may increase; |
• | problem assets and foreclosures may increase; |
• | collateral for loans made may decline in value, in turn reducing customers’ borrowing power; |
• | certain securities within the investment portfolio could become other-than-temporarily impaired, requiring a write-down through earnings to fair value, thereby reducing equity; |
• | low cost or non-interest bearing deposits may decrease; and |
• | demand for loan and other products and services may decrease. |
13
National and global economic and geopolitical conditions could adversely affect the Company’s future results of operations or market price of its stock.
The Company’s business is impacted by factors such as economic, political and market conditions, broad trends in industry and finance, changes in government monetary and fiscal policies, inflation, and financial market volatility, all of which are beyond the Company’s control. National and global economies are constantly in flux, as evidenced by recent market volatility resulting from, among other things, a relatively new presidential administration and new tax and economic policies associated therewith (e.g., Tax Act), the uncertain future relationship of the United Kingdom with the European Union (e.g., Brexit), and the ever-changing landscape of the energy industry. Future economic conditions cannot be predicted, and any renewed deterioration in the economies of the nation as a whole or in the Company’s markets could have an adverse effect, which could be material, on its business, financial condition, results of operations and prospects, and could cause the market price of the Company’s stock to decline.
The Company will be subject to heightened regulatory requirements when the Company exceeds $10 billion in assets.
The Company exceeded its total consolidated assets of $10 billion during the first quarter of 2018. The Dodd-Frank Act and its implementing regulations impose additional requirements on bank holding companies with $10 billion or more in total assets, including compliance with specific sections of the Federal Reserve's prudential oversight requirements and annual stress testing requirements. The Durbin Amendment, which was passed as part of Dodd-Frank, instructed the Federal Reserve to establish rules limiting the amount of interchange fees that can be charged to merchants for debit card processing. The Federal Reserve's final rules contained several key pieces, including in relevant part an interchange fee cap, certain fraud prevention adjustments, and, most notably, an exemption from the interchange fee cap for small issuers. Issuers with less than $10 billion in total assets (as of the end of the previous calendar year) are exempt from the Federal Reserve's interchange fee cap. As soon as the Company's total assets exceeded $10 billion, the interchange fee cap of the Durbin Amendment negatively affects the interchange income the Bank receives from electronic payment transactions. The interchange fee cap becomes effective to the Company commencing in 2019.
In addition, banks with $10 billion or more in total assets are primarily examined by the CFPB with respect to compliance with various federal consumer financial protection laws and regulations. As a fairly new agency with evolving regulations and practices, it is uncertain as to how the CFPB's examinations and regulatory authority may impact the Company's business.
A failure in or breach of the Bank’s operational or security systems, or those of the Bank’s third party service providers, including as a result of cyber attacks, could disrupt business, result in the disclosure or misuse of confidential or proprietary information, damage the Company’s reputation, increase costs and cause losses.
The Bank’s operations rely heavily on the secure processing, storage and transmission of confidential and other information on its computer systems and networks. Any failure, interruption or breach in security or operational integrity of these systems could result in failures or disruptions in the Bank’s online banking system, customer relationship management, general ledger, deposit and loan servicing, financial reporting and other systems. The security and integrity of the Bank’s systems could be threatened by a variety of interruptions or information security breaches, including those caused by computer hacking, cyber attacks, electronic fraudulent activity or attempted theft of financial assets. The Bank cannot assure that any such failures, interruption or security breaches will not occur, or if they do occur, that they will be adequately addressed. While the Bank has certain protective policies and procedures in place, the nature and sophistication of the threats continue to evolve. The Bank may be required to expend significant additional resources in the future to modify and enhance its protective measures.
Additionally, the Bank faces the risk of operational disruption, failure, termination or capacity constraints of any of the third parties that facilitate its business activities, including exchanges, clearing agents, clearing houses or other financial intermediaries. Such parties could also be the source of an attack on, or breach of, the Bank’s operational systems.
Any failures, interruptions or security breaches in the Bank’s information systems could damage its reputation, result in a loss of customer business, result in a violation of privacy or other laws, or expose the Company to civil litigation, regulatory fines or losses not covered by insurance.
The allowance for loan and lease losses may not be adequate to cover actual loan losses, which could adversely affect earnings.
The Bank maintains an allowance for loan and lease losses (“ALLL” or “allowance”) in an amount that it believes is adequate to provide for losses in the loan portfolio. While the Bank strives to carefully manage and monitor credit quality and to identify loans that may become non-performing, at any time there are loans included in the portfolio that will result in losses, but that have not been identified as non-performing or potential problem loans. With respect to real estate loans and property taken in satisfaction of such loans (“other real estate owned” or “OREO”), the Bank can be required to recognize significant declines in the value of the underlying real estate collateral quite suddenly as values are updated through appraisals and evaluations (new or updated) performed in the normal course of monitoring the credit quality of the loans. There are many factors that can cause the value of real estate to decline, including declines in the general real estate market, changes in methodology applied by appraisers, and/or using a different appraiser than was used for the prior appraisal or evaluation. The Bank’s ability to recover on real estate loans by selling or disposing of the underlying real estate collateral is adversely impacted by declining values, which increases the likelihood the Bank will suffer losses on defaulted loans beyond the amounts provided for in the ALLL. This, in turn, could require material increases in the Bank’s provision for loan losses and ALLL.
14
By closely monitoring credit quality, the Bank attempts to identify deteriorating loans before they become non-performing assets and adjust the ALLL accordingly. However, because future events are uncertain, and if difficult economic conditions occur, there may be loans that deteriorate to a non-performing status in an accelerated time frame. As a result, future additions to the ALLL may be necessary beyond the levels commensurate with any loan growth. Because the loan portfolio contains a number of loans with relatively large balances, the deterioration of one or a few of these loans may cause a significant increase in non-performing loans, requiring an increase to the ALLL. Additionally, future significant additions to the ALLL may be required based on changes in the mix of loans comprising the portfolio, changes in the financial condition of borrowers, which may result from changes in economic conditions, or changes in the assumptions used in determining the ALLL. Additionally, federal and state banking regulators, as an integral part of their supervisory function, periodically review the Bank’s loan portfolio and the adequacy of the ALLL. These regulatory authorities may require the Bank to recognize further loan loss provisions or charge-offs based upon their judgments, which may be different from the Bank’s judgments. Any increase in the ALLL could have an adverse effect, which could be material, on the Company’s financial condition and results of operations.
The Bank has a high concentration of loans secured by real estate, so any future deterioration in the real estate markets could require material increases in the ALLL and adversely affect the Company’s financial condition and results of operations.
The Bank has a high degree of concentration in loans secured by real estate. Any future deterioration in the real estate markets could adversely impact borrowers’ ability to repay loans secured by real estate and the value of real estate collateral, thereby increasing the credit risk associated with the loan portfolio. The Bank’s ability to recover on these loans by selling or disposing of the underlying real estate collateral would be adversely impacted by any decline in real estate values, which increases the likelihood that the Bank will suffer losses on defaulted loans secured by real estate beyond the amounts provided for in the ALLL. This, in turn, could require material increases in the ALLL which would adversely affect the Company’s financial condition and results of operations.
Non-performing assets could increase, which could adversely affect the Company’s results of operations and financial condition.
The Bank may experience increases in non-performing assets in the future. Non-performing assets (which include OREO) adversely affect the Company’s financial condition and results of operations in various ways. The Bank does not record interest income on non-accrual loans or OREO, thereby adversely affecting its earnings. When the Bank takes collateral in foreclosures and similar proceedings, it is required to mark the related asset to the then fair value of the collateral, less estimated cost to sell, which may result in a charge-off of the value of the asset and lead the Bank to increase the provision for loan losses. An increase in the level of non-performing assets also increases the Bank’s risk profile and may impact the capital levels its regulators believe are appropriate in light of such risks. Further decreases in the value of these assets, or the underlying collateral, or in these borrowers’ performance or financial condition, whether or not due to economic and market conditions beyond the Bank’s control, could adversely affect the Company’s business, results of operations and financial condition, perhaps materially. In addition to the carrying costs to maintain OREO, the resolution of non-performing assets increases the Bank’s loan administration costs generally, and requires significant commitments of time from management and the Company’s directors, which reduces the time they have to focus on profitably growing the Company’s business.
The Bank’s loan portfolio mix increases the exposure to credit risks tied to deteriorating conditions.
The loan portfolio contains a high percentage of commercial, commercial real estate, real estate acquisition and development loans in relation to the total loans and total assets. These types of loans have historically been viewed as having more risk of default than residential real estate loans or certain other types of loans or investments. In fact, the FDIC has issued pronouncements alerting banks of its concern about banks with a heavy concentration of commercial real estate loans. These types of loans also typically are larger than residential real estate loans and other commercial loans. Because the Bank’s loan portfolio contains a significant number of commercial and commercial real estate loans with relatively large balances, the deterioration of one or more of these loans may cause a significant increase in non-performing loans. An increase in non-performing loans could result in a loss of earnings from these loans, an increase in the provision for loan losses, or an increase in charge-offs, which could have a material adverse impact on results of operations and financial condition.
Competition in the Bank’s market areas may limit future success.
Commercial banking is a highly competitive business and a consolidating industry. The Bank competes with other commercial banks, credit unions, finance, insurance and other non-depository companies operating in its market areas. The Bank is subject to substantial competition for loans and deposits from other financial institutions. Some of its competitors are not subject to the same degree of regulation and restriction as the Bank. Some of the Bank’s competitors have greater financial resources than the Bank. If the Bank is unable to effectively compete in its market areas, the Bank’s business, results of operations and prospects could be adversely affected.
15
Fluctuating interest rates can adversely affect profitability.
The Bank’s profitability is dependent to a large extent upon net interest income, which is the difference (or “spread”) between the interest earned on loans, investment securities and other interest earning assets and interest paid on deposits, borrowings, and other interest bearing liabilities. Because of the differences in maturities and repricing characteristics of interest earning assets and interest bearing liabilities, changes in interest rates do not produce equivalent changes in interest income earned on interest earning assets and interest paid on interest bearing liabilities. Accordingly, fluctuations in interest rates could adversely affect the Bank’s interest rate spread, and, in turn, profitability. The Bank seeks to manage its interest rate risk within well established policies and guidelines. Generally, the Bank seeks an asset and liability structure that insulates net interest income from large deviations attributable to changes in market rates. However, the Bank’s structures and practices to manage interest rate risk may not be effective in a highly volatile rate environment. In December 2017, the Federal Reserve increased the federal funds target range by 0.25 percent from 1.25 to 1.50 percent and has indicated further increases could continue depending on economic conditions.
The Company may not be able to continue to grow organically or through acquisitions.
Historically, the Company has expanded through a combination of organic growth and acquisitions. If market and regulatory conditions become more challenging, the Company may be unable to grow organically or successfully complete or integrate potential future acquisitions. The Company has historically used its strong stock currency to complete acquisitions. Downturns in the stock market and the trading price of the Company’s stock could have an impact on future acquisitions. Furthermore, there can be no assurance that the Company can successfully complete such transactions, since they are subject to regulatory review and approval.
Growth through future acquisitions could, in some circumstances, adversely affect profitability or other performance measures.
During 2017 and in prior years, the Company has been active in acquisitions and may in the future engage in selected acquisitions of additional financial institutions. There are risks associated with any such acquisitions that could adversely affect profitability and other performance measures. These risks include, among other things, incorrectly assessing the asset quality of a financial institution being acquired, discovering compliance or regulatory issues after the acquisition, encountering greater than anticipated cost and use of management time associated with integrating acquired businesses into the Company’s operations, and being unable to profitably deploy funds acquired in an acquisition. The Company may not be able to continue to grow through acquisitions, and if it does, there is a risk of negative impacts of such acquisitions on the Company’s operating results and financial condition.
Acquisitions may also cause business disruptions that cause the Bank to lose customers or cause customers to remove their accounts from the Bank and move to competing financial institutions. Further, acquisitions may also disrupt the Bank's ongoing businesses or create inconsistencies in standards, controls, procedures, and policies that adversely affect relationships with employees, clients, customers, and depositors. The loss of key employees during acquisitions may also adversely affect the Company's business.
The Company anticipates that it might issue capital stock in connection with future acquisitions. Acquisitions and related issuances of stock may have a dilutive effect on earnings per share, book value per share, or the percentage ownership of current shareholders. In acquisitions involving the use of cash as consideration, there will be an impact on the Company's capital position.
The Company’s business is heavily dependent on the services of members of the senior management team.
The Company believes its success to date has been substantially dependent on its executive management team. In addition, the Company’s unique model relies upon the Presidents of its separate Bank divisions, particularly in light of the Company’s decentralized management structure in which such Bank divisions have significant local decision-making authority. The unexpected loss of any of these persons could have an adverse effect on the Company’s business and future growth prospects.
The Company’s future performance will depend on its ability to respond to technological change.
The financial services industry is experiencing rapid technological changes with frequent introductions of new technology-driven products and services. Effective use of technology increase efficiency and enables financial institutions to better serve customers and to reduce costs. Many of the Company’s competitors have substantially greater resources to invest in technological improvements than the Company does. The Company’s future success will depend, to some degree, upon its ability to address the needs of its customers by using technology to provide products and services that will satisfy customer demands for convenience, as well as create additional efficiencies in the Company’s operations. The Company may not be able to effectively implement new technology-driven products or services, or be successful in marketing these products and services. Additionally, the implementation of technological changes and upgrades to maintain current systems and integrate new ones may cause services interruptions, transaction processing errors and system conversion delays and may cause the Company to fail to comply with applicable laws. There can be no assurance that the Company will be able to successfully manage the risks associated with increased dependency on technology.
16
A decline in the fair value of the Bank’s investment portfolio could adversely affect earnings and capital.
The fair value of the Bank’s investment securities could decline as a result of factors including changes in market interest rates, tax reform, credit quality and credit ratings, lack of market liquidity and other economic conditions. An investment security is impaired if the fair value of the security is less than the carrying value. When a security is impaired, the Bank determines whether the impairment is temporary or other-than-temporary. If an impairment is determined to be other-than-temporary, an impairment loss is recognized by reducing the amortized cost only for the credit loss associated with the other-than-temporary loss with a corresponding charge to earnings for a like amount. Any such impairment charge would have an adverse effect, which could be material, on the Company’s results of operations and financial condition, including its capital.
The size of the investment portfolio has declined over the past few years and represents 25 percent of total assets at December 31, 2017 and 33 percent of total assets at December 31, 2016. While the Bank believes that the terms of such investments have been kept relatively short, the Bank is subject to elevated interest rate risk exposure if rates were to increase sharply. Further, investment securities present a different type of asset quality risk than the loan portfolio. At December 31, 2017, the investment portfolio consisted of 73 percent available-for-sale and 27 percent held-to-maturity designated investment securities. While the Company believes a relatively conservative management approach has been applied to the investment portfolio, there is always potential loss exposure under changing economic conditions.
Interest rate swaps expose the Bank to certain risks, and may not be effective in mitigating exposure to changes in interest rates.
The Bank has entered into interest rate swap agreements in order to manage a portion of the interest rate volatility risk. The Bank anticipates that it may enter into additional interest rate swaps. These swap agreements involve other risks, such as the risk that the counterparty may fail to honor its obligations under these arrangements, leaving the Bank vulnerable to interest rate movements. The Bank’s current interest rate swap agreements include bilateral collateral agreements whereby the net fair value position is collateralized by the party in a net liability position. The bilateral collateral agreements reduce the Bank’s counterparty risk exposure. There can be no assurance that these arrangements will be effective in reducing the Bank’s exposure to changes in interest rates.
If goodwill recorded in connection with acquisitions becomes additionally impaired, it could have an adverse impact on earnings and capital.
Accounting standards require the Company to account for acquisitions using the acquisition method of accounting. Under acquisition accounting, if the purchase price of an acquired company exceeds the fair value of its net assets, the excess is carried on the acquirer’s balance sheet as goodwill. In accordance with accounting principles generally accepted in the United States of America (“GAAP”), goodwill is not amortized but rather is evaluated for impairment on an annual basis or more frequently if events or circumstances indicate that a potential impairment exists. The Company's goodwill was not considered impaired as of December 31, 2017 and 2016; however, there can be no assurance that future evaluations of goodwill will not result in findings of impairment and write-downs, which could be material. While a non-cash item, impairment of goodwill could have a material adverse effect on the Company’s business, financial condition and results of operations. Furthermore, impairment of goodwill could subject the Company to regulatory limitations, including the ability to pay dividends on its common stock.
There can be no assurance the Company will be able to continue paying dividends on its common stock at recent levels.
The Company may not be able to continue paying quarterly dividends commensurate with recent levels given that the ability to pay dividends on the Company’s common stock depends on a variety of factors. The payment of dividends is subject to government regulation in that regulatory authorities may prohibit banks and bank holding companies from paying dividends that would constitute an unsafe or unsound banking practice. This is heavily based on the Company’s earnings and capital levels which currently are strong. Current guidance from the Federal Reserve provides, among other things, that dividends per share should not exceed earnings per share measured over the previous four fiscal quarters. The Bank is also subject to Montana state law and cannot declare a dividend greater than the previous two years’ net earnings without providing notice to the state. As a result, future dividends will generally depend on the level of earnings at the Bank.
The Company and the Bank operate in a highly regulated environment and changes or increases in, or supervisory enforcement of, banking or other laws and regulations or governmental fiscal or monetary policies could adversely affect the Company.
The Company and the Bank are subject to extensive regulation, supervision and examination by federal and state banking regulators. In addition, as a publicly-traded company, the Company is subject to regulation by the SEC. Any change in applicable regulations or federal, state or local legislation or in policies or interpretations or regulatory approaches to compliance and enforcement, income tax laws and accounting principles could have a substantial impact on the Company and its operations. Changes in laws and regulations may also increase expenses by imposing additional fees or taxes or restrictions on operations. Additional legislation and regulations that could significantly affect powers, authority and operations may be enacted or adopted in the future, which could have a material adverse effect on the Company’s financial condition and results of operations. Failure to appropriately comply with any such laws, regulations or principles could result in sanctions by regulatory agencies or damage to the Company’s reputation, all of which could adversely affect the Company’s business, financial condition or results of operations.
17
Regulators have significant discretion and authority to prevent or remedy unsafe or unsound practices or violations of laws or regulations by financial institutions and bank holding companies in the performance of their supervisory and enforcement duties. Existing and proposed federal and state laws and regulations restrict, limit and govern all aspects of the Company’s activities and may affect the ability to expand its business over time, may result in an increase in the Company’s compliance costs, and may affect its ability to attract and retain qualified executive officers and employees. Recently, these powers have been utilized more frequently due to the challenging national, regional and local economic conditions. The exercise of regulatory authority may have a negative impact on the Company’s financial condition and results of operations, including limiting the types of financial services and products the Company may offer or increasing the ability of non-banks to offer competing financial services and products. Additionally, the Company’s business is affected significantly by the fiscal and monetary policies of the federal government and its agencies, including the Federal Reserve.
The Company cannot accurately predict the full effects of recent legislation or the various other governmental, regulatory, monetary and fiscal initiatives which have been and may be enacted on the financial markets and on the Company. The terms and costs of these activities, or the failure of these actions to help stabilize the financial markets, asset prices, market liquidity and a continuation or worsening of current financial market and economic conditions could materially and adversely affect the Company’s business, financial condition, results of operations, and the trading price of the Company’s common stock
The FDIC has adopted a final rule to increase the federal Deposit Insurance Fund, including additional future premium increases and special assessments.
On March 15, 2016, the FDIC adopted a final rule to increase insurance premiums and has imposed special assessments to rebuild and maintain the DIF, and any additional future premium increases or special assessments could have a material adverse effect on the Company’s business, financial condition, and results of operations. Additional information regarding this matter is set forth under the heading “Supervision and Regulation” in “Item 1. Business.”
The Dodd-Frank Act broadened the base for FDIC insurance assessments. In addition, the Dodd-Frank Act established 1.35 percent as the minimum DIF reserve ratio. The FDIC has determined that the fund reserve ratio should be 2.0 percent (which is beyond what is required by law) and has adopted a plan under which it will meet the statutory minimum fund reserve ratio of 1.35 percent by the statutory deadline of September 30, 2020. The Dodd-Frank Act made banks with $10 billion or more in total assets responsible for the increase from 1.15 percent to 1.35 percent. The increase is effective for banks in the first quarter following four consecutive quarters of total consolidated assets exceeding $10 billion. Since the Bank exceeded the $10 billion asset threshold in the first quarter of 2018, the increase in deposit insurance assessments to be paid by the Bank is expected to be effective in the first quarter of 2019.
The impact of Basel III is uncertain.
Basel III sets forth more robust global regulatory standards on capital adequacy, qualifying capital instruments, leverage ratios, market liquidity risk, and stress testing, which may be stricter than standards currently in place. The phase-in period for Basel III began on January 1, 2015 and will end on January 1, 2019. The implementation of these new standards could have an adverse impact on the Company’s financial position and future earnings due to, among other things, the increased Tier 1 capital ratio requirements being implemented. Additional information regarding Basel III is set forth under the heading “Supervision and Regulation” in “Item 1. Business.”
The Company has various anti-takeover measures that could impede a takeover.
The Company’s articles of incorporation include certain provisions that could make it more difficult to acquire the Company by means of a tender offer, a proxy contest, merger or otherwise. These provisions include a requirement that any “Business Combination” (as defined in the articles of incorporation) be approved by at least 80 percent of the voting power of the then outstanding shares, unless it is either approved by the Company’s Board or certain price and procedural requirements are satisfied. In addition, the authorization of preferred stock, which is intended primarily as a financing tool and not as a defensive measure against takeovers, may potentially be used by management to make more difficult uninvited attempts to acquire control of the Company. These provisions may have the effect of lengthening the time required to acquire control of the Company through a tender offer, proxy contest or otherwise, and may deter any potentially unfriendly offers or other efforts to obtain control of the Company. This could deprive the Company’s shareholders of opportunities to realize a premium for their common stock in the Company, even in circumstances where such action is favored by a majority of the Company’s shareholders.
The Company's business is subject to the risks of earthquakes, floods, fires, and other natural catastrophes.
With Bank branches located in Montana, Idaho, Utah, Washington, Wyoming, Colorado and Arizona, the Company's business could be affected by a major natural catastrophe, such as a fire, flood, earthquake, or other natural disaster. The occurrence of any of these natural disasters may result in a prolonged interruption of the Company's business, which could have a material adverse effect on the Company's financial condition and operations.
18
Item 1B. Unresolved Staff Comments
None
Item 2. Properties
The following schedule provides information on the Company’s 145 properties as of December 31, 2017:
(Dollars in thousands) | Properties Leased | Properties Owned | Net Book Value | ||||||
Montana | 7 | 52 | $ | 82,614 | |||||
Idaho | 7 | 21 | 27,981 | ||||||
Utah | 1 | 3 | 2,147 | ||||||
Washington | 3 | 10 | 5,959 | ||||||
Wyoming | 1 | 15 | 16,567 | ||||||
Colorado | 2 | 18 | 15,574 | ||||||
Arizona | 3 | 2 | 5,231 | ||||||
24 | 121 | $ | 156,073 | ||||||
The Company believes that all of its facilities are well maintained, generally adequate and suitable for the current operations of its business, as well as fully utilized. In the normal course of business, new locations and facility upgrades occur as needed.
For additional information regarding the Company’s premises and equipment and lease obligations, see Note 4 to the Consolidated Financial Statements in “Item 8. Financial Statements and Supplementary Data.”
Item 3. Legal Proceedings
The Company is involved in various claims, legal actions and complaints which arise in the ordinary course of business. In the Company’s opinion, all such matters are adequately covered by insurance, are without merit or are of such kind, or involve such amounts, that unfavorable disposition would not have a material adverse effect on the financial condition or results of operations of the Company.
Item 4. Mine Safety Disclosures
Not Applicable
19
PART II
Item 5. Market for Registrant’s Common Equity, Related Stockholder Matters
and Issuer Purchases of Equity Securities
The Company’s stock trades on the NASDAQ Global Select Market under the symbol: GBCI. As of December 31, 2017, there were approximately 1,691 shareholders of record for the Company’s common stock. The market range of high and low sales prices for the Company’s common stock for the periods indicated are shown below:
2017 | 2016 | |||||||||||
High | Low | High | Low | |||||||||
First quarter | $ | 38.17 | 31.70 | 26.50 | 21.90 | |||||||
Second quarter | 37.41 | 31.56 | 27.84 | 24.18 | ||||||||
Third quarter | 38.18 | 31.38 | 30.12 | 25.09 | ||||||||
Fourth quarter | 41.23 | 35.50 | 37.87 | 27.31 | ||||||||
The following table summarizes the Company’s dividends declared during the periods indicated:
Years ended | ||||||
December 31, 2017 | December 31, 2016 | |||||
First quarter | $ | 0.21 | 0.20 | |||
Second quarter | 0.21 | 0.20 | ||||
Third quarter | 0.21 | 0.20 | ||||
Fourth quarter | 0.21 | 0.20 | ||||
Special | 0.30 | 0.30 | ||||
Total | $ | 1.14 | 1.10 | |||
Future cash dividends will depend on a variety of factors, including net income, capital, asset quality, general economic conditions and regulatory considerations. Information regarding the regulation considerations is set forth under the heading “Supervision and Regulation” in “Item 1. Business.”
Issuer Stock Purchases
The Company made no stock repurchases during 2017.
20
Stock Performance Graphs
The following graphs compare the yearly cumulative total return of the Company’s common stock over both a five-year and ten-year measurement period with the yearly cumulative total return on the stocks included in 1) the Russell 2000 Index; and 2) the SNL Bank Index comprised of banks and bank holding companies with total assets between $5 billion and $10 billion. Each of the cumulative total returns is computed assuming the reinvestment of dividends at the frequency with which dividends were paid during the applicable years.
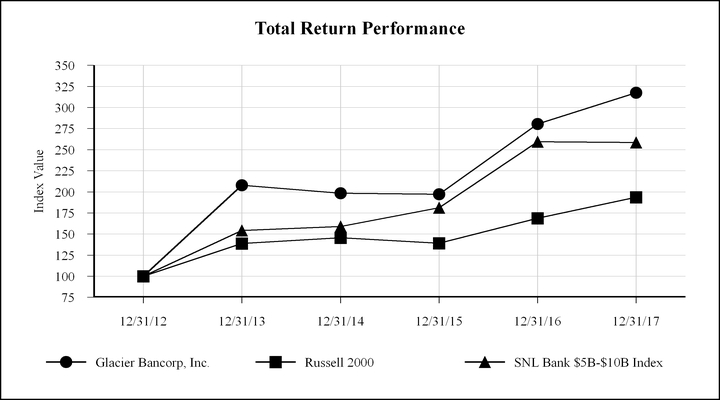
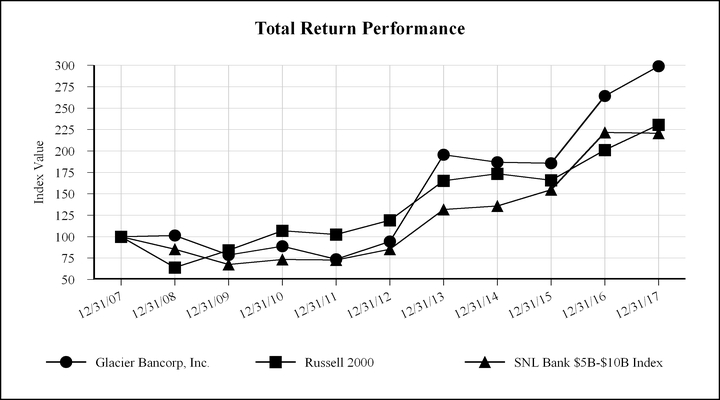
21
Item 6. Selected Financial Data
Non-GAAP Financial Measures
In addition to the results presented in accordance with GAAP, this Annual Report on Form 10-K contains certain non-GAAP financial measures. The Company believes that providing these non-GAAP financial measures provides investors with information useful in understanding the Company’s financial performance, performance trends, and financial position. While the Company uses these non-GAAP measures in its analysis of the Company’s performance, this information should not be considered an alternative to measurements required by GAAP. The following table provides a reconciliation of certain GAAP financial measures to non-GAAP financial measures.
Year ended December 31, 2017 | |||||||||
(Dollars in thousands, except per share data) | GAAP | Tax Act Adjustment | Non-GAAP | ||||||
Federal and state income tax expense | $ | 64,625 | (19,699 | ) | 44,926 | ||||
Net income | $ | 116,377 | 19,699 | 136,076 | |||||
Basic earnings per share | $ | 1.50 | 0.25 | 1.75 | |||||
Diluted earnings per share | $ | 1.50 | 0.25 | 1.75 | |||||
Return on average assets | 1.20 | % | 0.21 | % | 1.41 | % | |||
Return on average equity | 9.80 | % | 1.66 | % | 11.46 | % | |||
Dividend payout ratio | 76.00 | % | (10.86 | )% | 65.14 | % | |||
Effective tax rate | 35.70 | % | (10.88 | )% | 24.82 | % | |||
The reconciling item between the GAAP and non-GAAP financial measures was the current year one-time net tax expense of $19.7 million. The one-time net tax expense was driven by the Tax Act and the change in the current year federal marginal rate of 35 percent to 21 percent for future years, which resulted in this revaluation of its deferred tax assets and deferred tax liabilities (“net deferred tax asset”). The Company believes the financial results are more comparable excluding the impact of the revaluation of the net deferred tax asset.
Basic earnings per share is calculated by dividing net income by average outstanding shares and diluted earnings per share is calculated by dividing net income by diluted average outstanding shares. The one-time net tax expense of $19.7 million was included in determining income for both the GAAP basic earnings per share and the GAAP diluted earnings per share. Conversely, the one-time net tax expense of $19.7 million was excluded in determining income for both the non-GAAP basic earnings per share and the non-GAAP diluted earnings per share. Average outstanding shares of 77,537,664 was used in the GAAP and non-GAAP basic earnings per share for the year ended December 31, 2017. Diluted average outstanding shares of 77,607,605 was used in the GAAP and non-GAAP diluted earnings per share for the year ended December 31, 2017.
The return on average assets ratio is calculated by dividing net income by average assets and the return on average equity ratio is calculated by dividing net income by average equity. The one-time net tax expense of $19.7 million was included in determining income for both the GAAP return on average assets and the GAAP return on average equity. Conversely, the one-time net tax expense of $19.7 million was excluded in determining income for both the non-GAAP return on average assets and the non-GAAP return on average equity. Average assets of $9.678 billion was used in the GAAP and non-GAAP return on average assets ratios for the year ended December 31, 2017. Average equity of $1.188 billion was used in the GAAP and non-GAAP return on average equity ratios for the year ended December 31, 2017.
The dividend payout ratio is calculated by dividing dividends declared per share by basic earnings per share. The non-GAAP dividend payout ratio uses the non-GAAP basic earnings per share for calculating the ratio.
The effective tax rate is calculated by dividing federal and state income tax expense by income before income taxes. The non-GAAP effective tax rate uses the non-GAAP federal and state income tax expense of $44.9 million for calculating the rate.
22
Selected Financial Data
The following financial data of the Company is derived from the Company’s historical audited financial statements and related notes. The information set forth below should be read in conjunction with “Item 7. Management’s Discussion and Analysis of Financial Condition and Results of Operations” and “Item 8. Financial Statements and Supplementary Data” contained elsewhere in this Annual Report on Form 10-K.
December 31, | Compounded Annual Growth Rate | |||||||||||||||||||
(Dollars in thousands, except per share data) | 2017 | 2016 | 2015 | 2014 | 2013 | 1-Year | 5-Year | |||||||||||||
Selected Statements of Financial Condition Information | ||||||||||||||||||||
Total assets | $9,706,349 | $9,450,600 | $9,089,232 | $8,306,507 | $7,884,350 | 2.7 | % | 4.2 | % | |||||||||||
Investment securities | 2,426,556 | 3,101,151 | 3,312,832 | 2,908,425 | 3,222,829 | (21.8 | )% | (5.5 | )% | |||||||||||
Loans receivable, net | 6,448,256 | 5,554,891 | 4,948,984 | 4,358,342 | 3,932,487 | 16.1 | % | 10.4 | % | |||||||||||
Allowance for loan and lease losses | (129,568) | (129,572) | (129,697) | (129,753) | (130,351) | — | % | (0.1 | )% | |||||||||||
Goodwill and intangibles | 191,995 | 159,400 | 155,193 | 140,606 | 139,218 | 20.4 | % | 6.6 | % | |||||||||||
Deposits | 7,579,747 | 7,372,279 | 6,945,008 | 6,345,212 | 5,579,967 | 2.8 | % | 6.3 | % | |||||||||||
Federal Home Loan Bank advances | 353,995 | 251,749 | 394,131 | 296,944 | 840,182 | 40.6 | % | (15.9 | )% | |||||||||||
Securities sold under agreements to repurchase and other borrowed funds | 370,797 | 478,090 | 430,016 | 404,418 | 321,781 | (22.4 | )% | 2.9 | % | |||||||||||
Stockholders’ equity | 1,199,057 | 1,116,869 | 1,076,650 | 1,028,047 | 963,250 | 7.4 | % | 4.5 | % | |||||||||||
Equity per share | 15.37 | 14.59 | 14.15 | 13.70 | 12.95 | 5.3 | % | 3.5 | % | |||||||||||
Equity as a percentage of total assets | 12.35 | % | 11.82 | % | 11.85 | % | 12.38 | % | 12.22 | % | 4.5 | % | 0.2 | % | ||||||
Years ended December 31, | Compounded Annual Growth Rate | ||||||||||||||||||||||||
(Dollars in thousands, except per share data) | 2017 | 2016 | 2015 | 2014 | 2013 | 1-Year | 5-Year | ||||||||||||||||||
Summary Statements of Operations | |||||||||||||||||||||||||
Interest income | $ | 375,022 | $ | 344,153 | $ | 319,681 | $ | 299,919 | $ | 263,576 | 9.0 | % | 7.3 | % | |||||||||||
Interest expense | 29,864 | 29,631 | 29,275 | 26,966 | 28,758 | 0.8 | % | 0.8 | % | ||||||||||||||||
Net interest income | 345,158 | 314,522 | 290,406 | 272,953 | 234,818 | 18.9 | % | 8.0 | % | ||||||||||||||||
Provision for loan losses | 10,824 | 2,333 | 2,284 | 1,912 | 6,887 | 364.0 | % | 9.5 | % | ||||||||||||||||
Non-interest income | 112,239 | 107,318 | 98,761 | 90,302 | 93,047 | 4.6 | % | 3.8 | % | ||||||||||||||||
Non-interest expense | 265,571 | 258,714 | 236,757 | 212,679 | 195,317 | 2.7 | % | 6.3 | % | ||||||||||||||||
Income before income taxes | 181,002 | 160,793 | 150,126 | 148,664 | 125,661 | 20.6 | % | 7.6 | % | ||||||||||||||||
Federal and state income tax expense 1 | 44,926 | 39,662 | 33,999 | 35,909 | 30,017 | 13.3 | % | 8.4 | % | ||||||||||||||||
Net income 1 | $ | 136,076 | $ | 121,131 | $ | 116,127 | $ | 112,755 | $ | 95,644 | 17.2 | % | 7.3 | % | |||||||||||
Basic earnings per share 1 | $ | 1.75 | $ | 1.59 | $ | 1.54 | $ | 1.51 | $ | 1.31 | 10.1 | % | 6.0 | % | |||||||||||
Diluted earnings per share 1 | $ | 1.75 | $ | 1.59 | $ | 1.54 | $ | 1.51 | $ | 1.31 | 10.1 | % | 6.0 | % | |||||||||||
Dividends declared per share 2 | $ | 1.14 | $ | 1.10 | $ | 1.05 | $ | 0.98 | $ | 0.60 | 3.6 | % | 13.7 | % | |||||||||||
23
At or for the Years ended December 31, | |||||||||||||||
(Dollars in thousands) | 2017 | 2016 | 2015 | 2014 | 2013 | ||||||||||
Selected Ratios and Other Data | |||||||||||||||
Return on average assets 1 | 1.41 | % | 1.32 | % | 1.36 | % | 1.42 | % | 1.23 | % | |||||
Return on average equity 1 | 11.46 | % | 10.79 | % | 10.84 | % | 11.11 | % | 10.22 | % | |||||
Dividend payout ratio 1,2 | 65.14 | % | 69.18 | % | 68.18 | % | 64.90 | % | 45.80 | % | |||||
Average equity to average asset ratio | 12.27 | % | 12.27 | % | 12.52 | % | 12.81 | % | 11.99 | % | |||||
Total capital (to risk-weighted assets) | 15.64 | % | 16.38 | % | 17.17 | % | 18.93 | % | 18.97 | % | |||||
Tier 1 capital (to risk-weighted assets) | 14.39 | % | 15.12 | % | 15.91 | % | 17.67 | % | 17.70 | % | |||||
Common Equity Tier 1 (to risk-weighted assets) | 12.81 | % | 13.42 | % | 14.06 | % | N/A | N/A | |||||||
Tier 1 capital (to average assets) | 11.90 | % | 11.90 | % | 12.01 | % | 12.45 | % | 12.11 | % | |||||
Net interest margin on average earning assets (tax-equivalent) | 4.12 | % | 4.02 | % | 4.00 | % | 3.98 | % | 3.48 | % | |||||
Efficiency ratio 3 | 53.94 | % | 55.88 | % | 55.40 | % | 54.31 | % | 54.51 | % | |||||
Allowance for loan and lease losses as a percent of loans | 1.97 | % | 2.28 | % | 2.55 | % | 2.89 | % | 3.21 | % | |||||
Allowance for loan and lease losses as a percent of nonperforming loans | 255 | % | 257 | % | 244 | % | 209 | % | 158 | % | |||||
Non-performing assets as a percentage of subsidiary assets | 0.68 | % | 0.76 | % | 0.88 | % | 1.08 | % | 1.39 | % | |||||
Non-performing assets | $65,179 | 71,385 | 80,079 | 89,900 | 109,420 | ||||||||||
Loans originated and acquired | $3,629,493 | 3,474,000 | 3,000,830 | 2,404,299 | 2,477,804 | ||||||||||
Number of full time equivalent employees | 2,278 | 2,222 | 2,149 | 1,943 | 1,837 | ||||||||||
Number of locations | 145 | 142 | 144 | 129 | 118 | ||||||||||
______________________________
1 Excludes a one-time revaluation of the deferred tax assets and deferred tax liabilities as a result of the Tax Act for the year ended December 31, 2017. For additional information on the revaluation, see the “Non-GAAP Financial Measures” section.
2 Includes a special dividend declared of $0.30 per share for 2017, 2016, 2015 and 2014.
3 Non-interest expense before OREO expenses, core deposit intangibles amortization, goodwill impairment charges, and non-recurring expense items as a percentage of tax-equivalent net interest income and non-interest income, excluding gains or losses on sale of investments, OREO income, and non-recurring income items.
24
Item 7. Management’s Discussion and Analysis of Financial Condition and Results of Operations
The following discussion is intended to provide a more comprehensive review of the Company’s operating results and financial condition than can be obtained from reading the Consolidated Financial Statements alone. The discussion should be read in conjunction with the Consolidated Financial Statements and the notes thereto included in “Item 8. Financial Statements and Supplementary Data.”
CAUTIONARY NOTE REGARDING FORWARD-LOOKING STATEMENTS
This Annual Report on Form 10-K may contain forward-looking statements within the meaning of the Private Securities Litigation Reform Act of 1995. These forward-looking statements include, but are not limited to, statements about the Company’s plans, objectives, expectations and intentions that are not historical facts, and other statements identified by words such as “expects,” “anticipates,” “intends,” “plans,” “believes,” “should,” “projects,” “seeks,” “estimates”, or the negative version of those words or other comparable words or phrases of a future or forward-looking nature. These forward-looking statements are based on current beliefs and expectations of management and are inherently subject to significant business, economic and competitive uncertainties and contingencies, many of which are beyond the Company’s control. In addition, these forward-looking statements are subject to assumptions with respect to future business strategies and decisions that are subject to change. The following factors, among others, could cause actual results to differ materially from the anticipated results (express or implied) or other expectations in the forward-looking statements, including those set forth in this Annual Report on Form 10-K, or the documents incorporated by reference:
• | the risks associated with lending and potential adverse changes of the credit quality of loans in the Company’s portfolio; |
• | changes in trade, monetary and fiscal policies and laws, including interest rate policies of the Board of Governors of the Federal Reserve System or the Federal Reserve Board, which could adversely affect the Company’s net interest income and profitability; |
• | changes in the cost and scope of insurance from the FDIC and other third parties; |
• | legislative or regulatory changes, including increased banking and consumer protection regulation that adversely affect the Company’s business, both generally and as a result of the Company exceeding $10 billion in total consolidated assets; |
• | ability to complete pending or prospective future acquisitions, limit certain sources of revenue, or increase cost of operations; |
• | costs or difficulties related to the completion and integration of acquisitions; |
• | the goodwill the Company has recorded in connection with acquisitions could become impaired, which may have an adverse impact on earnings and capital; |
• | reduced demand for banking products and services; |
• | the reputation of banks and the financial services industry could deteriorate, which could adversely affect the Company's ability to obtain (and maintain) customers; |
• | competition among financial institutions in the Company's markets may increase significantly; |
• | the risks presented by continued public stock market volatility, which could adversely affect the market price of the Company’s common stock and the ability to raise additional capital or grow the Company through acquisitions; |
• | the projected business and profitability of an expansion or the opening of a new branch could be lower than expected; |
• | consolidation in the financial services industry in the Company’s markets resulting in the creation of larger financial institutions who may have greater resources could change the competitive landscape; |
• | dependence on the CEO, the senior management team and the Presidents of Glacier Bank divisions; |
• | material failure, potential interruption or breach in security of the Company’s systems and technological changes which could expose us to new risks (e.g., cybersecurity), fraud or system failures; |
• | natural disasters, including fires, floods, earthquakes, and other unexpected events; |
• | the Company’s success in managing risks involved in the foregoing; and |
• | the effects of any reputational damage to the Company resulting from any of the foregoing. |
Additional factors that could cause actual results to differ materially from those expressed in the forward-looking statements are discussed in “Item 1A. Risk Factors.” Please take into account that forward-looking statements speak only as of the date of this Annual Report on Form 10-K (or documents incorporated by reference, if applicable). Given the described uncertainties and risks, the Company cannot guarantee its future performance or results of operations and you should not place undue reliance on these forward-looking statements. The Company does not undertake any obligation to publicly correct, revise, or update any forward-looking statement if it later becomes aware that actual results are likely to differ materially from those expressed in such forward-looking statement, except as required under federal securities laws.
25
MANAGEMENT’S DISCUSSION AND ANALYSIS
OF FINANCIAL CONDITION AND RESULTS OF OPERATIONS
YEAR ENDED DECEMBER 31, 2017 COMPARED TO DECEMBER 31, 2016
Highlights and Overview
During the second quarter of 2017, the Company completed the acquisition of Foothills, a community bank based in Yuma, Arizona. Foothills became the Company’s fourteenth bank division and its first entrance into the Arizona market. During the fourth quarter of 2017, the Company also successfully completed the data processing system conversion for this acquisition. During the second quarter of 2017, the Company announced the signing of a definitive agreement to acquire Collegiate, a community bank based in Buena Vista, Colorado and the transaction was completed on January 31, 2018. Collegiate provides banking services to individuals and businesses in the Mountain and Front Range communities of Colorado with five banking offices located in Aurora, Buena Vista, Denver and Salida. The branches of Collegiate will operate as a new bank division of the Company. As of December 31, 2017, Collegiate had total assets of $533 million, gross loans of $346 million and total deposits of $464 million. During the fourth quarter of 2017, the Company announced the signing of a definitive agreement to acquire FSB, a community bank based in Bozeman, Montana. FSB provides banking services to individuals and businesses throughout Montana with eleven banking offices located in Bozeman, Belgrade, Big Sky, Choteau, Fairfield, Fort Benton, Three Forks, Vaughn and West Yellowstone. Upon closing of the transaction, which is anticipated to take place in February 2018, FSB will become a new bank division headquartered in Bozeman. Big Sky Western Bank, the Bank’s existing Bozeman-based division will combine with the new FSB division. The agriculture-focused northern branches of FSB, located in the area known as the Golden Triangle, will combine with the Bank’s First Bank of Montana division. As of December 31, 2017, FSB had total assets of $1.028 billion, gross loans of $640 million and total deposits of $891 million. See Notes 22 and 23 in the Consolidated Financial Statements in “Item 8. Financial Statements and Supplementary Data” for additional information regarding these acquisitions.
During the current year, the Company successfully executed its strategy to stay below $10 billion in total assets as of year end to delay the impact of the Durbin Amendment for one additional year. The Company accomplished this strategy in part by redeploying investment cash flow and selectively selling securities into the higher yielding loan portfolio. The Durbin Amendment, which was passed as part of the Dodd-Frank Act, establishes limits on the amount of interchange fees that can be charged to merchants for debit card processing and will reduce the Company’s service charge fee income in the future. Due to the closing of the Collegiate acquisition in January 2018, the Company crossed the $10 billion asset threshold. The Company has been preparing for this event and believes it is well positioned to comply with DFAST requirements.
The Tax Act resulted in a decrease in the federal marginal tax rate from 35 percent to 21 percent beginning in 2018. As a result of the Tax Act, the Company incurred a one-time tax expense adjustment of $19.7 million during 2017 due to the Company’s revaluation of its net deferred tax assets. Deferred tax assets and liabilities are measured using the enacted tax rates expected to apply to the years in which the temporary differences are expected to be recognized. The effect on the deferred tax assets and liabilities from a change in tax rates is recognized in net income in the period that includes the enactment date, which occurred on December 22, 2017 with the enactment of the Tax Act.
The Company experienced a strong year for organic loan growth, which increased $601 million, or 11 percent, with the primary increases in the commercial loan portfolio. As part of the strategy to stay below $10 billion, the Company redeployed cash flows from investment securities into the loan portfolio. Additionally, the Company utilized a third party vendor to transfer $433 million of deposits off-balance sheet as of December 31, 2017. These deposits can be brought back onto the Company’s balance sheet at the Company’s discretion. Including the deposit accounts transferred, organic deposit growth increased $478 million, or 7 percent, during the current year. Tangible stockholders’ equity increased $50 million, or $0.40 per share, as a result of earnings retention, increase in other comprehensive income (“OCI”), and Company stock issued in connection with the current year acquisition, all of which offset the increases in goodwill and intangibles from the acquisition. The Company increased its total dividends declared from $1.10 per share during 2016 to $1.14 per share in 2017.
The Company continued to reduce its non-performing assets and ended the year at $65.2 million which was a decrease of $6.2 million or, 9 percent, from the prior year end. The allowance as a percentage of total loans as of December, 31, 2017 was 1.97 percent, a decrease of 31 basis points (“bps”), or 13.5 percent, from 2.28 percent at December 31, 2016. Loan portfolio growth, composition, average loan size, credit quality considerations, and other environmental factors will continue to determine the ALLL.
26
Net income for the year was $116 million, a decrease of $4.8 million, or 4 percent, over the 2016 net income of $121 million. Diluted earnings per share for the year was $1.50, a decrease of $0.09, or 6 percent, from 2016 diluted earnings per share of $1.59. Such decreases were due to the one-time tax expense of $19.7 million from the revaluation of the net deferred tax assets. Excluding the $19.7 million impact from the Tax Act, the Company had record earnings of $136 million for 2017, an increase of $14.9 million, or 12 percent, over prior year’s net income of $121 million and diluted earnings per share of $1.75, an increase of $0.16, or 10 percent, from the prior year diluted earnings per share of $1.59. The improvement in net income for 2017 over 2016 was principally due to an increase in interest income from the commercial loan portfolio and the Bank divisions’ discipline in controlling operating expenses. For additional information on the revaluation of net deferred tax assets, see the “Non-GAAP Financial Measures” section in “Item 6. Selected Financial Data.”
Looking forward, the Company’s future performance will depend on many factors including economic conditions in the markets the Company serves, interest rate changes, increasing competition for deposits and loans, loan quality and growth, the impact and successful integration of acquisitions, and regulatory burden.
Financial Highlights
At or for the Years ended | ||||||
(Dollars in thousands, except per share data) | December 31, 2017 | December 31, 2016 | ||||
Operating results | ||||||
Net income 1 | $ | 136,076 | 121,131 | |||
Basic earnings per share 1 | $ | 1.75 | 1.59 | |||
Diluted earnings per share 1 | $ | 1.75 | 1.59 | |||
Dividends declared per share | $ | 1.14 | 1.10 | |||
Market value per share | ||||||
Closing | $ | 39.39 | 36.23 | |||
High | $ | 41.23 | 37.87 | |||
Low | $ | 31.38 | 21.90 | |||
Selected ratios and other data | ||||||
Number of common stock shares outstanding | 78,006,956 | 76,525,402 | ||||
Average outstanding shares - basic | 77,537,664 | 76,278,463 | ||||
Average outstanding shares - diluted | 77,607,605 | 76,341,836 | ||||
Return on average assets (annualized) 1 | 1.41 | % | 1.32 | % | ||
Return on average equity (annualized) 1 | 11.46 | % | 10.79 | % | ||
Efficiency ratio | 53.94 | % | 55.88 | % | ||
Dividend payout ratio 1 | 65.14 | % | 69.18 | % | ||
Loan to deposit ratio | 87.29 | % | 78.10 | % | ||
Number of full time equivalent employees | 2,278 | 2,222 | ||||
Number of locations | 145 | 142 | ||||
Number of ATMs | 200 | 200 | ||||
______________________________
1 Excludes a one-time revaluation of the deferred tax assets and deferred tax liabilities as a result of the Tax Act for the year ended December 31, 2017. For additional information on the revaluation, see the “Non-GAAP Financial Measures” section in “Item 6. Selected Financial Data.”
27
Recent Acquisitions
On April 30, 2017, the Company completed the acquisition of Foothills, which resulted in goodwill of $30.6 million. On August 31, 2016, the Company completed the acquisition of TSB, which resulted in goodwill of $6.4 million. The Company’s results of operations and financial condition include the acquisitions of Foothills and TSB from the acquisition dates. For additional information regarding acquisitions, see Note 22 to the Consolidated Financial Statements in “Item 8. Financial Statements and Supplementary Data.”
The following table provides information on the fair value of selected classifications of assets and liabilities acquired:
Foothills | TSB | |||||
(Dollars in thousands) | April 30, 2017 | August 31, 2016 | ||||
Total assets | $ | 385,839 | 76,165 | |||
Investment securities | 25,420 | — | ||||
Loans receivable | 292,529 | 51,875 | ||||
Non-interest bearing deposits | 97,527 | 13,005 | ||||
Interest bearing deposits | 199,233 | 45,359 | ||||
Federal Home Loan Bank advances | 22,800 | 3,260 | ||||
Financial Condition Analysis
Assets
The following table summarizes the Company’s assets as of the dates indicated:
(Dollars in thousands) | December 31, 2017 | December 31, 2016 | $ Change | % Change | ||||||||||
Cash and cash equivalents | $ | 200,004 | $ | 152,541 | $ | 47,463 | 31 | % | ||||||
Investment securities, available-for-sale | 1,778,243 | 2,425,477 | (647,234 | ) | (27 | )% | ||||||||
Investment securities, held-to-maturity | 648,313 | 675,674 | (27,361 | ) | (4 | )% | ||||||||
Total investment securities | 2,426,556 | 3,101,151 | (674,595 | ) | (22 | )% | ||||||||
Loans receivable | ||||||||||||||
Residential real estate | 720,728 | 674,347 | 46,381 | 7 | % | |||||||||
Commercial real estate | 3,577,139 | 2,990,141 | 586,998 | 20 | % | |||||||||
Other commercial | 1,579,353 | 1,342,250 | 237,103 | 18 | % | |||||||||
Home equity | 457,918 | 434,774 | 23,144 | 5 | % | |||||||||
Other consumer | 242,686 | 242,951 | (265 | ) | — | % | ||||||||
Loans receivable | 6,577,824 | 5,684,463 | 893,361 | 16 | % | |||||||||
Allowance for loan and lease losses | (129,568 | ) | (129,572 | ) | 4 | — | % | |||||||
Loans receivable, net | 6,448,256 | 5,554,891 | 893,365 | 16 | % | |||||||||
Other assets | 631,533 | 642,017 | (10,484 | ) | (2 | )% | ||||||||
Total assets | $ | 9,706,349 | $ | 9,450,600 | $ | 255,749 | 3 | % | ||||||
Total investment securities of $2.427 billion at December 31, 2017 decreased $675 million, or 22 percent, from the prior year fourth quarter. The decrease in the investment portfolio resulted from the Company continuing to redeploy the securities portfolio cash flow into the Company’s higher yielding loan portfolio. Investment securities represented 25 percent of total assets at December 31, 2017 compared to 33 percent of total assets at December 31, 2016.
Excluding the Foothills acquisition, the loan portfolio increased $601 million, or 11 percent, since the prior year end and primarily came from growth in commercial real estate and other commercial loans of $357 million and $209 million, respectively.
28
Liabilities
The following table summarizes the liability balances as of the dates indicated, and the amount of change from December 31, 2016:
(Dollars in thousands) | December 31, 2017 | December 31, 2016 | $ Change | % Change | ||||||||||
Deposits | ||||||||||||||
Non-interest bearing deposits | $ | 2,311,902 | $ | 2,041,852 | $ | 270,050 | 13 | % | ||||||
NOW and DDA accounts | 1,695,246 | 1,588,550 | 106,696 | 7 | % | |||||||||
Savings accounts | 1,082,604 | 996,061 | 86,543 | 9 | % | |||||||||
Money market deposit accounts | 1,512,693 | 1,464,415 | 48,278 | 3 | % | |||||||||
Certificate accounts | 817,259 | 948,714 | (131,455 | ) | (14 | )% | ||||||||
Core deposits, total | 7,419,704 | 7,039,592 | 380,112 | 5 | % | |||||||||
Wholesale deposits | 160,043 | 332,687 | (172,644 | ) | (52 | )% | ||||||||
Deposits, total | 7,579,747 | 7,372,279 | 207,468 | 3 | % | |||||||||
Securities sold under agreements to repurchase | 362,573 | 473,650 | (111,077 | ) | (23 | )% | ||||||||
Federal Home Loan Bank advances | 353,995 | 251,749 | 102,246 | 41 | % | |||||||||
Other borrowed funds | 8,224 | 4,440 | 3,784 | 85 | % | |||||||||
Subordinated debentures | 126,135 | 125,991 | 144 | — | % | |||||||||
Other liabilities | 76,618 | 105,622 | (29,004 | ) | (27 | )% | ||||||||
Total liabilities | $ | 8,507,292 | $ | 8,333,731 | $ | 173,561 | 2 | % | ||||||
The Company reduced the amount of on-balance sheet deposits during the year as part of its strategy to stay below $10 billion in total assets. Core deposits decreased $380 million, or 5 percent, from the prior year end. The Company utilized a third party vendor to transfer $433 million of deposits off-balance sheet as of December 31, 2017. Including the deposit accounts transferred, organic core deposits increased $478 million, or 7 percent, from December 31, 2016. At December 31, 2017, wholesale deposits were $160 million, a decrease of $173 million, or 52 percent, over the prior year end.
Securities sold under agreements to repurchase (“repurchase agreements”) of $363 million at December 31, 2017 decreased $111 million, or 23 percent, from the prior year end. Federal Home Loan Bank (“FHLB”) advances of $354 million at December 31, 2017 increased $102 million over the prior year end. The increase was the result of strategically managing the deposit accounts to stay below $10 billion and utilizing FHLB advances to manage the daily liquidity needs for loan growth.
Stockholders’ Equity
The following table summarizes the stockholders’ equity balances as of the dates indicated and the amount of change from December 31, 2016:
(Dollars in thousands, except per share data) | December 31, 2017 | December 31, 2016 | $ Change | % Change | ||||||||||
Common equity | $ | 1,201,036 | $ | 1,124,251 | $ | 76,785 | 7 | % | ||||||
Accumulated other comprehensive loss | (1,979 | ) | (7,382 | ) | 5,403 | (73 | )% | |||||||
Total stockholders’ equity | 1,199,057 | 1,116,869 | 82,188 | 7 | % | |||||||||
Goodwill and core deposit intangible, net | (191,995 | ) | (159,400 | ) | (32,595 | ) | 20 | % | ||||||
Tangible stockholders’ equity | $ | 1,007,062 | $ | 957,469 | $ | 49,593 | 5 | % | ||||||
Stockholders’ equity to total assets | 12.35 | % | 11.82 | % | 4 | % | ||||||||
Tangible stockholders’ equity to total tangible assets | 10.58 | % | 10.31 | % | 3 | % | ||||||||
Book value per common share | $ | 15.37 | $ | 14.59 | $ | 0.78 | 5 | % | ||||||
Tangible book value per common share | $ | 12.91 | $ | 12.51 | $ | 0.40 | 3 | % | ||||||
Tangible stockholders’ equity increased $49.6 million, or 5 percent, from a year ago, the result of earnings retention and $46.7 million of Company stock issued in connection with the Foothills acquisition; such increases more than offset the increase in goodwill and core deposit intangibles. Tangible book value per common share at year end increased $0.40 per share from a year ago.
29
Results of Operations
Income Summary
The following table summarizes revenue for the periods indicated, including the amount and percentage changes from December 31, 2016:
Years ended | $ Change | % Change | ||||||||||||
(Dollars in thousands) | December 31, 2017 | December 31, 2016 | ||||||||||||
Net interest income | ||||||||||||||
Interest income | $ | 375,022 | $ | 344,153 | $ | 30,869 | 9 | % | ||||||
Interest expense | 29,864 | 29,631 | 233 | 1 | % | |||||||||
Total net interest income | 345,158 | 314,522 | 30,636 | 10 | % | |||||||||
Non-interest income | ||||||||||||||
Service charges and other fees | 67,717 | 62,405 | 5,312 | 9 | % | |||||||||
Miscellaneous loan fees and charges | 4,360 | 4,613 | (253 | ) | (5 | )% | ||||||||
Gain on sale of loans | 30,439 | 33,606 | (3,167 | ) | (9 | )% | ||||||||
Loss on sale of investments | (660 | ) | (1,463 | ) | 803 | (55 | )% | |||||||
Other income | 10,383 | 8,157 | 2,226 | 27 | % | |||||||||
Total non-interest income | 112,239 | 107,318 | 4,921 | 5 | % | |||||||||
$ | 457,397 | $ | 421,840 | $ | 35,557 | 8 | % | |||||||
Net interest margin (tax-equivalent) | 4.12 | % | 4.02 | % | ||||||||||
Net Interest Income
Interest income for the current year increased $30.9 million, or 9 percent, from the prior year and was attributable to a $38.4 million increase in income from commercial loans which more than offset the decrease of $8.4 million in interest income on investments.
Interest expense of $29.9 million for the current year increased $233 thousand over the prior year. Interest expense on deposits decreased $1.6 million, or 9 percent, and was due to the decrease in wholesale deposits. Interest expense on repurchase agreements, FHLB advances, and subordinated debt increased $1.8 million, or 16 percent, over the prior year and was primarily driven by the increase in interest rates. The total funding cost (including non-interest bearing deposits) for 2017 was 36 basis points compared to 37 basis points for 2016.
The net interest margin as a percentage of earning assets, on a tax-equivalent basis, for 2017 was 4.12 percent, a 10 basis point increase from the net interest margin of 4.02 percent for 2016. The increase in the margin was primarily attributable to a shift in earning assets to higher yielding loans. Additionally, there was an increase in yields on earning assets combined with a continued increase in low cost deposits during the current year.
Non-interest Income
Non-interest income of $112.2 million for 2017 increased $4.9 million, or 5 percent, over last year. Service charges and other fees of $67.7 million for 2017 increased $5.3 million, or 9 percent, from the prior year as a result of an increased number of deposit accounts. The gain on sale of loans of $30.4 million for 2017 decreased $3.2 million, or 9 percent, from prior year which was due to a lower volume of refinanced and purchased mortgages. Other income of $10.4 million for 2017 increased $2.2 million, or 27 percent, over last year and was the result of an increase on gain on sale of OREO.
30
Non-interest Expense
The following table summarizes non-interest expense for the periods indicated, including the amount and percentage changes from December 31, 2016:
Years ended | $ Change | % Change | ||||||||||||
(Dollars in thousands) | December 31, 2017 | December 31, 2016 | ||||||||||||
Compensation and employee benefits | $ | 160,506 | $ | 151,697 | $ | 8,809 | 6 | % | ||||||
Occupancy and equipment | 26,631 | 25,979 | 652 | 3 | % | |||||||||
Advertising and promotions | 8,405 | 8,433 | (28 | ) | — | % | ||||||||
Data processing | 14,150 | 14,390 | (240 | ) | (2 | )% | ||||||||
Other real estate owned | 1,909 | 2,895 | (986 | ) | (34 | )% | ||||||||
Regulatory assessments and insurance | 4,431 | 4,780 | (349 | ) | (7 | )% | ||||||||
Core deposit intangible amortization | 2,494 | 2,970 | (476 | ) | (16 | )% | ||||||||
Other expenses | 47,045 | 47,570 | (525 | ) | (1 | )% | ||||||||
Total non-interest expense | $ | 265,571 | $ | 258,714 | $ | 6,857 | 3 | % | ||||||
During 2016, the Company consolidated its Bank divisions’ individual core database systems into a single core database and re-issued debit cards with chip technology (the Core Consolidation Project or “CCP”). Expenses related to CCP were $4.3 million during 2016. Excluding CCP expenses, non-interest expense for the current year increased $11.2 million, or 4 percent, over the prior year. Compensation and employee benefits for 2017 increased $8.8 million, or 6 percent, from the same period last year due to salary increases and the increased number of employees from the acquired banks. Occupancy and equipment expense increased $652 thousand, or 3 percent from the prior year as a result of increased costs from acquisitions. Data processing expense decreased $240 thousand, or 2 percent, from the prior year as a result of decreased costs associated with CCP. Current year other expenses of $47.0 million decreased $525 thousand, or 1 percent, from the prior year and was principally driven by decreased costs associated with CCP.
Efficiency Ratio
The efficiency ratio of 53.94 percent for 2017 decreased 194 basis points from the prior year efficiency ratio of 55.88 percent which resulted from the increase in net interest income largely due to higher interest income on commercial loans.
Provision for Loan Losses
The following table summarizes the provision for loan losses, net charge-offs and other select ratios for the previous eight quarters:
(Dollars in thousands) | Provision for Loan Losses | Net Charge-Offs (Recoveries) | ALLL as a Percent of Loans | Accruing Loans 30-89 Days Past Due as a Percent of Loans | Non-Performing Assets to Total Sub-sidiary Assets | |||||||||||
Fourth quarter 2017 | $ | 2,886 | $ | 2,894 | 1.97 | % | 0.57 | % | 0.68 | % | ||||||
Third quarter 2017 | 3,327 | 3,628 | 1.99 | % | 0.45 | % | 0.67 | % | ||||||||
Second quarter 2017 | 3,013 | 2,362 | 2.05 | % | 0.49 | % | 0.70 | % | ||||||||
First quarter 2017 | 1,598 | 1,944 | 2.20 | % | 0.67 | % | 0.75 | % | ||||||||
Fourth quarter 2016 | 1,139 | 4,101 | 2.28 | % | 0.45 | % | 0.76 | % | ||||||||
Third quarter 2016 | 626 | 478 | 2.37 | % | 0.49 | % | 0.84 | % | ||||||||
Second quarter 2016 | — | (2,315 | ) | 2.46 | % | 0.44 | % | 0.82 | % | |||||||
First quarter 2016 | 568 | 194 | 2.50 | % | 0.46 | % | 0.88 | % | ||||||||
The provision for loan losses was $10.8 million for 2017, an increase of $8.5 million from the same period in the prior year. Net charge-offs during 2017 were $10.8 million compared to $2.5 million during 2016. Loan portfolio growth, composition, average loan size, credit quality considerations, and other environmental factors will continue to determine the level of the loan loss provision.
31
MANAGEMENT’S DISCUSSION AND ANALYSIS
OF THE RESULTS OF OPERATIONS
YEAR ENDED DECEMBER 31, 2016 COMPARED TO DECEMBER 31, 2015
Income Summary
The following table summarizes revenue for the periods indicated, including the amount and percentage changes from December 31, 2015:
Years ended | $ Change | % Change | ||||||||||||
(Dollars in thousands) | December 31, 2016 | December 31, 2015 | ||||||||||||
Net interest income | ||||||||||||||
Interest income | $ | 344,153 | $ | 319,681 | $ | 24,472 | 8 | % | ||||||
Interest expense | 29,631 | 29,275 | 356 | 1 | % | |||||||||
Total net interest income | 314,522 | 290,406 | 24,116 | 8 | % | |||||||||
Non-interest income | ||||||||||||||
Service charges and other fees | 62,405 | 59,286 | 3,119 | 5 | % | |||||||||
Miscellaneous loan fees and charges | 4,613 | 4,276 | 337 | 8 | % | |||||||||
Gain on sale of loans | 33,606 | 26,389 | 7,217 | 27 | % | |||||||||
(Loss) gain on sale of investments | (1,463 | ) | 19 | (1,482 | ) | (7,800 | )% | |||||||
Other income | 8,157 | 8,791 | (634 | ) | (7 | )% | ||||||||
Total non-interest income | 107,318 | 98,761 | 8,557 | 9 | % | |||||||||
$ | 421,840 | $ | 389,167 | $ | 32,673 | 8 | % | |||||||
Net interest margin (tax-equivalent) | 4.02 | % | 4.00 | % | ||||||||||
Net Interest Income
Net interest income for 2016 was $315 million, an increase of $24.1 million, or 8 percent, over the prior year. Interest income for the 2016 increased $24.5 million, or 8 percent, from the prior year and was principally due to a $24.0 million increase in income from commercial loans. Additional increases included a $1.3 million in interest income from residential loans.
Interest expense of $29.6 million for 2016 increased $356 thousand, or 1 percent, over the prior year. Deposit interest expense for 2016 increased $2.3 million, or 14 percent, from the prior year and was driven by an increase in wholesale deposits and the additional interest expense for an interest rate swap with a notional amount of $100 million that began accruing in December 2015. FHLB interest expense decreased $2.6 million, or 30 percent, as the need for wholesale funding has decreased with strong deposit growth. The total funding cost (including non-interest bearing deposits) for 2016 was 37 basis points compared to 40 basis points for 2015.
The net interest margin as a percentage of earning assets, on a tax-equivalent basis, for 2016 was 4.02 percent, a 2 basis point increase from the net interest margin of 4.00 percent for 2015. The increase in the margin was primarily attributable to a shift in earning assets to higher yielding loans combined with a continued increase in low cost deposits.
Non-interest Income
Non-interest income of $107.3 million for 2016 increased $8.6 million, or 9 percent, over the prior year. Service charges and other fees of $62.4 million for 2016 increased $3.1 million, or 5 percent, from the prior year as a result of an increased number of deposit accounts, both from organic growth and from recent acquisitions. The gain of $33.6 million on the sale of loans for 2016 increased $7.2 million, or 27 percent, from 2015 which was attributable to the stronger housing market and the low interest rate environment. Included in other income was operating revenue of $127 thousand from OREO and gains of $918 thousand from the sales of OREO, which totaled $1.0 million for 2016 compared to $1.1 million for the prior year.
32
Non-interest Expense
The following table summarizes non-interest expense for the periods indicated, including the amount and percentage changes from December 31, 2015:
Years ended | $ Change | % Change | ||||||||||||
(Dollars in thousands) | December 31, 2016 | December 31, 2015 | ||||||||||||
Compensation and employee benefits | $ | 151,697 | $ | 134,382 | $ | 17,315 | 13 | % | ||||||
Occupancy and equipment | 25,979 | 25,483 | 496 | 2 | % | |||||||||
Advertising and promotions | 8,433 | 8,661 | (228 | ) | (3 | )% | ||||||||
Data processing | 14,390 | 11,244 | 3,146 | 28 | % | |||||||||
Other real estate owned | 2,895 | 3,693 | (798 | ) | (22 | )% | ||||||||
Regulatory assessments and insurance | 4,780 | 5,283 | (503 | ) | (10 | )% | ||||||||
Core deposit intangible amortization | 2,970 | 2,964 | 6 | — | % | |||||||||
Other expenses | 47,570 | 45,047 | 2,523 | 6 | % | |||||||||
Total non-interest expense | $ | 258,714 | $ | 236,757 | $ | 21,957 | 9 | % | ||||||
Non-interest expense of $259 million for 2016 increased $22.0 million, or 9 percent, over the prior year. Included in non-interest expense was $4.3 million of CCP related expenses. Compensation and employee benefits for 2016 increased $17.3 million, or 13 percent, from the prior year due to the increased number of employees including from the acquired banks and annual salary increases. Occupancy and equipment expense of $26.0 million for 2016 increased $474 thousand, or 2 percent, over the prior year. Outsourced data processing expense increased $3.3 million, or 29 percent, from the prior year primarily the result of additional costs from CCP. OREO expense of $2.9 million for 2016 decreased $798 thousand, or 22 percent, from the the prior year. OREO expense for 2016 included $761 thousand of operating expenses, $1.8 million of fair value write-downs, and $314 thousand of loss from the sales of OREO. Other expenses of $47.2 million for 2016 increased $2.4 million, or 5 percent, from the prior year and was driven by increases from costs associated with CCP.
Efficiency Ratio
The efficiency ratio was 55.88 percent for 2016 compared to 55.40 percent for 2015. Although there were increases in both net interest income and non-interest income, such increases were outpaced by the increases in CCP expenses and compensation expenses which contributed to the higher efficiency ratio in 2016.
Provision for Loan Losses
The provision for loan losses was $2.3 million for 2016, an increase of $49 thousand, or 2 percent, from the prior year. Net charge-offs during 2016 was $2.5 million which was relatively flat compared to the net charge-offs of $2.3 million for 2015, although the quarterly net charge-offs continue to experience a fair amount of volatility.
33
ADDITIONAL MANAGEMENT’S DISCUSSION AND ANALYSIS
Investment Activity
Investment securities classified as available-for-sale are carried at estimated fair value and investment securities classified as held-to-maturity are carried at amortized cost. Unrealized gains or losses, net of tax, on available-for-sale securities are reflected as an adjustment to OCI. The Company’s investment securities are summarized below:
December 31, 2017 | December 31, 2016 | December 31, 2015 | December 31, 2014 | December 31, 2013 | ||||||||||||||||||||||||||||||
(Dollars in thousands) | Carrying Amount | Percent | Carrying Amount | Percent | Carrying Amount | Percent | Carrying Amount | Percent | Carrying Amount | Percent | ||||||||||||||||||||||||
Available-for-sale | ||||||||||||||||||||||||||||||||||
U.S. government and federal agency | $ | 31,127 | 1 | % | $ | 39,407 | 1 | % | $ | 47,451 | 1 | % | $ | 44 | — | % | $ | — | — | % | ||||||||||||||
U.S. government sponsored enterprises | 19,091 | 1 | % | 19,570 | 1 | % | 93,167 | 3 | % | 21,945 | 1 | % | 10,628 | — | % | |||||||||||||||||||
State and local governments | 629,501 | 26 | % | 786,373 | 25 | % | 885,019 | 27 | % | 997,969 | 34 | % | 1,385,078 | 43 | % | |||||||||||||||||||
Corporate bonds | 216,762 | 9 | % | 471,951 | 15 | % | 384,163 | 12 | % | 314,854 | 11 | % | 442,501 | 14 | % | |||||||||||||||||||
Residential mortgage-backed securities | 779,283 | 32 | % | 1,007,515 | 33 | % | 1,198,549 | 36 | % | 1,049,575 | 36 | % | 1,383,560 | 43 | % | |||||||||||||||||||
Commercial mortgage-backed securities | 102,479 | 4 | % | 100,661 | 3 | % | 2,411 | — | % | 3,041 | — | % | 1,062 | — | % | |||||||||||||||||||
Total available-for-sale | 1,778,243 | 73 | % | 2,425,477 | 78 | % | 2,610,760 | 79 | % | 2,387,428 | 82 | % | 3,222,829 | 100 | % | |||||||||||||||||||
Held-to-maturity | ||||||||||||||||||||||||||||||||||
State and local governments | 648,313 | 27 | % | 675,674 | 22 | % | 702,072 | 21 | % | 520,997 | 18 | % | — | — | % | |||||||||||||||||||
Total held-to-maturity | 648,313 | 27 | % | 675,674 | 22 | % | 702,072 | 21 | % | 520,997 | 18 | % | — | — | % | |||||||||||||||||||
Total investment securities | $ | 2,426,556 | 100 | % | $ | 3,101,151 | 100 | % | $ | 3,312,832 | 100 | % | $ | 2,908,425 | 100 | % | $ | 3,222,829 | 100 | % | ||||||||||||||
The Company’s investment portfolio is primarily comprised of state and local government securities and mortgage-backed securities. State and local government securities are largely exempt from federal income tax and the Company’s maximum federal statutory rate of 35 percent is used in calculating the tax-equivalent yields on the tax-exempt securities. As a result of the Tax Act, the federal statutory rate decreased from 35 percent to 21 percent beginning in 2018. Net deferred tax assets associated with available-for-sale investment securities were remeasured using enacted tax rates expected to apply to the years in which the temporary differences are expected to be recognized. The effect on net deferred tax assets from the change in tax rates was recognized in net income during the current year, given that the enactment of the Tax Act occurred on December 22, 2017. Mortgage-backed securities are primarily short, weighted-average life U.S. agency guaranteed residential mortgage pass-through securities. To a lesser extent, mortgage-backed securities also consist of short, weighted-average life U.S. agency guaranteed residential collateralized mortgage obligations and U.S. agency guaranteed commercial mortgage-backed securities. Combined, the mortgage-backed securities provide the Company with ongoing liquidity as scheduled and pre-paid principal is received on the securities.
State and local government securities carry different risks that are not as prevalent in other security types. The Company evaluates the investment grade quality of its securities in accordance with regulatory guidance. Investment grade securities are those where the issuer has an adequate capacity to meet the financial commitments under the security for the projected life of the investment. An issuer has an adequate capacity to meet financial commitments if the risk of default by the obligor is low and the full and timely payment of principal and interest are expected. In assessing credit risk, the Company may use credit ratings from Nationally Recognized Statistical Rating Organizations (“NRSRO” entities such as Standard and Poor’s [“S&P”] and Moody’s) as support for the evaluation; however, they are not solely relied upon. There have been no significant differences in the Company’s internal evaluation of the creditworthiness of any issuer when compared with the ratings assigned by the NRSROs.
34
The following table stratifies the state and local government securities by the associated NRSRO ratings. The highest issued rating was used to categorize the securities in the table for those securities where the NRSRO ratings were not at the same level.
December 31, 2017 | December 31, 2016 | |||||||||||
(Dollars in thousands) | Amortized Cost | Fair Value | Amortized Cost | Fair Value | ||||||||
S&P: AAA / Moody’s: Aaa | $ | 310,040 | 311,759 | 345,527 | 346,301 | |||||||
S&P: AA+, AA, AA- / Moody’s: Aa1, Aa2, Aa3 | 767,306 | 783,795 | 879,271 | 894,652 | ||||||||
S&P: A+, A, A- / Moody’s: A1, A2, A3 | 167,230 | 175,539 | 209,217 | 216,589 | ||||||||
S&P: BBB+, BBB, BBB- / Moody’s: Baa1, Baa2, Baa3 | 2,271 | 2,372 | 2,270 | 2,352 | ||||||||
Not rated by either entity | 14,985 | 15,262 | 13,934 | 14,694 | ||||||||
Below investment grade | 847 | 860 | 850 | 874 | ||||||||
Total | $ | 1,262,679 | 1,289,587 | 1,451,069 | 1,475,462 | |||||||
State and local government securities largely consist of both taxable and tax-exempt general obligation and revenue bonds. The following table stratifies the state and local government securities by the associated security type.
December 31, 2017 | December 31, 2016 | |||||||||||
(Dollars in thousands) | Amortized Cost | Fair Value | Amortized Cost | Fair Value | ||||||||
General obligation - unlimited | $ | 717,610 | 735,218 | 805,779 | 819,990 | |||||||
General obligation - limited | 195,278 | 203,643 | 221,099 | 228,218 | ||||||||
Revenue | 322,394 | 323,183 | 389,506 | 391,615 | ||||||||
Certificate of participation | 19,366 | 19,922 | 23,590 | 24,603 | ||||||||
Other | 8,031 | 7,621 | 11,095 | 11,036 | ||||||||
Total | $ | 1,262,679 | 1,289,587 | 1,451,069 | 1,475,462 | |||||||
The following table outlines the five states in which the Company owns the highest concentrations of state and local government securities.
December 31, 2017 | December 31, 2016 | |||||||||||
(Dollars in thousands) | Amortized Cost | Fair Value | Amortized Cost | Fair Value | ||||||||
Washington | $ | 184,491 | 189,932 | 188,778 | 193,035 | |||||||
Texas | 170,786 | 175,217 | 193,652 | 196,641 | ||||||||
Michigan | 157,240 | 163,332 | 173,400 | 177,305 | ||||||||
Montana | 92,733 | 97,234 | 94,168 | 97,259 | ||||||||
California | 69,944 | 69,554 | 93,441 | 94,275 | ||||||||
All other states | 587,485 | 594,318 | 707,630 | 716,947 | ||||||||
Total | $ | 1,262,679 | 1,289,587 | 1,451,069 | 1,475,462 | |||||||
35
The following table presents the carrying amount and weighted-average yield of available-for-sale and held-to-maturity investment securities by contractual maturity at December 31, 2017. Weighted-average yields are based upon the amortized cost of securities and are calculated using the interest method which takes into consideration premium amortization, discount accretion and mortgage-backed securities’ prepayment provisions. Weighted-average yields on tax-exempt investment securities exclude the federal income tax benefit.
One Year or Less | After One through Five Years | After Five through Ten Years | After Ten Years | Mortgage-Backed Securities | Total | ||||||||||||||||||||||||||||||||||||
(Dollars in thousands) | Amount | Yield | Amount | Yield | Amount | Yield | Amount | Yield | Amount | Yield | Amount | Yield | |||||||||||||||||||||||||||||
Available-for-sale | |||||||||||||||||||||||||||||||||||||||||
U.S. government and federal agency | $ | — | — | % | $ | 2,227 | 1.76 | % | $ | 15,053 | 1.53 | % | $ | 13,847 | 1.14 | % | $ | — | — | % | $ | 31,127 | 1.37 | % | |||||||||||||||||
U.S. government sponsored enterprises | — | — | % | 19,091 | 1.96 | % | — | — | % | — | — | % | — | — | % | 19,091 | 1.96 | % | |||||||||||||||||||||||
State and local governments | 25,489 | 1.99 | % | 34,962 | 2.38 | % | 221,265 | 3.69 | % | 347,785 | 4.09 | % | — | — | % | 629,501 | 3.77 | % | |||||||||||||||||||||||
Corporate bonds | 44,161 | 2.24 | % | 172,601 | 2.27 | % | — | — | % | — | — | % | — | — | % | 216,762 | 2.26 | % | |||||||||||||||||||||||
Residential mortgage-backed securities | — | — | % | — | — | % | — | — | % | — | — | % | 779,283 | 2.07 | % | 779,283 | 2.07 | % | |||||||||||||||||||||||
Commercial mortgage-backed securities | — | — | % | — | — | % | — | — | % | — | — | % | 102,479 | 2.07 | % | 102,479 | 2.07 | % | |||||||||||||||||||||||
Total available-for-sale | 69,650 | 2.15 | % | 228,881 | 2.26 | % | 236,318 | 3.55 | % | 361,632 | 3.97 | % | 881,762 | 2.07 | % | 1,778,243 | 2.67 | % | |||||||||||||||||||||||
Held-to-maturity | |||||||||||||||||||||||||||||||||||||||||
State and local governments | — | — | % | 2,108 | 2.21 | % | 86,741 | 3.02 | % | 559,464 | 4.12 | % | — | — | % | 648,313 | 3.97 | % | |||||||||||||||||||||||
Total held-to-maturity | — | — | % | 2,108 | 2.21 | % | 86,741 | 3.02 | % | 559,464 | 4.12 | % | — | — | % | 648,313 | 3.97 | % | |||||||||||||||||||||||
Total investment securities | $ | 69,650 | 2.15 | % | $ | 230,989 | 2.26 | % | $ | 323,059 | 3.41 | % | $ | 921,096 | 4.07 | % | $ | 881,762 | 2.07 | % | $ | 2,426,556 | 3.02 | % | |||||||||||||||||
Interest income from investment securities consisted of the following:
Years ended | |||||||||
(Dollars in thousands) | December 31, 2017 | December 31, 2016 | December 31, 2015 | ||||||
Taxable interest | $ | 38,433 | 40,366 | 40,200 | |||||
Tax-exempt interest | 43,535 | 50,026 | 50,886 | ||||||
Total interest income | $ | 81,968 | 90,392 | 91,086 | |||||
For additional information on investment securities, see Notes 1 and 2 to the Consolidated Financial Statements in “Item 8. Financial Statements and Supplementary Data.”
Other-Than-Temporary Impairment on Securities Analysis
Non-marketable equity securities. Non-marketable equity securities largely consist of capital stock issued by the FHLB of Des Moines and are evaluated for impairment whenever events or circumstances suggest the carrying value may not be recoverable. Based on the Company’s evaluation of its investments in non-marketable equity securities as of December 31, 2017, the Company determined that none of such securities had other-than-temporary impairment.
Debt securities. In evaluating debt securities for other-than-temporary impairment losses, management assesses whether the Company intends to sell the security or if it is more-likely-than-not that the Company will be required to sell the debt security. In so doing, management considers contractual constraints, liquidity, capital, asset/liability management and securities portfolio objectives. For debt securities with limited or inactive markets, the impact of macroeconomic conditions in the U.S. upon fair value estimates includes higher risk-adjusted discount rates and changes in credit ratings provided by NRSRO. In June 2017, S&P issued a credit opinion confirming its AA+ rating of U.S. government long-term debt, and the outlook remains stable. In October 2017, Moody's issued a credit opinion confirming its Aaa rating of U.S. government long-term debt and the outlook remains stable. In April 2017, Fitch issued a credit opinion confirming its AAA rating of U.S. government long-term debt and the outlook remains stable. S&P, Moody's and Fitch have similar credit ratings and outlooks with respect to certain long-term debt instruments issued by Federal National Mortgage Association (“Fannie Mae”), Federal Home Loan Mortgage Corporation (“Freddie Mac”) and other U.S. government agencies linked to the long-term U.S. debt.
36
The following table separates investment securities with an unrealized loss position at December 31, 2017 into two categories: investments purchased prior to 2017 and those purchased during 2017. Of those investments purchased prior to 2017, the fair market value and unrealized gain or loss at December 31, 2016 is also presented.
December 31, 2017 | December 31, 2016 | ||||||||||||||||||||
(Dollars in thousands) | Fair Value | Unrealized Loss | Unrealized Loss as a Percent of Fair Value | Fair Value | Unrealized (Loss) Gain | Unrealized (Loss) Gain as a Percent of Fair Value | |||||||||||||||
Temporarily impaired securities purchased prior to 2017 | |||||||||||||||||||||
U.S. government and federal agency | $ | 14,387 | $ | (143 | ) | (1 | )% | $ | 18,402 | $ | (133 | ) | (1 | )% | |||||||
U.S. government sponsored enterprises | 18,351 | (104 | ) | (1 | )% | 18,397 | 6 | — | % | ||||||||||||
State and local governments | 303,205 | (13,341 | ) | (4 | )% | 307,559 | (11,340 | ) | (4 | )% | |||||||||||
Corporate bonds | 128,670 | (483 | ) | — | % | 131,099 | (485 | ) | — | % | |||||||||||
Residential mortgage-backed securities | 616,972 | (7,833 | ) | (1 | )% | 784,546 | (9,070 | ) | (1 | )% | |||||||||||
Commercial mortgage-backed securities | 92,252 | (1,735 | ) | (2 | )% | 102,472 | (1,915 | ) | (2 | )% | |||||||||||
Total | $ | 1,173,837 | $ | (23,639 | ) | (2 | )% | $ | 1,362,475 | $ | (22,937 | ) | (2 | )% | |||||||
Temporarily impaired securities purchased during 2017 | |||||||||||||||||||||
State and local governments | $ | 5,795 | $ | (396 | ) | (7 | )% | ||||||||||||||
Residential mortgage-backed securities | 9,924 | (97 | ) | (1 | )% | ||||||||||||||||
Commercial mortgage-backed securities | 8,366 | (135 | ) | (2 | )% | ||||||||||||||||
Total | $ | 24,085 | $ | (628 | ) | (3 | )% | ||||||||||||||
Temporarily impaired securities | |||||||||||||||||||||
U.S. government and federal agency | $ | 14,387 | $ | (143 | ) | (1 | )% | ||||||||||||||
U.S. government sponsored enterprises | 18,351 | (104 | ) | (1 | )% | ||||||||||||||||
State and local governments | 309,000 | (13,737 | ) | (4 | )% | ||||||||||||||||
Corporate bonds | 128,670 | (483 | ) | — | % | ||||||||||||||||
Residential mortgage-backed securities | 626,896 | (7,930 | ) | (1 | )% | ||||||||||||||||
Commercial mortgage-backed securities | 100,618 | (1,870 | ) | (2 | )% | ||||||||||||||||
Total | $ | 1,197,922 | $ | (24,267 | ) | (2 | )% | ||||||||||||||
With respect to severity, the following table provides the number of debt securities and amount of unrealized loss in the various ranges of unrealized loss as a percent of book value at December 31, 2017:
(Dollars in thousands) | Number of Debt Securities | Unrealized Loss | ||||
Greater than 10.0% | 9 | $ | (1,999 | ) | ||
5.1% to 10.0% | 75 | (9,153 | ) | |||
0.1% to 5.0% | 445 | (13,115 | ) | |||
Total | 529 | $ | (24,267 | ) | ||
With respect to the valuation history of the impaired debt securities, the Company identified 302 securities which have been continuously impaired for the twelve months ending December 31, 2017. The valuation history of such securities in the prior year(s) was also reviewed to determine the number of months in the prior year(s) in which the identified securities were in an unrealized loss position.
37
The following table provides details of the 302 debt securities which have been continuously impaired for the twelve months ended December 31, 2017, including the most notable loss for any one bond in each category.
(Dollars in thousands) | Number of Debt Securities | Unrealized Loss for 12 Months Or More | Most Notable Loss | |||||||
U.S. government and federal agency | 16 | $ | (138 | ) | $ | (28 | ) | |||
U.S. government sponsored enterprises | 1 | (48 | ) | (48 | ) | |||||
State and local governments | 188 | (12,862 | ) | (1,438 | ) | |||||
Corporate bonds | 8 | (219 | ) | (54 | ) | |||||
Residential mortgage-backed securities | 73 | (4,880 | ) | (462 | ) | |||||
Commercial mortgage-backed securities | 16 | (1,401 | ) | (230 | ) | |||||
Total | 302 | $ | (19,548 | ) | ||||||
Based on the Company's analysis of its impaired debt securities as of December 31, 2017, the Company determined that none of such securities had other-than-temporary impairment and the unrealized losses were primarily the result of interest rate changes and market spreads subsequent to acquisition. A substantial portion of the debt securities with unrealized losses at December 31, 2017 were issued by Fannie Mae, Freddie Mac, Government National Mortgage Association (“Ginnie Mae”) and other agencies of the U.S. government or have credit ratings issued by one or more of the NRSRO entities in the four highest credit rating categories. All of the Company's impaired debt securities at December 31, 2017 have been determined by the Company to be investment grade.
Lending Activity
The Company focuses its lending activities primarily on the following types of loans: 1) first-mortgage, conventional loans secured by residential properties, particularly single-family; 2) commercial lending, including agriculture and public entities; and 3) installment lending for consumer purposes (e.g., home equity, automobile, etc.). Supplemental information regarding the Company’s loan portfolio and credit quality based on regulatory classification is provided in the section captioned “Loans by Regulatory Classification” included in “Part I. Item 2. Management’s Discussion and Analysis of Financial Condition and Results of Operations.” The regulatory classification of loans is based primarily on the type of collateral for the loans. Loan information included in “Part I. Item 2. Management’s Discussion and Analysis of Financial Condition and Results of Operations” is based on the Company’s loan segments and classes, which are based on the purpose of the loan, unless otherwise noted as a regulatory classification. The following table summarizes the Company’s loan portfolio as of the dates indicated:
December 31, 2017 | December 31, 2016 | December 31, 2015 | December 31, 2014 | December 31, 2013 | ||||||||||||||||||||||||||||||
(Dollars in thousands) | Amount | Percent | Amount | Percent | Amount | Percent | Amount | Percent | Amount | Percent | ||||||||||||||||||||||||
Residential real estate loans | $ | 720,728 | 11 | % | $ | 674,347 | 12 | % | $ | 688,912 | 14 | % | $ | 611,463 | 14 | % | $ | 577,589 | 15 | % | ||||||||||||||
Commercial loans | ||||||||||||||||||||||||||||||||||
Real estate | 3,577,139 | 55 | % | 2,990,141 | 54 | % | 2,633,953 | 53 | % | 2,337,548 | 54 | % | 2,049,247 | 52 | % | |||||||||||||||||||
Other commercial | 1,579,353 | 25 | % | 1,342,250 | 24 | % | 1,099,564 | 22 | % | 925,900 | 21 | % | 852,036 | 22 | % | |||||||||||||||||||
Total | 5,156,492 | 80 | % | 4,332,391 | 78 | % | 3,733,517 | 75 | % | 3,263,448 | 75 | % | 2,901,283 | 74 | % | |||||||||||||||||||
Consumer and other loans | ||||||||||||||||||||||||||||||||||
Home equity | 457,918 | 7 | % | 434,774 | 8 | % | 420,901 | 9 | % | 394,670 | 9 | % | 366,465 | 9 | % | |||||||||||||||||||
Other consumer | 242,686 | 4 | % | 242,951 | 4 | % | 235,351 | 5 | % | 218,514 | 5 | % | 217,501 | 5 | % | |||||||||||||||||||
Total | 700,604 | 11 | % | 677,725 | 12 | % | 656,252 | 14 | % | 613,184 | 14 | % | 583,966 | 14 | % | |||||||||||||||||||
Loans receivable | 6,577,824 | 102 | % | 5,684,463 | 102 | % | 5,078,681 | 103 | % | 4,488,095 | 103 | % | 4,062,838 | 103 | % | |||||||||||||||||||
ALLL | (129,568 | ) | (2 | )% | (129,572 | ) | (2 | )% | (129,697 | ) | (3 | )% | (129,753 | ) | (3 | )% | (130,351 | ) | (3 | )% | ||||||||||||||
Loans receivable, net | $ | 6,448,256 | 100 | % | $ | 5,554,891 | 100 | % | $ | 4,948,984 | 100 | % | $ | 4,358,342 | 100 | % | $ | 3,932,487 | 100 | % | ||||||||||||||
38
The stated maturities or first repricing term (if applicable) for the loan portfolio at December 31, 2017 was as follows:
(Dollars in thousands) | Residential Real Estate | Commercial | Consumer and Other | Total | ||||||||
Variable rate maturing or repricing | ||||||||||||
In one year or less | $ | 255,733 | 1,296,661 | 335,641 | 1,888,035 | |||||||
After one year through five years | 156,282 | 1,713,739 | 130,032 | 2,000,053 | ||||||||
Thereafter | 4,682 | 292,190 | 4,529 | 301,401 | ||||||||
Fixed rate maturing | ||||||||||||
In one year or less | 169,674 | 546,275 | 111,210 | 827,159 | ||||||||
After one year through five years | 127,273 | 779,841 | 116,155 | 1,023,269 | ||||||||
Thereafter | 7,084 | 527,786 | 3,037 | 537,907 | ||||||||
Total | $ | 720,728 | 5,156,492 | 700,604 | 6,577,824 | |||||||
Residential Real Estate Lending
The Company’s lending activities consist of the origination of both construction and permanent loans on residential real estate. The Company actively solicits residential real estate loan applications from real estate brokers, contractors, existing customers, customer referrals, and on-line applications. The Company’s lending policies generally limit the maximum loan-to-value ratio on residential mortgage loans to 80 percent of the lesser of the appraised value or purchase price. Policies allow for higher loan-to-values with appropriate risk mitigation such as documented compensating factors, credit enhancement, etc. For loans held for sale, the Company complies with the investor’s loan-to-value guidelines. The Company also provides interim construction financing for single-family dwellings. These loans are supported by a term take-out commitment.
Consumer Land or Lot Loans
The Company originates land and lot acquisition loans to borrowers who intend to construct their primary residence on the respective land or lot. These loans are generally for a term of three to five years and are secured by the developed land or lot with the loan-to-value limited to the lesser of 75 percent of the appraised value or 75 percent of the cost.
Unimproved Land and Land Development Loans
Although the Company has originated very few unimproved land and land development loans since the economic downturn in 2008, the Company may originate such loans on properties intended for residential and commercial use where improved real estate market conditions have occurred. These loans are typically made for a term of 18 months to two years and are secured by the developed property with a loan-to-value not to exceed the lesser of 75 percent of cost or 65 percent of the appraised discounted bulk sale value upon completion of the improvements. The projects under development are inspected on a regular basis and advances are made on a percentage-of-completion basis. The loans are made to borrowers with real estate development experience and appropriate financial strength. Generally, the Company requires that a certain percentage of the development be pre-sold or that construction and term take-out commitments are in place prior to funding the loan. Loans made on unimproved land are generally made for a term of five to ten years with a loan-to-value not to exceed the lesser of 50 percent of appraised value or 50 percent of cost.
Residential Builder Guidance Lines
The Company provides Builder Guidance Lines that are comprised of pre-sold and spec-home construction and lot acquisition loans. The spec-home construction and lot acquisition loans are limited to a specific number and maximum amount. Generally, the individual loans will not exceed a one year maturity. The homes under construction are inspected on a regular basis and advances made on a percentage-of-completion basis.
Construction Loans
During the construction loan term, all construction loan collateral properties are inspected at least monthly, or more frequently as needed, until completion. Draws on construction loans are predicated upon the results of the inspection and advanced based upon a percentage-of-completion basis versus original budget percentages. When construction loans become non-performing and the associated project is not complete, the Company on a case-by-case basis makes the decision to advance additional funds or to initiate collection/foreclosure proceedings. Such decision includes obtaining “as-is” and “at completion” appraisals for consideration of potential increases or decreases in the collateral’s value. The Company also considers the increased costs of monitoring progress to completion, and the related collection/holding period costs should collateral ownership be transferred to the Company.
39
Commercial Real Estate Loans
Loans are made to purchase, construct and finance commercial real estate properties. These loans are generally made to borrowers who will own and occupy the property, but may include loans to finance investment or income properties. Commercial real estate loans generally have a loan-to-value up to the lesser of 75 percent of the appraised value or 75 percent of the cost and require a minimum 1.2 times debt service coverage margin.
Agricultural Lending
Agricultural lending is conducted on a conservative basis and consists of operating credits, term real estate loans for the acquisition or refinance of agricultural real estate or equipment, and term livestock loans for the acquisition or refinance of livestock. Loan-to-value on equipment, livestock and agricultural real estate is generally limited to 75 percent.
Home Equity Loans
The Company’s home equity loans of $458 million and $435 million as of December 31, 2017 and 2016, respectively, consist of 1-4 family junior lien mortgages and first and junior lien lines of credit secured by residential real estate. At December 31, 2017, the home equity loan portfolio consisted of 90 percent variable interest rate and 10 percent fixed interest rate loans. Approximately 54 percent of the home equity loans were in a first lien status with the remaining 46 percent in junior lien status. Approximately 8 percent of the home equity loans were closed-end amortizing loans and 92 percent were open-end, revolving home equity lines of credit. At December 31, 2016, the home equity loan portfolio consisted of 85 percent variable interest rate and 15 percent fixed interest rate loans. Approximately 54 percent of the home equity loans were in a first lien status with the remaining 46 percent in junior lien status. Approximately 12 percent of the home equity loans were closed-end amortizing loans and 88 percent were open-end, revolving home equity lines of credit.
Home equity lines of credit are generally originated with maturity terms of 15 years. At origination, borrowers can choose a variable interest rate that changes quarterly, or after the first 3, 5 or 10 years from the origination date. The draw period for home equity lines of credit usually exists from origination to maturity. During the draw period, the Company has home equity lines of credit where the borrowers pay interest only and home equity lines of credit where borrowers pay principal and interest.
Consumer Lending
The majority of consumer loans are secured by real estate, automobiles, or other assets. The Company intends to continue making such loans because of their short-term nature, generally between three months and five years. Moreover, interest rates on consumer loans are generally higher than on residential mortgage loans. The Company also originates second mortgage and home equity loans, especially to existing customers in instances where the first and second mortgage loans are less than 80 percent of the current appraised value of the property.
States and Political Subdivisions Lending
The Company lends directly to state and local political subdivisions. The loans are typically secured by the full faith and credit of the municipality or a specific revenue stream such as water or sewer fees. In general, state and local political subdivision loans carry a low risk of default and offer other complimentary business opportunities such as deposits and cash management. The loans are generally long-term in nature and interest on many of these loans is considered tax-exempt for federal income tax purposes.
Credit Risk Management
The Company is committed to a conservative management of the credit risk within the loan portfolio, including the early recognition of problem loans. The Company’s credit risk management includes stringent credit policies, individual loan approval limits, limits on concentrations of credit, and committee approval of larger loan requests. Management practices also include regular internal and external credit examinations, identification and review of individual loans and leases experiencing deterioration of credit quality, procedures for the collection of non-performing assets, quarterly monitoring of the loan portfolio, semi-annual review of loans by industry, and periodic stress testing of the loans secured by real estate. Federal and state regulatory safety and soundness examinations are conducted annually.
40
The Company’s loan policy and credit administration practices establish standards and limits for all extensions of credit that are secured by interests in or liens on real estate, or made for the purpose of financing the construction of real property or other improvements. Ongoing monitoring and review of the loan portfolio is based on current information, including: the borrowers’ and guarantors’ creditworthiness, value of the real estate and other collateral, the project’s performance against projections, and monthly inspections by Company employees or external parties until the real estate project is complete.
Monitoring of the junior lien and home equity lines of credit portfolios includes evaluating payment delinquency, collateral values, bankruptcy notices and foreclosure filings. Additionally, the Company places junior lien mortgages and junior lien home equity lines of credit on non-accrual status when there is evidence that the associated senior lien is 90 days past due or is in the process of foreclosure, regardless of the junior lien delinquency status.
Loan Approval Limits
Individual loan approval limits have been established for each lender based on the loan types and experience of the individual. Each Bank division has an Officer Loan Committee consisting of senior lenders and members of senior management. Each of the Bank divisions’ Officer Loan Committees has loan approval authority between $500,000 and $2,000,000. Each of the Bank divisions’ advisory boards has loan approval authority up to $4,000,000. Loans, or a combination of loans, including new and renewed, exceeding these limits and up to $20,000,000 are subject to approval by the Company’s Executive Loan Committee consisting of the Bank divisions’ senior loan officers and the Company’s Chief Credit Administrator. Loans, or a combination of loans, including new and renewed, greater than $20,000,000 are subject to approval by the Bank’s Board of Directors. Under banking laws, loans to one borrower and related entities are limited to a prescribed percentage of the unimpaired capital and surplus of the Bank.
Interest Reserves
Interest reserves are used to periodically advance loan funds to pay interest charges on the outstanding balance of the related loan. As with any extension of credit, the decision to establish a loan-funded interest reserve upon origination of construction loans, including residential construction and land, lot and other construction loans, is based on prudent underwriting, including the feasibility of the project, expected cash flow, creditworthiness of the borrower and guarantors, and the protection provided by the real estate and other underlying collateral. Interest reserves provide an effective means for addressing the cash flow characteristics of construction loans. In response to the downturn in the housing market and potential impact upon construction lending, the Company discourages the creation or continued use of interest reserves.
Interest reserves are advanced provided the related construction loan is performing as expected. Loans with interest reserves may be extended, renewed or restructured only when the related loan continues to perform as expected and meets the prudent underwriting standards identified above. Such renewals, extension or restructuring are not permitted in order to keep the related loan current.
In monitoring the performance and credit quality of a construction loan, the Company assesses the adequacy of any remaining interest reserve, and whether the use of an interest reserve remains appropriate in the presence of emerging weakness and associated risks in the construction loan.
The ongoing accrual and recognition of uncollected interest as income continues only when facts and circumstances continue to reasonably support the contractual payment of principal or interest. Loans are typically designated as non-accrual when the collection of the contractual principal or interest is unlikely and has remained unpaid for ninety days or more. For such loans, the accrual of interest and its capitalization into the loan balance will be discontinued.
The Company had $36.4 million and $58.7 million of loans with remaining interest reserves of $921 thousand and $1.1 million as of December 31, 2017 and 2016, respectively. The Company did not extend, renew or restructure any loans with interest reserves during 2017 or 2016. As of December 31, 2017, the Company had no construction loans with interest reserves that are currently non-performing or which are potential problem loans.
41
Loan Purchases and Sales
Fixed rate, long-term mortgage loans are generally sold in the secondary market. The Company is active in the secondary market, primarily through the origination of conventional, Rural Development, Federal Housing Administration and Department of Veterans Affairs residential mortgages. The sale of loans in the secondary mortgage market reduces the Company’s risk of holding long-term, fixed rate loans during periods of rising interest rates. In connection with conventional loan sales, the Company typically sells the majority of mortgage loans originated with servicing released. The Company has also been very active in generating commercial Small Business Administration loans, and other commercial loans, with a portion of those loans sold to investors. The Company has not originated any type of subprime mortgages, either for the loan portfolio or for sale to investors. In addition, the Company has not purchased investment securities collateralized with subprime mortgages. The Company does not actively purchase loans from other financial institutions, and substantially all of the Company’s loans receivable are with customers in the Company’s geographic market areas.
Loan Origination and Other Fees
In addition to interest earned on loans, the Company receives fees for originating loans. Loan fees generally are a percentage of the principal amount of the loan and are charged to the borrower, and are normally deducted from the proceeds of the loan. Loan origination fees are generally 1.0 percent to 1.5 percent on residential mortgages and 0.5 percent to 1.5 percent on commercial loans. Consumer loans generally require a fixed fee amount. The Company also receives other fees and charges relating to existing loans, which include charges and fees collected in connection with loan modifications.
Appraisal and Evaluation Process
The Company’s loan policy and credit administration practices have adopted and implemented the applicable legal and regulatory requirements, which establishes criteria for obtaining appraisals or evaluations (new or updated), including transactions that are otherwise exempt from the appraisal requirements.
Each of the Bank divisions monitor conditions, including supply and demand factors, in the real estate markets served so they can react quickly to changing market conditions to mitigate potential losses from specific credit exposures within the loan portfolio. Evidence of the following real estate market conditions and trends is obtained from lending personnel and third party sources:
• | demographic indicators, including employment and population trends; |
• | foreclosures, vacancy, construction and absorption rates; |
• | property sales prices, rental rates, and lease terms; |
• | current tax assessments; |
• | economic indicators, including trends within the lending areas; and |
• | valuation trends, including discount and capitalization rates. |
Third party information sources include federal, state, and local governments and agencies thereof, private sector economic data vendors, real estate brokers, licensed agents, sales, rental and foreclosure data tracking services.
The time between ordering an appraisal or evaluation and receipt from third party vendors is typically two to six weeks for residential property depending on geographic market and four to six weeks for non-residential property. For real estate properties that are of highly specialized or limited use, significantly complex or large, additional time beyond the typical times may be required for new appraisals or evaluations (new or updated).
As part of the Company’s credit administration and portfolio monitoring practices, the Company’s regular internal and external credit examinations review a significant number of individual loan files. Appraisals and evaluations (new or updated) are reviewed to determine whether the timeliness, methods, assumptions, and findings are reasonable and in compliance with the Company’s loan policy and credit administration practices. Such reviews include the adequacy of the steps taken by the Company to ensure that the individuals who perform appraisals and evaluations (new or updated) are appropriately qualified and are not subject to conflicts of interest. If there are any deficiencies noted in the reviews, they are reported to Bank management and prompt corrective action is taken.
42
Non-performing Assets
The following table summarizes information regarding non-performing assets at the dates indicated:
At or for the Years ended | |||||||||||||||
(Dollars in thousands) | December 31, 2017 | December 31, 2016 | December 31, 2015 | December 31, 2014 | December 31, 2013 | ||||||||||
Other real estate owned | $ | 14,269 | 20,954 | 26,815 | 27,804 | 26,860 | |||||||||
Accruing loans 90 days or more past due | |||||||||||||||
Residential real estate | 2,366 | 266 | — | 35 | 429 | ||||||||||
Commercial | 3,582 | 428 | 2,051 | 105 | 160 | ||||||||||
Consumer and other | 129 | 405 | 80 | 74 | 15 | ||||||||||
Total | 6,077 | 1,099 | 2,131 | 214 | 604 | ||||||||||
Non-accrual loans | |||||||||||||||
Residential real estate | 4,924 | 4,528 | 8,073 | 6,798 | 10,702 | ||||||||||
Commercial | 35,629 | 39,033 | 36,510 | 48,138 | 61,577 | ||||||||||
Consumer and other | 4,280 | 5,771 | 6,550 | 6,946 | 9,677 | ||||||||||
Total | 44,833 | 49,332 | 51,133 | 61,882 | 81,956 | ||||||||||
Total non-performing assets | $ | 65,179 | 71,385 | 80,079 | 89,900 | 109,420 | |||||||||
Non-performing assets as a percentage of subsidiary assets | 0.68 | % | 0.76 | % | 0.88 | % | 1.08 | % | 1.39 | % | |||||
ALLL as a percentage of non-performing loans | 255 | % | 257 | % | 244 | % | 209 | % | 158 | % | |||||
Accruing loans 30-89 days past due | $ | 37,687 | 25,617 | 19,413 | 25,904 | 32,116 | |||||||||
Accruing troubled debt restructurings | $ | 38,491 | 52,077 | 63,590 | 69,129 | 81,110 | |||||||||
Non-accrual troubled debt restructurings | $ | 23,709 | 21,693 | 27,057 | 33,714 | 42,461 | |||||||||
U.S. government guarantees included in non-performing assets | $ | 2,513 | 1,746 | 2,312 | 3,649 | 5,412 | |||||||||
Interest income 1 | $ | 2,162 | 2,364 | 2,471 | 3,005 | 4,122 | |||||||||
______________________________
1 | Amounts represent estimated interest income that would have been recognized on loans accounted for on a non-accrual basis as of the end of each period had such loans performed pursuant to contractual terms. |
Non-performing assets at December 31, 2017 were $65.2 million, a decrease of $6.2 million, or 9 percent, from a year ago. Non-performing assets as a percentage of subsidiary assets at December 31, 2017 was 0.68 percent which was a decrease of 8 basis points from the prior year end of 0.76 percent. Early stage delinquencies (accruing loans 30-89 days past due) of $37.7 million at December 31, 2017 increased $12.1 million from the prior year end.
Most of the Company’s non-performing assets are secured by real estate, and based on the most current information available to management, including updated appraisals or evaluations (new or updated), the Company believes the value of the underlying real estate collateral is adequate to minimize significant charge-offs or losses to the Company. The Company evaluates the level of its non-performing loans, the values of the underlying real estate and other collateral, and related trends in internal and external environmental factors and net charge-offs in determining the adequacy of the ALLL. Through pro-active credit administration, the Company works closely with its borrowers to seek favorable resolution to the extent possible, thereby attempting to minimize net charge-offs or losses to the Company.
43
In prior years, construction loans, a regulatory classification, accounted for a significant portion of the Company’s non-accrual loans. As a result of the gradual economic recovery and the Company’s diligent focus on this category of non-performing loans, construction loans only accounted for 24 percent of the Company’s non-accrual loans as of December 31, 2017. With very limited exceptions, the Company does not disburse additional funds on non-performing loans. Instead, the Company has proceeded to collection and foreclosure actions in order to reduce the Company’s exposure to loss on such loans.
For additional information on accounting policies relating to non-performing assets and impaired loans, see Note 1 to the Consolidated Financial Statements in “Item 8. Financial Statements and Supplementary Data.”
Impaired Loans
Loans are designated impaired when, based upon current information and events, it is probable that the Company will be unable to collect the scheduled payments of principal or interest when due according to the contractual terms of the loan agreement and therefore, the Company has serious doubts as to the ability of such borrowers to fulfill the contractual obligation. Impaired loans include non-performing loans (i.e., non-accrual loans and accruing loans ninety days or more past due) and accruing loans under ninety days past due where it is probable payments will not be received according to the loan agreement (e.g., troubled debt restructuring). Impaired loans were $120 million and $130 million as of December 31, 2017 and December 31, 2016, respectively. The ALLL includes specific valuation allowances of $5.2 million and $6.9 million of impaired loans as of December 31, 2017 and December 31, 2016, respectively.
Restructured Loans
A restructured loan is considered a troubled debt restructuring (“TDR”) if the creditor, for economic or legal reasons related to the debtor’s financial difficulties, grants a concession to the debtor that it would not otherwise consider. Each restructured debt is separately negotiated with the borrower and includes terms and conditions that reflect the borrower’s prospective ability to service the debt as modified. The Company discourages the use of the multiple loan strategy when restructuring loans regardless of whether or not the loans are designated as TDRs. The Company’s TDR loans of $62.2 million and $73.8 million as of December 31, 2017 and December 31, 2016, respectively, are considered impaired loans.
Other Real Estate Owned
The book value of loans prior to the acquisition of collateral and transfer of the loans into OREO during 2017 was $6.0 million. The fair value of the loan collateral acquired in foreclosure during 2017 was $4.5 million. The following table sets forth the changes in OREO for the periods indicated:
Years ended | |||||||||||||||
(Dollars in thousands) | December 31, 2017 | December 31, 2016 | December 31, 2015 | December 31, 2014 | December 31, 2013 | ||||||||||
Balance at beginning of period | $ | 20,954 | 26,815 | 27,804 | 26,860 | 45,115 | |||||||||
Acquisitions | 96 | 882 | 974 | 3,928 | 1,203 | ||||||||||
Additions | 4,466 | 5,198 | 7,989 | 11,493 | 15,266 | ||||||||||
Capital improvements | — | 149 | 1,710 | 1,661 | 79 | ||||||||||
Write-downs | (604 | ) | (1,821 | ) | (1,575 | ) | (691 | ) | (3,639 | ) | |||||
Sales | (10,643 | ) | (10,269 | ) | (10,087 | ) | (15,447 | ) | (31,164 | ) | |||||
Balance at end of period | $ | 14,269 | 20,954 | 26,815 | 27,804 | 26,860 | |||||||||
Allowance for Loan and Lease Losses
Determining the adequacy of the ALLL involves a high degree of judgment and is inevitably imprecise as the risk of loss is difficult to quantify. The ALLL methodology is designed to reasonably estimate the probable loan and lease losses within the Company’s loan portfolio. Accordingly, the ALLL is maintained within a range of estimated losses. The determination of the ALLL, including the provision for loan losses and net charge-offs, is a critical accounting estimate that involves management’s judgments about all known relevant internal and external environmental factors that affect loan losses, including the credit risk inherent in the loan portfolio, economic conditions nationally and in the local markets in which the Company operates, trends and changes in collateral values, delinquencies, non-performing assets, net charge-offs and credit-related policies and personnel. Although the Company continues to actively monitor economic trends, soft economic conditions combined with potential declines in the values of real estate that collateralize most of the Company’s loan portfolio may adversely affect the credit risk and potential for loss to the Company.
The ALLL evaluation is well documented and approved by the Company’s Board. In addition, the policy and procedures for determining the balance of the ALLL are reviewed annually by the Company’s Board, the internal audit department, independent credit reviewers and state and federal bank regulatory agencies.
44
At the end of each quarter, the Company analyzes its loan portfolio and maintains an ALLL at a level that is appropriate and determined in accordance with GAAP. The allowance consists of a specific valuation allowance component and a general valuation allowance component. The specific valuation allowance component relates to loans that are determined to be impaired. A specific valuation allowance is established when the fair value of a collateral-dependent loan or the present value of the loan’s expected future cash flows (discounted at the loan’s effective interest rate) is lower than the carrying value of the impaired loan. The general valuation allowance component relates to probable credit losses inherent in the balance of the loan portfolio based on historical loss experience, adjusted for changes in trends and conditions of qualitative or environmental factors.
The Bank divisions’ credit administration reviews their respective loan portfolios to determine which loans are impaired and estimates the specific valuation allowance. The impaired loans and related specific valuation allowance are then provided to the Company’s credit administration for further review and approval. The Company’s credit administration also determines the estimated general valuation allowance and reviews and approves the overall ALLL. The credit administration of the Company exercises significant judgment when evaluating the effect of applicable qualitative or environmental factors on the Company’s historical loss experience for loans not identified as impaired. Quantification of the impact upon the Company’s ALLL is inherently subjective as data for any factor may not be directly applicable, consistently relevant, or reasonably available for management to determine the precise impact of a factor on the collectability of the Company’s loans collectively evaluated for impairment as of each evaluation date. The Company’s credit administration documents its conclusions and rationale for changes that occur in each applicable factor’s weight (i.e., measurement) and ensures that such changes are directionally consistent based on the underlying current trends and conditions for the factor. To have directional consistency, the provision for loan losses and credit quality should generally move in the same direction.
The Company’s model includes fourteen bank divisions with separate management teams providing substantial local oversight to the lending and credit management function. The Company’s business model affords multiple reviews of larger loans before credit is extended, a significant benefit in mitigating and managing the Company’s credit risk. The geographic dispersion of the market areas in which the Company operates further mitigates the risk of credit loss. While this process is intended to limit credit exposure, there can be no assurance that further problem credits will not arise and additional loan losses incurred, particularly in this slowly improving, but fragile economic recovery and in periods of rapid economic downturns.
The primary responsibility for credit risk assessment and identification of problem loans rests with the loan officer of the account. This continuous process of identifying impaired loans is necessary to support management’s evaluation of the ALLL adequacy. An independent loan review function verifying credit risk ratings evaluates the loan officer and management’s evaluation of the loan portfolio credit quality.
No assurance can be given that the Company will not, in any particular period, sustain losses that are significant relative to the ALLL amount, or that subsequent evaluations of the loan portfolio applying management’s judgment about then current factors, including economic and regulatory developments, will not require significant changes in the ALLL. Under such circumstances, this could result in enhanced provisions for loan losses. See additional risk factors in “Item 1A. Risk Factors.”
The following table summarizes the allocation of the ALLL as of the dates indicated:
December 31, 2017 | December 31, 2016 | December 31, 2015 | December 31, 2014 | December 31, 2013 | ||||||||||||||||||||||||||||||
(Dollars in thousands) | ALLL | Percent of Loans in Category | ALLL | Percent of Loans in Category | ALLL | Percent of Loans in Category | ALLL | Percent of Loans in Category | ALLL | Percent of Loans in Category | ||||||||||||||||||||||||
Residential real estate | $ | 10,798 | 11 | % | $ | 12,436 | 12 | % | $ | 14,427 | 13 | % | $ | 14,680 | 13 | % | $ | 14,067 | 14 | % | ||||||||||||||
Commercial real estate | 68,515 | 54 | % | 65,773 | 52 | % | 67,877 | 52 | % | 67,799 | 52 | % | 70,332 | 51 | % | |||||||||||||||||||
Other commercial | 39,303 | 24 | % | 37,823 | 24 | % | 32,525 | 22 | % | 30,891 | 21 | % | 28,630 | 21 | % | |||||||||||||||||||
Home equity | 6,204 | 7 | % | 7,572 | 8 | % | 8,998 | 8 | % | 9,963 | 9 | % | 9,299 | 9 | % | |||||||||||||||||||
Other consumer | 4,748 | 4 | % | 5,968 | 4 | % | 5,870 | 5 | % | 6,420 | 5 | % | 8,023 | 5 | % | |||||||||||||||||||
Total | $ | 129,568 | 100 | % | $ | 129,572 | 100 | % | $ | 129,697 | 100 | % | $ | 129,753 | 100 | % | $ | 130,351 | 100 | % | ||||||||||||||
45
The following table summarizes the ALLL experience for the periods indicated:
Years ended | |||||||||||||||
(Dollars in thousands) | December 31, 2017 | December 31, 2016 | December 31, 2015 | December 31, 2014 | December 31, 2013 | ||||||||||
Balance at beginning of period | $ | 129,572 | 129,697 | 129,753 | 130,351 | 130,854 | |||||||||
Provision for loan losses | 10,824 | 2,333 | 2,284 | 1,912 | 6,887 | ||||||||||
Charge-offs | |||||||||||||||
Residential real estate | (199 | ) | (464 | ) | (985 | ) | (431 | ) | (793 | ) | |||||
Commercial loans | (9,044 | ) | (4,860 | ) | (4,242 | ) | (4,860 | ) | (8,407 | ) | |||||
Consumer and other loans | (10,088 | ) | (6,172 | ) | (1,775 | ) | (2,312 | ) | (4,443 | ) | |||||
Total charge-offs | (19,331 | ) | (11,496 | ) | (7,002 | ) | (7,603 | ) | (13,643 | ) | |||||
Recoveries | |||||||||||||||
Residential real estate | 82 | 207 | 92 | 328 | 299 | ||||||||||
Commercial loans | 3,569 | 5,576 | 3,620 | 3,757 | 4,803 | ||||||||||
Consumer and other loans | 4,852 | 3,255 | 950 | 1,008 | 1,151 | ||||||||||
Total recoveries | 8,503 | 9,038 | 4,662 | 5,093 | 6,253 | ||||||||||
Charge-offs, net of recoveries | (10,828 | ) | (2,458 | ) | (2,340 | ) | (2,510 | ) | (7,390 | ) | |||||
Balance at end of period | $ | 129,568 | 129,572 | 129,697 | 129,753 | 130,351 | |||||||||
ALLL as a percentage of total loans | 1.97 | % | 2.28 | % | 2.55 | % | 2.89 | % | 3.21 | % | |||||
Net charge-offs as a percentage of average loans | 0.17 | % | 0.05 | % | 0.05 | % | 0.06 | % | 0.20 | % | |||||
The ALLL as a percent of total loans outstanding at December 31, 2017 was 1.97 percent, a decrease of 31 basis points from 2.28 percent at December 31, 2016, which was driven by loan growth, stabilizing credit quality, and no allowance carried over from the Foothills acquisition as a result of the acquired loans recorded at fair value.
The Company’s ALLL of $130 million is considered adequate to absorb losses from any class of its loan portfolio. For the periods ended December 31, 2017 and 2016, the Company believes the ALLL is commensurate with the risk in the Company’s loan portfolio and is directionally consistent with the change in the quality of the Company’s loan portfolio.
When applied to the Company’s historical loss experience, the qualitative or environmental factors result in the provision for loan losses being recorded in the period in which the loss has probably occurred. When the loss is confirmed at a later date, a charge-off is recorded. During 2017, charge-offs, net of recoveries, exceeded the provision for loan losses by $4 thousand. During the same period in 2016, charge-offs, net of recoveries, exceeded the provision for loan losses by $125 thousand.
The Company provides commercial services to individuals, small to medium-sized businesses, community organizations and public entities from 145 locations, including 136 branches, across Montana, Idaho, Utah, Washington, Wyoming, Colorado and Arizona. The states in which the Company operates have diverse economies and markets that are tied to commodities (crops, livestock, minerals, oil and natural gas), tourism, real estate and land development and an assortment of industries, both manufacturing and service-related. Thus, the changes in the global, national, and local economies are not uniform across the Company’s geographic locations.
46
Overall, there continues to be improvements in the economic environment and housing markets throughout the Company’s footprint. Home prices continue to increase in all of the states within the Company’s footprint. Washington and Arizona are experiencing the strongest pricing pressures, while Wyoming continues to lag behind the national trend. Five of the Company’s states are ranked in the top 10 nationally for house price appreciation. Home ownership in the United States has increased slightly to 63.9 percent as of the third quarter of 2017 after bottoming out at 62.9 percent in the second quarter of 2016. The long-term average for the United States homeownership rate is at 65.3 percent. Quarterly personal income growth remains in positive territory for each of the Company’s states, while Wyoming is the only state in the Company’s footprint that doesn’t exceed the national average. The Federal Reserve Bank of Philadelphia’s composite state coincident indices projects steady growth throughout the Company’s footprint, with Arizona being one of only three states in the country with expected growth greater than 4.5 percent. The United States economy grew at or above 3 percent for a second straight quarter. All of the states in the Company’s footprint have unemployment rates at or below 5 percent, which reflects the Federal Reserve’s definition of full employment. There has been a slight uptick in crude oil and base metal prices, while natural gas prices remain steady. Certain agriculture commodities within the Company’s footprint remain volatile. The tourism industry and related lodging activity continues to be a source of strength for locations where the Company’s markets include national parks and similar recreational areas. However, Canadian tourism in Washington, Idaho and Montana continues to be negatively impacted by the weak Canadian dollar. Largely due to the recently enacted Tax Act, small business confidence ended the year at high levels; however, it remains to be seen how much of an impact the Tax Act will have on the Company’s economic environment. In general, the Company sees positive signs in the various economic indices; however, given the significant recession experienced during 2008 and 2009, the Company is cautiously optimistic about the subsequent recovery of the housing industry. The Company will continue to actively monitor the economy’s impact on its lending portfolio.
In evaluating the need for a specific or general valuation allowance for impaired and unimpaired loans, respectively, within the Company’s construction loan portfolio (i.e., regulatory classification), including residential construction and land, lot and other construction loans, the credit risk related to such loans was considered in the ongoing monitoring of such loans, including assessments based on current information, including appraisals or evaluations (new or updated) of the underlying collateral, expected cash flows and the timing thereof, as well as the estimated cost to sell when such costs are expected to reduce the cash flows available to repay or otherwise satisfy the construction loan. Construction loans were 13 percent and 12 percent of the Company’s total loan portfolio and accounted for 24 percent and 20 percent of the Company’s non-accrual loans at December 31, 2017 and December 31, 2016, respectively. Collateral securing construction loans includes residential buildings (e.g., single/multi-family and condominiums), commercial buildings, and associated land (e.g., multi-acre parcels and individual lots, with and without shorelines).
The Company’s ALLL consisted of the following components as of the dates indicated:
(Dollars in thousands) | December 31, 2017 | December 31, 2016 | ||||
Specific valuation allowance | $ | 5,223 | 6,881 | |||
General valuation allowance | 124,345 | 122,691 | ||||
Total ALLL | $ | 129,568 | 129,572 | |||
During 2017, the ALLL decreased by $4 thousand, the net result of a $1.7 million decrease in the specific valuation allowance and a $1.7 million increase in the general valuation allowance. The specific valuation allowance decreased as the result of a $4.4 million decrease in loans individually evaluated for impairment with a specific impairment. The increase in the general valuation allowance since the prior year end was a result of changes in qualitative or environmental factors and an increase of $605 million in loans collectively evaluated for impairment, excluding the current year acquisition. At acquisition date, the assets and liabilities of the acquired banks are recorded at their estimated fair values which results in no ALLL carried over on loans from acquired banks.
For additional information regarding the ALLL, its relation to the provision for loan losses and risk related to asset quality, see Note 3 to the Consolidated Financial Statements in “Item 8. Financial Statements and Supplementary Data.”
47
Loans by Regulatory Classification
Supplemental information regarding identification of the Company’s loan portfolio and credit quality based on regulatory classification is provided in the following tables. The regulatory classification of loans is based primarily on the type of collateral for the loans. There may be differences when compared to loan tables and loan amounts appearing elsewhere which reflect the Company’s internal loan segments and classes which are based on the purpose of the loan.
The following table summarizes the Company’s loan portfolio by regulatory classification:
(Dollars in thousands) | December 31, 2017 | December 31, 2016 | $ Change | % Change | ||||||||||
Custom and owner occupied construction | $ | 109,555 | $ | 86,233 | $ | 23,322 | 27 | % | ||||||
Pre-sold and spec construction | 72,160 | 66,184 | 5,976 | 9 | % | |||||||||
Total residential construction | 181,715 | 152,417 | 29,298 | 19 | % | |||||||||
Land development | 82,398 | 75,078 | 7,320 | 10 | % | |||||||||
Consumer land or lots | 102,289 | 97,449 | 4,840 | 5 | % | |||||||||
Unimproved land | 65,753 | 69,157 | (3,404 | ) | (5 | )% | ||||||||
Developed lots for operative builders | 14,592 | 13,254 | 1,338 | 10 | % | |||||||||
Commercial lots | 23,770 | 30,523 | (6,753 | ) | (22 | )% | ||||||||
Other construction | 391,835 | 257,769 | 134,066 | 52 | % | |||||||||
Total land, lot, and other construction | 680,637 | 543,230 | 137,407 | 25 | % | |||||||||
Owner occupied | 1,132,833 | 977,932 | 154,901 | 16 | % | |||||||||
Non-owner occupied | 1,186,066 | 929,729 | 256,337 | 28 | % | |||||||||
Total commercial real estate | 2,318,899 | 1,907,661 | 411,238 | 22 | % | |||||||||
Commercial and industrial | 751,221 | 686,870 | 64,351 | 9 | % | |||||||||
Agriculture | 450,616 | 407,208 | 43,408 | 11 | % | |||||||||
1st lien | 877,335 | 877,893 | (558 | ) | — | % | ||||||||
Junior lien | 51,155 | 58,564 | (7,409 | ) | (13 | )% | ||||||||
Total 1-4 family | 928,490 | 936,457 | (7,967 | ) | (1 | )% | ||||||||
Multifamily residential | 189,342 | 184,068 | 5,274 | 3 | % | |||||||||
Home equity lines of credit | 440,105 | 402,614 | 37,491 | 9 | % | |||||||||
Other consumer | 148,247 | 155,193 | (6,946 | ) | (4 | )% | ||||||||
Total consumer | 588,352 | 557,807 | 30,545 | 5 | % | |||||||||
States and political subdivisions | 383,252 | 255,420 | 127,832 | 50 | % | |||||||||
Other | 144,133 | 126,252 | 17,881 | 14 | % | |||||||||
Total loans receivable, including loans held for sale | 6,616,657 | 5,757,390 | 859,267 | 15 | % | |||||||||
Less loans held for sale 1 | (38,833 | ) | (72,927 | ) | 34,094 | (47 | )% | |||||||
Total loans receivable | $ | 6,577,824 | $ | 5,684,463 | $ | 893,361 | 16 | % | ||||||
______________________________
1 Loans held for sale are primarily 1st lien 1-4 family loans.
48
The following table summarizes the Company’s non-performing assets by regulatory classification:
Non-performing Assets, by Loan Type | Non- Accruing Loans | Accruing Loans 90 Days or More Past Due | Other Real Estate Owned | ||||||||||||
(Dollars in thousands) | December 31, 2017 | December 31, 2016 | December 31, 2017 | December 31, 2017 | December 31, 2017 | ||||||||||
Custom and owner occupied construction | $ | 48 | — | — | — | 48 | |||||||||
Pre-sold and spec construction | 38 | 226 | 38 | — | — | ||||||||||
Total residential construction | 86 | 226 | 38 | — | 48 | ||||||||||
Land development | 7,888 | 9,864 | 806 | — | 7,082 | ||||||||||
Consumer land or lots | 1,861 | 2,137 | 1,065 | — | 796 | ||||||||||
Unimproved land | 10,866 | 11,905 | 8,760 | — | 2,106 | ||||||||||
Developed lots for operative builders | 116 | 175 | — | — | 116 | ||||||||||
Commercial lots | 1,312 | 1,466 | 260 | — | 1,052 | ||||||||||
Other construction | 151 | — | — | — | 151 | ||||||||||
Total land, lot and other construction | 22,194 | 25,547 | 10,891 | — | 11,303 | ||||||||||
Owner occupied | 13,848 | 18,749 | 11,778 | 698 | 1,372 | ||||||||||
Non-owner occupied | 4,584 | 3,426 | 3,711 | 312 | 561 | ||||||||||
Total commercial real estate | 18,432 | 22,175 | 15,489 | 1,010 | 1,933 | ||||||||||
Commercial and industrial | 5,294 | 5,184 | 4,700 | 533 | 61 | ||||||||||
Agriculture | 3,931 | 1,615 | 3,931 | — | — | ||||||||||
1st lien | 9,261 | 9,186 | 6,452 | 2,605 | 204 | ||||||||||
Junior lien | 567 | 1,167 | 518 | — | 49 | ||||||||||
Total 1-4 family | 9,828 | 10,353 | 6,970 | 2,605 | 253 | ||||||||||
Multifamily residential | — | 400 | — | — | — | ||||||||||
Home equity lines of credit | 3,292 | 5,494 | 2,652 | — | 640 | ||||||||||
Other consumer | 322 | 391 | 162 | 129 | 31 | ||||||||||
Total consumer | 3,614 | 5,885 | 2,814 | 129 | 671 | ||||||||||
States and political subdivisions | 1,800 | — | — | 1,800 | — | ||||||||||
Total | $ | 65,179 | 71,385 | 44,833 | 6,077 | 14,269 | |||||||||
49
The following table summarizes the Company’s accruing loans 30-89 days past due by regulatory classification:
Accruing 30-89 Days Delinquent Loans, by Loan Type | ||||||||||||||
(Dollars in thousands) | December 31, 2017 | December 31, 2016 | $ Change | % Change | ||||||||||
Custom and owner occupied construction | $ | 300 | $ | 1,836 | $ | (1,536 | ) | (84 | )% | |||||
Pre-sold and spec construction | 102 | — | 102 | n/m | ||||||||||
Total residential construction | 402 | 1,836 | (1,434 | ) | (78 | )% | ||||||||
Land development | — | 154 | (154 | ) | (100 | )% | ||||||||
Consumer land or lots | 353 | 638 | (285 | ) | (45 | )% | ||||||||
Unimproved land | 662 | 1,442 | (780 | ) | (54 | )% | ||||||||
Developed lots for operative builders | 7 | — | 7 | n/m | ||||||||||
Commercial lots | 108 | — | 108 | n/m | ||||||||||
Total land, lot and other construction | 1,130 | 2,234 | (1,104 | ) | (49 | )% | ||||||||
Owner occupied | 4,726 | 2,307 | 2,419 | 105 | % | |||||||||
Non-owner occupied | 2,399 | 1,689 | 710 | 42 | % | |||||||||
Total commercial real estate | 7,125 | 3,996 | 3,129 | 78 | % | |||||||||
Commercial and industrial | 6,472 | 3,032 | 3,440 | 113 | % | |||||||||
Agriculture | 3,205 | 1,133 | 2,072 | 183 | % | |||||||||
1st lien | 10,865 | 7,777 | 3,088 | 40 | % | |||||||||
Junior lien | 4,348 | 1,016 | 3,332 | 328 | % | |||||||||
Total 1-4 family | 15,213 | 8,793 | 6,420 | 73 | % | |||||||||
Multifamily residential | — | 10 | (10 | ) | (100 | )% | ||||||||
Home equity lines of credit | 1,962 | 1,537 | 425 | 28 | % | |||||||||
Other consumer | 2,109 | 1,180 | 929 | 79 | % | |||||||||
Total consumer | 4,071 | 2,717 | 1,354 | 50 | % | |||||||||
States and political subdivisions | — | 1,800 | (1,800 | ) | (100 | )% | ||||||||
Other | 69 | 66 | 3 | 5 | % | |||||||||
Total | $ | 37,687 | $ | 25,617 | $ | 12,070 | 47 | % | ||||||
______________________________
n/m - not measurable
50
The following table summarizes the Company’s charge-offs and recoveries by regulatory classification:
Net Charge-Offs (Recoveries), Years ended, By Loan Type | Charge-Offs | Recoveries | ||||||||||
(Dollars in thousands) | December 31, 2017 | December 31, 2016 | December 31, 2017 | December 31, 2017 | ||||||||
Custom and owner occupied construction | $ | — | (1 | ) | 62 | 62 | ||||||
Pre-sold and spec construction | (23 | ) | 786 | — | 23 | |||||||
Total residential construction | (23 | ) | 785 | 62 | 85 | |||||||
Land development | (143 | ) | (2,661 | ) | — | 143 | ||||||
Consumer land or lots | 222 | (688 | ) | 411 | 189 | |||||||
Unimproved land | (304 | ) | (184 | ) | — | 304 | ||||||
Developed lots for operative builders | (107 | ) | (27 | ) | — | 107 | ||||||
Commercial lots | (6 | ) | 27 | — | 6 | |||||||
Other construction | 389 | — | 389 | — | ||||||||
Total land, lot and other construction | 51 | (3,533 | ) | 800 | 749 | |||||||
Owner occupied | 3,908 | 1,196 | 4,556 | 648 | ||||||||
Non-owner occupied | 368 | 44 | 382 | 14 | ||||||||
Total commercial real estate | 4,276 | 1,240 | 4,938 | 662 | ||||||||
Commercial and industrial | 883 | (370 | ) | 1,597 | 714 | |||||||
Agriculture | 9 | 50 | 37 | 28 | ||||||||
1st lien | (23 | ) | 487 | 356 | 379 | |||||||
Junior lien | 719 | 60 | 815 | 96 | ||||||||
Total 1-4 family | 696 | 547 | 1,171 | 475 | ||||||||
Multifamily residential | (230 | ) | 229 | — | 230 | |||||||
Home equity lines of credit | 272 | 611 | 463 | 191 | ||||||||
Other consumer | 505 | 257 | 735 | 230 | ||||||||
Total consumer | 777 | 868 | 1,198 | 421 | ||||||||
Other | 4,389 | 2,642 | 9,528 | 5,139 | ||||||||
Total | $ | 10,828 | 2,458 | 19,331 | 8,503 | |||||||
51
Sources of Funds
The Company’s deposits have traditionally been the principal source of funds for use in lending and other business purposes. The Company also obtains funds from repayment of loans and investment securities, repurchase agreements, wholesale deposits, advances from FHLB and other borrowings. Loan repayments are a relatively stable source of funds, while interest bearing deposit inflows and outflows are significantly influenced by general interest rate levels and market conditions. Borrowings and advances may be used on a short-term basis to compensate for reductions in normal sources of funds such as deposit inflows at less than projected levels. Borrowings also may be used on a long-term basis to support expanded activities, match maturities of longer-term assets or manage interest rate risk.
Deposits
The Company has several deposit programs designed to attract both short-term and long-term deposits from the general public by providing a wide selection of accounts and rates. These programs include non-interest bearing deposit accounts and interest bearing deposit accounts such as NOW, DDA, savings, money market deposits, fixed rate certificates of deposit with maturities ranging from three months to five years, negotiated-rate jumbo certificates, and individual retirement accounts. These deposits are obtained primarily from individual and business residents in the Bank’s geographic market areas. Wholesale deposits are obtained through various programs and include brokered deposits classified as NOW, DDA, money market deposit and certificate accounts. The Company utilized a third party vendor to transfer $433 million of deposits off-balance sheet as of December 31, 2017. Such deposits can be brought back onto the Company’s balance sheet at the Company’s discretion. The Company’s deposits are summarized below:
December 31, 2017 | December 31, 2016 | December 31, 2015 | December 31, 2014 | December 31, 2013 | ||||||||||||||||||||||||||||||
(Dollars in thousands) | Amount | Percent | Amount | Percent | Amount | Percent | Amount | Percent | Amount | Percent | ||||||||||||||||||||||||
Non-interest bearing deposits | $ | 2,311,902 | 31 | % | $ | 2,041,852 | 28 | % | $ | 1,918,310 | 28 | % | $ | 1,632,403 | 26 | % | $ | 1,374,419 | 25 | % | ||||||||||||||
NOW and DDA accounts | 1,695,246 | 22 | % | 1,588,550 | 22 | % | 1,516,026 | 22 | % | 1,328,130 | 21 | % | 1,113,878 | 20 | % | |||||||||||||||||||
Savings accounts | 1,082,604 | 14 | % | 996,061 | 13 | % | 838,274 | 12 | % | 693,714 | 11 | % | 600,998 | 11 | % | |||||||||||||||||||
Money market deposit accounts | 1,512,693 | 20 | % | 1,464,415 | 20 | % | 1,382,028 | 20 | % | 1,274,525 | 20 | % | 1,168,918 | 21 | % | |||||||||||||||||||
Certificate accounts | 817,259 | 11 | % | 948,714 | 13 | % | 1,060,650 | 15 | % | 1,167,228 | 18 | % | 1,116,622 | 20 | % | |||||||||||||||||||
Wholesale deposits | 160,043 | 2 | % | 332,687 | 4 | % | 229,720 | 3 | % | 249,212 | 4 | % | 205,132 | 3 | % | |||||||||||||||||||
Total interest bearing deposits | 5,267,845 | 69 | % | 5,330,427 | 72 | % | 5,026,698 | 72 | % | 4,712,809 | 74 | % | 4,205,548 | 75 | % | |||||||||||||||||||
Total deposits | $ | 7,579,747 | 100 | % | $ | 7,372,279 | 100 | % | $ | 6,945,008 | 100 | % | $ | 6,345,212 | 100 | % | $ | 5,579,967 | 100 | % | ||||||||||||||
The following table summarizes the amounts outstanding at December 31, 2017 for deposits of $100,000 and greater, according to the time remaining to maturity. Included in demand deposits are brokered deposits of $160 million.
(Dollars in thousands) | Certificates of Deposit | Demand Deposits | Total | ||||||
Within three months | $ | 99,485 | 4,366,626 | 4,466,111 | |||||
Three months to six months | 94,986 | — | 94,986 | ||||||
Seven months to twelve months | 112,761 | — | 112,761 | ||||||
Over twelve months | 137,159 | — | 137,159 | ||||||
Total | $ | 444,391 | 4,366,626 | 4,811,017 | |||||
For additional information on deposits, see Note 7 to the Consolidated Financial Statements in “Item 8. Financial Statements and Supplementary Data.”
52
Securities Sold Under Agreements to Repurchase, Federal Home Loan Bank Advances and Other Borrowings
The Company borrows money through repurchase agreements. This process involves the selling of one or more of the securities in the Company’s investment portfolio and simultaneously entering into an agreement to repurchase the same securities at an agreed upon later date, typically overnight. A rate of interest is paid for the agreed period of time. Through a policy adopted by the Bank’s Board of Directors, the Bank enters into repurchase agreements with local municipalities, and certain customers, and has adopted procedures designed to ensure proper transfer of title and safekeeping of the underlying securities. In addition to retail repurchase agreements, the Company periodically enters into wholesale repurchase agreements as additional funding sources. The Company has not entered into reverse repurchase agreements.
The Bank is a member of the FHLB of Des Moines, which is one of eleven banks that comprise the FHLB system. The Bank is required to maintain a certain level of activity-based stock in order to borrow or to engage in other transactions with the FHLB of Des Moines. Additionally, the Bank is subject to a membership capital stock requirement that is based upon an annual calibration tied to the total assets of the Bank. The borrowings are collateralized by eligible categories of loans and investment securities (principally, securities which are obligations of, or guaranteed by, the U.S. government and its agencies), provided certain standards related to credit-worthiness have been met. Advances are made pursuant to several different credit programs, each of which has its own interest rates and range of maturities. The Bank’s maximum amount of FHLB advances is limited to the lesser of a fixed percentage of the Bank’s total assets or the discounted value of eligible collateral. FHLB advances fluctuate to meet seasonal and other withdrawals of deposits and to expand lending or investment opportunities of the Company. During the year ended December 31, 2017, the Company modified the majority of its long-term FHLB advances, including prepaying higher cost advances, to strategically manage its asset size.
Additionally, the Company has other sources of secured and unsecured borrowing lines from various sources that may be used from time to time.
For additional information concerning the Company’s borrowings, see Note 8 to the Consolidated Financial Statements in “Item 8. Financial Statements and Supplementary Data.”
Short-term borrowings
A critical component of the Company’s liquidity and capital resources is access to short-term borrowings to fund its operations. Short-term borrowings are accompanied by increased risks managed by the Bank’s Asset Liability Committee (“ALCO”) such as rate increases or unfavorable change in terms which would make it more costly to obtain future short-term borrowings. The Company’s short-term borrowing sources include FHLB advances, federal funds purchased and retail and wholesale repurchase agreements. The Company also has access to the short-term discount window borrowing programs (i.e., primary credit) of the Federal Reserve Bank (“FRB”). FHLB advances and certain other short-term borrowings may be renewed as long-term borrowings to decrease certain risks such as liquidity or interest rate risk; however, the reduction in risks are weighed against the increased cost of funds and other risks.
The following table provides information relating to significant short-term borrowings, which consists of borrowings that mature within one year of period end:
At or for the Years ended | |||||||||
(Dollars in thousands) | December 31, 2017 | December 31, 2016 | December 31, 2015 | ||||||
Repurchase agreements | |||||||||
Amount outstanding at end of period | $ | 362,573 | 473,650 | 423,414 | |||||
Weighted interest rate on outstanding amount | 0.53 | % | 0.34 | % | 0.31 | % | |||
Maximum outstanding at any month end | $ | 497,187 | 473,650 | 441,041 | |||||
Average balance | $ | 413,873 | 384,066 | 376,983 | |||||
Weighted-average interest rate | 0.45 | % | 0.31 | % | 0.27 | % | |||
53
Subordinated Debentures
In addition to funds obtained in the ordinary course of business, the Company formed or acquired financing subsidiaries for the purpose of issuing trust preferred securities that entitle the investor to receive cumulative cash distributions thereon. The subordinated debentures outstanding as of December 31, 2017 were $126 million, including fair value adjustments from prior acquisitions. For additional information regarding the subordinated debentures, see Note 9 to the Consolidated Financial Statements in “Item 8. Financial Statements and Supplementary Data.”
Contractual Obligations and Off-Balance Sheet Arrangements
In the normal course of business, there may be various outstanding commitments to obtain funding and to extend credit, such as letters of credit and un-advanced loan commitments, which are not reflected in the accompanying condensed consolidated financial statements. The Company does not anticipate any material losses as a result of these transactions.
Off-balance sheet arrangements also include any obligation related to a variable interest held in an unconsolidated entity. The Company does not anticipate any material losses as a result of these transactions. For additional information regarding the Company’s interests in unconsolidated VIEs, see Note 6 to the Consolidated Financial Statements in “Item 8. Financial Statements and Supplementary Data.”
The following table represents the Company’s contractual obligations as of December 31, 2017:
Payments Due by Period | ||||||||||||||||||||||||
(Dollars in thousands) | Total | Indeter-minate Maturity 1 | 2018 | 2019 | 2020 | 2021 | 2022 | Thereafter | ||||||||||||||||
Deposits | $ | 7,579,747 | 6,762,488 | 557,693 | 120,657 | 65,284 | 45,409 | 27,974 | 242 | |||||||||||||||
Repurchase agreements | 362,573 | — | 362,573 | — | — | — | — | — | ||||||||||||||||
FHLB advances | 353,995 | — | 200,869 | 887 | 1,651 | 148,721 | 945 | 922 | ||||||||||||||||
Other borrowed funds | 7,964 | — | — | — | — | — | — | 7,964 | ||||||||||||||||
Subordinated debentures | 126,135 | — | — | — | — | — | — | 126,135 | ||||||||||||||||
Capital lease obligations | 287 | — | 92 | 92 | 92 | 11 | — | — | ||||||||||||||||
Operating lease obligations | 15,261 | — | 2,633 | 2,502 | 2,039 | 1,593 | 953 | 5,541 | ||||||||||||||||
Total | $ | 8,445,962 | 6,762,488 | 1,123,860 | 124,138 | 69,066 | 195,734 | 29,872 | 140,804 | |||||||||||||||
______________________________
1 Represents non-interest bearing deposits and NOW, DDA, savings, and money market accounts.
54
Liquidity Risk
Liquidity risk is the possibility that the Company will not be able to fund present and future obligations as they come due because of an inability to liquidate assets or obtain adequate funding at a reasonable cost. The objective of liquidity management is to maintain cash flows adequate to meet current and future needs for credit demand, deposit withdrawals, maturing liabilities and corporate operating expenses. Effective liquidity management entails three elements:
1. | assessing on an ongoing basis, the current and expected future needs for funds, and ensuring that sufficient funds or access to funds exist to meet those needs at the appropriate time; |
2. | providing for an adequate cushion of liquidity to meet unanticipated cash flow needs that may arise from potential adverse circumstances ranging from high probability/low severity events to low probability/high severity; and |
3. | balancing the benefits between providing for adequate liquidity to mitigate potential adverse events and the cost of that liquidity. |
The Company has a wide range of versatility in managing the liquidity and asset/liability mix. The Bank’s ALCO meets regularly to assess liquidity risk, among other matters. The Company monitors liquidity and contingency funding alternatives through management reports of liquid assets (e.g., investment securities), both unencumbered and pledged, as well as borrowing capacity, both secured and unsecured, including off-balance sheet funding sources. The Company evaluates its potential funding needs across alternative scenarios and maintains contingency funding plans consistent with the Company’s access to diversified sources of contingent funding.
The following table identifies certain liquidity sources and capacity available to the Company as of the dates indicated:
(Dollars in thousands) | December 31, 2017 | December 31, 2016 | ||||
FHLB advances | ||||||
Borrowing capacity | $ | 1,807,787 | 1,558,527 | |||
Amount utilized | (360,185 | ) | (251,749 | ) | ||
Amount available | $ | 1,447,602 | 1,306,778 | |||
FRB discount window | ||||||
Borrowing capacity | $ | 1,054,103 | 1,226,683 | |||
Amount utilized | — | — | ||||
Amount available | $ | 1,054,103 | 1,226,683 | |||
Unsecured lines of credit available | $ | 230,000 | 255,000 | |||
Unencumbered investment securities | ||||||
U.S. government and federal agency | $ | 29,097 | 39,407 | |||
U.S. government sponsored enterprises | 3,358 | 12,086 | ||||
State and local governments | 769,786 | 814,942 | ||||
Corporate bonds | 5,982 | 19,573 | ||||
Residential mortgage-backed securities | 115,527 | 258,260 | ||||
Commercial mortgage-backed securities | 54,998 | 78,144 | ||||
Total unencumbered securities | $ | 978,748 | 1,222,412 | |||
55
Capital Resources
Maintaining capital strength continues to be a long-term objective of the Company. Abundant capital is necessary to sustain growth, provide protection against unanticipated declines in asset values, and to safeguard the funds of depositors. Capital is also a source of funds for loan demand and enables the Company to effectively manage its assets and liabilities. The Company has the capacity to issue 117,187,500 shares of common stock of which 78,006,956 have been issued as of December 31, 2017. The Company also has the capacity to issue 1,000,000 shares of preferred stock of which none have been issued as of December 31, 2017. Conversely, the Company may decide to utilize a portion of its strong capital position, as it has done in the past, to repurchase shares of its outstanding common stock, depending on market price and other relevant considerations.
The Federal Reserve has adopted capital adequacy guidelines that are used to assess the adequacy of capital in supervising a bank holding company. The federal banking agencies implemented the Final Rules to establish a new comprehensive regulatory capital framework with a phase-in period beginning on January 1, 2015 and ending on January 1, 2019. The Final Rules implemented certain regulatory amendments based on the recommendation of the Basel Committee on Banking Supervision and certain requirements of the Dodd-Frank Act and substantially amended the regulatory risk-based capital rules applicable to the Company. The Final Rules require the Company to hold a conservation buffer designed to absorb losses during periods of economic stress. The capital conservation buffer for 2017 is 1.25%. As of December 31, 2017, management believes the Company and Bank meet all capital adequacy requirements to which they are subject and there are no conditions or events subsequent to this date that management believes have changed the Company’s or Bank’s risk-based capital category.
The following table illustrates the Bank’s regulatory ratios and the Federal Reserve’s current capital adequacy guidelines as of December 31, 2017. The Federal Reserve’s fully phased-in guidelines applicable in 2019 are also summarized.
Total Capital (To Risk-Weighted Assets) | Tier 1 Capital (To Risk-Weighted Assets) | Common Equity Tier 1 (To Risk-Weighted Assets) | Leverage Ratio/ Tier 1 Capital (To Average Assets) | ||||||||
Glacier Bank regulatory ratios | 15.04 | % | 13.79 | % | 13.79 | % | 11.47 | % | |||
Minimum capital requirements | 8.00 | % | 6.00 | % | 4.50 | % | 4.00 | % | |||
Well capitalized requirements | 10.00 | % | 8.00 | % | 6.50 | % | 5.00 | % | |||
Minimum capital requirements, including fully-phased in capital conservation buffer (2019) | 10.50 | % | 8.50 | % | 7.00 | % | N/A | ||||
For additional information regarding regulatory capital, see Note 11 to the Consolidated Financial Statements in “Item 8. Financial Statements and Supplementary Data.”
56
Federal and State Income Taxes
The Company files a consolidated federal income tax return using the accrual method of accounting. All required tax returns have been timely filed. Financial institutions are subject to the provisions of the Internal Revenue Code of 1986, as amended, in the same general manner as other corporations.
Under Montana, Idaho, Utah, Colorado and Arizona law, financial institutions are subject to a corporation income tax, which incorporates or is substantially similar to applicable provisions of the Internal Revenue Code. The corporation income tax is imposed on federal taxable income, subject to certain adjustments. State taxes are incurred at the rate of 6.75 percent in Montana, 7.4 percent in Idaho, 5 percent in Utah, 4.63 percent in Colorado and 4.9 percent in Arizona. Washington and Wyoming do not impose a corporate income tax.
Income tax expense for the years ended December 31, 2017 and 2016 was $64.6 million and $39.7 million, respectively, with such increase resulting from the $19.7 million revaluation of the Company’s net deferred tax asset. Deferred tax assets and liabilities were measured using enacted tax rates expected to apply to the years in which the temporary differences are expected to be recognized. The effect on deferred tax assets and liabilities from the change in tax rates was recognized in net income during the current year, given that the enactment of the Tax Act occurred on December 22, 2017, causing a current year effective tax rate of 35.7 percent. The current year federal marginal rate was 35 percent and will decrease to 21 percent in 2018. Excluding the impact of the Tax Act, the effective federal and state income tax rate for the Company was 24.8 percent in 2017 and is expected to decrease to a range of 17 to 18 percent during 2018 as a result of the Tax Act. The current and prior year’s low effective tax rates, excluding the impact of the Tax Act, of 24.8 percent and 24.7 percent, respectively, are due to income from tax-exempt investment securities, municipal loans and leases and benefits from federal income tax credits. The income from tax-exempt investment securities, loans and leases was $56.0 million and $58.1 million for the years ended December 31, 2017 and 2016, respectively. The benefits from federal income tax credits were $5.6 million and $3.3 million for the years ended December 31, 2017 and 2016, respectively. For additional information on the revaluation of the net deferred tax asset and the effective tax rate, see the “Non-GAAP Financial Measures” section in “Item 6. Selected Financial Data.”
The Company has equity investments in Certified Development Entities (“CDE”) which have received allocations of New Markets Tax Credits (“NMTC”). Administered by the Community Development Financial Institutions Fund (“CDFI Fund”) of the U.S. Department of the Treasury, the NMTC program is aimed at stimulating economic and community development and job creation in low-income communities. The federal income tax credits received are claimed over a seven-year credit allowance period. The Company also has equity investments in Low-Income Housing Tax Credits (“LIHTC”) which are indirect federal subsidies used to finance the development of affordable rental housing for low-income households. The federal income tax credits are claimed over a ten-year credit allowance period. The Company has investments of $21.2 million in Qualified Zone Academy and Qualified School Construction bonds whereby the Company receives quarterly federal income tax credits in lieu of taxable interest income. The federal income tax credits on these investment securities are subject to federal and state income tax.
Following is a list of expected federal income tax credits to be received in the years indicated.
(Dollars in thousands) | New Markets Tax Credits | Low-Income Housing Tax Credits | Investment Securities Tax Credits | Total | ||||||||
2018 | $ | 2,874 | 4,808 | 908 | 8,590 | |||||||
2019 | 2,974 | 5,070 | 850 | 8,894 | ||||||||
2020 | 3,296 | 4,855 | 791 | 8,942 | ||||||||
2021 | 3,296 | 4,038 | 737 | 8,071 | ||||||||
2022 | 2,528 | 4,010 | 673 | 7,211 | ||||||||
Thereafter | 1,930 | 18,618 | 2,149 | 22,697 | ||||||||
$ | 16,898 | 41,399 | 6,108 | 64,405 | ||||||||
For additional information on income taxes, see Note 15 to the Consolidated Financial Statements in “Item 8. Financial Statements and Supplementary Data”.
Average Balance Sheet
The following schedule provides 1) the total dollar amount of interest and dividend income of the Company for earning assets and the average yields; 2) the total dollar amount of interest expense on interest bearing liabilities and the average rates; 3) net interest and dividend income and interest rate spread; and 4) net interest margin (tax-equivalent).
57
Years ended | ||||||||||||||||||||||||||||||||
December 31, 2017 | December 31, 2016 | December 31, 2015 | ||||||||||||||||||||||||||||||
(Dollars in thousands) | Average Balance | Interest & Dividends | Average Yield/ Rate | Average Balance | Interest & Dividends | Average Yield/ Rate | Average Balance | Interest & Dividends | Average Yield/ Rate | |||||||||||||||||||||||
Assets | ||||||||||||||||||||||||||||||||
Residential real estate loans | $ | 744,523 | $ | 33,114 | 4.45 | % | $ | 741,876 | $ | 33,410 | 4.50 | % | $ | 687,013 | $ | 32,153 | 4.68 | % | ||||||||||||||
Commercial loans 1 | 4,792,720 | 233,744 | 4.88 | % | 3,993,363 | 193,147 | 4.84 | % | 3,459,470 | 167,587 | 4.84 | % | ||||||||||||||||||||
Consumer and other loans | 684,129 | 32,584 | 4.76 | % | 668,990 | 31,402 | 4.69 | % | 631,512 | 31,476 | 4.98 | % | ||||||||||||||||||||
Total loans 2 | 6,221,372 | 299,442 | 4.81 | % | 5,404,229 | 257,959 | 4.77 | % | 4,777,995 | 231,216 | 4.84 | % | ||||||||||||||||||||
Tax-exempt investment securities 3 | 1,160,182 | 66,077 | 5.70 | % | 1,325,810 | 75,907 | 5.73 | % | 1,328,908 | 77,199 | 5.81 | % | ||||||||||||||||||||
Taxable investment securities 4 | 1,722,264 | 39,727 | 2.31 | % | 1,874,240 | 41,775 | 2.23 | % | 1,918,283 | 41,648 | 2.17 | % | ||||||||||||||||||||
Total earning assets | 9,103,818 | 405,246 | 4.45 | % | 8,604,279 | 375,641 | 4.37 | % | 8,025,186 | 350,063 | 4.36 | % | ||||||||||||||||||||
Goodwill and intangibles | 180,014 | 155,981 | 143,293 | |||||||||||||||||||||||||||||
Non-earning assets | 394,363 | 392,353 | 389,126 | |||||||||||||||||||||||||||||
Total assets | $ | 9,678,195 | $ | 9,152,613 | $ | 8,557,605 | ||||||||||||||||||||||||||
Liabilities | ||||||||||||||||||||||||||||||||
Non-interest bearing deposits | $ | 2,175,750 | $ | — | — | % | $ | 1,934,543 | $ | — | — | % | $ | 1,756,888 | $ | — | — | % | ||||||||||||||
NOW and DDA accounts | 1,656,865 | 1,402 | 0.08 | % | 1,498,928 | 1,062 | 0.07 | % | 1,371,340 | 1,074 | 0.08 | % | ||||||||||||||||||||
Savings accounts | 1,055,688 | 624 | 0.06 | % | 920,058 | 464 | 0.05 | % | 758,776 | 360 | 0.05 | % | ||||||||||||||||||||
Money market deposit accounts | 1,547,659 | 2,407 | 0.16 | % | 1,420,700 | 2,183 | 0.15 | % | 1,340,967 | 2,066 | 0.15 | % | ||||||||||||||||||||
Certificate accounts | 888,887 | 5,114 | 0.58 | % | 1,013,046 | 5,998 | 0.59 | % | 1,131,210 | 6,891 | 0.61 | % | ||||||||||||||||||||
Wholesale deposits 5 | 275,804 | 7,246 | 2.63 | % | 335,616 | 8,695 | 2.59 | % | 206,889 | 5,747 | 2.78 | % | ||||||||||||||||||||
FHLB advances | 258,528 | 6,748 | 2.57 | % | 294,952 | 6,221 | 2.07 | % | 319,565 | 8,841 | 2.73 | % | ||||||||||||||||||||
Repurchase agreements and other borrowed funds | 547,307 | 6,323 | 1.16 | % | 515,254 | 5,008 | 0.97 | % | 509,431 | 4,296 | 0.84 | % | ||||||||||||||||||||
Total interest bearing liabilities | 8,406,488 | 29,864 | 0.36 | % | 7,933,097 | 29,631 | 0.37 | % | 7,395,066 | 29,275 | 0.40 | % | ||||||||||||||||||||
Other liabilities | 83,991 | 96,392 | 91,360 | |||||||||||||||||||||||||||||
Total liabilities | 8,490,479 | 8,029,489 | 7,486,426 | |||||||||||||||||||||||||||||
Stockholders’ Equity | ||||||||||||||||||||||||||||||||
Common stock | 775 | 763 | 755 | |||||||||||||||||||||||||||||
Paid-in capital | 781,267 | 740,792 | 720,827 | |||||||||||||||||||||||||||||
Retained earnings | 406,200 | 371,925 | 336,998 | |||||||||||||||||||||||||||||
Accumulated other comprehensive income | (526 | ) | 9,644 | 12,599 | ||||||||||||||||||||||||||||
Total stockholders’ equity | 1,187,716 | 1,123,124 | 1,071,179 | |||||||||||||||||||||||||||||
Total liabilities and stockholders’ equity | $ | 9,678,195 | $ | 9,152,613 | $ | 8,557,605 | ||||||||||||||||||||||||||
Net interest income (tax-equivalent) | $ | 375,382 | $ | 346,010 | $ | 320,788 | ||||||||||||||||||||||||||
Net interest spread (tax-equivalent) | 4.09 | % | 4.00 | % | 3.96 | % | ||||||||||||||||||||||||||
Net interest margin (tax-equivalent) | 4.12 | % | 4.02 | % | 4.00 | % | ||||||||||||||||||||||||||
______________________________
1 | Includes tax effect of $6.4 million, $4.2 million and $2.6 million on tax-exempt municipal loan and lease income for the years ended December 31, 2017, 2016 and 2015, respectively. |
2 | Total loans are gross of the allowance for loan and lease losses, net of unearned income and include loans held for sale. Non-accrual loans were included in the average volume for the entire period. |
3 | Includes tax effect of $22.5 million, $25.9 million and $26.3 million on tax-exempt investment securities income for the years ended December 31, 2017, 2016 and 2015, respectively. |
4 | Includes tax effect of $1.3 million, $1.4 million and $1.4 million on federal income tax credits for the years ended December 31, 2017, 2016 and 2015, respectively. |
5 | Wholesale deposits include brokered deposits classified as NOW, DDA, money market deposit and certificate accounts. |
58
Rate/Volume Analysis
Net interest income can be evaluated from the perspective of relative dollars of change in each period. Interest income and interest expense, which are the components of net interest income, are shown in the following table on the basis of the amount of any increases (or decreases) attributable to changes in the dollar levels of the Company’s interest earning assets and interest bearing liabilities (“volume”) and the yields earned and paid on such assets and liabilities (“rate”). The change in interest income and interest expense attributable to changes in both volume and rates has been allocated proportionately to the change due to volume and the change due to rate.
Year ended December 31, | Year ended December 31, | |||||||||||||||||
2017 vs. 2016 | 2016 vs. 2015 | |||||||||||||||||
Increase (Decrease) Due to: | Increase (Decrease) Due to: | |||||||||||||||||
(Dollars in thousands) | Volume | Rate | Net | Volume | Rate | Net | ||||||||||||
Interest income | ||||||||||||||||||
Residential real estate loans | $ | 119 | (415 | ) | (296 | ) | 2,568 | (1,311 | ) | 1,257 | ||||||||
Commercial loans (tax-equivalent) | 38,029 | 2,568 | 40,597 | 26,393 | (833 | ) | 25,560 | |||||||||||
Consumer and other loans | 623 | 559 | 1,182 | 1,960 | (2,034 | ) | (74 | ) | ||||||||||
Investment securities (tax-equivalent) | (11,680 | ) | (198 | ) | (11,878 | ) | (1,725 | ) | 560 | (1,165 | ) | |||||||
Total interest income | 27,091 | 2,514 | 29,605 | 29,196 | (3,618 | ) | 25,578 | |||||||||||
Interest expense | ||||||||||||||||||
NOW and DDA accounts | 109 | 231 | 340 | 103 | (115 | ) | (12 | ) | ||||||||||
Savings accounts | 67 | 93 | 160 | 78 | 26 | 104 | ||||||||||||
Money market deposit accounts | 189 | 35 | 224 | 129 | (12 | ) | 117 | |||||||||||
Certificate accounts | (750 | ) | (134 | ) | (884 | ) | (703 | ) | (190 | ) | (893 | ) | ||||||
Wholesale deposits | (1,569 | ) | 120 | (1,449 | ) | 3,602 | (654 | ) | 2,948 | |||||||||
FHLB advances | (783 | ) | 1,310 | 527 | (658 | ) | (1,962 | ) | (2,620 | ) | ||||||||
Repurchase agreements and other borrowed funds | 297 | 1,018 | 1,315 | 61 | 651 | 712 | ||||||||||||
Total interest expense | (2,440 | ) | 2,673 | 233 | 2,612 | (2,256 | ) | 356 | ||||||||||
Net interest income (tax-equivalent) | $ | 29,531 | (159 | ) | 29,372 | 26,584 | (1,362 | ) | 25,222 | |||||||||
Net interest income (tax-equivalent) increased $29.4 million for the year ended December 31, 2017 compared to the same period in 2016. The interest income for 2017 increased over the same period last year primarily from continued increased growth of the Company’s commercial loan portfolio along with increased yields on such loans. The decrease in interest income on the investment securities portfolio was the result of continuing to redeploy cash flow from investment securities into the loan portfolio. Total interest expense remained stable compared to the prior year with volatility in certain categories including wholesale deposits, FHLB advances and other borrowed funds. The decrease in wholesale deposits resulted from the Company taking the opportunity to pay off some of those higher cost funding sources. The increase in rates on FHLB advances resulted from the Company changing a portion of its LIBOR-based borrowings from wholesale deposits to FHLB advances for its cash flow hedge. The increase in rates on other borrowed funds resulted from the increased rates on the Company’s variable rate subordinated debentures.
Net interest income (tax-equivalent) increased $25.2 million during 2016 compared to 2015. The increase in interest income primarily resulted from increased growth of the Company’s commercial loan portfolio. Total interest expense for 2016 remained relatively flat compared to the prior year, although, there was an increase in expenses related to wholesale deposits which was offset by a decrease in expense from FHLB advances. The increase in the amount of wholesale deposits and related expense was driven by a delayed start interest rate swap (i.e., 3.5 years) with a notional amount of $100 million that started interest accruals in November 2015. The Company utilized wholesale deposits as the cash flow hedge which resulted in an increase amount of wholesale deposits and associated interest expense. The decrease in rates on FHLB advances was driven by long-term advances maturing and being replaced by short-term lower cost FHLB advances.
59
Effect of inflation and changing prices
GAAP often requires the measurement of financial position and operating results in terms of historical dollars, without consideration for change in relative purchasing power over time due to inflation. Virtually all assets of the Company are monetary in nature; therefore, interest rates generally have a more significant impact on a company’s performance than does the effect of inflation.
Critical Accounting Policies
The preparation of consolidated financial statements in conformity with GAAP often requires management to use significant judgments as well as subjective and/or complex measurements in making estimates and assumptions that affect the reported amounts of assets, liabilities, income and expenses. The Company considers its accounting policies for the ALLL, goodwill and fair value measurements to be critical accounting policies. The application of these policies has a significant impact on the Company’s consolidated financial statements and financial results could differ significantly if different judgments or estimates were to be applied.
Allowance for Loan and Lease Losses
For information regarding the ALLL, its relation to the provision for loan losses and risk related to asset quality, see the section captioned “Allowance for Loan and Lease Losses” included in “Item 7. Management’s Discussion and Analysis of Financial Condition and Results of Operations” and Notes 1 and 3 to the Consolidated Financial Statements in “Item 8. Financial Statements and Supplementary Data.”
Goodwill
For information on goodwill, see Notes 1 and 5 to the Consolidated Financial Statements in “Item 8. Financial Statements and Supplementary Data.”
Fair Value Measurements
For information on fair value measurements, see Note 20 to the Consolidated Financial Statements in “Item 8. Financial Statements and Supplementary Data.”
Impact of Recently Issued Accounting Standards
Authoritative accounting guidance that may have had a material impact on the Company that became effective during 2017 or 2016 includes amendments to:
• | Financial Accounting Standards Board (“FASB”) Accounting Standards CodificationTM (“ASC”) Topic 220, Income Statement - Reporting Comprehensive Income; |
• | FASB ASC Topic 718, Compensation - Stock Compensation; |
• | FASB ASC Topic 250, Accounting Changes and Error Corrections; |
• | FASB ASC Topic 805, Business Combinations; and |
• | FASB ASC Topic 810, Consolidation |
• | SEC Staff Accounting Bulletin (“SAB”) Topic 11.M, Disclosure of the Impact that Recently Issued Accounting Standards Will Have on the Financial Statements of the Registrant when Adopted in a Future Period |
Authoritative accounting guidance that may possibly have a material impact on the Company that is pending adoption at December 31, 2017 includes amendments to:
• | FASB ASC Topic 815, Derivatives and Hedging; |
• | FASB ASC Subtopic 310-20, Receivables - Nonrefundable Fees and Other Costs; |
• | FASB ASC Topic 350, Simplifying the Test for Goodwill; |
• | FASB ASC Topic 326, Financial Instruments - Credit Losses; |
• | FASB ASC Topic 842, Leases; |
• | FASB ASC Topic 825, Financial Instruments; and |
• | FASB ASC Topic 606, Revenue from Contracts with Customers |
For additional information on the topics and the impact on the Company see Note 1 to the Consolidated Financial Statements in “Item 8. Financial Statements and Supplementary Data.”
60
Item 7A. Quantitative and Qualitative Disclosures about Market Risk
The disclosures set forth in this item are qualified by the section captioned “Forward-Looking Statements” included in “Item 7. Management’s Discussion and Analysis of Financial Condition and Results of Operations.” Market risk is the risk of loss in a financial instrument arising from adverse changes in market rates/prices such as interest rates, foreign currency exchange rates, commodity prices, and equity prices. The Company’s primary market risk exposure is interest rate risk.
Interest Rate Risk
Interest rate risk is the potential for loss of future earnings resulting from adverse changes in the level of interest rates. Interest rate risk results from many factors and could have a significant impact on the Company’s net interest income, which is the Company’s primary source of net income. Net interest income is affected by changes in interest rates, the relationship between rates on interest bearing assets and liabilities, the impact of the interest fluctuations on asset prepayments and the mix of interest bearing assets and liabilities.
Although interest rate risk is inherent in the banking industry, banks are expected to have sound risk management practices in place to measure, monitor and control interest rate exposures. The objective of interest rate risk management is to contain the risks associated with interest rate fluctuations. The process involves identification and management of the sensitivity of net interest income to changing interest rates.
The ongoing monitoring and management of this risk is an important component of the Company’s asset/liability management process which is governed by policies established by the Company’s Board that are reviewed and approved annually. The Board delegates responsibility for carrying out the asset/liability management policies to the Bank’s ALCO. In this capacity, the ALCO develops guidelines and strategies impacting the Company’s asset/liability management related activities based upon estimated market risk sensitivity, policy limits and overall market interest rate levels and trends. The Company’s goal of its asset and liability management practices is to maintain or increase the level of net interest income within an acceptable level of interest rate risk.
In addition to the risk management practices previously described, the Company has entered into forecasted interest rate swap derivative financial instruments to hedge various interest rate exposures. For more information on the Company’s interest rate swaps, see Note 10 to the Consolidated Financial Statements in “Item 8. Financial Statements and Supplementary Data.”
Net interest income simulation
The Company uses a detailed and dynamic simulation model to quantify the estimated exposure of net interest income (“NII”) to sustained interest rate changes. While ALCO routinely monitors simulated NII sensitivity over rolling two-year and five-year horizons, it also utilizes additional tools to monitor potential longer-term interest rate risk (e.g., economic value of equity). The simulation model captures the impact of changing interest rates on the interest income received and interest expense paid on all assets and liabilities reflected on the Company’s statements of financial condition. This sensitivity analysis is compared to ALCO policy limits which specify a maximum tolerance level for NII exposure over a one year and two year horizon, assuming no balance sheet growth. The ALCO policy rate scenarios include upward and downward shifts in interest rates for 100 bps, 200 bps, 300 bps, and 400 bps scenarios with instantaneous and parallel changes in current market yield curves. The ALCO policy also includes 200 bps and 400 bps rate scenarios with gradual parallel shifts in interest rates over 12-month and 24-month periods, respectively. Given the historically low rate environment, a downward shift in interest rates of only 100 bps is modeled. Other non-parallel rate movement scenarios are also modeled to determine the potential impact on net interest income. The additional scenarios are adjusted as the economic environment changes and provide ALCO additional interest rate risk monitoring tools to evaluate current market conditions.
61
The following is indicative of the Company’s overall NII sensitivity analysis as of December 31, 2017 as compared to the ALCO policy limits approved by the Company’s Board. The Company’s interest sensitivity remained within policy limits at December 31, 2017.
One Year | Two Years | |||||||||||
Rate Scenarios | Policy Limits | Estimated Sensitivity | Policy Limits | Estimated Sensitivity | ||||||||
-100 bps Rate shock | (10.0 | )% | (3.9 | )% | (15.0 | )% | (6.2 | )% | ||||
+100 bps Rate shock | (10.0 | )% | (0.3 | )% | (15.0 | )% | 2.2 | % | ||||
+200 bps Rate shock | (10.0 | )% | 0.1 | % | (15.0 | )% | 4.5 | % | ||||
+200 bps Rate ramp | (10.0 | )% | (0.3 | )% | (15.0 | )% | 2.3 | % | ||||
+300 bps Rate shock | (20.0 | )% | 0.6 | % | (20.0 | )% | 7.0 | % | ||||
+400 bps Rate shock | (20.0 | )% | (0.1 | )% | (20.0 | )% | 8.4 | % | ||||
+400 bps Rate ramp | (10.0 | )% | 1.1 | % | (20.0 | )% | 2.5 | % | ||||
The preceding sensitivity analysis does not represent a forecast and should not be relied upon as being indicative of expected operating results. These hypothetical estimates are based upon numerous assumptions including: the nature and timing of interest rate levels including, but not limited to, yield curve shape, prepayments on loans and securities, deposit decay rates, pricing decisions on loans and deposits and reinvestment/replacement of asset and liability cash flows. While assumptions are developed based upon current economic and local market conditions, the Company cannot make any assurances as to the predictive nature of these assumptions including how customer preferences or competitor influences might change. Also, as market conditions vary from those assumed in the sensitivity analysis, actual results will also differ due to prepayment/refinancing levels likely deviating from those assumed, the varying impact of interest rate caps or floors on adjustable rate assets, the potential effect of changing debt service levels on customers with adjustable rate loans, depositor early withdrawals and product preference changes, and other internal and external variables. Furthermore, the sensitivity analysis does not reflect actions that ALCO might take in responding to or anticipating changes in interest rates.
Economic value of equity
In addition to the NII analyses, the Company calculates the economic value of equity (“EVE”) which focuses on longer term interest rate risk. The EVE process models the cash flow of financial instruments to maturity and then discounts those cashflows based on prevailing interest rates in order to develop a baseline EVE. The interest rates used in the model are then shocked for an immediate increase and decrease in interest rates. The results for the shocked model are compared to the baseline results to determine the percentage change in EVE under the various scenarios. The resulting percentage change in the EVE is an indication of the longer term re-pricing risk and option risks embedded in the balance sheet. The measure is not designed to estimate the Company’s capital levels, such as tangible, regulatory, or market capitalization.
The following reflects the Company’s EVE maximum sensitivity policy limits and EVE analysis as of December 31, 2017:
Rate Scenarios | Policy Limits | Post Shock Ratio | ||||
-100 bps Rate shock | (10.0 | )% | (5.1 | )% | ||
+100 bps Rate shock | (10.0 | )% | (0.9 | )% | ||
+200 bps Rate shock | (20.0 | )% | (3.6 | )% | ||
+300 bps Rate shock | (30.0 | )% | (6.2 | )% | ||
+400 bps Rate shock | (40.0 | )% | (9.2 | )% | ||
Item 8. Financial Statements and Supplementary Data
62
Report of Independent Registered Public Accounting Firm
To the Stockholders, Board of Directors and Audit Committee
Glacier Bancorp, Inc.
Kalispell, Montana
Opinion on the Financial Statements
We have audited the accompanying consolidated statements of financial condition of Glacier Bancorp, Inc. (the Company) as of December 31, 2017 and 2016, and the related consolidated statements of operations, comprehensive income, changes in stockholders’ equity and cash flows for each of the years in the three-year period ended December 31, 2017, and the related notes (collectively referred to as the “financial statements”). In our opinion, the consolidated financial statements referred to above present fairly, in all material respects, the financial position of the Company as of December 31, 2017 and 2016, and the results of its operations and its cash flows for each of the years in the three-year period ended December 31, 2017, in conformity with accounting principles generally accepted in the United States of America.
We also have audited, in accordance with the standards of the Public Company Accounting Oversight Board (United States) (“PCAOB”), the Company’s internal control over financial reporting as of December 31, 2017, based on criteria established in Internal Control-Integrated Framework: (2013) issued by the Committee of Sponsoring Organizations of the Treadway Commission (COSO) and our report dated February 22, 2018, expressed an unqualified opinion on the effectiveness of the Company’s internal control over financial reporting.
Basis for Opinion
These financial statements are the responsibility of the Company's management. Our responsibility is to express an opinion on the Company's financial statements based on our audits.
We are a public accounting firm registered with the PCAOB and are required to be independent with respect to the Company in accordance with the U.S. federal securities laws and the applicable rules and regulations of the Securities and Exchange Commission and the PCAOB.
We conducted our audits in accordance with the standards of the PCAOB. Those standards require that we plan and perform the audits to obtain reasonable assurance about whether the financial statements are free of material misstatement, whether due to error or fraud. Our audits included performing procedures to assess the risks of material misstatement of the financial statements, whether due to error or fraud, and performing procedures that respond to those risks. Such procedures include examining, on a test basis, evidence regarding the amounts and disclosures in the financial statements. Our audits also included evaluating the accounting principles used and significant estimates made by management, as well as evaluating the overall presentation of the financial statements. We believe that our audits provide a reasonable basis for our opinion.
/s/ BKD, LLP
We have served as the Company’s auditor since 2005.
Denver, Colorado
February 22, 2018
63
Report of Independent Registered Public Accounting Firm
To the Stockholders, Board of Directors and Audit Committee
Glacier Bancorp, Inc.
Kalispell, Montana
Opinion on the Internal Control over Financial Reporting
We have audited Glacier Bancorp, Inc.’s (the “Company”) internal control over financial reporting as of December 31, 2017, based on criteria established in Internal Control - Integrated Framework: (2013) issued by the Committee of Sponsoring Organizations of the Treadway Commission (COSO).
In our opinion, the Company maintained, in all material respects, effective internal control over financial reporting as of December 31, 2017, based on criteria established in Internal Control - Integrated Framework: (2013) issued by COSO.
We have also audited, in accordance with the standards of the Public Company Accounting Oversight Board (United States) (“PCAOB”), the consolidated financial statements of Glacier Bancorp, Inc. and our report dated February 22, 2018, expressed an unqualified opinion thereon.
Basis for Opinion
The Company’s management is responsible for maintaining effective internal control over financial reporting and for its assessment of the effectiveness of internal control over financial reporting, included in the accompanying Management’s Report on Internal Control over Financial Reporting. Our responsibility is to express an opinion on the Company’s internal control over financial reporting based on our audit.
We are a public accounting firm registered with the PCAOB and are required to be independent with respect to the Company in accordance with the U.S. federal securities laws and the applicable rules and regulations of the Securities and Exchange Commission and the PCAOB.
We conducted our audit in accordance with the standards of the PCAOB. Those standards require that we plan and perform the audit to obtain reasonable assurance about whether effective internal control over financial reporting was maintained in all material respects.
Our audit included obtaining an understanding of internal control over financial reporting, assessing the risk that a material weakness exists and testing and evaluating the design and operating effectiveness of internal control based on the assessed risk. Our audit also included performing such other procedures as we considered necessary in the circumstances. We believe that our audit provides a reasonable basis for our opinion.
64
Definitions and Limitations of Internal Control over Financial Reporting
A company's internal control over financial reporting is a process designed to provide reasonable assurance regarding the reliability of financial reporting and the preparation of financial statements for external purposes in accordance with generally accepted accounting principles. A company's internal control over financial reporting includes those policies and procedures that (1) pertain to the maintenance of records that, in reasonable detail, accurately and fairly reflect the transactions and dispositions of the assets of the company; (2) provide reasonable assurance that transactions are recorded as necessary to permit preparation of financial statements in accordance with generally accepted accounting principles, and that receipts and expenditures of the company are being made only in accordance with authorizations of management and directors of the company; and (3) provide reasonable assurance regarding prevention or timely detection of unauthorized acquisition, use or disposition of the company's assets that could have a material effect on the financial statements.
Because of its inherent limitations, internal control over financial reporting may not prevent or detect misstatements. Also, projections of any evaluation of effectiveness to future periods are subject to the risk that controls may become inadequate because of changes in conditions or that the degree of compliance with the policies or procedures may deteriorate.
/s/ BKD, LLP
Denver, Colorado
February 22, 2018
65
GLACIER BANCORP, INC.
CONSOLIDATED STATEMENTS OF FINANCIAL CONDITION
(Dollars in thousands, except per share data) | December 31, 2017 | December 31, 2016 | ||||
Assets | ||||||
Cash on hand and in banks | $ | 139,948 | 135,268 | |||
Interest bearing cash deposits | 60,056 | 17,273 | ||||
Cash and cash equivalents | 200,004 | 152,541 | ||||
Investment securities, available-for-sale | 1,778,243 | 2,425,477 | ||||
Investment securities, held-to-maturity | 648,313 | 675,674 | ||||
Total investment securities | 2,426,556 | 3,101,151 | ||||
Loans held for sale | 38,833 | 72,927 | ||||
Loans receivable | 6,577,824 | 5,684,463 | ||||
Allowance for loan and lease losses | (129,568 | ) | (129,572 | ) | ||
Loans receivable, net | 6,448,256 | 5,554,891 | ||||
Premises and equipment, net | 177,348 | 176,198 | ||||
Other real estate owned | 14,269 | 20,954 | ||||
Accrued interest receivable | 44,462 | 45,832 | ||||
Deferred tax asset | 38,344 | 67,121 | ||||
Core deposit intangible, net | 14,184 | 12,347 | ||||
Goodwill | 177,811 | 147,053 | ||||
Non-marketable equity securities | 29,884 | 25,550 | ||||
Other assets | 96,398 | 74,035 | ||||
Total assets | $ | 9,706,349 | 9,450,600 | |||
Liabilities | ||||||
Non-interest bearing deposits | $ | 2,311,902 | 2,041,852 | |||
Interest bearing deposits | 5,267,845 | 5,330,427 | ||||
Securities sold under agreements to repurchase | 362,573 | 473,650 | ||||
Federal Home Loan Bank advances | 353,995 | 251,749 | ||||
Other borrowed funds | 8,224 | 4,440 | ||||
Subordinated debentures | 126,135 | 125,991 | ||||
Accrued interest payable | 3,450 | 3,584 | ||||
Other liabilities | 73,168 | 102,038 | ||||
Total liabilities | 8,507,292 | 8,333,731 | ||||
Stockholders’ Equity | ||||||
Preferred shares, $0.01 par value per share, 1,000,000 shares authorized, none issued or outstanding | — | — | ||||
Common stock, $0.01 par value per share, 117,187,500 shares authorized | 780 | 765 | ||||
Paid-in capital | 797,997 | 749,107 | ||||
Retained earnings - substantially restricted | 402,259 | 374,379 | ||||
Accumulated other comprehensive loss | (1,979 | ) | (7,382 | ) | ||
Total stockholders’ equity | 1,199,057 | 1,116,869 | ||||
Total liabilities and stockholders’ equity | $ | 9,706,349 | 9,450,600 | |||
Number of common stock shares issued and outstanding | 78,006,956 | 76,525,402 | ||||
See accompanying notes to consolidated financial statements.
66
GLACIER BANCORP, INC.
CONSOLIDATED STATEMENTS OF OPERATIONS
Years ended | |||||||||
(Dollars in thousands, except per share data) | December 31, 2017 | December 31, 2016 | December 31, 2015 | ||||||
Interest Income | |||||||||
Investment securities | $ | 81,968 | 90,392 | 91,086 | |||||
Residential real estate loans | 33,114 | 33,410 | 32,153 | ||||||
Commercial loans | 227,356 | 188,949 | 164,966 | ||||||
Consumer and other loans | 32,584 | 31,402 | 31,476 | ||||||
Total interest income | 375,022 | 344,153 | 319,681 | ||||||
Interest Expense | |||||||||
Deposits | 16,793 | 18,402 | 16,138 | ||||||
Securities sold under agreements to repurchase | 1,858 | 1,207 | 1,021 | ||||||
Federal Home Loan Bank advances | 6,748 | 6,221 | 8,841 | ||||||
Other borrowed funds | 79 | 67 | 81 | ||||||
Subordinated debentures | 4,386 | 3,734 | 3,194 | ||||||
Total interest expense | 29,864 | 29,631 | 29,275 | ||||||
Net Interest Income | 345,158 | 314,522 | 290,406 | ||||||
Provision for loan losses | 10,824 | 2,333 | 2,284 | ||||||
Net interest income after provision for loan losses | 334,334 | 312,189 | 288,122 | ||||||
Non-Interest Income | |||||||||
Service charges and other fees | 67,717 | 62,405 | 59,286 | ||||||
Miscellaneous loan fees and charges | 4,360 | 4,613 | 4,276 | ||||||
Gain on sale of loans | 30,439 | 33,606 | 26,389 | ||||||
(Loss) gain on sale of investments | (660 | ) | (1,463 | ) | 19 | ||||
Other income | 10,383 | 8,157 | 8,791 | ||||||
Total non-interest income | 112,239 | 107,318 | 98,761 | ||||||
Non-Interest Expense | |||||||||
Compensation and employee benefits | 160,506 | 151,697 | 134,382 | ||||||
Occupancy and equipment | 26,631 | 25,979 | 25,483 | ||||||
Advertising and promotions | 8,405 | 8,433 | 8,661 | ||||||
Data processing | 14,150 | 14,390 | 11,244 | ||||||
Other real estate owned | 1,909 | 2,895 | 3,693 | ||||||
Regulatory assessments and insurance | 4,431 | 4,780 | 5,283 | ||||||
Core deposit intangible amortization | 2,494 | 2,970 | 2,964 | ||||||
Other expenses | 47,045 | 47,570 | 45,047 | ||||||
Total non-interest expense | 265,571 | 258,714 | 236,757 | ||||||
Income Before Income Taxes | 181,002 | 160,793 | 150,126 | ||||||
Federal and state income tax expense | 64,625 | 39,662 | 33,999 | ||||||
Net Income | $ | 116,377 | 121,131 | 116,127 | |||||
Basic earnings per share | $ | 1.50 | 1.59 | 1.54 | |||||
Diluted earnings per share | $ | 1.50 | 1.59 | 1.54 | |||||
Dividends declared per share | $ | 1.14 | 1.10 | 1.05 | |||||
Average outstanding shares - basic | 77,537,664 | 76,278,463 | 75,542,455 | ||||||
Average outstanding shares - diluted | 77,607,605 | 76,341,836 | 75,595,581 | ||||||
See accompanying notes to consolidated financial statements.
67
GLACIER BANCORP, INC.
CONSOLIDATED STATEMENTS OF COMPREHENSIVE INCOME
Years ended | |||||||||
(Dollars in thousands) | December 31, 2017 | December 31, 2016 | December 31, 2015 | ||||||
Net Income | $ | 116,377 | 121,131 | 116,127 | |||||
Other Comprehensive Income (Loss), Net of Tax | |||||||||
Unrealized gains (losses) on available-for-sale securities | 3,428 | (21,407 | ) | (22,845 | ) | ||||
Reclassification adjustment for losses (gains) included in net income | 636 | 1,335 | (69 | ) | |||||
Net unrealized gains (losses) on available-for-sale securities | 4,064 | (20,072 | ) | (22,914 | ) | ||||
Tax effect | (1,563 | ) | 7,776 | 8,904 | |||||
Net of tax amount | 2,501 | (12,296 | ) | (14,010 | ) | ||||
Unrealized gains (losses) on derivatives used for cash flow hedges | 444 | (1,643 | ) | (7,857 | ) | ||||
Reclassification adjustment for losses included in net income | 4,892 | 6,417 | 5,025 | ||||||
Net unrealized gains (losses) on derivatives used for cash flow hedges | 5,336 | 4,774 | (2,832 | ) | |||||
Tax effect | (2,083 | ) | (1,849 | ) | 1,087 | ||||
Net of tax amount | 3,253 | 2,925 | (1,745 | ) | |||||
Total other comprehensive income (loss), net of tax | 5,754 | (9,371 | ) | (15,755 | ) | ||||
Total Comprehensive Income | $ | 122,131 | 111,760 | 100,372 | |||||
See accompanying notes to consolidated financial statements.
68
GLACIER BANCORP, INC.
CONSOLIDATED STATEMENTS OF CHANGES IN STOCKHOLDERS’ EQUITY
Years ended December 31, 2017, 2016 and 2015
(Dollars in thousands, except per share data) | Common Stock | Paid-in Capital | Retained Earnings Substantially Restricted | Accumulated Other Comp-rehensive Income (Loss) | ||||||||||||||
Shares | Amount | Total | ||||||||||||||||
Balance at December 31, 2014 | 75,026,092 | $ | 750 | 708,356 | 301,197 | 17,744 | 1,028,047 | |||||||||||
Net income | — | — | — | 116,127 | — | 116,127 | ||||||||||||
Other comprehensive loss | — | — | — | — | (15,755 | ) | (15,755 | ) | ||||||||||
Cash dividends declared ($1.05 per share) | — | — | — | (79,792 | ) | — | (79,792 | ) | ||||||||||
Stock issued in connection with acquisitions | 997,850 | 10 | 25,929 | — | — | 25,939 | ||||||||||||
Stock issuances under stock incentive plans | 62,346 | 1 | 16 | — | — | 17 | ||||||||||||
Stock-based compensation and related taxes | — | — | 2,067 | — | — | 2,067 | ||||||||||||
Balance at December 31, 2015 | 76,086,288 | $ | 761 | 736,368 | 337,532 | 1,989 | 1,076,650 | |||||||||||
Net income | — | — | — | 121,131 | — | 121,131 | ||||||||||||
Other comprehensive loss | — | — | — | — | (9,371 | ) | (9,371 | ) | ||||||||||
Cash dividends declared ($1.10 per share) | — | — | — | (84,284 | ) | — | (84,284 | ) | ||||||||||
Stock issued in connection with acquisitions | 349,545 | 3 | 10,462 | — | — | 10,465 | ||||||||||||
Stock issuances under stock incentive plans | 89,569 | 1 | (1 | ) | — | — | — | |||||||||||
Stock-based compensation and related taxes | — | — | 2,278 | — | — | 2,278 | ||||||||||||
Balance at December 31, 2016 | 76,525,402 | $ | 765 | 749,107 | 374,379 | (7,382 | ) | 1,116,869 | ||||||||||
Net income | — | — | — | 116,377 | — | 116,377 | ||||||||||||
Other comprehensive income | — | — | — | 351 | 5,403 | 5,754 | ||||||||||||
Cash dividends declared ($1.14 per share) | — | — | — | (88,848 | ) | — | (88,848 | ) | ||||||||||
Stock issued in connection with acquisitions | 1,381,661 | 14 | 46,659 | — | — | 46,673 | ||||||||||||
Stock issuances under stock incentive plans | 99,893 | 1 | (1 | ) | — | — | — | |||||||||||
Stock-based compensation and related taxes | — | — | 2,232 | — | — | 2,232 | ||||||||||||
Balance at December 31, 2017 | 78,006,956 | $ | 780 | 797,997 | 402,259 | (1,979 | ) | 1,199,057 | ||||||||||
See accompanying notes to consolidated financial statements.
69
GLACIER BANCORP, INC.
CONSOLIDATED STATEMENTS OF CASH FLOWS
Years ended | |||||||||
(Dollars in thousands) | December 31, 2017 | December 31, 2016 | December 31, 2015 | ||||||
Operating Activities | |||||||||
Net income | $ | 116,377 | 121,131 | 116,127 | |||||
Adjustments to reconcile net income to net cash provided by operating activities: | |||||||||
Provision for loan losses | 10,824 | 2,333 | 2,284 | ||||||
Net amortization of investment securities premiums and discounts | 20,026 | 26,210 | 26,709 | ||||||
Net (accretion) amortization of purchase accounting adjustments | (5,131 | ) | (2,252 | ) | 1,264 | ||||
Amortization of debt modification costs | 471 | — | — | ||||||
Loans held for sale originated or acquired | (889,212 | ) | (1,098,864 | ) | (888,676 | ) | |||
Proceeds from sales of loans held for sale | 984,506 | 1,155,186 | 925,353 | ||||||
Gain on sale of loans | (30,439 | ) | (33,606 | ) | (26,389 | ) | |||
Loss (gain) on sale of investments | 660 | 1,463 | (19 | ) | |||||
Bank-owned life insurance income, net | (1,395 | ) | (1,142 | ) | (1,137 | ) | |||
Stock-based compensation, net of tax benefits | 2,952 | 1,844 | 1,695 | ||||||
Depreciation of premises and equipment | 14,758 | 15,294 | 14,365 | ||||||
(Gain) loss on sale of other real estate owned and write-downs, net | (1,641 | ) | 1,217 | 938 | |||||
Deferred tax expense (benefit) | 25,887 | (82 | ) | (4,080 | ) | ||||
Amortization of core deposit intangibles | 2,494 | 2,970 | 2,964 | ||||||
Amortization of investments in variable interest entities | 4,692 | 2,578 | 3,297 | ||||||
Net decrease (increase) in accrued interest receivable | 2,466 | (1,144 | ) | (2,377 | ) | ||||
Net decrease in other assets | 1,139 | 6,621 | 2,701 | ||||||
Net (decrease) increase in accrued interest payable | (135 | ) | 60 | (828 | ) | ||||
Net (decrease) increase in other liabilities | (4,558 | ) | (6,730 | ) | 2,580 | ||||
Net cash provided by operating activities | 254,741 | 193,087 | 176,771 | ||||||
Investing Activities | |||||||||
Sales of available-for-sale securities | 247,748 | 62,817 | 136,777 | ||||||
Maturities, prepayments and calls of available-for-sale securities | 446,695 | 662,003 | 663,828 | ||||||
Purchases of available-for-sale securities | (36,239 | ) | (585,064 | ) | (961,224 | ) | |||
Maturities, prepayments and calls of held-to-maturity securities | 25,187 | 25,405 | 20,997 | ||||||
Purchases of held-to-maturity securities | — | (1,222 | ) | (203,554 | ) | ||||
Principal collected on loans | 2,099,292 | 1,781,534 | 1,736,198 | ||||||
Loans originated or acquired | (2,740,281 | ) | (2,375,136 | ) | (2,112,154 | ) | |||
Net additions to premises and equipment | (10,128 | ) | (8,306 | ) | (18,224 | ) | |||
Proceeds from sale of other real estate owned | 12,335 | 10,145 | 10,278 | ||||||
Proceeds from sale of non-marketable equity securities | 68,610 | 73,611 | 38,607 | ||||||
Purchases of non-marketable equity securities | (71,396 | ) | (67,594 | ) | (10,837 | ) | |||
Proceeds from bank-owned life insurance | 437 | 437 | 1,143 | ||||||
Investments in variable interest entities | (14,514 | ) | (6,644 | ) | (4,576 | ) | |||
Net cash (paid) received in acquisitions | (4,091 | ) | 6,701 | 21,427 | |||||
Net cash provided by (used in) investing activities | 23,655 | (421,313 | ) | (681,314 | ) | ||||
See accompanying notes to consolidated financial statements.
70
GLACIER BANCORP, INC.
CONSOLIDATED STATEMENTS OF CASH FLOWS (Continued)
Years ended | |||||||||
(Dollars in thousands) | December 31, 2017 | December 31, 2016 | December 31, 2015 | ||||||
Financing Activities | |||||||||
Net (decrease) increase in deposits | $ | (89,397 | ) | 368,006 | 215,895 | ||||
Net (decrease) increase in securities sold under agreements to repurchase | (111,077 | ) | 50,236 | 24,951 | |||||
Net increase (decrease) in short-term Federal Home Loan Bank advances | 137,200 | (100,000 | ) | 140,000 | |||||
Proceeds from long-term Federal Home Loan Bank advances | 150,000 | — | 49,816 | ||||||
Repayments of long-term Federal Home Loan Bank advances | (208,192 | ) | (45,567 | ) | (94,621 | ) | |||
Net increase (decrease) in other borrowed funds | 3,784 | (521 | ) | (709 | ) | ||||
Cash dividends paid | (111,720 | ) | (84,040 | ) | (79,456 | ) | |||
Tax withholding payments for stock-based compensation | (1,531 | ) | (600 | ) | (489 | ) | |||
Net cash (used in) provided by financing activities | (230,933 | ) | 187,514 | 255,387 | |||||
Net increase (decrease) in cash and cash equivalents | 47,463 | (40,712 | ) | (249,156 | ) | ||||
Cash and cash equivalents at beginning of period | 152,541 | 193,253 | 442,409 | ||||||
Cash and cash equivalents at end of period | $ | 200,004 | 152,541 | 193,253 | |||||
Supplemental Disclosure of Cash Flow Information | |||||||||
Cash paid during the period for interest | $ | 30,000 | 29,576 | 30,103 | |||||
Cash paid during the period for income taxes | 40,219 | 36,225 | 39,622 | ||||||
Supplemental Disclosure of Non-Cash Investing Activities | |||||||||
Sale and refinancing of other real estate owned | $ | 553 | 728 | 446 | |||||
Transfer of loans to other real estate owned | 4,466 | 5,198 | 7,989 | ||||||
Dividends declared but not paid | 265 | 23,137 | 22,893 | ||||||
Acquisitions | |||||||||
Fair value of common stock shares issued | 46,673 | 10,465 | 25,939 | ||||||
Cash consideration for outstanding shares | 17,342 | 3,475 | 28,364 | ||||||
Fair value of assets acquired | 355,230 | 69,750 | 434,963 | ||||||
Liabilities assumed | 321,824 | 62,225 | 391,592 | ||||||
See accompanying notes to consolidated financial statements.
71
GLACIER BANCORP, INC.
NOTES TO CONSOLIDATED FINANCIAL STATEMENTS
Note 1. Nature of Operations and Summary of Significant Accounting Policies
General
Glacier Bancorp, Inc. (“Company”) is a Montana corporation headquartered in Kalispell, Montana. The Company provides a full range of banking services to individuals and businesses in Montana, Idaho, Utah, Washington, Wyoming, Colorado and Arizona through its wholly-owned bank subsidiary, Glacier Bank (“Bank”). The Company offers a wide range of banking products and services, including: 1) retail banking; 2) business banking; 3) real estate, commercial, agriculture and consumer loans; and 4) mortgage origination services. The Company serves individuals, small to medium-sized businesses, community organizations and public entities.
The preparation of financial statements in conformity with accounting principles generally accepted in the United States of America (“GAAP”) requires management to make estimates and assumptions that affect the reported amounts of assets and liabilities and disclosure of contingent assets and liabilities at the date of the financial statements and the reported amounts of income and expenses during the reporting period. Actual results could differ from those estimates.
Material estimates that are particularly susceptible to significant change include: 1) the determination of the allowance for loan and lease losses (“ALLL” or “allowance”); 2) the valuation of investment securities; 3) the valuation of real estate acquired in connection with foreclosures or in satisfaction of loans; and 4) the evaluation of goodwill impairment. For the determination of the ALLL and real estate valuation estimates, management obtains independent appraisals (new or updated) for significant items. Estimates relating to investment valuations are obtained from independent third parties. Estimates relating to the evaluation of goodwill for impairment are determined based on internal calculations using significant independent party inputs.
Principles of Consolidation
The consolidated financial statements of the Company include the parent holding company and the Bank. The Bank consists of fourteen bank divisions, a treasury division, an information technology division and a centralized mortgage division. The treasury division includes the Bank’s investment portfolio and wholesale borrowings, the information technology division includes the Bank’s internal data processing, and the centralized mortgage division includes mortgage loan servicing and secondary market sales. The Bank divisions operate under separate names, management teams and advisory directors. The Company considers the Bank to be its sole operating segment as the Bank 1) engages in similar bank business activity from which it earns revenues and incurs expenses; 2) the operating results of the Bank are regularly reviewed by the Chief Executive Officer (“CEO”) (i.e., the chief operating decision maker) who makes decisions about resources to be allocated to the Bank; and 3) financial information is available for the Bank. All significant inter-company transactions have been eliminated in consolidation.
The Bank has subsidiary interests in variable interest entities (“VIE”) for which the Bank has both the power to direct the VIE’s significant activities and the obligation to absorb losses or right to receive benefits of the VIE that could potentially be significant to the VIE. These subsidiary interests are included in the Company’s consolidated financial statements. The Bank also has subsidiary interests in VIEs for which the Bank does not have a controlling financial interest and is not the primary beneficiary. These subsidiary interests are not included in the Company’s consolidated financial statements.
The parent holding company owns non-bank subsidiaries that have issued trust preferred securities as Tier 1 capital instruments. The trust subsidiaries are not included in the Company’s consolidated financial statements. The Company's investments in the trust subsidiaries are included in non-marketable equity securities on the Company's statements of financial condition.
In April 2017, the Company completed its acquisition of TFB Bancorp, Inc. and its wholly-owned subsidiary, The Foothills Bank, a community bank based in Yuma, Arizona (collectively, “Foothills”). In August 2016, the Company completed its acquisition of Treasure State Bank (“TSB”), a community bank based in Missoula, Montana. In October 2015, the Company completed its acquisition of Cañon Bank Corporation and its wholly-owned subsidiary, Cañon National Bank, a community bank based in Cañon City, Colorado (collectively, “Cañon”). In February 2015, the Company completed its acquisition of Montana Community Banks, Inc. and its wholly-owned subsidiary, Community Bank, Inc., a community bank based in Ronan, Montana (collectively, “CB”). The transactions were accounted for using the acquisition method, and their results of operations have been included in the Company’s consolidated financial statements as of the acquisition dates. For additional information relating to recent mergers and acquisitions, see Note 22.
In January 2018, the Company acquired the outstanding common stock of Columbine Capital Corp., and its wholly-owned subsidiary, Collegiate Peaks Bank, a community bank based in Buena Vista, Colorado (collectively, “Collegiate”). As of December 31, 2017, Collegiate had total assets of $532,958,000, gross loans of $345,687,000 and total deposits of $463,970,000. For additional information relating to this subsequent event, see Note 23.
72
Note 1. Nature of Operations and Summary of Significant Accounting Policies (continued)
In October 2017, the Company announced the signing of a definitive agreement to acquire Inter-Mountain Bancorp, Inc. and its wholly-owned subsidiary, First Security Bank, a community bank based in Bozeman, Montana (collectively, “FSB”). FSB provides banking services to individuals and businesses throughout Montana with banking offices located in Bozeman, Belgrade, Big Sky, Choteau, Fairfield, Fort Benton, Three Forks, Vaughn and West Yellowstone. As of December 31, 2017, FSB had total assets of $1,027,685,000, gross loans of $639,880,000 and total deposits of $891,390,000. Upon closing of the transaction, which is anticipated to take place in February 2018, FSB will become a new bank division headquartered in Bozeman. Big Sky Western Bank, the Bank’s existing Bozeman-based division will combine with the new FSB division. The agriculture-focused northern branches of FSB, located in the area known as the Golden Triangle, will combine with the Bank’s First Bank of Montana division.
Cash and Cash Equivalents
Cash and cash equivalents include cash on hand, cash held as demand deposits at various banks and the Federal Reserve Bank (“FRB”), interest bearing deposits, federal funds sold, and liquid investments with original maturities of three months or less. The Bank is required to maintain an average reserve balance with either the FRB or in the form of cash on hand. The required reserve balance at December 31, 2017 was $10,916,000.
Investment Securities
Debt securities for which the Company has the positive intent and ability to hold to maturity are classified as held-to-maturity and are carried at amortized cost. Debt and equity securities held primarily for the purpose of selling in the near term are classified as trading securities and are reported at fair value, with unrealized gains and losses included in income. Debt and equity securities not classified as held-to-maturity or trading are classified as available-for-sale and are reported at fair value with unrealized gains and losses, net of income taxes, as a separate component of other comprehensive income (“OCI”). Premiums and discounts on investment securities are amortized or accreted into income using a method that approximates the interest method. The objective of the interest method is to calculate periodic interest income at a constant effective yield. The Company does not have any investment securities classified as trading securities.
The Company reviews and analyzes the various risks that may be present within the investment portfolio on an ongoing basis, including market risk and credit risk. Market risk is the risk to an entity’s financial condition resulting from adverse changes in the value of its holdings arising from movements in interest rates, foreign exchange rates, equity prices or commodity prices. The Company assesses the market risk of individual securities as well as the investment portfolio as a whole. Credit risk, broadly defined, is the risk that an issuer or counterparty will fail to perform on an obligation. A security is investment grade if the issuer has an adequate capacity to meet its commitment over the expected life of the investment, i.e., the risk of default is low and full and timely repayment of interest and principal is expected. To determine investment grade status for securities, the Company conducts due diligence of the creditworthiness of the issuer or counterparty prior to acquisition and ongoing thereafter consistent with the risk characteristics of the security and the overall risk of the investment portfolio. Credit quality due diligence takes into account the extent to which a security is guaranteed by the U.S. government and other agencies of the U.S. government. The depth of the due diligence is based on the complexity of the structure, the size of the security, and takes into account material positions and specific groups of securities or stratifications for analysis and review of similar risk positions. The due diligence includes consideration of payment performance, collateral adequacy, internal analyses, third party research and analytics, external credit ratings and default statistics.
For additional information relating to investment securities, see Note 2.
Temporary versus Other-Than-Temporary Impairment
The Company assesses individual securities in its investment portfolio for impairment at least on a quarterly basis, and more frequently when economic or market conditions warrant. An investment is impaired if the fair value of the security is less than its carrying value at the financial statement date. If impairment is determined to be other-than-temporary, an impairment loss is recognized by reducing the amortized cost for the credit loss portion of the impairment with a corresponding charge to earnings for a like amount.
In evaluating impaired securities for other-than-temporary impairment losses, management considers 1) the severity and duration of the impairment; 2) the credit ratings of the security; and 3) the overall deal structure, including the Company’s position within the structure, the overall and near term financial performance of the issuer and underlying collateral, delinquencies, defaults, loss severities, recoveries, prepayments, cumulative loss projections, discounted cash flows and fair value estimates.
73
Note 1. Nature of Operations and Summary of Significant Accounting Policies (continued)
In evaluating debt securities for other-than-temporary impairment losses, management assesses whether the Company intends to sell the security or if it is more-likely-than-not that the Company will be required to sell the debt security. In so doing, management considers contractual constraints, liquidity, capital, asset/liability management and securities portfolio objectives. If impairment is determined to be other-than-temporary and the Company does not intend to sell a debt security, and it is more-likely-than-not the Company will not be required to sell the security before recovery of its cost basis, it recognizes the credit component of an other-than-temporary impairment of a debt security in earnings and the remaining portion (noncredit portion) in OCI, net of tax. For held-to-maturity debt securities, the amount of an other-than-temporary impairment recorded in OCI for the noncredit portion of a previous other-than-temporary impairment is amortized prospectively, as an increase to the carrying amount of the security, over the remaining life of the security on the basis of the timing of future estimated cash flows of the security.
If impairment is determined to be other-than-temporary and the Company intends to sell a debt security or it is more-likely-than-not the Company will be required to sell the security before recovery of its cost basis, it recognizes the entire amount of the other-than-temporary impairment in earnings.
For debt securities with other-than-temporary impairment, the previous amortized cost basis less the other-than-temporary impairment recognized in earnings shall be the new amortized cost basis of the security. In subsequent periods, the Company accretes into interest income the difference between the new amortized cost basis and cash flows expected to be collected prospectively over the life of the debt security.
Loans Held for Sale
Loans held for sale generally consist of long-term, fixed rate, conforming, single-family residential real estate loans intended to be sold on the secondary market. Loans held for sale may be carried at the lower of cost or estimated fair value in the aggregate basis, or at fair value where the Company has elected the fair value option. When an election is made to carry the loans held for sale at fair value, the fair value includes the servicing value of the loans and any change in fair value is recognized in non-interest income. Fair value elections are made at the time of origination or purchase based on the Company’s fair value election policy. Beginning in 2017, the Company elected fair value accounting for all of its loans held for sale.
Loans Receivable
Loans that are intended to be held-to-maturity are reported at the unpaid principal balance less net charge-offs and adjusted for deferred fees and costs on originated loans and unamortized premiums or discounts on acquired loans. Fees and costs on originated loans and premiums or discounts on acquired loans are deferred and subsequently amortized or accreted as a yield adjustment over the expected life of the loan utilizing the interest method. The objective of the interest method is to calculate periodic interest income at a constant effective yield. When a loan is paid off prior to maturity, the remaining fees and costs on originated loans and premiums or discounts on acquired loans are immediately recognized into interest income.
The Company’s loan segments, which are based on the purpose of the loan, include residential real estate, commercial, and consumer loans. The Company’s loan classes, a further disaggregation of segments, include residential real estate loans (residential real estate segment), commercial real estate and other commercial loans (commercial segment), and home equity and other consumer loans (consumer segment).
Loans that are thirty days or more past due based on payments received and applied to the loan are considered delinquent. Loans are designated non-accrual and the accrual of interest is discontinued when the collection of the contractual principal or interest is unlikely. A loan is typically placed on non-accrual when principal or interest is due and has remained unpaid for ninety days or more. When a loan is placed on non-accrual status, interest previously accrued but not collected is reversed against current period interest income. Subsequent payments on non-accrual loans are applied to the outstanding principal balance if doubt remains as to the ultimate collectability of the loan. Interest accruals are not resumed on partially charged-off impaired loans. For other loans on nonaccrual, interest accruals are resumed on such loans only when they are brought fully current with respect to interest and principal and when, in the judgment of management, the loans are estimated to be fully collectible as to both principal and interest.
74
Note 1. Nature of Operations and Summary of Significant Accounting Policies (continued)
The Company considers impaired loans to be the primary credit quality indicator for monitoring the credit quality of the loan portfolio. Loans are designated impaired when, based upon current information and events, it is probable that the Company will be unable to collect the scheduled payments of principal or interest when due according to the contractual terms of the loan agreement and, therefore, the Company has serious doubts as to the ability of such borrowers to fulfill the contractual obligation. Impaired loans include non-performing loans (i.e., non-accrual loans and accruing loans ninety days or more past due) and accruing loans under ninety days past due where it is probable payments will not be received according to the loan agreement (e.g., troubled debt restructuring). Interest income on accruing impaired loans is recognized using the interest method. The Company measures impairment on a loan-by-loan basis in the same manner for each class within the loan portfolio. An insignificant delay or shortfall in the amounts of payments would not cause a loan or lease to be considered impaired. The Company determines the significance of payment delays and shortfalls on a case-by-case basis, taking into consideration all of the facts and circumstances surrounding the loan and the borrower, including the length and reasons for the delay, the borrower’s prior payment record, and the amount of the shortfall in relation to the principal and interest due.
A restructured loan is considered a troubled debt restructuring (“TDR”) if the creditor, for economic or legal reasons related to the debtor’s financial difficulties, grants a concession to the debtor that it would not otherwise consider. The Company periodically enters into restructure agreements with borrowers whereby the loans were previously identified as TDRs. When such circumstances occur, the Company carefully evaluates the facts of the subsequent restructure to determine the appropriate accounting and under certain circumstances it may be acceptable not to account for the subsequently restructured loan as a TDR. When assessing whether a concession has been granted by the Company, any prior forgiveness on a cumulative basis is considered a continuing concession. A TDR loan is considered an impaired loan and a specific valuation allowance is established when the fair value of the collateral-dependent loan or present value of the loan’s expected future cash flows (discounted at the loan’s effective interest rate based on the original contractual rate) is lower than the carrying value of the impaired loan. The Company has made the following types of loan modifications, some of which were considered a TDR:
• | reduction of the stated interest rate for the remaining term of the debt; |
• | extension of the maturity date(s) at a stated rate of interest lower than the current market rate for newly originated debt having similar risk characteristics; and |
• | reduction of the face amount of the debt as stated in the debt agreements. |
The Company recognizes that while borrowers may experience deterioration in their financial condition, many continue to be creditworthy customers who have the willingness and capacity for debt repayment. In determining whether non-restructured or unimpaired loans issued to a single or related party group of borrowers should continue to accrue interest when the borrower has other loans that are impaired or are TDRs, the Company on a quarterly or more frequent basis performs an updated and comprehensive assessment of the willingness and capacity of the borrowers to timely and ultimately repay their total debt obligations, including contingent obligations. Such analysis takes into account current financial information about the borrowers and financially responsible guarantors, if any, including for example:
• | analysis of global, i.e., aggregate debt service for total debt obligations; |
• | assessment of the value and security protection of collateral pledged using current market conditions and alternative market assumptions across a variety of potential future situations; and |
• | loan structures and related covenants. |
For additional information relating to loans, see Note 3.
Allowance for Loan and Lease Losses
Based upon management’s analysis of the Company’s loan portfolio, the balance of the ALLL is an estimate of probable credit losses known and inherent within the Bank’s loan portfolio as of the date of the consolidated financial statements. The ALLL is analyzed at the loan class level and is maintained within a range of estimated losses. Determining the adequacy of the ALLL involves a high degree of judgment and is inevitably imprecise as the risk of loss is difficult to quantify. The determination of the ALLL and the related provision for loan losses is a critical accounting estimate that involves management’s judgments about known relevant internal and external environmental factors that affect loan losses. The balance of the ALLL is highly dependent upon management’s evaluations of borrowers’ current and prospective performance, appraisals and other variables affecting the quality of the loan portfolio. Individually significant loans and major lending areas are reviewed periodically to determine potential problems at an early date. Changes in management’s estimates and assumptions are reasonably possible and may have a material impact upon the Company’s consolidated financial statements, results of operations or capital.
75
Note 1. Nature of Operations and Summary of Significant Accounting Policies (continued)
Risk characteristics considered in the ALLL analysis applicable to each loan class within the Company's loan portfolio are as follows:
Residential Real Estate. Residential real estate loans are secured by owner-occupied 1-4 family residences. Repayment of these loans is primarily dependent on the personal income and credit rating of the borrowers. Credit risk in these loans is impacted by economic conditions within the Company’s market areas that affect the value of the property securing the loans and affect the borrowers' personal incomes. Mitigating risk factors for this loan class include a large number of borrowers, geographic dispersion of market areas and the loans are originated for relatively smaller amounts.
Commercial Real Estate. Commercial real estate loans typically involve larger principal amounts, and repayment of these loans is generally dependent on the successful operation of the property securing the loan and/or the business conducted on the property securing the loan. Credit risk in these loans is impacted by the creditworthiness of a borrower, valuation of the property securing the loan and conditions within the local economies in the Company’s diverse, geographic market areas.
Commercial. Commercial loans consist of loans to commercial customers for use in financing working capital needs, equipment purchases and business expansions. The loans in this category are repaid primarily from the cash flow of a borrower’s principal business operation. Credit risk in these loans is driven by creditworthiness of a borrower and the economic conditions that impact the cash flow stability from business operations across the Company’s diverse, geographic market areas.
Home Equity. Home equity loans consist of junior lien mortgages and first and junior lien lines of credit (revolving open-end and amortizing closed-end) secured by owner-occupied 1-4 family residences. Repayment of these loans is primarily dependent on the personal income and credit rating of the borrowers. Credit risk in these loans is impacted by economic conditions within the Company’s market areas that affect the value of the residential property securing the loans and affect the borrowers' personal incomes. Mitigating risk factors for this loan class are a large number of borrowers, geographic dispersion of market areas and the loans are originated for terms that range from 10 years to 15 years.
Other Consumer. The other consumer loan portfolio consists of various short-term loans such as automobile loans and loans for other personal purposes. Repayment of these loans is primarily dependent on the personal income of the borrowers. Credit risk is driven by consumer economic factors (such as unemployment and general economic conditions in the Company’s diverse, geographic market area) and the creditworthiness of a borrower.
The ALLL consists of a specific valuation allowance component and a general valuation allowance component. The specific component relates to loans that are determined to be impaired and individually evaluated for impairment. The Company measures impairment on a loan-by-loan basis based on the present value of expected future cash flows discounted at the loan’s effective interest rate, except when it is determined that repayment of the loan is expected to be provided solely by the underlying collateral. For impairment based on expected future cash flows, the Company considers all information available as of a measurement date, including past events, current conditions, potential prepayments, and estimated cost to sell when such costs are expected to reduce the cash flows available to repay or otherwise satisfy the loan. For alternative ranges of cash flows, the likelihood of the possible outcomes is considered in determining the best estimate of expected future cash flows. The effective interest rate for a loan restructured in a TDR is based on the original contractual rate. For collateral-dependent loans and real estate loans for which foreclosure or a deed-in-lieu of foreclosure is probable, impairment is measured by the fair value of the collateral, less estimated cost to sell. The fair value of the collateral is determined primarily based upon appraisal or evaluation of the underlying real property value.
The general valuation allowance component relates to probable credit losses inherent in the balance of the loan portfolio based on historical loss experience, adjusted for changes in trends and conditions of qualitative or environmental factors. The historical loss experience is based on the previous twelve quarters loss experience by loan class adjusted for risk characteristics in the existing loan portfolio. The same trends and conditions are evaluated for each class within the loan portfolio; however, the risk characteristics are weighted separately at the individual class level based on the Company’s judgment and experience.
76
Note 1. Nature of Operations and Summary of Significant Accounting Policies (continued)
The changes in trends and conditions evaluated for each class within the loan portfolio include the following:
• | changes in lending policies and procedures, including changes in underwriting standards and collection, charge-off, and recovery practices not considered elsewhere in estimating credit losses; |
• | changes in global, national, regional, and local economic and business conditions and developments that affect the collectability of the portfolio, including the condition of various market segments; |
• | changes in the nature and volume of the portfolio and in the terms of loans; |
• | changes in experience, ability, and depth of lending management and other relevant staff; |
• | changes in the volume and severity of past due and nonaccrual loans; |
• | changes in the quality of the Company’s loan review system; |
• | changes in the value of underlying collateral for collateral-dependent loans; |
• | the existence and effect of any concentrations of credit, and changes in the level of such concentrations; and |
• | the effect of other external factors such as competition and legal and regulatory requirements on the level of estimated credit losses in the Company’s existing portfolio. |
The ALLL is increased by provisions for loan losses which are charged to expense. The portions of loan and overdraft balances determined by management to be uncollectible are charged off as a reduction of the ALLL and recoveries of amounts previously charged off are credited as an increase to the ALLL. The Company’s charge-off policy is consistent with bank regulatory standards. Consumer loans generally are charged off when the loan becomes over 120 days delinquent. Real estate acquired as a result of foreclosure or by deed-in-lieu of foreclosure is classified as OREO until such time as it is sold.
At acquisition date, the assets and liabilities of acquired banks are recorded at their estimated fair values which results in no ALLL carried over from acquired banks. Subsequent to acquisition, an allowance will be recorded on the acquired loan portfolios for further credit deterioration, if any.
Premises and Equipment
Premises and equipment are accounted for at cost less depreciation. Depreciation is computed on a straight-line method over the estimated useful lives or the term of the related lease. The estimated useful life for office buildings is 15 - 40 years and the estimated useful life for furniture, fixtures, and equipment is 3 - 10 years. Interest is capitalized for any significant building projects. For additional information relating to premises and equipment, see Note 4.
Leases
The Company leases certain land, premises and equipment from third parties under operating and capital leases. The lease payments for operating lease agreements are recognized on a straight-line basis. The present value of the future minimum rental payments for capital leases is recognized as an asset when the lease is formed. Lease improvements incurred at the inception of the lease are recorded as an asset and depreciated over the initial term of the lease and lease improvements incurred subsequently are depreciated over the remaining term of the lease. For additional information relating to leases, see Note 4.
Other Real Estate Owned
Property acquired by foreclosure or deed-in-lieu of foreclosure is initially recorded at fair value, less estimated selling cost, at acquisition date (i.e., cost of the property). The Company is considered to have received physical possession of residential real estate property collateralizing a consumer mortgage loan upon the occurrence of either the Company obtaining legal title to the property or the borrower conveying all interest in the property through a deed-in-lieu or similar agreement. Fair value is determined as the amount that could be reasonably expected in a current sale between a willing buyer and a willing seller in an orderly transaction between market participants at the measurement date. Subsequent to the initial acquisition, if the fair value of the asset, less estimated selling cost, is less than the cost of the property, a loss is recognized in other expense and the asset carrying value is reduced. Gain or loss on disposition of other real estate owned (“OREO”) is recorded in non-interest income or non-interest expense, respectively. In determining the fair value of the properties on the date of transfer and any subsequent estimated losses of net realizable value, the fair value of other real estate acquired by foreclosure or deed-in-lieu of foreclosure is determined primarily based upon appraisal or evaluation of the underlying property value.
Long-lived Assets
Long-lived assets are reviewed for impairment whenever events or changes in circumstances indicate that the carrying amount of an asset may not be recoverable. An asset is deemed impaired if the sum of the expected future cash flows is less than the carrying amount of the asset. If impaired, an impairment loss is recognized in other expense to reduce the carrying value of the asset to fair value. At December 31, 2017 and 2016, no long-lived assets were considered materially impaired.
77
Note 1. Nature of Operations and Summary of Significant Accounting Policies (continued)
Business Combinations and Intangible Assets
Acquisition accounting requires the total purchase price to be allocated to the estimated fair values of assets acquired and liabilities assumed, including certain intangible assets. Goodwill is recorded if the purchase price exceeds the net fair value of assets acquired and a bargain purchase gain is recorded in other income if the net fair value of assets acquired exceeds the purchase price.
Adjustment of the allocated purchase price may be related to fair value estimates for which all information has not been obtained of the acquired entity known or discovered during the allocation period, the period of time required to identify and measure the fair values of the assets and liabilities acquired in the business combination. The allocation period is generally limited to one year following consummation of a business combination.
Core deposit intangible represents the intangible value of depositor relationships resulting from deposit liabilities assumed in acquisitions and is amortized using an accelerated method based on an estimated runoff of the related deposits. The core deposit intangible is evaluated for impairment and recoverability whenever events or changes in circumstances indicate that its carrying amount may not be recoverable, with any changes in estimated useful life accounted for prospectively over the revised remaining life. For additional information relating to core deposit intangibles, see Note 5.
The Company tests goodwill for impairment at the reporting unit level annually during the third quarter. The Company has identified that each of the Bank divisions are reporting units (i.e., components of the Glacier Bank operating segment) given that each division has a separate management team that regularly reviews its respective division financial information; however, the reporting units are aggregated into a single reporting unit due to the reporting units having similar economic characteristics.
The goodwill of a reporting unit is tested for impairment between annual tests if an event occurs or circumstances change that would more-likely-than-not reduce the fair value of a reporting unit below its carrying amount. Examples of events and circumstances that could trigger the need for interim impairment testing include:
• | a significant change in legal factors or in the business climate; |
• | an adverse action or assessment by a regulator; |
• | unanticipated competition; |
• | a loss of key personnel; |
• | a more-likely-than-not expectation that a reporting unit or a significant portion of a reporting unit will be sold or otherwise disposed of; and |
• | the testing for recoverability of a significant asset group within a reporting unit. |
For the goodwill impairment assessment, the Company has the option, prior to the two-step process, to first assess qualitative factors to determine whether the existence of events or circumstances leads to a determination that it is more-likely-than-not that the fair value of a reporting unit is less than its carrying value. The Company opted to bypass the qualitative assessment for its 2017 and 2016 annual goodwill impairment testing and proceed directly to the two-step goodwill impairment test. The goodwill impairment two-step process requires the Company to make assumptions and judgments regarding fair value. In the first step, the Company calculates an implied fair value based on a control premium analysis. If the implied fair value is less than the carrying value, the second step is completed to compute the impairment amount, if any, by determining the “implied fair value” of goodwill. This determination requires the allocation of the estimated fair value of the reporting units to the assets and liabilities of the reporting units. Any remaining unallocated fair value represents the “implied fair value” of goodwill, which is compared to the corresponding carrying value of goodwill to compute impairment, if any.
For additional information relating to goodwill, see Note 5.
Non-Marketable Equity Securities
Non-marketable equity securities primarily consist of Federal Home Loan Bank (“FHLB”) stock. FHLB stock is restricted because such stock may only be sold to FHLB at its par value. Due to restrictive terms, and the lack of a readily determinable market value, FHLB stock is carried at cost. The investments in FHLB stock are required investments related to the Company’s borrowings from FHLB. FHLB obtains its funding primarily through issuance of consolidated obligations of the FHLB system. The U.S. government does not guarantee these obligations, and each of the regional FHLBs is jointly and severally liable for repayment of each other’s debt.
78
Note 1. Nature of Operations and Summary of Significant Accounting Policies (continued)
Bank-Owned Life Insurance
The Company maintains bank-owned life insurance policies on certain current and former employees and directors, which are recorded at their cash surrender values as determined by the insurance carriers. At December 31, 2017 and 2016, the carrying value associated with these policies is $59,351,000 and $50,451,000, respectively, and is recorded in other assets in the Company’s statements of financial position. The appreciation in the cash surrender value of the policies is recognized as a component of other non-interest income in the Company’s statements of operations.
Derivatives and Hedging Activities
For asset and liability management purposes, the Company has entered into interest rate swap agreements to hedge against changes in forecasted cash flows due to interest rate exposures. The interest rate swaps are recognized as assets or liabilities on the Company’s statements of financial condition and measured at fair value. Fair value estimates are obtained from third parties and are based on pricing models. The Company does not enter into interest rate swap agreements for trading or speculative purposes.
The Company takes into account the impact of bilateral collateral and master netting agreements that allows the Company to settle all interest rate swap agreements held with a single counterparty on a net basis, and to offset the net interest rate swap derivative position with the related collateral when recognizing interest rate swap derivative assets and liabilities.
Interest rate swaps are contracts in which a series of interest payments are exchanged over a prescribed period. The notional amount upon which the interest payments are based is not exchanged. The swap agreements are derivative instruments and convert a portion of the Company’s forecasted variable rate debt to a fixed rate (i.e., cash flow hedge) over the payment term of the interest rate swap. The effective portion of the gain or loss on the cash flow hedging instruments is initially reported as a component of OCI and subsequently reclassified into earnings in the same period during which the transaction affects earnings. The ineffective portion of the gain or loss on derivative instruments, if any, is recognized in earnings. For the years ended December 31, 2017, 2016, and 2015, the Company’s cash flow hedges were determined to be fully effective.
Interest rate derivative financial instruments receive hedge accounting treatment only if they are designated as a hedge and are expected to be, and are, highly effective in substantially reducing interest rate risk arising from the assets and liabilities identified as exposing the Company to risk. Derivative financial instruments that do not meet specified hedging criteria are recorded at fair value with changes in fair value recorded in income. The Company’s interest rate swaps are considered highly effective and currently meet the hedge accounting criteria.
Cash flows resulting from the interest rate derivative financial instruments that are accounted for as hedges of assets and liabilities are classified in the Company’s cash flow statement in the same category as the cash flows of the items being hedged. For additional information relating to interest rate swap agreements, see Note 10.
At December 31, 2017, the Company also had residential real estate derivatives for 1) commitments to fund certain residential real estate loans (interest rate locks) of $67,861,000 to be sold into the secondary market; and 2) forward commitments for the future delivery of residential real estate loans to third party investors on a best efforts basis. It is the Company’s practice to enter into forward commitments for the future delivery of residential real estate loans when interest rate lock commitments are entered into in order to economically hedge the effect of changes in interest rates resulting from its commitments to fund the loans. These derivatives are not designated in hedge relationships. Such derivatives are short-term in nature and changes in the fair values of these derivatives are not recorded as gains on sale of loans because the changes were not significant.
Stock-based Compensation
Stock-based compensation awards granted are valued at fair value and compensation cost is recognized on a straight-line basis over the requisite service period of each award. The impact of forfeitures of stock-based compensation awards on compensation expense is recognized as forfeitures occur. For additional information relating to stock-based compensation, see Note 12.
Advertising and Promotion
Advertising and promotion costs are recognized in the period incurred.
Income Taxes
The Company’s income tax expense consists of current and deferred income tax expense. Current income tax expense reflects taxes to be paid or refunded for the current period by applying the provisions of enacted tax law to earnings or losses. Deferred income tax expense results from changes in deferred assets and liabilities between periods. The Company recognizes interest and penalties related to income tax matters in income tax expense.
79
Note 1. Nature of Operations and Summary of Significant Accounting Policies (continued)
Deferred tax assets and liabilities are recognized for estimated future income tax consequences attributable to differences between the financial statement carrying amounts of assets and liabilities and their respective tax bases. The effect on deferred tax assets and liabilities of a change in income tax rates is recognized in income in the period that includes the enactment date.
Deferred tax assets are reduced by a valuation allowance if, based on the weight of available evidence, it is more-likely-than-not that some portion or all of the deferred tax assets will not be realized. The term more-likely-than-not means a likelihood of more than fifty percent. The recognition threshold considers the facts, circumstances, and information available at the reporting date and is subject to the Company’s judgment. In assessing the need for a valuation allowance, the Company considers both positive and negative evidence. For additional information relating to income taxes, see Note 15.
Comprehensive Income
Comprehensive income consists of net income and OCI. OCI includes unrealized gains and losses, net of tax effect, on available-for-sale securities and derivatives used for cash flow hedges. For additional information relating to OCI, see Note 16.
Earnings Per Share
Basic earnings per share is computed by dividing net income by the weighted-average number of shares of common stock outstanding during the period presented. Diluted earnings per share is computed by including the net increase in shares as if dilutive outstanding stock options were exercised and restricted stock awards were vested, using the treasury stock method. For additional information relating to earnings per share, see Note 17.
Reclassifications
Certain reclassifications have been made to the 2016 and 2015 financial statements to conform to the 2017 presentation.
Accounting Guidance Adopted in 2017
The Accounting Standards Codification™ (“ASC”) is the Financial Accounting Standards Board’s (“FASB”) officially recognized source of authoritative GAAP applicable to all public and non-public non-governmental entities. Rules and interpretive releases of the Securities and Exchange Commission (“SEC”) under the authority of the federal securities laws are also sources of authoritative GAAP for the Company as an SEC registrant. All other accounting literature is non-authoritative. The following paragraphs provide descriptions of recently adopted accounting standards that may have had a material effect on the Company’s financial position or results of operations.
Comprehensive Income. In February 2018, FASB amended ASC Topic 220 to allow a reclassification from accumulated other comprehensive income (“AOCI”) to retained earnings for stranded tax effects resulting from the newly enacted Tax Cuts and Jobs Act (“Tax Act”). The amount of the reclassification consists of the difference between the historical corporate income tax rates and the newly enacted 21 percent corporate income tax rate. The amendments are effective for all entities for the interim and annual reporting periods beginning after December 15, 2018 and early adoption is permitted, including interim periods in those years. The Company adopted the amendments as of December 31, 2017, which resulted in a net reclassification of $351,000 between AOCI and retained earnings. The Company’s policy is to release material stranded tax effects on a specific identification basis.
Stock Compensation. In March 2016, FASB amended ASC Topic 718 to address certain aspects of the accounting for share-based payment transactions, including the income tax consequences, classification of awards as either equity or liabilities, and classification of awards on the statements of cash flows. The amendments were effective for public business entities for the first interim and annual reporting periods beginning after December 15, 2016 and the Company adopted the amendments as of January 1, 2017. The amendments require entities to recognize all income tax effects related to share-based payment awards in the statements of operations when the awards vest or are settled. Previously, income tax benefits at the settlement of awards were reported as increases (or decreases) to additional paid-in capital to the extent that those benefits were greater than (or less than) the income tax benefits recognized in earnings during the awards’ vesting periods. Such amounts are to be classified as an operating activity in the statements of cash flows instead of the prior accounting treatment, which required it to be classified as both an operating and a financing activity. The Company has elected to apply this classification change on a retrospective basis. Also in connection with the adoption of the Update, the Company has elected to change its accounting policy to recognize forfeitures as they occur. The requirement to report income tax effects in earnings has been applied to the settlement of awards on a prospective basis and the impact of applying the guidance reduced reported income tax expense for the year ended December 31, 2017 by $553,000, or approximately $0.01 per diluted common share. The implementation of the remaining provisions of the Update did not have a significant impact on the Company’s consolidated financial statements.
80
Note 1. Nature of Operations and Summary of Significant Accounting Policies (continued)
Accounting Guidance Pending Adoption at December 31, 2017
The following paragraphs provide descriptions of newly issued but not yet effective accounting standards that could have a material effect on the Company’s financial position or results of operations.
Derivatives and Hedging. In August 2017, FASB amended ASC Topic 815 to improve the financial reporting of hedging relationships to better portray the economic results of an entity’s risk management activities in its financial statements. In addition, the amendments made targeted improvements to simplify the application of the hedge accounting guidance. The amendments are effective for public business entities for the first interim and annual reporting periods beginning after December 15, 2018 and early adoption is permitted. The Company is currently evaluating the full impact of the amendments on its existing interest rate swaps and whether it will early adopt. The Company does not expect there to be an impact to the Company’s financial position and results of operations, although, there may be additional financial statement disclosures. The accounting policies and procedures will be modified after the Company has fully evaluated the standard, although significant changes are not expected. For additional information on derivatives, see Note 10.
Receivables - Nonrefundable Fees and Other Costs. In March 2017, FASB amended ASC Subtopic 310-20 to shorten the amortization period for certain callable debt securities held at a premium. Specifically, the amendments require the premium to be amortized to the earliest call date instead of the maturity date. The amendments do not require an accounting change for securities held at a discount; the discount continues to be amortized to maturity. The amendments are effective for public business entities for the first interim and annual reporting periods beginning after December 15, 2018. Early adoption is permitted and if adopted in an interim period, any adjustments should be reflected as of the beginning of the year that includes the interim period. The entity should apply the amendments on a modified retrospective basis through a cumulative-effective adjustment directly to retained earnings as of the beginning of the period of adoption. The Company has premiums on debt securities that are currently being amortized to the maturity date, primarily in the state and local governments category. If the Company were to adopt these amendments as of January 1, 2018, the Company estimates that $21,219,000 of the premium associated with debt securities would be adjusted to retained earnings. The Company is still determining when it will adopt these amendments and accounting policies and procedures will be modified upon adoption of the standard.
Goodwill and Other Intangibles. In January 2017, FASB amended ASC Topic 350 to simplify the measurement of goodwill by eliminating Step 2 from the goodwill impairment test. Instead, under these amendments, an entity should perform its annual, or interim, goodwill impairment test by comparing the fair value of a reporting unit with its carrying amount. An entity should recognize an impairment charge for the amount by which the carrying amount exceeds the reporting unit’s fair value; however, the loss should not exceed the total amount of goodwill allocated to that reporting unit. The amendments are effective for public business entities for the first interim and annual reporting periods beginning after December 15, 2019. Early adoption is permitted for interim or annual goodwill impairment tests performed on testing dates after January 1, 2017. The Company has goodwill from prior business combinations and performs an annual impairment test or more frequently if changes or circumstances occur that would more-likely-than-not reduce the fair value of the reporting unit below its carrying value. During the third quarter of 2017, the Company performed its impairment assessment and determined the fair value of the aggregated reporting units exceed the carrying value, such that the Company’s goodwill was not considered impaired. Although the Company cannot anticipate future goodwill impairment assessments, based on the most recent assessment, it is unlikely that an impairment amount would need to be calculated and, therefore, the Company does not anticipate a material impact from these amendments to the Company’s financial position and results of operations. The current accounting policies and processes are not anticipated to change, except for the elimination of the Step 2 analysis. For additional information regarding goodwill impairment testing, see Note 5.
Financial Instruments. In June 2016, FASB amended ASC Topic 326 to replace the incurred loss model with a methodology that reflects expected credit losses over the life of the loan and requires consideration of a broader range of reasonable and supportable information to calculate credit loss estimates. The amendments are effective for public business entities for the first interim and annual reporting periods beginning after December 15, 2019. The Company is currently evaluating the impact of these amendments to the Company’s financial position and results of operations and currently does not know or cannot reasonably quantify the impact of the adoption of the amendments as a result of the complexity and extensive changes from the amendments. The ALLL is a material estimate of the Company and given the change from an incurred loss model to a methodology that considers the credit loss over the life of the loan, there is the potential for an increase in the ALLL at adoption date. The Company is anticipating a significant change in the processes and procedures to calculate the ALLL, including changes in assumptions and estimates to consider expected credit losses over the life of the loan versus the current accounting practice that utilizes the incurred loss model. The Company will also develop new procedures for determining an allowance for credit losses relating to held-to-maturity investment securities. In addition, the current accounting policy and procedures for other-than-temporary impairment on available-for-sale investment securities will be replaced with an allowance approach. The Company has formed a project team and is actively reviewing the standard for developing and implementing processes and procedures during the next two years to ensure it is fully compliant with the amendments at adoption date. For additional information on the ALLL, see Note 3.
81
Note 1. Nature of Operations and Summary of Significant Accounting Policies (continued)
Leases. In February 2016, FASB amended ASC Topic 842 to address several aspects of lease accounting with the significant change being the recognition of lease assets and lease liabilities for leases previously classified as operating leases. The amendments are effective for public business entities for the first interim and annual reporting periods beginning after December 15, 2018, and early adoption is permitted. The Company has several lease agreements for which the amendments will require the Company to recognize a lease liability to make lease payments and a right-of-use asset which will represent its right to use the underlying asset for the lease term. The Company is currently reviewing the amendments to ensure it is fully compliant by the adoption date and doesn’t expect to early adopt. As permitted by the amendments, the Company is anticipating electing an accounting policy to not recognize lease assets and lease liabilities for leases with a term of twelve months or less. The impact is not expected to have a material effect on the Company’s financial position or results of operations since the Company does not have a material amount of lease agreements. The Company is currently in the process of fully evaluating the amendments and will subsequently implement new processes, which are not expected to significantly change, since the Company already has processes for certain lease agreements that recognize the lease assets and lease liabilities. In addition, the Company will change its current accounting policies to comply with the amendments with such changes as mentioned above. For additional information on the Company’s leases, see Note 4.
Financial Instruments. In January 2016, FASB amended ASC Topic 825 to address certain aspects of recognition, measurement, presentation, and disclosure of financial instruments. The amendments are effective for public business entities for the first interim and annual reporting periods beginning after December 15, 2017. Early adoption is only permitted under certain circumstances outlined in the amendments. A reporting entity should apply the amendments by means of a cumulative-effect adjustment to the Company’s statements of financial condition as of the beginning of the reporting year of adoption. The amendments will impact the Company in a few areas including requiring equity investments (with certain exclusions) to be measured at fair value with the changes recognized in net income, requirement to utilize an exit price when measuring the fair value of financial instruments, additional disclosures related to OCI, evaluation of a valuation allowance on a deferred tax asset related to available-for-sale investment securities in combination with the entity’s other deferred tax assets, and other disclosure changes. The Company is currently evaluating the impact of these amendments, but does not expect them to have a material effect on the Company’s equity securities, financial position or results of operations. However, the amendments will have an impact on certain items that are disclosed at fair value that are not currently utilizing the exit price notion when measuring fair value. As of December 31, 2017, the Company cannot quantify the change in the fair value of such disclosures since the Company is currently finalizing the full impact of the Update. The Company has developed processes to comply with the disclosure requirements of such amendments and accounting policies and procedures will be updated and implemented upon adoption of the standard. For additional information on fair value of assets and liabilities, see Note 20.
Revenue Recognition. In May 2014, FASB amended ASC Topic 606 to clarify the principles for recognizing revenue and develop a common revenue standard among industries. The new guidance establishes the following core principle: recognize revenue to depict the transfer of promised goods or services to customers in an amount that reflects the consideration to which the entity expects to be entitled in exchange for goods or services. Five steps are provided for a company or organization to follow to achieve such core principle. The new guidance also includes a cohesive set of disclosure requirements that will provide users of financial statements with comprehensive information about the nature, amount, timing, and uncertainty of revenue and cash flows arising from contracts with customers. The entity should apply the amendments using one of two retrospective methods described in the amendment. Accounting Standards Update No. 2015-14, Revenue from Contracts with Customers (Topic 606) delayed the effective date for public entities to annual reporting periods beginning after December 15, 2017, including interim reporting periods within that reporting period. Several subsequent amendments have been issued that provide clarifying guidance and are effective with the adoption of the original Update. The Company has finalized its assessment of the Update and has identified the revenue line items within the scope of the new guidance. The majority of the Company’s revenue sources, such as interest income from investment securities and loans, fee income from loans and gain on sale of loans, are not within the scope of Topic 606. Conversely, the Company has evaluated the revenue sources determined to be in scope of Topic 606, including service charges and fee income on deposits and gain or loss on sale of OREO. The Company has determined the adoption of this guidance will not have a significant impact to the Company’s financial position or results of operations; however, beginning January 2018, updated policies and procedures on the sale of OREO will be implemented and additional quantitative and qualitative disclosures about the Company’s revenue may need to be incorporated into the notes to the financial statements.
82
Note 2. Investment Securities
The following tables present the amortized cost, the gross unrealized gains and losses and the fair value of the Company’s investment securities:
December 31, 2017 | ||||||||||||
Amortized Cost | Gross Unrealized | Fair Value | ||||||||||
(Dollars in thousands) | Gains | Losses | ||||||||||
Available-for-sale | ||||||||||||
U.S. government and federal agency | $ | 31,216 | 54 | (143 | ) | 31,127 | ||||||
U.S. government sponsored enterprises | 19,195 | — | (104 | ) | 19,091 | |||||||
State and local governments | 614,366 | 20,299 | (5,164 | ) | 629,501 | |||||||
Corporate bonds | 216,443 | 802 | (483 | ) | 216,762 | |||||||
Residential mortgage-backed securities | 785,960 | 1,253 | (7,930 | ) | 779,283 | |||||||
Commercial mortgage-backed securities | 104,324 | 25 | (1,870 | ) | 102,479 | |||||||
Total available-for-sale | 1,771,504 | 22,433 | (15,694 | ) | 1,778,243 | |||||||
Held-to-maturity | ||||||||||||
State and local governments | 648,313 | 20,346 | (8,573 | ) | 660,086 | |||||||
Total held-to-maturity | 648,313 | 20,346 | (8,573 | ) | 660,086 | |||||||
Total investment securities | $ | 2,419,817 | 42,779 | (24,267 | ) | 2,438,329 | ||||||
December 31, 2016 | ||||||||||||
Amortized Cost | Gross Unrealized | Fair Value | ||||||||||
(Dollars in thousands) | Gains | Losses | ||||||||||
Available-for-sale | ||||||||||||
U.S. government and federal agency | $ | 39,554 | 15 | (162 | ) | 39,407 | ||||||
U.S. government sponsored enterprises | 19,557 | 55 | (42 | ) | 19,570 | |||||||
State and local governments | 775,395 | 20,941 | (9,963 | ) | 786,373 | |||||||
Corporate bonds | 471,569 | 1,175 | (793 | ) | 471,951 | |||||||
Residential mortgage-backed securities | 1,014,518 | 2,744 | (9,747 | ) | 1,007,515 | |||||||
Commercial mortgage-backed securities | 102,209 | 30 | (1,578 | ) | 100,661 | |||||||
Total available-for-sale | 2,422,802 | 24,960 | (22,285 | ) | 2,425,477 | |||||||
Held-to-maturity | ||||||||||||
State and local governments | 675,674 | 21,400 | (7,985 | ) | 689,089 | |||||||
Total held-to-maturity | 675,674 | 21,400 | (7,985 | ) | 689,089 | |||||||
Total investment securities | $ | 3,098,476 | 46,360 | (30,270 | ) | 3,114,566 | ||||||
83
Note 2. Investment Securities (continued)
The following table presents the amortized cost and fair value of available-for-sale and held-to-maturity securities by contractual maturity at December 31, 2017. Actual maturities may differ from expected or contractual maturities since issuers have the right to prepay obligations with or without prepayment penalties.
December 31, 2017 | ||||||||||||
Available-for-Sale | Held-to-Maturity | |||||||||||
(Dollars in thousands) | Amortized Cost | Fair Value | Amortized Cost | Fair Value | ||||||||
Due within one year | $ | 69,596 | 69,650 | — | — | |||||||
Due after one year through five years | 228,415 | 228,881 | 2,108 | 2,136 | ||||||||
Due after five years through ten years | 228,766 | 236,318 | 86,741 | 88,264 | ||||||||
Due after ten years | 354,443 | 361,632 | 559,464 | 569,686 | ||||||||
881,220 | 896,481 | 648,313 | 660,086 | |||||||||
Mortgage-backed securities 1 | 890,284 | 881,762 | — | — | ||||||||
Total | $ | 1,771,504 | 1,778,243 | 648,313 | 660,086 | |||||||
______________________________
1 Mortgage-backed securities, which have prepayment provisions, are not assigned to maturity categories due to fluctuations in their prepayment speeds.
Proceeds from sales and calls of investment securities and the associated gains and losses that have been included in earnings are listed below:
Years ended | |||||||||
(Dollars in thousands) | December 31, 2017 | December 31, 2016 | December 31, 2015 | ||||||
Available-for-sale | |||||||||
Proceeds from sales and calls of investment securities | $ | 280,783 | 212,140 | 167,660 | |||||
Gross realized gains 1 | 3,369 | 2,459 | 1,877 | ||||||
Gross realized losses 1 | (4,005 | ) | (3,794 | ) | (1,808 | ) | |||
Held-to-maturity | |||||||||
Proceeds from calls of investment securities | 23,020 | 25,405 | 20,997 | ||||||
Gross realized gains 1 | 204 | 97 | 50 | ||||||
Gross realized losses 1 | (228 | ) | (225 | ) | (100 | ) | |||
______________________________
1 The gain or loss on the sale or call of each investment security is determined by the specific identification method.
At December 31, 2017 and 2016, the Company had investment securities with carrying values of $1,447,808,000 and $1,878,739,000, respectively, pledged as collateral for FHLB advances, FRB discount window borrowings, securities sold under agreements to repurchase (“repurchase agreements”), interest rate swap agreements and deposits of several local government units.
84
Note 2. Investment Securities (continued)
Investment securities with an unrealized loss position are summarized as follows:
December 31, 2017 | ||||||||||||||||||
Less than 12 Months | 12 Months or More | Total | ||||||||||||||||
(Dollars in thousands) | Fair Value | Unrealized Loss | Fair Value | Unrealized Loss | Fair Value | Unrealized Loss | ||||||||||||
Available-for-sale | ||||||||||||||||||
U.S. government and federal agency | $ | 1,208 | (5 | ) | 13,179 | (138 | ) | 14,387 | (143 | ) | ||||||||
U.S. government sponsored enterprises | 14,926 | (56 | ) | 3,425 | (48 | ) | 18,351 | (104 | ) | |||||||||
State and local governments | 61,126 | (689 | ) | 121,181 | (4,475 | ) | 182,307 | (5,164 | ) | |||||||||
Corporate bonds | 99,636 | (264 | ) | 29,034 | (219 | ) | 128,670 | (483 | ) | |||||||||
Residential mortgage-backed securities | 372,175 | (3,050 | ) | 254,721 | (4,880 | ) | 626,896 | (7,930 | ) | |||||||||
Commercial mortgage-backed securities | 37,650 | (469 | ) | 62,968 | (1,401 | ) | 100,618 | (1,870 | ) | |||||||||
Total available-for-sale | $ | 586,721 | (4,533 | ) | 484,508 | (11,161 | ) | 1,071,229 | (15,694 | ) | ||||||||
Held-to-maturity | ||||||||||||||||||
State and local governments | $ | 21,207 | (186 | ) | 105,486 | (8,387 | ) | 126,693 | (8,573 | ) | ||||||||
Total held-to-maturity | $ | 21,207 | (186 | ) | 105,486 | (8,387 | ) | 126,693 | (8,573 | ) | ||||||||
December 31, 2016 | ||||||||||||||||||
Less than 12 Months | 12 Months or More | Total | ||||||||||||||||
(Dollars in thousands) | Fair Value | Unrealized Loss | Fair Value | Unrealized Loss | Fair Value | Unrealized Loss | ||||||||||||
Available-for-sale | ||||||||||||||||||
U.S. government and federal agency | $ | 6,718 | (24 | ) | 26,239 | (138 | ) | 32,957 | (162 | ) | ||||||||
U.S. government sponsored enterprises | 6,049 | (42 | ) | — | — | 6,049 | (42 | ) | ||||||||||
State and local governments | 222,700 | (4,949 | ) | 81,783 | (5,014 | ) | 304,483 | (9,963 | ) | |||||||||
Corporate bonds | 174,821 | (774 | ) | 6,141 | (19 | ) | 180,962 | (793 | ) | |||||||||
Residential mortgage-backed securities | 688,811 | (9,079 | ) | 29,957 | (668 | ) | 718,768 | (9,747 | ) | |||||||||
Commercial mortgage-backed securities | 89,298 | (1,578 | ) | — | — | 89,298 | (1,578 | ) | ||||||||||
Total available-for-sale | $ | 1,188,397 | (16,446 | ) | 144,120 | (5,839 | ) | 1,332,517 | (22,285 | ) | ||||||||
Held-to-maturity | ||||||||||||||||||
State and local governments | $ | 117,912 | (1,712 | ) | 86,601 | (6,273 | ) | 204,513 | (7,985 | ) | ||||||||
Total held-to-maturity | $ | 117,912 | (1,712 | ) | 86,601 | (6,273 | ) | 204,513 | (7,985 | ) | ||||||||
Based on an analysis of its investment securities with unrealized losses as of December 31, 2017 and 2016, the Company determined that none of such securities had other-than-temporary impairment and the unrealized losses were primarily the result of interest rate changes and market spreads subsequent to acquisition. The fair value of the investment securities is expected to recover as payments are received and the securities approach maturity. At December 31, 2017, management determined that it did not intend to sell investment securities with unrealized losses, and there was no expected requirement to sell any of its investment securities with unrealized losses before recovery of their amortized cost.
85
Note 3. Loans Receivable, Net
The Company’s loan portfolio is comprised of three segments: residential real estate, commercial, and consumer and other loans. The loan segments are further disaggregated into the following classes: residential real estate, commercial real estate, other commercial, home equity and other consumer loans. The following table presents loans receivable for each portfolio class of loans:
At or for the Years ended | ||||||
(Dollars in thousands) | December 31, 2017 | December 31, 2016 | ||||
Residential real estate loans | $ | 720,728 | 674,347 | |||
Commercial loans | ||||||
Real estate | 3,577,139 | 2,990,141 | ||||
Other commercial | 1,579,353 | 1,342,250 | ||||
Total | 5,156,492 | 4,332,391 | ||||
Consumer and other loans | ||||||
Home equity | 457,918 | 434,774 | ||||
Other consumer | 242,686 | 242,951 | ||||
Total | 700,604 | 677,725 | ||||
Loans receivable | 6,577,824 | 5,684,463 | ||||
Allowance for loan and lease losses | (129,568 | ) | (129,572 | ) | ||
Loans receivable, net | $ | 6,448,256 | 5,554,891 | |||
Net deferred origination (fees) costs included in loans receivable | $ | (2,643 | ) | (1,228 | ) | |
Net purchase accounting (discounts) premiums included in loans receivable | $ | (16,325 | ) | (12,144 | ) | |
Weighted-average interest rate on loans (tax-equivalent) | 4.81 | % | 4.77 | % | ||
The following tables summarize the activity in the ALLL by portfolio segment:
Year ended December 31, 2017 | ||||||||||||||||||
(Dollars in thousands) | Total | Residential Real Estate | Commercial Real Estate | Other Commercial | Home Equity | Other Consumer | ||||||||||||
Balance at beginning of period | $ | 129,572 | 12,436 | 65,773 | 37,823 | 7,572 | 5,968 | |||||||||||
Provision for loan losses | 10,824 | (1,521 | ) | 7,152 | 2,545 | (1,103 | ) | 3,751 | ||||||||||
Charge-offs | (19,331 | ) | (199 | ) | (6,188 | ) | (2,856 | ) | (489 | ) | (9,599 | ) | ||||||
Recoveries | 8,503 | 82 | 1,778 | 1,791 | 224 | 4,628 | ||||||||||||
Balance at end of period | $ | 129,568 | 10,798 | 68,515 | 39,303 | 6,204 | 4,748 | |||||||||||
Year ended December 31, 2016 | ||||||||||||||||||
(Dollars in thousands) | Total | Residential Real Estate | Commercial Real Estate | Other Commercial | Home Equity | Other Consumer | ||||||||||||
Balance at beginning of period | $ | 129,697 | 14,427 | 67,877 | 32,525 | 8,998 | 5,870 | |||||||||||
Provision for loan losses | 2,333 | (1,734 | ) | (2,686 | ) | 5,164 | (520 | ) | 2,109 | |||||||||
Charge-offs | (11,496 | ) | (464 | ) | (3,082 | ) | (1,778 | ) | (1,185 | ) | (4,987 | ) | ||||||
Recoveries | 9,038 | 207 | 3,664 | 1,912 | 279 | 2,976 | ||||||||||||
Balance at end of period | $ | 129,572 | 12,436 | 65,773 | 37,823 | 7,572 | 5,968 | |||||||||||
86
Note 3. Loans Receivable, Net (continued)
Year ended December 31, 2015 | ||||||||||||||||||
(Dollars in thousands) | Total | Residential Real Estate | Commercial Real Estate | Other Commercial | Home Equity | Other Consumer | ||||||||||||
Balance at beginning of period | $ | 129,753 | 14,680 | 67,799 | 30,891 | 9,963 | 6,420 | |||||||||||
Provision for loan losses | 2,284 | 640 | (696 | ) | 3,030 | (480 | ) | (210 | ) | |||||||||
Charge-offs | (7,002 | ) | (985 | ) | (1,920 | ) | (2,322 | ) | (809 | ) | (966 | ) | ||||||
Recoveries | 4,662 | 92 | 2,694 | 926 | 324 | 626 | ||||||||||||
Balance at end of period | $ | 129,697 | 14,427 | 67,877 | 32,525 | 8,998 | 5,870 | |||||||||||
The following tables disclose the recorded investment in loans and the balance in the ALLL by portfolio segment:
December 31, 2017 | ||||||||||||||||||
(Dollars in thousands) | Total | Residential Real Estate | Commercial Real Estate | Other Commercial | Home Equity | Other Consumer | ||||||||||||
Loans receivable | ||||||||||||||||||
Individually evaluated for impairment | $ | 119,994 | 12,399 | 77,536 | 23,032 | 3,755 | 3,272 | |||||||||||
Collectively evaluated for impairment | 6,457,830 | 708,329 | 3,499,603 | 1,556,321 | 454,163 | 239,414 | ||||||||||||
Total loans receivable | $ | 6,577,824 | 720,728 | 3,577,139 | 1,579,353 | 457,918 | 242,686 | |||||||||||
ALLL | ||||||||||||||||||
Individually evaluated for impairment | $ | 5,223 | 246 | 500 | 3,851 | 56 | 570 | |||||||||||
Collectively evaluated for impairment | 124,345 | 10,552 | 68,015 | 35,452 | 6,148 | 4,178 | ||||||||||||
Total ALLL | $ | 129,568 | 10,798 | 68,515 | 39,303 | 6,204 | 4,748 | |||||||||||
December 31, 2016 | ||||||||||||||||||
(Dollars in thousands) | Total | Residential Real Estate | Commercial Real Estate | Other Commercial | Home Equity | Other Consumer | ||||||||||||
Loans receivable | ||||||||||||||||||
Individually evaluated for impairment | $ | 130,263 | 11,612 | 85,634 | 23,950 | 5,934 | 3,133 | |||||||||||
Collectively evaluated for impairment | 5,554,200 | 662,735 | 2,904,507 | 1,318,300 | 428,840 | 239,818 | ||||||||||||
Total loans receivable | $ | 5,684,463 | 674,347 | 2,990,141 | 1,342,250 | 434,774 | 242,951 | |||||||||||
ALLL | ||||||||||||||||||
Individually evaluated for impairment | $ | 6,881 | 856 | 922 | 4,419 | 296 | 388 | |||||||||||
Collectively evaluated for impairment | 122,691 | 11,580 | 64,851 | 33,404 | 7,276 | 5,580 | ||||||||||||
Total ALLL | $ | 129,572 | 12,436 | 65,773 | 37,823 | 7,572 | 5,968 | |||||||||||
Substantially all of the Company’s loans receivable are with customers in the Company’s geographic market areas. Although the Company has a diversified loan portfolio, a substantial portion of its customers’ ability to honor their obligations is dependent upon the economic performance in the Company’s market areas. The Company is subject to regulatory limits for the amount of loans to any individual borrower and the Company is in compliance with this regulation as of December 31, 2017 and 2016. No borrower had outstanding loans or commitments exceeding 10 percent of the Company’s consolidated stockholders’ equity as of December 31, 2017.
At December 31, 2017, the Company had $4,189,489,000 in variable rate loans and $2,388,335,000 in fixed rate loans. At December 31, 2017, the Company had loans of $3,836,190,000 pledged as collateral for FHLB advances and FRB discount window. There were no significant purchases or sales of portfolio loans during 2017, 2016 and 2015.
87
Note 3. Loans Receivable, Net (continued)
The Company has entered into transactions with its executive officers and directors and their affiliates. The aggregate amount of loans outstanding to such related parties at December 31, 2017 and 2016 was $82,350,000 and $58,438,000, respectively. During 2017, new loans to such related parties were $33,322,000 and repayments were $9,410,000. In management’s opinion, such loans were made in the ordinary course of business and were made on substantially the same terms as those prevailing at the time for comparable transaction with other persons.
The following tables disclose information related to impaired loans by portfolio segment:
At or for the Year ended December 31, 2017 | ||||||||||||||||||
(Dollars in thousands) | Total | Residential Real Estate | Commercial Real Estate | Other Commercial | Home Equity | Other Consumer | ||||||||||||
Loans with a specific valuation allowance | ||||||||||||||||||
Recorded balance | $ | 17,689 | 2,978 | 4,545 | 8,183 | 186 | 1,797 | |||||||||||
Unpaid principal balance | 18,400 | 3,046 | 4,573 | 8,378 | 199 | 2,204 | ||||||||||||
Specific valuation allowance | 5,223 | 246 | 500 | 3,851 | 56 | 570 | ||||||||||||
Average balance | 18,986 | 2,928 | 5,851 | 8,477 | 359 | 1,371 | ||||||||||||
Loans without a specific valuation allowance | ||||||||||||||||||
Recorded balance | 102,305 | 9,421 | 72,991 | 14,849 | 3,569 | 1,475 | ||||||||||||
Unpaid principal balance | 122,833 | 10,380 | 89,839 | 16,931 | 4,098 | 1,585 | ||||||||||||
Average balance | 107,945 | 9,834 | 76,427 | 15,129 | 4,734 | 1,821 | ||||||||||||
Total | ||||||||||||||||||
Recorded balance | 119,994 | 12,399 | 77,536 | 23,032 | 3,755 | 3,272 | ||||||||||||
Unpaid principal balance | 141,233 | 13,426 | 94,412 | 25,309 | 4,297 | 3,789 | ||||||||||||
Specific valuation allowance | 5,223 | 246 | 500 | 3,851 | 56 | 570 | ||||||||||||
Average balance | 126,931 | 12,762 | 82,278 | 23,606 | 5,093 | 3,192 | ||||||||||||
At or for the Year ended December 31, 2016 | ||||||||||||||||||
(Dollars in thousands) | Total | Residential Real Estate | Commercial Real Estate | Other Commercial | Home Equity | Other Consumer | ||||||||||||
Loans with a specific valuation allowance | ||||||||||||||||||
Recorded balance | $ | 22,128 | 2,759 | 9,129 | 8,814 | 334 | 1,092 | |||||||||||
Unpaid principal balance | 22,374 | 2,825 | 9,130 | 8,929 | 345 | 1,145 | ||||||||||||
Specific valuation allowance | 6,881 | 856 | 922 | 4,419 | 296 | 388 | ||||||||||||
Average balance | 26,745 | 4,942 | 10,441 | 9,840 | 257 | 1,265 | ||||||||||||
Loans without a specific valuation allowance | ||||||||||||||||||
Recorded balance | 108,135 | 8,853 | 76,505 | 15,136 | 5,600 | 2,041 | ||||||||||||
Unpaid principal balance | 131,059 | 9,925 | 94,180 | 17,724 | 7,120 | 2,110 | ||||||||||||
Average balance | 108,827 | 12,858 | 72,323 | 15,537 | 6,004 | 2,105 | ||||||||||||
Total | ||||||||||||||||||
Recorded balance | 130,263 | 11,612 | 85,634 | 23,950 | 5,934 | 3,133 | ||||||||||||
Unpaid principal balance | 153,433 | 12,750 | 103,310 | 26,653 | 7,465 | 3,255 | ||||||||||||
Specific valuation allowance | 6,881 | 856 | 922 | 4,419 | 296 | 388 | ||||||||||||
Average balance | 135,572 | 17,800 | 82,764 | 25,377 | 6,261 | 3,370 | ||||||||||||
Interest income recognized on impaired loans for the years ended December 31, 2017, 2016, and 2015 was not significant.
88
Note 3. Loans Receivable, Net (continued)
The following tables present an aging analysis of the recorded investment in loans by portfolio segment:
December 31, 2017 | ||||||||||||||||||
(Dollars in thousands) | Total | Residential Real Estate | Commercial Real Estate | Other Commercial | Home Equity | Other Consumer | ||||||||||||
Accruing loans 30-59 days past due | $ | 26,375 | 6,252 | 12,546 | 3,634 | 2,142 | 1,801 | |||||||||||
Accruing loans 60-89 days past due | 11,312 | 794 | 5,367 | 3,502 | 987 | 662 | ||||||||||||
Accruing loans 90 days or more past due | 6,077 | 2,366 | 609 | 2,973 | — | 129 | ||||||||||||
Non-accrual loans | 44,833 | 4,924 | 27,331 | 8,298 | 3,338 | 942 | ||||||||||||
Total past due and non-accrual loans | 88,597 | 14,336 | 45,853 | 18,407 | 6,467 | 3,534 | ||||||||||||
Current loans receivable | 6,489,227 | 706,392 | 3,531,286 | 1,560,946 | 451,451 | 239,152 | ||||||||||||
Total loans receivable | $ | 6,577,824 | 720,728 | 3,577,139 | 1,579,353 | 457,918 | 242,686 | |||||||||||
December 31, 2016 | ||||||||||||||||||
(Dollars in thousands) | Total | Residential Real Estate | Commercial Real Estate | Other Commercial | Home Equity | Other Consumer | ||||||||||||
Accruing loans 30-59 days past due | $ | 20,599 | 6,338 | 5,079 | 5,388 | 2,439 | 1,355 | |||||||||||
Accruing loans 60-89 days past due | 5,018 | 1,398 | 754 | 1,352 | 844 | 670 | ||||||||||||
Accruing loans 90 days or more past due | 1,099 | 266 | 145 | 283 | 191 | 214 | ||||||||||||
Non-accrual loans | 49,332 | 4,528 | 30,216 | 8,817 | 5,240 | 531 | ||||||||||||
Total past due and non-accrual loans | 76,048 | 12,530 | 36,194 | 15,840 | 8,714 | 2,770 | ||||||||||||
Current loans receivable | 5,608,415 | 661,817 | 2,953,947 | 1,326,410 | 426,060 | 240,181 | ||||||||||||
Total loans receivable | $ | 5,684,463 | 674,347 | 2,990,141 | 1,342,250 | 434,774 | 242,951 | |||||||||||
Interest income that would have been recorded on non-accrual loans if such loans had been current for the entire period would have been approximately $2,162,000, $2,364,000, and $2,471,000 for the years ended December 31, 2017, 2016, and 2015, respectively.
The following tables present TDRs that occurred during the periods presented and the TDRs that occurred within the previous twelve months that subsequently defaulted during the periods presented:
Year ended December 31, 2017 | ||||||||||||||||||
(Dollars in thousands) | Total | Residential Real Estate | Commercial Real Estate | Other Commercial | Home Equity | Other Consumer | ||||||||||||
TDRs that occurred during the period | ||||||||||||||||||
Number of loans | 32 | 5 | 13 | 11 | 2 | 1 | ||||||||||||
Pre-modification recorded balance | $ | 41,521 | 841 | 31,109 | 9,403 | 158 | 10 | |||||||||||
Post-modification recorded balance | $ | 38,838 | 841 | 28,426 | 9,403 | 158 | 10 | |||||||||||
TDRs that subsequently defaulted | ||||||||||||||||||
Number of loans | 1 | — | — | 1 | — | — | ||||||||||||
Recorded balance | $ | 18 | — | — | 18 | — | — | |||||||||||
89
Note 3. Loans Receivable, Net (continued)
Year ended December 31, 2016 | ||||||||||||||||||
(Dollars in thousands) | Total | Residential Real Estate | Commercial Real Estate | Other Commercial | Home Equity | Other Consumer | ||||||||||||
TDRs that occurred during the period | ||||||||||||||||||
Number of loans | 34 | — | 10 | 21 | 3 | — | ||||||||||||
Pre-modification recorded balance | $ | 22,907 | — | 8,454 | 14,183 | 270 | — | |||||||||||
Post-modification recorded balance | $ | 22,848 | — | 8,415 | 14,166 | 267 | — | |||||||||||
TDRs that subsequently defaulted | ||||||||||||||||||
Number of loans | 1 | — | — | 1 | — | — | ||||||||||||
Recorded balance | $ | 6 | — | — | 6 | — | — | |||||||||||
Year ended December 31, 2015 | ||||||||||||||||||
(Dollars in thousands) | Total | Residential Real Estate | Commercial Real Estate | Other Commercial | Home Equity | Other Consumer | ||||||||||||
TDRs that occurred during the period | ||||||||||||||||||
Number of loans | 64 | 3 | 25 | 22 | 1 | 13 | ||||||||||||
Pre-modification recorded balance | $ | 22,316 | 2,259 | 8,877 | 10,545 | 137 | 498 | |||||||||||
Post-modification recorded balance | $ | 23,110 | 2,203 | 9,927 | 10,325 | 157 | 498 | |||||||||||
TDRs that subsequently defaulted | ||||||||||||||||||
Number of loans | 7 | 1 | 1 | 4 | — | 1 | ||||||||||||
Recorded balance | $ | 2,556 | 1,947 | 78 | 529 | — | 2 | |||||||||||
The modifications for the TDRs that occurred during the years ended December 31, 2017, 2016 and 2015 included one or a combination of the following: an extension of the maturity date, a reduction of the interest rate or a reduction in the principal amount.
In addition to the TDRs that occurred during the period provided in the preceding tables, the Company had TDRs with pre-modification loan balances of $5,987,000, $5,331,000 and $8,893,000 for the years ended December 31, 2017, 2016 and 2015, respectively, for which OREO was received in full or partial satisfaction of the loans. The majority of such TDRs were in commercial real estate for the years ended December 31, 2017 and 2015 and in residential real estate for the year ended December 31, 2016. At December 31, 2017 and 2016, the Company had $743,000 and $1,770,000, respectively, of consumer mortgage loans secured by residential real estate properties for which formal foreclosure proceedings are in process. At December 31, 2017 and 2016, the Company had $893,000 and $2,699,000, respectively, of OREO secured by residential real estate properties.
There were $1,960,000 and $4,785,000 of additional unfunded commitments on TDRs outstanding at December 31, 2017 and 2016, respectively. The amount of charge-offs on TDRs during 2017, 2016 and 2015 was $2,984,000, $557,000 and $1,310,000, respectively.
90
Note 4. Premises and Equipment
Premises and equipment, net of accumulated depreciation, consist of the following:
(Dollars in thousands) | December 31, 2017 | December 31, 2016 | ||||
Land | $ | 31,370 | 29,648 | |||
Office buildings and construction in progress | 182,592 | 173,886 | ||||
Furniture, fixtures and equipment | 83,177 | 84,559 | ||||
Leasehold improvements | 8,085 | 7,853 | ||||
Accumulated depreciation | (127,876 | ) | (119,748 | ) | ||
Net premises and equipment | $ | 177,348 | 176,198 | |||
Depreciation expense for the years ended December 31, 2017, 2016, and 2015 was $14,758,000, $15,294,000, and $14,365,000, respectively.
The Company leases certain land, premises and equipment from third parties under operating and capital leases. Total rent expense for the years ended December 31, 2017, 2016, and 2015 was $3,629,000, $3,255,000, and $3,137,000, respectively. Amortization of building capital lease assets is included in depreciation. The Company has entered into lease transactions with related parties. Rent expense with such related parties for the years ended December 31, 2017, 2016, and 2015 was $164,000, $153,000, and $150,000, respectively.
The total future minimum rental commitments required under operating and capital leases that have initial or remaining noncancelable lease terms in excess of one year at December 31, 2017 are as follows:
(Dollars in thousands) | Capital Leases | Operating Leases | Total | ||||||
Years ending December 31, | |||||||||
2018 | $ | 92 | 2,633 | 2,725 | |||||
2019 | 92 | 2,502 | 2,594 | ||||||
2020 | 92 | 2,039 | 2,131 | ||||||
2021 | 11 | 1,593 | 1,604 | ||||||
2022 | — | 953 | 953 | ||||||
Thereafter | — | 5,541 | 5,541 | ||||||
Total minimum lease payments | 287 | 15,261 | 15,548 | ||||||
Less: Amount representing interest | 27 | ||||||||
Present value of minimum lease payments | 260 | ||||||||
Less: Current portion of obligations under capital leases | 79 | ||||||||
Long-term portion of obligations under capital leases | $ | 181 | |||||||
91
Note 5. Other Intangible Assets and Goodwill
The following table sets forth information regarding the Company’s core deposit intangibles:
At or for the Years ended | |||||||||
(Dollars in thousands) | December 31, 2017 | December 31, 2016 | December 31, 2015 | ||||||
Gross carrying value | $ | 21,649 | 21,943 | 38,527 | |||||
Accumulated amortization | (7,465 | ) | (9,596 | ) | (23,972 | ) | |||
Net carrying value | $ | 14,184 | 12,347 | 14,555 | |||||
Aggregate amortization expense | $ | 2,494 | 2,970 | 2,964 | |||||
Estimated amortization expense for the years ending December 31, | |||||||||
2018 | $ | 2,209 | |||||||
2019 | 2,100 | ||||||||
2020 | 2,027 | ||||||||
2021 | 1,952 | ||||||||
2022 | 1,871 | ||||||||
Core deposit intangibles increased $4,331,000, $762,000 and $6,619,000 during 2017, 2016 and 2015, respectively, due to acquisitions. For additional information relating to acquisitions, see Note 22.
The following schedule discloses the changes in the carrying value of goodwill:
Years ended | |||||||||
(Dollars in thousands) | December 31, 2017 | December 31, 2016 | December 31, 2015 | ||||||
Net carrying value at beginning of period | $ | 147,053 | 140,638 | 129,706 | |||||
Acquisitions and adjustments | 30,758 | 6,415 | 10,932 | ||||||
Net carrying value at end of period | $ | 177,811 | 147,053 | 140,638 | |||||
The Company’s first step in evaluating goodwill for possible impairment is a control premium analysis. The analysis first calculates the market capitalization and then adjusts such value for a control premium range which results in an implied fair value. The control premium range is determined based on historical control premiums for acquisitions that are comparable to the Company and is obtained from an independent third party. The calculated implied fair value is then compared to the book value to determine whether the Company needs to proceed to step two of the goodwill impairment assessment. The Company performed its annual goodwill impairment test during the third quarter of 2017 and determined the fair value of the aggregated reporting units exceeded the carrying value, such that the Company’s goodwill was not considered impaired. In recognition there were no events or circumstances that occurred during the fourth quarter of 2017 that would more-likely-than-not reduce the fair value of a reporting unit below its carrying value, the Company did not perform interim testing at December 31, 2017. Changes in the economic environment, operations of the aggregated reporting units, or other factors could result in the decline in the fair value of the aggregated reporting units which could result in a goodwill impairment in the future. Accumulated impairment charges were $40,159,000 as of December 31, 2017 and 2016.
92
Note 6. Variable Interest Entities
A VIE is a partnership, limited liability company, trust or other legal entity that meets one of the following criteria: 1) the entity’s equity investment at risk is not sufficient to permit the entity to finance its activities without additional subordinated financial support from other parties; 2) the holders of the equity investment at risk, as a group, lack the characteristics of a controlling financial interest; and 3) the voting rights of some holders of the equity investment at risk are disproportionate to their obligation to absorb losses or receive returns, and substantially all of the activities are conducted on behalf of the holder of equity investment at risk with disproportionately few voting rights. A VIE must be consolidated by the Company if it is deemed to be the primary beneficiary, which is the party involved with the VIE that has both: 1) the power to direct the activities of the VIE that most significantly affect the VIE’s economic performance; and 2) the obligation to absorb the losses of the VIE that could potentially be significant to the VIE or the right to receive benefits from the VIE that could potentially be significant to the VIE.
The Company’s VIEs are regularly monitored to determine if any reconsideration events have occurred that could cause the primary beneficiary status to change. A previously unconsolidated VIE is consolidated when the Company becomes the primary beneficiary. A previously consolidated VIE is deconsolidated when the Company ceases to be the primary beneficiary or the entity is no longer a VIE.
Consolidated Variable Interest Entities
The Company has equity investments in Certified Development Entities (“CDE”) which have received allocations of New Markets Tax Credits (“NMTC”). The NMTC program provides federal tax incentives to investors to make investments in distressed communities and promotes economic improvements through the development of successful businesses in these communities. The NMTC is available to investors over a seven-year period and is subject to recapture if certain events occur during such period. The maximum exposure to loss in the CDEs is the amount of equity invested and credit extended by the Company. However, the Company has credit protection in the form of indemnification agreements, guarantees, and collateral arrangements. The Company has evaluated the variable interests held by the Company in each CDE (NMTC) investment and determined the Company does not individually meet the characteristics of a primary beneficiary; however, the related-party group does meet the criteria as a group and substantially all of the activities of the CDEs either involve or are conducted on behalf of the Company. As a result, the Company is the primary beneficiary of the CDEs and their assets, liabilities, and results of operations are included in the Company’s consolidated financial statements. The primary activities of the CDEs are recognized in commercial loans interest income and other borrowed funds interest expense on the Company’s statements of operations and the federal income tax credit allocations from the investments are recognized in the Company’s statements of operations as a component of income tax expense. Such related cash flows are recognized in loans originated, principal collected on loans and change in other borrowed funds.
The following table summarizes the carrying amounts of the consolidated VIEs’ assets and liabilities included in the Company’s statements of financial condition and are adjusted for intercompany eliminations. All assets presented can be used only to settle obligations of the consolidated VIEs and all liabilities presented consist of liabilities for which creditors and other beneficial interest holders therein have no recourse to the general credit of the Company.
(Dollars in thousands) | December 31, 2017 | December 31, 2016 | ||||
Assets | ||||||
Loans receivable | $ | 57,796 | 36,950 | |||
Accrued interest receivable | 94 | 120 | ||||
Other assets | 15,885 | 10,024 | ||||
Total assets | $ | 73,775 | 47,094 | |||
Liabilities | ||||||
Other borrowed funds | $ | 7,964 | 4,105 | |||
Accrued interest payable | 1 | 2 | ||||
Other liabilities | 98 | 27 | ||||
Total liabilities | $ | 8,063 | 4,134 | |||
93
Note 6. Variable Interest Entities (continued)
Unconsolidated Variable Interest Entities
The Company has equity investments in Low-Income Housing Tax Credit (“LIHTC”) partnerships with carrying values of $9,169,000 and $7,282,000 as of December 31, 2017 and 2016, respectively. The LIHTCs are indirect federal subsidies to finance low-income housing and are used in connection with both newly constructed and renovated residential rental buildings. Once a project is placed in service, it is generally eligible for the tax credit for ten consecutive years. To continue generating the tax credit and to avoid tax credit recapture, a LIHTC building must satisfy specific low-income housing compliance rules for a full fifteen-year period. The maximum exposure to loss in the VIEs is the amount of equity invested and credit extended by the Company. However, the Company has credit protection in the form of indemnification agreements, guarantees, and collateral arrangements. The Company has evaluated the variable interests held by the Company in each LIHTC investment and determined that the Company does not have controlling financial interests in such investments, and is not the primary beneficiary. The Company reports the investments in the unconsolidated LIHTCs as other assets on the Company’s statements of financial condition. Total unfunded contingent commitments related to the Company’s LIHTC investments totaled $27,831,000 at December 31, 2017, and the Company expects to fulfill these commitments during 2018. There were no impairment losses on the Company’s LIHTC investments during the years ended December 31, 2017, 2016, and 2015.
The Company has elected to use the proportional amortization method, and more specifically the practical expedient method, for the amortization of all eligible LIHTC investments and amortization expense is recognized as a component of income tax expense. The following table summarizes the amortization expense and the amount of tax credits and other tax benefits recognized for qualified affordable housing project investments during the periods presented.
Years ended | |||||||||
(Dollars in thousands) | December 31, 2017 | December 31, 2016 | December 31, 2015 | ||||||
Amortization expense | $ | 2,507 | 1,125 | 974 | |||||
Tax credits and other tax benefits recognized | 3,827 | 1,515 | 1,552 | ||||||
The Company also owns the following trust subsidiaries, each of which issued trust preferred securities as Tier 1 capital instruments: Glacier Capital Trust II, Glacier Capital Trust III, Glacier Capital Trust IV, Citizens (ID) Statutory Trust I, Bank of the San Juans Bancorporation Trust I, First Company Statutory Trust 2001, and First Company Statutory Trust 2003. The trust subsidiaries have no assets, operations, revenues or cash flows other than those related to the issuance, administration and repayment of the securities held by third parties. The trust subsidiaries are not included in the Company’s consolidated financial statements because the sole asset of each trust subsidiary is a receivable from the Company, even though the Company owns all of the voting equity shares of the trust subsidiaries, has fully guaranteed the obligations of the trust subsidiaries and may have the right to redeem the third party securities under certain circumstances. The Company reports the trust preferred securities issued to the trust subsidiaries as subordinated debentures on the Company’s statements of financial condition. For additional information on the Company’s investments in trust subsidiaries, see Note 9.
94
Note 7. Deposits
Time deposits that meet or exceed the Federal Deposit Insurance Corporation Insurance (“FDIC”) limit of $250,000 at December 31, 2017 and 2016 were $193,962,000 and $254,611,000, respectively.
The scheduled maturities of time deposits are as follows:
(Dollars in thousands) | Amount | ||
Years ending December 31, | |||
2018 | $ | 557,693 | |
2019 | 120,657 | ||
2020 | 65,284 | ||
2021 | 45,409 | ||
2022 | 27,974 | ||
Thereafter | 242 | ||
$ | 817,259 | ||
The Company reclassified $4,402,000 and $3,618,000 of overdraft demand deposits to loans as of December 31, 2017 and 2016, respectively. The Company has entered into deposit transactions with its executive officers, directors and their affiliates. The aggregate amount of deposits with such related parties at December 31, 2017 and 2016 was $25,641,000 and $27,977,000, respectively.
Note 8. Borrowings
The Company’s repurchase agreements totaled $362,573,000 and $473,650,000 at December 31, 2017 and 2016, respectively, and are secured by investment securities with carrying values of $475,601,000 and $472,239,000, respectively. Securities are pledged to customers at the time of the transaction in an amount at least equal to the outstanding balance and are held in custody accounts by third parties. The fair value of collateral is continually monitored and additional collateral is provided as deemed appropriate. The following tables summarize the carrying value of the Company’s repurchase agreements by remaining contractual maturity and category of collateral:
December 31, 2017 | |||||||||
Remaining Contractual Maturity of the Agreements | |||||||||
(Dollars in thousands) | Overnight and Continuous | Up to 30 Days | Total | ||||||
Residential mortgage-backed securities | $ | 360,751 | — | 360,751 | |||||
Commercial mortgage-backed securities | 1,822 | — | 1,822 | ||||||
Total | $ | 362,573 | — | 362,573 | |||||
December 31, 2016 | |||||||||
Remaining Contractual Maturity of the Agreements | |||||||||
(Dollars in thousands) | Overnight and Continuous | Up to 30 Days | Total | ||||||
Residential mortgage-backed securities | $ | 471,706 | 643 | 472,349 | |||||
Commercial mortgage-backed securities | 1,301 | — | 1,301 | ||||||
Total | $ | 473,007 | 643 | 473,650 | |||||
95
Note 8. Borrowings (continued)
The Company’s FHLB advances bear a fixed rate of interest and are subject to restrictions or penalties in the event of prepayment. The advances are collateralized by specifically pledged loans and investment securities, FHLB stock owned by the Company, and a blanket assignment of the unpledged qualifying loans and investments. During the year ended December 31, 2017, the Company modified the majority of its long-term FHLB advances, including prepaying higher cost advances, to strategically manage its asset size. The scheduled maturities of FHLB advances consist of the following:
December 31, 2017 | December 31, 2016 | ||||||||||||
(Dollars in thousands) | Amount | Weighted Rate | Amount | Weighted Rate | |||||||||
Maturing within one year | $ | 200,869 | 1.64 | % | $ | 41,099 | 0.84 | % | |||||
Maturing one year through two years | 887 | 2.05 | % | 70,983 | 1.42 | % | |||||||
Maturing two years through three years | 1,651 | 3.58 | % | 927 | 2.16 | % | |||||||
Maturing three years through four years | 148,721 | 2.69 | % | 1,728 | 3.66 | % | |||||||
Maturing four years through five years | 945 | 5.25 | % | 135,000 | 3.08 | % | |||||||
Thereafter | 922 | 5.42 | % | 2,012 | 5.33 | % | |||||||
Total | $ | 353,995 | 2.11 | % | $ | 251,749 | 2.27 | % | |||||
The Company’s other borrowings consisted of capital lease obligations and other debt obligations through consolidation of certain VIEs. At December 31, 2017, the Company had $230,000,000 in unsecured lines of credit which are typically renewed on an annual basis with various correspondent entities.
Note 9. Subordinated Debentures
Trust preferred securities were issued by the Company’s trust subsidiaries, the common stock of which is wholly-owned by the Company, in conjunction with the Company issuing subordinated debentures to the trust subsidiaries. The terms of the subordinated debentures are the same as the terms of the trust preferred securities. The Company guaranteed the payment of distributions and payments for redemption or liquidation of the trust preferred securities to the extent of funds held by the trust subsidiaries. The obligations of the Company under the subordinated debentures together with the guarantee and other back-up obligations, in the aggregate, constitute a full and unconditional guarantee by the Company of the obligations of all trusts under the trust preferred securities.
The trust preferred securities are subject to mandatory redemption upon repayment of the subordinated debentures at their stated maturity date or the earlier redemption in an amount equal to their liquidation amount plus accumulated and unpaid distributions to the date of redemption. Interest distributions are payable quarterly. The Company may defer the payment of interest at any time for a period not exceeding 20 consecutive quarters provided that the deferral period does not extend past the stated maturity. During any such deferral period, distributions on the trust preferred securities will also be deferred and the Company’s ability to pay dividends on its common shares will be restricted.
Subject to prior approval by the FRB, the trust preferred securities may be redeemed at par prior to maturity at the Company’s option on or after the redemption date. All of the Company’s trust preferred securities have reached the redemption date and could be redeemed at the Company’s option. The trust preferred securities may also be redeemed at any time in whole (but not in part) for the Trusts in the event of unfavorable changes in laws or regulations that result in 1) subsidiary trusts becoming subject to federal income tax on income received on the subordinated debentures; 2) interest payable by the Company on the subordinated debentures becoming non-deductible for federal tax purposes; 3) the requirement for the trusts to register under the Investment Company Act of 1940, as amended; or 4) loss of the ability to treat the trust preferred securities as Tier 1 capital under the FRB capital adequacy guidelines.
For regulatory capital purposes, the FRB has allowed bank holding companies to continue to include trust preferred securities in Tier 1 capital up to a certain limit. Provisions of the Dodd-Frank Wall Street Reform and Consumer Protection Act of 2010 (“Dodd-Frank Act”) require the FRB to exclude trust preferred securities from Tier 1 capital, but a permanent grandfather provision applicable to the Company permits bank holding companies with consolidated assets of less than $15 billion to continue counting existing trust preferred securities as Tier 1 capital until they mature, even after the Company’s total assets exceed $15 billion. All of the Company’s trust preferred securities qualified as Tier 1 capital instruments at December 31, 2017. For additional information on regulatory capital, see Note 11.
96
Note 9. Subordinated Debentures (continued)
The terms of the subordinated debentures, arranged by maturity date, are reflected in the table below. The amounts include fair value adjustments from acquisitions.
December 31, 2017 | Variable Rate Structure | Maturity Date | ||||||||
(Dollars in thousands) | Balance | Rate | ||||||||
First Company Statutory Trust 2001 | $ | 3,269 | 4.680 | % | 3 month LIBOR plus 3.30% | 07/31/2031 | ||||
First Company Statutory Trust 2003 | 2,407 | 4.925 | % | 3 month LIBOR plus 3.25% | 03/26/2033 | |||||
Glacier Capital Trust II | 46,393 | 4.109 | % | 3 month LIBOR plus 2.75% | 04/07/2034 | |||||
Citizens (ID) Statutory Trust I | 5,155 | 4.250 | % | 3 month LIBOR plus 2.65% | 06/17/2034 | |||||
Glacier Capital Trust III | 36,083 | 2.649 | % | 3 month LIBOR plus 1.29% | 04/07/2036 | |||||
Glacier Capital Trust IV | 30,928 | 3.158 | % | 3 month LIBOR plus 1.57% | 09/15/2036 | |||||
Bank of the San Juans Bancorporation Trust I | 1,900 | 3.301 | % | 3 month LIBOR plus 1.82% | 03/01/2037 | |||||
$ | 126,135 | |||||||||
Note 10. Derivatives and Hedging Activities
The Company is exposed to certain risk relating to its ongoing business operations. The primary risk managed by using derivative instruments is interest rate risk. Interest rate swaps are entered into to manage interest rate risk associated with the Company’s forecasted variable rate borrowings. The Company recognizes interest rate swaps as either assets or liabilities at fair value in the statements of financial condition, after taking into account the effects of bilateral collateral and master netting agreements. These agreements allow the Company to settle all interest rate swap agreements held with a single counterparty on a net basis, and to offset net interest rate swap derivative positions with related collateral, where applicable.
The interest rate swaps on variable rate borrowings were designated as cash flow hedges and were over-the-counter contracts. The contracts were entered into by the Company with a single counterparty, and the specific terms and conditions were negotiated, including forecasted notional amounts, interest rates and maturity dates. The Company is exposed to credit-related losses in the event of nonperformance by the counterparty to the agreements. The Company controls the counterparty credit risk by maintaining bilateral collateral agreements and through monitoring policy and procedures. The Company only conducts business with primary dealers and believes that the credit risk inherent in these contracts was not significant.
The Company’s interest rate swap derivative financial instruments as of December 31, 2017 are as follows:
(Dollars in thousands) | Forecasted Notional Amount | Variable Interest Rate 1 | Fixed Interest Rate 1 | Payment Term | ||||||
Interest rate swap | $ | 160,000 | 3 month LIBOR | 3.378 | % | Oct. 21, 2014 - Oct. 21, 2021 | ||||
Interest rate swap | 100,000 | 3 month LIBOR | 2.498 | % | Nov. 30, 2015 - Nov. 30, 2022 | |||||
______________________________
1 The Company pays the fixed interest rate and the counterparty pays the Company the variable interest rate.
The hedging strategy converts the LIBOR-based variable interest rate on borrowings to a fixed interest rate, thereby protecting the Company from interest rate variability.
97
Note 10. Derivatives and Hedging Activities (continued)
The interest rate swaps with the $160,000,000 and $100,000,000 notional amounts began their payment terms in October 2014 and November 2015, respectively. The Company designated wholesale deposits and FHLB advances as the cash flow hedge and these hedged items were determined to be fully effective during current and prior years. As such, no amount of ineffectiveness has been included in the Company’s statements of operations for the years ended December 31, 2017, 2016 and 2015. Therefore, the aggregate fair value of the interest rate swaps was recorded in other liabilities with changes recorded in OCI. The Company expects the hedges to remain highly effective during the remaining terms of the interest rate swaps. Interest expense recorded on the interest rate swaps totaled $8,013,000, $8,035,000 and $5,695,000 during 2017, 2016 and 2015, respectively, and is reported as a component of interest expense on deposits and FHLB advances. Unless the interest rate swaps are terminated during the next year, the Company expects $4,228,000 of the unrealized loss reported in OCI at December 31, 2017 to be reclassified to interest expense during the next twelve months.
The following table presents the pre-tax gains or losses recorded in OCI and the Company’s statements of operations relating to the interest rate swap derivative financial instruments:
Years ended | |||||||||
(Dollars in thousands) | December 31, 2017 | December 31, 2016 | December 31, 2015 | ||||||
Interest rate swaps | |||||||||
Amount of gain (loss) recognized in OCI (effective portion) | $ | 444 | (1,643 | ) | (7,857 | ) | |||
Amount of loss reclassified from OCI to interest expense | (4,892 | ) | (6,417 | ) | (5,025 | ) | |||
Amount of loss recognized in other non-interest expense (ineffective portion) | — | — | — | ||||||
The following table discloses the offsetting of financial liabilities and interest rate swap derivative liabilities. There were no interest rate swap derivative assets at the dates presented.
December 31, 2017 | December 31, 2016 | |||||||||||||||||
(Dollars in thousands) | Gross Amounts of Recognized Liabilities | Gross Amounts Offset in the Statements of Financial Position | Net Amounts of Liabilities Presented in the Statements of Financial Position | Gross Amounts of Recognized Liabilities | Gross Amounts Offset in the Statements of Financial Position | Net Amounts of Liabilities Presented in the Statements of Financial Position | ||||||||||||
Interest rate swaps | $ | 9,389 | — | 9,389 | 14,725 | — | 14,725 | |||||||||||
Pursuant to the interest rate swap agreements, the Company pledged collateral to the counterparty in the form of investment securities totaling $23,692,000 at December 31, 2017. There was $0 collateral pledged from the counterparty to the Company as of December 31, 2017. There is the possibility that the Company may need to pledge additional collateral in the future if there were declines in the fair value of the interest rate swap derivative financial instruments versus the collateral pledged.
98
Note 11. Regulatory Capital
The Federal Reserve has adopted capital adequacy guidelines that are used to assess the adequacy of capital in supervising a bank holding company. The federal banking agencies implemented final rules (“Final Rules”) to establish a new comprehensive regulatory capital framework with a phase-in period beginning on January 1, 2015 and ending on January 1, 2019. The Final Rules implemented certain regulatory amendments based on the recommendation of the Basel Committee on Banking Supervision and certain requirements of the Dodd-Frank Act and substantially amended the regulatory risk-based capital rules applicable to the Company. The Final Rules require the Company to hold a conservation buffer designed to absorb losses during periods of economic stress. The capital conservation buffer for 2017 is 1.25 percent. The Company has elected to opt-out of the requirement to include most components of AOCI. As of December 31, 2017, management believes the Company and Bank meet all capital adequacy requirements to which they are subject.
Prompt corrective action regulations provide the following classifications: well capitalized, adequately capitalized, undercapitalized, significantly undercapitalized and critically undercapitalized. If undercapitalized, capital distributions (including payment of a dividend) are generally restricted, as is paying management fees to its bank holding company. Failure to meet minimum capital requirements set forth in the table below can initiate certain mandatory and possible additional discretionary actions by regulators that, if undertaken, could have a direct material effect on the Company’s and Bank’s financial condition. The Company’s and Bank’s capital amounts and classification are also subject to qualitative judgments by the regulators about components, risk weightings and other factors.
At December 31, 2017 and 2016, the most recent regulatory notifications categorized the Company and Bank as well capitalized under the regulatory framework for prompt corrective action. To be well capitalized, the Bank must maintain minimum total capital, Tier 1 capital, Common Tier 1 capital and Tier 1 Leverage ratios as set forth in the table below. There are no conditions or events since December 31, 2017 that management believes have changed the Company’s or Bank’s risk-based capital category.
Current guidance from the Federal Reserve provides, among other things, that dividends per share on the Company’s common stock generally should not exceed earnings per share, measured over the previous four fiscal quarters. The Bank is also subject to Montana state law and cannot declare a dividend greater than the previous two years’ net earnings without providing notice to the state.
The following tables illustrate the FRB’s adequacy guidelines and the Company’s and the Bank’s compliance with those guidelines:
December 31, 2017 | ||||||||||||||||||||
Actual | Required for Capital Adequacy Purposes | To Be Well Capitalized Under Prompt Corrective Action Regulations | ||||||||||||||||||
(Dollars in thousands) | Amount | Ratio | Amount | Ratio | Amount | Ratio | ||||||||||||||
Total capital (to risk-weighted assets) | ||||||||||||||||||||
Consolidated | $ | 1,232,089 | 15.64 | % | $ | 630,109 | 8.00 | % | N/A | N/A | ||||||||||
Glacier Bank | 1,182,509 | 15.04 | % | 628,823 | 8.00 | % | $ | 786,029 | 10.00 | % | ||||||||||
Tier 1 capital (to risk-weighted assets) | ||||||||||||||||||||
Consolidated | 1,133,125 | 14.39 | % | 472,582 | 6.00 | % | N/A | N/A | ||||||||||||
Glacier Bank | 1,083,744 | 13.79 | % | 471,617 | 6.00 | % | 628,823 | 8.00 | % | |||||||||||
Common Equity Tier 1 (to risk-weighted assets) | ||||||||||||||||||||
Consolidated | 1,009,276 | 12.81 | % | 354,437 | 4.50 | % | N/A | N/A | ||||||||||||
Glacier Bank | 1,083,744 | 13.79 | % | 353,713 | 4.50 | % | 510,919 | 6.50 | % | |||||||||||
Tier 1 capital (to average assets) | ||||||||||||||||||||
Consolidated | 1,133,125 | 11.90 | % | 380,770 | 4.00 | % | N/A | N/A | ||||||||||||
Glacier Bank | 1,083,744 | 11.47 | % | 377,809 | 4.00 | % | 472,261 | 5.00 | % | |||||||||||
99
Note 11. Regulatory Capital (continued)
December 31, 2016 | ||||||||||||||||||||
Actual | Required for Capital Adequacy Purposes | To Be Well Capitalized Under Prompt Corrective Action Regulations | ||||||||||||||||||
(Dollars in thousands) | Amount | Ratio | Amount | Ratio | Amount | Ratio | ||||||||||||||
Total capital (to risk-weighted assets) | ||||||||||||||||||||
Consolidated | $ | 1,179,673 | 16.38 | % | $ | 576,092 | 8.00 | % | N/A | N/A | ||||||||||
Glacier Bank | 1,131,949 | 15.76 | % | 574,658 | 8.00 | % | $ | 718,323 | 10.00 | % | ||||||||||
Tier 1 capital (to risk-weighted assets) | ||||||||||||||||||||
Consolidated | 1,089,142 | 15.12 | % | 432,069 | 6.00 | % | N/A | N/A | ||||||||||||
Glacier Bank | 1,041,640 | 14.50 | % | 430,994 | 6.00 | % | 574,658 | 8.00 | % | |||||||||||
Common Equity Tier 1 (to risk-weighted assets) | ||||||||||||||||||||
Consolidated | 966,701 | 13.42 | % | 324,052 | 4.50 | % | N/A | N/A | ||||||||||||
Glacier Bank | 1,041,640 | 14.50 | % | 323,245 | 4.50 | % | 466,910 | 6.50 | % | |||||||||||
Tier 1 capital (to average assets) | ||||||||||||||||||||
Consolidated | 1,089,142 | 11.90 | % | 365,994 | 4.00 | % | N/A | N/A | ||||||||||||
Glacier Bank | 1,041,640 | 11.45 | % | 363,945 | 4.00 | % | 454,932 | 5.00 | % | |||||||||||
______________________________
N/A - Not applicable
Note 12. Stock-based Compensation Plan
The Company has two stock-based compensation plans in effect at December 31, 2017. The 2005 Stock Incentive Plan expired in April 2015, but still has non-vested restricted stock awards at December 31, 2017. The 2015 Stock Incentive Plan provides incentives and awards to select employees and directors of the Company and permits the granting of stock options, share appreciation rights, restricted shares, restricted share units, unrestricted shares and performance awards. At December 31, 2017, the number of shares available to award to employees and directors under the 2015 Stock Incentive Plan was 2,249,767.
Restricted Stock Awards
The Company has awarded restricted stock to select employees and directors under the 2005 and 2015 Stock Incentive Plans. Common stock is issued as vesting restrictions lapse, which may be immediately or according to the terms of a vesting schedule. Restricted stock awards may not be sold, pledged or otherwise transferred until restrictions have lapsed. Under the 2005 Stock Incentive Plan, the recipient does not have the right to vote until the restricted stock award has vested but does have the right to receive dividends. Under the 2015 Stock Incentive Plan, the recipient does not have the right to vote or to receive dividends until the restricted stock award has vested. The fair value of the restricted stock awarded is the closing price of the Company’s common stock on the award date.
Compensation expense related to restricted stock awards for the years ended December 31, 2017, 2016 and 2015 was $3,764,000, $2,870,000 and $2,470,000, respectively, and the recognized income tax benefit related to this expense was $1,452,000, $1,112,000 and $957,000. As of December 31, 2017, total unrecognized compensation expense of $3,288,000 related to restricted stock awards is expected to be recognized over a weighted-average period of 1.8 years.
The fair value of restricted stock awards that vested during the years ended December 31, 2017, 2016 and 2015 was $3,746,000, $2,624,000 and $1,761,000, respectively, and the income tax benefit related to these awards was $1,998,000, $1,053,000 and $795,000, respectively. Upon vesting of restricted stock awards, the shares are issued from the Company’s authorized stock balance.
100
Note 12. Stock-based Compensation Plan (continued)
The following table summarizes the restricted stock award activity for the year ended December 31, 2017:
Restricted Stock | Weighted- Average Grant Date Fair Value | |||||
Non-vested at December 31, 2016 | 222,732 | $ | 24.46 | |||
Granted | 104,836 | 36.59 | ||||
Vested | (141,864 | ) | 26.41 | |||
Forfeited | (2,526 | ) | 29.07 | |||
Non-vested at December 31, 2017 | 183,178 | 29.84 | ||||
The average remaining contractual term on non-vested restricted stock awards at December 31, 2017 is 0.8 years. The aggregate intrinsic value of the non-vested restricted stock awards at December 31, 2017 was $7,215,000.
Note 13. Employee Benefit Plans
The Company provides its qualified employees with a comprehensive benefit program, including health, dental and vision insurance, life and accident insurance, short- and long-term disability coverage, vacation and sick leave, 401(k) plan, profit sharing plan, stock-based compensation plan, deferred compensation plans, and supplemental executive retirement plan. The Company has elected to self-insure certain costs related to employee health, dental and vision benefit programs. Costs resulting from noninsured losses are expensed as incurred. The Company has purchased insurance that limits its exposure on an individual claim basis for the employee health benefit programs.
401(k) Plan and Profit Sharing Plan
The Company’s 401(k) plan and profit sharing plan have safe harbor and employer discretionary components. To be considered eligible for the 401(k) and safe harbor components of the profit sharing plan, an employee must be 21 years of age and employed for three full months. Employees are eligible to participate in the 401(k) plan the first day of the month once they have met the eligibility requirements. To be considered eligible for the employer discretionary contribution of the profit sharing plan, an employee must be 21 years of age, worked one full calendar quarter, worked 501 hours in the plan year and be employed as of the last day of the plan year. Participants are at all times fully vested in all contributions.
The profit sharing plan contributions consists of a 3 percent non-elective safe harbor contribution fully funded by the Company and an employer discretionary contribution. The employer discretionary contribution depends on the Company’s profitability. The total profit sharing plan expense for the years ended December 31, 2017, 2016, and 2015 was $10,100,000, $9,041,000 and $8,017,000 respectively.
The 401(k) plan allows eligible employees under the age of 50 to contribute up to 60 percent, and those 50 and older to contribute up to 100 percent of their eligible annual compensation up to the limit set annually by the Internal Revenue Service (“IRS”). The Company matches an amount equal to 50 percent of the first 6 percent of an employee’s contribution. The Company’s contribution to the 401(k) for the years ended December 31, 2017, 2016 and 2015 was $3,224,000, $2,946,000, and $2,629,000, respectively.
Deferred Compensation Plans
The Company has non-funded deferred compensation plans for directors, senior officers and certain nonemployee service providers. The plans provide for participants’ elective deferral of cash payments of up to 50 percent of a participants’ salary and 100 percent of bonuses and directors fees. The total amount deferred for the plans was $739,000, $967,000, and $720,000, for the years ending December 31, 2017, 2016, and 2015, respectively. The participant receives an earnings credit at a rate equal to 50 percent of the Company’s return on average equity. The total earnings for the years ended December 31, 2017, 2016, and 2015 for the plans was $481,000, $431,000 and $386,000, respectively. In connection with several acquisitions, the Company assumed the obligations of deferred compensation plans for certain key employees. As of December 31, 2017 and 2016, the liability related to the obligations was $11,275,000 and $11,273,000, respectively, and was included in other liabilities. The total earnings for the years ended December 31, 2017, 2016, and 2015 for the acquired plans was insignificant.
101
Note 13. Employee Benefit Plans (continued)
Supplemental Executive Retirement Plan
The Company has a Supplemental Executive Retirement Plan (“SERP”) which is intended to supplement payments due to participants upon retirement under the Company’s other qualified plans. The Company credits the participant’s account on an annual basis for an amount equal to employer contributions that would have otherwise been allocated to the participant’s account under the tax-qualified plans were it not for limitations imposed by the IRS or the participation in the non-funded deferred compensation plan. Eligible employees include participants of the non-funded deferred compensation plan and employees whose benefits were limited as a result of IRS regulations. The Company’s required contribution to the SERP for the years ended December 31, 2017, 2016 and 2015 was $287,000, $299,000, and $224,000, respectively. The participant receives an earnings credit at a rate equal to 50 percent of the Company’s return on average equity. The total earnings for the years ended December 31, 2017, 2016, and 2015 for this plan was $105,000, $85,000, and $69,000, respectively.
Note 14. Other Expenses
Other expenses consists of the following:
Years ended | |||||||||
(Dollars in thousands) | December 31, 2017 | December 31, 2016 | December 31, 2015 | ||||||
Debit card expenses | $ | 7,189 | 8,462 | 6,153 | |||||
Consulting and outside services | 5,331 | 5,683 | 3,845 | ||||||
Employee expenses | 4,160 | 3,573 | 2,425 | ||||||
Telephone | 3,891 | 3,828 | 3,318 | ||||||
VIE amortization and other expenses | 3,109 | 2,702 | 4,528 | ||||||
Loan expenses | 3,080 | 3,611 | 2,824 | ||||||
Postage | 2,684 | 2,785 | 3,716 | ||||||
Printing and supplies | 2,661 | 2,800 | 3,529 | ||||||
Mergers and acquisition expenses | 2,130 | 1,732 | 2,459 | ||||||
Business development | 1,929 | 1,847 | 1,526 | ||||||
Accounting and audit fees | 1,848 | 1,613 | 1,331 | ||||||
Checking and operating expenses | 1,760 | 2,942 | 3,553 | ||||||
ATM expenses | 1,720 | 880 | 1,082 | ||||||
Legal fees | 1,106 | 1,027 | 866 | ||||||
Other | 4,447 | 4,085 | 3,892 | ||||||
Total other expenses | $ | 47,045 | 47,570 | 45,047 | |||||
102
Note 15. Federal and State Income Taxes
The Tax Act was enacted on December 22, 2017 and resulted in a decrease in the federal marginal tax rate from 35 percent to 21 percent beginning in 2018. As a result of the Tax Act, the Company incurred a one-time tax expense adjustment of $19,699,000 during 2017 due to the Company’s revaluation of its net deferred tax assets. This adjustment is reflected in the following tables.
The following table is a summary of consolidated income tax expense:
Years ended | |||||||||
(Dollars in thousands) | December 31, 2017 | December 31, 2016 | December 31, 2015 | ||||||
Current | |||||||||
Federal | $ | 29,555 | 30,461 | 28,705 | |||||
State | 9,183 | 9,283 | 9,374 | ||||||
Total current income tax expense | 38,738 | 39,744 | 38,079 | ||||||
Deferred 1 | |||||||||
Federal | 22,246 | (70 | ) | (3,451 | ) | ||||
State | 3,641 | (12 | ) | (629 | ) | ||||
Total deferred income tax expense (benefit) | 25,887 | (82 | ) | (4,080 | ) | ||||
Total income tax expense | $ | 64,625 | 39,662 | 33,999 | |||||
______________________________
1 | Includes tax benefit of operating loss carryforwards of $644,000, $571,000 and $391,000 for the years ended December 31, 2017, 2016, and 2015, respectively. |
Combined federal and state income tax expense differs from that computed at the federal statutory corporate tax rate as follows:
Years ended | ||||||||
December 31, 2017 | December 31, 2016 | December 31, 2015 | ||||||
Federal statutory rate | 35.0 | % | 35.0 | % | 35.0 | % | ||
State taxes, net of federal income tax benefit | 4.6 | % | 3.8 | % | 3.7 | % | ||
Tax rate change | 10.9 | % | — | % | — | % | ||
Tax-exempt interest income | (10.5 | )% | (12.2 | )% | (12.6 | )% | ||
Tax credits | (3.2 | )% | (2.1 | )% | (3.0 | )% | ||
Other, net | (1.1 | )% | 0.2 | % | (0.5 | )% | ||
Effective tax rate | 35.7 | % | 24.7 | % | 22.6 | % | ||
103
Note 15. Federal and State Income Taxes (continued)
The tax effect of temporary differences which give rise to a significant portion of deferred tax assets and deferred tax liabilities are as follows:
(Dollars in thousands) | December 31, 2017 | December 31, 2016 | ||||
Deferred tax assets | ||||||
Allowance for loan and lease losses | $ | 32,890 | 50,172 | |||
Deferred compensation | 5,640 | 8,320 | ||||
Other real estate owned | 5,126 | 8,309 | ||||
Acquisition fair market value adjustments | 4,139 | 4,763 | ||||
Net operating loss carryforwards | 2,841 | 4,737 | ||||
Employee benefits | 2,615 | 3,927 | ||||
Interest rate swap agreements | 2,379 | 5,705 | ||||
Other | 3,673 | 5,569 | ||||
Total gross deferred tax assets | 59,303 | 91,502 | ||||
Deferred tax liabilities | ||||||
Deferred loan costs | (5,854 | ) | (8,061 | ) | ||
Intangibles | (4,161 | ) | (5,477 | ) | ||
Depreciation of premises and equipment | (2,863 | ) | (3,111 | ) | ||
FHLB stock dividends | (2,602 | ) | (3,976 | ) | ||
Available-for-sale securities | (1,707 | ) | (1,036 | ) | ||
Debt modification costs | (1,591 | ) | — | |||
Other | (2,181 | ) | (2,720 | ) | ||
Total gross deferred tax liabilities | (20,959 | ) | (24,381 | ) | ||
Net deferred tax asset | $ | 38,344 | 67,121 | |||
The Company has federal net operating loss carryforwards of $10,635,000 expiring between 2030 and 2035. The Company has Colorado net operating loss carryforwards of $13,987,000 expiring between 2031 and 2032. The net operating loss carryforwards originated from bank acquisitions. The Company has federal tax credit carryforwards with no expiration dates of $411,000.
The Company and the Bank file consolidated income tax returns in the following jurisdictions: federal, Montana, Idaho, Utah, Colorado and Arizona. Although the Bank has operations in Wyoming and Washington, neither Wyoming nor Washington imposes a corporate-level income tax. All required income tax returns have been timely filed. The following schedule summarizes the years that remain subject to examination as of December 31, 2017:
Years ended December 31, | |
Federal | 2013, 2014, 2015 and 2016 |
Montana | 2014, 2015 and 2016 |
Idaho | 2014, 2015 and 2016 |
Utah | 2014, 2015 and 2016 |
Colorado | 2013, 2014, 2015 and 2016 |
Arizona | 2013, 2014, 2015 and 2016 |
104
Note 15. Federal and State Income Taxes (continued)
The Company had no unrecognized income tax benefits as of December 31, 2017 and 2016. The Company recognizes interest related to unrecognized income tax benefits in interest expense and penalties are recognized in other expense. Interest expense and penalties recognized with respect to income tax liabilities for the years ended December 31, 2017, 2016, and 2015 was not significant. The Company had no accrued liabilities for the payment of interest or penalties at December 31, 2017 and 2016.
The Company has assessed the need for a valuation allowance and determined that a valuation allowance was not necessary at December 31, 2017 and 2016. The Company believes that it is more-likely-than-not that the Company’s deferred tax assets will be realizable by offsetting future taxable income from reversing taxable temporary differences and anticipated future taxable income (exclusive of reversing temporary differences). In its assessment, the Company considered its strong earnings history, no history of income tax credit carryforwards expiring unused, and no future net operating losses (for tax purposes) are expected.
Note 16. Accumulated Other Comprehensive Income (Loss)
The following table illustrates the activity within accumulated other comprehensive income (loss) by component, net of tax:
(Dollars in thousands) | Gains on Available-For-Sale Securities | Losses on Derivatives Used for Cash Flow Hedges | Total | ||||||
Balance at December 31, 2014 | $ | 27,945 | (10,201 | ) | 17,744 | ||||
Other comprehensive loss before reclassifications | (13,968 | ) | (4,823 | ) | (18,791 | ) | |||
Reclassification adjustments for (losses) gains included in net income | (42 | ) | 3,078 | 3,036 | |||||
Net current period other comprehensive loss | (14,010 | ) | (1,745 | ) | (15,755 | ) | |||
Balance at December 31, 2015 | $ | 13,935 | (11,946 | ) | 1,989 | ||||
Other comprehensive loss before reclassifications | (13,113 | ) | (1,006 | ) | (14,119 | ) | |||
Reclassification adjustments for gains included in net income | 817 | 3,931 | 4,748 | ||||||
Net current period other comprehensive (loss) income | (12,296 | ) | 2,925 | (9,371 | ) | ||||
Balance at December 31, 2016 | $ | 1,639 | (9,021 | ) | (7,382 | ) | |||
Other comprehensive income before reclassifications | 2,110 | 248 | 2,358 | ||||||
Reclassification adjustments for gains included in net income | 391 | 3,005 | 3,396 | ||||||
Reclassifications from accumulated other comprehensive income (loss) to retained earnings 1 | 891 | (1,242 | ) | (351 | ) | ||||
Net current period other comprehensive income | 3,392 | 2,011 | 5,403 | ||||||
Balance at December 31, 2017 | $ | 5,031 | (7,010 | ) | (1,979 | ) | |||
______________________________
1 | Reclassifications were due to the one-time revaluation of the deferred tax assets and deferred tax liabilities as a result of the Tax Act. For additional information relating to this reclassification, see Note 1. |
105
Note 17. Earnings Per Share
Basic earnings per share is computed by dividing net income by the weighted-average number of shares of common stock outstanding during the period presented. Diluted earnings per share is computed by including the net increase in shares as if dilutive outstanding restricted stock awards were vested, using the treasury stock method.
Basic and diluted earnings per share has been computed based on the following:
Years ended | |||||||||
(Dollars in thousands, except per share data) | December 31, 2017 | December 31, 2016 | December 31, 2015 | ||||||
Net income available to common stockholders, basic and diluted | $ | 116,377 | 121,131 | 116,127 | |||||
Average outstanding shares - basic | 77,537,664 | 76,278,463 | 75,542,455 | ||||||
Add: dilutive restricted stock awards | 69,941 | 63,373 | 53,126 | ||||||
Average outstanding shares - diluted | 77,607,605 | 76,341,836 | 75,595,581 | ||||||
Basic earnings per share | $ | 1.50 | 1.59 | 1.54 | |||||
Diluted earnings per share | $ | 1.50 | 1.59 | 1.54 | |||||
There were no restricted stock awards excluded from the diluted average outstanding share calculation for the years ended December 31, 2017, 2016, and 2015. Anti-dilution occurs when the unrecognized compensation cost per share of a restricted stock award exceeds the market price of the Company’s stock.
Note 18. Parent Holding Company Information (Condensed)
The following condensed financial information was the unconsolidated information for the parent holding company:
Condensed Statements of Financial Condition
(Dollars in thousands) | December 31, 2017 | December 31, 2016 | ||||
Assets | ||||||
Cash on hand and in banks | $ | 9,304 | 5,906 | |||
Interest bearing cash deposits | 38,420 | 57,700 | ||||
Cash and cash equivalents | 47,724 | 63,606 | ||||
Investment securities, available-for-sale | — | 36 | ||||
Other assets | 8,871 | 10,764 | ||||
Investment in subsidiaries | 1,281,392 | 1,201,667 | ||||
Total assets | $ | 1,337,987 | 1,276,073 | |||
Liabilities and Stockholders’ Equity | ||||||
Dividends payable | $ | 265 | 23,137 | |||
Subordinated debentures | 126,135 | 125,991 | ||||
Other liabilities | 12,530 | 10,076 | ||||
Total liabilities | 138,930 | 159,204 | ||||
Common stock | 780 | 765 | ||||
Paid-in capital | 797,997 | 749,107 | ||||
Retained earnings | 402,259 | 374,379 | ||||
Accumulated other comprehensive loss | (1,979 | ) | (7,382 | ) | ||
Total stockholders’ equity | 1,199,057 | 1,116,869 | ||||
Total liabilities and stockholders’ equity | $ | 1,337,987 | 1,276,073 | |||
106
Note 18. Parent Holding Company Information (Condensed) (continued)
Condensed Statements of Operations and Comprehensive Income
Years ended | |||||||||
(Dollars in thousands) | December 31, 2017 | December 31, 2016 | December 31, 2015 | ||||||
Income | |||||||||
Dividends from subsidiaries | $ | 119,000 | 108,350 | 109,000 | |||||
Gain on sale of investments | 3 | — | — | ||||||
Intercompany charges for services | 14,299 | 12,248 | 10,562 | ||||||
Other income | 225 | 311 | 196 | ||||||
Total income | 133,527 | 120,909 | 119,758 | ||||||
Expenses | |||||||||
Compensation and employee benefits | 17,864 | 15,665 | 13,205 | ||||||
Other operating expenses | 10,425 | 7,701 | 7,313 | ||||||
Total expenses | 28,289 | 23,366 | 20,518 | ||||||
Income before income tax benefit and equity in undistributed net income of subsidiaries | 105,238 | 97,543 | 99,240 | ||||||
Income tax benefit | 2,983 | 4,040 | 3,105 | ||||||
Income before equity in undistributed net income of subsidiaries | 108,221 | 101,583 | 102,345 | ||||||
Equity in undistributed net income of subsidiaries | 8,156 | 19,548 | 13,782 | ||||||
Net Income | $ | 116,377 | 121,131 | 116,127 | |||||
Comprehensive Income | $ | 122,131 | 111,760 | 100,372 | |||||
Condensed Statements of Cash Flows
Years ended | |||||||||
(Dollars in thousands) | December 31, 2017 | December 31, 2016 | December 31, 2015 | ||||||
Operating Activities | |||||||||
Net income | $ | 116,377 | 121,131 | 116,127 | |||||
Adjustments to reconcile net income to net cash provided by operating activities: | |||||||||
Subsidiary income in excess of dividends distributed | (8,156 | ) | (19,548 | ) | (13,782 | ) | |||
Amortization of purchase accounting adjustments | 143 | 143 | 143 | ||||||
Gain on sale of investments | (3 | ) | — | — | |||||
Stock-based compensation, net of tax benefits | 1,460 | 804 | 695 | ||||||
Net change in other assets and other liabilities | 5,051 | (297 | ) | 118 | |||||
Net cash provided by operating activities | 114,872 | 102,233 | 103,301 | ||||||
Investing Activities | |||||||||
Sales of available-for-sale securities | 27 | — | — | ||||||
Net (increase) decrease of premises and equipment | (79 | ) | 771 | (1,405 | ) | ||||
Proceeds from sale of non-marketable equity securities | 114 | 55 | 22 | ||||||
Equity contributions to subsidiaries | (17,565 | ) | (3,475 | ) | (28,457 | ) | |||
Net cash used in by investing activities | (17,503 | ) | (2,649 | ) | (29,840 | ) | |||
Financing Activities | |||||||||
Cash dividends paid | (111,720 | ) | (84,040 | ) | (79,456 | ) | |||
Tax withholding payments for stock-based compensation | (1,531 | ) | (600 | ) | (489 | ) | |||
Net cash used in financing activities | (113,251 | ) | (84,640 | ) | (79,945 | ) | |||
Net (decrease) increase in cash and cash equivalents | (15,882 | ) | 14,944 | (6,484 | ) | ||||
Cash and cash equivalents at beginning of year | 63,606 | 48,662 | 55,146 | ||||||
Cash and cash equivalents at end of year | $ | 47,724 | 63,606 | 48,662 | |||||
107
Note 19. Unaudited Quarterly Financial Data (Condensed)
Summarized unaudited quarterly financial data is as follows:
Quarters ended 2017 | ||||||||||||
(Dollars in thousands, except per share data) | March 31 | June 30 | September 30 | December 31 | ||||||||
Interest income | $ | 87,628 | 94,032 | 96,464 | 96,898 | |||||||
Interest expense | 7,366 | 7,774 | 7,652 | 7,072 | ||||||||
Net interest income | 80,262 | 86,258 | 88,812 | 89,826 | ||||||||
Provision for loan losses | 1,598 | 3,013 | 3,327 | 2,886 | ||||||||
Net interest income after provision for loan losses | 78,664 | 83,245 | 85,485 | 86,940 | ||||||||
Non-interest income | 25,689 | 27,656 | 31,185 | 27,709 | ||||||||
Non-interest expense | 63,344 | 65,309 | 68,552 | 68,366 | ||||||||
Income before income taxes | 41,009 | 45,592 | 48,118 | 46,283 | ||||||||
Federal and state income tax expense | 9,754 | 11,905 | 11,639 | 31,327 | ||||||||
Net income | $ | 31,255 | 33,687 | 36,479 | 14,956 | |||||||
Basic earnings per share | $ | 0.41 | 0.43 | 0.47 | 0.19 | |||||||
Diluted earnings per share | $ | 0.41 | 0.43 | 0.47 | 0.19 | |||||||
Quarters ended 2016 | ||||||||||||
(Dollars in thousands, except per share data) | March 31 | June 30 | September 30 | December 31 | ||||||||
Interest income | $ | 84,381 | 86,069 | 85,944 | 87,759 | |||||||
Interest expense | 7,675 | 7,424 | 7,318 | 7,214 | ||||||||
Net interest income | 76,706 | 78,645 | 78,626 | 80,545 | ||||||||
Provision for loan losses | 568 | — | 626 | 1,139 | ||||||||
Net interest income after provision for loan losses | 76,138 | 78,645 | 78,000 | 79,406 | ||||||||
Non-interest income | 24,252 | 26,759 | 28,293 | 28,014 | ||||||||
Non-interest expense | 62,356 | 64,461 | 65,180 | 66,717 | ||||||||
Income before income taxes | 38,034 | 40,943 | 41,113 | 40,703 | ||||||||
Federal and state income tax expense | 9,352 | 10,492 | 10,156 | 9,662 | ||||||||
Net income | $ | 28,682 | 30,451 | 30,957 | 31,041 | |||||||
Basic earnings per share | $ | 0.38 | 0.40 | 0.40 | 0.41 | |||||||
Diluted earnings per share | $ | 0.38 | 0.40 | 0.40 | 0.41 | |||||||
108
Note 20. Fair Value of Assets and Liabilities
Fair value is defined as the price that would be received to sell an asset or paid to transfer a liability in an orderly transaction between market participants at the measurement date. There is a fair value hierarchy which requires an entity to maximize the use of observable inputs and minimize the use of unobservable inputs when measuring fair value. The three levels of inputs that may be used to measure fair value are as follows:
Level 1 Quoted prices in active markets for identical assets or liabilities
Level 2 | Observable inputs other than Level 1 prices, such as quoted prices for similar assets or liabilities; quoted prices in markets that are not active; or other inputs that are observable or can be corroborated by observable market data for substantially the full term of the assets or liabilities |
Level 3 | Unobservable inputs that are supported by little or no market activity and that are significant to the fair value of the assets or liabilities |
Transfers in and out of Level 1 (quoted prices in active markets), Level 2 (significant other observable inputs) and Level 3 (significant unobservable inputs) are recognized on the actual transfer date. There were no transfers between fair value hierarchy levels during the years ended December 31, 2017 and 2016.
Recurring Measurements
The following is a description of the inputs and valuation methodologies used for assets and liabilities measured at fair value on a recurring basis, as well as the general classification of such assets and liabilities pursuant to the valuation hierarchy. There have been no significant changes in the valuation techniques during the period ended December 31, 2017.
Investment securities, available-for-sale: fair value for available-for-sale securities is estimated by obtaining quoted market prices for identical assets, where available. If such prices are not available, fair value is based on independent asset pricing services and models, the inputs of which are market-based or independently sourced market parameters, including but not limited to, yield curves, interest rates, volatilities, market spreads, prepayments, defaults, recoveries, cumulative loss projections, and cash flows. Such securities are classified in Level 2 of the valuation hierarchy. Where Level 1 or Level 2 inputs are not available, such securities are classified as Level 3 within the hierarchy.
Fair value determinations of available-for-sale securities are the responsibility of the Company’s corporate accounting and treasury departments. The Company obtains fair value estimates from independent third party vendors on a monthly basis. The vendors’ pricing system methodologies, procedures and system controls are reviewed to ensure they are appropriately designed and operating effectively. The Company reviews the vendors’ inputs for fair value estimates and the recommended assignments of levels within the fair value hierarchy. The review includes the extent to which markets for investment securities are determined to have limited or no activity, or are judged to be active markets. The Company reviews the extent to which observable and unobservable inputs are used as well as the appropriateness of the underlying assumptions about risk that a market participant would use in active markets, with adjustments for limited or inactive markets. In considering the inputs to the fair value estimates, the Company places less reliance on quotes that are judged to not reflect orderly transactions, or are non-binding indications. In assessing credit risk, the Company reviews payment performance, collateral adequacy, third party research and analyses, credit rating histories and issuers’ financial statements. For those markets determined to be inactive or limited, the valuation techniques used are models for which management has verified that discount rates are appropriately adjusted to reflect illiquidity and credit risk.
Loans held for sale: loans held for sale measured at fair value, for which an active secondary market and readily available market prices exist, are initially valued at the transaction price and are subsequently valued by using quoted prices for similar assets, adjusted for specific attributes of that loan or other observable market data, such as outstanding commitments from third party investors. Loans held for sale measured at fair value are classified within Level 2. Included in gain on sale of loans were net gains of $994,000, $0 and $0 for the years ended December 31, 2017, 2016 and 2015, respectively, from the changes in fair value of these loans held for sale measured at fair value. Electing to measure loans held for sale at fair value reduces certain timing differences and better matches changes in fair value of these assets with changes in the value of the derivative instruments used to economically hedge them without the burden of complying with the requirements for hedge accounting.
109
Note 20. Fair Value of Assets and Liabilities (continued)
Interest rate swap derivative financial instruments: fair values for interest rate swap derivative financial instruments are based upon the estimated amounts to settle the contracts considering current interest rates and are calculated using discounted cash flows that are observable or that can be corroborated by observable market data and, therefore, are classified within Level 2 of the valuation hierarchy. The inputs used to determine fair value include the 3 month LIBOR forward curve to estimate variable rate cash inflows and the Fed Funds Effective Swap Rate to estimate the discount rate. The estimated variable rate cash inflows are compared to the fixed rate outflows and such difference is discounted to a present value to estimate the fair value of the interest rate swaps. The Company also obtains and compares the reasonableness of the pricing from an independent third party.
The following tables disclose the fair value measurement of assets and liabilities measured at fair value on a recurring basis:
Fair Value Measurements At the End of the Reporting Period Using | ||||||||||||
(Dollars in thousands) | Fair Value December 31, 2017 | Quoted Prices in Active Markets for Identical Assets (Level 1) | Significant Other Observable Inputs (Level 2) | Significant Unobservable Inputs (Level 3) | ||||||||
Investment securities, available-for-sale | ||||||||||||
U.S. government and federal agency | $ | 31,127 | — | 31,127 | — | |||||||
U.S. government sponsored enterprises | 19,091 | — | 19,091 | — | ||||||||
State and local governments | 629,501 | — | 629,501 | — | ||||||||
Corporate bonds | 216,762 | — | 216,762 | — | ||||||||
Residential mortgage-backed securities | 779,283 | — | 779,283 | — | ||||||||
Commercial mortgage-backed securities | 102,479 | — | 102,479 | — | ||||||||
Loans held for sale | 38,833 | — | 38,833 | — | ||||||||
Total assets measured at fair value on a recurring basis | $ | 1,817,076 | — | 1,817,076 | — | |||||||
Interest rate swaps | $ | 9,389 | — | 9,389 | — | |||||||
Total liabilities measured at fair value on a recurring basis | $ | 9,389 | — | 9,389 | — | |||||||
110
Note 20. Fair Value of Assets and Liabilities (continued)
Fair Value Measurements At the End of the Reporting Period Using | ||||||||||||
(Dollars in thousands) | Fair Value December 31, 2016 | Quoted Prices in Active Markets for Identical Assets (Level 1) | Significant Other Observable Inputs (Level 2) | Significant Unobservable Inputs (Level 3) | ||||||||
Investment securities, available-for-sale | ||||||||||||
U.S. government and federal agency | $ | 39,407 | — | 39,407 | — | |||||||
U.S. government sponsored enterprises | 19,570 | — | 19,570 | — | ||||||||
State and local governments | 786,373 | — | 786,373 | — | ||||||||
Corporate bonds | 471,951 | — | 471,951 | — | ||||||||
Residential mortgage-backed securities | 1,007,515 | — | 1,007,515 | — | ||||||||
Commercial mortgage-backed securities | 100,661 | — | 100,661 | — | ||||||||
Total assets measured at fair value on a recurring basis | $ | 2,425,477 | — | 2,425,477 | — | |||||||
Interest rate swaps | $ | 14,725 | — | 14,725 | — | |||||||
Total liabilities measured at fair value on a recurring basis | $ | 14,725 | — | 14,725 | — | |||||||
Non-recurring Measurements
The following is a description of the inputs and valuation methodologies used for assets recorded at fair value on a non-recurring basis, as well as the general classification of such assets pursuant to the valuation hierarchy. There have been no significant changes in the valuation techniques during the period ended December 31, 2017.
Other real estate owned: OREO is carried at the lower of fair value at acquisition date or current estimated fair value, less estimated cost to sell. Estimated fair value of OREO is based on appraisals or evaluations (new or updated). OREO is classified within Level 3 of the fair value hierarchy.
Collateral-dependent impaired loans, net of ALLL: loans included in the Company’s loan portfolio for which it is probable that the Company will not collect all principal and interest due according to contractual terms are considered impaired. Estimated fair value of collateral-dependent impaired loans is based on the fair value of the collateral, less estimated cost to sell. Collateral-dependent impaired loans are classified within Level 3 of the fair value hierarchy.
The Company’s credit department reviews appraisals for OREO and collateral-dependent loans, giving consideration to the highest and best use of the collateral. The appraisal or evaluation (new or updated) is considered the starting point for determining fair value. The valuation techniques used in preparing appraisals or evaluations (new or updated) include the cost approach, income approach, sales comparison approach, or a combination of the preceding valuation techniques. The key inputs used to determine the fair value of the collateral-dependent loans and OREO include selling costs, discounted cash flow rate or capitalization rate, and adjustment to comparables. Valuations and significant inputs obtained by independent sources are reviewed by the Company for accuracy and reasonableness. The Company also considers other factors and events in the environment that may affect the fair value. The appraisals or evaluations (new or updated) are reviewed at least quarterly and more frequently based on current market conditions, including deterioration in a borrower’s financial condition and when property values may be subject to significant volatility. After review and acceptance of the collateral appraisal or evaluation (new or updated), adjustments to the impaired loan or OREO may occur. The Company generally obtains appraisals or evaluations (new or updated) annually.
111
Note 20. Fair Value of Assets and Liabilities (continued)
The following tables disclose the fair value measurement of assets with a recorded change during the period resulting from re-measuring the assets at fair value on a non-recurring basis:
Fair Value Measurements At the End of the Reporting Period Using | ||||||||||||
(Dollars in thousands) | Fair Value December 31, 2017 | Quoted Prices in Active Markets for Identical Assets (Level 1) | Significant Other Observable Inputs (Level 2) | Significant Unobservable Inputs (Level 3) | ||||||||
Other real estate owned | $ | 2,296 | — | — | 2,296 | |||||||
Collateral-dependent impaired loans, net of ALLL | 6,339 | — | — | 6,339 | ||||||||
Total assets measured at fair value on a non-recurring basis | $ | 8,635 | — | — | 8,635 | |||||||
Fair Value Measurements At the End of the Reporting Period Using | ||||||||||||
(Dollars in thousands) | Fair Value December 31, 2016 | Quoted Prices in Active Markets for Identical Assets (Level 1) | Significant Other Observable Inputs (Level 2) | Significant Unobservable Inputs (Level 3) | ||||||||
Other real estate owned | $ | 7,839 | — | — | 7,839 | |||||||
Collateral-dependent impaired loans, net of ALLL | 5,664 | — | — | 5,664 | ||||||||
Total assets measured at fair value on a non-recurring basis | $ | 13,503 | — | — | 13,503 | |||||||
Non-recurring Measurements Using Significant Unobservable Inputs (Level 3)
The following tables present additional quantitative information about assets measured at fair value on a non-recurring basis and for which the Company has utilized Level 3 inputs to determine fair value:
Fair Value | Quantitative Information about Level 3 Fair Value Measurements | ||||||||
(Dollars in thousands) | December 31, 2017 | Valuation Technique | Unobservable Input | Range (Weighted- Average) 1 | |||||
Other real estate owned | $ | 2,296 | Sales comparison approach | Selling costs | 0.0% - 10.0% (6.0%) | ||||
Collateral-dependent impaired loans, net of ALLL | $ | 238 | Cost approach | Selling costs | 10.0% - 20.0% (10.6%) | ||||
2,541 | Sales comparison approach | Selling costs | 8.0% - 10.0% (9.4%) | ||||||
3,560 | Combined approach | Selling costs | 10.0% - 10.0% (10.0%) | ||||||
$ | 6,339 | ||||||||
112
Note 20. Fair Value of Assets and Liabilities (continued)
Fair Value | Quantitative Information about Level 3 Fair Value Measurements | ||||||||
(Dollars in thousands) | December 31, 2016 | Valuation Technique | Unobservable Input | Range (Weighted- Average) 1 | |||||
Other real estate owned | $ | 7,767 | Sales comparison approach | Selling costs | 6.0% - 10.0% (6.9%) | ||||
Adjustment to comparables | 0.0% - 10.0% (0.1%) | ||||||||
72 | Combined approach | Selling costs | 10.0% - 10.0% (10.0%) | ||||||
Adjustment to comparables | 10.0% - 10.0% (10.0%) | ||||||||
$ | 7,839 | ||||||||
Collateral-dependent impaired loans, net of ALLL | $ | 110 | Cost approach | Selling costs | 6.0% - 20.0% (6.6%) | ||||
1,982 | Sales comparison approach | Selling costs | 8.0% - 10.0% (9.6%) | ||||||
3,572 | Combined approach | Selling costs | 10.0% - 10.0% (10.0%) | ||||||
Adjustment to comparables | 20.0% - 20.0% (20.0%) | ||||||||
$ | 5,664 | ||||||||
______________________________
1 The range for selling costs and adjustments to comparables indicate reductions to the fair value.
Fair Value of Financial Instruments
The following is a description of the methods used to estimate the fair value of all other assets and liabilities recognized at amounts other than fair value.
Cash and cash equivalents: fair value is estimated at book value.
Investment securities, held-to-maturity: fair value for held-to-maturity securities is estimated in the same manner as available-for-sale securities, which is described above.
Loans held for sale: fair value of loans held for sale for which the fair value election has not been made is estimated at book value.
Loans receivable, net of ALLL: fair value is estimated by discounting the future cash flows using the rates at which similar notes would be written for the same remaining maturities. The market rates used are based on current rates the Company would impose for similar loans and reflect a market participant assumption about risks associated with non-performance, illiquidity, and the structure and term of the loans along with local economic and market conditions. Estimated fair value of impaired loans is based on the fair value of the collateral, less estimated cost to sell, or the present value of the loan’s expected future cash flows (discounted at the loan’s effective interest rate). All impaired loans are classified as Level 3 and all other loans are classified as Level 2 within the valuation hierarchy.
Accrued interest receivable: fair value is estimated at book value.
Non-marketable equity securities: fair value is estimated at book value due to restrictions that limit the sale or transfer of such securities.
Deposits: fair value of term deposits is estimated by discounting the future cash flows using rates of similar deposits with similar maturities. The market rates used were obtained from an independent third party and reviewed by the Company. The rates were the average of current rates offered by the Company’s local competitors. The estimated fair value of demand deposits such as NOW, DDA, savings, and money market deposit accounts is the book value since rates are regularly adjusted to market rates and transactions are executed at book value daily. Therefore, such deposits are classified in Level 1 of the valuation hierarchy. Certificate accounts and wholesale deposits are classified as Level 2 within the hierarchy.
Federal Home Loan Bank advances: fair value of non-callable FHLB advances is estimated by discounting the future cash flows using rates of similar advances with similar maturities. Such rates were obtained from current rates offered by FHLB. The estimated fair value of callable FHLB advances was obtained from FHLB and the model was reviewed by the Company.
113
Note 20. Fair Value of Assets and Liabilities (continued)
Securities sold under agreements to repurchase and other borrowed funds: fair value of term repurchase agreements and other term borrowings is estimated based on current repurchase rates and borrowing rates currently available to the Company for repurchases and borrowings with similar terms and maturities. The estimated fair value for overnight repurchase agreements and other borrowings is book value.
Subordinated debentures: fair value of the subordinated debt is estimated by discounting the estimated future cash flows using current estimated market rates. The market rates used were averages of currently traded trust preferred securities with similar characteristics to the Company’s issuances and obtained from an independent third party.
Accrued interest payable: fair value is estimated at book value.
Off-balance sheet financial instruments: unused lines of credit and letters of credit represent the principal categories of off-balance sheet financial instruments. The fair value of commitments is based on fees currently charged to enter into similar agreements, taking into account the remaining terms of the agreements and the counterparties’ credit standing. The fair value of unused lines of credit and letters of credit is not material; therefore, such commitments are not included in the following tables.
The following tables present the carrying amounts, estimated fair values and the level within the fair value hierarchy of the Company’s financial instruments:
Fair Value Measurements At the End of the Reporting Period Using | ||||||||||||
(Dollars in thousands) | Carrying Amount December 31, 2017 | Quoted Prices in Active Markets for Identical Assets (Level 1) | Significant Other Observable Inputs (Level 2) | Significant Unobservable Inputs (Level 3) | ||||||||
Financial assets | ||||||||||||
Cash and cash equivalents | $ | 200,004 | 200,004 | — | — | |||||||
Investment securities, available-for-sale | 1,778,243 | — | 1,778,243 | — | ||||||||
Investment securities, held-to-maturity | 648,313 | — | 660,086 | — | ||||||||
Loans held for sale | 38,833 | — | 38,833 | — | ||||||||
Loans receivable, net of ALLL | 6,448,256 | — | 6,219,515 | 114,771 | ||||||||
Accrued interest receivable | 44,462 | 44,462 | — | — | ||||||||
Non-marketable equity securities | 29,884 | — | 29,884 | — | ||||||||
Total financial assets | $ | 9,187,995 | 244,466 | 8,726,561 | 114,771 | |||||||
Financial liabilities | ||||||||||||
Deposits | $ | 7,579,747 | 6,602,445 | 978,803 | — | |||||||
FHLB advances | 353,995 | — | 352,886 | — | ||||||||
Repurchase agreements and other borrowed funds | 370,797 | — | 370,797 | — | ||||||||
Subordinated debentures | 126,135 | — | 98,023 | — | ||||||||
Accrued interest payable | 3,450 | 3,450 | — | — | ||||||||
Interest rate swaps | 9,389 | — | 9,389 | — | ||||||||
Total financial liabilities | $ | 8,443,513 | 6,605,895 | 1,809,898 | — | |||||||
114
Note 20. Fair Value of Assets and Liabilities (continued)
Fair Value Measurements At the End of the Reporting Period Using | ||||||||||||
(Dollars in thousands) | Carrying Amount December 31, 2016 | Quoted Prices in Active Markets for Identical Assets (Level 1) | Significant Other Observable Inputs (Level 2) | Significant Unobservable Inputs (Level 3) | ||||||||
Financial assets | ||||||||||||
Cash and cash equivalents | $ | 152,541 | 152,541 | — | — | |||||||
Investment securities, available-for-sale | 2,425,477 | — | 2,425,477 | — | ||||||||
Investment securities, held-to-maturity | 675,674 | — | 689,089 | — | ||||||||
Loans held for sale | 72,927 | 72,927 | — | — | ||||||||
Loans receivable, net of ALLL | 5,554,891 | — | 5,380,286 | 123,382 | ||||||||
Accrued interest receivable | 45,832 | 45,832 | — | — | ||||||||
Non-marketable equity securities | 25,550 | — | 25,550 | — | ||||||||
Total financial assets | $ | 8,952,892 | 271,300 | 8,520,402 | 123,382 | |||||||
Financial liabilities | ||||||||||||
Deposits | $ | 7,372,279 | 6,090,879 | 1,283,532 | — | |||||||
FHLB advances | 251,749 | — | 257,643 | — | ||||||||
Repurchase agreements and other borrowed funds | 478,090 | — | 478,090 | — | ||||||||
Subordinated debentures | 125,991 | — | 85,557 | — | ||||||||
Accrued interest payable | 3,584 | 3,584 | — | — | ||||||||
Interest rate swaps | 14,725 | — | 14,725 | — | ||||||||
Total financial liabilities | $ | 8,246,418 | 6,094,463 | 2,119,547 | — | |||||||
Note 21. Contingencies and Commitments
The Company is a party to financial instruments with off-balance sheet risk in the normal course of business to meet the financing needs of its customers. These financial instruments include commitments to extend credit and letters of credit, and involve, to varying degrees, elements of credit risk. The Company’s exposure to credit loss in the event of nonperformance by the other party to the financial instrument for commitments to extend credit is represented by the contractual amount of those instruments. The Company uses the same credit policies in making commitments and conditional obligations as it does for on-balance sheet instruments.
The Company had the following outstanding commitments:
(Dollars in thousands) | December 31, 2017 | December 31, 2016 | ||||
Unused lines of credit | $ | 1,565,112 | 1,325,236 | |||
Letters of credit | 40,082 | 26,162 | ||||
Total outstanding commitments | $ | 1,605,194 | 1,351,398 | |||
The Company is a defendant in legal proceedings arising in the normal course of business. In the opinion of management, the disposition of pending litigation will not have a material affect on the Company’s consolidated financial position, results of operations or liquidity.
115
Note 22. Mergers and Acquisitions
On April 30, 2017, the Company acquired 100 percent of the outstanding common stock of TFB Bancorp, Inc. and its wholly-owned subsidiary, The Foothills Bank, a community bank based in Yuma, Arizona. Foothills provides banking services to individuals and businesses in Arizona, with banking offices located in Yuma, Prescott and Casa Grande, Arizona. The acquisition expands the Company’s market into the state of Arizona and further diversifies the Company’s loan, customer and deposit base. Foothills merged into the Bank and operates as a separate Bank division under its existing name and management team. The Foothills acquisition was valued at $64,015,000 and resulted in the Company issuing 1,381,661 shares of its common stock and $17,342,000 in cash in exchange for all of Foothills’ outstanding common stock shares. The fair value of the Company shares issued was determined on the basis of the closing market price of the Company’s common stock on the April 30, 2017 acquisition date. The excess of the fair value of consideration transferred over total identifiable net assets was recorded as goodwill. The goodwill arising from the acquisition consists largely of the synergies and economies of scale expected from combining the operations of the Company and Foothills. None of the goodwill is deductible for income tax purposes as the acquisition was accounted for as a tax-free exchange.
On August 31, 2016, the Company acquired 100 percent of the outstanding common stock of Treasure State Bank, a community bank based in Missoula, Montana. TSB provides banking services to individuals and businesses in the greater Missoula market. TSB merged into the Bank and became a part of the First Security Bank of Missoula bank division. The TSB acquisition was valued at $13,940,000 and resulted in the Company issuing 349,545 shares of its common stock and $3,475,000 in cash in exchange for all of TSB’s outstanding common stock shares. The fair value of the Company shares issued was determined on the basis of the closing market price of the Company’s common stock on the August 31, 2016 acquisition date. The excess of the fair value of consideration transferred over total identifiable net assets was recorded as goodwill. The goodwill arising from the acquisition consists largely of the synergies and economies of scale expected from combining the operations of the Company and TSB. None of the goodwill is deductible for income tax purposes as the acquisition was accounted for as a tax-free exchange.
The assets and liabilities of Foothills and TSB were recorded on the Company’s consolidated statements of financial condition at their estimated fair values as of the April 30, 2017 and August 31, 2016 acquisition dates, respectively, and their results of operations have been included in the Company’s consolidated statements of operations since those dates. The following table discloses the calculation of the fair value of the consideration transferred, the total identifiable net assets acquired and the resulting goodwill arising from the Foothills and TSB acquisitions:
Foothills | TSB | |||||
(Dollars in thousands) | April 30, 2017 | August 31, 2016 | ||||
Fair value of consideration transferred | ||||||
Fair value of Company shares issued, net of equity issuance costs | $ | 46,673 | 10,465 | |||
Cash consideration for outstanding shares | 17,342 | 3,475 | ||||
Contingent consideration | — | — | ||||
Total fair value of consideration transferred | 64,015 | 13,940 | ||||
Recognized amounts of identifiable assets acquired and liabilities assumed | ||||||
Identifiable assets acquired | ||||||
Cash and cash equivalents | 13,251 | 10,176 | ||||
Investment securities | 25,420 | — | ||||
Loans receivable | 292,529 | 51,875 | ||||
Core deposit intangible 1 | 4,331 | 762 | ||||
Accrued income and other assets | 19,699 | 6,937 | ||||
Total identifiable assets acquired | 355,230 | 69,750 | ||||
Liabilities assumed | ||||||
Deposits | 296,760 | 58,364 | ||||
FHLB advances | 22,800 | 3,260 | ||||
Accrued expenses and other liabilities | 2,264 | 601 | ||||
Total liabilities assumed | 321,824 | 62,225 | ||||
Total identifiable net assets | 33,406 | 7,525 | ||||
Goodwill recognized | $ | 30,609 | 6,415 | |||
______________________________
1 The core deposit intangible for each acquisition was determined to have an estimated life of 10 years.
116
Note 22. Mergers and Acquisitions (continued)
The fair value of the Foothills and TSB assets acquired includes loans with fair values of $292,529,000 and $51,875,000, respectively. The gross principal and contractual interest due under the Foothills and TSB contracts is $303,527,000 and $54,819,000, respectively. The Company evaluated the principal and contractual interest due at each of the acquisition dates and determined that insignificant amounts were not expected to be collectible.
The Company incurred $1,127,000 of third-party acquisition-related costs in connection with the Foothills acquisition during the year ended December 31, 2017. The Company incurred $456,000 of third-party acquisition-related costs in connection with the TSB acquisition during the year ended December 31, 2016. The expenses are included in other expense in the Company's consolidated statements of operations.
Total income consisting of net interest income and non-interest income of the acquired operations of Foothills was approximately $13,625,000 and net income was approximately $2,626,000 from April 30, 2017 to December 31, 2017. The following unaudited pro forma summary presents consolidated information of the Company as if the Foothills acquisition had occurred on January 1, 2016:
Years ended | ||||||
(Dollars in thousands) | December 31, 2017 | December 31, 2016 | ||||
Net interest income and non-interest income | $ | 462,603 | 436,678 | |||
Net income | 114,187 | 124,373 | ||||
Total income consisting of net interest income and non-interest income of the acquired operations of TSB was approximately $1,800,000 and net income was approximately $897,000 from August 31, 2016 to December 31, 2016. The following unaudited pro forma summary presents consolidated information of the Company as if the TSB acquisition had occurred on January 1, 2015:
Years ended | ||||||
(Dollars in thousands) | December 31, 2016 | December 31, 2015 | ||||
Net interest income and non-interest income | $ | 424,242 | 392,252 | |||
Net income | 120,929 | 116,577 | ||||
Note 23. Subsequent Events
On January 31, 2018, the Company acquired 100 percent of the outstanding common stock of Columbine Capital Corp., and its wholly-owned subsidiary, Collegiate Peaks Bank, a community bank based in Buena Vista, Colorado. Collegiate provides banking services to businesses and individuals in the Mountain and Front Range communities of Colorado, with banking offices located in Aurora, Buena Vista, Denver and Salida. Collegiate will operate as a division of the Bank under the name “Collegiate Peaks Bank, division of Glacier Bank.” The Collegiate acquisition was valued at $96,083,000 and resulted in the Company issuing common stock and paying cash and other considerations in exchange for all of Collegiate's outstanding common stock shares. The fair value of the Company shares issued was determined on the basis of the closing market price of the Company's common stock shares on the January 31, 2018 acquisition date. The initial accounting for the Collegiate acquisition has not been completed because the fair value of financial assets, financial liabilities and goodwill have not yet been determined.
As a result of the closing of the Collegiate acquisition, the Company crossed the $10 billion asset threshold and will now be subject to heightened regulations required by the Dodd-Frank Act. The Company will be required to, among other requirements: 1) perform annual stress tests; 2) calculate its FDIC deposit assessment base using a performance score and a loss-severity score system; and 3) be examined for compliance with federal consumer protection laws primarily by the Consumer Financial Protection Bureau (the “CFPB”). The Company will also be subject to the interchange fee cap imposed by the Durbin Amendment to the Dodd-Frank Act, which is expected to have a significant financial impact to the Company’s earnings.
117
Item 9. Changes in and Disagreements with Accountants on Accounting and Financial Disclosure
There have been no changes or disagreements with accountants on accounting and financial disclosure.
Item 9A. Controls and Procedures
Evaluation of Disclosure Controls and Procedures
An evaluation was carried out under the supervision and with the participation of the Company’s management, including the CEO and Chief Financial Officer (“CFO”), of the effectiveness of the disclosure controls and procedures. Based on that evaluation, the CEO and CFO have concluded that as of the end of the period covered by this report, the disclosure controls and procedures are effective to provide reasonable assurance that information required to be disclosed by the Company in reports that are filed or submitted under the Securities Exchange Act of 1934 are recorded, processed, summarized and timely reported as provided in the SEC’s rules and forms. As a result of this evaluation, there were no significant changes in the internal control over financial reporting during the year ended December 31, 2017 that have materially affected, or are reasonable likely to materially affect, the internal control over financial reporting.
Management’s Report on Internal Control Over Financial Reporting
Management is responsible for establishing and maintaining effective internal control over financial reporting as it relates to its financial statements presented in conformity with GAAP. The Company’s internal control system was designed to provide reasonable assurance to the Company’s management and Board of Directors regarding the preparation and fair presentation of published financial statements in accordance with GAAP. Internal control over financial reporting includes self monitoring mechanisms and actions are taken to correct deficiencies as they are identified.
There are inherent limitations in any internal control, no matter how well designed, misstatements due to error or fraud may occur and not be detected, including the possibility of circumvention or overriding of controls. Accordingly, even an effective internal control system can provide only reasonable assurance with respect to financial statement preparation. Further, because of changes in conditions, the effectiveness of an internal control system may vary over time.
Management assessed its internal control structure over financial reporting as of December 31, 2017. This assessment was based on criteria for effective internal control over financial reporting described in the “2013 Internal Control – Integrated Framework” issued by the Committee of Sponsoring Organizations of the Treadway Commission. Based on this assessment, management asserts that the Company maintained effective internal control over financial reporting as it relates to its financial statements presented in conformity with GAAP.
BKD, LLP, the independent registered public accounting firm that audited the financial statements for the year ended December 31, 2017, has issued an attestation report on the Company’s internal control over financial reporting. Such attestation report expresses an unqualified opinion on the effectiveness of the Company’s internal control over financial reporting as of December 31, 2017 and is included in “Item 8. Financial Statements and Supplementary Data.”
Item 9B. Other Information
None
118
PART III
Item 10. Directors, Executive Officers and Corporate Governance
Information regarding “Directors and Executive Officers” is set forth under the headings “Election of Directors” and “Management – Named Executive Officers who are not Directors” of the Company’s 2018 Annual Meeting Proxy Statement (“Proxy Statement”) and is incorporated herein by reference.
Information regarding “Compliance with Section 16(a) of the Exchange Act” is set forth under the section “Section 16(a) Beneficial Ownership Reporting Compliance” of the Company’s Proxy Statement and is incorporated herein by reference.
Information regarding the Company’s audit committee is set forth under the heading “Meetings and Committees of the Board of Directors – Committee Membership” in the Company’s Proxy Statement and is incorporated herein by reference.
Consistent with the requirements of the Sarbanes-Oxley Act, the Company has adopted a code of ethics applicable to its senior financial officers. The code of ethics can be accessed electronically by visiting the Company’s website at www.glacierbancorp.com and is incorporated by reference to the Company’s 2016 annual report on Form 10-K.
Item 11. Executive Compensation
Information regarding “Executive Compensation” is set forth under the headings “Compensation of Directors” and “Executive Compensation” of the Company’s Proxy Statement and is incorporated herein by reference.
Information regarding “Compensation Committee Interlocks and Insider Participation” is set forth under the heading “Compensation of Directors - Compensation Committee Interlocks and Insider Participation” of the Company’s Proxy Statement and is incorporated herein by reference.
Information regarding the “Compensation Committee Report” is set forth under the heading “Report of Compensation Committee” of the Company’s Proxy Statement and is incorporated herein by reference.
Item 12. Security Ownership of Certain Beneficial Owners and Management and Related Stockholder Matters
Information regarding “Security Ownership of Certain Beneficial Owners and Management and Related Stockholder Matters” is set forth under the headings “Voting Securities and Principal Holders Thereof,” “Compensation Discussion and Analysis” and “Compensation of Directors” of the Company’s Proxy Statement and is incorporated herein by reference.
Item 13. Certain Relationships and Related Transactions, and Director Independence
Information regarding “Certain Relationships and Related Transactions, and Director Independence” is set forth under the headings “Transactions with Management” and “Corporate Governance – Director Independence” of the Company’s Proxy Statement and is incorporated herein by reference.
Item 14. Principal Accounting Fees and Services
Information regarding “Principal Accounting Fees and Services” is set forth under the heading “Auditors – Fees Paid to Independent Registered Public Accounting Firm” of the Company’s Proxy Statement and is incorporated herein by reference.
119
PART IV
Item 15. Exhibits, Financial Statement Schedules
List of Financial Statements and Financial Statement Schedules
(a) The following documents are filed as a part of this report:
(1) Financial Statements and
(2) Financial Statement schedules required to be filed by Item 8 of this report.
(3) The following exhibits are required by Item 601 of Regulation S-K and are included as part of this Form 10-K:
Exhibit No. | Exhibit | ||
3(i) | |||
3(ii) | |||
10(a) * | |||
10(b) * | |||
10(c) * | |||
10(d) * | |||
10(e) * | |||
10(f) * | |||
10(g) * | |||
10(h) * | |||
10(i) * | |||
10(j) * | |||
10(k) * | |||
10(l) * | |||
14 | |||
21 | Subsidiaries of the Company (See item 1, “Subsidiaries”) | ||
23 | |||
31.1 | |||
31.2 | |||
32 | |||
101 | The following financial information from Glacier Bancorp, Inc’s Annual Report on Form 10-K for the year ended December 31, 2017 is formatted in XBRL: 1) the Consolidated Statements of Financial Condition; 2) the Consolidated Statements of Operations; 3) the Consolidated Statements of Stockholders’ Equity and Comprehensive Income; 4) the Consolidated Statements of Cash Flows; and 5) the Notes to Consolidated Financial Statements. | ||
______________________________
1 | Incorporated by reference to Exhibits 3.i. and 3.ii included in the Company’s Quarterly Report on form 10-Q for the quarter ended June 30, 2008. |
2 | Incorporated by reference to Exhibits 10(c) and 10(d) included in the Company’s Form 10-K for the year ended December 31, 2008. |
3 | Incorporated by reference to Exhibits 99.1 through 99.3 of the Company’s S-8 Registration Statement (No. 333-125024). |
4 | Incorporated by reference to Exhibits 99.1 through 99.3 of the Company’s S-8 Registration Statement (No. 333-204023). |
5 Incorporated by reference to Exhibits 10.1 and 10.2 included in the Company’s Form 8-K filed by the Company on January 4, 2017.
6 Incorporated by reference to Exhibit 10.1 included in the Company’s Form 8-K filed by the Company on June 22, 2015.
7 Incorporated by reference to Exhibit 10.1 included in the Company’s Form 8-K filed by the Company on October 31, 2012.
8 Incorporated by reference to Exhibit 14 included in the Company’s Form 10-K for the year ended December 31, 2016.
* | Compensatory Plan or Arrangement |
All other financial statement schedules required by Regulation S-X are omitted because they are not applicable, not material or because the information is included in the consolidated financial statements or related notes.
Item 16. Form 10-K Summary
None
120
SIGNATURES
Pursuant to the requirements of Section 13 or 15(d) of the Securities Exchange Act of 1934, the Registrant has duly caused this report to be signed on its behalf by the undersigned, thereunto duly authorized on February 22, 2018.
GLACIER BANCORP, INC. | |||
By: /s/ Randall M. Chesler | |||
Randall M. Chesler | |||
President and CEO | |||
Pursuant to the requirements of the Securities Exchange Act of 1934, this report has been signed below on February 22, 2018, by the following persons on behalf of the registrant and in the capacities indicated.
/s/ Randall M. Chesler | President, CEO, and Director | |
Randall M. Chesler | (Principal Executive Officer) | |
/s/ Ron J. Copher | Executive Vice President and CFO | |
Ron J. Copher | (Principal Financial Accounting Officer) | |
Board of Directors | ||
/s/ Dallas I. Herron | Chairman | |
Dallas I. Herron | ||
/s/ Sherry L. Cladouhos | Director | |
Sherry L. Cladouhos | ||
/s/ James M. English | Director | |
James M. English | ||
/s/ Annie M. Goodwin | Director | |
Annie M. Goodwin | ||
/s/ Craig A. Langel | Director | |
Craig A. Langel | ||
/s/ Douglas J. McBride | Director | |
Douglas J. McBride | ||
/s/ John W. Murdoch | Director | |
John W. Murdoch | ||
/s/ Mark J. Semmens | Director | |
Mark J. Semmens | ||
/s/ George R. Sutton | Director | |
George R. Sutton | ||
121