Attached files
| file | filename |
|---|---|
| EX-32.2 - EX-32.2 - Financial Engines, Inc. | fngn-ex322_9.htm |
| EX-32.1 - EX-32.1 - Financial Engines, Inc. | fngn-ex321_11.htm |
| EX-31.2 - EX-31.2 - Financial Engines, Inc. | fngn-ex312_7.htm |
| EX-31.1 - EX-31.1 - Financial Engines, Inc. | fngn-ex311_10.htm |
| EX-23.1 - EX-23.1 - Financial Engines, Inc. | fngn-ex231_8.htm |
| EX-21.1 - EX-21.1 - Financial Engines, Inc. | fngn-ex211_6.htm |
UNITED STATES
SECURITIES AND EXCHANGE COMMISSION
Washington, D.C. 20549
Form 10-K
(Mark One)
|
☒ |
ANNUAL REPORT PURSUANT TO SECTION 13 OR 15(d) OF THE SECURITIES EXCHANGE ACT OF 1934 |
For the fiscal year ended December 31, 2017
OR
|
☐ |
TRANSITION REPORT PURSUANT TO SECTION 13 OR 15(d) OF THE SECURITIES EXCHANGE ACT OF 1934 |
For the transition period from to
Commission File No. 001-34636
FINANCIAL ENGINES, INC.
(Exact name of registrant as specified in its charter)
|
Delaware |
|
94-3250323 |
|
(State or other jurisdiction of incorporation or organization) |
|
(I.R.S. Employer Identification No.) |
1050 Enterprise Way, 3rd Floor
Sunnyvale, California 94089
(Address of principal executive offices, Zip Code)
(408) 498-6000
(Registrant’s telephone number, including area code)
Securities registered pursuant to Section 12(b) of the Act:
|
Common Stock, $0.0001 par value per share |
|
The NASDAQ Stock Market LLC |
Securities registered pursuant to Section 12(g) of the Act:
None
Indicate by check mark if the registrant is a well-known seasoned issuer, as defined in Rule 405 of the Securities Act. Yes ☒ No ☐
Indicate by check mark if the registrant is not required to file reports pursuant to Section 13 or Section 15(d) of the Act. Yes ☐ No ☒
Indicate by check mark whether the registrant (1) has filed all reports required to be filed by Section 13 or 15(d) of the Securities Exchange Act of 1934 during the preceding 12 months (or for such shorter period that the registrant was required to file such reports), and (2) has been subject to such filing requirements for the past 90 days. Yes ☒ No ☐
Indicate by check mark whether the registrant has submitted electronically and posted on its corporate Web site, if any, every Interactive Data File required to be submitted and posted pursuant to Rule 405 of Regulation S-T (§ 232.405 of this chapter) during the preceding 12 months (or for such shorter period that the registrant was required to submit and post such files). Yes ☒ No ☐
Indicate by check mark if disclosure of delinquent filers pursuant to Item 405 of Regulation S-K is not contained herein, and will not be contained, to the best of registrant’s knowledge, in definitive proxy or information statements incorporated by reference in Part III of this Form 10-K or any amendment to Form 10-K. ☒
Indicate by check mark whether the registrant is a large accelerated filer, an accelerated filer, a non-accelerated filer, a smaller reporting company, or an emerging growth company. See the definitions of “large accelerated filer,” “accelerated filer”, “smaller reporting company” and “emerging growth company” in Rule 12b-2 of the Exchange Act. (Check one):
|
Large accelerated filer |
|
☒ |
|
Accelerated filer |
|
☐ |
|
Non-accelerated filer |
|
☐ (Do not check if a smaller reporting company) |
|
Smaller reporting company |
|
☐ |
|
Emerging growth company |
|
☐ |
|
|
|
|
If an emerging growth company, indicate by check mark if the registrant has elected not to use the extended transition period for complying with any new or revised financial accounting standards provided pursuant to Section 13(a) of the Exchange Act. ☐
Indicate by check mark whether the registrant is a shell company (as defined in Rule 12b-2 of the Act). Yes ☐ No ☒
The aggregate market value of the registrant’s common stock held by non-affiliates of the registrant was approximately $911,886,000 based upon the closing price of $36.60 of such common stock on The NASDAQ Global Select Market on June 30, 2017 (the last business day of the registrant’s most recently completed second fiscal quarter). Shares of common stock held as of June 30, 2017 by each director and executive officer of the registrant, as well as shares held by each holder of 5% of the common stock known to the registrant, have been excluded for purposes of the foregoing calculation. This determination of affiliate status is not a conclusive determination for other purposes.
As of January 31, 2018, there were 63,061,372 shares of common stock of the registrant outstanding.
DOCUMENTS INCORPORATED BY REFERENCE:
Portions of the Proxy Statement for the Annual Meeting of Stockholders (the “Proxy Statement”) to be held on May 22, 2018, and to be filed pursuant to Regulation 14A within 120 days after registrant’s fiscal year ended December 31, 2017 are incorporated by reference into Part III of this Report.
|
|
|
|
|
Page |
|
|
|
|
1 |
|
|
|
|
|||
|
Item 1. |
|
|
1 |
|
|
Item 1A. |
|
|
15 |
|
|
Item 1B. |
|
|
29 |
|
|
Item 2. |
|
|
30 |
|
|
Item 3. |
|
|
30 |
|
|
Item 4. |
|
|
30 |
|
|
|
|
|||
|
|
|
|
31 |
|
|
|
|
|||
|
Item 5. |
|
|
31 |
|
|
Item 6. |
|
|
34 |
|
|
Item 7. |
|
Management’s Discussion and Analysis of Financial Condition and Results of Operations |
|
37 |
|
Item 7A. |
|
|
70 |
|
|
Item 8. |
|
|
70 |
|
|
Item 9. |
|
Changes and Disagreements with Accountants on Accounting and Financial Disclosure |
|
71 |
|
Item 9A. |
|
|
71 |
|
|
Item 9B. |
|
|
71 |
|
|
|
|
|||
|
|
|
|
72 |
|
|
|
|
|||
|
Item 10. |
|
|
72 |
|
|
Item 11. |
|
|
72 |
|
|
Item 12. |
|
Security Ownership of Certain Beneficial Owners and Management and Related Stockholder Matters |
|
72 |
|
Item 13. |
|
Certain Relationships and Related Transactions, and Director Independence |
|
73 |
|
Item 14. |
|
|
73 |
|
|
|
|
|||
|
|
|
|
74 |
|
|
|
|
|||
|
Item 15. |
|
|
74 |
|
|
Item 16. |
|
|
77 |
|
i
This Report contains forward-looking statements that involve risks and uncertainties. The forward-looking statements are contained principally in the sections entitled “Business,” “Risk Factors” and “Management’s Discussion and Analysis of Financial Condition and Results of Operations.” In some cases, you can identify forward-looking statements by terms such as “may,” “will,” “goal,” “intend,” “could,” “can,” “would,” “expect,” “believe,” “designed to,” “estimate,” “predict,” “potential,” “plan,” or the negative of these terms, and similar expressions intended to identify forward-looking statements. These statements reflect our current views with respect to future events and are based on assumptions and subject to risks and uncertainties. Given these uncertainties, you should not place undue reliance on these forward-looking statements. Forward-looking statements include, but are not limited to, statements regarding: anticipated trends and challenges in our business and the markets in which we operate; the capabilities, benefits and effectiveness of our services; our strategy; our intention to sell our services to additional plan sponsors; our plans for future services, enhancements of existing services and our growth; our expectations that we will continue to earn on a consolidated basis, a significant portion of our revenue through our subadvisory relationships; our expectations that compliance costs and liability risks for investment advisers will increase; our research program; our competitive position; our expectations regarding our expenses, revenue, and revenue growth; our expectation that connectivity costs will increase; our effective tax rate, our deferred tax assets, our anticipated cash needs, and our estimates regarding our capital requirements and our needs for additional financing; estimated cash incentive compensation payments, including the amounts and timing thereof; expectations regarding cash payments for tax withholding, including the amounts and timing thereof; contractual obligations; our exposure to market risk, including our expectations regarding the percentage of revenue derived from fees based on the market value of AUM increasing over time and the impact of our fee calculation methodologies; our ability to retain and attract customers; our regulatory environment; our ability to recruit and retain professionals; volatility of our stock price; our expectations regarding the amounts, timing and frequency of any payment of dividends; our expectations regarding our stock repurchase program; our expectations for granting equity awards, and the potential financial and accounting impact related thereto; impact of accounting policies; benefit of non-GAAP financial measures; our disclosure controls and procedures; our legal proceedings; intellectual property; our expectations regarding competition; and sources of revenue. These statements involve known and unknown risks, uncertainties and other factors which may cause our actual results, performance or achievements to be materially different from any future results, performances or achievements expressed or implied by the forward-looking statements. Forward-looking statements are subject to risks and uncertainties that could cause actual results to differ materially from those projected. These risks and uncertainties include, but are not limited to, the risks set forth throughout this Report, including under Item 1, “Business” and under Item 1A, “Risk Factors.” These forward-looking statements speak only as of the date hereof. We expressly disclaim any obligation or undertaking to release publicly any updates or revisions to any forward-looking statements contained herein to reflect any change in our expectations with regard thereto or any change in events, conditions or circumstances on which any such statement is based.
Financial Engines, Inc. was incorporated on May 13, 1996 under the laws of the state of California and is headquartered in Sunnyvale, California. In February 2010, Financial Engines, Inc. was reincorporated in the state of Delaware. Our investment advisory and management services are provided through our subsidiary, Financial Engines Advisors L.L.C., a federally registered investment adviser. In February 2016, we completed the acquisition of Kansas City 727 Acquisition LLC, a Delaware limited liability corporation, as well as its subsidiaries and certain affiliates (collectively, “The Mutual Fund Store”). The Mutual Fund Store operated as a federally registered investment advisor. References in this Report to “Financial Engines,” “our company” “we,” “us” and “our” refer to Financial Engines, Inc. and its consolidated subsidiaries during the periods presented unless the context requires otherwise. Item 1 describes the Financial Engines business as of December 31, 2017, unless noted otherwise.
1
FINANCIAL ENGINES®, INVESTOR CENTRAL®, RETIREMENT HELP FOR LIFE®, and the Financial Engines logo are all trademarks or service marks owned by Financial Engines, Inc., registered in the United States or other countries. The marks “Income+,” “Investing Sense,” “Retirement Paycheck,” and “Financial Engines Investment Advisor” are also trademarks owned by Financial Engines, Inc. All other trademarks, service marks and trade names appearing in this filing are the property of their respective owners.
Our Company
We are a leading provider of independent, technology-enabled financial advisory services, discretionary portfolio management, personalized investment advice, financial and retirement income planning, and financial education and guidance. We help individuals, either online or with an advisor, develop a strategy to reach financial goals by offering a comprehensive set of services, including holistic, personalized plans for saving and investing, assessments of retirement income, and the option to meet face-to-face with a financial advisor at one of more than 140 advisor centers nationwide. As the burden of retirement investing shifts from employer-sponsored retirement plans to the individual, we believe that there is an increasing need for assistance and guidance on how to invest for retirement wealth. Our advice and planning services cover employer-sponsored defined contribution (DC) accounts (401(k), 457, and 403(b) plans), IRA accounts, and taxable accounts.
We use our proprietary advice technology platform to provide our services to millions of individual investors, both DC plan participants in the workplace as well as retail investors, on a cost-efficient basis. We believe that our services have significantly increased the accessibility of low-cost, high-quality, independent, personalized portfolio management services, investment advice and financial planning.
Our business model of comprehensive financial planning is based primarily on providing access to our advisory services through DC plans in the workplace, and expanding that connection to a holistic financial advisory relationship with our clients. We also provide advisory services to individual clients who access our services directly. Clients are defined as individuals who utilize our services, including Professional Management, Personal Advisor, Online Advice, education or guidance. We work with three key constituencies: individual investors, plan sponsors (employers offering DC plans to their employees) and plan providers (companies providing administrative services to plan sponsors). We provide the following benefits for each of these constituencies:
Individual Investors: For individuals, we provide discretionary portfolio management, personalized investment advice, financial and retirement income planning, financial education and guidance that is free of product conflict. Individual clients may access our services as DC plan participants in the workplace (as employees of companies offering DC plans) or may choose to access our services as a retail investor directly by meeting with an advisor at one of our more than 140 locations.
Plan Sponsors: For DC plan sponsors, our services are designed to improve employee satisfaction and reduce fiduciary and business risk by evaluating, disclosing and addressing investment and savings decisions by plan participants both before and after retirement.
Plan Providers: For DC plan providers, our services can represent a cost-effective method of providing personalized, independent investment advice that can be an attractive and increasingly necessary service for the largest plan sponsors. Providing these services helps plan providers compete more effectively.
We deliver our services to plan sponsors and plan participants primarily through connections to nine DC plan providers. We target large plan sponsors across a wide range of industries. For individual retail clients whom we service directly, we deliver services through individual client agreements entered into with our network of investment advisors.
2
As of December 31, 2017, our services were available to 747 plan sponsors representing approximately 9.8 million participants and approximately $1.22 trillion of assets in DC plans for which we have made our discretionary portfolio service available to eligible prospective clients in the workplace, which we refer to as DC Assets Under Contract, or DC AUC. Our DC AUC does not include assets in plans for which we have signed contracts but have not yet made our discretionary portfolio service available. We do not derive revenue based on DC AUC but believe that DC AUC can be a useful indicator of the additional plan assets available for enrollment efforts that, if successful, would result in these assets becoming AUM.
As of December 31, 2017, individual clients enrolled in our discretionary portfolio management services, were over 1,058,000 and we had approximately $169.4 billion in assets under management, or AUM. AUM is defined as the amount of assets that we manage as part of our discretionary portfolio management services, which includes general portfolio advisory management, as well as the services we market as Professional Management and Personal Advisor. Our business model is characterized by generating revenue through three primary sources: professional management, platform and other revenue, as discussed below in “Revenue”.
Products and Services
We provide independent, personalized, technology-enabled financial planning services, including education and guidance, portfolio management, investment advice and retirement income services. Clients primarily access our services through plan providers but may also access services directly at one of our advisor center locations. Our services are available online and through advisors, both in person and over the phone. Financial Engines advisory services available to clients include discretionary portfolio management, online advice, income planning and financial wellness.
|
|
• |
Discretionary portfolio management – Personalized asset management available through: |
|
|
• |
Professional Management - a discretionary portfolio management service for DC participants who want to work with or delegate the management of their retirement accounts to a professional with the help of an advisor team; |
|
|
• |
Personal Advisor – a discretionary portfolio management service for clients who want to partner with a dedicated advisor representative for help with 401(k), IRA and/or taxable assets, or for comprehensive financial planning; |
|
|
• |
Online Advice - personalized online savings and investment advice and retirement income projections for clients who want to manage their retirement themselves; |
|
|
• |
Financial Planning and Retirement Income Planning – access to goals-based financial planning and retirement income planning services, including Social Security guidance; and |
|
|
• |
Financial Wellness – a wide range of financial education and guidance delivered through multiple channels, including in person, on-site events, online content and phone-based advisors. |
The breadth of our services are described in more detail below.
Professional Management. Our Professional Management service provides discretionary portfolio management service for individuals in the workplace who want affordable and personalized portfolio management for their retirement accounts. The service provides retirement account management and retirement income services from an independent investment advisor without the conflicts of interest that can arise when an advisor offers proprietary products. We developed our Professional Management service to reach a large number of plan participants on a cost-effective basis and assist them on the path to a secure retirement. With this service, which is available to DC participants, we provide discretionary management of the client’s assets and make investment decisions on behalf of the client. When DC plan participants enroll in our Professional Management service, we use our proprietary investment methodologies, which we call our Advice Engines, to create personalized, diversified portfolios and provide ongoing management. Our investment management takes into account the investment alternatives available in the client’s DC plan, including any employer stock, as determined and approved by a plan fiduciary other than us, and can take into account other identified holdings of the plan participant.
3
Personal Advisor. Our Personal Advisor service offers discretionary portfolio management for 401(k), IRA and taxable accounts for both DC plan participants and individual retail investors. Clients work with a dedicated advisor to personalize a financial plan that covers accumulation, pre-retirement and retirement phases of planning. Services may cover a wide array of topics – including budget planning, maximizing employer-sponsored retirement plans and IRAs, life insurance needs, estate planning, tax optimization, health care, Social Security optimization, retirement planning, and others - that will impact clients’ short-term and long-term financial goals. Clients and advisors stay connected through regular in-person meetings and calls to monitor and take action to help clients stay on track toward meeting their financial goals.
Online Advice. Our Online Advice service is an Internet-based investment advisory service designed for individuals who wish to take a more active role in personally managing their portfolios. With this service, individuals may elect to follow the advice without delegating discretionary investment decision-making or trading authority to us, making this a non-discretionary service. This service includes interactive access to simulation and portfolio optimization technologies through our Advice Engines. Individuals see a forecast that shows how likely they are to reach their desired retirement goals, get recommendations on which investments to buy or sell, and simulate how their portfolios might perform under a wide variety of economic scenarios. They can also explore different levels of investment risk, savings amounts and retirement horizons, as well as get tax-efficient advice on accounts other than their DC accounts. The service offers investment advice on the fund options available in a DC plan and can also offer advice on IRA and taxable accounts. Since we began offering the Online Advice service, more than 3.8 million participants have accepted our online services agreement.
Financial Planning and Retirement Income Planning. Our services include access to comprehensive goals-based financial planning and retirement income planning services. Enrolled participants in our Professional Management service receive a retirement plan, which sets out investment allocation and savings actions recommended to achieve a targeted retirement income. The retirement plan reviews annual contribution amounts, shows proposed investment allocations, and forecasts retirement income relative to a retirement goal. Individuals are encouraged to provide their personalized information such as desired financial goals, risk preference and employer stock holding preference, to enable us to create a more personalized financial plan and portfolio allocation. Clients may also have access to create a broader financial plan, which extends the Retirement Plan to cover other financial decisions.
|
|
• |
Retirement Income. Our retirement income solutions, including Income+ and Retirement Paycheck, which are features of our Professional Management and Personal Advisor services, respectively, provide clients approaching or in retirement with discretionary portfolio management with an income objective and steady monthly payments from their accounts during retirement, including Social Security claiming guidance and planning. We do not provide the annuity, nor do we receive, accept or charge fees, or pay commissions related to any purchases of insurance products or services related to Income+. |
|
|
• |
Social Security Planning. Social Security claiming guidance is available online and through registered Investment Advisor Representatives. The service is available at no additional cost to help participants nearing retirement better understand their Social Security claiming options by creating personalized strategies that account for single individuals, divorced individuals, spouses, multiple income sources and realistic life expectancies. A Social Security planner is also available to the public on our website at no charge. |
Financial Wellness. A wide range of financial education and guidance delivered through multiple channels, including on-site events, online content and phone-based advisors.
|
|
• |
Education and Guidance. We provide educational content and guidance on a broad range of financial wellness-related topics. The content and guidance are delivered through live events, interactive online tools and advisor access. These services are available at no additional cost to participants at select plan sponsors as well as to prospective clients. |
4
|
|
• |
Advisor Access. Clients may choose to use our services through an in-person advisor. Advisors are able to answer questions and provide education on a range of financial topics. The advisor confirms the client’s financial goals, reviews the client’s financial plan and helps the clients make desired adjustments. Subadvisory DC plan providers also maintain call centers to support participants in the plans record-kept by that provider. |
Revenue
We generate our revenue through three primary sources: professional management, platform and other revenue.
Professional Management. We derive professional management revenue from client fees paid by or on behalf of both DC and individual investor clients who are enrolled in one of our discretionary portfolio management services (either the Professional Management or the Personal Advisor service) for the management of their account assets. We continue to use the term professional management revenue to include revenue from both the Professional Management and Personal Advisor services. Our arrangements with clients using discretionary portfolio management services generally provide for fees based on the value of assets we manage and are generally payable quarterly in arrears. The majority of client fees across both services, as well as across both advisory and subadvisory relationships for DC accounts, are calculated on a monthly basis, as the product of client fee rates and the value of assets under management (AUM) at or near the end of each month. For IRA and taxable accounts, our client fees are calculated on a quarterly basis at the end of each quarter.
Platform. We derive platform revenue from recurring, subscription-based fees for access to our services, including Online Advice, education and guidance. The arrangements generally provide for fees to be paid by the plan sponsor, plan provider or the DC plan itself, depending on the plan structure. Platform revenue is generally paid annually or quarterly in advance and recognized ratably over the term of the subscription period beginning after the completion of customer setup and data connectivity.
Other. Other revenue includes reimbursement for a portion of marketing and client materials from certain subadvisory relationships, and for the year ended December 31, 2016, fees for non-retirement account servicing and franchise royalty fees. As we have acquired all franchises, we no longer have franchise royalty revenue after October 2016.
None of our fees are based on investment performance or other incentive arrangements. Our fees generally are based on AUM, which is influenced by market performance. Our fees are not based on a share of the capital gains or appreciation in a client’s account.
Our total revenue was $310.7 million, $423.9 million and $480.5 million for the years 2015, 2016 and 2017, respectively. We generated professional management revenue of $277.2 million, $385.9 million and $450.3 million for the years 2015, 2016 and 2017, respectively and we generated platform revenue of $30.8 million, $28.4 million and $26.6 million for the years 2015, 2016 and 2017, respectively. We have historically earned, and expect to continue to earn on a consolidated basis, a significant portion of our revenue through our subadvisory relationships. Please refer to the “Management’s Discussion and Analysis of Financial Condition and Results of Operations” section for additional revenue information.
5
Investment Process and Methodology
Our goal is to apply investment techniques traditionally available only to large, sophisticated investors to help individual investors achieve their retirement goals. Our advice services incorporate several of the methodologies developed by our co-founder and economics Nobel Laureate, Professor William F. Sharpe. We use Monte Carlo simulation and proprietary optimization techniques to provide cost-effective, sophisticated and personalized advice that is free from product conflict. Monte Carlo simulation is widely used in investment management and is a statistical technique in which many simulations of an uncertain quantity are run to model the distribution of possible outcomes.
Workplace DC Services. When providing simulations and investment recommendations, our methodology evaluates a variety of factors that impact investment returns, including fees, portfolio turnover, management performance, tax-efficiency, and a fund’s investment style where we identify the underlying asset class exposures and active management risk associated with asset allocation changes by a fund manager in response to market conditions and decisions to weight specific security holdings differently than comparable indices. By modeling the characteristics of specific investment alternatives, we are able to provide quantitative estimates of possible future outcomes and make investment recommendations. We are also able to model the complexities found in large DC plans and to provide investment advice to plan participants that can be implemented within the limits of a given plan’s available options.
Unlike traditional advisory services, our workplace services do not rely on the subjective evaluation of each plan participant’s portfolio by a human investment advisor. Instead, our services rely on Advice Engines (described below under “Investment Technology”) that accept inputs on available investment choices along with a variety of personal information including investment objective, risk tolerance, investment horizon, age, savings, outside personal assets, investor preferences and tax considerations.
Our investment recommendations for workplace accounts are limited to the investment alternatives available in a 401(k) plan, although we do take into account other identified holdings of the plan participant when offering investment advice. With the exception of employer stock, if any, included as an investment alternative, we do not provide advice on or manage single-company securities.
We offer no proprietary investment products, which keeps us free of the conflicts of interest, or the perceptions of conflicts of interest, that can arise for competitors who offer such products. We do not receive differential compensation based on the investments we recommend. For our workplace clients, we do not hold assets in custody or execute trades.
For clients with the Income+ feature enabled, the investment portfolios are structured to provide the potential for steady income payouts throughout retirement. To accomplish this objective, the Income+ optimization approach divides the portfolio into three components: fixed income, an optional purchase of an annuity outside of the plan, and equities. We do not provide annuities or other financial products to any Income+ clients. Over time, the equities are gradually converted into additional fixed income assets to support a higher floor level of income.
Services Offered Directly to Retail Investors. We provide retail clients with two primary asset management services: the standard service and the Retirement Paycheck service. We manage client accounts on a discretionary basis, and the management of those accounts is guided by the stated objective(s) of the client. These objectives may include, generally, growth, income, or a combination of these. The investment products recommended for both services are usually actively and/or passively managed mutual funds and/or exchange-traded funds. For the Retirement Paycheck service, fixed income investments are also recommended, and may include highly-rated bonds, FDIC insured certificates of deposit and U.S. government issued or guaranteed securities.
While we may and can provide investment recommendations on other securities, including equity securities, U.S. government securities, corporate and municipal bonds and variable life insurance and annuities, our focus is on mutual funds and/or exchange-traded funds. We direct custodians to execute trades on behalf of our direct individual clients, whose assets are held in custodial accounts by third parties.
6
Advisors at our branch locations provide advice for individual accounts using asset allocation strategies into mutual funds and ETFs researched and selected by our investment management team. The advisor creates a portfolio based on a selection of several core asset allocation models to fit client needs. The portfolios span the risk spectrum from highly conservative to aggressive, and allocation models are reviewed on a quarterly basis. Additionally, there are a limited number of specialized allocation models for specific situations such as Retirement Paycheck. Our investment management team manages the various asset allocation models, including the oversight of, and selection of, funds.
Investment Technology
We believe high-quality advisory services should be offered to all individuals regardless of wealth. As of December 31, 2017, the median assets under management for all Professional Management service clients was approximately $69,000. Because we service numerous accounts of varying sizes, achieving our objective requires significant scalability to achieve an affordable cost to the investment manager. Our scalable technology has continued to deliver flexibility and results as our business has grown.
Workplace Services. Our Advice Engines consist of two main components: a Simulation Engine and an Optimization Engine. In the course of our development, we have received U.S. patents that relate to various parts of our financial advisory platform, including patents that apply specifically to the Advice Engines.
Workplace Services-Simulation Engine. We have developed a Monte Carlo Simulation Engine that provides plan participants with a view of the potential range of future values of their retirement investments. The Simulation Engine helps plan participants reach informed decisions about the appropriate level of risk, savings and time horizon to improve the likelihood of achieving financial goals. Our Simulation Engine is capable of:
|
|
• |
modeling more than 37,000 securities, including retail mutual funds, stocks, employee stock options, institutional funds, guaranteed investment contracts and stable value funds, exchange-traded funds and fixed-income securities; |
|
|
• |
considering security-specific characteristics such as investment style, expenses, turnover, manager performance, and security-specific and industry risk; |
|
|
• |
forecasting the total household portfolio, including tax-deferred and taxable accounts; |
|
|
• |
incorporating social security, pension income and other retirement benefits; and |
|
|
• |
presenting outcomes in terms of portfolio value or retirement income. |
Workplace DC Services-Optimization Engine. We use our Optimization Engine to construct personalized portfolios. Our Optimization Engine takes into consideration the costs, quality and investment styles of the specific investment alternatives available to a plan participant. Specifically, our investment recommendations take into consideration for each fund the mix of asset class exposures, fund expenses, turnover, fund-specific risk due to active management, manager performance and consistency, user-imposed constraints and tax efficiency, where applicable, to construct a personalized portfolio recommendation for each client.
When constructing a portfolio during the accumulation phase, our Optimization Engine:
|
|
• |
supports dynamic, specific, product-level buy and sell recommendations for Online Advice, which can be readily executed, and automated transactions for the Professional Management service; |
|
|
• |
creates recommended portfolios from the available investment alternatives, such as retail mutual funds, institutional funds and employer stock, in the case of a 401(k) plan, or from either the entire universe of more than 25,000 retail mutual funds, or a subset thereof, in the case of taxable or other tax-deferred accounts; |
|
|
• |
creates recommendations across multiple taxable and tax-deferred accounts; |
7
|
|
• |
for assets held in taxable accounts, considers the impact of personal tax rates, unrealized capital gains and losses, the tax efficiency of specific investment options including the propensity to distribute capital gains and income distributions and the benefit of optimal asset placement to maximize after-tax investment returns; and |
|
|
• |
enables real-time interaction with plan participants allowing them to partially override certain types of recommendations and immediately receive updated advice reflecting these constraints. |
When managing a portfolio during the income phase, our Optimization Engine:
|
|
• |
creates structured 401(k) portfolios of fixed income and equities that enable the generation of steady income payouts that can last for life, and can go up with the market; and |
|
|
• |
takes into consideration fund expenses, bond durations, asset class style exposures, and changes in interest rates to create dynamic portfolios that support steady income payouts. |
Our systems assess a plan participant’s portfolio through a variety of market conditions including variation in inflation, interest rates, and dividends.
Services Offered Directly to Retail Investors. For our services offered directly, we use institutional asset management analytics and third-party vendors (such as FactSet Research Services, Bloomberg, or Morningstar Direct), and proprietary research processes for portfolio construction, performance and risk measurement, contribution and decomposition in both the investment strategy due diligence process and portfolio/allocation construction process.
We use these tools in combination with research and analysis that leverages institutional research providers (such as CornerstoneMacro, EvercoreISI and Bespoke Investment Group) to supplement capital market and macroeconomic data that helps inform risk management and asset allocation decisions. With the combination of the investment due diligence, asset class research and analysis, and capital market and economic assessments, we create portfolios and allocations for advisors to use with clients.
Our advisor representatives then use third-party financial planning technology and software and direct, personal relationships with clients to match clients with the appropriate portfolios and asset allocations given the clients’ goals and objectives and their willingness and ability to accept risk.
Research and Development
Research and development expense includes costs associated with defining and specifying new features and ongoing enhancement to our Advice Engines and other aspects of our service offerings, financial research, quality assurance, related administration and other costs that do not qualify for capitalization. Costs in this area are primarily related to employee compensation for our investment research, product development and engineering personnel and related expenses and, to a lesser extent, related external consulting expenses.
Research and development expenses were $35.6 million, $38.0 million and $44.0 million for the years 2015, 2016 and 2017, respectively.
8
Customers and Key Relationships
Individual Clients. For individuals, we provide discretionary portfolio management, personalized investment advice, financial and retirement income planning, financial education and guidance that is free of product conflict. Our services include our Professional Management, Personal Advisor, or Online Advice services. DC plan participants in the workplace gain access to our services through their DC plan provider platforms or online directly with us, pursuant to agreements between us and the applicable plan sponsor and in accordance with the terms and conditions that apply to the services. Retail investors who choose to access our discretionary portfolio management directly have the option to meet with an advisor face-to-face at one of our more than 140 locations. In direct client relationships with retail investors, we contract directly with the client, including any consents required by a third-party custodian, to enable our advisors to direct securities transactions on their behalf.
Plan Sponsors. We define plan sponsors as employers across a range of industries who offer defined contribution plans to employees. No more than 4% of our revenue was associated with any one plan sponsor for the year ended December 31, 2017. As of December 31, 2017, the average annual sponsor retention over the last three years was 96%. The average annual AUM retention rate over the same period was 97%, which represents the average ratio of AUM from all sponsors as of January 1st versus the same AUM for those sponsors who were retained as of December 31st of each of the last three years. When providing advisory services directly as not as subadvisor, we enter into contracts with plan sponsors. These contracts are typically for an initial three- or five-year term and continue thereafter unless terminated. Under these contracts, at any time during the initial term or thereafter, the plan sponsor can cancel a contract for fiduciary reasons or breach of contract and can generally terminate a contract after the initial term upon 90 days’ notice.
Plan Providers. We define plan providers as the administrators and record-keepers of defined contribution, or DC, plans. In consultation with plan sponsors, plan providers make available a range of investment alternatives through DC plans to individual participants. We work with plan providers to make available discretionary portfolio management and other investment advisory services to the participants in the DC plans of plan sponsors. We deliver our services to plan sponsors and plan participants primarily through existing connections with nine DC plan providers. Our contracts with plan providers generally have terms ranging from three to five years, and have successive automatic renewal terms of one year unless terminated in accordance with prior notice requirements. A majority of these provider agreements are in renewal periods. In addition, a plan provider may terminate its contract with us at any time for specified breaches. We maintain two types of relationships with our plan providers:
|
|
• |
Subadvisory Relationships. In these relationships, the plan provider is the primary advisor and plan fiduciary and we act in a subadvisory capacity. Our contract is with the plan provider and not the plan sponsor. We offer our co-branded services under the plan provider’s brand, with the services typically identified as “powered by Financial Engines.” Revenue is collected by the plan provider who then pays a subadvisory fee to us. We have subadvisory relationships with Alight Financial Advisors, Empower RetirementTM, Vanguard, and Voya. The Alight Financial Advisors subadvisory relationship excludes those sponsors currently under contract with us for a direct advisory relationship. We have historically earned, and expect to continue to earn on a consolidated basis, a significant portion of our revenue through subadvisory relationships with DC plan providers. For the years ended December 31, 2015 and 2017, Alight Financial Advisors accounted for 10% of our total revenue. We did not have any customers that comprised 10% or more of our total revenue for the year ended December 31, 2016. |
9
Our sales and marketing team seeks to increase assets we manage, primarily by adding clients. Our marketing approach is to develop familiarity, trust, and relationships with individual investors, so that we are a natural partner when individuals begin exploring financial help. We seek to build this relationship by being helpful, providing ongoing communication of educational content, basic financial planning modules, and easy access to advisors. We complement this relationship marketing approach by remaining accessible with our phone-based National Advisor Center and our digital website that is accessible from a plan sponsor’s intranet and plan provider’s website. The locations of many of our advisor centers are also aligned with the locations where our DC participants are geographically clustered.
Marketing to Individual Clients:
|
|
• |
Marketing to DC plan participants in the workplace. In the workplace, we must establish relationships and data connections with plan providers, and obtain contracts with plan sponsors to make our services available to their plan participants. Once a DC plan has been set up on our systems and our services have been made available to plan participants, we then conduct ongoing communications and undertake promotional activities to encourage use of our services. These efforts typically include printed or electronic Retirement Evaluations, email notifications, website integration and other forms of online engagement. |
We also conduct an annual communications campaign in conjunction with plan sponsors to deliver a retirement readiness assessment, which highlights specific risks in a participant’s retirement account, provide guidance on how to reduce those risks, and introduce our services as a means of obtaining help in addressing these issues. We typically undertake promotional activities in conjunction with these annual campaigns to incent trial use of the service. In addition, throughout the year, we send communications to engage participants on various financial topics in an effort to build deeper relationships with current and prospective clients.
When a plan sponsor first rolls out our services, the sponsor can choose an active enrollment campaign, in which a plan participant must affirmatively sign up for the Professional Management service, or a passive enrollment campaign, in which a plan participant will become a client of the Professional Management service unless the individual declines the service. Passive enrollment campaigns achieve higher enrollment results at lower acquisition cost per client than do active enrollment campaigns. We may eliminate or reduce our platform fees, as well as reduce the fees payable by plan participants, depending upon the scope of services and methodologies we are able to use, such as passive enrollment. Once a DC plan participant enrolls in our Professional Management service, the retirement assets of that plan participant count toward our AUM.
|
|
• |
Marketing to retail investors. We use a range of channels to reach current and prospective individual retail clients, including digital marketing, affinity programs, hosted live events and seminars, as well as a weekly syndicated radio show called Investing Sense. Once a Personal Advisor client deposits assets into his or her account, those assets count toward our AUM. |
Establishing Relationships and Connections with Plan Providers. We rely on direct sales to create contractual relationships with plan providers. Following contract signing, technical teams from Financial Engines and the plan provider initiate a data connection project that typically takes between four months and one year to complete. Once we have incurred this one-time, up-front cost to establish a relationship and connection with a plan provider, we are able to roll out our services for any plan sponsor of that plan provider.
10
Obtaining Contracts with Plan Sponsors. Either Financial Engines or, in the case of a subadvisory relationship, the plan provider, must obtain a contract with a plan sponsor before we can make available our Professional Management or Online Advice services to that plan sponsor’s participants. We market our services to plan sponsors in the following manner:
|
|
• |
Direct to Plan Sponsor. In the case of direct advisory relationships, we pursue a direct sales strategy with plan sponsors. Our direct sales team’s efforts are supported by an institutional services team that engages in sales efforts with existing plan sponsors. The direct sales and institutional services teams are supported by a marketing team that seeks to generate demand for our services through public relations, industry events, plan provider specific marketing programs and sales support in the field. We intend to sell our services to plan sponsors that are not current clients but are serviced by the plan providers with whom we have relationships. |
|
|
• |
Sell through the Retirement Plan Provider. Where we have a subadvisory relationship with the plan provider, we provide a combination of primary and secondary sales and marketing support depending on the plan sponsor opportunity. Together with the plan provider, we develop a joint sales and rollout plan in which our relationship managers and direct sales team support the plan provider. This distribution model enables us to reach plan sponsors efficiently, while providing consistent and independent investment advice to plan participants. |
Service Delivery and Systems
Our service delivery team is responsible for the rollout, operation and support of our Professional Management, Personal Advisor and Online Advice services in the workplace. The key steps associated with delivering our services in the workplace include contracting with the plan sponsor, obtaining plan and plan participant data and setting up the plan on our system.
For DC plan participants in the workplace, our client implementations team is responsible for project management and the steps involved in setting up and rolling out our services to a plan sponsor. This includes learning the specifics of each plan sponsor’s plan(s), including the fund lineup, fees, matching rules, associated defined benefit, non-qualified and other plans, configuring the plan specifics using our plan sponsor configuration tool, verifying the implementation and approving the commencement of enrollment efforts. The team also oversees the preparation and production of enrollment materials for each participant in the plan. Once a sponsor is set up and rolled out, our client implementations team is also responsible for maintenance of each sponsor’s ongoing plan updates as directed by our account managers and/or subadvisory record-keepers.
The operations team is responsible for data processing and validation of prospect data for new sponsor rollouts and annual campaigns, as well as the ongoing servicing of clients. These client servicing responsibilities include client data load and verification, the coordination and oversight of all printed materials and electronic communications, transaction processing and reconciliation, fee processing and reconciliation and quarterly sponsor report generation.
Our National Advisor Center in Phoenix, Arizona is staffed with registered investment advisor representatives. These advisors service participants through phone and email channels by providing guidance to plan participants, enrollment, and personalization of the participant’s financial profile. Our registered investment advisor representatives and certain call center personnel of the plan providers with whom we work have access to the Financial Engines Professional Advisor, our proprietary client relationship management application, which enables the advisor to edit or add to the personal information used to manage the client’s portfolio allocation. Our services are deployed using industry-standard hardware, software and third-party solutions. We have off-site back-up facilities for our database and network equipment, a disaster recovery plan and on-going third-party security audits to secure the integrity of our systems. We evaluate and improve our systems based on measures of availability, system response time and processing capacity.
11
For retail investors, the key steps associated with delivering our services directly include learning about the client’s current financial state and risk preferences using questionnaires and a third-party financial planning solution. An investment advisor representative or client service manager provides disclosure and oversees the preparation of custodial account and asset transfer paperwork. After the client’s account paperwork is processed by the custodian, the advisor works to establish a personal relationship with the client, build a comprehensive financial plan, and then monitor and adjust the portfolio to help the client reach financial goals. Retail clients receive a quarterly statement.
Competition
We operate in a highly competitive industry, with many investment advice providers competing for business from individual investors, financial advisors and institutional customers. Direct competitors who offer independent portfolio management and investment advisory services to plan participants in the workplace include GuidedChoice and Morningstar. Plan providers that offer directly competing portfolio management and investment advisory services to investors in the workplace include Fidelity. Some plan providers with whom we have relationships also provide, or may provide, competing services or products, which may strain our relationship with these plan providers and could result in less favorable contract terms or contract cancellations.
Retail competitors include financial institutions, such as Charles Schwab & Co., Inc., Edward Jones, Fidelity, and Vanguard, insurance companies, such as MetLife and New York Life, and other registered investment advisors such as Creative Planning, Edelman Financial Services, and Fisher Investments. Emerging competitors include firms that provide portfolio management services delivered primarily through online channels with minimal human interaction such as Betterment, Personal Capital, and Wealthfront (some of which also provide bundled services to the small retirement plan market).
We also face indirect competition from products that could potentially be substitutes for our portfolio management services, investment advice and retirement income services, most notably target-date retirement funds. Target-date funds are offered by multiple financial institutions, such as Fidelity, Vanguard, T. Rowe Price, Wells Fargo, Voya and Empower RetirementTM funds. In addition, competitors to our retirement income features include providers of retirement income products in the defined contribution market, such as Prudential, AllianceBernstein, and other providers of insurance products.
We believe the competitive factors in our industry include:
|
|
• |
ability to provide independent, systemic portfolio management, investment advice and retirement income services based on widely recognized financial economic theory without product conflicts of interest; |
|
|
• |
ability to provide holistic, comprehensive advice across an individual’s 401(k), IRA and taxable accounts; |
|
|
• |
nationwide branch network of registered investment advisor representatives; |
|
|
• |
established investment methodology and technology that allows for personalized, scalable advice across a range of account sizes; |
|
|
• |
value for fees; |
|
|
• |
proprietary methodologies; |
|
|
• |
established relationships with plan providers and plan sponsors; and |
|
|
• |
reputation and experience serving investors. |
We believe we currently compete favorably with respect to these factors.
12
We derive nearly all of our revenue from our investment advisory subsidiary Financial Engines Advisors L.L.C., or FEA. Our investment advisory and management business is subject to extensive, complex and rapidly changing federal and state laws and regulations. FEA is registered as an investment advisor with the SEC and is subject to examination by the SEC. The Investment Advisers Act of 1940, as amended, referred to as the Advisers Act, and related regulations impose numerous obligations and restrictions on registered investment advisers including fiduciary duties, record keeping requirements, operational requirements, marketing requirements and disclosure obligations.
The SEC is authorized to institute proceedings for violations of the Advisers Act, and to impose fines and sanctions, including disgorgement of fees or profits, reimbursement for losses, limiting, restricting or prohibiting a registered investment adviser from carrying on its business, or requiring a registered investment adviser to change its business practices or disclosure, in the event that a registered investment adviser fails to comply with applicable laws and regulations. Our failure to comply with the requirements of the Advisers Act or the related SEC rules and interpretations, or other relevant legal provisions could have a material adverse effect on us. We believe we are in compliance in all material respects with SEC requirements under the Advisers Act and other applicable laws and regulations. Some of our executives and other employees are registered Investment Adviser Representatives with various states through the Investment Adviser Registration Depository and are subject in some states to examination requirements.
FEA and our other registered investment advisor subsidiary are subject to the Employee Retirement Income Security Act of 1974, as amended, referred to as ERISA, and the regulations promulgated thereunder, with respect to investment advisory and management services provided to participants in DC plans covered by ERISA and is also subject to state laws applicable to DC plans not covered by ERISA. We are a fiduciary under ERISA. ERISA and applicable provisions of the Internal Revenue Code of 1986, as amended, referred to as the Code, impose certain duties on persons who are fiduciaries under ERISA and prohibit certain transactions involving ERISA plan clients. We rely on certain regulatory interpretations and guidance in connection with our current business model, including regulations and guidance relating to passive enrollment of participants into our Professional Management service. We provide subadvisory services pursuant to the Department of Labor’s Advisory Opinion 2001-09A. The failure of FEA or our other registered investment advisor subsidiaries to comply with these requirements could have a material adverse effect on us. The Department of Labor is authorized to institute proceedings for violations of ERISA. We believe that we are in compliance in all material respects with ERISA.
We are also subject to state and federal regulations related to privacy, data use and security. These rules require that we develop, implement and maintain written, comprehensive information security programs including safeguards that are appropriate to our size and complexity, the nature and scope of our activities and the sensitivity of any customer information at issue. In recent years, there has been a heightened legislative and regulatory focus on data security, including requiring consumer notification in the event of a data breach. Legislation has been introduced in Congress and there have been several Congressional hearings addressing these issues. From time to time, Congress has considered and may do so again, legislation establishing requirements for data security and response to data breaches that, if implemented, could affect us by increasing our costs of doing business. In addition, several states have enacted security breach legislation requiring varying levels of consumer notification in the event of a security breach. Several other states are considering similar legislation.
13
In recent years, there has been a heightened legislative and regulatory focus on the financial services industry, including revised rules that redefine and expand what constitutes an ERISA fiduciary, call for creation of a self-regulatory framework for investment advisors similar to the regulatory structure that currently exists for broker/dealers through the Financial Industry Regulatory Authority, elimination of pre-dispute arbitration clauses, additional fee disclosures, and the imposition of additional qualification requirements on investment advisors providing services to ERISA plan clients. The Dodd-Frank Wall Street Reform and Consumer Protection Act, referred to as the Dodd-Frank Act, included various financial reform proposals that may affect investment advisers, including FEA. Although some implementing rules and regulations under the Dodd-Frank Act are still pending, it is expected that the compliance costs and liability risks for investment advisers will increase.
Rigorous legal and compliance analysis of our business is important to our culture. Our General Counsel supervises our compliance group, which is responsible for addressing all regulatory and compliance matters that affect our investment advisory activities.
We rely on a combination of trademark, copyright, patent and trade secret protection laws to protect our proprietary technology and our intellectual property. We seek to control access to and distribution of our proprietary information. We enter into confidentiality agreements with our employees, consultants, vendors, plan sponsors and plan providers that generally provide that any confidential or proprietary information developed by us or on our behalf be kept confidential. We have proprietary know-how in software development, implementation and testing methodologies. We also pursue the registration of certain of our trademarks and service marks in the United States and other countries. We have registered the mark “Financial Engines” in Australia, China, the European Community, Hong Kong, Japan, Russia, Switzerland, Taiwan, Tunisia, and the United States. The sun and clouds design, “Investor Central” and “Retirement Help for Life” trademarks are registered in the United States. We also own the trademarks “Fin Engines,” the FE stylized company logo, and the insurance product logo, all of which are in the process of being registered in the U.S. We also own, through the acquisition of The Mutual Fund Store, the following registered (U.S.) trademarks: “Annuity Optimizer,” “Investing Sense,” “M The Mutual Fund Store & design”, M logos (color and black-and-white), “Market Reentry Plan,” “Retirement Paycheck,” “Smart401K,” “Someday Is Not A Day Of The Week,” “The Mutual Fund Show,” “The Mutual Fund Store,” and “We Work Hard For Hardworking People.” In addition, we have registered our domain name, www.FinancialEngines.com. As of December 31, 2017, we have five issued U.S. patents in the following categories: load-aware optimization; tax-aware asset allocation; advice palatability and retirement income planning and payout generation. We also have one issued patent in Australia. These patents have expiration dates ranging from September 11, 2018 to August 1, 2031.
We have designed and implemented and continue to maintain a security program consisting of policies, procedures, and technology meant to maintain the privacy, security and integrity of information, systems, and networks. Among other things, the program includes controls designed to limit and monitor access to authorized systems, networks, and data, prevent inappropriate access or modification, and monitor for threats or vulnerability. Data and assets are categorized based on their sensitivity, and protected accordingly. Subject to customary exclusions and limitations, we also maintain cyber and technology liability insurance, which provides coverage for damages related to data breaches or similar intrusions.
As of December 31, 2017, we employed approximately 935 full-time equivalent employees including employees in service delivery, advisor centers, investment management, product development and engineering, sales and marketing, and general and administrative management. We consider relations with our employees to be good and have never experienced a work stoppage. None of our employees are either represented by a labor union or subject to a collective bargaining agreement.
14
Our website is http://www.financialengines.com. We make available free of charge, on or through our website, our Annual Report on Form 10-K, quarterly reports on Form 10-Q, current reports on Form 8-K and amendments to those reports, if any, or other filings filed or furnished pursuant to Section 13(a) or 15(d) of the Exchange Act as soon as reasonably practicable after electronically filing or furnishing these reports with the SEC. Information contained on our website is not a part of this report. We have adopted a code of ethics applicable to our senior financial officers which is available free of charge, on or through our website’s investor relations page.
The SEC maintains an Internet site at http://www.sec.gov that contains the Annual Report on Form 10-K, quarterly reports on Form 10-Q, current reports on Form 8-K and amendments to those reports, if any, or other filings filed or furnished pursuant to Section 13(a) or 15(d) of the Exchange Act, proxy and information statements. All reports that we file with the SEC may be read and copied at the SEC’s Public Reference Room at 100 F Street, N.E., Washington, DC, 20549. Information about the operation of the Public Reference Room can be obtained by calling the SEC at 1-800-SEC-0330.
Risks Related to Our Business
Our revenue and operating results can fluctuate from period to period, which could cause our share price to fluctuate.
Our revenue and operating results have fluctuated in the past and may fluctuate from period-to-period in the future due to a variety of factors, many of which are beyond our control. Factors relating to our business that may contribute to these fluctuations include the following factors, as well as other factors described elsewhere in this document:
|
|
• |
a reduction of the assets we have under management; |
|
|
• |
failure of our growth strategy or marketing efforts to expand our services, or to retain or acquire clients; |
|
|
• |
termination, non-renewal, or renegotiation of an existing contract with a plan provider, and effects of competition with plan providers; |
|
|
• |
downward pressure on fees we charge for our services, contractual fee reductions, or changes in pricing policies; |
|
|
• |
variations in enrollment, contribution rates, cancellation or withdrawal rates for our discretionary portfolio management services; |
|
|
• |
adverse effects from actual or perceived errors, breaches of contract, confidentiality, privacy, or fiduciary obligations; |
|
|
• |
negative public perception and reputation of our Company or the financial services industry; |
|
|
• |
the impact of any business acquisitions or dispositions we may make, or among plan providers, plan sponsors or competitors; |
|
|
• |
operational, executive or regulatory changes; and |
|
|
• |
geopolitical and other economic factors. |
As a result of these and other factors, the results of any prior quarterly or annual periods should not be relied upon as indications of our future revenue or operating performance.
15
A substantial portion of our revenue is based on fees earned on the value of assets we manage. Our revenue and earnings could suffer if the financial markets experience a downturn or a slowdown in growth that reduces the value, or slows the growth, of our Assets Under Management.
We derive a significant and growing portion of our revenue from client fees based on the assets in the accounts we manage, which we refer to as AUM. The assets we manage include a wide variety of investment alternatives, the value of which can be affected by the performance of the financial markets globally, currency fluctuations, interest rate fluctuations and other factors. Our professional management revenue and fees are generally calculated quarterly using the value of AUM at the end of each month or calendar quarter. Our methodology may result in lower fees if the financial markets are down when fees are calculated, even if the market had performed well earlier in the month or the quarter. In addition, our business is highly concentrated in DC plans. An economic downturn, changes in tax laws, or slowdown in economic growth could cause plan participants or their employers to contribute less to their DC plans, cause fewer eligible employees to participate in DC plans, or cause employees or clients to withdraw funds from or close their DC or retail accounts, which could adversely affect the amount of AUM. If clients are not satisfied with our services or the performance of their portfolios due to a decline in the financial markets or otherwise, our cancellation or account withdrawal rates could increase, which in turn would cause our AUM to decline. Historically, client cancellations rates have typically increased during periods where there has been a significant decline in stock market performance. Any potential decline in AUM would not necessarily be proportional to, and, in total, could be greater than, the overall market decline. If any of these factors reduces the value of assets we have under management, the amount of fees we would earn for managing those assets would decline, and our revenue, operating results and financial condition could be harmed.
Our revenue could be harmed if we fail to enroll new clients in our discretionary portfolio management services, if we experience increased cancellations or unsuccessful marketing results, or if we otherwise fail to increase usage of our services.
Our revenue depends on clients enrolling in our discretionary portfolio management services or, in the case of a passive enrollment campaign, not declining, our services. Increasing client enrollment in our services increases the AUM on which we earn fees. If we are unable to continue to increase our enrollment, or if cancellations increase, our business may not grow as we anticipate. Unanticipated or unsuccessful results from our marketing campaigns, or our inability to successfully employ marketing techniques such as integration with provider websites or outbound calling, or other methods used to attract clients, could also affect our revenue for a particular period. For example, we have found that if plan sponsors do not use our standard marketing campaign, enrollment rates tend to be lower.
As we endeavor to find new ways to grow enrollment, we may introduce marketing strategies or customer experiences that are unsuccessful, in generating enrollment, produce higher cancellation rates, or harm our reputation and jeopardize future enrollment. Individual clients whose accounts we manage may choose at any time to stop having us manage those accounts. Historically, client cancellations rates have typically increased during periods where there has been a significant decline in stock market performance and, in addition, client cancellation rates are typically the highest in the three months immediately following the completion of a given promotional campaign. If we are unsuccessful in our enrollment campaigns, if we lose clients, or if we otherwise fail to increase enrollment rates, our revenue, operating results and financial condition could be harmed.
Our revenue is highly dependent upon a small number of plan providers with whom we have relationships, and the renegotiation or termination of our relationship with any of these plan providers could significantly impact our business.
Our relationships and data connections with plan providers allow us to effectively manage plan participant accounts and integrate our services into plan providers’ current service platforms. These relationships also provide us with an advantage in trying to sign potential plan sponsors.
16
We refer to four of our nine primary DC plan provider relationships as subadvisory relationships, including one plan provider with whom we have a subadvisory relationship for some plan sponsors and a direct advisory relationship for other plan sponsors. Where we act as subadvisor, we do not have a direct relationship with the plan sponsors and therefore may be less able to influence decisions by those plan sponsors to use or continue to use our services or to add additional services. Where we act as subadvisor, we do not know and cannot control the exact terms of the contract between the plan provider and the plan sponsor, which vary on terms such as the length of the contract, renewal and cancellation provisions. We have historically earned, and expect to continue to earn on a combined basis, a significant portion of our revenue through subadvisory relationships with DC plan providers. The renegotiation or termination of our relationship with any of these plan providers could negatively impact our business. For the year ended December 31, 2017, 10%, 5%, 6% and 5% of our total revenue was attributable to the subadvisory fees paid to us by Alight (formerly Aon Hewitt), Empower RetirementTM, Vanguard and Voya, respectively, the four plan providers with whom we had subadvisory relationships as of December 31, 2017.
Our contracts with our nine primary DC plan providers generally have terms ranging from three to five years, and have successive automatic renewal terms of one year unless terminated in accordance with prior notice requirements. A majority of these provider agreements are in renewal periods. A plan provider may also terminate its contract with us at any time for specified breaches. Further, either party may decide to renegotiate the terms of the contract. In addition, there are factors other than our performance which may be outside of our control (for example, provider data connectivity fee litigation) that could cause the loss of a plan provider. If we lose one of our plan providers with whom we have a relationship or if one of those plan providers significantly reduces its volume of business with us or renegotiates the economic terms of its contract with us, our revenue, operating results and financial condition could be harmed.
Our growth strategy includes extending and expanding our services including entering new markets and we may not be able to develop a successful growth strategy, successfully implement new services, or accurately estimate the impact on our business of developing and introducing these services.
Our strategy includes enhancing and expanding the functionality of our services with new features, offering new services within our existing market, expanding our business directly with clients beyond the workplace and continuing to evaluate new opportunities in markets adjacent to our existing market. For example, in 2016, we acquired the business of The Mutual Fund Store, which allows us to offer advice and portfolio management on IRA and taxable accounts. We may not be able to anticipate or manage new risks and obligations in these new markets outside of the workplace, or attract new clients on a cost-effective basis, or at all.
In furtherance of our strategy, we intend to invest significant resources in the research, development, sales and marketing of new services and features. A viable market for our new services or features may not exist or develop as we anticipated, and our offerings may not be well received by potential or current plan sponsor customers, individual plan participants, retail clients or investors. We may make incorrect decisions as we implement our strategy, such as decisions whether to design and build elements of our services in-house or procure them through third parties or through acquisition. We may not be able to accurately estimate the impact on our business of entering new markets and implementing new features or services. We may not be able to anticipate or manage new risks and obligations, or legal, compliance, operational or other requirements that may arise when entering new markets or offering new features and services. In addition, the anticipated benefits of these actions may not outweigh the resources and costs associated with their development or acquisition, or the liabilities associated with their operation. If we do not realize the anticipated benefits of our strategic actions, our revenue, operating results and financial condition could be harmed.
17
Our workplace discretionary portfolio management services make up a significant and growing part of our revenue base. Our business could suffer if fees we can charge for these services decline.
We earn fees for our discretionary portfolio management services based on the value of AUM. We believe that these services will continue to make up a substantial and growing portion of our revenue for the foreseeable future. There are many investment advisory and management services and other financial products available in the marketplace, which puts downward pressure on fees for our discretionary portfolio management services, whether provided through or outside of the workplace. We have in the past made, and may in the future make, strategic decisions to lower our fees. As a result, our revenue growth may be slower than it would have been had we not reduced our fees, despite increasing AUM. Congressional, regulatory or industry attention focused on fees for financial services, such as legislative constraints on fees or rules requiring additional disclosure regarding fees, could result in downward pressure on fees or impose limits on the fees we can charge for our discretionary portfolio management services. If we lower the fees we charge for our discretionary portfolio management services, our revenue, operating results and financial condition could be harmed.
Some plan providers with whom we have relationships also provide, or may provide, competing services or products, which may strain our relationship with these plan providers and could result in less favorable contract terms or contract cancellations, which in turn may harm our revenue, operating results and financial condition.
Some plan providers with whom we have relationships, such as Fidelity offer or may offer directly competing investment guidance, retirement advice, portfolio management and retirement income services to DC plan participants. We currently have a relationship with Fidelity that allows us to provide our services to plan sponsors, for whom Fidelity is the plan provider, who elect to hire us. Retail competitors include financial institutions with whom we have relationships, such as Charles Schwab & Co., Inc., Fidelity, and Vanguard.
We also face indirect competition from products that could potentially substitute for our services, most notably target-date funds, which are offered by a number of plan providers with whom we have relationships, including Empower RetirementTM , Fidelity, T. Rowe Price, Vanguard, Voya, and Wells Fargo. Plan providers who offer competing services or products may be better positioned to promote or offer their services or products over ours in the sales process, or may prevent us from offering our services to their sponsors. Where we have a subadvisory relationship with the plan provider, the plan provider may compete with us for plan sponsors. Our expansion into the retail market, and our strategy to manage a client’s total portfolio outside of the workplace, has increased this competitive dynamic.
This competition with companies with whom we have relationships can strain the relationship with plan providers and may result in less favorable contract terms or contract cancellation, in which event our revenue, operating results and financial condition could be harmed.
18
Competition could reduce our share of the portfolio management, investment advisory and DC planning market and harm our financial performance.
We operate in a highly competitive industry, with many investment advice providers competing for business from individual investors, financial advisors and institutional customers. Direct competitors that offer independent portfolio management and investment advisory services to plan participants in the workplace include Morningstar and Guided Choice. Retail competitors include large broker/dealers that provide financial services, such as Charles Schwab & Co., Edward Jones, Fidelity, and Vanguard, insurance companies, such as MetLife and New York Life, and other registered investment advisors, such as Creative Planning, Edelman Financial Services, and Fisher Investments. Emerging competitors include firms that provide portfolio management services delivered primarily through online channels with minimal human interaction, such as Betterment, Personal Capital, and Wealthfront (some of which also provide bundled services to the small retirement plan market). We also face indirect competition from products that could potentially substitute for our portfolio management services, investment advice and retirement income, most notably target-date funds. Target-date funds are offered by multiple financial institutions, including Empower RetirementTM, Fidelity, T. Rowe Price, Wells Fargo, Vanguard, and Voya. In addition, competitors to our retirement income features include providers of retirement income products in the defined contribution market, such as AllianceBernstein, Prudential, and other providers of insurance products.
Many of our competitors have larger customer bases and significantly greater resources than we do, or may have fewer regulatory or other constraints. This may allow our competitors to respond more quickly to new technologies and changes in demand for services, to devote greater resources to developing and promoting their services, and to make more attractive offers to potential plan providers, plan sponsors and plan participants. Industry consolidation may also lead to more intense competition. Increased competition could result in fee reductions or loss of market share, in which event our revenue, operating results and financial condition could be harmed.
Our share price may be volatile, and the value of an investment in our common stock may decline.
An active, liquid and orderly market for our common stock may not be sustained, which could depress the trading price of our common stock. The price of our common stock has been, and is likely to continue to be, volatile, and could decline substantially, including within a short period of time. For example, the 2017 range on intra-day sales prices for our common stock on The NASDAQ Global Select Market ranged from $24.45 to $45.75. The market price of shares of our common stock could be subject to wide fluctuations as a result of a wide variety of factors, including, but not limited to, those discussed in this report, many of which are beyond our control, including:
|
|
• |
our announcement of actual results for a fiscal period that are higher or lower than projected results or our announcement of revenue or earnings guidance that is higher or lower than expected; |
|
|
• |
issuance of new or updated or negative research or reports by, or the reduction or cessation of research coverage by one or more, securities analysts; |
|
|
• |
actual or anticipated fluctuations in our financial condition, operating results or growth rate; |
|
|
• |
changes in the economic performance or market valuations of our competitors or of companies perceived by investors to be comparable to us; |
|
|
• |
the amount, timing or frequency of any share repurchases; |
|
|
• |
issuances, sales or expected sales of additional shares of common stock, including by any of our officers, directors, or other affiliates; |
|
|
• |
share price and volume fluctuations attributable to inconsistent trading volume levels of our shares; |
|
|
• |
operational, executive or regulatory changes; |
|
|
• |
changes in the amounts, timing or frequency of any cash dividends we may pay; and |
|
|
• |
general economic and market conditions. |
19
Furthermore, the stock markets have experienced extreme price and volume fluctuations that have affected and continue to affect the market prices of equity securities of many companies. These fluctuations may be unrelated or disproportionate to the operating performance of those companies. These broad market and industry fluctuations, as well as general economic, political and market conditions such as recessions, interest rate changes or international currency fluctuations, may cause the market price of shares of our common stock to decline. In the past, companies that have experienced volatility in the market price of their stock have been subject to securities class action litigation. We may be the target of this type of litigation in the future. Securities litigation against us could result in substantial costs and divert our management’s attention from other business concerns, which could seriously harm our business.
Our revenue is highly dependent upon the plan sponsors with whom we have relationships, our failure to maintain or grow sponsor relationships could significantly and negatively impact our business.
A substantial portion of our revenue is generated as a result of contracts with plan sponsors. Under these contracts, where we are providing advisory services directly and not in a subadvisory capacity, we typically earn annual platform fees that are paid by the plan sponsor, plan provider or the DC plan itself as well as fees based on AUM that are generally paid by plan participants. These contracts with plan sponsors typically have initial terms of three or five years and continue thereafter unless terminated. At any time during the initial term or thereafter, a plan sponsor can cancel a contract for fiduciary reasons or breach of contract. A plan sponsor can generally terminate a contract after the initial term upon 90 days’ notice. If a plan sponsor were to cancel or not renew a contract, we would no longer earn platform fees under that contract. In addition, we would no longer manage any assets in that plan and consequently would no longer earn fees based on AUM in that plan. A plan sponsor may also move to a record-keeper that does not offer our services, or determine to contract through a subadvisory relationship with a plan provider or change to a different record-keeper, which may result in lower revenues for our company due to the contract terms. The loss of one or more of our larger plan sponsors, or a reduction in fees could harm our revenue, operating results and financial condition.
Any failure to protect the confidentiality of plan provider, plan sponsor, plan participant or individual investor data could lead to legal liability, adversely affect our reputation and have a material adverse effect on our business, financial condition or results of operations.
Our services involve the exchange of information, including detailed information regarding individual investors or information regarding plan participants provided by plan providers, plan sponsors, and retirement account custodians through a variety of electronic and non-electronic means. In addition, plan participants and clients routinely provide confidential information and input personal investment and financial information, including portfolio holdings and, in some instances, credit card data, into our systems. Clients also provide confidential information to their advisors verbally and in written format, which is then input manually. Client records are maintained in our retail locations in paper files and local computers, and may be vulnerable to physical breaches. We rely on a complex network of process and software controls to protect the confidentiality of data provided to us, stored on our systems or on the systems of third-party vendors. If we do not maintain adequate internal controls or fail to implement new or improved controls, this data could be misappropriated or confidentiality could otherwise be breached. As we expand our business and increasingly integrate our services with and rely upon third parties we may be subject to increased risk and liability for security breaches. We must devote increasing management time and resources to monitoring third-party security controls. We could be subject to liability if any individual investor’s personal information is inappropriately disclosed or altered, or if third parties are able to penetrate our network security or otherwise gain access to any plan participant’s and client’s name, address, portfolio holdings, credit card number or other personal information. Any such event could subject us to claims for unauthorized credit card purchases, identity theft or other similar fraud claims or claims for other misuses of personal information, such as unauthorized marketing or unauthorized access to personal information.
20
Many of our agreements with plan sponsors, plan providers and clients do not limit our potential liability for breaches of confidentiality, and consequential damages. If any person, including any of our employees, contractors, or consultants, penetrates our network security, misappropriates or mishandles sensitive data, inadvertently or otherwise, we could be subject to significant liability from our plan sponsors, plan providers, participants and clients for breaching contractual confidentiality provisions or privacy laws. In addition, our agreements with plan sponsors and plan providers require us to meet specified minimum system security and privacy standards. Given the growing concern over privacy and identity theft, we have been and expect to continue to be subject to increased scrutiny by both plan providers and plan sponsors, which have increased the frequency and thoroughness of their audits. If we fail to meet these standards, our plan sponsors and plan providers may seek to limit or terminate their agreements with us. Regulations in some states and proposed federal regulations may require notification via the press or to customers in the event of security breaches, which could harm our reputation and increase our costs of doing business. Unauthorized disclosure of sensitive or confidential data, whether through breach of our computer systems or third-party systems, systems failure or otherwise, could damage our reputation, expose us to litigation, cause us to lose business, harm our revenue, operating results or financial condition and subject us to regulatory action, which could include sanctions and fines.
We rely on plan providers, plan sponsors and custodians to provide us with accurate and timely plan and client data in order for us to provide our services, and we rely on plan providers and custodians to execute transactions in the accounts we manage.
Our ability to provide high-quality services depends, in part, on plan sponsors, plan providers and third-party account custodians supplying us with accurate and timely data in a usable format. Data transmissions from our plan sponsors and providers routinely contain errors or are not supplied in a timely manner. Although we have processes in place to attempt to detect and correct such errors and to encourage timely transmissions, our efforts may not be sufficient. Errors or delays in the data we receive, missing data, data transmitted in a format that we cannot readily use, or miscommunication about what data should be transmitted or in what format, could lead us to make advisory, transaction, disbursement or communication errors that could harm our reputation or lead to financial liability, or may prevent us from providing our services to, or earning revenue from, otherwise eligible clients. In addition, when we make changes in an account we manage, or direct a disbursement, we instruct the plan provider or custodian to execute the transactions. If a plan provider or custodian fails to execute transactions in an accurate and timely manner, it could harm our reputation or lead to financial liability. In turn, our revenue, operating results and financial condition could be harmed.
Our revenue could be harmed if we experience unanticipated delays in expected service availability.
We generally do not earn platform fees from a plan sponsor until our services are available to plan participants, and we do not earn fees for our Professional Management service until we begin to manage a participant’s account. Service delays may impact many or all accounts at a new plan sponsor and delay our ability to manage participant accounts and collect fees. If service availability is delayed due to actions or inactions on our part or on the part of a plan sponsor, plan provider or other third party, or due to matters beyond our control, our revenue would be harmed. This in turn would negatively affect our anticipated operating results and financial condition for a particular period.
21
We may be liable for damages caused by errors, system failures, or unsatisfactory performance of services.
If we fail to prevent, detect or resolve errors in our services, including services offered through our subsidiaries or third-party providers, regardless of the cause of the errors, we could be liable for the harm caused. Errors in inputs or processing, such as plan set-ups, transaction instructions or plan participant data could be magnified across many accounts. We use an automated trading system for the workplace DC Professional Management service, and an error or failure of this system could result in widespread material trading errors, which could be exacerbated by financial market movement. Concentrated positions held by many plan participants, particularly in employer stock, could result in a large liability if a systematic input or processing error was to cause us to make errors in transactions relating to those positions. The manual and individual nature of our Personal Advisor service increases the risk of human error or malfeasance and could cause mistakes in client transactions. Our advisors servicing our Personal Advisor clients are able to move client assets and to make changes to client investment accounts directly. When managing taxable accounts, errors could affect client tax obligations and create liability for us. We could also face liability if we fail to process a client’s instructions. We may not be able to identify or resolve these errors in a timely manner. In addition, failure to perform our services on a timely basis could result in liability. We may also have liability to the plan provider where we have a subadvisory relationship with the plan provider.
In the past, our company has reimbursed plan providers, sponsors, participants and clients for errors in our services, and we expect to do so in the future. After an error is identified, resolving the error and implementing remedial measures has at times diverted the attention and resources of our management, key technical personnel and internal resources from other business concerns. Any errors or poor execution in the performance of services could cause a plan sponsor, plan provider, or client to terminate their relationship with us. Although we attempt to limit our contractual liability for consequential damages in rendering our services, these limitations on liability may be unenforceable in some cases, or may be insufficient to protect us from liability for damages. ERISA and other applicable laws require that we meet a fiduciary obligation to plan participants. In the event of liability or claims against us for these errors or failures, insurance may be unavailable or insufficient, in which event our operating results and financial condition could be harmed.
If our reputation is harmed, we could suffer losses in our business and revenue.
Our reputation, which depends on earning and maintaining the trust and confidence of plan providers, plan sponsors, plan participants and individual investors that are current and potential clients, is critical to our business. Our reputation is vulnerable to many threats that can be difficult or impossible to control, and costly or impossible to remediate. Regulatory inquiries or investigations, lawsuits initiated by plan fiduciaries, plan participants, such as the lawsuits challenging provider data connectivity fees filed in 2016, clients, current or former employees, or stockholders, employee misconduct, perceptions of conflicts of interest, rumors, communication errors, and transactional mistakes, among other developments, could substantially damage our reputation, even if they are baseless or satisfactorily addressed, or do not specifically name us as a party to the complaint.
In addition, any perception that the quality of our investment advice may not be the same or better than that of other providers could also damage our reputation. Any damage to our reputation could harm our ability to attract and retain plan providers, plan sponsor customers, individual investors and key personnel. This damage could also cause current or potential clients to stop using or enrolling in our discretionary portfolio management services, which would adversely affect the amount of AUM on which we earn fees, in which event our revenue, operating results and financial condition could be harmed.
22
Privacy concerns could require us to modify our operations.
As part of our business, we use plan participants’ and clients’ personal data. For privacy or security reasons, privacy groups, governmental agencies and individuals may seek to restrict or prevent our use of this data. We have incurred, and will continue to incur, expenses to comply with privacy and security standards and protocols imposed by law, regulation, industry standards or contractual obligations. Increased domestic or international regulation of data utilization and distribution practices, including self-regulation, could require us to modify our operations and incur significant additional expense, in which event our revenue, operating results and financial condition could be harmed.
Our future success depends on our ability to recruit and retain qualified employees, including our executive officers and advisors.
Our ability to provide our services and maintain and develop relationships with plan participants, plan providers, plan sponsors and individual investors depends largely on our ability to attract, train, motivate and retain highly skilled professionals, particularly professionals with backgrounds in sales, marketing, technology and financial and investment services. Consequently, we must hire and retain employees with the technical expertise and industry knowledge necessary to continue to develop our services and effectively manage our growing sales and marketing organization to assist the growth of our operations.
We believe there is significant competition for professionals with the skills necessary to perform the services we offer, particularly in the geographic area of our headquarters in Sunnyvale, California. We experience competition for analysts and other employees from financial institutions and financial services organizations such as hedge funds and investment management companies that generally have greater resources than we do and therefore may be able to offer higher compensation packages. Competition for these employees is intense, and we may not have sufficient human resources programs, practices and benefits to be able to retain our existing employees, or be able to recruit and retain other highly qualified personnel. If we cannot retain key employees in our retail advisor function, we may lose important knowledge and skills resident in that organization. In addition, many of the advisors employed in our advisor network have developed personal relationships with their clients. If we are not able to retain these advisors, their clients may close their accounts or leave to follow their advisor, which could reduce our AUM and revenue. If we cannot hire and retain qualified personnel, our ability to sustain and continue to expand our business would be impaired and our revenue, operating results and financial condition could be harmed.
Our ability to compete, succeed and generate profits depends, in part, on our ability to obtain accurate and timely data from third-party vendors on commercially reasonable terms.
We currently obtain market and other financial data we use to generate our investment advice from a number of third-party vendors. Termination of one or more of these vendor agreements, exclusion from, or restricted use of a data provider’s information could decrease the information available for us to use and offer our clients. We do not currently have secondary sources or other suppliers for some of these data items and the lack of these resources may have a material adverse effect on our business, financial condition or results of operations. If these data feed agreements were terminated, backup services would take time to set up and our business and results of operations could be harmed. We rely on these data suppliers to provide timely and accurate information, and their failure to do so could harm our business. In addition, some data suppliers may seek to increase licensing fees for providing content to us. If we are unable to renegotiate acceptable licensing arrangements with these data suppliers or find alternative sources of equivalent content, we may experience a reduction in our operating margins or market share, in which event our revenue, operating results and financial condition could be harmed.
23
Our discretionary portfolio management and investment advisory operations may subject us to liability for losses that result from a breach of our fiduciary duties or other obligations.
Our discretionary portfolio management and investment advisory operations involve fiduciary obligations that require us to act in the best interests of the plan participants to whom we provide advice or for whom we manage accounts. We may face liabilities for actual or claimed breaches of our fiduciary duties. We may not be able to prevent plan participants, plan sponsors or the plan providers to or through whom we provide investment advisory services from taking legal action against us for an actual or claimed breach of a fiduciary duty. Because we currently provide investment advisory services on substantial assets, we could face substantial liability to plan participants or plan sponsors if we breach our fiduciary duties. In addition, we may face liabilities for actual or claimed deficiencies in the quality or outcome of our investment advisory recommendations, investment management and other services, even in the absence of an actual or claimed breach of fiduciary duty. While we believe that we would have substantial and meritorious defenses against such a claim, we cannot predict the outcome or consequences of any such potential litigation.
If our intellectual property and technology are not adequately protected to prevent use or appropriation by our competitors, our business and competitive position could suffer.
Our future success and competitive position depend in part on our ability to protect our proprietary technology and intellectual property. We rely and expect to continue to rely on a combination of trademark, copyright, patent and trade secret protection laws to protect our proprietary technology and intellectual property. We also require our employees, consultants, vendors, plan sponsors and plan providers to enter into confidentiality agreements with us. As of December 31, 2017, we have issued U.S. patents which relate to novel aspects of our financial advisory platform, including user interface features, our pricing module, load-aware optimization, tax-aware asset allocation, financial goal planning, advice palatability, and other key technologies of our outcomes-based investing methodologies. One or more of our issued patents or pending patent applications may be called into question on the basis of being directed to abstract ideas or methods of doing or conducting business. The general validity of software patents and so called “business method” patents have been challenged in a number of jurisdictions, including the United States. Changes in patent laws or case law may impact the scope of patent-eligible subject matter by, for example, limiting what constitutes a patentable “process.” Our patents may become less valuable if software or business methods are found to be a non-patentable subject matter or if additional requirements are imposed that our patents do not meet.
The steps we have taken may be inadequate to prevent the misappropriation of our proprietary technology. There can be no assurance that others will not develop or patent similar or superior technologies, products or services, or that our patents, trademarks and other intellectual property will not be challenged, invalidated or circumvented by others. Unauthorized copying or other misappropriation of our proprietary technologies could enable third parties to benefit from our technologies without paying us for doing so, which could harm our business. Policing unauthorized use of proprietary technology is difficult and expensive and our monitoring and policing activities may not be sufficient to identify any misappropriation and protect our proprietary technology. In addition, third parties may knowingly or unknowingly infringe our patents, trademarks and other intellectual property rights, and litigation may be necessary to protect and enforce our intellectual property rights. If litigation is necessary to protect and enforce our intellectual property rights, any such litigation could be very costly and could divert management attention and resources.
We also expect that the more successful we are, the more likely it becomes that competitors will try to develop products that are similar to ours, which may infringe on our proprietary rights. If we are unable to protect our proprietary rights or if third parties independently develop or gain access to our or similar technologies, our business, revenue, operating results, financial condition, reputation and competitive position could be harmed.
24
Third parties may assert intellectual property infringement claims against us, or our services may infringe the intellectual property rights of third parties, which may subject us to legal liability and harm our reputation.
Assertion of intellectual property infringement claims against us, plan providers or plan sponsors could result in litigation. We might not prevail in any such litigation or be able to obtain a license for the use of any infringed intellectual property from a third party on commercially reasonable terms, or at all. Even if obtained, we may be unable to protect such licenses from infringement or misuse, or prevent infringement claims against us in connection with our licensing efforts. We expect that the risk of infringement claims against us will increase if more of our competitors are able to obtain intellectual property protection for their technology and business processes, and if we hire employees who possess third-party proprietary information. Any such claims, regardless of their merit or ultimate outcome, could result in substantial cost to us, divert management’s attention and our resources away from our operations and otherwise harm our reputation. If we are not successful in overcoming such claims and are required to pay damages, licensing fees or fines, or alter our services or business practices, our revenue, operating results and financial condition could be harmed.
Any inability to manage our growth could disrupt our business and harm our operating results.
We expect our growth to place significant demands on our management and other resources. Our success will depend in part upon the ability of our senior management to execute on our growth strategy and to manage growth effectively. Our continued growth and expanded business model increases the challenges involved in developing, improving and scaling our internal administrative infrastructure, particularly our financial, operational, compliance, recordkeeping, communications and other internal systems; and maintaining high levels of satisfaction with our services among our business partners, employees and clients. We may make acquisitions in furtherance of our strategy, such as our acquisition of The Mutual Fund Store in 2016, and the success of any acquisition will depend, in part, on our ability to successfully integrate and realize the anticipated benefits from combining our businesses. We rely on proprietary and customized software, systems and reporting processes, which require experienced personnel to operate, maintain and expand, and which is made more complex by acquisition activity. Organic or acquisition-related growth may require additional capital, and there is no assurance that financing, if required, will be available in amounts or on terms acceptable to us, if at all. We may not fully realize, in a timely manner or otherwise, the anticipated synergies and other potential benefits of an acquisition due to several factors, including: unanticipated costs, liabilities or expenses; harm to our existing business relationships or reputation; the loss of key employees in the acquired business; competitive responses; use of substantial amounts of cash, incurring additional debt, or potentially dilutive issuances of equity securities; exposure to potential unknown liabilities of the acquired business; or other factors. If we do not manage our growth appropriately, our revenue, operating results and financial condition could be harmed.
25
We are subject to regulatory compliance requirements as a result of being a public company, which causes additional expenses and challenges for our management team.
We are investing resources to comply with evolving laws and regulations, including the requirements of the Sarbanes-Oxley Act of 2002, the Dodd-Frank Wall Street Reform and Consumer Protection Act, the Investor Protection and Securities Reform Act of 2010, as well as the rules and regulations implemented by the SEC and The NASDAQ Stock Market. We rely upon proprietary and customized software, systems and reporting processes, which increases the complexity of our internal control structure and procedures for financial reporting and introduces more opportunities for error. This compliance can require a diversion of management’s time and attention from revenue-generating activities to compliance activities. For example, Section 404 of the Sarbanes-Oxley Act of 2002 requires that our management report on, and our independent auditors attest to, the effectiveness of our internal control structure and procedures for financial reporting in our annual report on Form 10-K. Any claim that our internal controls over financial reporting are not effective as defined under Section 404, or that we have failed to comply with other public company regulatory requirements, regardless of merit or ultimate outcome, could subject us to lawsuits, stockholder derivative demands, sanctions or investigations by The NASDAQ Stock Market, the SEC, or other regulatory authorities. This risk is increased significantly by the need to establish public-company levels of controls on the acquired business of The Mutual Fund Store. Furthermore, investor perceptions of our company may suffer, and this could cause a decline in the market price of our stock. Any failure of our internal controls could have a material adverse effect on our stated results of operations and harm our reputation. If we are unable to meet public company regulatory compliance requirements effectively or efficiently, or there are changes in the standards, methods, estimates and judgments used in applying our accounting policies, it could harm our operations, financial reporting or financial results and could result in an adverse opinion on internal controls from our independent auditors.
We could face liability for certain information we disclose, including information based on data we obtain from other parties.
We may be subject to claims for securities law violations, negligence, or other claims relating to the information we disclose. In addition, we provide information through newsletters and other topical communications to our clients and also host a regular radio program. Our businesses also communicate through social media and other online means. Individuals who use our services may take legal action against us if they rely on information that contains an error, or a company may claim that we have made a defamatory statement about it or its employees. We could also be subject to claims based upon the content that is accessible from our website through links to other websites. We rely on a variety of outside parties as the original sources for the information we use in our published data. These sources include securities exchanges, fund companies and transfer agents. Accordingly, in addition to possible exposure for publishing incorrect information that results directly from our own errors, we could face liability based on inaccurate data provided to us by others. Defending claims based on the information we publish could be expensive and time-consuming and could adversely impact our business, operating results and financial condition.
26
If our operations are interrupted as a result of system failures or service downtime, our business and reputation could suffer.
The success of our business depends upon our ability to obtain and deliver time-sensitive, up-to-date data and information. Key portions of our services are delivered using proprietary and customized software, systems and reporting processes, which require experienced personnel and cannot be duplicated by outside vendors or off-the-shelf products. Our operations and those of our plan providers and plan sponsors are vulnerable to interruption by technical breakdowns, computer hardware and software malfunctions, software viruses, infrastructure failures, fire, earthquake, power loss, telecommunications failure, terrorist attacks, wars, Internet failures, Internet-based attacks and other events beyond our control. Any disruption in our services or operations could harm our ability to perform our services effectively which in turn could result in a reduction in revenue or a claim for substantial damages against us, regardless of whether we are responsible for that failure. We rely on our computer equipment, database storage facilities and other office equipment, which are located primarily in the seismically active San Francisco Bay area. We maintain off-site back-up facilities in Dulles, Virginia for our database and network equipment, but these facilities could be subject to the same interruptions that may affect our headquarters. If we suffer a significant database or network facility outage, our business could experience disruption until we fully implement our back-up systems, which may not provide full recovery. We also depend on third-party vendors to deliver key services and software for our offering, provide facility and cloud storage and related maintenance of our main technology equipment and data. Any failure by these vendors to perform those services, any temporary or permanent loss of our equipment or systems or any disruptions to basic infrastructure like power and telecommunications could impede our ability to provide services to our clients, harm our reputation, cause clients to stop using our investment advisory or discretionary portfolio management services, reduce our revenue and harm our business. Our agreements with our plan providers, plan sponsors, also require us to meet specified minimum system security and privacy standards. If we fail to meet these standards, our plan sponsors and plan providers, may seek to terminate their agreements with us. This in turn could damage our reputation and harm our market position and business.
Changes in laws applicable to our services may adversely affect our business.
We may be adversely affected as a result of new or revised legislation or regulations promulgated by Congress, the SEC, Department of Labor or other U.S. regulatory authorities or self-regulatory organizations that supervise the financial markets and our industry. In addition, we may be adversely affected by changes in the interpretation of existing laws and rules by these governmental authorities and self-regulatory organizations. It is impossible to determine the extent of the impact of any new laws, regulations or initiatives that may be proposed, or whether any of the proposals will become law. It is difficult to predict the future impact of the broad and expanding legislative and regulatory requirements affecting our business. For example, additional requirements for fee disclosure have become effective in recent years and there is increased sponsor and consultant focus on the fees associated with all plan services, including our services. We may need to offer more or broader services to justify our fees or may need to lower our fees to retain or expand our existing business relationships. Legislation and regulation that changed certain existing restrictions relating to conflicts of interest, such as the February 2017 executive order directing the Department of Labor to review its conflict of interest rule and delaying implementation of such rule for six months, might lower the relative value of our independence, or allow for increased competition. Legislation may reduce or eliminate tax benefits associated with defined contribution plans or otherwise restructure defined contribution plans in a way that affects their use by plan sponsors or plan participants, which could cause a reduction in the number of plans where our services are offered or slow our AUM growth.
27
Future legislation or regulation could affect our ability to offer services for accounts other than 401(k) accounts or may impose requirements for retirement income forecasts and distribution that we might not be able to satisfy, or which might lower the relative value of our services or allow for increased competition. Changes to laws or regulations, or in their interpretation, or any change that results in our becoming subject to the jurisdiction of any additional regulator, such as a self-regulatory organization, could increase our potential liability for offering portfolio management services, investment advice and retirement income, affect our ability to offer our passive enrollment option or invalidate pre-dispute arbitration clauses in our agreements, leading to increased costs to litigate any claims against us. Changes to laws or regulations, or in their interpretation, could also increase our legal and compliance costs, divert internal resources and make some activities more time-consuming and costly. The laws, rules and regulations applicable to our business may change in the future, and we may not be able to comply with any such changes. If we fail to comply with any applicable law, rule or regulation, we could be fined, sanctioned or barred from providing investment advisory services in the future, which could materially harm our business and reputation.
We are subject to complex regulation, and any compliance failures or regulatory action could adversely affect our business.
The financial services industry is subject to extensive regulation at the federal and state levels. It is very difficult to predict the future impact of the legislative and regulatory requirements affecting our business. The securities laws and other laws that govern our activities as a registered investment advisor are complex and subject to rapid change. The activities of our investment advisory and management operations are subject primarily to provisions of the Investment Advisers Act and ERISA, as well as certain state laws, some of which may provide for private rights of action. We are a fiduciary under ERISA. Our investment advisory services are also subject to state laws including anti-fraud laws and regulations. The Investment Advisers Act addresses, among other things, fiduciary duties, recordkeeping and reporting requirements, advertising, and disclosure requirements and also includes general anti-fraud provisions. We rely on certain regulatory interpretations and guidance in connection with our current business model, including regulations and guidance relating to passive enrollment of participants into our Professional Management service. If we are found to have failed to comply with any applicable law, rule or regulation, we could be fined, sanctioned, required to disgorge fees we have previously collected, required to reimburse clients for any losses in their accounts, required to change our business practices or disclosure, or barred from providing investment advisory services in the future, or we may agree to one or more of such payments, sanctions or changes as part of a settlement agreement, which could materially harm our business and reputation.
We may also become subject to additional regulatory and compliance requirements as a result of any expansion or enhancement of our existing services or any services we may offer in the future. For example, we may be subject to insurance licensing or other requirements in connection with our DC retirement income planning services, even if our activities are limited to describing regulated products. One of our acquired subsidiaries is an insurance agency, which is an industry in which we have limited experience.
Compliance with any new regulatory requirements may divert internal resources and take significant time and effort. Any claim of noncompliance, regardless of merit or ultimate outcome, could subject us to investigation by the SEC or other regulatory authorities. This in turn could result in additional claims or class-action litigation brought on behalf of our clients, any of which could result in substantial cost to us and divert management’s attention and other resources away from our operations. Furthermore, investor perceptions of us may suffer, and this could cause a decline in the market price of our common stock. Our compliance processes may not be sufficient to prevent assertions that we failed to comply with any applicable law, rule or regulation.
28
Changes in accounting principles or standards, or in the way they are applied, could result in unfavorable accounting charges or effects and unexpected financial reporting fluctuations, and could adversely affect our reported operating results even if there are no underlying changes in the economics of the business.
We prepare our consolidated financial statements in conformity with U.S. generally accepted accounting principles (U.S. GAAP), which are subject to interpretation by the Securities and Exchange Commission (SEC) and other regulatory bodies. A change in existing principles, standards or guidance can have a significant effect on our reported results, may retroactively affect previously reported results, could cause unexpected financial reporting fluctuations, and may require us to make costly changes to our internal controls, operational and financial reporting processes.
For example, in February 2016, the Financial Accounting Standards Board (FASB), issued ASU 2016-02, Leases, which requires that lessees recognize assets and liabilities for leases with lease terms greater than twelve months in the balance sheet. We plan to adopt this ASU on January 1, 2019 and we are evaluating the effect that ASU 2016-02 will have on our consolidated financial statements and related disclosures. Adoption of the new requirements could have a significant impact on our financial statements and may impact our processes and our controls. In addition, changes in accounting principles to converge U.S. GAAP and International Financial Reporting Standards may have a material impact on our financial statements and may retroactively affect the accounting treatment of previously reported transactions.
We face additional scrutiny when we act as subadvisor, and any failure to comply with regulations or meet expectations could harm our business.
Some of the plan providers to whom we are subadvisors are broker/dealers registered under the Securities Exchange Act of 1934, also referred to as the Exchange Act, and are subject to the rules of the Financial Industry Regulatory Authority. When we act as a subadvisor, we may be subject to the oversight by regulators of another advisor. We may be affected by any regulatory examination of that plan provider.
In addition, our subadvisory arrangements are structured to follow Advisory Opinion 2001-09A, a Department of Labor opinion provided to SunAmerica Retirement Markets. We could also be adversely affected if the Department of Labor increases examination of these subadvisory arrangements or changes the interpretive positions described in the Advisory Opinion. We could be adversely affected if ERISA is amended in a way that overturns or materially changes the Department of Labor’s position in Advisory Opinion 2001-09A, such as the imposition of additional requirements relating to conflicts of interest on the plan providers to which we act as a subadvisor. Recent regulations imposed additional requirements relating to conflicts of interest on some of the plan providers to which we act as a subadvisor. If a plan provider(s) determines not to comply with these requirements, we may therefore not be able to continue to provide our services on a subadvisory basis. In such event, we could incur additional costs to transition our services for affected plan providers and their plan sponsors to another structure.
We are subject to risks associated with leasing space for our retail locations.
We operate over 140 retail locations located on leased premises. As leases underlying these locations expire, we may be unable to negotiate a new lease or lease extension, either on commercially acceptable terms or at all, which could cause us to close offices in desirable locations. As a result, our revenue and our brand building initiatives could be adversely affected. Current locations may become unattractive to us as demographic patterns change. We generally cannot cancel current leases. Therefore, if an existing or future retail location is not profitable, and we decide to close it, we may nonetheless be committed to perform our obligations under the applicable lease including, among other things, paying the base rent for the balance of the lease term. If we are unable to manage these risks effectively, our business and financial results could be adversely affected.
None.
29
We currently lease our principal executive offices in Sunnyvale, California, under an 8-year lease term that expires in May 2020. The premises consist of 80,995 square feet of office space with the right to lease additional space. Our headquarters facility has earned Leadership in Energy and Environmental Design (LEED) for Core and Shell Gold certification awarded by the U.S. Green Building Council. We also have three other principal locations. We lease 33,860 square feet of office space in Boston, Massachusetts, principally for executive functions and institutional sales and support, under a lease term through July 2025. In addition, we lease 35,741 square feet of office space in Phoenix, Arizona under a lease term through December 2021, primarily for our operations and call center. We also lease a 33,100 square-foot office in Overland Park, Kansas, mainly for the business operations that support our retail advisor centers, under a lease term of 11 years expiring in March 2027. In addition, we maintain a call center in St. George, Utah. Our business also has more than 140 advisor center locations, both permanently-staffed and appointment-only locations, in over 35 states. We believe that our facilities are suitable and adequate to meet our needs.
We are currently not party to any material legal proceedings. We may from time to time become involved in litigation relating to claims arising from our ordinary course of business. These claims, even if not meritorious, could result in the expenditure of significant financial and managerial resources.
None.
30
|
Item 5. |
Market for Registrant’s Common Equity, Related Stockholder Matters and Issuer Purchases of Equity Securities |
Market Information
Our shares of common stock are traded on The NASDAQ Global Select Market under the symbol “FNGN.” The following table shows, for the periods indicated, the high and low intra-day sale prices for our common stock on The NASDAQ Global Select Market.
|
|
|
High |
|
|
Low |
|
||
|
Fiscal year ending December 31, 2017 |
|
|
|
|
|
|
|
|
|
First Quarter |
|
$ |
45.75 |
|
|
$ |
35.40 |
|
|
Second Quarter |
|
$ |
45.00 |
|
|
$ |
35.78 |
|
|
Third Quarter |
|
$ |
39.05 |
|
|
$ |
31.00 |
|
|
Fourth Quarter |
|
$ |
37.90 |
|
|
$ |
24.45 |
|
|
|
|
|
|
|
|
|
|
|
|
Fiscal year ending December 31, 2016 |
|
|
|
|
|
|
|
|
|
First Quarter |
|
$ |
33.85 |
|
|
$ |
23.22 |
|
|
Second Quarter |
|
$ |
33.77 |
|
|
$ |
23.56 |
|
|
Third Quarter |
|
$ |
32.58 |
|
|
$ |
23.87 |
|
|
Fourth Quarter |
|
$ |
39.95 |
|
|
$ |
25.00 |
|
As of January 31, 2018, the number of record holders of our common stock was 90. Because most of our shares are held by brokers and other institutions on behalf of stockholders, we are unable to estimate the total number of beneficial stockholders represented by these record holders.
Dividends
During each of the years ended December 31, 2015, 2016 and 2017, the Board of Directors declared quarterly cash dividends totaling $0.28 per share annually of common stock outstanding. On February 14, 2018 the Board of Directors declared a quarterly dividend of $0.08 per share to be paid on April 5, 2018 to record-holders as of March 22, 2018. While we currently expect to pay comparable cash dividends on a quarterly basis in the future, any future determination with respect to the declaration and payment of dividends will be at the discretion of the Board of Directors.
Securities Authorized for Issuance under Equity Compensation Plans
Information regarding the securities authorized for issuance under our equity compensation plans can be found under Item 12 of this Annual Report on Form 10-K.
Stock Performance Graph
This performance graph shall not be deemed “soliciting material” or to be “filed” with the Securities and Exchange Commission, or the SEC, for purposes of Section 18 of the Securities Exchange Act of 1934, as amended, or the “Exchange Act”, or otherwise subject to the liabilities under that Section, and shall not be deemed to be incorporated by reference into any filing of Financial Engines, Inc. under the Exchange Act or the Securities Act of 1933, as amended, or the “Securities Act”.
The following graph shows a comparison from December 31, 2012 through December 31, 2017 of the cumulative total stockholder return on our common stock with the cumulative total return of The NASDAQ Composite Index, the Financial Sector SPDR and S&P Small Cap 600 Index. The graph assumes an investment of $100 on December 31, 2012, and the reinvestment of any dividends. The reinvestment of cash dividends for our common stock is reflected in the table below, starting with the first cash dividend payment in April 2013. We did not pay any cash dividends prior to fiscal year 2013.
31
The comparisons in the graph below are required by the SEC and are not intended to forecast or be indicative of possible future performance of our common stock.
COMPARISON OF CUMULATIVE TOTAL RETURN*
Among Financial Engines, Inc.,
The NASDAQ Composite Index, Financial Sector SPDR and the S&P Small Cap 600 Index
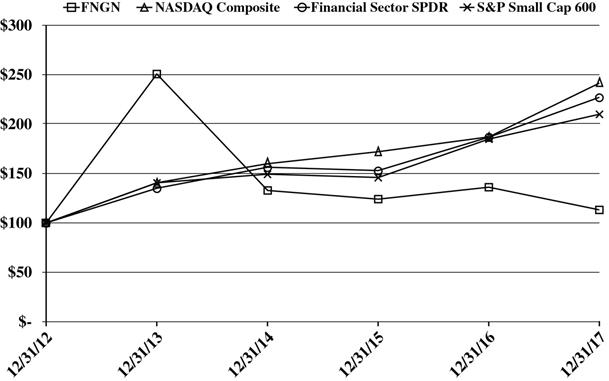
* $100 invested in stock as of December 31, 2012 — including reinvestment of dividends
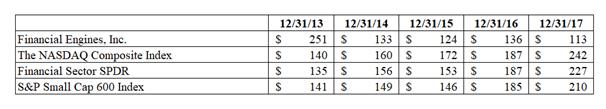
Unregistered Sales of Equity Securities
For the year ended December 31, 2017, we issued 230,000 shares of common stock upon the exercise of options to purchase our common stock granted under our 1998 Stock Plan. The shares of common stock issued pursuant to these stock options were unregistered securities granted under our 1998 Stock Plan as permitted by Rule 701 of the Securities Act of 1933. The aggregate purchase price of the shares was $1.7 million, all of which was received in cash. All recipients either received adequate information about us or had access, through employment or other relationships, to such information. There were no underwriters employed in connection with these transactions.
32
On February 1, 2016, in connection with the closing of the acquisition of The Mutual Fund Store and as part of the merger consideration, we issued 9,885,889 shares of our common stock to former equity holders of the acquired entities. The issuance was made pursuant to an exemption under Regulation D, as promulgated under the Securities Act.
Purchases of Equity Securities by the Issuer
On October 24, 2017, our Board of Directors approved a stock repurchase program of up to $60.0 million of our common stock in open market purchases or negotiated transactions over the subsequent twelve-month period. We used $10.8 million of cash to repurchase 399,638 shares of our common stock during the year ended December 31, 2017 and have $49.2 million available for repurchase under the existing repurchase authorization limit. The stock repurchase program may be modified, extended or terminated by the Board of Directors at any time and there is no guarantee as to the exact number of shares, if any, that will be repurchased under the program.
|
|
|
Total Number of Shares Purchased |
|
|
Average Repurchase Price Per Share |
|
|
Total Number of Shares Purchased as Part of a Publicly Announced Repurchase Program |
|
|
Approximate Dollar Value of Shares That May Yet Be Purchased Under the Repurchase Program |
|
||||
|
Period: |
|
|
|
|
|
|
|
|
|
|
|
|
|
(In thousands) |
|
|
|
October 1, 2017 - October 31, 2017 |
|
|
- |
|
|
$ |
- |
|
|
|
- |
|
|
$ |
- |
|
|
November 1, 2017 - November 30, 2017 |
|
|
399,638 |
|
|
$ |
27.02 |
|
|
|
399,638 |
|
|
$ |
49,200 |
|
|
December 1, 2017 - December 31, 2017 |
|
|
- |
|
|
$ |
- |
|
|
|
- |
|
|
$ |
49,200 |
|
|
Total |
|
|
399,638 |
|
|
$ |
27.02 |
|
|
|
399,638 |
|
|
|
|
|
33
The following selected consolidated financial data should be read together with the consolidated financial statements and the notes to the consolidated financial statements and “Management’s Discussion and Analysis of Financial Condition and Results of Operations,” which are included elsewhere in this report.
On February 1, 2016, we completed the acquisition of The Mutual Fund Store and as a result, our revenue and expenses increased significantly. Income tax expense increased for the year ended December 31, 2017 primarily due to the remeasurement of deferred tax assets resulting from the Tax Cuts and Jobs Act (the 2017 Tax Act).
|
|
|
Year Ended December 31, |
|
|||||||||||||||||
|
|
|
2013 |
|
|
2014 |
|
|
2015 |
|
|
2016 |
|
|
2017 |
|
|||||
|
|
|
(In thousands, except per share data) |
|
|||||||||||||||||
|
Statements of Income Data: |
|
|
|
|
|
|
|
|
|
|
|
|
|
|
|
|
|
|
|
|
|
Revenue: |
|
|
|
|
|
|
|
|
|
|
|
|
|
|
|
|
|
|
|
|
|
Professional management |
|
$ |
202,811 |
|
|
$ |
245,812 |
|
|
$ |
277,162 |
|
|
$ |
385,944 |
|
|
$ |
450,320 |
|
|
Platform |
|
|
33,475 |
|
|
|
33,071 |
|
|
|
30,766 |
|
|
|
28,366 |
|
|
|
26,558 |
|
|
Other |
|
|
2,672 |
|
|
|
3,037 |
|
|
|
2,794 |
|
|
|
9,627 |
|
|
|
3,628 |
|
|
Total revenue |
|
|
238,958 |
|
|
|
281,920 |
|
|
|
310,722 |
|
|
|
423,937 |
|
|
|
480,506 |
|
|
Costs and expenses: |
|
|
|
|
|
|
|
|
|
|
|
|
|
|
|
|
|
|
|
|
|
Cost of revenue |
|
|
91,990 |
|
|
|
112,817 |
|
|
|
131,011 |
|
|
|
186,009 |
|
|
|
212,924 |
|
|
Research and development |
|
|
30,917 |
|
|
|
29,830 |
|
|
|
35,581 |
|
|
|
37,983 |
|
|
|
44,018 |
|
|
Sales and marketing |
|
|
43,400 |
|
|
|
50,091 |
|
|
|
61,262 |
|
|
|
84,068 |
|
|
|
80,888 |
|
|
General and administrative |
|
|
21,353 |
|
|
|
22,453 |
|
|
|
28,813 |
|
|
|
46,497 |
|
|
|
39,696 |
|
|
Amortization of intangible assets, including internal use software |
|
|
6,402 |
|
|
|
5,974 |
|
|
|
4,900 |
|
|
|
15,408 |
|
|
|
17,028 |
|
|
Loss on reacquired franchisee rights |
|
|
- |
|
|
|
- |
|
|
|
- |
|
|
|
4,092 |
|
|
|
- |
|
|
Total costs and expenses |
|
|
194,062 |
|
|
|
221,165 |
|
|
|
261,567 |
|
|
|
374,057 |
|
|
|
394,554 |
|
|
Income from operations |
|
|
44,896 |
|
|
|
60,755 |
|
|
|
49,155 |
|
|
|
49,880 |
|
|
|
85,952 |
|
|
Interest income, net |
|
|
58 |
|
|
|
169 |
|
|
|
356 |
|
|
|
176 |
|
|
|
1,167 |
|
|
Other income (expense) |
|
|
(13 |
) |
|
|
3 |
|
|
|
(30 |
) |
|
|
(784 |
) |
|
|
(508 |
) |
|
Income before income taxes |
|
|
44,941 |
|
|
|
60,927 |
|
|
|
49,481 |
|
|
|
49,272 |
|
|
|
86,611 |
|
|
Income tax expense |
|
|
14,986 |
|
|
|
23,975 |
|
|
|
17,864 |
|
|
|
20,712 |
|
|
|
39,951 |
|
|
Net income |
|
$ |
29,955 |
|
|
$ |
36,952 |
|
|
$ |
31,617 |
|
|
$ |
28,560 |
|
|
$ |
46,660 |
|
|
|
|
|
|
|
|
|
|
|
|
|
|
|
|
|
|
|
|
|
|
|
|
Net income per share attributable to holders of common stock |
|
|
|
|
|
|
|
|
|
|
|
|
|
|
|
|
|
|
|
|
|
Basic |
|
$ |
0.61 |
|
|
$ |
0.72 |
|
|
$ |
0.61 |
|
|
$ |
0.47 |
|
|
$ |
0.74 |
|
|
Diluted |
|
$ |
0.57 |
|
|
$ |
0.69 |
|
|
$ |
0.60 |
|
|
$ |
0.46 |
|
|
$ |
0.72 |
|
|
Shares used to compute net income per share attributable to holders of common stock |
|
|
|
|
|
|
|
|
|
|
|
|
|
|
|
|
|
|
|
|
|
Basic |
|
|
49,512 |
|
|
|
51,601 |
|
|
|
51,732 |
|
|
|
60,962 |
|
|
|
62,952 |
|
|
Diluted |
|
|
52,335 |
|
|
|
53,309 |
|
|
|
53,039 |
|
|
|
62,103 |
|
|
|
64,605 |
|
|
|
|
|
|
|
|
|
|
|
|
|
|
|
|
|
|
|
|
|
|
|
|
Cash dividends per share declared to common stockholders |
|
$ |
0.20 |
|
|
$ |
0.24 |
|
|
$ |
0.28 |
|
|
$ |
0.28 |
|
|
$ |
0.28 |
|
|
|
|
|
|
|
|
|
|
|
|
|
|
|
|
|
|
|
|
|
|
|
|
Non-GAAP Financial Data: |
|
|
|
|
|
|
|
|
|
|
|
|
|
|
|
|
|
|
|
|
|
Adjusted EBITDA(1) |
|
$ |
79,295 |
|
|
$ |
98,602 |
|
|
$ |
95,587 |
|
|
$ |
134,288 |
|
|
$ |
160,762 |
|
|
Adjusted net income(2) |
|
$ |
39,037 |
|
|
$ |
48,923 |
|
|
$ |
49,360 |
|
|
$ |
69,973 |
|
|
$ |
89,297 |
|
|
Adjusted earnings per share (3) |
|
$ |
0.75 |
|
|
$ |
0.92 |
|
|
$ |
0.93 |
|
|
$ |
1.13 |
|
|
$ |
1.38 |
|
|
(1) |
The table below sets forth a reconciliation of GAAP net income to non-GAAP adjusted EBITDA based on our historical results: |
34
|
|
|
Year Ended December 31, |
|
|||||||||||||||||
|
Non-GAAP adjusted EBITDA |
|
2013 |
|
|
2014 |
|
|
2015 |
|
|
2016 |
|
|
2017 |
|
|||||
|
|
|
(In thousands, unaudited) |
|
|||||||||||||||||
|
GAAP net income |
|
$ |
29,955 |
|
|
$ |
36,952 |
|
|
$ |
31,617 |
|
|
$ |
28,560 |
|
|
$ |
46,660 |
|
|
Interest income, net |
|
|
(58 |
) |
|
|
(169 |
) |
|
|
(356 |
) |
|
|
(176 |
) |
|
|
(1,167 |
) |
|
Income tax expense |
|
|
14,986 |
|
|
|
23,975 |
|
|
|
17,864 |
|
|
|
20,712 |
|
|
|
39,951 |
|
|
Depreciation and amortization |
|
|
4,024 |
|
|
|
4,930 |
|
|
|
6,092 |
|
|
|
8,946 |
|
|
|
8,505 |
|
|
Amortization of intangible assets (excluding internal use software) |
|
|
- |
|
|
|
- |
|
|
|
- |
|
|
|
10,111 |
|
|
|
11,183 |
|
|
Amortization of internal use software |
|
|
6,007 |
|
|
|
5,614 |
|
|
|
4,566 |
|
|
|
4,853 |
|
|
|
5,279 |
|
|
Amortization and impairment of direct response advertising |
|
|
5,994 |
|
|
|
6,010 |
|
|
|
5,359 |
|
|
|
4,702 |
|
|
|
3,592 |
|
|
Amortization of deferred sales commissions |
|
|
1,869 |
|
|
|
1,525 |
|
|
|
1,717 |
|
|
|
1,560 |
|
|
|
1,052 |
|
|
Non-GAAP EBITDA |
|
|
62,777 |
|
|
|
78,837 |
|
|
|
66,859 |
|
|
|
79,268 |
|
|
|
115,055 |
|
|
Stock-based compensation expense |
|
|
16,518 |
|
|
|
19,765 |
|
|
|
26,028 |
|
|
|
33,689 |
|
|
|
36,425 |
|
|
Acquisition-related expenses |
|
|
- |
|
|
|
- |
|
|
|
2,700 |
|
|
|
17,239 |
|
|
|
5,647 |
|
|
Restructuring expenses |
|
|
- |
|
|
|
- |
|
|
|
- |
|
|
|
- |
|
|
|
3,635 |
|
|
Loss on reacquired franchisee rights |
|
|
- |
|
|
|
- |
|
|
|
- |
|
|
|
4,092 |
|
|
|
- |
|
|
Non-GAAP adjusted EBITDA |
|
$ |
79,295 |
|
|
$ |
98,602 |
|
|
$ |
95,587 |
|
|
$ |
134,288 |
|
|
$ |
160,762 |
|
|
(2) |
The table below sets forth a reconciliation of GAAP net income to non-GAAP adjusted net income based on our historical results: |
|
|
|
Year Ended December 31, |
|
|||||||||||||||||
|
Non-GAAP adjusted net income |
|
2013 |
|
|
2014 |
|
|
2015 |
|
|
2016 |
|
|
2017 |
|
|||||
|
|
|
(In thousands, unaudited) |
|
|||||||||||||||||
|
GAAP net income |
|
$ |
29,955 |
|
|
$ |
36,952 |
|
|
$ |
31,617 |
|
|
$ |
28,560 |
|
|
$ |
46,660 |
|
|
Stock-based compensation expense |
|
|
16,518 |
|
|
|
19,765 |
|
|
|
26,028 |
|
|
|
33,689 |
|
|
|
36,425 |
|
|
Amortization of intangible assets (excluding internal use software) |
|
|
- |
|
|
|
- |
|
|
|
- |
|
|
|
10,111 |
|
|
|
11,183 |
|
|
Acquisition-related expenses |
|
|
- |
|
|
|
- |
|
|
|
2,700 |
|
|
|
17,239 |
|
|
|
5,647 |
|
|
Restructuring expenses |
|
|
- |
|
|
|
- |
|
|
|
- |
|
|
|
- |
|
|
|
3,635 |
|
|
Loss on reacquired franchisee rights |
|
|
- |
|
|
|
- |
|
|
|
- |
|
|
|
4,092 |
|
|
|
- |
|
|
Income tax expense from non- deductible transaction expenses(1) |
|
|
- |
|
|
|
- |
|
|
|
- |
|
|
|
1,162 |
|
|
|
- |
|
|
2017 Tax Act impacts |
|
|
- |
|
|
|
- |
|
|
|
- |
|
|
|
- |
|
|
|
7,641 |
|
|
Release of valuation allowance |
|
|
(1,125 |
) |
|
|
(243 |
) |
|
|
(11 |
) |
|
|
- |
|
|
|
(162 |
) |
|
Tax effect of adjustments(2) |
|
|
(6,311 |
) |
|
|
(7,551 |
) |
|
|
(10,974 |
) |
|
|
(24,880 |
) |
|
|
(21,732 |
) |
|
Non-GAAP adjusted net income |
|
$ |
39,037 |
|
|
$ |
48,923 |
|
|
$ |
49,360 |
|
|
$ |
69,973 |
|
|
$ |
89,297 |
|
|
(1) |
This amount represents estimated additional income tax expense incurred in the period for non-deductible transaction expenses related to acquisition activity. |
|
(2) |
An estimated statutory tax rate of 38.2% has been applied to eliminate the tax-effect for all periods presented. |
35
|
(3) |
The table below sets forth a reconciliation of GAAP diluted earnings per share to non-GAAP adjusted earnings per share based on our historical results: |
|
|
|
Year Ended December 31, |
|
|||||||||||||||||
|
Non-GAAP adjusted earnings per share |
|
2013 |
|
|
2014 |
|
|
2015 |
|
|
2016 |
|
|
2017 |
|
|||||
|
|
|
(In thousands, except per share data, unaudited) |
|
|||||||||||||||||
|
GAAP diluted earnings per share |
|
$ |
0.57 |
|
|
$ |
0.69 |
|
|
$ |
0.60 |
|
|
$ |
0.46 |
|
|
$ |
0.72 |
|
|
Stock-based compensation expense |
|
|
0.32 |
|
|
|
0.37 |
|
|
|
0.49 |
|
|
|
0.54 |
|
|
|
0.56 |
|
|
Amortization of intangible assets (excluding internal use software) |
|
|
- |
|
|
|
- |
|
|
|
- |
|
|
|
0.16 |
|
|
|
0.17 |
|
|
Acquisition-related expenses |
|
|
- |
|
|
|
- |
|
|
|
0.05 |
|
|
|
0.28 |
|
|
|
0.09 |
|
|
Restructuring expenses |
|
|
- |
|
|
|
- |
|
|
|
- |
|
|
|
- |
|
|
|
0.06 |
|
|
Loss on reacquired franchisee rights |
|
|
- |
|
|
|
- |
|
|
|
- |
|
|
|
0.07 |
|
|
|
- |
|
|
Income tax expense from non- deductible transaction expenses(1) |
|
|
- |
|
|
|
- |
|
|
|
- |
|
|
|
0.02 |
|
|
|
- |
|
|
2017 Tax Act impacts |
|
|
- |
|
|
|
- |
|
|
|
- |
|
|
|
- |
|
|
|
0.12 |
|
|
Release of valuation allowance |
|
|
(0.02 |
) |
|
|
- |
|
|
|
- |
|
|
|
- |
|
|
|
- |
|
|
Tax effect of adjustments(2) |
|
|
(0.12 |
) |
|
|
(0.14 |
) |
|
|
(0.21 |
) |
|
|
(0.40 |
) |
|
|
(0.34 |
) |
|
Non-GAAP adjusted earnings per share |
|
$ |
0.75 |
|
|
$ |
0.92 |
|
|
$ |
0.93 |
|
|
$ |
1.13 |
|
|
$ |
1.38 |
|
|
|
|
|
|
|
|
|
|
|
|
|
|
|
|
|
|
|
|
|
|
|
|
Shares of common stock outstanding |
|
|
49,512 |
|
|
|
51,601 |
|
|
|
51,732 |
|
|
|
60,962 |
|
|
|
62,952 |
|
|
Dilutive stock options, RSUs and PSUs |
|
|
2,823 |
|
|
|
1,708 |
|
|
|
1,307 |
|
|
|
1,141 |
|
|
|
1,653 |
|
|
Non-GAAP adjusted common shares outstanding |
|
|
52,335 |
|
|
|
53,309 |
|
|
|
53,039 |
|
|
|
62,103 |
|
|
|
64,605 |
|
|
(1) |
This amount represents estimated additional income tax expense incurred in the period for non-deductible transaction expenses related to acquisition activity. |
|
(2) |
An estimated statutory tax rate of 38.2% has been applied to eliminate the tax-effect for all periods presented. |
|
|
|
As of December 31, |
|
|||||||||||||||||
|
|
|
2013 |
|
|
2014 |
|
|
2015 |
|
|
2016 |
|
|
2017 |
|
|||||
|
|
|
(In thousands) |
|
|||||||||||||||||
|
Balance Sheet Data: |
|
|
|
|
|
|
|
|
|
|
|
|
|
|
|
|
|
|
|
|
|
Cash and cash equivalents |
|
$ |
126,003 |
|
|
$ |
126,564 |
|
|
$ |
305,216 |
|
|
$ |
134,246 |
|
|
$ |
224,543 |
|
|
Short-term investments |
|
$ |
120,027 |
|
|
$ |
179,885 |
|
|
$ |
39,936 |
|
|
$ |
- |
|
|
$ |
- |
|
|
Working capital |
|
$ |
287,489 |
|
|
$ |
347,695 |
|
|
$ |
368,768 |
|
|
$ |
170,499 |
|
|
$ |
284,735 |
|
|
Total assets |
|
$ |
375,681 |
|
|
$ |
435,045 |
|
|
$ |
482,580 |
|
|
$ |
840,136 |
|
|
$ |
925,902 |
|
|
Capital leases |
|
$ |
199 |
|
|
$ |
262 |
|
|
$ |
367 |
|
|
$ |
258 |
|
|
$ |
373 |
|
|
Total liabilities |
|
$ |
53,795 |
|
|
$ |
54,834 |
|
|
$ |
67,433 |
|
|
$ |
92,805 |
|
|
$ |
80,763 |
|
|
Total stockholders’ equity |
|
$ |
321,886 |
|
|
$ |
380,211 |
|
|
$ |
415,147 |
|
|
$ |
747,331 |
|
|
$ |
845,139 |
|
36
Overview
We are a leading provider of independent, technology-enabled comprehensive financial advisory services, discretionary portfolio management, personalized investment advice, financial and retirement income planning, financial education and guidance. We help individuals, either online or with an advisor, develop a strategy to reach financial goals by offering a comprehensive set of services, including holistic, personalized plans for saving and investing, assessments of retirement income, and the option to meet face-to-face with a dedicated financial advisor at one of more than 140 advisor centers nationwide. Our advice and planning services cover employer-sponsored defined contribution (DC) accounts (401(k), 457, and 403(b) plans), IRA accounts, and taxable accounts.
We use our proprietary advice technology platform to provide our services to millions of individual investors, both DC plan participants in the workplace as well as retail investors, on a cost-efficient basis. We believe that our services have significantly increased the accessibility of low-cost, high-quality, independent, personalized portfolio management services, investment advice and financial planning.
Our business model of comprehensive financial planning is based primarily on providing access to our advisory services through DC plans in the workplace, and expanding that connection to a holistic financial advisory relationship with our clients. We also provide advisory services to individual clients who access our services directly. Clients are defined as individuals who utilize our services, including Professional Management, Personal Advisor, Online Advice, education or guidance. We work with three key constituencies: individual investors, plan sponsors (employers offering DC plans to their employees) and plan providers (companies providing administrative services to plan sponsors).
We maintain two types of relationships with DC plan providers. In direct advisory relationships, we are the primary advisor and a plan fiduciary. In subadvisory relationships, the plan provider (or its affiliate) is the primary advisor and plan fiduciary, and we act in a subadvisory capacity.
Revenue
We generate revenue through three primary sources: professional management, platform and other revenue.
Professional Management Revenue
We derive professional management revenue from client fees paid by or on behalf of individual clients in both the workplace and on a retail basis who are enrolled in one of our discretionary portfolio management services (either the Professional Management service or the Personal Advisor service) for the management of their account assets. We use the term professional management revenue to include revenue from both the Professional Management and Personal Advisor services. Our Professional Management service is a discretionary personalized portfolio management service for DC participants who want to work with or delegate the management of their retirement accounts to a professional with the help of an advisor team. Personal Advisor is a personalized service that can provide discretionary portfolio management on a client’s 401(k), IRA and/or taxable accounts, as well as financial planning and a dedicated advisor representative that clients can meet with in person, online or by phone. Our retirement income solutions, including Income+ and Retirement Paycheck, which are features of our Professional Management and Personal Advisor services, respectively, provide clients approaching or in retirement with discretionary portfolio management with an income objective and steady monthly payments from their accounts during retirement, including Social Security claiming guidance and planning. Our discretionary portfolio management services in the workplace are generally made available to prospective clients by written agreements with the plan provider, the plan sponsor and the plan participant in a DC plan (and may be provided on a subadvisory basis)generally made available by written agreements with individual retail investors .
37
Our arrangements with clients using discretionary portfolio management services generally provide for fees based on the value of assets we manage and are generally payable quarterly in arrears. The majority of our client fees for DC accounts, for both advisory and subadvisory relationships, are calculated on a monthly basis, as the product of client fee rates and the value of assets under management (AUM) at or near the end of each month. In general, we expect this monthly methodology to reduce the impact of financial market volatility on this portion of our professional management revenue, although this methodology may result in lower client fees if the financial markets are down when client fees are calculated, even if the market had performed well earlier in the month or the quarter. For IRA and taxable accounts, our client fees are calculated on a quarterly basis at the end of each quarter. In general, we expect this quarterly methodology to potentially result in greater impact of financial market volatility on this portion of our professional management revenue and may result in lower client fees if the financial markets are down when client fees are calculated, even if the market had performed well earlier in the month or the quarter.
Pursuant to the contracts with our clients, we calculate the fees billed to clients based on the asset amounts in data files as received directly from the account provider or custodian, with no judgments or estimates on our part. None of our professional management fee revenue is based on investment performance or other incentive arrangements. Our fees generally are based on AUM, which is influenced by market performance. Our fees are not based on a share of the capital gains or appreciation in a client’s account. In some cases, our client fees or the applicable fee schedule may adjust downward based on overall participant or DC AUM enrollment performance milestones over time. Our client fees are determined by the value of the assets in the client’s account at specified dates and are recognized as the services are performed.
The trends associated with our professional management revenue are driven primarily by trends related to our AUM, as well as the trends related to client fees. The factors primarily affecting our AUM include our ability to enroll and retain clients in our discretionary portfolio management services, to retain existing and to sign new contracts with sponsors, providers and custodians, the level of employee, employer and individual investor contributions, and market performance. The factors primarily affecting our client fees include the value of services provided and industry pricing trends that result in ongoing downward pricing pressure. In addition, there are other factors that have varying impact and applicability from period to period, including fee reductions based upon individual account balances or achieving plan enrollment thresholds, contract modifications at the plan sponsor level, the timing of promotional and communication techniques, and the net effect of sponsor conversions between advisory and subadvisory status.
In order to encourage utilization of our discretionary portfolio management services, we use a variety of promotional and communication techniques, some of which can potentially impact the amount of revenue recognized, the timing of revenue recognition or both. Historically, we have seen a general preference from workplace plan sponsors to commence campaigns in the second and third quarters of the year and we expect this trend to continue. We would generally expect our professional management revenue to continue to increase as a percentage of overall revenue, which will cause our revenue to become increasingly more sensitive to market performance.
Professional management revenue is earned as services are performed. We use estimates primarily related to the portion of professional management revenue that has not been invoiced and is not otherwise due from the customer at period end.
Professional Management Revenue Metrics
AUM is defined as the amount of assets that we manage as part of our discretionary portfolio management services. Our AUM is the value of assets under management as reported by plan providers and custodians at or near the end of each month or quarter.
38
DC AUM is the DC asset balances associated with clients enrolled in one of our discretionary portfolio management services in the workplace. We measure enrollment in our discretionary portfolio services by DC clients as a percentage of eligible DC prospective clients and by DC AUM as a percentage of defined contribution account Assets Under Contract (DC AUC). IRA and taxable account AUM represent the IRA and taxable account asset balances associated with those clients enrolled in the Personal Advisor service as of a specified date.
As of December 31, 2017, we had approximately $156.4 billion of DC AUM and $13.0 billion of IRA and taxable account AUM associated with approximately 1,058,000 total clients.
DC AUC is defined as the amount of assets in DC plans under contract for which discretionary portfolio management services have been made available to eligible prospective clients in the workplace. Our DC AUC and eligible prospective clients do not include assets or prospective clients in DC plans where we have signed contracts but for which we have not yet made our discretionary portfolio management services available.
Eligible prospective clients and DC AUC are reported by plan providers with varying frequency and at different points in time, and are not always updated or marked to market. If markets have declined or if assets have left the plan since the reporting date, our DC AUC may be overstated. If markets have risen, or if assets have been added to the plan, since the reporting date, our DC AUC may be understated. Some prospective clients may not be eligible for our services due to plan sponsor limitations on employees treated as insiders for purposes of securities laws or other characteristics of the prospective client. Certain securities within a plan prospective client’s account may be ineligible for management by us, such as employer stock subject to trading restrictions, and we do not manage or charge a fee for that portion of the account. In both of these circumstances, assets of the relevant prospective clients may be included in DC AUC but cannot be converted to DC AUM. We believe that DC AUC can be a useful indicator of the additional DC plan assets available for enrollment efforts that, if successful, would result in these assets becoming DC AUM. We believe that total eligible prospective clients provides a useful approximation of the number of workplace-based prospective clients available for enrollment into our one of our discretionary portfolio management services.
As of December 31, 2017, we had approximately $1.22 trillion of DC AUC and 9.8 million eligible prospective clients in DC plans for which our discretionary portfolio management services were available. As of December 31, 2017, approximately 10.4% of DC eligible prospective clients were enrolled as clients and 12.8% of DC AUC was enrolled as DC AUM.
Changes in AUM
The following definitions are provided and relate to the table below, illustrating estimated changes in our AUM over the last four quarters.
New assets from new clients represents the aggregate amount of new AUM, measured at or near the end of the quarter, from new clients who enrolled in one of our discretionary portfolio management services within the quarter. We receive DC account balances for each new client at least weekly, and accordingly, we are generally able to measure the DC account asset balances within a week of the end of the quarter for new clients. For new clients with new IRA and taxable accounts assets, we are generally able to measure the account balances as of the last day of the quarter. New client assets for IRA and taxable accounts are those assets acquired within a ninety-day period after enrollment during which assets may be rolled into those accounts, and new client assets acquired in the subsequent quarter after enrollment are valued as of the last day of that subsequent quarter.
39
New assets from existing clients represents the aggregate amount of new AUM within the quarter from existing clients who originally enrolled in one of our discretionary portfolio management services during a prior period. These new assets include employer and employee contributions into DC plan accounts, as well as assets added by existing clients into new or existing IRA and taxable accounts. Employer and employee DC contributions data is estimated each quarter from annual contribution rates based on data received from plan providers or plan sponsors. Typically, we receive data from plan providers or plan sponsors via weekly client files, allowing us to estimate contributions for those clients for whom we have received this data. After the first 90 days, new clients become existing clients. For new IRA and taxable account assets, we are generally able to measure the new assets from existing clients as of the date the additional assets are deposited.
Voluntary cancellations represent the aggregate amount of assets, measured at or near the start of the quarter, for clients who have voluntarily terminated their discretionary portfolio management service relationship within the period. Clients may cancel at any time without any requirement to provide advance notice. Our quarter-end AUM excludes all of the assets of any accounts cancelled by a client prior to the end of the last day of the quarter. We receive DC account balances for each client at least weekly, and accordingly, we are able to measure the DC account asset balances within a week of the start of the quarter for existing clients. For existing IRA and taxable accounts assets, we are able to measure the account balances as of the first day of the quarter.
Involuntary cancellations represent the aggregate amount of DC assets, measured at or near the start of the quarter, for clients whose discretionary portfolio management service relationship was terminated within the period for reasons other than a voluntary termination. Such cancellations may occur when all of the client’s account balances have been reduced to zero or when the cancellation of a plan sponsor contract for discretionary portfolio services has become effective within the period. Plan sponsors may cancel their contract upon specified notice or without notice for fiduciary reasons or breach of contract. If a plan sponsor has provided advance notice of cancellation of the plan sponsor contract, however, the AUM for clients of that plan sponsor is included in our AUM until the effective date of the cancellation, which is typically the business day following the termination date, after which it is no longer part of our AUM. If a client’s accounts value falls to zero, either upon the effective date of a sponsor cancellation or as a result of the client transferring the entire balance of their accounts, we will terminate their discretionary portfolio management services relationship.
Assets withdrawn by existing clients includes voluntary withdrawals from IRA and taxable accounts. Voluntary withdrawals represent the aggregate amount of assets, measured at the time of withdrawal, for clients who took automatic distributions or who otherwise withdrew funds from their managed IRA or taxable accounts without terminating their service relationship within the period.
Market movement and other factors affecting AUM include estimated market movement, plan administrative and investment advisory fees, client loans, hardship and other defined contribution account withdrawals, and timing differences for the data feeds for clients enrolled in our discretionary portfolio management services throughout the period. We expect that market movement would typically represent the most substantial portion of this line item in any given quarter.
40
The following table illustrates estimated changes in our AUM over the last four quarters:
|
|
|
Q1'17 |
|
|
Q2'17 |
|
|
Q3'17 |
|
|
Q4'17 |
|
||||
|
|
|
(In billions) |
|
|||||||||||||
|
AUM, beginning of period |
|
$ |
138.0 |
|
|
$ |
144.4 |
|
|
$ |
151.8 |
|
|
$ |
160.2 |
|
|
New assets - new clients |
|
|
3.4 |
|
|
|
5.3 |
|
|
|
5.4 |
|
|
|
6.4 |
|
|
New assets - existing clients(1) |
|
|
2.4 |
|
|
|
2.4 |
|
|
|
2.5 |
|
|
|
2.5 |
|
|
Asset cancellations - voluntary |
|
|
(2.1 |
) |
|
|
(1.6 |
) |
|
|
(1.6 |
) |
|
|
(2.1 |
) |
|
Asset cancellations - involuntary(2) |
|
|
(2.7 |
) |
|
|
(3.3 |
) |
|
|
(1.9 |
) |
|
|
(3.3 |
) |
|
Assets withdrawn - existing clients |
|
|
(0.2 |
) |
|
|
(0.1 |
) |
|
|
(0.2 |
) |
|
|
(0.2 |
) |
|
Net new assets |
|
|
0.8 |
|
|
|
2.7 |
|
|
|
4.2 |
|
|
|
3.3 |
|
|
Market movement and other |
|
|
5.6 |
|
|
|
4.7 |
|
|
|
4.2 |
|
|
|
5.9 |
|
|
AUM, end of period |
|
$ |
144.4 |
|
|
$ |
151.8 |
|
|
$ |
160.2 |
|
|
$ |
169.4 |
|
|
(1) |
For Q1’17, Q2’17, Q3’17 and Q4’17, we estimate employer and employee DC plan contributions to be $2.1 billion, $2.2 billion, $2.2 billion and $2.3 billion, respectively. For the last four quarters, the weekly client files contained annual contribution rates, employer matching and salary levels for a subset of our total DC clients, representing approximately 89-92% of our DC clients. Effective Q1’17, we have changed the basis of this estimate from AUM to clients, as we believe this provides a more accurate estimate. The average contribution rate is calculated using this data and extrapolated to approximate 100% of employee and employer contributions for our overall AUM. |
|
(2) |
Involuntary client cancellations due to the effective date of a plan sponsor cancellation occurring between January 1, 2018 and January 31, 2018 would cause the total AUM that was reported as of December 31, 2017 to be reduced by 0.3%. |
Our AUM increases or decreases based on several factors. AUM can increase due to market performance, by the addition of new assets as clients enroll into our discretionary portfolio management services, and by the addition of new assets from existing clients, including from employee and employer contributions into their DC accounts. AUM can decrease due to market performance and by the reduction of assets as a result of clients terminating their relationships, clients rolling their assets out of their accounts, and sponsors canceling our discretionary portfolio management services. Historically, client cancellation rates have typically increased during periods where there has been a significant decline in stock market performance. In addition, client cancellation rates are typically the highest during the six months immediately following the completion of a given promotion, and certain types of promotional techniques may result in higher than average cancellation rates at the end of the promotional period.
As of December 31, 2017, the approximate aggregate style exposure of the accounts we managed was as follows:
|
Domestic Equity |
|
|
46 |
% |
|
International Equity |
|
|
29 |
% |
|
Bonds |
|
|
23 |
% |
|
Cash and uncategorized assets(1) |
|
|
2 |
% |
|
Total |
|
|
100 |
% |
|
(1) |
Uncategorized assets may include CDs, options, warrants and other vehicles not currently categorized. |
The percentages in the table above can be affected by the asset exposures of the overall market portfolio of the accounts we manage, the demographics of our client population including the adoption of Income+, the number of clients who have told us that they want to assume greater or lesser investment risk, and, to a lesser extent given the amount of assets we have under management, the proportion of our clients for whom we have completed the transition from their initial portfolio.
41
A substantial portion of the assets we manage is invested in equity securities, the market prices of which can vary substantially based on changes in economic conditions. An additional portion is invested in fixed income securities, which will generally have lower volatility than the equity market. Therefore, while any changes in equity market performance would significantly affect the value of our AUM, particularly for the AUM invested in equity securities, such changes would typically result in lower volatility for our AUM than the volatility of the equity market as a whole. Because a substantial portion of our revenue is derived from the value of our AUM, changes in fixed income or equity market performance could significantly affect the amount of revenue in a given period. If any of these factors reduces our AUM, the amount of client fees we would earn for managing those assets would decline, which in turn could negatively impact our revenue.
Platform Revenue
We derive platform revenue from recurring, subscription-based fees for access to our services, including Online Advice, Financial Wellness programs, and to a lesser extent, from setup fees. Online Advice is a non-discretionary, Internet-based investment advisory service, which includes personalized online savings and investment advice, and retirement income projections for clients who want to manage their retirement themselves. Our Financial Wellness program consists of a wide range of financial education and guidance delivered through multiple channels, including in person, on-site events, online content and phone-based advisors. The arrangements generally provide for our fees to be paid by the plan sponsor, plan provider or the DC plan itself, depending on the plan structure. Platform revenue is generally paid annually or quarterly in advance and recognized ratably over the term of the subscription period beginning after the completion of customer setup and data connectivity. Setup fees are recognized ratably over seven years and are immaterial for the periods presented.
Other Revenue
Other revenue includes reimbursement for a portion of marketing and client materials from certain subadvisory relationships. Non-retirement account servicing fees were applicable for the period of February 1, 2016 to December 31, 2016. Franchise royalty fees were applicable for the period of February 1, 2016 to September 30, 2016, as we had acquired all remaining franchises as of October 2016. Professional management revenue earned subsequent to the respective acquisition date of the franchises is included in professional management revenue. Costs associated with reimbursed printed fulfillment materials are expensed to cost of revenue as incurred.
Costs and Expenses
Employee compensation and related expenses represent our largest expense. These expenses include employee-related expenses including wages, benefits expenses and employer payroll tax, cash incentive compensation expense, variable cash compensation expense related to ongoing asset servicing activities by advisor center advisors, commission expense, and non-cash stock-based compensation expense. Our cash incentive compensation plan is based, in part, on achieving pre-determined annual corporate financial objectives and may result in an increased current period expense while the anticipated revenue benefits associated with the achievement of such corporate financial objectives may be realized in future periods. We allocate compensation, including wages, cash incentive compensation expense and non-cash stock-based compensation, and other expenses from overhead departments such as human resources, facilities and information technology to our cost of revenue, research and development, sales and marketing, general and administrative functional areas, as well as to internal use software, which is included in amortization of intangible assets.
We expect our headcount to increase over time, and to be a primary area of growth in our costs and expenses. We anticipate granting equity awards to board members and certain of our employees each year that may result in significant non-cash stock-based compensation expense. We anticipate the largest grant events to typically occur in the first quarter of each year, although significant awards may also be granted at other times. In 2016, we began to issue restricted stock units as the primary stock award for non-executive employees, rather than stock options. We anticipate providing annual compensation increases to certain of our employees each year, typically in the first quarter, that would result in an increase primarily to wages and cash incentive compensation expenses.
42
Other costs and expenses include the costs of fees paid to plan providers related to the exchange of plan and prospective client data, as well as implementing our transaction instructions for client accounts, printed marketing and client materials and postage, facilities-related expenses, advertising including radio and digital, consulting and professional service expenses, amortization and depreciation for hardware and software purchases and support, and amortization of intangible assets.
The following summarizes our cost of revenue and certain significant operating expenses:
Cost of Revenue. Cost of revenue includes fees paid to plan providers for connectivity to plan and plan prospective client data, printed materials fulfillment costs for certain subadvisory relationships for which a portion are reimbursed, and printed client materials. Also included in cost of revenue are employee-related costs for in-person dedicated advisor centers, including variable cash compensation expense related to ongoing asset servicing activities, as well as employee-related costs for call center advisors, operations, implementations, technical operations, portfolio management and client service administration. Costs in this area are related primarily to payments to third parties, employee compensation and related expenses, facilities-related expenses, purchased materials and depreciation. Costs for connectivity to plan and prospective client data are expected to increase proportionally with our professional management revenue related to DC AUM. The expenses included in cost of revenue are shared across the different revenue categories, and we are not able to meaningfully allocate such costs between separate categories of revenue. Consequently, all costs and expenses applicable to our revenue are included in the category cost of revenue in our Consolidated Statements of Income.
Research and Development. Research and development expense includes costs associated with defining and specifying new features and ongoing enhancement to our advice engines and other aspects of our service offerings, investment methodology, financial research, quality assurance, related administration and other costs that do not qualify for capitalization. Costs in this area are related primarily to employee compensation for our engineering, product development and investment research personnel and associated expenses, and to a lesser extent, external consulting expenses related to development, support and maintenance of our existing services.
Sales and Marketing. Sales and marketing expense includes costs associated with product and consumer marketing, provider and sponsor relationship management, provider and sponsor marketing, direct sales, corporate communications, public relations, creative services, sales related call center activities, advertising and live seminars, and printing of, and postage for, marketing materials for direct advisory relationships, including amortization of direct response advertising. Costs in this area are related primarily to employee compensation for sales and marketing personnel and related expenses, and also include commissions, printed materials and general marketing programs, including radio and digital advertising. Amounts received for support of marketing and client acquisition efforts are credited ratably to marketing expense. The fees for such support do not impact client fees paid for discretionary portfolio management services, and are disclosed in the applicable Form ADV of the company advisory subsidiaries.
General and Administrative. General and administrative expense includes costs for finance, accounting, legal, compliance, risk management and administration, as well as acquisition-related expenses, when applicable. Costs in this area include employee compensation and related expenses, and fees for consulting and professional services.
Amortization of Intangible Assets. Amortization of intangible assets includes the amortization of acquisition-related assets such as customer relationships, trademarks and trade names over the estimated useful lives using a straight-line method of amortization. It also includes the amortization of internal use software, which includes engineering costs associated with enhancing our advisory service platform and developing internal systems for tracking client data, including AUM, client cancellations and other related client and customer experience statistics. Associated direct development costs are capitalized and amortized using the straight-line method over the estimated lives, typically two to three years, of the underlying technology. Costs associated with internal use software include employee compensation and related expenses, and fees for external consulting services.
43
Our consolidated financial statements are prepared in accordance with accounting principles generally accepted in the United States of America which requires us to make judgments, assumptions and estimates that affect the amounts reported. We have established policies and control procedures which seek to ensure that estimates and assumptions are appropriately governed and applied consistently from period to period. However, actual results could differ from our assumptions and estimates, and such differences could be material.
We believe that the following accounting estimates are the most critical to fully understand and evaluate our reported financial results, as they require our most subjective or complex management judgments, resulting from the need to make estimates about the effect of matters that are inherently uncertain and unpredictable.
Purchase Price Accounting
On February 1, 2016, we completed the acquisition of The Mutual Fund Store for aggregate consideration totaling approximately $513 million, consisting of approximately $246 million in cash and 9,885,889 shares of our common stock, subject to certain closing and post-closing adjustments. A portion of the acquisition consideration was placed in an escrow fund for up to 14 months following the closing for the satisfaction of certain indemnification claims. For the year ended December 31 2016, we completed the acquisition of twenty-one franchises for a total aggregate cash consideration of $35.3 million. For more information on these acquisitions, see Note 4 to the consolidated financial statements.
We are required to allocate the purchase consideration paid in a business combination to the tangible and intangible assets acquired and to the liabilities assumed based on their respective acquisition-date fair values, and any residual purchase price is recorded as goodwill. Determining the fair market values of the assets acquired and liabilities assumed at the date of acquisition requires knowledge of current market values, and the values of assets in use, and often requires the application of considerable judgment regarding estimates and assumptions. Assumed liabilities are valued based on estimates of anticipated expenditures to be incurred to satisfy the assumed obligations, including contractual liabilities assumed, which require the exercise of professional judgment as to amounts and timing of settlement. Our estimates may include, but are not limited to, future cash flows of an acquired business, the appropriate discount rate, expected customer retention rates and the cost savings expected to be derived from an acquisition. These estimates are inherently difficult, subjective and unpredictable, and if different estimates were used, the purchase price allocation to the acquired assets and liabilities would be different. In addition, we make estimates when we assign useful lives to intangible assets identified as part of our acquisitions. These estimates are also inherently uncertain and if different estimates were used, the useful life over which we amortize intangible assets would be different. Therefore, our assessment of the estimated fair value of each of these assets and liabilities can have a material effect on our financial statements.
Direct Response Advertising
Effective July 1, 2009, we commenced capitalization of advertising costs associated with direct advisory active enrollment campaigns, where marketing materials are sent to solicit enrollment in our Professional Management service, which caused a significant amount of costs to be capitalized for the years ended December 31, 2015, 2016 and 2017. Our advertising costs consist primarily of printed materials associated with new client solicitations, as well as internal labor costs associated with the production of these printed materials. Advertising costs that do not qualify as direct response advertising are expensed to sales and marketing at the first time the advertisement takes place. As campaign materials are modified over time, we evaluate the content to ensure we have properly identified those campaigns which qualify for capitalization per the accounting definition of direct-response advertising and expense those campaigns that do not qualify as incurred.
44
Direct response advertising costs are capitalized only if the primary purpose of the advertising is to elicit sales to customers who could be shown to have responded specifically to the advertising and the direct response advertising results in probable future benefits. Advertising costs relating to passive enrollment campaigns, where the plan sponsor defaults all eligible clients into the Professional Management service unless they decline, and other general marketing materials sent to participants do not qualify as direct response advertising and are expensed to sales and marketing in the period the advertising activities first take place. Printed fulfillment costs relating to subadvisory campaigns do not qualify as direct response advertising and are expensed to cost of revenue in the period in which the expenses were incurred. Advertising costs associated with direct advisory active enrollment campaigns that result in probable future benefits qualify for capitalization as direct response advertising. The capitalized costs are amortized over the period over which the future benefits are expected to be received. Because of how we earn revenue from our Professional Management service, demonstrating that the direct response advertising related to our direct advisory active enrollment campaigns results in probable future benefits requires us to make several assumptions about the average period of probable future benefits, the gross revenue we will earn and costs we will incur as a result of each campaign.
We have developed forecasting methodologies that have a degree of reliability sufficient to reasonably estimate the future gross revenue stream associated with a given campaign. The estimates we use in our forecasting methodologies include average period of probable future benefits, change in AUM due to market performance, AUM cancellation rates, net contribution rates and estimated enrollment results for campaigns that have not yet been completed. We have estimated our period of probable future benefits by considering both the historical retention rate of our clients while not exceeding the number of years over which we can accurately forecast future net revenues. The change in AUM due to market performance is an estimate of future stock market performance and its estimated relative effect on our AUM. AUM cancellation rate is defined as the rate at which assets will cancel out of the Professional Management service due to voluntary client terminations. A voluntary client termination is when a client contacts us and terminates his or her membership in the Professional Management service. Involuntary cancellations (such as sponsor and employee terminations or rollovers) are captured in the net contribution rate. Net contribution rate is defined as the net amount assets will increase as a result of new contributions into the 401(k) plan less the amount assets will decrease as a result of disbursements from the 401(k) plan, as a result of involuntary cancellations. We have estimated AUM cancellation and net contribution rates by analyzing their respective historical rates. We currently have assumed a probable period of future benefits of three years, no change in AUM due to market performance and a zero net contribution rate for the purpose of calculating estimated gross revenue. The realizability of the amounts of direct response advertising reported as assets are evaluated at each balance sheet date by comparing the carrying amounts of such assets on a cost-pool-by-cost-pool basis to the probable remaining future net revenues expected to result directly from such advertising.
As of December 31, 2017, $4.7 million of advertising costs associated with Professional Management service active choice enrollment campaigns were reported as assets. During the years ended December 31, 2015, 2016 and 2017, we capitalized $4.4 million, $3.5 million and $2.5 million, respectively, of direct response advertising costs. Advertising expense was $8.2 million, $19.9 million and $21.6 million for the years ended December 31, 2015, 2016 and 2017, respectively, of which direct response advertising amortization was $5.5 million, $4.8 million and $3.7 million, respectively. During the years ended December 31, 2015, 2016 and 2017, impairments to direct response advertising were immaterial. Advertising expense other than direct response advertising amortization, such as radio and digital advertising, was expensed as incurred.
The table below evaluates the sensitivity of the two estimates that are most impactful to the realizability of the net capitalized direct response advertising costs as of December 31, 2017, namely average period of probable future benefits and assumed change in our AUM due to market performance. This sensitivity analysis considered all historic and current year campaigns with a net capitalized balance as of December 31, 2017 under our current assumptions of a three-year average period of probable future benefits and 0% change in AUM due to market performance per year. The sensitivity table indicates the additional expense charges that would have been recorded during the year ended December 31, 2017 if, effective January 1, 2017, we had assumed different levels of change in AUM due to market performance and assumed an estimated period of probable benefits other than 3 years.
45
Direct Response Advertising Sensitivity Analysis
Additional Expense (Impairments) to be Recognized
|
|
|
Assumed Change in AUM due to Market Performance (1) |
|
|||||||||||||
|
|
|
-20% |
|
|
-10% |
|
|
0% |
|
|
8% |
|
||||
|
|
|
(In thousands) |
|
|||||||||||||
|
Average Period of Probable Future Benefits: |
|
|
|
|
|
|
|
|
|
|
|
|
|
|
|
|
|
1 year |
|
$ |
5,527 |
|
|
$ |
5,406 |
|
|
$ |
5,278 |
|
|
$ |
5,157 |
|
|
2 years |
|
$ |
2,154 |
|
|
$ |
1,918 |
|
|
$ |
1,797 |
|
|
$ |
1,747 |
|
|
3 years |
|
$ |
553 |
|
|
$ |
143 |
|
|
$ |
- |
|
|
$ |
- |
|
|
4 years |
|
$ |
87 |
|
|
$ |
4 |
|
|
$ |
- |
|
|
$ |
- |
|
|
5 years |
|
$ |
87 |
|
|
$ |
- |
|
|
$ |
- |
|
|
$ |
- |
|
|
(1) |
Any comparable percentage change to AUM due to market performance, net contribution rate and AUM cancellation rate would have the same relative impact on the sensitivity analysis as they all directly impact client AUM. |
We expect direct response advertising costs currently capitalized and amortized for certain printed materials associated with new customer solicitations to be expensed as incurred after adoption of Accounting Standards Update No. (ASU) 2014-09, Revenue from Contracts with Customers, on January 1, 2018.
Stock-Based Compensation
Stock-based compensation expense for stock option awards is estimated at the grant date based on the award’s fair value as calculated by the Black-Scholes option pricing model and is recognized as expense over the requisite service period. The determination of the fair value of stock-based option awards on the date of grant using an option pricing model is affected by our stock price as well as assumptions regarding a number of complex and subjective variables. These variables include volatility, actual and projected employee stock option exercise behaviors, risk-free interest rate, estimated forfeitures and expected dividends over the expected term of the awards.
|
|
|
Year Ended December 31, |
|
||||||
|
|
|
2015 |
|
|
2016 |
|
|
2017 |
|
|
Expected life in years |
|
6 |
|
|
6 |
|
|
6 |
|
|
Risk-free interest rate |
|
1.72% |
|
|
1.42% |
|
|
2.05% |
|
|
Volatility |
|
37% |
|
|
43% |
|
|
38% |
|
|
Dividend yield |
|
0.8% |
|
|
1.0% |
|
|
0.7% |
|
We use the “simplified” method in developing an estimate of expected term of stock options. We base the risk-free interest rate on risk-free U.S. Treasury issues with remaining terms similar to the expected term on the options. Prior to 2016, the computation of expected volatility was based on a combination of the historical and implied volatility of comparable companies from a representative peer group based on industry and market capitalization data, as well as our own historical volatility. Beginning in 2016, we base expected volatility solely on our own historical volatility, as we had sufficient exercise history to do so. We include a dividend yield in our Black-Scholes option pricing model to reflect the anticipated dividends to be paid over the expected term of the awards.
46
The 2013-2017 Long-Term Incentive Program (the LTIP) was based on objective performance criteria pre-established by the Compensation Committee of the Board of Directors. Stock-based compensation expense for performance stock units (PSUs) was based on the award’s fair value as of the grant date, as well as the estimated probability of achieving the objective performance criteria pre-established by the Compensation Committee of the Board of Directors. The stock-based compensation expense for PSUs is recognized as expense over the requisite service period under the graded-vesting attribution method, net of estimated forfeitures prior to January 1, 2017. Each PSU consisted of two vesting cliffs, with sixty percent vested on January 1, 2016 and forty percent vested on January 1, 2018. Depending on performance against the target metrics, vesting could be between 0% and 140% of target value for each of the vesting cliffs. On a quarterly basis, the estimated probability of achieving the objective performance criteria was re-evaluated by management and the expense was adjusted accordingly at the end of each balance sheet period. In determining the probability of achieving the performance objectives, management had to make judgments based on forecasted information. The number of shares of our common stock issued to the award recipients at the end of each of the PSU vesting periods was based on actual achievement results. This plan expired on January 1, 2018.
Recent Developments
On December 22, 2017, the U.S. government enacted comprehensive tax legislation commonly referred to as the Tax Cuts and Jobs Act (the 2017 Tax Act). We have not completed our determination of the accounting implications of the 2017 Tax Act. However, we have reasonably estimated the effects of the 2017 Tax Act and recorded provisional amounts in our financial statements as of December 31, 2017. We recorded a provisional tax expense for the impact of the 2017 Tax Act of approximately $7.6 million. This amount is comprised primarily of the remeasurement of federal deferred tax assets resulting from the permanent reduction in the U.S. statutory corporate tax rate to 21% from 35%. As we complete our analysis of the 2017 Tax Act, collect and prepare necessary data, and interpret any additional guidance issued by the U.S. Treasury Department, the IRS, and other standard-setting bodies, we may make adjustments to the provisional amounts.
47
The following tables set forth our results of operations. The period to period comparisons of financial results are not necessarily indicative of future results.
Comparison of the Years Ended December 31, 2016 and 2017
|
|
|
Year Ended December 31, |
|
|
Year Ended December 31, |
|
|
Increase (Decrease) |
|
|
|||||||||||||||
|
|
|
2016 |
|
|
2017 |
|
|
2016 |
|
|
2017 |
|
|
Amount |
|
|
% |
|
|
||||||
|
|
|
(As a percentage of revenue) |
|
|
(In thousands, except percentages) |
|
|
||||||||||||||||||
|
Revenue: |
|
|
|
|
|
|
|
|
|
|
|
|
|
|
|
|
|
|
|
|
|
|
|
|
|
|
Professional management |
|
|
91 |
|
% |
|
94 |
|
% |
$ |
385,944 |
|
|
$ |
450,320 |
|
|
$ |
64,376 |
|
|
|
17 |
|
% |
|
Platform |
|
|
7 |
|
|
|
5 |
|
|
|
28,366 |
|
|
|
26,558 |
|
|
|
(1,808 |
) |
|
|
(6 |
) |
|
|
Other |
|
|
2 |
|
|
|
1 |
|
|
|
9,627 |
|
|
|
3,628 |
|
|
|
(5,999 |
) |
|
|
(62 |
) |
|
|
Total revenue |
|
|
100 |
|
|
|
100 |
|
|
|
423,937 |
|
|
|
480,506 |
|
|
|
56,569 |
|
|
|
13 |
|
|
|
Costs and expenses: |
|
|
|
|
|
|
|
|
|
|
|
|
|
|
|
|
|
|
|
|
|
|
|
|
|
|
Cost of revenue |
|
|
44 |
|
|
|
44 |
|
|
|
186,009 |
|
|
|
212,924 |
|
|
|
26,915 |
|
|
|
14 |
|
|
|
Research and development |
|
|
9 |
|
|
|
9 |
|
|
|
37,983 |
|
|
|
44,018 |
|
|
|
6,035 |
|
|
|
16 |
|
|
|
Sales and marketing |
|
|
20 |
|
|
|
17 |
|
|
|
84,068 |
|
|
|
80,888 |
|
|
|
(3,180 |
) |
|
|
(4 |
) |
|
|
General and administrative |
|
|
11 |
|
|
|
8 |
|
|
|
46,497 |
|
|
|
39,696 |
|
|
|
(6,801 |
) |
|
|
(15 |
) |
|
|
Amortization of intangible assets, including internal use software |
|
|
3 |
|
|
|
4 |
|
|
|
15,408 |
|
|
|
17,028 |
|
|
|
1,620 |
|
|
|
11 |
|
|
|
Loss on reacquired franchisee rights |
|
|
1 |
|
|
|
- |
|
|
|
4,092 |
|
|
|
- |
|
|
|
(4,092 |
) |
|
n/a |
|
|
|
|
Total costs and expenses |
|
|
88 |
|
|
|
82 |
|
|
|
374,057 |
|
|
|
394,554 |
|
|
|
20,497 |
|
|
|
5 |
|
|
|
Income from operations |
|
|
12 |
|
|
|
18 |
|
|
|
49,880 |
|
|
|
85,952 |
|
|
|
36,072 |
|
|
|
72 |
|
|
|
Interest income, net |
|
|
- |
|
|
|
- |
|
|
|
176 |
|
|
|
1,167 |
|
|
|
991 |
|
|
|
563 |
|
|
|
Other expense, net |
|
|
- |
|
|
|
- |
|
|
|
(784 |
) |
|
|
(508 |
) |
|
|
276 |
|
|
|
(35 |
) |
|
|
Income before income tax expense |
|
|
12 |
|
|
|
18 |
|
|
|
49,272 |
|
|
|
86,611 |
|
|
|
37,339 |
|
|
|
76 |
|
|
|
Income tax expense |
|
|
5 |
|
|
|
8 |
|
|
|
20,712 |
|
|
|
39,951 |
|
|
|
19,239 |
|
|
|
93 |
|
|
|
Net income |
|
|
7 |
|
% |
|
10 |
|
% |
$ |
28,560 |
|
|
$ |
46,660 |
|
|
$ |
18,100 |
|
|
|
63 |
|
% |
Revenue
Total revenue increased $56.6 million, or 13%, from $423.9 million for the year ended December 31, 2016 to $480.5 million for the year ended December 31, 2017, which included one additional month of revenue from 2016 acquisition activity compared to the year ended December 31, 2016. This increase was due primarily to growth in professional management revenue of $64.4 million for the year ended December 31, 2017 compared to the year ended December 31, 2016, partially offset by decreases in platform revenue and other revenue of $1.8 million and $6.0 million, respectfully. Professional management revenue and platform revenue comprised 94% and 5%, respectively, of total revenue for the year ended December 31, 2017, and 91% and 7% respectively, of total revenue for the year ended December 31, 2016.
48
Professional Management Revenue
Professional management revenue increased $64.4 million, or 17%, from $385.9 million for the year ended December 31, 2016 to $450.3 million for the year ended December 31, 2017, which includes one additional month of professional management revenue from 2016 acquisition activity. This increase in professional management revenue for the year ended December 31, 2017 was due primarily to an increase in the estimated average AUM used to calculate fees from approximately $127.2 billion for the year ended December 31, 2016 to approximately $153.3 billion for the year ended December 31, 2017, which was driven primarily by new assets from new and existing clients and market performance, partially offset by cancellations and withdrawals. The increase in professional management revenue was also driven by franchise acquisitions in 2016, as we now receive all of the advisory fees rather than a royalty percentage. In addition, there was a decrease in average fees due primarily to the net effect of sponsor conversions between advisory and subadvisory status, fee reductions based upon individual account balances, contract modifications and the timing of promotional and communication techniques. As we establish various strategies, including pricing packages, to solidify our long-term growth, we expect that revenue growth will be under pressure in 2018.
Platform Revenue
Platform revenue decreased $1.8 million, or 6%, from $28.4 million for the year ended December 31, 2016 to $26.6 million for the year ended December 31, 2017. This decrease in platform revenue for the year ended December 31, 2017 was due primarily to a small percentage of sponsor terminations, as well as platform fee reductions resulting from sponsors adding new services, converting to a subadvisory plan provider as well as contract modifications. These decreases were partially offset by an increase in platform fees due to service availability at new sponsors. We expect platform revenue to continue to decline as we employ various pricing strategies.
Other Revenue
Other revenue decreased $6.0 million, or 62%, from $9.6 million for the year ended December 31, 2016 to $3.6 million for the year ended December 31, 2017. This decrease was due primarily to a contract change which eliminated account servicing fees as of January 1, 2017, as well as the elimination of franchise royalty revenue after we acquired all franchises as of October 2016, partially offset by an increase in reimbursable printed fulfillment materials from some subadvisory relationships.
Costs and Expenses
Costs and expenses increased $20.5 million, or 5%, from $374.1 million for the year ended December 31, 2016 to $394.6 million for the year ended December 31, 2017. This increase was due to a $26.9 million increase in cost of revenue, a $6.0 million increase in research and development expense, a $3.2 million decrease in sales and marketing expense, a $6.8 million decrease in general and administrative expense, a $1.6 million increase in amortization of intangible assets and a $4.1 million decrease in loss on required franchisee rights for the year ended December 31, 2017 compared to the year ended December 31, 2016.
Employee-related expenses, including wages, increased primarily as a result of headcount growth and compensation increases, and additionally due to an increase in severance expenses related to employee terminations as the result of restructuring activities. The restructuring activities were undertaken to position us for future growth and reallocate resources to priority areas. Cash incentive compensation expense increased primarily as a result of headcount growth and compensation increases, and additionally due to higher cash incentive plan percentage achievement for the year ended December 31, 2017 compared to the year ended December 31, 2016
Non-cash stock-based compensation also increased across all functional areas due primarily to awards granted to executive and non-executive employees in the past year. Our equity awards generally vest over four years and we utilize the graded-vesting attribution method, resulting in greater amounts of compensation expense recognized in earlier periods of the awards with declining amounts recognized in later periods.
49
We granted equity awards with an aggregate estimated expense value of approximately $28.3 million to certain of our existing executive and non-executive employees in the first quarter of 2017. In addition, we granted equity awards with an aggregate estimated expense value of approximately $16.6 million to certain of our existing non-executive employees in the fourth quarter of 2017. In February 2018, the Board of Directors approved equity awards with an aggregate estimated expense value of approximately $11 million to be granted to certain of our existing executive employees in February 2018. The non-cash stock-based compensation expense associated with these awards will be in addition to the amortization of both previously and subsequently granted stock awards. We typically account for equity awards over a four-year vesting period utilizing the graded-vesting attribution method and the expense may be reduced by forfeitures as they occur. We plan to continue to grant equity awards during fiscal year 2018 to certain of our existing employees, new employees and board members.
We adopted the entity-wide accounting policy election to account for forfeitures when they occur per ASU 2017-09 effective January 1, 2017, which may cause the timing of our non-cash stock-based compensation expense to be more volatile.
Cost of Revenue
Cost of revenue increased $26.9 million, or 14%, from $186.0 million for the year ended December 31, 2016 to $212.9 million for the year ended December 31, 2017. There was an increase of $11.2 million in employee-related expenses, including wages, an increase of $1.9 million in cash incentive compensation expense and an increase of $2.0 million in non-cash stock-based compensation for the year ended December 31, 2017 compared to the year ended December 31, 2016. There was also an increase of $6.4 million in fees paid to plan providers for connectivity to plan and plan participant data due primarily to an increase in professional management revenue related to DC AUM. In addition, variable cash compensation expense, related to ongoing asset servicing activities by acquired advisor center advisors, increased $3.2 million. Facilities–related overhead expenses, including rent and depreciation, increased $2.5 million due primarily to increased headcount. These increases were partially offset by a $0.8 million decrease in printed member and subadvisory marketing materials costs as we move more towards electronic delivery, as well as a decrease of $0.1 million in other expenses. As a percentage of revenue, cost of revenue remained constant at 44% for the years ended December 31, 2016 and 2017.
Research and Development
Research and development expense increased $6.0 million, or 16%, from $38.0 million for the year ended December 31, 2016 to $44.0 million for the year ended December 31, 2017. There was an increase of $3.9 million in employee-related expenses, including wages and severance expenses, an increase of $1.1 million in cash incentive compensation expense and an increase of $1.7 million in non-cash stock-based compensation expense for the year ended December 31, 2017 compared to the year ended December 31, 2016. Other expenses, including facilities–related overhead expenses, including rent and depreciation, as well as non-capitalized equipment related expenses, increased $1.0 million. These increases were partially offset by a $1.7 million increase in the amount of internal use software capitalized as increased labor rates and more developer hours were dedicated to internal use software projects for the year ended December 31, 2017. As a percentage of revenue, research and development expense remained constant at 9% for the years ended December 31, 2016 and 2017.
50
Sales and marketing expense decreased $3.2 million, or 4%, from $84.1 million for the year ended December 31, 2016 to $80.9 million for the year ended December 31, 2017. There was a $4.0 million decrease in consulting expenses for the year ended December 31, 2017 compared to the year ended December 31, 2016 due primarily to outside marketing services related mainly to brand and pricing evaluations incurred in 2016, as well as an acquisition-related consulting contract which terminated in the three months ended March 31, 2017. In addition, there was a $1.5 million decrease in printed marketing materials expense due primarily to a decrease in the amortization of direct response advertising as we move more towards electronic delivery. There was also a $1.2 million decrease in marketing programs due primarily to an increase in the amounts received for support of marketing and client acquisition efforts, partially offset by an increase in marketing programs expense, including radio and digital advertising. Additionally, there was a $1.4 million decrease in non-cash stock-based compensation expense due to employee terminations and a $0.6 million decrease in facilities–related overhead expenses, including rent and depreciation. These increases were partially offset by a $3.6 million increase in employee-related expense, including wages and severance expenses, and a $1.3 million increase in cash incentive compensation expense. There was also an increase of $0.6 million in non-capitalized equipment related expense. As a percentage of revenue, sales and marketing expenses decreased from 20% for the year ended December 31, 2016 to 17% for the year ended December 31, 2017. The decrease as a percentage of revenue was due primarily to a decrease in consulting expenses, marketing programs expenses, printed marketing materials expenses, and non-cash stock-based compensation expense.
General and Administrative
General and administrative expense decreased $6.8 million, or 15%, from $46.5 million for the year ended December 31, 2016 to $39.7 million for the year ended December 31, 2017. There was a $7.0 million decrease in consulting and professional services fees due primarily to acquisition-related expenses incurred during the year ended December 31, 2016. Other expenses, including travel and entertainment, cash incentive compensation expense, and non-capitalized equipment related expenses decreased $1.1 million. This decrease was partially offset by a $1.3 million increase in allocated facilities–related overhead expenses, including rent and depreciation. As a percentage of revenue, general and administrative expense decreased from 11% for the year ended December 31, 2016 to 8% for the year ended December 31, 2017. The decrease as a percentage of revenue was due primarily to the decrease in consulting and professional services expenses.
Amortization of Intangible Assets
Amortization of intangible assets increased $1.6 million, or 11%, from $15.4 million for the year ended December 31, 2016 to $17.0 million for the year ended December 31, 2017, due primarily to one additional month of amortization related to acquisitions activity in 2016.
Loss on Reacquired Franchisee Rights
In the case of two franchise acquisitions, we assessed the fair value of these reacquired rights to be less than the purchase price based on market values of other recently reacquired franchisee rights. This resulted in an unfavorable reacquisition of these franchisee rights, resulting in a $4.1 million loss for these transactions for the year ended December 31, 2016.
Interest Income, Net
Interest income, net of interest expense, increased $1.0 million, or 563%, from $0.2 million for the year ended December 31, 2016 to $1.2 million for the year ended December 31, 2017 due primarily to an increase in our cash balance and interest rates.
Other Expense, Net
Other expense, net of other income, decreased $0.3 million for the year ended December 31, 2017 due primarily to losses on leasehold improvement asset disposals.
51
Income tax expense increased from $20.7 million for the year ended December 31, 2016 to $40.0 million for the year ended December 31, 2017. Our effective tax rates were 42% and 46% for the year ended December 31, 2016 and 2017, respectively. Our effective tax rate increased during the year ended December 31, 2017 primarily due to the accounting for 2017 Tax Act.
On December 22, 2017, the U.S. government enacted comprehensive tax legislation. We have not completed our determination of the accounting implications of the 2017 Tax Act. However, we have reasonably estimated the effects of the 2017 Tax Act and recorded provisional amounts in our financial statements as of December 31, 2017. We recorded provisional tax expense for the impact of the 2017 Tax Act of approximately $7.6 million comprised primarily of the remeasurement of federal deferred tax assets resulting from the permanent reductions in the U.S. statutory corporate tax rate to 21% from 35%. The effective tax rate for the year ended December 31, 2016 was higher than the federal statutory rate of 35% due primarily to non-deductible expenditures incurred in connection with acquisition activity.
The reduction in the U.S. statutory corporate tax rate to 21% from 35% is effective for the Company beginning January 1, 2018, and accordingly, we expect to see an effective tax rate of approximately 24% to 26% in future years, excluding the effect of discrete items in future periods.
Effective January 1, 2017, we adopted ASU 2016-09, which requires the income tax effects (excess tax benefits or deficiencies) of awards to be recognized in the income statement as discrete items when the awards vest or are settled. This may also cause our effective tax rate to be more volatile in future periods.
Comparison of the Years Ended December 31, 2015 and 2016
|
|
|
Year Ended December 31, |
|
|
Year Ended December 31, |
|
|
Increase (Decrease) |
|
|
|||||||||||||||
|
|
|
2015 |
|
|
2016 |
|
|
2015 |
|
|
2016 |
|
|
Amount |
|
|
% |
|
|
||||||
|
|
|
(As a percentage of revenue) |
|
|
(In thousands, except percentages) |
|
|
||||||||||||||||||
|
Revenue: |
|
|
|
|
|
|
|
|
|
|
|
|
|
|
|
|
|
|
|
|
|
|
|
|
|
|
Professional management |
|
|
89 |
|
% |
|
91 |
|
% |
$ |
277,162 |
|
|
$ |
385,944 |
|
|
$ |
108,782 |
|
|
|
39 |
|
% |
|
Platform |
|
|
10 |
|
|
|
7 |
|
|
|
30,766 |
|
|
|
28,366 |
|
|
|
(2,400 |
) |
|
|
(8 |
) |
|
|
Other |
|
|
1 |
|
|
|
2 |
|
|
|
2,794 |
|
|
|
9,627 |
|
|
|
6,833 |
|
|
|
245 |
|
|
|
Total revenue |
|
|
100 |
|
|
|
100 |
|
|
|
310,722 |
|
|
|
423,937 |
|
|
|
113,215 |
|
|
|
36 |
|
|
|
Costs and expenses: |
|
|
|
|
|
|
|
|
|
|
|
|
|
|
|
|
|
|
|
|
|
|
|
|
|
|
Cost of revenue |
|
|
42 |
|
|
|
44 |
|
|
|
131,011 |
|
|
|
186,009 |
|
|
|
54,998 |
|
|
|
42 |
|
|
|
Research and development |
|
|
10 |
|
|
|
9 |
|
|
|
35,581 |
|
|
|
37,983 |
|
|
|
2,402 |
|
|
|
7 |
|
|
|
Sales and marketing |
|
|
20 |
|
|
|
20 |
|
|
|
61,262 |
|
|
|
84,068 |
|
|
|
22,806 |
|
|
|
37 |
|
|
|
General and administrative |
|
|
9 |
|
|
|
11 |
|
|
|
28,813 |
|
|
|
46,497 |
|
|
|
17,684 |
|
|
|
61 |
|
|
|
Amortization of intangible assets, including internal use software |
|
|
2 |
|
|
|
3 |
|
|
|
4,900 |
|
|
|
15,408 |
|
|
|
10,508 |
|
|
|
214 |
|
|
|
Loss on reacquired franchisee rights |
|
|
- |
|
|
|
1 |
|
|
|
- |
|
|
|
4,092 |
|
|
|
4,092 |
|
|
n/a |
|
|
|
|
Total costs and expenses |
|
|
84 |
|
|
|
88 |
|
|
|
261,567 |
|
|
|
374,057 |
|
|
|
112,490 |
|
|
|
43 |
|
|
|
Income from operations |
|
|
16 |
|
|
|
12 |
|
|
|
49,155 |
|
|
|
49,880 |
|
|
|
725 |
|
|
|
1 |
|
|
|
Interest income, net |
|
|
- |
|
|
|
- |
|
|
|
356 |
|
|
|
176 |
|
|
|
(180 |
) |
|
|
(51 |
) |
|
|
Other expense, net |
|
|
- |
|
|
|
- |
|
|
|
(30 |
) |
|
|
(784 |
) |
|
|
(754 |
) |
|
|
2,513 |
|
|
|
Income before income tax expense |
|
|
16 |
|
|
|
12 |
|
|
|
49,481 |
|
|
|
49,272 |
|
|
|
(209 |
) |
|
|
(0 |
) |
|
|
Income tax expense |
|
|
6 |
|
|
|
5 |
|
|
|
17,864 |
|
|
|
20,712 |
|
|
|
2,848 |
|
|
|
16 |
|
|
|
Net income |
|
|
10 |
|
% |
|
7 |
|
% |
$ |
31,617 |
|
|
$ |
28,560 |
|
|
$ |
(3,057 |
) |
|
|
(10 |
) |
% |
52
Total revenue increased $113.2 million, or 36%, from $310.7 million for the year ended December 31, 2015 to $423.9 million for the year ended December 31, 2016. The increase was due primarily to growth in professional management revenue of $108.8 million for the year ended December 31, 2016 compared to the year ended December 31, 2015, as well as an increase in other revenue of $6.8 million, offset by a decrease in platform revenue of $2.4 million. Revenue due to acquisitions was $103.8 million for the year ended December 31, 2016. Professional management revenue and platform revenue comprised 91% and 7%, respectively, of total revenue for the year ended December 31, 2016, and 89% and 10% respectively, of total revenue for the year ended December 31, 2015.
Throughout the year ended December 31, 2016, we repurchased all twenty-one franchises of The Mutual Fund Store. Approximately $6.4 million of revenue for the year ended December 31, 2016 was associated with repurchased franchises, representing the incremental revenue associated with receiving all of the advisory fees rather than a royalty percentage as a result of franchise acquisitions.
Professional Management Revenue
Professional management revenue increased $108.8 million, or 39%, from $277.2 million for the year ended December 31, 2015 to $385.9 million for the year ended December 31, 2016. This increase in professional management revenue for the year ended December 31, 2016 was due primarily to an increase in the estimated average AUM used to calculate fees from approximately $110.9 billion for the year ended December 31, 2015 to approximately $127.2 billion for the year ended December 31, 2016, as well as an increase in average basis points over the prior year as result of client agreements associated with acquired assets. This increase in average AUM was driven by new AUM of $9.8 billion as measured on March 31, 2016 acquired through The Mutual Fund Store acquisition, net new assets from new and existing clients, including contributions, and market performance. Approximately $96.5 million of professional management revenue for the year ended December 31, 2016 was associated with acquisitions.
Platform Revenue
Platform revenue decreased $2.4 million, or 8%, from $30.8 million for the year ended December 31, 2015 to $28.4 million for the year ended December 31, 2016. This decrease in platform revenue for the year ended December 31, 2016 was due primarily to a small number of sponsor terminations, as well as platform fee reductions resulting from a small number of sponsors converting to a subadvisory plan provider. These decreases were partially offset by an increase in platform fees due to service availability at new sponsors.
Other Revenue
Other revenue increased $6.8 million, or 245%, from $2.8 million for the year ended December 31, 2015 to $9.6 million for the year ended December 31, 2016. This increase was due primarily to the addition of account servicing fee revenue and franchise royalty revenue of $6.9 million as a result of acquisition activity. As we have acquired all remaining franchises, we no longer expect to have franchise royalty revenue subsequent to October 2016. Professional management revenue earned subsequent to the respective acquisition dates of the franchises is included in professional management revenue.
Costs and Expenses
Costs and expenses increased $112.5 million, or 43%, from $261.6 million for the year ended December 31, 2015 to $374.1 million for the year ended December 31, 2016. This increase was due to a $55.0 million increase in cost of revenue, a $2.4 million increase in research and development expense, a $22.8 million increase in sales and marketing expense, a $17.7 million increase in general and administrative expense, a $10.5 million increase in amortization of intangible assets, and a $4.1 million loss on reacquired franchisee rights for the year ended December 31, 2016 compared to the year ended December 31, 2015. Expenses increased during year ended December 31, 2016 due primarily to increased personnel and operations related to the acquisitions.
53
Across all functional areas, employee-related expenses, such as wages and cash incentive compensation expense, increased primarily as a result of acquisition activity, which included the addition of approximately 340 new employees. Non-cash stock-based compensation also increased across all functional areas due primarily to awards granted to employees acquired in February 2016, as well as to awards granted to certain executives in May 2016. In addition to compensation-related expenses, other expenses related to the acquisition of The Mutual Fund Store such as advertising expenses, with the addition of radio and digital advertising, and facilities-related expenses, with the addition of approximately 130 advisor center locations and an Overland Park, Kansas office, significantly contributed to the increase in expenses for the year ended December 31, 2016.
Across all functional areas non-cash stock-based compensation expense increased due primarily to equity awards granted during the years ended December 31, 2015 and 2016. Our equity awards generally vest over four years and we utilize the graded-vesting attribution method, resulting in greater amounts of compensation expense recognized in earlier periods of the awards with declining amounts recognized in later periods.
Effective February 1, 2016, the performance metrics related to the LTIP will be based on the financial results at the consolidated level, per the terms of the LTIP agreements. The amounts earned under the LTIP based on such consolidated financial results may result in an increase or decrease in non-cash stock-based compensation expense for the year ended December 31, 2017.
Cost of Revenue
Cost of revenue increased $55.0 million, or 42%, from $131.0 million for the year ended December 31, 2015 to $186.0 million for the year ended December 31, 2016. There was an increase of $18.4 million in employee-related expenses, including wages, an increase of $3.4 million in cash incentive compensation expense and an increase of $2.9 million in non-cash stock-based compensation expense for the year ended December 31, 2016 compared to the year ended December 31, 2015, due primarily to the majority of acquired employees categorized to cost of revenue, including advisors and other employees associated with advisor center servicing activities. In addition, variable cash compensation expense, related to ongoing asset servicing activities by acquired advisor center advisors, resulted in expense of $11.7 million. Facilities–related expenses, including rent, depreciation and overhead allocations, increased $12.3 million due primarily to acquired advisor centers and increased allocation due to increased headcount. There was also an increase of $4.0 million in fees paid to plan providers for connectivity to plan and plan participant data due primarily to an increase in professional management revenue related to DC AUM. Non-capitalized equipment-related expenses increased $1.9 million due primarily to hardware and software support expenses as a result of the acquisition. In addition, general operating expenses increased $0.7 million, travel and entertainment increased $0.6 million, hosting and production expenses increased $0.3 million, consulting expenses increased $0.3 million and other expenses increased $0.4 million. These increases were partially offset by a $2.1 million decrease in printed member and subadvisory marketing materials costs as we move more towards electronic delivery. As a percentage of revenue, cost of revenue increased from 42% for the year ended December 31, 2015 to 44% for the year ended December 31, 2016 due primarily to employee-related expense, including wages, variable cash compensation expenses and facilities-related expenses increasing at a faster rate than revenue, partially offset by data connectivity fees expense increasing at a slower rate than revenue.
54
Research and development expense increased $2.4 million, or 7%, from $35.6 million for the year ended December 31, 2015 to $38.0 million for the year ended December 31, 2016. There was an increase of $3.7 million in employee-related expenses, including wages, an increase of $1.2 million in cash incentive compensation expense and an increase of $0.6 million in non-cash stock-based compensation expense for the year ended December 31, 2016 compared to the year ended December 31, 2015. Facilities–related expenses, including rent, depreciation and overhead allocations, increased $0.4 million and other expenses increased $0.1 million. These increases were partially offset by a $2.2 million increase in the amount of internal use software capitalized as increased labor rates and more developer hours were dedicated to internal use software projects for the year ended December 31, 2016, as well as a decrease of $1.4 million in consulting expenses as projects required less external support for the year ended December 31, 2016. As a percentage of revenue, research and development expense decreased from 11% for the year ended December 31, 2015 to 9% for the year ended December 31, 2016. The decrease as a percentage of revenue was due primarily to employee-related expenses, including wages, and non-cash stock-based compensation expense increasing at a slower rate than revenue.
Sales and Marketing
Sales and marketing expense increased $22.8 million, or 37%, from $61.3 million for the year ended December 31, 2015 to $84.1 million for the year ended December 31, 2016. There was a $9.2 million increase in marketing programs expense, due primarily to radio and digital advertising, partially offset by amounts received for support of marketing and client acquisition efforts for the year ended December 31, 2016 compared to the year ended December 31, 2015. In addition, there was a $3.3 million increase in employee-related expense, including wages, and a $2.3 million increase in cash incentive compensation expense, due primarily to the addition of employees as the result of acquisition activity and annual compensation increases. There was also a $1.9 million increase in non-cash stock-based compensation expense, due primarily to the addition of employees as the result of acquisition activity. Consulting expenses increased $4.3 million, due primarily to outside marketing services related mainly to brand and pricing evaluations. Travel and entertainment expenses increased $1.8 million, due primarily to an annual national advisors conference. Facilities–related overhead expenses, including rent, depreciation and overhead allocations, increased by $0.9 million. These increases were partially offset by a $0.7 million decrease in printed marketing materials expense as more printed marketing materials qualified for capitalization in accordance with the accounting definition of direct response advertising for the year ended December 31, 2016, as well as a $0.2 million decrease in commission expense. As a percentage of revenue, sales and marketing expenses remained constant at 20% for the years ended December 31, 2015 and 2016.
General and Administrative
General and administrative expense increased $17.7 million, or 61%, from $28.8 million for the year ended December 31, 2015 to $46.5 million for the year ended December 31, 2016. There was an $8.1 million increase in consulting and professional services expenses, due primarily to fees related to the acquisition of The Mutual Fund Store for the year ended December 31, 2016 compared to the year ended December 31, 2015. In addition, there was a $4.3 million increase in employee-related expenses, including wages, and a $2.5 million increase in cash incentive compensation expense, due primarily to the addition of employees as the result of acquisition activity, as well as annual compensation increases. There was also a $1.6 million increase in non-cash stock-based compensation expense, due primarily to increases in headcount as a result of acquisition activity. In addition, there was a $0.7 million increase in travel and entertainment expenses, a $0.5 million increase in other equipment related expenses and a $0.5 million increase in operating and other expenses. These increases were partially offset by a $0.5 million decrease in facilities–related overhead expenses, including rent, depreciation and overhead allocations. As a percentage of revenue, general and administrative expense increased from 9% for the year ended December 31, 2015 to 11% for the year ended December 31, 2016. The increase as a percentage of revenue was due primarily to an increase in acquisition-related professional services expenses relative to the increase in revenue during the year.
55
Amortization of Intangible Assets
Amortization of intangible assets increased $10.5 million, or 214%, from $4.9 million for the year ended December 31, 2015 to $15.4 million for the year ended December 31, 2016, due primarily to the addition of amortization of customer relationships, and trademarks and trade names associated with acquisition activity.
Loss on Reacquired Franchisee Rights
In the case of two franchise acquisitions, we assessed the fair value of these reacquired rights to be less than the amount paid to reacquire them based on market values of other recently reacquired franchisee rights. This resulted in an unfavorable reacquisition of these franchisee rights, resulting in a $4.1 million loss for these transactions for the year ended December 31, 2016.
Interest Income, Net
Interest income, net of interest expense, decreased $0.2 million, or 51%, from $0.4 million for the year ended December 31, 2015 to $0.2 million for the year ended December 31, 2016, as interest earned on short-term investments decreased. As of January 2016, we have sold all of our short-term investments.
Other Expense, Net
Other expense, net of other income, increased $0.8 million for the year ended December 31, 2016, due primarily to losses on fixed asset disposals as well as notes receivable that were deemed uncollectable.
Income Taxes
Income tax expense increased from $17.9 million for the year ended December 31, 2015 to $20.7 million for the year ended December 31, 2016. Our effective tax rates were 36% and 42% for the year ended December 31, 2015 and 2016, respectively. The effective tax rate increased during the year ended December 31, 2016 due primarily to non-deductible expenditures incurred in connection with acquiring The Mutual Fund Store. The lower effective tax rate for the year ended December 31, 2015 was due primarily to the recognition of tax benefits upon resolution of income tax uncertainties and changes in state taxes.
56
Quarterly Results of Operations
The following table sets forth our unaudited quarterly condensed consolidated statements of income data for the eight quarters ended December 31, 2017. The data have been prepared on the same basis as the audited consolidated financial statements and related notes, and you should read the following tables together with such financial statements. The quarterly results of operations include all necessary adjustments, consisting of only normal recurring adjustments that we consider necessary for a fair presentation of this data. Results of interim periods are not necessarily indicative of results for the entire year and are not necessarily indicative of future results. The acquisition of The Mutual Fund Store occurred on February 1, 2016, and as a result, the three months ended March 31, 2016 includes only two months of revenue and expenses related to that acquired business.
Our professional management revenue generally increased sequentially in each of the quarters presented as a result of AUM growth driven primarily by a combination of contributions, net new enrollment resulting from marketing campaigns and other ongoing client acquisitions and market appreciation. Platform revenue has decreased due primarily to platform fee reductions as a result of sponsors adding new asset-based discretionary portfolio management services, as well as sponsors converting to a subadvisory plan provider or terminating. Other revenue decreased due primarily to a contract change which eliminated account servicing fees as of January 1, 2017, as well as the elimination of franchise royalty revenue after we acquired all franchises as of October 2016.
Total costs and expenses have fluctuated both in absolute dollars and percentage of revenue from quarter to quarter due primarily to increases in employee-related expenses and cash incentive compensation expenses related to headcount growth and compensation increases, as well as non-cash stock-based compensation expenses. Other significant fluctuations included fees paid to plan providers for connectivity to plan and plan participant data, and consulting and professional services expense which were generally high in 2016 as a result of acquisition integration efforts. Cost of revenue generally increased in absolute dollars for each quarter presented as a result of increased data connectivity fees and headcount growth. General and administrative expenses increased for the three months ended March 31, 2016 due to significant acquisition-related closing costs. During the three months ended December 31, 2017, we recorded $3.6 million of severance and benefits related to restructuring activities. Notable income tax fluctuations include additional income tax expense due to non-deductible transaction expenses related to acquisition activity for the three months ended March 31, 2016 and the remeasurement of deferred tax assets resulting from the 2017 Tax Act for the three months ended December 31, 2017.
57
|
|
|
For the Three Months Ended |
|
|||||||||||||||||||||||||||||
|
Condensed Consolidated Statements of Income Data: |
|
Mar 31, 2016 |
|
|
Jun 30, 2016 |
|
|
Sept 30, 2016 |
|
|
Dec 31, 2016 |
|
|
Mar 31, 2017 |
|
|
Jun 30, 2017 |
|
|
Sept 30, 2017 |
|
|
Dec 31, 2017 |
|
||||||||
|
|
|
(In thousands, except per share data, unaudited) |
|
|||||||||||||||||||||||||||||
|
Revenue: |
|
|
|
|
|
|
|
|
|
|
|
|
|
|
|
|
|
|
|
|
|
|
|
|
|
|
|
|
|
|
|
|
|
Professional management |
|
$ |
82,806 |
|
|
$ |
96,071 |
|
|
$ |
102,641 |
|
|
$ |
104,426 |
|
|
$ |
106,760 |
|
|
$ |
110,640 |
|
|
$ |
114,088 |
|
|
$ |
118,832 |
|
|
Platform |
|
|
7,098 |
|
|
|
7,173 |
|
|
|
7,035 |
|
|
|
7,060 |
|
|
|
6,894 |
|
|
|
6,784 |
|
|
|
6,528 |
|
|
|
6,352 |
|
|
Other |
|
|
2,154 |
|
|
|
2,989 |
|
|
|
2,748 |
|
|
|
1,736 |
|
|
|
441 |
|
|
|
1,050 |
|
|
|
1,631 |
|
|
|
506 |
|
|
Total revenue |
|
|
92,058 |
|
|
|
106,233 |
|
|
|
112,424 |
|
|
|
113,222 |
|
|
|
114,095 |
|
|
|
118,474 |
|
|
|
122,247 |
|
|
|
125,690 |
|
|
Costs and expenses: |
|
|
|
|
|
|
|
|
|
|
|
|
|
|
|
|
|
|
|
|
|
|
|
|
|
|
|
|
|
|
|
|
|
Cost of revenue |
|
|
39,331 |
|
|
|
46,540 |
|
|
|
50,230 |
|
|
|
49,908 |
|
|
|
51,525 |
|
|
|
53,286 |
|
|
|
53,253 |
|
|
|
54,860 |
|
|
Research and development |
|
|
9,267 |
|
|
|
8,967 |
|
|
|
9,599 |
|
|
|
10,150 |
|
|
|
10,568 |
|
|
|
11,119 |
|
|
|
10,771 |
|
|
|
11,560 |
|
|
Sales and marketing |
|
|
18,463 |
|
|
|
21,686 |
|
|
|
21,743 |
|
|
|
22,176 |
|
|
|
19,315 |
|
|
|
21,189 |
|
|
|
19,933 |
|
|
|
20,451 |
|
|
General and administrative |
|
|
14,600 |
|
|
|
9,809 |
|
|
|
11,189 |
|
|
|
10,899 |
|
|
|
12,194 |
|
|
|
8,566 |
|
|
|
8,941 |
|
|
|
9,995 |
|
|
Amortization of intangible assets, including internal use software |
|
|
3,026 |
|
|
|
4,099 |
|
|
|
4,012 |
|
|
|
4,271 |
|
|
|
4,163 |
|
|
|
4,231 |
|
|
|
4,289 |
|
|
|
4,345 |
|
|
Loss on reacquired franchisee rights |
|
|
- |
|
|
|
- |
|
|
|
4,092 |
|
|
|
- |
|
|
|
- |
|
|
|
- |
|
|
|
- |
|
|
|
- |
|
|
Total costs and expenses |
|
|
84,687 |
|
|
|
91,101 |
|
|
|
100,865 |
|
|
|
97,404 |
|
|
|
97,765 |
|
|
|
98,391 |
|
|
|
97,187 |
|
|
|
101,211 |
|
|
Income from operations |
|
|
7,371 |
|
|
|
15,132 |
|
|
|
11,559 |
|
|
|
15,818 |
|
|
|
16,330 |
|
|
|
20,083 |
|
|
|
25,060 |
|
|
|
24,479 |
|
|
Interest income (expense) |
|
|
4 |
|
|
|
(20 |
) |
|
|
149 |
|
|
|
43 |
|
|
|
67 |
|
|
|
196 |
|
|
|
351 |
|
|
|
553 |
|
|
Other expense, net |
|
|
(33 |
) |
|
|
(427 |
) |
|
|
(185 |
) |
|
|
(139 |
) |
|
|
(128 |
) |
|
|
(44 |
) |
|
|
(29 |
) |
|
|
(307 |
) |
|
Income before income taxes |
|
|
7,342 |
|
|
|
14,685 |
|
|
|
11,523 |
|
|
|
15,722 |
|
|
|
16,269 |
|
|
|
20,235 |
|
|
|
25,382 |
|
|
|
24,725 |
|
|
Income tax expense |
|
|
4,013 |
|
|
|
5,642 |
|
|
|
4,376 |
|
|
|
6,681 |
|
|
|
4,095 |
|
|
|
7,432 |
|
|
|
9,963 |
|
|
|
18,461 |
|
|
Net income |
|
$ |
3,329 |
|
|
$ |
9,043 |
|
|
$ |
7,147 |
|
|
$ |
9,041 |
|
|
$ |
12,174 |
|
|
$ |
12,803 |
|
|
$ |
15,419 |
|
|
$ |
6,264 |
|
|
|
|
|
|
|
|
|
|
|
|
|
|
|
|
|
|
|
|
|
|
|
|
|
|
|
|
|
|
|
|
|
|
|
|
Net income per share: |
|
|
|
|
|
|
|
|
|
|
|
|
|
|
|
|
|
|
|
|
|
|
|
|
|
|
|
|
|
|
|
|
|
Basic |
|
$ |
0.06 |
|
|
$ |
0.15 |
|
|
$ |
0.12 |
|
|
$ |
0.15 |
|
|
$ |
0.19 |
|
|
$ |
0.20 |
|
|
$ |
0.24 |
|
|
$ |
0.10 |
|
|
Diluted |
|
$ |
0.06 |
|
|
$ |
0.14 |
|
|
$ |
0.11 |
|
|
$ |
0.14 |
|
|
$ |
0.19 |
|
|
$ |
0.20 |
|
|
$ |
0.24 |
|
|
$ |
0.10 |
|
|
|
|
|
|
|
|
|
|
|
|
|
|
|
|
|
|
|
|
|
|
|
|
|
|
|
|
|
|
|
|
|
|
|
|
Non-GAAP Financial Data: |
|
|
|
|
|
|
|
|
|
|
|
|
|
|
|
|
|
|
|
|
|
|
|
|
|
|
|
|
|
|
|
|
|
Adjusted EBITDA(1) |
|
$ |
28,283 |
|
|
$ |
33,446 |
|
|
$ |
36,325 |
|
|
$ |
36,234 |
|
|
$ |
35,196 |
|
|
$ |
37,415 |
|
|
$ |
42,373 |
|
|
$ |
45,778 |
|
|
Adjusted net income(2) |
|
$ |
14,391 |
|
|
$ |
17,554 |
|
|
$ |
19,425 |
|
|
$ |
18,603 |
|
|
$ |
21,092 |
|
|
$ |
20,636 |
|
|
$ |
23,315 |
|
|
$ |
24,254 |
|
|
Adjusted earnings per share(3) |
|
$ |
0.24 |
|
|
$ |
0.28 |
|
|
$ |
0.31 |
|
|
$ |
0.29 |
|
|
$ |
0.33 |
|
|
$ |
0.32 |
|
|
$ |
0.36 |
|
|
$ |
0.38 |
|
58
|
(1) |
The table below sets forth a reconciliation of GAAP net income to non-GAAP adjusted EBITDA based on our historical results: |
|
|
|
For the Three Months Ended |
|
|||||||||||||||||||||||||||||
|
Non-GAAP adjusted EBITDA |
|
Mar 31, 2016 |
|
|
Jun 30, 2016 |
|
|
Sept 30, 2016 |
|
|
Dec 31, 2016 |
|
|
Mar 31, 2017 |
|
|
Jun 30, 2017 |
|
|
Sept 30, 2017 |
|
|
Dec 31, 2017 |
|
||||||||
|
|
|
(In thousands, unaudited) |
|
|||||||||||||||||||||||||||||
|
GAAP net income |
|
$ |
3,329 |
|
|
$ |
9,043 |
|
|
$ |
7,147 |
|
|
$ |
9,041 |
|
|
$ |
12,174 |
|
|
$ |
12,803 |
|
|
$ |
15,419 |
|
|
$ |
6,264 |
|
|
Interest (income) expense |
|
|
(4 |
) |
|
|
20 |
|
|
|
(149 |
) |
|
|
(43 |
) |
|
|
(67 |
) |
|
|
(196 |
) |
|
|
(351 |
) |
|
|
(553 |
) |
|
Income tax expense |
|
|
4,013 |
|
|
|
5,642 |
|
|
|
4,376 |
|
|
|
6,681 |
|
|
|
4,095 |
|
|
|
7,432 |
|
|
|
9,963 |
|
|
|
18,461 |
|
|
Depreciation and amortization |
|
|
2,047 |
|
|
|
2,260 |
|
|
|
2,363 |
|
|
|
2,276 |
|
|
|
2,118 |
|
|
|
2,084 |
|
|
|
2,110 |
|
|
|
2,193 |
|
|
Amortization of intangible assets (excluding internal use software) |
|
|
1,675 |
|
|
|
2,916 |
|
|
|
2,710 |
|
|
|
2,810 |
|
|
|
2,796 |
|
|
|
2,797 |
|
|
|
2,795 |
|
|
|
2,795 |
|
|
Amortization of internal use software |
|
|
1,247 |
|
|
|
1,084 |
|
|
|
1,187 |
|
|
|
1,335 |
|
|
|
1,239 |
|
|
|
1,298 |
|
|
|
1,348 |
|
|
|
1,394 |
|
|
Amortization and impairment of direct response advertising |
|
|
1,214 |
|
|
|
1,211 |
|
|
|
1,122 |
|
|
|
1,155 |
|
|
|
919 |
|
|
|
1,032 |
|
|
|
877 |
|
|
|
764 |
|
|
Amortization of deferred sales commissions |
|
|
418 |
|
|
|
413 |
|
|
|
413 |
|
|
|
316 |
|
|
|
288 |
|
|
|
287 |
|
|
|
230 |
|
|
|
247 |
|
|
Non-GAAP EBITDA |
|
|
13,939 |
|
|
|
22,589 |
|
|
|
19,169 |
|
|
|
23,571 |
|
|
|
23,562 |
|
|
|
27,537 |
|
|
|
32,391 |
|
|
|
31,565 |
|
|
Stock-based compensation expense |
|
|
6,204 |
|
|
|
8,523 |
|
|
|
9,580 |
|
|
|
9,382 |
|
|
|
8,443 |
|
|
|
9,159 |
|
|
|
9,015 |
|
|
|
9,808 |
|
|
Acquisition-related expenses |
|
|
8,140 |
|
|
|
2,334 |
|
|
|
3,484 |
|
|
|
3,281 |
|
|
|
3,191 |
|
|
|
719 |
|
|
|
967 |
|
|
|
770 |
|
|
Restructuring expenses |
|
|
- |
|
|
|
- |
|
|
|
- |
|
|
|
- |
|
|
|
- |
|
|
|
- |
|
|
|
- |
|
|
|
3,635 |
|
|
Loss on reacquired franchisee rights |
|
|
- |
|
|
|
- |
|
|
|
4,092 |
|
|
|
- |
|
|
|
- |
|
|
|
- |
|
|
|
- |
|
|
|
- |
|
|
Non-GAAP adjusted EBITDA |
|
$ |
28,283 |
|
|
$ |
33,446 |
|
|
$ |
36,325 |
|
|
$ |
36,234 |
|
|
$ |
35,196 |
|
|
$ |
37,415 |
|
|
$ |
42,373 |
|
|
$ |
45,778 |
|
59
|
(2) |
The table below sets forth a reconciliation of GAAP net income to non-GAAP adjusted net income based on our historical results: |
|
|
|
For the Three Months Ended |
|
|||||||||||||||||||||||||||||
|
Non-GAAP adjusted net income |
|
Mar 31, 2016 |
|
|
Jun 30, 2016 |
|
|
Sept 30, 2016 |
|
|
Dec 31, 2016 |
|
|
Mar 31, 2017 |
|
|
Jun 30, 2017 |
|
|
Sept 30, 2017 |
|
|
Dec 31, 2017 |
|
||||||||
|
|
|
(In thousands, unaudited) |
|
|||||||||||||||||||||||||||||
|
GAAP net income |
|
$ |
3,329 |
|
|
$ |
9,043 |
|
|
$ |
7,147 |
|
|
$ |
9,041 |
|
|
$ |
12,174 |
|
|
$ |
12,803 |
|
|
$ |
15,419 |
|
|
$ |
6,264 |
|
|
Stock-based compensation expense |
|
|
6,204 |
|
|
|
8,523 |
|
|
|
9,580 |
|
|
|
9,382 |
|
|
|
8,443 |
|
|
|
9,159 |
|
|
|
9,015 |
|
|
|
9,808 |
|
|
Amortization of intangible assets (excluding internal use software) |
|
|
1,675 |
|
|
|
2,916 |
|
|
|
2,710 |
|
|
|
2,810 |
|
|
|
2,796 |
|
|
|
2,797 |
|
|
|
2,795 |
|
|
|
2,795 |
|
|
Acquisition-related expenses |
|
|
8,140 |
|
|
|
2,334 |
|
|
|
3,484 |
|
|
|
3,281 |
|
|
|
3,191 |
|
|
|
719 |
|
|
|
967 |
|
|
|
770 |
|
|
Restructuring expenses |
|
|
- |
|
|
|
- |
|
|
|
- |
|
|
|
- |
|
|
|
- |
|
|
|
- |
|
|
|
- |
|
|
|
3,635 |
|
|
Loss on reacquired franchisee rights |
|
|
- |
|
|
|
- |
|
|
|
4,092 |
|
|
|
- |
|
|
|
- |
|
|
|
- |
|
|
|
- |
|
|
|
- |
|
|
Income tax expense from non-deductible transaction expenses(1) |
|
|
1,162 |
|
|
|
- |
|
|
|
- |
|
|
|
- |
|
|
|
- |
|
|
|
- |
|
|
|
- |
|
|
|
- |
|
|
2017 Tax Act impacts |
|
|
- |
|
|
|
- |
|
|
|
- |
|
|
|
- |
|
|
|
- |
|
|
|
- |
|
|
|
- |
|
|
|
7,641 |
|
|
Release of valuation allowance |
|
|
- |
|
|
|
- |
|
|
|
- |
|
|
|
- |
|
|
|
- |
|
|
|
- |
|
|
|
- |
|
|
|
(162 |
) |
|
Tax effect of adjustments(2) |
|
|
(6,119 |
) |
|
|
(5,262 |
) |
|
|
(7,588 |
) |
|
|
(5,911 |
) |
|
|
(5,512 |
) |
|
|
(4,842 |
) |
|
|
(4,881 |
) |
|
|
(6,497 |
) |
|
Non-GAAP adjusted net income |
|
$ |
14,391 |
|
|
$ |
17,554 |
|
|
$ |
19,425 |
|
|
$ |
18,603 |
|
|
$ |
21,092 |
|
|
$ |
20,636 |
|
|
$ |
23,315 |
|
|
$ |
24,254 |
|
|
(1) |
This amount represents estimated additional income tax expense incurred in the period for non-deductible transaction expenses related to acquisition activity. |
|
(2) |
An estimated statutory tax rate of 38.2% has been applied to eliminate the tax-effect for all periods presented. |
60
|
(3) |
The table below sets forth a reconciliation of GAAP diluted earnings per share to non-GAAP adjusted earnings per share based on our historical results: |
|
|
|
For the Three Months Ended |
|
|||||||||||||||||||||||||||||
|
Non-GAAP adjusted earnings per share |
|
Mar 31, 2016 |
|
|
Jun 30, 2016 |
|
|
Sept 30, 2016 |
|
|
Dec 31, 2016 |
|
|
Mar 31, 2017 |
|
|
Jun 30, 2017 |
|
|
Sept 30, 2017 |
|
|
Dec 31, 2017 |
|
||||||||
|
|
|
(In thousands, except per share data, unaudited) |
|
|||||||||||||||||||||||||||||
|
GAAP net income |
|
$ |
0.06 |
|
|
$ |
0.14 |
|
|
$ |
0.11 |
|
|
$ |
0.14 |
|
|
$ |
0.19 |
|
|
$ |
0.20 |
|
|
$ |
0.24 |
|
|
$ |
0.10 |
|
|
Stock-based compensation expense |
|
|
0.10 |
|
|
|
0.13 |
|
|
|
0.15 |
|
|
|
0.15 |
|
|
|
0.13 |
|
|
|
0.14 |
|
|
|
0.14 |
|
|
|
0.15 |
|
|
Amortization of intangible assets (excluding internal use software) |
|
|
0.03 |
|
|
|
0.05 |
|
|
|
0.04 |
|
|
|
0.04 |
|
|
|
0.04 |
|
|
|
0.04 |
|
|
|
0.04 |
|
|
|
0.04 |
|
|
Acquisition-related expenses |
|
|
0.13 |
|
|
|
0.04 |
|
|
|
0.06 |
|
|
|
0.05 |
|
|
|
0.05 |
|
|
|
0.01 |
|
|
|
0.02 |
|
|
|
0.01 |
|
|
Restructuring expenses |
|
|
- |
|
|
|
- |
|
|
|
- |
|
|
|
- |
|
|
|
- |
|
|
|
- |
|
|
|
- |
|
|
|
0.06 |
|
|
Loss on reacquired franchisee rights |
|
|
- |
|
|
|
- |
|
|
|
0.07 |
|
|
|
- |
|
|
|
- |
|
|
|
- |
|
|
|
- |
|
|
|
- |
|
|
Income tax expense from non-deductible transaction expenses(1) |
|
|
0.02 |
|
|
|
- |
|
|
|
- |
|
|
|
- |
|
|
|
- |
|
|
|
- |
|
|
|
- |
|
|
|
- |
|
|
2017 Tax Act impacts |
|
|
- |
|
|
|
- |
|
|
|
- |
|
|
|
- |
|
|
|
- |
|
|
|
- |
|
|
|
- |
|
|
|
0.12 |
|
|
Release of valuation allowance |
|
|
- |
|
|
|
- |
|
|
|
- |
|
|
|
- |
|
|
|
- |
|
|
|
- |
|
|
|
- |
|
|
|
- |
|
|
Tax effect of adjustments(2) |
|
|
(0.10 |
) |
|
|
(0.08 |
) |
|
|
(0.12 |
) |
|
|
(0.09 |
) |
|
|
(0.08 |
) |
|
|
(0.07 |
) |
|
|
(0.08 |
) |
|
|
(0.10 |
) |
|
Non-GAAP adjusted net income |
|
$ |
0.24 |
|
|
$ |
0.28 |
|
|
$ |
0.31 |
|
|
$ |
0.29 |
|
|
$ |
0.33 |
|
|
$ |
0.32 |
|
|
$ |
0.36 |
|
|
$ |
0.38 |
|
|
|
|
|
|
|
|
|
|
|
|
|
|
|
|
|
|
|
|
|
|
|
|
|
|
|
|
|
|
|
|
|
|
|
|
Shares of common stock |
|
|
58,256 |
|
|
|
61,716 |
|
|
|
61,838 |
|
|
|
62,024 |
|
|
|
62,445 |
|
|
|
62,998 |
|
|
|
63,181 |
|
|
|
63,173 |
|
|
Dilutive stock options, RSUs and PSUs |
|
|
931 |
|
|
|
1,054 |
|
|
|
1,163 |
|
|
|
1,413 |
|
|
|
2,058 |
|
|
|
1,828 |
|
|
|
1,461 |
|
|
|
1,264 |
|
|
Non-GAAP adjusted common shares outstanding |
|
|
59,187 |
|
|
|
62,770 |
|
|
|
63,001 |
|
|
|
63,437 |
|
|
|
64,503 |
|
|
|
64,826 |
|
|
|
64,642 |
|
|
|
64,437 |
|
|
(1) |
This amount represents estimated additional income tax expense incurred in the period for non-deductible transaction expenses related to acquisition activity. |
|
(2) |
An estimated statutory tax rate of 38.2% has been applied to eliminate the tax-effect for all periods presented. |
61
Non-GAAP Adjusted EBITDA, Adjusted Net Income and Adjusted Earnings Per Share
Adjusted EBITDA represents net income before net interest expense (income), income tax expense (benefit), depreciation, amortization of intangible assets, including internal use software, amortization and impairment of direct response advertising, amortization of deferred sales commissions, non-cash stock-based compensation expense, expenses related to the closing and integration of acquisitions, severance and benefits expenses related to restructuring activities and losses incurred on acquisitions, if applicable for the period. Adjusted net income represents net income before non-cash stock-based compensation expense, amortization of intangible assets related to assets acquired, including customer relationships, trade names and trademarks, expenses related to the closing and integration of acquisitions, severance and benefits expenses related to restructuring activities, losses incurred on acquisitions, if applicable for the period, partially offset by the estimated tax impact of these items, and certain other items such as the income tax benefit from the release of valuation allowances, income tax impacts from non-deductible transaction expenses related to acquisitions, and the accounting effects of the 2017 Tax Act, if applicable for the period,. Adjusted earnings per share is defined as adjusted net income divided by the weighted average of dilutive common share equivalents outstanding.
Our management uses adjusted EBITDA, adjusted net income and adjusted earnings per share as measures of operating performance, for planning purposes (including the preparation of annual budgets), to allocate resources to enhance the financial performance of our business, to evaluate the effectiveness of our business strategies and in communications with our Board of Directors concerning our financial performance. In addition, management currently uses non-GAAP measures in determining cash incentive compensation.
We present adjusted EBITDA, adjusted net income and adjusted earnings per share as supplemental performance measures because we believe that these measures provide our Board of Directors, management and investors with additional information and greater transparency with respect to our performance and decision-making. We feel these performance measures provide investors and others with a better understanding and ability to evaluate our operating results and future prospects and provides the same performance measurement information as utilized by management. Adjusted EBITDA reflects the elements of profitability that can be most directly impacted by employees and our management believes that tracking this metric motivates executives to focus on profitable growth. Management believes it is useful to exclude non-cash stock-based compensation expense from our non-GAAP metrics because this expense is based upon the historical value of each award at the time of grant, which may not be reflective of the current compensation value, and the ongoing expense is outside of the control of management in the current reporting period. Adjusted EBITDA also excludes non-cash items such as depreciation and various types of amortization, as well as income taxes. We exclude expenses related to the closing and integration of acquisitions, as well as the severance and benefits expenses associated with restructuring activities, for comparability purposes. Management believes it is useful to exclude these items as they do not necessarily reflect how our business is performing during the period reported.
Adjusted net income and adjusted earnings per share exclude non-cash stock-based compensation expense, expenses related to the closing and integration of acquisitions, the severance and benefits expenses associated with restructuring activities, as well as losses incurred on acquisitions, for comparability purposes, and amortization of intangible assets related to acquired assets including customer relationships, trade names and trademarks for comparability purposes. In addition, certain other items such as the income tax benefit from the release of valuation allowances, income tax impacts from non-deductible transaction expenses related to acquisitions, and the accounting effects of the 2017 Tax Act are also excluded for comparability purposes.
Adjusted EBITDA, adjusted net income and adjusted earnings per share are not measurements of our financial performance under GAAP and should not be considered as an alternative to net income, operating income, earnings per share or any other performance measures derived in accordance with GAAP, or as an alternative to cash flows from operating activities as a measure of our profitability or liquidity.
We understand that, although adjusted EBITDA, adjusted net income and adjusted earnings per share are frequently used by securities analysts, lenders and others in their evaluation of companies, adjusted EBITDA, adjusted net income and adjusted earnings per share have limitations as an analytical tool, and you should not consider them in isolation, or as a substitute for an analysis of our results as reported under GAAP. In particular, you should consider:
62
|
|
• |
Adjusted EBITDA, adjusted net income and adjusted earnings per share do not reflect our cash expenditures, or future requirements for capital expenditures or contractual commitments; |
|
|
• |
Adjusted EBITDA, adjusted net income and adjusted earnings per share do not reflect changes in, or cash requirements for, our working capital needs; |
|
|
• |
Adjusted EBITDA, adjusted net income and adjusted earnings per share do not reflect the non-cash component of employee compensation; |
|
|
• |
Although depreciation and amortization are non-cash charges, the assets being depreciated and amortized generally required prior cash outlays and generally will have to be replaced in the future by payment of cash, and adjusted EBITDA does not reflect any cash requirements for such replacements; and |
|
|
• |
Other companies in our industry may calculate adjusted EBITDA, adjusted net income and adjusted earnings per share differently than we do, limiting their usefulness as a comparative measure. |
Given the limitations associated with using adjusted EBITDA, adjusted net income and adjusted earnings per share, these financial measures should be considered in conjunction with our financial statements presented in accordance with GAAP and the reconciliation of adjusted EBITDA and adjusted net income to the most directly comparable GAAP measure, net income, and adjusted earnings per share to the most directly comparable GAAP measure, diluted earnings per share. Further, management also reviews GAAP measures and evaluates individual measures that are not included in adjusted EBITDA, such as our level of capital expenditures and equity issuance, among other measures.
The table below sets forth a reconciliation of GAAP net income to non-GAAP adjusted EBITDA based on our historical results:
|
|
|
Year Ended December 31, |
|
|||||||||
|
Non-GAAP adjusted EBITDA |
|
2015 |
|
|
2016 |
|
|
2017 |
|
|||
|
|
|
(In thousands, unaudited) |
|
|||||||||
|
GAAP net income |
|
$ |
31,617 |
|
|
$ |
28,560 |
|
|
$ |
46,660 |
|
|
Interest income, net |
|
|
(356 |
) |
|
|
(176 |
) |
|
|
(1,167 |
) |
|
Income tax expense |
|
|
17,864 |
|
|
|
20,712 |
|
|
|
39,951 |
|
|
Depreciation and amortization |
|
|
6,092 |
|
|
|
8,946 |
|
|
|
8,505 |
|
|
Amortization of intangible assets (excluding internal use software) |
|
|
- |
|
|
|
10,111 |
|
|
|
11,183 |
|
|
Amortization of internal use software |
|
|
4,566 |
|
|
|
4,853 |
|
|
|
5,279 |
|
|
Amortization and impairment of direct response advertising |
|
|
5,359 |
|
|
|
4,702 |
|
|
|
3,592 |
|
|
Amortization of deferred sales commissions |
|
|
1,717 |
|
|
|
1,560 |
|
|
|
1,052 |
|
|
Non-GAAP EBITDA |
|
|
66,859 |
|
|
|
79,268 |
|
|
|
115,055 |
|
|
Stock-based compensation |
|
|
26,028 |
|
|
|
33,689 |
|
|
|
36,425 |
|
|
Acquisition-related expenses |
|
|
2,700 |
|
|
|
17,239 |
|
|
|
5,647 |
|
|
Restructuring expenses |
|
|
- |
|
|
|
- |
|
|
|
3,635 |
|
|
Loss on reacquired franchisee rights |
|
|
- |
|
|
|
4,092 |
|
|
|
- |
|
|
Non-GAAP adjusted EBITDA |
|
$ |
95,587 |
|
|
$ |
134,288 |
|
|
$ |
160,762 |
|
We expect direct response advertising costs currently capitalized and amortized for certain printed materials associated with new customer solicitations to be expensed as incurred after adoption of Accounting Standards Update No. (ASU) 2014-09, Revenue from Contracts with Customers, on January 1, 2018, and therefore amortization and impairment of direct response advertising will no longer appear as a reconciling item for non-GAAP adjusted EBITDA. Adoption may also impact both the amount of commissions capitalized, as well as the length of time over which commissions are amortized.
63
The table below sets forth a reconciliation of GAAP net income to non-GAAP adjusted net income based on our historical results:
|
|
|
Year Ended December 31, |
|
|||||||||
|
Non-GAAP adjusted net income |
|
2015 |
|
|
2016 |
|
|
2017 |
|
|||
|
|
|
(In thousands, unaudited) |
|
|||||||||
|
GAAP net income |
|
$ |
31,617 |
|
|
$ |
28,560 |
|
|
$ |
46,660 |
|
|
Stock-based compensation expense |
|
|
26,028 |
|
|
|
33,689 |
|
|
|
36,425 |
|
|
Amortization of intangible assets (excluding internal use software) |
|
|
- |
|
|
|
10,111 |
|
|
|
11,183 |
|
|
Acquisition-related expenses |
|
|
2,700 |
|
|
|
17,239 |
|
|
|
5,647 |
|
|
Restructuring expenses |
|
|
- |
|
|
|
- |
|
|
|
3,635 |
|
|
Loss on reacquired franchisee rights |
|
|
- |
|
|
|
4,092 |
|
|
|
- |
|
|
Income tax expense from non-deductible transaction expenses(1) |
|
|
- |
|
|
|
1,162 |
|
|
|
- |
|
|
2017 Tax Act impacts |
|
|
- |
|
|
|
- |
|
|
|
7,641 |
|
|
Release of valuation allowance |
|
|
(11 |
) |
|
|
- |
|
|
|
(162 |
) |
|
Tax effect of adjustments(2) |
|
|
(10,974 |
) |
|
|
(24,880 |
) |
|
|
(21,732 |
) |
|
Non-GAAP adjusted net income |
|
|
49,360 |
|
|
|
69,973 |
|
|
|
89,297 |
|
|
(1) |
This amount represents estimated additional income tax expense incurred in the period for non-deductible transaction expenses related to acquisition activity. |
|
(2) |
An estimated statutory tax rate of 38.2% has been applied to eliminate the tax-effect for all periods presented. |
The table below sets forth a reconciliation of GAAP diluted earnings per share to non-GAAP adjusted earnings per share based on our historical results:
|
|
|
Year Ended December 31, |
|
|||||||||
|
Non-GAAP adjusted earnings per share |
|
2015 |
|
|
2016 |
|
|
2017 |
|
|||
|
|
|
(In thousands, except per share data, unaudited) |
|
|||||||||
|
GAAP diluted earnings per share |
|
$ |
0.60 |
|
|
$ |
0.46 |
|
|
$ |
0.72 |
|
|
Stock-based compensation expense |
|
|
0.49 |
|
|
|
0.54 |
|
|
|
0.56 |
|
|
Amortization of intangible assets (excluding internal use software) |
|
|
- |
|
|
|
0.16 |
|
|
|
0.17 |
|
|
Acquisition-related expenses |
|
|
0.05 |
|
|
|
0.28 |
|
|
|
0.09 |
|
|
Restructuring expenses |
|
|
- |
|
|
|
- |
|
|
|
0.06 |
|
|
Loss on reacquired franchisee rights |
|
|
- |
|
|
|
0.07 |
|
|
|
- |
|
|
Income tax expense from non-deductible transaction expenses(1) |
|
|
- |
|
|
|
0.02 |
|
|
|
- |
|
|
2017 Tax Act impacts |
|
|
- |
|
|
|
- |
|
|
|
0.12 |
|
|
Release of valuation allowance |
|
|
- |
|
|
|
- |
|
|
|
- |
|
|
Tax effect of adjustments(2) |
|
|
(0.21 |
) |
|
|
(0.40 |
) |
|
|
(0.34 |
) |
|
Non-GAAP adjusted earnings per share |
|
$ |
0.93 |
|
|
$ |
1.13 |
|
|
$ |
1.38 |
|
|
|
|
|
|
|
|
|
|
|
|
|
|
|
|
Shares of common stock outstanding |
|
|
51,732 |
|
|
|
60,962 |
|
|
|
62,952 |
|
|
Dilutive stock options, RSUs and PSUs |
|
|
1,307 |
|
|
|
1,141 |
|
|
|
1,653 |
|
|
Non-GAAP adjusted common shares outstanding |
|
|
53,039 |
|
|
|
62,103 |
|
|
|
64,605 |
|
|
(1) |
This amount represents estimated additional income tax expense incurred in the period for non-deductible transaction expenses related to acquisition activity. |
|
(2) |
An estimated statutory tax rate of 38.2% has been applied to eliminate the tax-effect for all periods presented. |
64
For the non-GAAP metrics above, the variances in the comparable periods are consistent with the GAAP variances discussed in the comparison of the years ended December 31, 2015, 2016 and 2017 as presented above in our “Management’s Discussion and Analysis of Financial Condition and Results of Operations”.
Liquidity and Capital Resources
Sources of Liquidity
As of December 31, 2017, we had total cash and cash equivalents of $224.5 million, compared to $134.2 million of cash and cash equivalents as of December 31, 2016. Since February 1, 2016, we have used approximately $274.6 million of cash related to acquisitions, net of cash received and including holdbacks reserved with respect to indemnification claims. Over the next twelve months, and in the longer term, we expect that our cash and liquidity needs will be met by existing resources, consisting of cash and cash equivalents, and cash generated from ongoing operations. We plan to use existing cash and cash generated in the ongoing operations of our business to fund our current operations, capital expenditures, dividend payments, a stock repurchase program, and possible future strategic investments or acquisitions.
Consolidated Cash Flow Data
The following table presents information regarding our cash flows, cash and cash equivalents for the years ended December 31, 2015, 2016 and 2017:
|
|
|
Year Ended December 31, |
|
|||||||||
|
|
|
2015 |
|
|
2016 |
|
|
2017 |
|
|||
|
|
|
(In thousands) |
|
|||||||||
|
Net cash provided by operating activities |
|
$ |
96,313 |
|
|
$ |
93,205 |
|
|
$ |
121,864 |
|
|
Net cash provided by (used in) investing activities |
|
|
129,174 |
|
|
|
(248,587 |
) |
|
|
(16,985 |
) |
|
Net cash used in financing activities |
|
|
(46,835 |
) |
|
|
(15,588 |
) |
|
|
(14,582 |
) |
|
Net increase (decrease) in cash and cash equivalents |
|
$ |
178,652 |
|
|
$ |
(170,970 |
) |
|
$ |
90,297 |
|
|
Cash and cash equivalents, end of year |
|
$ |
305,216 |
|
|
$ |
134,246 |
|
|
$ |
224,543 |
|
Comparison of the Years Ended December 31, 2016 and 2017
Cash and cash equivalents increased primarily due to cash generated from our operations and proceeds from issuance of common stock related to employee stock option exercises. This increase was partially offset by cash dividend payments, stock repurchases, purchases of property and equipment, and payments for taxes related to net share settlement of stock-based awards.
65
Net cash provided by operating activities for the year ended December 31, 2017 was $121.9 million compared to net cash provided by operating activities of $93.2 million for the year ended December 31, 2016. Net cash provided by operating activities was the result of net income of $46.7 million for the year ended December 31, 2017, compared to net income of $28.6 million for the year ended December 31, 2016, plus adjustments for non-cash expenses. These non-cash adjustments include $36.4 million in non-cash stock-based compensation expense, $16.5 million in amortization of intangible assets including internal use software, $8.5 million of depreciation expense, $3.6 million in amortization and impairment of direct response advertising expense, $1.1 million in amortization of deferred commissions, $0.4 million loss on fixed asset disposals and $0.7 million for the provision for doubtful accounts. In addition, there was a decrease of $36.7 million in deferred tax assets. In addition, net cash provided by operating activities decreased due to a $13.5 million increase in accounts receivable due to growth in professional management revenue, a $8.0 million decrease in accounts payable, $2.4 million of capitalized direct-response advertising for the year ended December 31, 2017, a $2.3 million increase in other assets, a $1.9 million increase in prepaid expenses, a $0.8 million decrease in deferred rent, and a $0.6 million decrease in deferred revenue. These decreases were partially offset by an increase of $0.8 million in accrued compensation due primarily to increased headcount for the year ended December 31, 2017 compared to the year ended December 31, 2016.
We incurred cash payments totaling approximately $3.9 million in the first quarter of 2017 associated with a change to our paid time off program for exempt employees as of January 1, 2017. We currently anticipate paying an estimated $17.3 million in annual cash incentive compensation in this first quarter of 2018.
Investing Activities
Net cash used in investing activities was $17.0 million for the year ended December 31, 2017 compared to net cash used in investing activities of $248.6 million for the year ended December 31, 2016. We used $8.7 million for the purchase of property and equipment compared to $7.0 million, which included capital expenditures associated with capital improvements to our advisor centers for the year ended December 31, 2017. For the year ended December 31, 2017, we capitalized $8.3 million of internal use software costs compared to $6.9 million for the year ended December 31, 2016, as increased labor rates and more developer hours were dedicated to internal use software projects for the year ended December 31, 2017. We expect to have ongoing capital expenditure requirements to support technical operations and other infrastructure needs, and expect to fund this investment with our existing cash and cash equivalents.
On February 1, 2016, we completed the acquisition of The Mutual Fund Store for approximately $241.0 million in cash consideration, net of $5.0 million cash acquired, and approximately $267 million in common stock consideration. For the year ended December 31, 2016, we completed the acquisition of twenty-one franchises for cash consideration of approximately $33.6 million, net of $1.7 million of holdbacks reserved with respect to indemnification claims.
Financing Activities
Net cash used in financing activities was $14.6 million for the year ended December 31, 2017 compared to net cash used in financing activities of $15.6 million for the year ended December 31, 2016. For the year ended December 31, 2017, we received $22.4 million of net proceeds from the issuance of common stock upon the exercise of stock options compared to $6.6 million for the year ended December 31, 2016. During the years ended December 31, 2016 and 2017, we paid $2.2 million and $2.8 million, respectively, for previously-withheld consideration for franchises acquired by The Mutual Fund Store prior to February 1, 2016, as well as for previously-withheld consideration related to the acquisition of The Mutual Fund Store and acquisition of franchises in 2016. We also incurred cash payments of $5.6 million associated with net share settlements for non-cash stock-based awards minimum tax withholdings for the year ended December 31, 2017 compared to $3.3 million for the year ended December 31, 2016 related to annual vesting of restricted stock units.
66
On October 24, 2017, our Board of Directors approved a stock repurchase program of up to $60.0 million of our common stock over the subsequent twelve months. We used $10.8 million of cash to repurchase our common stock during the year ended December 31, 2017 and have $49.2 million remaining available for repurchase under the existing repurchase authorization limit. The stock repurchase program may be modified, extended or terminated by our Board of Directors at any time and there is no guarantee as to the exact number of shares, if any, that will be repurchased under the program. The stock repurchase program is expected to be funded by available working capital.
For the year ended December 31, 2017, we incurred $17.6 million of cash dividend payments compared to $16.6 for the year ended December 31, 2016. Based on the shares outstanding as of December 31, 2017 of 63,048,801 and assuming a $0.08 per share quarterly dividend for 2017, we would estimate dividend payments to total approximately $19.5 million for the year ended December 31, 2018, including the $4.4 million payment made in January 2018. We currently expect to pay comparable cash dividends on a quarterly basis in the future, however, any future determination with respect to the declaration and payment of dividends will be at the discretion of our Board of Directors.
For the year ended December 31, 2018, we expect to incur cash payments in an amount necessary to satisfy the minimum tax withholding obligations for restricted stock units previously granted to employees that vest in the year ended December 31, 2018, which will be determined based on the fair value of our common stock and applicable tax rates on the vesting dates. Based on the fair value of our common stock on December 31, 2017 of $30.30 and assuming a 40% tax rate, the estimated minimum tax withholding obligations would be approximately $8.4 million, during the year ended December 31, 2018. We anticipate this type of cash payment to occur throughout each year with the largest portions typically occurring in the first and fourth quarters, and with the payment amounts determined by the number of shares released, the fair value of our common stock and applicable tax rates at that point in time.
Comparison of the Years Ended December 31, 2015 and 2016
Operating Activities
As a result of retrospectively presenting ASU 2016-09, the excess tax benefit associated with non-cash stock-based compensation year ended December 31, 2016 is now presented within operating activities.
Net cash provided by operating activities for the year ended December 31, 2016 was $93.2 million compared to net cash provided by operating activities of $96.3 million for the year ended December 31, 2015. Net cash provided by operating activities was the result of net income of $28.6 million for the year ended December 31, 2016, compared to net income of $31.6 million for the year ended December 31, 2015, plus adjustments for non-cash expenses. These non-cash adjustments include $33.7 million in non-cash stock-based compensation expense, $15.0 million in amortization of intangible assets including internal use software, $8.9 million of depreciation expense, $4.7 million in amortization and impairment of direct response advertising expense, $1.6 million in amortization of deferred commissions and $0.7 million for the provision for doubtful accounts, partially offset an increase of $1.1 million in deferred tax assets. In addition, net cash provided by operating activities increased due to a $18.8 million increase in accounts payable due primarily to an increase in excess tax benefits associated with stock-based compensation, a $4.4 million increase in accrued compensation due primarily to increased headcount for the year ended December 31, 2016 compared to the year ended December 31, 2015, and a $1.1 million increase in deferred rent. These increases were offset by a $15.3 million increase in accounts receivable due to growth in professional management revenue mainly through acquisitions, $3.4 million of capitalized direct-response advertising for the year ended December 31, 2016, a $1.8 million decrease in deferred revenue, a $1.5 million increase in other assets, and a $1.4 million increase in prepaid expenses.
67
Net cash used in investing activities was $248.6 million for the year ended December 31, 2016 compared to net cash provided by investing activities of $129.2 million for the year ended December 31, 2015. For the year ended December 31, 2016, cash paid for acquisitions, net of cash received, was $274.6 million related to The Mutual Fund Store transaction, as well as franchise acquisitions. We had cash provided by the sale of short-term investments of $39.9 million for the year ended December 31, 2016 compared to cash used for the purchase of short-term investments of $159.6 million, offset by maturities of $180.0 million and sales of $119.9 million for the year ended December 31, 2015. We used $7.0 million for the purchase of property and equipment compared to $6.1 million, which included capital expenditures associated with our new Overland Park, Kansas office for the year ended December 31, 2016. For the year ended December 31, 2016, we capitalized $6.9 million of internal use software costs compared to $5.0 million for the year ended December 31, 2015, as increased labor rates and more developer hours were dedicated to internal use software projects for the year ended December 31, 2016. We expect to have ongoing capital expenditure requirements to support technical operations and other infrastructure needs, and expect to fund this investment with our existing cash and cash equivalents.
On February 1, 2016, we completed the acquisition of The Mutual Fund Store for approximately $241 million in cash consideration, net of $5.0 million of cash acquired, and approximately $267 million in common stock consideration, subject to certain closing and post-closing adjustments.
In April 2016, we completed the acquisition of seven franchises for approximately $13.6 million in cash consideration, net of $0.8 million in holdbacks. In July and August 2016, we completed the acquisition of six franchises for approximately $7.8 million in cash consideration, net of $0.3 million in holdbacks. In October 2016, we completed the acquisition of eight franchises for approximately $12.2 million in cash consideration, net of $0.6 million in holdbacks.
Financing Activities
As a result of retrospectively adopting ASU 2016-09 to present the excess tax benefit associated with non-cash stock-based compensation as operating activities, net cash used by financing activities for the year ended December 31, 2016 was adjusted by $18.4 million, from $2.8 million net cash provided by to $15.6 million net cash used in financing activities.
Net cash used in financing activities was $15.6 million for the year ended December 31, 2016 compared to net cash used in financing activities of $46.8 million for the year ended December 31, 2015. For the year ended December 31, 2016, we received $6.6 million of net proceeds from the issuance of common stock upon the exercise of stock options compared to $9.2 million for the year ended December 31, 2015. During the year ended December 31, 2016, we paid $2.2 million for primarily previously withheld consideration for franchises acquired by The Mutual Fund Store prior to February 1, 2016. We also incurred cash payments of $3.3 million associated with net share settlements for non-cash stock-based awards minimum tax withholdings for the year ended December 31, 2016 compared to $3.5 million for the year ended December 31, 2015 related to annual vesting of restricted stock units.
On November 5, 2014, our Board of Directors approved a stock repurchase program of up to $50.0 million of our common stock over the subsequent twelve months. We used $38.5 million of cash to repurchase our common stock for the year ended December 31, 2015. The stock repurchase program expired on November 4, 2015 and was funded by available working capital.
For the year ended December 31, 2016, we incurred $16.6 million of cash dividend payments compared to $14.0 for the year ended December 31, 2015.
68
The following table describes our contractual obligations as of December 31, 2017:
|
|
|
Payments Due by Period |
|
|||||||||||||||||
|
|
|
Total |
|
|
Less than 1 Year |
|
|
Years 1-3 |
|
|
Years 3-5 |
|
|
More than 5 Years |
|
|||||
|
|
|
(In thousands) |
|
|||||||||||||||||
|
Operating leases (including capital tenant improvements) and capital leases (1) |
|
$ |
48,763 |
|
|
$ |
10,116 |
|
|
$ |
18,001 |
|
|
$ |
10,197 |
|
|
$ |
10,449 |
|
|
Purchase obligations(2) |
|
$ |
11,569 |
|
|
$ |
3,849 |
|
|
$ |
4,637 |
|
|
$ |
3,083 |
|
|
$ |
- |
|
|
(1) |
As of December 31, 2017, we lease facilities under non-cancelable operating leases expiring at various dates through 2027. |
|
(2) |
Purchase obligations represent non-cancelable, long-term contracts primarily related to software and data services, and includes a 5-year contract with a vendor for software services with a total commitment of $7.7 million. |
Off-Balance Sheet Arrangements
As of December 31, 2017, we did not have any off-balance sheet arrangements, as defined in Item 303(a)(4)(ii) of Regulation S-K promulgated by the SEC, that have or are reasonably likely to have a current or future effect on our financial condition, changes in our financial condition, revenues, or expenses, results of operations, liquidity, capital expenditures, or capital resources that is material to investors.
Recent Accounting Pronouncements
On May 28, 2014, the FASB issued Accounting Standards Update No. (ASU) 2014-09, Revenue from Contracts with Customers, which requires an entity to recognize the amount of revenue to which it expects to be entitled for the transfer of promised goods or services to customers. Subsequently, the FASB also issued a series of amendments to the new revenue standard. These ASUs, which are required to be adopted together, will replace most existing revenue recognition guidance in GAAP. We adopted these ASUs on January 1, 2018 using the retrospective effect transition method. We are in the process of completing the evaluation of the impact that the adoption of these standards will have on the identification of and accounting for performance obligations related to our historical contracts, and on the recognition of costs related to obtaining customer contracts. Based on our current assessment, which is subject to completion (including our evaluation of internal controls over the adoption), we anticipate the adoption of these ASUs will primarily impact certain costs we incur to obtain sales contracts from our customers. For example, prior to adoption, there are direct response advertising costs capitalized and amortized for certain printed materials associated with new customer solicitations. Under the new guidance, these costs will be expensed as incurred. In addition, these ASUs will potentially impact both the amount of commissions capitalized, as well as the length of time over which commissions are amortized by increasing the amortization period beyond the initial contract term to a beneficial period of 6 years. The new guidance will also require additional disclosures.
Currently, we are in the process of finalizing the quantitative impacts associated with the adjustments for the years ended December 31, 2016 and 2017. However, we do not anticipate the adoption of these ASUs to have a material impact on the opening balance sheet as of January 1, 2016 or to have a material impact on the financial results for the years ended December 31, 2016 and 2017. Under the retrospective effect transition method, we expect the cumulative effect adjustment as of January 1, 2016 and the adjustments to net income (primarily related to contract costs) for each of the years ended December 31, 2016 and 2017 to be under $2 million. We continue to evaluate the impact the update will have on our consolidated financial statements and related disclosures and expect to be in a position to timely report our results under the new standard in our 10-Q for the three months ended March 31, 2018.
69
On February 25, 2016, the FASB issued ASU No. ASU 2016-02, Leases, which requires that lessees recognize assets and liabilities for leases with lease terms greater than twelve months in the balance sheet. The ASU also requires additional disclosures to help users of financial statements better understand the amount, timing and uncertainty of cash flows arising from leases. The ASU is effective for fiscal years beginning after December 15, 2018, including interim periods within those fiscal years, with early adoption permitted. Adoption of the standard will require a modified retrospective approach. We plan to adopt this ASU on January 1, 2019 and we are in the process of implementing lease software which will aid in the transition to the new standard. We are evaluating the effect that ASU 2016-02 will have on our consolidated financial statements and related disclosures.
On August 26, 2016, the FASB issued ASU No. 2016-15, Statement of Cash Flows (Topic 230): Classification of Certain Cash Receipts and Cash Payments. This ASU clarifies and provides guidance on eight specific cash flow classification issues that are not currently addressed by current GAAP thereby reducing current diversity in practice. Although early adoption is permitted, we have adopted the ASU on January 1, 2018 and do not expect it to have a material impact on our consolidated financial statements.
On January 26, 2017, the FASB issued ASU No. 2017-04, “Simplifying the Test for Goodwill Impairment.” This standard simplifies the measurement of goodwill impairment by removing the second step of the goodwill impairment test, which requires the determination of the fair value of individual assets and liabilities of a reporting unit. Under this guidance, goodwill impairment is to be measured as the amount by which a reporting unit’s carrying value exceeds its fair value with the loss recognized not to exceed the total amount of goodwill allocated to the reporting unit. The standard will be applied prospectively and is effective for impairment tests performed after December 15, 2019, with early adoption permitted. The standard is not expected to have a material effect on our consolidated financial statements once implemented.
Market Risk. Our exposure to market risk is directly related to our role as an investment manager for investor accounts for which we provide discretionary portfolio management services. For the year ended December 31, 2017, 94% of our revenue was derived from fees based on the market value of AUM compared to 91% for the year ended December 31, 2016. In general, we expect the percentage of revenue that is derived from fees based on the market value of AUM to increase over time.
A substantial portion of the assets we manage is invested in equity securities, the market prices of which can vary substantially based on changes in economic conditions. An additional portion is invested in fixed income securities, which will generally have lower volatility than the equity market. Therefore, while any changes in equity market performance would significantly affect the value of our AUM, particularly for the AUM invested in equity securities, such changes would typically result in lower volatility for our AUM than the volatility of the equity market as a whole. Because a substantial portion of our revenue is derived from the value of our AUM, any changes in fixed income or equity market performance would significantly affect the amount of revenue in a given period. If any of these factors reduces our AUM, the amount of client fees we would earn for managing those assets would decline, which in turn could negatively impact our revenue.
For DC professional management revenue, fees are calculated at or near the end of each month. We expect this monthly methodology potentially reduces the impact of financial market volatility on this portion of our professional management revenue. For IRA and taxable professional management revenue, fees are calculated at the end of each quarter. We expect this quarterly methodology potentially results in greater impact of financial market volatility on this portion of our professional management revenue.
The response to this Item is submitted as a separate section of this Form 10-K. See Item 15.
70
None.
Evaluation of Disclosure Controls and Procedures
We maintain “disclosure controls and procedures” as such term is defined in Rule 13a-15(e) under the Securities Exchange Act of 1934, as amended (or the Exchange Act), that are designed to ensure that information required to be disclosed by us in reports that we file or submit under the Exchange Act is recorded, processed, summarized and reported within the time periods specified in Securities and Exchange Commission rules and forms, and is accumulated and communicated to our management, including our principal executive officer and principal financial officer, as appropriate to allow timely decisions regarding required disclosure. In designing and evaluating our disclosure controls and procedures, management recognized that disclosure controls and procedures, no matter how well conceived and operated, can provide only reasonable, not absolute, assurance that the objectives of the disclosure controls and procedures are met. Our disclosure controls and procedures have been designed to meet reasonable assurance standards. Additionally, in designing disclosure controls and procedures, our management necessarily was required to apply its judgment in evaluating the cost-benefit relationship of possible disclosure controls and procedures. The design of any disclosure controls and procedures also is based in part upon certain assumptions about the likelihood of future events, and there can be no assurance that any design will succeed in achieving its stated goals under all potential future conditions.
Based on our management’s evaluation, with the participation of our Chief Executive Officer (our principal executive officer) and our Chief Financial Officer (our principal financial officer), as of the end of the period covered by this Annual Report on Form 10-K, our principal executive officer and principal financial officer have concluded that our disclosure controls and procedures are effective at the reasonable assurance level.
Management’s Report on Internal Control Over Financial Reporting
Our management is responsible for establishing and maintaining adequate internal control over financial reporting as defined in Rules 13a-15(f) and 15d-15(f) under the Exchange Act. In accordance with those rules, and consistent with the inherent limitations of internal control over financial reporting, our internal control over financial reporting is a process designed to provide reasonable, not absolute, assurance regarding the reliability of financial reporting and the preparation of financial statements for external purposes in accordance with accounting principles generally accepted in the United States. Under the supervision and with the participation of our management, including our Chief Executive Officer and Chief Financial Officer, we conducted an evaluation of the effectiveness of our internal control over financial reporting as of December 31, 2017 using the criteria established in the updated Internal Control — Integrated Framework (2013) issued by the Committee of Sponsoring Organizations of the Treadway Commission (COSO). Based on our evaluation under the COSO framework, management has concluded that our internal control over financial reporting was effective as of December 31, 2017.
KPMG LLP, an independent registered public accounting firm, has issued a report concerning the effectiveness of our internal control over financial reporting as of December 31, 2017. See “Report of Independent Registered Public Accounting Firm” in Item 15 of this Form 10-K.
Changes in Internal Control over Financial Reporting
There was no change in our internal control over financial reporting (as such term is defined in Rules 13a-15(f) and 15d-15(f) under the Exchange Act) during the three months ended December 31, 2017 that has materially affected, or is reasonably likely to materially affect, our internal control over financial reporting.
Not applicable.
71
The information required by Item 10 with respect to our directors and executive officers is incorporated by reference from the information set forth under the captions “Election of Directors — Directors and Nominees” and “Election of Directors — Executive Officers and Directors” in our Definitive Proxy Statement in connection with our 2018 Annual Meeting of Stockholders to be held on May 22, 2018 (or the Proxy Statement), which will be filed with the SEC no later than 120 days after December 31, 2017.
Item 405 of Regulation S-K calls for disclosure of any known late filing or failure by an insider to file a report required by Section 16(a) of the Exchange Act. This information is incorporated by reference from the section called “Section 16(a) Beneficial Ownership Reporting Compliance” in the Proxy Statement.
We have adopted a Code of Ethics for Senior Financial Officers that applies to all of our directors, officers (including our chief executive officer (our principal executive officer), chief financial officer (our principal financial officer), chief accounting officer (our principal accounting officer), controller and any person performing similar functions) and employees. The Code of Ethics for Senior Financial Officers is available on our web site, free of charge, at www.financialengines.com. We will disclose on our web site amendments to, or waivers from, our Code of Ethics for Senior Financial Officers applicable to our directors and executive officers, including our chief executive officer (our principal executive officer), our chief financial officer (our principal financial officer) and our chief accounting officer (our principal accounting officer), in accordance with applicable laws and regulations.
We have a separately designated standing Audit Committee established in accordance with Section 3(a) (58) (A) of the Securities Exchange Act of 1934. The members of the Audit Committee are Heidi Kunz (Chairperson), Joseph A. Grundfest and Robert A. Huret. All of such members meet the independence standards established by The NASDAQ Stock Market for serving on an audit committee. SEC regulations require us to disclose whether a director qualifying as an “audit committee financial expert” serves on our Audit Committee. Our Board of Directors has determined that each of Heidi Kunz, Joseph A. Grundfest and Robert A. Huret qualifies as an “audit committee financial expert” within the meaning of such regulations.
The information required by Item 11 is incorporated by reference from the information set forth under the captions “Compensation Discussion and Analysis”, “Compensation Committee Report”, “Executive Compensation”, “Corporate Governance — Compensation Committee Interlocks and Insider Participation” and “Compensation of Directors” in the Proxy Statement.
|
Item 12. |
Security Ownership of Certain Beneficial Owners and Management and Related Stockholder Matters |
The information required by Item 12 with respect to security ownership of certain beneficial owners and management is incorporated by reference from the information set forth under the caption “Security Ownership of Certain Beneficial Owners and Management” in the Proxy Statement.
72
The following chart sets forth certain information as of December 31, 2017, with respect to our equity compensation plans, specifically our 1998 Stock Plan and our 2009 Stock Incentive Plan. Each of the 1998 Stock Plan and the 2009 Stock Incentive Plan has been approved by our stockholders.
Equity Compensation Plan Information
|
Plan Category |
|
Number of Securities to be Issued Upon Exercise of Outstanding Options and Rights |
|
|
Weighted Average Exercise Price of Outstanding Options |
|
|
Number of Securities Remaining Available for Future Issuance Under Equity Compensation Plans (Excluding Securities Reflected in Column (a)) |
|
|
|||
|
|
|
(a) |
|
|
(b) |
|
|
(c) |
|
|
|||
|
Equity compensation plans approved by security holders |
|
|
7,107,580 |
|
(1) |
$ |
32.37 |
|
(2) |
|
5,476,488 |
|
(3) |
|
Equity compensation plans not approved by security holders |
|
|
— |
|
|
$ |
— |
|
|
|
— |
|
|
|
Total |
|
|
7,107,580 |
|
|
$ |
32.37 |
|
|
|
5,476,488 |
|
|
|
(1) |
Consists of 4,635,510 options outstanding granted under the 1998 Stock Plan and 2009 Stock Incentive Plan, 2,390,910 RSUs and 81,160 PSUs granted under the 2009 Stock Incentive Plan. |
|
(2) |
Weighted average exercise price for outstanding options only. |
|
(3) |
The 5,476,488 shares reserved for issuance under the 2009 Stock Incentive Plan represents shares available for grant as of December 31, 2017. The 2009 Stock Incentive Plan provides for the grant of options to purchase shares of common stock as well as the grant of restricted stock, stock appreciation rights and stock units. The number of shares reserved for issuance under the 2009 Stock Incentive Plan is increased from time to time in an amount equal to the number of shares subject to outstanding options under the 1998 Stock Plan that are subsequently forfeited or terminate for any other reason before being exercised and unvested shares that are forfeited pursuant to the 1998 Stock Plan. |
The information required by Item 13 is incorporated by reference from the information set forth under the captions “Certain Relationships and Related Person Transactions” and “Corporate Governance — Organization of our Board of Directors” in the Proxy Statement.
The information required by Item 14 is incorporated by reference from the information set forth under the caption “Ratification of the Appointment of Independent Registered Public Accountants — Principal Accounting Fees and Services” in the Proxy Statement.
73
|
(a) |
1. Financial Statements |
The financial statements filed as part of this report are identified in the Index to Consolidated Financial Statements on page F-1.
2. Financial Statement Schedules
See Item 15(c) below.
3. Exhibits
See Item 15(b) below.
|
(b) |
Exhibits |
The following exhibits are filed herewith or are incorporated by reference to exhibits previously filed with the Securities and Exchange Commission. Financial Engines, Inc. (the Registrant) shall furnish copies of exhibits for a reasonable fee (covering the expense of furnishing copies) upon request.
74
75
76
|
Exhibit Number |
|
Description |
|
|
|
|
|
|
||
|
|
|
|
|
101.INS |
|
XBRL Instance Document |
|
|
|
|
|
101.SCH |
|
XBRL Schema Document |
|
|
|
|
|
101.CAL |
|
XBRL Calculation Linkbase Document |
|
|
|
|
|
101.DEF |
|
XBRL Definition Linkbase Document |
|
|
|
|
|
101.LAB |
|
XBRL Label Linkbase Document |
|
|
|
|
|
101.PRE |
|
XBRL Presentation Linkbase Document |
|
(#) |
Indicates management contract or compensatory plan or arrangement. |
|
(*) |
Financial Engines hereby undertakes to furnish supplementally a copy of any omitted schedule or exhibit to such agreement to the U.S. Securities and Exchange Commission upon request. |
|
(1) |
The material contained in Exhibit 32.1 and Exhibit 32.2 is not deemed “filed” with the SEC and is not to be incorporated by reference into any filing of the Registrant under the Securities Act of 1933 or the Securities Exchange Act of 1934, whether made before or after the date hereof and irrespective of any general incorporation language contained in such filing, except to the extent that the Registrant specifically incorporates it by reference. |
|
(c) |
Financial Statement Schedules. |
Schedules not listed above have been omitted because they are not applicable or required, or the information required to be set forth therein is included in the consolidated financial statements or notes hereto.
Not applicable.
77
Pursuant to the requirements of Section 13 or 15(d) of the Securities Exchange Act of 1934, the registrant has duly caused this report to be signed on its behalf by the undersigned, thereunto duly authorized.
Date: February 22, 2018
|
FINANCIAL ENGINES, INC. |
|
|
|
|
|
/s/ Lawrence M. Raffone |
|
|
Lawrence M. Raffone |
|
|
President and Chief Executive Officer |
|
|
(Duly authorized officer and principal executive officer) |
|
|
|
|
|
/s/ Craig L. Foster |
|
|
Craig L. Foster |
|
|
Executive Vice President, Chief Financial Officer |
|
|
(Duly authorized officer, principal financial officer and principal accounting officer) |
|
|
|
|
78
KNOW ALL PERSONS BY THESE PRESENTS, that each person whose signature appears below constitutes and appoints Lawrence M. Raffone and Craig L. Foster and each of them, such person’s true and lawful attorneys-in-fact and agents, each with full power of substitution and resubstitution, for such person and in such person’s name, place and stead, in any and all capacities, to sign any and all amendments to this Annual Report on Form 10-K, and to file the same, with exhibits thereto and other documents in connection therewith, with the Securities and Exchange Commission granting unto said attorneys-in-fact and agents, and each of them, full power and authority to do and perform each and every act and thing requisite and necessary to be done, as fully to all intents and purposes as such person might or could do in person, hereby ratifying and confirming all that each of said attorneys-in-fact and agents, or such person’s substitute or substitutes may lawfully do or cause to be done by virtue hereof.
Pursuant to the requirements of the Securities Exchange Act of 1934, this report has been signed below by the following persons on behalf of the registrant and in the capacities and on the dates indicated.
|
Name |
|
Title |
|
Date |
|
|
|
|
|
|
|
|
|
|
|
|
|
/s/ Lawrence M. Raffone |
|
President and Chief Executive Officer |
|
February 22, 2018 |
|
Lawrence M. Raffone |
|
|
|
|
|
|
|
|
|
|
|
/s/ Craig L. Foster |
|
Executive Vice President, Chief Financial |
|
February 22, 2018 |
|
Craig L. Foster |
|
|
|
|
|
|
|
|
|
|
|
/s/ Blake R. Grossman |
|
Chairman |
|
February 22, 2018 |
|
Blake R. Grossman |
|
|
|
|
|
|
|
|
|
|
|
/s/ E. Olena Berg-Lacy |
|
Director |
|
February 22, 2018 |
|
E. Olena Berg-Lacy |
|
|
|
|
|
|
|
|
|
|
|
/s/ Joseph A. Grundfest |
|
Director |
|
February 22, 2018 |
|
Joseph A. Grundfest |
|
|
|
|
|
|
|
|
|
|
|
/s/ Robert A. Huret |
|
Director |
|
February 22, 2018 |
|
Robert A. Huret |
|
|
|
|
|
|
|
|
|
|
|
/s/ Heidi Kunz |
|
Director |
|
February 22, 2018 |
|
Heidi Kunz |
|
|
|
|
|
|
|
|
|
|
|
/s/ Michael E. Martin |
|
Director |
|
February 22, 2018 |
|
Michael E. Martin |
|
|
|
|
|
|
|
|
|
|
|
/s/ John B. Shoven |
|
Director |
|
February 22, 2018 |
|
John B. Shoven |
|
|
|
|
|
|
|
|
|
|
|
/s/ David B. Yoffie |
|
Director |
|
February 22, 2018 |
|
David B. Yoffie |
|
|
|
|
|
|
79
FINANCIAL ENGINES, INC. AND SUBSIDIARIES
INDEX TO CONSOLIDATED FINANCIAL STATEMENTS
F-1
Report of Independent Registered Public Accounting Firm
To the Stockholders and Board of Directors
Financial Engines, Inc.:
Opinions on the Consolidated Financial Statements and Internal Control Over Financial Reporting
We have audited the accompanying consolidated balance sheets of Financial Engines, Inc. and its subsidiaries (the Company) as of December 31, 2016 and 2017, the related consolidated statements of income, stockholders’ equity, and cash flows for each of the years in the three-year period ended December 31, 2017, and the related notes (collectively, the consolidated financial statements). We also have audited the internal control over financial reporting of Finanical Engines, Inc. as of December 31, 2017, based on criteria established in Internal Control – Integrated Framework (2013) issued by the Committee of Sponsoring Organizations of the Treadway Commission”.
In our opinion, the consolidated financial statements referred to above present fairly, in all material respects, the financial position of the Company as of December 31, 2016 and 2017, and the results of its operations and its cash flows for each of the years in the three-year period ended December 31, 2017, in conformity with U.S. generally accepted accounting principles. Also in our opinion, Finanical Engines, Inc. maintained, in all material respects, effective internal control over financial reporting as of December 31, 2017, based on criteria established in Internal Control – Integrated Framework (2013) issued by the Committee of Sponsoring Organizations of the Treadway Commission.
Basis for Opinions
The Company’s management is responsible for these consolidated financial statements, for maintaining effective internal control over financial reporting, and for its assessment of the effectiveness of internal control over financial reporting, included in the accompanying management’s report on internal control over financial reporting included in Item 9A. Our responsibility is to express an opinion on the Company’s consolidated financial statements and an opinion on the Company’s internal control over financial reporting based on our audits. We are a public accounting firm registered with the Public Company Accounting Oversight Board (United States) (PCAOB) and are required to be independent with respect to the Company in accordance with the U.S. federal securities laws and the applicable rules and regulations of the Securities and Exchange Commission and the PCAOB.
We conducted our audits in accordance with the standards of the PCAOB. Those standards require that we plan and perform the audits to obtain reasonable assurance about whether the consolidated financial statements are free of material misstatement, whether due to error or fraud, and whether effective internal control over financial reporting was maintained in all material respects.
Our audits of the consolidated financial statements included performing procedures to assess the risks of material misstatement of the consolidated financial statements, whether due to error or fraud, and performing procedures that respond to those risks. Such procedures included examining, on a test basis, evidence regarding the amounts and disclosures in the consolidated financial statements. Our audits also included evaluating the accounting principles used and significant estimates made by management, as well as evaluating the overall presentation of the consolidated financial statements. Our audit of internal control over financial reporting included obtaining an understanding of internal control over financial reporting, assessing the risk that a material weakness exists, and testing and evaluating the design and operating effectiveness of internal control based on the assessed risk. Our audits also included performing such other procedures as we considered necessary in the circumstances. We believe that our audits provide a reasonable basis for our opinions.
Definition and Limitations of Internal Control Over Financial Reporting
A company’s internal control over financial reporting is a process designed to provide reasonable assurance regarding the reliability of financial reporting and the preparation of financial statements for external purposes in accordance with generally accepted accounting principles. A company’s internal control over financial reporting includes those policies and procedures that (1) pertain to the maintenance of records that, in reasonable detail, accurately and fairly reflect the transactions and dispositions of the assets of the company; (2) provide reasonable assurance that transactions are recorded as necessary to permit preparation of financial statements in accordance with generally accepted accounting principles, and that receipts and expenditures of the company are being made only in accordance with authorizations of management and directors of the company; and (3) provide reasonable assurance regarding prevention or timely detection of unauthorized acquisition, use, or disposition of the company’s assets that could have a material effect on the financial statements.
Because of its inherent limitations, internal control over financial reporting may not prevent or detect misstatements. Also, projections of any evaluation of effectiveness to future periods are subject to the risk that controls may become inadequate because of changes in conditions, or that the degree of compliance with the policies or procedures may deteriorate.
/s/ KPMG LLP
We have served as the Company’s auditor since 2002.
Santa Clara, California
February 22, 2018
F-2
FINANCIAL ENGINES, INC. AND SUBSIDIARIES
December 31, 2016 and 2017
|
|
|
December 31, |
|
|||||
|
|
|
2016 |
|
|
2017 |
|
||
|
|
|
(In thousands, except per share data) |
|
|||||
|
Assets |
|
|
|
|
|
|
|
|
|
Current assets: |
|
|
|
|
|
|
|
|
|
Cash and cash equivalents |
|
$ |
134,246 |
|
|
$ |
224,543 |
|
|
Accounts receivable, net of allowances of $206 and $172 as of December 31, 2016 and 2017, respectively |
|
|
103,256 |
|
|
|
116,116 |
|
|
Prepaid expenses |
|
|
7,370 |
|
|
|
9,159 |
|
|
Other current assets |
|
|
3,468 |
|
|
|
4,501 |
|
|
Total current assets |
|
|
248,340 |
|
|
|
354,319 |
|
|
Property and equipment, net |
|
|
24,532 |
|
|
|
25,880 |
|
|
Intangible assets, net |
|
|
205,751 |
|
|
|
198,045 |
|
|
Goodwill |
|
|
312,020 |
|
|
|
312,020 |
|
|
Long-term deferred tax assets |
|
|
40,504 |
|
|
|
28,801 |
|
|
Direct response advertising, net |
|
|
5,849 |
|
|
|
4,653 |
|
|
Other assets |
|
|
3,140 |
|
|
|
2,184 |
|
|
Total assets |
|
$ |
840,136 |
|
|
$ |
925,902 |
|
|
|
|
|
|
|
|
|
|
|
|
Liabilities and Stockholders’ Equity |
|
|
|
|
|
|
|
|
|
Current liabilities: |
|
|
|
|
|
|
|
|
|
Accounts payable |
|
$ |
36,780 |
|
|
$ |
29,993 |
|
|
Accrued compensation |
|
|
27,667 |
|
|
|
28,519 |
|
|
Deferred revenue |
|
|
4,701 |
|
|
|
4,204 |
|
|
Dividend payable |
|
|
4,350 |
|
|
|
4,411 |
|
|
Other current liabilities |
|
|
4,343 |
|
|
|
2,457 |
|
|
Total current liabilities |
|
|
77,841 |
|
|
|
69,584 |
|
|
Long-term deferred rent |
|
|
12,269 |
|
|
|
10,720 |
|
|
Long-term tax liabilities |
|
|
2,207 |
|
|
|
- |
|
|
Other liabilities |
|
|
488 |
|
|
|
459 |
|
|
Total liabilities |
|
|
92,805 |
|
|
|
80,763 |
|
|
Contingencies (see note 9) |
|
|
|
|
|
|
|
|
|
Stockholders’ equity: |
|
|
|
|
|
|
|
|
|
Preferred stock, $0.0001 par value — 10,000 authorized as of December 31, 2016 and 2017; None issued or outstanding as of December 31, 2016 and 2017 |
|
|
— |
|
|
|
— |
|
|
Common stock, $0.0001 par value — 500,000 authorized as of December 31, 2016 and 2017; 63,476 and 64,725 shares issued and 62,199 and 63,049 shares outstanding at December 31, 2016 and 2017, respectively |
|
|
6 |
|
|
|
6 |
|
|
Additional paid-in capital |
|
|
782,079 |
|
|
|
838,461 |
|
|
Treasury stock, at cost (1,277 shares and 1,677 as of December 31, 2016 and 2017, respectively) |
|
|
(47,637 |
) |
|
|
(58,437 |
) |
|
Retained Earnings |
|
|
12,883 |
|
|
|
65,109 |
|
|
Total stockholders’ equity |
|
|
747,331 |
|
|
|
845,139 |
|
|
Total liabilities and stockholders’ equity |
|
$ |
840,136 |
|
|
$ |
925,902 |
|
See accompanying notes to the consolidated financial statements.
F-3
FINANCIAL ENGINES, INC. AND SUBSIDIARIES
Consolidated Statements of Income
Years Ended December 31, 2015, 2016, and 2017
|
|
|
2015 |
|
|
2016 |
|
|
2017 |
|
|||
|
|
|
(In thousands, except per share data) |
|
|||||||||
|
Revenue: |
|
|
|
|
|
|
|
|
|
|
|
|
|
Professional management |
|
$ |
277,162 |
|
|
$ |
385,944 |
|
|
$ |
450,320 |
|
|
Platform |
|
|
30,766 |
|
|
|
28,366 |
|
|
|
26,558 |
|
|
Other |
|
|
2,794 |
|
|
|
9,627 |
|
|
|
3,628 |
|
|
Total revenue |
|
|
310,722 |
|
|
|
423,937 |
|
|
|
480,506 |
|
|
Costs and expenses: |
|
|
|
|
|
|
|
|
|
|
|
|
|
Cost of revenue |
|
|
131,011 |
|
|
|
186,009 |
|
|
|
212,924 |
|
|
Research and development |
|
|
35,581 |
|
|
|
37,983 |
|
|
|
44,018 |
|
|
Sales and marketing |
|
|
61,262 |
|
|
|
84,068 |
|
|
|
80,888 |
|
|
General and administrative |
|
|
28,813 |
|
|
|
46,497 |
|
|
|
39,696 |
|
|
Amortization of intangible assets, including internal use software |
|
|
4,900 |
|
|
|
15,408 |
|
|
|
17,028 |
|
|
Loss on reacquired franchisee rights |
|
|
- |
|
|
|
4,092 |
|
|
|
- |
|
|
Total costs and expenses |
|
|
261,567 |
|
|
|
374,057 |
|
|
|
394,554 |
|
|
Income from operations |
|
|
49,155 |
|
|
|
49,880 |
|
|
|
85,952 |
|
|
Interest income, net |
|
|
356 |
|
|
|
176 |
|
|
|
1,167 |
|
|
Other expense, net |
|
|
(30 |
) |
|
|
(784 |
) |
|
|
(508 |
) |
|
Income before income taxes |
|
|
49,481 |
|
|
|
49,272 |
|
|
|
86,611 |
|
|
Income tax expense |
|
|
17,864 |
|
|
|
20,712 |
|
|
|
39,951 |
|
|
Net and comprehensive income |
|
$ |
31,617 |
|
|
$ |
28,560 |
|
|
$ |
46,660 |
|
|
Dividends declared per share of common stock |
|
$ |
0.28 |
|
|
$ |
0.28 |
|
|
$ |
0.28 |
|
|
Net income per share attributable to holders of common stock |
|
|
|
|
|
|
|
|
|
|
|
|
|
Basic |
|
$ |
0.61 |
|
|
$ |
0.47 |
|
|
$ |
0.74 |
|
|
Diluted |
|
$ |
0.60 |
|
|
$ |
0.46 |
|
|
$ |
0.72 |
|
|
Shares used to compute net income per share attributable to holders of common stock |
|
|
|
|
|
|
|
|
|
|
|
|
|
Basic |
|
|
51,732 |
|
|
|
60,962 |
|
|
|
62,952 |
|
|
Diluted |
|
|
53,039 |
|
|
|
62,103 |
|
|
|
64,605 |
|
See accompanying notes to the consolidated financial statements.
F-4
FINANCIAL ENGINES, INC. AND SUBSIDIARIES
Consolidated Statements of Stockholders’ Equity
Years Ended December 31, 2015, 2016 and 2017
|
|
|
Common stock |
|
|
Treasury Stock |
|
|
|
|
|
|
|
|
|
|
||||||||||||||
|
|
|
Shares |
|
|
Amount |
|
|
Additional paid-in capital |
|
|
Shares |
|
|
Amount |
|
|
Retained Earnings (Accumulated deficit) |
|
|
Total Stockholders’ Equity |
|
|
|||||||
|
|
|
(In thousands, except share data) |
|
|
|||||||||||||||||||||||||
|
Balance, January 1, 2015 |
|
|
52,223,545 |
|
|
$ |
5 |
|
|
$ |
404,908 |
|
|
|
(280,000 |
) |
|
$ |
(9,182 |
) |
|
$ |
(15,520 |
) |
|
$ |
380,211 |
|
|
|
Issuance of common stock upon exercise of options, net |
|
|
546,511 |
|
|
|
- |
|
|
|
9,201 |
|
|
|
- |
|
|
|
- |
|
|
|
- |
|
|
|
9,201 |
|
|
|
Vested restricted stock units converted to shares |
|
|
302,617 |
|
|
|
- |
|
|
|
- |
|
|
|
- |
|
|
|
- |
|
|
|
- |
|
|
|
- |
|
|
|
Net share settlements for stock-based minimum tax withholdings |
|
|
(100,337 |
) |
|
|
- |
|
|
|
(3,514 |
) |
|
|
- |
|
|
|
- |
|
|
|
- |
|
|
|
(3,514 |
) |
|
|
Repurchases of common stock |
|
|
- |
|
|
|
- |
|
|
|
- |
|
|
|
(997,000 |
) |
|
|
(38,455 |
) |
|
|
- |
|
|
|
(38,455 |
) |
|
|
Stock-based compensation under the fair value method |
|
|
- |
|
|
|
- |
|
|
|
26,213 |
|
|
|
- |
|
|
|
- |
|
|
|
- |
|
|
|
26,213 |
|
|
|
Cash dividends declared ($0.28 per share) |
|
|
- |
|
|
|
- |
|
|
|
- |
|
|
|
- |
|
|
|
- |
|
|
|
(14,457 |
) |
|
|
(14,457 |
) |
|
|
Excess tax benefit associated with stock-based compensation |
|
|
- |
|
|
|
- |
|
|
|
24,331 |
|
|
|
- |
|
|
|
- |
|
|
|
- |
|
|
|
24,331 |
|
|
|
Net and comprehensive income |
|
|
- |
|
|
|
- |
|
|
|
|
|
|
|
- |
|
|
|
- |
|
|
|
31,617 |
|
|
|
31,617 |
|
|
|
Balance, December 31, 2015 |
|
|
52,972,336 |
|
|
$ |
5 |
|
|
$ |
461,139 |
|
|
|
(1,277,000 |
) |
|
$ |
(47,637 |
) |
|
$ |
1,640 |
|
|
$ |
415,147 |
|
|
|
Issuance of common stock upon exercise of options, net |
|
|
404,208 |
|
|
|
- |
|
|
|
6,625 |
|
|
|
- |
|
|
|
- |
|
|
|
- |
|
|
|
6,625 |
|
|
|
Issuance of common stock related to business combination |
|
|
9,885,889 |
|
|
|
1 |
|
|
|
267,017 |
|
|
|
- |
|
|
|
- |
|
|
|
- |
|
|
|
267,018 |
|
|
|
Vested restricted stock units converted to shares |
|
|
317,497 |
|
|
|
- |
|
|
|
- |
|
|
|
- |
|
|
|
- |
|
|
|
- |
|
|
|
- |
|
|
|
Net share settlements for stock-based minimum tax withholdings |
|
|
(104,109 |
) |
|
|
- |
|
|
|
(3,336 |
) |
|
|
- |
|
|
|
- |
|
|
|
- |
|
|
|
(3,336 |
) |
|
|
Stock-based compensation under the fair value method |
|
|
- |
|
|
|
- |
|
|
|
33,988 |
|
|
|
- |
|
|
|
- |
|
|
|
- |
|
|
|
33,988 |
|
|
|
Cash dividends declared ($0.28 per share) |
|
|
- |
|
|
|
- |
|
|
|
- |
|
|
|
- |
|
|
|
- |
|
|
|
(17,317 |
) |
|
|
(17,317 |
) |
|
|
Excess tax benefit associated with stock-based compensation |
|
|
- |
|
|
|
- |
|
|
|
16,646 |
|
|
|
- |
|
|
|
- |
|
|
|
- |
|
|
|
16,646 |
|
|
|
Net and comprehensive income |
|
|
- |
|
|
|
- |
|
|
|
- |
|
|
|
- |
|
|
|
- |
|
|
|
28,560 |
|
|
|
28,560 |
|
|
|
Balance, December 31, 2016 |
|
|
63,475,821 |
|
|
$ |
6 |
|
|
$ |
782,079 |
|
|
|
(1,277,000 |
) |
|
$ |
(47,637 |
) |
|
$ |
12,883 |
|
|
$ |
747,331 |
|
|
|
Issuance of common stock upon exercise of options, net |
|
|
933,245 |
|
|
|
- |
|
|
|
22,424 |
|
|
|
- |
|
|
|
- |
|
|
|
- |
|
|
|
22,424 |
|
|
|
Vested restricted stock units converted to shares |
|
|
473,569 |
|
|
|
- |
|
|
|
- |
|
|
|
- |
|
|
|
- |
|
|
|
- |
|
|
|
- |
|
|
|
Net share settlements for stock-based minimum tax withholdings |
|
|
(157,196 |
) |
|
|
- |
|
|
|
(5,638 |
) |
|
|
- |
|
|
|
- |
|
|
|
- |
|
|
|
(5,638 |
) |
|
|
Repurchases of common stock |
|
|
|
|
|
|
|
|
|
|
|
|
|
|
(399,638 |
) |
|
|
(10,800 |
) |
|
|
|
|
|
|
(10,800 |
) |
|
|
Stock-based compensation under the fair value method |
|
|
- |
|
|
|
- |
|
|
|
36,819 |
|
|
|
- |
|
|
|
- |
|
|
|
- |
|
|
|
36,819 |
|
|
|
Cumulative effect on adoption of new accounting standards |
|
|
|
|
|
|
|
|
|
|
2,777 |
|
|
|
|
|
|
|
|
|
|
|
23,215 |
|
|
|
25,992 |
|
|
|
Cash dividends declared ($0.28 per share) |
|
|
- |
|
|
|
- |
|
|
|
- |
|
|
|
- |
|
|
|
- |
|
|
|
(17,649 |
) |
|
|
(17,649 |
) |
|
|
Net and comprehensive income |
|
|
- |
|
|
|
- |
|
|
|
- |
|
|
|
- |
|
|
|
- |
|
|
|
46,660 |
|
|
|
46,660 |
|
|
|
Balance, December 31, 2017 |
|
|
64,725,439 |
|
|
$ |
6 |
|
|
$ |
838,461 |
|
|
|
(1,676,638 |
) |
|
$ |
(58,437 |
) |
|
$ |
65,109 |
|
|
$ |
845,139 |
|
|
See accompanying notes to the consolidated financial statements.
F-5
FINANCIAL ENGINES, INC. AND SUBSIDIARIES
Consolidated Statements of Cash Flows
Years Ended December 31, 2015, 2016, and 2017
|
|
|
2015 |
|
|
2016 |
|
|
2017 |
|
|||
|
|
|
(In thousands) |
|
|||||||||
|
Cash flows from operating activities: |
|
|
|
|
|
|
|
|
|
|
|
|
|
Net income |
|
$ |
31,617 |
|
|
$ |
28,560 |
|
|
$ |
46,660 |
|
|
Adjustments to reconcile net income to net cash provided by operating activities: |
|
|
|
|
|
|
|
|
|
|
|
|
|
Depreciation and amortization |
|
|
6,092 |
|
|
|
8,946 |
|
|
|
8,505 |
|
|
Amortization of intangible assets |
|
|
4,566 |
|
|
|
14,964 |
|
|
|
16,462 |
|
|
Stock-based compensation |
|
|
26,028 |
|
|
|
33,689 |
|
|
|
36,425 |
|
|
Amortization of deferred sales commissions |
|
|
1,717 |
|
|
|
1,560 |
|
|
|
1,052 |
|
|
Amortization and impairment of direct response advertising |
|
|
5,359 |
|
|
|
4,702 |
|
|
|
3,592 |
|
|
Amortization of discount on short-term investments |
|
|
(359 |
) |
|
|
(5 |
) |
|
|
- |
|
|
Provision for doubtful accounts |
|
|
938 |
|
|
|
746 |
|
|
|
678 |
|
|
Write off of notes receivable |
|
|
- |
|
|
|
290 |
|
|
|
- |
|
|
Deferred tax assets |
|
|
(9,196 |
) |
|
|
(1,116 |
) |
|
|
36,731 |
|
|
Loss on fixed asset disposal |
|
|
14 |
|
|
|
281 |
|
|
|
405 |
|
|
Loss (gain) on sale of short-term investments |
|
|
(9 |
) |
|
|
18 |
|
|
|
- |
|
|
Changes in operating assets and liabilities: |
|
|
|
|
|
|
|
|
|
|
|
|
|
Accounts receivable |
|
|
(6,225 |
) |
|
|
(15,250 |
) |
|
|
(13,539 |
) |
|
Prepaid expenses |
|
|
(723 |
) |
|
|
(1,369 |
) |
|
|
(1,872 |
) |
|
Direct response advertising |
|
|
(4,338 |
) |
|
|
(3,388 |
) |
|
|
(2,429 |
) |
|
Other assets |
|
|
1,773 |
|
|
|
(1,455 |
) |
|
|
(2,290 |
) |
|
Accounts payable |
|
|
30,856 |
|
|
|
18,827 |
|
|
|
(7,958 |
) |
|
Accrued compensation |
|
|
6,998 |
|
|
|
4,369 |
|
|
|
852 |
|
|
Deferred revenue |
|
|
391 |
|
|
|
(1,768 |
) |
|
|
(557 |
) |
|
Deferred rent |
|
|
814 |
|
|
|
1,130 |
|
|
|
(833 |
) |
|
Other liabilities |
|
|
- |
|
|
|
(526 |
) |
|
|
(20 |
) |
|
Net cash provided by operating activities |
|
$ |
96,313 |
|
|
$ |
93,205 |
|
|
$ |
121,864 |
|
|
Cash flows from investing activities: |
|
|
|
|
|
|
|
|
|
|
|
|
|
Purchase of property and equipment |
|
|
(6,094 |
) |
|
|
(7,037 |
) |
|
|
(8,657 |
) |
|
Capitalization of internal use software |
|
|
(5,049 |
) |
|
|
(6,904 |
) |
|
|
(8,328 |
) |
|
Purchases of short-term investments |
|
|
(159,555 |
) |
|
|
- |
|
|
|
- |
|
|
Maturities of short-term investments |
|
|
180,000 |
|
|
|
- |
|
|
|
- |
|
|
Sale of short-term investments |
|
|
119,872 |
|
|
|
39,923 |
|
|
|
- |
|
|
Cash paid for acquisitions, net of cash acquired |
|
|
- |
|
|
|
(274,569 |
) |
|
|
- |
|
|
Net cash provided (used in) by investing activities |
|
$ |
129,174 |
|
|
$ |
(248,587 |
) |
|
$ |
(16,985 |
) |
|
Cash flows from financing activities: |
|
|
|
|
|
|
|
|
|
|
|
|
|
Payments on capital lease obligations |
|
|
(112 |
) |
|
|
(106 |
) |
|
|
(136 |
) |
|
Payments related to business combinations |
|
|
- |
|
|
|
(2,189 |
) |
|
|
(2,845 |
) |
|
Net share settlements for stock-based awards minimum tax withholdings |
|
|
(3,514 |
) |
|
|
(3,336 |
) |
|
|
(5,638 |
) |
|
Repurchase of common stock |
|
|
(38,455 |
) |
|
|
- |
|
|
|
(10,800 |
) |
|
Proceeds from issuance of common stock |
|
|
9,201 |
|
|
|
6,625 |
|
|
|
22,424 |
|
|
Cash dividend payments |
|
|
(13,955 |
) |
|
|
(16,582 |
) |
|
|
(17,587 |
) |
|
Net cash used in financing activities |
|
$ |
(46,835 |
) |
|
$ |
(15,588 |
) |
|
$ |
(14,582 |
) |
|
Net increase (decrease) in cash and cash equivalents |
|
|
178,652 |
|
|
|
(170,970 |
) |
|
|
90,297 |
|
|
Cash and cash equivalents, beginning of year |
|
|
126,564 |
|
|
|
305,216 |
|
|
|
134,246 |
|
|
Cash and cash equivalents, end of year |
|
$ |
305,216 |
|
|
$ |
134,246 |
|
|
$ |
224,543 |
|
|
Supplemental cash flows information: |
|
|
|
|
|
|
|
|
|
|
|
|
|
Income taxes paid, net of refunds |
|
$ |
1,584 |
|
|
$ |
3,336 |
|
|
$ |
7,832 |
|
|
Interest paid |
|
$ |
13 |
|
|
$ |
13 |
|
|
$ |
65 |
|
|
Non-cash operating, investing and financing activities: |
|
|
|
|
|
|
|
|
|
|
|
|
|
Issuance of common stock related to acquisition |
|
$ |
- |
|
|
$ |
267,018 |
|
|
$ |
- |
|
|
Unpaid purchases of property and equipment |
|
$ |
574 |
|
|
$ |
173 |
|
|
$ |
1,365 |
|
|
Purchase of property and equipment with non-cash tenant improvement allowance |
|
$ |
- |
|
|
$ |
1,952 |
|
|
$ |
187 |
|
|
Purchase of property and equipment under capital lease |
|
$ |
216 |
|
|
$ |
- |
|
|
$ |
243 |
|
|
Capitalized stock-based compensation for internal use software |
|
$ |
515 |
|
|
$ |
766 |
|
|
$ |
994 |
|
|
Capitalized stock-based compensation for direct response advertising |
|
$ |
97 |
|
|
$ |
79 |
|
|
$ |
56 |
|
|
Dividends declared but not yet paid |
|
$ |
3,615 |
|
|
$ |
4,350 |
|
|
$ |
4,411 |
|
5
See accompanying notes to the consolidated financial statements.
F-6
FINANCIAL ENGINES, INC. AND SUBSIDIARIES
NOTES TO THE CONSOLIDATED FINANCIAL STATEMENTS
NOTE 1 — Organization and Description of the Business
The Company
Financial Engines, Inc. (the Company) was incorporated on May 13, 1996 under the laws of the State of California and is headquartered in Sunnyvale, California. In February 2010, the Company was reincorporated under the laws of the State of Delaware.
The Company is a leading provider of independent, technology-enabled comprehensive financial advisory services, discretionary portfolio management, personalized investment advice, financial and retirement income planning, financial education and guidance. The Company helps individuals, either online or with an advisor, develop a strategy to reach financial goals by offering a comprehensive set of services, including holistic, personalized plans for saving and investing, assessments of retirement income, and the option to meet face-to-face with a dedicated financial advisor at one of more than 140 advisor centers nationwide. The Company’s advice and planning services cover employer-sponsored defined contribution (DC) accounts (401(k), 457, and 403(b) plans), IRA accounts, and taxable accounts.
The Company’s business model of comprehensive financial planning is based primarily on providing access to its advisory services through DC plans in the workplace, and expanding that connection to a holistic financial advisory relationship with our clients. The Company also provides advisory services to individual clients who access our services directly. Clients are defined as individuals who utilize our services, including Professional Management, Personal Advisor, Online Advice, education or guidance. The Company works with three key constituencies: individual investors, plan sponsors (employers offering DC plans to their employees) and plan providers (companies providing administrative services to plan sponsors).
The Company’s investment advisory and management services are provided through its subsidiary, Financial Engines Advisors L.L.C., a federally registered investment adviser. In February 2016, the Company completed the acquisition of Kansas City 727 Acquisition LLC, a Delaware limited liability corporation, as well as its subsidiaries (collectively, “The Mutual Fund Store”).
NOTE 2 — Basis of Presentation and Principles of Consolidation
The accompanying consolidated financial statements were prepared in accordance with accounting principles generally accepted in the United States of America (GAAP).
The accompanying consolidated financial statements include the accounts of the Company and all of its wholly owned subsidiaries. All intercompany balances and transactions have been eliminated in consolidation.
Use of Estimates
The preparation of financial statements in conformity with GAAP requires management to make estimates and assumptions that affect the reported amounts of assets and liabilities, the disclosures of contingent assets and liabilities at the date of the financial statements and the reported amounts of revenue and expense during the reporting period. Significant items subject to such estimates include stock-based compensation, direct response advertising, the fair value of acquired assets and assumed liabilities, internal use software, income taxes and goodwill, intangible assets and property, plant and equipment. Actual results could differ from those estimates under different assumptions or conditions.
Cash and Cash Equivalents
The Company considers all highly liquid investments with an original maturity of three months or less from date of purchase to be cash equivalents. Cash and cash equivalents are comprised of cash held primarily in money market funds.
F-7
FINANCIAL ENGINES, INC. AND SUBSIDIARIES
NOTES TO THE CONSOLIDATED FINANCIAL STATEMENTS — (Continued)
Concentration of Credit Risk and Fair Value of Financial Instruments
The Company measures and reports its investments in money market funds at fair value on a recurring basis, which approximates their carrying value due to the short period of time to maturity as of December 31, 2016 and 2017. There have been no changes in the Company’s valuation techniques during the years ended December 31, 2016 and 2017. The money market funds are classified as Level 1.
The following table summarizes the Company’s financial assets measured at fair value on a recurring basis:
|
|
|
As of December 31, 2016 |
|
|
As of December 31, 2017 |
|
||||||||||||||||||||||||||
|
|
|
Total Fair Value |
|
|
Quoted Prices in Active Markets for Identical Assets (Level 1) (1) |
|
|
Significant Other Observable Inputs (Level 2) (2) |
|
|
Significant Other Unobservable Inputs (Level 3) (3) |
|
|
Total Fair Value |
|
|
Quoted Prices in Active Markets for Identical Assets (Level 1) (1) |
|
|
Significant Other Observable Inputs (Level 2) (2) |
|
|
Significant Other Unobservable Inputs (Level 3) (3) |
|
||||||||
|
|
|
(In thousands) |
|
|||||||||||||||||||||||||||||
|
Assets: |
|
|
|
|
|
|
|
|
|
|
|
|
|
|
|
|
|
|
|
|
|
|
|
|
|
|
|
|
|
|
|
|
|
Money Market Funds |
|
$ |
50,077 |
|
|
$ |
50,077 |
|
|
$ |
- |
|
|
$ |
- |
|
|
$ |
215,572 |
|
|
$ |
215,572 |
|
|
$ |
- |
|
|
$ |
- |
|
|
(1) |
Level 1: Observable inputs that reflect quoted prices (unadjusted) for identical assets or liabilities in active markets. |
|
(2) |
Level 2: Inputs reflect quoted prices for identical assets or liabilities in markets that are not active; quoted prices for similar assets or liabilities in active markets; inputs other than quoted prices that are observable for the assets or liabilities; or inputs that are derived principally from or corroborated by observable market data by correlation or other means. |
|
(3) |
Level 3: Unobservable inputs reflecting the Company’s own assumptions incorporated in valuation techniques used to determine fair value. These assumptions are required to be consistent with market participant assumptions that are reasonably available. |
Financial instruments that potentially subject the Company to significant concentrations of credit risk consist principally of cash, cash equivalents and accounts receivable. The Company maintains its cash and cash equivalents primarily in highly-rated taxable money market funds which hold securities issued or guaranteed by the United States government or their agencies. These deposits may exceed federal deposit insurance limits. The fair value of the Company’s money market funds is based on a trade date basis on the last business day of the accounting period. The fair value of the Company’s accounts receivable and accounts payable approximates the carrying amount due to their short duration.
The Company’s customers are concentrated in the United States. The Company performs ongoing credit evaluations of its customers and does not require collateral. The Company reviews the need for allowances for potential credit losses and such losses have been insignificant to date.
Significant Customer Information
One customer accounted for 10% of the Company’s accounts receivable as of December 31, 2017, and this same customer accounted for 10% of the Company’s total revenue for the years ended December 31, 2015 and 2017. No customers accounted for 10% or more of accounts receivable as of December 31, 2016 or total revenue for the year ended December 31, 2016.
Allowance for Doubtful Accounts
Trade accounts receivable are recorded at the invoiced amount and are not interest bearing. The Company maintains an allowance for doubtful accounts to reserve for potentially uncollectible trade receivables. The Company reviews its trade receivables by aging category to identify significant customers with collection issues. For accounts not specifically identified, the Company provides reserves based on historical bad debt loss experience. The allowance for doubtful accounts were immaterial for the years ended December 31, 2015, 2016 and 2017.
F-8
FINANCIAL ENGINES, INC. AND SUBSIDIARIES
NOTES TO THE CONSOLIDATED FINANCIAL STATEMENTS — (Continued)
Property and equipment are stated at cost less accumulated depreciation. Depreciation is computed using the straight-line method over the estimated useful lives of the assets and allocated to the department of benefit in the accompanying Consolidated Statements of Income. Leasehold improvements and capital lease equipment are amortized over the shorter of the remaining lease term or the useful life of the asset. Software purchased for internal use is amortized over its useful life. Expenditures for maintenance and repairs are charged to expense as incurred.
|
|
|
Estimated Useful Lives in Years |
|
|
|
Computer equipment |
|
|
3 |
|
|
Computer software |
|
|
2 |
|
|
Furniture, fixtures, and equipment |
|
|
5 |
|
|
Leasehold improvements |
|
life of the lease |
|
|
|
Capital lease equipment |
|
life of the lease |
|
|
Internal Use Software
Certain direct development costs associated with internal use software are capitalized and include payroll costs for employees and external direct consulting costs related to software coding, designing system interfaces, and installation and testing of the software. Internal use software includes engineering costs associated with (1) enhancing the Company’s advisory service platform and (2) developing internal systems for tracking member data, including AUM, member cancellations and other related member statistics. The capitalized costs are amortized using the straight-line method over an estimated life of approximately two to four years, beginning when the asset is substantially ready for use. Costs related to preliminary project activities and post implementation activities are expensed as incurred. A portion of internal use software relates to cost of revenue, as well as the Company’s other functional departments. However the Company is not able to meaningfully allocate the costs among cost of revenue and operations. Accordingly, amortization is presented within amortization of intangible assets on the accompanying Consolidated Statements of Income.
Business Combinations
The Company accounts for business combinations under the acquisition method. The cost of an acquired company is assigned to the tangible and intangible assets acquired and the liabilities assumed on the basis of their fair values at the date of acquisition. The determination of fair values of assets acquired and liabilities assumed requires management to make estimates and use valuation techniques when market values are not readily available. Any excess of the aggregate purchase price over the fair value of net tangible and identifiable intangible assets acquired is allocated to goodwill. Transaction costs associated with business combinations are expensed as incurred.
F-9
FINANCIAL ENGINES, INC. AND SUBSIDIARIES
NOTES TO THE CONSOLIDATED FINANCIAL STATEMENTS — (Continued)
Goodwill and Intangible Assets
Goodwill consists of the excess of the aggregate purchase price over the fair value of net tangible and identifiable intangible assets acquired by the Company. The carrying amount of goodwill is tested for impairment each year in the fourth quarter, or more frequently if facts and circumstances warrant a review, by using a two-step process. The Company has concluded that it has a single reporting unit for the purpose of goodwill impairment testing, and accordingly, all goodwill resides within a single reporting unit. The Company compares the fair value of the reporting unit with its carrying amount, including goodwill. If the fair value of the reporting unit exceeds its carrying value, goodwill of the reporting unit is not considered impaired. If the carrying value of the reporting unit exceeds its fair value, the Company would perform a measurement of the amount of impairment by comparing the carrying amount of the goodwill to a determination of the implied fair value of the goodwill. If the carrying amount of the goodwill is greater than the implied value, an impairment loss is recognized for the difference. There have been no goodwill impairment losses to date.
The Company does not have any indefinite lived intangible assets besides goodwill. Intangible assets with definite useful lives are recorded at their acquired value less accumulated amortization. Intangible assets are reviewed for impairment whenever events or changes in circumstances raise doubt about recoverability of the net assets. Such reviews include an analysis of current results and take into consideration the undiscounted value of projected operating cash flows. There were no impairments or changes in useful lives of acquired intangible assets during the periods presented.
Intangible assets consist primarily of customer relationships, trademarks, trade names, internal use software and reacquired franchisee rights. These intangible assets are acquired through business combinations or, in the case of capitalized software costs, are internally developed. Intangible assets are amortized on a straight-line basis over their estimated useful lives which range from 1 year to 20 years.
Long-Lived Assets
Long-lived assets, such as property, equipment, direct response advertising and intangible assets, including capitalized internal use software, subject to depreciation and amortization, are reviewed for impairment whenever events or changes in circumstances indicate that the carrying amount of an asset or an asset group may not be recoverable. When such events or changes in circumstances occur, the Company assesses recoverability by determining whether the carrying value of such assets or asset group will be recovered through the undiscounted expected future cash flows. If the future undiscounted cash flows of the assets or asset group are less than their carrying amount, the Company would recognize an impairment loss based on any excess of the carrying amount of the asset or asset group over their fair value.
Management evaluates the useful lives of these assets on an annual basis and tests for impairment whenever events or changes in circumstances occur that could impact the recoverability of these assets. Impairments to long-lived assets were immaterial during the periods presented.
Deferred Sales Commissions
Deferred sales commissions consist of incremental costs paid to the Company’s sales force associated with the execution of customer contracts. The deferred sales commission amounts are recoverable through future revenue streams under the customer contracts. The Company believes this is the preferable method of accounting as the commission charges are so closely related to the revenue from the customer contracts that they should be recorded as an asset and charged to expense over the initial term of the related customer contracts, which is typically three to five years. Amortization of deferred sales commissions is included in sales and marketing expense in the accompanying Consolidated Statements of Income.
Comprehensive Income
Comprehensive income is defined as the change in equity of a business enterprise during a period from transactions and other events and circumstances from non-owner sources. Comprehensive income is the same as net income for all periods presented.
F-10
FINANCIAL ENGINES, INC. AND SUBSIDIARIES
NOTES TO THE CONSOLIDATED FINANCIAL STATEMENTS — (Continued)
The Company’s chief operating decision-maker, its chief executive officer, reviews the Company’s operating results on an aggregate, consolidated basis and manages its operations as a single operating segment. In addition, all of the Company’s operations and assets are based in the United States.
Revenue Recognition
The Company recognizes revenue when all of the following conditions are met:
|
|
• |
There is persuasive evidence of an arrangement, as evidenced by a signed contract; |
|
|
• |
Delivery has occurred or the service has been made available to the customer, which occurs upon completion of implementation and connectivity services, if applicable, and acceptance by the customer; |
|
|
• |
The collectability of the fees is reasonably assured; and |
|
|
• |
The amount of fees to be paid by the customer is fixed or determinable. |
The Company generates its revenue through three primary sources: professional management, platform and other revenue.
Professional Management. The Company derives professional management revenue from client fees paid by or on behalf of both DC and individual investor clients who are enrolled in one of its discretionary portfolio management services (either the Professional Management service or the Personal Advisor service) for the management of their account assets. The Company continues to use the term professional management revenue to include revenue from both the Professional Management and Personal Advisor services. The Company’s Professional Management service is a discretionary personalized portfolio management service for DC participants who want to work with or delegate the management of their retirement accounts to a professional with the help of an advisor team. Personal Advisor is a personalized service that can provide discretionary portfolio management on a client’s 401(k), IRA and/or taxable assets, as well as comprehensive financial planning and a dedicated advisor representative that participants can meet with in person, online or by phone. The Company’s retirement income solutions, including Income+ and Retirement Paycheck, which are features of its Professional Management and Personal Advisor services, respectively, provide clients approaching or in retirement with discretionary portfolio management with an income objective and steady monthly payments from their accounts during retirement, including Social Security claiming guidance and planning. The services are generally made available to prospective clients by written agreements with the plan provider, the plan sponsor and the plan participant in a DC plan (and may be provided on a subadvisory basis) and by written agreements with retail investors.
The Company’s arrangements with clients using discretionary portfolio management services generally provide for fees based on the value of assets managed and are generally payable quarterly in arrears. The majority of client fees for DC accounts, for both advisory and subadvisory relationships, are calculated on a monthly basis, as the product of client fee rates and the value of assets under management (AUM) at or near the end of each month. For IRA and taxable accounts, client fees are calculated on a quarterly basis at the end of each quarter.
Platform. The Company derives platform revenue from recurring, subscription-based fees for access to its services, including Online Advice, education and guidance, and to a lesser extent, from setup fees. Online Advice is a non-discretionary, Internet-based investment advisory service, which includes personalized online savings and investment advice and retirement income projections for clients who want to manage their retirement themselves. The arrangements generally provide for fees to be paid by the plan sponsor, plan provider or the DC plan itself, depending on the plan structure. Platform revenue is generally paid annually or quarterly in advance and recognized ratably over the term of the subscription period beginning after the completion of customer setup and data connectivity. Setup fees are recognized ratably over seven years and are immaterial for the periods presented.
F-11
FINANCIAL ENGINES, INC. AND SUBSIDIARIES
NOTES TO THE CONSOLIDATED FINANCIAL STATEMENTS — (Continued)
Other. Other revenue includes reimbursement for a portion of marketing and client materials from certain subadvisory relationships. Non-retirement account servicing fees were applicable for the period of February 1, 2016 to December 31, 2016. The fees for non-retirement account servicing do not impact client fees paid for discretionary portfolio management services, and are disclosed in the applicable Form ADV of the Company’s advisory subsidiaries. Franchise royalty fees were applicable for the period of February 1, 2016 to September 30, 2016, as the Company had acquired all remaining franchises as of October 2016. Professional management revenue earned subsequent to the respective acquisition date of the franchises is included in professional management revenue. The franchise royalty fees were recognized as revenue as the services are performed by the franchisees and were based on specified percentages of the franchisees’ advisory fees billed to their clients, which were primarily based on predetermined percentages of the market value of the AUM and were affected by changes in the AUM. Costs associated with reimbursed printed fulfillment materials are expensed to cost of revenue as incurred.
Deferred Revenue
Deferred revenue consists primarily of billings or payments received in advance of revenue recognition generated by the Company’s platform service and setup fees. For these services, the Company generally invoices its customers in annual or quarterly installments payable in advance. Accordingly, the deferred revenue balance does not represent the total contract value of annual or multi-year, non-cancelable subscription contracts.
Cost of Revenue
Cost of revenue includes fees paid to plan providers for connectivity to plan and plan participant data, printed materials fulfillment costs for certain subadvisory relationships for which a portion are reimbursed, printed client materials, and employee-related costs for in-person dedicated advisor centers and call center advisors, operations, implementations, technical operations, portfolio management and client service administration. Costs in this area are related primarily to payments to third parties, employee compensation and related expenses, facilities expenses, purchased materials and depreciation.
The expenses included in cost of revenue are shared across the different revenue categories, and the Company is not able to meaningfully allocate such costs between separate categories of revenue. Consequently, all costs and expenses applicable to the Company’s revenue are included in the category cost of revenue in the Consolidated Statements of Income. A portion of the amortization of intangible assets, including internal use software, relates to the Company’s cost of revenue but is reflected together with all amortization of intangible assets as a separate line item in the Company’s Consolidated Statements of Income.
Direct Response Advertising
The Company’s advertising costs include printed materials associated with new customer solicitations. These costs relate primarily to either active enrollment campaigns, where marketing materials are sent to solicit enrollment in the Company’s Professional Management service, or passive enrollment campaigns, where the plan sponsor defaults all eligible clients into the Professional Management service unless they decline. Advertising costs relating to passive enrollment campaigns and other general marketing materials sent to participants do not qualify as direct response advertising and are expensed to sales and marketing in the period the advertising activities first take place. Printed fulfillment costs relating to subadvisory campaigns do not qualify as direct response advertising and are expensed to cost of revenue in the period in which the expenses were incurred. As campaign materials are modified over time, the Company evaluates the content to ensure it has properly identified those campaigns which qualify for capitalization per the accounting definition of direct-response advertising and expense those campaigns that do not qualify as incurred. Advertising costs associated with direct advisory active enrollment campaigns qualify for capitalization as direct response advertising. The capitalized costs are amortized within sales and marketing expense in the Company’s Consolidated Statements of Income over the estimated three-year period of probable future benefits following the enrollment of a client into the Professional Management service based on the ratio of current period revenue for the direct response advertising cost pool as compared to the total estimated revenue expected for the direct response advertising cost pool over the remaining period of probable future benefits. The realizability of the amounts of direct response advertising reported as assets are evaluated at each balance sheet date by comparing the carrying amounts of such assets on a cost-pool-by-cost-pool basis to the probable remaining future net revenues expected to result directly from such advertising.
F-12
FINANCIAL ENGINES, INC. AND SUBSIDIARIES
NOTES TO THE CONSOLIDATED FINANCIAL STATEMENTS — (Continued)
The Company capitalizes direct response advertising costs associated with direct advisory active enrollment campaigns as the Company has sufficient and verifiable historical patterns to demonstrate the probable future benefits of such campaigns. During the years ended December 31, 2015, 2016 and 2017, the Company capitalized $4.4 million, $3.5 million and $2.5 million, respectively, of direct response advertising costs. Advertising expense was $8.2 million, $19.9 million and $21.6 million for the years ended December 31, 2015, 2016 and 2017, respectively, of which direct response advertising amortization and impairment was $5.5 million, $4.8 million and $3.7 million, respectively. During the years ended December 31, 2015, 2016 and 2017, impairment to direct response advertising were immaterial. Advertising expense other than direct response advertising amortization, such as radio and digital advertising, was expensed as incurred.
The Company expects direct response advertising costs currently capitalized and amortized for certain printed materials associated with new customer solicitations to be expensed as incurred after adoption of Accounting Standards Update No. (ASU) 2014-09, Revenue from Contracts with Customers, on January 1, 2018.
Deferred Income Taxes
Deferred tax assets and liabilities are determined based on temporary differences between financial reporting and the tax bases of assets and liabilities. Deferred tax assets are also recognized for tax net operating loss carryforwards. These deferred tax assets and liabilities are measured using the enacted tax rates and laws that are expected to be in effect when such amounts are expected to reverse or be utilized. The realization of total deferred tax assets is contingent upon the generation of future taxable income. Valuation allowances are provided to reduce such deferred tax assets to amounts more likely than not to be ultimately realized. See Note 7 for additional information.
Stock-based Compensation
Employee stock-based compensation expense is based on the following: (1) the grant date fair value of stock option awards granted or modified after January 1, 2006, and (2) the fair value of the Company’s common stock as of the grant date for restricted stock units (RSUs) and performance stock units (PSUs).
The Company estimates the fair value of stock options granted using the Black-Scholes option pricing model. The Company currently uses the simplified method in developing an estimate of expected term of stock options. The expected term represents the period that stock-based awards are expected to be outstanding, giving consideration to the contractual terms of the stock-based awards, vesting schedules and expectations of future employee behavior as influenced by changes to the terms of the Company’s stock-based awards. Prior to 2016, the computation of expected volatility was based on a combination of the historical and implied volatility of comparable companies from a representative peer group based on industry and market capitalization data, as well as the Company’s own historical volatility. Beginning in 2016, the Company began to base expected volatility on its own historical volatility, as it had sufficient exercise history to do so. The Company includes a dividend yield in its Black-Scholes option pricing model to reflect the anticipated dividends to be paid over the expected term of the awards.
The Company expenses RSUs over the performance period based on the fair market value of the awards at the date of grant.
The Company expenses PSUs based on the fair market value of the awards on the date of grant and the number of shares ultimately expected to vest at the end of each performance period, ratably over the each of the performance periods. Each PSU award consisted of two vesting cliffs. Sixty percent of each award vested on January 1, 2016 and forty percent vested on January 1, 2018. Depending on performance against the target metrics, vesting could be between 0% and 140%. The actual number of shares of common stock issued were determined on each vesting cliff date based on actual performance results against the target metrics. For PSUs, the Company re-assessed the probability of achieving the target metrics at the end of each reporting period and adjusted the recognition of expense accordingly.
F-13
FINANCIAL ENGINES, INC. AND SUBSIDIARIES
NOTES TO THE CONSOLIDATED FINANCIAL STATEMENTS — (Continued)
The Company’s stock-based compensation instruments are accounted for as equity awards as the settlement is in shares of the Company’s common stock. The Company amortizes stock-based compensation expense using a graded vesting method over the requisite service periods of the awards, which is generally the vesting period. Management estimates expected forfeitures and recognizes compensation costs only for those stock-based awards expected to vest. Amortization of stock-based compensation is presented in the same line item as the cash compensation to those employees in the accompanying Consolidated Statements of Income.
The Company’s current practice is to issue new shares to settle stock option exercises and on vesting of RSUs and PSUs.
Net Income per Common Share
Basic net income per common share is computed by dividing net income attributable to common stockholders by the weighted average number of common shares outstanding during the period less the weighted average number of common shares repurchased by the Company during the period. Diluted net income per common share is computed by giving effect to all dilutive potential common shares, including options, RSUs, and PSUs. Repurchased shares are held as treasury stock and outstanding shares used to calculate earnings per share have been reduced by the weighted number of repurchased shares.
Recently Adopted Accounting Standards
On March 30, 2016, FASB issued ASU No. 2016-09, Compensation-Stock Compensation (Topic 718): Improvement to Employee Share-Based Payment Accounting. The new standard: (a) requires all income tax effects of awards to be recognized in the income statement when the awards vest or are settled, (b) requires classification of excess tax benefits as an operating activity in the statement of cash flows rather than a financing activity, (c) eliminates the requirement to defer recognition of an excess tax benefit until the benefit is realized through a reduction to taxes payable, (d) modifies statutory withholding tax requirements, and (e) provides for a policy election to account for forfeitures as they occur. The Company adopted the new standard on January 1, 2017.
As a result of the adoption of the new standard, the Company recorded all income tax effects of share-based awards in its provision for income taxes in its Consolidated Statements of Income for the year ended December 31, 2017. On January 1, 2017, the Company also recorded a cumulative effect adjustment of $24.4 million as an increase of retained earnings on the Company’s Consolidated Balance Sheet, which included an increase to deferred tax assets of approximately $27.1 million related primarily to the recognition of excess tax benefits from stock-based compensation. Upon adoption, the Company elected to account for forfeitures as they occur, which may cause the timing of its non-cash stock-based compensation expense to be more volatile. Additionally, the Company adopted the change in presentation in the Consolidated Statements of Cash Flows related to excess tax benefits on a retrospective basis. The Consolidated Statement of Cash Flows for the year ended December 31, 2015 and 2016 were adjusted as follows: a $25.1 million and an $18.4 million increase to net cash provided by operating activities and a $25.1 million and an $18.4 million increase to net cash used in financing activities, respectively. There was no impact for the change in presentation in the statement of cash flows related to statutory tax withholding requirements because the Company had historically classified the statutory tax withholding as a financing activity in its Consolidated Statements of Cash Flows.
In October 2016, FASB issued ASU No. 2016-16, Income Taxes (Topic 740): Intra-Entity Transfer of Assets Other than Inventory (ASU 2016-16), which requires the recognition of the income tax consequences of an intra-entity transfer of an asset, other than inventory, when the transfer occurs. The Company early adopted the new standard as of January 1, 2017. The cumulative impact of applying this guidance to retained earnings was a decrease of approximately $1.1 million.
F-14
FINANCIAL ENGINES, INC. AND SUBSIDIARIES
NOTES TO THE CONSOLIDATED FINANCIAL STATEMENTS — (Continued)
Cash and Cash Equivalents
Cash and cash equivalents consist of the following:
|
|
|
December 31, |
|
|||||
|
|
|
2016 |
|
|
2017 |
|
||
|
|
|
(In thousands) |
|
|||||
|
Cash |
|
$ |
84,169 |
|
|
$ |
8,971 |
|
|
Money market fund(1) |
|
|
50,077 |
|
|
|
215,572 |
|
|
Total cash and cash equivalents |
|
$ |
134,246 |
|
|
$ |
224,543 |
|
|
(1) |
Effective August 2017, the Company implemented a sweep money market account which reduces most of its cash account balances to zero at the end of each business day. |
Property and Equipment
Property and equipment consist of the following:
|
|
|
December 31, |
|
|||||
|
|
|
2016 |
|
|
2017 |
|
||
|
|
|
(In thousands) |
|
|||||
|
Computer equipment |
|
$ |
13,220 |
|
|
$ |
14,049 |
|
|
Computer software |
|
|
4,279 |
|
|
|
4,034 |
|
|
Furniture, fixtures and equipment |
|
|
13,641 |
|
|
|
16,083 |
|
|
Leasehold improvements |
|
|
20,083 |
|
|
|
25,372 |
|
|
Total property and equipment |
|
|
51,223 |
|
|
|
59,538 |
|
|
Less: Accumulated depreciation and amortization |
|
|
(26,691 |
) |
|
|
(33,658 |
) |
|
Property and equipment, net |
|
$ |
24,532 |
|
|
$ |
25,880 |
|
Depreciation and amortization expense was $6.1 million, $8.9 million and $8.5 million for the years ended December 31, 2015, 2016 and 2017, respectively. Included in property and equipment as of December 31, 2016 and 2017 are assets acquired under capital lease obligations with original costs of $0.7 million and $0.5 million, respectively. Accumulated depreciation on capital lease assets was $0.4 million and $0.2 million as of December 31, 2016 and 2017, respectively. For the years ended December 31, 2016 and 2017, disposed property and equipment were immaterial.
Goodwill and Intangible Assets
Goodwill as of December 31, 2016 and 2017 consisted of the following:
|
(In thousands) |
|
|
|
|
|
Balance as of December 31, 2015 |
|
$ |
- |
|
|
The Mutual Fund Store acquisition |
|
|
293,720 |
|
|
2016 franchise acquisitions |
|
|
18,300 |
|
|
Balance as of December 31, 2016 and 2017(1) |
|
$ |
312,020 |
|
|
(1) |
There is no accumulated impairment of goodwill for the periods presented. There were no adjustments to goodwill for the year ended December 31, 2017. |
F-15
FINANCIAL ENGINES, INC. AND SUBSIDIARIES
NOTES TO THE CONSOLIDATED FINANCIAL STATEMENTS — (Continued)
Intangible assets as of December 31, 2016 and 2017 consisted of the following:
|
|
|
|
|
|
|
December 31, 2016 |
|
|
December 31, 2017 |
|
||||||||||||||||||
|
|
|
|
|
|
|
(In thousands) |
|
|||||||||||||||||||||
|
|
|
Useful Life (years) |
|
|
Gross Carrying Amount |
|
|
Accumulated Amortization |
|
|
Net Carrying Amount |
|
|
Gross Carrying Amount |
|
|
Accumulated Amortization |
|
|
Net Carrying Amount |
|
|||||||
|
Customer relationships |
|
14 - 19 |
|
|
$ |
164,338 |
|
|
$ |
7,781 |
|
|
$ |
156,557 |
|
|
$ |
164,338 |
|
|
$ |
16,675 |
|
|
$ |
147,663 |
|
|
|
Franchise agreements and reacquired franchisee rights |
|
1 - 9 |
|
|
|
2,697 |
|
|
|
498 |
|
|
|
2,199 |
|
|
|
2,697 |
|
|
|
787 |
|
|
|
1,910 |
|
|
|
Favorable leases, net |
|
|
6 |
|
|
|
140 |
|
|
|
22 |
|
|
|
118 |
|
|
|
140 |
|
|
|
46 |
|
|
|
94 |
|
|
Trademarks/Trade names |
|
|
20 |
|
|
|
39,230 |
|
|
|
1,810 |
|
|
|
37,420 |
|
|
|
39,230 |
|
|
|
3,785 |
|
|
|
35,445 |
|
|
Internal use software |
|
2 - 4 |
|
|
|
60,965 |
|
|
|
51,508 |
|
|
|
9,457 |
|
|
|
58,359 |
|
|
|
45,426 |
|
|
|
12,933 |
|
|
|
Total |
|
|
|
|
|
$ |
267,370 |
|
|
$ |
61,619 |
|
|
$ |
205,751 |
|
|
$ |
264,764 |
|
|
$ |
66,719 |
|
|
$ |
198,045 |
|
Impairments to intangible assets were immaterial for the years ended December 31, 2016 and 2017.
Amortization expense related to intangible assets was as follows:
|
|
Year Ended December 31, |
|
|||||
|
|
2016 |
|
|
2017 |
|
||
|
|
(In thousands) |
|
|||||
|
Customer relationships |
$ |
7,781 |
|
|
$ |
8,894 |
|
|
Franchise agreements and reacquired franchisee rights |
|
498 |
|
|
|
289 |
|
|
Favorable leases, net |
|
22 |
|
|
|
24 |
|
|
Trademarks/Trade names |
|
1,810 |
|
|
|
1,975 |
|
|
Internal use software(1) |
|
5,297 |
|
|
|
5,846 |
|
|
Amortization expense |
$ |
15,408 |
|
|
$ |
17,028 |
|
|
(1) |
For the year ended December 31, 2016 and 2017, internal use software amortization included approximately $0.5 million and $0.6 million of stock-based compensation expense, respectively. |
The following table presents the estimated future amortization of intangible assets as of December 31, 2017:
|
(In thousands) |
|
|
|
|
|
Years ending December 31: |
|
|
|
|
|
2018 |
|
$ |
16,910 |
|
|
2019 |
|
|
14,957 |
|
|
2020 |
|
|
14,080 |
|
|
2021 |
|
|
11,552 |
|
|
2022 |
|
|
11,102 |
|
|
Thereafter |
|
|
129,444 |
|
|
|
|
$ |
198,045 |
|
F-16
FINANCIAL ENGINES, INC. AND SUBSIDIARIES
NOTES TO THE CONSOLIDATED FINANCIAL STATEMENTS — (Continued)
Accounts payable consists of the following:
|
|
|
December 31, |
|
|||||
|
|
|
2016 |
|
|
2017 |
|
||
|
|
|
(In thousands) |
|
|||||
|
Data connectivity fees payable |
|
$ |
28,731 |
|
|
$ |
23,489 |
|
|
Trade accounts payable |
|
|
4,654 |
|
|
|
5,210 |
|
|
Other |
|
|
3,395 |
|
|
|
1,294 |
|
|
Total accounts payable |
|
$ |
36,780 |
|
|
$ |
29,993 |
|
Accrued Compensation
Accrued compensation consists of the following:
|
|
|
December 31, |
|
|||||
|
|
|
2016 |
|
|
2017 |
|
||
|
|
|
(In thousands) |
|
|||||
|
Accrued bonus |
|
$ |
20,028 |
|
|
$ |
22,558 |
|
|
Accrued vacation(1) |
|
|
4,099 |
|
|
|
364 |
|
|
Accrued payroll(2) |
|
|
1,465 |
|
|
|
3,144 |
|
|
Other |
|
|
2,075 |
|
|
|
2,453 |
|
|
Total accrued compensation |
|
$ |
27,667 |
|
|
$ |
28,519 |
|
|
(1) |
The Company incurred cash payments totaling approximately $3.9 million in January 2017 associated with a change to its paid time off program for exempt employees as of January 1, 2017. |
|
(2) |
For the year ended December 31, 2017, accrued payroll includes $2.6 million of severance expense payable related to restructuring activities. |
Other Current Liabilities
Other current liabilities consist of the following:
|
|
|
December 31, |
|
|||||
|
|
|
2016 |
|
|
2017 |
|
||
|
|
|
(In thousands) |
|
|||||
|
Short term deferred rent |
|
$ |
1,361 |
|
|
$ |
2,264 |
|
|
Short term holdbacks and earnouts |
|
|
2,873 |
|
|
|
50 |
|
|
Other |
|
|
109 |
|
|
|
143 |
|
|
Total other current liabilities |
|
$ |
4,343 |
|
|
$ |
2,457 |
|
NOTE 4 — Business Combinations
Acquisition of The Mutual Fund Store and Franchises
On February 1, 2016, the Company completed the acquisition of The Mutual Fund Store pursuant to an Agreement and Plan of Mergers, dated November 5, 2015, as amended. In addition, The Mutual Fund Store franchised certain of its stores, and twenty-one franchises were in operation at the time of the acquisition. Beginning in April 2016 and ending in October 2016, the Company acquired all of the franchised stores and as a result, after October 2016 all stores were company-owned. The acquisition enabled the Company to expand its independent advisory services to defined contribution participants through comprehensive financial planning and the option to meet face-to-face with a dedicated financial advisor.
F-17
FINANCIAL ENGINES, INC. AND SUBSIDIARIES
NOTES TO THE CONSOLIDATED FINANCIAL STATEMENTS — (Continued)
For the year ended December 31, 2016, the Company paid total consideration of $548.4 million related to acquisitions, including $274.6 million of cash consideration, net of holdbacks. The assets acquired consisted primarily of customer relationships, trade names and trademarks, reacquired franchisee rights and accounts receivable. The purchase price allocations for these acquisitions resulted in $312.0 million of goodwill. The Company incurred transaction costs related to acquisitions of $2.7 million and $6.6 million for the year ended December 31, 2015 and 2016, respectively.
NOTE 5 — Stockholders’ Equity
Common Stock
As of December 31, 2017, there were 500,000,000 shares of common stock authorized, 64,725,439 shares issued and 63,048,801 shares outstanding. Common stockholders are entitled to dividends if and when declared by the Board of Directors.
Cash Dividends
For the year ended December 31, 2017, the Board of Directors declared quarterly cash dividends totaling $0.28 per share annually of common stock outstanding. On February 14, 2018 the Board of Directors declared a quarterly dividend of $0.08 per share to be paid on April 5, 2018 to record-holders as of March 22, 2018. While the Company currently expects to pay comparable cash dividends on a quarterly basis in the future, any future determination with respect to the declaration and payment of dividends will be at the discretion of the Board of Directors. As of December 31, 2017, the Company had a dividend payable balance of $4.4 million, which was paid to stockholders in January 2018.
Stock Repurchase Program
On October 24, 2017, the Board of Directors approved a stock repurchase program of up to $60.0 million of the Company’s common stock over a twelve-month period of which $10.8 million has been utilized as of December 31, 2017. The approximate dollar value of shares that may yet be purchased under the repurchase program is $49.2 million. Any share repurchases may be made through open market and privately negotiated transactions, at times and in such amounts as management deems appropriate, and may or may not be made pursuant to one or more Rule 10b5-1 trading plans adopted in accordance with Rule 10b5-1 of the Securities Exchange Act of 1934. The timing and amount of any shares repurchased will depend on a variety of factors, including stock price, market conditions, corporate and regulatory requirements (including applicable securities laws and regulations and the rules of The NASDAQ Stock Market), any additional constraints related to material inside information the Company may possess, and capital availability. The Company has no commitment to make any repurchases. The stock repurchase program may be modified, extended or terminated by the Board of Directors at any time and there is no guarantee as to the exact number of shares, if any, that will be repurchased under the program. The stock repurchase program is expected to be funded by available working capital.
F-18
FINANCIAL ENGINES, INC. AND SUBSIDIARIES
NOTES TO THE CONSOLIDATED FINANCIAL STATEMENTS — (Continued)
The repurchases were recorded as treasury stock and resulted in a reduction of stockholders’ equity. The Company repurchased shares of its common stock in the open market during the periods presented as follows:
|
|
|
Total Number of Shares Purchased |
|
|
Average Repurchase Price Per Share |
|
|
Amount |
|
|||
|
Year ended December 31, 2015: |
|
|
|
|
|
|
|
|
|
(In thousands) |
|
|
|
Third quarter |
|
|
344,000 |
|
|
$ |
32.43 |
|
|
$ |
11,154 |
|
|
Second quarter |
|
|
378,000 |
|
|
$ |
42.29 |
|
|
$ |
15,984 |
|
|
First quarter |
|
|
275,000 |
|
|
$ |
41.15 |
|
|
$ |
11,317 |
|
|
Total |
|
|
997,000 |
|
|
|
|
|
|
$ |
38,455 |
|
|
|
|
|
|
|
|
|
|
|
|
|
|
|
|
|
|
Total Number of Shares Purchased |
|
|
Average Repurchase Price Per Share |
|
|
Amount |
|
|||
|
Year ended December 31, 2017: |
|
|
|
|
|
|
|
|
|
(In thousands) |
|
|
|
Fourth quarter |
|
|
399,638 |
|
|
$ |
27.02 |
|
|
$ |
10,800 |
|
Common Stock Reserved for Future Issuance
As of December 31, 2017, the Company has reserved the following shares of common stock for issuance in connection with:
|
Stock options outstanding |
|
|
4,635,510 |
|
|
Restricted stock units outstanding |
|
|
2,390,910 |
|
|
Performance stock units outstanding |
|
|
81,160 |
|
|
Stock awards available for grant |
|
|
5,476,488 |
|
|
Total shares reserved |
|
|
12,584,068 |
|
Stock Plans
1998 Stock Plan
The 1998 Stock Plan expired in April 2010. The Company has reserved a total of 305,155 shares of its common stock for issuance under its 1998 Stock Plan related to options granted prior to the initial public offering. Under the 1998 Stock Plan, the Board of Directors granted stock purchase rights and incentive and non-statutory stock options to employees, consultants and directors at fair market value on the date of grant. Vesting provisions of stock purchase rights and options granted under the 1998 Stock Plan were determined by the Board of Directors. Stock purchase rights have a 30-day expiration period and options expire no later than 10 years from the date of grant. In the event of voluntary or involuntary termination of employment with the Company, with or without cause, typically all unvested options are forfeited and all vested options must be exercised within three months or they are forfeited.
2009 Stock Incentive Plan
The Company has reserved a total of 6,802,425 shares of its common stock for issuance under its Amended and Restated 2009 Stock Incentive Plan (the 2009 Stock Incentive Plan).
In February 2013, the Board of Directors amended and restated the 2009 Stock Incentive Plan and approved the 2013-2017 Long-Term Incentive Program (the LTIP) thereunder, which was subsequently approved by stockholders in May 2013. Under the LTIP, the Company may grant performance stock unit (PSUs) awards based on objective performance criteria pre-established by the Compensation Committee of the Board of Directors.
F-19
FINANCIAL ENGINES, INC. AND SUBSIDIARIES
NOTES TO THE CONSOLIDATED FINANCIAL STATEMENTS — (Continued)
Under the 2009 Stock Incentive Plan, the Board of Directors may grant restricted stock awards, RSUs, PSUs, stock appreciation rights and incentive and non-statutory stock options to employees, consultants and directors at fair market value on the date of grant. Vesting provisions of equity awards granted under the 2009 Stock Incentive Plan are determined by the Board of Directors. Options granted will generally vest over a period of four years with 25% vesting on the first anniversary of the grant date and 1/48 vesting per month thereafter.
Options expire no later than 10 years from the date of grant. RSUs will vest according to the terms of the award on the date of the grant, which is typically a period of four years with 25% of the shares vesting on each anniversary after the grant date. Restricted stock and PSUs awarded will vest according to the terms of the award on the date of the grant.
For PSUs granted for the years ended December 31, 2013 and 2014, each PSU award consisted of two vesting cliffs. Sixty percent of each award vested on January 1, 2016 and 40% vested on January 1, 2018. Depending on performance against the target metrics, vesting could be between 0% and 140%. On a quarterly basis, the estimated probability of achieving the objective performance criteria was re-evaluated by management and the expense was adjusted accordingly at the end of each balance sheet period. The number of shares of the Company’s common stock issued to the award recipients at the end of each of the PSU vesting periods was based on actual achievement results.
Options, RSUs and PSUs carry neither voting rights nor rights to dividends.
In the event of voluntary or involuntary termination of employment with the Company, with or without cause, typically all unvested options, RSUs and PSUs are forfeited and all vested options must be exercised within three months or they are forfeited. Certain awards under the 2009 Stock Incentive Plan also provide for partial acceleration in the event of involuntary termination within 12 months of a change of control event, death, or total and permanent disability.
In February 2016, the Board of Directors approved an executive severance and change in control policy for the Company’s executive officers, which provides that the executive officers may receive 100% accelerated vesting of outstanding equity awards and extended exercise rights for outstanding stock option awards, subject to severance and change in control conditions and contingent upon the execution by the executive officer of a full release of claims against the Company and any of its affiliates. The change in control provisions apply to the equity awards made to the Company’s executive officers under the 2009 Stock Incentive Plan on May 20, 2016.
Upon vesting, RSUs and PSUs are settled in common stock on a one-for-one basis. Upon vesting of the RSUs and PSUs, the Company typically withholds shares that would otherwise be distributed to the employee when the RSUs and PSUs are settled having a fair market value equal to the amount necessary to satisfy minimum tax withholding obligations, which the Company will remit from operational cash.
As of December 31, 2017, no shares were subject to repurchase and 5,476,488 shares were available for future grant. The 2009 Stock Incentive Plan expires in March 2026.
F-20
FINANCIAL ENGINES, INC. AND SUBSIDIARIES
NOTES TO THE CONSOLIDATED FINANCIAL STATEMENTS — (Continued)
The following table summarizes option activity under the 1998 Stock Plan and the 2009 Stock Incentive Plan:
|
|
|
Number of Options |
|
|
Weighted Average Exercise Price |
|
|
Weighted Average Remaining Term |
|
|
Aggregate Intrinsic Value |
|
||||
|
Balance, January 1, 2015 |
|
|
4,148,998 |
|
|
$ |
27.73 |
|
|
|
|
|
|
|
|
|
|
Granted |
|
|
1,115,109 |
|
|
|
37.30 |
|
|
|
|
|
|
|
|
|
|
Exercised |
|
|
(546,511 |
) |
|
|
16.86 |
|
|
|
|
|
|
|
|
|
|
Forfeited |
|
|
(317,781 |
) |
|
|
39.63 |
|
|
|
|
|
|
|
|
|
|
Balance, December 31, 2015 |
|
|
4,399,815 |
|
|
|
30.65 |
|
|
|
|
|
|
|
|
|
|
Granted |
|
|
1,831,432 |
|
|
|
27.05 |
|
|
|
|
|
|
|
|
|
|
Exercised |
|
|
(404,208 |
) |
|
|
16.39 |
|
|
|
|
|
|
|
|
|
|
Forfeited |
|
|
(369,946 |
) |
|
|
36.96 |
|
|
|
|
|
|
|
|
|
|
Balance, December 31, 2016 |
|
|
5,457,093 |
|
|
|
30.07 |
|
|
|
|
|
|
|
|
|
|
Granted |
|
|
804,231 |
|
|
|
40.96 |
|
|
|
|
|
|
|
|
|
|
Exercised |
|
|
(933,245 |
) |
|
|
24.03 |
|
|
|
|
|
|
|
|
|
|
Forfeited |
|
|
(692,569 |
) |
|
|
35.45 |
|
|
|
|
|
|
|
|
|
|
Balance, December 31, 2017 |
|
|
4,635,510 |
|
|
$ |
32.37 |
|
|
|
6.62 |
|
|
$ |
13,915,173 |
|
|
Vested and expected to vest, December 31, 2017 |
|
|
4,635,510 |
|
|
$ |
32.37 |
|
|
|
6.62 |
|
|
$ |
13,915,173 |
|
|
Exercisable, December 31, 2017 |
|
|
2,616,627 |
|
|
$ |
30.95 |
|
|
|
5.40 |
|
|
$ |
11,208,649 |
|
The aggregate intrinsic values in the table above represent the total pre-tax intrinsic value (the aggregate difference between the fair value of the Company’s common stock on December 31, 2017 of $30.30, and the exercise price of in-the-money options) that would have been received by the option holders had all option holders exercised their options as of that date. The total intrinsic value of options exercised during the years ended December 31, 2015, 2016 and 2017 was $12.9 million, $6.2 million and $16.0 million, respectively. The weighted average fair value per share of options granted to employees for the years ended December 31, 2015, 2016 and 2017 was approximately $13.17, $10.35 and $15.24, respectively. Total cash received from employees as a result of employee stock option exercises for the years ended December 31, 2015, 2016 and 2017 was $9.2 million, $6.6 million and $22.4 million, respectively. The total grant-date fair value of the shares vested during the years ended December 31, 2015, 2016 and 2017 was $11.2 million, $11.2 million and $13.9 million, respectively.
As of December 31, 2017, there was $11.3 million of unrecognized compensation cost related to unvested stock options, to be recognized over the weighted average remaining requisite service period of 1.2 years.
The following weighted average assumptions were used to value options granted:
|
|
|
2015 |
|
|
2016 |
|
|
2017 |
|
|
Expected life in years |
|
6 |
|
|
6 |
|
|
6 |
|
|
Risk-free interest rate |
|
1.72% |
|
|
1.42% |
|
|
2.05% |
|
|
Volatility |
|
37% |
|
|
43% |
|
|
38% |
|
|
Dividend yield |
|
0.8% |
|
|
1.0% |
|
|
0.7% |
|
F-21
FINANCIAL ENGINES, INC. AND SUBSIDIARIES
NOTES TO THE CONSOLIDATED FINANCIAL STATEMENTS — (Continued)
Restricted Stock Units Information
The following table summarizes RSU activity under the 2009 Stock Incentive Plan:
|
|
|
Number of Shares |
|
|
Weighted Average Grant-Date Fair Value |
|
|
Weighted Average Remaining Term |
|
Aggregate Intrinsic Value |
|
|||
|
Balance, January 1, 2015 |
|
|
844,722 |
|
|
$ |
36.38 |
|
|
|
|
|
|
|
|
Granted |
|
|
363,388 |
|
|
|
36.23 |
|
|
|
|
|
|
|
|
Vested and settled (1) |
|
|
(302,617 |
) |
|
|
34.90 |
|
|
|
|
|
|
|
|
Forfeited |
|
|
(90,676 |
) |
|
|
37.06 |
|
|
|
|
|
|
|
|
Balance, December 31, 2015 |
|
|
814,817 |
|
|
|
36.78 |
|
|
|
|
|
|
|
|
Granted |
|
|
1,156,344 |
|
|
|
27.28 |
|
|
|
|
|
|
|
|
Vested and settled (1) |
|
|
(278,700 |
) |
|
|
36.15 |
|
|
|
|
|
|
|
|
Forfeited |
|
|
(95,140 |
) |
|
|
34.36 |
|
|
|
|
|
|
|
|
Balance, December 31, 2016 |
|
|
1,597,321 |
|
|
|
30.16 |
|
|
|
|
|
|
|
|
Granted |
|
|
1,511,078 |
|
|
|
36.03 |
|
|
|
|
|
|
|
|
Vested and settled (1) |
|
|
(473,569 |
) |
|
|
31.95 |
|
|
|
|
|
|
|
|
Forfeited |
|
|
(243,920 |
) |
|
|
33.15 |
|
|
|
|
|
|
|
|
Balance, December 31, 2017 |
|
|
2,390,910 |
|
|
$ |
33.21 |
|
|
1.72 |
|
$ |
72,444,573 |
|
|
Expected to vest, December 31, 2017 |
|
|
2,390,910 |
|
|
$ |
33.21 |
|
|
1.72 |
|
$ |
72,444,573 |
|
|
(1) |
Vested and settled for the years ended December 31, 2015, 2016 and 2017 includes 100,337 shares, 104,109 shares and 157,196 shares, respectively, which were tendered in exchange for minimum tax withholdings. |
The aggregate intrinsic values in the table above represent the total pre-tax intrinsic value (using the fair value of the Company’s common stock on December 31, 2017 of $30.30). As of December 31, 2017, the aggregate intrinsic value of unvested RSUs was $72.4 million. The total intrinsic value of RSUs vested and settled during the years ended December 31, 2015, 2016 and 2017 was $10.8 million, $9.0 million and $17.1 million, respectively. The total grant-date fair value of shares vested during the years ended December 31, 2015, 2016 and 2017 was $10.6 million, $10.1 million and $15.1 million, respectively.
As of December 31, 2017, there was $48.4 million of unrecognized compensation cost related to restricted stock purchase rights to be recognized over the weighted average remaining requisite service period of 1.7 years.
F-22
FINANCIAL ENGINES, INC. AND SUBSIDIARIES
NOTES TO THE CONSOLIDATED FINANCIAL STATEMENTS — (Continued)
Performance Stock Units Information
During the years ended December 31, 2013 and 2014, the Compensation Committee of the Board of Directors granted PSUs to certain executives.
The following table summarizes unvested PSU activity under the 2009 Stock Incentive Plan:
|
|
|
Number of Shares |
|
|
Weighted Average Grant-Date Fair Value |
|
|
Weighted Average Remaining Term |
|
Aggregate Intrinsic Value |
|
|||
|
Balance, January 1, 2015 |
|
|
292,000 |
|
|
$ |
43.32 |
|
|
|
|
|
|
|
|
Granted |
|
|
- |
|
|
|
- |
|
|
|
|
|
|
|
|
Vested and settled |
|
|
- |
|
|
|
- |
|
|
|
|
|
|
|
|
Forfeited |
|
|
- |
|
|
|
- |
|
|
|
|
|
|
|
|
Balance, December 31, 2015 |
|
|
292,000 |
|
|
|
43.32 |
|
|
|
|
|
|
|
|
Granted |
|
|
- |
|
|
|
- |
|
|
|
|
|
|
|
|
Vested and settled |
|
|
(38,797 |
) |
|
|
43.32 |
|
|
|
|
|
|
|
|
Forfeited |
|
|
(148,123 |
) |
|
|
43.27 |
|
|
|
|
|
|
|
|
Balance, December 31, 2016 |
|
|
105,080 |
|
|
|
43.39 |
|
|
|
|
|
|
|
|
Granted |
|
|
- |
|
|
|
- |
|
|
|
|
|
|
|
|
Vested and settled |
|
|
- |
|
|
|
- |
|
|
|
|
|
|
|
|
Forfeited |
|
|
(23,920 |
) |
|
|
43.16 |
|
|
|
|
|
|
|
|
Balance, December 31, 2017 |
|
|
81,160 |
|
|
$ |
43.46 |
|
|
0.0 |
|
$ |
2,459,148 |
|
|
Expected to vest, December 31, 2017 |
|
|
20,488 |
|
|
$ |
43.46 |
|
|
0.0 |
|
$ |
620,786 |
|
The aggregate intrinsic values in the table above represent the total pre-tax intrinsic value (using the fair value of the Company’s common stock on December 31, 2017 of $30.30).
As of December 31, 2017, of the remaining unrecognized compensation cost was immaterial and the remaining requisite service period for PSUs ended January 1, 2018. On January 1, 2016, performance achievement for the December 31, 2015 performance metrics that were probable of achievement resulted in 38,797 shares issued to certain executives in February 2016. On January 1, 2018, performance achievement for the December 31, 2017 performance metrics that were probable of achievement resulted in 20,488 shares issued to certain executives in February 2018.
Stock-based Compensation
The following table summarizes the stock-based compensation by functional area:
|
|
|
Year Ended December 31, |
|
|||||||||
|
|
|
2015 |
|
|
2016 |
|
|
2017 |
|
|||
|
|
|
(In thousands) |
|
|||||||||
|
Stock-based compensation: |
|
|
|
|
|
|
|
|
|
|
|
|
|
Cost of revenue |
|
$ |
4,501 |
|
|
$ |
7,974 |
|
|
$ |
10,225 |
|
|
Research and development |
|
|
5,631 |
|
|
|
6,012 |
|
|
|
7,575 |
|
|
Sales and marketing |
|
|
7,643 |
|
|
|
9,610 |
|
|
|
8,355 |
|
|
General and administrative |
|
|
7,918 |
|
|
|
9,604 |
|
|
|
9,703 |
|
|
Amortization of intangible assets |
|
|
335 |
|
|
|
489 |
|
|
|
567 |
|
|
Total stock-based compensation |
|
$ |
26,028 |
|
|
$ |
33,689 |
|
|
$ |
36,425 |
|
Recognized income tax benefit on stock-based compensation included with income tax expense for the years ended December 31, 2015, 2016 and 2017 was $10.5 million, $13.4 million and $10.2 million, respectively.
F-23
FINANCIAL ENGINES, INC. AND SUBSIDIARIES
NOTES TO THE CONSOLIDATED FINANCIAL STATEMENTS — (Continued)
On January 1, 2017, the Company adopted ASU No. ASU 2016-09, Compensation – Stock Compensation (Topic 718): Improvements to Employee Share-Based Payment Accounting and elected to account for forfeitures as they occur, which may cause the timing of stock-based compensation expense to be more volatile.
NOTE 6 — Net Income Per Common Share
The following table sets forth the computation of basic and diluted net income per share attributable to holders of common stock:
|
|
|
Year Ended December 31, |
|
|||||||||
|
|
|
2015 |
|
|
2016 |
|
|
2017 |
|
|||
|
|
|
(In thousands, except per share data) |
|
|||||||||
|
Numerator (basic and diluted): |
|
|
|
|
|
|
|
|
|
|
|
|
|
Net income |
|
$ |
31,617 |
|
|
$ |
28,560 |
|
|
$ |
46,660 |
|
|
Denominator (basic): |
|
|
|
|
|
|
|
|
|
|
|
|
|
Weighted average common shares outstanding |
|
|
51,732 |
|
|
|
60,962 |
|
|
|
62,952 |
|
|
Denominator (diluted): |
|
|
|
|
|
|
|
|
|
|
|
|
|
Weighted average common shares outstanding |
|
|
51,732 |
|
|
|
60,962 |
|
|
|
62,952 |
|
|
Dilutive stock options outstanding |
|
|
903 |
|
|
|
602 |
|
|
|
808 |
|
|
Dilutive unvested restricted stock units |
|
|
374 |
|
|
|
524 |
|
|
|
827 |
|
|
Dilutive unvested performance stock units |
|
|
30 |
|
|
|
15 |
|
|
|
18 |
|
|
Net weighted average common shares outstanding |
|
|
53,039 |
|
|
|
62,103 |
|
|
|
64,605 |
|
|
Net income per share attributable to holders of common stock: |
|
|
|
|
|
|
|
|
|
|
|
|
|
Basic |
|
$ |
0.61 |
|
|
$ |
0.47 |
|
|
$ |
0.74 |
|
|
Diluted |
|
$ |
0.60 |
|
|
$ |
0.46 |
|
|
$ |
0.72 |
|
Diluted net income per share does not include the effect of the following anti-dilutive common equivalent shares:
|
|
|
Year Ended December 31, |
|
|||||||||
|
|
|
2015 |
|
|
2016 |
|
|
2017 |
|
|||
|
|
|
(In thousands) |
|
|||||||||
|
Stock options outstanding |
|
|
1,601 |
|
|
|
3,443 |
|
|
|
1,906 |
|
|
Restricted stock units outstanding |
|
|
32 |
|
|
|
72 |
|
|
|
65 |
|
|
Total anti-dilutive common equivalent shares |
|
|
1,633 |
|
|
|
3,515 |
|
|
|
1,971 |
|
On February 1, 2016, the Company issued 9,885,889 shares of its common stock as part of the consideration to acquire The Mutual Fund Store.
F-24
FINANCIAL ENGINES, INC. AND SUBSIDIARIES
NOTES TO THE CONSOLIDATED FINANCIAL STATEMENTS — (Continued)
The Company is subject to income taxes only in the United States. Provision for income tax expense consists of the following:
|
|
|
Year Ended December 31, |
|
|||||||||
|
|
|
2015 |
|
|
2016 |
|
|
2017 |
|
|||
|
|
|
(In thousands) |
|
|||||||||
|
Current expense: |
|
|
|
|
|
|
|
|
|
|
|
|
|
Federal |
|
$ |
24,995 |
|
|
$ |
19,580 |
|
|
$ |
1,534 |
|
|
State |
|
|
598 |
|
|
|
2,244 |
|
|
|
1,777 |
|
|
Total current |
|
|
25,593 |
|
|
|
21,824 |
|
|
|
3,311 |
|
|
Deferred expense: |
|
|
|
|
|
|
|
|
|
|
|
|
|
Federal |
|
|
(7,968 |
) |
|
|
(1,403 |
) |
|
|
34,532 |
|
|
State |
|
|
239 |
|
|
|
291 |
|
|
|
2,108 |
|
|
Total deferred |
|
|
(7,729 |
) |
|
|
(1,112 |
) |
|
|
36,640 |
|
|
Total provision for income taxes |
|
$ |
17,864 |
|
|
$ |
20,712 |
|
|
$ |
39,951 |
|
For the years ended December 31, 2015 and 2016, the Company's current income tax expense does not reflect the excess tax benefits of employee stock-based awards. For stock options, the Company receives an income tax benefit calculated as the tax effect of the difference between the fair market value of the stock issued at the time of the exercise and the exercise price. For RSUs, the Company receives an income tax benefit upon the award's vesting equal to the tax effect of the underlying stock's fair market value. For tax years ended December 31, 2015 and 2016, where an incremental excess tax benefit was realized as a reduction of income taxes payable, such excess tax benefit was recognized as an increase to additional paid-in capital. The realized excess tax benefits from employee stock-based awards transactions in the years ended December 31, 2015 and 2016 were $25.1 million and $18.4 million, respectively.
Beginning January 1, 2017, with the adoption of ASU No. 2016-09, Compensation - Stock Compensation (Topic 718): Improvement to Employee Share-Based Payment Accounting, all tax effects of employee stock-based awards are recorded within current and deferred tax expense.
The difference between income tax expense and the amount resulting from applying the federal statutory rate of 35% to net income is attributable to the following:
|
|
|
Year Ended December 31, |
|
|||||||||
|
|
|
2015 |
|
|
2016 |
|
|
2017 |
|
|||
|
Federal tax at statutory rate |
|
|
35.0 |
% |
|
|
35.0 |
% |
|
|
35.0 |
% |
|
State taxes, net of federal benefit |
|
|
1.4 |
% |
|
|
3.6 |
% |
|
|
4.1 |
% |
|
2017 Tax Act impacts |
|
|
0.0 |
% |
|
|
0.0 |
% |
|
|
8.8 |
% |
|
Nondeductible expenses |
|
|
0.2 |
% |
|
|
0.4 |
% |
|
|
0.2 |
% |
|
Stock-based compensation |
|
|
-0.2 |
% |
|
|
0.2 |
% |
|
|
0.0 |
% |
|
Research and development credit |
|
|
-0.3 |
% |
|
|
-0.3 |
% |
|
|
-1.4 |
% |
|
Change in valuation allowance |
|
|
0.0 |
% |
|
|
0.0 |
% |
|
|
-0.2 |
% |
|
Other |
|
|
0.0 |
% |
|
|
3.1 |
% |
|
|
-0.4 |
% |
|
Income tax expense |
|
|
36.1 |
% |
|
|
42.0 |
% |
|
|
46.1 |
% |
On December 22, 2017, the U.S. government enacted comprehensive tax legislation commonly referred to as the Tax Cuts and Jobs Act (the 2017 Tax Act). The Company has not completed its determination of the accounting implications of the 2017 Tax Act. However, it has reasonably estimated the effects of the 2017 Tax Act and recorded provisional amounts in the financial statements as of December 31, 2017. The Company recorded a provisional tax expense for the impact of the 2017 Tax Act of approximately $7.6 million. This amount is primarily comprised of the remeasurement of federal deferred tax assets resulting from the permanent reduction in the U.S. statutory corporate tax rate to 21% from 35%. As the Company completes its analysis of the 2017 Tax Act, collects
F-25
FINANCIAL ENGINES, INC. AND SUBSIDIARIES
NOTES TO THE CONSOLIDATED FINANCIAL STATEMENTS — (Continued)
and prepares necessary data, interprets any additional guidance issued by the U.S. Treasury Department, the IRS, and other standard-setting bodies, it may make adjustments to the provisional amounts.
For the year ended December 31, 2016, there was $1.5 million of income tax expense due to non-deductible transaction expenses related to acquisition activity included in the 3.1% in the table above. On January 1, 2017, the Company adopted ASU 2016-09, Compensation - Stock Compensation (Topic 718): Improvements to Employee Share-Based Payment Accounting, which requires excess tax benefits and deficiencies to be a component of income tax expense, and which increased volatility within the Company's provision for income taxes as the amount of excess tax benefits or deficiencies from stock-based compensation awards are dependent on the stock price at the date the awards vest. As a result, the Company's income tax expense and associated effective tax rate will be impacted by fluctuations in stock price between the grant dates and vesting dates of equity awards. For the year ended December 31, 2017, the net excess tax benefits from stock options decreased the effective tax rate by 2.3%.
The components of the Company’s deferred tax assets and liabilities are as follows:
|
|
|
December 31, |
|
|||||
|
|
|
2016 |
|
|
2017 |
|
||
|
|
|
(In thousands) |
|
|||||
|
Deferred tax assets: |
|
|
|
|
|
|
|
|
|
Net operating loss carryforwards |
|
$ |
14,046 |
|
|
$ |
11,321 |
|
|
Tax credits |
|
|
2,091 |
|
|
|
10,474 |
|
|
Deferred revenue |
|
|
98 |
|
|
|
73 |
|
|
Stock-based compensation |
|
|
23,763 |
|
|
|
17,942 |
|
|
Accrued expenses and reserves |
|
|
15,017 |
|
|
|
3,945 |
|
|
Total gross deferred tax assets |
|
|
55,015 |
|
|
|
43,755 |
|
|
Valuation allowance |
|
|
(162 |
) |
|
|
- |
|
|
Net deferred tax assets |
|
|
54,853 |
|
|
|
43,755 |
|
|
Deferred tax liabilities |
|
|
|
|
|
|
|
|
|
Fixed assets and intangible amortization |
|
|
(14,349 |
) |
|
|
(14,954 |
) |
|
Total deferred tax liabilities |
|
|
(14,349 |
) |
|
|
(14,954 |
) |
|
Net deferred tax assets |
|
$ |
40,504 |
|
|
$ |
28,801 |
|
The Company continuously evaluates additional facts representing positive and negative evidence in the determination of the realizability of the deferred tax assets. Upon evaluating the positive and negative evidence present at December 31, 2017, management concluded it was more likely than not that the benefit of its deferred tax assets will be realized.
As of December 31, 2017, the Company has net operating loss carryforwards for federal and state income tax purposes of approximately $39.3 million and $68.9 million, respectively, available to reduce future income subject to income taxes. The federal and state net operating loss carryforwards expire through 2036.
As of December 31, 2017, the Company has research credit carryforwards for federal and California income tax purposes of approximately $6.8 million and $8.6 million, respectively, available to reduce future income taxes. The federal research credit carryforwards expire through 2037. The California research credit carries forward indefinitely.
F-26
FINANCIAL ENGINES, INC. AND SUBSIDIARIES
NOTES TO THE CONSOLIDATED FINANCIAL STATEMENTS — (Continued)
A reconciliation of the beginning and ending balances of the total amounts of gross unrecognized tax benefits is as follows:
|
|
|
Year Ended December 31, |
|
|||||
|
|
|
2016 |
|
|
2017 |
|
||
|
|
|
(In thousands) |
|
|||||
|
Balance, beginning of year |
|
$ |
6,657 |
|
|
$ |
6,672 |
|
|
Reductions for tax positions taken in the prior year |
|
|
- |
|
|
|
- |
|
|
Additions for tax positions taken in the prior year |
|
|
- |
|
|
|
- |
|
|
Additions for tax positions taken in the current year |
|
|
15 |
|
|
|
281 |
|
|
Balance, end of year |
|
$ |
6,672 |
|
|
$ |
6,953 |
|
As of December 31, 2017, unrecognized tax benefits approximating $5.5 million would affect the effective tax rate if recognized. The Company does not anticipate adjustments to unrecognized tax benefits which would result in a material change to its financial position within the next twelve months.
The Company recognizes accrued interest and penalties related to unrecognized tax benefits as a component of income tax expense. During the years ended December 31, 2015, 2016 and 2017, the accrued interest and penalties were immaterial.
The Company is subject to income taxes in the U.S. federal jurisdiction and various state jurisdictions. All tax years since inception in the Company’s major jurisdictions are open due to loss carryforwards and may be subject to examination in one or more jurisdictions.
NOTE 8 — Savings Plan
The Company maintains a savings plan under Section 401(k) of the Internal Revenue Code. Under the plan, employees may contribute up to 75% of their pre-tax salaries per year, but not more than the statutory limits. The Company may, at its discretion, make matching contributions to the 401(k) Plan. For the years ended December 31, 2015, 2016 and 2017 the Company made matching contributions of 100% of employee contributions up to 4% of salary (including commissions), which totaled $2.3 million, $3.7 million and $4.3 million, respectively.
NOTE 9 — Commitments and Contingencies
Commitments
The Company leases its facilities under non-cancelable operating leases expiring at various dates through the year 2027.
The Company classifies tenant improvement allowances in its Consolidated Balance Sheets under deferred rent and amortizes them on a straight-line basis over the related lease period. Tenant improvement allowance activity is presented as part of cash flows from operating activities in the accompanying Consolidated Statements of Cash Flows.
Certain of the Company’s facility leases provide for a free rent period or escalating rent payments and, accordingly, the Company has straight-lined the rental payments over the respective lease terms. As of December 31, 2016 and 2017, deferred rent was $13.6 million and $13.0 million, respectively. Rent expense for all operating leases totaled approximately $3.9 million, $8.3 million and $9.0 million for the years ended December 31, 2015, 2016 and 2017, respectively.
In the years ended December 31, 2015, 2016 and 2017, the Company entered into various office equipment capital leases which terminate in between April 2019 and January 2022.
F-27
FINANCIAL ENGINES, INC. AND SUBSIDIARIES
NOTES TO THE CONSOLIDATED FINANCIAL STATEMENTS — (Continued)
The following table summarizes the Company’s contractual obligations as of December 31, 2017. Certain of these contractual obligations are reflected on the Company’s Consolidated Balance Sheets while others are disclosed as future obligations under GAAP. Purchase obligations represent non-cancelable, long-term contracts primarily related to software and data services, and includes a 5-year contract with a vendor for software services with a total commitment of $7.7 million.
|
|
|
Capital Lease |
|
|
Operating Leases |
|
|
Purchase Obligations |
|
|||
|
|
|
(In thousands) |
|
|||||||||
|
Year ending December 31, |
|
|
|
|
|
|
|
|
|
|
|
|
|
2018 |
|
$ |
155 |
|
|
$ |
9,961 |
|
|
$ |
3,849 |
|
|
2019 |
|
|
102 |
|
|
|
10,160 |
|
|
|
2,978 |
|
|
2020 |
|
|
69 |
|
|
|
7,670 |
|
|
|
1,659 |
|
|
2021 |
|
|
69 |
|
|
|
5,813 |
|
|
|
1,542 |
|
|
2022 |
|
|
1 |
|
|
|
4,314 |
|
|
|
1,541 |
|
|
Thereafter |
|
|
- |
|
|
|
10,449 |
|
|
|
- |
|
|
Total minimum payments |
|
|
396 |
|
|
$ |
48,367 |
|
|
$ |
11,569 |
|
|
Less: Amounts representing interest expense |
|
|
(23 |
) |
|
|
|
|
|
|
|
|
|
Present value of net minimum lease payments |
|
|
373 |
|
|
|
|
|
|
|
|
|
|
Less: Current obligations |
|
|
(144 |
) |
|
|
|
|
|
|
|
|
|
Long-term obligations |
|
$ |
229 |
|
|
|
|
|
|
|
|
|
In February 2016, as a result of the acquisition of The Mutual Fund Store, the Company acquired non-cancelable operating leases, including an existing office in Overland Park, Kansas, which expired in September 2016, as well as a new 33,100 square foot office in Overland Park, Kansas, which operating lease expires in March 2027. This Overland Park, Kansas lease also includes a tenant improvement allowance of approximately $1.8 million. During the year ended December 31, 2017, the Company had approximately 140 advisor center location operating leases located in over 35 states with expiration dates through July 2027.
Contingencies
Service Level Agreements
The Company includes service level commitments to its customers warranting certain levels of reliability and performance. The maximum total commitments under these obligations would have less than a $1.0 million impact on the Company’s annual operating results as of December 31, 2017.
Self-Insurance
The Company provides self-insured medical benefits for employees based upon their coverage elections. The medical plan carries a stop-loss policy which will protect from individual claims during the plan year exceeding $100,000 and when cumulative medical claims exceed 120% of expected claims for the plan year. The Company records estimates of the total costs of claims incurred based on an analysis of historical data. The liability for self-insured medical claims is included within accrued compensation in the Company’s Consolidated Balance Sheet and was $0.6 million and $0.7 million as of December 31, 2016 and 2017, respectively.
F-28
FINANCIAL ENGINES, INC. AND SUBSIDIARIES
NOTES TO THE CONSOLIDATED FINANCIAL STATEMENTS — (Continued)
Equity Awards to Certain Executive Officers
In February 2018, the Compensation Committee approved the grant of stock options and RSUs to certain executives made available under the Company’s 2009 Stock Incentive Plan. The stock options and RSUs have an expense value of approximately $11 million. The Company will account for these equity awards over a four-year vesting period utilizing the graded-vesting attribution method and the expense may be reduced by forfeitures as they occur.
F-29