Attached files
| file | filename |
|---|---|
| EX-32.1 - EX-32.1 - Apple Hospitality REIT, Inc. | ex32-1.htm |
| EX-31.2 - EX-31.2 - Apple Hospitality REIT, Inc. | ex31-2.htm |
| EX-31.1 - EX-31.1 - Apple Hospitality REIT, Inc. | ex31-1.htm |
| EX-23.1 - EX-23.1 - Apple Hospitality REIT, Inc. | ex23-1.htm |
| EX-21.1 - EX-21.1 - Apple Hospitality REIT, Inc. | ex21-1.htm |
| EX-12.1 - EX-12.1 - Apple Hospitality REIT, Inc. | ex12-1.htm |
UNITED STATES
SECURITIES AND EXCHANGE COMMISSION
Washington, D.C. 20549
FORM 10-K
| ☒ |
Annual report pursuant to section 13 or 15(d) of the Securities Exchange Act of 1934
|
For the fiscal year ended December 31, 2017
or
| ☐ |
Transition report pursuant to section 13 or 15(d) of the Securities Exchange Act of 1934
|
Commission File Number 001-37389
APPLE HOSPITALITY REIT, INC.
(Exact name of registrant as specified in its charter)
|
Virginia
|
26-1379210
|
|
(State of Organization)
|
(I.R.S. Employer Identification Number)
|
|
814 East Main Street
Richmond, Virginia
|
23219
|
|
(Address of principal executive offices)
|
(Zip Code)
|
(804) 344-8121
(Registrant’s telephone number, including area code)
Securities registered pursuant to Section 12(b) of the Act:
|
Title of each class
|
Name of each exchange on which registered
|
|
Common Shares, no par value
|
New York Stock Exchange
|
Securities registered pursuant to Section 12(g) of the Act: None
Indicate by check mark if the registrant is a well-known seasoned issuer, as defined in Rule 405 of the Securities Act. Yes ☒ No ☐
Indicate by check mark if the registrant is not required to file reports pursuant to Section 13 or Section 15(d) of the Act. Yes ☐ No ☒
Indicate by check mark whether the registrant (1) has filed all reports required to be filed by Section 13 or 15(d) of the Securities Exchange Act of 1934 during the preceding 12 months (or for such shorter period that the registrant was required to file such reports), and (2) has been subject to such filing requirements for the past 90 days. Yes ☒ No ☐
Indicate by check mark whether the registrant has submitted electronically and posted on its corporate Web site, if any, every Interactive Data File required to be submitted and posted pursuant to Rule 405 of Regulation S-T (§232.405 of this chapter) during the preceding 12 months (or for such shorter period that the registrant was required to submit and post such files). Yes ☒ No ☐
Indicate by check mark if disclosure of delinquent filers pursuant to Item 405 of Regulation S-K (§229.405 of this chapter) is not contained herein, and will not be contained, to the best of registrant’s knowledge, in definitive proxy or information statements incorporated by reference in Part III of this Form 10-K or any amendment to this Form 10-K. ☒
Indicate by check mark whether the registrant is a large accelerated filer, an accelerated filer, a non-accelerated filer, a smaller reporting company, or an emerging growth company. See the definitions of “large accelerated filer,” “accelerated filer,” “smaller reporting company,” and “emerging growth company” in Rule 12b-2 of the Exchange Act.
|
Large accelerated filer ☒
|
Accelerated filer ☐
|
|
Non-accelerated filer ¨ (Do not check if a smaller reporting company)
|
Smaller reporting company ☐
|
|
|
Emerging growth company ☐
|
If an emerging growth company, indicate by check mark if the registrant has elected not to use the extended transition period for complying with any new or revised financial accounting standards provided pursuant to Section 13(a) of the Exchange Act. ¨
Indicate by check mark whether the registrant is a shell company (as defined in Rule 12b-2 of the Exchange Act). Yes ☐ No ☒
The aggregate market value of the common shares held by non-affiliates of the registrant (based on the closing sale price on the New York Stock Exchange) was approximately $3,917,705,000 as of June 30, 2017.
The number of common shares outstanding on February 16, 2018 was 230,204,289.
Documents Incorporated by Reference
The information required by Part III of this report, to the extent not set forth herein, is incorporated by reference from the Company’s definitive proxy statement to be filed with the Securities and Exchange Commission in connection with the Company’s annual meeting of shareholders to be held on May 17, 2018.
APPLE HOSPITALITY REIT, INC.
FORM 10-K
|
|
Page
|
||
|
Part I
|
|
|
|
|
|
Item 1.
|
3 | |
|
|
Item 1A.
|
9 | |
|
|
Item 1B.
|
24 | |
|
|
Item 2.
|
25 | |
|
|
Item 3.
|
30 | |
|
Item 4.
|
30 | ||
|
Part II
|
|
|
|
|
|
Item 5.
|
31 | |
|
|
Item 6.
|
34 | |
|
|
Item 7.
|
35 | |
|
|
Item 7A.
|
49 | |
|
|
Item 8.
|
51 | |
|
|
Item 9.
|
81 | |
|
|
Item 9A.
|
81 | |
|
|
Item 9B.
|
81 | |
|
Part III
|
|
|
|
|
|
Item 10.
|
82 | |
|
|
Item 11.
|
82 | |
|
|
Item 12.
|
82 | |
|
|
Item 13.
|
82 | |
|
|
Item 14.
|
82 | |
|
Part IV
|
|
|
|
|
|
Item 15.
|
83 | |
|
Item 16.
|
85 | ||
|
90
|
|||
This Form 10-K includes references to certain trademarks or service marks. The Courtyard by Marriott®, Fairfield Inn by Marriott®, Fairfield Inn & Suites by Marriott®, Marriott® Hotels, Renaissance® Hotels, Residence Inn by Marriott®, SpringHill Suites by Marriott® and TownePlace Suites by Marriott® trademarks are the property of Marriott International, Inc. or one of its affiliates. The Embassy Suites by Hilton®, Hampton by Hilton®, Hampton Inn & Suites by Hilton®, Hilton® Hotels & Resorts, Hilton Garden Inn®, Home2 Suites by Hilton® and Homewood Suites by Hilton® trademarks are the property of Hilton Worldwide Holdings Inc. or one or more of its affiliates. For convenience, the applicable trademark or service mark symbol has been omitted but will be deemed to be included wherever the above referenced terms are used.
PART I
Forward-Looking Statements
This Annual Report contains forward-looking statements within the meaning of Section 27A of the Securities Act of 1933, as amended, and Section 21E of the Securities Exchange Act of 1934, as amended. Forward-looking statements are typically identified by use of statements that include phrases such as “may,” “believe,” “expect,” “anticipate,” “intend,” “estimate,” “project,” “target,” “goal,” “plan,” “should,” “will,” “predict,” “potential,” “outlook,” “strategy,” and similar expressions that convey the uncertainty of future events or outcomes. Such statements involve known and unknown risks, uncertainties, and other factors which may cause the actual results, performance, or achievements of Apple Hospitality REIT, Inc. and its wholly-owned subsidiaries (the “Company”) to be materially different from future results, performance or achievements expressed or implied by such forward-looking statements. Such factors include, but are not limited to, the ability of the Company to effectively acquire and dispose of properties; the ability of the Company to successfully integrate pending transactions and implement its operating strategy; changes in general political, economic and competitive conditions and specific market conditions; adverse changes in the real estate and real estate capital markets; financing risks; the outcome of current and future litigation, including any legal proceedings that have been or may be instituted against the Company or others; regulatory proceedings or inquiries; and changes in laws or regulations or interpretations of current laws and regulations that impact the Company’s business, assets or classification as a real estate investment trust (“REIT”). Although the Company believes that the assumptions underlying the forward-looking statements contained herein are reasonable, any of the assumptions could be inaccurate, and therefore there can be no assurance that such statements included in this Annual Report will prove to be accurate. In light of the significant uncertainties inherent in the forward-looking statements included herein, the inclusion of such information should not be regarded as a representation by the Company or any other person that the results or conditions described in such statements or the objectives and plans of the Company will be achieved. In addition, the Company’s qualification as a REIT involves the application of highly technical and complex provisions of the Internal Revenue Code. Readers should carefully review the risk factors described in the Company’s filings with the Securities and Exchange Commission (“SEC”), including but not limited to those discussed in the section titled “Risk Factors” in Item 1A in this Annual Report. Any forward-looking statement that the Company makes speaks only as of the date of this Annual Report. The Company undertakes no obligation to publicly update or revise any forward-looking statements or cautionary factors, as a result of new information, future events, or otherwise, except as required by law.
The Company, formed in November 2007 as a Virginia corporation, is a self-advised REIT that invests in income-producing real estate, primarily in the lodging sector, in the United States. The Company has elected to be treated as a REIT for federal income tax purposes. As of December 31, 2017, the Company owned 239 hotels with an aggregate of 30,322 rooms located in urban, high-end suburban and developing markets throughout 34 states. All of the Company’s hotels operate under Marriott or Hilton brands. The hotels are operated and managed under separate management agreements with 23 hotel management companies, none of which are affiliated with the Company. The Company’s common shares are listed on the New York Stock Exchange (“NYSE”) under the ticker symbol “APLE.” The Company has no foreign operations or assets and its operating structure includes only one reportable segment. Refer to Part II, Item 8, for the Consolidated Financial Statements and Notes thereto, appearing elsewhere in this Annual Report on Form 10-K.
Business Objectives
The Company is one of the largest hospitality REITs in the United States, in both the number of hotels and guest rooms, with significant geographic and brand diversity. The Company’s primary business objective is to maximize shareholder value by achieving long-term growth in cash available for distributions to its shareholders. The Company has pursued and will continue to pursue this objective through the following investment strategies:
|
·
|
pursuing thoughtful capital allocation with selective acquisitions and dispositions of primarily select-service hotels;
|
|
·
|
focusing on investments in the upscale sector of the lodging industry;
|
|
·
|
employing broad geographic diversification of its investments;
|
|
·
|
franchising and collaborating with leading brands in the sector;
|
|
·
|
utilizing strong experienced operators for its hotels and enhancing their performance with proactive asset management;
|
|
·
|
reinvesting in the Company’s hotels to maintain their competitive advantage; and
|
|
·
|
maintaining low leverage providing the Company with financial flexibility.
|
The Company has generally acquired fee simple ownership of its properties, with a focus on hotels that have or have the potential to have diverse demand generators, strong brand recognition, high levels of customer satisfaction and strong operating margins. The acquisitions have been in broadly diversified markets across the United States to limit dependence on any one geographic area or demand generator. With an emphasis on upscale select-service hotels, the Company utilizes its asset management experience and expertise to improve the quality and performance of its hotels by working with its property managers to aggressively manage room rates and cost structure by benchmarking with internal and external data, using the Company’s scale to help negotiate favorable vendor contracts, engaging industry leaders in hotel management, and franchising the hotels with leading brands and actively participating with the franchisors to strengthen the brands. To maintain its competitive advantage in each market, the Company continually reinvests in its hotels. With its depth of ownership in particular brands and extensive experience with the Hilton and Marriott select-service brands, the Company has been able to enhance its reinvestment approach. By maintaining a flexible balance sheet, with a total debt to total capitalization (total debt outstanding plus equity market capitalization based on the Company’s December 31, 2017 closing share price) ratio at December 31, 2017 of 21%, the Company is positioned to opportunistically consider investments that further improve shareholder value.
Hotel Operating Performance
As of December 31, 2017, the Company owned 239 hotels with a total of 30,322 rooms as compared to 235 hotels with a total of 30,073 rooms as of December 31, 2016, however, operating performance is included only for the period of ownership for hotels acquired or disposed of during 2017 and 2016. During 2017, the Company acquired three newly constructed hotels (one on February 2, 2017 and two on September 12, 2017) and three existing hotels (one on October 13, 2017, one on October 20, 2017, and one on December 1, 2017) and sold two hotels (one on April 20, 2017 and one on October 5, 2017). During 2016, the Company acquired 56 hotels in the Apple REIT Ten, Inc. (“Apple Ten”) merger effective September 1, 2016, acquired one additional newly constructed hotel on July 1, 2016 and sold one hotel on December 6, 2016. The following table reflects certain operating statistics for the Company’s hotels for their respective periods of ownership by the Company. Average Daily Rate (“ADR”) is calculated as room revenue divided by the number of rooms sold, and revenue per available room (“RevPAR”) is calculated as occupancy multiplied by ADR.
|
Years Ended December 31,
|
||||||||||||
|
2017
|
2016
|
Percent Change
|
||||||||||
|
ADR
|
$
|
134.61
|
$
|
133.61
|
0.7
|
%
|
||||||
|
Occupancy
|
77.4
|
%
|
76.9
|
%
|
0.7
|
%
|
||||||
|
RevPAR
|
$
|
104.13
|
$
|
102.80
|
1.3
|
%
|
||||||
Comparable Hotels Operating Performance
The following table reflects certain operating statistics for the Company’s 239 hotels owned as of December 31, 2017 (“Comparable Hotels”). The Company defines metrics from Comparable Hotels as results generated by the 239 hotels owned as of the end of the reporting period. For the hotels acquired during the reporting periods shown, the Company has included, as applicable, results of those hotels for periods prior to the Company’s ownership using information provided by the properties’ prior owners at the time of acquisition and not adjusted by the Company. This information has not been audited, either for the periods owned or prior to ownership by the Company. For dispositions, results have been excluded for the Company’s period of ownership.
|
Years Ended December 31,
|
||||||||||||
|
2017
|
2016
|
Percent Change
|
||||||||||
|
ADR
|
$
|
134.75
|
$
|
133.45
|
1.0
|
%
|
||||||
|
Occupancy
|
77.5
|
%
|
77.0
|
%
|
0.6
|
%
|
||||||
|
RevPAR
|
$
|
104.40
|
$
|
102.80
|
1.6
|
%
|
||||||
Hotel performance is impacted by many factors, including the economic conditions in the United States and each individual locality. Moderate improvements in the general U.S. economy have been partially offset by increased supply in many markets, resulting in modest revenue growth. During 2017, the Company experienced a slight increase in both occupancy and ADR resulting in a modest increase in RevPAR as compared to 2016. Overall, the Company’s Comparable Hotels’ RevPAR growth for 2017 was in line with industry/brand averages. Although certain markets will vary based on local supply/demand dynamics and local market economic conditions, with continued overall room rate improvement combined with expected stable overall demand growth compared to supply growth, the Company, on a comparable basis, and industry are forecasting a low single digit percentage increase in revenue for 2018 as compared to 2017. The low growth is primarily due to inconsistent demand in certain markets and increased hotel supply meeting demand growth in others, limiting the Company’s ability to increase rates. See Part II, Item 7, Management’s Discussion and Analysis of Financial Condition and Results of Operations, appearing elsewhere in this Annual Report on Form 10-K for more information on the Company’s results of operations.
2017 Investing Activities
The Company continually monitors market conditions and attempts to maximize shareholder value by investing in properties that it believes provide superior long-term value. Consistent with this strategy and the Company’s focus on investing in select-service hotels, the Company acquired six hotels for an aggregate purchase price of approximately $161.8 million during 2017: a new 124-room Courtyard in Fort Worth, Texas, a new 104-room Hilton Garden Inn and 106-room Home2 Suites on the same site in Birmingham, Alabama, a 179-room Residence Inn in Portland, Maine, a 136-room Residence Inn in Salt Lake City, Utah and a 135-room Home2 Suites in Anchorage, Alaska. In February 2018, the Company completed the purchase of two additional hotels (a 119-room Hampton Inn & Suites in Atlanta, Georgia and a 144-room Hampton Inn & Suites in Memphis, Tennessee) for an aggregate purchase price of $63.0 million. The Company also has outstanding contracts for the potential purchase of two additional hotels that are under construction for a total purchase price of approximately $64.8 million, which are planned to be completed and opened for business during 2018, at which time closing on these hotels is expected to occur. The Company utilized its $540 million revolving credit facility (the “revolving credit facility”) to fund the 2017 and 2018 acquisitions and plans to utilize the revolving credit facility for any additional acquisitions that are completed in 2018.
Additionally, the Company monitors each of its properties’ profitability, market conditions and capital requirements and attempts to maximize shareholder value by disposing of properties when it believes that the proceeds from the sale of the property can be reinvested into opportunities that have more growth potential. As a result, on April 20, 2017, the Company completed the sale of its 224-room Hilton hotel in Dallas, Texas, for a gross sales price of approximately $56.1 million. Also, on October 5, 2017, the Company completed the sale of its 316-room Marriott hotel in Fairfax, Virginia, for a gross sales price of approximately $41.5 million. The Company used the net proceeds from the sales to pay down borrowings on its revolving credit facility.
See Note 3 titled “Investment in Real Estate” and Note 4 titled “Dispositions” in Part II, Item 8, of the Consolidated Financial Statements and Notes thereto, appearing elsewhere in this Annual Report on Form 10-K for additional information concerning these transactions.
In addition to continually considering opportunities to invest in select-service hotels, the Company also monitors the trading price of its common shares and may repurchase common shares should it believe there is an opportunity to increase shareholder value. Although the Company did not repurchase any common shares in 2017, the Board of Directors has authorized a $475 million share repurchase program which at December 31, 2017 had $467.5 million remaining. See Note 8 titled “Shareholders’ Equity” in Part II, Item 8, of the Consolidated Financial Statements and Notes thereto, appearing elsewhere in this Annual Report on Form 10-K for additional information concerning the share repurchase program.
Merger with Apple Ten
Effective September 1, 2016, the Company completed its merger with Apple Ten, and added 56 Marriott and Hilton branded primarily select-service and extended-stay hotels located in 17 states with an aggregate of 7,209 rooms, to the Company’s real estate portfolio (the “Apple Ten merger”). See Note 2 titled “Merger with Apple REIT Ten, Inc.” in Part II, Item 8, of the Consolidated Financial Statements and Notes thereto, appearing elsewhere in this Annual Report on Form 10-K for additional information concerning the merger with Apple Ten.
Hotel Industry and Competition
The hotel industry is highly competitive. Each of the Company’s hotels competes for guests primarily with other hotels in its immediate vicinity and secondarily with other hotels or lodging facilities in its geographic market. An increase in the number of competitive hotels or other lodging facilities in a particular area could have a material adverse effect on the occupancy, ADR and RevPAR of the Company’s hotels in that area. The Company believes that brand recognition, location, price and quality (of both the hotel and the services provided) are the principal competitive factors affecting the Company’s hotels. Additionally, general economic conditions in a particular market and nationally impact the performance of the hotel industry.
Management and Franchise Agreements
All of the Company’s hotels operate under Marriott or Hilton brands, and as of December 31, 2017, consisted of the following:
|
Number of Hotels and Guest Rooms by Brand
|
||||||||
|
Number of
|
Number of
|
|||||||
|
Brand
|
Hotels
|
Rooms
|
||||||
|
Hilton Garden Inn
|
42
|
5,807
|
||||||
|
Courtyard
|
40
|
5,460
|
||||||
|
Hampton
|
36
|
4,422
|
||||||
|
Residence Inn
|
34
|
4,011
|
||||||
|
Homewood Suites
|
34
|
3,831
|
||||||
|
SpringHill Suites
|
17
|
2,248
|
||||||
|
TownePlace Suites
|
12
|
1,196
|
||||||
|
Fairfield Inn
|
11
|
1,300
|
||||||
|
Home2 Suites
|
8
|
910
|
||||||
|
Marriott
|
2
|
616
|
||||||
|
Embassy Suites
|
2
|
316
|
||||||
|
Renaissance
|
1
|
205
|
||||||
|
Total
|
239
|
30,322
|
||||||
Each of the Company’s 239 hotels owned as of December 31, 2017 is operated and managed under separate management agreements with 23 hotel management companies, none of which are affiliated with the Company. The management agreements generally provide for initial terms of one to 30 years. The Company has the option to terminate the management agreements if specified performance thresholds are not satisfied. As of December 31, 2017, nearly 80% of the Company’s hotels operate under a variable management fee agreement, with an average initial term of two years, which the Company believes better aligns incentives for each hotel manager to maximize each property’s performance than a base-plus-incentive management fee structure, as described below, which is more common throughout the industry. Under the variable fee structure, the management fee earned for each hotel is generally within a range of 2.5% to 3.5% of revenue, based on each hotel’s performance relative to other hotels owned by the Company. The performance measures are based on various financial and quality performance metrics. The Company’s remaining hotels operate under a management fee structure which generally includes the payment of base management fees and an opportunity for incentive management fees. Under this structure, base management fees are calculated as a percentage of gross revenues and the incentive management fees are calculated as a percentage of operating profit in excess of a priority return to the Company, as defined in the management agreements. In addition to the above, management fees for all of the Company’s hotels generally include accounting fees and other fees for centralized services, which are allocated among all of the hotels that receive the benefit of such services.
Sixteen of the Company’s hotels are managed by affiliates of Marriott or Hilton. The remainder of the Company’s hotels are managed by companies that are not affiliated with either Marriott or Hilton, and, as a result, the hotels they manage were required to obtain separate franchise agreements with each respective franchisor. The franchise agreements generally provide for initial terms of approximately 10 to 30 years and generally provide for renewals subject to franchise requirements at the time of renewal. The Company pays various fees under these agreements, including the payment of royalty fees, marketing fees, reservation fees, a communications support fee, brand loyalty program fees and other similar fees based on room revenues.
The franchise and/or management agreements provide a variety of benefits for the Company, which include national advertising, publicity, and other marketing programs designed to increase brand awareness, training of personnel, continuous review of quality standards, centralized reservation systems and best practices within the industry.
Hotel Maintenance and Renovation
The Company’s hotels have an ongoing need for renovation and refurbishment. To maintain and enhance each property’s competitive position in its market, the Company has invested in and plans to continue to reinvest in its hotels. During 2017 and 2016, the Company’s capital improvements for existing hotels were approximately $69.1 million and $63.4 million, respectively. During 2018, the Company anticipates investing approximately $70 to $80 million in capital improvements, which includes various scheduled renovation projects for approximately 30 to 35 properties.
Financing
The Company’s principal sources of liquidity are the operating cash flow generated from the Company’s properties and availability under its revolving credit facility. Depending on market conditions, the Company also has the ability to enter into additional secured and unsecured debt financing and to issue common shares under its at-the-market offering program discussed below. The Company anticipates that funds from these sources will be adequate to meet its anticipated liquidity requirements, including debt service, hotel acquisitions, hotel renovations, required distributions to shareholders (the Company is not required to make distributions at its current rate for REIT purposes) and share repurchases.
As of December 31, 2017, the Company had approximately $457.4 million in outstanding mortgage debt secured by 29 properties, with maturity dates ranging from June 2020 to January 2038 and stated interest rates ranging from 3.55% to 6.25%. Additionally, the Company had approximately $766.9 million in outstanding debt under its unsecured credit facilities with maturity dates ranging from May 2019 to July 2024 and interest rates ranging from 2.54% to 3.76%.
As of December 31, 2017, the Company’s revolving credit facility had an outstanding principal balance of approximately $106.9 million, with approximately $433.1 million in borrowing capacity. The revolving credit facility is available for acquisitions, hotel renovations and development, share repurchases, working capital and other general corporate funding purposes, including the payment of distributions to shareholders. As discussed above, the Company has historically maintained and plans in the future to maintain relatively low leverage as compared to the real estate industry as a whole and the lodging sector in particular. The Company’s ratio of total debt to total capitalization as of December 31, 2017 was 21%. The Company may increase debt levels at any time to take advantage of investment opportunities, but would plan to reduce any significant increases as appropriate with the issuance of equity or property dispositions to maintain its flexible balance sheet and reduce risks to investors compared to those of highly leveraged companies. The Company plans to maintain staggered maturities of its debt, utilize unsecured debt when available and fix the rate on the majority of its debt. All of these strategies reduce shareholder risk related to the Company’s financing structure. See Note 5 titled “Debt” in Part II, Item 8, of the Consolidated Financial Statements and Notes thereto, appearing elsewhere in this Annual Report on Form 10-K for additional information regarding the Company’s debt.
In February 2017, the Company executed an equity distribution agreement that allows the Company to sell, from time to time, up to an aggregate of $300 million of its common shares through sales agents under an at-the-market offering program (the “ATM Program”). During the fourth quarter of 2017, the Company sold approximately 6.9 million common shares under its ATM Program at a weighted-average market sales price of approximately $19.55 per common share and received aggregate gross proceeds of approximately $135.1 million. The Company used the proceeds from the sale of these shares to pay down borrowings on its revolving credit facility. As of December 31, 2017, approximately $164.9 million remained available for issuance under the ATM program. Future sales will depend on a variety of factors to be determined by the Company, including market conditions, the trading price of the Company’s common shares and opportunities for uses of any proceeds.
Distribution Policy
The Company plans to continue to pay a consistent distribution on a monthly basis, with distributions based on anticipated cash generated from operations. The Company’s annualized distribution rate was $1.20 per common share at December 31, 2017. As it has done historically, due to seasonality, the Company may use its revolving credit facility to maintain the consistency of the monthly distribution rate, taking into consideration any acquisitions, dispositions, capital improvements and economic cycles. Any distribution is subject to approval of the Company’s Board of Directors and there can be no assurance of the classification or duration of distributions at the current annual distribution rate. The Board of Directors monitors the Company’s distribution rate relative to the performance of its hotels on an ongoing basis and may make adjustments to the distribution rate as determined to be prudent in relation to other cash requirements of the Company. If cash flow from operations and the revolving credit facility are not adequate to meet liquidity requirements, the Company may utilize additional financing sources to make distributions. Although the Company has relatively low levels of debt, there can be no assurance it will be successful with this strategy and may need to reduce its distributions to required levels to maintain its REIT status. If the Company were unable to extend its maturing debt in future periods or if it were to default on its debt, it may be unable to make distributions.
Insurance
The Company maintains comprehensive insurance coverage for general liability, property, business interruption and other risks with respect to all of its hotels. These policies offer coverage features and insured limits that the Company believes are customary for similar types of properties. However, various types of catastrophic losses, like earthquakes, hurricanes, or certain types of terrorism, may not be insurable or may not be economically insurable.
Environmental Matters
The Company’s hotels are subject to various U.S. federal, state, and local environmental, health and safety laws and regulations that address a wide variety of issues, including, but not limited to, storage tanks, air emissions from emergency generators, storm water and waste water discharges, lead-based paint, mold and mildew and waste management, and impose liability for contamination. In connection with each of the Company’s hotel acquisitions, the Company reviewed a Phase I Environmental Report and additional environmental reports and surveys, as were necessitated by the preliminary report. Based on the reports, the Company is not aware of any environmental situations requiring remediation at the Company’s properties, which have not been, or are not currently being remediated as necessary. No material remediation costs have occurred or are expected to occur. Under various laws, owners as well as tenants and operators of real estate may be required to investigate and clean up or remove hazardous substances present at or migrating from properties they own, lease or operate and may be held liable for property damage or personal injuries that result from hazardous substances. These laws also expose the Company to the possibility that it may become liable to reimburse governments for damages and costs they incur in connection with hazardous substances.
Seasonality
The hotel industry historically has been seasonal in nature. Seasonal variations in occupancy at the Company’s hotels may cause quarterly fluctuations in its revenues. Generally, occupancy rates and hotel revenues are greater in the second and third quarters than in the first and fourth quarters. To the extent that cash flow from operations is insufficient during any quarter, due to temporary or seasonal fluctuations in revenue, the Company expects to utilize cash on hand or available financing sources to meet cash requirements.
Related Parties
The Company has, and is expected to continue to engage in, transactions with related parties. These transactions cannot be construed to be at arm’s length and the results of the Company’s operations may be different if these transactions were conducted with non-related parties. See Note 7 titled “Related Parties” in Part II, Item 8, of the Consolidated Financial Statements and Notes thereto, appearing elsewhere in this Annual Report on Form 10-K for additional information concerning the Company’s related party transactions.
Employees
During 2017, all employees involved in the day-to-day operation of the Company’s hotels were employed by third party management companies engaged pursuant to the hotel management agreements. At December 31, 2017, the Company had 56 employees. The employees not only provide support to the Company, but, as discussed in Note 7 titled “Related Parties” in Part II, Item 8, of the Consolidated Financial Statements and Notes thereto, appearing elsewhere in this Annual Report on Form 10-K, provide support services to Apple Realty Group, Inc. (“ARG”), which is wholly owned by Glade M. Knight, Executive Chairman of the Company.
Website Access
The address of the Company’s Internet website is www.applehospitalityreit.com. The Company makes available free of charge through its Internet website its annual report on Form 10-K, quarterly reports on Form 10-Q, current reports on Form 8-K, proxy statements, and amendments to those reports filed or furnished pursuant to section 13(a) or 15(d) of the Securities Exchange Act of 1934, as amended, as soon as reasonably practicable after the Company electronically files such material with, or furnishes it to, the SEC. Information contained on the Company’s website is not incorporated by reference into this report.
The Company has identified the following significant risk factors which may affect, among other things, the Company’s business, financial position, results of operations, operating cash flow, market value, and ability to service its debt obligations and make distributions to its shareholders. You should carefully consider the risks described below and the risks disclosed in other filings with the SEC, in addition to the other information contained in this report.
Risks Related to the Company’s Business and Operations
The Company is subject to various risks which are common to the hotel industry on a national, regional and local market basis that are beyond its control and could adversely affect its business.
The success of the Company’s hotels depends largely on the hotel operators’ ability to adapt to dominant trends and risks in the hotel industry, both nationally and in individual local markets. These risks could adversely affect hotel occupancy and the rates that can be charged for hotel rooms as well as hotel operating expenses. The following is a summary of risks that may affect the hotel industry in general and as a result may affect the Company:
|
·
|
an increase in supply of hotel rooms that exceeds increases in demand;
|
|
·
|
competition from other hotels and lodging alternatives in the markets in which the Company operates;
|
|
·
|
dependence on business and leisure travel;
|
|
·
|
increases in energy costs and other travel expenses, which may affect travel patterns and reduce business and leisure travel;
|
|
·
|
reduced business and leisure travel due to geo-political uncertainty, including terrorism, travel-related health concerns, including the widespread outbreak of infectious or contagious diseases in the U.S., inclement weather conditions, including natural disasters such as hurricanes and earthquakes, and airline strikes or disruptions;
|
|
·
|
reduced travel due to adverse national, regional or local economic and market conditions;
|
|
·
|
seasonality of the hotel industry may cause quarterly fluctuations in operating results;
|
|
·
|
changes in marketing and distribution for the industry including the cost and the ability of third-party internet and other travel intermediaries to attract and retain customers;
|
|
·
|
changes in hotel room demand in a local market;
|
|
·
|
ability of a hotel franchise to fulfill its obligations to franchisees;
|
|
·
|
brand expansion;
|
|
·
|
the performance of third-party managers of the Company’s hotels;
|
|
·
|
increases in operating costs, including increases in the cost of property insurance, utilities and real estate and personal property taxes, due to inflation and other factors that may not be offset by increased room rates;
|
|
·
|
labor shortages and increases in the cost of labor due to low unemployment rates or to government regulations surrounding wage rates, health care coverage and other benefits;
|
|
·
|
changes in governmental laws and regulations, fiscal policies and zoning ordinances and the related costs of compliance with applicable laws and regulations;
|
|
·
|
business interruptions due to cyber-attacks;
|
|
·
|
requirements for periodic capital reinvestment to repair and upgrade hotels;
|
|
·
|
limited alternative uses for the hotel buildings;
|
|
·
|
condemnation or uninsured losses; and
|
|
·
|
adverse effects of a downturn in the hospitality industry.
|
Any of these factors may reduce operating results and the value of properties that the Company owns. Additionally, these items, among others, may reduce the availability of capital to the Company.
Adverse economic conditions in the United States and individual markets may adversely affect the Company’s business operations and financial performance.
The performance of the lodging industry has historically been closely linked to the performance of the general economy both nationally and within local markets in the United States. The lodging industry is also sensitive to government, business and personal discretionary spending levels. Declines in government and corporate budgets and consumer demand due to adverse general economic conditions, risks affecting or reducing travel patterns, lower consumer confidence or adverse political conditions can lower the revenue and profitability of the Company’s hotels and therefore the net operating profits of its investments. A slowing of the current economic growth or new economic weakness could have an adverse effect on the Company’s revenue and negatively affect its profitability. Furthermore, even if the economy in the United States in general continues to improve, the Company cannot provide any assurances that demand for hotels will increase from current levels, nationally or more specifically regionally, where the Company’s properties are located.
In addition, many of the expenses associated with the Company’s business, including personnel costs, interest expense, ground leases, property taxes, insurance and utilities, are relatively fixed. During a period of overall economic weakness, if the Company is unable to meaningfully decrease these costs as demand for its hotels decreases, the Company’s business operations and financial performance may be adversely affected.
The Company is affected by restrictions in, and compliance with, its franchise and license agreements.
The Company’s wholly-owned taxable REIT subsidiaries (“TRSs”) (or subsidiaries thereof) operate all of the hotels pursuant to franchise or license agreements with nationally recognized hotel brands. These franchise and license agreements contain specific standards for, and restrictions and limitations on, the operation and maintenance of the Company’s hotels in order to maintain uniformity within the franchisor system. The Company may be required to incur costs to comply with these standards and these standards could potentially conflict with the Company’s ability to create specific business plans tailored to each property and to each market. Failure to comply with these brand standards may result in termination of the applicable franchise or license agreement. If the Company were to lose a franchise or license agreement, the Company would be required to re-brand the hotel, which could result in a decline in the value of the hotel, the loss of marketing support and participation in guest loyalty programs, and harm the Company’s relationship with the franchisor, impeding the Company’s ability to operate other hotels under the same brand. Additionally, the franchise and license agreements have provisions that could limit the Company’s ability to sell or finance a hotel which could further affect the Company.
All of the Company’s hotels operate under either Marriott or Hilton brands; therefore, the Company is subject to risks associated with concentrating its portfolio in only two brand families.
All of the hotels that the Company owned as of December 31, 2017 operate under brands owned by Marriott or Hilton. As a result, the Company’s success is dependent in part on the continued success of Marriott and Hilton and their respective brands. The Company believes that building brand value is critical to increase demand and strengthen customer loyalty. Consequently, if market recognition or the positive perception of Marriott and/or Hilton is reduced or compromised, the goodwill associated with the Marriott and Hilton branded hotels in the Company’s portfolio may be adversely affected. Also, if Marriott and Hilton alter certain policies, including their respective guest loyalty programs, this could reduce the Company’s future revenues. Furthermore, if the Company’s relationship with Marriott or Hilton were to deteriorate or terminate as a result of disputes regarding the Company’s hotels or for other reasons, Marriott and/or Hilton could, under certain circumstances, terminate the Company’s current franchise
licenses with them or decline to provide franchise licenses for hotels that the Company may acquire in the future. If any of the foregoing were to occur, it could have a material adverse effect on the Company.
Competition in the markets where the Company owns hotels may adversely affect the Company’s results of operations.
The hotel industry is highly competitive. Each of the Company’s hotels competes for guests primarily with other hotels in its immediate vicinity and secondarily with other hotels in its geographic market. The Company also competes with numerous owners and operators of vacation ownership resorts, as well as alternative lodging companies, such as HomeAway and Airbnb, which operate websites that market available furnished, privately-owned residential properties, including homes and condominiums, that can be rented on a nightly, weekly or monthly basis. An increase in the number of competitive hotels, vacation ownership resorts and alternative lodging arrangements in a particular area could have a material adverse effect on the occupancy, ADR and RevPAR of the Company’s hotels in that area.
The Company is dependent on third-party hotel managers to operate its hotels and could be adversely affected if such managers do not manage the hotels successfully.
To maintain its status as a REIT, the Company is not permitted to operate any of its hotels. As a result, the Company has entered into management agreements with third-party managers to operate its hotels. For this reason, the Company’s ability to direct and control how its hotels are operated is less than if the Company were able to manage its hotels directly. Under the terms of the hotel management agreements, the Company’s ability to participate in operating decisions regarding its hotels is limited to certain matters, and it does not have the authority to require any hotel to be operated in a particular manner (for instance, setting room rates). The Company does not supervise any of the hotel managers or their respective personnel on a day-to-day basis. The Company cannot be assured that the hotel managers will manage its hotels in a manner that is consistent with their respective obligations under the applicable management agreement or the Company’s obligations under its hotel franchise agreements. The Company could be materially and adversely affected if any of its third-party managers fail to effectively manage revenues and expenses, provide quality services and amenities, or otherwise fail to manage its hotels in its best interest, and may be financially responsible for the actions and inactions of the managers. In certain situations, the Company may terminate the management agreement. However, the Company can provide no assurances that it could identify a replacement manager, that the franchisor will consent to the replacement manager, or that the replacement manager will manage the hotel successfully. A failure by the Company’s hotel managers to successfully manage its hotels could lead to an increase in its operating expenses or decrease in its revenues, or both.
The growth of lodging distribution channels could adversely affect the Company’s business and profitability.
Although a majority of rooms sold are sold through the hotel franchisors’ channels, a growing number of the Company’s hotel rooms are sold through other channels or intermediaries. Rooms sold through non-franchisors’ channels are generally less profitable (after associated fees) than rooms sold through franchisors’ channels. Although the Company’s franchisors may have established agreements with many of these alternative channels or intermediaries that limit transaction fees for hotels, there can be no assurance that the Company’s franchisors will be able to renegotiate such agreements upon their expiration with terms as favorable as the provisions that exist today. Moreover, alternative channels or intermediaries may employ aggressive marketing strategies, including expending significant resources for online and television advertising campaigns to drive consumers to their websites. As a result, consumers may develop brand loyalties to the intermediaries’ offered brands, websites and reservations systems rather than to those of the Company’s franchisors. If this happens, the Company’s business and profitability may be significantly negatively impacted.
Renovations and capital improvements may reduce the Company’s profitability.
The Company has ongoing needs for hotel renovations and capital improvements, including requirements under all of its hotel franchise and management agreements and certain loan agreements to maintain the hotels. In addition, from time to time the Company will need to make renovations and capital improvements to comply with applicable laws and regulations, to remain competitive with other hotels and to maintain the economic value of its hotels. The Company also may need to make significant capital improvements to hotels that it acquires. Occupancy and ADR are often affected by the maintenance and capital improvements at a hotel, especially in the event that the
maintenance or improvements are not completed on schedule, or if the improvements require significant disruptions at the hotel. The costs of capital improvements the Company needs or chooses to make could reduce the funds available for other purposes and may reduce the Company’s profitability.
Certain hotels are subject to ground leases that may affect the Company’s ability to use the hotel or restrict its ability to sell the hotel.
As of December 31, 2017, 14 of the Company’s hotels were subject to ground leases. Accordingly, the Company effectively only owns a long-term leasehold interest in these hotels. If the Company is found to be in breach of a ground lease, it could lose the right to use the hotel. In addition, unless the Company can purchase a fee interest in the underlying land or renew the terms of these leases before their expiration, as to which no assurance can be given, the Company will lose its right to operate these properties and its interest in the property, including any investment that it made in the property. The Company’s ability to exercise any extension options relating to its ground leases is subject to the condition that the Company is not in default under the terms of the ground lease at the time that it exercises such options, and the Company can provide no assurances that it will be able to exercise any available options at such time. If the Company were to lose the right to use a hotel due to a breach or non-renewal of a ground lease, it would be unable to derive income from such hotel. Finally, the Company may not be permitted to sell or finance a hotel subject to a ground lease without the consent of the lessor.
The Company may not be able to complete hotel dispositions when and as anticipated.
The Company continually monitors the profitability of its hotels, market conditions, and capital requirements and attempts to maximize shareholder value by timely disposal of its hotels. Real estate investments are, in general, relatively difficult to sell due to, among other factors, the size of the required investment and the volatility in availability of adequate financing for a potential buyer. This illiquidity will tend to limit the Company’s ability to promptly vary its portfolio in response to changes in economic or other conditions. Additionally, factors specific to an individual property, such as its specific market and operating performance, restrictions in franchise and management agreements, debt secured by the property, a ground lease, or capital expenditure needs may further increase the difficulty in selling a property. Therefore, the Company cannot predict whether it will be able to sell any hotels for the price or on the terms set by the Company, or whether any price or other terms offered by a prospective purchaser would be acceptable to the Company. In addition, provisions of the Internal Revenue Code of 1986, as amended (the “Code”) relating to REITs have certain limits on the Company’s ability to sell hotels.
Real estate impairment losses may adversely affect the Company’s financial condition and results of operations.
As a result of changes in an individual hotel’s operating results or to the Company’s planned hold period for a hotel, the Company may be required to record an impairment loss for a property. The Company analyzes its hotel properties individually for indicators of impairment throughout the year. The Company records impairment losses on a hotel property if indicators of impairment are present, and the sum of the undiscounted cash flows estimated to be generated by the respective property over its estimated remaining useful life, based on historical and industry data, is less than the property’s carrying amount. Indicators of impairment include, but are not limited to, a property with current or potential losses from operations, when it becomes more likely than not that a property will be sold before the end of its previously estimated useful life or when events, trends, contingencies or changes in circumstances indicate that a triggering event has occurred and an asset’s carrying value may not be recoverable.
The Company’s failure to identify and complete accretive acquisitions may adversely affect the profitability of the Company.
The Company’s business strategy includes identifying and completing accretive hotel acquisitions. The Company competes with other investors who are engaged in the acquisition of hotels, and these competitors may affect the supply/demand dynamics and, accordingly, increase the price the Company must pay for hotels it seeks to acquire, and these competitors may succeed in acquiring those hotels. Any delay or failure on the Company’s part to identify, negotiate, finance on favorable terms, consummate and integrate such acquisitions could materially impede the Company’s growth. The Company may also incur costs that it cannot recover if it abandons a potential acquisition. If the Company does not reinvest proceeds received from hotel dispositions timely, it could result in lower income. The Company’s profitability may also suffer because future acquisitions of hotels may not yield the returns the Company expects and the integration of such acquisitions may cause disruptions in the Company’s business and to management or may take longer than projected.
The Company’s inability to obtain financing on favorable terms or pay amounts due on its financing may adversely affect the Company’s operating results.
Although the Company anticipates maintaining relatively low levels of debt, it may periodically use financing to acquire properties, perform renovations to its properties, or make shareholder distributions or share repurchases in periods of fluctuating income from its properties. The credit markets have historically been volatile and subject to increased regulation in recent years, and as a result, the Company may not be able to obtain debt financing to meet its cash requirements, including refinancing any scheduled debt maturities, which may adversely affect its ability to execute its business strategy. If the Company refinances debt, such refinancing may not be in the same amount or on terms as favorable as the terms of the existing debt being refinanced. If the Company is unable to refinance its debt, it may be forced to dispose of hotels or issue equity at inopportune times or on disadvantageous terms, which could result in higher costs of capital.
The Company is also subject to risks associated with increases in interest rates with respect to the Company’s floating rate debt which could reduce cash from operations. In addition, the Company has used interest rate swaps to manage its interest rate risks on a portion of its variable rate debt, and in the future it may use hedging arrangements, such as interest rate swaps to manage its exposure to interest rate volatility. The Company’s actual hedging decisions are determined in light of the facts and circumstances existing at the time of the hedge. There is no assurance that the Company’s hedging strategy will achieve its objectives, and the Company may be subject to costs, such as transaction fees or breakage costs, if it terminates these arrangements.
Compliance with financial and other covenants in the Company’s existing or future debt agreements may reduce operational flexibility and create default risk.
The Company’s existing indebtedness, whether secured by mortgages on certain properties or unsecured, contains, and indebtedness that the Company may enter into in the future likely will contain, customary covenants that may restrict the Company’s operations and limit its ability to enter into future indebtedness. In addition, the Company’s ability to borrow under its unsecured credit facilities is subject to compliance with its financial and other covenants, including, among others, a minimum tangible net worth, maximum debt limits, minimum interest and fixed charge coverage ratios, limits on dividend payments and share repurchases and restrictions on certain investments. The Company’s failure to comply with the covenants in its existing or future indebtedness, as well as its inability to make required principal and interest payments, could cause a default under the applicable debt agreement, which could result in the acceleration of the debt and require the Company to repay such debt with capital obtained from other sources, which may not be available to the Company or may be available only on unfavorable terms.
If the Company defaults on its secured debt, lenders can take possession of the property or properties securing such debt. As a general policy, the Company seeks to obtain mortgages securing indebtedness which encumber only the particular property to which the indebtedness relates, but recourse on these loans may include all of its assets. If recourse on any loan incurred by the Company to acquire or refinance any particular property includes all of its assets, the equity in other properties could be reduced or eliminated through foreclosure on that loan. If a loan is secured by a mortgage on a single property, the Company could lose that property through foreclosure if it defaults on that loan. If the Company defaults under a loan, it is possible that it could become involved in litigation related to matters concerning the loan, and such litigation could result in significant costs. Additionally, defaulting under a loan may damage the Company’s reputation as a borrower and may limit its ability to secure financing in the future.
Technology is used in operations, and any material failure, inadequacy, interruption or security failure of that technology could harm the business.
The Company and its hotel managers and franchisors rely on information technology networks and systems, including the Internet, to process, transmit and store electronic information, and to manage or support a variety of business processes, including financial transactions and records, personal identifying information, reservations, billing and operating data. Some of the information technology is purchased from third party vendors, on whom the systems depend. The Company and its hotel managers and franchisors rely on commercially available and internally developed systems, software, tools and monitoring to provide security for processing, transmission and storage of confidential operator and other customer information, such as individually identifiable information, including information relating to financial accounts. Although the Company and its hotel managers and franchisors have taken steps necessary to protect the security of their information systems and the data maintained in those systems, it is
possible that the safety and security measures taken will not be able to prevent the systems’ improper functioning or damage, or the improper access or disclosure of personally identifiable information such as in the event of cyber-attacks. Security breaches, including physical or electronic break-ins, computer viruses, attacks by hackers and similar breaches, can create system disruptions, shutdowns or unauthorized disclosure of confidential information. Any failure to maintain proper function, security and availability of information systems could interrupt operations, damage reputation, subject the Company to liability claims or regulatory penalties and could have a material adverse effect on the business, financial condition and results of operations of the Company.
Potential losses not covered by insurance may adversely affect the Company’s financial condition.
The Company maintains comprehensive insurance coverage for general liability, property, business interruption and other risks with respect to all of its hotels. These policies offer coverage features and insured limits that the Company believes are customary for similar types of properties. There are no assurances that coverage will be available or at reasonable rates in the future. Also, various types of catastrophic losses, like earthquakes, hurricanes, or certain types of terrorism, may not be insurable or may not be economically insurable. Even when insurable, these policies may have high deductibles and/or high premiums. Additionally, although the Company may be insured for a particular loss, the Company is not insured against the impact a catastrophic event may have on the industry as a whole. There also can be risks such as certain environmental hazards that may be deemed to fall outside of the coverage. In the event of a substantial loss, the Company’s insurance coverage may not be sufficient to cover the full current market value or replacement cost of its lost investment. Should an uninsured loss or a loss in excess of insured limits occur, the Company could lose all or a portion of the capital it has invested in a hotel, as well as the anticipated future revenue from the hotel. In that event, the Company might nevertheless remain obligated for any mortgage debt or other financial obligations related to the hotel. Inflation, changes in building codes and ordinances, environmental considerations and other factors might also prevent the Company from using insurance proceeds to replace or renovate a hotel after it has been damaged or destroyed. The Company also may encounter challenges with an insurance provider regarding whether it will pay a particular claim that the Company believes to be covered under its policy. Under those circumstances, the insurance proceeds the Company receives might be inadequate to restore its economic position in the damaged or destroyed hotel, which could have a material adverse effect on the Company’s financial condition and results of operations.
The Company faces possible risks associated with the physical effects of climate change.
The Company is subject to the risks associated with the physical effects of climate change, which could include more frequent or severe storms, droughts, hurricanes and flooding, any of which could have a material adverse effect on the Company’s properties, operations and business. To the extent climate change causes changes in weather patterns, its markets could experience increases in storm intensity and rising sea-levels causing damage to the Company’s properties. Over time, these conditions could result in declining hotel demand or the Company’s inability to operate the affected hotels at all. Climate change also may have indirect effects on its business by increasing the cost of (or making unavailable) property insurance on terms the Company finds acceptable, as well as increasing the cost of renovations, energy, water and snow removal at its properties. The Company cannot predict with certainty whether climate change is occurring and, if so, at what rate, and therefore, there can be no assurance that climate change will not have a material adverse effect on the Company.
The Company could incur significant, material costs related to government regulation and litigation with respect to environmental matters, which could have a material adverse effect on the Company.
The Company’s hotels are subject to various U.S. federal, state and local environmental laws that impose liability for contamination. Under these laws, governmental entities have the authority to require the Company, as the current owner of a hotel, to perform or pay for the clean-up of contamination (including hazardous substances, asbestos and asbestos-containing materials, waste, petroleum products or mold) at, on, under or emanating from the hotel and to pay for natural resource damages arising from such contamination. Such laws often impose liability without regard to whether the owner or operator or other responsible party knew of, or caused such contamination, and the liability may be joint and several. Because these laws also impose liability on persons who owned or operated a property at the time it became contaminated, it is possible the Company could incur cleanup costs or other environmental liabilities even after it sells or no longer operates hotels. Contamination at, on, under or emanating from the Company’s hotels also may expose it to liability to private parties for costs of remediation, personal injury and/or property damage. In addition, environmental laws may create liens on contaminated sites in favor of the
government for damages and costs it incurs to address such contamination. If contamination is discovered on the Company’s properties, environmental laws also may impose restrictions on the manner in which the properties may be used or businesses may be operated, and these restrictions may require substantial expenditures. Moreover, environmental contamination can affect the value of a property and, therefore, an owner’s ability to borrow funds using the property as collateral or to sell the property on favorable terms or at all. Furthermore, persons who sent waste to a waste disposal facility, such as a landfill or an incinerator, may be liable for costs associated with cleanup of that facility.
In addition, the Company’s hotels are subject to various U.S. federal, state, and local environmental, health and safety laws and regulations that address a wide variety of issues, including, but not limited to, storage tanks, air emissions from emergency generators, storm water and wastewater discharges, lead-based paint, mold and mildew, and waste management. Some of the Company’s hotels routinely handle and use hazardous or regulated substances and wastes as part of their operations, which substances and wastes are subject to regulation (e.g., swimming pool chemicals and cleaning supplies). The Company’s hotels incur costs to comply with these environmental, health and safety laws and regulations and could be subject to fines and penalties for non-compliance with applicable requirements.
Liabilities and costs associated with environmental contamination at, on, under or emanating from the hotel’s properties, defending against claims related to alleged or actual environmental issues, or complying with environmental, health and safety laws and regulations could be material and could materially and adversely affect the Company. The Company can make no assurances that changes in current laws or regulations or future laws or regulations will not impose additional or new material environmental liabilities or that the current environmental condition of its hotels will not be affected by its operations, the condition of the properties in the vicinity of its hotels, or by third parties unrelated to the Company. The discovery of material environmental liabilities at its properties could subject the Company to unanticipated significant costs, which could significantly reduce or eliminate its profitability.
The Company may incur significant costs complying with various regulatory requirements, which could materially and adversely affect the Company.
The Company and its hotels are subject to various U.S. federal, state and local regulatory requirements. These requirements are wide ranging and include among others, state and local fire and life safety requirements, federal laws such as the Americans with Disabilities Act of 1990 and the Accessibility Guidelines promulgated thereunder and the Sarbanes-Oxley Act of 2002. Liability and costs associated with complying with these requirements are and could be material. If the Company fails to comply with these various requirements, it could incur governmental fines or private damage awards. In addition, existing requirements could change and future requirements might require the Company to make significant unanticipated expenditures, which could materially and adversely affect the Company.
The Company is currently party to litigation and may be subject to litigation or regulatory inquiries in the future, which may require the Company to incur significant costs.
The Company is currently subject to litigation. See Part I, Item 3, Legal Proceedings, appearing elsewhere in this Annual Report on Form 10-K for additional information pertaining to this litigation. Due to the uncertainties related to litigation, the Company is unable at this time to evaluate the likelihood of either a favorable or unfavorable outcome or to estimate the range of potential exposure. If the outcome is unfavorable, the Company may be required to pay damages and/or change its business practices, any of which could have a material adverse effect on the Company’s financial condition, results of operations and cash flows. Also, other litigation may be filed against the Company in the future. The ability of the Company to access capital markets, including commercial debt markets, could be negatively impacted by unfavorable, or the possibility of unfavorable, outcomes to lawsuits or adverse regulatory actions.
The Company has been and could be subject to regulatory inquiries in the future, which have resulted in and which could result in costs and personnel time commitment to respond. It may also be subject to additional investigations and action by governing regulatory agencies, as a result of its activities, which could result in costs to respond and fines or changes in the Company’s business practices, any of which could have a material adverse effect on the financial condition, results of operations, liquidity and capital resources, and cash flows of the Company.
Risks Related to the Company’s Organization and Structure
The Company’s ownership limitations may restrict or prevent certain acquisitions and transfers of its shares.
In order for the Company to maintain its qualification as a REIT under the Code, not more than 50% in value of its outstanding shares may be owned, directly or indirectly, by five or fewer individuals (as defined in the Code to include certain entities) at any time during the last half of each taxable year following the Company’s first year (the “5/50 Test”). Additionally, at least 100 persons must beneficially own the Company’s shares during at least 335 days of each taxable year (the “100 Shareholder Test”). The Company’s amended and restated articles of incorporation, with certain exceptions, authorizes the Company’s Board of Directors to take the actions that are necessary and desirable to preserve its qualification as a REIT. In addition to the 5/50 Test and the 100 Shareholder Test, the Company’s amended and restated articles of incorporation provide that no person or entity may directly or indirectly, beneficially or constructively, own more than 9.8% of the aggregate of its outstanding common shares or 9.8% of the aggregate of the outstanding preferred shares of any class or series (“share ownership limits”). The Company’s Board of Directors may, in its sole discretion, grant an exemption to the share ownership limits, subject to certain conditions and the receipt by the Board of Directors of certain representations and undertakings. In addition, the Board of Directors may change the share ownership limits. The share ownership limits contained in the amended and restated articles of incorporation key off the ownership at any time by any “person,” which term includes entities, and take into account direct and indirect ownership as determined under various ownership attribution rules in the Code. The share ownership limits also might delay or prevent a transaction or a change in the Company’s control that might involve a premium price for the Company’s common shares or otherwise be in the best interests of its shareholders.
The Company’s amended and restated articles of incorporation allow the Board of Directors to issue up to 30 million “blank check” preferred shares.
The Company’s amended and restated articles of incorporation allow the Board of Directors to issue up to 30 million “blank check” preferred shares, without action by shareholders. Preferred shares may be issued on terms determined by the Board of Directors, and may have rights, privileges and preferences superior to those of common shares. Without limiting the foregoing, (i) such preferred shares could have liquidation rights that are senior to the liquidation preference applicable to common shares, (ii) such preferred shares could have voting or conversion rights, which could adversely affect the voting power of the holders of common shares and (iii) the ownership interest of holders of common shares will be diluted following the issuance of any such preferred shares. In addition, the issuance of blank check preferred shares could have the effect of discouraging, delaying or preventing a change of control of the Company.
Provisions of the Company’s amended and restated articles of incorporation and second amended and restated bylaws could inhibit changes in control.
Provisions in the Company’s amended and restated articles of incorporation and second amended and restated bylaws may make it difficult for another company to acquire it and for shareholders to receive any related takeover premium for its common shares. These provisions include, among other things, a staggered Board of Directors in which the Board of Directors is divided into three classes, with one class elected each year to serve a three-year term, and the absence of cumulative voting in the election of directors. The Company intends to submit a proposal to the Company’s shareholders at the 2018 annual meeting of shareholders to further amend the Company’s amended and restated articles of incorporation to, among other things, destagger the Board of Directors and provide that all directors serve a one-year term. In addition, pursuant to the Company’s second amended and restated bylaws, directors are elected by the plurality of votes cast and entitled to vote in the election of directors. However, the Company’s corporate governance guidelines require that if an incumbent director fails to receive at least a majority of the votes cast, such director will tender his or her resignation from the Board of Directors. The Nominating and Governance Committee of the Board of Directors will consider, and determine whether to accept, such resignation. Additionally, the second amended and restated bylaws of the Company have various advance notice provisions that require shareholders to meet certain requirements and deadlines for proposals at an annual meeting of shareholders. These advance notice provisions may have the effect of delaying, deferring or preventing a transaction or a change in control of the Company that might involve a premium to the price of the Company’s common shares or otherwise be in the shareholders’ best interests.
The Company’s Executive Chairman has interests that may conflict with the interests of the Company.
Glade M. Knight, the Company’s Executive Chairman, is and will be a principal in other real estate investment transactions or programs that may compete with the Company, and he is and may be a principal in other business ventures. Mr. Knight’s management and economic interests in these other transactions or programs may conflict with the interests of the Company.
The Company’s executive officers provide services to other companies that may detract from the time devoted to the Company.
The Company’s executive officers and other employees of the Company may devote time to other companies which have been or may be organized by Mr. Knight in the future. Neither Mr. Knight nor any of the other executive officers is required to devote a fixed amount of time and attention to the Company’s business affairs as opposed to the other companies, which could detract from time devoted to the Company.
The Company may change its operational policies, investment guidelines and its investment and growth strategies without shareholder consent, which may subject it to different and more significant risks in the future, which could materially and adversely affect the Company.
The Board of Directors determines the Company’s operational policies, investment guidelines and its investment and growth strategies, subject to the restrictions on certain transactions as set forth in the second amended and restated bylaws. The Board of Directors may make changes to, or approve transactions that deviate from, those policies, guidelines and strategies without a vote of, or notice to, shareholders. This could result in the Company conducting operational matters, making investments or pursuing investment or growth strategies different than those contemplated in this Annual Report on Form 10-K. Under any of these circumstances, the Company may expose itself to different and more significant risks in the future, which could materially and adversely affect the Company.
Risks Related to the Ownership of the Company’s Common Shares
The market price of the Company’s common shares may fluctuate widely and there can be no assurance that the market for its common shares will provide shareholders with adequate liquidity.
The Company’s common shares are listed on the NYSE under the ticker symbol “APLE.” The market price of the Company’s common shares may fluctuate widely, depending on many factors, some of which may be beyond the Company’s control, including:
|
·
|
actual versus anticipated differences in the Company’s operating results, liquidity, or financial condition;
|
|
·
|
changes in actual and/or estimated financial performance;
|
|
·
|
publication of research reports about the Company, its hotels or the lodging or overall real estate industry;
|
|
·
|
failure to meet analysts’ revenue or earnings estimates;
|
|
·
|
the extent of institutional investors’ interest in the Company and their decision to buy or sell the Company’s common shares;
|
|
·
|
issuances of common shares or other securities by the Company;
|
|
·
|
the passage of legislation or other regulatory developments that may adversely affect the Company or its industry;
|
|
·
|
the reputation of REITs and real estate investments generally and the attractiveness of REIT equity securities in comparison to other equity securities, including securities issued by other real estate companies, and fixed income instruments;
|
|
·
|
changes in market interest rates compared to the Company’s distribution yield on its common shares;
|
|
·
|
additions and departures of key personnel;
|
|
·
|
announcements by franchisors, operators or other owners in the hospitality industry;
|
|
·
|
the performance and market valuations of similar companies;
|
|
·
|
strategic actions by the Company or its competitors, such as acquisitions or dispositions;
|
|
·
|
fluctuations in the stock price and operating results of the Company’s competitors;
|
|
·
|
speculation in the press or investment community;
|
|
·
|
changes in accounting principles;
|
|
·
|
changes in capital costs;
|
|
·
|
terrorist acts;
|
|
·
|
general market and economic conditions, including factors unrelated to the Company’s operating performance; and
|
|
·
|
the realization of any of the other risk factors presented in this Annual Report on Form 10-K.
|
Stock markets in general have experienced volatility that has often been unrelated to the operating performance of a particular company. These broad market fluctuations may adversely affect the trading price of the Company’s common shares.
The Company may change its distribution policy or may not have funds available to make distributions to shareholders.
The Board of Directors will continue to evaluate the Company’s distribution policy, the impact of the economy on its operations, actual and projected financial condition and results of operations, capital expenditure requirements and other factors, including those discussed in this Annual Report on Form 10-K. While the Company intends to make monthly distributions to shareholders, there can be no assurance that the Company will be able to make distributions at any particular time or rate, or at all. Further, there is no assurance that a distribution rate achieved for a particular period will be maintained in the future. The Company evaluates the distribution rate on an ongoing basis and may make changes at any time if the Company believes the rate is not appropriate based on REIT taxable income, limitations under financing arrangements, or other cash needs. A reduction in the Company’s distribution rate could have a material adverse effect on the market price of the Company’s common shares.
While the Company generally seeks to make distributions from its operating cash flows, distributions may be made (although there is no obligation to do so) in certain circumstances, in part, from financing proceeds or other sources. While distributions from such sources would result in the shareholder receiving cash, the consequences to the shareholders would differ from a distribution from the Company’s operating cash flows. For example, if debt financing is the source of a distribution, that financing would not be available for other opportunities and would have to be repaid.
Future offerings or the perception that future offerings could occur may adversely affect the market price of the Company’s common shares and future offerings may be dilutive to existing shareholders.
The Company has in the past and may in the future issue additional common shares to raise capital necessary to finance hotel acquisitions, fund capital expenditures, pay down outstanding borrowings on its revolving credit facility, refinance debt or for other corporate purposes. A large volume of sales of the Company’s common shares could decrease the market price of the Company’s common shares and could impair the Company’s ability to raise additional capital through the sale of equity securities in the future. Even if a substantial number of sales of common shares are not affected, the mere perception of the possibility of these sales could depress the market price of the Company’s common shares and have a negative effect on the Company’s ability to raise capital in the future. In addition, anticipated downward pressure on the price of the Company’s common shares due to actual or anticipated sales of common shares could cause some institutions or individuals to engage in short sales of the common shares, which may itself cause the price of the common shares to decline. Because the Company’s decision to issue equity securities in any future offering will depend on market conditions and other factors beyond its control, the Company cannot predict or estimate the amount, timing or nature of its future offerings. Therefore, the Company’s shareholders bear the risk of its future offerings reducing the market price of its common shares and diluting their equity interests in the Company.
Tax-Related Risks and Risks Related to the Company’s Status as a REIT
Qualifying as a REIT involves highly technical and complex provisions of the Code and failure of the Company to qualify as a REIT would have adverse consequences to the Company and its shareholders.
The Company’s qualification as a REIT involves the application of highly technical and complex Code provisions for which only limited judicial and administrative authorities exist. Even a technical or inadvertent violation could jeopardize the Company’s REIT qualification. Moreover, new legislation, court decisions or administrative guidance, in each case possibly with retroactive effect, may make it more difficult or impossible for the
Company to qualify as a REIT. Maintaining the Company’s qualification as a REIT will depend on the Company’s satisfaction of certain asset, income, organizational, distribution, shareholder ownership and other requirements on a continuing basis. The Company’s ability to satisfy the REIT income and asset tests depends upon the Company’s analysis of the characterization and fair market values of the Company’s assets, some of which are not susceptible to a precise determination and for which the Company will not obtain independent appraisals, and upon the Company’s ability to successfully manage the composition of its income and assets on an ongoing basis. In addition, the Company’s ability to satisfy the requirements to maintain its qualification as a REIT depends in part on the actions of third parties over which the Company has no control or only limited influence.
If the Company does not qualify as a REIT or if the Company fails to remain qualified as a REIT, the Company will be subject to U.S. federal income tax and potentially state and local taxes, which would reduce the Company’s earnings and the amount of cash available for distribution to its shareholders.
If the Company failed to qualify as a REIT in any taxable year and any available relief provisions did not apply, the Company would be subject to U.S. federal and state corporate income tax, including any applicable alternative minimum tax for taxable years beginning before December 31, 2017, on its taxable income at regular corporate rates, and dividends paid to its shareholders would not be deductible by it in computing its taxable income. Unless the Company was entitled to statutory relief under certain Code provisions, the Company also would be disqualified from taxation as a REIT for the four taxable years following the year in which it failed to qualify as a REIT.
Any determination that the Company does not qualify as a REIT would have a material adverse effect on the Company’s results of operations and could materially reduce the market price of its common shares. The Company’s additional tax liability could be substantial and would reduce its net earnings available for investment, debt service or distributions to shareholders. Furthermore, the Company would no longer be required to make any distributions to shareholders as a condition to REIT qualification and all of its distributions to shareholders would be taxable as ordinary C corporation dividends to the extent of its current and accumulated earnings and profits. The Company’s failure to qualify as a REIT also could cause an event of default under loan documents governing its debt.
Even if the Company qualifies as a REIT, it may face other tax liabilities that reduce its cash flow.
Even if the Company qualifies for taxation as a REIT, it may be subject to certain U.S. federal, state and local taxes, including payroll taxes, taxes on any undistributed income, taxes on income from some activities conducted as a result of a foreclosure, a 100% excise tax on any transactions with a TRS that are not conducted on an arm’s-length basis, and state or local income, franchise, property and transfer taxes. Moreover, if the Company has net income from the sale of properties that are “dealer” properties (a “prohibited transaction” under the Code), that income will be subject to a 100% tax. The Company could, in certain circumstances, be required to pay an excise or penalty tax (which could be significant in amount) in order to utilize one or more relief provisions under the Code to maintain its qualification as a REIT. In addition, the Company’s TRSs will be subject to U.S. federal, state and local corporate income taxes on their net taxable income, if any. Any of these taxes would decrease cash available for the payment of the Company’s debt obligations and distributions to shareholders.
The Company may incur adverse tax consequences if Apple REIT Seven, Inc. (“Apple Seven”), Apple REIT Eight, Inc. (“Apple Eight”) or Apple Ten (collectively, the “merged companies”) failed to qualify as a REIT for U.S. federal income tax purposes, or if the Apple Seven and Apple Eight mergers, and the Apple Ten merger, (collectively, the “mergers”) failed to qualify as a tax free reorganization under the Code.
On March 1, 2014, Apple Seven and Apple Eight merged into acquisition subsidiaries of the Company and ceased their separate corporate existences, and, on September 1, 2016, Apple Ten merged into an acquisition subsidiary of the Company and ceased its separate corporate existence. If any of the merged companies failed to qualify as a REIT for any of their taxable years ending on or before the date of their respective mergers, each of the merged companies, as the case may be, would be liable for (and the Company would be obligated to pay) U.S. federal income tax on its taxable income for such years at regular corporate rates and, assuming the mergers qualified as reorganizations within the meaning of Section 368(a) of the Code,
|
·
|
the Company would be subject to tax on the built-in gain on each asset of the merged companies, as the case may be, existing at the time of each respective merger if the Company was to dispose of
|
|
|
the merged companies assets for up to 5 years following each respective merger. Such tax would be imposed at the highest regular corporate rate in effect at the date of the sale,
|
|
·
|
the Company would succeed to any earnings and profits accumulated by the merged companies for taxable periods that it did not qualify as a REIT, and the Company would have to pay a special dividend and/or employ applicable deficiency dividend procedures (including interest payments to the Internal Revenue Service (the “IRS”)) to eliminate such earnings and profits (if the Company does not timely distribute those earnings and profits, the Company could fail to qualify as a REIT), and
|
|
·
|
if any merged company incurred any unpaid tax liabilities prior to the merger, those tax liabilities would be transferred to the Company as a result of the merger.
|
If there is an adjustment to any of the merged companies’ taxable income or dividends paid deductions, the Company could elect to use the deficiency dividend procedure in order to maintain that merged company’s REIT status. That deficiency dividend procedure could require the Company to make significant distributions to its shareholders and to pay significant interest to the IRS.
Moreover, and irrespective of whether each of the merged companies qualified as a REIT, if any were to incur tax liabilities as a result of the failure of the mergers to qualify as a reorganization within the meaning of Section 368(a) of the Code, those tax liabilities would be transferred to the Company as a result of the mergers. Any of the merged companies’ failure (before or at the date of the respective mergers) to qualify as a REIT and/or a failure of the mergers to qualify as reorganizations within the meaning of Section 368(a) of the Code could impair the Company’s ability after the mergers to expand its business and raise capital, and could materially adversely affect the value of the Company’s common shares.
REIT distribution requirements could adversely affect the Company’s ability to execute its business plan or cause it to increase debt levels or issue additional equity during unfavorable market conditions.
The Company generally must distribute annually at least 90% of its REIT taxable income, subject to certain adjustments and excluding any net capital gain, in order for U.S. federal corporate income tax not to apply to earnings that it distributes. To the extent that the Company satisfies this distribution requirement but distributes less than 100% of its taxable income, the Company will be subject to U.S. federal corporate income tax on its undistributed taxable income. In addition, the Company will be subject to a 4% nondeductible excise tax if the actual amount that the Company pays out to its shareholders in a calendar year is less than a minimum amount specified under U.S. federal tax laws. If there is an adjustment to any of the Company’s taxable income or dividends paid deductions, the Company could elect to use the deficiency dividend procedure in order to maintain the Company’s REIT status. That deficiency dividend procedure could require the Company to make significant distributions to its shareholders and to pay significant interest to the IRS.
From time to time, the Company may generate taxable income greater than its income for financial reporting purposes prepared in accordance with accounting principles generally accepted in the United States of America (“GAAP”). In addition, differences in timing between the recognition of taxable income and the actual receipt of cash may occur. As a result, the Company may find it difficult or impossible to meet distribution requirements in certain circumstances. In particular, where the Company experiences differences in timing between the recognition of taxable income and the actual receipt of cash, the requirement to distribute a substantial portion of its taxable income could cause it to: (1) sell assets in adverse market conditions; (2) incur debt or issue additional equity on unfavorable terms; (3) distribute amounts that would otherwise be invested in future acquisitions or capital expenditures or used for the repayment of debt; or (4) make a taxable distribution of its common shares as part of a distribution in which shareholders may elect to receive the Company’s common shares or (subject to a limit measured as a percentage of the total distribution) cash, in order to comply with REIT requirements. These alternatives could increase the Company’s costs or dilute its equity. In addition, because the REIT distribution requirement prevents the Company from retaining earnings, the Company generally will be required to refinance debt at its maturity with additional debt or equity. Thus, compliance with the REIT requirements may hinder the Company’s ability to grow, which could adversely affect the market price of its common shares.
In the event that distributions made by Apple Seven, Apple Eight, Apple Ten or the Company (the “Apple Companies”) are deemed “preferential dividends,” the Company could be subject to U.S. federal income tax liabilities and could be required to pay a “deficiency dividend” to its shareholders.
For taxable years ending on or before December 31, 2014, in order for distributions to be counted toward satisfying the annual distribution requirement for REITs, and to provide the Company with a REIT-level tax deduction, the distributions must not be “preferential dividends.” A dividend is not a preferential dividend if the distribution is (1) pro rata among all outstanding shares within a particular class, and (2) in accordance with the preferences among different classes of shares as set forth in the Company’s organizational documents. For each taxable year commencing with the taxable year that began on January 1, 2015, so long as the Company continues to be a “publicly offered REIT” (i.e., a REIT which is required to file annual and periodic reports with the SEC under the Exchange Act), the preferential dividend rule will not apply to the Company.
Each of Apple Seven, Apple Eight, and the Company (the “Apple REITs”) issued units (which, at the time, consisted of one common share together with one Series A preferred share of the applicable Apple REIT) under their dividend reinvestment plans (“DRIPs”) until June 2013. Participation in the DRIPs was at the discretion of each shareholder. Pursuant to the DRIPs, each of the Apple REITs sold its units at a price per unit that was based on the most recent price at which an unrelated person had purchased units from that Apple REIT. This method of issuing units could present the issue of whether the distributions were “preferential distributions” and thus would not have counted toward satisfying the annual distribution requirement which could have resulted in the loss of its REIT status. The Company believes each Apple REIT’s DRIP has not violated the prohibition on the payment of preferential dividends; however, there can be no assurance or guarantee that the IRS will concur.
If any Apple Company violated the prohibition on the payment of preferential dividends and that violation caused it to fail to meet the annual distribution requirement with respect to any year, such failure would preclude that Apple Company from qualifying as a REIT for U.S. federal income tax purposes and disqualify that Apple Company from taxation as a REIT for the four taxable years following the year during which its qualification was lost. That result could subject the Company to federal income tax liabilities. The requirement to pay any federal income tax liabilities could have an adverse effect on the Company’s ability to make the required distributions to meet the 90% distribution requirement. If it were determined that certain distributions by the Apple Companies to shareholders failed to qualify for the dividends paid deduction for one or more taxable years with the result that any of the Apple Companies would not have satisfied its distribution requirement with respect to any such taxable year, the Company would expect to pay a “deficiency dividend” to its shareholders in the amount necessary to permit each Apple Company to satisfy the distribution requirements of Section 857 of the Code for each such taxable year. The amount of the deficiency dividend (plus the interest payable to the IRS) that would need to be paid for all of the Apple Companies in that circumstance could be significant.
The Company may in the future choose to pay dividends in the form of common shares, in which case shareholders may be required to pay income taxes in excess of the cash dividends they receive.
The Company may seek in the future to distribute taxable dividends that are payable in cash and common shares, at the election of each shareholder. Taxable shareholders receiving such dividends will be required to include the full amount of the dividend as ordinary income to the extent of the Company’s current and accumulated earnings and profits for U.S. federal income tax purposes. As a result, shareholders may be required to pay income taxes with respect to such dividends in excess of the cash dividends received. If a U.S. shareholder sells the common shares that it receives as a dividend in order to pay this tax, the sales proceeds may be less than the amount included in income with respect to the dividend, depending on the market price of common shares at the time of the sale. In addition, in such case, a U.S. shareholder could have a capital loss with respect to the common shares sold that could not be used to offset such dividend income. Furthermore, with respect to certain non-U.S. shareholders, the Company may be required to withhold U.S. federal income tax with respect to such dividends, including in respect of all or a portion of such dividend that is payable in common shares. In addition, such a taxable share dividend could be viewed as equivalent to a reduction in the Company’s cash distributions, and that factor, as well as the possibility that a significant number of the Company’s shareholders could determine to sell the common shares in order to pay taxes owed on dividends, may put downward pressure on the market price of the Company’s common shares.
If the Company’s leases are not respected as true leases for U.S. federal income tax purposes, the Company would likely fail to qualify as a REIT.
To qualify as a REIT, the Company must satisfy two gross income tests, pursuant to which specified percentages of the Company’s gross income must be passive income, such as rent. For the rent paid pursuant to the hotel leases with the Company’s TRSs, which the Company currently expects will continue to constitute substantially
all of the REIT’s gross income, to qualify for purposes of the gross income tests, the leases must be respected as true leases for federal income tax purposes and must not be treated as service contracts, joint ventures or some other type of arrangement. The Company believes that the leases have been and will continue to be respected as true leases for federal income tax purposes. There can be no assurance, however, that the IRS will agree with this characterization. If the leases were not respected as true leases for federal income tax purposes, the Company may not be able to satisfy either of the two gross income tests applicable to REITs and may lose its REIT status. Additionally, the Company could be subject to a 100% excise tax for any adjustment to its leases.
If any of the hotel management companies that the Company’s TRSs engage do not qualify as “eligible independent contractors,” or if the Company’s hotels are not “qualified lodging facilities,” the Company would likely fail to qualify as a REIT.
Rent paid by a lessee that is a “related party tenant” of the Company generally will not be qualifying income for purposes of the two gross income tests applicable to REITs. An exception is provided, however, for leases of “qualified lodging facilities” to a TRS so long as the hotels are managed by an “eligible independent contractor” and certain other requirements are satisfied. The Company intends to continue to take advantage of this exception. The Company leases and expects to continue to lease all or substantially all of its hotels to TRS lessees and to engage hotel management companies that are intended to qualify as “eligible independent contractors.” Among other requirements, in order to qualify as an eligible independent contractor, the hotel management company must not own, directly or through its shareholders, more than 35% of the Company’s outstanding shares, and no person or group of persons can own more than 35% of the Company’s outstanding shares and the shares (or ownership interest) of the hotel management company (taking into account certain ownership attribution rules). The ownership attribution rules that apply for purposes of these 35% thresholds are complex, and monitoring actual and constructive ownership of the Company’s shares by the hotel management companies and their owners may not be practical. Accordingly, there can be no assurance that these ownership levels will not be exceeded.
In addition, for a hotel management company to qualify as an eligible independent contractor, such company or a related person must be actively engaged in the trade or business of operating “qualified lodging facilities” (as defined below) for one or more persons not related to the REIT or its TRSs at each time that such company enters into a hotel management contract with a TRS. As of the date hereof, the Company believes the hotel management companies operate qualified lodging facilities for certain persons who are not related to the Company or its TRSs. However, no assurances can be provided that this will continue to be the case or that any other hotel management companies that the Company may engage in the future will in fact comply with this requirement in the future. Finally, each hotel with respect to which the Company’s TRS lessees pay rent must be a “qualified lodging facility.” A “qualified lodging facility” is a hotel, motel, or other establishment more than one-half of the dwelling units in which are used on a transient basis, including customary amenities and facilities, provided that no wagering activities are conducted at or in connection with such facility by any person who is engaged in the business of accepting wagers and who is legally authorized to engage in such business at or in connection with such facility. Although the Company intends to monitor future acquisitions and improvements of hotels, the REIT provisions of the Code provide only limited guidance for making determinations under the requirements for qualified lodging facilities, and there can be no assurance that these requirements will be satisfied in all cases.
The Company’s ownership of TRSs is limited, and the Company’s transactions with its TRSs will cause it to be subject to a 100% penalty tax on certain income or deductions if those transactions are not conducted on arm’s-length terms.
A REIT may own up to 100% of the stock of one or more TRSs. A TRS may hold assets and earn income that would not be qualifying assets or income if held or earned directly by a REIT. Both the subsidiary and the REIT must jointly elect to treat the subsidiary as a TRS. A corporation of which a TRS directly or indirectly owns more than 35% of the voting power or value of the stock will automatically be treated as a TRS. Overall, no more than 25% (20% for tax years beginning after December 31, 2017) of the value of a REIT’s assets may consist of stock or securities of one or more TRSs. In addition, the rules applicable to TRSs limit the deductibility of interest paid or accrued by a TRS to its parent REIT to assure that the TRS is subject to an appropriate level of corporate taxation. The rules also impose a 100% excise tax on certain transactions, including the leases, between the TRS and the REIT that are not conducted on an arm’s-length basis.
The Company’s TRSs will pay U.S. federal, state and local income taxes on their net taxable income, and their after-tax net income will be available for distribution to the REIT but is not required to be distributed. The Company believes that the aggregate value of the stock and securities of its TRSs has been and will continue to be less than 25% (20% for tax years beginning after December 31, 2017) of the value of its total assets (including the stock and securities of its TRSs). Furthermore, the Company has monitored and will continue to monitor the value of its respective investments in its TRSs for the purpose of ensuring compliance with the ownership limitations applicable to TRSs. In addition, the Company will continue to scrutinize all of its transactions with its TRSs to ensure that they are entered into on arm’s-length terms to avoid incurring the 100% excise tax. There can be no assurance, however, that the Company will be able to comply with the rules regarding TRSs or to avoid application of the 100% excise tax. The most significant transactions between the Company and its TRSs are the hotel leases from the Company to its TRSs. While the Company believes its leases have customary terms and reflect normal business practices and that the rents paid thereto reflect market terms, there can be no assurance that the IRS will agree.
Complying with REIT requirements may force the Company to forgo and/or liquidate otherwise attractive investment opportunities.
To qualify as a REIT, the Company must continually satisfy tests concerning, among other things, the sources of its income, the nature and diversification of its assets, the amount it distributes to its shareholders and the ownership of its common shares. In order to meet these tests, the Company may be required to liquidate from its portfolio, or contribute to a TRS, otherwise attractive investments in order to maintain its qualification as a REIT. These actions could have the effect of reducing the Company’s income and amounts available for distribution to its shareholders. In addition, the Company may be required to make distributions to shareholders at disadvantageous times or when the Company does not have funds readily available for distribution, and may be unable to pursue investments that would otherwise be advantageous to it in order to satisfy the source of income or asset diversification requirements for qualifying as a REIT. Thus, compliance with the REIT requirements may hinder the Company’s ability to make, and, in certain cases, maintain ownership of, certain attractive investments.
The Company’s inability to deduct for tax purposes compensation paid to its executives could require it to increase its distributions to shareholders in order to maintain its REIT status or to avoid entity-level taxes.
Section 162(m) of the Code prohibits publicly held corporations from taking a tax deduction for annual compensation in excess of $1 million paid to any of the corporation’s “covered employees.” Prior to the enactment of the Tax Cuts and Jobs Act (the “Act”), a publicly held corporation’s covered employees included its chief executive officer and three other most highly compensated executive officers (other than the chief financial officer), and certain “performance-based compensation” was excluded from the $1 million cap. The Act made certain changes to Section 162(m), effective for taxable years beginning after December 31, 2017. These changes include, among others, expanding the definition of “covered employees” to include the chief financial officer and repealing the performance-based compensation exception to the $1 million cap, subject to a transition rule for remuneration provided pursuant to a written binding contract which was in effect on November 2, 2017, and which was not modified in any material respect on or after that date.
Since the Company qualifies as a REIT under the Code and is generally not subject to U.S. federal income taxes other than through its TRSs, if compensation did not qualify for deduction under Section 162(m), the payment of compensation that fails to satisfy the requirements of Section 162(m) would not have a material adverse consequence to the Company, provided the Company continues to distribute 100% of its taxable income. Based on the Company’s current taxable income and distributions, the Company does not believe that it will be required to increase its rate of distributions in order to maintain its status as a REIT (or to avoid paying corporate or excise taxes at the entity level) if the Company’s payment of compensation fails to satisfy the requirements of Section 162(m). However, in that case, a larger portion of shareholder distributions that would otherwise have been treated as a return of capital will be subject to U.S. federal income tax as dividend income. In the future, if the Company makes compensation payments subject to Section 162(m) limitations on deductibility, the Company may be required to make additional distributions to shareholders to comply with REIT distribution requirements and eliminate U.S. federal income tax liability at the entity level. Any such compensation allocated to the TRSs whose income is subject to U.S. federal income tax would result in an increase in income taxes due to the inability to deduct such compensation.
There is a risk of changes in the tax law applicable to REITs.
The IRS, the United States Treasury Department and Congress frequently review U.S. federal income tax legislation, regulations and other guidance. The Company cannot predict whether, when or to what extent new U.S. federal tax laws, regulations, interpretations or rulings will be adopted. Any legislative action may prospectively or retroactively modify the Company’s tax treatment and, therefore, may adversely affect taxation of the Company or the Company’s shareholders. In particular, the Act, which was signed into law on December 22, 2017 and which generally takes effect for taxable years beginning on or after January 1, 2018, makes many significant changes to the U.S. federal income tax laws that will impact the taxation of individuals and corporations (both regular C corporations as well as, to a lesser extent, corporations that have elected to be taxed as REITs). These changes will impact the Company and the Company’s shareholders in various ways, although, based on the Company’s initial assessment, the impact of these changes are not expected to be material. To date, the IRS has issued only limited guidance with respect to certain of the new provisions, and there are numerous interpretive issues that will require guidance. It is highly likely that technical correction legislation will be needed to clarify certain aspects of the new law and give proper effect to Congressional intent. There can be no assurance, however, that technical clarifications or changes needed to prevent unintended or unforeseen tax consequences will be enacted by Congress in the near future.
None.
As of December 31, 2017, the Company owned 239 hotels with an aggregate of 30,322 rooms located in 34 states. All of the Company’s hotels operate under Marriott or Hilton brands. The hotels are operated and managed under separate management agreements with 23 hotel management companies, none of which are affiliated with the Company. The following tables summarize the number of hotels and rooms by brand and state:
|
Number of Hotels and Guest Rooms by Brand
|
||||||||
|
Number of
|
Number of
|
|||||||
|
Brand
|
Hotels
|
Rooms
|
||||||
|
Hilton Garden Inn
|
42
|
5,807
|
||||||
|
Courtyard
|
40
|
5,460
|
||||||
|
Hampton
|
36
|
4,422
|
||||||
|
Residence Inn
|
34
|
4,011
|
||||||
|
Homewood Suites
|
34
|
3,831
|
||||||
|
SpringHill Suites
|
17
|
2,248
|
||||||
|
TownePlace Suites
|
12
|
1,196
|
||||||
|
Fairfield Inn
|
11
|
1,300
|
||||||
|
Home2 Suites
|
8
|
910
|
||||||
|
Marriott
|
2
|
616
|
||||||
|
Embassy Suites
|
2
|
316
|
||||||
|
Renaissance
|
1
|
205
|
||||||
|
Total
|
239
|
30,322
|
||||||
|
Number of Hotels and Guest Rooms by State
|
||||||||
|
Number of
|
Number of
|
|||||||
|
State
|
Hotels
|
Rooms
|
||||||
|
Alabama
|
15
|
1,434
|
||||||
|
Alaska
|
2
|
304
|
||||||
|
Arizona
|
11
|
1,434
|
||||||
|
Arkansas
|
4
|
408
|
||||||
|
California
|
27
|
3,807
|
||||||
|
Colorado
|
4
|
567
|
||||||
|
Florida
|
23
|
2,851
|
||||||
|
Georgia
|
6
|
596
|
||||||
|
Idaho
|
2
|
416
|
||||||
|
Illinois
|
8
|
1,420
|
||||||
|
Indiana
|
4
|
479
|
||||||
|
Iowa
|
3
|
301
|
||||||
|
Kansas
|
4
|
422
|
||||||
|
Louisiana
|
4
|
541
|
||||||
|
Maine
|
1
|
179
|
||||||
|
Maryland
|
2
|
233
|
||||||
|
Massachusetts
|
4
|
466
|
||||||
|
Michigan
|
1
|
148
|
||||||
|
Minnesota
|
2
|
244
|
||||||
|
Mississippi
|
2
|
168
|
||||||
|
Missouri
|
4
|
544
|
||||||
|
Nebraska
|
4
|
621
|
||||||
|
New Jersey
|
5
|
629
|
||||||
|
New York
|
4
|
550
|
||||||
|
North Carolina
|
12
|
1,337
|
||||||
|
Ohio
|
2
|
252
|
||||||
|
Oklahoma
|
4
|
545
|
||||||
|
Pennsylvania
|
3
|
391
|
||||||
|
South Carolina
|
5
|
538
|
||||||
|
Tennessee
|
12
|
1,356
|
||||||
|
Texas
|
34
|
4,072
|
||||||
|
Utah
|
3
|
393
|
||||||
|
Virginia
|
14
|
2,067
|
||||||
|
Washington
|
4
|
609
|
||||||
|
Total
|
239
|
30,322
|
||||||
The following table is a list of the 239 hotels the Company owned as of December 31, 2017. As noted below, 14 of the Company’s hotels are subject to ground leases and 29 of its hotels are encumbered by mortgage notes.
|
City
|
State
|
Brand
|
Manager
|
Date Acquired or Completed
|
Rooms
|
||||||||
|
Anchorage
|
AK
|
Embassy Suites
|
Stonebridge
|
4/30/2010
|
169
|
(2)
|
|||||||
|
Anchorage
|
AK
|
Home2 Suites
|
Stonebridge
|
12/1/2017
|
135
|
||||||||
|
Auburn
|
AL
|
Hilton Garden Inn
|
LBA
|
3/1/2014
|
101
|
||||||||
|
Birmingham
|
AL
|
Courtyard
|
LBA
|
3/1/2014
|
84
|
||||||||
|
Birmingham
|
AL
|
Hilton Garden Inn
|
LBA
|
9/12/2017
|
104
|
||||||||
|
Birmingham
|
AL
|
Home2 Suites
|
LBA
|
9/12/2017
|
106
|
||||||||
|
Birmingham
|
AL
|
Homewood Suites
|
McKibbon
|
3/1/2014
|
95
|
||||||||
|
Dothan
|
AL
|
Hilton Garden Inn
|
LBA
|
6/1/2009
|
104
|
||||||||
|
Dothan
|
AL
|
Residence Inn
|
LBA
|
3/1/2014
|
84
|
||||||||
|
Huntsville
|
AL
|
Hampton
|
LBA
|
9/1/2016
|
98
|
||||||||
|
Huntsville
|
AL
|
Hilton Garden Inn
|
LBA
|
3/1/2014
|
101
|
||||||||
|
Huntsville
|
AL
|
Home2 Suites
|
LBA
|
9/1/2016
|
77
|
||||||||
|
Huntsville
|
AL
|
Homewood Suites
|
LBA
|
3/1/2014
|
107
|
(2)
|
|||||||
|
Mobile
|
AL
|
Hampton
|
McKibbon
|
9/1/2016
|
101
|
(1)
|
|||||||
|
Montgomery
|
AL
|
Hilton Garden Inn
|
LBA
|
3/1/2014
|
97
|
||||||||
|
Montgomery
|
AL
|
Homewood Suites
|
LBA
|
3/1/2014
|
91
|
||||||||
|
Prattville
|
AL
|
Courtyard
|
LBA
|
3/1/2014
|
84
|
(2)
|
|||||||
|
Rogers
|
AR
|
Hampton
|
Raymond
|
8/31/2010
|
122
|
||||||||
|
Rogers
|
AR
|
Homewood Suites
|
Raymond
|
4/30/2010
|
126
|
||||||||
|
Rogers
|
AR
|
Residence Inn
|
Raymond
|
3/1/2014
|
88
|
||||||||
|
Springdale
|
AR
|
Residence Inn
|
Aimbridge
|
3/1/2014
|
72
|
||||||||
|
Chandler
|
AZ
|
Courtyard
|
North Central
|
11/2/2010
|
150
|
||||||||
|
Chandler
|
AZ
|
Fairfield Inn & Suites
|
North Central
|
11/2/2010
|
110
|
||||||||
|
Phoenix
|
AZ
|
Courtyard
|
North Central
|
11/2/2010
|
164
|
||||||||
|
Phoenix
|
AZ
|
Courtyard
|
North Central
|
9/1/2016
|
127
|
||||||||
|
Phoenix
|
AZ
|
Hampton
|
North Central
|
9/1/2016
|
125
|
(1)
|
|||||||
|
Phoenix
|
AZ
|
Homewood Suites
|
North Central
|
9/1/2016
|
134
|
(1)
|
|||||||
|
Phoenix
|
AZ
|
Residence Inn
|
North Central
|
11/2/2010
|
129
|
||||||||
|
Scottsdale
|
AZ
|
Hilton Garden Inn
|
North Central
|
9/1/2016
|
122
|
||||||||
|
Tucson
|
AZ
|
Hilton Garden Inn
|
Western
|
7/31/2008
|
125
|
||||||||
|
Tucson
|
AZ
|
Residence Inn
|
Western
|
3/1/2014
|
124
|
||||||||
|
Tucson
|
AZ
|
TownePlace Suites
|
Western
|
10/6/2011
|
124
|
||||||||
|
Agoura Hills
|
CA
|
Homewood Suites
|
Dimension
|
3/1/2014
|
125
|
||||||||
|
Burbank
|
CA
|
Courtyard
|
Huntington
|
8/11/2015
|
190
|
(2)
|
|||||||
|
Burbank
|
CA
|
Residence Inn
|
Marriott
|
3/1/2014
|
166
|
||||||||
|
Burbank
|
CA
|
SpringHill Suites
|
Marriott
|
7/13/2015
|
170
|
||||||||
|
Clovis
|
CA
|
Hampton
|
Dimension
|
7/31/2009
|
86
|
||||||||
|
Clovis
|
CA
|
Homewood Suites
|
Dimension
|
2/2/2010
|
83
|
||||||||
|
Cypress
|
CA
|
Courtyard
|
Dimension
|
3/1/2014
|
180
|
||||||||
|
Cypress
|
CA
|
Hampton
|
Dimension
|
6/29/2015
|
110
|
||||||||
|
Oceanside
|
CA
|
Courtyard
|
Marriott
|
9/1/2016
|
142
|
(2)
|
|||||||
|
Oceanside
|
CA
|
Residence Inn
|
Marriott
|
3/1/2014
|
125
|
||||||||
|
Rancho Bernardo/San Diego
|
CA
|
Courtyard
|
InnVentures
|
3/1/2014
|
210
|
(2)
|
|||||||
|
Sacramento
|
CA
|
Hilton Garden Inn
|
Dimension
|
3/1/2014
|
153
|
||||||||
|
San Bernardino
|
CA
|
Residence Inn
|
InnVentures
|
2/16/2011
|
95
|
||||||||
|
San Diego
|
CA
|
Courtyard
|
Huntington
|
9/1/2015
|
245
|
(2)
|
|||||||
|
San Diego
|
CA
|
Hampton
|
Dimension
|
3/1/2014
|
177
|
(2)
|
|||||||
|
San Diego
|
CA
|
Hilton Garden Inn
|
InnVentures
|
3/1/2014
|
200
|
||||||||
|
San Diego
|
CA
|
Residence Inn
|
Dimension
|
3/1/2014
|
121
|
(2)
|
|||||||
|
San Jose
|
CA
|
Homewood Suites
|
Dimension
|
3/1/2014
|
140
|
(2)
|
|||||||
|
San Juan Capistrano
|
CA
|
Residence Inn
|
Marriott
|
9/1/2016
|
130
|
(1)(2)
|
|||||||
|
Santa Ana
|
CA
|
Courtyard
|
Dimension
|
5/23/2011
|
155
|
||||||||
|
Santa Clarita
|
CA
|
Courtyard
|
Dimension
|
9/24/2008
|
140
|
||||||||
|
Santa Clarita
|
CA
|
Fairfield Inn
|
Dimension
|
10/29/2008
|
66
|
||||||||
|
City
|
State
|
Brand
|
Manager
|
Date Acquired or Completed
|
Rooms
|
||||||||
|
Santa Clarita
|
CA
|
Hampton
|
Dimension
|
10/29/2008
|
128
|
||||||||
|
Santa Clarita
|
CA
|
Residence Inn
|
Dimension
|
10/29/2008
|
90
|
||||||||
|
Tulare
|
CA
|
Hampton
|
InnVentures
|
3/1/2014
|
86
|
||||||||
|
Tustin
|
CA
|
Fairfield Inn & Suites
|
Marriott
|
9/1/2016
|
145
|
||||||||
|
Tustin
|
CA
|
Residence Inn
|
Marriott
|
9/1/2016
|
149
|
||||||||
|
Colorado Springs
|
CO
|
Hampton
|
Chartwell
|
9/1/2016
|
101
|
(2)
|
|||||||
|
Denver
|
CO
|
Hilton Garden Inn
|
Stonebridge
|
9/1/2016
|
221
|
(2)
|
|||||||
|
Highlands Ranch
|
CO
|
Hilton Garden Inn
|
Dimension
|
3/1/2014
|
128
|
||||||||
|
Highlands Ranch
|
CO
|
Residence Inn
|
Dimension
|
3/1/2014
|
117
|
||||||||
|
Boca Raton
|
FL
|
Hilton Garden Inn
|
White Lodging
|
9/1/2016
|
149
|
||||||||
|
Cape Canaveral
|
FL
|
Homewood Suites
|
LBA
|
9/1/2016
|
153
|
||||||||
|
Fort Lauderdale
|
FL
|
Hampton
|
Vista Host
|
12/31/2008
|
109
|
||||||||
|
Fort Lauderdale
|
FL
|
Hampton
|
LBA
|
6/23/2015
|
156
|
||||||||
|
Fort Lauderdale
|
FL
|
Residence Inn
|
LBA
|
9/1/2016
|
156
|
||||||||
|
Gainesville
|
FL
|
Hilton Garden Inn
|
McKibbon
|
9/1/2016
|
104
|
||||||||
|
Gainesville
|
FL
|
Homewood Suites
|
McKibbon
|
9/1/2016
|
103
|
||||||||
|
Jacksonville
|
FL
|
Homewood Suites
|
McKibbon
|
3/1/2014
|
119
|
||||||||
|
Lakeland
|
FL
|
Courtyard
|
LBA
|
3/1/2014
|
78
|
||||||||
|
Miami
|
FL
|
Courtyard
|
Dimension
|
3/1/2014
|
118
|
(1)
|
|||||||
|
Miami
|
FL
|
Hampton
|
White Lodging
|
4/9/2010
|
121
|
||||||||
|
Miami
|
FL
|
Homewood Suites
|
Dimension
|
3/1/2014
|
162
|
(2)
|
|||||||
|
Orlando
|
FL
|
Fairfield Inn & Suites
|
Marriott
|
7/1/2009
|
200
|
||||||||
|
Orlando
|
FL
|
SpringHill Suites
|
Marriott
|
7/1/2009
|
200
|
||||||||
|
Panama City
|
FL
|
Hampton
|
LBA
|
3/12/2009
|
95
|
||||||||
|
Panama City
|
FL
|
TownePlace Suites
|
LBA
|
1/19/2010
|
103
|
||||||||
|
Pensacola
|
FL
|
TownePlace Suites
|
McKibbon
|
9/1/2016
|
97
|
||||||||
|
Sanford
|
FL
|
SpringHill Suites
|
LBA
|
3/1/2014
|
105
|
||||||||
|
Sarasota
|
FL
|
Homewood Suites
|
Hilton
|
3/1/2014
|
100
|
||||||||
|
Tallahassee
|
FL
|
Fairfield Inn & Suites
|
LBA
|
9/1/2016
|
97
|
||||||||
|
Tallahassee
|
FL
|
Hilton Garden Inn
|
LBA
|
3/1/2014
|
85
|
(1)
|
|||||||
|
Tampa
|
FL
|
Embassy Suites
|
White Lodging
|
11/2/2010
|
147
|
||||||||
|
Tampa
|
FL
|
TownePlace Suites
|
McKibbon
|
3/1/2014
|
94
|
||||||||
|
Albany
|
GA
|
Fairfield Inn & Suites
|
LBA
|
1/14/2010
|
87
|
||||||||
|
Atlanta
|
GA
|
Home2 Suites
|
McKibbon
|
7/1/2016
|
128
|
||||||||
|
Columbus
|
GA
|
SpringHill Suites
|
LBA
|
3/1/2014
|
89
|
||||||||
|
Columbus
|
GA
|
TownePlace Suites
|
LBA
|
3/1/2014
|
86
|
(1)
|
|||||||
|
Macon
|
GA
|
Hilton Garden Inn
|
LBA
|
3/1/2014
|
101
|
(1)
|
|||||||
|
Savannah
|
GA
|
Hilton Garden Inn
|
Newport
|
3/1/2014
|
105
|
(1)
|
|||||||
|
Cedar Rapids
|
IA
|
Hampton
|
Schulte
|
9/1/2016
|
103
|
||||||||
|
Cedar Rapids
|
IA
|
Homewood Suites
|
Schulte
|
9/1/2016
|
95
|
||||||||
|
Davenport
|
IA
|
Hampton
|
Schulte
|
9/1/2016
|
103
|
||||||||
|
Boise
|
ID
|
Hampton
|
Raymond
|
4/30/2010
|
186
|
(2)
|
|||||||
|
Boise
|
ID
|
SpringHill Suites
|
InnVentures
|
3/1/2014
|
230
|
||||||||
|
Des Plaines
|
IL
|
Hilton Garden Inn
|
Raymond
|
9/1/2016
|
252
|
||||||||
|
Hoffman Estates
|
IL
|
Hilton Garden Inn
|
White Lodging
|
9/1/2016
|
184
|
||||||||
|
Mettawa
|
IL
|
Hilton Garden Inn
|
White Lodging
|
11/2/2010
|
170
|
||||||||
|
Mettawa
|
IL
|
Residence Inn
|
White Lodging
|
11/2/2010
|
130
|
||||||||
|
Rosemont
|
IL
|
Hampton
|
Raymond
|
9/1/2016
|
158
|
||||||||
|
Schaumburg
|
IL
|
Hilton Garden Inn
|
White Lodging
|
11/2/2010
|
166
|
||||||||
|
Skokie
|
IL
|
Hampton
|
Raymond
|
9/1/2016
|
225
|
||||||||
|
Warrenville
|
IL
|
Hilton Garden Inn
|
White Lodging
|
11/2/2010
|
135
|
||||||||
|
Indianapolis
|
IN
|
SpringHill Suites
|
White Lodging
|
11/2/2010
|
130
|
||||||||
|
Merrillville
|
IN
|
Hilton Garden Inn
|
White Lodging
|
9/1/2016
|
124
|
||||||||
|
Mishawaka
|
IN
|
Residence Inn
|
White Lodging
|
11/2/2010
|
106
|
||||||||
|
South Bend
|
IN
|
Fairfield Inn & Suites
|
White Lodging
|
9/1/2016
|
119
|
||||||||
|
Overland Park
|
KS
|
Fairfield Inn & Suites
|
True North
|
3/1/2014
|
110
|
||||||||
|
Overland Park
|
KS
|
Residence Inn
|
True North
|
3/1/2014
|
120
|
||||||||
|
City
|
State
|
Brand
|
Manager
|
Date Acquired or Completed
|
Rooms
|
||||||||
|
Overland Park
|
KS
|
SpringHill Suites
|
True North
|
3/1/2014
|
102
|
||||||||
|
Wichita
|
KS
|
Courtyard
|
Aimbridge
|
3/1/2014
|
90
|
||||||||
|
Baton Rouge
|
LA
|
SpringHill Suites
|
Dimension
|
9/25/2009
|
119
|
||||||||
|
Lafayette
|
LA
|
Hilton Garden Inn
|
LBA
|
7/30/2010
|
153
|
(1)
|
|||||||
|
Lafayette
|
LA
|
SpringHill Suites
|
LBA
|
6/23/2011
|
103
|
||||||||
|
New Orleans
|
LA
|
Homewood Suites
|
Dimension
|
3/1/2014
|
166
|
(2)
|
|||||||
|
Andover
|
MA
|
SpringHill Suites
|
Marriott
|
11/5/2010
|
136
|
||||||||
|
Marlborough
|
MA
|
Residence Inn
|
True North
|
3/1/2014
|
112
|
||||||||
|
Westford
|
MA
|
Hampton
|
True North
|
3/1/2014
|
110
|
||||||||
|
Westford
|
MA
|
Residence Inn
|
True North
|
3/1/2014
|
108
|
(2)
|
|||||||
|
Annapolis
|
MD
|
Hilton Garden Inn
|
White Lodging
|
3/1/2014
|
126
|
||||||||
|
Silver Spring
|
MD
|
Hilton Garden Inn
|
White Lodging
|
7/30/2010
|
107
|
||||||||
|
Portland
|
ME
|
Residence Inn
|
Pyramid
|
10/13/2017
|
179
|
||||||||
|
Novi
|
MI
|
Hilton Garden Inn
|
White Lodging
|
11/2/2010
|
148
|
||||||||
|
Maple Grove
|
MN
|
Hilton Garden Inn
|
North Central
|
9/1/2016
|
120
|
||||||||
|
Rochester
|
MN
|
Hampton
|
Raymond
|
8/3/2009
|
124
|
||||||||
|
Kansas City
|
MO
|
Hampton
|
Raymond
|
8/31/2010
|
122
|
||||||||
|
Kansas City
|
MO
|
Residence Inn
|
True North
|
3/1/2014
|
106
|
||||||||
|
St. Louis
|
MO
|
Hampton
|
Raymond
|
8/31/2010
|
190
|
||||||||
|
St. Louis
|
MO
|
Hampton
|
Raymond
|
4/30/2010
|
126
|
||||||||
|
Hattiesburg
|
MS
|
Courtyard
|
LBA
|
3/1/2014
|
84
|
(2)
|
|||||||
|
Hattiesburg
|
MS
|
Residence Inn
|
LBA
|
12/11/2008
|
84
|
||||||||
|
Carolina Beach
|
NC
|
Courtyard
|
Crestline
|
3/1/2014
|
144
|
||||||||
|
Charlotte
|
NC
|
Fairfield Inn & Suites
|
Newport
|
9/1/2016
|
94
|
||||||||
|
Charlotte
|
NC
|
Homewood Suites
|
McKibbon
|
9/24/2008
|
118
|
||||||||
|
Durham
|
NC
|
Homewood Suites
|
McKibbon
|
12/4/2008
|
122
|
||||||||
|
Fayetteville
|
NC
|
Home2 Suites
|
LBA
|
2/3/2011
|
118
|
||||||||
|
Fayetteville
|
NC
|
Residence Inn
|
Aimbridge
|
3/1/2014
|
92
|
||||||||
|
Greensboro
|
NC
|
SpringHill Suites
|
Newport
|
3/1/2014
|
82
|
||||||||
|
Holly Springs
|
NC
|
Hampton
|
LBA
|
11/30/2010
|
124
|
||||||||
|
Jacksonville
|
NC
|
Home2 Suites
|
LBA
|
9/1/2016
|
105
|
||||||||
|
Wilmington
|
NC
|
Fairfield Inn & Suites
|
Crestline
|
3/1/2014
|
122
|
||||||||
|
Winston-Salem
|
NC
|
Courtyard
|
McKibbon
|
3/1/2014
|
122
|
||||||||
|
Winston-Salem
|
NC
|
Hampton
|
McKibbon
|
9/1/2016
|
94
|
||||||||
|
Omaha
|
NE
|
Courtyard
|
Marriott
|
3/1/2014
|
181
|
||||||||
|
Omaha
|
NE
|
Hampton
|
White Lodging
|
9/1/2016
|
139
|
||||||||
|
Omaha
|
NE
|
Hilton Garden Inn
|
White Lodging
|
9/1/2016
|
178
|
(2)
|
|||||||
|
Omaha
|
NE
|
Homewood Suites
|
White Lodging
|
9/1/2016
|
123
|
||||||||
|
Cranford
|
NJ
|
Homewood Suites
|
Dimension
|
3/1/2014
|
108
|
||||||||
|
Mahwah
|
NJ
|
Homewood Suites
|
Dimension
|
3/1/2014
|
110
|
||||||||
|
Mount Laurel
|
NJ
|
Homewood Suites
|
Newport
|
1/11/2011
|
118
|
||||||||
|
Somerset
|
NJ
|
Courtyard
|
Newport
|
3/1/2014
|
162
|
(1)(2)
|
|||||||
|
West Orange
|
NJ
|
Courtyard
|
Newport
|
1/11/2011
|
131
|
||||||||
|
Islip/Ronkonkoma
|
NY
|
Hilton Garden Inn
|
White Lodging
|
3/1/2014
|
165
|
||||||||
|
New York
|
NY
|
Renaissance
|
Highgate
|
3/1/2014
|
205
|
(1)
|
|||||||
|
Syracuse
|
NY
|
Courtyard
|
New Castle
|
10/16/2015
|
102
|
(2)
|
|||||||
|
Syracuse
|
NY
|
Residence Inn
|
New Castle
|
10/16/2015
|
78
|
(2)
|
|||||||
|
Mason
|
OH
|
Hilton Garden Inn
|
Schulte
|
9/1/2016
|
110
|
||||||||
|
Twinsburg
|
OH
|
Hilton Garden Inn
|
Gateway
|
10/7/2008
|
142
|
||||||||
|
Oklahoma City
|
OK
|
Hampton
|
Raymond
|
5/28/2010
|
200
|
||||||||
|
Oklahoma City
|
OK
|
Hilton Garden Inn
|
Raymond
|
9/1/2016
|
155
|
||||||||
|
Oklahoma City
|
OK
|
Homewood Suites
|
Raymond
|
9/1/2016
|
100
|
||||||||
|
Oklahoma City (West)
|
OK
|
Homewood Suites
|
Chartwell
|
9/1/2016
|
90
|
||||||||
|
Collegeville/Philadelphia
|
PA
|
Courtyard
|
White Lodging
|
11/15/2010
|
132
|
(2)
|
|||||||
|
Malvern/Philadelphia
|
PA
|
Courtyard
|
White Lodging
|
11/30/2010
|
127
|
||||||||
|
Pittsburgh
|
PA
|
Hampton
|
Vista Host
|
12/31/2008
|
132
|
||||||||
|
Charleston
|
SC
|
Home2 Suites
|
LBA
|
9/1/2016
|
122
|
||||||||
|
Columbia
|
SC
|
Hilton Garden Inn
|
Newport
|
3/1/2014
|
143
|
||||||||
|
City
|
State
|
Brand
|
Manager
|
Date Acquired or Completed
|
Rooms
|
||||||||
|
Columbia
|
SC
|
TownePlace Suites
|
Newport
|
9/1/2016
|
91
|
||||||||
|
Greenville
|
SC
|
Residence Inn
|
McKibbon
|
3/1/2014
|
78
|
||||||||
|
Hilton Head
|
SC
|
Hilton Garden Inn
|
McKibbon
|
3/1/2014
|
104
|
||||||||
|
Chattanooga
|
TN
|
Homewood Suites
|
LBA
|
3/1/2014
|
76
|
||||||||
|
Franklin
|
TN
|
Courtyard
|
Chartwell
|
9/1/2016
|
126
|
(2)
|
|||||||
|
Franklin
|
TN
|
Residence Inn
|
Chartwell
|
9/1/2016
|
124
|
(2)
|
|||||||
|
Jackson
|
TN
|
Hampton
|
Vista Host
|
12/30/2008
|
83
|
||||||||
|
Johnson City
|
TN
|
Courtyard
|
LBA
|
9/25/2009
|
90
|
||||||||
|
Knoxville
|
TN
|
Homewood Suites
|
McKibbon
|
9/1/2016
|
103
|
||||||||
|
Knoxville
|
TN
|
SpringHill Suites
|
McKibbon
|
9/1/2016
|
103
|
||||||||
|
Knoxville
|
TN
|
TownePlace Suites
|
McKibbon
|
9/1/2016
|
97
|
||||||||
|
Memphis
|
TN
|
Homewood Suites
|
Hilton
|
3/1/2014
|
140
|
||||||||
|
Nashville
|
TN
|
Hilton Garden Inn
|
Vista Host
|
9/30/2010
|
194
|
||||||||
|
Nashville
|
TN
|
Home2 Suites
|
Vista Host
|
5/31/2012
|
119
|
||||||||
|
Nashville
|
TN
|
TownePlace Suites
|
LBA
|
9/1/2016
|
101
|
||||||||
|
Addison
|
TX
|
SpringHill Suites
|
Marriott
|
3/1/2014
|
159
|
||||||||
|
Allen
|
TX
|
Hampton
|
Gateway
|
9/26/2008
|
103
|
||||||||
|
Allen
|
TX
|
Hilton Garden Inn
|
Gateway
|
10/31/2008
|
150
|
||||||||
|
Arlington
|
TX
|
Hampton
|
Western
|
12/1/2010
|
98
|
||||||||
|
Austin
|
TX
|
Courtyard
|
White Lodging
|
11/2/2010
|
145
|
||||||||
|
Austin
|
TX
|
Fairfield Inn & Suites
|
White Lodging
|
11/2/2010
|
150
|
||||||||
|
Austin
|
TX
|
Hampton
|
Vista Host
|
4/14/2009
|
124
|
||||||||
|
Austin
|
TX
|
Hilton Garden Inn
|
White Lodging
|
11/2/2010
|
117
|
||||||||
|
Austin
|
TX
|
Homewood Suites
|
Vista Host
|
4/14/2009
|
97
|
||||||||
|
Austin/Round Rock
|
TX
|
Homewood Suites
|
Vista Host
|
9/1/2016
|
115
|
||||||||
|
Beaumont
|
TX
|
Residence Inn
|
Western
|
10/29/2008
|
133
|
||||||||
|
Burleson/Fort Worth
|
TX
|
Hampton
|
LBA
|
10/7/2014
|
88
|
||||||||
|
Dallas
|
TX
|
Homewood Suites
|
Western
|
9/1/2016
|
130
|
||||||||
|
Denton
|
TX
|
Homewood Suites
|
Chartwell
|
9/1/2016
|
107
|
||||||||
|
Duncanville
|
TX
|
Hilton Garden Inn
|
Gateway
|
10/21/2008
|
142
|
||||||||
|
El Paso
|
TX
|
Hilton Garden Inn
|
Western
|
12/19/2011
|
145
|
||||||||
|
El Paso
|
TX
|
Homewood Suites
|
Western
|
3/1/2014
|
114
|
||||||||
|
Fort Worth
|
TX
|
Courtyard
|
LBA
|
2/2/2017
|
124
|
||||||||
|
Fort Worth
|
TX
|
TownePlace Suites
|
Western
|
7/19/2010
|
140
|
||||||||
|
Frisco
|
TX
|
Hilton Garden Inn
|
Western
|
12/31/2008
|
102
|
||||||||
|
Grapevine
|
TX
|
Hilton Garden Inn
|
Western
|
9/24/2010
|
110
|
(2)
|
|||||||
|
Houston
|
TX
|
Courtyard
|
LBA
|
9/1/2016
|
124
|
||||||||
|
Houston
|
TX
|
Marriott
|
Western
|
1/8/2010
|
206
|
||||||||
|
Houston
|
TX
|
Residence Inn
|
Western
|
3/1/2014
|
129
|
||||||||
|
Houston
|
TX
|
Residence Inn
|
Western
|
9/1/2016
|
120
|
||||||||
|
Irving
|
TX
|
Homewood Suites
|
Western
|
12/29/2010
|
77
|
||||||||
|
Lewisville
|
TX
|
Hilton Garden Inn
|
Gateway
|
10/16/2008
|
165
|
||||||||
|
Round Rock
|
TX
|
Hampton
|
Vista Host
|
3/6/2009
|
94
|
||||||||
|
San Antonio
|
TX
|
TownePlace Suites
|
Western
|
3/1/2014
|
106
|
||||||||
|
Shenandoah
|
TX
|
Courtyard
|
LBA
|
9/1/2016
|
124
|
||||||||
|
Stafford
|
TX
|
Homewood Suites
|
Western
|
3/1/2014
|
78
|
||||||||
|
Texarkana
|
TX
|
Courtyard
|
Aimbridge
|
3/1/2014
|
90
|
||||||||
|
Texarkana
|
TX
|
Hampton
|
Aimbridge
|
1/31/2011
|
81
|
||||||||
|
Texarkana
|
TX
|
TownePlace Suites
|
Aimbridge
|
3/1/2014
|
85
|
||||||||
|
Provo
|
UT
|
Residence Inn
|
Dimension
|
3/1/2014
|
114
|
||||||||
|
Salt Lake City
|
UT
|
Residence Inn
|
Huntington
|
10/20/2017
|
136
|
||||||||
|
Salt Lake City
|
UT
|
SpringHill Suites
|
White Lodging
|
11/2/2010
|
143
|
||||||||
|
Alexandria
|
VA
|
Courtyard
|
Marriott
|
3/1/2014
|
178
|
||||||||
|
Alexandria
|
VA
|
SpringHill Suites
|
Marriott
|
3/28/2011
|
155
|
||||||||
|
Bristol
|
VA
|
Courtyard
|
LBA
|
11/7/2008
|
175
|
||||||||
|
Charlottesville
|
VA
|
Courtyard
|
Crestline
|
3/1/2014
|
139
|
||||||||
|
Harrisonburg
|
VA
|
Courtyard
|
Newport
|
3/1/2014
|
125
|
||||||||
|
Manassas
|
VA
|
Residence Inn
|
Crestline
|
2/16/2011
|
107
|
||||||||
|
City
|
State
|
Brand
|
Manager
|
Date Acquired or Completed
|
Rooms
|
||||||||
|
Richmond
|
VA
|
Courtyard
|
White Lodging
|
12/8/2014
|
135
|
||||||||
|
Richmond
|
VA
|
Marriott
|
White Lodging
|
3/1/2014
|
410
|
(1)
|
|||||||
|
Richmond
|
VA
|
Residence Inn
|
White Lodging
|
12/8/2014
|
75
|
||||||||
|
Richmond
|
VA
|
SpringHill Suites
|
McKibbon
|
9/1/2016
|
103
|
||||||||
|
Suffolk
|
VA
|
Courtyard
|
Crestline
|
3/1/2014
|
92
|
||||||||
|
Suffolk
|
VA
|
TownePlace Suites
|
Crestline
|
3/1/2014
|
72
|
||||||||
|
Virginia Beach
|
VA
|
Courtyard
|
Crestline
|
3/1/2014
|
141
|
||||||||
|
Virginia Beach
|
VA
|
Courtyard
|
Crestline
|
3/1/2014
|
160
|
||||||||
|
Kirkland
|
WA
|
Courtyard
|
InnVentures
|
3/1/2014
|
150
|
(2)
|
|||||||
|
Seattle
|
WA
|
Residence Inn
|
InnVentures
|
3/1/2014
|
234
|
(1)(2)
|
|||||||
|
Tukwila
|
WA
|
Homewood Suites
|
Dimension
|
3/1/2014
|
106
|
(2)
|
|||||||
|
Vancouver
|
WA
|
SpringHill Suites
|
InnVentures
|
3/1/2014
|
119
|
||||||||
|
Total
|
30,322
|
| (1) | Hotel is subject to ground lease. |
| (2) | Hotel is encumbered by mortgage. |
The Company’s investment in real estate at December 31, 2017, consisted of the following (in thousands):
|
Land
|
$
|
720,465
|
||
|
Building and Improvements
|
4,362,929
|
|||
|
Furniture, Fixtures and Equipment
|
428,734
|
|||
|
Franchise Fees
|
12,315
|
|||
|
5,524,443
|
||||
|
Less Accumulated Depreciation
|
(731,284
|
)
|
||
|
Investment in Real Estate, net
|
$
|
4,793,159
|
For additional information about the Company’s properties, refer to Schedule III – Real Estate and Accumulated Depreciation included at the end of Part IV, appearing elsewhere in this Annual Report on Form 10-K.
For a discussion of the Company’s legal proceedings, refer to Note 14 titled “Legal Proceedings” in Part II, Item 8, of the Consolidated Financial Statements and Notes thereto, appearing elsewhere in this Annual Report on Form 10-K, which information is incorporated by reference herein.
Not Applicable.
PART II
| Item 5. |
Market For Registrant’s Common Equity, Related Shareholder Matters and Issuer Purchases of Equity Securities
|
Market Information
On May 18, 2015, the Company’s common shares were listed and began trading on the NYSE under the ticker symbol “APLE” (the “Listing”). Prior to that time, there was no public market for the Company’s common shares. As of December 31, 2017 and February 16, 2018, the last reported closing price per share for the Company’s common shares as reported on the NYSE was $19.61 and $18.37, respectively. The following table sets forth the high and low sales prices per share of the Company’s common shares as reported on the NYSE and distributions declared per common share for each quarterly period indicated:
|
2017
|
High
|
Low
|
Distributions(1)
|
|||||||||
|
First Quarter
|
$
|
20.68
|
$
|
18.45
|
$
|
0.30
|
||||||
|
Second Quarter
|
$
|
19.60
|
$
|
18.26
|
$
|
0.30
|
||||||
|
Third Quarter
|
$
|
19.07
|
$
|
17.49
|
$
|
0.30
|
||||||
|
Fourth Quarter
|
$
|
20.15
|
$
|
18.66
|
$
|
0.30
|
||||||
|
2016
|
High
|
Low
|
Distributions(1)
|
|||||||||
|
First Quarter
|
$
|
20.53
|
$
|
16.35
|
$
|
0.30
|
||||||
|
Second Quarter
|
$
|
19.78
|
$
|
17.71
|
$
|
0.30
|
||||||
|
Third Quarter
|
$
|
20.65
|
$
|
18.11
|
$
|
0.30
|
||||||
|
Fourth Quarter
|
$
|
20.00
|
$
|
17.32
|
$
|
0.30
|
||||||
(1) During both 2017 and 2016, distributions were declared and paid at a monthly rate of $0.10 per common share. As of December 31, 2017, a monthly distribution of $0.10 per common share had been declared and was paid in January 2018.
Share Return Performance
The following graph compares the cumulative total shareholder return of the Company’s common shares to the cumulative total returns of the Standard and Poor’s 500 Stock Index (“S&P 500 Index”) and the SNL US REIT Hotel Index for the period from May 18, 2015, the date of the Company’s Listing, to December 31, 2017. The SNL US REIT Hotel Index is comprised of publicly traded REITs which focus on investments in hotel properties. The graph assumes an initial investment of $100 in the Company’s common shares and in each of the indices, and also assumes the reinvestment of dividends.
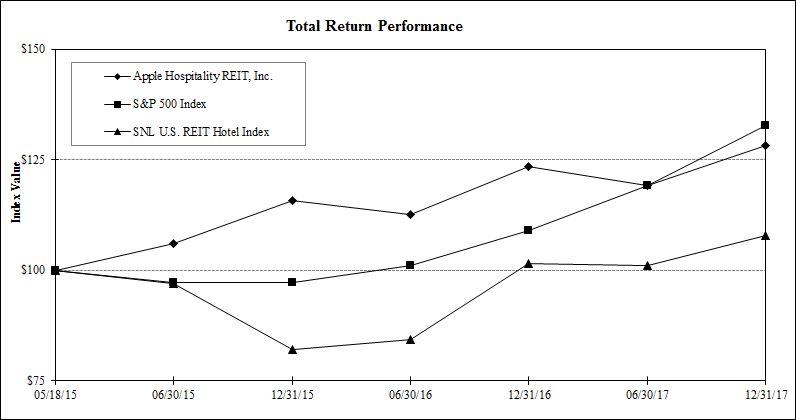
| Value of Initial Investment at | ||||||||||||||||||||||||||||
|
Name
|
05/18/15
|
06/30/15
|
12/31/15
|
06/30/16
|
12/31/16
|
06/30/17
|
12/31/17
|
|||||||||||||||||||||
|
Apple Hospitality REIT, Inc.
|
$
|
100.00
|
$
|
105.95
|
$
|
115.73
|
$
|
112.53
|
$
|
123.34
|
$
|
119.17
|
$
|
128.27
|
||||||||||||||
|
S&P 500 Index
|
$
|
100.00
|
$
|
97.14
|
$
|
97.29
|
$
|
101.02
|
$
|
108.92
|
$
|
119.10
|
$
|
132.70
|
||||||||||||||
|
SNL U.S. REIT Hotel Index
|
$
|
100.00
|
$
|
96.87
|
$
|
81.94
|
$
|
84.35
|
$
|
101.55
|
$
|
101.12
|
$
|
107.92
|
||||||||||||||
This performance graph shall not be deemed “filed” for the purposes of Section 18 of the Securities Exchange Act of 1934, as amended, or incorporated by reference into any filing by the Company under the Securities Act of 1933, as amended, or the Securities Exchange Act, except as shall be expressly set forth by specific reference in such filing. The performance graph is not indicative of future investment performance. The Company does not make or endorse any predictions as to future share price performance.
Shareholder Information
As of February 16, 2018, the Company had approximately 80 holders of record of its common shares and there were approximately 230 million common shares outstanding. Because many of the Company’s common shares are held by brokers and other institutions on behalf of shareholders, the Company believes there are substantially more beneficial holders of its common shares than record holders. In order to comply with certain requirements related to the Company’s qualification as a REIT, the Company’s amended and restated articles of incorporation provides that, subject to certain exceptions, no person or entity (other than a person or entity who has been granted an exemption) may directly or indirectly, beneficially or constructively, own more than 9.8% of the aggregate of its outstanding common shares or 9.8% of the aggregate of the outstanding preferred shares of any class or series.
Distribution Information
To maintain its REIT status, the Company is required to distribute at least 90% of its ordinary income. For the years ended December 31, 2017 and 2016, the Company paid distributions of $1.20 per common share, for a total of approximately $267.9 million and $229.1 million, respectively. The Company’s current annual distribution rate, payable monthly, is $1.20 per common share. Although the Company intends to continue paying distributions on a monthly basis, the amount and timing of distributions to shareholders are within the discretion of the Company’s Board of Directors and there can be no assurance of the classification or duration of distributions at the current annual distribution rate. The amount and frequency of future distributions will depend on certain items, including but not limited to, the Company’s results of operations, cash flow from operations, economic conditions, working capital requirements, cash requirements to fund investing and financing activities, and capital expenditure requirements, including improvements to and expansions of properties, as well as the distribution requirements under federal income tax provisions for qualification as a REIT. The Company’s $965 million credit facility limits distributions to 95% of funds from operations annually unless the Company is required to distribute more to meet REIT requirements. As it has done historically, due to seasonality, the Company may use its $540 million revolving credit facility to maintain the consistency of the monthly distribution rate, taking into consideration any acquisitions, dispositions, capital improvements and economic cycles.
Share Repurchases
During 2017, the Company’s Board of Directors authorized an extension of its share repurchase program to repurchase up to $475 million of its common shares, which program will end in July 2018, if not terminated earlier. The program may be suspended or terminated at any time by the Company. As part of the implementation of the program, the Company has utilized written trading plans, with the plans providing for share repurchases in open market transactions. Since inception of the share repurchase program in July 2015 through December 31, 2017, the Company has purchased approximately 1.7 million of its common shares at a weighted-average market purchase price of approximately $17.64 per common share, for an aggregate purchase price of approximately $29.9 million, including the purchase of approximately 0.4 million of its common shares in 2016, at a weighted-average market purchase price of approximately $17.72 per common share for an aggregate purchase price of approximately $7.9 million. Repurchases under the program were funded with availability under its revolving credit facility. In connection with the implementation of the ATM Program, in February 2017 the Company terminated its then existing written trading plan under the Company’s share repurchase program and made no repurchases of its common shares in 2017. The Company plans to continue to consider opportunistic share repurchases under the $467.5 million remaining portion of the authorized $475 million share repurchase program, which will depend upon prevailing market conditions and other factors.
Additionally, during 2017 and 2016, certain of the Company’s employees surrendered common shares to satisfy their tax withholding obligations associated with the vesting of common shares issued under the 2014 Omnibus Incentive Plan (the “Omnibus Plan”) as described in Note 9 titled “Compensation Plans” in Part II, Item 8, of the Consolidated Financial Statements and Notes thereto, appearing elsewhere in this Annual Report on Form 10-K.
The following is a summary of all share repurchases during the fourth quarter of 2017.
|
Issuer Purchases of Equity Securities
|
||||||||||||||||
|
(a)
|
(b)
|
(c)
|
(d)
|
|||||||||||||
|
Period
|
Total Number of Shares Purchased
|
Average Price Paid per Share
|
Total Number of Shares Purchased as Part of Publicly Announced Plans or Programs
|
Approximate Dollar Value of Shares that May Yet Be Purchased Under the Plans or Programs (in thousands) (1)
|
||||||||||||
|
October 1 - October 31, 2017
|
-
|
-
|
-
|
$
|
467,500
|
|||||||||||
|
November 1 - November 30, 2017
|
-
|
-
|
-
|
$
|
467,500
|
|||||||||||
|
December 1 - December 31, 2017 (2)
|
13,129
|
$
|
19.85
|
-
|
$
|
467,500
|
||||||||||
|
Total
|
13,129
|
-
|
||||||||||||||
|
(1)
|
Represents amount outstanding under the Company’s authorized $475 million share repurchase program. This program may be suspended or terminated at any time by the Company. If not terminated earlier, the program will end in July 2018. No shares were repurchased during the fourth quarter of 2017.
|
|
(2)
|
Reflects common shares surrendered to the Company to satisfy tax withholding obligations associated with the vesting of restricted common shares.
|
Equity Compensation Plans
The Company’s Board of Directors adopted and the Company’s shareholders approved the Omnibus Plan, which provides for the issuance of up to 10 million common shares, subject to adjustments, to employees, officers, and directors of the Company or affiliates of the Company, consultants or advisers currently providing services to the Company or affiliates of the Company, and any other person whose participation in the Omnibus Plan is determined by the Compensation Committee to be in the best interests of the Company. The Company’s Board of Directors previously adopted and the Company’s shareholders approved the non-employee directors’ stock option plan (the “Directors’ Plan”) to provide incentives to attract and retain directors. In May 2015, the Directors Plan was terminated effective upon the Listing, and no further grants can be made under the Directors’ Plan, provided however, that the termination did not affect any outstanding director option awards previously issued under the Directors’ Plan. The following is a summary of securities issued under the Company’s equity compensation plans as of December 31, 2017:
|
Number of Securities to be Issued Upon Exercise of Outstanding Options, Warrants and Rights (1)
|
Weighted-Average Exercise Price of Outstanding Options, Warrants and Rights
|
Number of Securities Remaining Available for Future Issuance Under Equity Compensation Plans (Excluding Securities Reflected in First Column)
|
||||||||||
|
Equity compensation plans approved by security holders
|
478,978
|
$
|
21.05
|
11,079,676
|
||||||||
|
Equity compensation plans not approved by security holders
|
-
|
-
|
-
|
|||||||||
|
Total equity compensation plans
|
478,978
|
$
|
21.05
|
11,079,676
|
||||||||
|
(1)
|
Represents 312,937 stock options granted to the Company’s directors under the Directors’ Plan and 166,041 stock options granted under the Omnibus Plan in exchange for all of Apple Ten’s outstanding stock options as a result of the Apple Ten merger effective September 1, 2016.
|
The following table sets forth selected financial data for the five years ended December 31, 2017. Certain information in the table has been derived from the Company’s audited financial statements and notes thereto. This data should be read in conjunction with Item 7, Management’s Discussion and Analysis of Financial Condition and Results of Operations, and Item 8, the Consolidated Financial Statements and Notes thereto, appearing elsewhere in this Annual Report on Form 10-K.
|
Year Ended December 31,
|
||||||||||||||||||||
|
(in thousands except per share and statistical data)
|
2017
|
2016 (a)
|
2015
|
2014 (b)
|
2013
|
|||||||||||||||
|
Revenues:
|
||||||||||||||||||||
|
Room
|
$
|
1,143,987
|
$
|
956,119
|
$
|
821,733
|
$
|
735,882
|
$
|
353,338
|
||||||||||
|
Other
|
94,635
|
84,906
|
76,581
|
68,014
|
34,653
|
|||||||||||||||
|
Total revenue
|
1,238,622
|
1,041,025
|
898,314
|
803,896
|
387,991
|
|||||||||||||||
|
Expenses and other income:
|
||||||||||||||||||||
|
Hotel operating expense
|
697,402
|
582,839
|
507,081
|
455,895
|
220,214
|
|||||||||||||||
|
Property taxes, insurance and other expense
|
69,391
|
56,860
|
46,023
|
40,046
|
20,556
|
|||||||||||||||
|
Ground lease expense
|
11,313
|
10,409
|
9,996
|
8,341
|
302
|
|||||||||||||||
|
General and administrative expense
|
26,341
|
17,032
|
19,552
|
20,914
|
6,169
|
|||||||||||||||
|
Transaction and litigation costs (reimbursements)
|
(2,586
|
)
|
34,989
|
7,181
|
5,142
|
3,179
|
||||||||||||||
|
Loss on impairment of depreciable real estate assets
|
45,875
|
5,471
|
45,000
|
10,988
|
-
|
|||||||||||||||
|
Depreciation expense
|
176,499
|
148,163
|
127,449
|
113,112
|
54,827
|
|||||||||||||||
|
Series B convertible preferred share expense
|
-
|
-
|
-
|
117,133
|
-
|
|||||||||||||||
|
Interest and other expense, net
|
47,343
|
40,026
|
33,132
|
23,523
|
8,446
|
|||||||||||||||
|
Investment income from note receivable
|
-
|
-
|
-
|
-
|
(9,040
|
)
|
||||||||||||||
|
(Gain) loss on sale of real estate
|
(16,295
|
)
|
153
|
(15,286
|
)
|
-
|
-
|
|||||||||||||
|
Income tax expense
|
847
|
431
|
898
|
1,969
|
1,422
|
|||||||||||||||
|
Total expenses and other income
|
1,056,130
|
896,373
|
781,026
|
797,063
|
306,075
|
|||||||||||||||
|
Income from continuing operations
|
182,492
|
144,652
|
117,288
|
6,833
|
81,916
|
|||||||||||||||
|
Income from discontinued operations, net of tax
|
-
|
-
|
-
|
-
|
33,306
|
|||||||||||||||
|
Net income
|
$
|
182,492
|
$
|
144,652
|
$
|
117,288
|
$
|
6,833
|
$
|
115,222
|
||||||||||
|
Per Share:
|
||||||||||||||||||||
|
Income from continuing operations per common share
|
$ | 0.82 | $ | 0.76 | $ | 0.65 | $ | 0.04 | $ | 0.90 | ||||||||||
|
Income from discontinued operations per common share
|
-
|
-
|
-
|
-
|
0.36
|
|||||||||||||||
|
Net income per common share
|
$
|
0.82
|
$
|
0.76
|
$
|
0.65
|
$
|
0.04
|
$
|
1.26
|
||||||||||
|
Distributions declared per common share (c)
|
$
|
1.20
|
$
|
1.20
|
$
|
1.37
|
$
|
1.39
|
$
|
1.66
|
||||||||||
|
Weighted-average common shares outstanding - basic and diluted
|
223,526
|
190,856
|
180,261
|
171,489
|
91,308
|
|||||||||||||||
|
Balance Sheet Data (at end of period):
|
||||||||||||||||||||
|
Cash and cash equivalents
|
$
|
-
|
$
|
-
|
$
|
-
|
$
|
-
|
$
|
18,102
|
||||||||||
|
Investment in real estate, net
|
$
|
4,793,159
|
$
|
4,823,489
|
$
|
3,641,767
|
$
|
3,492,821
|
$
|
1,443,498
|
||||||||||
|
Assets held for sale
|
$
|
-
|
$
|
39,000
|
$
|
-
|
$
|
195,588
|
$
|
-
|
||||||||||
|
Total assets
|
$
|
4,902,338
|
$
|
4,979,883
|
$
|
3,722,775
|
$
|
3,776,805
|
$
|
1,489,926
|
||||||||||
|
Total debt
|
$
|
1,222,196
|
$
|
1,337,963
|
$
|
998,103
|
$
|
706,626
|
$
|
161,196
|
||||||||||
|
Shareholders’ equity
|
$
|
3,571,085
|
$
|
3,517,064
|
$
|
2,647,058
|
$
|
3,014,624
|
$
|
1,311,811
|
||||||||||
|
Net book value per share
|
$
|
15.53
|
$
|
15.78
|
$
|
15.18
|
$
|
16.13
|
$
|
14.35
|
||||||||||
|
Other Data:
|
||||||||||||||||||||
|
Cash Flow From (Used In):
|
||||||||||||||||||||
|
Operating activities
|
$
|
384,741
|
$
|
332,034
|
$
|
281,052
|
$
|
252,187
|
$
|
137,446
|
||||||||||
|
Investing activities
|
$
|
(159,292
|
)
|
$
|
(169,837
|
)
|
$
|
(82,285
|
)
|
$
|
(58,404
|
)
|
$
|
25,446
|
||||||
|
Financing activities
|
$
|
(225,449
|
)
|
$
|
(162,197
|
)
|
$
|
(198,767
|
)
|
$
|
(211,885
|
)
|
$
|
(153,817
|
)
|
|||||
|
Number of hotels owned at end of period
|
239
|
235
|
179
|
191
|
89
|
|||||||||||||||
|
(a)
|
Effective September 1, 2016, the Company completed the merger with Apple Ten as described in Note 2 titled “Merger with Apple REIT Ten, Inc.” in Part II, Item 8, of the Consolidated Financial Statements and Notes thereto, appearing elsewhere in this Annual Report on Form 10-K.
|
|
(b)
|
Effective March 1, 2014, the Company completed the mergers with Apple Seven and Apple Eight and added 99 continuing hotels located in 27 states with an aggregate of 12,121 rooms to the Company’s real estate portfolio. In connection with the Apple Seven and Apple Eight mergers, the Company issued approximately 90 million common shares to Apple Seven and Apple Eight shareholders. Also, upon completion of the Apple Seven and Apple Eight mergers, the Company became self-advised and the advisory agreements between the Company and its advisors were terminated, resulting in the conversion of the Company’s Series B convertible preferred shares into approximately 5.8 million common shares. In connection with this event, during the first quarter of 2014, the Company recorded a noncash expense totaling approximately $117.1 million.
|
|
(c)
|
2015 distributions include a distribution of $0.10 per common share that was declared in December 2015 and paid in January 2016. For all other periods presented, distributions per common share declared equaled distributions paid.
|
The following discussion and analysis should be read in conjunction with Item 8, the Consolidated Financial Statements and Notes thereto, the introduction of Part I regarding “Forward-Looking Statements,” and Item 1A, “Risk Factors” appearing elsewhere in this Annual Report on Form 10-K.
Overview
The Company is a Virginia corporation that has elected to be treated as a REIT for federal income tax purposes. The Company is self-advised and invests in income-producing real estate, primarily in the lodging sector, in the United States. As of December 31, 2017, the Company owned 239 hotels with an aggregate of 30,322 rooms located in urban, high-end suburban and developing markets throughout 34 states. All of the Company’s hotels operate under Marriott or Hilton brands. The hotels are operated and managed under separate management agreements with 23 hotel management companies, none of which are affiliated with the Company. The Company’s common shares are listed on the NYSE under the ticker symbol “APLE.”
2017 Hotel Portfolio Activities
The Company continually monitors market conditions and attempts to maximize shareholder value by investing in properties that it believes provide superior value in the long term. Consistent with this strategy and the Company’s focus on investing in select-service hotels, the Company acquired six hotels for an aggregate purchase price of approximately $161.8 million during 2017: a new 124-room Courtyard in Fort Worth, Texas, a new 104-room Hilton Garden Inn and 106-room Home2 Suites on the same site in Birmingham, Alabama, a 179-room Residence Inn in Portland, Maine, a 136-room Residence Inn in Salt Lake City, Utah and a 135-room Home2 Suites in Anchorage, Alaska. In February 2018, the Company completed the purchase of two additional hotels (a 119-room Hampton Inn & Suites in Atlanta, Georgia and a 144-room Hampton Inn & Suites in Memphis, Tennessee) for an aggregate purchase price of $63.0 million. The Company also has outstanding contracts for the potential purchase of two additional hotels that are under construction for a total purchase price of approximately $64.8 million, which are planned to be completed and opened for business during 2018, at which time closing on these hotels is expected to occur. The Company utilized its revolving credit facility to fund the 2017 and 2018 acquisitions and plans to utilize the revolving credit facility for any additional acquisitions that are completed in 2018.
Additionally, the Company monitors each of its properties’ profitability, market conditions and capital requirements and attempts to maximize shareholder value by disposing of properties when it believes that the proceeds from the sale of the property can be reinvested into opportunities that have more growth potential. As a result, on April 20, 2017, the Company completed the sale of its 224-room Hilton hotel in Dallas, Texas, for a gross sales price of approximately $56.1 million. Also, on October 5, 2017, the Company completed the sale of its 316-room Marriott hotel in Fairfax, Virginia, for a gross sales price of approximately $41.5 million. The Company used the net proceeds from the sales to pay down borrowings on its revolving credit facility.
See Note 3 titled “Investment in Real Estate” and Note 4 titled “Dispositions” in Part II, Item 8, of the Consolidated Financial Statements and Notes thereto, appearing elsewhere in this Annual Report on Form 10-K for additional information concerning these transactions.
Merger with Apple Ten
Effective September 1, 2016, the Company completed its merger with Apple Ten, and, as a result of the merger, acquired the business of Apple Ten, a REIT which, immediately prior to the merger, owned 56 Marriott and Hilton branded primarily select-service and extended-stay hotels located in 17 states with an aggregate of 7,209 rooms, and assumed all of Apple Ten’s assets and liabilities at closing. For purpose of accounting for the transaction, the aggregate value of the merger consideration paid to Apple Ten shareholders was estimated to be approximately $1.0 billion, and was comprised of approximately $956.1 million for the issuance of approximately 48.7 million common shares of the Company valued at $19.62 per share, which was the closing price of the Company’s common shares on August 31, 2016 (the date that the merger was approved), and $93.6 million in cash, which was funded through borrowings on the Company’s revolving credit facility. Upon completion of the merger, the advisory and related party arrangements with respect to the Company, Apple Ten and Apple Ten’s advisors were terminated. See Note 2 titled “Merger with Apple REIT Ten, Inc.” in Part II, Item 8, of the Consolidated Financial Statements and
Notes thereto, appearing elsewhere in this Annual Report on Form 10-K for additional information concerning the merger with Apple Ten.
Hotel Operations
Although hotel performance can be influenced by many factors including local competition, local and general economic conditions in the United States and the performance of individual managers assigned to each hotel, performance of the Company’s hotels as compared to other hotels within their respective local markets, in general, has met the Company’s expectations for the period owned. Over the past several quarters, the lodging industry and the Company have experienced low single digit revenue growth. Moderate improvements in the general U.S. economy have been partially offset by increased supply in many markets. With modest revenue growth, the Company has produced stable operating results during 2017 on a comparable basis (as defined below) with expense increases generally offsetting revenue growth. There is no way to predict future economic conditions, and there continue to be additional factors that could negatively affect the lodging industry and the Company, including but not limited to, increased hotel supply in certain markets, labor uncertainty both for the economy as a whole and the lodging industry in particular, global volatility and government fiscal policies. The Company, on a comparable basis, and industry are forecasting a low single digit percentage increase in revenue for 2018 as compared to 2017. The low growth is primarily due to inconsistent demand in certain markets and increased hotel supply meeting demand growth in others, limiting the Company’s ability to increase rates.
In evaluating financial condition and operating performance, the most important indicators on which the Company focuses are revenue measurements, such as average occupancy, ADR and RevPAR, and expenses, such as hotel operating expenses, general and administrative expenses and other expenses described below.
The following is a summary of the results from operations of the Company’s hotels for their respective periods of ownership by the Company.
|
Years Ended December 31,
|
||||||||||||||||||||||||||||||||
|
(in thousands, except statistical data)
|
2017
|
Percent of Revenue
|
2016
|
Percent of Revenue
|
Change 2016 to 2017
|
2015
|
Percent of Revenue
|
Change 2015 to 2016
|
||||||||||||||||||||||||
|
Total revenue
|
$
|
1,238,622
|
100.0
|
%
|
$
|
1,041,025
|
100.0
|
%
|
19.0
|
%
|
$
|
898,314
|
100.0
|
%
|
15.9
|
%
|
||||||||||||||||
|
Hotel operating expense
|
697,402
|
56.3
|
%
|
582,839
|
56.0
|
%
|
19.7
|
%
|
507,081
|
56.4
|
%
|
14.9
|
%
|
|||||||||||||||||||
|
Property taxes, insurance and other expense
|
69,391
|
5.6
|
%
|
56,860
|
5.5
|
%
|
22.0
|
%
|
46,023
|
5.1
|
%
|
23.5
|
%
|
|||||||||||||||||||
|
Ground lease expense
|
11,313
|
0.9
|
%
|
10,409
|
1.0
|
%
|
8.7
|
%
|
9,996
|
1.1
|
%
|
4.1
|
%
|
|||||||||||||||||||
|
General and administrative expense
|
26,341
|
2.1
|
%
|
17,032
|
1.6
|
%
|
54.7
|
%
|
19,552
|
2.2
|
%
|
-12.9
|
%
|
|||||||||||||||||||
|
Transaction and litigation costs (reimbursements)
|
(2,586
|
)
|
34,989
|
n/a
|
7,181
|
n/a
|
||||||||||||||||||||||||||
|
Loss on impairment of depreciable real estate assets
|
45,875
|
5,471
|
n/a
|
45,000
|
n/a
|
|||||||||||||||||||||||||||
|
Depreciation expense
|
176,499
|
148,163
|
19.1
|
%
|
127,449
|
16.3
|
%
|
|||||||||||||||||||||||||
|
Interest and other expense, net
|
47,343
|
40,026
|
18.3
|
%
|
33,132
|
20.8
|
%
|
|||||||||||||||||||||||||
|
Gain (loss) on sale of real estate
|
16,295
|
(153
|
)
|
n/a
|
15,286
|
n/a
|
||||||||||||||||||||||||||
|
Income tax expense
|
847
|
431
|
96.5
|
%
|
898
|
-52.0
|
%
|
|||||||||||||||||||||||||
|
Number of hotels owned at end of period
|
239
|
235
|
1.7
|
%
|
179
|
31.3
|
%
|
|||||||||||||||||||||||||
|
ADR
|
$
|
134.61
|
$
|
133.61
|
0.7
|
%
|
$
|
129.38
|
3.3
|
%
|
||||||||||||||||||||||
|
Occupancy
|
77.4
|
%
|
76.9
|
%
|
0.7
|
%
|
76.9
|
%
|
-
|
|||||||||||||||||||||||
|
RevPAR
|
$
|
104.13
|
$
|
102.80
|
1.3
|
%
|
$
|
99.46
|
3.4
|
%
|
||||||||||||||||||||||
Comparable Hotels Operating Results
The following table reflects certain operating statistics for the Company’s 239 hotels owned as of December 31, 2017 (“Comparable Hotels”). The Company defines metrics from Comparable Hotels as results generated by the 239 hotels owned as of the end of the reporting period. For the hotels acquired during the reporting periods shown, the Company has included, as applicable, results of those hotels for periods prior to the Company’s ownership using information provided by the properties’ prior owners at the time of acquisition and not adjusted by the Company. This information has not been audited, either for the periods owned or prior to ownership by the Company. For dispositions, results have been excluded for the Company’s period of ownership.
|
Years Ended December 31,
|
||||||||||||||||||||
|
2017
|
2016
|
Change 2016 to 2017
|
2015
|
Change 2015 to 2016
|
||||||||||||||||
|
ADR
|
$
|
134.75
|
$
|
133.45
|
1.0
|
%
|
$
|
130.02
|
2.6
|
%
|
||||||||||
|
Occupancy
|
77.5
|
%
|
77.0
|
%
|
0.6
|
%
|
77.0
|
%
|
-
|
|||||||||||
|
RevPAR
|
$
|
104.40
|
$
|
102.80
|
1.6
|
%
|
$
|
100.12
|
2.7
|
%
|
||||||||||
Same Store Operating Results
The following table reflects certain operating statistics for the 170 hotels owned by the Company as of January 1, 2015 and during the entirety of the reporting periods being compared (“Same Store Hotels”). This information has not been audited.
|
Years Ended December 31,
|
||||||||||||||||||||
|
2017
|
2016
|
Change 2016 to 2017
|
2015
|
Change 2015 to 2016
|
||||||||||||||||
|
ADR
|
$
|
134.35
|
$
|
132.76
|
1.2
|
%
|
$
|
129.40
|
2.6
|
%
|
||||||||||
|
Occupancy
|
77.3
|
%
|
77.2
|
%
|
0.1
|
%
|
77.2
|
%
|
-
|
|||||||||||
|
RevPAR
|
$
|
103.88
|
$
|
102.50
|
1.3
|
%
|
$
|
99.84
|
2.7
|
%
|
||||||||||
As discussed above, hotel performance is impacted by many factors, including the economic conditions in the United States as well as each individual locality. Economic indicators in the United States have generally been favorable, which has been partially offset by increased supply in many of the Company’s markets. As a result, the Company’s revenue and operating results for its Comparable Hotels and Same Store Hotels experienced modest growth in 2017 as compared to 2016 and 2015. The Company expects continued modest improvement in revenue and operating results for its Comparable Hotels in 2018 as compared to 2017. The Company’s hotels in general have shown results consistent with industry and brand averages for the period of ownership.
Results of Operations for Years 2017 and 2016
As of December 31, 2017, the Company owned 239 hotels with a total of 30,322 rooms as compared to 235 hotels with a total of 30,073 rooms as of December 31, 2016. Results of operations are included only for the period of ownership for hotels acquired or disposed of during 2017 and 2016. During 2017, the Company acquired three newly constructed hotels (one on February 2, 2017 and two on September 12, 2017) and three existing hotels (one on October 13, 2017, one on October 20, 2017 and one on December 1, 2017), and sold two hotels (one on April 20, 2017 and one on October 5, 2017). During 2016, the Company acquired 56 hotels in the Apple Ten merger effective September 1, 2016, acquired one additional newly constructed hotel on July 1, 2016 and sold one hotel on December 6, 2016. As a result, the comparability of results for the years ended December 31, 2017 and 2016 as discussed below is significantly impacted by these transactions.
Revenues
The Company’s principal source of revenue is hotel revenue consisting of room and other related revenue. For the years ended December 31, 2017 and 2016, the Company had total revenue of $1.2 billion and $1.0
billion, respectively. For the years ended December 31, 2017 and 2016, respectively, Comparable Hotels achieved combined average occupancy of 77.5% and 77.0%, ADR of $134.75 and $133.45 and RevPAR of $104.40 and $102.80.
During 2017, the Company experienced modest increases in both occupancy and ADR as compared to 2016, resulting in a 1.6% increase in RevPAR for Comparable Hotels. Overall, because of its geographic diversity, the Company’s Comparable Hotels’ RevPAR growth for 2017 was in line with industry/brand averages. During the fourth quarter of 2017, the Company’s Comparable Hotels’ RevPAR increased 3.5%. Markets with above average growth in 2017 for both the Company and industry included Richmond, Virginia, Houston, Texas, Knoxville, Tennessee, Kansas City, Missouri, San Diego, California and Tampa, Florida. Markets that were below average for both the Company and industry included Dallas, Texas, Austin, Texas and Charlotte, North Carolina. In the second half of 2017, Houston and certain Florida markets experienced an increase in demand due to evacuation and restoration efforts related to hurricanes Harvey and Irma, which led to increased RevPAR for the Company and industry in those markets. While certain of the Company’s hotels incurred minor wind and water related damage from the hurricanes, the overall impact was not material. The Company’s growth during 2017 was also impacted by a decline in the Los Angeles, California market due to outsized growth in 2016 from the Porter Ranch gas leak.
Hotel Operating Expense
Hotel operating expense consists of direct room operating expense, hotel administrative expense, sales and marketing expense, utilities expense, repair and maintenance expense, franchise fees and management fees. For the years ended December 31, 2017 and 2016, respectively, hotel operating expense totaled $697.4 million and $582.8 million or 56.3% and 56.0% of total revenue for each respective period. Overall hotel operational expenses for 2017 include the results of the six hotels acquired in 2017 from their respective dates of acquisition and the results of two hotels sold during the year until their respective dates of sale, as well as the results of the 56 hotels acquired in the Apple Ten merger on September 1, 2016 and one hotel acquired on July 1, 2016 for the full year. Expenses for 2016 include the results of the 57 hotels acquired from their respective dates of acquisition and one hotel sold until the date of sale. For the Company’s Comparable Hotels, hotel operating expense as a percentage of revenue increased approximately 90 basis points for the year ended December 31, 2017 as compared to the year ended December 31, 2016. During 2017, the Company experienced increases in labor costs as a percentage of revenue, which was the primary cause of the increase in hotel operating expense. The Company anticipates continued increases in labor costs due to government regulations surrounding wages, healthcare and other benefits, other wage-related initiatives and lower unemployment rates. Although operating expenses will increase as revenue increases, the Company will continue to work with its management companies to reduce costs as a percentage of revenue where possible while maintaining quality and service levels at each property.
Property Taxes, Insurance and Other Expense
Property taxes, insurance and other expense for the years ended December 31, 2017 and 2016 totaled $69.4 million and $56.9 million, respectively, or 5.6% and 5.5% of total revenue, for each respective period, and for Comparable Hotels, 5.6% of total revenue for each year. For the Company’s Comparable Hotels, real estate taxes increased slightly in 2017 compared to 2016, with tax increases at certain locations due to the reassessment of property values by localities related to the improved economy, partially offset by decreases at other locations due to successful appeals of tax assessments. With the economy continuing to improve, the Company anticipates continued increases in property tax assessments in 2018. The Company will continue to appeal tax assessments in certain jurisdictions to attempt to minimize tax increases as warranted.
Ground Lease Expense
Ground lease expense for the years ended December 31, 2017 and 2016 was $11.3 million and $10.4 million, respectively. Ground lease expense primarily represents the expense incurred by the Company to lease land for 14 of its hotel properties, including four hotels acquired in the Apple Ten merger effective September 1, 2016.
General and Administrative Expense
General and administrative expense for the years ended December 31, 2017 and 2016 was $26.3 million and $17.0 million, respectively, or 2.1% and 1.6% of total revenue, for each respective period. The principal components
of general and administrative expense are payroll and related benefit costs, legal fees, accounting fees and reporting expenses. In addition, through August 31, 2016, the Company provided to Apple Ten the advisory services contemplated under its advisory agreement, and the Company received fees and reimbursement of expenses payable under the advisory agreement from Apple Ten totaling approximately $3.5 million, which were recorded as reductions to general and administrative expenses. Effective September 1, 2016, in connection with the completion of the Apple Ten merger, the advisory agreement was terminated and the Company no longer receives the fees and reimbursement of expenses payable under the advisory agreement from Apple Ten, which resulted in an increase in the Company’s general and administrative expense from the prior year. Although expense for the Company in total dollars increased from the prior year, since both the advisory fees and reimbursed costs received by the Company from Apple Ten were recorded as general and administrative expense by Apple Ten and as reductions to general and administrative expense by the Company, the termination of the advisory agreement had no financial impact on the combined company after the effective time of the Apple Ten merger. General and administrative expense also increased in 2017 as compared to 2016 due to an increase in compensation expense. Based on the Company’s performance in 2017 in relation to the operational performance and shareholder return metrics of the 2017 executive incentive plan effective January 1, 2017 (“2017 Incentive Plan”), the amounts earned under the 2017 Incentive Plan were higher than the comparable compensation under the 2016 executive incentive plan (“2016 Incentive Plan”), resulting in an increase in executive compensation expense for 2017 of approximately $4.5 million, as compared to 2016.
Transaction and Litigation Costs (Reimbursements)
Transaction and litigation costs (reimbursements) for the years ended December 31, 2017 and 2016 were approximately $(2.6) million and $35.0 million, respectively. Transaction and litigation costs (reimbursements) for 2017 primarily related to additional proceeds received in May 2017 from the Company’s directors and officers insurance carriers in connection with the Apple Ten merger litigation which was settled in 2017, as discussed herein. Transaction and litigation costs (reimbursements) for 2016 consisted primarily of (i) costs related to the Apple Ten merger discussed herein totaling approximately $29.2 million (including costs related to the Apple Ten merger litigation consisting of $32.0 million funded by the Company in January 2017 to settle the litigation, plus approximately $3.1 million in legal costs incurred to defend the litigation, less $10.0 million of proceeds received from the Company’s directors and officers insurance carriers in January 2017), (ii) $5.5 million of costs incurred to settle the previously disclosed litigation related to Apple Seven’s and Apple Eight’s terminated Dividend Reinvestment Plans, as discussed herein, and (iii) other acquisition related costs totaling approximately $0.4 million. On January 1, 2017, the Company adopted the newly issued accounting standard on business combinations that modifies the definition of a business. Under the new guidance, acquisition of hotel properties will generally be accounted for as an acquisition of a group of assets with transaction costs associated with the acquisition capitalized as part of the cost of the asset acquired instead of expensed in the period they are incurred. In accordance with this standard, the Company capitalized approximately $0.4 million in transaction costs related to the acquisition of six hotels during 2017.
Loss on Impairment of Depreciable Real Estate Assets
Loss on impairment of depreciable real estate assets was approximately $45.9 million and $5.5 million for the years ended December 31, 2017 and 2016, respectively, and consisted of the following impairment charges: (a) $38.0 million for the New York, New York Renaissance hotel recorded in the fourth quarter of 2017, as a result of declines in the hotel’s current and projected cash flows, (b) $7.9 million for the Columbus, Georgia SpringHill Suites and TownePlace Suites hotels, recorded during the first quarter of 2017, that the Company identified for potential sale, which resulted in a change in the anticipated hold period in these assets, and (c) $5.5 million for the Chesapeake, Virginia Marriott hotel recorded during the third quarter of 2016, resulting from a change in the anticipated hold period for this asset, which was later sold in December 2016. See Note 3 titled “Investment in Real Estate” in Part II, Item 8, of the Consolidated Financial Statements and Notes thereto, appearing elsewhere in this Annual Report on Form 10-K for additional information concerning these impairment losses.
Depreciation Expense
Depreciation expense for the years ended December 31, 2017 and 2016 was $176.5 million and $148.2 million, respectively. Depreciation expense primarily represents expense of the Company’s hotel buildings and related improvements, and associated personal property (furniture, fixtures, and equipment) for their respective periods owned. The increase was primarily due to the increase in the number of properties owned as a result of the
acquisition of six hotels in 2017, the Apple Ten merger effective September 1, 2016, the acquisition of one hotel on July 1, 2016 and renovations completed throughout 2017 and 2016.
Interest and Other Expense, net
Interest and other expense, net for the years ended December 31, 2017 and 2016 was $47.3 million and $40.0 million, respectively, and is net of approximately $1.3 million and $1.6 million of interest capitalized associated with renovation projects, respectively. The increase in interest expense was primarily due to an increase in the Company’s average outstanding borrowings during 2017 as compared to 2016 which is primarily attributable to (a) mortgage debt assumed in the Apple Ten merger effective September 1, 2016 and (b) borrowings to fund (i) the cash payment portion of the Apple Ten merger, (ii) the repayment of Apple Ten’s outstanding balance on its extinguished credit facility assumed in the merger and (iii) the acquisition of seven hotels (six in 2017 and one on July 1, 2016), which increases were partially offset by proceeds from the sale of three hotels (one in December 2016, one in April 2017 and one in October 2017) and issuance of common shares in the fourth quarter of 2017 under the Company’s ATM Program. Although during 2017 variable interest rates increased in the United States with one-month LIBOR (the London Inter-Bank Offered Rate for a one-month term) increasing from 0.77% at December 31, 2016 to 1.56% at December 31, 2017, the Company was able to offset the increases by hedging a portion of its variable rate debt and entering into fixed rate mortgages, achieving comparable effective borrowing rates for 2016 and 2017. While approximately 83% of the Company’s outstanding debt was effectively fixed rate at December 31, 2017, the Company does expect interest costs to increase in 2018 due to increased rates for its remaining variable rate debt.
Results of Operations for Years 2016 and 2015
As of December 31, 2016, the Company owned 235 hotels with 30,073 rooms as compared to 179 hotels with a total of 22,961 rooms as of December 31, 2015. Results of operations are included only for the period of ownership for hotels acquired or disposed of during 2016 and 2015. During 2016, the Company acquired 56 hotels in the Apple Ten merger effective September 1, 2016, acquired one additional newly constructed hotel on July 1, 2016 and sold one hotel on December 6, 2016. During 2015, the Company acquired one new and six existing hotels (between June 1, 2015 and October 31, 2015) and sold 19 hotels (18 of which were sold on February 26, 2015 and one of which was sold on June 1, 2015). As a result, the comparability of results for the years ended December 31, 2016 and 2015 as discussed below is significantly impacted by these transactions.
Revenues
For the years ended December 31, 2016 and 2015, the Company had total revenue of $1.0 billion and $898.3 million, respectively. For the years ended December 31, 2016 and 2015, respectively, Comparable Hotels achieved combined average occupancy of 77.0% in both years, ADR of $133.45 and $130.02 and RevPAR of $102.80 and $100.12. During 2016, as the United States economy continued to improve, the Company experienced stable occupancy combined with an increase in ADR of 2.6%, resulting in an increase of 2.7% in RevPAR for its Comparable Hotels as compared to 2015.
Hotel Operating Expense
For the years ended December 31, 2016 and 2015, respectively, hotel operating expense totaled $582.8 million and $507.1 million or 56.0% and 56.4% of total revenue for each respective period. Overall hotel operational expenses for 2016 include the results of the 56 hotels acquired in the Apple Ten merger for the last four months of the year, one hotel acquired on July 1, 2016 from the date of acquisition, the results of the seven hotels acquired between June 1, 2015 and October 31, 2015 for the full year, and the results of one hotel sold on December 6, 2016 until the date of sale. Expenses for 2015 include the results of the 19 hotels sold in 2015 until the respective dates of sale and the seven hotels acquired in 2015 from their respective dates of acquisition. For the Company’s Comparable Hotels, hotel operating expense as a percentage of revenue decreased approximately 20 basis points for the year ended December 31, 2016 as compared to the year ended December 31, 2015, primarily due to the overall increase in ADR for these hotels and the Company’s success in reducing, relative to revenue increases, certain utility costs, hotel supply costs and maintenance costs, partially offset by increasing labor costs.
Property Taxes, Insurance and Other Expense
Property taxes, insurance and other expense for the years ended December 31, 2016 and 2015 totaled $56.9 million and $46.0 million, respectively, or 5.5% and 5.1% of total revenue, respectively. The increase as a percent of revenue from 2015 is due primarily to the receipt in 2015 of approximately $1.8 million in settlement proceeds, net of costs, from the Deepwater Horizon Economic and Property Damages Settlement Program related to damages suffered at several of the Company’s hotels as a result of the Gulf of Mexico oil spill in 2010. For the Company’s Comparable Hotels, real estate taxes increased in 2016 compared to 2015, with tax increases at certain locations due to the reassessment of property values by localities related to the improved economy, partially offset by decreases at other locations due to successful appeals of tax assessments.
Ground Lease Expense
Ground lease expense for the years ended December 31, 2016 and 2015 was $10.4 million and $10.0 million, respectively. Ground lease expense primarily represents the expense incurred by the Company to lease land for 14 of its hotel properties, including four hotels acquired in the Apple Ten merger effective September 1, 2016.
General and Administrative Expense
General and administrative expense for the years ended December 31, 2016 and 2015 was $17.0 million and $19.6 million, respectively, or 1.6% and 2.2% of total revenue, respectively. The decrease in general and administrative expense for 2016 as compared to 2015 was due primarily to a decrease in compensation expense partially offset by the elimination of the advisory fee and reimbursement of costs received from Apple Ten effective September 1, 2016 due to the acquisition of Apple Ten. Based on the Company’s performance in 2016 in relation to the operational performance and shareholder return metrics of the 2016 Incentive Plan, the amounts earned under the 2016 Incentive Plan were lower than the comparable compensation under the 2015 executive incentive plan (“2015 Incentive Plan”), resulting in a decrease in executive compensation expense for 2016 of approximately $5.6 million, as compared to 2015. However, the decrease in compensation expense was partially offset by the time-based vesting component to the 2015 Incentive Plan, with compensation recognized over a two year period and, as a result, 2016 executive compensation expense includes recognition of share based compensation from both the 2015 and 2016 executive compensation incentive plans.
Transaction and Litigation Costs (Reimbursements)
Transaction and litigation costs (reimbursements) for the years ended December 31, 2016 and 2015 were $35.0 million and $7.2 million, respectively. Transaction and litigation costs (reimbursements) for 2016 consist primarily of (i) costs related to the Apple Ten merger totaling approximately $29.2 million, (ii) $5.5 million of costs incurred to settle the litigation related to Apple Seven’s and Apple Eight’s terminated Dividend Reinvestment Plans discussed herein, and (iii) other acquisition related costs totaling approximately $0.4 million. Transaction and litigation costs (reimbursements) for 2015 consist primarily of (i) costs related to the Board of Directors’ review and evaluation of strategic alternatives, including the Listing, totaling approximately $5.8 million, (ii) costs related to the Company’s merger with Apple Seven and Apple Eight on March 1, 2014 (“A7 and A8 mergers”) totaling approximately $0.1 million, which consisted primarily of costs incurred to defend the A7 and A8 mergers class action lawsuit, dismissed in 2016, net of reimbursements received from the Company’s directors and officers insurance carriers related to these costs and (iii) acquisition related costs totaling approximately $1.2 million.
Loss on Impairment of Depreciable Real Estate Assets
Loss on impairment of depreciable real estate assets was approximately $5.5 million and $45.0 million for the years ended December 31, 2016 and 2015, respectively, and consisted of impairment charges for (a) its Chesapeake, Virginia Marriott hotel recorded during the third quarter of 2016, resulting from a change in the anticipated hold period for this asset, which was later sold in December 2016, and (b) its New York, New York Renaissance hotel recorded in the fourth quarter of 2015, as a result of declines in the hotel’s current and projected operations. See Note 3 titled “Investment in Real Estate” in Part II, Item 8, of the Consolidated Financial Statements and Notes thereto, appearing elsewhere in this Annual Report on Form 10-K for additional information concerning these impairment losses.
Depreciation Expense
Depreciation expense for the years ended December 31, 2016 and 2015 was $148.2 million and $127.4 million, respectively. The increase was primarily due to the increase in the number of properties owned as a result of the Apple Ten merger effective September 1, 2016, the acquisition of one hotel on July 1, 2016 and seven hotels in 2015 and renovations completed throughout 2016 and 2015.
Interest and Other Expense, net
Interest and other expense, net for the years ended December 31, 2016 and 2015 was $40.0 million and $33.1 million, respectively, and is net of approximately $1.6 million and $1.5 million of interest capitalized associated with renovation and construction projects, respectively. The increase in interest expense was primarily due to an increase in the Company’s average outstanding borrowings during 2016 as compared to 2015 which is primarily attributable to (a) mortgage debt assumed in the Apple Ten merger effective September 1, 2016 and (b) borrowings to fund (i) the cash payment portion of the Apple Ten merger, (ii) the repayment of Apple Ten’s outstanding balance on its extinguished credit facility assumed in the merger, (iii) the acquisition of eight hotels (seven between June 1, 2015 and October 31, 2015 and one on July 1, 2016) and (iv) the Company’s tender offer and other share repurchases in 2016 and 2015. The impact of higher debt balances was partially offset by a reduction in the average interest rate incurred on the Company’s total outstanding debt. Also, interest expense in 2015 included a loss of approximately $0.4 million recorded to interest and other expense, net related to the change in fair value in the Company’s interest rate swap terminated in May 2015, from the time that it was no longer designated as a cash flow hedge during the first quarter of 2015 through the termination date.
Non-GAAP Financial Measures
The Company considers the following non-GAAP financial measures useful to investors as key supplemental measures of its operating performance: Funds from Operations (“FFO”), Modified FFO (“MFFO”), Earnings before Interest, Income Taxes, Depreciation and Amortization (“EBITDA”), and Adjusted EBITDA (“Adjusted EBITDA”). These non-GAAP financial measures should be considered along with, but not as alternatives to, net income, cash flow from operations or any other operating GAAP measure. FFO, MFFO, EBITDA and Adjusted EBITDA are not necessarily indicative of funds available to fund the Company’s cash needs, including its ability to make cash distributions. Although FFO, MFFO, EBITDA and Adjusted EBITDA, as calculated by the Company, may not be comparable to FFO, MFFO, EBITDA and Adjusted EBITDA as reported by other companies that do not define such terms exactly as the Company defines such terms, the Company believes these supplemental measures are useful to investors when comparing the Company’s results between periods and with other REITs.
FFO and MFFO
The Company calculates and presents FFO in accordance with standards established by the National Association of Real Estate Investment Trusts (“Nareit”), which defines FFO as net income (computed in accordance with GAAP), excluding gains or losses from sales of real estate, extraordinary items as defined by GAAP, and the cumulative effect of changes in accounting principles, plus real estate related depreciation, amortization and impairments, and adjustments for unconsolidated partnerships and joint ventures. Historical cost accounting for real estate assets implicitly assumes that the value of real estate assets diminishes predictably over time. Since real estate values instead have historically risen or fallen with market conditions, most real estate industry investors consider FFO to be helpful in evaluating a real estate company’s operations. The Company further believes that by excluding the effects of these items, FFO is useful to investors in comparing its operating performance between periods and between REITs that report FFO using the Nareit definition. FFO as presented by the Company is applicable only to its common shareholders, but does not represent an amount that accrues directly to common shareholders.
The Company further adjusts FFO for certain additional items that are not in Nareit’s definition of FFO, including: (i) the exclusion of transaction and litigation costs (reimbursements) as these do not represent ongoing operations and (ii) the exclusion of non-cash straight-line ground lease expense as this expense does not reflect the underlying performance of the related hotels. The Company presents MFFO when evaluating its performance because it believes that it provides further useful supplemental information to investors regarding its ongoing operating performance.
The following table reconciles the Company’s GAAP net income to FFO and MFFO for the years ended December 31, 2017, 2016 and 2015 (in thousands).
|
Years Ended December 31,
|
||||||||||||
|
2017
|
2016
|
2015
|
||||||||||
|
Net income
|
$
|
182,492
|
$
|
144,652
|
$
|
117,288
|
||||||
|
Depreciation of real estate owned
|
175,581
|
147,244
|
126,530
|
|||||||||
|
(Gain) loss on sale of real estate
|
(16,295
|
)
|
153
|
(15,286
|
)
|
|||||||
|
Loss on impairment of depreciable real estate assets
|
45,875
|
5,471
|
45,000
|
|||||||||
|
Amortization of favorable and unfavorable leases, net
|
663
|
674
|
2,422
|
|||||||||
|
Funds from operations
|
388,316
|
298,194
|
275,954
|
|||||||||
|
Transaction and litigation costs (reimbursements)
|
(2,586
|
)
|
34,989
|
7,181
|
||||||||
|
Non-cash straight-line ground lease expense
|
3,700
|
3,419
|
3,347
|
|||||||||
|
Modified funds from operations
|
$
|
389,430
|
$
|
336,602
|
$
|
286,482
|
||||||
EBITDA and Adjusted EBITDA
EBITDA is a commonly used measure of performance in many industries and is defined as net income excluding interest, income taxes, depreciation and amortization. The Company believes EBITDA is useful to investors because it helps the Company and its investors evaluate the ongoing operating performance of the Company by removing the impact of its capital structure (primarily interest expense) and its asset base (primarily depreciation and amortization). In addition, certain covenants included in the agreements governing the Company’s indebtedness use EBITDA, as defined in the specific credit agreement, as a measure of financial compliance.
The Company considers the exclusion of certain additional items from EBITDA useful, including (i) the exclusion of transaction and litigation costs (reimbursements), gains or losses from sales of real estate and the loss on impairment of depreciable real estate assets as these do not represent ongoing operations, and (ii) the exclusion of non-cash straight-line ground lease expense as this expense does not reflect the underlying performance of the related hotels.
The following table reconciles the Company’s GAAP net income to EBITDA and Adjusted EBITDA for the years ended December 31, 2017, 2016 and 2015 (in thousands).
|
Years Ended December 31,
|
||||||||||||
|
2017
|
2016
|
2015
|
||||||||||
|
Net income
|
$
|
182,492
|
$
|
144,652
|
$
|
117,288
|
||||||
|
Depreciation
|
176,499
|
148,163
|
127,449
|
|||||||||
|
Amortization of favorable and unfavorable leases, net
|
663
|
674
|
2,422
|
|||||||||
|
Interest and other expense, net
|
47,343
|
40,026
|
33,132
|
|||||||||
|
Income tax expense
|
847
|
431
|
898
|
|||||||||
|
EBITDA
|
407,844
|
333,946
|
281,189
|
|||||||||
|
Transaction and litigation costs (reimbursements)
|
(2,586
|
)
|
34,989
|
7,181
|
||||||||
|
(Gain) loss on sale of real estate
|
(16,295
|
)
|
153
|
(15,286
|
)
|
|||||||
|
Loss on impairment of depreciable real estate assets
|
45,875
|
5,471
|
45,000
|
|||||||||
|
Non-cash straight-line ground lease expense
|
3,700
|
3,419
|
3,347
|
|||||||||
|
Adjusted EBITDA
|
$
|
438,538
|
$
|
377,978
|
$
|
321,431
|
||||||
Hotels Owned
As of December 31, 2017, the Company owned 239 hotels with an aggregate of 30,322 rooms located in 34 states. The following tables summarize the number of hotels and rooms by brand and by state:
|
Number of Hotels and Guest Rooms by Brand
|
||||||||
|
Number of
|
Number of
|
|||||||
|
Brand
|
Hotels
|
Rooms
|
||||||
|
Hilton Garden Inn
|
42
|
5,807
|
||||||
|
Courtyard
|
40
|
5,460
|
||||||
|
Hampton
|
36
|
4,422
|
||||||
|
Residence Inn
|
34
|
4,011
|
||||||
|
Homewood Suites
|
34
|
3,831
|
||||||
|
SpringHill Suites
|
17
|
2,248
|
||||||
|
TownePlace Suites
|
12
|
1,196
|
||||||
|
Fairfield Inn
|
11
|
1,300
|
||||||
|
Home2 Suites
|
8
|
910
|
||||||
|
Marriott
|
2
|
616
|
||||||
|
Embassy Suites
|
2
|
316
|
||||||
|
Renaissance
|
1
|
205
|
||||||
|
Total
|
239
|
30,322
|
||||||
|
Number of Hotels and Guest Rooms by State
|
||||||||
|
Number of
|
Number of
|
|||||||
|
State
|
Hotels
|
Rooms
|
||||||
|
Alabama
|
15
|
1,434
|
||||||
|
Alaska
|
2
|
304
|
||||||
|
Arizona
|
11
|
1,434
|
||||||
|
Arkansas
|
4
|
408
|
||||||
|
California
|
27
|
3,807
|
||||||
|
Colorado
|
4
|
567
|
||||||
|
Florida
|
23
|
2,851
|
||||||
|
Georgia
|
6
|
596
|
||||||
|
Idaho
|
2
|
416
|
||||||
|
Illinois
|
8
|
1,420
|
||||||
|
Indiana
|
4
|
479
|
||||||
|
Iowa
|
3
|
301
|
||||||
|
Kansas
|
4
|
422
|
||||||
|
Louisiana
|
4
|
541
|
||||||
|
Maine
|
1
|
179
|
||||||
|
Maryland
|
2
|
233
|
||||||
|
Massachusetts
|
4
|
466
|
||||||
|
Michigan
|
1
|
148
|
||||||
|
Minnesota
|
2
|
244
|
||||||
|
Mississippi
|
2
|
168
|
||||||
|
Missouri
|
4
|
544
|
||||||
|
Nebraska
|
4
|
621
|
||||||
|
New Jersey
|
5
|
629
|
||||||
|
New York
|
4
|
550
|
||||||
|
North Carolina
|
12
|
1,337
|
||||||
|
Ohio
|
2
|
252
|
||||||
|
Oklahoma
|
4
|
545
|
||||||
|
Pennsylvania
|
3
|
391
|
||||||
|
South Carolina
|
5
|
538
|
||||||
|
Tennessee
|
12
|
1,356
|
||||||
|
Texas
|
34
|
4,072
|
||||||
|
Utah
|
3
|
393
|
||||||
|
Virginia
|
14
|
2,067
|
||||||
|
Washington
|
4
|
609
|
||||||
|
Total
|
239
|
30,322
|
||||||
Refer to Part I, Item 2, of this Annual Report on Form 10-K for a table summarizing the location, brand, manager, date acquired or completed and number of rooms for each of the 239 hotels the Company owned as of December 31, 2017.
Related Parties
The Company has, and is expected to continue to engage in, transactions with related parties. These transactions cannot be construed to be at arm’s length and the results of the Company’s operations may be different if these transactions were conducted with non-related parties. See Note 7 titled “Related Parties” in Part II, Item 8, of the Consolidated Financial Statements and Notes thereto, appearing elsewhere in this Annual Report on Form 10-K for additional information concerning the Company’s related party transactions.
Liquidity and Capital Resources
Contractual Commitments
The following is a summary of the Company’s significant contractual obligations as of December 31, 2017 (in thousands):
|
Amount of Commitments Expiring per Period
|
||||||||||||||||||||
|
Total
|
1 Year
|
2-3 Years
|
4-5 Years
|
Over 5 Years
|
||||||||||||||||
|
Property Purchase Commitments
|
$
|
127,836
|
$
|
127,836
|
$
|
-
|
$
|
-
|
$
|
-
|
||||||||||
|
Debt (including interest of $196.6 million)
|
1,420,903
|
56,783
|
665,416
|
247,656
|
451,048
|
|||||||||||||||
|
Ground Leases
|
361,572
|
6,318
|
13,372
|
14,074
|
327,808
|
|||||||||||||||
|
$
|
1,910,311
|
$
|
190,937
|
$
|
678,788
|
$
|
261,730
|
$
|
778,856
|
|||||||||||
Capital Resources
The Company’s principal daily sources of liquidity are the operating cash flow generated from the Company’s properties and availability under its revolving credit facility. Periodically the Company may receive proceeds from strategic additional secured and unsecured debt financing, dispositions of its hotel properties and offerings of the Company’s common shares.
The Company’s revolving credit facility has an initial maturity of May 18, 2019 and, subject to certain conditions and fees, may be extended one year. The revolving credit facility, which as of December 31, 2017 had unused borrowing capacity of approximately $433.1 million, is available for acquisitions, hotel renovations and development, share repurchases, working capital and other general corporate funding purposes, including the payment of distributions to shareholders. As of December 31, 2017, the Company’s revolving credit facility had an outstanding principal balance of approximately $106.9 million with an annual variable interest rate of approximately 3.11%.
The credit agreement governing the revolving credit facility contains mandatory prepayment requirements, customary affirmative covenants, negative covenants and events of default. The credit agreement requires that the Company comply with various covenants, which include, among others, a minimum tangible net worth, maximum debt limits, minimum interest and fixed charge coverage ratios, limits on dividend payments and share repurchases and restrictions on certain investments. The Company was in compliance with the applicable covenants at December 31, 2017 and anticipates being in compliance during 2018. See Note 5 titled “Debt” in Part II, Item 8, of the Consolidated Financial Statements and Notes thereto, appearing elsewhere in this Annual Report on Form 10-K for a summary of the financial and restrictive covenants as defined in the credit agreement and a description of the Company’s other debt instruments.
The Company’s ATM Program allows it to sell, from time to time, up to an aggregate of $300 million of its common shares through sales agents. During the fourth quarter of 2017, the Company sold approximately 6.9 million common shares under its ATM Program at a weighted-average market sales price of approximately $19.55 per common share and received aggregate gross proceeds of approximately $135.1 million and proceeds net of offering costs of approximately $132.9 million. The Company used the proceeds from the sale of these shares to pay down borrowings on its revolving credit facility. As of December 31, 2017, approximately $164.9 million remained available for issuance under the ATM program. Future sales will depend on a variety of factors to be determined by
the Company, including market conditions, the trading price of the Company’s common shares and opportunities for uses of any proceeds.
Capital Uses
The Company anticipates that cash flow from operations, availability under its revolving credit facility, additional borrowings and proceeds from hotel dispositions and equity offerings will be adequate to meet its anticipated liquidity requirements, including debt service, hotel acquisitions, hotel renovations, required distributions to shareholders (the Company is not required to make distributions at its current rate for REIT purposes) and share repurchases.
Distributions
To maintain its REIT status the Company is required to distribute at least 90% of its ordinary income. Distributions paid during the year ended December 31, 2017 totaled approximately $267.9 million or $1.20 per common share and were paid at a monthly rate of $0.10 per common share. For the same period, the Company’s net cash generated from operations was approximately $384.7 million, which included a payment of approximately $19.4 million, net of reimbursements received from the Company’s directors and officers insurance carriers, during 2017 to settle the Apple Ten merger litigation which is discussed in Note 14 titled “Legal Proceedings” in Part II, Item 8, of the Consolidated Financial Statements and Notes thereto, appearing elsewhere in this Annual Report on Form 10-K. Distributions paid during the year ended December 31, 2016 totaled $229.1 million or $1.20 per common share and net cash from operations was approximately $332.0 million. Distributions paid during the year ended December 31, 2015 totaled $229.1 million or $1.27 per common share and net cash from operations was approximately $281.1 million.
The Company’s current annual distribution rate, payable monthly, is $1.20 per common share. As it has done historically, due to seasonality, the Company may use its revolving credit facility to maintain the consistency of the monthly distribution rate, taking into consideration any acquisitions, dispositions, capital improvements and economic cycles. Any distribution will be subject to approval of the Company’s Board of Directors and there can be no assurance of the classification or duration of distributions at the current annual distribution rate. The Board of Directors monitors the Company’s distribution rate relative to the performance of the hotels on an ongoing basis and may make adjustments to the distribution rate as determined to be prudent in relation to other cash requirements of the Company. If cash flow from operations and the revolving credit facility are not adequate to meet liquidity requirements, the Company may utilize additional financing sources to make distributions. Although the Company has relatively low levels of debt, there can be no assurances it will be successful with this strategy and may need to reduce its distributions to required levels. If the Company were unable to extend its maturing debt in future periods or if it were to default on its debt, it may be unable to make distributions.
Share Repurchases
During 2017, the Company’s Board of Directors authorized an extension of its share repurchase program to repurchase up to $475 million of its common shares, which program will end in July 2018, if not terminated earlier. The program may be suspended or terminated at any time by the Company. In connection with the implementation of the ATM Program, in February 2017 the Company terminated its then existing written trading plan under the Company’s share repurchase program. Since inception of the share repurchase program in July 2015 through December 31, 2017, the Company has purchased approximately 1.7 million of its common shares at a weighted-average market purchase price of approximately $17.64 per common share, for an aggregate purchase price of approximately $29.9 million, including the purchase of approximately 0.4 million of its common shares in 2016, at a weighted-average market purchase price of approximately $17.72 per common share for an aggregate purchase price of approximately $7.9 million and approximately 1.2 million of its common shares in 2015, at a weighted-average market purchase price of approximately $17.61 per common share for an aggregate purchase price of approximately $22.0 million. Repurchases under the program were funded with availability under the revolving credit facility. The Company did not repurchase any common shares under its share repurchase program during 2017. The Company plans to continue to consider opportunistic share repurchases under the $467.5 million remaining portion of the authorized $475 million share repurchase program, which will depend upon prevailing market conditions and other factors.
In connection with the Listing, the Company completed a modified “Dutch Auction” tender offer in June 2015 and purchased approximately 10.5 million of its common shares, which were retired, at a purchase price of $19.00 per common share, for an aggregate purchase price of approximately $200 million, excluding fees and expenses related to the tender offer. The Company funded the tender offer and all related costs primarily from borrowings under its $965 million credit facility.
Prior to the Listing, during 2015, the Company redeemed approximately 0.8 million common shares at a price of $18.40 per common share, or a total of approximately $14.9 million, under its previous share redemption program that was terminated following the April 2015 redemption.
Capital Improvements
The Company has ongoing capital commitments to fund its capital improvements. To maintain and enhance each property’s competitive position in its market, the Company has invested in and plans to continue to reinvest in its hotels. Under certain loan and management agreements, the Company is required to place in escrow funds for the repair, replacement and refurbishing of furniture, fixtures, and equipment, based on a percentage of gross revenues, provided that such amount may be used for the Company’s capital expenditures with respect to the hotels. As of December 31, 2017, the Company held approximately $26.4 million in reserve related to these properties. During 2017, the Company invested approximately $69.1 million in capital expenditures and anticipates spending approximately $70 to $80 million during 2018, which includes various scheduled renovation projects for approximately 30 to 35 properties. The Company does not currently have any existing or planned projects for development.
Hotel Contract Commitments
As of December 31, 2017, the Company had outstanding contracts for the potential purchase of four hotels for a total purchase price of $127.8 million. Two of the hotels, the Atlanta Hampton Inn & Suites and the Memphis Hampton Inn & Suites, both of which are in operation, were acquired in February 2018 for a gross purchase price of $63.0 million. The two remaining hotels are under construction and are planned to be completed and opened for business during 2018, at which time closing on these hotels is expected to occur. Although the Company is working towards acquiring the two hotels under construction, there are many conditions to closing that have not yet been satisfied and there can be no assurance that a closing on these hotels will occur under the outstanding purchase contracts. The purchase price for the Atlanta Hampton Inn & Suites and the Memphis Hampton Inn & Suites was funded through the Company’s revolving credit facility and it is anticipated that the purchase price for the remaining hotels will be funded similarly.
Cash Management Activities
As part of the cost sharing arrangements discussed in Note 7 titled “Related Parties” in Part II, Item 8, of the Consolidated Financial Statements and Notes thereto, appearing elsewhere in this Annual Report on Form 10-K, certain day-to-day transactions may result in amounts due to or from the Company and ARG. To efficiently manage cash disbursements, the Company or ARG may make payments for the other company. Under the cash management process, each company may advance or defer up to $1 million at any time. Each quarter, any outstanding amounts are settled between the companies. This process allows each company to minimize its cash on hand and reduces the cost for each company. The amounts outstanding at any point in time are not significant to either of the companies.
Management and Franchise Agreements
Each of the Company’s 239 hotels owned as of December 31, 2017 is operated and managed under separate management agreements with 23 hotel management companies, none of which are affiliated with the Company. Sixteen of the Company’s hotels are managed by affiliates of Marriott or Hilton. The remainder of the Company’s hotels are managed by companies that are not affiliated with either Marriott or Hilton, and as a result, the hotels they manage were required to obtain separate franchise agreements with each respective franchisor. See Note 10 titled “Management and Franchise Agreements” in Part II, Item 8, of the Consolidated Financial Statements and Notes thereto, appearing elsewhere in this Annual Report on Form 10-K for additional information pertaining to the management and franchise agreements, including a listing of the Company’s hotel management companies. For the years ended December 31, 2017, 2016 and 2015, the Company incurred approximately $42.7 million, $35.6 million
and $31.1 million in management fees, respectively. For the years ended December 31, 2017, 2016 and 2015, the Company incurred approximately $52.9 million, $44.2 million and $38.0 million, respectively, in franchise royalty fees.
Impact of Inflation
Operators of hotels, in general, possess the ability to adjust room rates daily to reflect the effects of inflation. Competitive pressures may, however, limit the operators’ ability to raise room rates. Currently the Company is not experiencing any material impact from inflation.
Business Interruption
Being in the real estate industry, the Company is exposed to natural disasters on both a local and national scale. Although management believes it has adequate insurance to cover this exposure, there can be no assurance that such events will not have a material adverse effect on the Company’s financial position or results of operations.
Seasonality
The hotel industry historically has been seasonal in nature. Seasonal variations in occupancy at the Company’s hotels may cause quarterly fluctuations in its revenues. Generally, occupancy rates and hotel revenues are greater in the second and third quarters than in the first and fourth quarters. To the extent that cash flow from operations is insufficient during any quarter, due to temporary or seasonal fluctuations in revenue, the Company expects to utilize cash on hand or available financing sources to meet cash requirements.
Critical Accounting Policies
The following contains a discussion of what the Company believes to be its critical accounting policies. These items should be read to gain a further understanding of the principles used to prepare the Company’s financial statements. These principles include application of judgment; therefore, changes in judgments may have a significant impact on the Company’s reported results of operations and financial condition.
Investment Policy
Upon acquisition of real estate properties, the Company estimates the fair value of acquired tangible assets (consisting of land, buildings and improvements, and furniture, fixtures and equipment) and identified intangible assets and liabilities, including in-place leases, and assumed debt based on evaluation of information and estimates available at that date. Fair values for these assets are not directly observable and estimates are based on comparables and other information which is subjective in nature. The Company has not assigned any value to management contracts and franchise agreements as such contracts are generally at current market rates based on the remaining terms of the contracts and any other value attributable to these contracts is not considered material. Prior to January 1, 2017, the Company’s acquisitions of hotel properties were accounted for as acquisitions of existing businesses, and therefore all transaction costs associated with the acquisitions, including title, legal, accounting, brokerage commissions and other related costs, were expensed as incurred. Beginning January 1, 2017, acquisitions of hotel properties have been and will generally be accounted for as acquisitions of a group of assets, with costs incurred to effect an acquisition being capitalized as part of the cost of the assets acquired, instead of accounted for separately as expenses in the period that they are incurred.
Capitalization Policy
The Company considers expenditures to be capital in nature based on the following criteria: (1) for a single asset, the cost must be at least $500, including all normal and necessary costs to place the asset in service, and the useful life must be at least one year; (2) for group purchases of 10 or more identical assets, the unit cost for each asset must be at least $50, including all normal and necessary costs to place the asset in service, and the useful life must be at least one year; and (3) for major repairs to a single asset, the repair must be at least $2,500 and the useful life of the asset must be substantially extended.
Impairment Losses Policy
The Company records impairment losses on hotel properties used in operations if indicators of impairment are present, and the sum of the undiscounted cash flows estimated to be generated by the respective properties over their estimated remaining useful life, based on historical and industry data, is less than the properties’ carrying amount. Indicators of impairment include a property with current or potential losses from operations, when it becomes more likely than not that a property will be sold before the end of its previously estimated useful life or when events, trends, contingencies or changes in circumstances indicate that a triggering event has occurred and an asset’s carrying value may not be recoverable. The Company monitors its properties on an ongoing basis by analytically reviewing financial performance and considers each property individually for purposes of reviewing for indicators of impairment. As many indicators of impairment are subjective, such as general economic and market declines, the Company also prepares an annual recoverability analysis for each of its properties to assist with its evaluation of impairment indicators. The analysis compares each property’s net book value to each property’s estimated operating income using current operating results for each stabilized property and projected stabilized operating results based on the property’s market for properties that recently opened, were recently renovated or experienced other short-term business disruption. The Company’s planned initial hold period for each property is generally 39 years. If events or circumstances change, such as the Company’s intended hold period for a property or if the operating performance of a property declines substantially for an extended period of time, the Company’s carrying value for a particular property may not be recoverable, and an impairment loss will be recorded. Impairment losses are measured as the difference between the asset’s fair value and its carrying value. The Company’s ongoing analyses and annual recoverability analyses have not identified any impairment losses other than the losses on impairment of three properties recorded in 2017, one property recorded in 2016 and one property recorded in 2015 totaling approximately $45.9 million, $5.5 million and $45.0 million, respectively, as discussed herein under “Results of Operations” and in Note 3 titled “Investment in Real Estate” in Part II, Item 8, of the Consolidated Financial Statements and Notes thereto, appearing elsewhere in this Annual Report on Form 10-K.
New Accounting Standards
See Note 1 titled “Organization and Summary of Significant Accounting Policies” in Part II, Item 8, of the Consolidated Financial Statements and Notes thereto, appearing elsewhere in this Annual Report on Form 10-K for information on the adoption of accounting standards in 2017 and the anticipated adoption of recently issued accounting standards.
Subsequent Events
In both January 2018 and February 2018, the Company paid approximately $23.0 million, or $0.10 per outstanding common share, in distributions to its common shareholders.
In February 2018, the Company declared a regular monthly cash distribution of $0.10 per common share for the month of March 2018. The distribution is payable on March 15, 2018.
On February 5, 2018, the Company closed on the purchase of an existing 119-room Hampton Inn & Suites in Atlanta, Georgia and an existing 144-room Hampton Inn & Suites in Memphis, Tennessee for a gross purchase price of $63.0 million.
As of December 31, 2017, the Company’s financial instruments were not exposed to significant market risk due to foreign currency exchange risk, commodity price risk or equity price risk. However, the Company is exposed to interest rate risk due to possible changes in short term interest rates as it invests its cash or borrows on its revolving credit facility and due to its variable interest rate term loans. As of December 31, 2017, after giving effect to interest rate swaps, as described below, approximately $209.4 million, or approximately 17% of the Company’s total debt outstanding, was subject to variable interest rates. Based on the Company’s variable rate debt outstanding as of December 31, 2017, every 100 basis points change in interest rates will impact the Company’s annual net income by approximately $2.1 million, all other factors remaining the same. With the exception of interest rate swap transactions, the Company has not engaged in transactions in derivative financial instruments or derivative commodity instruments. The Company’s cash balance at December 31, 2017 was $0.
As of December 31, 2017, the Company’s variable rate debt consisted of its $540 million revolving credit facility and six term loans totaling $660 million. Currently, the Company uses interest rate swaps to manage its interest rate risk on a portion of its variable rate debt. As of December 31, 2017, the Company had six interest rate swap agreements that effectively fix the interest payments on approximately $557.5 million of the Company’s variable rate debt (consisting of five term loans) through maturity. Under the terms of all of the Company’s interest rate swaps, the Company pays a fixed rate of interest and receives a floating rate of interest equal to the one-month LIBOR.
In addition to its variable rate debt and interest rate swaps discussed above, the Company has assumed or originated fixed interest rate mortgages payable to lenders under permanent financing arrangements. The following table summarizes the annual maturities and average interest rates of the Company’s mortgage debt, the six term loans and borrowings outstanding under the $540 million revolving credit facility at December 31, 2017. All dollar amounts are in thousands.
|
2018
|
2019
|
2020
|
2021
|
2022
|
Thereafter
|
Total
|
Fair Market Value
|
|||||||||||||||||||||||||
|
Total debt:
|
||||||||||||||||||||||||||||||||
|
Maturities
|
$
|
11,964
|
$
|
139,622
|
$
|
452,223
|
$
|
96,415
|
$
|
108,034
|
$
|
416,077
|
$
|
1,224,335
|
$
|
1,221,312
|
||||||||||||||||
|
Average interest rates
|
3.6
|
%
|
3.6
|
%
|
3.8
|
%
|
4.0
|
%
|
3.9
|
%
|
3.8
|
%
|
||||||||||||||||||||
|
Variable rate debt:
|
||||||||||||||||||||||||||||||||
|
Maturities
|
$
|
-
|
$
|
106,900
|
$
|
425,000
|
$
|
50,000
|
$
|
-
|
$
|
185,000
|
$
|
766,900
|
$
|
768,745
|
||||||||||||||||
|
Average interest rates (1)
|
3.1
|
%
|
3.1
|
%
|
3.2
|
%
|
3.3
|
%
|
3.4
|
%
|
3.4
|
%
|
||||||||||||||||||||
|
Fixed rate debt:
|
||||||||||||||||||||||||||||||||
|
Maturities
|
$
|
11,964
|
$
|
32,722
|
$
|
27,223
|
$
|
46,415
|
$
|
108,034
|
$
|
231,077
|
$
|
457,435
|
$
|
452,567
|
||||||||||||||||
|
Average interest rates
|
4.5
|
%
|
4.5
|
%
|
4.5
|
%
|
4.4
|
%
|
4.2
|
%
|
4.1
|
%
|
||||||||||||||||||||
| (1) |
The average interest rate gives effect to interest rate swaps, as applicable.
|
Report of Management
on Internal Control over Financial Reporting
on Internal Control over Financial Reporting
February 22, 2018
To the Shareholders
Apple Hospitality REIT, Inc.
To the Shareholders
Apple Hospitality REIT, Inc.
Management of Apple Hospitality REIT, Inc. (the “Company”) is responsible for establishing and maintaining adequate internal control over financial reporting and for the assessment of the effectiveness of internal control over financial reporting. As defined by the Securities and Exchange Commission, internal control over financial reporting is a process designed by, or under the supervision of the Company’s principal executive and principal financial officers and effected by the Company’s Board of Directors, management and other personnel, to provide reasonable assurance regarding the reliability of financial reporting and the preparation of the consolidated financial statements for external purposes in accordance with U.S. generally accepted accounting principles.
The Company’s internal control over financial reporting is supported by written policies and procedures that (1) pertain to the maintenance of records that, in reasonable detail, accurately and fairly reflect the Company’s transactions and dispositions of the Company’s assets; (2) provide reasonable assurance that transactions are recorded as necessary to permit preparation of the consolidated financial statements in accordance with generally accepted accounting principles, and the receipts and expenditures of the Company are being made only in accordance with authorizations of the Company’s management and directors; and (3) provide reasonable assurance regarding prevention or timely detection of unauthorized acquisition, use or disposition of the Company’s assets that could have a material effect on the consolidated financial statements.
Because of its inherent limitations, internal control over financial reporting may not prevent or detect misstatements. Also, projections of any evaluation of effectiveness to future periods are subject to the risk that controls may become inadequate because of changes in conditions, or that the degree of compliance with the policies or procedures may deteriorate.
In connection with the preparation of the Company’s annual consolidated financial statements, management has undertaken an assessment of the effectiveness of the Company’s internal control over financial reporting as of December 31, 2017, based on criteria established in Internal Control—Integrated Framework issued by the Committee of Sponsoring Organizations of the Treadway Commission (2013 framework). Management’s assessment included an evaluation of the design of the Company’s internal control over financial reporting and testing of the operational effectiveness of those controls.
Based on this assessment, management has concluded that as of December 31, 2017, the Company’s internal control over financial reporting was effective to provide reasonable assurance regarding the reliability of financial reporting and the preparation of financial statements for external purposes in accordance with U.S. generally accepted accounting principles.
Ernst & Young LLP, the independent registered public accounting firm that audited the Company’s consolidated financial statements included in this report, has issued an attestation report on the Company’s internal control over financial reporting, a copy of which appears on the next page of this annual report.
|
/s/ Justin G. Knight
|
|
/s/ Bryan Peery
|
|
Justin G. Knight,
President and
|
|
Bryan Peery,
Chief Financial Officer
|
|
Chief Executive Officer
(Principal Executive Officer)
|
|
(Principal Financial and Principal
Accounting Officer)
|
Report of Independent Registered Public Accounting Firm
To the Shareholders and the Board of Directors of Apple Hospitality REIT, Inc.
Opinion on Internal Control over Financial Reporting
We have audited Apple Hospitality REIT, Inc.’s internal control over financial reporting as of December 31, 2017, based on criteria established in Internal Control—Integrated Framework issued by the Committee of Sponsoring Organizations of the Treadway Commission (2013 framework) (the COSO criteria). In our opinion, Apple Hospitality REIT, Inc. (the Company) maintained, in all material respects, effective internal control over financial reporting as of December 31, 2017, based on the COSO criteria.
We also have audited, in accordance with the standards of the Public Company Accounting Oversight Board (United States) (PCAOB), the consolidated balance sheets of the Company as of December 31, 2017 and 2016, the related consolidated statements of operations and comprehensive income, shareholders’ equity and cash flows for each of the three years in the period ended December 31, 2017, and the related notes and the financial statement schedule listed in the Index at Item 15(2) and our report dated February 22, 2018 expressed an unqualified opinion thereon.
Basis for Opinion
The Company’s management is responsible for maintaining effective internal control over financial reporting and for its assessment of the effectiveness of internal control over financial reporting included in the accompanying Report of Management on Internal Control over Financial Reporting. Our responsibility is to express an opinion on the Company’s internal control over financial reporting based on our audit. We are a public accounting firm registered with the PCAOB and are required to be independent with respect to the Company in accordance with the U.S. federal securities laws and the applicable rules and regulations of the Securities and Exchange Commission and the PCAOB.
We conducted our audit in accordance with the standards of the PCAOB. Those standards require that we plan and perform the audit to obtain reasonable assurance about whether effective internal control over financial reporting was maintained in all material respects.
Our audit included obtaining an understanding of internal control over financial reporting, assessing the risk that a material weakness exists, testing and evaluating the design and operating effectiveness of internal control based on the assessed risk, and performing such other procedures as we considered necessary in the circumstances. We believe that our audit provides a reasonable basis for our opinion.
Definition and Limitations of Internal Control Over Financial Reporting
A company’s internal control over financial reporting is a process designed to provide reasonable assurance regarding the reliability of financial reporting and the preparation of financial statements for external purposes in accordance with generally accepted accounting principles. A company’s internal control over financial reporting includes those policies and procedures that (1) pertain to the maintenance of records that, in reasonable detail, accurately and fairly reflect the transactions and dispositions of the assets of the company; (2) provide reasonable assurance that transactions are recorded as necessary to permit preparation of financial statements in accordance with generally accepted accounting principles, and that receipts and expenditures of the company are being made only in accordance with authorizations of management and directors of the company; and (3) provide reasonable assurance regarding prevention or timely detection of unauthorized acquisition, use, or disposition of the company’s assets that could have a material effect on the financial statements.
Because of its inherent limitations, internal control over financial reporting may not prevent or detect misstatements. Also, projections of any evaluation of effectiveness to future periods are subject to the risk that controls may become inadequate because of changes in conditions, or that the degree of compliance with the policies or procedures may deteriorate.
/s/ Ernst & Young LLP
Richmond, Virginia
February 22, 2018
Report of Independent Registered Public Accounting Firm
To the Shareholders and the Board of Directors of Apple Hospitality REIT, Inc.
Opinion on the Financial Statements
We have audited the accompanying consolidated balance sheets of Apple Hospitality REIT, Inc. (the Company) as of December 31, 2017 and 2016, the related consolidated statements of operations and comprehensive income, shareholders’ equity and cash flows for each of the three years in the period ended December 31, 2017, and the related notes and the financial statement schedule listed in the Index at Item 15(2) (collectively referred to as the “consolidated financial statements”). In our opinion, the consolidated financial statements present fairly, in all material respects, the financial position of the Company at December 31, 2017 and 2016, and the results of its operations and its cash flows for each of the three years in the period ended December 31, 2017, in conformity with U.S. generally accepted accounting principles.
We also have audited, in accordance with the standards of the Public Company Accounting Oversight Board (United States) (PCAOB), the Company’s internal control over financial reporting as of December 31, 2017, based on criteria established in Internal Control-Integrated Framework issued by the Committee of Sponsoring Organizations of the Treadway Commission (2013 framework), and our report dated February 22, 2018 expressed an unqualified opinion thereon.
Basis for Opinion
These financial statements are the responsibility of the Company’s management. Our responsibility is to express an opinion on the Company’s financial statements based on our audits. We are a public accounting firm registered with the PCAOB and are required to be independent with respect to the Company in accordance with the U.S. federal securities laws and the applicable rules and regulations of the Securities and Exchange Commission and the PCAOB.
We conducted our audits in accordance with the standards of the PCAOB. Those standards require that we plan and perform the audit to obtain reasonable assurance about whether the financial statements are free of material misstatement, whether due to error or fraud. Our audits included performing procedures to assess the risks of material misstatement of the financial statements, whether due to error or fraud, and performing procedures that respond to those risks. Such procedures included examining, on a test basis, evidence regarding the amounts and disclosures in the financial statements. Our audits also included evaluating the accounting principles used and significant estimates made by management, as well as evaluating the overall presentation of the financial statements. We believe that our audits provide a reasonable basis for our opinion.
/s/ Ernst & Young LLP
We have served as the Company’s auditor since 2007.
Richmond, Virginia
February 22, 2018
Apple Hospitality REIT, Inc.
Consolidated Balance Sheets
(in thousands, except share data)
|
As of December 31,
|
||||||||
|
2017
|
2016
|
|||||||
|
Assets
|
||||||||
|
Investment in real estate, net of accumulated depreciation
of $731,284 and $557,597, respectively
|
$
|
4,793,159
|
$
|
4,823,489
|
||||
|
Assets held for sale
|
-
|
39,000
|
||||||
|
Restricted cash-furniture, fixtures and other escrows
|
29,791
|
29,425
|
||||||
|
Due from third party managers, net
|
31,457
|
31,460
|
||||||
|
Other assets, net
|
47,931
|
56,509
|
||||||
|
Total Assets
|
$
|
4,902,338
|
$
|
4,979,883
|
||||
|
Liabilities
|
||||||||
|
Revolving credit facility
|
$
|
106,900
|
$
|
270,000
|
||||
|
Term loans
|
656,279
|
570,934
|
||||||
|
Mortgage debt
|
459,017
|
497,029
|
||||||
|
Accounts payable and other liabilities
|
109,057
|
124,856
|
||||||
|
Total Liabilities
|
1,331,253
|
1,462,819
|
||||||
|
Shareholders’ Equity
|
||||||||
|
Preferred stock, authorized 30,000,000 shares; none issued
and outstanding
|
-
|
-
|
||||||
|
Common stock, no par value, authorized 800,000,000 shares;
issued and outstanding 229,961,548 and 222,938,648 shares, respectively
|
4,588,188
|
4,453,205
|
||||||
|
Accumulated other comprehensive income
|
9,778
|
4,589
|
||||||
|
Distributions greater than net income
|
(1,026,881
|
)
|
(940,730
|
)
|
||||
|
Total Shareholders’ Equity
|
3,571,085
|
3,517,064
|
||||||
|
Total Liabilities and Shareholders’ Equity
|
$
|
4,902,338
|
$
|
4,979,883
|
||||
See notes to consolidated financial statements.
Apple Hospitality REIT, Inc.
Consolidated Statements of Operations and Comprehensive Income
(in thousands, except per share data)
|
Years Ended December 31,
|
||||||||||||
|
2017
|
2016
|
2015
|
||||||||||
|
Revenues:
|
||||||||||||
|
Room
|
$
|
1,143,987
|
$
|
956,119
|
$
|
821,733
|
||||||
|
Other
|
94,635
|
84,906
|
76,581
|
|||||||||
|
Total revenue
|
1,238,622
|
1,041,025
|
898,314
|
|||||||||
|
Expenses:
|
||||||||||||
|
Operating
|
310,756
|
262,432
|
227,915
|
|||||||||
|
Hotel administrative
|
99,745
|
81,099
|
69,526
|
|||||||||
|
Sales and marketing
|
100,877
|
82,663
|
71,009
|
|||||||||
|
Utilities
|
41,909
|
35,585
|
32,668
|
|||||||||
|
Repair and maintenance
|
48,463
|
41,249
|
36,886
|
|||||||||
|
Franchise fees
|
52,930
|
44,225
|
38,003
|
|||||||||
|
Management fees
|
42,722
|
35,586
|
31,074
|
|||||||||
|
Property taxes, insurance and other
|
69,391
|
56,860
|
46,023
|
|||||||||
|
Ground lease
|
11,313
|
10,409
|
9,996
|
|||||||||
|
General and administrative
|
26,341
|
17,032
|
19,552
|
|||||||||
|
Transaction and litigation costs (reimbursements)
|
(2,586
|
)
|
34,989
|
7,181
|
||||||||
|
Loss on impairment of depreciable real estate assets
|
45,875
|
5,471
|
45,000
|
|||||||||
|
Depreciation
|
176,499
|
148,163
|
127,449
|
|||||||||
|
Total expenses
|
1,024,235
|
855,763
|
762,282
|
|||||||||
|
Operating income
|
214,387
|
185,262
|
136,032
|
|||||||||
|
Interest and other expense, net
|
(47,343
|
)
|
(40,026
|
)
|
(33,132
|
)
|
||||||
|
Gain (loss) on sale of real estate
|
16,295
|
(153
|
)
|
15,286
|
||||||||
|
Income before income taxes
|
183,339
|
145,083
|
118,186
|
|||||||||
|
Income tax expense
|
(847
|
)
|
(431
|
)
|
(898
|
)
|
||||||
|
Net income
|
$
|
182,492
|
$
|
144,652
|
$
|
117,288
|
||||||
|
Other comprehensive income (loss):
|
||||||||||||
|
Interest rate derivatives
|
5,189
|
6,646
|
(1,546
|
)
|
||||||||
|
Comprehensive income
|
$
|
187,681
|
$
|
151,298
|
$
|
115,742
|
||||||
|
Basic and diluted net income per common share
|
$
|
0.82
|
$
|
0.76
|
$
|
0.65
|
||||||
|
Weighted average common shares outstanding - basic and diluted
|
223,526
|
190,856
|
180,261
|
|||||||||
See notes to consolidated financial statements.
Apple Hospitality REIT, Inc.
Consolidated Statements of Shareholders’ Equity
(in thousands, except per share data)
|
Common Stock
|
Accumulated Other Comprehensive Income (Loss)
|
Distributions Greater Than Net Income
|
||||||||||||||||||
|
Number of Shares
|
Amount
|
Total
|
||||||||||||||||||
|
Balance at December 31, 2014
|
186,910
|
$
|
3,737,328
|
$
|
(511
|
)
|
$
|
(722,193
|
)
|
$
|
3,014,624
|
|||||||||
|
Share based compensation and rounding of fractional shares for 50% reverse share split
|
44
|
823
|
-
|
-
|
823
|
|||||||||||||||
|
Common shares repurchased
|
(12,586
|
)
|
(237,567
|
)
|
-
|
-
|
(237,567
|
)
|
||||||||||||
|
Interest rate derivatives
|
-
|
-
|
(1,546
|
)
|
-
|
(1,546
|
)
|
|||||||||||||
|
Net income
|
-
|
-
|
-
|
117,288
|
117,288
|
|||||||||||||||
|
Distributions declared and paid to shareholders ($1.27 per share)
|
-
|
-
|
-
|
(229,127
|
)
|
(229,127
|
)
|
|||||||||||||
|
Distribution declared and payable to shareholders ($0.10 per share)
|
-
|
-
|
-
|
(17,437
|
)
|
(17,437
|
)
|
|||||||||||||
|
Balance at December 31, 2015
|
174,368
|
3,500,584
|
(2,057
|
)
|
(851,469
|
)
|
2,647,058
|
|||||||||||||
|
Share based compensation, net
|
284
|
5,611
|
-
|
-
|
5,611
|
|||||||||||||||
|
Issuance of common shares, net
|
48,730
|
954,879
|
-
|
-
|
954,879
|
|||||||||||||||
|
Common shares repurchased
|
(443
|
)
|
(7,869
|
)
|
-
|
-
|
(7,869
|
)
|
||||||||||||
|
Interest rate derivatives
|
-
|
-
|
6,646
|
-
|
6,646
|
|||||||||||||||
|
Net income
|
-
|
-
|
-
|
144,652
|
144,652
|
|||||||||||||||
|
Distributions declared to shareholders ($1.20 per share)
|
-
|
-
|
-
|
(233,913
|
)
|
(233,913
|
)
|
|||||||||||||
|
Balance at December 31, 2016
|
222,939
|
4,453,205
|
4,589
|
(940,730
|
)
|
3,517,064
|
||||||||||||||
|
Share based compensation, net
|
115
|
2,178
|
-
|
-
|
2,178
|
|||||||||||||||
|
Issuance of common shares, net
|
6,908
|
132,805
|
-
|
-
|
132,805
|
|||||||||||||||
|
Interest rate derivatives
|
-
|
-
|
5,189
|
-
|
5,189
|
|||||||||||||||
|
Net income
|
-
|
-
|
-
|
182,492
|
182,492
|
|||||||||||||||
|
Distributions declared to shareholders ($1.20 per share)
|
-
|
-
|
-
|
(268,643
|
)
|
(268,643
|
)
|
|||||||||||||
|
Balance at December 31, 2017
|
229,962
|
$
|
4,588,188
|
$
|
9,778
|
$
|
(1,026,881
|
)
|
$
|
3,571,085
|
||||||||||
See notes to consolidated financial statements.
Apple Hospitality REIT, Inc.
Consolidated Statements of Cash Flows
(in thousands)
|
Years Ended December 31,
|
||||||||||||
|
2017
|
2016
|
2015
|
||||||||||
|
Cash flows from operating activities:
|
||||||||||||
|
Net income
|
$
|
182,492
|
$
|
144,652
|
$
|
117,288
|
||||||
|
Adjustments to reconcile net income to cash provided by operating activities:
|
||||||||||||
|
Depreciation
|
176,499
|
148,163
|
127,449
|
|||||||||
|
Loss on impairment of depreciable real estate assets
|
45,875
|
5,471
|
45,000
|
|||||||||
|
(Gain) loss on sale of real estate
|
(16,295
|
)
|
153
|
(15,286
|
)
|
|||||||
|
Other non-cash expenses, net
|
7,120
|
6,747
|
6,015
|
|||||||||
|
Changes in operating assets and liabilities, net of amounts acquired or assumed with acquisitions:
|
||||||||||||
|
Decrease (increase) in due from third party managers, net
|
17
|
5,164
|
(1,827
|
)
|
||||||||
|
Decrease (increase) in other assets, net
|
11,905
|
(9,912
|
)
|
(644
|
)
|
|||||||
|
Increase (decrease) in accounts payable and other liabilities
|
(22,872
|
)
|
31,596
|
3,057
|
||||||||
|
Net cash provided by operating activities
|
384,741
|
332,034
|
281,052
|
|||||||||
|
Cash flows from investing activities:
|
||||||||||||
|
Cash consideration in Apple Ten merger
|
-
|
(93,590
|
)
|
-
|
||||||||
|
Acquisition of hotel properties, net
|
(162,903
|
)
|
(23,994
|
)
|
(233,078
|
)
|
||||||
|
Deposits and other disbursements for potential acquisitions
|
(1,359
|
)
|
(510
|
)
|
(563
|
)
|
||||||
|
Capital improvements and development costs
|
(63,305
|
)
|
(65,128
|
)
|
(62,260
|
)
|
||||||
|
Decrease (increase) in capital improvement reserves
|
(1,036
|
)
|
3,625
|
8,451
|
||||||||
|
Net proceeds from sale of real estate
|
69,311
|
9,760
|
205,165
|
|||||||||
|
Net cash used in investing activities
|
(159,292
|
)
|
(169,837
|
)
|
(82,285
|
)
|
||||||
|
Cash flows from financing activities:
|
||||||||||||
|
Net proceeds (disbursements) related to issuance of common shares
|
132,993
|
(1,207
|
)
|
-
|
||||||||
|
Repurchases of common shares
|
-
|
(7,869
|
)
|
(237,567
|
)
|
|||||||
|
Repurchases of common shares to satisfy employee withholding requirements
|
(692
|
)
|
(1,459
|
)
|
-
|
|||||||
|
Distributions paid to common shareholders
|
(267,917
|
)
|
(229,056
|
)
|
(229,127
|
)
|
||||||
|
Net proceeds from (payments on) revolving credit facility
|
(163,100
|
)
|
155,200
|
23,200
|
||||||||
|
Payments on extinguished credit facility
|
-
|
(111,100
|
)
|
-
|
||||||||
|
Proceeds from term loans
|
85,000
|
150,000
|
425,000
|
|||||||||
|
Repayment of term loan
|
-
|
-
|
(100,000
|
)
|
||||||||
|
Proceeds from mortgage debt
|
30,000
|
94,000
|
38,000
|
|||||||||
|
Payments of mortgage debt
|
(39,920
|
)
|
(207,694
|
)
|
(111,218
|
)
|
||||||
|
Financing costs
|
(1,813
|
)
|
(3,012
|
)
|
(7,055
|
)
|
||||||
|
Net cash used in financing activities
|
(225,449
|
)
|
(162,197
|
)
|
(198,767
|
)
|
||||||
|
Net change in cash and cash equivalents
|
-
|
-
|
-
|
|||||||||
|
Cash and cash equivalents, beginning of period
|
-
|
-
|
-
|
|||||||||
|
Cash and cash equivalents, end of period
|
$
|
-
|
$
|
-
|
$
|
-
|
||||||
|
Supplemental cash flow information:
|
||||||||||||
|
Interest paid
|
$
|
46,885
|
$
|
41,884
|
$
|
35,019
|
||||||
|
Income taxes paid
|
$
|
877
|
$
|
1,104
|
$
|
1,021
|
||||||
|
Supplemental disclosure of noncash investing and financing activities:
|
||||||||||||
|
Stock consideration in Apple Ten merger (see note 2)
|
$
|
-
|
$
|
956,086
|
$
|
-
|
||||||
|
Mortgage debt assumed in acquisition of hotel properties
|
$
|
-
|
$
|
-
|
$
|
22,399
|
||||||
|
Mortgage debt assumed by buyer upon sale of real estate
|
$
|
27,073
|
$
|
-
|
$
|
-
|
||||||
|
Accrued distribution to common shareholders
|
$
|
23,020
|
$
|
22,294
|
$
|
17,437
|
||||||
See notes to consolidated financial statements.
Apple Hospitality REIT, Inc.
Notes to Consolidated Financial Statements
Note 1
Organization and Summary of Significant Accounting Policies
Organization
Apple Hospitality REIT, Inc., formed in November 2007 as a Virginia corporation, together with its wholly-owned subsidiaries (the “Company”), is a self-advised real estate investment trust (“REIT”) that invests in income-producing real estate, primarily in the lodging sector, in the United States. The Company’s fiscal year end is December 31. The Company has no foreign operations or assets and its operating structure includes only one reportable segment. The consolidated financial statements include the accounts of the Company and its subsidiaries. All intercompany accounts and transactions have been eliminated. Although the Company has interests in potential variable interest entities through its purchase commitments, it is not the primary beneficiary as the Company does not have any elements of power in the decision making process of these entities, and therefore does not consolidate the entities. As of December 31, 2017, the Company owned 239 hotels with an aggregate of 30,322 rooms located in 34 states. All information related to the number of rooms included in these notes to the consolidated financial statements and Schedule III - Real Estate and Accumulated Depreciation listed in the Index at Item 15(2) has not been audited. The Company’s common shares are listed on the New York Stock Exchange (“NYSE”) under the ticker symbol “APLE.”
The Company has elected to be treated as a REIT for federal income tax purposes. The Company has a wholly-owned taxable REIT subsidiary (or subsidiaries thereof) (collectively, the “Lessee”), which leases all of the Company’s hotels.
Cash and Cash Equivalents
Cash and cash equivalents consist of highly liquid investments with original maturities of three months or less. The fair market value of cash and cash equivalents approximates their carrying value. Cash balances may at times exceed federal depository insurance limits.
Restricted Cash
Restricted cash includes reserves for debt service, real estate taxes, and insurance, and reserves for furniture, fixtures, and equipment replacements of up to 5% of property revenue for certain hotels, as required by certain management or mortgage debt agreement restrictions and provisions. The fair market value of restricted cash approximates its carrying value.
Investment in Real Estate and Related Depreciation
Real estate is stated at cost, net of depreciation. Repair and maintenance costs are expensed as incurred while significant improvements, renovations, and replacements are capitalized. Depreciation is computed using the straight-line method over average estimated useful lives of the assets, which are generally 39 years for buildings, 10 to 20 years for franchise fees, 10 years for major improvements and three to seven years for furniture and equipment.
The Company considers expenditures to be capital in nature based on the following criteria: (1) for a single asset, the cost must be at least $500, including all normal and necessary costs to place the asset in service, and the useful life must be at least one year; (2) for group purchases of 10 or more identical assets, the unit cost for each asset must be at least $50, including all normal and necessary costs to place the asset in service, and the useful life must be at least one year; and (3) for major repairs to a single asset, the repair must be at least $2,500 and the useful life of the asset must be substantially extended.
Upon acquisition of real estate properties, the Company estimates the fair value of acquired tangible assets (consisting of land, buildings and improvements, and furniture, fixtures and equipment) and identified intangible assets and liabilities, including in-place leases, and assumed debt based on evaluation of information and estimates
available at that date. Fair values for these assets are not directly observable and estimates are based on comparables and other information which is subjective in nature. The Company has not assigned any value to management contracts and franchise agreements as such contracts are generally at current market rates based on the remaining terms of the contracts and any other value attributable to these contracts is not considered material. Prior to January 1, 2017, the Company’s acquisitions of hotel properties were accounted for as acquisitions of existing businesses, and therefore all transaction costs associated with the acquisitions, including title, legal, accounting, brokerage commissions and other related costs, were expensed as incurred. Beginning January 1, 2017, acquisitions of hotel properties have been and will generally be accounted for as acquisitions of a group of assets, with costs incurred to effect an acquisition being capitalized as part of the cost of the assets acquired, instead of accounted for separately as expenses in the period that they are incurred.
The Company records impairment losses on hotel properties used in operations if indicators of impairment are present, and the sum of the undiscounted cash flows estimated to be generated by the respective properties over their estimated remaining useful life, based on historical and industry data, is less than the properties’ carrying amount. Indicators of impairment include a property with current or potential losses from operations, when it becomes more likely than not that a property will be sold before the end of its previously estimated useful life or when events, trends, contingencies or changes in circumstances indicate that a triggering event has occurred and an asset’s carrying value may not be recoverable. The Company monitors its properties on an ongoing basis by analytically reviewing financial performance and considers each property individually for purposes of reviewing for indicators of impairment. As many indicators of impairment are subjective, such as general economic and market declines, the Company also prepares an annual recoverability analysis for each of its properties to assist with its evaluation of impairment indicators. The analysis compares each property’s net book value to each property’s estimated operating income using current operating results for each stabilized property and projected stabilized operating results based on the property’s market for properties that recently opened, were recently renovated or experienced other short-term business disruption. The Company’s planned initial hold period for each property is generally 39 years. If events or circumstances change, such as the Company’s intended hold period for a property or if the operating performance of a property declines substantially for an extended period of time, the Company’s carrying value for a particular property may not be recoverable, and an impairment loss will be recorded. Impairment losses are measured as the difference between the asset’s fair value and its carrying value. The Company’s ongoing analyses and annual recoverability analyses have not identified any impairment losses other than the losses on impairment of three properties recorded in 2017, one property recorded in 2016 and one property recorded in 2015 totaling approximately $45.9 million, $5.5 million and $45.0 million, respectively, as discussed in Note 3.
Assets Held for Sale
The Company classifies assets as held for sale when a binding agreement to sell the property has been signed under which the buyer has committed a significant amount of nonrefundable cash, no significant contingencies exist which could prevent the transaction from being completed in a timely manner, and the sale is expected to close within one year. If these criteria are met, the Company will cease recording depreciation and will record an impairment charge if the fair value less costs to sell is less than the carrying amount of the disposal group. The Company will generally classify the impairment charge, together with the related operating results, as continuing operations in the Company’s consolidated statements of operations and classify the assets and related liabilities as held for sale in the Company’s consolidated balance sheets. If the Company’s plan of sale changes and the Company subsequently decides not to sell a property that is classified as held for sale, the property will be reclassified as held and used in the period the change occurs. As of December 31, 2017, the Company did not have any assets classified as held for sale. As of December 31, 2016, the Company had one hotel classified as held for sale, which was sold to an unrelated party in April 2017, discussed further in Notes 3 and 4.
Revenue Recognition
Hotel revenue is recognized as earned, which is generally defined as the date upon which a guest occupies a room or utilizes the hotel’s services.
Comprehensive Income
Comprehensive income includes net income and other comprehensive income (loss), which is comprised of unrealized gains (losses) and other adjustments resulting from hedging activity.
Net Income Per Common Share
Basic net income per common share is computed based upon the weighted average number of shares outstanding during the year. Diluted net income per common share is calculated after giving effect to all potential common shares that were dilutive and outstanding for the year. Basic and dilutive net income per common share were the same for each of the years presented.
Income Taxes
The Company is operated as, and has elected to be taxed as, a REIT under Sections 856 to 860 of the Internal Revenue Code. Earnings and profits, which will determine the taxability of distributions to shareholders, will differ from income reported for financial reporting purposes primarily due to the differences for federal income tax purposes in the carrying value (basis) of the investment in properties and estimated useful lives used to compute depreciation, transaction and litigation costs (reimbursements), straight-line ground lease expense, amortization of favorable and unfavorable leases, loss on impairment of depreciable real estate assets and gain (loss) on sale of real estate assets. The characterization of 2017 paid distributions of $1.20 per share for tax purposes was 94% ordinary income and 6% return of capital. The characterization of 2016 paid distributions of $1.20 per share for tax purposes was 76% ordinary income and 24% return of capital. The characterization of 2015 paid distributions of $1.27 per share for tax purposes was 72% ordinary income, 15% return of capital, 8% unrecaptured Section 1250 gain and 5% long-term capital gain.
The Lessee, as a taxable REIT subsidiary of the Company, is subject to federal and state income taxes. Due to historical cumulative operating losses, the taxable REIT subsidiary did not incur federal income tax for the three years ended December 31, 2017 and recorded a valuation allowance against the entire deferred asset for all periods presented. The total net operating loss carry forward for federal income tax purposes was approximately $95 million as of December 31, 2017, $94 million as of December 31, 2016 and $100 million as of December 31, 2015. The net operating losses expire beginning in 2028. There are no material differences between the book and tax cost basis of the Company’s assets and liabilities, except for the carrying value (basis) of the investment in properties. The Company’s income tax expense as shown in the consolidated statements of operations primarily includes franchise and income taxes at the state jurisdiction level, which do not have any associated material deferred taxes.
As of December 31, 2017, the tax years that remain subject to examination by major tax jurisdictions generally include 2014-2017.
On December 22, 2017, the Tax Cuts and Jobs Act (the “Act”) was signed into law, and is effective as of January 1, 2018. Based on the Company’s initial assessment of the Act, it is not expected to have a material impact on the Company’s consolidated financial statements.
Sales and Marketing Costs
Sales and marketing costs are expensed when incurred. These costs represent the expense for franchise advertising and reservation systems under the terms of the hotel management and franchise agreements and general and administrative expenses that are directly attributable to advertising and promotion.
Use of Estimates
The preparation of the financial statements in conformity with United States generally accepted accounting principles requires management to make estimates and assumptions that affect the amounts reported in the consolidated financial statements and accompanying notes. Actual results could differ from those estimates.
Reclassifications
Certain prior year amounts in the consolidated financial statements have been reclassified to conform to the current year presentation with no effect on previously reported net income, shareholders’ equity or cash flows.
Accounting Standards Recently Adopted
In January 2017, the Financial Accounting Standards Board (“FASB”) issued Accounting Standards Update (“ASU”) No. 2017-01, Business Combinations (Topic 805), Clarifying the Definition of a Business, which is intended to add guidance to assist entities with evaluating whether transactions should be accounted for as acquisitions (or disposals) of assets or businesses. The standard is effective for annual and interim periods beginning after December 15, 2017 with early adoption permitted. The Company adopted this standard effective January 1, 2017 on a prospective basis. Prior to the adoption of this standard, the Company’s acquisitions of hotel properties were accounted for as existing businesses, and therefore all transaction costs associated with the acquisitions, including title, legal, accounting, brokerage commissions and other related costs were expensed as incurred. Under the new standard, effective January 1, 2017, acquisitions of hotel properties (including the acquisition of six hotels in 2017, as discussed in Note 3) will generally be accounted for as acquisitions of a group of assets, with costs incurred to effect an acquisition being capitalized as part of the cost of the assets acquired, instead of accounted for separately as expenses in the period that they are incurred. Asset acquisitions now require the Company to complete its allocation of the purchase price at the time of the acquisition as the measurement period applicable to business combinations does not apply to asset acquisitions.
In March 2016, the FASB issued ASU No. 2016-09, Compensation – Stock Compensation (Topic 718), Improvements to Employee Share-Based Payment Accounting, which simplifies several aspects of the accounting for employee share-based payment transactions, including the income tax consequences, classification of awards as either equity or liabilities, and classification on the statement of cash flows. The standard was effective for annual and interim periods beginning after December 15, 2016. The Company adopted this standard as of January 1, 2017, which did not have a material impact on the Company’s consolidated financial statements.
Accounting Standards Recently Issued
In May 2014, the FASB issued ASU No. 2014-09, Revenue from Contracts with Customers (Topic 606), which affects virtually all aspects of an entity’s revenue recognition. The core principle of the new standard is that revenue should be recognized to depict the transfer of promised goods or services to customers in an amount that reflects the consideration to which the entity expects to be entitled in exchange for those goods or services. In March 2016, April 2016, May 2016, December 2016, September 2017 and November 2017, the FASB issued ASUs No. 2016-08, 2016-10, 2016-12, 2016-20, 2017-13 and 2017-14, respectively, all related to Revenue from Contracts with Customers (Topic 606), which further clarify the application of the standard. In August 2015, the FASB issued ASU No. 2015-14, Revenue from Contracts with Customers (Topic 606): Deferral of the Effective Date, which deferred the effectiveness of ASU No. 2014-09 to annual and interim periods beginning after December 15, 2017, and permitted early application for annual reporting periods beginning after December 15, 2016. The Company adopted this standard as of January 1, 2018 using the modified retrospective approach, and based on its final assessment, the standard will not significantly impact the amount or timing of revenue recognition in its consolidated financial statements.
In February 2016, the FASB issued ASU No. 2016-02, Leases (Topic 842), which amends the existing accounting standards for lease accounting, including requiring lessees to recognize most leases on their balance sheets as right-of-use assets and lease liabilities, as well as making targeted changes to lessor accounting. Leases will be classified as either finance or operating, with classification affecting the pattern of expense recognition in the income statement. Leases with a term of 12 months or less will be accounted for similar to the existing guidance today for operating leases. The standard requires a modified retrospective transition approach for all leases existing at, or entered into after, the date of initial application, with an option to use certain transition relief. The standard is effective for annual and interim periods beginning after December 15, 2018 with early adoption permitted. The Company expects to adopt this standard as of January 1, 2019. The Company is the lessee on certain ground leases and hotel equipment leases, which represents a majority of the Company’s current operating lease payments, and expects to record right of use assets and lease liabilities for these leases under the new standard. The Company is also a lessor in certain retail lease agreements related to its real estate, however, it does not anticipate any material change to the accounting for these leasing arrangements. The Company is still evaluating the impact this standard will have on its consolidated financial statements and related disclosures, and other than the inclusion of right-of-use assets and related lease liabilities in the Company’s consolidated balance sheet, such effects have not yet been determined.
In August 2016, the FASB issued ASU No. 2016-15, Statement of Cash Flows (Topic 230), Classification of Certain Cash Receipts and Cash Payments, which is intended to reduce diversity in practice in how certain transactions are classified in the statement of cash flows. The standard is effective for annual and interim periods beginning after December 15, 2017 with early adoption permitted. The standard requires a retrospective transition approach where practicable. The Company adopted this standard as of January 1, 2018 and it is not expected to have a material impact on the Company’s consolidated financial statements.
In November 2016, the FASB issued ASU No. 2016-18, Statement of Cash Flows (Topic 230), Restricted Cash, which is intended to reduce diversity in practice in the classification and presentation of changes in restricted cash in the statement of cash flows. The standard is effective for annual and interim periods beginning after December 15, 2017 with early adoption permitted. The standard requires a retrospective transition approach. The adoption of this standard is expected to result in the reclassification of restricted cash balances and activity in the Company’s statements of cash flows, which as of December 31, 2017 and 2016 totaled approximately $29.8 million and $29.4 million, respectively. The Company adopted this standard as of January 1, 2018 and, other than the reclassification of restricted cash balances and activity in the statements of cash flows, is not expected to have a material impact on the Company’s consolidated financial statements.
In February 2017, the FASB issued ASU No. 2017-05, Other Income—Gains and Losses from the Derecognition of Nonfinancial Assets (Subtopic 610-20), Clarifying the Scope of Asset Derecognition Guidance and Accounting for Partial Sales of Nonfinancial Assets, which clarifies the scope of Accounting Standards Codification (“ASC”) Subtopic 610-20 and adds guidance for the derecognition of nonfinancial assets, including partial sales. The standard is effective in conjunction with ASU No. 2014-09, presented above, which is effective for annual and interim periods beginning after December 15, 2017 with early adoption permitted. The provisions of this update must be applied at the same time as the adoption of ASU No. 2014-09. The Company adopted this standard as of January 1, 2018 using the modified retrospective approach. The adoption of this standard is not expected to have a material impact on the Company’s consolidated financial statements.
In August 2017, the FASB issued ASU No. 2017-12, Derivatives and Hedging (Topic 815), Targeted Improvements to Accounting for Hedging Activities, which amends the hedge accounting model to enable entities to better portray their risk management activities in their financial statements and enhance the transparency and understandability of hedging activity. The standard simplifies the application of hedge accounting and reduces the administrative burden of hedge documentation requirements and assessing hedge effectiveness. The standard is effective for annual and interim periods beginning after December 15, 2018 with early adoption permitted. The standard requires a modified retrospective approach for all hedge relationships that exist on the date of adoption. The presentation and disclosure guidance is required only prospectively. The Company plans to adopt this standard in the first quarter of 2018. Based on the Company’s existing derivative instruments, the adoption of this standard is not expected to have a material impact on the Company’s consolidated financial statements.
Note 2
Merger with Apple REIT Ten, Inc.
Effective September 1, 2016, the Company completed its merger with Apple REIT Ten, Inc. (“Apple Ten”) (the “merger” or “Apple Ten merger”), which merger and related transaction proposals were approved by each company’s respective shareholders, as applicable, on August 31, 2016. Pursuant to the Agreement and Plan of Merger entered into on April 13, 2016, as amended on July 13, 2016 (the “Merger Agreement”), Apple Ten merged with and into a wholly-owned subsidiary of the Company (“Acquisition Sub”), at which time the separate corporate existence of Apple Ten ceased and Acquisition Sub became the surviving corporation in the merger. Acquisition Sub was formed solely for the purpose of engaging in the merger and had not conducted any prior activities. As a result of the merger, the Company acquired the business of Apple Ten, a REIT, which immediately prior to the effective time of the merger, owned 56 hotels located in 17 states with an aggregate of 7,209 rooms, and through its wholly-owned subsidiary, assumed all of Apple Ten’s assets and liabilities at closing.
The Company accounted for the merger in accordance with ASC 805, Business Combinations. The Company was considered the acquirer for financial reporting purposes, which required, among other things, that the assets acquired and liabilities assumed from Apple Ten be recognized at their acquisition date fair values. For purpose of accounting for the transaction, the aggregate value of the merger consideration paid to Apple Ten shareholders was
estimated to be approximately $1.0 billion, and was comprised of approximately $956.1 million for the issuance of approximately 48.7 million common shares of the Company valued at $19.62 per share, which was the closing price of the Company’s common shares on August 31, 2016 (the date that the merger was approved), and $93.6 million in cash, which was funded through borrowings on the Company’s $540 million revolving credit facility (the “revolving credit facility”). All costs (reimbursements) related to the merger were recorded in the period incurred and are included in transaction and litigation costs (reimbursements) in the Company’s consolidated statements of operations. In connection with the merger, the Company incurred approximately $29.2 million in merger costs for the year ended December 31, 2016, which included $25.1 million in net costs related to the Apple Ten merger litigation (consisting of $32.0 million funded by the Company in January 2017 to settle the litigation, plus approximately $3.1 million in legal costs incurred to defend the litigation, less $10.0 million in proceeds received from its director and officer insurance carriers in January 2017). In May 2017, the Company received an additional $2.6 million of reimbursements from its directors and officers insurance carriers which were included as reductions in transaction and litigation costs (reimbursements) for the year ended December 31, 2017. Further discussion of the merger litigation is included in Note 14.
As more fully described in Note 5, effective September 1, 2016, upon completion of the merger, the Company assumed approximately $145.7 million in mortgage debt, prior to any fair value adjustments, secured by nine properties. The Company also assumed the outstanding balance on Apple Ten’s credit facility totaling $111.1 million, which was terminated and repaid in full on September 1, 2016 with borrowings on the Company’s revolving credit facility.
In connection with the issuance of the approximately 48.7 million common shares to effect the merger, the Company incurred approximately $1.2 million in issuance costs including legal, accounting and reporting services. These costs were recorded by the Company as a reduction of shareholders’ equity.
As contemplated in the Merger Agreement, in connection with the completion of the merger, the advisory and related party arrangements with respect to the Company, Apple Ten and Apple Ten’s advisors, as described in more detail in Note 7, were terminated.
The following table summarizes the Company’s purchase price allocation for the merger, which represents its best estimate of the fair values of the assets acquired and liabilities assumed on September 1, 2016, the effective date of the merger (in thousands):
|
Purchase Price Allocation
|
||||
|
Assets:
|
||||
|
Land
|
$
|
150,780
|
||
|
Building and improvements
|
1,066,379
|
|||
|
Furniture, fixtures and equipment
|
75,345
|
|||
|
Franchise fees
|
2,917
|
|||
|
Investment in real estate
|
1,295,421
|
|||
|
Restricted cash, due from third party managers and other assets
|
33,579
|
|||
|
Total assets
|
1,329,000
|
|||
|
Liabilities:
|
||||
|
Credit facility
|
111,100
|
|||
|
Mortgage debt
|
151,885
|
|||
|
Accounts payable and other liabilities
|
16,339
|
|||
|
Total liabilities
|
279,324
|
|||
|
Fair value estimate of net assets acquired (total consideration paid)
|
$
|
1,049,676
|
||
The allocation of the purchase price required a significant amount of judgment and was based upon valuations and other analyses described below that were finalized during the fourth quarter of 2016. The Company engaged a valuation firm to assist in the analysis. The methodologies and significant inputs and assumptions used in deriving estimates of fair value vary and are based on the nature of the tangible or intangible asset acquired or liability assumed. The fair value of land, building and improvements, furniture, fixtures and equipment, and identifiable intangible assets was developed based on the cost approach, market approach or income approach depending on
available information and compared to a secondary approach when possible. The fair value of debt was estimated based on contractual future cash flows discounted using borrowing spreads and market interest rates that would be available to the Company as of the acquisition date for the issuance of debt with similar terms and remaining maturities. Significant inputs and assumptions associated with these approaches included estimates of future operating cash flows and discount rates based on an evaluation of both observable market data (categorized as Level 2 inputs under the fair value hierarchy) and unobservable inputs that reflect the Company’s own internal assumptions and calculations (categorized as Level 3 inputs under the fair value hierarchy). No goodwill was recorded in connection with the merger.
The following unaudited pro forma information for the years ended December 31, 2017 and 2016, is presented as if the merger, effective September 1, 2016, had occurred on January 1, 2016, and is based on assumptions and estimates considered appropriate by the Company. The pro forma information is provided for illustrative purposes only and does not necessarily reflect what the operating results would have been had the merger been completed on January 1, 2016, nor is it necessarily indicative of future operating results. The pro forma information does not give effect to any cost synergies or other operating efficiencies that could result from the merger. Amounts are in thousands except per share data.
|
Year Ended December 31,
|
||||||||
|
2017
|
2016
|
|||||||
|
Total revenue
|
$
|
1,238,622
|
$
|
1,232,191
|
||||
|
Net income
|
$
|
179,906
|
$
|
210,311
|
||||
|
Basic and diluted net income per common share
|
$
|
0.80
|
$
|
0.94
|
||||
|
Weighted average common shares outstanding - basic and diluted
|
223,526
|
223,343
|
||||||
For purposes of calculating these pro forma amounts, merger transaction and litigation costs (reimbursements) totaling approximately $(2.6) million and $29.2 million for the years ended December 31, 2017 and 2016, included in the Company’s consolidated statements of operations, were excluded from the pro forma amounts since these costs are attributable to the merger and related transactions and do not have an ongoing impact to the statements of operations.
Note 3
Investment in Real Estate
The Company’s investment in real estate consisted of the following (in thousands):
|
December 31,
|
December 31,
|
|||||||
|
2017
|
2016
|
|||||||
|
Land
|
$
|
720,465
|
$
|
707,878
|
||||
|
Building and Improvements
|
4,362,929
|
4,270,095
|
||||||
|
Furniture, Fixtures and Equipment
|
428,734
|
391,421
|
||||||
|
Franchise Fees
|
12,315
|
11,692
|
||||||
|
5,524,443
|
5,381,086
|
|||||||
|
Less Accumulated Depreciation
|
(731,284
|
)
|
(557,597
|
)
|
||||
|
Investment in Real Estate, net
|
$
|
4,793,159
|
$
|
4,823,489
|
||||
As of December 31, 2017, the Company owned 239 hotels with an aggregate of 30,322 rooms located in 34 states.
The Company leases all of its hotels to its wholly-owned taxable REIT subsidiary (or a subsidiary thereof) under master hotel lease agreements.
2017 and 2016 Acquisitions
During 2017, the Company acquired six hotels. The following table sets forth the location, brand, manager, date acquired, number of rooms and gross purchase price for each hotel acquired during 2017. All dollar amounts are in thousands.
|
City
|
State
|
Brand
|
Manager
|
Date Acquired
|
Rooms
|
Gross Purchase Price (a)
|
||||||||||
|
Fort Worth
|
TX
|
Courtyard
|
LBA
|
2/2/2017
|
124
|
$
|
18,034
|
|||||||||
|
Birmingham (b)
|
AL
|
Hilton Garden Inn
|
LBA
|
9/12/2017
|
104
|
19,162
|
||||||||||
|
Birmingham (b)
|
AL
|
Home2 Suites
|
LBA
|
9/12/2017
|
106
|
19,276
|
||||||||||
|
Portland
|
ME
|
Residence Inn
|
Pyramid
|
10/13/2017
|
179
|
55,750
|
||||||||||
|
Salt Lake City
|
UT
|
Residence Inn
|
Huntington
|
10/20/2017
|
136
|
25,500
|
||||||||||
|
Anchorage
|
AK
|
Home2 Suites
|
Stonebridge
|
12/1/2017
|
135
|
24,048
|
||||||||||
|
784
|
$
|
161,770
|
||||||||||||||
| (a) |
The acquisitions of these hotel properties were accounted for as acquisitions of a group of assets, with costs incurred to effect the acquisitions, which were not significant, capitalized as part of the cost of the assets acquired. The gross purchase price excludes capitalized transaction costs. At the date of purchase, the purchase price for each of these properties was funded through the Company’s revolving credit facility.
|
| (b) |
The Hilton Garden Inn and Home2 Suites hotels in Birmingham, AL are part of an adjoining two-hotel complex located on the same site.
|
For the six hotels acquired during 2017, the amount of revenue and operating income included in the Company’s consolidated statement of operations from the date of acquisition through December 31, 2017 was approximately $8.9 million and $1.4 million, respectively.
On July 1, 2016, the Company closed on the purchase of a newly constructed 128-room Home2 Suites hotel in Atlanta, Georgia, the same day the hotel opened for business, for a purchase price of approximately $24.6 million. The Company used borrowings under its revolving credit facility to purchase the hotel. Additionally, as described in Note 2, effective September 1, 2016, the Company completed the merger with Apple Ten, which added 56 hotels, located in 17 states, with an aggregate of 7,209 rooms to the Company’s real estate portfolio. As shown in the table setting forth the purchase price allocation for the merger in Note 2, the total real estate value of the merger was estimated to be approximately $1.3 billion. The Company accounted for the purchase of these hotels in accordance with ASC 805, Business Combinations. No goodwill was recorded in connection with any of the acquisitions. For the 57 hotels acquired during 2016, the amount of revenue and operating income (excluding merger and other acquisition related transaction costs) included in the Company’s consolidated statement of operations from the date of acquisition through December 31, 2016 was approximately $90.2 million and $19.5 million, respectively.
Loss on Impairment of Depreciable Real Estate Assets
During the years ended December 31, 2017, 2016 and 2015, the Company recorded impairment losses totaling approximately $45.9 million, $5.5 million and $45.0 million.
During the fourth quarters of 2017 and 2015, upon finalizing its property level budgets for the following years and, in 2017, experiencing delays and increased costs in leasing the property’s retail rental space, the Company identified indicators of impairment at its Renaissance hotel in New York, New York, due to declines in the current and forecasted cash flows from the property. In each instance, the Company performed a test of recoverability and determined that the carrying value of the hotel exceeded its estimated undiscounted future cash flows. The shortfalls in estimated cash flows were triggered by a combination of (a) declines in existing and forecasted hotel market conditions in New York, (b) new supply in the market and (c) the loss of retail tenants and the extended period of time and incremental costs it has taken and is anticipated to take to re-lease the available retail space. In addition, during 2015, the cost of transitioning to a new management company and increases in real estate taxes impacted the shortfall. Upon concluding that the carrying cost exceeded the estimated undiscounted future cash flows, the Company adjusted the carrying value of the hotel (approximately $40 million and $86 million as of December 31, 2017 and 2015, respectively) to its estimated fair market value (approximately $2 million and $41 million as of December 31, 2017 and 2015, respectively), resulting in impairment losses of approximately $38.0 million in 2017 and $45.0 million in 2015. The Company engaged a third party to assist with the analysis of the fair market values. The fair market values
of the hotel were estimated by using the income and market approaches, as applicable, as outlined under ASC 820, using both observable market data (categorized as Level 2 inputs under the fair value hierarchy) and unobservable inputs that reflect the Company’s own internal assumptions and calculations (categorized as Level 3 inputs under the fair value hierarchy). Under the income approach, the fair value estimates were calculated from discounted cash flow analyses, using expected future cash flows based on stabilized room revenue growth rates of 0% to 4.5% in 2017 and 1% to 4% in 2015, estimated discount rates of approximately 8.5% to 10.0% in 2017 and 8.5% to 9.5% in 2015, an estimated terminal capitalization rate of 7% in 2015 and other market considerations.
During the first quarter of 2017, the Company identified two properties for potential sale: the Columbus, Georgia SpringHill Suites and TownePlace Suites hotels. In April 2017, the Company entered into separate contracts with the same unrelated party for the sale of these properties for a total combined gross sales price of approximately $10.0 million. Due to the change in the anticipated hold period for each of these hotels, the Company reviewed the estimated undiscounted cash flows generated by each property (including its sale price, net of estimated selling costs) and determined that, for each hotel, the undiscounted cash flows were less than its carrying value; therefore the Company recognized an impairment loss of approximately $7.9 million in the first quarter of 2017 to adjust the bases of these properties to their estimated fair values, which were based on the contracted sale price, net of estimated selling costs, a Level 1 input under the fair value hierarchy. In May 2017, both of these contracts were terminated.
During the third quarter of 2016, the Company identified two properties for potential sale: the Dallas, Texas Hilton hotel and the Chesapeake, Virginia Marriott hotel. In October 2016, the Company entered into separate contracts for the sale of these properties. Due to the change in the anticipated hold period for each of these hotels, the Company reviewed the estimated undiscounted cash flows generated by each property (including its sale price, net of commissions and other selling costs) and determined that the Chesapeake, Virginia Marriott’s estimated undiscounted cash flows were less than its carrying value; therefore the Company recognized an impairment loss of approximately $5.5 million in the third quarter of 2016 to adjust the basis of this property to its estimated fair value, which was based on the original contracted sale price, net of broker commissions and other estimated selling costs, a Level 1 input under the fair value hierarchy. As further discussed in Note 4, the Chesapeake, Virginia Marriott was sold in December 2016 and the Dallas, Texas Hilton was sold in April 2017.
Note 4
Dispositions
2017 Dispositions
In December 2016, the Company entered into a purchase and sale agreement with an unrelated party for the sale of its 224-room Hilton hotel in Dallas, Texas for a gross sales price of approximately $56.1 million, as amended. The hotel was classified as held for sale at its historical cost (which was less than the contract price, net of costs to sell) in the Company’s consolidated balance sheet at December 31, 2016. On April 20, 2017, the Company completed the sale resulting in a gain of approximately $16.0 million, which is included in the Company’s consolidated statement of operations for the year ended December 31, 2017. The hotel had a carrying value totaling approximately $39.0 million at the date of sale. Under the contract, at closing, the mortgage loan secured by the Dallas, Texas Hilton hotel was assumed by the buyer with the buyer receiving a credit for the amount assumed, which was approximately $27.1 million at the date of sale.
In June 2017, the Company entered into a purchase and sale agreement with an unrelated party for the sale of its 316-room Marriott hotel in Fairfax, Virginia, acquired by the Company in the merger with Apple Ten in September 2016, for a gross sales price of $41.5 million, as amended. On October 5, 2017, the Company completed the sale, resulting in a gain of approximately $0.3 million, which is included in the Company’s consolidated statement of operations for the year ended December 31, 2017. The hotel had a carrying value totaling approximately $40.6 million at the date of sale.
2016 Dispositions
In October 2016, the Company entered into a purchase and sale agreement with an unrelated party for the sale of its 226-room Marriott hotel in Chesapeake, Virginia, for a gross sales price of approximately $9.9 million, as amended. As discussed in Note 3, during the third quarter of 2016, the Company recognized an impairment loss of
$5.5 million to adjust the basis of this property to its estimated fair value, which was based on the original contracted sale price, net of broker commissions and other estimated selling costs. In December 2016, the Company completed the sale, resulting in a loss of approximately $0.2 million, which is included in the Company’s consolidated statement of operations for the year ended December 31, 2016.
2015 Dispositions
During the year ended December 31, 2015, the Company sold 19 properties in two separate transactions for a total sales price of approximately $208.5 million, resulting in a gain of approximately $15.3 million, which is included in the Company’s consolidated statement of operations for the year ended December 31, 2015.
The Company’s consolidated statements of operations include operating income (loss) of approximately $2.4 million, $(1.4) million and $4.7 million for the years ended December 31, 2017, 2016 and 2015, respectively, relating to the results of operations of the 22 hotels sold during the three years ended December 31, 2017, as noted above, for the period of ownership. The sale of these properties does not represent a strategic shift that has, or will have, a major effect on the Company’s operations and financial results, and therefore the operating results for the period of ownership of these properties are included in income from continuing operations for the three years ended December 31, 2017, as applicable. The net proceeds from the sales were used primarily to pay down borrowings on the Company’s revolving credit facility.
Note 5
Debt
$965 Million Credit Facility
On May 18, 2015, concurrent with the listing of the Company’s common shares on the NYSE (the “Listing”), the Company amended and restated its $345 million credit facility with a syndicate of commercial banks, increasing the borrowing capacity to $965 million, reducing the annual interest rate and extending the maturity dates. The unsecured “$965 million credit facility” is comprised of (i) a $540 million revolving credit facility with an initial maturity date of May 18, 2019 and (ii) a $425 million term loan facility with a maturity date of May 18, 2020, consisting of three term loans, all funded during 2015 (the “$425 million term loans”). Subject to certain conditions including covenant compliance and additional fees, the revolving credit facility maturity date may be extended one year. The Company may make voluntary prepayments in whole or in part, at any time. Interest payments on the $965 million credit facility are due monthly and the interest rate, subject to certain exceptions, is equal to an annual rate of the one-month LIBOR (the London Inter-Bank Offered Rate for a one-month term) plus a margin ranging from 1.50% to 2.30%, depending upon the Company’s leverage ratio, as calculated under the terms of the credit agreement. In conjunction with the $425 million term loans, the Company entered into two interest rate swap agreements, which effectively fix the interest rate on $322.5 million of the outstanding balance at approximately 3.10%, subject to adjustment based on the Company’s leverage ratio, through maturity. See Note 6 for more information on the interest rate swap agreements. The Company is also required to pay quarterly an unused facility fee at an annual rate of 0.20% or 0.30% on the unused portion of the revolving credit facility, based on the amount of borrowings outstanding during the quarter.
$150 Million Term Loan Facility
On April 8, 2016, the Company entered into an unsecured $150 million term loan facility with a syndicate of commercial banks (the “$150 million term loan facility”), consisting of a term loan of up to $50 million that will mature on April 8, 2021 (the “$50 million term loan”) and a term loan of up to $100 million that will mature on April 8, 2023 (the “$100 million term loan,” and collectively with the $50 million term loan, the “$150 million term loans”). The Company initially borrowed $50 million under the $150 million term loan facility on April 8, 2016 and borrowed the remaining $100 million on September 30, 2016. The credit agreement contains requirements and covenants similar to the Company’s $965 million credit facility. The Company may make voluntary prepayments in whole or in part, at any time, subject to certain conditions. Interest payments on the $150 million term loan facility are due monthly and the interest rate is equal to an annual rate of the one-month LIBOR plus a margin ranging from 1.45% to 2.20% for the $50 million term loan and 1.80% to 2.60% for the $100 million term loan, depending upon the Company’s leverage ratio, as calculated under the terms of the credit agreement. The Company also entered
into two interest rate swap agreements which, beginning on September 30, 2016, effectively fix the interest rate on the $50 million term loan and $100 million term loan at 2.54% and 3.13%, respectively, subject to adjustment based on the Company’s leverage ratio, through maturity. See Note 6 for more information on the interest rate swap agreements. Net proceeds from the $150 million term loan facility were used to pay down outstanding borrowings on the Company’s revolving credit facility.
$85 Million Term Loan
On July 25, 2017, the Company entered into an unsecured $85 million term loan with a syndicate of commercial banks, with a maturity date of July 25, 2024 (the “$85 million term loan” and, together with the $425 million term loans and the $150 million term loans, the “term loans”). Net proceeds from the $85 million term loan were used to pay down outstanding borrowings on the Company’s revolving credit facility. The credit agreement contains requirements and covenants similar to the Company’s $965 million credit facility. The Company may make voluntary prepayments in whole or in part, at any time, subject to certain conditions. Interest payments on the $85 million term loan are due monthly and the interest rate is equal to an annual rate of the one-month LIBOR plus a margin ranging from 1.80% to 2.60%, depending upon the Company’s leverage ratio, as calculated under the terms of the credit agreement. In conjunction with the $85 million term loan, the Company entered into two interest rate swap agreements (one in May 2017 with a notional amount of $75 million, effective July 31, 2017, and the other in August 2017 with a notional amount of $10 million, effective August 10, 2017), which effectively fix the interest rate on the $85 million term loan at approximately 3.76%, subject to adjustment based on the Company’s leverage ratio, through maturity. See Note 6 for more information on the interest rate swap agreements.
As of December 31, 2017 and 2016, the details of the Company’s revolving credit facility and term loans were as set forth below. All dollar amounts are in thousands.
|
As of December 31, 2017
|
As of December 31, 2016
|
|||||||||||||||||||
|
|
Maturity Date
|
Outstanding Balance
|
Interest Rate
|
Outstanding Balance
|
Interest Rate
|
|||||||||||||||
|
Revolving credit facility (1)
|
5/18/2019
|
$
|
106,900
|
3.11
|
%
|
(2)
|
$
|
270,000
|
2.32
|
%
|
(2)
|
|||||||||
|
Term loans
|
||||||||||||||||||||
|
$425 million term loans
|
5/18/2020
|
425,000
|
3.09
|
%
|
(3)
|
425,000
|
2.90
|
%
|
(3)
|
|||||||||||
|
$50 million term loan
|
4/8/2021
|
50,000
|
2.54
|
%
|
(4)
|
50,000
|
2.54
|
%
|
(4)
|
|||||||||||
|
$100 million term loan
|
4/8/2023
|
100,000
|
3.13
|
%
|
(4)
|
100,000
|
3.13
|
%
|
(4)
|
|||||||||||
|
$85 million term loan
|
7/25/2024
|
85,000
|
3.76
|
%
|
(4)
|
-
|
n/a
|
|||||||||||||
|
Total term loans at stated value
|
660,000
|
575,000
|
||||||||||||||||||
|
Unamortized debt issuance costs
|
(3,721
|
)
|
(4,066
|
)
|
||||||||||||||||
|
Total term loans
|
656,279
|
570,934
|
||||||||||||||||||
|
Total revolving credit facility and term loans
|
$
|
763,179
|
$
|
840,934
|
||||||||||||||||
| (1) |
Unamortized debt issuance costs related to the revolving credit facility totaled approximately $1.7 million and $2.8 million as of December 31, 2017 and 2016, respectively, and are included in other assets, net in the Company’s consolidated balance sheets.
|
| (2) |
Annual variable interest rate at the balance sheet date.
|
| (3) |
Effective annual interest rate which includes the effect of interest rate swaps on $322.5 million of the outstanding loan balance, resulting in an annual fixed interest rate of approximately 3.10% on this portion of the debt, subject to adjustment based on the Company’s leverage ratio. See Note 6 for more information on the interest rate swap agreements. Remaining portion is variable rate debt.
|
| (4) |
Annual fixed interest rate at the balance sheet date which includes the effect of interest rate swaps on the outstanding loan balance, subject to adjustment based on the Company’s leverage ratio. See Note 6 for more information on the interest rate swap agreements.
|
The credit agreements governing the $965 million credit facility, the $150 million term loan facility and the $85 million term loan contain mandatory prepayment requirements, customary affirmative covenants, negative covenants and events of default. The credit agreements require that the Company comply with various covenants, which include, among others, a minimum tangible net worth, maximum debt limits, minimum interest and fixed charge coverage ratios, limits on dividend payments and share repurchases and restrictions on certain investments.
The credit agreements contain the following financial and restrictive covenants (capitalized terms are defined in the credit agreements).
|
·
|
A ratio of Consolidated Total Indebtedness to Consolidated EBITDA of not more than 6.00 to 1.00 (subject to a higher amount in certain circumstances);
|
|
·
|
A ratio of Consolidated Secured Indebtedness to Consolidated Total Assets of not more than 45%;
|
|
·
|
A minimum Consolidated Tangible Net Worth of approximately $2.3 billion (plus an amount equal to 75% of the Net Cash Proceeds from issuances and sales of Equity Interests occurring after the Closing Date, subject to adjustment, less the lesser of (a) an amount equal to 75% of Restricted Payments for the tender, redemption and/or other purchases of its common shares made by the Company after the Closing Date and (b) $375 million);
|
|
·
|
A ratio of Adjusted Consolidated EBITDA to Consolidated Fixed Charges of not less than 1.50 to 1.00 for the trailing four full quarters;
|
|
·
|
A ratio of Unencumbered Adjusted NOI to Consolidated Implied Interest Expense for Consolidated Unsecured Indebtedness of not less than 2.00 to 1.00 for the trailing four full quarters;
|
|
·
|
A ratio of Consolidated Unsecured Indebtedness to Unencumbered Asset Value of not more than 60% (subject to a higher level in certain circumstances);
|
|
·
|
A ratio of Consolidated Secured Recourse Indebtedness to Consolidated Total Assets of not more than 10%; and
|
|
·
|
Restricted Payments (including distributions and share repurchases), net of any proceeds from a dividend reinvestment plan and excluding Restricted Payments for the tender, redemption and/or other purchases of its common shares in an amount not to exceed $700 million in the aggregate, cannot exceed 95% of Funds From Operations for each fiscal year, unless the Company is required to distribute more to meet REIT requirements.
|
The Company was in compliance with the applicable covenants at December 31, 2017.
Mortgage Debt
As of December 31, 2017, the Company had approximately $457.4 million in outstanding mortgage debt secured by 29 properties, with maturity dates ranging from June 2020 to January 2038, stated interest rates ranging from 3.55% to 6.25% and effective interest rates ranging from 3.55% to 4.97%. The loans generally provide for monthly payments of principal and interest on an amortized basis and defeasance or prepayment penalties if prepaid. The following table sets forth the hotel properties securing each loan, the interest rate, loan assumption or origination date, maturity date, the principal amount assumed or originated, and the outstanding balance prior to any fair value adjustments or debt issuance costs as of December 31, 2017 and 2016 for each of the Company’s debt obligations. All dollar amounts are in thousands.
|
Location
|
Brand
|
Interest Rate (1)
|
Loan Assumption or Origination Date
|
Maturity Date
|
Principal Assumed or Originated
|
Outstanding balance as of December 31, 2017
|
Outstanding balance as of December 31, 2016
|
|||||||||||||||||
|
Irving, TX
|
Homewood Suites
|
5.83
|
%
|
12/29/2010
|
(2)
|
$
|
6,052
|
$
|
-
|
$
|
5,072
|
|||||||||||||
|
Gainesville, FL
|
Homewood Suites
|
5.89
|
%
|
9/1/2016
|
(2)
|
12,051
|
-
|
11,966
|
||||||||||||||||
|
Duncanville, TX
|
Hilton Garden Inn
|
5.88
|
%
|
10/21/2008
|
(2)
|
13,966
|
-
|
12,126
|
||||||||||||||||
|
Dallas, TX
|
Hilton
|
3.95
|
%
|
5/22/2015
|
(3)
|
28,000
|
-
|
27,246
|
||||||||||||||||
|
San Juan Capistrano, CA
|
Residence Inn
|
4.15
|
%
|
9/1/2016
|
6/1/2020
|
16,210
|
15,774
|
16,104
|
||||||||||||||||
|
Colorado Springs, CO
|
Hampton
|
6.25
|
%
|
9/1/2016
|
7/6/2021
|
7,923
|
7,754
|
7,883
|
||||||||||||||||
|
Franklin, TN
|
Courtyard
|
6.25
|
%
|
9/1/2016
|
8/6/2021
|
14,679
|
14,368
|
14,604
|
||||||||||||||||
|
Franklin, TN
|
Residence Inn
|
6.25
|
%
|
9/1/2016
|
8/6/2021
|
14,679
|
14,368
|
14,604
|
||||||||||||||||
|
Grapevine, TX
|
Hilton Garden Inn
|
4.89
|
%
|
8/29/2012
|
9/1/2022
|
11,810
|
10,412
|
10,707
|
||||||||||||||||
|
Collegeville/Philadelphia, PA
|
Courtyard
|
4.89
|
%
|
8/30/2012
|
9/1/2022
|
12,650
|
11,152
|
11,468
|
||||||||||||||||
|
Hattiesburg, MS
|
Courtyard
|
5.00
|
%
|
3/1/2014
|
9/1/2022
|
5,732
|
5,212
|
5,357
|
||||||||||||||||
|
Rancho Bernardo/San Diego, CA
|
Courtyard
|
5.00
|
%
|
3/1/2014
|
9/1/2022
|
15,060
|
13,692
|
14,074
|
||||||||||||||||
|
Kirkland, WA
|
Courtyard
|
5.00
|
%
|
3/1/2014
|
9/1/2022
|
12,145
|
11,042
|
11,350
|
||||||||||||||||
|
Seattle, WA
|
Residence Inn
|
4.96
|
%
|
3/1/2014
|
9/1/2022
|
28,269
|
25,687
|
26,409
|
||||||||||||||||
|
Anchorage, AK
|
Embassy Suites
|
4.97
|
%
|
9/13/2012
|
10/1/2022
|
23,230
|
20,560
|
21,133
|
||||||||||||||||
|
Somerset, NJ
|
Courtyard
|
4.73
|
%
|
3/1/2014
|
10/6/2022
|
8,750
|
7,932
|
8,160
|
||||||||||||||||
|
Tukwila, WA
|
Homewood Suites
|
4.73
|
%
|
3/1/2014
|
10/6/2022
|
9,431
|
8,549
|
8,795
|
||||||||||||||||
|
Prattville, AL
|
Courtyard
|
4.12
|
%
|
3/1/2014
|
2/6/2023
|
6,596
|
5,943
|
6,123
|
||||||||||||||||
|
Location
|
Brand
|
Interest Rate (1)
|
Loan Assumption or Origination Date
|
Maturity Date
|
Principal Assumed or Originated
|
Outstanding balance as of December 31, 2017
|
Outstanding balance as of December 31, 2016
|
|||||||||||||||||
|
Huntsville, AL
|
Homewood Suites
|
4.12
|
%
|
3/1/2014
|
2/6/2023
|
$ |
8,306
|
$ |
7,483
|
$ |
7,711
|
|||||||||||||
|
San Diego, CA
|
Residence Inn
|
3.97
|
%
|
3/1/2014
|
3/6/2023
|
18,600
|
16,733
|
17,248
|
||||||||||||||||
|
Miami, FL
|
Homewood Suites
|
4.02
|
%
|
3/1/2014
|
4/1/2023
|
16,677
|
15,022
|
15,479
|
||||||||||||||||
|
Syracuse, NY
|
Courtyard
|
4.75
|
%
|
10/16/2015
|
8/1/2024
|
(4)
|
|
11,199
|
10,637
|
10,905
|
||||||||||||||
|
Syracuse, NY
|
Residence Inn
|
4.75
|
%
|
10/16/2015
|
8/1/2024
|
(4)
|
|
11,199
|
10,637
|
10,905
|
||||||||||||||
|
New Orleans, LA
|
Homewood Suites
|
4.36
|
%
|
7/17/2014
|
8/11/2024
|
27,000
|
24,919
|
25,577
|
||||||||||||||||
|
Westford, MA
|
Residence Inn
|
4.28
|
%
|
3/18/2015
|
4/11/2025
|
10,000
|
9,386
|
9,626
|
||||||||||||||||
|
Denver, CO
|
Hilton Garden Inn
|
4.46
|
%
|
9/1/2016
|
6/11/2025
|
34,118
|
33,046
|
33,857
|
||||||||||||||||
|
Oceanside, CA
|
Courtyard
|
4.28
|
%
|
9/1/2016
|
10/1/2025
|
13,655
|
13,332
|
13,576
|
||||||||||||||||
|
Omaha, NE
|
Hilton Garden Inn
|
4.28
|
%
|
9/1/2016
|
10/1/2025
|
22,682
|
22,145
|
22,550
|
||||||||||||||||
|
Boise, ID
|
Hampton
|
4.37
|
%
|
5/26/2016
|
6/11/2026
|
24,000
|
23,422
|
23,813
|
||||||||||||||||
|
Burbank, CA
|
Courtyard
|
3.55
|
%
|
11/3/2016
|
12/1/2026
|
25,564
|
24,917
|
25,564
|
||||||||||||||||
|
San Diego, CA
|
Courtyard
|
3.55
|
%
|
11/3/2016
|
12/1/2026
|
25,473
|
24,828
|
25,473
|
||||||||||||||||
|
San Diego, CA
|
Hampton
|
3.55
|
%
|
11/3/2016
|
12/1/2026
|
18,963
|
18,483
|
18,963
|
||||||||||||||||
|
San Jose, CA
|
Homewood Suites
|
4.22
|
%
|
12/22/2017
|
1/1/2038
|
30,000
|
30,000
|
-
|
||||||||||||||||
|
$
|
544,669
|
457,435
|
494,428
|
|||||||||||||||||||||
|
Unamortized fair value adjustment of assumed debt
|
4,330
|
5,229
|
||||||||||||||||||||||
|
Unamortized debt issuance costs
|
(2,748
|
)
|
(2,628
|
)
|
||||||||||||||||||||
|
Total
|
$
|
459,017
|
$
|
497,029
|
||||||||||||||||||||
| (1) |
Interest rates are the rates per the loan agreement. For loans assumed, the Company adjusted the interest rates per the loan agreement to market rates and is amortizing the adjustments to interest expense over the life of the loan.
|
| (2) |
Loans were repaid in full during 2017.
|
| (3) |
Assets securing this loan were classified as held for sale as of December 31, 2016. In April 2017, the assets securing this loan were sold, and the loan was assumed by the buyer of those assets.
|
| (4) |
Outstanding principal balance is callable by lender or prepayable by the Company on August 1, 2019.
|
The aggregate amounts of principal payable under the Company’s total debt obligations (including mortgage debt, the revolving credit facility and term loans), for the five years subsequent to December 31, 2017 and thereafter are as follows (in thousands):
|
2018
|
$
|
11,964
|
||
|
2019
|
139,622
|
|||
|
2020
|
452,223
|
|||
|
2021
|
96,415
|
|||
|
2022
|
108,034
|
|||
|
Thereafter
|
416,077
|
|||
|
1,224,335
|
||||
|
Unamortized fair value adjustment of assumed debt
|
4,330
|
|||
|
Unamortized debt issuance costs related to term loans and mortgage debt
|
(6,469
|
)
|
||
|
Total
|
$
|
1,222,196
|
Upon completion of the Apple Ten merger on September 1, 2016, the Company assumed approximately $145.7 million in mortgage debt, prior to any fair value adjustments, secured by nine properties. This assumed mortgage debt had maturity dates ranging from February 2017 to October 2025 and stated interest rates ranging from 4.15% to 6.25%. A fair value premium adjustment totaling approximately $6.2 million was recorded upon the assumption of the above market rate mortgages, and the effective interest rates on the applicable debt obligations ranged from 3.80% to 4.23% at the date of assumption. The total fair value, net premium adjustment for all of the Company’s debt assumptions (including the assumption of above (premium) market rate mortgages assumed in the Apple Ten merger) is being amortized as a reduction to interest expense over the remaining term of the respective mortgages using a method approximating the effective interest rate method, and totaled approximately $0.9 million, $2.3 million and $3.2 million for the years ended December 31, 2017, 2016 and 2015, respectively.
Debt issuance costs related to the assumption or origination of debt are amortized over the period to maturity of the applicable debt instrument, as an addition to interest expense. Amortization of such costs totaled approximately $2.8 million, $2.9 million and $2.4 million for the years ended December 31, 2017, 2016 and 2015, respectively.
The Company’s interest expense in 2017, 2016 and 2015 is net of interest capitalized in conjunction with hotel renovations totaling approximately $1.3 million, $1.6 million and $1.5 million, respectively.
Note 6
Fair Value of Financial Instruments
Except as described below, the carrying value of the Company’s financial instruments approximates fair value due to the short-term nature of these financial instruments.
Debt
The Company estimates the fair value of its debt by discounting the future cash flows of each instrument at estimated market rates consistent with the maturity of a debt obligation with similar credit terms and credit characteristics, which are Level 3 inputs under the fair value hierarchy. Market rates take into consideration general market conditions and maturity. As of December 31, 2017, both the carrying value and estimated fair value of the Company’s debt were approximately $1.2 billion. As of December 31, 2016, both the carrying value and estimated fair value of the Company’s debt were approximately $1.3 billion. Both the carrying value and estimated fair value of the Company’s debt (as discussed above) is net of unamortized debt issuance costs related to term loans and mortgage debt for each specific year.
Derivative Instruments
Currently, the Company uses interest rate swaps to manage its interest rate risks on variable rate debt. Throughout the terms of these interest rate swaps, the Company pays a fixed rate of interest and receives a floating rate of interest equal to the one month LIBOR. The swaps are designed to effectively fix the interest payments on variable rate debt instruments. These instruments are recorded at fair value and, if in an asset position, are included in other assets, net, and, if in a liability position, are included in accounts payable and other liabilities in the Company’s consolidated balance sheets. The fair values of the Company’s interest rate swap agreements are determined using the market standard methodology of netting the discounted future fixed cash payments and the discounted expected variable cash receipts, which is considered a Level 2 measurement under the fair value hierarchy. The variable cash receipts are based on an expectation of future interest rates (forward curves) derived from observable market interest rate curves. The following table sets forth information for each of the Company’s interest rate swap agreements outstanding as of December 31, 2017 and 2016. All dollar amounts are in thousands.
|
Notional Amount at
December 31, 2017 |
Fair Value Asset (Liability)
|
||||||||||||||||||
|
Hedge Type
|
Origination Date
|
Maturity Date
|
Swap Fixed Interest Rate
|
December 31, 2017
|
December 31, 2016
|
||||||||||||||
|
Cash flow hedge
|
$
|
212,500
|
5/21/2015
|
5/18/2020
|
1.58
|
%
|
$
|
2,033
|
$
|
(198
|
)
|
||||||||
|
Cash flow hedge
|
110,000
|
7/2/2015
|
5/18/2020
|
1.62
|
%
|
951
|
(246
|
)
|
|||||||||||
|
Cash flow hedge
|
50,000
|
4/7/2016
|
3/31/2021
|
1.09
|
%
|
1,544
|
1,289
|
||||||||||||
|
Cash flow hedge
|
100,000
|
4/7/2016
|
3/31/2023
|
1.33
|
%
|
4,098
|
3,744
|
||||||||||||
|
Cash flow hedge
|
75,000
|
5/31/2017
|
6/30/2024
|
1.96
|
%
|
1,043
|
-
|
||||||||||||
|
Cash flow hedge
|
10,000
|
8/10/2017
|
6/30/2024
|
2.01
|
%
|
109
|
-
|
||||||||||||
|
$
|
557,500
|
$
|
9,778
|
$
|
4,589
|
||||||||||||||
The Company assesses, both at inception and on an ongoing basis, the effectiveness of its qualifying cash flow hedges. Changes in fair value on the effective portion of all designated cash flow hedges are recorded to accumulated other comprehensive income, a component of shareholders’ equity in the Company’s consolidated balance sheets. Changes in fair value on the ineffective portion of all designated cash flow hedges are recorded to interest and other expense, net in the Company’s consolidated statements of operations. For terminated or matured swaps that were not designated as cash flow hedges (including four swaps, of which three matured or terminated in 2015 and one terminated in 2016), the changes in fair value were recorded to interest and other expense, net in the Company’s consolidated statements of operations. Other than the fair value changes associated with a terminated interest rate swap for which hedge accounting was discontinued during 2015 resulting in approximately $0.4 million recorded as an increase to interest and other expense, net, fair value changes for derivatives that were not in qualifying hedge relationships or the ineffective portion of designated cash flow hedges for the years ended December 31, 2017, 2016 and 2015 were not material.
To adjust qualifying cash flow hedges to their fair value and recognize the impact of hedge accounting, the Company recorded net unrealized gains (losses) of approximately $5.2 million and $6.6 million and $(1.5) million
during the years ended December 31, 2017, 2016 and 2015, respectively, to other comprehensive income (loss). Amounts reported in accumulated other comprehensive income will be reclassified to interest and other expense, net as interest payments are made or received on the Company’s variable-rate derivatives. Net unrealized losses on cash flow hedges previously recorded to accumulated other comprehensive income (loss) that were reclassified to interest and other expense, net during the years ended December 31, 2017, 2016 and 2015, were approximately $(2.2) million, $(4.0) million and $(2.1) million, respectively. The Company estimates that approximately $1.1 million of net unrealized gains included in accumulated other comprehensive income at December 31, 2017 will be reclassified as a net decrease to interest and other expense, net within the next 12 months. Also, during the year ended December 31, 2015, the Company reclassified $(0.8) million of unrealized losses from accumulated other comprehensive income (loss) to net income which was associated with the termination of a swap agreement.
Note 7
Related Parties
The Company has, and is expected to continue to engage in, transactions with related parties. These transactions cannot be construed to be at arm’s length and the results of the Company’s operations may be different if these transactions were conducted with non-related parties. The Company’s independent members of the Board of Directors oversee and annually review the Company’s related party relationships (including the relationships discussed in this section) and are required to approve any significant modifications to the existing relationships, as well as any new significant related party transactions. The Board of Directors is not required to approve each individual transaction that falls under the related party relationships. However, under the direction of the Board of Directors, at least one member of the Company’s senior management team approves each related party transaction. Below is a summary of the significant related party relationships in effect and transactions that occurred during each of the three years in the period ended December 31, 2017.
Prior to the Apple Ten merger, Glade M. Knight, Executive Chairman of the Company, was Chairman and Chief Executive Officer of Apple Ten. Apple Ten’s advisors, Apple Ten Advisors, Inc. (“A10A”) and Apple Realty Group, Inc. (“ARG”), are wholly owned by Mr. Knight. Mr. Knight is also currently a partner and Chief Executive Officer of Energy 11 GP, LLC and Energy Resources 12 GP, LLC, which are the respective general partners of Energy 11, L.P. and Energy Resources 12, L.P. Justin G. Knight, the Company’s President and Chief Executive Officer, and a member of the Company’s Board of Directors, also served as President of Apple Ten prior to the merger. Mr. Glade M. Knight is the only member of the Company’s Board of Directors that was also on the Board of Directors of Apple Ten. As part of the Apple Ten merger transaction, the officers and Executive Chairman of the Company received a combined 3.1 million common shares of the Company and $6.0 million in exchange for their ownership interests in Apple Ten, including amounts assigned to others.
Support Services to Apple Ten, A10A and ARG Prior to and After the Apple Ten Merger
Effective September 1, 2016, the Company completed its merger with Apple Ten. As contemplated in the Merger Agreement, in connection with the completion of the merger, the advisory and related party agreements with respect to the Company, Apple Ten and Apple Ten’s advisors, A10A and ARG, were terminated effective immediately after the effective time of the merger on September 1, 2016, and no fees were paid as a result of the termination of these agreements. As a result, effective September 1, 2016, the Company (including Apple Ten) no longer has any advisory contracts with A10A or ARG. Prior to the merger, both the advisory fees and reimbursed costs received by the Company from Apple Ten were recorded as general and administrative expense by Apple Ten and reductions to general and administrative expense by the Company and, therefore, the termination of the subcontract agreement had no financial impact on the combined company after the effective time of the merger.
Prior to the merger, A10A subcontracted its obligations under its advisory agreement between A10A and Apple Ten to the Company. The Company provided to Apple Ten the advisory services contemplated under the A10A advisory agreement and received an annual advisory fee, and was reimbursed by Apple Ten for the use of the Company’s employees and corporate office and other costs associated with the advisory agreement. Advisory fees earned by the Company from Apple Ten totaled approximately $1.6 million for the eight months ended August 31, 2016 and $2.5 million for the year ended December 31, 2015, and are recorded as a reduction to general and administrative expenses in the Company’s consolidated statements of operations. Prior to the merger, the Company provided support services to Apple Ten and its advisors, A10A and ARG, which agreed to reimburse the Company
for its costs in providing these services. After the merger, the Company has continued and will continue to provide support services to ARG for activities unrelated to Apple Ten. Under this cost sharing structure, amounts reimbursed to the Company include both compensation for personnel and office related costs (including office rent, utilities, office supplies, etc.) used by each company during these periods. The amounts reimbursed to the Company are based on the actual costs of the services and a good faith estimate of the proportionate amount of time incurred by the Company’s employees on behalf of ARG. Total reimbursed costs received by the Company from these entities for the years ended December 31, 2017, 2016 and 2015 (including Apple Ten, A10A and ARG prior to September 1, 2016 and ARG thereafter) totaled approximately $0.7 million, $2.5 million and $3.1 million, respectively, and are recorded as a reduction to general and administrative expenses in the Company’s consolidated statements of operations.
As part of the cost sharing arrangement, certain day-to-day transactions may result in amounts due to or from the Company and ARG. To efficiently manage cash disbursements, the Company or ARG may make payments for the other company. Under this cash management process, each company may advance or defer up to $1 million at any time. Each quarter, any outstanding amounts are settled between the companies. This process allows each company to minimize its cash on hand and reduces the cost for each company. The amounts outstanding at any point in time are not significant to either of the companies. As of December 31, 2017 and 2016, total amounts due from ARG for reimbursements under the cost sharing structure totaled approximately $0.3 million and $0.2 million, respectively, and are included in other assets, net in the Company’s consolidated balance sheets. Prior to the Apple Ten merger, Apple Ten, A10A and ARG (for activities both related and unrelated to Apple Ten) were part of the cost sharing structure and participated in this cash management process.
Aircraft Usage
The Company, through a wholly-owned subsidiary, Apple Air Holding, LLC (“Apple Air”), owns a Learjet used primarily for acquisition, asset management, renovation and public relations purposes. The aircraft is also leased to affiliates of the Company based on third party rates, which was not significant during the reporting periods. Prior to the merger, Apple Air was jointly owned by the Company (74%) and Apple Ten (26%), with Apple Ten’s ownership interest accounted for as a minority interest. Apple Ten’s portion of Apple Air’s loss was approximately $0.2 million for the eight months ended August 31, 2016 and $0.3 million for the year ended December 31, 2015, and was recorded as a reduction to general and administrative expenses in the Company’s consolidated statements of operations. Effective September 1, 2016, with the completion of the merger, the Company acquired Apple Ten’s 26% equity interest in Apple Air for a total allocated purchase price of approximately $0.7 million, which approximated the fair market value at the time of acquisition based on third party market comparisons, resulting in a 100% equity ownership interest in Apple Air and the elimination of Apple Ten’s minority interest.
The Company also utilizes aircraft, owned through two entities, one of which is owned by the Company’s Executive Chairman, and the other, its President and Chief Executive Officer, for acquisition, asset management, renovation and public relations purposes, and reimburses these entities at third party rates. Total costs incurred for the use of these aircraft during 2017, 2016 and 2015 were approximately $0.1 million, $0.2 million and $0.2 million in each respective year and are included in general and administrative expenses in the Company’s consolidated statements of operations.
Note 8
Shareholders’ Equity
Distributions
The Company’s current annual distribution rate, payable monthly, is $1.20 per common share. On April 23, 2015, the Company’s Board of Directors, in anticipation of the Listing, reduced the annual distribution rate from $1.36 per common share to the current annual distribution rate, effective with the June 2015 distribution. For the years ended December 31, 2017, 2016 and 2015, the Company paid distributions of $1.20, $1.20 and $1.27 per common share for a total of approximately $267.9 million, $229.1 million and $229.1 million, respectively. Additionally, in December 2017, the Company declared a monthly distribution of $0.10 per common share, totaling $23.0 million, which was recorded as a payable as of December 31, 2017 and paid in January 2018. As of December 31, 2016, a monthly distribution of $0.10 per common share, totaling $22.3 million, was recorded as a payable and paid in January 2017. These accrued distributions were included in accounts payable and other liabilities in the Company’s consolidated balance sheets.
Issuance of Shares
On February 28, 2017, the Company entered into an equity distribution agreement with Robert W. Baird & Co. Incorporated, Merrill Lynch, Pierce, Fenner & Smith Incorporated, Canaccord Genuity Inc., FBR Capital Markets & Co., Jefferies LLC, KeyBanc Capital Markets Inc. and Scotia Capital (USA) Inc. (collectively, the “Sales Agents”), pursuant to which the Company may sell, from time to time, up to an aggregate of $300 million of its common shares through the Sales Agents under an at-the-market offering program (the “ATM Program”). During the fourth quarter of 2017, the Company sold approximately 6.9 million common shares under its ATM Program at a weighted-average market sales price of approximately $19.55 per common share and received aggregate gross proceeds of approximately $135.1 million, before commissions and issuance costs. The Company used the proceeds from the sale of these shares to pay down borrowings on its revolving credit facility. As of December 31, 2017, approximately $164.9 million remained available for issuance under the ATM program.
Share Repurchases
During 2017, the Company’s Board of Directors authorized an extension of its share repurchase program to repurchase up to $475 million of its common shares, which program will end in July 2018, if not terminated earlier. The program may be suspended or terminated at any time by the Company. In connection with the implementation of the ATM Program, in February 2017 the Company terminated its then existing written trading plan under the Company’s share repurchase program. Since inception of the share repurchase program in July 2015 through December 31, 2017, the Company has purchased approximately 1.7 million of its common shares at a weighted-average market purchase price of approximately $17.64 per common share, for an aggregate purchase price of approximately $29.9 million, including the purchase of approximately 0.4 million of its common shares in 2016, at a weighted-average market purchase price of approximately $17.72 per common share for an aggregate purchase price of approximately $7.9 million and approximately 1.2 million of its common shares in 2015, at a weighted-average market purchase price of approximately $17.61 per common share for an aggregate purchase price of approximately $22.0 million. Repurchases under the program were funded with availability under its revolving credit facility. The Company did not repurchase any common shares under its share repurchase program during 2017. The Company plans to continue to consider opportunistic share repurchases under the $467.5 million remaining portion of the authorized $475 million share repurchase program, which will depend upon prevailing market conditions and other factors.
In connection with the Listing, the Company completed a modified “Dutch Auction” tender offer in June 2015 and purchased approximately 10.5 million of its common shares, which were retired, at a purchase price of $19.00 per common share, for an aggregate purchase price of approximately $200 million, excluding fees and expenses related to the tender offer. The Company funded the tender offer and all related costs primarily from borrowings under its $965 million credit facility.
Prior to the Listing, during 2015, the Company redeemed approximately 0.8 million common shares at a price of $18.40 per common share, or a total of approximately $14.9 million, under its previous share redemption program that was terminated following the April 2015 redemption.
Reverse Share Split
In connection with the Listing, effective May 18, 2015, the Company completed a 50% reverse share split. As a result of the reverse share split, every two common shares were converted into one common share, reducing the number of issued and outstanding common shares from 372.2 million to 186.1 million on the effective date. The common shares have the same respective voting rights, preferences and relative, participating, optional or other rights, and qualifications, limitations or restrictions as set forth in the amended and restated articles of incorporation in effect immediately prior to the effective date of the reverse share split. The reverse share split did not have any effect on the total number of common shares the Company is authorized to issue under its amended and restated articles of incorporation.
Preferred Shares
No preferred shares of the Company are issued and outstanding. The Company’s amended and restated articles of incorporation authorize issuance of up to 30 million preferred shares. The Company believes that the
authorization to issue preferred shares benefits the Company and its shareholders by permitting flexibility in financing additional growth, giving the Company additional financing options in corporate planning and in responding to developments in its business, including financing of additional acquisitions and other general corporate purposes. Having authorized preferred shares available for issuance in the future gives the Company the ability to respond to future developments and allows preferred shares to be issued without the expense and delay of a special shareholders’ meeting. At present, the Company has no specific financing or acquisition plans involving the issuance of preferred shares and the Company does not propose to fix the characteristics of any series of preferred shares in anticipation of issuing preferred shares. The Company cannot now predict whether or to what extent, if any, preferred shares will be used or if so used what the characteristics of a particular series may be. A series of preferred shares could be given rights that are superior to rights of holders of common shares and a series having preferential distribution rights could limit common share distributions and reduce the amount holders of common shares would otherwise receive on dissolution. Unless otherwise required by applicable law or regulation, the preferred shares would be issuable without further authorization by holders of the common shares and on such terms and for such consideration as may be determined by the Board of Directors. The preferred shares could be issued in one or more series having varying voting rights, redemption and conversion features, distribution (including liquidating distribution) rights and preferences, and other rights, including rights of approval of specified transactions. The voting rights and rights to distributions of the holders of common shares will be subject to the priority rights of the holders of any subsequently-issued preferred shares.
Note 9
Compensation Plans
In May 2014, the Board of Directors adopted the Company’s 2014 Omnibus Incentive Plan (the “Omnibus Plan”), and in May 2015, the Company’s shareholders approved the Omnibus Plan. The Omnibus Plan permits the grant of awards of stock options, stock appreciation rights, restricted stock, stock units, unrestricted stock, dividend equivalent rights, performance shares and other performance-based awards, other equity-based awards, and cash bonus awards to any employee, officer, or director of the Company or an affiliate of the Company, a consultant or adviser currently providing services to the Company or an affiliate of the Company, or any other person whose participation in the Omnibus Plan is determined by the Compensation Committee of the Board of Directors to be in the best interests of the Company. The maximum number of the Company’s common shares available for issuance under the Omnibus Plan is 10 million. As of December 31, 2017, there were approximately 9.4 million common shares not reserved and available for issuance under the Omnibus Plan.
In February 2017, the Compensation Committee of the Board of Directors (“Compensation Committee”) approved an executive incentive plan (“2017 Incentive Plan”), effective January 1, 2017, and established incentive goals for 2017. Under the 2017 Incentive Plan, participants are eligible to receive a bonus based on the achievement of certain 2017 performance measures, consisting of operational performance metrics (including targeted Modified Funds from Operations per share, Comparable Hotels revenue per available room growth and Adjusted Hotel EBITDA Margin growth) and shareholder return metrics (including shareholder return relative to a peer group and total shareholder return over one-year and two-year periods). The components of the operational performance metrics and shareholder return metrics are equally weighted and the two metrics each account for 50% of the total target incentive compensation. The range of potential aggregate payouts under the 2017 Incentive Plan was $0 - $18 million. Based on performance during 2017, the Company has accrued approximately $8.4 million as a liability for executive bonus payments under the 2017 Incentive Plan, which is included in accounts payable and other liabilities in the Company’s consolidated balance sheet as of December 31, 2017 and in general and administrative expenses in the Company’s consolidated statement of operations for the year ended December 31, 2017. Additionally, approximately $1.2 million, which is subject to vesting on December 14, 2018, will be recognized proportionally throughout 2018. Assuming the portion subject to vesting in 2018 vests for all participants, approximately 25% of awards under the 2017 Incentive Plan will be paid in cash and 75% will be issued in stock under the Company’s 2014 Omnibus Incentive Plan in the first quarter of 2018, approximately two-thirds of which will be unrestricted and one-third of which will be restricted to vesting on December 14, 2018.
During 2016 and 2015, comparable executive incentive plans were approved by the Compensation Committee (“2016 Incentive Plan” and “2015 Incentive Plan”) that were effective January 1, 2016 and January 1, 2015, respectively. The Company accrued approximately $2.8 million, including $1.9 million in share based compensation as noted below, as a liability for executive bonus payments under the 2016 Incentive Plan, which was included in
accounts payable and other liabilities in the Company’s consolidated balance sheet as of December 31, 2016 and in general and administrative expenses in the Company’s consolidated statement of operations for the year ended December 31, 2016. The Company accrued approximately $8.4 million, including $4.7 million in share based compensation as noted below, as a liability for executive bonus payments under the 2015 Incentive Plan, which was included in general and administrative expenses in the Company’s consolidated statement of operations for the year ended December 31, 2015.
Share Based Compensation Awards
During the first quarters of 2017 and 2016, the Company issued 101,305 and 304,345 common shares earned under the 2016 and 2015 Incentive Plans (net of 19,667 and 11,787 common shares surrendered to satisfy tax withholding obligations) at $19.10 and $19.87 per share, or approximately $2.3 million and $6.3 million in share based compensation, including the surrendered shares, respectively. Of the total shares issued under the 2016 Incentive Plan, 60,028 shares were unrestricted at the time of issuance, and the remaining 41,277 restricted shares vested on December 15, 2017, of which 13,129 common shares were surrendered to satisfy tax withholding obligations. Of the total shares issued under the 2015 Incentive Plan, 146,279 shares were unrestricted at the time of issuance, and the remaining 158,066 restricted shares vested on December 31, 2016, of which 50,044 common shares were surrendered to satisfy tax withholding obligations. Of the total 2016 share based compensation, approximately $1.9 million was recognized as share based compensation expense during the year ended December 31, 2016 and included in the liability recorded as of December 31, 2016, and the remaining $0.4 million, which vested on December 15, 2017, was recognized as share based compensation expense during the year ended December 31, 2017. Of the total 2015 share based compensation, approximately $4.7 million was recorded as compensation expense during the year ended December 31, 2015, and the remaining $1.6 million, which vested on December 31, 2016, was recognized as share based compensation expense during the year ended December 31, 2016.
Note 10
Management and Franchise Agreements
Each of the Company’s 239 hotels owned as of December 31, 2017 is operated and managed under a separate management agreement with one of the following management companies or one of their affiliates, none of which are affiliated with the Company:
|
Manager
|
Number of Hotels
|
|||
|
LBAM-Investor Group, LLC (“LBA”)
|
42
|
|||
|
White Lodging Services Corporation (“White Lodging”)
|
28
|
|||
|
Dimension Development Two, LLC (“Dimension”)
|
24
|
|||
|
MHH Management, LLC (“McKibbon”)
|
18
|
|||
|
Texas Western Management Partners, LP (“Western”)
|
17
|
|||
|
Marriott International, Inc. (“Marriott”)
|
14
|
|||
|
Raymond Management Company, Inc. (“Raymond”)
|
14
|
|||
|
Newport Hospitality Group, Inc. (“Newport”)
|
9
|
|||
|
North Central Hospitality, LLC (“North Central”)
|
9
|
|||
|
Vista Host, Inc. (“Vista Host”)
|
9
|
|||
|
Crestline Hotels & Resorts, LLC (“Crestline”)
|
8
|
|||
|
InnVentures IVI, LP (“InnVentures”)
|
8
|
|||
|
True North Hotel Group, Inc. (“True North”)
|
7
|
|||
|
Aimbridge Hospitality, LLC (“Aimbridge”)
|
6
|
|||
|
Chartwell Hospitality, LLC (“Chartwell”)
|
5
|
|||
|
Gateway Hospitality Group, Inc. (“Gateway”)
|
5
|
|||
|
Schulte Hospitality Group, Inc. (“Schulte”)
|
4
|
|||
|
Huntington Hotel Group, LP (“Huntington”)
|
3
|
|||
|
Stonebridge Realty Advisors, Inc. (“Stonebridge”)
|
3
|
|||
|
Hilton Worldwide Holdings Inc. (“Hilton”)
|
2
|
|||
|
New Castle Hotels & Resorts (“New Castle”)
|
2
|
|||
|
Highgate Hotels, L.P. (“Highgate”)
|
1
|
|||
|
Pyramid Advisors Limited Partnership (“Pyramid”)
|
1
|
|||
|
Total
|
239
|
|||
The management agreements generally provide for initial terms of one to 30 years. The Company has the option to terminate the management agreements if specified performance thresholds are not satisfied. As of December 31, 2017, nearly 80% of the Company’s hotels operate under a variable management fee structure, which the Company believes better aligns incentives for each hotel manager to maximize each property’s performance than a base-plus-incentive management fee structure, as described below, which is more common throughout the industry. Under the variable fee structure, the management fee earned for each hotel is generally within a range of 2.5% to 3.5% of revenue based on each hotel’s performance relative to other hotels owned by the Company. The performance measures are based on various financial and quality performance metrics. The Company’s remaining hotels operate under a management fee structure which generally includes the payment of base management fees and an opportunity for incentive management fees. Under this structure, base management fees are calculated as a percentage of gross revenues and the incentive management fees are calculated as a percentage of operating profit in excess of a priority return to the Company, as defined in the management agreements. In addition to the above, management fees for all of the Company’s hotels generally include accounting fees and other fees for centralized services, which are allocated among all of the hotels that receive the benefit of such services. For the years ended December 31, 2017, 2016 and 2015, the Company incurred approximately $42.7 million, $35.6 million and $31.1 million in management fees, respectively.
Sixteen of the Company’s hotels are managed by affiliates of Marriott or Hilton. The remainder of the Company’s hotels are managed by companies that are not affiliated with either Marriott or Hilton, and as a result, the hotels they manage were required to obtain separate franchise agreements with each respective franchisor. The franchise agreements generally provide for initial terms of approximately 10 to 30 years and generally provide for renewals subject to franchise requirements at the time of renewal. The Company pays various fees under these agreements, including the payment of royalty fees, marketing fees, reservation fees, a communications support fee, brand loyalty program fees and other similar fees based on room revenues. For the years ended December 31, 2017, 2016 and 2015, the Company incurred approximately $52.9 million, $44.2 million and $38.0 million, respectively, in franchise royalty fees.
Note 11
Lease Commitments
The Company has ground leases relating to 14 of its hotels and three parking lot leases. At the time of acquisition, the Company recorded initial intangible assets for twelve of these leases that were below market leases (including three leases relating to four hotels assumed as part of the Apple Ten merger, effective September 1, 2016), which at December 31, 2017 and 2016 totaled approximately $27.3 million and $28.4 million, respectively, and are included in other assets, net in the Company’s consolidated balance sheets. The Company recorded initial intangible liabilities for three of these leases that were above market leases, which as of December 31, 2017 and 2016 totaled approximately $6.2 million and $6.5 million, respectively, and are included in accounts payable and other liabilities in the Company’s consolidated balance sheets. The value of each lease intangible is amortized over the term of the respective lease and the amortization is included in ground lease expense in the Company’s consolidated statements of operations, resulting in a net increase of approximately $0.8 million, $0.7 million and $0.7 million to ground lease expense for the years ended December 31, 2017, 2016 and 2015.
The Company’s leases have remaining terms ranging from approximately six to 88 years, excluding any option periods to extend the initial lease term. The Company has options to extend certain leases beyond the initial lease term by periods ranging from five to 120 years. The leases are classified as operating leases. The leases generally have fixed scheduled rent increases, and lease expense is recognized on a straight-line basis over the remaining term of the respective leases. Ground lease expense includes approximately $3.7 million, $3.4 million and $3.3 million of adjustments to record rent on a straight-line basis for the years ended December 31, 2017, 2016 and 2015. The accrued straight-line lease liability balance as of December 31, 2017 and 2016 was approximately $13.3 million and $9.6 million, respectively, and is included in accounts payable and other liabilities in the Company’s consolidated balance sheets.
The aggregate amounts of the estimated minimum lease payments for the five years subsequent to December 31, 2017 and thereafter, are as follows (in thousands):
|
Total
|
||||
|
2018
|
$
|
6,318
|
||
|
2019
|
6,600
|
|||
|
2020
|
6,772
|
|||
|
2021
|
6,957
|
|||
|
2022
|
7,117
|
|||
|
Thereafter
|
327,808
|
|||
|
Total
|
$
|
361,572
|
||
Note 12
Industry Segments
The Company owns hotel properties throughout the United States that generate rental and other property related income. The Company separately evaluates the performance of each of its hotel properties. However, because each of the hotels has similar economic characteristics, facilities, and services, and each hotel is not individually significant, the properties have been aggregated into a single reportable segment. All segment disclosures are included in, or can be derived from the Company’s consolidated financial statements.
Note 13
Hotel Contract Commitments
As of December 31, 2017, the Company had outstanding contracts for the potential purchase of four hotels for a total purchase price of $127.8 million. Two of the hotels, the Atlanta Hampton Inn & Suites and the Memphis Hampton Inn & Suites, both of which are already in operation, were acquired in February 2018. The two remaining hotels are under construction and are planned to be completed and opened for business during 2018, at which time closing on these hotels is expected to occur. Although the Company is working towards acquiring the two hotels under construction, there are many conditions to closing that have not yet been satisfied and there can be no assurance that a closing on these hotels will occur under the outstanding purchase contracts. The following table summarizes the location, brand, date of purchase contract, expected number of rooms, refundable (if the seller does not meet its obligations under the contract) contract deposits paid, and gross purchase price for each of the contracts outstanding at December 31, 2017. All dollar amounts are in thousands.
|
Location
|
Brand
|
Date of Purchase Contract
|
Rooms
|
Refundable Deposits
|
Gross Purchase Price
|
|||||||||||
|
Operating
|
||||||||||||||||
|
Atlanta, GA
|
Hampton
|
12/22/2017
|
119
|
$
|
(a
|
)
|
$
|
(a
|
)
|
|||||||
|
Memphis, TN
|
Hampton
|
12/22/2017
|
144
|
(a
|
) |
(a
|
) | |||||||||
|
Under development (b)
|
||||||||||||||||
|
Phoenix, AZ
|
Hampton
|
10/25/2016
|
210
|
500
|
44,100
|
|||||||||||
|
Orlando, FL
|
Home2 Suites
|
1/18/2017
|
128
|
3
|
20,736
|
|||||||||||
|
601
|
$
|
1,503
|
$
|
127,836
|
||||||||||||
|
(a)
|
These two hotels are included in one purchase contract with a total gross purchase price of $63.0 million and an initial deposit of $1.0 million. These amounts are included in the total gross purchase price and refundable deposits as indicated above. Closing on these hotels occurred in February 2018.
|
|
(b)
|
As of December 31, 2017, these hotels were under construction. The table shows the expected number of rooms upon hotel completion and the expected franchise brands. Assuming all conditions to closing are met, the purchases of these hotels are expected to occur during 2018. If the seller meets all of the conditions to closing, the Company is obligated to specifically perform under the contract. As the properties are under construction, at this time, the seller has not met all of the conditions to closing.
|
The purchase price for the Atlanta Hampton Inn & Suites and the Memphis Hampton Inn & Suites was funded through the Company’s revolving credit facility and it is anticipated that the purchase price for the remaining hotels will be funded similarly.
Note 14
Legal Proceedings
Quinn v. Knight, et al.
On July 19, 2016, a purported shareholder of Apple Ten, now part of the Company, commenced a derivative action in the United States District Court for the Eastern District of Virginia, captioned and numbered Quinn v. Knight, et al, Case No. 3:16-cv-610 (the “Complaint”) regarding the merger with Apple Ten. The Complaint named as defendants the members of Apple Ten’s board of directors, certain officers of Apple Ten and the Company, the Company and, as a nominal defendant, Apple Ten. On November 2, 2016, the parties reached an agreement in principle to settle the litigation, which the Court approved by order dated March 16, 2017. In January 2017, the Company funded the settlement amount of $32 million, which was included in accounts payable and other liabilities in its consolidated balance sheet as of December 31, 2016, and received $10 million of proceeds from its director and officer insurance carriers, which was included in other assets, net in its consolidated balance sheet as of December 31, 2016 and the net $22 million was included in transaction and litigation costs (reimbursements) in the Company’s consolidated statement of operations for the year then ended. In May 2017, the Company received an additional $2.6 million of proceeds from its director and officer insurance carriers, which was included as a reduction in transaction and litigation costs (reimbursements) in the Company’s consolidated statements of operations for the year ended December 31, 2017. The Company does not anticipate additional costs or reimbursements related to this litigation.
Moses, et al. v. Apple Hospitality REIT, Inc., et al.
On April 22, 2014, Plaintiff Susan Moses, purportedly a shareholder of Apple REIT Seven, Inc. (“Apple Seven”) and Apple REIT Eight, Inc. (“Apple Eight”), filed a class action against the Company and several individual directors on behalf of all then-existing shareholders and former shareholders of Apple Seven and Apple Eight, who purchased additional shares under the Dividend Reinvestment Plans (“DRIP”) of Apple Seven, Apple Eight and the Company between July 17, 2007 and February 12, 2014 (Susan Moses, et al. v. Apple Hospitality REIT, Inc., et al., 14-CV-3131 (DLI)(SMG)). In January 2017, the parties reached an agreement in principle to settle the litigation for $5.5 million. In January 2018, the settlement was funded by the Company. The settlement amount has been included in accounts payable and other liabilities in the Company’s consolidated balance sheets as of December 31, 2017 and 2016, and in transaction and litigation costs (reimbursements) in the Company’s consolidated statement of operations for the year ended December 31, 2016. The settlement is subject to approval by the United States District Court for the Eastern District of New York. At this time, no assurance can be given that the proposed settlement will be approved, and therefore the actual loss incurred could be in excess of the amount accrued as of December 31, 2017.
Wilchfort, et al. v. Apple Hospitality REIT, Inc., et al.
On February 24, 2017, Plaintiff Marsha Wilchfort, purportedly a shareholder of Apple REIT Six, Inc. (“Apple Six”), Apple Seven and Apple Eight, filed a class action against, among others, the Company and the former individual directors of Apple Six, Apple Seven and Apple Eight, including Mr. Glade Knight, on behalf of all then-existing shareholders and former shareholders of Apple Six, Apple Seven and Apple Eight, who purchased additional shares under Apple Six’s, Apple Seven’s and Apple Eight’s DRIP between July 17, 2007 and December 2012 (in the case of Apple Six shareholders) or June 30, 2013 (in the case of Apple Seven and Apple Eight shareholders). The complaint was filed in the United States District Court for the Eastern District of New York and alleges, among other items, breach of contract under Virginia law, tortious interference and breach of implied duty of good faith and fair dealing. The complaint alleges that the prices at which Plaintiff and the purported class members purchased additional shares through the DRIPs were not indicative of the true value of the units of Apple Six, Apple Seven and Apple Eight.
The Company believes that Plaintiff’s claims are without merit and intends to defend this case vigorously. At this time, the Company cannot reasonably predict the outcome of this proceeding or provide a reasonable estimate of the possible loss or range of loss due to this proceeding, if any.
Note 15
Settlement Proceeds
During the year ended December 31, 2015, the Company received approximately $1.8 million in settlement proceeds, net of costs, from the Deepwater Horizon Economic and Property Damages Settlement Program related to damages suffered at several of the Company’s hotels as a result of the Gulf of Mexico oil spill in 2010, which was classified as a reduction to property taxes, insurance and other expense.
Note 16
Quarterly Financial Data (Unaudited)
The following is a summary of quarterly results of operations for the years ended December 31, 2017 and 2016 (in thousands, except per share data):
|
2017
|
||||||||||||||||
|
First Quarter
|
Second Quarter
|
Third Quarter
|
Fourth Quarter
|
|||||||||||||
|
Total revenue
|
$
|
292,925
|
$
|
331,704
|
$
|
324,926
|
$
|
289,067
|
||||||||
|
Net income (loss)
|
$
|
34,365
|
$
|
87,606
|
$
|
62,824
|
$
|
(2,303
|
)
|
|||||||
|
Comprehensive income
|
$
|
35,910
|
$
|
86,431
|
$
|
63,083
|
$
|
2,257
|
||||||||
|
Basic and diluted net income (loss) per common share
|
$
|
0.15
|
$
|
0.39
|
$
|
0.28
|
$
|
(0.01
|
)
|
|||||||
| 2016 | ||||||||||||||||
|
First Quarter
|
Second Quarter
|
Third Quarter
|
Fourth Quarter
|
|||||||||||||
|
Total revenue
|
$
|
224,487
|
$
|
257,636
|
$
|
276,471
|
$
|
282,431
|
||||||||
|
Net income
|
$
|
34,686
|
$
|
54,718
|
$
|
13,694
|
$
|
41,554
|
||||||||
|
Comprehensive income
|
$
|
27,992
|
$
|
49,217
|
$
|
17,955
|
$
|
56,134
|
||||||||
|
Basic and diluted net income per common share
|
$
|
0.20
|
$
|
0.31
|
$
|
0.07
|
$
|
0.19
|
||||||||
Net income for the second quarter of 2017 includes a gain on sale of real estate of $16.1 million, representing net income of $0.07 per basic and diluted common share. Net loss for the fourth quarter of 2017 includes a loss on impairment of depreciable assets of $38.0 million, representing a net loss of $(0.17) per basic and diluted common share. Net income (loss) per common share for the four quarters of 2017 are non-additive in comparison to net income per common share for the year ended December 31, 2017 due to the equity issued in the fourth quarter of 2017 under the ATM Program.
Net income for the third quarter of 2016 includes costs incurred to defend and settle the litigation related to the Apple Ten merger of $33.8 million, representing a net loss of $(0.18) per basic and diluted common share. Net income per common share for the four quarters of 2016 are non-additive in comparison to net income per common share for the year ended December 31, 2016 due to the equity issued in connection with the Apple Ten merger, effective September 1, 2016.
Note 17
Subsequent Events
In both January 2018 and February 2018, the Company paid approximately $23.0 million, or $0.10 per outstanding common share, in distributions to its common shareholders.
In February 2018, the Company declared a regular monthly cash distribution of $0.10 per common share for the month of March 2018. The distribution is payable on March 15, 2018.
On February 5, 2018, the Company closed on the purchase of an existing 119-room Hampton Inn & Suites in Atlanta, Georgia and an existing 144-room Hampton Inn & Suites in Memphis, Tennessee for a gross purchase price of $63.0 million.
None.
Senior management, including the Chief Executive Officer and Chief Financial Officer, evaluated the effectiveness of the Company’s disclosure controls and procedures as of the end of the period covered by this report. Based on this evaluation process, the Chief Executive Officer and Chief Financial Officer have concluded that the Company’s disclosure controls and procedures were effective as of December 31, 2017. There have been no changes in the Company’s internal control over financial reporting that occurred during the last fiscal quarter that have materially affected, or are reasonably likely to materially affect, the Company’s internal control over financial reporting.
See Item 8 for the Report of Management on Internal Control over Financial Reporting and the Company’s Independent Registered Public Accounting Firm’s attestation report regarding internal control over financial reporting, which are incorporated herein by reference.
None.
PART III
The information required by Items 401, 405, 406 and 407(c)(3), (d)(4) and (d)(5) of Regulation S-K will be set forth in the Company’s definitive proxy statement for its 2018 Annual Meeting of Shareholders (the “2018 Proxy Statement”). For the limited purpose of providing the information necessary to comply with this Item 10, the 2018 Proxy Statement is incorporated herein by this reference.
The information required by Items 402 and 407(e)(4) and (e)(5) of Regulation S-K will be set forth in the Company’s 2018 Proxy Statement. For the limited purpose of providing the information necessary to comply with this Item 11, the 2018 Proxy Statement is incorporated herein by this reference.
| Item 12. |
Security Ownership of Certain Beneficial Owners and Management and Related Shareholder Matters
|
The information required by Items 201(d) and 403 of Regulation S-K will be set forth in the Company’s 2018 Proxy Statement. For the limited purpose of providing the information necessary to comply with this Item 12, the 2018 Proxy Statement is incorporated herein by this reference.
The information required by Items 404 and 407(a) of Regulation S-K will be set forth in the Company’s 2018 Proxy Statement. For the limited purpose of providing the information necessary to comply with this Item 13, the 2018 Proxy Statement is incorporated herein by this reference.
The information required by Item 9(e) of Schedule 14A will be set forth in the Company’s 2018 Proxy Statement. For the limited purpose of providing the information necessary to comply with this Item 14, the 2018 Proxy Statement is incorporated herein by this reference.
PART IV
1. Financial Statements of Apple Hospitality REIT, Inc.
Report of Management on Internal Control over Financial Reporting
Report of Independent Registered Public Accounting Firm—Ernst & Young LLP
Report of Independent Registered Public Accounting Firm—Ernst & Young LLP
Consolidated Balance Sheets as of December 31, 2017 and 2016
Consolidated Statements of Operations and Comprehensive Income for the years ended December 31, 2017, 2016 and 2015
Consolidated Statements of Shareholders’ Equity for the years ended December 31, 2017, 2016 and 2015
Consolidated Statements of Cash Flows for the years ended December 31, 2017, 2016 and 2015
Notes to Consolidated Financial Statements
These financial statements are set forth in Item 8 of this report and are hereby incorporated by reference.
2. Financial Statement Schedules
Schedule III—Real Estate and Accumulated Depreciation (Included at the end of this Part IV of this report.)
Financial statement schedules not listed are either omitted because they are not applicable or the required information is shown in the consolidated financial statements or notes thereto.
3. Exhibit Listing
|
Exhibit
Number
|
Description of Documents
|
|
2.6
|
|
|
2.7
|
|
|
3.1
|
|
|
3.2
|
|
|
10.1*
|
|
|
10.2
|
|
|
10.3
|
|
| 10.4* | |
|
10.5*
|
|
|
10.6
|
|
|
10.7
|
|
|
10.8
|
|
|
10.9
|
|
Exhibit
Number
|
Description of Documents
|
|
10.10
|
|
|
12.1
|
|
|
21.1
|
|
|
23.1
|
|
|
31.1
|
|
|
31.2
|
|
|
32.1
|
|
|
101
|
The following materials from Apple Hospitality REIT, Inc.’s Annual Report on Form 10-K for the year ended December 31, 2017 formatted in XBRL (eXtensible Business Reporting Language): (i) the Consolidated Balance Sheets, (ii) the Consolidated Statements of Operations and Comprehensive Income, (iii) the Consolidated Statements of Shareholders’ Equity, (iv) the Consolidated Statements of Cash Flows, and (v) related notes to these financial statements, tagged as blocks of text and in detail (FILED HEREWITH)
|
* Denotes Compensation Plan.
None.
SCHEDULE III
Real Estate and Accumulated Depreciation
As of December 31, 2017
(dollars in thousands)
|
Subsequently
Capitalized |
|||||||||||||||||||||||||||||||||||||||
|
Initial Cost
|
Bldg.
Imp. &
FF&E |
Total
Gross
Cost (2) |
|||||||||||||||||||||||||||||||||||||
|
City
|
State
|
Description
|
Encumbrances
|
Land (1)
|
Bldg./
FF&E /Other |
Acc.
Deprec. |
Date of
Construction |
Date
Acquired |
Depreciable
Life |
# of
Rooms |
|||||||||||||||||||||||||||||
|
Anchorage
|
AK
|
Embassy Suites
|
$
|
20,560
|
$
|
2,955
|
$
|
39,053
|
$
|
4,103
|
$
|
46,111
|
$
|
(10,911
|
)
|
2008
|
Apr-10
|
3 - 39 yrs.
|
169
|
||||||||||||||||||||
|
Anchorage
|
AK
|
Home2 Suites
|
-
|
2,683
|
21,606
|
-
|
- |
24,289
|
(64
|
)
|
2015
|
Dec-17
|
3 - 39 yrs.
|
135
|
|||||||||||||||||||||||||
|
Auburn
|
AL
|
Hilton Garden Inn
|
-
|
1,580
|
9,659
|
223
|
11,462
|
(1,585
|
)
|
2001
|
Mar-14
|
3 - 39 yrs.
|
101
|
||||||||||||||||||||||||||
|
Birmingham
|
AL
|
Courtyard
|
-
|
2,310
|
6,425
|
1,142
|
9,877
|
(1,015
|
)
|
2007
|
Mar-14
|
3 - 39 yrs.
|
84
|
||||||||||||||||||||||||||
|
Birmingham
|
AL
|
Hilton Garden Inn
|
-
|
3,425
|
15,853
|
-
|
19,278
|
(204
|
)
|
2017
|
Sep-17
|
3 - 39 yrs.
|
104
|
||||||||||||||||||||||||||
|
Birmingham
|
AL
|
Home2 Suites
|
-
|
3,491
|
15,901
|
-
|
19,392
|
(196
|
)
|
2017
|
Sep-17
|
3 - 39 yrs.
|
106
|
||||||||||||||||||||||||||
|
Birmingham
|
AL
|
Homewood Suites
|
-
|
1,010
|
12,981
|
1,730
|
15,721
|
(2,101
|
)
|
2005
|
Mar-14
|
3 - 39 yrs.
|
95
|
||||||||||||||||||||||||||
|
Dothan
|
AL
|
Hilton Garden Inn
|
-
|
1,037
|
10,581
|
182
|
11,800
|
(3,359
|
)
|
2009
|
Jun-09
|
3 - 39 yrs.
|
104
|
||||||||||||||||||||||||||
|
Dothan
|
AL
|
Residence Inn
|
-
|
970
|
13,185
|
822
|
14,977
|
(1,608
|
)
|
2008
|
Mar-14
|
3 - 39 yrs.
|
84
|
||||||||||||||||||||||||||
|
Huntsville
|
AL
|
Hampton
|
-
|
550
|
11,962
|
7
|
12,519
|
(555
|
)
|
2013
|
Sep-16
|
3 - 39 yrs.
|
98
|
||||||||||||||||||||||||||
|
Huntsville
|
AL
|
Hilton Garden Inn
|
-
|
890
|
11,227
|
268
|
12,385
|
(1,623
|
)
|
2005
|
Mar-14
|
3 - 39 yrs.
|
101
|
||||||||||||||||||||||||||
|
Huntsville
|
AL
|
Home2 Suites
|
-
|
490
|
10,840
|
5
|
11,335
|
(497
|
)
|
2013
|
Sep-16
|
3 - 39 yrs.
|
77
|
||||||||||||||||||||||||||
|
Huntsville
|
AL
|
Homewood Suites
|
7,483
|
210
|
15,654
|
1,782
|
17,646
|
(2,285
|
)
|
2006
|
Mar-14
|
3 - 39 yrs.
|
107
|
||||||||||||||||||||||||||
|
Mobile
|
AL
|
Hampton
|
-
|
-
|
11,452
|
231
|
11,683
|
(531
|
)
|
2006
|
Sep-16
|
3 - 39 yrs.
|
101
|
||||||||||||||||||||||||||
|
Montgomery
|
AL
|
Hilton Garden Inn
|
-
|
2,640
|
12,315
|
285
|
15,240
|
(1,858
|
)
|
2003
|
Mar-14
|
3 - 39 yrs.
|
97
|
||||||||||||||||||||||||||
|
Montgomery
|
AL
|
Homewood Suites
|
-
|
1,760
|
10,818
|
296
|
12,874
|
(1,854
|
)
|
2004
|
Mar-14
|
3 - 39 yrs.
|
91
|
||||||||||||||||||||||||||
|
Prattville
|
AL
|
Courtyard
|
5,943
|
2,050
|
9,101
|
922
|
12,073
|
(1,490
|
)
|
2007
|
Mar-14
|
3 - 39 yrs.
|
84
|
||||||||||||||||||||||||||
|
Rogers
|
AR
|
Hampton
|
-
|
961
|
8,483
|
875
|
10,319
|
(2,571
|
)
|
1998
|
Aug-10
|
3 - 39 yrs.
|
122
|
||||||||||||||||||||||||||
|
Rogers
|
AR
|
Homewood Suites
|
-
|
1,375
|
9,514
|
2,226
|
13,115
|
(3,791
|
)
|
2006
|
Apr-10
|
3 - 39 yrs.
|
126
|
||||||||||||||||||||||||||
|
Rogers
|
AR
|
Residence Inn
|
-
|
1,130
|
12,417
|
332
|
13,879
|
(1,831
|
)
|
2003
|
Mar-14
|
3 - 39 yrs.
|
88
|
||||||||||||||||||||||||||
|
Springdale
|
AR
|
Residence Inn
|
-
|
330
|
8,651
|
315
|
9,296
|
(1,080
|
)
|
2001
|
Mar-14
|
3 - 39 yrs.
|
72
|
||||||||||||||||||||||||||
|
Chandler
|
AZ
|
Courtyard
|
-
|
1,061
|
16,008
|
1,540
|
18,609
|
(4,171
|
)
|
2009
|
Nov-10
|
3 - 39 yrs.
|
150
|
||||||||||||||||||||||||||
|
Chandler
|
AZ
|
Fairfield Inn & Suites
|
-
|
778
|
11,272
|
978
|
13,028
|
(2,849
|
)
|
2009
|
Nov-10
|
3 - 39 yrs.
|
110
|
||||||||||||||||||||||||||
|
Phoenix
|
AZ
|
Courtyard
|
-
|
1,413
|
14,669
|
2,174
|
18,256
|
(4,570
|
)
|
2007
|
Nov-10
|
3 - 39 yrs.
|
164
|
||||||||||||||||||||||||||
|
Phoenix
|
AZ
|
Courtyard
|
-
|
1,730
|
17,401
|
95
|
19,226
|
(795
|
)
|
2008
|
Sep-16
|
3 - 39 yrs.
|
127
|
||||||||||||||||||||||||||
|
Phoenix
|
AZ
|
Hampton
|
-
|
-
|
15,209
|
137
|
15,346
|
(739
|
)
|
2008
|
Sep-16
|
3 - 39 yrs.
|
125
|
||||||||||||||||||||||||||
|
Phoenix
|
AZ
|
Homewood Suites
|
-
|
-
|
18,907
|
79
|
18,986
|
(950
|
)
|
2008
|
Sep-16
|
3 - 39 yrs.
|
134
|
||||||||||||||||||||||||||
|
Phoenix
|
AZ
|
Residence Inn
|
-
|
1,111
|
12,953
|
1,616
|
15,680
|
(3,779
|
)
|
2008
|
Nov-10
|
3 - 39 yrs.
|
129
|
||||||||||||||||||||||||||
|
Scottsdale
|
AZ
|
Hilton Garden Inn
|
-
|
6,000
|
26,861
|
237
|
33,098
|
(1,087
|
)
|
2005
|
Sep-16
|
3 - 39 yrs.
|
122
|
||||||||||||||||||||||||||
|
Tucson
|
AZ
|
Hilton Garden Inn
|
-
|
1,005
|
17,925
|
1,829
|
20,759
|
(5,756
|
)
|
2008
|
Jul-08
|
3 - 39 yrs.
|
125
|
||||||||||||||||||||||||||
|
Tucson
|
AZ
|
Residence Inn
|
-
|
2,080
|
12,424
|
1,494
|
15,998
|
(1,766
|
)
|
2008
|
Mar-14
|
3 - 39 yrs.
|
124
|
||||||||||||||||||||||||||
|
Tucson
|
AZ
|
TownePlace Suites
|
-
|
992
|
14,543
|
109
|
15,644
|
(3,230
|
)
|
2011
|
Oct-11
|
3 - 39 yrs.
|
124
|
||||||||||||||||||||||||||
|
Agoura Hills
|
CA
|
Homewood Suites
|
-
|
3,430
|
21,290
|
2,179
|
26,899
|
(3,302
|
)
|
2007
|
Mar-14
|
3 - 39 yrs.
|
125
|
||||||||||||||||||||||||||
|
Burbank
|
CA
|
Courtyard
|
24,917
|
12,916
|
41,218
|
422
|
54,556
|
(3,297
|
)
|
2002
|
Aug-15
|
3 - 39 yrs.
|
190
|
||||||||||||||||||||||||||
|
Burbank
|
CA
|
Residence Inn
|
-
|
32,270
|
41,559
|
2,406
|
76,235
|
(5,606
|
)
|
2007
|
Mar-14
|
3 - 39 yrs.
|
166
|
||||||||||||||||||||||||||
|
Burbank
|
CA
|
SpringHill Suites
|
-
|
10,734
|
49,181
|
38
|
59,953
|
(3,844
|
)
|
2015
|
Jul-15
|
3 - 39 yrs.
|
170
|
||||||||||||||||||||||||||
|
Clovis
|
CA
|
Hampton
|
-
|
1,287
|
9,888
|
865
|
12,040
|
(2,903
|
)
|
2009
|
Jul-09
|
3 - 39 yrs.
|
86
|
||||||||||||||||||||||||||
|
Clovis
|
CA
|
Homewood Suites
|
-
|
1,500
|
10,970
|
96
|
12,566
|
(3,042
|
)
|
2010
|
Feb-10
|
3 - 39 yrs.
|
83
|
||||||||||||||||||||||||||
|
Cypress
|
CA
|
Courtyard
|
-
|
4,410
|
35,033
|
685
|
40,128
|
(4,825
|
)
|
1988
|
Mar-14
|
3 - 39 yrs.
|
180
|
||||||||||||||||||||||||||
|
Cypress
|
CA
|
Hampton
|
-
|
3,209
|
16,749
|
1,965
|
21,923
|
(1,583
|
)
|
2006
|
Jun-15
|
3 - 39 yrs.
|
110
|
||||||||||||||||||||||||||
|
Oceanside
|
CA
|
Courtyard
|
13,332
|
3,080
|
25,769
|
146
|
28,995
|
(1,047
|
)
|
2011
|
Sep-16
|
3 - 39 yrs.
|
142
|
||||||||||||||||||||||||||
|
Oceanside
|
CA
|
Residence Inn
|
-
|
7,790
|
24,048
|
1,649
|
33,487
|
(3,294
|
)
|
2007
|
Mar-14
|
3 - 39 yrs.
|
125
|
||||||||||||||||||||||||||
|
Rancho Bernardo/San Diego
|
CA
|
Courtyard
|
13,692
|
16,380
|
28,952
|
480
|
45,812
|
(4,113
|
)
|
1987
|
Mar-14
|
3 - 39 yrs.
|
210
|
||||||||||||||||||||||||||
|
Sacramento
|
CA
|
Hilton Garden Inn
|
-
|
5,920
|
21,515
|
3,216
|
30,651
|
(3,454
|
)
|
1999
|
Mar-14
|
3 - 39 yrs.
|
153
|
||||||||||||||||||||||||||
|
San Bernardino
|
CA
|
Residence Inn
|
-
|
1,490
|
13,662
|
1,708
|
16,860
|
(3,659
|
)
|
2006
|
Feb-11
|
3 - 39 yrs.
|
95
|
||||||||||||||||||||||||||
|
San Diego
|
CA
|
Courtyard
|
24,828
|
11,268
|
44,851
|
583
|
56,702
|
(3,620
|
)
|
2002
|
Sep-15
|
3 - 39 yrs.
|
245
|
||||||||||||||||||||||||||
|
San Diego
|
CA
|
Hampton
|
18,483
|
13,570
|
36,644
|
2,657
|
52,871
|
(4,750
|
)
|
2001
|
Mar-14
|
3 - 39 yrs.
|
177
|
||||||||||||||||||||||||||
|
San Diego
|
CA
|
Hilton Garden Inn
|
-
|
8,020
|
29,151
|
358
|
37,529
|
(4,022
|
)
|
2004
|
Mar-14
|
3 - 39 yrs.
|
200
|
||||||||||||||||||||||||||
|
San Diego
|
CA
|
Residence Inn
|
16,733
|
22,400
|
20,640
|
309
|
43,349
|
(3,239
|
)
|
1999
|
Mar-14
|
3 - 39 yrs.
|
121
|
||||||||||||||||||||||||||
|
San Jose
|
CA
|
Homewood Suites
|
30,000
|
12,860
|
28,084
|
4,980
|
45,924
|
(5,530
|
)
|
1991
|
Mar-14
|
3 - 39 yrs.
|
140
|
||||||||||||||||||||||||||
|
San Juan Capistrano
|
CA
|
Residence Inn
|
15,774
|
-
|
32,292
|
44
|
32,336
|
(1,384
|
)
|
2012
|
Sep-16
|
3 - 39 yrs.
|
130
|
||||||||||||||||||||||||||
|
Santa Ana
|
CA
|
Courtyard
|
-
|
3,082
|
21,051
|
147
|
24,280
|
(4,886
|
)
|
2011
|
May-11
|
3 - 39 yrs.
|
155
|
||||||||||||||||||||||||||
|
Santa Clarita
|
CA
|
Courtyard
|
-
|
4,568
|
18,721
|
2,246
|
25,535
|
(6,560
|
)
|
2007
|
Sep-08
|
3 - 39 yrs.
|
140
|
||||||||||||||||||||||||||
|
Santa Clarita
|
CA
|
Fairfield Inn
|
-
|
1,864
|
7,753
|
1,834
|
11,451
|
(3,088
|
)
|
1997
|
Oct-08
|
3 - 39 yrs.
|
66
|
||||||||||||||||||||||||||
|
Santa Clarita
|
CA
|
Hampton
|
-
|
1,812
|
15,761
|
1,999
|
19,572
|
(5,977
|
)
|
1988
|
Oct-08
|
3 - 39 yrs.
|
128
|
||||||||||||||||||||||||||
|
Santa Clarita
|
CA
|
Residence Inn
|
-
|
2,539
|
14,493
|
3,917
|
20,949
|
(6,153
|
)
|
1997
|
Oct-08
|
3 - 39 yrs.
|
90
|
||||||||||||||||||||||||||
|
Tulare
|
CA
|
Hampton
|
-
|
400
|
9,194
|
1,061
|
10,655
|
(1,437
|
)
|
2008
|
Mar-14
|
3 - 39 yrs.
|
86
|
||||||||||||||||||||||||||
|
Tustin
|
CA
|
Fairfield Inn & Suites
|
-
|
7,700
|
26,580
|
68
|
34,348
|
(1,132
|
)
|
2013
|
Sep-16
|
3 - 39 yrs.
|
145
|
||||||||||||||||||||||||||
|
Tustin
|
CA
|
Residence Inn
|
-
|
11,680
|
33,645
|
70
|
45,395
|
(1,477
|
)
|
2013
|
Sep-16
|
3 - 39 yrs.
|
149
|
||||||||||||||||||||||||||
|
Colorado Springs
|
CO
|
Hampton
|
7,754
|
1,780
|
15,860
|
29
|
17,669
|
(740
|
)
|
2008
|
Sep-16
|
3 - 39 yrs.
|
101
|
||||||||||||||||||||||||||
|
Denver
|
CO
|
Hilton Garden Inn
|
33,046
|
9,940
|
57,595
|
131
|
67,666
|
(2,618
|
)
|
2007
|
Sep-16
|
3 - 39 yrs.
|
221
|
||||||||||||||||||||||||||
|
Highlands Ranch
|
CO
|
Hilton Garden Inn
|
-
|
5,480
|
20,465
|
246
|
26,191
|
(2,654
|
)
|
2006
|
Mar-14
|
3 - 39 yrs.
|
128
|
||||||||||||||||||||||||||
|
Highlands Ranch
|
CO
|
Residence Inn
|
-
|
5,350
|
19,167
|
2,814
|
27,331
|
(3,286
|
)
|
1996
|
Mar-14
|
3 - 39 yrs.
|
117
|
||||||||||||||||||||||||||
|
Boca Raton
|
FL
|
Hilton Garden Inn
|
-
|
7,220
|
22,177
|
344
|
29,741
|
(1,012
|
)
|
2002
|
Sep-16
|
3 - 39 yrs.
|
149
|
||||||||||||||||||||||||||
|
Cape Canaveral
|
FL
|
Homewood Suites
|
-
|
2,780
|
23,967
|
32
|
26,779
|
(1,219
|
)
|
2016
|
Sep-16
|
3 - 39 yrs.
|
153
|
||||||||||||||||||||||||||
|
Fort Lauderdale
|
FL
|
Hampton
|
-
|
2,235
|
17,590
|
2,880
|
22,705
|
(5,810
|
)
|
2001
|
Dec-08
|
3 - 39 yrs.
|
109
|
||||||||||||||||||||||||||
|
Fort Lauderdale
|
FL
|
Hampton
|
-
|
1,793
|
21,357
|
4,405
|
27,555
|
(2,424
|
)
|
2002
|
Jun-15
|
3 - 39 yrs.
|
156
|
||||||||||||||||||||||||||
|
Fort Lauderdale
|
FL
|
Residence Inn
|
-
|
5,760
|
26,727
|
-
|
32,487
|
(1,227
|
)
|
2014
|
Sep-16
|
3 - 39 yrs.
|
156
|
||||||||||||||||||||||||||
|
Gainesville
|
FL
|
Hilton Garden Inn
|
-
|
1,300
|
17,322
|
109
|
18,731
|
(758
|
)
|
2007
|
Sep-16
|
3 - 39 yrs.
|
104
|
||||||||||||||||||||||||||
|
Gainesville
|
FL
|
Homewood Suites
|
-
|
1,740
|
16,329
|
51
|
18,120
|
(772
|
)
|
2005
|
Sep-16
|
3 - 39 yrs.
|
103
|
||||||||||||||||||||||||||
|
Jacksonville
|
FL
|
Homewood Suites
|
-
|
9,480
|
21,247
|
1,914
|
32,641
|
(3,749
|
)
|
2005
|
Mar-14
|
3 - 39 yrs.
|
119
|
||||||||||||||||||||||||||
|
Lakeland
|
FL
|
Courtyard
|
-
|
3,740
|
10,813
|
1,305
|
15,858
|
(1,653
|
)
|
2000
|
Mar-14
|
3 - 39 yrs.
|
78
|
||||||||||||||||||||||||||
|
Miami
|
FL
|
Courtyard
|
-
|
-
|
31,488
|
1,569
|
33,057
|
(4,004
|
)
|
2008
|
Mar-14
|
3 - 39 yrs.
|
118
|
||||||||||||||||||||||||||
|
Miami
|
FL
|
Hampton
|
-
|
1,972
|
9,987
|
2,711
|
14,670
|
(4,413
|
)
|
2000
|
Apr-10
|
3 - 39 yrs.
|
121
|
||||||||||||||||||||||||||
|
Miami
|
FL
|
Homewood Suites
|
15,022
|
18,820
|
25,375
|
3,435
|
47,630
|
(4,552
|
)
|
2000
|
Mar-14
|
3 - 39 yrs.
|
162
|
||||||||||||||||||||||||||
SCHEDULE III
Real Estate and Accumulated Depreciation - (continued)
As of December 31, 2017
(dollars in thousands)
|
Subsequently
Capitalized |
|||||||||||||||||||||||||||||||||||||||
|
Initial Cost
|
Bldg.
Imp. &
FF&E |
Total
Gross
Cost (2) |
|||||||||||||||||||||||||||||||||||||
|
City
|
State
|
Description
|
Encumbrances
|
Land (1)
|
Bldg./
FF&E /Other |
Acc.
Deprec. |
Date of
Construction |
Date
Acquired |
Depreciable
Life |
# of
Rooms |
|||||||||||||||||||||||||||||
|
Orlando
|
FL
|
Fairfield Inn & Suites
|
$ |
-
|
$ |
3,140
|
$ |
22,580
|
$ |
695
|
$ |
26,415
|
$ |
(6,619
|
)
|
2009
|
Jul-09
|
3 - 39 yrs.
|
200
|
||||||||||||||||||||
|
Orlando
|
FL
|
SpringHill Suites
|
-
|
3,141
|
25,779
|
2,286
|
31,206
|
(7,566
|
)
|
2009
|
Jul-09
|
3 - 39 yrs.
|
200
|
||||||||||||||||||||||||||
|
Panama City
|
FL
|
Hampton
|
-
|
1,605
|
9,995
|
984
|
12,584
|
(3,142
|
)
|
2009
|
Mar-09
|
3 - 39 yrs.
|
95
|
||||||||||||||||||||||||||
|
Panama City
|
FL
|
TownePlace Suites
|
-
|
908
|
9,549
|
254
|
10,711
|
(2,728
|
)
|
2010
|
Jan-10
|
3 - 39 yrs.
|
103
|
||||||||||||||||||||||||||
|
Pensacola
|
FL
|
TownePlace Suites
|
-
|
1,770
|
12,562
|
51
|
14,383
|
(567
|
)
|
2008
|
Sep-16
|
3 - 39 yrs.
|
97
|
||||||||||||||||||||||||||
|
Sanford
|
FL
|
SpringHill Suites
|
-
|
1,050
|
12,830
|
1,453
|
15,333
|
(2,327
|
)
|
2000
|
Mar-14
|
3 - 39 yrs.
|
105
|
||||||||||||||||||||||||||
|
Sarasota
|
FL
|
Homewood Suites
|
-
|
480
|
14,120
|
486
|
15,086
|
(2,279
|
)
|
2005
|
Mar-14
|
3 - 39 yrs.
|
100
|
||||||||||||||||||||||||||
|
Tallahassee
|
FL
|
Fairfield Inn & Suites
|
-
|
960
|
11,734
|
29
|
12,723
|
(493
|
)
|
2011
|
Sep-16
|
3 - 39 yrs.
|
97
|
||||||||||||||||||||||||||
|
Tallahassee
|
FL
|
Hilton Garden Inn
|
-
|
-
|
10,938
|
233
|
11,171
|
(1,560
|
)
|
2006
|
Mar-14
|
3 - 39 yrs.
|
85
|
||||||||||||||||||||||||||
|
Tampa
|
FL
|
Embassy Suites
|
-
|
1,824
|
20,034
|
2,980
|
24,838
|
(5,636
|
)
|
2007
|
Nov-10
|
3 - 39 yrs.
|
147
|
||||||||||||||||||||||||||
|
Tampa
|
FL
|
TownePlace Suites
|
-
|
1,430
|
9,015
|
371
|
10,816
|
(1,659
|
)
|
1999
|
Mar-14
|
3 - 39 yrs.
|
94
|
||||||||||||||||||||||||||
|
Albany
|
GA
|
Fairfield Inn & Suites
|
-
|
899
|
7,263
|
147
|
8,309
|
(2,137
|
)
|
2010
|
Jan-10
|
3 - 39 yrs.
|
87
|
||||||||||||||||||||||||||
|
Atlanta
|
GA
|
Home2 Suites
|
-
|
740
|
23,819
|
-
|
24,559
|
(1,228
|
)
|
2016
|
Jul-16
|
3 - 39 yrs.
|
128
|
||||||||||||||||||||||||||
|
Columbus
|
GA
|
SpringHill Suites
|
-
|
1,270
|
10,060
|
(4,700
|
)
|
(3)
|
6,630
|
(1,113
|
)
|
2008
|
Mar-14
|
3 - 39 yrs.
|
89
|
||||||||||||||||||||||||
|
Columbus (4)
|
GA
|
TownePlace Suites
|
-
|
-
|
7,467
|
(1,493
|
)
|
(3)
|
5,974
|
(1,174
|
)
|
2008
|
Mar-14
|
3 - 39 yrs.
|
86
|
||||||||||||||||||||||||
|
Macon
|
GA
|
Hilton Garden Inn
|
-
|
-
|
15,043
|
332
|
15,375
|
(2,051
|
)
|
2007
|
Mar-14
|
3 - 39 yrs.
|
101
|
||||||||||||||||||||||||||
|
Savannah
|
GA
|
Hilton Garden Inn
|
-
|
-
|
14,716
|
900
|
15,616
|
(1,819
|
)
|
2004
|
Mar-14
|
3 - 39 yrs.
|
105
|
||||||||||||||||||||||||||
|
Cedar Rapids
|
IA
|
Hampton
|
-
|
1,590
|
11,364
|
55
|
13,009
|
(594
|
)
|
2009
|
Sep-16
|
3 - 39 yrs.
|
103
|
||||||||||||||||||||||||||
|
Cedar Rapids
|
IA
|
Homewood Suites
|
-
|
1,770
|
13,116
|
18
|
14,904
|
(539
|
)
|
2010
|
Sep-16
|
3 - 39 yrs.
|
95
|
||||||||||||||||||||||||||
|
Davenport
|
IA
|
Hampton
|
-
|
400
|
16,915
|
65
|
17,380
|
(782
|
)
|
2007
|
Sep-16
|
3 - 39 yrs.
|
103
|
||||||||||||||||||||||||||
|
Boise
|
ID
|
Hampton
|
23,422
|
1,335
|
21,114
|
2,598
|
25,047
|
(6,503
|
)
|
2007
|
Apr-10
|
3 - 39 yrs.
|
186
|
||||||||||||||||||||||||||
|
Boise
|
ID
|
SpringHill Suites
|
-
|
2,120
|
24,112
|
3,966
|
30,198
|
(4,242
|
)
|
1992
|
Mar-14
|
3 - 39 yrs.
|
230
|
||||||||||||||||||||||||||
|
Des Plaines
|
IL
|
Hilton Garden Inn
|
-
|
10,000
|
38,186
|
315
|
48,501
|
(1,612
|
)
|
2005
|
Sep-16
|
3 - 39 yrs.
|
252
|
||||||||||||||||||||||||||
|
Hoffman Estates
|
IL
|
Hilton Garden Inn
|
-
|
1,770
|
14,373
|
357
|
16,500
|
(695
|
)
|
2000
|
Sep-16
|
3 - 39 yrs.
|
184
|
||||||||||||||||||||||||||
|
Mettawa
|
IL
|
Hilton Garden Inn
|
-
|
2,246
|
28,328
|
2,376
|
32,950
|
(6,790
|
)
|
2008
|
Nov-10
|
3 - 39 yrs.
|
170
|
||||||||||||||||||||||||||
|
Mettawa
|
IL
|
Residence Inn
|
-
|
1,722
|
21,843
|
1,578
|
25,143
|
(5,243
|
)
|
2008
|
Nov-10
|
3 - 39 yrs.
|
130
|
||||||||||||||||||||||||||
|
Rosemont
|
IL
|
Hampton
|
-
|
3,410
|
23,594
|
3
|
27,007
|
(1,144
|
)
|
2015
|
Sep-16
|
3 - 39 yrs.
|
158
|
||||||||||||||||||||||||||
|
Schaumburg
|
IL
|
Hilton Garden Inn
|
-
|
1,450
|
19,122
|
2,223
|
22,795
|
(5,235
|
)
|
2008
|
Nov-10
|
3 - 39 yrs.
|
166
|
||||||||||||||||||||||||||
|
Skokie
|
IL
|
Hampton
|
-
|
2,650
|
31,284
|
1,019
|
34,953
|
(1,345
|
)
|
2000
|
Sep-16
|
3 - 39 yrs.
|
225
|
||||||||||||||||||||||||||
|
Warrenville
|
IL
|
Hilton Garden Inn
|
-
|
1,171
|
20,894
|
2,144
|
24,209
|
(5,126
|
)
|
2008
|
Nov-10
|
3 - 39 yrs.
|
135
|
||||||||||||||||||||||||||
|
Indianapolis
|
IN
|
SpringHill Suites
|
-
|
1,310
|
11,542
|
1,787
|
14,639
|
(3,182
|
)
|
2007
|
Nov-10
|
3 - 39 yrs.
|
130
|
||||||||||||||||||||||||||
|
Merrillville
|
IN
|
Hilton Garden Inn
|
-
|
1,860
|
17,755
|
443
|
20,058
|
(810
|
)
|
2008
|
Sep-16
|
3 - 39 yrs.
|
124
|
||||||||||||||||||||||||||
|
Mishawaka
|
IN
|
Residence Inn
|
-
|
898
|
12,862
|
1,411
|
15,171
|
(3,234
|
)
|
2007
|
Nov-10
|
3 - 39 yrs.
|
106
|
||||||||||||||||||||||||||
|
South Bend
|
IN
|
Fairfield Inn & Suites
|
-
|
2,090
|
23,361
|
122
|
25,573
|
(924
|
)
|
2010
|
Sep-16
|
3 - 39 yrs.
|
119
|
||||||||||||||||||||||||||
|
Overland Park
|
KS
|
Fairfield Inn & Suites
|
-
|
1,230
|
11,713
|
102
|
13,045
|
(1,449
|
)
|
2008
|
Mar-14
|
3 - 39 yrs.
|
110
|
||||||||||||||||||||||||||
|
Overland Park
|
KS
|
Residence Inn
|
-
|
1,790
|
20,633
|
2,377
|
24,800
|
(3,497
|
)
|
2000
|
Mar-14
|
3 - 39 yrs.
|
120
|
||||||||||||||||||||||||||
|
Overland Park
|
KS
|
SpringHill Suites
|
-
|
1,060
|
8,263
|
353
|
9,676
|
(1,776
|
)
|
1998
|
Mar-14
|
3 - 39 yrs.
|
102
|
||||||||||||||||||||||||||
|
Wichita
|
KS
|
Courtyard
|
-
|
1,940
|
9,739
|
897
|
12,576
|
(1,990
|
)
|
2000
|
Mar-14
|
3 - 39 yrs.
|
90
|
||||||||||||||||||||||||||
|
Baton Rouge
|
LA
|
SpringHill Suites
|
-
|
1,280
|
13,870
|
(3,464
|
)
|
(3)
|
11,686
|
(3,713
|
)
|
2009
|
Sep-09
|
3 - 39 yrs.
|
119
|
||||||||||||||||||||||||
|
Lafayette
|
LA
|
Hilton Garden Inn
|
-
|
-
|
17,898
|
2,621
|
20,519
|
(5,689
|
)
|
2006
|
Jul-10
|
3 - 39 yrs.
|
153
|
||||||||||||||||||||||||||
|
Lafayette
|
LA
|
SpringHill Suites
|
-
|
709
|
9,400
|
97
|
10,206
|
(2,339
|
)
|
2011
|
Jun-11
|
3 - 39 yrs.
|
103
|
||||||||||||||||||||||||||
|
New Orleans
|
LA
|
Homewood Suites
|
24,919
|
4,150
|
52,258
|
4,083
|
60,491
|
(7,274
|
)
|
2002
|
Mar-14
|
3 - 39 yrs.
|
166
|
||||||||||||||||||||||||||
|
Andover
|
MA
|
SpringHill Suites
|
-
|
702
|
5,799
|
2,411
|
8,912
|
(2,768
|
)
|
2001
|
Nov-10
|
3 - 39 yrs.
|
136
|
||||||||||||||||||||||||||
|
Marlborough
|
MA
|
Residence Inn
|
-
|
3,480
|
17,341
|
1,612
|
22,433
|
(2,729
|
)
|
2006
|
Mar-14
|
3 - 39 yrs.
|
112
|
||||||||||||||||||||||||||
|
Westford
|
MA
|
Hampton
|
-
|
3,410
|
16,320
|
1,313
|
21,043
|
(2,349
|
)
|
2007
|
Mar-14
|
3 - 39 yrs.
|
110
|
||||||||||||||||||||||||||
|
Westford
|
MA
|
Residence Inn
|
9,386
|
1,760
|
20,791
|
360
|
22,911
|
(2,575
|
)
|
2001
|
Mar-14
|
3 - 39 yrs.
|
108
|
||||||||||||||||||||||||||
|
Annapolis
|
MD
|
Hilton Garden Inn
|
-
|
4,350
|
13,974
|
1,716
|
20,040
|
(2,285
|
)
|
2007
|
Mar-14
|
3 - 39 yrs.
|
126
|
||||||||||||||||||||||||||
|
Silver Spring
|
MD
|
Hilton Garden Inn
|
-
|
1,361
|
16,094
|
420
|
17,875
|
(4,156
|
)
|
2010
|
Jul-10
|
3 - 39 yrs.
|
107
|
||||||||||||||||||||||||||
|
Portland
|
ME
|
Residence Inn
|
-
|
4,440
|
51,534
|
71
|
56,045
|
(385
|
)
|
2009
|
Oct-17
|
3 - 39 yrs.
|
179
|
||||||||||||||||||||||||||
|
Novi
|
MI
|
Hilton Garden Inn
|
-
|
1,213
|
15,052
|
1,874
|
18,139
|
(4,161
|
)
|
2008
|
Nov-10
|
3 - 39 yrs.
|
148
|
||||||||||||||||||||||||||
|
Maple Grove
|
MN
|
Hilton Garden Inn
|
-
|
1,560
|
13,717
|
183
|
15,460
|
(635
|
)
|
2003
|
Sep-16
|
3 - 39 yrs.
|
120
|
||||||||||||||||||||||||||
|
Rochester
|
MN
|
Hampton
|
-
|
916
|
13,225
|
785
|
14,926
|
(4,099
|
)
|
2009
|
Aug-09
|
3 - 39 yrs.
|
124
|
||||||||||||||||||||||||||
|
Kansas City
|
MO
|
Hampton
|
-
|
727
|
9,363
|
1,143
|
11,233
|
(2,812
|
)
|
1999
|
Aug-10
|
3 - 39 yrs.
|
122
|
||||||||||||||||||||||||||
|
Kansas City
|
MO
|
Residence Inn
|
-
|
2,000
|
20,818
|
1,832
|
24,650
|
(2,636
|
)
|
2002
|
Mar-14
|
3 - 39 yrs.
|
106
|
||||||||||||||||||||||||||
|
St. Louis
|
MO
|
Hampton
|
-
|
1,758
|
20,954
|
5,992
|
28,704
|
(6,507
|
)
|
2003
|
Aug-10
|
3 - 39 yrs.
|
190
|
||||||||||||||||||||||||||
|
St. Louis
|
MO
|
Hampton
|
-
|
758
|
15,287
|
1,934
|
17,979
|
(4,518
|
)
|
2006
|
Apr-10
|
3 - 39 yrs.
|
126
|
||||||||||||||||||||||||||
|
Hattiesburg
|
MS
|
Courtyard
|
5,212
|
1,390
|
11,324
|
1,113
|
13,827
|
(1,492
|
)
|
2006
|
Mar-14
|
3 - 39 yrs.
|
84
|
||||||||||||||||||||||||||
|
Hattiesburg
|
MS
|
Residence Inn
|
-
|
906
|
9,151
|
956
|
11,013
|
(3,010
|
)
|
2008
|
Dec-08
|
3 - 39 yrs.
|
84
|
||||||||||||||||||||||||||
|
Carolina Beach
|
NC
|
Courtyard
|
-
|
7,490
|
31,588
|
2,445
|
41,523
|
(3,802
|
)
|
2003
|
Mar-14
|
3 - 39 yrs.
|
144
|
||||||||||||||||||||||||||
|
Charlotte
|
NC
|
Fairfield Inn & Suites
|
-
|
1,030
|
11,111
|
83
|
12,224
|
(476
|
)
|
2010
|
Sep-16
|
3 - 39 yrs.
|
94
|
||||||||||||||||||||||||||
|
Charlotte
|
NC
|
Homewood Suites
|
-
|
1,031
|
4,937
|
6,435
|
12,403
|
(5,712
|
)
|
1990
|
Sep-08
|
3 - 39 yrs.
|
118
|
||||||||||||||||||||||||||
|
Durham
|
NC
|
Homewood Suites
|
-
|
1,232
|
18,343
|
4,763
|
24,338
|
(7,331
|
)
|
1999
|
Dec-08
|
3 - 39 yrs.
|
122
|
||||||||||||||||||||||||||
|
Fayetteville
|
NC
|
Home2 Suites
|
-
|
746
|
10,563
|
44
|
11,353
|
(2,933
|
)
|
2011
|
Feb-11
|
3 - 39 yrs.
|
118
|
||||||||||||||||||||||||||
|
Fayetteville
|
NC
|
Residence Inn
|
-
|
3,530
|
19,799
|
198
|
23,527
|
(2,786
|
)
|
2006
|
Mar-14
|
3 - 39 yrs.
|
92
|
||||||||||||||||||||||||||
|
Greensboro
|
NC
|
SpringHill Suites
|
-
|
1,850
|
10,157
|
344
|
12,351
|
(1,522
|
)
|
2004
|
Mar-14
|
3 - 39 yrs.
|
82
|
||||||||||||||||||||||||||
|
Holly Springs
|
NC
|
Hampton
|
-
|
1,620
|
13,260
|
208
|
15,088
|
(3,605
|
)
|
2010
|
Nov-10
|
3 - 39 yrs.
|
124
|
||||||||||||||||||||||||||
|
Jacksonville
|
NC
|
Home2 Suites
|
-
|
910
|
12,527
|
44
|
13,481
|
(565
|
)
|
2012
|
Sep-16
|
3 - 39 yrs.
|
105
|
||||||||||||||||||||||||||
|
Wilmington
|
NC
|
Fairfield Inn & Suites
|
-
|
1,310
|
13,034
|
694
|
15,038
|
(1,640
|
)
|
2008
|
Mar-14
|
3 - 39 yrs.
|
122
|
||||||||||||||||||||||||||
|
Winston-Salem
|
NC
|
Courtyard
|
-
|
3,860
|
11,585
|
175
|
15,620
|
(1,917
|
)
|
1998
|
Mar-14
|
3 - 39 yrs.
|
122
|
||||||||||||||||||||||||||
|
Winston-Salem
|
NC
|
Hampton
|
-
|
2,170
|
14,268
|
7
|
16,445
|
(552
|
)
|
2010
|
Sep-16
|
3 - 39 yrs.
|
94
|
||||||||||||||||||||||||||
|
Omaha
|
NE
|
Courtyard
|
-
|
6,700
|
36,829
|
3,159
|
46,688
|
(4,449
|
)
|
1999
|
Mar-14
|
3 - 39 yrs.
|
181
|
||||||||||||||||||||||||||
|
Omaha
|
NE
|
Hampton
|
-
|
1,710
|
22,636
|
88
|
24,434
|
(1,013
|
)
|
2007
|
Sep-16
|
3 - 39 yrs.
|
139
|
||||||||||||||||||||||||||
|
Omaha
|
NE
|
Hilton Garden Inn
|
22,145
|
1,620
|
35,962
|
186
|
37,768
|
(1,538
|
)
|
2001
|
Sep-16
|
3 - 39 yrs.
|
178
|
||||||||||||||||||||||||||
|
Omaha
|
NE
|
Homewood Suites
|
-
|
1,890
|
22,014
|
21
|
23,925
|
(1,068
|
)
|
2008
|
Sep-16
|
3 - 39 yrs.
|
123
|
||||||||||||||||||||||||||
|
Cranford
|
NJ
|
Homewood Suites
|
-
|
4,550
|
23,828
|
3,631
|
32,009
|
(3,951
|
)
|
2000
|
Mar-14
|
3 - 39 yrs.
|
108
|
||||||||||||||||||||||||||
SCHEDULE III
Real Estate and Accumulated Depreciation - (continued)
As of December 31, 2017
(dollars in thousands)
|
Subsequently
Capitalized |
|||||||||||||||||||||||||||||||||||||||
|
Initial Cost
|
Bldg.
Imp. &
FF&E |
Total
Gross
Cost (2) |
|||||||||||||||||||||||||||||||||||||
|
City
|
State
|
Description
|
Encumbrances
|
Land (1)
|
Bldg./
FF&E /Other |
Acc.
Deprec. |
Date of
Construction |
Date
Acquired |
Depreciable
Life |
# of
Rooms |
|||||||||||||||||||||||||||||
|
Mahwah
|
NJ
|
Homewood Suites
|
$ |
-
|
$ |
3,220
|
$ |
22,742
|
$ |
3,981
|
$ |
29,943
|
$ |
(3,543
|
)
|
2001
|
Mar-14
|
3 - 39 yrs.
|
110
|
||||||||||||||||||||
|
Mount Laurel
|
NJ
|
Homewood Suites
|
-
|
1,589
|
13,476
|
2,063
|
17,128
|
(4,084
|
)
|
2006
|
Jan-11
|
3 - 39 yrs.
|
118
|
||||||||||||||||||||||||||
|
Somerset
|
NJ
|
Courtyard
|
7,932
|
-
|
27,133
|
2,351
|
29,484
|
(4,742
|
)
|
2002
|
Mar-14
|
3 - 25 yrs.
|
162
|
||||||||||||||||||||||||||
|
West Orange
|
NJ
|
Courtyard
|
-
|
2,054
|
19,513
|
2,294
|
23,861
|
(5,063
|
)
|
2005
|
Jan-11
|
3 - 39 yrs.
|
131
|
||||||||||||||||||||||||||
|
Islip/Ronkonkoma
|
NY
|
Hilton Garden Inn
|
-
|
6,510
|
28,718
|
837
|
36,065
|
(3,740
|
)
|
2003
|
Mar-14
|
3 - 39 yrs.
|
165
|
||||||||||||||||||||||||||
|
New York
|
NY
|
Renaissance
|
-
|
-
|
102,832
|
(74,659
|
)
|
(3)
|
28,173
|
(11,824
|
)
|
1916
|
Mar-14
|
3 - 32 yrs.
|
205
|
||||||||||||||||||||||||
|
Syracuse
|
NY
|
Courtyard
|
10,637
|
812
|
23,278
|
27
|
24,117
|
(1,694
|
)
|
2013
|
Oct-15
|
3 - 39 yrs.
|
102
|
||||||||||||||||||||||||||
|
Syracuse
|
NY
|
Residence Inn
|
10,637
|
621
|
17,589
|
29
|
18,239
|
(1,333
|
)
|
2013
|
Oct-15
|
3 - 39 yrs.
|
78
|
||||||||||||||||||||||||||
|
Mason
|
OH
|
Hilton Garden Inn
|
-
|
1,120
|
16,770
|
1,027
|
18,917
|
(835
|
)
|
2010
|
Sep-16
|
3 - 39 yrs.
|
110
|
||||||||||||||||||||||||||
|
Twinsburg
|
OH
|
Hilton Garden Inn
|
-
|
1,419
|
16,614
|
3,165
|
21,198
|
(6,632
|
)
|
1999
|
Oct-08
|
3 - 39 yrs.
|
142
|
||||||||||||||||||||||||||
|
Oklahoma City
|
OK
|
Hampton
|
-
|
1,430
|
31,327
|
1,395
|
34,152
|
(7,798
|
)
|
2009
|
May-10
|
3 - 39 yrs.
|
200
|
||||||||||||||||||||||||||
|
Oklahoma City
|
OK
|
Hilton Garden Inn
|
-
|
1,270
|
32,700
|
15
|
33,985
|
(1,406
|
)
|
2014
|
Sep-16
|
3 - 39 yrs.
|
155
|
||||||||||||||||||||||||||
|
Oklahoma City
|
OK
|
Homewood Suites
|
-
|
760
|
20,056
|
7
|
20,823
|
(900
|
)
|
2014
|
Sep-16
|
3 - 39 yrs.
|
100
|
||||||||||||||||||||||||||
|
Oklahoma City (West)
|
OK
|
Homewood Suites
|
-
|
1,280
|
13,340
|
35
|
14,655
|
(737
|
)
|
2008
|
Sep-16
|
3 - 39 yrs.
|
90
|
||||||||||||||||||||||||||
|
Collegeville/Philadelphia
|
PA
|
Courtyard
|
11,152
|
2,115
|
17,953
|
2,341
|
22,409
|
(5,014
|
)
|
2005
|
Nov-10
|
3 - 39 yrs.
|
132
|
||||||||||||||||||||||||||
|
Malvern/Philadelphia
|
PA
|
Courtyard
|
-
|
996
|
20,374
|
1,869
|
23,239
|
(5,202
|
)
|
2007
|
Nov-10
|
3 - 39 yrs.
|
127
|
||||||||||||||||||||||||||
|
Pittsburgh
|
PA
|
Hampton
|
-
|
2,503
|
18,537
|
4,474
|
25,514
|
(6,445
|
)
|
1991
|
Dec-08
|
3 - 39 yrs.
|
132
|
||||||||||||||||||||||||||
|
Charleston
|
SC
|
Home2 Suites
|
-
|
3,250
|
16,778
|
93
|
20,121
|
(711
|
)
|
2011
|
Sep-16
|
3 - 39 yrs.
|
122
|
||||||||||||||||||||||||||
|
Columbia
|
SC
|
Hilton Garden Inn
|
-
|
3,540
|
16,399
|
346
|
20,285
|
(2,603
|
)
|
2006
|
Mar-14
|
3 - 39 yrs.
|
143
|
||||||||||||||||||||||||||
|
Columbia
|
SC
|
TownePlace Suites
|
-
|
1,330
|
10,839
|
933
|
13,102
|
(550
|
)
|
2009
|
Sep-16
|
3 - 39 yrs.
|
91
|
||||||||||||||||||||||||||
|
Greenville
|
SC
|
Residence Inn
|
-
|
900
|
9,778
|
305
|
10,983
|
(1,553
|
)
|
1998
|
Mar-14
|
3 - 39 yrs.
|
78
|
||||||||||||||||||||||||||
|
Hilton Head
|
SC
|
Hilton Garden Inn
|
-
|
3,600
|
11,386
|
1,163
|
16,149
|
(1,521
|
)
|
2001
|
Mar-14
|
3 - 39 yrs.
|
104
|
||||||||||||||||||||||||||
|
Chattanooga
|
TN
|
Homewood Suites
|
-
|
1,410
|
9,361
|
2,617
|
13,388
|
(1,866
|
)
|
1997
|
Mar-14
|
3 - 39 yrs.
|
76
|
||||||||||||||||||||||||||
|
Franklin
|
TN
|
Courtyard
|
14,368
|
2,510
|
31,341
|
20
|
33,871
|
(1,318
|
)
|
2008
|
Sep-16
|
3 - 39 yrs.
|
126
|
||||||||||||||||||||||||||
|
Franklin
|
TN
|
Residence Inn
|
14,368
|
2,970
|
29,208
|
1,253
|
33,431
|
(1,331
|
)
|
2009
|
Sep-16
|
3 - 39 yrs.
|
124
|
||||||||||||||||||||||||||
|
Jackson
|
TN
|
Hampton
|
-
|
692
|
12,281
|
770
|
13,743
|
(3,678
|
)
|
2007
|
Dec-08
|
3 - 39 yrs.
|
83
|
||||||||||||||||||||||||||
|
Johnson City
|
TN
|
Courtyard
|
-
|
1,105
|
8,632
|
193
|
9,930
|
(2,662
|
)
|
2009
|
Sep-09
|
3 - 39 yrs.
|
90
|
||||||||||||||||||||||||||
|
Knoxville
|
TN
|
Homewood Suites
|
-
|
2,160
|
14,704
|
57
|
16,921
|
(715
|
)
|
2005
|
Sep-16
|
3 - 39 yrs.
|
103
|
||||||||||||||||||||||||||
|
Knoxville
|
TN
|
SpringHill Suites
|
-
|
1,840
|
12,441
|
68
|
14,349
|
(594
|
)
|
2006
|
Sep-16
|
3 - 39 yrs.
|
103
|
||||||||||||||||||||||||||
|
Knoxville
|
TN
|
TownePlace Suites
|
-
|
1,190
|
7,920
|
1,323
|
10,433
|
(506
|
)
|
2003
|
Sep-16
|
3 - 39 yrs.
|
97
|
||||||||||||||||||||||||||
|
Memphis
|
TN
|
Homewood Suites
|
-
|
1,930
|
13,028
|
2,989
|
17,947
|
(2,947
|
)
|
1989
|
Mar-14
|
3 - 39 yrs.
|
140
|
||||||||||||||||||||||||||
|
Nashville
|
TN
|
Hilton Garden Inn
|
-
|
2,754
|
39,997
|
3,823
|
46,574
|
(9,917
|
)
|
2009
|
Sep-10
|
3 - 39 yrs.
|
194
|
||||||||||||||||||||||||||
|
Nashville
|
TN
|
Home2 Suites
|
-
|
1,153
|
15,206
|
170
|
16,529
|
(3,181
|
)
|
2012
|
May-12
|
3 - 39 yrs.
|
119
|
||||||||||||||||||||||||||
|
Nashville
|
TN
|
TownePlace Suites
|
-
|
7,390
|
13,929
|
16
|
21,335
|
(590
|
)
|
2012
|
Sep-16
|
3 - 39 yrs.
|
101
|
||||||||||||||||||||||||||
|
Addison
|
TX
|
SpringHill Suites
|
-
|
1,210
|
19,700
|
368
|
21,278
|
(2,941
|
)
|
2003
|
Mar-14
|
3 - 39 yrs.
|
159
|
||||||||||||||||||||||||||
|
Allen
|
TX
|
Hampton
|
-
|
1,442
|
11,456
|
1,581
|
14,479
|
(4,626
|
)
|
2006
|
Sep-08
|
3 - 39 yrs.
|
103
|
||||||||||||||||||||||||||
|
Allen
|
TX
|
Hilton Garden Inn
|
-
|
2,130
|
16,731
|
3,934
|
22,795
|
(7,464
|
)
|
2002
|
Oct-08
|
3 - 39 yrs.
|
150
|
||||||||||||||||||||||||||
|
Arlington
|
TX
|
Hampton
|
-
|
1,217
|
8,738
|
979
|
10,934
|
(2,440
|
)
|
2007
|
Dec-10
|
3 - 39 yrs.
|
98
|
||||||||||||||||||||||||||
|
Austin
|
TX
|
Courtyard
|
-
|
1,579
|
18,487
|
385
|
20,451
|
(4,513
|
)
|
2009
|
Nov-10
|
3 - 39 yrs.
|
145
|
||||||||||||||||||||||||||
|
Austin
|
TX
|
Fairfield Inn & Suites
|
-
|
1,306
|
16,504
|
248
|
18,058
|
(4,005
|
)
|
2009
|
Nov-10
|
3 - 39 yrs.
|
150
|
||||||||||||||||||||||||||
|
Austin
|
TX
|
Hampton
|
-
|
1,459
|
17,184
|
2,188
|
20,831
|
(5,946
|
)
|
1996
|
Apr-09
|
3 - 39 yrs.
|
124
|
||||||||||||||||||||||||||
|
Austin
|
TX
|
Hilton Garden Inn
|
-
|
1,614
|
14,451
|
1,729
|
17,794
|
(3,964
|
)
|
2008
|
Nov-10
|
3 - 39 yrs.
|
117
|
||||||||||||||||||||||||||
|
Austin
|
TX
|
Homewood Suites
|
-
|
1,898
|
16,462
|
2,748
|
21,108
|
(6,068
|
)
|
1997
|
Apr-09
|
3 - 39 yrs.
|
97
|
||||||||||||||||||||||||||
|
Austin/Round Rock
|
TX
|
Homewood Suites
|
-
|
2,180
|
25,644
|
40
|
27,864
|
(1,011
|
)
|
2010
|
Sep-16
|
3 - 39 yrs.
|
115
|
||||||||||||||||||||||||||
|
Beaumont
|
TX
|
Residence Inn
|
-
|
1,177
|
16,180
|
1,449
|
18,806
|
(5,492
|
)
|
2008
|
Oct-08
|
3 - 39 yrs.
|
133
|
||||||||||||||||||||||||||
|
Burleson/Fort Worth
|
TX
|
Hampton
|
-
|
557
|
6,601
|
1,297
|
8,455
|
(1,068
|
)
|
2008
|
Oct-14
|
3 - 39 yrs.
|
88
|
||||||||||||||||||||||||||
|
Dallas
|
TX
|
Homewood Suites
|
-
|
4,920
|
29,427
|
35
|
34,382
|
(1,275
|
)
|
2013
|
Sep-16
|
3 - 39 yrs.
|
130
|
||||||||||||||||||||||||||
|
Denton
|
TX
|
Homewood Suites
|
-
|
990
|
14,895
|
117
|
16,002
|
(793
|
)
|
2009
|
Sep-16
|
3 - 39 yrs.
|
107
|
||||||||||||||||||||||||||
|
Duncanville
|
TX
|
Hilton Garden Inn
|
-
|
2,378
|
15,935
|
2,836
|
21,149
|
(6,983
|
)
|
2005
|
Oct-08
|
3 - 39 yrs.
|
142
|
||||||||||||||||||||||||||
|
El Paso
|
TX
|
Hilton Garden Inn
|
-
|
1,244
|
18,300
|
146
|
19,690
|
(4,159
|
)
|
2011
|
Dec-11
|
3 - 39 yrs.
|
145
|
||||||||||||||||||||||||||
|
El Paso
|
TX
|
Homewood Suites
|
-
|
2,800
|
16,657
|
1,719
|
21,176
|
(2,245
|
)
|
2008
|
Mar-14
|
3 - 39 yrs.
|
114
|
||||||||||||||||||||||||||
|
Fort Worth
|
TX
|
Courtyard
|
-
|
2,313
|
15,825
|
92
|
18,230
|
(568
|
)
|
2017
|
Feb-17
|
3 - 39 yrs.
|
124
|
||||||||||||||||||||||||||
|
Fort Worth
|
TX
|
TownePlace Suites
|
-
|
2,104
|
16,311
|
235
|
18,650
|
(4,124
|
)
|
2010
|
Jul-10
|
3 - 39 yrs.
|
140
|
||||||||||||||||||||||||||
|
Frisco
|
TX
|
Hilton Garden Inn
|
-
|
2,507
|
12,981
|
1,454
|
16,942
|
(4,260
|
)
|
2008
|
Dec-08
|
3 - 39 yrs.
|
102
|
||||||||||||||||||||||||||
|
Grapevine
|
TX
|
Hilton Garden Inn
|
10,412
|
1,522
|
15,543
|
280
|
17,345
|
(4,004
|
)
|
2009
|
Sep-10
|
3 - 39 yrs.
|
110
|
||||||||||||||||||||||||||
|
Houston
|
TX
|
Courtyard
|
-
|
2,080
|
21,836
|
-
|
23,916
|
(1,003
|
)
|
2012
|
Sep-16
|
3 - 39 yrs.
|
124
|
||||||||||||||||||||||||||
|
Houston
|
TX
|
Marriott
|
-
|
4,143
|
46,623
|
311
|
51,077
|
(12,428
|
)
|
2010
|
Jan-10
|
3 - 39 yrs.
|
206
|
||||||||||||||||||||||||||
|
Houston
|
TX
|
Residence Inn
|
-
|
12,070
|
19,769
|
359
|
32,198
|
(3,214
|
)
|
2006
|
Mar-14
|
3 - 39 yrs.
|
129
|
||||||||||||||||||||||||||
|
Houston
|
TX
|
Residence Inn
|
-
|
2,070
|
11,186
|
17
|
13,273
|
(578
|
)
|
2012
|
Sep-16
|
3 - 39 yrs.
|
120
|
||||||||||||||||||||||||||
|
Irving
|
TX
|
Homewood Suites
|
-
|
705
|
9,610
|
1,391
|
11,706
|
(3,046
|
)
|
2006
|
Dec-10
|
3 - 39 yrs.
|
77
|
||||||||||||||||||||||||||
|
Lewisville
|
TX
|
Hilton Garden Inn
|
-
|
3,361
|
23,919
|
2,240
|
29,520
|
(8,833
|
)
|
2007
|
Oct-08
|
3 - 39 yrs.
|
165
|
||||||||||||||||||||||||||
|
Round Rock
|
TX
|
Hampton
|
-
|
865
|
10,999
|
1,539
|
13,403
|
(3,991
|
)
|
2001
|
Mar-09
|
3 - 39 yrs.
|
94
|
||||||||||||||||||||||||||
|
San Antonio
|
TX
|
TownePlace Suites
|
-
|
2,220
|
9,610
|
1,067
|
12,897
|
(1,597
|
)
|
2007
|
Mar-14
|
3 - 39 yrs.
|
106
|
||||||||||||||||||||||||||
|
Shenandoah
|
TX
|
Courtyard
|
-
|
3,350
|
17,256
|
-
|
20,606
|
(811
|
)
|
2014
|
Sep-16
|
3 - 39 yrs.
|
124
|
||||||||||||||||||||||||||
|
Stafford
|
TX
|
Homewood Suites
|
-
|
1,880
|
10,969
|
247
|
13,096
|
(1,922
|
)
|
2006
|
Mar-14
|
3 - 39 yrs.
|
78
|
||||||||||||||||||||||||||
|
Texarkana
|
TX
|
Courtyard
|
-
|
590
|
7,208
|
639
|
8,437
|
(1,153
|
)
|
2003
|
Mar-14
|
3 - 39 yrs.
|
90
|
||||||||||||||||||||||||||
|
Texarkana
|
TX
|
Hampton
|
-
|
636
|
8,723
|
1,144
|
10,503
|
(2,547
|
)
|
2004
|
Jan-11
|
3 - 39 yrs.
|
81
|
||||||||||||||||||||||||||
|
Texarkana
|
TX
|
TownePlace Suites
|
-
|
430
|
6,571
|
(2,198
|
)
|
(3)
|
4,803
|
(842
|
)
|
2006
|
Mar-14
|
3 - 39 yrs.
|
85
|
||||||||||||||||||||||||
|
Provo
|
UT
|
Residence Inn
|
-
|
1,150
|
18,277
|
2,127
|
21,554
|
(2,757
|
)
|
1996
|
Mar-14
|
3 - 39 yrs.
|
114
|
||||||||||||||||||||||||||
|
Salt Lake City
|
UT
|
Residence Inn
|
-
|
1,515
|
24,214
|
-
|
25,729
|
(196
|
)
|
2014
|
Oct-17
|
3 - 39 yrs.
|
136
|
||||||||||||||||||||||||||
|
Salt Lake City
|
UT
|
SpringHill Suites
|
-
|
1,092
|
16,465
|
1,169
|
18,726
|
(3,997
|
)
|
2009
|
Nov-10
|
3 - 39 yrs.
|
143
|
||||||||||||||||||||||||||
|
Alexandria
|
VA
|
Courtyard
|
-
|
6,860
|
19,681
|
3,559
|
30,100
|
(3,477
|
)
|
1987
|
Mar-14
|
3 - 39 yrs.
|
178
|
||||||||||||||||||||||||||
|
Alexandria
|
VA
|
SpringHill Suites
|
-
|
5,968
|
-
|
18,991
|
24,959
|
(5,243
|
)
|
2011
|
Mar-09
|
3 - 39 yrs.
|
155
|
||||||||||||||||||||||||||
|
Bristol
|
VA
|
Courtyard
|
-
|
1,723
|
19,162
|
1,846
|
22,731
|
(6,824
|
)
|
2004
|
Nov-08
|
3 - 39 yrs.
|
175
|
||||||||||||||||||||||||||
|
Charlottesville
|
VA
|
Courtyard
|
-
|
21,130
|
27,737
|
389
|
49,256
|
(3,733
|
)
|
2000
|
Mar-14
|
3 - 39 yrs.
|
139
|
||||||||||||||||||||||||||
SCHEDULE III
Real Estate and Accumulated Depreciation - (continued)
As of December 31, 2017
(dollars in thousands)
|
Subsequently
Capitalized |
|||||||||||||||||||||||||||||||||||||||
|
Initial Cost
|
Bldg.
Imp. &
FF&E |
Total
Gross
Cost (2) |
|||||||||||||||||||||||||||||||||||||
|
City
|
State
|
Description
|
Encumbrances
|
Land (1)
|
Bldg./
FF&E /Other |
Acc.
Deprec. |
Date of
Construction |
Date
Acquired |
Depreciable
Life |
# of
Rooms |
|||||||||||||||||||||||||||||
|
Harrisonburg
|
VA
|
Courtyard
|
$ |
-
|
$ |
2,480
|
$ |
12,757
|
$ |
383
|
$ |
15,620
|
$ |
(1,808
|
)
|
1999
|
Mar-14
|
3 - 39 yrs.
|
125
|
||||||||||||||||||||
|
Manassas
|
VA
|
Residence Inn
|
-
|
1,395
|
14,962
|
1,661
|
- |
18,018
|
(3,900
|
)
|
2006
|
Feb-11
|
3 - 39 yrs.
|
107
|
|||||||||||||||||||||||||
|
Richmond
|
VA
|
Courtyard
|
-
|
2,003
|
-
|
22,972
|
24,975
|
(2,725
|
)
|
2014
|
Jul-12
|
3 - 39 yrs.
|
135
|
||||||||||||||||||||||||||
|
Richmond
|
VA
|
Marriott
|
-
|
-
|
83,698
|
5,731
|
89,429
|
(12,254
|
)
|
1984
|
Mar-14
|
3 - 39 yrs.
|
410
|
||||||||||||||||||||||||||
|
Richmond
|
VA
|
Residence Inn
|
-
|
1,113
|
-
|
12,717
|
13,830
|
(1,511
|
)
|
2014
|
Jul-12
|
3 - 39 yrs.
|
75
|
||||||||||||||||||||||||||
|
Richmond
|
VA
|
SpringHill Suites
|
-
|
1,930
|
10,726
|
54
|
12,710
|
(589
|
)
|
2008
|
Sep-16
|
3 - 39 yrs.
|
103
|
||||||||||||||||||||||||||
|
Suffolk
|
VA
|
Courtyard
|
-
|
940
|
5,186
|
1,247
|
7,373
|
(1,105
|
)
|
2007
|
Mar-14
|
3 - 39 yrs.
|
92
|
||||||||||||||||||||||||||
|
Suffolk
|
VA
|
TownePlace Suites
|
-
|
710
|
5,241
|
634
|
6,585
|
(937
|
)
|
2007
|
Mar-14
|
3 - 39 yrs.
|
72
|
||||||||||||||||||||||||||
|
Virginia Beach
|
VA
|
Courtyard
|
-
|
10,580
|
29,140
|
1,782
|
41,502
|
(3,579
|
)
|
1999
|
Mar-14
|
3 - 39 yrs.
|
141
|
||||||||||||||||||||||||||
|
Virginia Beach
|
VA
|
Courtyard
|
-
|
12,000
|
40,556
|
3,602
|
56,158
|
(5,086
|
)
|
2002
|
Mar-14
|
3 - 39 yrs.
|
160
|
||||||||||||||||||||||||||
|
Kirkland
|
WA
|
Courtyard
|
11,042
|
18,950
|
25,028
|
271
|
44,249
|
(3,691
|
)
|
2006
|
Mar-14
|
3 - 39 yrs.
|
150
|
||||||||||||||||||||||||||
|
Seattle
|
WA
|
Residence Inn
|
25,687
|
-
|
92,786
|
4,593
|
97,379
|
(13,353
|
)
|
1991
|
Mar-14
|
3 - 35 yrs.
|
234
|
||||||||||||||||||||||||||
|
Tukwila
|
WA
|
Homewood Suites
|
8,549
|
8,130
|
16,659
|
4,410
|
29,199
|
(2,939
|
)
|
1992
|
Mar-14
|
3 - 39 yrs.
|
106
|
||||||||||||||||||||||||||
|
Vancouver
|
WA
|
SpringHill Suites
|
-
|
3,010
|
16,162
|
1,473
|
20,645
|
(2,438
|
)
|
2007
|
Mar-14
|
3 - 39 yrs.
|
119
|
||||||||||||||||||||||||||
|
Richmond
|
VA
|
Corporate Office
|
-
|
682
|
3,723
|
561
|
4,966
|
(1,375
|
)
|
1893
|
May-13
|
3 - 39 yrs.
|
N/A
|
||||||||||||||||||||||||||
|
$
|
457,435
|
$
|
720,465
|
$
|
4,552,869
|
$
|
251,109
|
$
|
5,524,443
|
$
|
(731,284
|
)
|
30,322
|
||||||||||||||||||||||||||
|
Real estate owned:
|
2017
|
2016
|
2015
|
|||||||||
|
Balance as of January 1
|
$
|
5,381,086
|
$
|
4,064,824
|
$
|
3,789,380
|
||||||
|
Acquisitions
|
162,734
|
1,319,986
|
255,636
|
|||||||||
|
Improvements and Development Costs
|
69,081
|
63,364
|
59,565
|
|||||||||
|
Dispositions
|
(42,583
|
)
|
(11,951
|
)
|
(2,238
|
)
|
||||||
|
Assets Held for Sale (4)
|
-
|
(49,666
|
)
|
7,481
|
||||||||
|
Impairment of Depreciable Assets
|
(45,875
|
)
|
(5,471
|
)
|
(45,000
|
)
|
||||||
|
Balance at December 31
|
$
|
5,524,443
|
$
|
5,381,086
|
$
|
4,064,824
|
||||||
|
Accumulated depreciation:
|
2017 | 2016 | 2015 | |||||||||
|
Balance as of January 1
|
$
|
(557,597
|
)
|
$
|
(423,057
|
)
|
$
|
(296,559
|
)
|
|||
|
Depreciation Expense
|
(175,581
|
)
|
(147,244
|
)
|
(126,530
|
)
|
||||||
|
Accumulated Depreciation on Dispositions
|
1,894
|
2,038
|
257
|
|||||||||
|
Assets Held for Sale (4)
|
-
|
10,666
|
(225
|
)
|
||||||||
|
Balance at December 31
|
$
|
(731,284
|
)
|
$
|
(557,597
|
)
|
$
|
(423,057
|
)
|
|||
|
(1)
|
Land is owned fee simple unless cost is $0, which means the property is subject to a ground lease.
|
|
(2)
|
The aggregate cost for federal income tax purposes is approximately $5.2 billion at December 31, 2017 (unaudited).
|
|
(3)
|
Amount includes a reduction in cost due to recognition of an impairment loss.
|
|
(4)
|
As of December 31, 2016, the Company had one hotel classified as held for sale, which was not included in this schedule, and was sold during 2017. As of December 31, 2014, the Company had 19 hotels classified as held for sale which were not included in this schedule, of which 18 of the hotels were sold and the remaining hotel (Columbus, Georgia TownePlace Suites) was reclassified as held and used during 2015.
|
Pursuant to the requirements of Section 13 or 15(d) of the Securities Exchange Act of 1934, the registrant has duly caused this report to be signed on its behalf by the undersigned, thereunto duly authorized.
|
Apple Hospitality REIT, Inc.
|
|
|
||
|
By:
|
/s/ Justin G. Knight
|
|
|
Date: February 22, 2018
|
|
|
Justin G. Knight,
President and Chief Executive Officer
(Principal Executive Officer)
|
|
|
|
|
|
|
|
|
|
|
By:
|
/s/ Bryan Peery
|
|
|
Date: February 22, 2018
|
|
|
Bryan Peery,
Chief Financial Officer
(Principal Financial and Principal Accounting Officer)
|
|
|
|
Pursuant to the requirements of the Securities Exchange Act of 1934, this report has been signed below by the following persons on behalf of the registrant and in the capacities and on the date indicated.
|
By:
|
/s/ Glade M. Knight
|
Date: February 22, 2018
|
|
|
Glade M. Knight, Executive Chairman and Director
|
|||
|
By:
|
/s/ Justin G. Knight
|
Date: February 22, 2018
|
|
|
|
Justin G. Knight,
President and Chief Executive Officer and Director
(Principal Executive Officer)
|
|
|
|
By:
|
/s/ Bryan Peery
|
Date: February 22, 2018
|
|
|
Bryan Peery,
Chief Financial Officer
(Principal Financial and Principal Accounting Officer)
|
|||
|
By:
|
/s/ Glenn W. Bunting, Jr.
|
Date: February 22, 2018
|
|
|
|
Glenn W. Bunting, Jr., Director
|
|
|
|
By:
|
/s/ Jon A. Fosheim
|
Date: February 22, 2018
|
|
|
Jon A. Fosheim, Director
|
|||
|
By:
|
/s/ Bruce H. Matson
|
Date: February 22, 2018
|
|
|
Bruce H. Matson, Director
|
|||
|
By:
|
/s/ Daryl A. Nickel
|
Date: February 22, 2018
|
|
|
Daryl A. Nickel, Director
|
|||
|
By:
|
/s/ L. Hugh Redd
|
Date: February 22, 2018
|
|
|
|
L. Hugh Redd, Director
|
|
|