Attached files
| file | filename |
|---|---|
| 8-K - 8-K - REGIONS FINANCIAL CORP | rf2018-02x23ir.htm |

Investor Deck
February - March, 2018
Exhibit 99.1
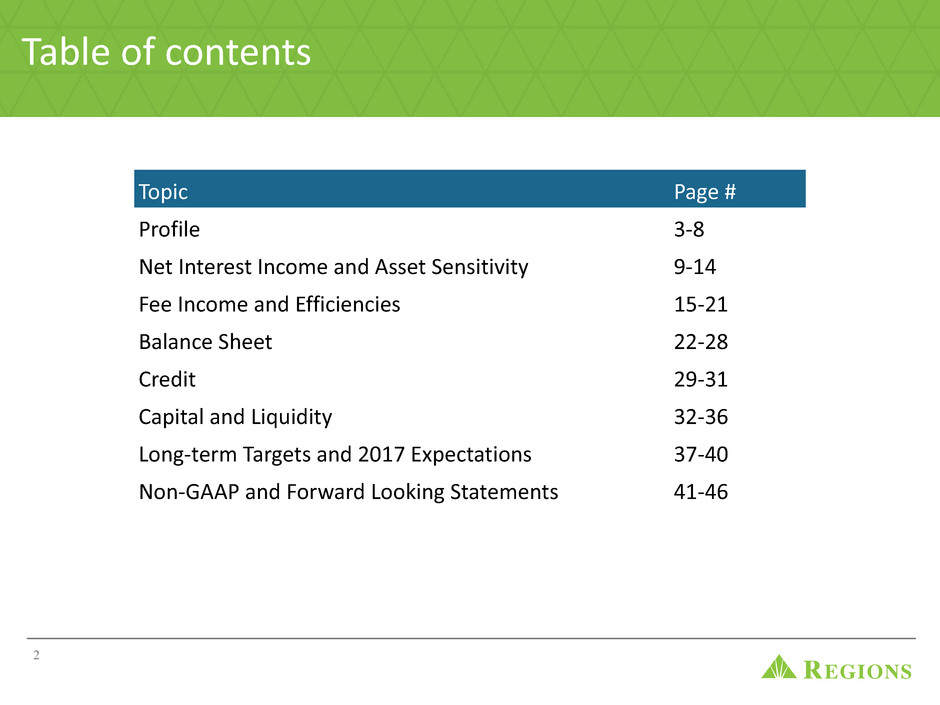
Table of contents
Topic Page #
Profile 3-8
Net Interest Income and Asset Sensitivity 9-14
Fee Income and Efficiencies 15-21
Balance Sheet 22-28
Credit 29-31
Capital and Liquidity 32-36
Long-term Targets and 2017 Expectations 37-40
Non-GAAP and Forward Looking Statements 41-46
2

Profile
3
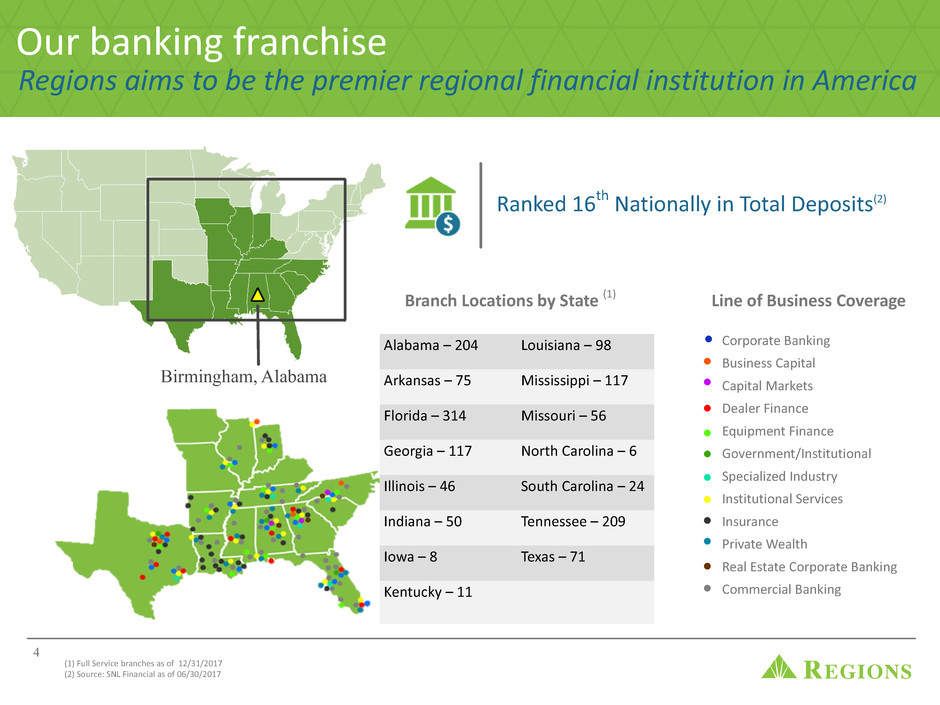
Regions aims to be the premier regional financial institution in America
Line of Business Coverage
Alabama – 204 Louisiana – 98
Arkansas – 75 Mississippi – 117
Florida – 314 Missouri – 56
Georgia – 117 North Carolina – 6
Illinois – 46 South Carolina – 24
Indiana – 50 Tennessee – 209
Iowa – 8 Texas – 71
Kentucky – 11
Ranked 16th Nationally in Total Deposits(2)
Corporate Banking
Business Capital
Capital Markets
Dealer Finance
Equipment Finance
Government/Institutional
Specialized Industry
Institutional Services
Insurance
Private Wealth
Real Estate Corporate Banking
Commercial Banking
•
•
•
•
•
•
•
•
•
•
•
•
Branch Locations by State (1)
Our banking franchise
Birmingham, Alabama
(1) Full Service branches as of 12/31/2017
(2) Source: SNL Financial as of 06/30/2017
4
Strength of our markets
5
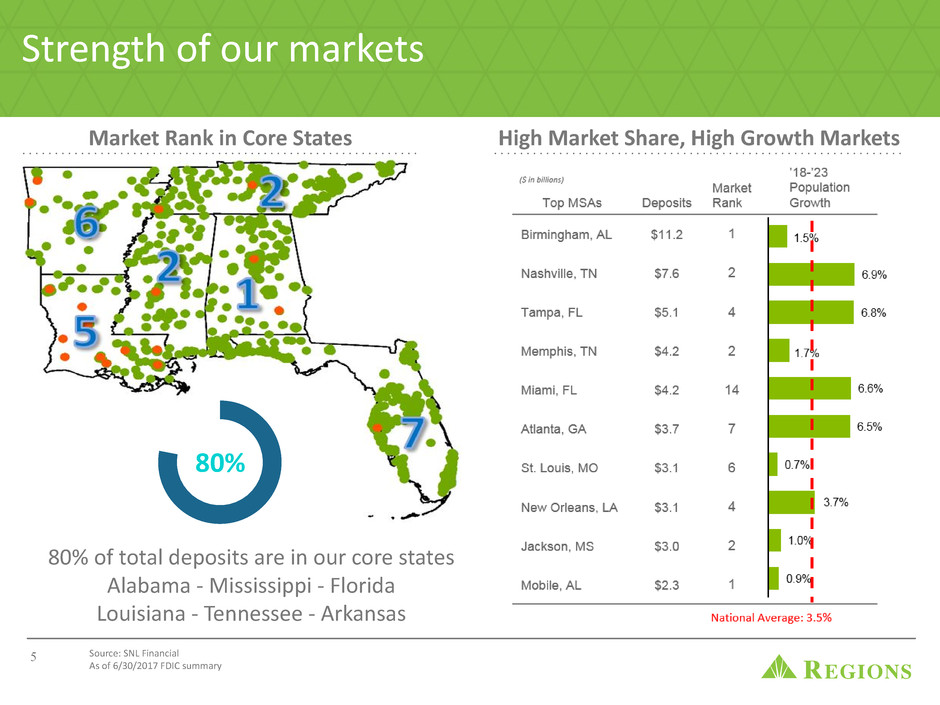
Market Rank in Core States
80% of total deposits are in our core states
Alabama - Mississippi - Florida
Louisiana - Tennessee - Arkansas
80%
High Market Share, High Growth Markets
Source: SNL Financial
As of 6/30/2017 FDIC summary
Strength of our markets - our 15 state footprint
6 1. Source: Bureau of Labor Statistics through March 2017; Data pulled May 2, 20172. Source: Automotive News Light Vehicle Production by state for 2016
3. Source: U.S. Census Bureau
4. Based on Total Domestic Shipping Tonnage by state; U.S. Army Corps of Engineers, as of 2015
5. Bureau of Economic Analysis; non-durable goods is as a percent of the non-durable good subcomponent of GDP, as of 2015
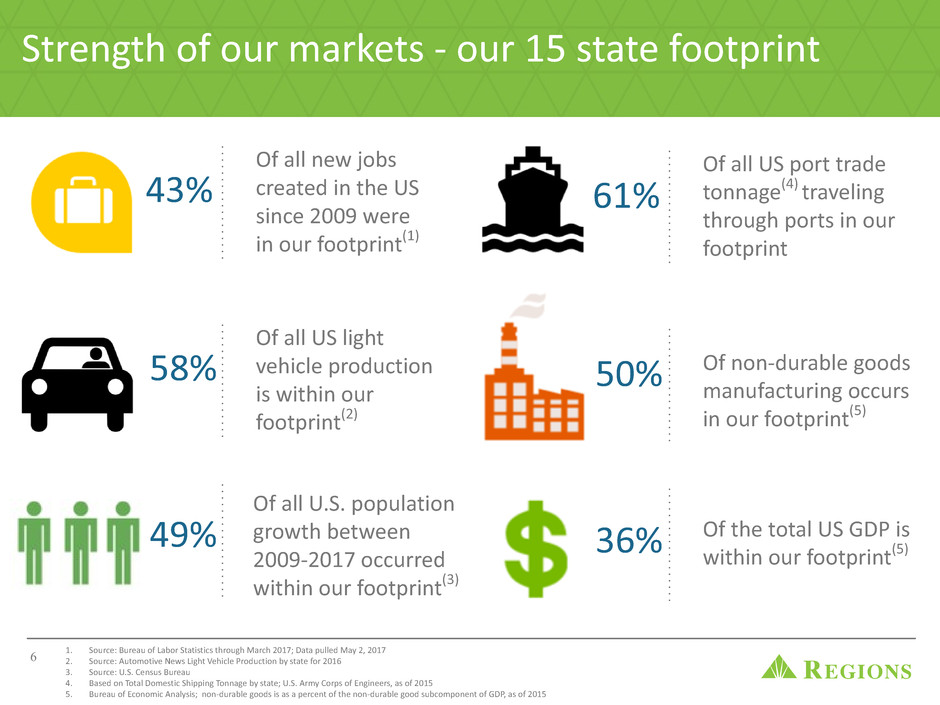
Of all new jobs
created in the US
since 2009 were
in our footprint(1)
Of all US light
vehicle production
is within our
footprint(2)
Of all U.S. population
growth between
2009-2017 occurred
within our footprint(3)
Of all US port trade
tonnage(4) traveling
through ports in our
footprint
Of non-durable goods
manufacturing occurs
in our footprint(5)
Of the total US GDP is
within our footprint(5)
61%
50%
36%
43%
58%
49%
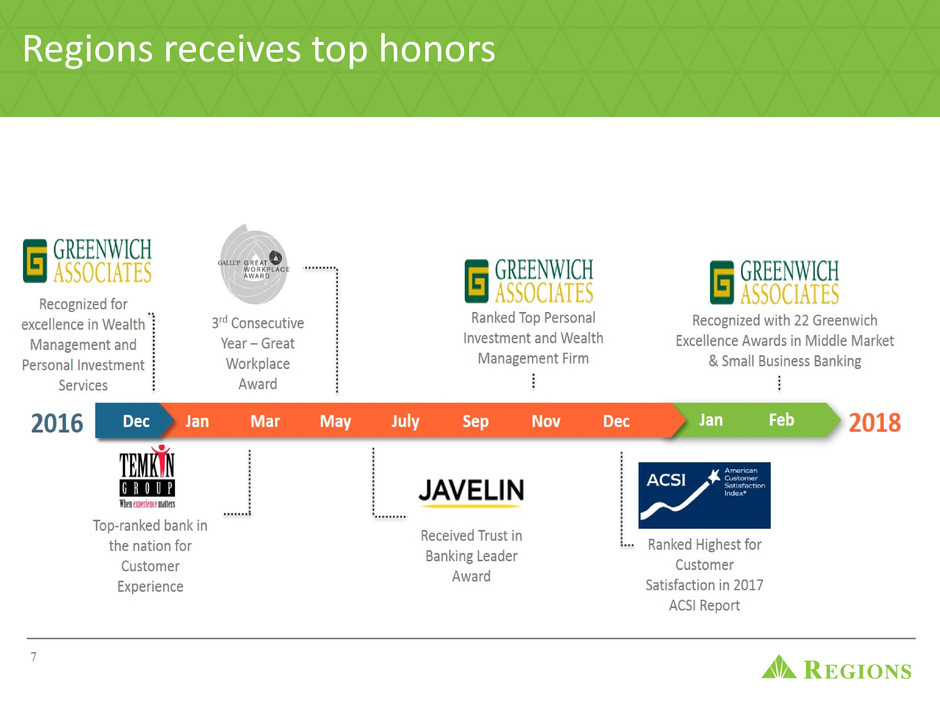
Regions receives top honors
7
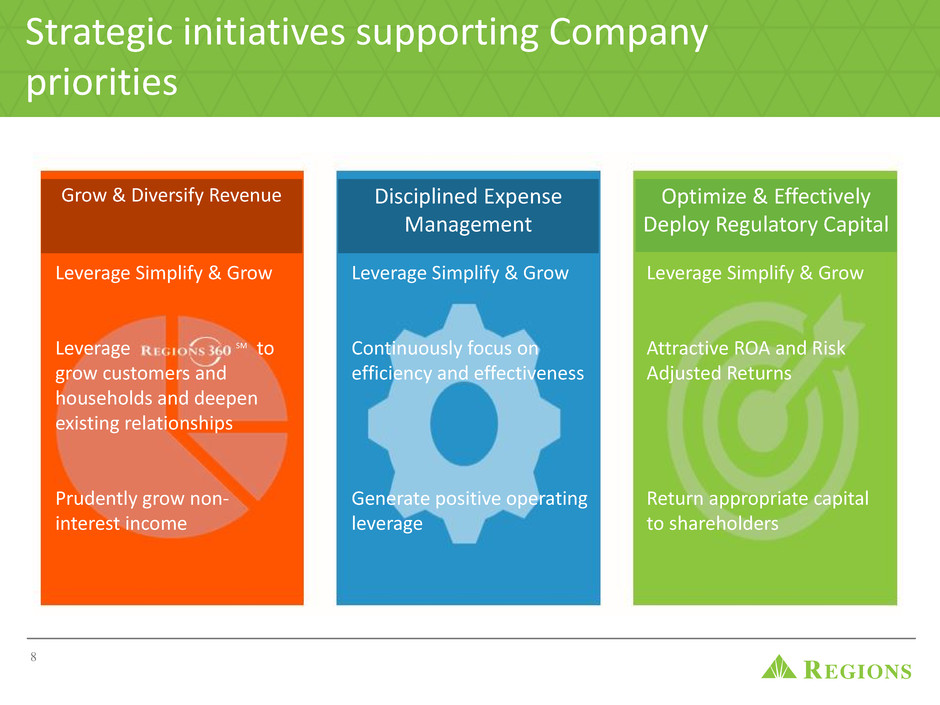
Grow & Diversify Revenue Disciplined Expense
Management
Optimize & Effectively
Deploy Regulatory Capital
Leverage Simplify & Grow
Leverage SM to
grow customers and
households and deepen
existing relationships
Prudently grow non-
interest income
Leverage Simplify & Grow
Attractive ROA and Risk
Adjusted Returns
Return appropriate capital
to shareholders
Leverage Simplify & Grow
Continuously focus on
efficiency and effectiveness
Generate positive operating
leverage
8
Strategic initiatives supporting Company
priorities

Net Interest
Income and Asset
Sensitivity
9
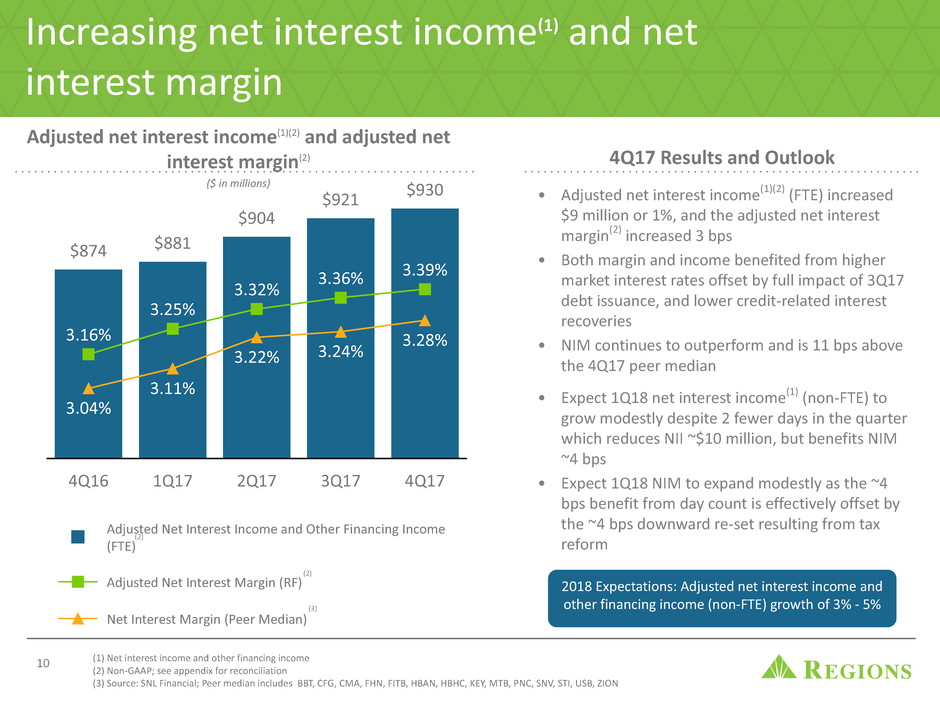
Adjusted net interest income(1)(2) and adjusted net
interest margin(2)
Increasing net interest income(1) and net
interest margin
Adjusted Net Interest Income and Other Financing Income
(FTE)
Adjusted Net Interest Margin (RF)
Net Interest Margin (Peer Median)
4Q16 1Q17 2Q17 3Q17 4Q17
$874 $881
$904
$921 $930
3.16%
3.25%
3.32% 3.36%
3.39%
3.04%
3.11%
3.22% 3.24%
3.28%
• Adjusted net interest income(1)(2) (FTE) increased
$9 million or 1%, and the adjusted net interest
margin(2) increased 3 bps
• Both margin and income benefited from higher
market interest rates offset by full impact of 3Q17
debt issuance, and lower credit-related interest
recoveries
• NIM continues to outperform and is 11 bps above
the 4Q17 peer median
• Expect 1Q18 net interest income(1) (non-FTE) to
grow modestly despite 2 fewer days in the quarter
which reduces NII ~$10 million, but benefits NIM
~4 bps
• Expect 1Q18 NIM to expand modestly as the ~4
bps benefit from day count is effectively offset by
the ~4 bps downward re-set resulting from tax
reform
($ in millions)
10 (1) Net interest income and other financing income
(2) Non-GAAP; see appendix for reconciliation
(3) Source: SNL Financial; Peer median includes BBT, CFG, CMA, FHN, FITB, HBAN, HBHC, KEY, MTB, PNC, SNV, STI, USB, ZION
4Q17 Results and Outlook
2018 Expectations: Adjusted net interest income and
other financing income (non-FTE) growth of 3% - 5%(3)
(2)
(2)
Deposits
90%
Borrowings
8%
Other
2%
IB Checking,
Money Market
& Savings
56%
Non-Interest
Bearing
Checking
37%
Time
7%
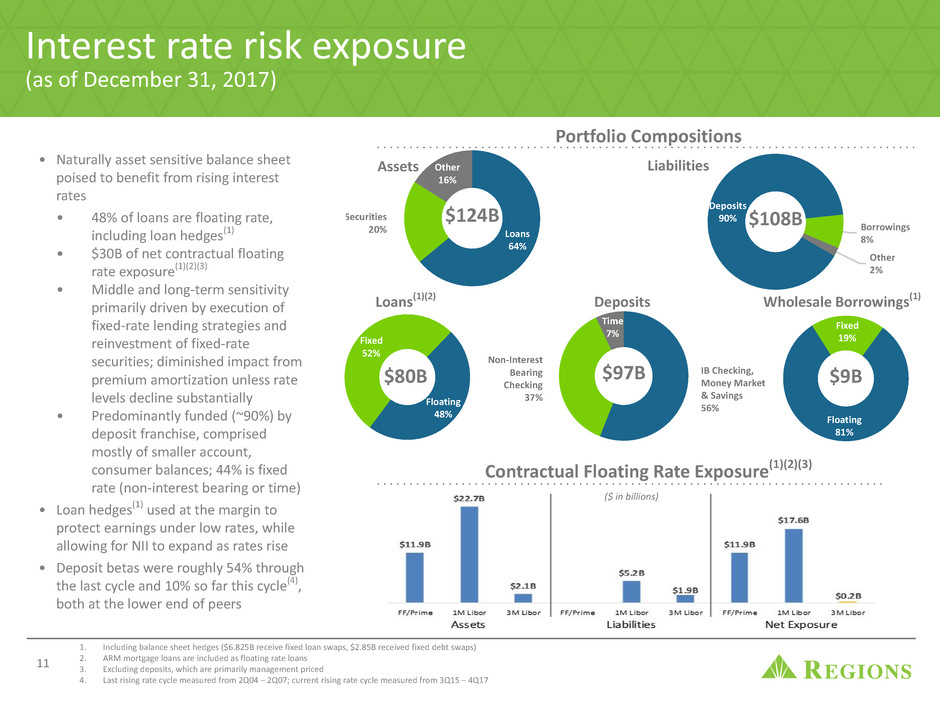
Interest rate risk exposure
(as of December 31, 2017)
• Naturally asset sensitive balance sheet
poised to benefit from rising interest
rates
• 48% of loans are floating rate,
including loan hedges(1)
• $30B of net contractual floating
rate exposure(1)(2)(3)
• Middle and long-term sensitivity
primarily driven by execution of
fixed-rate lending strategies and
reinvestment of fixed-rate
securities; diminished impact from
premium amortization unless rate
levels decline substantially
• Predominantly funded (~90%) by
deposit franchise, comprised
mostly of smaller account,
consumer balances; 44% is fixed
rate (non-interest bearing or time)
• Loan hedges(1) used at the margin to
protect earnings under low rates, while
allowing for NII to expand as rates rise
• Deposit betas were roughly 54% through
the last cycle and 10% so far this cycle(4),
both at the lower end of peers
Portfolio Compositions
11
1. Including balance sheet hedges ($6.825B receive fixed loan swaps, $2.85B received fixed debt swaps)
2. ARM mortgage loans are included as floating rate loans
3. Excluding deposits, which are primarily management priced
4. Last rising rate cycle measured from 2Q04 – 2Q07; current rising rate cycle measured from 3Q15 – 4Q17
Contractual Floating Rate Exposure(1)(2)(3)
Loans
64%
Securities
20%
Other
16%
$124B
Assets Liabilities
$108B
Floating
81%
Fixed
19%
Wholesale Borrowings(1)
$9B$97B
Deposits
Floating
48%
Fixed
52%
Loans(1)(2)
$80B
($ in billions)
12
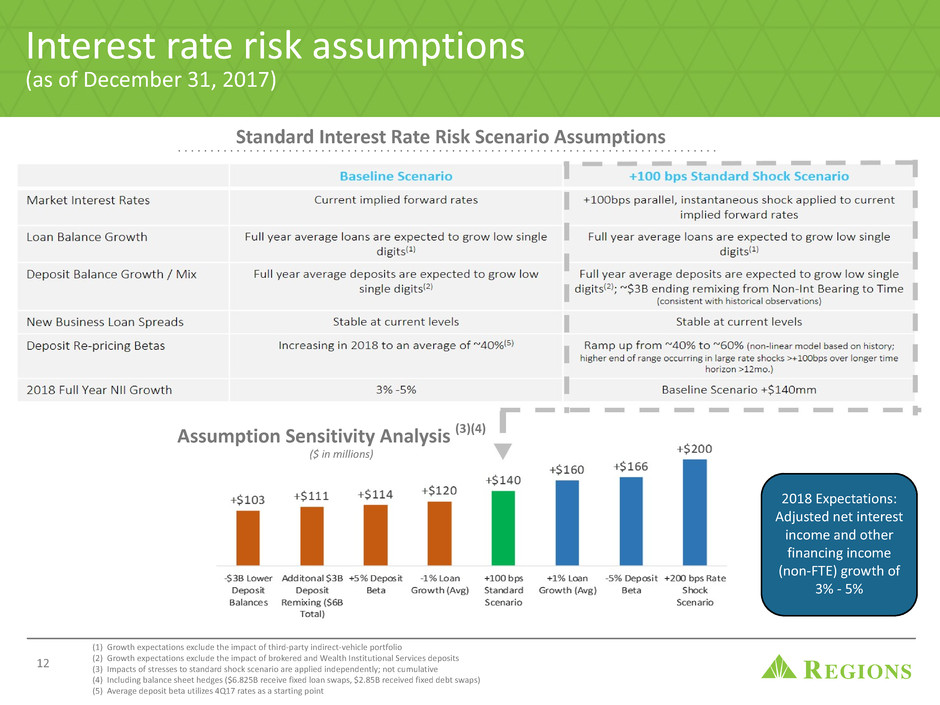
Assumption Sensitivity Analysis (3)(4)
($ in millions)
Standard Interest Rate Risk Scenario Assumptions
Interest rate risk assumptions
(as of December 31, 2017)
(1) Growth expectations exclude the impact of third-party indirect-vehicle portfolio
(2) Growth expectations exclude the impact of brokered and Wealth Institutional Services deposits
(3) Impacts of stresses to standard shock scenario are applied independently; not cumulative
(4) Including balance sheet hedges ($6.825B receive fixed loan swaps, $2.85B received fixed debt swaps)
(5) Average deposit beta utilizes 4Q17 rates as a starting point
2018 Expectations:
Adjusted net interest
income and other
financing income
(non-FTE) growth of
3% - 5%
Peer #1
Peer #2
RF
Peer #3
Peer #4
Peer #5
Peer #6
Peer #7
Peer #8
Peer #9
Peer #10
Peer #11
Peer #12
Peer #13
Peer #14
2bps
3bps
6bps
8bps
9bps
11bps
12bps
14bps
14bps
14bps
17bps
20bps
21bps
22bps
27bps
$57
$8
$28
$3
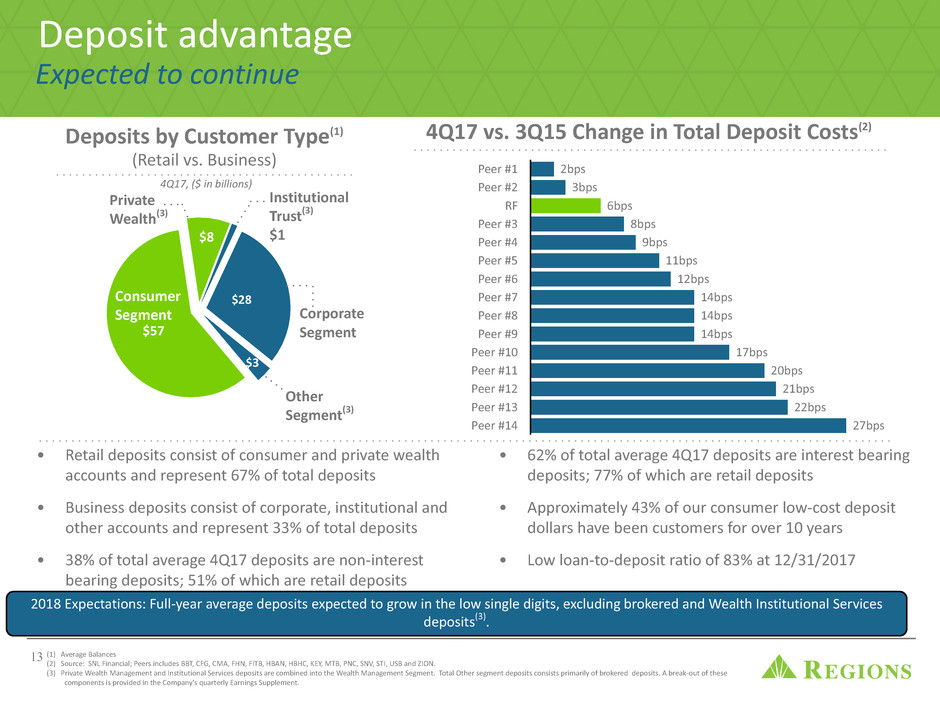
4Q17 vs. 3Q15 Change in Total Deposit Costs(2)
Other
Segment(3)
Deposit advantage
Deposits by Customer Type(1)
(Retail vs. Business)
• Retail deposits consist of consumer and private wealth
accounts and represent 67% of total deposits
• Business deposits consist of corporate, institutional and
other accounts and represent 33% of total deposits
• 38% of total average 4Q17 deposits are non-interest
bearing deposits; 51% of which are retail deposits
• 62% of total average 4Q17 deposits are interest bearing
deposits; 77% of which are retail deposits
• Approximately 43% of our consumer low-cost deposit
dollars have been customers for over 10 years
• Low loan-to-deposit ratio of 83% at 12/31/2017
Consumer
Segment
Private
Wealth(3)
Corporate
Segment
Institutional
Trust(3)
$1
(1) Average Balances
(2) Source: SNL Financial; Peers includes BBT, CFG, CMA, FHN, FITB, HBAN, HBHC, KEY, MTB, PNC, SNV, STI, USB and ZION.
(3) Private Wealth Management and Institutional Services deposits are combined into the Wealth Management Segment. Total Other segment deposits consists primarily of brokered deposits. A break-out of these
components is provided in the Company's quarterly Earnings Supplement.
4Q17, ($ in billions)
Expected to continue
2018 Expectations: Full-year average deposits expected to grow in the low single digits, excluding brokered and Wealth Institutional Services
deposits(3).
13
Deposit composition and pricing
(as of December 31, 2017)
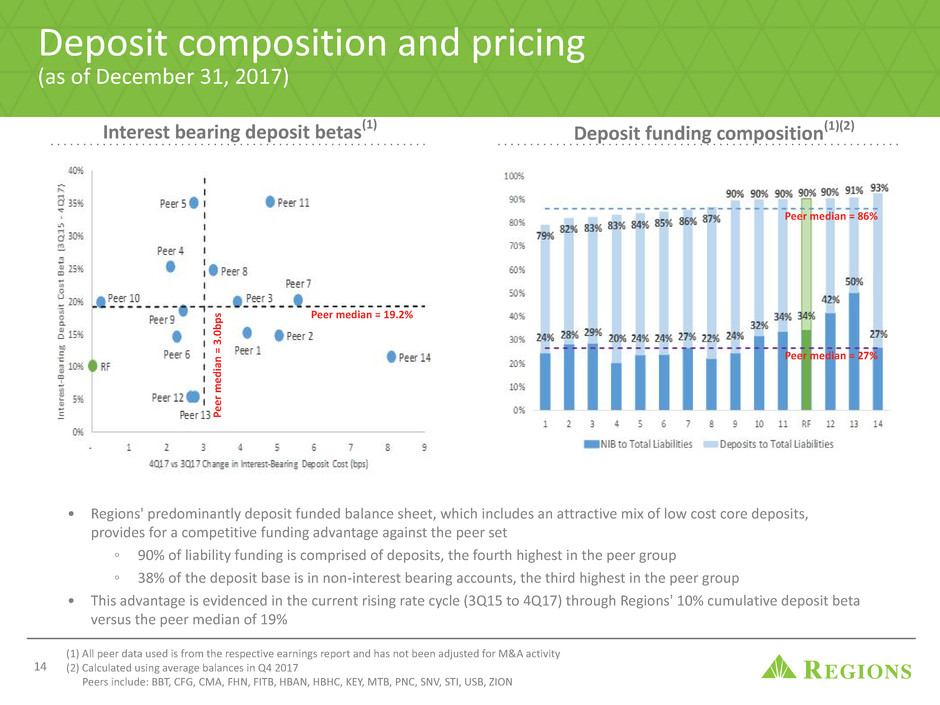
• Regions' predominantly deposit funded balance sheet, which includes an attractive mix of low cost core deposits,
provides for a competitive funding advantage against the peer set
◦ 90% of liability funding is comprised of deposits, the fourth highest in the peer group
◦ 38% of the deposit base is in non-interest bearing accounts, the third highest in the peer group
• This advantage is evidenced in the current rising rate cycle (3Q15 to 4Q17) through Regions' 10% cumulative deposit beta
versus the peer median of 19%
Interest bearing deposit betas(1) Deposit funding composition(1)(2)
(1) All peer data used is from the respective earnings report and has not been adjusted for M&A activity
(2) Calculated using average balances in Q4 2017
Peers include: BBT, CFG, CMA, FHN, FITB, HBAN, HBHC, KEY, MTB, PNC, SNV, STI, USB, ZION
14
Peer median = 19.2%
Peer median = 3.0b
ps
Peer median = 86%
Peer median = 27%
Fee Income and
Efficiencies
15
16
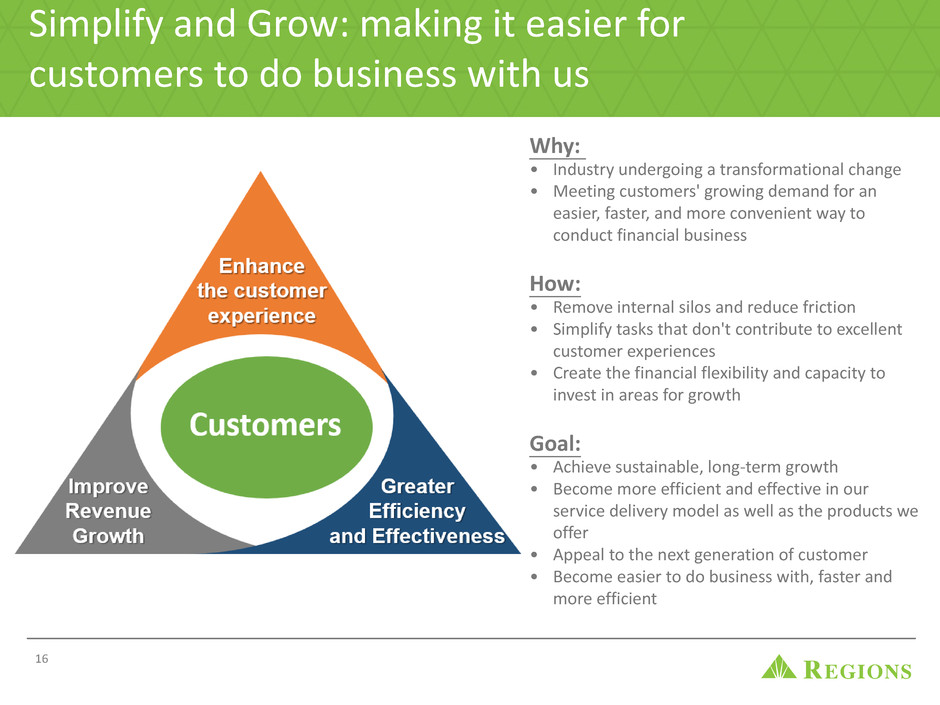
Simplify and Grow: making it easier for
customers to do business with us
Why:
• Industry undergoing a transformational change
• Meeting customers' growing demand for an
easier, faster, and more convenient way to
conduct financial business
How:
• Remove internal silos and reduce friction
• Simplify tasks that don't contribute to excellent
customer experiences
• Create the financial flexibility and capacity to
invest in areas for growth
Goal:
• Achieve sustainable, long-term growth
• Become more efficient and effective in our
service delivery model as well as the products we
offer
• Appeal to the next generation of customer
• Become easier to do business with, faster and
more efficient
17
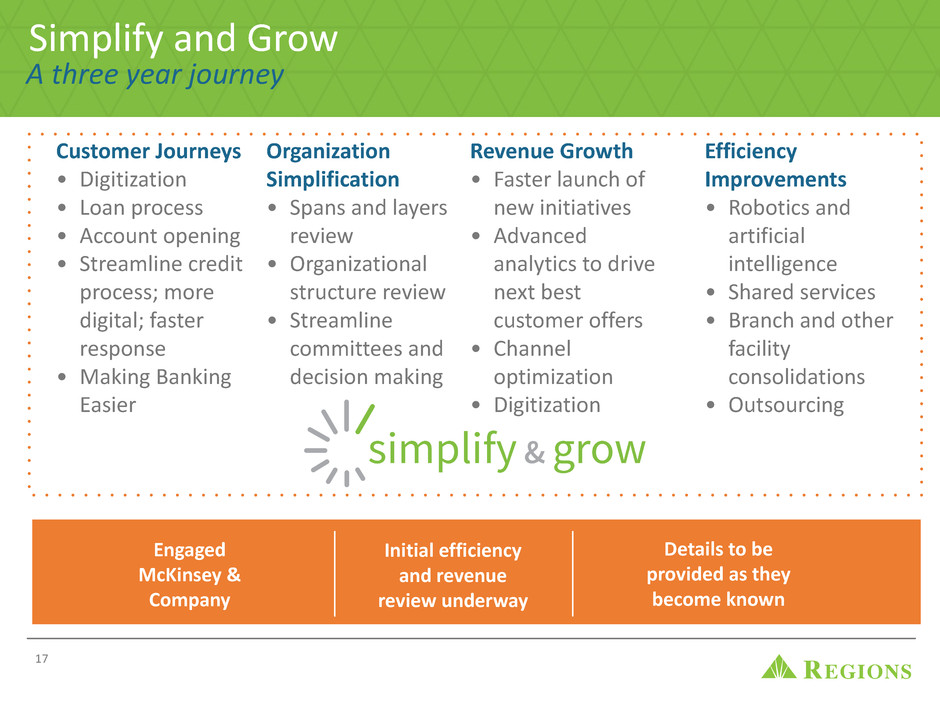
Simplify and Grow
A three year journey
Customer Journeys
• Digitization
• Loan process
• Account opening
• Streamline credit
process; more
digital; faster
response
• Making Banking
Easier
Revenue Growth
• Faster launch of
new initiatives
• Advanced
analytics to drive
next best
customer offers
• Channel
optimization
• Digitization
Organization
Simplification
• Spans and layers
review
• Organizational
structure review
• Streamline
committees and
decision making
Efficiency
Improvements
• Robotics and
artificial
intelligence
• Shared services
• Branch and other
facility
consolidations
• Outsourcing
Engaged
McKinsey &
Company
Initial efficiency
and revenue
review underway
Details to be
provided as they
become known
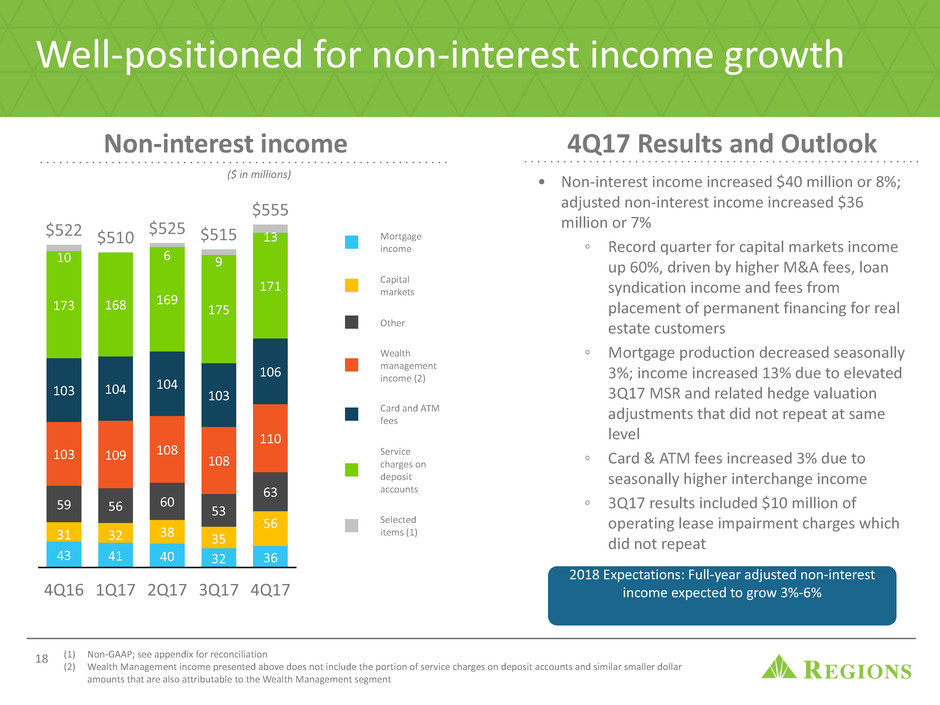
Non-interest income
Mortgage
income
Capital
markets
Other
Wealth
management
income (2)
Card and ATM
fees
Service
charges on
deposit
accounts
Selected
items (1)
4Q16 1Q17 2Q17 3Q17 4Q17
43 41 40 32 36
31 32 38 35
56
59 56 60 53
63
103 109 108 108
110
103 104 104 103
106
173 168
$510
169
175
171
10
$522
6
$525
9
$515 13
$555
Well-positioned for non-interest income growth
(1) Non-GAAP; see appendix for reconciliation
(2) Wealth Management income presented above does not include the portion of service charges on deposit accounts and similar smaller dollar
amounts that are also attributable to the Wealth Management segment
($ in millions)
18
• Non-interest income increased $40 million or 8%;
adjusted non-interest income increased $36
million or 7%
◦ Record quarter for capital markets income
up 60%, driven by higher M&A fees, loan
syndication income and fees from
placement of permanent financing for real
estate customers
◦ Mortgage production decreased seasonally
3%; income increased 13% due to elevated
3Q17 MSR and related hedge valuation
adjustments that did not repeat at same
level
◦ Card & ATM fees increased 3% due to
seasonally higher interchange income
◦ 3Q17 results included $10 million of
operating lease impairment charges which
did not repeat
2018 Expectations: Full-year adjusted non-interest
income expected to grow 3%-6%
4Q17 Results and Outlook
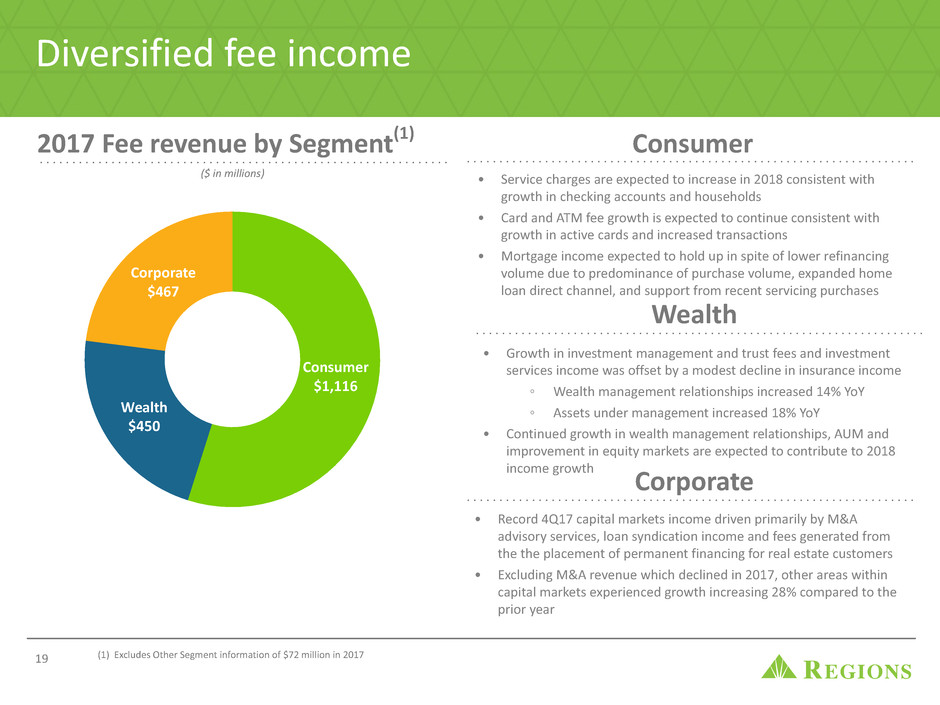
Consumer
$1,116
Wealth
$450
Corporate
$467
(1) Excludes Other Segment information of $72 million in 2017
2017 Fee revenue by Segment(1)
Diversified fee income
($ in millions)
19
• Service charges are expected to increase in 2018 consistent with
growth in checking accounts and households
• Card and ATM fee growth is expected to continue consistent with
growth in active cards and increased transactions
• Mortgage income expected to hold up in spite of lower refinancing
volume due to predominance of purchase volume, expanded home
loan direct channel, and support from recent servicing purchases
Consumer
Wealth
• Growth in investment management and trust fees and investment
services income was offset by a modest decline in insurance income
◦ Wealth management relationships increased 14% YoY
◦ Assets under management increased 18% YoY
• Continued growth in wealth management relationships, AUM and
improvement in equity markets are expected to contribute to 2018
income growth Corporate
• Record 4Q17 capital markets income driven primarily by M&A
advisory services, loan syndication income and fees generated from
the the placement of permanent financing for real estate customers
• Excluding M&A revenue which declined in 2017, other areas within
capital markets experienced growth increasing 28% compared to the
prior year
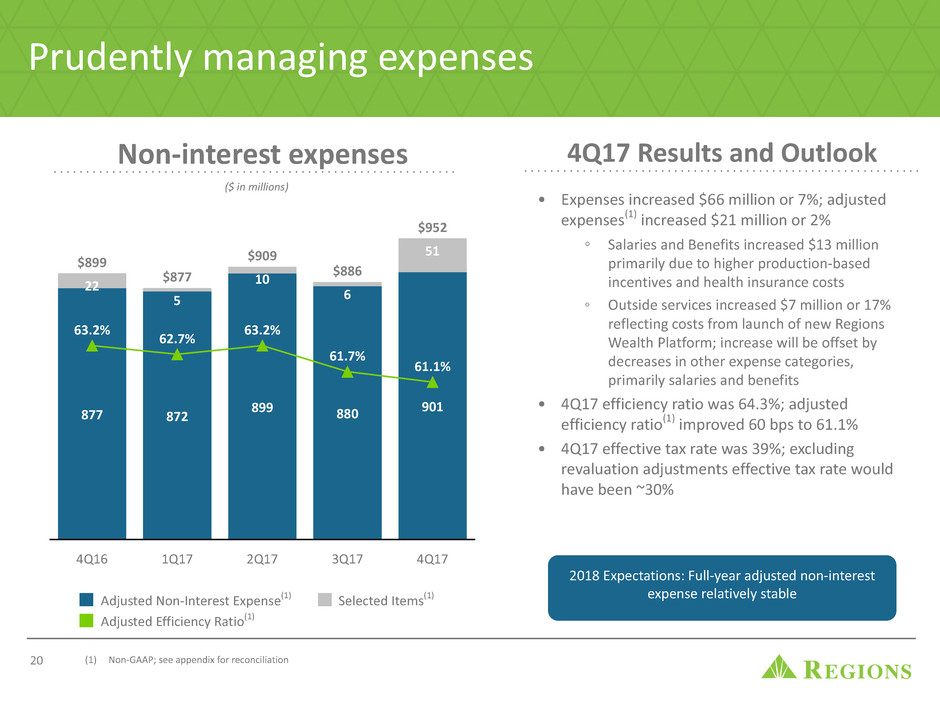
Non-interest expenses
Prudently managing expenses
4Q16 1Q17 2Q17 3Q17 4Q17
877 872 899 880
901
22
$899
5
$877 10
$909
6
$886
51
$952
63.2% 62.7% 63.2%
61.7%
61.1%
(1) Non-GAAP; see appendix for reconciliation
($ in millions)
Selected Items(1)Adjusted Non-Interest Expense(1)
20
• Expenses increased $66 million or 7%; adjusted
expenses(1) increased $21 million or 2%
◦ Salaries and Benefits increased $13 million
primarily due to higher production-based
incentives and health insurance costs
◦ Outside services increased $7 million or 17%
reflecting costs from launch of new Regions
Wealth Platform; increase will be offset by
decreases in other expense categories,
primarily salaries and benefits
• 4Q17 efficiency ratio was 64.3%; adjusted
efficiency ratio(1) improved 60 bps to 61.1%
• 4Q17 effective tax rate was 39%; excluding
revaluation adjustments effective tax rate would
have been ~30%
4Q17 Results and Outlook
2018 Expectations: Full-year adjusted non-interest
expense relatively stable
Adjusted Efficiency Ratio(1)
21
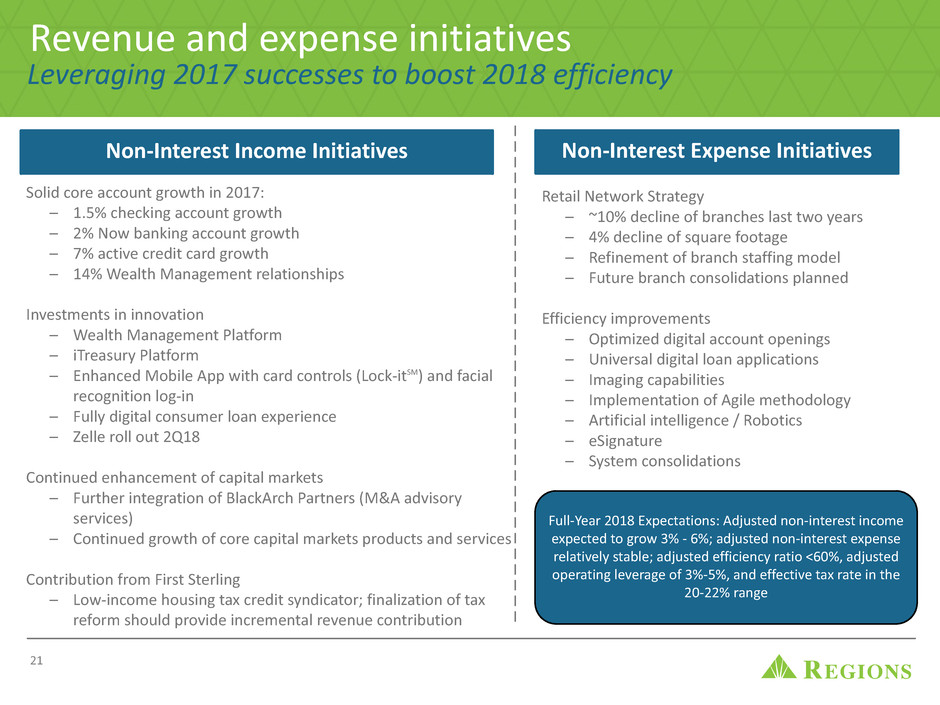
Retail Network Strategy
– ~10% decline of branches last two years
– 4% decline of square footage
– Refinement of branch staffing model
– Future branch consolidations planned
Efficiency improvements
– Optimized digital account openings
– Universal digital loan applications
– Imaging capabilities
– Implementation of Agile methodology
– Artificial intelligence / Robotics
– eSignature
– System consolidations
Solid core account growth in 2017:
– 1.5% checking account growth
– 2% Now banking account growth
– 7% active credit card growth
– 14% Wealth Management relationships
Investments in innovation
– Wealth Management Platform
– iTreasury Platform
– Enhanced Mobile App with card controls (Lock-itSM) and facial
recognition log-in
– Fully digital consumer loan experience
– Zelle roll out 2Q18
Continued enhancement of capital markets
– Further integration of BlackArch Partners (M&A advisory
services)
– Continued growth of core capital markets products and services
Contribution from First Sterling
– Low-income housing tax credit syndicator; finalization of tax
reform should provide incremental revenue contribution
Revenue and expense initiatives
Leveraging 2017 successes to boost 2018 efficiency
Non-Interest Income Initiatives Non-Interest Expense Initiatives
Full-Year 2018 Expectations: Adjusted non-interest income
expected to grow 3% - 6%; adjusted non-interest expense
relatively stable; adjusted efficiency ratio <60%, adjusted
operating leverage of 3%-5%, and effective tax rate in the
20-22% range

Balance Sheet
22
23
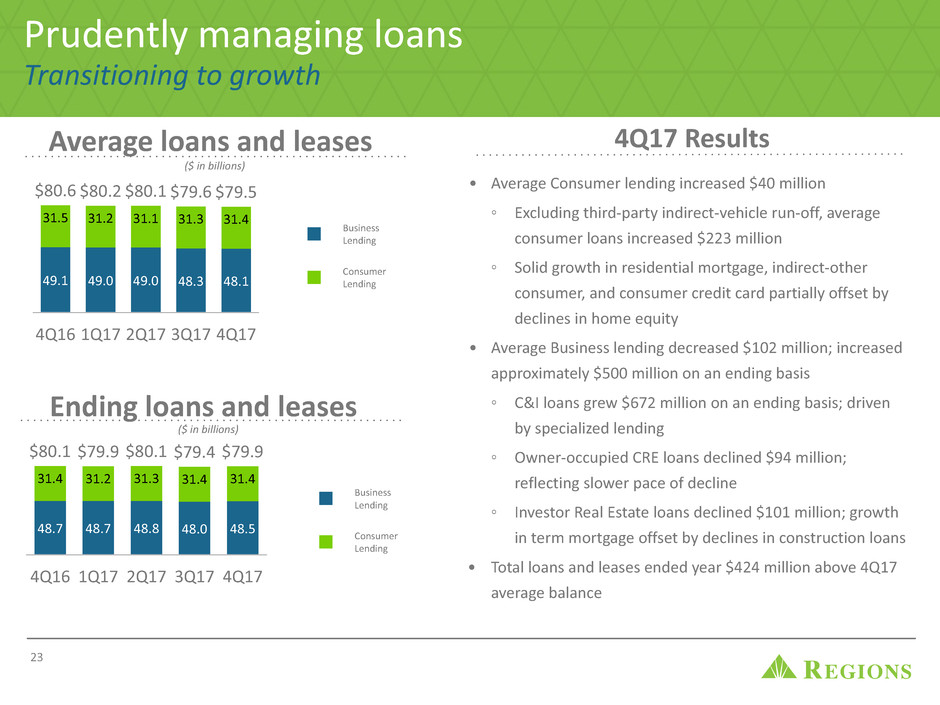
Average loans and leases
Prudently managing loans
Transitioning to growth
($ in billions)
• Average Consumer lending increased $40 million
◦ Excluding third-party indirect-vehicle run-off, average
consumer loans increased $223 million
◦ Solid growth in residential mortgage, indirect-other
consumer, and consumer credit card partially offset by
declines in home equity
• Average Business lending decreased $102 million; increased
approximately $500 million on an ending basis
◦ C&I loans grew $672 million on an ending basis; driven
by specialized lending
◦ Owner-occupied CRE loans declined $94 million;
reflecting slower pace of decline
◦ Investor Real Estate loans declined $101 million; growth
in term mortgage offset by declines in construction loans
• Total loans and leases ended year $424 million above 4Q17
average balance
Ending loans and leases
($ in billions)
Business
Lending
Consumer
Lending
4Q16 1Q17 2Q17 3Q17 4Q17
49.1 49.0 49.0 48.3 48.1
31.5
$80.6
31.2
$80.2
31.1
$80.1
31.3
$79.6
31.4
$79.5
Business
Lending
Consumer
Lending
4Q16 1Q17 2Q17 3Q17 4Q17
48.7 48.7 48.8 48.0 48.5
31.4
$80.1
31.2
$79.9
31.3
$80.1
31.4
$79.4
31.4
$79.9
4Q17 Results
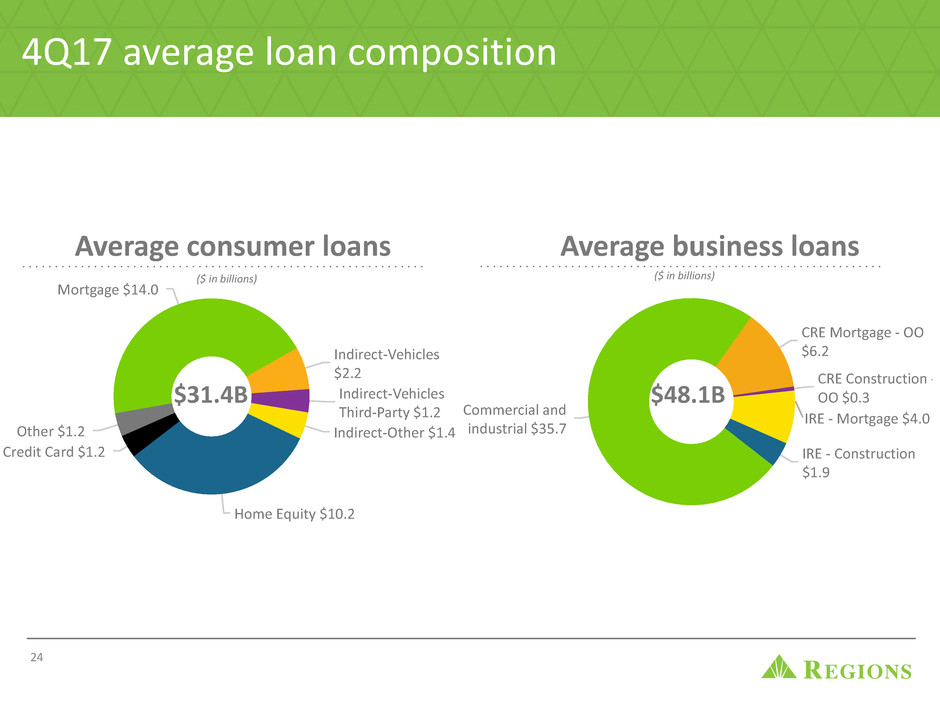
4Q17 average loan composition
Mortgage $14.0
Indirect-Vehicles
$2.2
Indirect-Vehicles
Third-Party $1.2
Indirect-Other $1.4
Home Equity $10.2
Credit Card $1.2
Other $1.2
Average consumer loans
($ in billions)
24
$31.4B
Average business loans
Commercial and
industrial $35.7
CRE Mortgage - OO
$6.2
CRE Construction -
OO $0.3
IRE - Mortgage $4.0
IRE - Construction
$1.9
$48.1B
($ in billions)
25
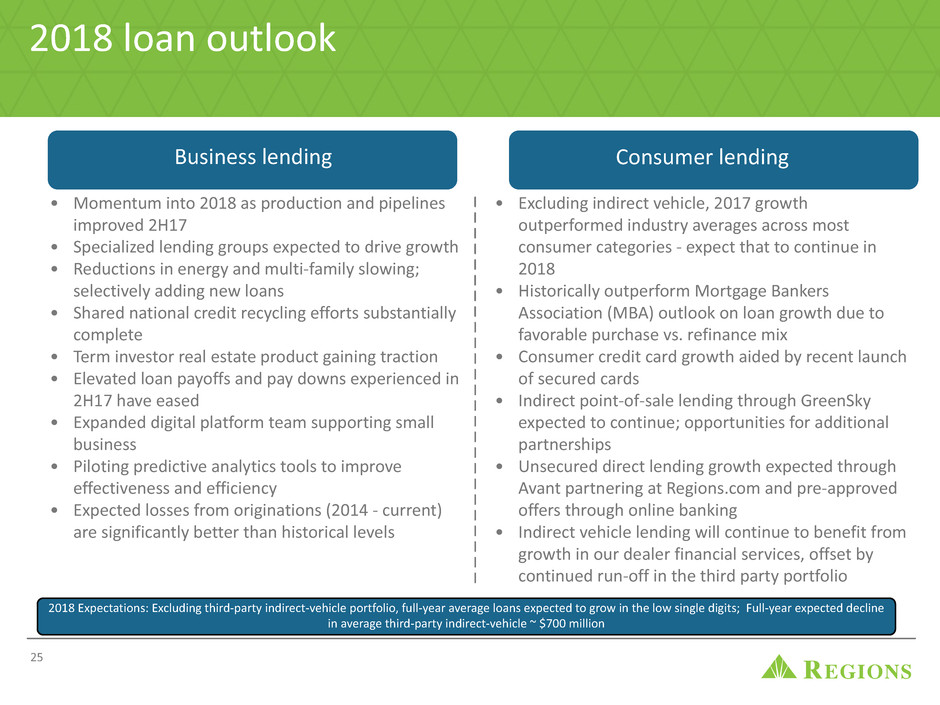
• Excluding indirect vehicle, 2017 growth
outperformed industry averages across most
consumer categories - expect that to continue in
2018
• Historically outperform Mortgage Bankers
Association (MBA) outlook on loan growth due to
favorable purchase vs. refinance mix
• Consumer credit card growth aided by recent launch
of secured cards
• Indirect point-of-sale lending through GreenSky
expected to continue; opportunities for additional
partnerships
• Unsecured direct lending growth expected through
Avant partnering at Regions.com and pre-approved
offers through online banking
• Indirect vehicle lending will continue to benefit from
growth in our dealer financial services, offset by
continued run-off in the third party portfolio
2018 loan outlook
• Momentum into 2018 as production and pipelines
improved 2H17
• Specialized lending groups expected to drive growth
• Reductions in energy and multi-family slowing;
selectively adding new loans
• Shared national credit recycling efforts substantially
complete
• Term investor real estate product gaining traction
• Elevated loan payoffs and pay downs experienced in
2H17 have eased
• Expanded digital platform team supporting small
business
• Piloting predictive analytics tools to improve
effectiveness and efficiency
• Expected losses from originations (2014 - current)
are significantly better than historical levels
2018 Expectations: Excluding third-party indirect-vehicle portfolio, full-year average loans expected to grow in the low single digits; Full-year expected decline
in average third-party indirect-vehicle ~ $700 million
Business lending Consumer lending
Average deposits by segment
Consumer
Bank
Corporate
Bank
Wealth
Management
Other
4Q16 1Q17 2Q17 3Q17 4Q17
55.6 56.2 57.1 57.0 56.9
28.7 28.2 27.6 27.6 28.4
10.2 10.0 9.5 9.3 9.2
4.0
$98.5
3.6
$98.0
3.3
$97.5
3.0
$96.9
2.6
$97.1
Average deposits by type
Solid deposit mix
Low-cost
deposits
Time deposits
+ Other
4Q16 1Q17 2Q17 3Q17 4Q17
91.0 90.8 90.5 89.9 90.1
7.5
$98.5
7.2
$98.0
7.0
$97.5
7.0
$96.9
7.0
$97.1
($ in billions)
26
($ in billions)
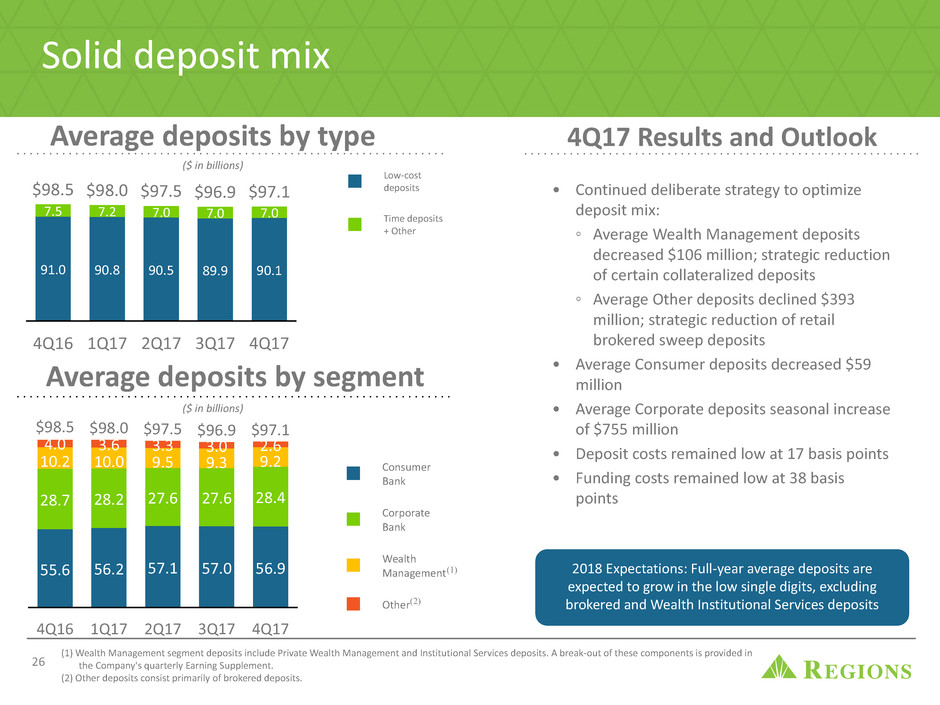
• Continued deliberate strategy to optimize
deposit mix:
◦ Average Wealth Management deposits
decreased $106 million; strategic reduction
of certain collateralized deposits
◦ Average Other deposits declined $393
million; strategic reduction of retail
brokered sweep deposits
• Average Consumer deposits decreased $59
million
• Average Corporate deposits seasonal increase
of $755 million
• Deposit costs remained low at 17 basis points
• Funding costs remained low at 38 basis
points
4Q17 Results and Outlook
2018 Expectations: Full-year average deposits are
expected to grow in the low single digits, excluding
brokered and Wealth Institutional Services deposits
(1) Wealth Management segment deposits include Private Wealth Management and Institutional Services deposits. A break-out of these components is provided in
the Company's quarterly Earning Supplement.
(2) Other deposits consist primarily of brokered deposits.
(1)
(2)
Securities portfolio
27
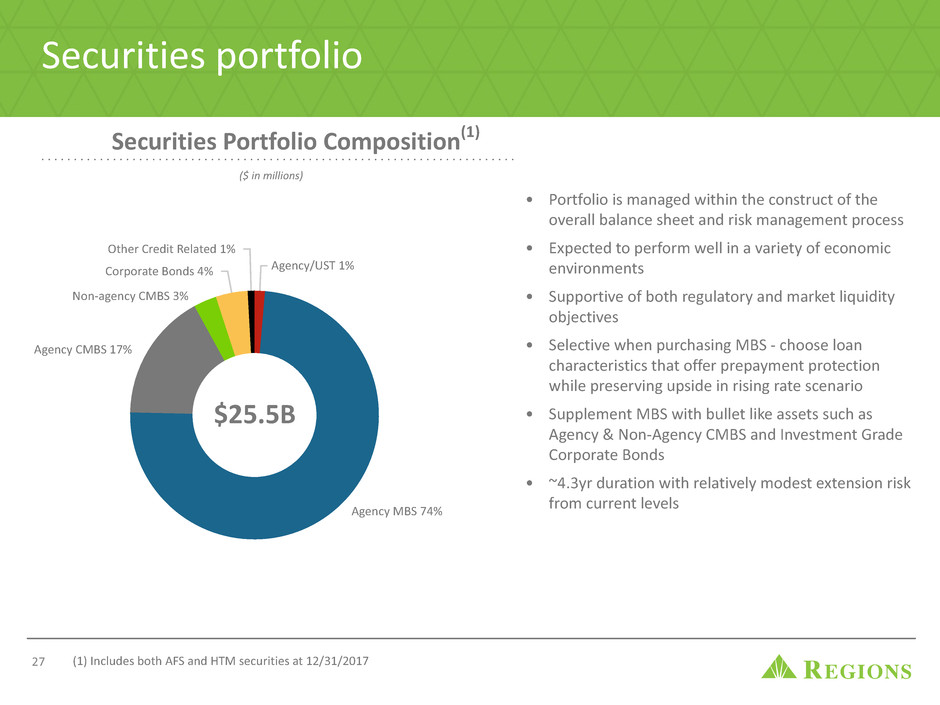
• Portfolio is managed within the construct of the
overall balance sheet and risk management process
• Expected to perform well in a variety of economic
environments
• Supportive of both regulatory and market liquidity
objectives
• Selective when purchasing MBS - choose loan
characteristics that offer prepayment protection
while preserving upside in rising rate scenario
• Supplement MBS with bullet like assets such as
Agency & Non-Agency CMBS and Investment Grade
Corporate Bonds
• ~4.3yr duration with relatively modest extension risk
from current levels
Agency/UST 1%
Agency MBS 74%
Agency CMBS 17%
Non-agency CMBS 3%
Corporate Bonds 4%
Other Credit Related 1%
(1) Includes both AFS and HTM securities at 12/31/2017
Securities Portfolio Composition(1)
($ in millions)
$25.5B
Historical Debt Profile
Unsecured Secured (FHLB)
Total Debt as a % of Assets
1Q15 2Q15 3Q15 4Q15 1Q16 2Q16 3Q16 4Q16 1Q17 2Q17 3Q17 4Q17
3.16
$3.16
2.31
3.06 3.06
3.55
4.15
3.50 3.50 3.50 3.50
4.50 4.50
3.00
$5.31
4.25
$7.31 5.25
$8.31
4.25
$7.80 4.75
$8.90
2.50
$6.00
4.25
$7.75
2.50
$6.00 3.85
$7.35
2.20
$6.70
4.15
$8.65
2.58%
4.35%
5.85%
6.58%
6.21%
7.04%
4.79%
6.14%
4.81%
5.89%
5.42%
6.94%
Balance sheet optimization
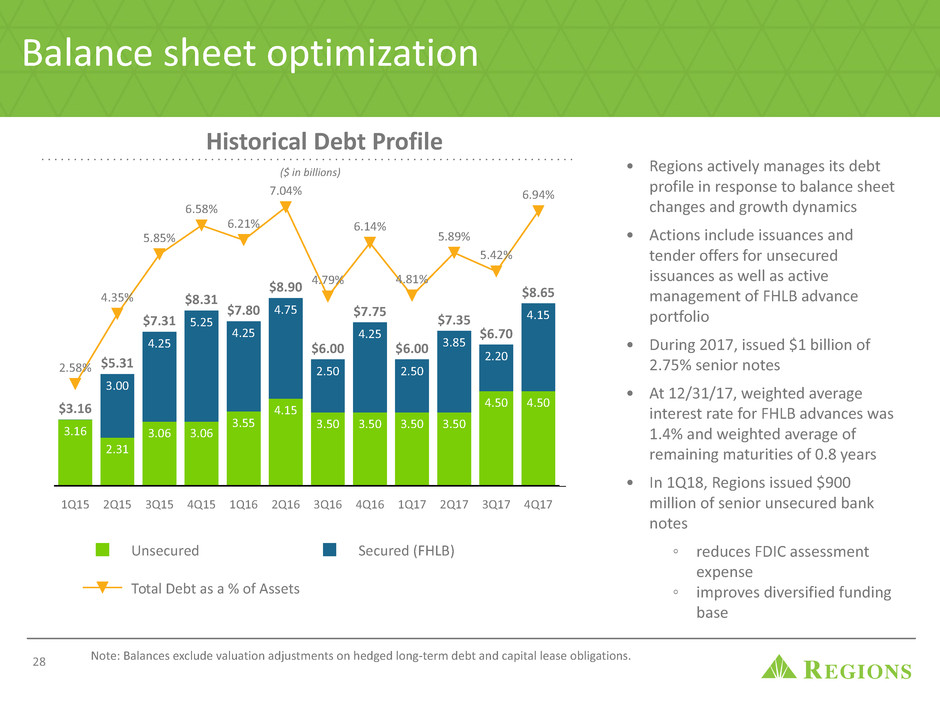
• Regions actively manages its debt
profile in response to balance sheet
changes and growth dynamics
• Actions include issuances and
tender offers for unsecured
issuances as well as active
management of FHLB advance
portfolio
• During 2017, issued $1 billion of
2.75% senior notes
• At 12/31/17, weighted average
interest rate for FHLB advances was
1.4% and weighted average of
remaining maturities of 0.8 years
• In 1Q18, Regions issued $900
million of senior unsecured bank
notes
◦ reduces FDIC assessment
expense
◦ improves diversified funding
base
28 Note: Balances exclude valuation adjustments on hedged long-term debt and capital lease obligations.
($ in billions)

Credit
29
NPLs and coverage ratio(1)
Classified Special Mention
4Q16 1Q17 2Q17 3Q17 4Q17
2,406 2,395 2,118 2,021 1,449
1,206
$3,612
1,143
$3,538
1,162
$3,280
941
$2,962
1,007
$2,456
Net Charge-Offs Net Charge-Offs ratio
4Q16 1Q17 2Q17 3Q17 4Q17
$83
$100
$68 $76 $63
0.41%
0.51%
0.34% 0.38% 0.31%
NPLs Coverage Ratio
4Q16 1Q17 2Q17 3Q17 4Q17
$995 $1,004
$823 $760
$650
110% 106%
127% 137% 144%
Stable asset quality
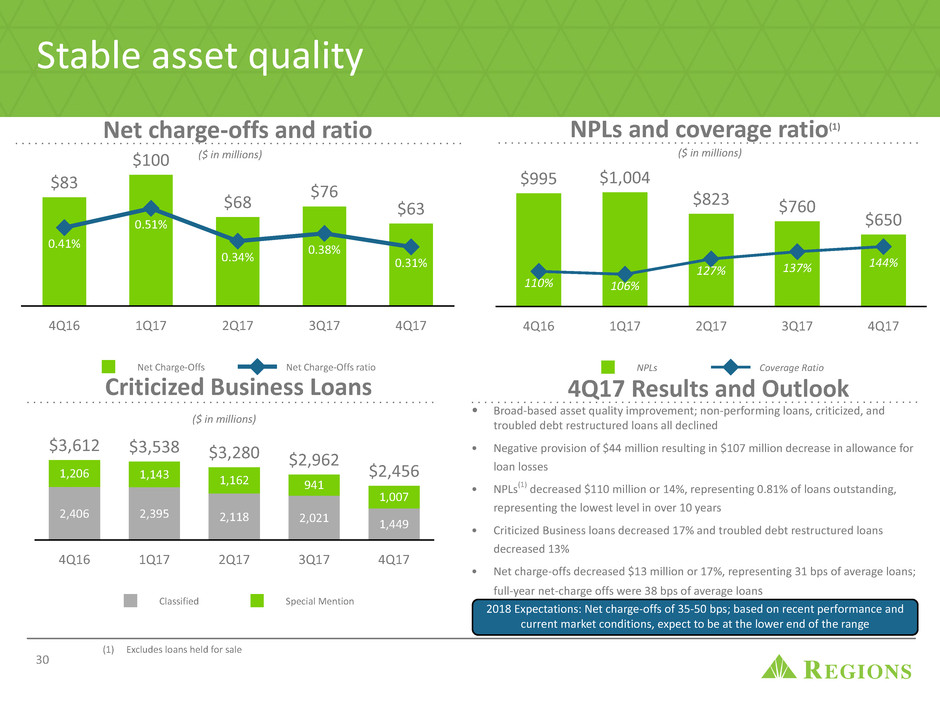
• Broad-based asset quality improvement; non-performing loans, criticized, and
troubled debt restructured loans all declined
• Negative provision of $44 million resulting in $107 million decrease in allowance for
loan losses
• NPLs(1) decreased $110 million or 14%, representing 0.81% of loans outstanding,
representing the lowest level in over 10 years
• Criticized Business loans decreased 17% and troubled debt restructured loans
decreased 13%
• Net charge-offs decreased $13 million or 17%, representing 31 bps of average loans;
full-year net-charge offs were 38 bps of average loans
($ in millions) ($ in millions)
30
4Q17 Results and Outlook
(1) Excludes loans held for sale
Net charge-offs and ratio
Criticized Business Loans
($ in millions)
2018 Expectations: Net charge-offs of 35-50 bps; based on recent performance and
current market conditions, expect to be at the lower end of the range
31
Significant improvement in asset quality
Net Charge-Offs Non-Performing Loans
4Q
10
4Q
11
4Q
12
4Q
13
4Q
14
4Q
15
4Q
16
4Q
17
$682
$63
$3,160
$650
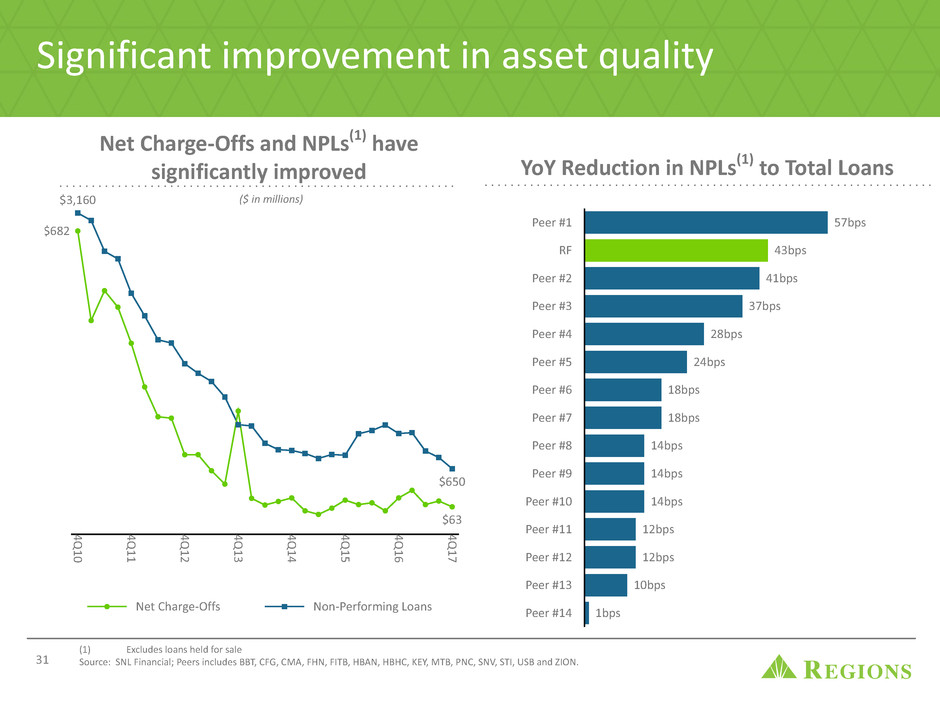
Net Charge-Offs and NPLs(1) have
significantly improved
(1) Excludes loans held for sale
Source: SNL Financial; Peers includes BBT, CFG, CMA, FHN, FITB, HBAN, HBHC, KEY, MTB, PNC, SNV, STI, USB and ZION.
YoY Reduction in NPLs(1) to Total Loans
Peer #1
RF
Peer #2
Peer #3
Peer #4
Peer #5
Peer #6
Peer #7
Peer #8
Peer #9
Peer #10
Peer #11
Peer #12
Peer #13
Peer #14
57bps
43bps
41bps
37bps
28bps
24bps
18bps
18bps
14bps
14bps
14bps
12bps
12bps
10bps
1bps
($ in millions)

Capital and
Liquidity
32
Solid liquidity
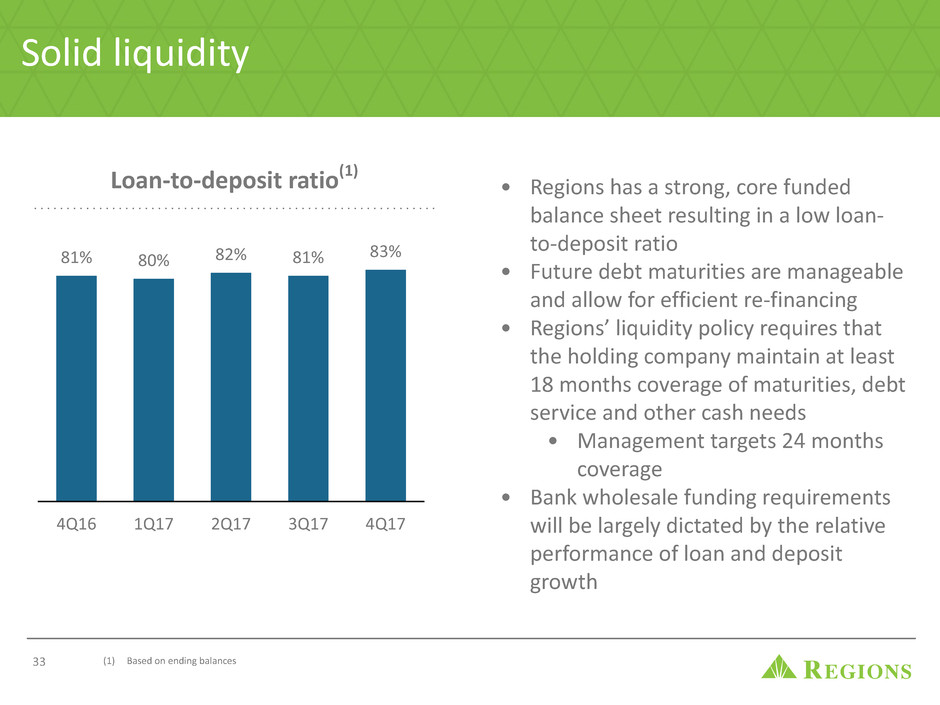
• Regions has a strong, core funded
balance sheet resulting in a low loan-
to-deposit ratio
• Future debt maturities are manageable
and allow for efficient re-financing
• Regions’ liquidity policy requires that
the holding company maintain at least
18 months coverage of maturities, debt
service and other cash needs
• Management targets 24 months
coverage
• Bank wholesale funding requirements
will be largely dictated by the relative
performance of loan and deposit
growth
(1) Based on ending balances33
Loan-to-deposit ratio(1)
4Q16 1Q17 2Q17 3Q17 4Q17
81% 80% 82% 81% 83%
Strong capital levels
34
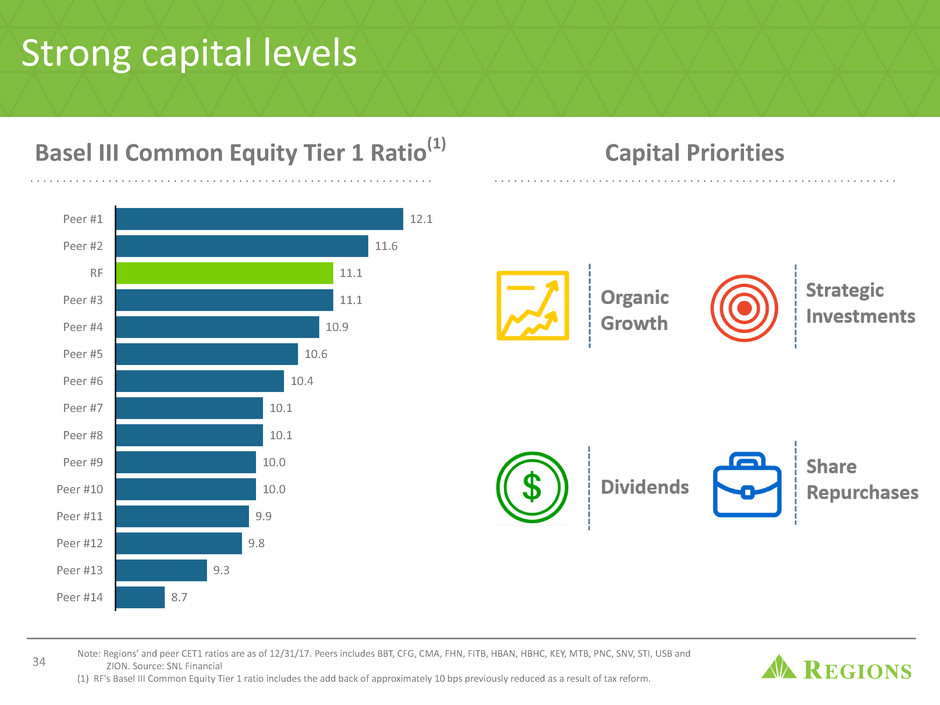
Basel III Common Equity Tier 1 Ratio(1)
Peer #1
Peer #2
RF
Peer #3
Peer #4
Peer #5
Peer #6
Peer #7
Peer #8
Peer #9
Peer #10
Peer #11
Peer #12
Peer #13
Peer #14
12.1
11.6
11.1
11.1
10.9
10.6
10.4
10.1
10.1
10.0
10.0
9.9
9.8
9.3
8.7
Capital Priorities
Note: Regions’ and peer CET1 ratios are as of 12/31/17. Peers includes BBT, CFG, CMA, FHN, FITB, HBAN, HBHC, KEY, MTB, PNC, SNV, STI, USB and
ZION. Source: SNL Financial
(1) RF's Basel III Common Equity Tier 1 ratio includes the add back of approximately 10 bps previously reduced as a result of tax reform.
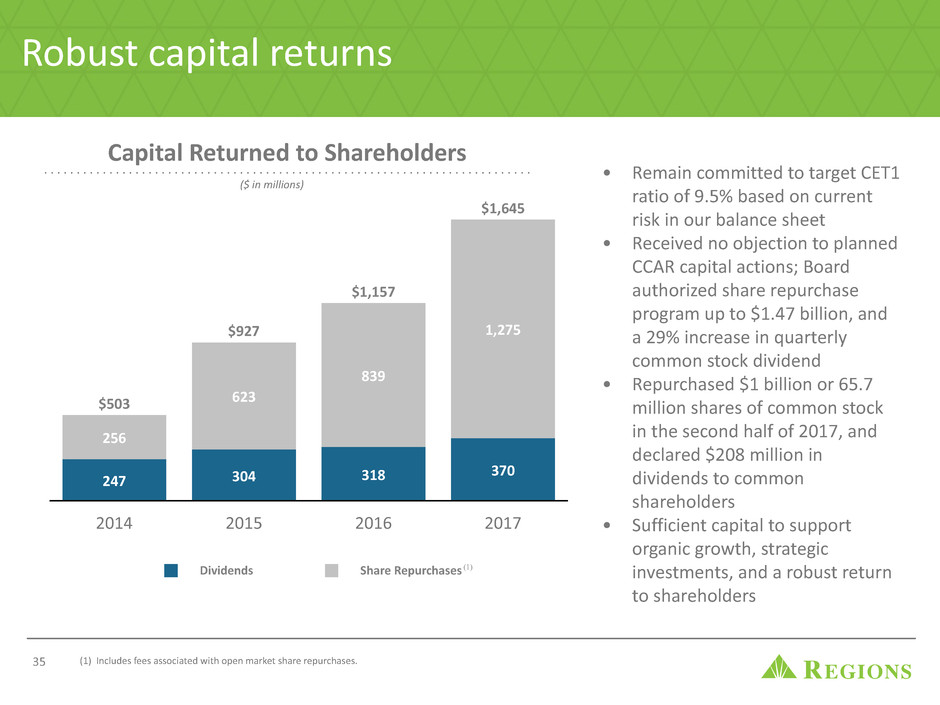
Capital Returned to Shareholders
Dividends Share Repurchases
2014 2015 2016 2017
247 304 318
370
256
$503 623
$927
839
$1,157
1,275
$1,645
Robust capital returns
(1) Includes fees associated with open market share repurchases.35
• Remain committed to target CET1
ratio of 9.5% based on current
risk in our balance sheet
• Received no objection to planned
CCAR capital actions; Board
authorized share repurchase
program up to $1.47 billion, and
a 29% increase in quarterly
common stock dividend
• Repurchased $1 billion or 65.7
million shares of common stock
in the second half of 2017, and
declared $208 million in
dividends to common
shareholders
• Sufficient capital to support
organic growth, strategic
investments, and a robust return
to shareholders
($ in millions)
(1)
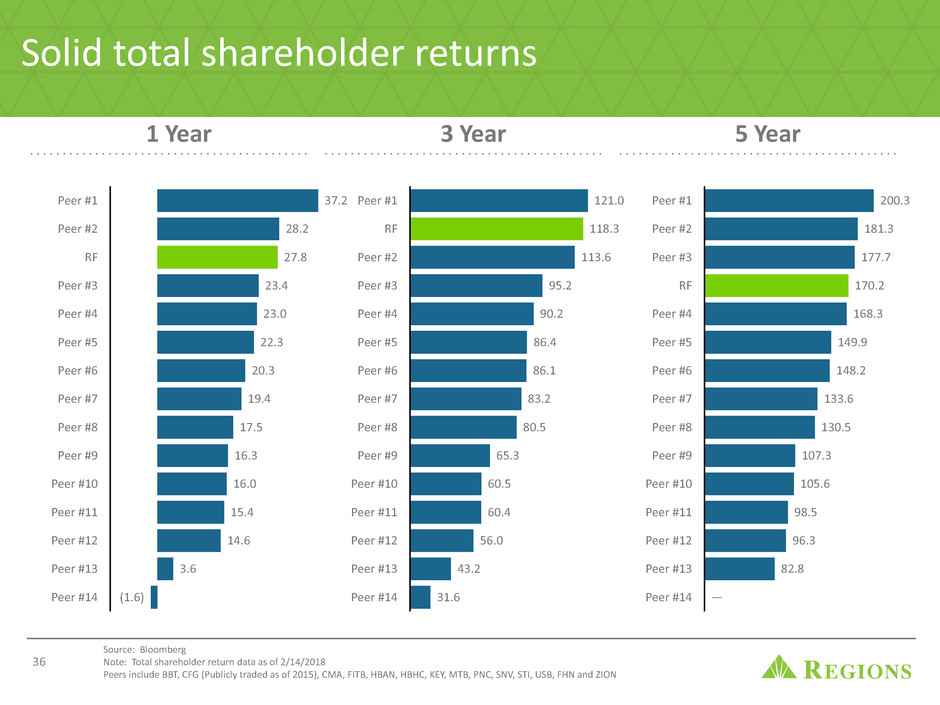
Solid total shareholder returns
Source: Bloomberg
Note: Total shareholder return data as of 2/14/2018
Peers include BBT, CFG (Publicly traded as of 2015), CMA, FITB, HBAN, HBHC, KEY, MTB, PNC, SNV, STI, USB, FHN and ZION
36
1 Year
Peer #1
Peer #2
RF
Peer #3
Peer #4
Peer #5
Peer #6
Peer #7
Peer #8
Peer #9
Peer #10
Peer #11
Peer #12
Peer #13
Peer #14
37.2
28.2
27.8
23.4
23.0
22.3
20.3
19.4
17.5
16.3
16.0
15.4
14.6
3.6
(1.6)
3 Year
Peer #1
RF
Peer #2
Peer #3
Peer #4
Peer #5
Peer #6
Peer #7
Peer #8
Peer #9
Peer #10
Peer #11
Peer #12
Peer #13
Peer #14
121.0
118.3
113.6
95.2
90.2
86.4
86.1
83.2
80.5
65.3
60.5
60.4
56.0
43.2
31.6
5 Year
Peer #1
Peer #2
Peer #3
RF
Peer #4
Peer #5
Peer #6
Peer #7
Peer #8
Peer #9
Peer #10
Peer #11
Peer #12
Peer #13
Peer #14
200.3
181.3
177.7
170.2
168.3
149.9
148.2
133.6
130.5
107.3
105.6
98.5
96.3
82.8
—
Long-term Targets
and 2018
Expectations
37
38
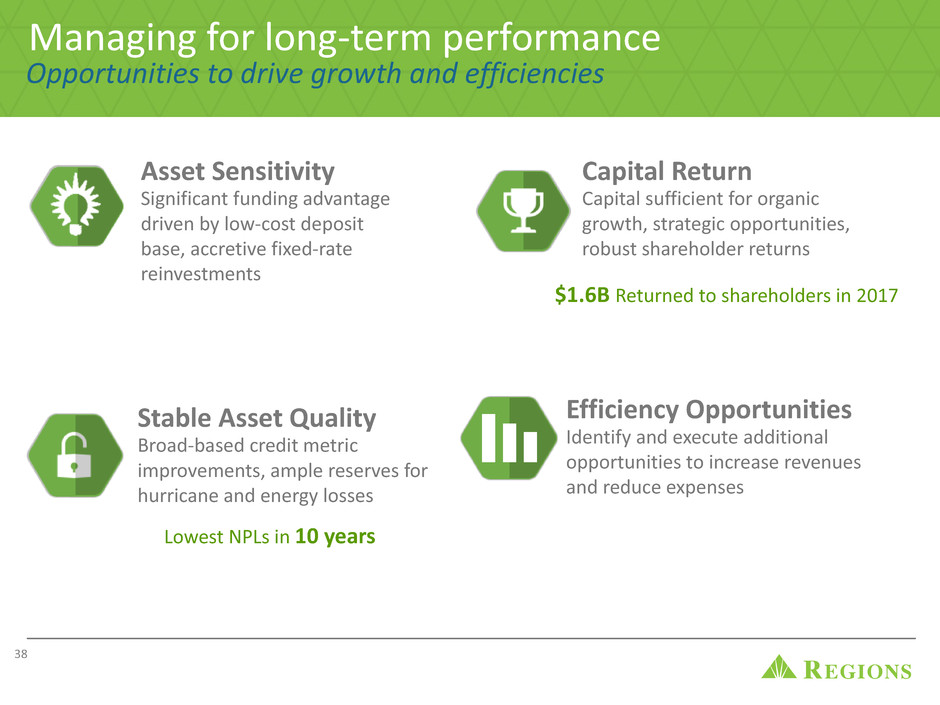
Asset Sensitivity
Significant funding advantage
driven by low-cost deposit
base, accretive fixed-rate
reinvestments
Stable Asset Quality
Broad-based credit metric
improvements, ample reserves for
hurricane and energy losses
Capital Return
Capital sufficient for organic
growth, strategic opportunities,
robust shareholder returns
Efficiency Opportunities
Identify and execute additional
opportunities to increase revenues
and reduce expenses
Lowest NPLs in 10 years
$1.6B Returned to shareholders in 2017
Managing for long-term performance
Opportunities to drive growth and efficiencies
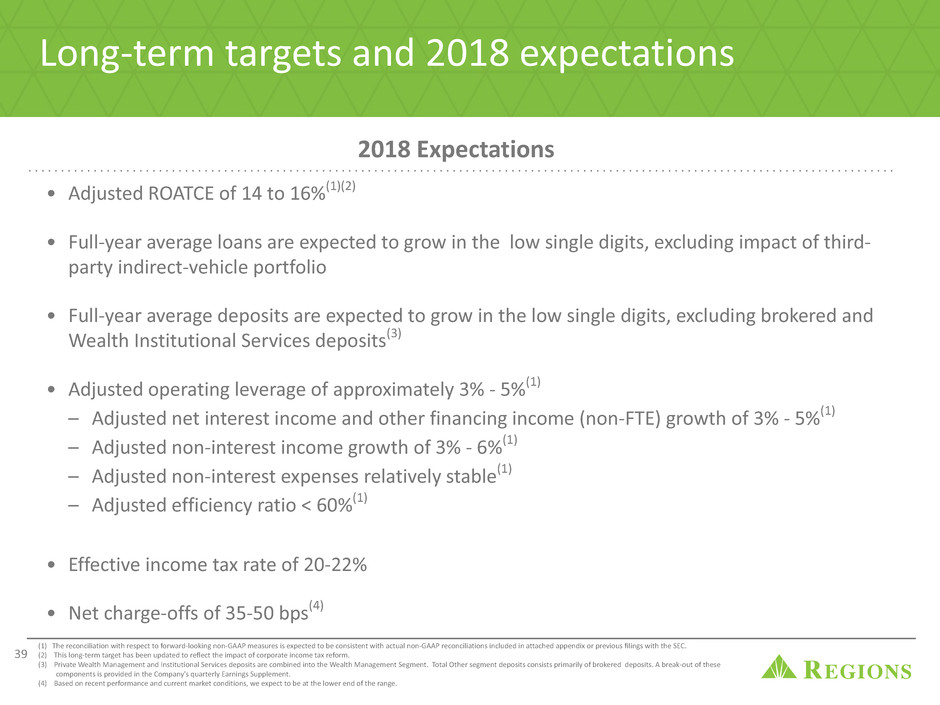
Long-term targets and 2018 expectations
• Adjusted ROATCE of 14 to 16%(1)(2)
• Full-year average loans are expected to grow in the low single digits, excluding impact of third-
party indirect-vehicle portfolio
• Full-year average deposits are expected to grow in the low single digits, excluding brokered and
Wealth Institutional Services deposits(3)
• Adjusted operating leverage of approximately 3% - 5%(1)
– Adjusted net interest income and other financing income (non-FTE) growth of 3% - 5%(1)
– Adjusted non-interest income growth of 3% - 6%(1)
– Adjusted non-interest expenses relatively stable(1)
– Adjusted efficiency ratio < 60%(1)
• Effective income tax rate of 20-22%
• Net charge-offs of 35-50 bps(4)
(1) The reconciliation with respect to forward-looking non-GAAP measures is expected to be consistent with actual non-GAAP reconciliations included in attached appendix or previous filings with the SEC.
(2) This long-term target has been updated to reflect the impact of corporate income tax reform.
(3) Private Wealth Management and Institutional Services deposits are combined into the Wealth Management Segment. Total Other segment deposits consists primarily of brokered deposits. A break-out of these
components is provided in the Company's quarterly Earnings Supplement.
(4) Based on recent performance and current market conditions, we expect to be at the lower end of the range.
2018 Expectations
39
40
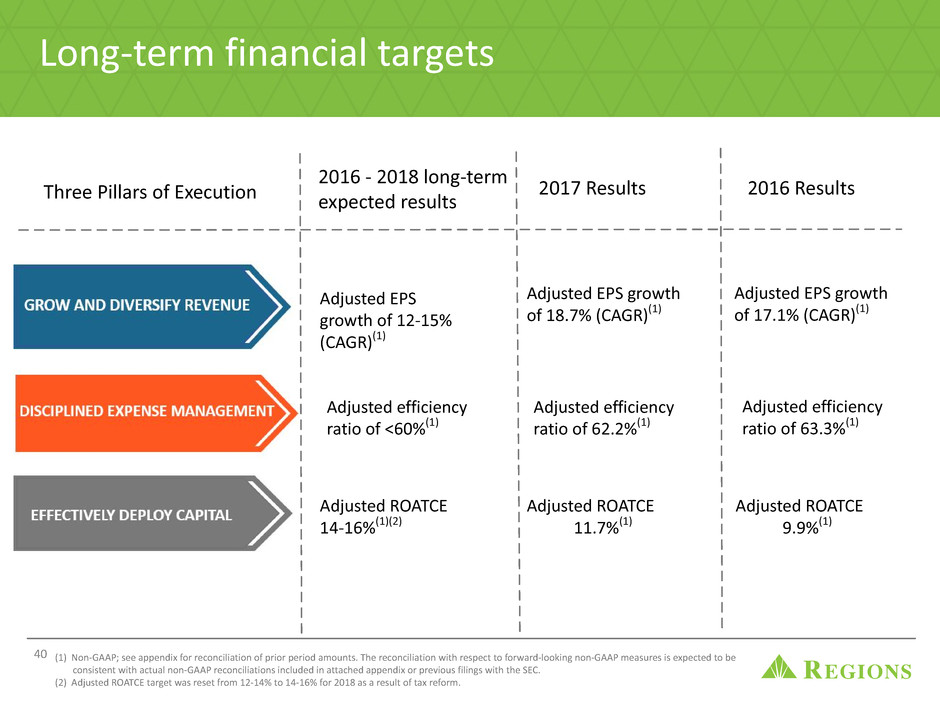
Long-term financial targets
Three Pillars of Execution
2016 - 2018 long-term
expected results
2017 Results 2016 Results
Adjusted efficiency
ratio of <60%(1)
Adjusted ROATCE
14-16%(1)(2)
Adjusted EPS
growth of 12-15%
(CAGR)(1)
Adjusted ROATCE
9.9%(1)
Adjusted efficiency
ratio of 63.3%(1)
Adjusted EPS growth
of 17.1% (CAGR)(1)
Adjusted ROATCE
11.7%(1)
Adjusted efficiency
ratio of 62.2%(1)
Adjusted EPS growth
of 18.7% (CAGR)(1)
(1) Non-GAAP; see appendix for reconciliation of prior period amounts. The reconciliation with respect to forward-looking non-GAAP measures is expected to be
consistent with actual non-GAAP reconciliations included in attached appendix or previous filings with the SEC.
(2) Adjusted ROATCE target was reset from 12-14% to 14-16% for 2018 as a result of tax reform.
Non-GAAP and
Forward Looking
Statements
41
NM - Not Meaningful
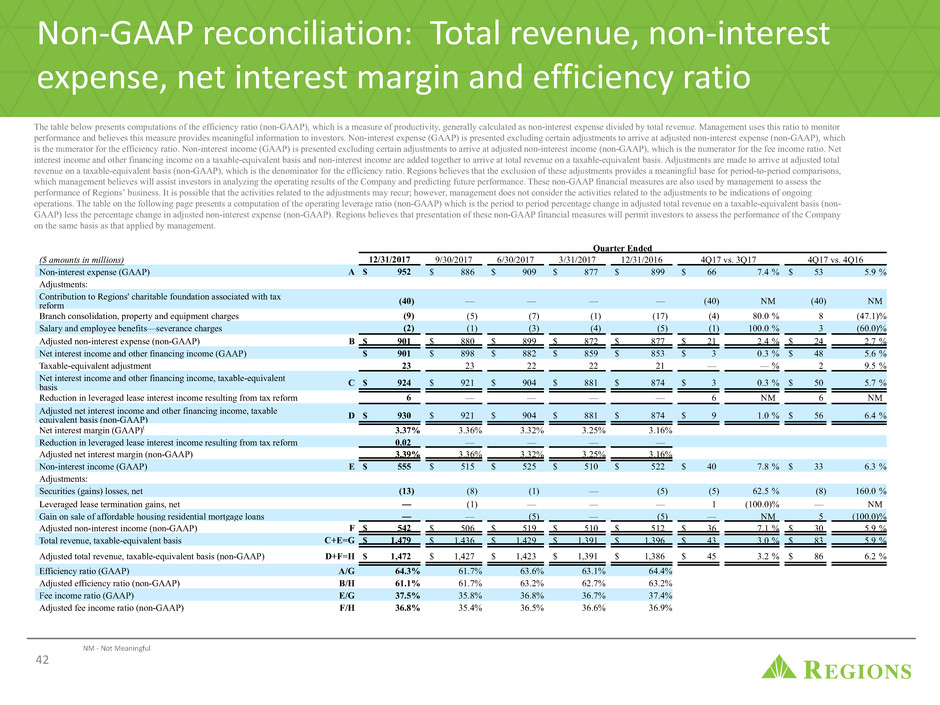
The table below presents computations of the efficiency ratio (non-GAAP), which is a measure of productivity, generally calculated as non-interest expense divided by total revenue. Management uses this ratio to monitor
performance and believes this measure provides meaningful information to investors. Non-interest expense (GAAP) is presented excluding certain adjustments to arrive at adjusted non-interest expense (non-GAAP), which
is the numerator for the efficiency ratio. Non-interest income (GAAP) is presented excluding certain adjustments to arrive at adjusted non-interest income (non-GAAP), which is the numerator for the fee income ratio. Net
interest income and other financing income on a taxable-equivalent basis and non-interest income are added together to arrive at total revenue on a taxable-equivalent basis. Adjustments are made to arrive at adjusted total
revenue on a taxable-equivalent basis (non-GAAP), which is the denominator for the efficiency ratio. Regions believes that the exclusion of these adjustments provides a meaningful base for period-to-period comparisons,
which management believes will assist investors in analyzing the operating results of the Company and predicting future performance. These non-GAAP financial measures are also used by management to assess the
performance of Regions’ business. It is possible that the activities related to the adjustments may recur; however, management does not consider the activities related to the adjustments to be indications of ongoing
operations. The table on the following page presents a computation of the operating leverage ratio (non-GAAP) which is the period to period percentage change in adjusted total revenue on a taxable-equivalent basis (non-
GAAP) less the percentage change in adjusted non-interest expense (non-GAAP). Regions believes that presentation of these non-GAAP financial measures will permit investors to assess the performance of the Company
on the same basis as that applied by management.
42
Non-GAAP reconciliation: Total revenue, non-interest
expense, net interest margin and efficiency ratio
Quarter Ended
($ amounts in millions) 12/31/2017 9/30/2017 6/30/2017 3/31/2017 12/31/2016 4Q17 vs. 3Q17 4Q17 vs. 4Q16
Non-interest expense (GAAP) A $ 952 $ 886 $ 909 $ 877 $ 899 $ 66 7.4 % $ 53 5.9 %
Adjustments:
Contribution to Regions' charitable foundation associated with tax
reform (40) — — — — (40) NM (40) NM
Branch consolidation, property and equipment charges (9) (5) (7) (1) (17) (4) 80.0 % 8 (47.1)%
Salary and employee benefits—severance charges (2) (1) (3) (4) (5) (1) 100.0 % 3 (60.0)%
Adjusted non-interest expense (non-GAAP) B $ 901 $ 880 $ 899 $ 872 $ 877 $ 21 2.4 % $ 24 2.7 %
Net interest income and other financing income (GAAP) $ 901 $ 898 $ 882 $ 859 $ 853 $ 3 0.3 % $ 48 5.6 %
Taxable-equivalent adjustment 23 23 22 22 21 — — % 2 9.5 %
Net interest income and other financing income, taxable-equivalent
basis C $ 924 $ 921 $ 904 $ 881 $ 874 $ 3 0.3 % $ 50 5.7 %
Reduction in leveraged lease interest income resulting from tax reform 6 — — — — 6 NM 6 NM
Adjusted net interest income and other financing income, taxable
equivalent basis (non-GAAP) D $ 930 $ 921 $ 904 $ 881 $ 874 $ 9 1.0 % $ 56 6.4 %
Net interest margin (GAAP)( 3.37% 3.36% 3.32% 3.25% 3.16%
Reduction in leveraged lease interest income resulting from tax reform 0.02 — — — —
Adjusted net interest margin (non-GAAP) 3.39% 3.36% 3.32% 3.25% 3.16%
Non-interest income (GAAP) E $ 555 $ 515 $ 525 $ 510 $ 522 $ 40 7.8 % $ 33 6.3 %
Adjustments:
Securities (gains) losses, net (13) (8) (1) — (5) (5) 62.5 % (8) 160.0 %
Leveraged lease termination gains, net — (1) — — — 1 (100.0)% — NM
Gain on sale of affordable housing residential mortgage loans — — (5) — (5) — NM 5 (100.0)%
Adjusted non-interest income (non-GAAP) F $ 542 $ 506 $ 519 $ 510 $ 512 $ 36 7.1 % $ 30 5.9 %
Total revenue, taxable-equivalent basis C+E=G $ 1,479 $ 1,436 $ 1,429 $ 1,391 $ 1,396 $ 43 3.0 % $ 83 5.9 %
Adjusted total revenue, taxable-equivalent basis (non-GAAP) D+F=H $ 1,472 $ 1,427 $ 1,423 $ 1,391 $ 1,386 $ 45 3.2 % $ 86 6.2 %
Efficiency ratio (GAAP) A/G 64.3% 61.7% 63.6% 63.1% 64.4%
Adjusted efficiency ratio (non-GAAP) B/H 61.1% 61.7% 63.2% 62.7% 63.2%
Fee income ratio (GAAP) E/G 37.5% 35.8% 36.8% 36.7% 37.4%
Adjusted fee income ratio (non-GAAP) F/H 36.8% 35.4% 36.5% 36.6% 36.9%
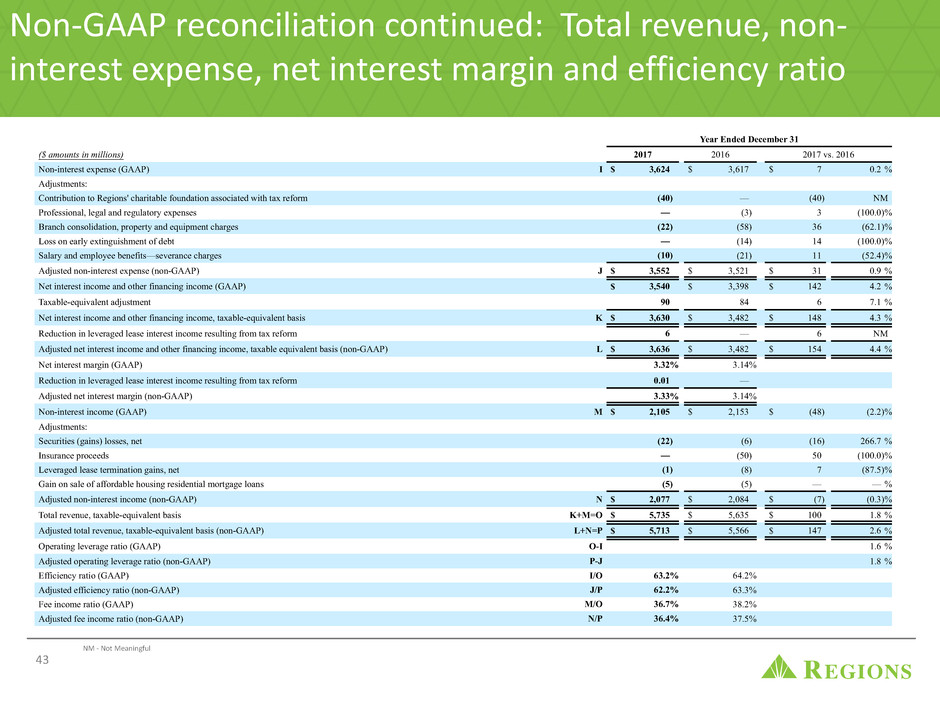
NM - Not Meaningful
43
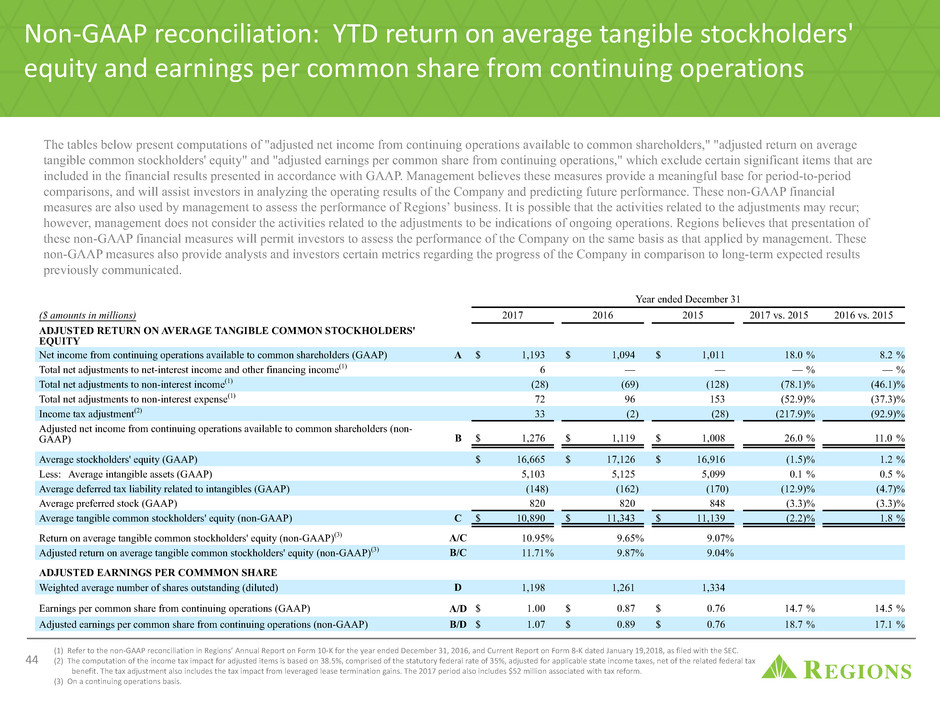
Year Ended December 31
($ amounts in millions) 2017 2016 2017 vs. 2016
Non-interest expense (GAAP) I $ 3,624 $ 3,617 $ 7 0.2 %
Adjustments:
Contribution to Regions' charitable foundation associated with tax reform (40) — (40) NM
Professional, legal and regulatory expenses — (3) 3 (100.0)%
Branch consolidation, property and equipment charges (22) (58) 36 (62.1)%
Loss on early extinguishment of debt — (14) 14 (100.0)%
Salary and employee benefits—severance charges (10) (21) 11 (52.4)%
Adjusted non-interest expense (non-GAAP) J $ 3,552 $ 3,521 $ 31 0.9 %
Net interest income and other financing income (GAAP) $ 3,540 $ 3,398 $ 142 4.2 %
Taxable-equivalent adjustment 90 84 6 7.1 %
Net interest income and other financing income, taxable-equivalent basis K $ 3,630 $ 3,482 $ 148 4.3 %
Reduction in leveraged lease interest income resulting from tax reform 6 — 6 NM
Adjusted net interest income and other financing income, taxable equivalent basis (non-GAAP) L $ 3,636 $ 3,482 $ 154 4.4 %
Net interest margin (GAAP) 3.32% 3.14%
Reduction in leveraged lease interest income resulting from tax reform 0.01 —
Adjusted net interest margin (non-GAAP) 3.33% 3.14%
Non-interest income (GAAP) M $ 2,105 $ 2,153 $ (48) (2.2)%
Adjustments:
Securities (gains) losses, net (22) (6) (16) 266.7 %
Insurance proceeds — (50) 50 (100.0)%
Leveraged lease termination gains, net (1) (8) 7 (87.5)%
Gain on sale of affordable housing residential mortgage loans (5) (5) — — %
Adjusted non-interest income (non-GAAP) N $ 2,077 $ 2,084 $ (7) (0.3)%
Total revenue, taxable-equivalent basis K+M=O $ 5,735 $ 5,635 $ 100 1.8 %
Adjusted total revenue, taxable-equivalent basis (non-GAAP) L+N=P $ 5,713 $ 5,566 $ 147 2.6 %
Operating leverage ratio (GAAP) O-I 1.6 %
Adjusted operating leverage ratio (non-GAAP) P-J 1.8 %
Efficiency ratio (GAAP) I/O 63.2% 64.2%
Adjusted efficiency ratio (non-GAAP) J/P 62.2% 63.3%
Fee income ratio (GAAP) M/O 36.7% 38.2%
Adjusted fee income ratio (non-GAAP) N/P 36.4% 37.5%
Non-GAAP reconciliation continued: Total revenue, non-
interest expense, net interest margin and efficiency ratio
Non-GAAP reconciliation: YTD return on average tangible stockholders'
equity and earnings per common share from continuing operations
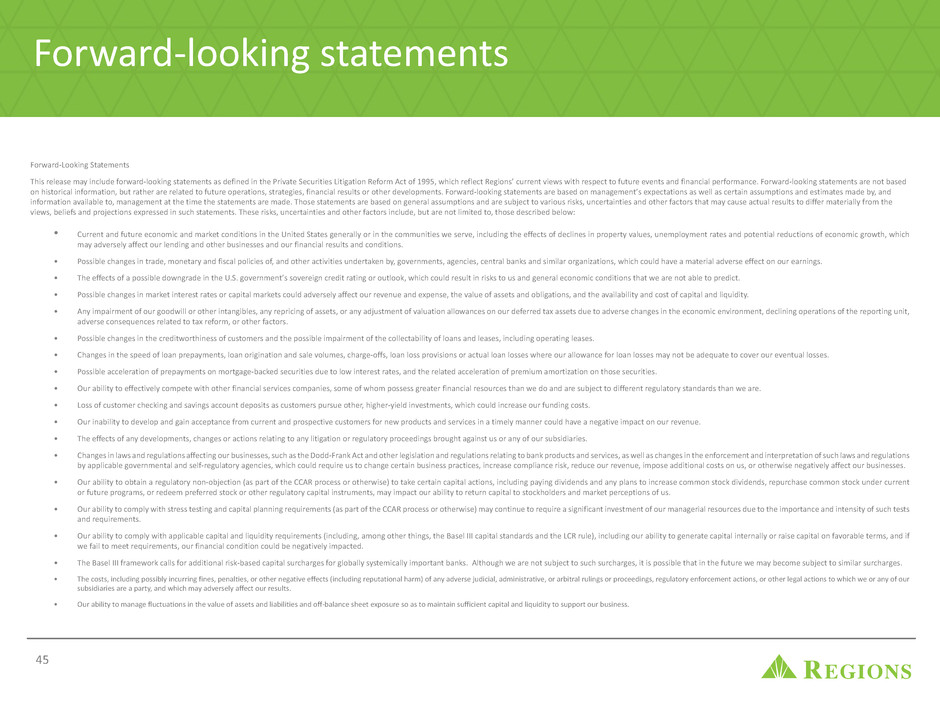
The tables below present computations of "adjusted net income from continuing operations available to common shareholders," "adjusted return on average
tangible common stockholders' equity" and "adjusted earnings per common share from continuing operations," which exclude certain significant items that are
included in the financial results presented in accordance with GAAP. Management believes these measures provide a meaningful base for period-to-period
comparisons, and will assist investors in analyzing the operating results of the Company and predicting future performance. These non-GAAP financial
measures are also used by management to assess the performance of Regions’ business. It is possible that the activities related to the adjustments may recur;
however, management does not consider the activities related to the adjustments to be indications of ongoing operations. Regions believes that presentation of
these non-GAAP financial measures will permit investors to assess the performance of the Company on the same basis as that applied by management. These
non-GAAP measures also provide analysts and investors certain metrics regarding the progress of the Company in comparison to long-term expected results
previously communicated.
44
Year ended December 31
($ amounts in millions) 2017 2016 2015 2017 vs. 2015 2016 vs. 2015
ADJUSTED RETURN ON AVERAGE TANGIBLE COMMON STOCKHOLDERS'
EQUITY
Net income from continuing operations available to common shareholders (GAAP) A $ 1,193 $ 1,094 $ 1,011 18.0 % 8.2 %
Total net adjustments to net-interest income and other financing income(1) 6 — — — % — %
Total net adjustments to non-interest income(1) (28) (69) (128) (78.1)% (46.1)%
Total net adjustments to non-interest expense(1) 72 96 153 (52.9)% (37.3)%
Income tax adjustment(2) 33 (2) (28) (217.9)% (92.9)%
Adjusted net income from continuing operations available to common shareholders (non-
GAAP) B $ 1,276 $ 1,119 $ 1,008 26.0 % 11.0 %
Average stockholders' equity (GAAP) $ 16,665 $ 17,126 $ 16,916 (1.5)% 1.2 %
Less: Average intangible assets (GAAP) 5,103 5,125 5,099 0.1 % 0.5 %
Average deferred tax liability related to intangibles (GAAP) (148) (162) (170) (12.9)% (4.7)%
Average preferred stock (GAAP) 820 820 848 (3.3)% (3.3)%
Average tangible common stockholders' equity (non-GAAP) C $ 10,890 $ 11,343 $ 11,139 (2.2)% 1.8 %
Return on average tangible common stockholders' equity (non-GAAP)(3) A/C 10.95% 9.65% 9.07%
Adjusted return on average tangible common stockholders' equity (non-GAAP)(3) B/C 11.71% 9.87% 9.04%
ADJUSTED EARNINGS PER COMMMON SHARE
Weighted average number of shares outstanding (diluted) D 1,198 1,261 1,334
Earnings per common share from continuing operations (GAAP) A/D $ 1.00 $ 0.87 $ 0.76 14.7 % 14.5 %
Adjusted earnings per common share from continuing operations (non-GAAP) B/D $ 1.07 $ 0.89 $ 0.76 18.7 % 17.1 %
(1) Refer to the non-GAAP reconciliation in Regions’ Annual Report on Form 10-K for the year ended December 31, 2016, and Current Report on Form 8-K dated January 19,2018, as filed with the SEC.
(2) The computation of the income tax impact for adjusted items is based on 38.5%, comprised of the statutory federal rate of 35%, adjusted for applicable state income taxes, net of the related federal tax
benefit. The tax adjustment also includes the tax impact from leveraged lease termination gains. The 2017 period also includes $52 million associated with tax reform.
(3) On a continuing operations basis.
Forward-looking statements
45
Forward-Looking Statements
This release may include forward-looking statements as defined in the Private Securities Litigation Reform Act of 1995, which reflect Regions’ current views with respect to future events and financial performance. Forward-looking statements are not based
on historical information, but rather are related to future operations, strategies, financial results or other developments. Forward-looking statements are based on management’s expectations as well as certain assumptions and estimates made by, and
information available to, management at the time the statements are made. Those statements are based on general assumptions and are subject to various risks, uncertainties and other factors that may cause actual results to differ materially from the
views, beliefs and projections expressed in such statements. These risks, uncertainties and other factors include, but are not limited to, those described below:
• Current and future economic and market conditions in the United States generally or in the communities we serve, including the effects of declines in property values, unemployment rates and potential reductions of economic growth, which
may adversely affect our lending and other businesses and our financial results and conditions.
• Possible changes in trade, monetary and fiscal policies of, and other activities undertaken by, governments, agencies, central banks and similar organizations, which could have a material adverse effect on our earnings.
• The effects of a possible downgrade in the U.S. government’s sovereign credit rating or outlook, which could result in risks to us and general economic conditions that we are not able to predict.
• Possible changes in market interest rates or capital markets could adversely affect our revenue and expense, the value of assets and obligations, and the availability and cost of capital and liquidity.
• Any impairment of our goodwill or other intangibles, any repricing of assets, or any adjustment of valuation allowances on our deferred tax assets due to adverse changes in the economic environment, declining operations of the reporting unit,
adverse consequences related to tax reform, or other factors.
• Possible changes in the creditworthiness of customers and the possible impairment of the collectability of loans and leases, including operating leases.
• Changes in the speed of loan prepayments, loan origination and sale volumes, charge-offs, loan loss provisions or actual loan losses where our allowance for loan losses may not be adequate to cover our eventual losses.
• Possible acceleration of prepayments on mortgage-backed securities due to low interest rates, and the related acceleration of premium amortization on those securities.
• Our ability to effectively compete with other financial services companies, some of whom possess greater financial resources than we do and are subject to different regulatory standards than we are.
• Loss of customer checking and savings account deposits as customers pursue other, higher-yield investments, which could increase our funding costs.
• Our inability to develop and gain acceptance from current and prospective customers for new products and services in a timely manner could have a negative impact on our revenue.
• The effects of any developments, changes or actions relating to any litigation or regulatory proceedings brought against us or any of our subsidiaries.
• Changes in laws and regulations affecting our businesses, such as the Dodd-Frank Act and other legislation and regulations relating to bank products and services, as well as changes in the enforcement and interpretation of such laws and regulations
by applicable governmental and self-regulatory agencies, which could require us to change certain business practices, increase compliance risk, reduce our revenue, impose additional costs on us, or otherwise negatively affect our businesses.
• Our ability to obtain a regulatory non-objection (as part of the CCAR process or otherwise) to take certain capital actions, including paying dividends and any plans to increase common stock dividends, repurchase common stock under current
or future programs, or redeem preferred stock or other regulatory capital instruments, may impact our ability to return capital to stockholders and market perceptions of us.
• Our ability to comply with stress testing and capital planning requirements (as part of the CCAR process or otherwise) may continue to require a significant investment of our managerial resources due to the importance and intensity of such tests
and requirements.
• Our ability to comply with applicable capital and liquidity requirements (including, among other things, the Basel III capital standards and the LCR rule), including our ability to generate capital internally or raise capital on favorable terms, and if
we fail to meet requirements, our financial condition could be negatively impacted.
• The Basel III framework calls for additional risk-based capital surcharges for globally systemically important banks. Although we are not subject to such surcharges, it is possible that in the future we may become subject to similar surcharges.
• The costs, including possibly incurring fines, penalties, or other negative effects (including reputational harm) of any adverse judicial, administrative, or arbitral rulings or proceedings, regulatory enforcement actions, or other legal actions to which we or any of our
subsidiaries are a party, and which may adversely affect our results.
• Our ability to manage fluctuations in the value of assets and liabilities and off-balance sheet exposure so as to maintain sufficient capital and liquidity to support our business.
Forward-looking statements continued
46
• Our ability to execute on our strategic and operational plans, including our ability to fully realize the financial and non-financial benefits relating to our strategic initiatives.
• The success of our marketing efforts in attracting and retaining customers.
• Possible changes in consumer and business spending and saving habits and the related effect on our ability to increase assets and to attract deposits, which could adversely affect our net income.
• Our ability to recruit and retain talented and experienced personnel to assist in the development, management and operation of our products and services may be affected by changes in laws and regulations in effect from time to time.
• Fraud or misconduct by our customers, employees or business partners.
• Any inaccurate or incomplete information provided to us by our customers or counterparties.
• The risks and uncertainties related to our acquisition and integration of other companies.
• Inability of our framework to manage risks associated with our business such as credit risk and operational risk, including third-party vendors and other service providers, which could, among other things, result in a breach of operating or security
systems as a result of a cyber attack or similar act.
• The inability of our internal disclosure controls and procedures to prevent, detect or mitigate any material errors or fraudulent acts.
• The effects of geopolitical instability, including wars, conflicts and terrorist attacks and the potential impact, directly or indirectly, on our businesses.
• The effects of man-made and natural disasters, including fires, floods, droughts, tornadoes, hurricanes, and environmental damage, which may negatively affect our operations and/or our loan portfolios and increase our cost of conducting business.
• Changes in commodity market prices and conditions could adversely affect the cash flows of our borrowers operating in industries that are impacted by changes in commodity prices (including businesses indirectly impacted by commodities prices
such as businesses that transport commodities or manufacture equipment used in the production of commodities), which could impair their ability to service any loans outstanding to them and/or reduce demand for loans in those industries.
• Our inability to keep pace with technological changes could result in losing business to competitors.
• Our ability to identify and address cyber-security risks such as data security breaches, malware, “denial of service” attacks, “hacking” and identity theft, a failure of which could disrupt our business and result in the disclosure of and/or misuse or
misappropriation of confidential or proprietary information; disruption or damage to our systems; increased costs; losses; or adverse effects to our reputation.
• Our ability to realize our adjusted efficiency ratio target as part of our expense management initiatives.
• Significant disruption of, or loss of public confidence in, the Internet and services and devices used to access the Internet could affect the ability of our customers to access their accounts and conduct banking transactions.
• Possible downgrades in our credit ratings or outlook could increase the costs of funding from capital markets.
• The effects of problems encountered by other financial institutions that adversely affect us or the banking industry generally could require us to change certain business practices, reduce our revenue, impose additional costs on us, or otherwise
negatively affect our businesses.
• The effects of the failure of any component of our business infrastructure provided by a third party could disrupt our businesses; result in the disclosure of and/or misuse of confidential information or proprietary information; increase our costs;
negatively affect our reputation; and cause losses.
• Our ability to receive dividends from our subsidiaries could affect our liquidity and ability to pay dividends to stockholders.
• Changes in accounting policies or procedures as may be required by the FASB or other regulatory agencies could materially affect how we report our financial results.
• Other risks identified from time to time in reports that we file with the SEC.
• The effects of any damage to our reputation resulting from developments related to any of the items identified above.
The foregoing list of factors is not exhaustive. For discussion of these and other factors that may cause actual results to differ from expectations, look under the captions “Forward-Looking Statements” and “Risk Factors” of Regions’ Annual Report on Form 10-
K for the year ended December 31, 2016, as filed with the SEC.
The words “anticipates,” “intends,” “plans,” “seeks,” “believes,” “estimates,” “expects,” “targets,” “projects,” “outlook,” “forecast,” “will,” “may,” “could,” “should,” “can,” and similar expressions often signify forward-looking statements. You should not place
undue reliance on any forward-looking statements, which speak only as of the date made. We assume no obligation to update or revise any forward-looking statements that are made from time to time.
Regions’ Investor Relations contact is Dana Nolan at (205) 264-7040; Regions’ Media contact is Evelyn Mitchell at (205) 264-4551.
®
47
