Attached files
| file | filename |
|---|---|
| EX-32.2 - Inovalon Holdings, Inc. | exhibit322-12312017.htm |
| EX-32.1 - Inovalon Holdings, Inc. | exhibit321-12312017.htm |
| EX-31.2 - Inovalon Holdings, Inc. | exhibit312-12312017.htm |
| EX-31.1 - Inovalon Holdings, Inc. | exhibit311-12312017.htm |
| EX-23.1 - Inovalon Holdings, Inc. | exhibit231-12312017.htm |
| EX-21.1 - Inovalon Holdings, Inc. | exhibit211-12312017.htm |
| EX-10.24 - Inovalon Holdings, Inc. | exhibit1024-12312017.htm |
| EX-10.23 - Inovalon Holdings, Inc. | exhibit1023-12312017.htm |
| EX-10.22 - Inovalon Holdings, Inc. | exhibit1022-12312017.htm |
UNITED STATES
SECURITIES AND EXCHANGE COMMISSION
WASHINGTON, D.C. 20549
FORM 10-K
(Mark One) | ||
ý | ANNUAL REPORT PURSUANT TO SECTION 13 OR 15(d) OF THE SECURITIES EXCHANGE ACT OF 1934 | |
For the fiscal year ended December 31, 2017
or
o | TRANSITION REPORT PURSUANT TO SECTION 13 OR 15(d) OF THE SECURITIES EXCHANGE ACT OF 1934 | |
For the transition period from to
Commission file number: 001-36841
INOVALON HOLDINGS, INC.
(Exact Name of Registrant as Specified in Its Charter)
Delaware (State or Other Jurisdiction of Incorporation or Organization) | 47-1830316 (IRS Employer Identification No.) |
4321 Collington Road Bowie, Maryland (Address of Principal Executive Offices) | 20716 (Zip Code) |
(301) 809-4000
Registrant’s Telephone Number, Including Area Code
Securities registered pursuant to Section 12(b) of the Act:
Title of Each Class | Name Of Each Exchange On Which Registered | |
Class A Common Stock, $0.000005 par value per share | NASDAQ Global Select Market | |
Securities registered pursuant to Section 12(g) of the Act: None
Indicate by check mark if the registrant is a well-known seasoned issuer, as defined in Rule 405 of the Securities Act. Yes ý No o
Indicate by check mark if the registrant is not required to file reports pursuant to Section 13 or 15(d) of the Act. Yes o No ý
Indicate by check mark whether the registrant (1) has filed all reports required to be filed by Section 13 or 15(d) of the Securities Exchange Act of 1934 during the preceding 12 months (or for such shorter period that the registrant was required to file such reports), and (2) has been subject to such filing requirements for the past 90 days. Yes ý No o
Indicate by check mark whether the registrant has submitted electronically and posted on its corporate web site, if any, every Interactive Data File required to be submitted and posted pursuant to Rule 405 of Regulation S-T (§ 232.405 of this chapter) during the preceding 12 months (or for such shorter period that the registrant was required to submit and post such files). Yes ý No o
Indicate by check mark if disclosure of delinquent filers pursuant to Item 405 of Regulation S-K (§ 229.405) is not contained herein, and will not be contained, to the best of registrant’s knowledge, in definitive proxy or information statements incorporated by reference in Part III of this Form 10-K or any amendment to this Form 10-K. o
Indicate by check mark whether the registrant is a large accelerated filer, an accelerated filer, a non-accelerated filer, or a smaller reporting company. See the definitions of “large accelerated filer,” “accelerated filer” and “smaller reporting company” in Rule 12b-2 of the Exchange Act. (Check one):
Large accelerated filer x | Accelerated filer o | Non-accelerated filer o (Do not check if a smaller reporting company) | Smaller reporting company o Emerging growth company o | |||
If an emerging growth company, indicate by check mark if the registrant has elected not to use the extended transition period for complying with any new or revised financial accounting standards provided pursuant to Section 13(a) of the Exchange Act. o
Indicate by check mark whether the registrant is a shell company (as defined in Rule 12b-2 of the Act). Yes o No ý
As of June 30, 2017, the last business day of the registrant’s most recently completed second fiscal quarter, aggregate market value of the voting stock (common stock) held by non-affiliates of the registrant was approximately $683.2 million.
As of February 9, 2018, the registrant had 63,445,573 shares of Class A common stock outstanding and 80,957,495 shares of Class B common stock outstanding.
Documents Incorporated by Reference
The information required by Part III (Items 10, 11, 12, 13 and 14) will be incorporated by reference from the Registrant’s definitive proxy statement relating to its 2018 annual meeting of stockholders (the “2018 Proxy Statement”). The 2018 Proxy Statement will be filed with the U.S. Securities and Exchange Commission within 120 days after the end of the fiscal year to which this report relates.
INOVALON HOLDINGS, INC.
FORM 10-K
FOR THE FISCAL YEAR ENDED DECEMBER 31, 2017
TABLE OF CONTENTS
F-1 | ||
i
SPECIAL NOTE REGARDING FORWARD-LOOKING STATEMENTS
This Annual Report on Form 10-K contains forward-looking statements within the meaning of Section 27A of the Securities Act of 1933, as amended (the “Securities Act”), and Section 21E of the Securities Exchange Act of 1934, as amended (the “Exchange Act”). All statements contained in this Annual Report other than statements of historical fact, including but not limited to statements regarding our future results of operations and financial position, our business strategy and plans, market growth, and our objectives for future operations, are forward-looking statements. The words “believe,” “may,” “see,” “will,” “estimate,” “continue,” “anticipate,” “intend,” “expect,” and similar expressions are intended to identify forward-looking statements. We have based these forward-looking statements largely on our current expectations and projections about future events and trends that we believe may affect our financial condition, results of operations, business strategy, short-term and long-term business operations and objectives and financial needs. Moreover, we operate in a very competitive and rapidly changing environment. New risks emerge from time to time. It is not possible for our management to predict all risks, nor can we assess the impact of all factors on our business or the extent to which any factor, or combination of factors, may cause actual results to differ materially from those contained in any forward-looking statements we may make. In light of these risks, uncertainties and assumptions, the future events and trends discussed in this Annual Report may not occur and actual results could differ materially and adversely from those anticipated or implied in the forward-looking statements.
Factors that may cause actual results to differ from expected results include, among others:
• | our future financial performance, including our ability to continue and manage our growth; |
• | our ability to retain our client base and sell additional services to them; |
• | the effect of the concentration of our revenue among our top clients; |
• | our ability to innovate and adapt our platforms and toolsets; |
• | the effects of regulations applicable to us, including regulations relating to data protection and data privacy; |
• | the effects of consolidation in the healthcare industry; |
• | the ability to successfully integrate our acquisitions and the ability of the acquired business to perform as expected; |
• | the ability to enter into new agreements with existing or new platforms, products, and solutions in the timeframes expected, or at all; |
• | the successful implementation and adoption of new platforms, products and solutions; |
• | the effects of changes in tax legislation for jurisdictions within which we operate, including recent changes in U.S. tax laws; |
• | the ability to protect the privacy of our clients’ data and prevent security breaches; |
• | the effect of current or future litigation; |
• | the effect of competition on our business; and |
• | the efficacy of our platforms and toolsets. |
Forward-looking statements are only current predictions and are subject to known and unknown risks, uncertainties, and other factors that may cause our actual results, levels of activity, performance, or achievements to be materially different from those anticipated by such statements. These factors include, among other factors, those set forth in Part I, Item 1A, “Risk Factors.”
You should not rely upon forward-looking statements as predictions of future events. The events and circumstances reflected in the forward-looking statements may not be achieved or occur. Although we believe that the expectations reflected in the forward-looking statements are reasonable, we cannot guarantee future results, levels of activity, performance, or achievements. We are under no duty to, and we disclaim any obligation to, update any of these forward-looking statements after the date of this Annual Report or to conform these statements to actual results or revised expectations.
ii
PART I
Explanatory Note Regarding Market Information: This Annual Report on Form 10-K includes market data and forecasts with respect to the healthcare industry. Although we are responsible for all of the disclosure contained in this Annual Report, in some cases we rely on and refer to market data and certain industry forecasts that were obtained from third party surveys, market research, consultant surveys, publicly available information and industry publications and surveys that we believe to be reliable.
Item 1. Business.
Our Company
We are a leading technology company providing cloud-based platforms empowering a data-driven transformation from volume-based to value-based models throughout the healthcare industry. Through the Inovalon ONE™ Platform, Inovalon brings to the marketplace a national-scale capability to interconnect with the healthcare ecosystem on a very large scale, aggregate and analyze data in petabyte volumes to arrive at sophisticated insights in real-time, drive impact wherever it is analytically identified best to intervene, and intuitively visualize data and information to inform business strategy and execution. Leveraging its platform capabilities, large proprietary data sets, and industry-leading subject matter expertise, Inovalon enables the assessment and improvement of clinical and quality outcomes and financial performance across the healthcare ecosystem. From health plans and provider organizations, to pharmaceutical, medical device, and diagnostics companies, Inovalon’s unique achievement of value is delivered through the effective progression of “Turning Data into Insight, and Insight into Action®.” Providing technology that supports a client base approaching 500 healthcare organizations, Inovalon’s platforms are informed by data pertaining to more than 932,000 physicians, 455,000 clinical facilities, 240 million individuals, and 37 billion medical events.
We generate the substantial majority of our revenue through the sale or subscription licensing of our cloud-based data analytics, intervention and reporting platforms and related support services.
On September 17, 2014, Inovalon, Inc. implemented a holding company reorganization, pursuant to which Inovalon Holdings, Inc. became the new parent company of Inovalon, Inc. and Inovalon, Inc. became the direct, wholly owned subsidiary of the Company. The Company was incorporated in the state of Delaware on September 11, 2014. Inovalon, Inc. was incorporated in the state of Delaware on November 18, 2005. In this Annual Report, unless we indicate otherwise or the context requires, references to the “Company,” “Inovalon,” “we,” “our,” “ours,” and “us” refer to Inovalon Holdings, Inc. and its consolidated subsidiaries.
Industry Overview and Demand Drivers
The Company believes that healthcare is increasingly becoming data-driven in nature, transactional in design, real-time in speed, and ultimately consumer-centric in focus. Driven by the first waves of disease-burden based reimbursement models and quality incentive programs, data has gained an increasing role in the U.S. healthcare system. Data is increasingly a competitive differentiator, as its aggregation, analysis, validation, and associated connectivity can be leveraged to identify individual patients’ unique needs, refine care plans, speed drug discovery and commercialization, reduce waste, expand the value proposition of medications and medical devices, and streamline healthcare workflows and supply chains. As transparency into the many facets of healthcare increases, the Company believes the pace of the industry’s transformation will accelerate, ultimately placing the consumer at the center as they play an increasingly active role in their care.
We believe that demand for our offerings is driven by the confluence of a number of fundamental healthcare industry trends, including:
Shift to Value-Based Healthcare. The healthcare industry is undergoing a significant transformation, driven by a shift from volume-based models to value-based and outcome-based models. The traditional fee-for-service reimbursement model in healthcare has played a major role in elevating both the level and growth rate of healthcare spending. In response, both the public and private sectors are shifting away from the historical fee-for-service (volume-based) models toward value-based, capitated payment models that are designed to incentivize value and quality at an individual patient level. The number of Americans covered by capitated payment programs (care programs wherein an organization is financially responsible for the healthcare of a population of patients for which the total compensation is fixed other than adjustments for factors including specifically how sick individual patients are, how much resource is needed to be applied or spent on each patient, what is the quality of the clinical care, and other demographic factors) continues to increase, according to industry sources and our internal estimates. This increase is expected to further drive the critical importance to accurately measure, analyze, report, and improve patient disease and comorbidity conditions, utilization rates, and clinical quality outcomes. Further, this shift from volume-based to value-based and outcome-based models is increasingly impacting other segments of the healthcare industry, including pharmaceutical companies, healthcare providers, medical device manufacturers, and diagnostics companies. For example, pharmaceutical companies are increasingly pursuing outcomes-based contracting (“OBC”) arrangements with health plans in
1
order to leverage data and analytics to demonstrate value and improve care outcomes. This is particularly true as a large number of new, complex, and expensive specialty treatments are expected to enter the market over the coming years.
Digitization of Healthcare Information. Across the healthcare landscape, a significant amount of data is being created every day, driven by patient care, payment systems, regulatory compliance, and record keeping. These data include information within patient health records, clinical trials, pharmacy benefit programs, imaging systems, sensors and monitoring platforms, laboratory results, patient reported information, hospital and physician performance programs, and billing and payment processing. However, despite significant investments by public and private sources within the industry, the digitized healthcare data remain largely stored in “walled gardens”—data that is static and not easily shared or interpreted. As the amount of data in healthcare continues to grow, we believe that it will be critical for participants across the healthcare industry to be able to analyze this disparate data and apply insights in a targeted manner in order to better achieve the goals of higher quality and more efficient care.
Healthcare Becoming Increasingly Consumer-centric. Increasingly, the patient (the consumer of healthcare) wants to take a more active and informed role in how their own individual healthcare is delivered - how to select their health plan and based on what information, how to select and interact with a physician, how to determine whether or not to have a particular surgical procedure or whether or not to take a particular medication, etc. Similar to other industries including financial services, retail, and entertainment, the healthcare marketplace is becoming increasingly consumer-centric. This transformation means that interactions in healthcare are becoming increasingly data-driven, transactional, and real-time in nature, all of which require increasingly sophisticated data ingestion and analytical capabilities, extensive industry connectivity, and high-speed, scalable, and secure compute infrastructures.
Increasing Complexity. The healthcare industry is on a course of dramatically progressive complexity. As technology employed in the healthcare space has become increasingly sophisticated, new diagnostics and treatments have been introduced, the pool of clinical research has expanded, and the paradigms dictating payment and regulatory oversight have multiplied. This expanding complexity drives a growing and continuous need for the aggregation, analysis, and targeted application of the underlying and resulting data.
Unsustainable Rise in Healthcare Costs. According to the 2017 National Health Expenditure Projections prepared by the Centers for Medicare and Medicaid Services (“CMS”), healthcare spending in the U.S. is projected to have increased 4.6% on a year-over-year basis to $3.5 trillion in 2017, representing 17.9% of U.S. Gross Domestic Product (“GDP”). CMS projects healthcare spending in the U.S. to increase to approximately 20% of GDP by 2026. To address this expected significant rise in healthcare costs, the U.S. healthcare market is seeking more efficient and effective methods of delivering care. This same trend is playing out across modernized nations around the globe.
Our Market Opportunity
We believe that our market opportunity is significant and growing. The ability to aggregate, integrate, and analyze data on a massive scale and apply garnered insights in a manner that achieves meaningful impact is crucial for healthcare payers (e.g., health plans and integrated health delivery systems), healthcare providers (e.g., hospitals, accountable care organizations (“ACOs”), post-acute care providers, and physicians), pharmaceutical companies (e.g., medication discovery and manufacturers, specialty pharmacies, retail pharmacies, pharmacy benefit management companies), medical device manufacturers, diagnostics companies, and consumers.
2
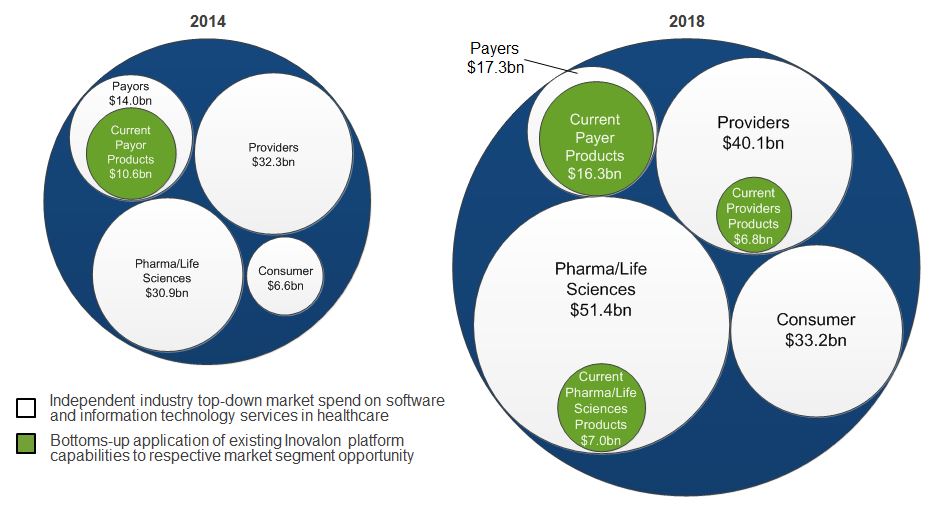
According to third-party industry estimates, the addressable market for software and related services capabilities serving these healthcare constituents is approximately $142 billion in 2018, up from approximately $84 billion in 2014. According to industry sources, the market for software and related services is approximately $17.3 billion within the U.S. payer market. We believe that as analytics continue to demonstrate greater value within the U.S. payer landscape, the market will expand commensurately. We believe that the market opportunity for our current offerings within the payer market, the historical focus of our Company, is approximately $16.3 billion. As we continue to build and launch new capabilities, we believe analytics will provide a significantly larger value opportunity within this same payer space. For providers, industry sources estimate that software and related services represent a $40.1 billion U.S. market size. We believe that the market opportunity for our current offerings within the provider market is approximately $6.8 billion. In the pharmaceutical and life-sciences market, industry sources estimate a $51.4 billion market size for total software and related services spend. We believe that the market opportunity for our current offerings within the pharmaceutical and life-sciences market is approximately $7.0 billion, largely driven by our acquisitions of Avalere Health, Inc. (“Avalere”), a leading provider of data-driven advisory services and business intelligence solutions in the pharmaceutical and life sciences industry, in 2015, and Creehan Holding Co., Inc. (“Creehan”), a leader in specialty pharmacy software platforms, in 2016. In the consumer market, industry sources estimate a $33.2 billion global market size for mobile health applications and solutions. We believe that, over time, analytics will also drive a significant opportunity expansion in the consumer market, as consumers seek to take a more active and informed role in how their healthcare is delivered.
_______________________________________
Source: Gartner, IDC, Research and Markets and Inovalon (with methodology validated by HMA).
In addition, the pressures that face the U.S. healthcare market are not unique, as other communities around the world are facing aging populations and growing pressures in the sustainable affordability of healthcare. We believe that our capabilities are highly applicable to other developed and developing countries around the globe, which we believe represents a sizable related future opportunity for our Company.
The Inovalon ONE™ Platform
Inovalon provides a technology platform that enables healthcare organizations to implement highly sophisticated value-based initiatives in very large scale. At the core of value-based initiatives is the need to aggregate and analyze data, garner meaningful insight from the results, and use these insights to drive material change to outcomes and economics. To achieve this, four competencies are needed: 1) large-scale data connectivity, integration, and validation capabilities, 2) advanced predictive analytics and high-speed compute, 3) toolsets to translate resulting insights into real-world impact, and 4) purpose-built data visualization and reporting. To inform and enable these competencies, Inovalon brings to bear large-scale datasets, expansive connectivity, robust technology infrastructure, and industry-leading subject matter expertise.
3
The Inovalon ONE™ Platform is an integrated native cloud-based platform of more than 80 individual proprietary toolsets. Each toolset is referred to as a “Component,” with each supporting critical healthcare ecosystem functional needs. Components are configured into integrated sets identified as “Modules,” each of which share cohesive interoperability and common data management. The Inovalon ONE™ Platform brings to the marketplace a highly extensible, national-scale capability to interconnect with the healthcare ecosystem on a very large scale, aggregate and analyze data in petabyte volumes, arrive at sophisticated insights in real-time, and drive impact wherever it is analytically identified best to intervene.
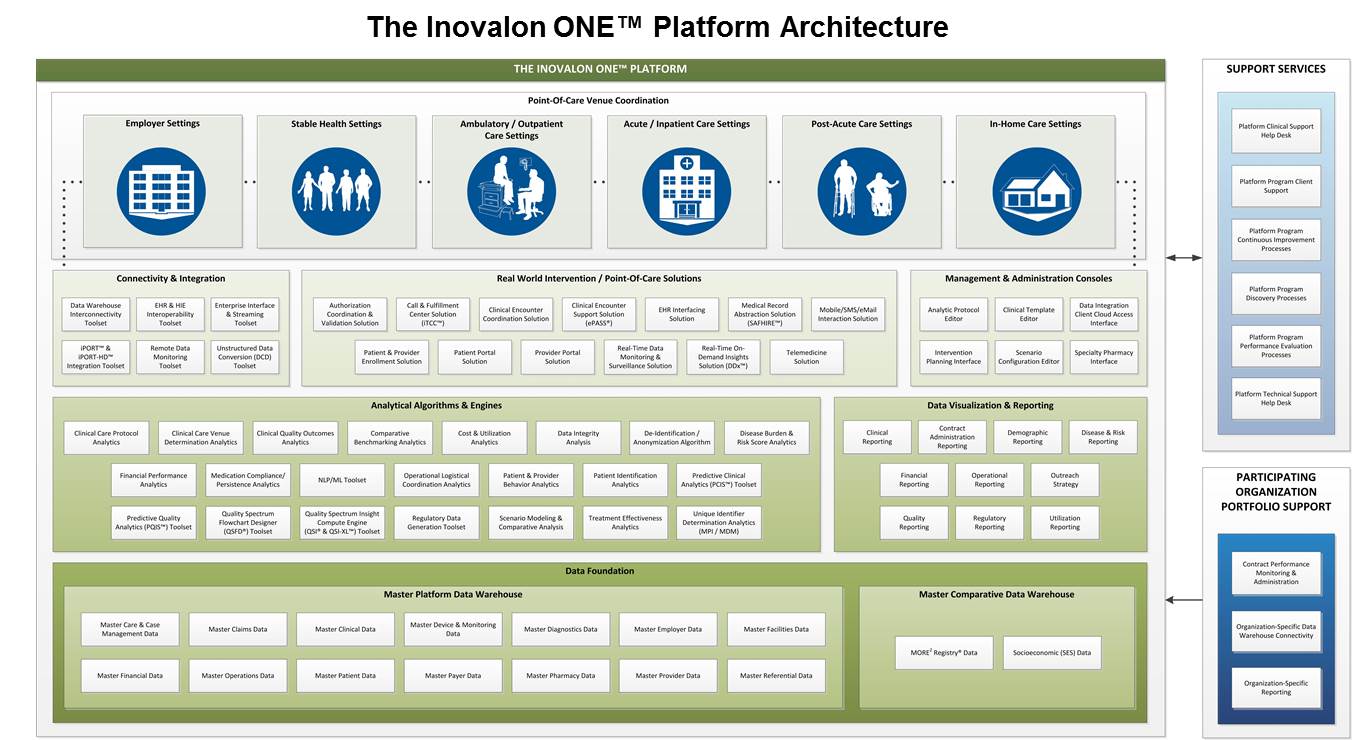
Platform Capabilities
Data Integration. Throughout the healthcare industry, data is captured from many different sources, and while standards for exchanging information between healthcare applications are emerging, much of the data associated with population health remains in disparate silos, in various formats, on paper, and is both interchanged and processed without automation. Where investments have been made in the digitization of health data, many of the resulting solutions remain “walled gardens” of information—data that is static and not easily shared or interpreted.
Our data integration platform capability was designed and developed to address these challenges. This capability enables integration of any data source, on any hardware platform, in any data format at extremely high speeds. Our data integration platform receives information from external sources through a number of channels, including secure FTP, web services, and direct connections to external systems. Our data integration platform loads data into our “data lake” in its native format, which ensures that we maintain all data as it is received and allows users to query the data directly in its structured or unstructured format. Processing data in its raw format, however, presents many technological challenges. We have developed interactive data mapping technologies to support the mapping of the raw data files to staging structures used by our platform to convert data from its native format into a structured format that can be used by all processes on our platform. Once mapped, the data is run through multiple processes to standardize the data and perform data verification and integrity checks so that values are uniform across our entire platform.
We believe that our enterprise-scale data integration and management capability enables us to receive, integrate, and process extremely large-scale data flows at industry-leading speeds, and is a critical capability in achieving material improvement in clinical quality outcomes and financial performance in healthcare, creating a material market differentiator and value creator for us and our clients. We integrate data seamlessly and securely into our systems through our proprietary Extract, Transform, Load tools and processes. This system manages the process of defining and configuring thousands of industry data feeds from our clients and partners (such as electronic health records (“EHR”), laboratory, pharmacy, patient reported, claims, paper based medical records, biometric, and hospital data feeds respectively), manages the data processing workflow, and monitors the ongoing provision and quality of data through the application of more than 2,000 data integrity checks.
4
Our big data technology has been created through the use of internally developed software coupled with industry-leading technology frameworks that are vendor-agnostic. We leverage modern big data frameworks such as Hadoop and the Hadoop Distributed File System, which enable us to store structured and unstructured data while making it readily accessible by our analytics engine. Our big data processing capabilities enable dramatic improvements in data integration and analytical cycle speed to value recognition to empower improvements for intelligent product development through the “real world” functional application. Our big data technology lays the foundation of the data fabric allowing integration into our analytical capabilities.
Advanced Analytics. We have developed, honed, and scaled a broad portfolio of sophisticated analytics. Applying our subject matter expertise in computer processing, data architecture, statistics, medical sciences, healthcare policy, and leveraging the billions of medical events within our significant propriety datasets, we believe that we have developed one of the most advanced analytical platforms in the industry, as well as a culture and set of analytical toolsets that serve to rapidly innovate and expand our platform capabilities. In addition, by leveraging technologies such as Optical Character Recognition, Natural Language Processing and Machine Learning, we are able to further enhance our analytical capabilities, improve efficiency, and accelerate processing capacity and client value delivery.
Intervention Systems. In order to translate analytical insights into tangible impact, interventions at the point of care are critical. We are able to translate our analytical insights into meaningful impact through data-driven, multi-channel intervention platforms, which include toolsets and services that enable our clients to take the insights derived from our analytics and implement solutions that achieve meaningful impact at the patient and provider level. Our intervention capabilities include direct connectivity with many leading EHR systems, hard copy and electronic mail, and interactions via telephone, in patients’ homes, through mobile devices, at dedicated patient centers, through web-enabled decision support tools, in retail pharmacies, and in traditional clinical locations.
Business Processing. Our business processing capability consists of a powerful business intelligence system and comprehensive data warehousing to provide historical and current data insight, reporting, and benchmarking to support multiple client business needs such as government-mandated data filings, financial planning, and compliance requirements. We have also implemented an integrated platform of data visualization, allowing clients and their downstream users and operators to access data and analytical results from the population-level down to sophisticated individual drill-down details in real-time.
Data Sets
Datasets and the management of data are part of our core strengths, which give us insight into how a patient, provider, or population is doing. Our datasets grant us both relative and absolute insight, and inform the construction of new analytics capabilities, predictive models, and impact predictions. Further, data management speeds our time to client impact, decreases the burden on clients choosing to do business with us, and empowers our achievement of mission and results.
In addition to being maintained and tagged within client-specific data lakes, data we receive in the course of providing our services are statistically de-identified and stored in our MORE2 Registry®. The MORE2 Registry® goes beyond just claims data to include information about demographics, enrollment, diagnoses, procedures, pharmacy, laboratory results, and deep medical record clinical data and presents a significant representative mix of commercial, HIX Marketplace, Medicare Advantage, and managed Medicaid care plan patients. As of December 31, 2017, our MORE2 Registry® dataset contained data pertaining to more than 932,000 physicians, 455,000 clinical facilities, 240 million individuals, and 37 billion medical events. The following is a sample of components within our MORE2 Registry®:
• Patient Demographic Data | • Benefits Data | |
• Medical Record Documentation | • Encounter and Procedural Data | |
• Operating Room, Procedure, | • Pharmacy Data | |
Discharge Summary, | • Imaging Report Data | |
Emergency Room Records | • Laboratory & Pathology Data | |
• Electronic Health Record Data | • Durable Medical Equipment Data | |
• Health Risk Assessment Data | • Self-Reported Data | |
• Practitioner Profile Data | • Social History Data | |
• Claim Diagnostic Data | • Activities of Daily Living (ADL) | |
• Eligibility and Enrollment Data | • Cost Data | |
5
Connectivity
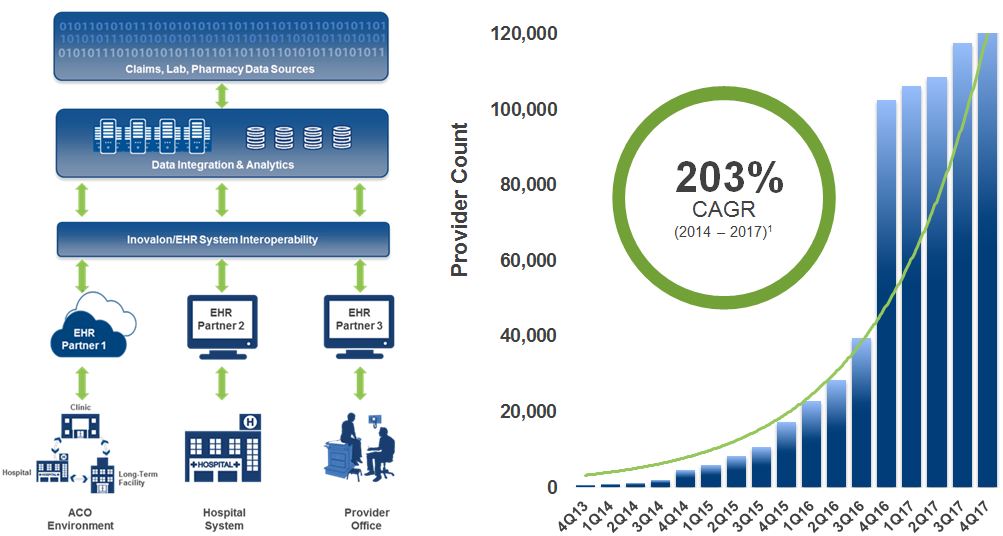
We have developed technology that enables real-time, bi-directional data aggregation and point-of-care intervention through many leading EHR systems, which drives positive impact and efficiency for clients, clinicians, patients, and the Company.
Inovalon’s Interoperability Platform facilitates the two-way exchange of clinical data with both cloud and non-cloud based EHR and Integrating the Healthcare Enterprise systems, connecting thousands of physicians in an effective, efficient, secure and scalable fashion while minimizing disruption. Our Interoperability Platform automatically requests and retrieves necessary clinical data, which is then analyzed by our advanced predictive analytics to identify gaps in patient care, and then embeds those insights directly into the clinical workflow to inform targeted interventions at the point-of-care.
______________________________________
(1) | The 2014 and 2017 figures are as of December 31 for each respective year. |
6
Technology Infrastructure
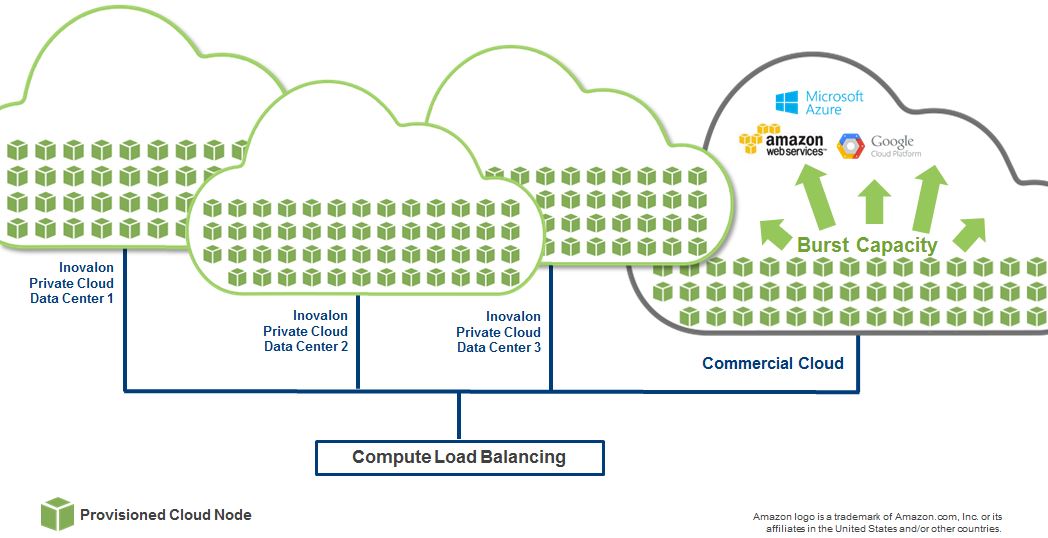
We believe that our track record of service is the result of our commitment to excellence and our devotion to maintaining one of the industry’s most sophisticated technology infrastructures. We have made significant investments over the past decade to build an industry-leading enterprise-scale infrastructure capable of managing the heavy computing and storage requirements of our cloud-based data-driven business. Today, we employ a combination of owned, virtualized data centers along with hosted facilities to enable seamless, secure, and scalable solutions nationwide.
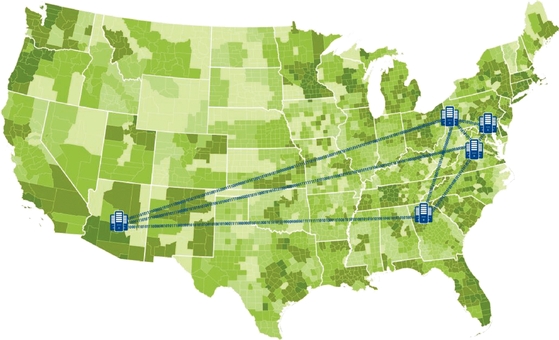
Our physical converged compute and storage infrastructure is deployed with a hybrid approach to cloud computing. Leveraging heavily virtualized infrastructure together with orchestration and automation tools, we have achieved significant capabilities within our private cloud environment. The following diagram provides a high level overview of our key infrastructure elements.
_______________________________________
Our data and compute capacity is maintained within an interconnected set of infrastructure sets made up of owned and co-located data centers. The three principal datacenters owned by Inovalon are located in the Washington D.C. metro area, Atlanta metro region and the Pittsburgh metro region. Our co-located datacenter facilities are located in Northern Virginia and in Phoenix, Arizona. Each datacenter supports the ability to interconnect agnostically to third-party cloud capacity providers. This macro architecture provides us a significant ability to maintain both enterprise-level capacity and redundancy, while also achieving significant flexibility and cost effectiveness for burst capacity needs.
We have a proven track record of implementing virtualization as our current datacenters are over 85% virtualized using VMware technologies. Operations of the virtualization technologies are streamlined by the orchestration, automation, and reporting capabilities provided by our private cloud and integration with public cloud service providers. These technologies are used to provide computing, storage, and networking components to the hosting environment and provide operational efficiencies and cost optimization for the corporation.
We have implemented a sophisticated hybrid cloud and service based application stack design, enabling “burst” capacity architecture to allow provider-agnostic utilization of public cloud capacity if such capacity is required. Our virtualization technology has been integrated with automation and orchestration technology to create a cloud environment that provides both Infrastructure and Platform as a Service capabilities. These service based capabilities allow us to dynamically expand our compute capacity in real time and provide the business with a cost effective and nimble platform. By leveraging both private and public cloud offerings, we can provide efficient, elastic, and cost effective compute resources based on the operational needs of our clients. We believe we are leaders in the use of big data technology and high performance compute technology stack at the point of care in our industry.
7
Our platform is built utilizing an innovative enterprise infrastructure platform enabling robust performance scaling, strong security, high availability, and advanced business continuity options. The building blocks of this infrastructure consist of the following:
• | Multiple data centers connected by redundant high-speed WAN connections; |
• | High competency and utilization of virtualization technologies; |
• | Rapid provisioning of computing capabilities to support the dynamic elasticity needed to support the variable computing needs of the application; |
• | Measured service to optimize resource utilization and provide transparency of the utilized services; and |
• | Available hosting facilities providing physical structure compliance with Federal Information Security Management Act (“FISMA”) standards. |
Disaster Recovery. Our contingency program is designed to provide response and subsequent recovery from unplanned business disruptions. Supported by our data centers, our contingency program provides a coordinated emergency response foundation across the organization. The program includes business continuity, emergency occupant, pandemic planning, security incident response, and disaster recovery plans that encompass all areas of our technology and business operations. These interrelated processes align to provide significant protection and risk mitigation. In addition to company-wide plans, specific details on event response and subsequent business recovery actions and activities are included within each respective business unit plan.
_______________________________________
Business continuity and disaster recovery are an important part of our technology platform. Through significant investment in hardware, software, and application design, Inovalon provides solutions that support mission critical, business critical, and business important products and services through our nationwide enterprise data center presence.
Network Operations Center. We maintain a central network operations center (“NOC”) where systems are monitored to ensure proper operation and capacity utilization. The NOC monitors and collects information about a multitude of technology operating metrics regarding system load and status. In conjunction with the rapid provisioning capability, automation, and standardization, the NOC provides us with the automated capabilities to oversee and manage our technology resources in order to meet business demands.
Privacy Management and Data Security. Protected health information is a sensitive component of personal information. It is highly important that information about an individual’s healthcare is properly and thoroughly protected from any inappropriate access, use and disclosure. Given the industry vertical in which we operate, we realize the importance of the safety and sensitivity of personal health information. We have been a trusted partner to our clients and are committed to the security and privacy of our client data, enterprise data, and our systems through the application of highly trained personnel, robust processes, and technology. Our privacy and security management includes:
• | governance, frameworks, and models to promote good decision making and accountability. Our comprehensive privacy and security program is based on industry practices including those of the National Institute of Standards and |
8
Technology, the Control Objectives for Information and Related Technology, Defense Information Systems Agency, and FISMA;
• | an internal security council, which advises on and prioritizes the development of information security initiatives, projects, and policies; |
• | a layered approach to privacy and security management to avoid single points of failure; |
• | a defense in depth protection model that addresses the network, platform, application, and file and data layers; |
• | ongoing evaluation of privacy and security practices to promote continuous improvement; |
• | use of safeguards and controls including: administrative, technical, and physical safeguards; |
• | collaboration with our clients on best security and privacy practices; and |
• | working closely with leading researchers, thought leaders, and policy makers. |
Platform Modularity
Our platform has been created through the use of internally-developed software coupled with industry-leading technology frameworks that are vendor-agnostic. Because we have designed and developed our own software, we have built significant flexibility and modularity into our platform components. This enables us to not only enhance our existing products as our clients’ needs evolve, but also to increase our addressable market opportunity by rapidly developing new product offerings and expanding into adjacent markets in the healthcare industry. Our acquisitions of Avalere and Creehan further enhance this process through the additional capabilities, technologies, client relationships, and industry expertise that they bring. Our large, deep proprietary data sets in the MORE2 Registry® also enable and support this flexibility and modularity, as the depth and breadth of the data allows its analysis and application in the context of many situations across the healthcare industry-not just for payers, but also providers, pharmaceutical companies, device manufacturers, diagnostics companies, etc. For example, within the set of Inovalon ONE™ Platform Components that would typically enable our Quality Measurement and Reporting offering for a national health plan, a certain subset of these Components could be combined with an additional new set of Components to enable our OBC offering with a global pharmaceutical company.
Our Clients
For over 18 years, we have provided quality services to our clients. During that time, we have built a leading position and have become a true thought leader and innovator in our industry. We have achieved significant scale, and we believe that we play a key role in the U.S. healthcare market.
Our clients renew existing client agreements throughout the year. The renewal rates of existing clients for the years ended December 31, 2017, 2016 and 2015 were approximately 88%, 93% and 93%, respectively. The renewal rate is representative of clients with engagements exceeding $0.1 million in revenue.
For the year ended December 31, 2017, Anthem (formerly known as WellPoint) accounted for approximately 12% of our total revenue, and no other clients represented greater than 10% of our revenue. See Note 2, “Summary of Significant Accounting Policies,” under the heading “Concentrations of Credit Risk,” of the notes to our audited consolidated financial statements included elsewhere within this Annual Report on Form 10-K for more information.
Sales and Marketing
We believe that our sales and marketing initiatives are key to capitalizing on our significant market and growth opportunities. While we have successfully leveraged our sales and marketing as we have grown, we believe that additional strategic investments in sales and marketing capacity and capabilities will enable us to increasingly seize on the healthcare industry’s need for data analytics and data-driven intervention services, and empower the healthcare industry’s transformation from volume-based models to value-based models.
We sell our offerings primarily through three avenues:
• | Business development led by product and management personnel: We benefit significantly from the subject matter expertise, market credibility, thought leadership, and relationships of our executives, senior management, and product leaders within the industry. They have played, and are expected to continue to play, a significant role in the establishment and ongoing development of our client relationships. |
• | Business development led by dedicated sales personnel: We have a dedicated, direct sales team, which is comprised of focused field sales professionals who are organized principally by geography and product type. Our dedicated sales personnel are supported by a sales operations staff, including product technology experts, lead generation personnel, and sales data personnel. |
9
• | Business development led by strategic channel relationships: We increasingly are developing and expanding our use of strategic partnerships and channel relationships for the establishment and development of new and existing clients. |
Our marketing and communications strategies are centered on initiatives that drive awareness of our Company and capabilities. These initiatives include: educating the market about our Company broadly; hosting industry-focused events and speaking engagements; disseminating articles discussing data trends and metrics, and strategic interfacing with key business and trade media personnel. We employ a broad array of specific events to facilitate these initiatives, including but not limited to:
• | Sponsorship and partnership of key industry conferences; |
• | Client-focused events and programs; |
• | Hosting our annual Client Congress highlighted by healthcare leaders, industry icons and senior government officials sharing best practices, strategies, and trends; |
• | Web and social properties, digital and video content marketing, creative online advertising, and blogs; and |
• | Hosted webinars, direct mail, analyst relations, and media relations. |
In addition, in order to enhance our value proposition, our sales and marketing staff develops best practices tools, case studies, and educational materials to drive deeper client engagement, understanding, and utilization.
Operations
Our operations are divided into two groups. Our IT Operations Group manages the process steps from data receipt through to the generation of analytical outputs. Our Services Operations Group manages the process steps applied to achieve impact through our data-driven intervention platforms.
IT Operations Group
We achieve excellence in the operation of our technology based on a foundation of service management aligned with data integration, data provisioning, system support, and security operations. These operational processes are measured clearly through a framework of key performance indicators, which seek to provide an optimal level of transparency and control.
We have implemented a rigorous command and control structure for maintaining availability of production systems and ensuring the security of technology infrastructure. Our NOC is responsible for monitoring network and systems, security incident response, and management and communication as well as the oversight of planned system maintenance. The personnel of the NOC are also responsible for invoking our business continuity plan when appropriate.
The security operations within our NOC maintain the confidentiality, integrity, and availability of our production systems and technology infrastructure by maintaining security situational awareness, as well as coordinating security incident response and proactively protecting sensitive data. The security operations team utilizes a variety of tools and techniques to identify, contain, remediate, and gather intelligence on both known and emerging technology threats. Reports are tracked through automated event management triggers and communicated to leadership through our business service management layer.
We have a comprehensive framework for managing change control, problem management, incident and event management, service management, and production operations. We use a defined quality change control management system for managing technology changes.
Product support integration across all of our solutions enables commonality of processes—allowing our clients to benefit from increased technology operational efficiencies. Regardless of the efficiencies achieved, we are continuously enhancing our technology product operations through the dedication of the process automation and performance assurance team focused on designing and deploying zero-touch capabilities.
Services Operations Group
Many of our clients utilize the analytical outputs of our platform to feed into their own internal systems to achieve value within the provider and patient base. Other clients license our data-driven intervention platforms to facilitate the realization of value from our analytics. For still other clients, our service support personnel operate our data-driven intervention platforms to deliver end-to-end value realization. For these clients, through the implementation of our sophisticated platforms, we leverage our analytical output to provide data-driven intervention support services at the varying points of care necessary to achieve the goals of our clients. This unique end-to-end approach implements the solutions necessary to turn insight generated through our advanced analytics into meaningful impact and realized value for our clients on a national scale.
One of the centerpieces of our services operations is our strong management systems, which serve as vehicles to drive transparency, ownership and execution. Our management systems enable general managers and operational leaders the ability
10
to “see around the corner” and be ambidextrous in how they balance achieving efficiency gains while also focusing on exceptional client value delivery.
Competition
We compete with a broad and diverse set of businesses. We believe the competitive landscape is highly fragmented with no single competitor offering similarly expansive capabilities and solution offerings in healthcare data analytics and data-driven interventions. Our primary competitive challenge is to demonstrate to our existing and potential clients the value of utilizing our platforms rather than developing or assembling their own alternative capabilities. We believe that the combination of our competitive strengths and successful culture of innovation, including our large proprietary datasets, advanced data integration technologies, sophisticated predictive analytics, extensive industry connectivity, data-driven intervention platforms, and the deep subject matter expertise of our associates, make it time- and cost-prohibitive for our clients to replace or replicate all that we offer. In addition, we believe the combination of these attributes differentiates us from our competition.
The competitive landscape can be characterized by the following categories of companies that provide capabilities or solutions that compete with one or more offerings of our platform:
• | Large-scale healthcare-specific solutions providers, such as Optum, Change Healthcare (formerly Change Healthcare Holdings, Inc. and McKesson Technology Solutions), Verscend Technologies (formerly Verisk Health), and IQVIA (formerly QuintilesIMS); |
• | Providers of enterprise-scale, industry agnostic IT solutions, such as Oracle, Dell, SAP, SAS, and IBM; |
• | Large-scale IT consultants and third-party service providers, such as Accenture and Deloitte Consulting; and |
• | Point solution providers, such as Change Healthcare, DST Systems, edifecs, and Silverlink. |
Intellectual Property
We generally rely on copyright, trademark, and trade secret laws as well as confidentiality agreements, licenses, and other agreements with employees, consultants, vendors, and customers. We also seek to control access to and distribution of our proprietary software, confidential information and know-how, technology, and other intellectual property. Historically, because our initial technological innovations were primarily algorithmic in nature, these innovations were well suited to trade secret protection. Accordingly, and due to the complex, time intensive, and costly patent process, with somewhat limited utility for business processes, the use of patents has not historically been compelling for us. However, beginning in the second quarter of 2015, we filed a limited number of provisional and non-provisional patent applications. We expect to continue to seek patents in the future.
We own and use trademarks in connection with our applications and services, including both unregistered common law marks and issued trademark registrations in the United States. Our material trademarks, service marks and other marks include: CAAS™, CARA®, Caresync Advantage®, CCS Advantage®, CEDI™, ChaseWise™, Data-Driven Improvements in Health Care™, Distributed Analytics®, EMR Acceleration™, eCAAS Advantage®, ePASS®, Healthcare Empowered®, Healthier Members, Healthier Business®, HEDIS Advantage, HCC Surveillance®, HIX Foundation®, iDCT™, INDICES®, Inovalon®, Inovalon-US, Inovalon-EU, Inovalon Healthcare Empowered (and Spiral Design to left)-EU, Inovalon (and Spiral Design on top), Inovalon (and Spiral Design to left), Inovalon Healthcare Empowered (and Spiral Design on top), Inovalon Healthcare Empowered (and Spiral Design to left)-US, Inovalon Healthcare Empowered (wordmark), Insights: a business intelligence solution™, iPORT™, iTCC™, MORE2 Registry®, PCIS™, Prospective Advantage®, QSCL™, QSFD®, QSI®, SRSA™, Star Advantage®, Turning Data into Insight and Insight into Action®, We See Solutions™, Data Diagnostics®, DDx™ and the Inovalon ONE™ Platform. We also have trademark applications pending to register marks in the United States and European Union.
While our intellectual property rights are important to our success, we believe that our business as a whole is not materially dependent on any particular patent, trademark, license or other intellectual property right.
Our Employees
As of December 31, 2017, we had a total of 2,480 associates across the following areas: Technology, Innovation and Product, Data-driven Client Services, and Selling, General and Administrative. There were 1,758 full-time associates and 722 part-time associates. None of our associates are represented by a labor union; all of our associates currently work in the U.S. and its territories (Puerto Rico), and we consider our current relations with our associates to be good.
Requirements Regarding the Privacy and Security of Personal Information
HIPAA and Other Privacy and Security Requirements. There are numerous U.S. federal and state laws and regulations related to the privacy and security of personal information. In particular, regulations promulgated pursuant to the Health Insurance Portability and Accountability Act of 1996 (“HIPPA”), as amended, and its implementing regulations, establish
11
privacy and security standards that limit the use and disclosure of Protected Health Information (“PHI”) and require the implementation of administrative, physical, and technical safeguards to ensure the confidentiality, integrity, and availability of individually identifiable health information in electronic form. Our health plan customers, as well as healthcare clearinghouses and certain providers with which we may have or may establish business relationships, are covered entities that are regulated under HIPAA. The Health Information Technology for Economic and Clinical Health Act (“HITECH”) which became effective on February 17, 2010, and an implementing regulation known as the Omnibus Final Rule, which became effective on September 23, 2013, significantly expanded HIPAA’s privacy and security requirements. Among other things, HITECH and the Omnibus Final Rule make HIPAA’s privacy and security standards directly applicable to “business associates,” which are independent contractors or agents of covered entities that create, receive, maintain, or transmit PHI in connection with providing a service for or on behalf of a covered entity. Under HIPAA and our contractual agreements with our customers, we are considered a “business associate” to our customers and thus are directly subject to HIPAA’s privacy and security standards. In order to provide our covered entity clients with services that involve the use or disclosure of PHI, HIPAA requires our clients to enter into business associate agreements with us. Such agreements must, among other things, require us to:
• | limit how we will use and disclose PHI; |
• | implement reasonable administrative, physical, and technical safeguards to protect such information from misuse; |
• | enter into similar agreements with our agents and subcontractors that have access to the information; |
• | report security incidents, breaches, and other inappropriate uses or disclosures of the information; and |
• | assist the customer in question with certain of its duties under the privacy standards. |
In addition to HIPAA, HITECH, and their implementing regulations, we may be subject to other state and federal privacy laws, including laws that prohibit unfair privacy and security practices and deceptive statements about privacy and security and laws that place specific requirements on certain types of activities, such as data security and texting. We may also be subject to state medical record privacy laws, which may be more strict than HIPAA, including the laws of the state of California.
Data Protection and Breaches. In recent years, there have been a number of well-publicized data breaches involving the improper use and disclosure of individuals’ personal information. Many states have responded to these incidents by enacting laws requiring holders of personal information to maintain safeguards and to take certain actions in response to a data breach, such as providing prompt notification of the breach to affected individuals and state officials. In addition, under HIPAA and pursuant to our business associate agreement obligations, we must report breaches of unsecured PHI to our contractual partners following discovery of the breach. Notification must also be made in certain circumstances to affected individuals, HHS and the media.
We have implemented and maintain physical, technical, and administrative safeguards intended to protect individually identifiable health information and have processes in place to assist us in complying with all applicable laws, regulations, and contractual requirements regarding the protection of these data and properly responding to any security breaches or incidents. Furthermore, in many cases, applicable state laws, including breach notification requirements, are not preempted by the HIPAA privacy and security standards and are subject to interpretation by various courts and other governmental authorities, thereby complicating our compliance efforts. Where a state law is not preempted by HIPAA, we may also be subject to that state law’s requirements, in addition to our obligations under HIPAA, HITECH, and their implementing regulations. Additionally, state and federal laws regarding deceptive practices may apply to public assurances we give to individuals about the security of services we provide on behalf of our contractual customers.
Other Requirements. In addition to HIPAA, numerous other U.S. state and federal laws govern the collection, dissemination, use, access to, and confidentiality of individually identifiable health information and healthcare provider information. Some states also are considering new laws and regulations that further protect the confidentiality, privacy, and security of medical records or other types of medical information. Further, Congress and a number of states have considered or are considering prohibitions or limitations on the disclosure of medical or other information to individuals or entities located outside of the United States.
Seasonality
The nature of our customers’ end-market results in seasonality reflected in both revenue and cost of revenue differences during the year. Regulatory impact of data submission deadlines in, for example, March, June, September, and January drive timing of analytics and data processing activity variances from quarter to quarter. Further, regulatory clinical encounter deadlines of June 30th and December 31st drive intervention concentration variances from quarter to quarter. The timing of these factors results in analytical and intervention activity mix variances which impact financial performance from quarter to quarter. Finally, quarter to quarter financial performance may increasingly vary from historical seasonal trends as we further expand into adjacent markets and increase the portion of our revenue generated from new offerings.
12
Corporate Information
Our executive offices are located at 4321 Collington Road, Bowie, Maryland 20716. Our telephone number at our executive offices is (301) 809-4000 and our corporate website is www.inovalon.com. The information on, or accessible through, our website is not incorporated into and does not constitute a part of this Annual Report on Form 10-K or any other report or document we file with or furnish to the Securities and Exchange Commission (“SEC”). Our Class A common stock is listed on the NASDAQ Global Select Market under the symbol “INOV.”
Available Information
We file our Annual Report on Form 10-K, Quarterly Reports on Form 10-Q, Current Reports on Form 8-K, and all amendments to those reports with the SEC. You may obtain copies of these documents by visiting the SEC’s Public Reference Room at 100 F Street, N.E., Washington, D.C. 20549, by calling the SEC at 1-800-SEC-0330 or by accessing the SEC’s website at www.sec.gov. In addition, as soon as reasonably practicable after such materials are furnished to the SEC, we make copies of these documents available to the public free of charge through our website or by contacting our Secretary at the address set forth above under “—Corporate Information.”
Our Board of Directors Corporate Governance Charter, Code of Business Conduct and Ethics, and the charters of our audit committee, compensation committee, nominating and corporate governance committee and security and compliance committee are all available in the Governance Documents section of the Corporate Information section of our website.
Financial Information
For required financial information related to our operations, please refer to our consolidated financial statements, including the notes thereto, included with this Annual Report on Form 10-K.
Item 1A. Risk Factors.
Set forth below are the risks that we believe are material to our stockholders. You should carefully consider the following risks in evaluating our Company and our business. The occurrence of any of the following risks could materially adversely impact our financial condition, results of operations, cash flow, the market price of shares of our common stock and our ability to, among other things, satisfy our debt service obligations and to make distributions to our stockholders, which in turn could cause our stockholders to lose all or a part of their investment. Some statements in this report including statements in the following risk factors constitute forward-looking statements. Please refer to the section entitled “Special Note Regarding Forward-Looking Statements” at the beginning of this Annual Report on Form 10-K.
Risks Related to Our Business
We may not grow at the rates we historically have achieved or at all, even if our key metrics may indicate growth, which could have a material adverse effect on the market price of our Class A common stock.
We have experienced significant growth since 2013, with total revenues growing from approximately $295.8 million for the year ended December 31, 2013 to approximately $449.4 million for the year ended December 31, 2017. Future revenues may not grow at these same rates or may decline, such as the approximate 2% revenue decline from the year ended December 31, 2015 to the year ended December 31, 2016. Our future growth will depend, in part, on our ability to grow our revenue from existing clients, to complete sales to potential new clients, to expand our client base in adjacent industry segments such as the life sciences industry and with provider organizations, to develop new services and capabilities including direct-to-consumer services, and to expand internationally. We can provide no assurances that we will be successful in executing on these growth strategies or that, even if our key metrics, such as trailing 12 month Patient Analytics Months (“PAM”), would indicate future growth, we will continue to grow our revenue, margins or net income. Our ability to execute on our existing sales pipeline, create additional sales opportunities, and expand our client base depends on, among other things, the attractiveness of our services relative to those offered by our competitors, our ability to demonstrate the value of our existing and future services, and our ability to attract and retain a sufficient number of qualified sales and marketing leadership and support personnel. In addition, clients in certain industries in which we have a more limited presence, such as the life sciences industry, may be slower to adopt our services than we currently anticipate, which could adversely affect our results of operations and growth prospects.
If our existing clients do not renew their agreements with us, renew at lower fee levels, decline to purchase additional services from us, choose to purchase fewer services from us, or terminate their agreements with us, and we are unable to replace any lost revenue, our business and operating results could suffer.
We historically have derived, and expect in the future to derive, a significant portion of our revenue from renewals of existing client agreements and sales of additional services to existing clients. As a result, achieving a high renewal rate of our client agreements and selling additional services to existing clients is critical to our future operating results. It is difficult to
13
predict our client renewal rate, and we may experience significantly more difficulty than we anticipate in renewing existing client agreements. Factors that may affect the renewal rate for our services and our ability to sell additional services include:
• | the price, performance and functionality of our services; |
• | the availability, price, performance and functionality of competing services; |
• | our clients’ perceived ability to develop and perform the services that we offer using their internal resources; |
• | our ability to develop complementary services; |
• | our continued ability to access the data necessary to enable us to effectively develop and deliver new services to clients; |
• | the stability and security of our platform; |
• | changes in healthcare laws, regulations or trends; and |
• | the business environment of our clients, in particular, reductions in our clients’ membership populations and budgetary constraints affecting our clients. |
Contracts with our clients generally have stated terms of two to five years. However, our clients have no obligation to renew their contracts for our services after the term expires. In addition, a high renewal rate in any particular year does not necessarily correlate to recurring or increasing revenue from our existing clients, as our clients may negotiate terms less advantageous to us upon renewal, may renew for fewer services, may choose to discontinue one or more services under an existing contract, may exercise flexibilities within their contracts to adjust service volumes, or which could reduce our revenue from these clients. Accordingly, annual renewal rate metrics have inherent limitations and renewal rates should not be used as a key metric to evaluate the Company’s results of operations. Our future operating results also depend, in part, on our ability to sell new services to our existing clients. If our clients fail to renew their agreements, renew their agreements upon less favorable terms, at lower fee levels or for fewer services, fail to purchase new services from us, or terminate their agreements with us, and we are unsuccessful in generating significant revenue from new clients to replace any lost revenue, our revenues may decline and our future revenue growth may be constrained.
If a client fails to fulfill its obligations under its agreements with us, or permanently terminates certain services or its agreement in its entirety prior to its expected completion date, whether or not in our view permitted by the terms of the agreement, and revenue and cash flows expected from a client are not realized in the time period expected or at all, our business, operating results and financial condition could be adversely affected.
Our top clients account for a significant portion of our revenues and, as a result, the loss of one or more of these clients could materially and adversely affect our business and operating results.
Our largest client, Anthem (formerly known as WellPoint), represented approximately 12% of our revenues for the year ended December 31, 2017. No other clients represented greater than 10% of our revenue. Our top ten clients accounted for approximately 53% of our revenues for the year ended December 31, 2017. The engagement between these clients and us generally is covered through multiple separate statements of work (“SOWs”), each often with different and/or staggered terms which are all multi-year in their duration, ranging typically from two to five years. We can provide no assurance that these clients will renew their existing contracts or all SOWs with us upon expiration or that any such failure to renew will not have a material adverse effect on our revenue. If we lose one or more of our top clients, or if one or more of these clients significantly decreases its use of our services, our business and operating results could be materially and adversely affected.
If we do not develop new services that are adopted by clients, or fail to provide high quality support services to our clients, our growth prospects, revenues and operating results could be materially and adversely affected.
Our longer-term operating results and revenue growth will depend in part on our ability to successfully develop and sell new services that existing and potential clients want and are willing to purchase. We must continue to invest significant resources in research and development in order to enhance our existing services and introduce new high-quality services that clients and prospective clients will want. If we are unable to predict or adapt to changes in user preferences or industry or regulatory changes, or if we are unable to modify our services on a timely basis in response to those changes, clients may not renew their agreements with us, and our services may become less attractive than services offered by our competitors. Our operating results could also suffer if our innovations are not responsive to the needs of our clients, are not appropriately timed with market opportunity, or are not effectively brought to market. Our success also depends on successfully providing high-quality support services to resolve any issues related to our services. High-quality education and client support is important for the successful marketing and sale of our services and for the renewal of existing clients. If we do not help our clients quickly resolve issues and provide effective ongoing support, our ability to sell additional services to existing clients would suffer and our reputation with existing or potential clients would be harmed.
14
We cannot assure you that we will be able to manage our growth effectively, which could have a material adverse effect on our business, results of operations and growth prospects.
If we are successful in expanding our client base and growing our business, our existing services may not be as scalable as we anticipate, and we may need to expend significant resources to enhance our IT infrastructure, financial and accounting systems, and controls, and also hire a significant number of qualified client support personnel, professional services personnel, software engineers, technical personnel, and management personnel in order to provide services to those new clients. As a result, our expenses may increase more than expected, which could adversely affect our results of operations and net income. In addition, identifying and recruiting qualified personnel and training them in the use of our services requires significant time, expense, and attention, and our business may be adversely affected if our efforts to expand and train qualified personnel do not generate a corresponding increase in revenues. If our existing services are not as scalable as we anticipate or if we are unable to manage our growth and the cost thereof effectively, the quality of our services and our reputation may suffer, which could adversely affect our business, results of operations and growth prospects.
If our security measures fail or are breached and unauthorized access to a client’s data is obtained, our services may be perceived as insecure, we may incur significant liabilities, our reputation may be harmed, and we could lose sales and clients.
Our services involve the storage and transmission of clients’ proprietary information, sensitive or confidential data, including valuable intellectual property and personal information of employees, clients and others, as well as protected health information, or PHI, of our clients’ patients. Because of the extreme sensitivity of the information we store and transmit, the security features of our computer, network, and communications systems infrastructure are critical to the success of our business. A breach or failure of our security measures could result from a variety of circumstances and events, including third-party action, employee negligence or error, malfeasance, computer viruses, cyber-attacks by computer hackers, failures during the process of upgrading or replacing software and databases, power outages, hardware failures, telecommunication failures, user errors, or catastrophic events. Information security risks have generally increased in recent years because of the proliferation of new technologies and the increased sophistication and activities of perpetrators of cyber-attacks, including, for example, the recent Spectre and Meltdown threats which, rather than acting as viruses, were design flaws in many CPUs that allowed programs to steal data stored in the memory of other running programs and required patch software to correct. As cyber threats continue to evolve, we may be required to expend additional resources to further enhance our information security measures and/or to investigate and remediate any information security vulnerabilities. If our security measures fail or are breached, it could result in unauthorized persons accessing sensitive client or patient data (including PHI), a loss of or damage to our data, an inability to access data sources, or process data or provide our services to our clients. Such failures or breaches of our security measures, or our inability to effectively resolve such failures or breaches in a timely manner, could severely damage our reputation, adversely affect client or investor confidence in us, and reduce the demand for our services from existing and potential clients. In addition, we could face litigation, damages for contract breach, monetary penalties, or regulatory actions for violation of applicable laws or regulations, and incur significant costs for remedial measures to prevent future occurrences and mitigate past violations. Although we maintain insurance covering certain security and privacy damages and claim expenses, we may not carry insurance or maintain coverage sufficient to compensate for all liability and in any event, insurance coverage would not address the reputational damage that could result from a security incident.
We may experience cyber-security and other breach incidents that remain undetected for an extended period. Because techniques used to obtain unauthorized access or to sabotage systems change frequently and generally are not recognized until launched, we may be unable to anticipate these techniques or to implement adequate preventive measures. In addition, in the event that our clients authorize or enable third parties to access their information and data that are stored on our systems, we cannot ensure the complete integrity or security of such data in our systems as we would not control access. If an actual or perceived breach of our security occurs, or if we are unable to effectively resolve such breaches in a timely manner, the market perception of the effectiveness of our security measures could be harmed and we could lose sales and clients, which could have a material adverse effect on our business, operations, and financial results.
Data protection, privacy and similar laws restrict access, use, and disclosure of information, and failure to comply with or adapt to changes in these laws could materially and adversely harm our business.
We are subject to data privacy and security regulation by both the federal government and the states in which we conduct our business. HIPAA established uniform federal standards for certain “covered entities,” which include healthcare providers and health plans, governing the conduct of specified electronic healthcare transactions and protecting the security and privacy of PHI. HITECH and the Omnibus Final Rule, which became effective on September 23, 2013, make HIPAA’s privacy and security standards directly applicable to “business associates,” which are independent contractors or agents of covered entities that create, receive, maintain, or transmit PHI in connection with providing a service for or on behalf of a covered entity. HITECH also increased the civil and criminal penalties that may be imposed against covered entities, business associates, and
15
other persons, and gave state attorneys general new authority to file civil actions for damages or injunctions in federal courts to enforce HIPAA’s requirements and seek attorney’s fees and costs associated with pursuing federal civil actions.
A portion of the data that we obtain and handle for or on behalf of our clients is considered PHI and subject to HIPAA because our clients are covered entities under HIPAA and we act as their business associate. Under HIPAA and our contractual agreements with our HIPAA-covered entity health plan clients, we are considered a “business associate” to those clients, and are required to maintain the privacy and security of PHI in accordance with HIPAA and the terms of our agreements with clients, including by implementing HIPAA-required administrative, technical, and physical safeguards. We have incurred, and will continue to incur, significant costs to establish and maintain these safeguards and, if additional safeguards are required to comply with HIPAA or our clients’ requirements, our costs could increase further, which would negatively affect our operating results. Furthermore, if we fail to maintain adequate safeguards, or we use or disclose PHI in a manner not permitted by HIPAA or our agreements with our clients, or if the privacy or security of PHI that we obtain and handle is otherwise compromised, we could be subject to significant liabilities and consequences, including, without limitation:
• | breach of our contractual obligations to clients, which may cause our clients to terminate their relationship with us and may result in potentially significant financial obligations to our clients; |
• | investigation by the federal regulatory authorities empowered to enforce HIPAA, which include the U.S. Department of Health and Human Services, or HHS, the Federal Trade Commission, and investigation by the state attorneys general empowered to enforce comparable state laws, and the possible imposition of civil and criminal penalties; |
• | private litigation by individuals adversely affected by any violation of HIPAA, HITECH, or comparable state laws to which we are subject; and |
• | negative publicity, which may decrease the willingness of current and potential future clients to work with us and negatively affect our sales and operating results. |
Laws and expectations relating to privacy continue to evolve, and we continue to adapt to changing needs. Nevertheless, changes in these laws may limit our data access, use, and disclosure, and may require increased expenditures by us or may dictate that we not offer certain types of services. Any of the foregoing may have a material adverse effect on our ability to provide services to our clients and, in turn, our results of operations.
Data protection, privacy and similar laws protect more than patient information and, although they vary by jurisdiction, these laws can extend to employee information, business contact information, provider information, and other information relating to identifiable individuals. Failure to comply with these laws may result in, among other things, civil and criminal liability, negative publicity, damage to our reputation, and liability under contractual provisions. In addition, compliance with such laws may require increased costs to us or may dictate that we not offer certain types of services in the future.
The information that we provide to our clients could be inaccurate or incomplete, which could harm our business reputation, financial condition, and results of operations.
We aggregate, process, and analyze healthcare-related data and information for use by our clients. Because data in the healthcare industry is fragmented in origin, inconsistent in format, and often incomplete, the overall quality of data received or accessed in the healthcare industry is often poor, the degree or amount of data which is knowingly or unknowingly absent or omitted can be material, and we frequently discover data issues and errors during our data integrity checks. If the analytical data that we provide to our clients are based on incorrect or incomplete data or if we make mistakes in the capture, input, or analysis of these data, our reputation may suffer and our ability to attract and retain clients may be materially harmed.
In addition, we assist our clients with the management and submission of data to governmental entities, including CMS. These processes and submissions are governed by complex data processing and validation policies and regulations. If we fail to abide by such policies or submit incorrect or incomplete data, we may be exposed to liability to a client, court, or government agency that concludes that our storage, handling, submission, delivery, or display of health information or other data was wrongful or erroneous. For example, on February 16, 2017, an order was entered unsealing a relator’s civil False Claims Act qui tam complaint in the matter of U.S. ex rel. Benjamin Poehling, individually (Civil Action No: 11-cv-0258-A). The action was filed on October 27, 2011 in the Western District of New York. The case names 15 defendants, one of which is MedAssurant, Inc., the Company's former name, and cites the allegedly fraudulent submission of claims for and alleged false statements relating to risk adjustment payments under the federal Medicare program as the basis for the suit. The Company was not aware prior to February 16, 2017, that it was named as one of 15 defendants in this case until the complaint was unsealed. On May 16, 2017, the plaintiff and the U.S. government filed amended complaints. The Company was not named as a defendant in the amended complaints filed on May 16, 2017. The Company has not been served. If the Company is served, the Company intends to defend itself vigorously. In light of, among other things, the early stage of the litigation, the Company is unable to predict the outcome of this lawsuit and is unable to make a meaningful estimate of the amount or range of loss, if any, that could result from an unfavorable outcome. Further, although we maintain insurance coverage, this coverage may prove to
16
be inadequate or could cease to be available to us on acceptable terms, if at all. Even unsuccessful claims could result in substantial costs and diversion of management time, attention, and resources. A claim brought against us that is uninsured or under-insured could harm our business, financial condition, and results of operations.
General economic, political and market forces and dislocations beyond our control could reduce demand for our solutions and harm our business.
The demand for our platform capabilities, toolsets and services may be impacted by factors that are beyond our control, including macroeconomic, political and market conditions, the availability of short-term and long-term funding and capital, and the level of interest rates. We believe that the state of economic and political conditions in the U.S. is particularly uncertain due to ongoing political discord between and among the legislative and executive branches of the U.S. government, potential shifts in legislative and regulatory conditions concerning, among other matters, international trade and taxation, as well as healthcare, and that an uneven recovery or a renewed global downturn may contribute to reduced demand for our platforms, toolsets and services, which could have an adverse effect on our results of operations and financial condition.
Our business is principally focused on the healthcare industry, and factors that adversely affect the financial condition of the healthcare industry could consequently affect our business.
We derive substantially all of our revenue from clients within the healthcare industry. As a result, our financial condition and results of operations could be adversely affected by conditions affecting the healthcare industry generally and health systems and payers in particular. For example, in 2016 and 2017, consumer operated and oriented plans, or health insurance Co-Ops, experienced financial distress, including insolvency, bankruptcy or liquidation, and many were forced to exit the exchange marketplace. Our ability to grow will depend upon the economic environment of the healthcare industry, as well as our ability to increase the number of services that we sell to our clients. Furthermore, we may not become aware in a timely manner of changes in regulatory requirements affecting our business, which could result in us taking, or failing to take, actions, resulting in noncompliance with state or federal regulations.
There are many factors that could affect the purchasing practices, operations and, ultimately, the operating funds of healthcare organizations, such as reimbursement policies for healthcare expenses, consolidation in the healthcare industry, and regulation, litigation, and general economic conditions. In particular, we could be required to make unplanned modifications to our services or could suffer delays or cancellations of orders or reductions in demand for our services as a result of changes in regulations affecting the healthcare industry, such as any increased regulation by governmental agencies, changes to HIPAA and other federal or state privacy laws, laws relating to the tax-exempt status of many of our clients or restrictions on permissible discounts, and other financial arrangements. We cannot predict with certainty what additional healthcare regulations, if any, will be implemented at the federal and state level, or what the ultimate effect of federal healthcare reform or any future legislation or regulation will have on us and our clients. We cannot predict with certainty what effect the current U.S. presidential administration together with the U.S. Congress may have, if any, on coverage and reimbursement for healthcare items and services. Further, regardless of the prevailing political environment in the United States, Medicare, Medicaid and managed care organizations are increasing pressure to both control healthcare utilization and to limit reimbursement. Changes in reimbursement programs or regulations, including retroactive and prospective rate and coverage criteria changes, competitive bidding for certain products and services, and other changes intended to reduce expenditures could adversely affect the portions of our clients' businesses that are dependent on third-party reimbursement or direct governmental payment. Moreover, to the extent that our clients experience reimbursement pressure resulting in lower revenue for them, their demand for our products and services might decrease. It is unclear what long-term effects the general economic conditions will have on the healthcare industry, and in turn, on our business, financial condition, and results of operations.
Consolidation in the industries in which our clients operate may result in certain clients discontinuing their use of our services following an acquisition or merger, which could materially and adversely affect our business and financial results.
Mergers or consolidations among our clients have in the past and could in the future reduce the number of our existing and potential clients. When companies consolidate, overlapping services previously purchased separately are typically purchased only once by the combined entity, leading to loss of revenue for the service provider. If our clients merge with or are acquired by other entities that are not our clients, they may discontinue their use of our services. There can be no assurance as to the degree to which we may be able to address the revenue impact of such consolidation. Any of these developments could materially and adversely affect our business and financial results.
Our services could become subject to new, revised, or enhanced regulatory requirements in the future, which could result in increased costs, could delay or prevent our introduction of new services, or could impair the function or value of our existing services, which could materially and adversely affect our results of operations and growth prospects.
The healthcare industry is highly regulated on the federal, state, and local levels, and is subject to changing legislative, regulatory, political, and other influences. Changes to existing laws and regulations, or the enactment of new federal and state
17
laws and regulations affecting the healthcare industry, could create unexpected liabilities for us, could cause us or our clients to incur additional costs, could alter our clients’ business models, and could restrict our or our clients’ operations.
Many healthcare laws are complex, subject to frequent change, and dependent on interpretation and enforcement decisions from government agencies and other adjudicatory bodies with broad discretion. The application of these laws to us, our clients, or the specific services and relationships we have with our clients is not always clear. In addition, federal and state legislatures have periodically considered programs to reform or amend the U.S. healthcare system at both the federal and state level, such as the enactment of the Patient Protection and Affordable Care Act, as amended by the Health Care and Education Reconciliation Act of 2010 (the “ACA”). The ACA included provisions to control health care costs, improve health care quality, and expand access to affordable health insurance. Together with ongoing statutory and budgetary policy developments at a federal level, this health care reform legislation could include changes in Medicare and Medicaid payment policies and other health care delivery administrative reforms that could potentially negatively impact the business of our clients. Because not all the administrative rules implementing health care reform under the legislation have been finalized, because of ongoing federal fiscal budgetary pressures yet to be resolved for federal health programs, and because of the lack of implementing regulations or interpretive guidance, gradual and partially delayed implementation, possible amendment, repeal or further implementation delays, the full impact of the health care reform legislation and of further statutory actions to reform healthcare payment on our business and the business of our clients is unknown. Further, we expect that the current U.S. presidential administration together with the U.S. Congress will continue to seek to modify, repeal or otherwise invalidate all or certain provisions of the ACA. Any such changes will likely take time to be implemented and there can be no assurances that health care reform legislation will not adversely impact either our operational results or the manner in which we operate our business. Health care industry participants may respond by reducing their investments or postponing investment decisions, including investments in our platforms, solutions and services. Our failure to anticipate accurately the application of these laws and similar or future laws and regulations, or our failure to comply with them, could create liability for us, result in adverse publicity, and negatively affect our business.
Our services may become subject to new or enhanced regulatory requirements, and we may be required to change or adapt our services in order to comply with these regulations. If we fail to successfully implement new, enhanced or revised regulatory requirements, it could adversely affect our ability to offer services deemed critical by our clients, which could materially and adversely affect our results of operations. New or enhanced regulatory requirements may render our services obsolete or prevent us from performing certain services. New or enhanced regulatory requirements could impose additional costs on us, and thereby make existing services unprofitable, and could make the introduction of new services more costly or time-consuming than we anticipate, which could materially and adversely affect our results of operations and growth prospects.
Because personal, public, and non-public information is stored in some of our databases, we are subject to government regulation and vulnerable to adverse publicity concerning the use of our data.
We provide many types of data and services that already are subject to regulation under HIPAA and, to a lesser extent, various other federal, state, and local laws and regulations. These laws and regulations are designed to protect the privacy of the public and to prevent the misuse of personal information in the marketplace. However, many consumer advocates, privacy advocates, and government regulators believe that existing laws and regulations do not adequately protect privacy. They have become increasingly concerned with the use of personal information, including health information. As a result, they are lobbying for further restrictions on the dissemination or commercial use of personal information to the public and private sectors. Similar initiatives are under way in other countries in which we may do business in the future. The following legal and regulatory developments also could have a material adverse effect on our business, financial position, results of operations, or cash flows:
• | amendment, enactment, or interpretation of laws and regulations that restrict the access and use of personal information and reduce the supply of data available to clients; |
• | changes in cultural and consumer attitudes to favor further restrictions on information collection and sharing, which may lead to regulations that prevent full utilization of our solutions; |
• | failure of our solutions to comply with current laws and regulations; and |
• | failure of our solutions to adapt to changes in the regulatory environment in an efficient, cost-effective manner. |
Our estimates of market opportunity and forecasts of market growth may prove to be inaccurate, and even if the market in which we compete achieves the forecasted growth, our business could fail to grow at similar rates, if at all.
Market opportunity estimates and growth forecasts are subject to significant uncertainty and are based on assumptions and estimates that may not prove to be accurate. Our estimates and forecasts relating to the size and expected growth of our aggregate market opportunity or any of the sub-components of our total addressable market may prove to be inaccurate. Even if
18
our total addressable market or any sub-component thereof meets our size estimates and forecasted growth, our business could fail to grow at similar rates, if at all.
Our proprietary applications may not operate properly, which could damage our reputation, give rise to a variety of claims against us, or divert our resources from other purposes, any of which could harm our business and operating results.
Proprietary software and application development is time-consuming, expensive, and complex, and may involve unforeseen difficulties. We may encounter technical obstacles, and it is possible that we discover additional problems that prevent our proprietary applications from operating properly. If our applications and services do not function reliably or fail to achieve client expectations in terms of performance, clients could assert liability claims against us and attempt to cancel their contracts with us. Moreover, material performance problems, defects, or errors in our existing or new applications and services may arise in the future and may result from, among other things, the lack of interoperability of our applications with systems and data that we did not develop and the function of which is outside of our control or undetected in our testing. Defects or errors in our applications might discourage existing or potential clients from purchasing services from us. Correction of defects or errors could prove to be time consuming, costly, impossible, or impracticable. The existence of errors or defects in our applications and the correction of such errors could divert our resources from other matters relating to our business, damage our reputation, increase our costs, and have a material adverse effect on our business, financial condition, and results of operations.
As a result of our variable sales and implementation cycles, we might not be able to recognize revenue to offset expenditures, which could result in fluctuations in our quarterly results of operations or otherwise adversely affect our future operating results.
The sales cycle for our services is typically four to six months from initial contact to contract execution, but can vary depending on the particular client, product under consideration, and time of year, among other factors. Some clients, for instance, undertake a more prolonged evaluation process, which has in the past resulted in extended sales cycles. Our sales efforts involve educating potential clients about the use, technical capabilities, and benefits of our services, and gaining an understanding of their needs and budgets. During the sales cycle, we expend significant time and resources, and we do not recognize any revenue to offset such expenditures, which could result in fluctuations in our quarterly results of operations and adversely affect our future operating results. In addition, we may be unable to enter into definitive contracts at the end of a sales cycle on terms that are favorable to us or at all, in some cases for reasons outside our control, which may materially adversely affect our ability to accurately forecast future growth which may cause our stock price to decline.
After a client contract is signed, we provide an implementation process for the client during which we load, test, and integrate data into our system and train client personnel. Our implementation cycle generally ranges from 20 to 90 days from contract execution to completion of implementation, but can vary depending on the amount and quality of the client’s data and how quickly the client facilitates access to data. In addition, for certain clients, our third-party vendors must go through delegation processes in order to become authorized to provide certain services to those clients, which could delay our ability to provide such services to those clients. During the implementation cycle, we expend time, effort, and financial resources implementing our services, but accounting principles do not allow us to recognize the resulting revenue until implementation is complete and the services are available for use by our clients. If implementation periods are extended, revenue recognition will be delayed, which could adversely affect our results of operations in certain periods.
In addition, because most of our revenue in each quarter is derived from agreements entered into with our clients during previous quarters, the negative impacts resulting from a decline in new or renewed agreements in any one quarter may not be fully reflected in our revenue for that quarter. Such declines, however, would negatively affect our revenue in future periods and the effect of significant downturns in sales of and market demand for our services, and potential changes in our renewal rates or renewal terms may not be fully reflected in our results of operations until future periods. Our sales and implementation cycles also make it difficult for us to rapidly increase our total revenue through additional sales in any period. As a result, the effect of changes in the industry impacting our business, or changes we experience in our new sales, may not be reflected in our short-term results of operations.
We operate in a competitive industry, and if we are not able to compete effectively, our business and financial results could be materially and adversely impacted.
We operate in a competitive industry, and we expect that competition will increase as a result of consolidation in both the information technology and healthcare industries. Our future growth and success will depend on our ability to successfully compete with other companies that provide similar services, including existing clients and other healthcare organizations that seek to build and operate competing services themselves and newer companies that provide similar services, often at substantially lower prices. We compete on the basis of various factors, including breadth and depth of services, reputation, reliability, quality, innovation, security, price, and industry expertise, and experience. If we are unable to maintain our technology, management, healthcare, or regulatory expertise or attract and retain a sufficient number of qualified sales and marketing leadership and support personnel, we will be at a competitive disadvantage. Some of our competitors, in particular
19
health plans and larger technology or technology-enabled consultative service providers, have greater name recognition, longer operating histories, and significantly greater resources than we do. Furthermore, our current or potential competitors may have greater financial resources and larger sales and marketing capabilities than we have, and may have a more diversified set of revenue sources, which may allow them to be less sensitive to changes in client preferences and more aggressive in pricing their services, any of which could put us at a competitive disadvantage. As a result, our competitors may be able to respond more quickly and effectively than we can to new or changing opportunities, technologies, standards, or client requirements and may have the ability to initiate or withstand substantial price competition. In addition, potential clients frequently have requested competitive bids from us and our competitors in terms of price and services offered and, if we do not accurately assess potential clients’ needs and budgets when submitting our proposals, they may appear less attractive than those of our competitors, and we may not be successful in attracting new business. In addition, our clients may perceive our toolsets to be at a higher price point than our competitors, which could result in reduced revenue if we are not able to adequately demonstrate the value of our toolsets to our clients and prospective clients. Increases in competition in our industry could reduce our market share and result in price declines for certain services, which could negatively impact our business, profitability, and growth prospects.
If we fail to maintain awareness of our brand in a cost-effective manner, our business might suffer.
Maintaining awareness of our brand in a cost-effective manner is critical to continuing the widespread acceptance of our existing services and is an important element in attracting new clients and in attracting and retaining qualified employees. The importance of brand recognition may increase as competition in our market increases. Successful promotion of our brand will depend largely on the effectiveness of our marketing efforts and on our ability to provide reliable and useful services at competitive prices. Our efforts to build and maintain our brand nationally have involved and will continue to involve significant expense. Brand promotion activities may not yield increased revenue, and even if they do, any increased revenue may not offset the expenses we incur in maintaining our brand. In addition, third parties’ use of trademarks or branding similar to ours could materially harm our business or result in litigation and other costs. If we fail to successfully maintain our brand, or incur substantial expenses in an unsuccessful attempt to maintain our brand, we may fail to attract enough new clients or retain our existing clients to the extent necessary to realize a sufficient return on our brand-building efforts, and our business and our ability to attract and retain qualified employees could suffer.
Our success depends on our ability to protect our intellectual property rights.
Our success depends in part on our ability to protect our proprietary software, confidential information and know-how, technology, and other intellectual property and intellectual property rights. We rely generally on copyright, trademark and trade secret laws, confidentiality and invention assignment agreements with employees and third parties, and license and other agreements with consultants, vendors, and clients. There can be no assurance that employees, consultants, vendors, and clients have executed such agreements or have not breached or will not breach their agreements with us, that we will have adequate remedies for any breach, or that our trade secrets will not otherwise become known or independently developed by competitors. Additionally, we monitor our use of open source software to avoid uses that would require us to disclose our proprietary source code or violate applicable open source licenses, but if we engaged in such uses inadvertently, we could be required to take remedial action or release certain of our proprietary source code. These scenarios could materially and adversely affect our business, financial condition, and results of operations. In addition, despite the protections we do place on our intellectual property, a third party could, without authorization, copy or otherwise obtain and use our products or technology, or develop similar technology. In addition, agreement terms that address non-competition are difficult to enforce in many jurisdictions and might not be enforceable in certain cases.
Beginning in the second quarter of 2015, we filed a limited number of provisional and non-provisional patent applications, which may or may not result in an issued patent or patents. In addition, we do not know whether the examination process will require us to narrow our claims. To the extent that patents are issued from our patent applications, which are not certain, they may be contested, circumvented or invalidated in the future. Moreover, the rights granted under any issued patents may not provide us with proprietary protection or competitive advantages, may be successfully challenged by third parties, and, as with any technology, competitors may be able to develop similar or superior technologies to our own now or in the future.
We currently rely primarily on unpatented proprietary technology. It is possible that others will independently develop the same or similar technology or otherwise obtain access to our unpatented technology. To protect our trade secrets and other proprietary information, we require employees, consultants, advisors, and collaborators to enter into confidentiality agreements. We cannot assure you that these agreements will provide meaningful protection for our trade secrets, know-how, or other proprietary information in the event of any unauthorized use, misappropriation, or disclosure of such trade secrets, know-how, or other proprietary information. Further, the theft or unauthorized use or publication of our trade secrets and other confidential business information could reduce the differentiation of our services and harm our business, the value of our investment in development or business acquisitions could be reduced, and third parties might make claims against us related to losses of their confidential or proprietary information.
20
We rely on our trademarks, service marks, trade names, and brand names to distinguish our services from the services of our competitors, and have registered or applied to register many of these trademarks. We cannot assure you that our trademark applications will be approved. Third parties may also oppose our trademark applications, or otherwise challenge our use of the trademarks. In the event that our trademarks are successfully challenged, we could be forced to rebrand our services, which could result in loss of brand recognition and could require us to devote resources advertising and marketing new brands. Further, we cannot assure you that competitors will not infringe our trademarks or that we will have adequate resources to enforce our trademarks.
Our ability to obtain, protect, and enforce our intellectual property rights is subject to uncertainty as to the scope of protection, registerability, patentability, validity, and enforceability of our intellectual property rights in each applicable jurisdiction, as well as the risk of general litigation or third-party oppositions.
Existing U.S. federal and state intellectual property laws offer only limited protection. Moreover, if we expand our business into markets outside of the United States, our intellectual property rights may not receive the same degree of protection as they would in the United States because of the differences in foreign trademark and other laws concerning proprietary rights. Governments may adopt regulations, and government agencies or courts may render decisions, requiring compulsory licensing of intellectual property rights. When we seek to enforce our intellectual property rights we may be subject to claims that the intellectual property rights are invalid or unenforceable. Litigation may be necessary in the future to enforce our intellectual property rights and to protect our trade secrets. Litigation brought to protect and enforce our intellectual property rights could be costly, time consuming, and distracting to management and could result in the impairment or loss of portions of our intellectual property rights. Furthermore, our efforts to enforce our intellectual property rights may be met with defenses, counterclaims, and countersuits attacking the validity and enforceability of our intellectual property rights. Our inability to protect our proprietary technology against unauthorized copying or use, as well as any costly litigation or diversion of our management’s attention and resources, could delay further sales or the implementation of our solutions, impair the functionality of our solutions, delay introductions of new solutions, result in our substituting inferior or more costly technologies into our solutions, or have a material adverse effect on our business, financial condition, and results of operations.
Laws regulating the corporate practice of medicine could restrict the manner in which we provide our clients certain of our intervention toolsets, and the failure to comply with such laws could subject us to penalties or require that we change the manner in which we provide such toolsets.
Among our intervention toolsets are supplemental patient encounters (“SPEs”). While some clients utilize our platform toolsets to conduct their own SPEs directly or through third-parties, some of our clients engage us to utilize our intervention platform toolsets to facilitate SPEs. In such cases, we use third-parties to undertake such SPEs utilizing our intervention platform toolsets or may utilize our own associate to undertake such SPEs. Certain of our SPEs may be considered patient care. Some states have laws that prohibit business entities from practicing medicine, employing providers to practice medicine, exercising control over medical decisions by providers (also known collectively as the corporate practice of medicine). These laws, regulations, and interpretations have, in certain states, been subject to enforcement, as well as judicial and regulatory interpretation, and are subject to change.
In these states, we operate by maintaining long term contracts with affiliated physician groups, which are each owned and operated by physicians and which employ or contract with additional providers to perform the SPEs, If there were a determination that a corporate practice of medicine violation existed or exists, we could be subject to criminal or civil penalties or an injunction for practicing medicine without a license or aiding and abetting the unlicensed practice of medicine. The occurrence of any of such events could have a material adverse effect on our ability to continue to provide our clients with the full array of our intervention toolsets.
We could experience losses or liability not covered by insurance.
Our business exposes us to risks that are inherent in the provision of analytics and toolsets that assist clinical decision-making and relate to patient medical histories and treatment plans. If clients or individuals assert liability claims against us, any ensuing litigation, regardless of outcome, could result in a substantial cost to us, divert management’s attention from operations, and decrease market acceptance of our toolsets. We attempt to limit our liability to clients by contract; however, the limitations of liability set forth in the contracts may not be enforceable or may not otherwise protect us from liability for damages. Additionally, we may be subject to claims that are not explicitly covered by contract. We also maintain general liability coverage; however, this coverage may not continue to be available on acceptable terms, may not be available in sufficient amounts to cover one or more large claims against us, and may include larger self-insured retentions or exclusions for certain products. In addition, the insurer might disclaim coverage as to any future claim. A successful claim not fully covered by our insurance could have a material adverse impact on our liquidity, financial condition, and results of operations.
21
We could incur substantial costs as a result of any claim of infringement of another party’s intellectual property rights.
In recent years, there has been significant litigation in the United States involving patents and other intellectual property rights. Companies in the software and healthcare technology and services industries are increasingly bringing and becoming subject to suits alleging infringement of proprietary rights, particularly patent rights, and our competitors and other third parties may hold patents or have pending patent applications which could be related to our business. These risks have been amplified by the increase in third parties, which we refer to as non-practicing entities, whose primary business is to assert infringement claims or make royalty demands. Moreover, many of our current and potential competitors may dedicate substantially greater resources to protection and enforcement of intellectual property rights, especially patents. It is difficult to proceed with certainty in a rapidly evolving technological environment in which there may be patent applications pending related to our technologies, many of which are confidential when filed.
We may receive in the future notices that claim we or our clients using our services have misappropriated or misused other parties’ intellectual property rights, particularly as the number of competitors in our market grows and the functionality of services among competitors overlaps. If we are sued by a third party that claims that our technology infringes its rights, the litigation, whether or not successful, could be extremely costly to defend, divert our management’s time, attention, and resources, damage our reputation and brand, and substantially harm our business. We do not currently have a patent portfolio of our own, which may limit the defenses available to us in any such litigation.
In addition, in most instances, we have agreed to indemnify our clients against certain third-party claims, which may include claims that one of our services infringes the intellectual property rights of such third parties. These claims may require us to initiate or defend protracted and costly litigation on behalf of our clients, regardless of the merits of these claims. If any of these claims succeed, we may be forced to pay damages on behalf of our clients or may be required to obtain licenses for the products they use. If we cannot obtain all necessary licenses on commercially reasonable terms, our customers may be forced to stop using our services. In addition, our business could be adversely affected by any significant disputes between us and our clients as to the applicability or scope of our indemnification obligations to them. The results of any intellectual property litigation to which we might become a party, or for which we are required to provide indemnification, may also require us to do one or more of the following:
• | cease offering or using technologies that incorporate the challenged intellectual property; |
• | make substantial payments for legal fees, settlement payments, or other costs or damages; |
• | obtain a license, which may not be available on reasonable terms, to sell or use the relevant technology; or |
• | redesign technology to avoid infringement, if feasible. |
If we were to discover that our applications and services violate third-party proprietary rights, there can be no assurance that we would be able to obtain licenses to continue offering those applications and services on commercially reasonable terms, or at all, to redesign our technology to avoid infringement, or to avoid or settle litigation regarding alleged infringement without substantial expense and damage awards. Any claims against us relating to the infringement of third-party proprietary rights, even if not meritorious, could result in the expenditure of significant financial and managerial resources and in injunctions preventing us from distributing certain products. If we are required to make substantial payments or undertake any of the other actions noted above as a result of any intellectual property infringement claims against us or any obligation to indemnify our clients for such claims, such payments or costs could have a material adverse effect on our business, financial condition, and results of operations.
We depend on our senior management team and other key employees, and the loss of one or more of our executive officers or key employees could materially and adversely affect our business.
Our success depends in large part upon the continued services of our key executive officers, including Dr. Dunleavy. We also rely on our leadership team in the areas of research and development, marketing, services, and general and administrative functions. We can provide no assurances that any of our executive officers or key employees will continue their employment with us. The replacement of one or more of our executive officers or other key employees would likely involve significant time and costs and may significantly delay or prevent the achievement of our business objectives.
We may fail to attract, train, and retain enough qualified employees to support our operations and growth strategy, which could materially and adversely affect our business and growth strategy.
The success of our business and growth strategy depends on our ability to attract, train, and retain qualified employees, particularly technology personnel, subject matter experts, sales and marketing leadership and support personnel, and personnel with healthcare regulatory, clinical, and appropriate management expertise. The market for qualified employees in our industry and in the markets in which we operate is very competitive, and companies that we compete with for experienced personnel may have greater resources than we. In addition, our ability to attract and retain qualified employees depends in part on our
22
ability to maintain awareness of our brand. If we are not successful in our recruiting efforts, or if we are unable to train and retain a sufficient number of qualified employees, our ability to develop and deliver successful technologies and services and grow our business may be materially and adversely affected.
We may acquire other companies or technologies, which could divert our management’s attention, result in dilution to our stockholders and otherwise disrupt our operations and adversely affect our operating results.
We have previously and may in the future seek to acquire or invest in businesses, services, or technologies that we believe could complement or expand our services, enhance our technical capabilities, or otherwise offer growth opportunities. For example, on September 1, 2015, we acquired Avalere, on October 1, 2016, we acquired Creehan and on July 6, 2017, the Company completed the acquisition of ComplexCare Solutions, Inc. and ComplexCare Solutions IPA, LLC (together, “CCS”). The pursuit of potential acquisitions may divert the attention of management and cause us to incur various expenses in identifying, investigating, and pursuing suitable acquisitions, whether or not they are consummated. Acquisitions also could result in dilutive issuances of equity securities or the incurrence of debt, which could adversely affect our operating results and financial condition. In addition, we have limited experience in acquiring other businesses. We may not achieve the anticipated benefits from the acquired business, including from Avalere, Creehan, or CCS, due to a number of factors, including:
• | inability or difficulty integrating and benefiting from acquired technologies, services, or clients in a profitable manner, including as a result of reductions in operating income, increases in expenses, the failure to achieve anticipated synergies, or otherwise; |
• | unanticipated costs or liabilities associated with the acquisition; |
• | difficulty integrating the accounting systems, operations, and personnel of the acquired business; |
• | adverse effects to our existing business relationships with business partners and clients as a result of the acquisition; |
• | assuming potential liabilities of an acquired company; |
• | possibility of overpaying for acquisitions, particularly those with significant intangibles and those assets that derive value using novel tools or are involved in niche markets; |
• | difficulty in acquiring suitable businesses, including challenges in predicting the value an acquisition will ultimately contribute to our business; |
• | the potential loss of key employees; |
• | use of substantial portions of our available cash to consummate the acquisition; and |
• | the need to understand local healthcare regulatory regimes. |
If an acquired business fails to meet our expectations, our operating results, business, and financial condition may suffer materially.
The integration of newly acquired businesses, including Avalere, Creehan and CCS, will also require a significant amount of time and attention from management. The diversion of management attention away from ongoing operations and key research and development, marketing or sales efforts could adversely affect ongoing operations and business relationships. Moreover, even if we were able to fully integrate a new acquisition’s business operations and other assets successfully, there can be no assurance that such integration will result in the realization of the full benefits of synergies, cost savings, innovation and operational efficiencies that may be possible or were anticipated from the acquisition or that these benefits will be achieved within a reasonable period of time. Delays in integrating our acquisitions, which could be caused by factors outside of our control, could adversely affect the intended benefits of the acquisitions to our business, financial results, financial condition and the trading price of our Class A common stock.
In addition, a significant portion of the purchase price of companies we acquire may be allocated to acquired goodwill and other intangible assets, which must be assessed for impairment at least annually. In the future, if our acquisitions do not yield expected returns, we may be required to take charges to our operating results based on this impairment assessment process, which could adversely affect our results of operations.
Our use of accounting estimates involves judgment and could adversely impact our financial results, and ineffective internal controls could adversely impact our business and operating results.
The methods, estimates, and judgments that we use in applying accounting policies have a significant impact on our results of operations. For more information on our critical accounting policies and estimates, see “Management’s Discussion and Analysis of Financial Condition and Results of Operations” and Note 2, “Summary of Significant Accounting Policies,” of the notes to our consolidated financial statements included elsewhere in this Annual Report on Form 10-K. In addition, our results presented elsewhere in this Annual Report include reasonable estimates of the impact of the Tax Cuts and Jobs Act of
23
2017 (the “Tax Act”), which was signed into law on December 22, 2017 and is effective January 1, 2018, which are subject to change as we further evaluate the impact of the Tax Act on us. These methods, estimates, and judgments are subject to significant risks, uncertainties, and assumptions, and changes could affect our results of operations. In addition, our internal control over financial reporting may not prevent or detect misstatements because of the inherent limitations, including the possibility of human error, the circumvention or overriding of controls, or fraud. Even effective internal controls can provide only reasonable assurance with respect to the preparation and fair presentation of our consolidated financial statements.
We are obligated to report on the effectiveness of our internal control over financial reporting. These internal controls may not be determined to be effective, which may harm investor confidence in our Company and, as a result, the trading price of our Class A common stock.
The Sarbanes-Oxley Act of 2002 (the “Sarbanes-Oxley Act”) requires, among other things, that we maintain effective internal controls for financial reporting and disclosure controls and procedures. We are required, pursuant to Section 404 of the Sarbanes-Oxley Act to furnish a report by management on, among other things, the effectiveness of our internal control over financial reporting in each Annual Report on Form 10-K. This assessment will need to include disclosure of material weaknesses, if any, identified by our management in our internal control over financial reporting. In addition, our independent registered public accounting firm is required to formally attest to the effectiveness of our internal control over financial reporting in each of our Annual Reports on Form 10-K. There can be no assurance that we or our independent registered public accounting firm will not identify a material weakness in our internal control over financial reporting in the future. Any failure of our internal control over financial reporting to be effective or our failure to implement required new or improved controls, if any, or difficulties encountered in their implementation, including delaying or failing to successfully integrate our acquisitions into our internal control over financial reporting or the identification and reporting of a material weakness, may harm our operating results, cause us to fail to meet our reporting obligations, harm investor confidence, and negatively impact the trading price of our Class A common stock.
Our Board of Directors may change our strategies, policies, and procedures without stockholder approval and we may become more highly leveraged, which may increase our risk of default under our debt obligations.
Our investment, financing, leverage, and dividend policies, and our policies with respect to all other activities, including growth, capitalization, and operations, are determined exclusively by our board of directors, and may be amended or revised at any time by our board of directors without notice to or a vote of our stockholders. This could result in us conducting operational matters, making investments, or pursuing different business or growth strategies than those contemplated in this Annual Report on Form 10-K. Further, our charter and bylaws do not limit the amount or percentage of indebtedness, funded or otherwise, that we may incur. Higher leverage also increases the risk of default on our obligations. In addition, a change in our investment policies, including the manner in which we allocate our resources across our portfolio or the types of assets in which we seek to invest, may increase our exposure to interest rate risk and liquidity risk. Changes to our policies with regards to the foregoing could materially adversely affect our financial condition, results of operations, and cash flow.
Future sales to clients outside the United States or use of third party vendors outside the United States might expose us to risks inherent in international operations which, if realized, could adversely affect our business.
An element of our growth strategy is to expand internationally. In addition, we intend to continue to utilize certain third-party vendors that are located outside of the United States. For example, we currently contract with a third-party vendor in India that provides IT support for certain of our operations. Operating in international markets requires significant resources and management attention and subjects us to regulatory, economic, and political risks that are different from those in the United States. Because of our limited experience with international operations, any international expansion efforts might not be successful in creating demand for our services outside of the United States or in effectively selling our services in the international markets we enter. In addition, we will face risks in doing business internationally that could adversely affect our business, including:
• | the need to localize and adapt our services for specific countries, including translation into foreign languages and associated expenses; |
• | difficulties in staffing and managing foreign operations; |
• | different pricing environments, longer sales cycles, and longer accounts receivable payment cycles and collections issues; |
• | new and different sources of competition; |
• | weaker protection for intellectual property and other legal rights than in the United States and practical difficulties in enforcing intellectual property and other rights outside of the United States; |
• | laws and business practices favoring local competitors; |
24
• | compliance challenges related to the complexity of multiple, conflicting, and changing governmental laws and regulations, including employment, anti-bribery, foreign investment, tax, privacy, and data protection laws and regulations; |
• | increased financial accounting and reporting burdens and complexities; |
• | adverse tax consequences; and |
• | if we denominate our international contracts in local currencies, fluctuations in the value of the U.S. dollar and foreign currencies might impact our operating results when translated into U.S. dollars. |
Our business could be harmed by disruptions in network service or operational failures at our data centers (including our co-location facility) related to the storage, transmission and presentation of client data.
Our success depends on the efficient and uninterrupted operation of our data centers and service provider locations. Interruptions in service or damage to locations may be caused by natural disasters, power loss, Internet or network failures, physical damage, operator error, security breaches, computer viruses, denial-of-service attacks, or similar events. The varied types and severity of the interruptions that could occur may render our safeguards inadequate. These service interruption events could result in the corruption or loss of data and impair the processing of data and our delivery of services to clients, which could have an adverse effect on our business, operations, and financial results. Furthermore, if any of our data centers are unable to keep up with our growing needs for capacity, it could have an adverse effect on our business.
Problems faced by our third-party data center location, with the telecommunications network providers with whom we or it contract, or with the systems by which our telecommunications providers allocate capacity among their clients, including us, could adversely affect the experience of our clients and the security of the data.
Further, our ability to deliver our cloud-based services depends on the infrastructure of the Internet and a reliable network with the necessary speed, data capacity, bandwidth capacity, and security. Our services are designed to operate without interruption in accordance with our service level commitments. We have, however, experienced, and may experience in the future, interruptions and delays in services and availability from time to time. An extended period of network unavailability could negatively impact our ability to deliver acceptable or accurate services, and negatively impact our relationship with clients, which could have an adverse effect on our reputation, financial condition, and results of operations.
We rely on third-party cloud capacity providers to efficiently scale our cloud-based solutions.
Although substantially all of the computer hardware necessary to deliver our solutions, data and compute capacity is located and maintained in our owned data centers, we rely on third-party cloud capacity providers, including Amazon Web Services, Microsoft Azure, and Google cloud services, to efficiently scale our cloud-based solutions. The systems and operations of our third-party cloud based capacity providers could suffer damage or interruption as a result of human error, fire, flood, power loss, telecommunications failure, break-ins, terrorist attacks, acts of war, and similar events. The occurrence of any such natural disaster, an act of terrorism or other unanticipated problems at our third-party cloud based capacity providers’ hosting facilities could result in lengthy interruptions in our service. Although our third-party cloud based capacity providers maintain backup facilities and disaster recovery services in the event of a system failure, these systems may be insufficient or fail. Any system failure, including network, software, or hardware failure, that causes an interruption in our use of third-party cloud capacity providers or that causes a decrease in responsiveness of our cloud-based solutions could damage our reputation and cause our customers and potential customers to believe that our service is unreliable, causing us to lose customers, which could have a material adverse effect on our business, financial condition and results of operations.
We rely on agreements with third parties to provide certain services, goods, technology, and intellectual property rights necessary to enable us to implement some of our applications.
Our ability to implement and provide our applications and services to our clients depends, in part, on services, goods, technology, and intellectual property rights owned or controlled by third parties, including one vendor from whom we purchase significant components of our storage architecture. These third parties may become unable to or refuse to continue to provide these services, goods, technology, or intellectual property rights on commercially reasonable terms consistent with our business practices, or otherwise discontinue a service important for us to continue to operate our applications. If we fail to replace these services, goods, technologies, or intellectual property rights in a timely manner or on commercially reasonable terms, our operating results and financial condition could be harmed. In addition, we exercise limited control over our third-party vendors, which increases our vulnerability to problems with technology and services those vendors provide. If the services, technology, or intellectual property of third parties were to fail to perform as expected, it could subject us to potential liability, adversely affect our renewal rates, and have a material adverse effect on our financial condition and results of operations.
25
Our reliance on third-party vendors to perform certain of our intervention toolsets could have an adverse effect on our business, results of operations and growth prospects.
We rely in part on third-party vendors to perform certain of our intervention toolsets, including supplemental patient encounters such as in-home encounters. These third parties may not perform their obligations to us in a timely and cost-effective manner, in compliance with applicable regulations, or in a manner that is in our and our clients’ best interests, which could have an adverse effect on our reputation and our ability to retain and attract clients. In addition, our growth depends in part on the ability of our third-party vendors to leverage our intervention toolsets to a larger group of clients. If our third-party vendors do not perform their services at a level acceptable to us or our clients or if they are unable to leverage our intervention toolsets to a larger group of clients, it could have an adverse effect on our business, results of operations, and growth prospects.
We are currently the subject of purported securities class action lawsuits and additional litigation may be brought against us in the future.
We are currently the subject of two consolidated purported class action lawsuits which assert violations of Section 11, Section 12, and Section 15 of the Securities Act based on allegedly false or misleading statements and omissions in our Registration Statement issued in connection with our initial public offering on February 18, 2015. These lawsuits seek certification as a class and unspecified compensatory damages plus interest and attorneys’ fees. We believe that the claims against us and our officers and directors are without merit, and we and the named officers and directors intend to defend ourselves and themselves vigorously. In light of, among other things, the early stage of the litigation, we are unable to predict the outcome of these lawsuits or make a meaningful estimate of the amount or range of potential loss, if any, that could result from an unfavorable outcome. In addition, in the past, following periods of volatility in the market, securities class action litigation has often been instituted against companies. Such current and additional litigation, if any, including in the form of stockholder derivative actions against our Board of Directors, could result in substantial costs and diversion of management’s attention and resources, which could materially and adversely affect our business, financial condition, results of operations and growth prospects and cause our stock price to decline.
The effects of the Tax Act on our business and financial results are uncertain.
The Tax Act made significant changes to the taxation of U.S. business entities. These changes include a permanent reduction to the federal corporate income tax rate and are expected to result in a decrease in our provision for income taxes and deferred tax liability. Our provision for income taxes, deferred tax liability and net income presented in this Annual Report on Form 10-K include a reasonable estimate of the effect of the Tax Act on our results for the year ended December 31, 2017, and our previously disclosed earnings guidance for 2018 also includes reasonable estimates of the effects of the Tax Act on our business and financial results. However, we continue to evaluate the effects of the Tax Act on these and other parts of our business and financial results and there can be no assurance that these estimates will be accurate or that there will not be negative changes to such estimates in the future.
Risks Related to Our Class A Common Stock
Our quarterly operating results may fluctuate significantly, which could adversely impact the value of our Class A common stock.
Our quarterly results of operations, including our revenue, cost of revenue, net income, and cash flows, may vary significantly in the future, and sequential quarter-to-quarter comparisons of our operating results may not be meaningful. In addition to the other risk factors included in this section, some of the important factors that may cause sequential quarter-to-quarter fluctuations in our operating results include:
• | seasonal variations driven primarily by regulatory timelines have historically caused a significantly higher proportion of our services to be performed, and therefore revenues and costs to be recognized, during the second and, to a lesser extent, the fourth quarters of the year compared to the first and, most significantly, the third quarter, (quarter to quarter financial performance may increasingly vary from historical seasonal trends as we further expand into adjacent markets and increase the portion of our revenue generated from new offerings); |
• | possible delays in the expected recognition of revenue due to lengthy and sometimes unpredictable sales and implementation timelines; |
• | the amount and timing of operating expenses related to the maintenance and expansion of our business, operations, and infrastructure; |
• | the timing and success of introductions of new applications and services by us or our competitors or any other change in the competitive dynamics of our industry, including consolidation among competitors, clients, or strategic partners; |
• | the addition or loss of large clients, including through acquisitions or consolidations of such clients; |
26
• | network outages or security breaches; |
• | our ability to attract new clients; |
• | general economic, industry, and market conditions; |
• | client renewal rates and the timing and terms of client renewals; |
• | changes in our pricing policies or those of our competitors; |
• | the mix of applications and services sold during a period; and |
• | the timing of expenses related to the development or acquisition of technologies or businesses. |
Any fluctuations in our quarterly operating results may not accurately reflect the underlying longer-term performance of our business and could cause a decline in the trading price of our Class A common stock.
Because the dual class structure of our common stock has the effect of concentrating voting control with holders of our Class B common stock, holders of our Class B common stock, including Dr. Dunleavy and Mr. Hoffmann, have significant influence over us, including control over decisions that require the approval of stockholders, which could limit your ability to influence the outcome of matters submitted to stockholders for a vote.
We are currently controlled by holders of our Class B common stock. As of February 9, 2018, holders of our Class B common stock beneficially own an aggregate of approximately 93% of the voting power of our common stock. In particular, Dr. Dunleavy beneficially owns an aggregate of approximately 63% of the voting power of our common stock, and Mr. Hoffmann beneficially owns an aggregate of approximately 22% of the voting power of our common stock. The shares beneficially owned by Dr. Dunleavy and Mr. Hoffmann and certain other stockholders are shares of Class B common stock, which have 10 votes per share, whereas each share of Class A common stock has one vote per share. As long as holders of our Class B common stock control at least a majority of the voting power of our outstanding common stock, they will have the ability to exercise substantial control over all corporate actions requiring stockholder approval, irrespective of how our other stockholders may vote, including the election and removal of directors and the size of our board of directors, any amendment of our certificate of incorporation or bylaws, or the approval of any merger or other significant corporate transaction, including a sale of all or substantially all of our assets. Even if their ownership falls below 50%, holders of our Class B common stock will continue to be able to exert significant influence or effectively control our decisions because of the dual class structure of our common stock. This concentrated control by our Class B common stockholders will limit or preclude your ability to influence those corporate matters for the foreseeable future and, as a result, we may take actions that holders of our Class A common stock do not view as beneficial. This dual class structure may adversely affect the market price of our Class A common stock. In addition, this structure may prevent or discourage unsolicited acquisition proposals or offers for our capital stock that you may feel are in your best interest as one of our stockholders.
We incur significantly increased costs and devote substantial management time as a result of operating as a public company.
As a publicly traded company, we incur significant legal, accounting, stockholder communication, and other expenses and spend a significant amount of management time and internal resources to comply with changing tax laws, regulations and standards relating to corporate governance and public disclosure. For example, we are subject to the reporting requirements of the Exchange Act, and are required to comply with the applicable requirements of the Sarbanes-Oxley Act and the Dodd-Frank Wall Street Reform and Consumer Protection Act, as well as rules and regulations subsequently implemented by the SEC, and the NASDAQ Stock Market LLC (“NASDAQ”), including the establishment and maintenance of effective disclosure and financial controls, changes in corporate governance practices, and required filing of annual, quarterly, and current reports with respect to our business and operating results. In particular, we incur significant expenses and devote substantial management effort toward ensuring compliance with the requirements of Section 404 of the Sarbanes-Oxley Act.
Changing laws, regulations and standards relating to corporate governance and public disclosure, including the Sarbanes-Oxley Act, the Dodd-Frank Wall Street Reform and Consumer Protection Act of 2010 and new regulations issued by the SEC are creating additional disclosure obligations for public companies. We may need to invest substantial resources to comply with evolving standards, which may result in increased expenses and a diversion of management time. Furthermore, if we are unable to satisfy our obligations as a public company, we could be subject to delisting of our Class A common stock, fines, sanctions, and other regulatory action and potentially civil litigation, which could have a material adverse effect on our financial condition and results of operations.
The stock price of our Class A common stock may be volatile or may decline regardless of our operating performance, and you may not be able to resell your shares at or above the price at which you acquire shares of our Class A common stock.
The market price of our Class A common stock may fluctuate significantly. These fluctuations could cause you to lose all or part of your investment in our common stock since you might be unable to sell your shares at or above the price you paid.
27
Factors, many of which are beyond our control, that could cause fluctuations in the market price of our Class A common stock include the following:
• | overall performance of the equity markets; |
• | our operating performance and the performance of other similar companies; |
• | changes in the market valuations of similar companies; |
• | changes in our capital structure, such as future issuances of securities or the incurrence of debt; |
• | changes in the estimates of our operating results that we provide to the public or our failure to meet these projections; |
• | failure of securities analysts to maintain coverage of us, changes in financial estimates by securities analysts who follow our company, or our failure to meet these estimates or the expectations of investors or changes in recommendations by securities analysts that elect to follow our Class A common stock; |
• | sales of shares of our Class B common stock by our stockholders; |
• | announcements of technological innovations, new services or enhancements to services, acquisitions, strategic alliances, or significant agreements by us or by our competitors; |
• | disruptions in our services due to computer hardware, software, or network problems or a security breach; |
• | announcements of client additions and client cancellations or delays in client purchases; |
• | recruitment or departure of key personnel; |
• | the economy as a whole or market conditions in our industry and the industries of our clients; |
• | litigation involving us, our industry, or both, or investigations by regulators into our operations or those of our competitors; |
• | developments or disputes concerning our intellectual property or other proprietary rights; |
• | new laws or regulations, or new interpretations of existing laws or regulations, applicable to our business; |
• | the size of our market float; and |
• | any other factors discussed in this Annual Report on Form 10-K. |
In addition, the stock markets have experienced extreme price and volume fluctuations that have affected and continue to affect the market prices of equity securities of many technology companies. Stock prices of many technology companies have fluctuated in a manner unrelated or disproportionate to the operating performance of those companies. In the past, stockholders have filed securities class action litigation following periods of market volatility. If we were to become involved in securities litigation, it could subject us to substantial costs, divert resources and the attention of management from our business, and materially adversely affect our business.
We do not currently intend to pay dividends on our common stock and, consequently, your ability to achieve a return on your investment will depend on appreciation in the price of our Class A common stock.
Although we have paid cash dividends on our common stock in the past, we currently intend to invest any future earnings to finance the operation and growth of our business and do not expect to pay any dividends for the foreseeable future. As a result, the success of an investment in shares of our Class A common stock will depend upon future appreciation in its value, if any, and there is no guarantee that shares of our Class A common stock will appreciate in value.
Delaware law and provisions in our restated certificate of incorporation and bylaws could make a merger, tender offer, or proxy contest difficult, thereby depressing the trading price of our Class A common stock.
Our status as a Delaware corporation and the anti-takeover provisions of the Delaware General Corporation Law may discourage, delay, or prevent a change in control by prohibiting us from engaging in a business combination with an interested stockholder (generally a stockholder, who together with affiliates and associates, owns 15% or more of our voting rights) for a period of three years after the person becomes an interested stockholder, even if a change of control would be beneficial to our stockholders. In addition, our restated certificate of incorporation and bylaws contain provisions that may make the acquisition of our company more difficult, including the following:
• | we have a dual class common stock structure, which could provide the holders of our Class B common stock, including our executive officers, directors, and their affiliates, with the ability to control the outcome of matters requiring stockholder approval, even if they own significantly less than a majority of the shares of our outstanding Class A and Class B common stock; |
28
• | when the outstanding shares of our Class B common stock represent less than 10% of the total outstanding shares of our common stock, certain amendments to our restated bylaws will require the approval of two-thirds of the voting power of our then-outstanding shares of common stock; |
• | when the outstanding shares of our Class B common stock represent less than 10% of the total outstanding shares of our common stock, vacancies on our board of directors will be able to be filled only by our board of directors and not by stockholders; |
• | when the outstanding shares of our Class B common stock represent less than 10% of the total outstanding shares of our common stock, our board of directors will be classified into three classes of directors with staggered three-year terms and directors will only be able to be removed from office for cause; |
• | when the outstanding shares of our Class B common stock represent less than 10% of the total outstanding shares of our common stock, our stockholders will only be able to take action at a meeting of stockholders and not by written consent; |
• | only our chairman, our chief executive officer, a majority of our board of directors, or stockholders holding shares representing at least 50% of the combined voting power of our Class A common Stock and Class B common stock will be authorized to call a special meeting of stockholders until the outstanding shares of our Class B common stock represent less than 10% of the total outstanding shares of our common stock, at which time only our chairman, our chief executive officer, or a majority of our board of directors will be authorized to call a special meeting of stockholders; |
• | advance notice procedures will apply for stockholders to nominate candidates for election as directors or to bring matters before an annual meeting of stockholders; |
• | our restated certificate of incorporation authorized up to 100,000,000 shares of undesignated preferred stock, the terms of which may be established, and shares of which may be issued, without stockholder approval; and |
• | certain litigation against us can only be brought in Delaware. |
Our restated certificate of incorporation provides that, subject to certain exceptions, the Court of Chancery of the State of Delaware shall be the sole and exclusive forum for certain stockholder litigation matters, which could limit our stockholders’ ability to obtain a favorable judicial forum for disputes with us or our directors, officers or employees.
Our restated certificate of incorporation provides that, subject to limited exceptions, the Court of Chancery of the State of Delaware will be the sole and exclusive forum for (i) any derivative action or proceeding brought on our behalf, (ii) any action asserting a claim of breach of a fiduciary duty owed by any of our directors, officers or other employees to us or our stockholders, (iii) any action asserting a claim against us arising pursuant to any provision of the Delaware General Corporation Law, our restated certificate of incorporation or our restated bylaws, or (iv) any action asserting a claim against us that is governed by the internal affairs doctrine. Any person or entity purchasing or otherwise acquiring any interest in shares of our capital stock shall be deemed to have notice of and to have consented to the provisions of our restated certificate of incorporation described above. This choice of forum provision may limit a stockholder’s ability to bring a claim in a judicial forum that it finds favorable for disputes with us or any of our directors, officers or other employees, which may discourage lawsuits with respect to such claims. Alternatively, if a court were to find the choice of forum provision contained in our amended and restated certificate of incorporation to be inapplicable or unenforceable in an action, we may incur additional costs associated with resolving such action in other jurisdictions, which could harm our business, operating results and financial condition.
If securities or industry analysts do not publish research or reports about our business, if they adversely change their recommendations regarding our shares, or if our results of operations do not meet their expectations, the share price and trading volume of our Class A common stock could decline.
The trading market for our Class A common stock will be influenced by the research and reports that industry or securities analysts publish about us or our business. We do not have any control over these analysts. If one or more of these analysts cease coverage of our company or fail to publish reports on us regularly, we could lose visibility in the financial markets, which in turn could cause the share price or trading volume of our Class A common stock to decline. Moreover, if one or more of the analysts who cover us, express views regarding us that may be perceived as negative or less favorable than previous views, downgrade our stock, or if our results of operations do not meet their expectations, the share price of our Class A common stock could decline.
Item 1B. Unresolved Staff Comments.
None.
29
Item 2. Properties.
Our corporate headquarters is located in Bowie, Maryland, where we occupy approximately 110,000 square feet under a lease agreement that expires in June 2029. In addition, we lease an aggregate of approximately 240,000 square feet at the following locations: Columbia, Maryland; Bowie, Maryland; Herndon, Virginia; Washington, DC; Phoenix, Arizona; Cecil, Pennsylvania; Canonsburg, Pennsylvania; and Nashville, Tennessee. We own one property in Snellville, Georgia, which is approximately 12,000 square feet. In addition, we maintain a number of leases for smaller office facilities in various locations in the regions of our clients coinciding with specific client needs.
Item 3. Legal Proceedings.
Legal Proceedings—From time to time the Company is involved in various litigation matters arising out of the normal course of business. The Company consults with legal counsel on those issues related to litigation and seeks input from other experts and advisors with respect to such matters. Estimating the probable losses or a range of probable losses resulting from litigation, government actions and other legal proceedings is inherently difficult and requires an extensive degree of judgment, particularly where the matters involve indeterminate claims for monetary damages, may involve discretionary amounts, present novel legal theories, are in the early stages of the proceedings, or are subject to appeal. Whether any losses, damages or remedies ultimately resulting from such matters could reasonably have a material effect on the Company’s business, financial condition, results of operations, or cash flows will depend on a number of variables, including, for example, the timing and amount of such losses or damages (if any) and the structure and type of any such remedies. The Company’s management does not presently expect any litigation matters to have a material adverse impact on the condensed consolidated financial statements of the Company.
On June 24, 2016, a purported securities class action complaint (Xiang v. Inovalon Holdings, Inc., et.al., No. 1:16-cv-04923) was filed in the United States District Court for the Southern District of New York against the Company, certain officers, directors and underwriters in the Company’s initial public offering (the “Complaint”). The Complaint was brought on behalf of a purported class consisting of all persons or entities who purchased shares of the Company’s Class A common stock pursuant or traceable to the Registration Statement relating to the Company’s initial public offering on February 18, 2015. The Complaint asserted violations of Sections 11 and 15 of the Securities Act based on allegedly false or misleading statements and omissions with respect to, among other things, the Company’s revenues from sales in the city and state of New York and the Company’s effective tax rate. The Complaint sought certification as a class action and unspecified compensatory damages plus interest and attorneys’ fees. On June 28, 2016, a nearly identical complaint was filed in the same court captioned Patel v. Inovalon Holdings, Inc., et. al., No. 1:16-cv-05065. On July 5, 2016, the court consolidated the Xiang and Patel actions. On September 20, 2016, the court appointed a lead plaintiff and lead counsel. On December 21, 2016, lead plaintiff filed a consolidated class action complaint (the “Amended Complaint”) purporting to assert violations of Sections 11, 12(a)(2), and 15 of the Securities Act of 1933, as amended, based on allegedly false or misleading statements and omissions with respect to substantially the same topics as alleged in the Complaint. On February 21, 2017, and as required by the court’s individual practices, the Company invoked the pre-motion process required prior to filing a motion to dismiss. On May 23, 2017, the court issued a decision and order construing the pre-motion letter submitted by the defendants as a motion to dismiss, granting dismissal of the Section 12 claims against the individual defendants, but denying dismissal of the remaining claims. On June 6, 2017, defendants filed a joint motion for reconsideration and supporting memorandum of law seeking reconsideration of the court’s decision and arguing that plaintiff’s claims are time-barred. Also on June 6, 2017, defendants submitted a letter to the court requesting, in the alternative to the motion for reconsideration, a pre-motion conference concerning defendants’ anticipated motion for certification of an interlocutory appeal to resolve a controlling question of law. On July 11, 2017, the Company and its officers and directors filed their answer to the Amended Complaint denying that plaintiffs are entitled to any relief. On July 28, 2017, the court issued a decision and order denying both the motion for reconsideration and defendant’s request for an interlocutory appeal. On January 22, 2018, lead plaintiff filed its motion for class certification, and on February 12, 2018, defendants filed an opposition to such motion for class certification, which motion remains pending. The parties are presently engaged in discovery. The court has set October 22, 2018 as the deadline for the completion of all discovery. In light of, among other things, the early stage of the litigation, the Company is unable to predict the outcome of these consolidated actions and is unable to make a meaningful estimate of the amount or range of loss, if any, that could result from this proceeding.
On June 29, 2017, Virginia Rodriquez filed a putative shareholder derivative suit in the Supreme Court of the State of New York, County of Westchester, against certain of the Company’s present and former directors and officers (the “Derivative Complaint”). The Company was named as a nominal defendant. The Derivative Complaint makes allegations similar to the allegations in the securities class action Amended Complaint described above and asserts claims for breach of fiduciary duty, unjust enrichment, abuse of control and gross mismanagement, and seeks unspecified damages, an order directing the Company “to reform and improve” certain corporate governance and internal procedures, restitution from the defendants and disgorgement of all profits, benefits and other compensation received and costs and disbursements incurred in connection with
30
the action, including attorneys’ fees. On September 12, 2017, the Company and the individual defendants filed a joint motion to dismiss the Derivative Complaint. As directed by the court, the parties submitted memoranda of law concerning only the forum selection provision contained in the Company’s Second Amended and Restated Certificate of Incorporation. On December 27, 2017, the court issued a decision and order granting the defendants’ joint motion to dismiss plaintiff’s Derivative Complaint on the basis of the forum selection provision.
Item 4. Mine Safety Disclosures.
Not Applicable.
31
PART II
Item 5. Market For Registrant’s Common Equity, Related Stockholder Matters and Issuer Purchases of Equity Securities.
Market Information
Our Class A common stock is listed on the NASDAQ Global Select Market under the symbol “INOV.” Initial trading of our Class A common stock commenced on February 12, 2015. Accordingly, no market for our common stock existed prior to that date. On February 12, 2015, we offered our IPO at a price to the public of $27.00 per share. The following table lists quarterly information on the price range of our Class A common stock based on the high and low reported sale prices for our Class A common stock as reported by NASDAQ for the periods indicated below:
Price Range | |||||||
High | Low | ||||||
Year Ended December 31, 2017: | |||||||
First quarter | $ | 12.65 | $ | 10.25 | |||
Second quarter | $ | 14.65 | $ | 11.35 | |||
Third quarter | $ | 17.80 | $ | 11.60 | |||
Fourth quarter | $ | 17.70 | $ | 14.55 | |||
Year Ended December 31, 2016: | |||||||
First quarter | $ | 19.99 | $ | 15.12 | |||
Second quarter | $ | 19.40 | $ | 15.50 | |||
Third quarter | $ | 20.05 | $ | 13.85 | |||
Fourth quarter | $ | 16.20 | $ | 8.60 | |||
Year Ended December 31, 2015: | |||||||
First quarter | $ | 33.75 | $ | 21.68 | |||
Second quarter | $ | 30.55 | $ | 22.06 | |||
Third quarter | $ | 28.38 | $ | 17.78 | |||
Fourth quarter | $ | 23.87 | $ | 16.51 | |||
32
Stock Performance Graph
The following performance graph and related information shall not be deemed “soliciting material” or to be “filed” with the Securities and Exchange Commission, nor shall such information be incorporated by reference into any future filing under the Securities Act of 1933 or Securities Exchange Act of 1934, each as amended, except to the extent that we specifically incorporate it by reference into such filing.
The line graph and table below compare the cumulative total stockholder return on our Class A common stock with the NASDAQ Composite-Total Returns Index and the NASDAQ Computer Index. This graph and table assume the investment of $100 in Company common stock on February 12, 2015 and assumes the reinvestment of dividends, if any, on the relevant payment dates.
The following performance graph is historical and not necessarily indicative of future price performance.
The following table was used to prepare the preceding chart, assumes $100 was invested at the close of market on February 12, 2015, which was our initial trading day, and illustrates the value of the investment based on quoted prices as of the indicated dates:
Feb 12, 2015 | Mar 31, 2015 | Jun 30, 2015 | Sep 30, 2015 | Dec 31, 2015 | Mar 31, 2016 | Jun 30, 2016 | Sep 30, 2016 | Dec 31, 2016 | Mar 31, 2017 | Jun 30, 2017 | Sep 30, 2017 | Dec 31, 2017 | |||||||||||||||||||||||||||||||||||||||
Inovalon Holdings, Inc. | $ | 100 | $ | 112 | $ | 103 | $ | 77 | $ | 63 | $ | 69 | $ | 67 | $ | 54 | $ | 38 | $ | 47 | $ | 49 | $ | 63 | $ | 56 | |||||||||||||||||||||||||
NASDAQ Composite Index | $ | 100 | $ | 101 | $ | 103 | $ | 95 | $ | 103 | $ | 100 | $ | 100 | $ | 109 | $ | 111 | $ | 122 | $ | 126 | $ | 134 | $ | 142 | |||||||||||||||||||||||||
NASDAQ Computer Index | $ | 100 | $ | 99 | $ | 99 | $ | 94 | $ | 104 | $ | 105 | $ | 101 | $ | 115 | $ | 117 | $ | 132 | $ | 137 | $ | 149 | $ | 162 | |||||||||||||||||||||||||
Holders
As of February 9, 2018, there were 78 stockholders of record of our Class A common stock. However, because many shares of our common stock are held by brokers and other institutions on behalf of stockholders, we believe there are substantially more beneficial holders of our common stock than record holders. As of February 9, 2018, there were 23 stockholders of record of our Class B common stock.
Dividend Policy
Our board of directors does not currently intend to declare and pay dividends on our common stock. However, our board of directors will periodically reevaluate our dividend policy and may determine to pay dividends in the future. Any future determination to declare cash dividends will be at the sole discretion of our board of directors. No dividends were declared during the years ended December 31, 2017 and 2016.
Unregistered Sales of Equity Securities
None.
33
Use of Proceeds from Registered Securities
On February 18, 2015, we completed our initial public offering (“IPO”) of 22,222,222 shares of Class A common stock and, upon the underwriters’ exercise of their option to purchase additional shares, issued an additional 3,142,581 shares of Class A common stock for a total of 25,364,803 shares issued. All of the shares issued in the IPO were primary shares offered by us as none of our stockholders sold any shares in the IPO. The offering price of the shares sold in the IPO was $27.00 per share, resulting in net proceeds to us, after underwriters’ discounts and commissions and other expenses payable by us, of $639.1 million. All of the shares were sold pursuant to our registration statement on Form S-1, as amended (File No. 333-201321), that was declared effective by the SEC on February 11, 2015. Goldman, Sachs & Co., Morgan Stanley & Co. LLC, and Citigroup Global Markets Inc. acted as joint book-running managers for the IPO and as representatives of the underwriters. The principal purposes of our IPO were to create a public market for our Class A common stock and thereby enable future access to the public equity markets by us and our stockholders, and obtain additional capital. On September 1, 2015, we used approximately $126.2 million of the net proceeds from the IPO to complete the acquisition of Avalere Health, Inc. On October 1, 2016, we committed $120.0 million as partial consideration for our acquisition of Creehan. (See Note 3, “Business Combinations” of the notes to our audited consolidated financial statements included elsewhere within this Annual Report on Form 10-K for more information). Through December 31, 2017, in aggregate, we have used approximately $200.0 million of the net proceeds from the IPO to repurchase outstanding shares of Class A common stock under our share repurchase program. We intend to use the remaining net proceeds to us from our IPO for working capital and other general corporate purposes. Additionally, we may use a portion of the remaining net proceeds for additional acquisitions of complementary businesses, technologies, or other assets, or to repay outstanding indebtedness.
Purchases of Equity Securities by the Issuer or Affiliated Purchasers
The following table presents a summary of share repurchases made by the Company during the quarter ended December 31, 2017:
Period | Total Number of Shares Purchased | Average Price Paid per Share | Total Number of Shares Purchased as Part of Publicly Announced Plans or Programs | Maximum Number of Shares (or approximate dollar value) that May Yet be Purchased under the Plans or Programs(1) | |||||||||
October 1, 2017 - October 31, 2017 | — | $ | — | — | $ | 28,783,049 | |||||||
November 1, 2017 - November 30, 2017 | 740,133 | 15.39 | 740,133 | 17,391,338 | |||||||||
December 1, 2017 - December 31, 2017 | 1,135,553 | 15.15 | 1,135,553 | — | |||||||||
Total | 1,875,686 | $ | 15.25 | 1,875,686 | $ | — | |||||||
_______________________________________
(1) | On May 4, 2016, we announced that our Board of Directors authorized a program to repurchase up to $100 million of Inovalon’s Class A common stock through December 31, 2016. On November 2, 2016, we announced that our Board of Directors authorized an expansion of the share repurchase program to repurchase up to an additional $100 million of shares of Inovalon’s Class A common stock (bringing the total to $200 million) through December 31, 2017. As of December 31, 2017, the Company repurchased approximately 14.6 million shares at an average purchase price of $13.67 per share for a total purchase price of approximately $200.0 million under this program. The share repurchase program expired on December 31, 2017. |
Securities Authorized for Issuance Under Equity Compensation Plans
See Item 12, “Security Ownership of Certain Beneficial Owners and Management and Related Stockholder Matters” for information regarding securities authorized for issuance.
34
Item 6. Selected Financial Data.
The following table sets forth selected consolidated financial data for the years presented and at the dates indicated below. Our historical results are not necessarily indicative of our results in any future periods. The summary of our consolidated financial data set forth below should be read together with our consolidated financial statements and related notes, as well as the sections entitled “Management’s Discussion and Analysis of Financial Condition and Results of Operations,” included elsewhere in this Annual Report on Form 10-K.
Year Ended December 31, | |||||||||||||||||||
2017 | 2016 | 2015 | 2014 | 2013 | |||||||||||||||
(in thousands, except share and per share information) | |||||||||||||||||||
Consolidated Statement of Operations Data: | |||||||||||||||||||
Revenue | $ | 449,358 | $ | 427,588 | $ | 437,271 | $ | 361,540 | $ | 295,798 | |||||||||
Income from operations | 33,789 | 37,634 | 116,456 | 110,061 | 52,445 | ||||||||||||||
Net income | 34,818 | 27,104 | 66,063 | 65,352 | 32,718 | ||||||||||||||
Net income attributable to common stockholders | 33,828 | 26,943 | 66,014 | 65,352 | 32,718 | ||||||||||||||
Basic net income per share | $ | 0.24 | $ | 0.18 | $ | 0.45 | $ | 0.50 | $ | 0.24 | |||||||||
Diluted net income per share | $ | 0.24 | $ | 0.18 | $ | 0.45 | $ | 0.49 | $ | 0.24 | |||||||||
December 31, | |||||||||||||||||||
2017 | 2016 | 2015 | 2014 | 2013 | |||||||||||||||
(in thousands) | |||||||||||||||||||
Consolidated Balance Sheet Data: | |||||||||||||||||||
Cash and cash equivalents | $ | 208,944 | $ | 127,683 | $ | 114,034 | $ | 162,567 | $ | 110,594 | |||||||||
Short-term investments | 267,288 | 445,315 | 614,130 | — | — | ||||||||||||||
Accounts receivable, net of allowances | 90,054 | 85,591 | 81,305 | 43,938 | 33,398 | ||||||||||||||
Working capital | 466,628 | 601,720 | 776,477 | 168,217 | 130,562 | ||||||||||||||
Property, equipment and capitalized software, net | 125,768 | 76,420 | 65,031 | 50,962 | 43,050 | ||||||||||||||
Goodwill | 184,932 | 184,557 | 137,733 | 62,269 | 62,269 | ||||||||||||||
Total assets | 995,078 | 1,053,344 | 1,112,877 | 342,569 | 269,746 | ||||||||||||||
Long-term debt and capital lease obligations | 203,359 | 236,465 | 266,546 | 281,418 | 279 | ||||||||||||||
Total liabilities | 352,306 | 369,767 | 373,721 | 350,791 | 38,012 | ||||||||||||||
Total stockholders’ equity (deficit) | 642,772 | 683,577 | 739,156 | (8,222 | ) | 231,734 | |||||||||||||
Item 7. Management’s Discussion and Analysis of Financial Condition and Results of Operations.
You should read the following discussion and analysis of our financial condition and results of operations in conjunction with our “Selected Financial Data” and our consolidated financial statements and notes thereto appearing elsewhere in this Annual Report on Form 10-K. In addition to historical consolidated financial information, the following discussion and analysis may contain forward-looking statements that involve risks, uncertainties and assumptions. Our actual results could differ materially from those anticipated by forward-looking statements as a result of many factors. We discuss factors that we believe could cause or contribute to these differences below and elsewhere in this Annual Report on Form 10-K, including those set forth under “Risk Factors” and “Special Note Regarding Forward-Looking Statements.”
Overview
We are a leading technology company providing cloud-based platforms empowering a data-driven transformation from volume-based to value-based models throughout the healthcare industry. Through the Inovalon ONE™ Platform, Inovalon brings to the marketplace a national-scale capability to interconnect with the healthcare ecosystem on a very large scale, aggregate and analyze data in petabyte volumes to arrive at sophisticated insights in real-time, drive impact wherever it is analytically identified best to intervene, and intuitively visualize data and information to inform business strategy and execution. Leveraging its platform capabilities, large proprietary data sets, and industry-leading subject matter expertise, Inovalon enables the assessment and improvement of clinical and quality outcomes and financial performance across the healthcare ecosystem. From health plans and provider organizations, to pharmaceutical, medical device, and diagnostics companies, Inovalon’s unique achievement of value is delivered through the effective progression of “Turning Data into Insight, and Insight into Action®.” Providing technology that supports a client base approaching 500 healthcare organizations,
35
Inovalon’s platforms are informed by data pertaining to more than 932,000 physicians, 455,000 clinical facilities, 240 million individuals, and 37 billion medical events.
We generate the substantial majority of our revenue through the sale or subscription licensing of our cloud-based data analytics, intervention and reporting platforms and related support services.
On February 18, 2015, we completed our IPO of 22,222,222 shares of Class A common stock and, upon the underwriters’ exercise of their option to purchase additional shares, issued an additional 3,142,581 shares of Class A common stock for a total of 25,364,803 shares issued. All of the shares issued in the IPO were primary shares offered by us as none of our stockholders sold any shares in the IPO. The offering price of the shares sold in the IPO was $27.00 per share, resulting in net proceeds to us, after underwriters’ discounts and commissions and other expenses payable by us, of $639.1 million. Our Class A common stock is currently traded on the NASDAQ Global Select Market under the symbol “INOV.”
On September 1, 2015, we acquired all of the issued and outstanding capital stock of Avalere for an aggregate purchase price of $140.0 million, consisting of cash and 235,737 shares of the Company’s Class A common stock, which were subject to resale restrictions. Avalere is a provider of data-driven advisory services and business intelligence solutions primarily to the pharmaceutical and life sciences industry. Pursuant to the Share Purchase Agreement between the Company and Avalere, certain portions of the stated purchase price of $140.0 million were contingent upon the achievement of financial and operational objectives, and other portions were subject to continued employment provisions. The addition of Avalere, with its more than 200 pharmaceutical and life sciences clients, as well as an extensive array of client relationships with payers, providers and research institutions, is expected to expand our capabilities and client base into the expansive and adjacent markets of the pharmaceutical and life sciences industry. The results of operations related to Avalere are included in our consolidated statements of operations beginning from the date of acquisition. See Note 3, “Business Combinations,” of the notes to our audited consolidated financial statements included elsewhere within this Annual Report on Form 10-K for more information.
On October 1, 2016, we completed our acquisition of Creehan, a leading provider of specialty pharmacy software solutions to the pharmaceutical industry, by acquiring all of Creehan’s issued and outstanding capital stock for an aggregate purchase price of $130.0 million, consisting of cash and 651,355 shares of the Company’s Class A common stock, which are subject to resale restrictions. Certain components of the aggregate purchase price are subject to the achievement of financial performance objectives. We acquired Creehan for the assembled workforce, technology platform, client base, and to accelerate entry into the specialty pharmacy software market. The results of operations related to Creehan are included in our consolidated statements of operations beginning from the date of acquisition. See Note 3, “Business Combinations,” of the notes to our audited consolidated financial statements included elsewhere within this Annual Report on Form 10-K for more information.
On July 6, 2017, we completed the acquisition of CCS, a company which provides technology-enabled interventions and member engagement coordination services for a number of payers and employers throughout the United States. We acquired all of the capital stock of CCS for approximately $4.5 million in cash and the settlement of an existing payable to CCS of $2.3 million. See Note 3, “Business Combinations,” of the notes to our audited consolidated financial statements included elsewhere within this Annual Report on Form 10-K for more information.
Key Metrics
We review a number of metrics, including the key metrics shown in the table below. We believe that these metrics are indicative of our overall level of analytical activity and the underlying growth in our business.
Year Ended December 31, | ||||||||
2017 | 2016 | 2015 | ||||||
(in thousands, except percentages) | ||||||||
MORE2 Registry® dataset metrics(1) | ||||||||
Unique patient count(2) | 240,180 | 150,961 | 130,953 | |||||
Medical event count(3) | 37,813,583 | 13,345,220 | 11,051,441 | |||||
Trailing 12 month PAM(1)(4) | 42,156,422 | 26,401,946 | 21,449,667 | |||||
_______________________________________
(1) | MORE2 Registry® dataset metrics and Trailing 12 month PAM, each of which is presented in the table, are key operating metrics that management uses to assess our level of operational activity. While we believe that each of these metrics is indicative of our overall level of analytical activity and the underlying growth in our business, increases or decreases in these metrics do not necessarily correlate to proportional increases or decreases in revenue, or net income. For instance, although increased levels of analytical activity historically have corresponded to increases in revenue over the long term, differences in fees charged for different analytical packages exist and differences in how analytics trigger the applicability |
36
of our data-driven intervention platforms may result in increases in analytical activity that do not result in proportional increases in revenue, or net income (and vice versa). Accordingly, while we believe the presentation of these operating metrics is helpful to investors in understanding our business, these metrics have limitations and should not be considered as substitutes for analysis of our financial results reported under generally accepted accounting principles (“GAAP”). In addition, we believe that other companies, including companies in our industry, do not present similar operating metrics and that there is no commonly accepted method of calculating these metrics, which may reduce their usefulness as comparative measures.
(2) | Unique patient count is defined as each unique, longitudinally matched, de-identified natural person represented in our MORE2 Registry® as of the end of the period presented. |
(3) | Medical event count is defined as the total number of discrete medical events as of the end of the period presented (for example, a discrete medical event typically results from the presentation of a patient to a physician for the diagnosis of diabetes and congestive heart failure in a single visit, the presentation of a patient to an emergency department for chest pain, etc.). |
(4) | PAM is defined as the sum of the analytical processes performed on each respective patient within patient populations covered by clients under contract. As used in the metric, an “analytical process” is a distinct set of data calculations undertaken by us which is initiated and completed by our analytical platform to examine a specific question such as whether a patient is believed to have a condition such as diabetes, or worsening of the disease, during a specific time period. |
Trends and Factors Affecting Our Future Performance
A number of factors influence our growth and performance. We see many of these factors as being more quantitatively driven, such as the rate of growth of the underlying data counts within our datasets, the ongoing investment in innovation, and our level of analytical activity. Additionally, there are several factors that influence our growth and performance that are less quantitatively driven, including seasonality, macro-economic forces, and trends within healthcare (such as payment models, incentivization, and regulatory oversight), that can be driven by changes in federal and state laws and regulations, as well as private sector market forces.
Growth of Datasets. Healthcare costs in the United States have been increasing significantly for many years. This rise in healthcare costs has driven a broad transition from consumption-based payment models to quality and value-based payment models across the healthcare landscape. As a result, the specific disease and comorbidity status, clinical and quality outcomes, resource utilization, and care details of the individual patient have become increasingly relevant to the various constituents across the healthcare delivery system. Concurrently, the count and complexity of diseases, diagnostics, and treatments—as well as payment models and regulatory oversight requirements—have soared. In this setting, granular data has become critical to determining and improving quality and financial performance in healthcare. Our MORE2 Registry® is our largest principal dataset and serves as a proxy for our general growth of datasets within Inovalon. The growth of our datasets that inform our analytical capabilities and comparative analytics is a key aspect of our provision of value to our clients and is indicative of our overall growth and capabilities.
37
Innovation and Platform Development. Our business model is based upon our ability to deliver value to our clients through the combination of advanced, cloud-based data analytics and data-driven intervention platforms focused on the achievement of meaningful and measurable improvements in clinical quality outcomes and financial performance in healthcare. Our ability to deliver this value is dependent in part on our ability to continue to innovate, design new capabilities, enter into new agreements with clients for new platforms, and bring these capabilities to market in an enterprise scale. Our continued ability to innovate our platform and bring differentiated capabilities to market is an important aspect of our business success. Our investment in innovation includes costs for research and development, capitalized software development, and capital expenditures related to hardware and software platforms on which our data analytics and data-driven interventions capabilities are deployed as summarized below (in thousands, except percentages).
Year Ended December 31, | |||||||||||
2017 | 2016 | 2015 | |||||||||
Investment in Innovation | |||||||||||
Research and development(1) | $ | 27,383 | $ | 29,148 | $ | 22,329 | |||||
Capitalized software development(2) | 34,789 | 21,994 | 20,199 | ||||||||
Research and development infrastructure investments(3) | 23,642 | 11,288 | 5,255 | ||||||||
Total investment in innovation | $ | 85,814 | $ | 62,430 | $ | 47,783 | |||||
As a percentage of revenue | |||||||||||
Research and development(1) | 6 | % | 7 | % | 5 | % | |||||
Capitalized software development(2) | 8 | % | 5 | % | 5 | % | |||||
Research and development infrastructure investments(3) | 5 | % | 3 | % | 1 | % | |||||
Total investment in innovation | 19 | % | 15 | % | 11 | % | |||||
_______________________________________
(1) | Research and development primarily includes employee costs related to the development and enhancement of our service offerings. |
(2) | Capitalized software development includes capitalized costs incurred to develop and enhance functionality for our data analytics and data-driven intervention platforms. |
(3) | Research and development infrastructure investments include strategic capital expenditures related to hardware and software platforms under development or enhancement. |
Data Analytics and Data-Driven Intervention Mix. Our business and operational models are highly scalable and leverage variable costs to support revenue generating activities. Our data analytic service costs are less variable in nature and require lower incremental capital expenditures. As a result, following initial development and deployment investments, our big data analytics platform and data technology capabilities allow us to process significant volumes of transactions with lower incremental costs. Conversely, our data-driven intervention costs are generally variable in nature and require incremental costs to generate additional revenue. As a result, the mix of our data analytics and data interventions activities affects our financial performance.
Client and Analytical Process Count Growth. Our business is generally driven by the number of underlying patients for which our analytics and data-driven intervention platforms are being utilized. As such, we track the number of analytical processes that we run on patients each month in fulfillment of our client contracts, as totaled for the trailing 12 months. We believe that PAM is indicative of our overall level of analytical activity, and we expect our period-to-period comparisons of our PAM to be indicative of underlying growth of our business, although changes in levels of analytical activity do not always directly translate to changes in financial performance of our business. Differences in fees charged for different analytical packages exist and differences in how analytics trigger the applicability of our data-driven intervention platforms may result in increases in analytical activity that do not result in proportional increases in revenue, or net income (and vice versa). Therefore, in situations in which a new engagement is initiated for analytical processes that have a higher than average fee rate, revenue could expand disproportionately faster than the increase in PAM. Likewise, if engagements for analytical processes that have a higher than average fee rate are concluded then such conclusions can negatively affect revenue disproportionately more than PAM.
Seasonality. The nature of our customers’ end-market results in partial seasonality reflected in both revenue and cost of revenue differences during the year. Regulatory impact of data submission deadlines in, for example, March, June, September, and January drive some degree of predictable timing of analytics and data processing activity variances from quarter to quarter. Further, regulatory clinical encounter deadlines of June 30th and December 31st drive predictable intervention concentrations variances from quarter to quarter. The timing of these factors results in analytical and intervention activity mix variances which have limited predictable impact in the aggregate on our financial performance from quarter to quarter. Finally, quarter to quarter
38
financial performance may increasingly vary from historical seasonal trends as we continue to expand into adjacent markets and increase the portion of our revenue generated from new offerings.
Regulatory, Economic and Industry Trends. Our clients are affected, sometimes directly, and sometimes counter-intuitively, by macro-economic trends such as economic growth (or economic recession), inflation, and unemployment. Further, industry trends in federal and state laws and regulations, as well as emerging trends in private sector payment models, affect our clients’ businesses and their need for technologies and services to support these challenges. These factors have various effects on our business, and on occasion have resulted in the slowing or cessation of the decision-making process by clients adopting our technologies and services. On the other hand, changes in macro-economic trends and the industry landscape have accelerated the need for our technologies and services from time-to-time, particularly as regulators introduce complex requirements with which our clients must comply.
Shift to Fully Automated Data-Driven Intervention Platform Services. We view the decreased proportion of revenue derived from partially automated data-driven intervention platform services as a positive reflection of our cloud-based interconnectivity and automation capabilities. The proportion of our revenue derived from pure data analytics and fully automated data-driven intervention platform services revenue is expected to continue to expand over time as a percentage of total revenue as a result of our continued expansion of our cloud-based interconnectivity technologies and the continued expansion of interconnectivity within the healthcare landscape. In order to drive value for our clients and serve them irrespective of their level of connectivity, we continue to provide cloud-based partially automated data-driven intervention platform services, converting the performance of such services to cloud-based fully automated data-driven intervention platform services wherever possible. As the healthcare infrastructure becomes more interconnected and our integration and interconnectivity technologies continue to expand, we believe that we will be able to achieve more rapid implementation, and greater value impact, at more efficient costs.
Components of Results of Operations
Revenue
We earn revenue primarily through the sale or subscription licensing of our cloud-based data analytics, data-driven intervention platform services, our advisory services and business intelligence solutions.
Our cloud-based data analytics services are performed either at the beginning of a data-driven intervention process, which typically aligns with regulatory submission deadlines, or on a monthly basis, depending on the particular client’s needs. Cloud-based data analytics revenue is driven primarily by the number of unique patients in a client’s dataset, a minimum data analytics processing fee, the number of identified gaps in care, quality, data integrity, and financial performance identified in a client’s dataset, and a contractually negotiated transactional price for each identified gap or unique patient. Subscription licensing revenue is driven primarily by the number of clients, the number of unique patients in a client’s population dataset, the number of analytical services contracted for by a client, and the contractually negotiated price of such services.
Cloud-based data-driven intervention platform service revenue represents revenue that is generated from fully automated processes (i.e., those processes that require no material variable-based labor components) and partially automated processes (i.e., those processes that require a degree of variable-based labor components). As many of our analytical capabilities are designed to identify gaps in care, quality, utilization, compliance, and/or other gaps that may impact our clients’ achievement of greater healthcare quality and financial performance, our cloud-based data driven intervention platform services revenue is driven primarily by the results of our cloud-based data analytics processes and our clients’ desire to utilize our cloud-based data-driven intervention platforms to resolve such identified gaps. Informed by our analytics, our cloud-based data-driven intervention platforms are designed to enable the resolution of specific gaps through the aggregation of specific data or achievement of specific impact. Revenue from our intervention platform utilization is generally driven by the quantity and type of completed interventions enabled by our platform, and a contractually negotiated transactional price for each such intervention.
Advisory service and business intelligence solutions revenue represents revenue that is generated from strategic advisory, analysis and educational services. Revenue from our advisory services arrangements is generally provided under time and materials, fixed-price, or retainer-based contracts, based on contractually negotiated prices for each such arrangement.
Cost of Revenue
Cost of revenue consists primarily of expenses for employees who provide direct contractual services to our clients, including salaries, benefits, discretionary incentive compensation, employment taxes, severance, and equity compensation costs. Cost of revenue also includes expenses associated with the integration, and verification of data and other service costs incurred to fulfill our revenue contracts. Cost of revenue does not include allocated amounts for occupancy expense and depreciation and amortization. Many of the elements of our cost of revenue are relatively variable and semi-variable, and can be reduced in the near-term to help offset any decline in our revenue.
39
Our business and operational models are designed to be highly scalable and leverage variable costs to support revenue generating activities. While we may grow our headcount over time to capitalize on our market opportunities, we believe our increased investment in automation, electronic health record integration capabilities, and economies of scale in our operating model, will position us to grow our cloud-based data analytics and cloud-based data-driven intervention platform services revenue at a greater rate than our cost of revenue, over time, excluding the impact of stock-based compensation expense.
Sales and Marketing
Sales and marketing expense consists primarily of employee-related expenses, including salaries, benefits, commissions, discretionary incentive compensation, employment taxes, severance, and equity compensation costs for our employees engaged in sales, sales support, business development, and marketing. Sales and marketing expense also includes operating expenses for marketing programs, research, trade shows and brand messages, and public relations costs. Our sales and marketing expense excludes any allocation of occupancy expense and depreciation and amortization.
We expect our sales and marketing expenses to continue to increase in absolute dollar terms as we strategically invest to expand our business. Over the long term, we believe that sales and marketing expenses as a percentage of total revenues will decrease.
Research and Development
Research and development expense (one component of our investment in innovation) consists primarily of employee-related expenses, including salaries, benefits, discretionary incentive compensation, employment taxes, severance, and equity compensation costs for our software developers, engineers, analysts, project managers, and other employees engaged in the development and enhancement of our service offerings. Research and development expense also includes certain third party consulting fees. Our research and development expense excludes any allocation of occupancy expense and depreciation and amortization.
We expect to continue our focus on developing new product offerings and enhancing our existing product offerings. As a result, we expect our research and development expense to increase in absolute dollars, although it may vary from period to period as a percentage of revenue.
General and Administrative
Our general and administrative expense consists primarily of employee-related expenses including salaries, benefits, discretionary incentive compensation, employment taxes, severance, and equity compensation costs, for employees who are responsible for management information systems, administration, human resources, finance, legal, and executive management. General and administrative expense also includes occupancy expenses (including rent, utilities, communications, and facilities maintenance), professional fees, consulting fees, insurance, travel, and other expenses. Our general and administrative expense excludes depreciation and amortization.
We expect our general and administrative expense to decrease on an organic basis in absolute dollars and as a percentage of revenue driven by cost savings from technology-enabled and employee-related efficiencies.
Depreciation and Amortization Expense
Our depreciation and amortization expense consists primarily of depreciation of fixed assets, amortization of capitalized software development costs, and amortization of acquisition-related intangible assets.
We expect our depreciation and amortization expense to increase as we expand our business organically and through acquisitions.
Realized Gains (Losses) on Short-term Investments
Realized gains and losses on short-term investments consist of gains and losses realized upon the sale of certain of the Company’s available-for-sale securities, prior to their maturity. The gains and losses were incurred as the value of the available-for-sale securities declined from the date of purchase to the date of sale.
We expect to incur realized gains or losses to the extent the available-for-sale securities are sold prior to their maturity. From time to time we may sell our available-for-sale securities prior to their maturity to generate cash needed to fund strategic initiatives including acquisitions.
(Loss) Gain on Disposal of Equipment
Gain on disposal of equipment consists of proceeds received for the disposition of equipment that were greater than the equipment’s depreciated book value.
40
We expect to recognize gains or on disposal of equipment to the extent that proceeds received upon disposal are greater than the carrying value of the underlying equipment, otherwise loss on disposal of equipment could be incurred.
Interest Income
Interest income represents interest earned net of amortization of premium for purchased interest from our available-for-sale short-term investments.
We expect our interest income to fluctuate in proportion to the amount of funds we invest, according to our corporate investment policy, in available-for-sale short-term investments and considering prevailing available interest rate yields on such investment grade debt securities.
Interest Expense
Interest expense represents interest incurred on our Credit Facilities (as defined below, under the heading “Liquidity and Capital Resources—Debt”).
We expect our interest expense to fluctuate in proportion to the outstanding principal balance of the Credit Facilities and the prevailing London Interbank Offer Rate (“LIBOR”) interest rate.
Provision for Income Taxes
Provision for income taxes consists of federal and state income taxes in the United States and foreign income taxes from the territory of Puerto Rico, including deferred income taxes reflecting the net tax effects of temporary differences between the carrying amounts of assets and liabilities for financial reporting purposes and the amounts used for income tax purposes, and excess tax benefits or deficiencies derived from exercises of stock options and vesting of restricted stock.
We expect that our effective tax rate will decrease due to the Tax Act and in the future may fluctuate due to the recognition of excess tax benefits and tax deficiencies associated with stock-based compensation transactions which are considered to be discrete items. Excluding discrete items impacting the effective tax rate, we expect our long-term tax rate to reflect the applicable statutory rates. Refer to Note 14, “Income Taxes,” of the notes to our audited consolidated financial statements, included elsewhere in this Annual Report on Form 10-K.
41
Results of Operations
The following tables set forth our consolidated statement of operations data for each of the periods presented (in thousands, except percentages):
Year Ended December 31, | 2017 to 2016 Change | 2016 to 2015 Change | |||||||||||||||||||||||
2017 | 2016 | 2015 | $ | % | $ | % | |||||||||||||||||||
Revenue | $ | 449,358 | $ | 427,588 | $ | 437,271 | $ | 21,770 | 5 | % | $ | (9,683 | ) | (2 | )% | ||||||||||
Expenses: | |||||||||||||||||||||||||
Cost of revenue(1) | 151,046 | 159,169 | 146,140 | (8,123 | ) | (5 | )% | 13,029 | 9 | % | |||||||||||||||
Sales and marketing(1) | 34,103 | 27,078 | 14,684 | 7,025 | 26 | % | 12,394 | 84 | % | ||||||||||||||||
Research and development(1) | 27,383 | 29,148 | 22,329 | (1,765 | ) | (6 | )% | 6,819 | 31 | % | |||||||||||||||
General and administrative(1) | 149,948 | 137,275 | 115,029 | 12,673 | 9 | % | 22,246 | 19 | % | ||||||||||||||||
Depreciation and amortization | 53,089 | 37,284 | 22,633 | 15,805 | 42 | % | 14,651 | 65 | % | ||||||||||||||||
Total operating expenses | 415,569 | 389,954 | 320,815 | 25,615 | 7 | % | 69,139 | 22 | % | ||||||||||||||||
Income from operations | 33,789 | 37,634 | 116,456 | (3,845 | ) | (10 | )% | (78,822 | ) | (68 | )% | ||||||||||||||
Other income and (expenses) | |||||||||||||||||||||||||
Realized gains (losses) on short-term investments | — | 4 | (328 | ) | (4 | ) | *% | 332 | *% | ||||||||||||||||
(Loss) Gain on disposal of equipment | (406 | ) | 534 | — | (940 | ) | *% | 534 | *% | ||||||||||||||||
Interest income | 5,429 | 5,792 | 3,003 | (363 | ) | (6 | )% | 2,789 | 93 | % | |||||||||||||||
Interest expense | (6,225 | ) | (5,065 | ) | (4,420 | ) | (1,160 | ) | 23 | % | (645 | ) | 15 | % | |||||||||||
Income before taxes | 32,587 | 38,899 | 114,711 | (6,312 | ) | (16 | )% | (75,812 | ) | (66 | )% | ||||||||||||||
(Benefit from) Provision for income taxes | (2,231 | ) | 11,795 | 48,648 | (14,026 | ) | (119 | )% | (36,853 | ) | (76 | )% | |||||||||||||
Net income | $ | 34,818 | $ | 27,104 | $ | 66,063 | $ | 7,714 | 28 | % | $ | (38,601 | ) | (58 | )% | ||||||||||
_______________________________________
(1) Includes stock-based compensation expense as follows: | |||||||||||||||||||||||||
Cost of revenue | $ | 1,652 | $ | 483 | $ | 164 | $ | 1,169 | 242 | % | $ | 319 | 195 | % | |||||||||||
Sales and marketing | 2,011 | 613 | 173 | 1,398 | 228 | % | 440 | 254 | % | ||||||||||||||||
Research and development | 1,293 | 1,184 | 1,212 | 109 | 9 | % | (28 | ) | (2 | )% | |||||||||||||||
General and administrative | 12,362 | 7,774 | 5,866 | 4,588 | 59 | % | 1,908 | 33 | % | ||||||||||||||||
Total stock-based compensation expense | $ | 17,318 | $ | 10,054 | $ | 7,415 | $ | 7,264 | 72 | % | $ | 2,639 | 36 | % | |||||||||||
* Asterisk denotes not meaningful
42
The following table sets forth our consolidated statement of operations data for each of the periods presented as a percentage of revenue:
Year Ended December 31, | ||||||||
2017 | 2016 | 2015 | ||||||
Revenue | 100 | % | 100 | % | 100 | % | ||
Expenses: | ||||||||
Cost of revenue | 34 | % | 37 | % | 33 | % | ||
Sales and marketing | 8 | % | 6 | % | 3 | % | ||
Research and development | 6 | % | 7 | % | 5 | % | ||
General and administrative | 33 | % | 32 | % | 26 | % | ||
Depreciation and amortization | 12 | % | 9 | % | 5 | % | ||
Total operating expenses | 93 | % | 91 | % | 73 | % | ||
Income from operations | 7 | % | 9 | % | 27 | % | ||
Other income and (expenses): | ||||||||
Realized gains (losses) on short-term investments | — | % | *% | *% | ||||
(Loss) Gain on disposal of equipment | *% | *% | — | % | ||||
Interest income | 1 | % | 1 | % | *% | |||
Interest expense | (1 | )% | (1 | )% | (1 | )% | ||
Income before taxes | 7 | % | 9 | % | 26 | % | ||
(Benefit from) Provision for income taxes | (1 | )% | 3 | % | 11 | % | ||
Net income | 8 | % | 6 | % | 15 | % | ||
Years Ended December 31, 2017, 2016, and 2015
Revenue
2017 Compared with 2016. In 2017, Inovalon continued to execute on its transition from legacy enterprise solutions to subscription-based cloud-based platform offerings, with this portion of revenue contribution accounting for $295.3 million (or 66% of revenue), reflecting growth of 30% over 2016. Revenue for the year ended December 31, 2017 was approximately $449.4 million, an increase of 5% compared with revenue of approximately $427.6 million for the year ended December 31, 2016. This increase was primarily attributable to approximately $35.3 million in revenue within the acquired businesses of Creehan and CCS, through the anniversary date of the acquisition, and approximately $14.5 million in revenue contributed from new clients signed, which was partially offset by a decrease of approximately $28.0 million in revenue from existing clients resulting from a combination of factors including the transition of client contracts to newer product offerings and more subscription-based agreements versus the year-ago period, and the conclusion of client contracts included in the year-ago period.
2016 Compared with 2015. Revenue for the year ended December 31, 2016 was approximately $427.6 million, a decrease of 2% compared with revenue of approximately $437.3 million for the year ended December 31, 2015. This decrease was primarily attributable to a net decrease of approximately $75.0 million in revenue from existing clients, partially offset by approximately $44.5 million in revenue within the acquired businesses of Avalere and Creehan, through the anniversary date of the acquisition, and an increase in revenue from new clients signed of approximately $20.8 million. The change in revenue from new and existing clients resulted from a combination of factors including a product transition, sales and marketing capacity, and the business performance of certain ACA-focused clients (including Co-Ops).
Cost of Revenue
2017 Compared with 2016. During the year ended December 31, 2017, cost of revenue decreased by approximately $8.1 million, or 5%, compared with the year ended December 31, 2016. The decrease in cost of revenue was primarily attributable to a decrease of employee-related expenses of $30.6 million driven by technology-enabled platform efficiency initiatives, which was partially offset by the combined incremental cost of revenue of $17.5 million attributable to the acquired businesses of Creehan and CCS, an increase in fulfillment of $2.3 million, an increase in professional third-party costs of $1.6 million, and an increase in stock-based compensation expense of $1.2 million. Cost of revenue as a percentage of revenue was 34% and 37% for the years ended December 31, 2017 and 2016, respectively.
2016 Compared with 2015. During the year ended December 31, 2016, cost of revenue increased by approximately $13.0 million, or 9%, compared with the year ended December 31, 2015. Approximately $8.9 million of the increase was driven by the composition of a greater volume of data-driven intervention platform services as a percentage of revenue and
43
approximately $4.1 million was attributable to the acquisition of Creehan. Cost of revenue as a percentage of revenue was 37%, and 33%, for the years ended December 31, 2016 and 2015, respectively.
Sales and Marketing
2017 Compared with 2016. During the year ended December 31, 2017, sales and marketing expenses increased by approximately $7.0 million, or 26%, compared with the year ended December 31, 2016. The increase was primarily due to an increase in employee-related expenses of approximately $4.9 million, which were driven by our investment to expand our sales organization and partner team to focus on adding new clients and capturing an increased amount of market opportunity, and an increase in stock-based compensation expense of approximately $1.4 million. Sales and marketing as a percentage of revenue was 8% and 6% for the years ended December 31, 2017 and 2016, respectively.
2016 Compared with 2015. During the year ended December 31, 2016, sales and marketing expenses increased by approximately $12.4 million, or 84%, compared with the year ended December 31, 2015. Approximately $10.5 million of the increase was directly attributable to salaries and benefits for employees that was driven by our investment in new sales personnel to focus on adding new clients and capturing an increased amount of market opportunity.
Research and Development
2017 Compared with 2016. During the year ended December 31, 2017, research and development expense decreased by approximately $1.8 million, or 6%, compared with the year ended December 31, 2016. The decrease was primarily attributable to an increased focus of development on the Inovalon ONE™ Platform, resulting in an increase to capitalized software projects of approximately $6.8 million, which was partially offset by the incremental expense of approximately $4.4 million attributable to the acquired businesses of Creehan and CCS, through the anniversary date of the acquisition.
2016 Compared with 2015. During the year ended December 31, 2016, research and development expense increased by approximately $6.8 million, or 31%, compared with the year ended December 31, 2015. Approximately $6.3 million of the increase was attributable to growth in employee-related expenses necessary to support our on-going investment in innovation and platform development.
General and Administrative
2017 Compared with 2016. During the year ended December 31, 2017, general and administrative expenses increased by approximately $12.7 million, or 9%, compared with the year ended December 31, 2016. The increase was primarily attributable to incremental expenses of approximately $18.5 million attributable to the acquired businesses of Creehan and CCS, through the anniversary date of the acquisition, an increase in professional third-party costs of approximately $5.8 million, which includes a $3.1 million increase in legal expenses related to non-recurring litigation, and an increase of approximately $4.6 million related to stock-based compensation expense. The increase in general and administrative expense was partially offset by a decrease of employee-related expenses of $10.2 million, and a decrease of approximately $5.2 million related to the fair value adjustment of contingent consideration. General and administrative expenses as a percentage of revenue was 33% and 32% for the years ended December 31, 2017 and 2016, respectively.
2016 Compared with 2015. During the year ended December 31, 2016, general and administrative expenses increased by approximately $22.2 million, or 19%, compared with the year ended December 31, 2015. The increase was primarily attributable to our expansion, driven by the acquisitions of Avalere and Creehan, resulting in additional employee-related expenses of approximately $8.5 million, an increase in compensation expense related to compensatory contingent consideration that included earn-outs with continuing service requirements related to our acquisitions of approximately $7.4 million, increased growth-related infrastructure expenses of approximately $4.3 million, and an increase related to contingent consideration accretion of approximately $0.7 million.
Depreciation and Amortization
2017 Compared with 2016. During the year ended December 31, 2017, depreciation and amortization expense increased by approximately $15.8 million, or 42%, compared with the year ended December 31, 2016. The increase was primarily attributable to approximately $6.0 million of amortization of acquired intangible assets, $4.2 million of incremental amortization of capitalized software, and approximately $0.7 million of depreciation of other assets related to the acquired businesses of Creehan, through the anniversary date of the acquisition, and CCS.
2016 Compared with 2015. During the year ended December 31, 2016, depreciation and amortization expense increased by approximately $14.7 million, or 65%, compared with the year ended December 31, 2015. The increase is primarily attributable to approximately $7.3 million of incremental amortization of capitalized software, approximately $6.2 million of amortization of intangible assets related to the acquisitions of Avalere and Creehan, and approximately $0.8 million of depreciation of other assets acquired with Avalere and Creehan, as compared with the year ended December 31, 2015.
44
Realized Gains (Losses) on Short-Term Investments
Realized investment gains and losses are attributable to sales of certain of the Company’s available-for-sale short-term investments, prior to maturity. Funds generated from such sales of available-for-sale short term investments were used to fund strategic initiatives such as the share repurchase program in 2017 and 2016 and the Company’s acquisition of Avalere in 2015. Sales of the Company’s available-for-sale, short term investments may be required from time-to-time to fund similar strategic initiatives and such sales may result in realized gains or losses, depending on the value of the securities at the time of liquidation.
(Losses) Gains on Disposal of Equipment
During the year ended December 31, 2017, we incurred a loss of approximately $0.4 million related to the disposal of equipment. During the year ended December 31, 2016, we replaced certain data-center equipment. The replacement of the equipment was covered under our insurance and the cost of our replacement equipment was reimbursed by our insurance carrier. As a result, the disposal and replacement of the equipment resulted in a gain of $0.5 million.
Interest Income
2017 Compared with 2016. During the year ended December 31, 2017, interest income decreased by approximately $0.4 million, compared with the year ended December 31, 2016. A portion of our available-for-sale short-term investments have been used to fund strategic initiatives and the share repurchase program. The decrease in our interest income was primarily attributable to the decline in the overall value of our available-for-sale short term investment portfolios that resulted in a decrease in earnings derived from our available-for-sale short-term investments.
2016 Compared with 2015. During the year ended December 31, 2016, interest income increased by approximately $2.8 million, compared with the year ended December 31, 2015. Our interest income is primarily attributable to an increase in earnings derived from our available-for-sale short-term investments.
Interest Expense
During the year ended December 31, 2017, interest expense increased by approximately $1.2 million, compared with the year ended December 31, 2016. During the year ended December 31, 2016, interest expense increased by approximately $0.6 million, compared with the year ended December 31, 2015. These increases were attributable to interest expense on our Term Loan Facility (as defined below, under the heading “Debt”).
(Benefit from) Provision for Income Taxes
2017 Compared with 2016. During the year ended December 31, 2017, provision for income taxes decreased by approximately $14.0 million, or 119%, compared to the year ended December 31, 2016. Our effective tax rate for the year ended December 31, 2017 was approximately (7)%, resulting in a benefit from income tax, as compared to approximately 30% for the year ended December 31, 2016. The decrease in our provision for income taxes is primarily due to a tax benefit of approximately $15.5 million recognized as a result of the Tax Act which was signed into law on December 22, 2017 and is effective January 1, 2018. This tax benefit represents what we believe is a reasonable estimate of the impact of the income tax effects of the Tax Act in our consolidated statement of operations as of December 31, 2017 pending additional guidance.
2016 Compared with 2015. During the year ended December 31, 2016, provision for income taxes decreased by approximately $36.9 million, compared with the year ended December 31, 2015. Approximately $32.2 million of the decrease was due to the corresponding decline in income before taxes; approximately $2.6 million of the decrease was attributable to acquisition related deferred tax adjustments; approximately $1.1 million of the decrease was attributable to the realization of a tax deduction that arose under the payout of a contingent consideration, and approximately $0.9 million was attributable to excess tax benefits, derived from exercises of stock options and vesting of restricted stock, recognized in conjunction with our early adoption of the provisions of ASU 2016-09.
45
Quarterly Financial Information
The following tables show a summary of the Company’s quarterly financial information for each of the four quarters of 2017 and 2016 (in thousands, except per share amounts):
2017 | |||||||||||||||
Fourth Quarter | Third Quarter | Second Quarter | First Quarter | ||||||||||||
Revenue | $ | 114,619 | $ | 115,855 | $ | 110,578 | $ | 108,306 | |||||||
Gross profit | $ | 77,487 | $ | 77,424 | $ | 73,380 | $ | 70,021 | |||||||
Net income | $ | 17,449 | $ | 8,241 | $ | 5,486 | $ | 3,642 | |||||||
Net income attributable to common stockholders | $ | 16,864 | $ | 7,968 | $ | 5,338 | $ | 3,569 | |||||||
Basic net income per share(1) | $ | 0.12 | $ | 0.06 | $ | 0.04 | $ | 0.02 | |||||||
Diluted net income per share(1) | $ | 0.12 | $ | 0.06 | $ | 0.04 | $ | 0.02 | |||||||
2016 | |||||||||||||||
Fourth Quarter | Third Quarter | Second Quarter | First Quarter | ||||||||||||
Revenue | $ | 96,093 | $ | 105,013 | $ | 123,825 | $ | 102,657 | |||||||
Gross profit | $ | 57,494 | $ | 69,580 | $ | 80,611 | $ | 60,734 | |||||||
Net income | $ | 681 | $ | 7,807 | $ | 16,251 | $ | 2,365 | |||||||
Net income attributable to common stockholders | $ | 674 | $ | 7,771 | $ | 16,179 | $ | 2,356 | |||||||
Basic net income per share(1) | $ | — | $ | 0.05 | $ | 0.11 | $ | 0.02 | |||||||
Diluted net income per share(1) | $ | — | $ | 0.05 | $ | 0.11 | $ | 0.02 | |||||||
_______________________________________
(1) | Basic and diluted earnings per share are computed independently for each of the quarters presented. Therefore, the sum of quarterly basic and diluted per share information may not equal annual basic and diluted earnings per share. |
Liquidity and Capital Resources
The following table presents a summary of our cash flow activity for the periods set forth below (in thousands):
Year Ended December 31, | |||||||||||
2017 | 2016 | 2015 | |||||||||
Consolidated Statements of Cash Flows Data: | |||||||||||
Net income | $ | 34,818 | $ | 27,104 | $ | 66,063 | |||||
Net cash provided by operating activities | $ | 97,706 | $ | 92,830 | $ | 67,554 | |||||
Net cash provided by (used in) investing activities | $ | 106,559 | $ | 39,799 | $ | (768,320 | ) | ||||
Net cash (used in) provided by financing activities | $ | (123,004 | ) | $ | (118,980 | ) | $ | 652,233 | |||
Sources of Liquidity
Our principal sources of liquidity have been cash generated by operating activities, proceeds from our initial public offering and proceeds from our Credit Facilities. Our cash generated from such means has been sufficient to fund our growth, including our capital expenditures. As of December 31, 2017, our cash, cash equivalents and short-term investments totaled $476.2 million, of which $267.3 million represented short-term, available-for-sale, investment grade, domestic debt-securities, compared to $573.0 million of cash, cash equivalents, and short-term investments as of December 31, 2016, of which $445.3 million represented short-term, available-for-sale, investment grade, domestic debt-securities. All cash held by the Company is domiciled in the United States.
We believe our current cash, cash equivalents, and short-term investments balance, expected cash generated by operating activities and availability of cash under our Credit Facilities are sufficient to fund our operations, finance our strategic initiatives, and fund our investment in innovation and new service offerings, for the foreseeable future. There can be no assurance that we will continue to generate cash flows at or above current levels or that we will be able to maintain our ability to borrow under our Credit Facilities.
On February 18, 2015, we completed our IPO of 22,222,222 shares of Class A common stock and, upon the underwriters’ exercise of their option to purchase additional shares, issued an additional 3,142,581 shares of Class A common stock for a total of 25,364,803 shares issued. All of the shares issued in the IPO were primary shares offered by us as none of our stockholders
46
sold any shares in the IPO. The offering price of the shares sold in the IPO was $27.00 per share, resulting in net proceeds to us, after underwriters’ discounts and commissions and other expenses payable by us, of approximately $639.1 million.
On May 4, 2016, the Company announced that our Board of Directors authorized a program to repurchase up to $100 million of Inovalon’s Class A common stock through December 31, 2016. Repurchases under the Company’s share repurchase program have been made in open-market or privately negotiated transactions. We funded repurchases through a combination of cash on hand, cash generated by operations and sales of short-term investments, as needed. On November 2, 2016, we announced that our Board of Directors authorized an expansion of the share repurchase program to repurchase up to an additional $100 million of shares of Inovalon’s Class A Common Stock (bringing the total to $200 million) through December 31, 2017. The share repurchase program did not obligate us to acquire any particular amount of Class A common stock. During the year ended December 31, 2017, the Company repurchased 7,111,190 Class A common shares for $93.6 million, at an average cost of $13.16 per share, excluding commissions. The share repurchase program expired on December 31, 2017.
Debt
On September 19, 2014, we entered into a Credit and Guaranty Agreement with a group of lenders including Goldman Sachs Bank USA, as administrative agent (the “Credit Agreement”). The terms of the Credit Agreement provide for credit facilities in the aggregate maximum principal amount of $400.0 million, consisting of a senior unsecured term loan facility in the original principal amount of $300.0 million (the “Term Loan Facility”) and a senior unsecured revolving credit facility in the maximum principal amount of $100.0 million (the “Revolving Credit Facility” and, together with the Term Loan Facility, the “Credit Facilities”).
As of December 31, 2017, we had outstanding indebtedness under the Term Loan Facility and capital lease obligations of approximately $236.3 million and approximately $12.4 million, respectively. No amounts were outstanding under the Revolving Credit Facility as of December 31, 2017 or 2016. The obligations under the Credit Facilities are guaranteed by our domestic, wholly owned subsidiaries. The Credit Facilities contain customary affirmative and negative covenants, including limitations on negative pledges and liens. In addition, under the Credit Facilities we are required to maintain certain minimum liquidity levels, ($50.0 million while the Term Loan Facility remains available, or, if the Term Loan Facility has been repaid, $20.0 million), measured at the end of each our fiscal quarters. In addition, our ability to incur debt under the Credit Facilities is subject to compliance with a 4.00 to 1.00 leverage ratio under certain circumstances. The Credit Agreement also contains certain mandatory prepayment requirements in connection with certain asset sales and customary events of default, including as a result of certain specified change of control events. The Term Loan Facility has a five-year term and is an amortizing facility with quarterly principal payments and monthly interest payments. Scheduled principal payments totaling $30.0 million and scheduled interest payments totaling approximately $6.0 million were paid during the year ended December 31, 2017. The interest rate for the Term Loan Facility is LIBOR plus 1.25% per annum or the base rate plus 0.25% per annum (at our election). As of December 31, 2017, we were in compliance with the covenants under the Credit Agreement.
Cash Flows
Operating Cash Flow Activities
Cash provided by operating activities consisted of net income adjusted for certain non-cash items, including depreciation and amortization, stock-based compensation, and deferred income taxes, as well as the effect of changes in working capital and other activities.
2017 Compared with 2016. Cash provided by operating activities during the year ended December 31, 2017 was approximately $97.7 million, representing an increase in cash inflow of approximately $4.9 million compared with the year ended December 31, 2016. Cash provided by operating activities was driven by net income of approximately $34.8 million, as adjusted for the exclusion of non-cash expenses totaling approximately $59.5 million, and approximately $3.4 million related to the effect of changes in working capital and other balance sheet accounts.
2016 Compared with 2015. Cash provided by operating activities during the year ended December 31, 2016 was approximately $92.8 million, representing an increase in cash inflow of approximately $25.3 million compared with the year ended December 31, 2015. Cash provided by operating activities was driven by net income of approximately $27.1 million, as adjusted for the exclusion of non-cash expenses totaling approximately $48.4 million, and approximately $17.3 million related to the effect of changes in working capital and other balance sheet accounts.
Investing Cash Flow Activities
We make investments in innovation, including research and development expense, capital software development costs, and research and development infrastructure investments, on a recurring basis. We expect our investment in innovation to increase in the foreseeable future to support our continued growth and new service offerings.
47
2017 Compared with 2016. Cash provided by investing activities during the year ended December 31, 2017 was approximately $106.6 million compared with approximately $39.8 million during the year ended December 31, 2016. Cash provided by investing activities was primarily due to proceeds generated from maturities of available-for-sale securities of approximately $174.4 million, partially offset by approximately $65.5 million of investments in property and equipment and capitalized software.
2016 Compared with 2015. Cash provided by investing activities during the year ended December 31, 2016 was approximately $39.8 million compared with cash used in investing activities of approximately $768.3 million during the year ended December 31, 2015. The cash provided by investing activities was primarily due to proceeds generated from approximately $167.3 million of sales and maturities of available-for-sale securities, net of purchases. The cash provided by investing activities was partially offset by approximately $88.5 million of our investment in Creehan, (net of cash acquired of approximately $0.9 million), and $39.0 million of our investments in property and equipment and capitalized software.
Financing Cash Flow Activities
2017 Compared with 2016. Cash used in financing activities during the year ended December 31, 2017 was approximately $123.0 million, compared with approximately $119.0 million during the year ended December 31, 2016. The cash used in financing activities during the year ended December 31, 2017 was primarily due to approximately $93.6 million related to share repurchases and approximately $30.0 million for the repayment of Credit Facility borrowings.
2016 Compared with 2015. Cash used in financing activities during the year ended December 31, 2016 was approximately $119.0 million, compared with cash provided by financing activities of approximately $652.2 million during the year ended December 31, 2015. The cash used in financing activities during the year ended December 31, 2016 was primarily comprised of approximately $106.2 million related to share repurchases, approximately $15.0 million for the repayment of Credit Facility borrowings, $2.3 million related to the payment of contingent consideration for an earn-out achieved by Avalere, approximately $1.5 million of tax payments related to equity award vesting events, and was offset by approximately $6.2 million of proceeds received from the exercise of stock options.
Off Balance Sheet Arrangements
We do not have any off-balance sheet arrangements and did not have any such arrangements during the years ended December 31, 2017, 2016, and 2015.
Contractual Obligations
Our principal commitments consist of obligations under our Term Loan Facility, purchase obligations, our operating leases for equipment, office space, and co-located data center facilities and our capital leases for office space. See Note 9, “Credit Facilities,” and Note 10, “Commitment and Contingencies,” of the notes to our audited consolidated financial statements included elsewhere in this Annual Report on Form 10-K. The following table summarizes our future payments in cash, excluding the effects of time value, on contractual obligations by period as of December 31, 2017 (in thousands).
Payments Due by Period | |||||||||||||||||||
Total | Less than 1 year | 1 - 3 years | 3 - 5 years | More than 5 years | |||||||||||||||
Credit facilities | $ | 236,250 | $ | 45,000 | $ | 191,250 | $ | — | $ | — | |||||||||
Purchase obligation | 2,685 | 688 | 1,376 | 621 | — | ||||||||||||||
Capital lease obligations | 12,445 | 448 | 1,955 | 2,031 | 8,011 | ||||||||||||||
Operating lease obligations | 33,537 | 7,286 | 9,771 | 3,878 | 12,602 | ||||||||||||||
Total | $ | 284,917 | $ | 53,422 | $ | 204,352 | $ | 6,530 | $ | 20,613 | |||||||||
We have cash interest requirements due on the Credit Facilities, payable at variable rates, that are not included in the table above.
Our existing operating lease agreements may provide us with the option to renew. Our future operating lease obligations would change if we entered into additional operating lease agreements and if we exercised renewal options.
Contractual obligations represent future cash commitments and liabilities under agreements with third parties, and exclude purchase orders for goods and services. Purchase orders are not included in the table above. Our purchase orders represent authorizations to purchase rather than legally binding agreements. The contractual commitment amounts in the table above are associated with agreements that are legally binding and enforceable, and that specify all significant terms, including fixed or minimum services to be used, fixed, minimum or variable price provisions and the approximate timing of the transaction.
48
Critical Accounting Policies and Estimates
We prepare our consolidated financial statements in accordance with GAAP. The preparation of these consolidated financial statements requires us to make estimates and assumptions that affect our reported amounts of assets, liabilities, revenue and expenses, as well as related disclosures. To the extent that there are material differences between these estimates and actual results, our financial condition or operating results would be affected. We base our estimates on past experience and other assumptions that we believe are reasonable under the circumstances, and we evaluate these estimates on an ongoing basis. We refer to accounting estimates of this type as critical accounting policies and estimates, which we discuss further below.
Our significant accounting policies are described in Note 2, “Summary of Significant Accounting Policies,” of the notes to our audited consolidated financial statements, included elsewhere in this Annual Report on Form 10-K. The following are the accounting policies that we believe involve a greater degree of judgment and complexity and are the most critical to aid in fully understanding and evaluating our consolidated financial condition and results of operations.
Revenue Recognition
We recognize revenue when it is realized (or realizable) and earned (i.e., when services have been rendered or delivery of applicable deliverables has occurred). This occurs when persuasive evidence of an arrangement exists, the product or service has been performed or delivered, fees are fixed or determinable, and collection is reasonably assured. When collectability is not reasonably assured, revenue is recognized when cash is collected. Cash collections and invoices generated in excess of revenue recognized are recorded as deferred revenue until the revenue recognition criteria are met.
We have primarily derived our revenue from sales of our data analytics and data-driven intervention platform services. We allocate revenue to our data-driven analytics and data-driven intervention platform services using the relative selling price method. We have generally been unable to establish vendor-specific objective evidence of fair value and, while we continually seek third-party evidence of fair value, meaningful data have generally been unavailable as our services are unique and visibility into our competitors’ pricing is unavailable. As a result, we use our best estimate of selling price to allocate arrangement consideration to its contractual service elements.
We have determined an estimated selling price by considering several external and internal factors, including, but not limited to pricing practices, profitability objectives, competition, customer demand, internal costs, and overall economic trends. Generally, the best estimate of selling price is consistent with the contractual arrangement fee for each element.
Revenue is recognized as cloud-based data analytics and data-driven intervention services are performed and information is delivered to clients, which generally align with our right to invoice our clients. Cloud-based data analytics services are considered performed when gaps in care, quality, data integrity, or financial performance, and summarized key analytics and benchmarking analytics reports are delivered to its clients, provided that all contractual performance requirements and other revenue recognition criteria are met. Cloud-based data-driven intervention services are considered performed upon completion, provided that all contractual performance requirements and other revenue recognition criteria are met.
We also generate revenue from data-driven advisory services and recognize revenue for these services when persuasive evidence of an arrangement exists, services have been rendered, the contract price is fixed or determinable, and collectability is reasonably assured. We enter into arrangements for data-driven advisory services under time and materials, fixed-price, or retainer based contracts. Revenue for time and material contracts is recognized based upon contractually agreed upon billing rates applied to direct labor hours expended plus the costs of other items used in the performance of the contract. Revenues under fixed-price and retainer-based contracts are recognized ratably over the contract period or upon contract completion. Invoices to clients are generated in accordance with the terms of the applicable contract, which may not be directly related to the performance of services. Unbilled receivables are invoiced when the achievement of specific events as defined by each contract occurs. Unbilled receivables, if any, are classified as a current asset. Advanced billings to clients in excess of revenue earned are recorded as deferred revenue until the aforementioned revenue recognition criteria are met.
We also enter into multiple-element software arrangements, which are recognized under ASC 985-605, Software Revenue Recognition, when a software subscription license is provided to customers. Under these arrangements, we provide post-contract support, including help desk support and unspecified upgrades. Vendor-specific objective evidence of fair value has not been established for maintenance as maintenance is not renewed separately from the license fees. As a result, under these subscription software license agreements, we recognize revenue from the license of software ratably over the life of the agreement. We begin to recognize revenue upon execution of a signed agreement and delivery of the software, provided that the software license fees are fixed and determinable, and collection of the resulting receivable is reasonably assured.
Certain of our arrangements entitle a client to receive a refund if we fail to satisfy contractually specified performance obligations. The refund is limited to a portion or all of the consideration paid. In this case, revenue is recognized when any and all performance obligations are satisfied.
49
We maintain an allowance, charged to revenue, which reflects our estimated future billing adjustments resulting from client concessions or resolutions of billing disputes. We believe that our approach and judgments applied to estimating our allowance is reasonable, actual results could differ, and we may be exposed to increases or decreases in revenue to the extent that actual results differ from our estimates.
Stock-Based Compensation
Stock-based awards, including employee stock options, Restricted Stock Unit (“RSU”) and Restricted Stock Award (“RSA”) grants, including RSAs with performance conditions, are measured and recognized in the financial statements at fair value as of the grant date in accordance with ASC 718, Compensation—Stock Compensation. RSUs are share awards that, upon vesting, will deliver to the holder shares of the Company’s common stock. RSAs are shares of the Company’s common stock that are reserved in the grantee’s name upon grant which will be delivered to the holder upon vesting.
We estimate the fair value of each RSU and RSA based on the fair market values of the underlying common stock on the dates of grant. Additionally, our performance-based RSAs have vesting conditions tied to the achievement of specified performance conditions, which have target performance levels that span from three to five years. Upon the conclusion of the performance period, the performance level achieved will be measured and the ultimate number of shares that vest will be determined.
We recognize stock-based compensation expense using the straight-line basis over the requisite service period of the applicable award, which is generally three to five years. Stock-based compensation expense for RSAs with performance conditions is recorded ratably over their vesting period, depending on the specific terms of the award and achievement of the specified performance conditions. We record adjustments related to forfeitures as they occur.
Income Taxes
We account for income taxes using the asset and liability approach, which requires the recognition of deferred tax assets and liabilities related to the expected future tax consequences of events that have been recognized between financial reporting and income tax reporting. We measure deferred tax assets and liabilities using enacted tax rates expected to apply to taxable income in the years in which those temporary differences are expected to be recovered or settled.
We make estimates, assumptions and judgments to determine our provision for income taxes and also for deferred tax assets and liabilities and any valuation allowances recorded against our deferred tax assets. We assess the likelihood that our deferred tax assets will be recovered from future taxable income and, to the extent we believe that recovery is not likely, we establish a valuation allowance.
We account for uncertain tax positions in accordance with ASC 740-10, Accounting for Uncertainty in Income Taxes, that prescribes a recognition threshold of more-likely-than-not, and a measurement attribute for all tax positions taken or expected to be taken on a tax return, in order for those positions to be recognized in the financial statements. We continually review tax laws, regulations and related guidance in order to properly record any uncertain tax liability positions. We adjust these reserves in light of changing facts and circumstances.
As a result of the Tax Act, we revalued our ending net deferred tax liabilities at December 31, 2017 and recognized a $15.5 million tax benefit in the Company’s consolidated statement of operations for the year ended December 31, 2017 pending additional guidance. Refer to Note 14, “Income Taxes,” of the notes to our audited consolidated financial statements, included elsewhere in this Annual Report on Form 10-K.
We adopted ASU 2016-09 in the fourth quarter of 2016, which resulted in the modification of income tax consequences for several aspects of stock-based payment awards. Excess tax benefits and tax deficiencies for stock-based payments are now included in our tax provision expense rather than additional-paid-in-capital. Variability of tax consequences arising from excess tax benefits and tax deficiencies may result due to fluctuations in our stock price and the volume of our employees’ equity awards that are exercised or vest.
Goodwill
Goodwill represents the excess of acquisition costs over the fair value of tangible net assets and identifiable intangible assets of businesses acquired. Goodwill is not amortized and is subject to impairment testing annually, or whenever events or changes in circumstances indicate that the carrying amount may not be fully recoverable.
In January 2017, the FASB issued ASU 2017-04, Intangibles—Goodwill and Other (Topic 350): Simplifying the Test for Goodwill Impairment. The new standard simplifies the subsequent measurement of goodwill by eliminating the second step of the goodwill impairment test. This ASU will be applied prospectively and is effective for annual or interim goodwill impairment tests in fiscal years beginning after December 15, 2019. Early adoption is permitted for interim or annual goodwill impairment tests performed on testing dates after January 1, 2017. The Company early adopted the requirements of the new standard in the fourth quarter of 2017. As a result, the amendments modify the concept of impairment from the condition that
50
exists when the carrying amount of goodwill exceeds its implied fair value to the condition that exists when the carrying amount of a reporting unit exceeds its fair value. If the fair value of the reporting unit exceeds the carrying value of the reporting unit, goodwill is not impaired. If the carrying value of the reporting unit exceeds the fair value of the reporting unit, then the Company will record an impairment loss in the amount equal to the difference between the fair value and the carrying value.
The Company performs the goodwill impairment testing annually as of December 31st, or whenever events or changes in circumstances indicate that the carrying amount may not be fully recoverable. Significant judgment in testing goodwill for impairment includes assigning assets and liabilities to the reporting unit and assessing or determining the fair value of each reporting unit based on the Company’s best estimates and assumptions, as well as other information including valuations that utilize customary valuation procedures and techniques. The Company tests its goodwill for impairment at the reporting unit level which is one level below the operating segment and has identified three reporting units: Inovalon, Avalere and Creehan.
During 2017, the Company performed a qualitative assessment for the Inovalon reporting unit and concluded that it was not impaired. Qualitative factors that were considered include, but were not limited to, macroeconomic conditions, industry and market conditions, company specific events, changes in circumstances, after tax cash flows and market capitalization.
The Company elected to bypass the qualitative assessment and performed a quantitative assessment for its Avalere and Creehan reporting units and concluded that these reporting units were not impaired. The Company employed a combined valuation approach that included the income approach using the discounted cash flow method, the market approach using the guideline public company method and the merger and acquisition method to value the reporting units. Critical estimates in determining the fair value of the reporting units include, but are not limited to, historical and projected customer retention rates, anticipated growth in revenue and earnings, and expected future cash outflows. Based on the Company’s annual impairment evaluation performed as of December 31, 2017, the Company concluded that there was no impairment of goodwill.
During 2016, the Company performed a qualitative assessment for the Inovalon and Creehan reporting units and concluded that they were not impaired. Qualitative factors that were considered include, but were not limited to, macroeconomic conditions, industry and market conditions, company specific events, changes in circumstances, after tax cash flows and market capitalization.
The Company performed the first step of the goodwill impairment test for the Avalere reporting and concluded that it was not impaired. The Company employed a combined valuation approach that included the income approach using the discounted cash flow method, the market approach using the guideline public company method and the merger and acquisition method to value the reporting units. Critical estimates in determining the fair value of the reporting units include, but are not limited to, historical and projected customer retention rates, anticipated growth in revenue and earnings, and expected future cash outflows. Based on the Company’s annual impairment evaluation performed as of December 31, 2016, the Company concluded that there was no impairment of goodwill.
Business Combinations
Business combinations, which may include purchased intangible assets, are accounted for at fair value. Acquisition costs are expensed as incurred and recorded in general and administrative expenses. Measurement period adjustments relate to information that we should have known at the time of acquisition; these adjustments and any other changes to purchase accounting are included in earnings in the current period. The fair value amount assigned to intangible assets is based on an exit price from a market participant’s viewpoint, and utilizes data such as discounted cash flow analysis and replacement cost models. We review acquired intangible assets for impairment whenever events or changes in circumstances indicate that the carrying amount of such assets may not be recoverable. Indefinite-lived intangible assets are reviewed for recoverability at least annually, or more frequently if indicators of impairment are present or changes in circumstances suggest that impairment may exist. Management’s best estimates and assumptions are employed in determining the appropriateness of the assumptions used to derive acquisition date fair value. Future business and economic conditions, as well as differences actually related to any of the assumptions, could materially impact the financial statements through impairment of goodwill or intangible assets, and acceleration of the amortization period of the purchased intangible assets, which are finite-lived assets.
Recently Issued Accounting Standards
Recently issued accounting standards and their expected impact, if any, are discussed in Note 2, “Summary of Significant Accounting Policies,” of the notes to our consolidated financial statements, included elsewhere within this Annual Report on Form 10-K.
51
Item 7A. Quantitative and Qualitative Disclosures About Market Risk.
Market risk includes risks that arise from changes in interest rates, equity prices and other market changes that affect market sensitive instruments. Our primary market risk exposure is related to changes in interest rates on our variable rate debt and marketable securities.
Variable Rate Debt Risk. Our variable rate debt includes our Term Loan Facility and our Revolving Credit Facility. As of December 31, 2017, we had $236.3 million outstanding under our Term Loan Facility at an effective interest rate of 2.6%. As a result, if market interest rates were to increase by 1.0%, or 100 basis points, interest expense would decrease future earnings and cash flows, net of estimated tax benefits, by approximately $1.3 million annually, assuming that we do not enter into contractual hedging arrangements. As of December 31, 2017, there was no balance outstanding on the Revolving Credit Facility.
Marketable Securities Risk. We had short-term investment portfolios, including cash held in money market funds, totaling approximately $429.6 million as of December 31, 2017. This amount was invested primarily in marketable securities including corporate notes and bonds, U.S. agency obligations, U.S. treasury securities and money market funds. Our investments are made for capital preservation purposes. We do not enter into investments for trading or speculative purposes.
Our short-term investments are subject to market risk due to changes in interest rates, which could affect our results of operations. A rise in interest rates may adversely affect the market value of fixed rate securities, while floating rate securities may produce less income than expected if interest rates fall. Due in part to these factors, our future investment income may fluctuate due to changes in interest rates or we may suffer losses in principal if we are forced to sell securities that decline in market value due to changes in interest rates. However because we classify our marketable securities as “available-for-sale,” no gains or losses are recognized due to changes in interest rates unless such securities are sold prior to maturity or declines in fair value are determined to be other-than-temporary.
An immediate increase of 100-basis points in interest rates would have decreased the market value of our investment portfolio by approximately $0.8 million as of December 31, 2017. An immediate decrease of 100-basis points in interest rates would have increased the market value of our investment portfolio by approximately $2.5 million as of December 31, 2017. This estimate is based on a sensitivity model that measures market value changes when changes in interest rates occur. Fluctuations in the value of our investment securities caused by a change in interest rates (gains or losses on the carrying value) are recorded in accumulated other comprehensive income (loss), and are realized only if we sell the underlying securities prior to their maturity.
Item 8. Financial Statements and Supplementary Data.
Our consolidated financial statements and supplementary data are included as a separate section of this Annual Report on Form 10-K commencing on page F-1 and are incorporated herein by reference.
The supplementary financial information required by this Item 8 is included in Item 7 under the caption “Quarterly Financial Information,” which is incorporated herein by reference.
Item 9. Changes and Disagreements with Accountants on Accounting and Financial Disclosure.
None.
Item 9A. Controls and Procedures.
Disclosure Controls and Procedures
Our management, with the participation of our chief executive officer (“CEO”) and chief financial officer (“CFO”), has evaluated the effectiveness of our disclosure controls and procedures, (as defined in Rules 13a- 15(e) and 15d- 15(e) under the Exchange Act), as of the end of the period covered by this Annual Report on Form 10-K. Based on such evaluation, our CEO and CFO have concluded that, as of December 31, 2017, our disclosure controls and procedures were designed at a reasonable assurance level to ensure that material information relating to Inovalon Holdings, Inc., including its consolidated subsidiaries, is made known to our CEO and CFO by others within those entities, particularly during the period in which this report was being prepared and that our disclosure controls and procedures were effective in providing reasonable assurance that information we are required to disclose in reports that we file or submit under the Exchange Act is recorded, processed, summarized, and reported within the time periods specified in the rules and forms of the SEC, and that such information is accumulated and communicated to our management, including our CEO and CFO, as appropriate, to allow timely decisions regarding required disclosure.
52
Management’s Annual Report on Internal Control over Financial Reporting
Our management, with the participation of our CEO and CFO, is responsible for establishing and maintaining adequate internal control over financial reporting (as defined in Rule 13a-15(f) under the Exchange Act). Our management conducted an assessment of the effectiveness of our internal control over financial reporting based on the criteria established in “Internal Control—Integrated Framework” (2013) issued by the Committee of Sponsoring Organizations of the Treadway Commission (COSO). Based on that assessment, which excluded the integration of our acquisition of CCS, management has concluded that our internal control over financial reporting was effective as of December 31, 2017.
Our management, including our CEO and CFO, believes that our disclosure controls and procedures and internal control over financial reporting are designed to provide reasonable assurance of achieving their objectives and are effective at the reasonable assurance level. However, our management does not expect that our disclosure controls and procedures or our internal control over financial reporting will prevent all errors and all fraud. A control system, no matter how well conceived and operated, can provide only reasonable, not absolute, assurance that the objectives of the control system are met. Further, the design of a control system must reflect the fact that there are resource constraints, and the benefits of controls must be considered relative to their costs. Because of the inherent limitations in all control systems, no evaluation of controls can provide absolute assurance that all control issues and instances of fraud, if any, have been detected. These inherent limitations include the realities that judgments in decision-making can be faulty, and that breakdowns can occur because of a simple error or mistake. Additionally, controls can be circumvented by the individual acts of some persons, by collusion of two or more people or by management override of the controls. The design of any system of controls also is based in part upon certain assumptions about the likelihood of future events, and there can be no assurance that any design will succeed in achieving its stated goals under all potential future conditions; over time, controls may become inadequate because of changes in conditions, or the degree of compliance with policies or procedures may deteriorate. Because of the inherent limitations in a cost-effective control system, misstatements due to error or fraud may occur and not be detected.
The effectiveness of the Company’s internal control over financial reporting as of December 31, 2017, has been audited by Deloitte & Touche LLP, an independent registered public accounting firm, as stated in their report which appears in Part II, Item 8 of this Annual Report on Form 10-K.
Changes in Internal Control over Financial Reporting
There have been no changes in the Company’s internal control over financial reporting (as defined in Rules 13a-15(f) and 15d-15(f) of the Exchange Act) during the year ended December 31, 2017 that have materially affected, or are reasonably likely to materially affect, the Company’s internal control over financial reporting.
Item 9B. Other Information.
None.
53
PART III
Item 10. Directors, Executive Officers and Corporate Governance.
The information required by this Item 10 will be included in the 2018 Proxy Statement and is incorporated herein by reference.
Item 11. Executive Compensation.
The information required by this Item 11 will be included in the 2018 Proxy Statement and is incorporated herein by reference.
Item 12. Security Ownership of Certain Beneficial Owners and Management and Related Stockholder Matters.
The information required by this Item 12 will be included in the 2018 Proxy Statement and is incorporated herein by reference.
Item 13. Certain Relationships and Related Transactions and Director Independence.
The information required by this Item 13 will be included in the 2018 Proxy Statement and is incorporated herein by reference.
Item 14. Principal Accounting Fees and Services.
The information required by this Item 14 will be included in the 2018 Proxy Statement and is incorporated herein by reference.
54
PART IV
Item 15. Exhibits and Financial Statement Schedules.
The following is a list of documents filed as a part of this report:
(1) | Financial Statements |
(2) | Financial Statement Schedule |
(3) | Exhibits |
The exhibits required to be filed by Item 601 of Regulation S-K are listed in the Exhibit Index contained within this Annual Report on Form 10-K.
55
EXHIBIT INDEX
Exhibit Number | Description of Document | ||
3.1 | |||
3.2 | |||
10.1 | |||
10.2 | |||
10.3 | |||
10.4 | |||
10.5 | |||
10.6 | |||
10.7 | |||
10.8 | |||
10.9 | |||
10.10 | |||
10.11 | |||
10.12 | |||
10.13 | |||
10.14 | |||
10.15 | |||
10.16 | |||
10.17 | |||
56
Exhibit Number | Description of Document | ||
10.18 | |||
10.19 | |||
10.20 | |||
10.21 | |||
10.22* | |||
10.23* | |||
10.24* | |||
21.1* | |||
23.1* | |||
31.1* | |||
31.2* | |||
32.1** | |||
32.2** | |||
101.INS* | XBRL Instance Document | ||
101.SCH* | XBRL Taxonomy Extension Schema | ||
101.CAL* | XBRL Taxonomy Extension Calculation Linkbase | ||
101.DEF* | XBRL Taxonomy Extension Definition Linkbase | ||
101.LAB* | XBRL Taxonomy Extension Label Linkbase | ||
101.PRE* | XBRL Taxonomy Extension Presentation Linkbase | ||
_______________________________________
* Filed herewith.
** This certification is deemed not filed for purposes of Section 18 of the Securities Exchange Act of 1934, as amended (Exchange Act), or otherwise subject to the liability of that section, nor shall it be deemed incorporated by reference into any filing under the Securities Act of 1933, as amended (Securities Act), or the Exchange Act.
57
SIGNATURES
Pursuant to the requirements of Section 13 or 15(d) of the Securities Exchange Act of 1934, the Registrant has duly caused this report to be signed on its behalf by the undersigned, thereunto duly authorized.
Date: | February 21, 2018 | INOVALON HOLDINGS, INC. | ||
By: | /s/ KEITH R. DUNLEAVY, M.D. | |||
Keith R. Dunleavy, M.D | ||||
Chief Executive Officer & Chairman | ||||
(Principal Executive Officer) | ||||
Pursuant to the requirements of the Securities Exchange Act of 1934, this report has been signed below by the following persons on behalf of the Registrant and in the capacities and on the dates indicated.
Signature | Title | Date | ||
/s/ KEITH R. DUNLEAVY, M.D. | Chief Executive Officer & Chairman (principal executive officer) | February 21, 2018 | ||
Keith R. Dunleavy, M.D. | ||||
/s/ CHRISTOPHER E. GREINER | Chief Financial & Operating Officer (principal financial officer & principal accounting officer) | February 21, 2018 | ||
Christopher E. Greiner | ||||
/s/ DENISE K. FLETCHER | Director | February 21, 2018 | ||
Denise K. Fletcher | ||||
/s/ WILLIAM D. GREEN | Director | February 21, 2018 | ||
William D. Green | ||||
/s/ ANDRÉ S. HOFFMANN | Director | February 21, 2018 | ||
André S. Hoffmann | ||||
/s/ LEE D. ROBERTS | Director | February 21, 2018 | ||
Lee D. Roberts | ||||
/s/ WILLIAM J. TEUBER | Director | February 21, 2018 | ||
William J. Teuber | ||||
58
INOVALON HOLDINGS, INC.
INDEX TO CONSOLIDATED FINANCIAL STATEMENTS
F-1
REPORT OF INDEPENDENT REGISTERED PUBLIC ACCOUNTING FIRM
To the Shareholders and the Board of Directors of
Inovalon Holdings, Inc.
Bowie, MD
Opinion on the Financial Statements
We have audited the accompanying consolidated balance sheets of Inovalon Holdings, Inc. and subsidiaries (the "Company") as of December 31, 2017 and 2016, the related consolidated statements of operations, comprehensive income, stockholders' equity (deficit), and cash flows, for each of the three years in the period ended December 31, 2017, and the related notes (collectively referred to as the "financial statements”). In our opinion, the financial statements present fairly, in all material respects, the financial position of the Company as of December 31, 2017 and 2016, and the results of its operations and its cash flows for each of the three years in the period ended December 31, 2017, in conformity with accounting principles generally accepted in the United States of America.
We have also audited, in accordance with the standards of the Public Company Accounting Oversight Board (United States) (PCAOB), the Company's internal control over financial reporting as of December 31, 2017, based on criteria established in Internal Control - Integrated Framework (2013) issued by the Committee of Sponsoring Organizations of the Treadway Commission and our report dated February 21, 2018, expressed an unqualified opinion on the Company's internal control over financial reporting.
Basis for Opinion
These financial statements are the responsibility of the Company's management. Our responsibility is to express an opinion on the Company's financial statements based on our audits. We are a public accounting firm registered with the PCAOB and are required to be independent with respect to the Company in accordance with the U.S. federal securities laws and the applicable rules and regulations of the Securities and Exchange Commission and the PCAOB.
We conducted our audits in accordance with the standards of the PCAOB. Those standards require that we plan and perform the audit to obtain reasonable assurance about whether the financial statements are free of material misstatement, whether due to error or fraud. Our audits included performing procedures to assess the risks of material misstatement of the financial statements, whether due to error or fraud, and performing procedures that respond to those risks. Such procedures included examining, on a test basis, evidence regarding the amounts and disclosures in the financial statements. Our audits also included evaluating the accounting principles used and significant estimates made by management, as well as evaluating the overall presentation of the financial statements. We believe that our audits provide a reasonable basis for our opinion.
/s/ DELOITTE & TOUCHE LLP
McLean, Virginia
February 21, 2018
We have served as the Company's auditor since 2007.
F-2
REPORT OF INDEPENDENT REGISTERED PUBLIC ACCOUNTING FIRM
To the Shareholders and the Board of Directors of
Inovalon Holdings, Inc.
Bowie, MD
Opinion on Internal Control over Financial Reporting
We have audited the internal control over financial reporting of Inovalon Holdings, Inc. and subsidiaries (the "Company") as of December 31, 2017, based on criteria established in Internal Control - Integrated Framework (2013) issued by the Committee of Sponsoring Organizations of the Treadway Commission (COSO). In our opinion, the Company maintained, in all material respects, effective internal control over financial reporting as of December 31, 2017, based on criteria established in Internal Control - Integrated Framework (2013) issued by COSO.
We have also audited, in accordance with the standards of the Public Company Accounting Oversight Board (United States) (PCAOB), the consolidated financial statements as of and for the year ended December 31, 2017 of the Company and our report dated February 21, 2018, expressed an unqualified opinion on those financial statements.
Basis for Opinion
The Company’s management is responsible for maintaining effective internal control over financial reporting and for its assessment of the effectiveness of internal control over financial reporting, included in the accompanying Management's Annual Report on Internal Control over Financial Reporting. Our responsibility is to express an opinion on the Company’s internal control over financial reporting based on our audit. We are a public accounting firm registered with the PCAOB and are required to be independent with respect to the Company in accordance with the U.S. federal securities laws and the applicable rules and regulations of the Securities and Exchange Commission and the PCAOB.
We conducted our audit in accordance with the standards of the PCAOB. Those standards require that we plan and perform the audit to obtain reasonable assurance about whether effective internal control over financial reporting was maintained in all material respects. Our audit included obtaining an understanding of internal control over financial reporting, assessing the risk that a material weakness exists, testing and evaluating the design and operating effectiveness of internal control based on the assessed risk, and performing such other procedures as we considered necessary in the circumstances. We believe that our audit provides a reasonable basis for our opinion.
Definition and Limitations of Internal Control over Financial Reporting
A company’s internal control over financial reporting is a process designed to provide reasonable assurance regarding the reliability of financial reporting and the preparation of financial statements for external purposes in accordance with generally accepted accounting principles. A company’s internal control over financial reporting includes those policies and procedures that (1) pertain to the maintenance of records that, in reasonable detail, accurately and fairly reflect the transactions and dispositions of the assets of the company; (2) provide reasonable assurance that transactions are recorded as necessary to permit preparation of financial statements in accordance with generally accepted accounting principles, and that receipts and expenditures of the company are being made only in accordance with authorizations of management and directors of the company; and (3) provide reasonable assurance regarding prevention or timely detection of unauthorized acquisition, use, or disposition of the company’s assets that could have a material effect on the financial statements.
Because of its inherent limitations, internal control over financial reporting may not prevent or detect misstatements. Also, projections of any evaluation of effectiveness to future periods are subject to the risk that controls may become inadequate because of changes in conditions, or that the degree of compliance with the policies or procedures may deteriorate.
/s/ DELOITTE & TOUCHE LLP
McLean, Virginia
February 21, 2018
F-3
Inovalon Holdings, Inc.
Consolidated Balance Sheets
(in thousands, except share amounts)
December 31, | |||||||
2017 | 2016 | ||||||
ASSETS | |||||||
Current assets: | |||||||
Cash and cash equivalents | $ | 208,944 | $ | 127,683 | |||
Short-term investments | 267,288 | 445,315 | |||||
Accounts receivable (net of allowances of $2,038 and $3,782 at December 31, 2017 and 2016, respectively) | 90,054 | 85,591 | |||||
Prepaid expenses and other current assets | 10,441 | 12,100 | |||||
Income tax receivable | 11,987 | 15,165 | |||||
Total current assets | 588,714 | 685,854 | |||||
Non-current assets: | |||||||
Property, equipment and capitalized software, net | 125,768 | 76,420 | |||||
Goodwill | 184,932 | 184,557 | |||||
Intangible assets, net | 89,326 | 103,549 | |||||
Other assets | 6,338 | 2,964 | |||||
Total assets | $ | 995,078 | $ | 1,053,344 | |||
LIABILITIES AND STOCKHOLDERS’ EQUITY | |||||||
Current liabilities: | |||||||
Accounts payable | $ | 34,109 | $ | 16,474 | |||
Accrued compensation | 18,592 | 15,211 | |||||
Other current liabilities | 15,277 | 9,468 | |||||
Deferred revenue | 6,954 | 11,850 | |||||
Deferred rent | 1,818 | 1,016 | |||||
Credit facilities | 45,000 | 30,000 | |||||
Capital lease obligation | 336 | 115 | |||||
Total current liabilities | 122,086 | 84,134 | |||||
Non-current liabilities: | |||||||
Credit facilities, less current portion | 191,250 | 236,250 | |||||
Capital lease obligation, less current portion | 12,109 | 215 | |||||
Deferred rent | 219 | 1,457 | |||||
Other liabilities | — | 13,158 | |||||
Deferred income taxes | 26,642 | 34,553 | |||||
Total liabilities | 352,306 | 369,767 | |||||
Commitments and contingencies (Note 10) | |||||||
Stockholders’ equity: | |||||||
Common stock, $0.000005 par value, 900,000,000 shares authorized, zero shares issued and outstanding at each of December 31, 2017 and 2016, respectively | — | — | |||||
Class A common stock, $0.000005 par value, 750,000,000 shares authorized; 77,588,018 shares issued and 62,967,843 shares outstanding at December 31, 2017; 72,271,298 shares issued and 64,786,705 shares outstanding at December 31, 2016 | — | — | |||||
Class B common stock, $0.000005 par value, 150,000,000 shares authorized; 80,957,495 shares issued and outstanding at December 31, 2017; 83,303,628 shares issued and outstanding at December 31, 2016 | 1 | 1 | |||||
Preferred stock, $0.0001 par value, 100,000,000 shares authorized, zero shares issued and outstanding at December 31, 2017 and 2016, respectively | — | — | |||||
Additional paid-in-capital | 534,159 | 516,300 | |||||
Retained earnings | 308,905 | 274,087 | |||||
Treasury stock, at cost, 14,620,175 and 7,508,985 shares at December 31, 2017 and 2016, respectively | (199,817 | ) | (106,231 | ) | |||
Other comprehensive loss, net of tax | (476 | ) | (580 | ) | |||
Total stockholders’ equity | 642,772 | 683,577 | |||||
Total liabilities and stockholders’ equity | $ | 995,078 | $ | 1,053,344 | |||
See notes to consolidated financial statements.
F-4
Inovalon Holdings, Inc.
Consolidated Statements of Operations
(In thousands, except per share amounts)
Year Ended December 31, | |||||||||||
2017 | 2016 | 2015 | |||||||||
Revenue | $ | 449,358 | $ | 427,588 | $ | 437,271 | |||||
Expenses: | |||||||||||
Cost of revenue(1) | 151,046 | 159,169 | 146,140 | ||||||||
Sales and marketing(1) | 34,103 | 27,078 | 14,684 | ||||||||
Research and development(1) | 27,383 | 29,148 | 22,329 | ||||||||
General and administrative(1) | 149,948 | 137,275 | 115,029 | ||||||||
Depreciation and amortization | 53,089 | 37,284 | 22,633 | ||||||||
Total operating expenses | 415,569 | 389,954 | 320,815 | ||||||||
Income from operations | 33,789 | 37,634 | 116,456 | ||||||||
Other income and (expenses): | |||||||||||
Realized gains (losses) on short-term investments | — | 4 | (328 | ) | |||||||
(Loss) Gain on disposal of equipment | (406 | ) | 534 | — | |||||||
Interest income | 5,429 | 5,792 | 3,003 | ||||||||
Interest expense | (6,225 | ) | (5,065 | ) | (4,420 | ) | |||||
Income before taxes | 32,587 | 38,899 | 114,711 | ||||||||
(Benefit from) Provision for income taxes | (2,231 | ) | 11,795 | 48,648 | |||||||
Net income | $ | 34,818 | $ | 27,104 | $ | 66,063 | |||||
Net income attributable to common stockholders, basic and diluted | $ | 33,828 | $ | 26,943 | $ | 66,014 | |||||
Net income per share attributable to common stockholders, basic and diluted: | |||||||||||
Basic net income per share | $ | 0.24 | $ | 0.18 | $ | 0.45 | |||||
Diluted net income per share | $ | 0.24 | $ | 0.18 | $ | 0.45 | |||||
Weighted average shares of common stock outstanding: | |||||||||||
Basic | 142,225 | 150,048 | 145,745 | ||||||||
Diluted | 142,737 | 150,955 | 148,275 | ||||||||
_______________________________________
(1) Includes stock-based compensation expense as follows: | |||||||||||
Cost of revenue | $ | 1,652 | $ | 483 | $ | 164 | |||||
Sales and marketing | 2,011 | 613 | 173 | ||||||||
Research and development | 1,293 | 1,184 | 1,212 | ||||||||
General and administrative | 12,362 | 7,774 | 5,866 | ||||||||
Total stock-based compensation expense | $ | 17,318 | $ | 10,054 | $ | 7,415 | |||||
See notes to consolidated financial statements.
F-5
Inovalon Holdings, Inc.
Consolidated Statements of Comprehensive Income
(In thousands)
Year Ended December 31, | |||||||||||
2017 | 2016 | 2015 | |||||||||
Net income | $ | 34,818 | $ | 27,104 | $ | 66,063 | |||||
Other comprehensive income (loss): | |||||||||||
Realized (gains) losses on short-term investments reclassified from accumulated other comprehensive income, net of tax of $0, $4 and $(139), respectively | — | (6 | ) | 191 | |||||||
Net change in unrealized gains and (losses) on available-for-sale investments, net of tax of $(94), $(682) and $1,269, respectively | 104 | 1,008 | (1,773 | ) | |||||||
Comprehensive income | $ | 34,922 | $ | 28,106 | $ | 64,481 | |||||
See notes to consolidated financial statements.
F-6
Inovalon Holdings, Inc.
Consolidated Statements of Stockholders’ Equity (Deficit)
(in thousands, except share amounts)
Issued Class A Common Stock | Issued Class B Common Stock | Treasury Stock | Additional Paid-in Capital | Retained Earnings | Accumulated Other Comprehensive Loss | Total Stockholders’ Equity (Deficit) | |||||||||||||||||||||||||||||||
Shares | Amount | Shares | Amount | Shares | Amount | ||||||||||||||||||||||||||||||||
Balance—January 1, 2015 | 11,109,285 | $ | — | 122,257,145 | $ | 1 | (11,109,285 | ) | $ | (300,017 | ) | $ | 110,317 | $ | 181,477 | $ | — | $ | (8,222 | ) | |||||||||||||||||
Issuance of common stock upon initial public offering, net of offering costs | 14,255,518 | — | — | — | — | — | 359,170 | — | — | 359,170 | |||||||||||||||||||||||||||
Issuance of treasury stock upon initial public offering, net of offering costs | — | — | — | — | 11,109,285 | 300,017 | (20,115 | ) | — | — | 279,902 | ||||||||||||||||||||||||||
Stock-based compensation expense | — | — | — | — | — | — | 7,259 | — | — | 7,259 | |||||||||||||||||||||||||||
Issuance of common stock related to business combination | 235,737 | — | — | — | — | — | 3,847 | — | — | 3,847 | |||||||||||||||||||||||||||
Exercise of stock options | — | — | 3,222,201 | — | — | — | 14,652 | — | — | 14,652 | |||||||||||||||||||||||||||
Tax benefit from exercise of non-qualified stock options | — | — | — | — | — | — | 18,608 | — | — | 18,608 | |||||||||||||||||||||||||||
Conversion Class B to Class A common stock | 27,313,057 | — | (27,313,057 | ) | — | — | — | — | — | — | — | ||||||||||||||||||||||||||
Issuance of shares for Employee Stock Purchase Plan | 30,689 | — | — | — | — | — | 8 | — | — | 8 | |||||||||||||||||||||||||||
Issuance of shares related to restricted stock units | 538,383 | — | 94,784 | — | — | — | — | — | — | — | |||||||||||||||||||||||||||
Shares withheld for employee taxes upon conversion of restricted stock units | — | — | (30,710 | ) | — | — | — | (549 | ) | — | — | (549 | ) | ||||||||||||||||||||||||
Other comprehensive loss | — | — | — | — | — | — | — | — | (1,582 | ) | (1,582 | ) | |||||||||||||||||||||||||
Net income | — | — | — | — | — | — | — | 66,063 | — | 66,063 | |||||||||||||||||||||||||||
Balance—December 31, 2015 | 53,482,669 | $ | — | 98,230,363 | $ | 1 | — | $ | — | $ | 493,197 | $ | 247,540 | $ | (1,582 | ) | 739,156 | ||||||||||||||||||||
Adjustment to adopt ASU 2016-09 | — | — | — | — | — | — | 757 | (557 | ) | — | 200 | ||||||||||||||||||||||||||
Repurchase of common stock | — | — | — | — | (7,508,985 | ) | (106,231 | ) | — | — | — | (106,231 | ) | ||||||||||||||||||||||||
Stock-based compensation expense | — | — | — | — | — | — | 9,914 | — | — | 9,914 | |||||||||||||||||||||||||||
Issuance of common stock related to business combination | 651,355 | — | — | — | — | — | 7,764 | — | — | 7,764 | |||||||||||||||||||||||||||
Exercise of stock options | 660,156 | — | 158,753 | — | — | — | 6,200 | — | — | 6,200 | |||||||||||||||||||||||||||
Conversion Class B to Class A common stock | 15,085,488 | — | (15,085,488 | ) | — | — | — | — | — | — | — | ||||||||||||||||||||||||||
Issuance of shares for Employee Stock Purchase Plan | — | — | — | — | — | — | (34 | ) | — | (34 | ) | ||||||||||||||||||||||||||
Issuance of shares related to restricted stock units and awards | 2,453,593 | — | — | — | — | — | — | — | — | — | |||||||||||||||||||||||||||
Shares withheld for employee taxes upon conversion of restricted stock | (61,963 | ) | — | — | — | — | — | (1,498 | ) | — | — | (1,498 | ) | ||||||||||||||||||||||||
Other comprehensive loss | — | — | — | — | — | — | — | — | 1,002 | 1,002 | |||||||||||||||||||||||||||
Net income | — | — | — | — | — | — | — | 27,104 | — | 27,104 | |||||||||||||||||||||||||||
Balance—December 31, 2016 | 72,271,298 | $ | — | 83,303,628 | $ | 1 | (7,508,985 | ) | $ | (106,231 | ) | $ | 516,300 | $ | 274,087 | $ | (580 | ) | $ | 683,577 | |||||||||||||||||
Repurchase of common stock | — | — | — | — | (7,111,190 | ) | (93,586 | ) | — | — | — | (93,586 | ) | ||||||||||||||||||||||||
Stock-based compensation expense | — | — | — | — | — | — | 17,164 | — | — | 17,164 | |||||||||||||||||||||||||||
Exercise of stock options | 654,035 | — | 6,833 | — | — | — | 4,967 | — | — | 4,967 | |||||||||||||||||||||||||||
Conversion Class B to Class A common stock | 2,352,966 | — | (2,352,966 | ) | — | — | — | — | — | — | — | ||||||||||||||||||||||||||
Issuance of shares related to restricted stock units and awards | 2,546,426 | — | — | — | — | — | — | — | — | — | |||||||||||||||||||||||||||
Shares withheld for employee taxes upon conversion of restricted stock | (236,707 | ) | — | — | — | — | — | (4,272 | ) | — | — | (4,272 | ) | ||||||||||||||||||||||||
Other comprehensive loss | — | — | — | — | — | — | — | — | 104 | 104 | |||||||||||||||||||||||||||
Net income | — | — | — | — | — | — | — | 34,818 | — | 34,818 | |||||||||||||||||||||||||||
Balance—December 31, 2017 | 77,588,018 | $ | — | 80,957,495 | $ | 1 | (14,620,175 | ) | $ | (199,817 | ) | $ | 534,159 | $ | 308,905 | $ | (476 | ) | $ | 642,772 | |||||||||||||||||
See notes to consolidated financial statements.
F-7
Inovalon Holdings, Inc.
Consolidated Statements of Cash Flows
(in thousands)
Year Ended December 31, | |||||||||||
2017 | 2016 | 2015 | |||||||||
Cash flows from operating activities: | |||||||||||
Net income | $ | 34,818 | $ | 27,104 | $ | 66,063 | |||||
Adjustments to reconcile net income to net cash provided by operating activities: | |||||||||||
Stock-based compensation expense | 17,318 | 10,054 | 7,415 | ||||||||
Depreciation | 37,853 | 28,078 | 19,221 | ||||||||
Amortization of intangibles | 15,236 | 9,206 | 3,412 | ||||||||
Amortization of premiums or discounts on short-term investments | 1,958 | 3,163 | 2,212 | ||||||||
Realized (gains) losses on short-term investments | — | (4 | ) | 328 | |||||||
Tax payments for equity award issuances | — | 127 | 697 | ||||||||
Deferred income taxes | (6,665 | ) | (1,740 | ) | 5,786 | ||||||
Excess tax benefits from stock-based compensation | — | — | (18,608 | ) | |||||||
Loss (Gain) on disposal of equipment and long-lived assets | 406 | (534 | ) | 52 | |||||||
Change in fair value of contingent consideration | (5,200 | ) | 706 | — | |||||||
Bargain purchase gain | (1,434 | ) | — | — | |||||||
Bad debt expense | — | 79 | — | ||||||||
Changes in assets and liabilities: | |||||||||||
Accounts receivable | (977 | ) | 4,683 | (24,475 | ) | ||||||
Prepaid expenses and other current assets | 3,346 | (6,198 | ) | (1,110 | ) | ||||||
Income taxes receivable | 3,293 | 3,639 | 7,825 | ||||||||
Other assets | (3,355 | ) | 4,071 | (1,776 | ) | ||||||
Accounts payable | 8,252 | (3,463 | ) | 4,474 | |||||||
Accrued compensation | 3,030 | 243 | (6,178 | ) | |||||||
Other liabilities | (5,373 | ) | 10,479 | 2,788 | |||||||
Deferred rent | (440 | ) | (770 | ) | (575 | ) | |||||
Deferred revenue | (4,360 | ) | 3,907 | 3 | |||||||
Net cash provided by operating activities | 97,706 | 92,830 | 67,554 | ||||||||
Cash flows from investing activities: | |||||||||||
Acquisition, net of cash acquired of $1,535, $861 and $4,037, respectively | (3,490 | ) | (88,509 | ) | (114,718 | ) | |||||
Escrow funding associated with acquisition | — | — | (7,875 | ) | |||||||
Maturities of short-term investments | 174,416 | 300,524 | 177,723 | ||||||||
Sales of short-term investments | 1,175 | 31,549 | 166,930 | ||||||||
Purchases of short-term investments | — | (164,737 | ) | (964,037 | ) | ||||||
Purchases of property and equipment | (32,565 | ) | (19,360 | ) | (6,486 | ) | |||||
Investment in capitalized software | (32,977 | ) | (19,668 | ) | (19,951 | ) | |||||
Proceeds from sale of property and equipment | — | — | 94 | ||||||||
Net cash provided by (used in) investing activities | 106,559 | 39,799 | (768,320 | ) | |||||||
Cash flows from financing activities: | |||||||||||
Proceeds from issuance of common stock, net of underwriters’ discount | — | — | 362,082 | ||||||||
Proceeds from issuance of treasury stock, net of underwriters’ discount | — | — | 282,172 | ||||||||
Payment of offering costs | — | — | (5,182 | ) | |||||||
Repurchase of common stock | (93,586 | ) | (106,231 | ) | — | ||||||
Repayment of credit facility borrowings | (30,000 | ) | (15,000 | ) | (18,750 | ) | |||||
Acquisition-related contingent consideration | — | (2,300 | ) | — | |||||||
Proceeds from exercise of stock options | 4,967 | 6,165 | 14,660 | ||||||||
Capital lease obligations paid | (113 | ) | (116 | ) | (112 | ) | |||||
Tax payments for equity award issuances | (4,272 | ) | (1,498 | ) | (1,245 | ) | |||||
Excess tax benefits from stock-based compensation | — | — | 18,608 | ||||||||
Net cash (used in) provided by financing activities | (123,004 | ) | (118,980 | ) | 652,233 | ||||||
Increase (decrease) in cash and cash equivalents | 81,261 | 13,649 | (48,533 | ) | |||||||
Cash and cash equivalents, beginning of period | 127,683 | 114,034 | 162,567 | ||||||||
Cash and cash equivalents, end of period | $ | 208,944 | $ | 127,683 | $ | 114,034 | |||||
Supplemental cash flow disclosure: | |||||||||||
Cash paid during the year for: | |||||||||||
Income taxes, net of refunds | $ | 962 | $ | 11,117 | $ | 35,038 | |||||
Interest | 5,972 | 4,835 | 4,359 | ||||||||
Non-cash investing activities: | |||||||||||
Capital lease obligations incurred | 12,231 | — | 249 | ||||||||
Accruals of purchases of property, equipment | 7,924 | 816 | 3,189 | ||||||||
Accruals for investment in capitalized software | 2,711 | 913 | 567 | ||||||||
See notes to consolidated financial statements.
F-8
Inovalon Holdings, Inc.
Notes to Consolidated Financial Statements
1. NATURE OF OPERATIONS
Inovalon Holdings, Inc., (the “Company”), is a leading technology company providing cloud-based platforms empowering a data-driven transformation from volume-based to value-based models throughout the healthcare industry. Through the Inovalon ONE™ Platform, Inovalon brings to the marketplace a national-scale capability to interconnect with the healthcare ecosystem on a very large scale, aggregate and analyze data in petabyte volumes to arrive at sophisticated insights in real-time, drive impact wherever it is analytically identified best to intervene, and intuitively visualize data and information to inform business strategy and execution. Leveraging its platform capabilities, large proprietary data sets, and industry-leading subject matter expertise, Inovalon enables the assessment and improvement of clinical and quality outcomes and financial performance across the healthcare ecosystem. From health plans and provider organizations, to pharmaceutical, medical device, and diagnostics companies, Inovalon’s unique achievement of value is delivered through the effective progression of “Turning Data into Insight, and Insight into Action®.”
On September 17, 2014, Inovalon, Inc. implemented a holding company reorganization, pursuant to which Inovalon Holdings, Inc. (together with its wholly owned subsidiaries, Inovalon or the Company) became the new parent company of Inovalon, Inc. and Inovalon, Inc. became the direct, wholly owned subsidiary of the Company. The Company was incorporated in the state of Delaware on September 11, 2014. Inovalon, Inc. was incorporated in the state of Delaware on November 18, 2005. The impact of the holding company reorganization is retrospectively presented in the accompanying consolidated financial statements by recognizing the entity as Inovalon Holdings, Inc. The consolidated balance sheet and consolidated statement of stockholders’ equity (deficit) depict the authorized classes of stock. Additionally, earnings per share is calculated based upon the authorized, issued and outstanding shares of Class A and Class B common stock (refer to Notes 4 and 13 for additional information). On January 14, 2015, the Company’s board of directors approved a five-for-one stock split of the Company’s Class A common stock and Class B common stock. Effective January 16, 2015 the Company amended its certificate of incorporation to give effect to the stock split and to change the Company’s authorized common equity capital to 900,000,000 shares of common stock, 750,000,000 shares of Class A common stock, and 150,000,000 shares of Class B common stock, par value $0.000005 per share. All share data included in these financial statements give retroactive effect to the stock split and related amendment to the Company’s certificate of incorporation.
2. SUMMARY OF SIGNIFICANT ACCOUNTING POLICIES
Principles of Consolidation—The accompanying consolidated financial statements include the accounts of Inovalon Holdings, Inc. and its wholly owned subsidiaries. All intercompany accounts and transactions have been eliminated in consolidation.
Basis of Presentation and Use of Estimates—These consolidated financial statements have been prepared in accordance with United States Generally Accepted Accounting Principles (“GAAP”). The preparation of consolidated financial statements in conformity with GAAP requires management to make estimates and assumptions that affect the reported amounts of assets and liabilities, disclosures of contingent assets and liabilities as of the date of the financial statements, and the reported amounts of revenue and expenses during the reported period. Certain prior period amounts have been reclassified on the statements of stockholders' equity, within the operating section of the statements of cash flows, and within the investing section of the statements of cash flows to conform with current period presentation. Such reclassifications had no impact on total equity, net cash provided by operating activities or net cash provided by (used in) investing activities as previously reported.
Significant estimates made by management include, but are not limited to: revenue recognition, including selling prices associated with the individual elements in multiple element arrangements; accounts receivable allowances; estimates of the fair value of stock-based awards; fair value of intangibles and goodwill; depreciable lives of property, equipment and capitalized software; and useful lives of intangible assets. Actual results could differ from management’s estimates, and such differences could be material to the Company’s consolidated financial position and results of operations.
Cash and Cash Equivalents—Cash and cash equivalents consist of highly liquid investments with an original maturity of three months or less at the time of purchase, and demand deposits with financial institutions.
Short-term investments—Short-term investments consists of investment grade debt securities. The Company classifies short-term investments as available-for-sale at the time of purchase and reevaluates such classification as of each balance sheet date. All short-term investments are recorded at estimated fair value. Unrealized gains and losses for available-for-sale securities are included in accumulated other comprehensive loss, a component of stockholders’ equity. The Company evaluates its investments to assess whether those with unrealized loss positions are other than temporarily impaired. Impairments are considered to be other-than-temporary if they are related to deterioration in credit risk, if it is more likely than not that the Company will be required to sell or intends to sell the securities before the recovery of their cost basis. Realized gains and
F-9
Inovalon Holdings, Inc.
Notes to Consolidated Financial Statements (Continued)
2. SUMMARY OF SIGNIFICANT ACCOUNTING POLICIES (Continued)
losses and declines in value judged to be other than temporary are determined based on the specific identification method and are reported as components of other income and (expenses), in the consolidated statements of operations. Interest, amortization of premiums, and accretion of discount on short-term investments classified as available for sale are included as a component of interest income, in the consolidated statements of operations. There were no other-than-temporary impairments during 2017.
The Company may sell short-term investments at any time, without significant penalty, for use in current operations or for other purposes, even if the short-term investments have not yet reached maturity. As a result, the Company classifies these investments, including securities with maturities beyond 12 months, as current assets in the accompanying consolidated balance sheets. Gains or losses realized from the sale of securities are reclassified out of other comprehensive income (loss) into earnings using the specific identification method.
Concentrations of Credit Risk—Accounts receivable and cash and cash equivalents subject the Company to its highest potential concentrations of credit risk. Although the Company deposits its cash and cash equivalents with multiple financial institutions, the Company’s deposits may exceed federally insured limits. The Company has not experienced any losses on cash and cash equivalent accounts to date, and management believes the Company is not exposed to any significant credit risk related to cash and cash equivalents.
The Company sells services to clients without requiring collateral, based on an evaluation of the client’s financial condition. Exposure to losses on receivables is principally dependent on each client’s financial condition. The Company monitors its exposure for credit losses and maintains allowances for anticipated losses.
Revenue from a significant client, representing 10% or more of total revenue for the respective periods, is summarized as follows:
Year Ended December 31, | ||||||||
2017 | 2016 | 2015 | ||||||
Client A | 12 | % | 17 | % | 12 | % | ||
Accounts receivable from a significant client, representing 10% or more of total accounts receivable for the respective dates, is summarized below:
December 31, | ||||
2017 | 2016 | |||
Client A | * | 14 | % | |
_______________________________________
*Less than 10%
Accounts Receivable and Allowances—Accounts receivable consists primarily of amounts due to the Company from its normal business activities. The Company provides an allowance for estimated losses resulting from the failure of clients to make required payments (credit losses) and a sales allowance for estimated future billing adjustments resulting from client concessions or resolutions of billing disputes. The provision for sales allowances are charged against revenue while credit losses are recorded in general and administrative expenses.
Fair Value Measurements—The Company applies the Accounting Standards Codifications (“ASC”) 820-10, Fair Value Measurements and Disclosures. ASC 820-10 defines fair value, establishes a fair value hierarchy for assets and liabilities measured at fair value, and expands required disclosures about fair value measurements. This guidance requires the Company to classify and disclose assets and liabilities measured at fair value on a recurring basis, as well as fair value measurements of assets and liabilities measured on a nonrecurring basis in periods subsequent to initial measurement, in a three-tier fair value hierarchy as described below.
The guidance defines fair value as the exchange price that would be received for an asset or paid to transfer a liability in the principal or most advantageous market for the asset or liability in an orderly transaction between market participants on the measurement date. Valuation techniques used to measure fair value must maximize the use of observable inputs and minimize the use of unobservable inputs. The guidance describes three levels of inputs that may be used to measure fair value:
Level 1—Financial assets and liabilities whose values are based on quoted prices (unadjusted) in active markets for identical assets or liabilities that the reporting entity can access at the measurement date.
F-10
Inovalon Holdings, Inc.
Notes to Consolidated Financial Statements (Continued)
2. SUMMARY OF SIGNIFICANT ACCOUNTING POLICIES (Continued)
Level 2—Financial assets and liabilities whose values are based on inputs other than quoted prices included within Level 1 that are observable for the asset or liability, either directly or indirectly.
Level 3—Financial assets and liabilities whose values are based on unobservable inputs for the asset or liability.
The carrying amounts of accounts receivable, other current assets, accounts payable, and accrued liabilities approximate fair value due to their short-term nature. The Company’s Credit Facilities (as defined in Note 9) approximate fair value because of their floating rate structure.
Property, Equipment and Capitalized Software, net—Property and equipment are stated at cost, less accumulated depreciation and amortization. Depreciation and amortization on property, leasehold improvements, equipment, and software is computed on a straight-line basis over the estimated useful lives of the assets, as follows:
Useful Life | |
Office and computer equipment | 3 - 5 years |
Purchased software | 5 years |
Capitalized software | 3 - 5 years |
Furniture and fixtures | 7 years |
Building | * |
Leasehold improvements | * |
Assets under capital leases | * |
_______________________________________
*Lesser of lease term or economic life
Expenses for repairs and maintenance that do not extend the life of property and equipment are expensed as incurred. Expenses for major renewals and betterments, which significantly extend the useful lives of existing property and equipment, are capitalized and depreciated. Upon retirement or disposition of property and equipment, the cost and related accumulated depreciation are removed from the accounts and any resulting gain or loss is recognized.
In accordance with ASC 350-40, Internal-use Software, the Company capitalizes certain software development costs while in the application development stage related to software developed for internal use. All other costs to develop software for internal use, either in the preliminary project stage or post implementation stage, are expensed when incurred. Software development costs are amortized on a straight-line basis over a three to five year period, which management believes represents the useful life of these capitalized costs.
In accordance with ASC 985-20, Software to be Sold, Leased, or Marketed, certain software development costs are expensed as incurred until technological feasibility has been established. Thereafter, all software development costs incurred through the software’s general release date are capitalized and subsequently reported at the lower of amortized cost or net realizable value. Capitalized costs are amortized based on current and expected future revenue for each software solution with minimum annual amortization equal to the straight-line amortization over the estimated economic life, which is typically over a three to five year period.
Intangible Assets—Intangible assets consist of acquired technology, including developed and core technology, databases, trade names, and customer relationships. Intangible assets are initially recorded at fair value and amortized on a straight line basis over their estimated useful lives. Acquired intangible assets are being amortized over the following periods:
Useful Life | |
Proprietary software technology | 3 - 10 years |
Trademark | 3 - 10 years |
Database | 10 years |
Customer relationships | 8 - 15.75 years |
Non-compete agreements | Contractual term |
In-process research and development | Indefinite |
On an annual basis, the Company reviews its intangible assets for impairment based on estimated future undiscounted cash flows attributable to the assets. In the event such cash flows are not expected to be sufficient to recover the recorded value
F-11
Inovalon Holdings, Inc.
Notes to Consolidated Financial Statements (Continued)
2. SUMMARY OF SIGNIFICANT ACCOUNTING POLICIES (Continued)
of the assets, the assets are written down to their net realizable values. There were no impairment charges on intangible assets for the years ended December 31, 2017 and 2016.
Goodwill—Goodwill represents the excess of acquisition costs over the fair value of tangible net assets and identifiable intangible assets of businesses acquired. Goodwill is not amortized and is subject to impairment testing annually, or whenever events or changes in circumstances indicate that the carrying amount may not be fully recoverable.
In January 2017, the FASB issued Accounting Standards Update (“ASU”) 2017-04, Intangibles—Goodwill and Other (Topic 350): Simplifying the Test for Goodwill Impairment. The new standard simplifies the subsequent measurement of goodwill by eliminating the second step of the goodwill impairment test. This ASU will be applied prospectively and is effective for annual or interim goodwill impairment tests in fiscal years beginning after December 15, 2019. Early adoption is permitted for interim or annual goodwill impairment tests performed on testing dates after January 1, 2017. The Company early adopted the requirements of the new standard in the fourth quarter of 2017. As a result, the amendments modify the concept of impairment from the condition that exists when the carrying amount of goodwill exceeds its implied fair value to the condition that exists when the carrying amount of a reporting unit exceeds its fair value. If the fair value of the reporting unit exceeds the carrying value of the reporting unit, goodwill is not impaired. If the carrying value of the reporting unit exceeds the fair value of the reporting unit, then the Company will record an impairment loss in the amount equal to the difference between the fair value and the carrying value.
The Company performs the goodwill impairment testing annually as of December 31st, or whenever events or changes in circumstances indicate that the carrying amount may not be fully recoverable. Significant judgment in testing goodwill for impairment includes assigning assets and liabilities to the reporting unit and assessing or determining the fair value of each reporting unit based on the Company’s best estimates and assumptions, as well as other information including valuations that utilize customary valuation procedures and techniques. The Company tests its goodwill for impairment at the reporting unit level which is one level below the operating segment and has identified three reporting units: Inovalon, Avalere and Creehan. Based on the Company’s annual impairment evaluation performed as of December 31, 2017, the Company concluded that there was no impairment of goodwill. Refer to Note 8 for a summary of changes in goodwill.
Valuation of Long-Lived Assets—The Company reviews long-lived assets for events or changes in circumstances that would indicate potential impairment. If the Company determines that an asset may not be recoverable, an impairment charge is recorded. There were no impairment charges on long-lived assets for the years ended December 31, 2017, 2016 and 2015.
Revenue Recognition—The Company recognizes revenue when it is realized (or realizable) and earned (i.e., when services have been rendered or delivery of applicable deliverables has occurred). This occurs when persuasive evidence of an arrangement exists, the product or service has been performed or delivered, fees are fixed or determinable, and collection is reasonably assured. When collectability is not reasonably assured, revenue is recognized when cash is collected. Cash collections and invoices generated in excess of revenue recognized are recorded as deferred revenue until the revenue recognition criteria are met.
The Company primarily derives its revenue from multiple-element arrangement sales of its cloud-based data analytics and data-driven intervention platform services. Revenue from these multiple element arrangements are recognized in accordance with ASC 605-25, Revenue Recognition—Multiple Element Arrangements. The Company allocates revenue to its cloud-based data analytics and data-driven intervention platform services using the relative selling price method. The Company has generally been unable to establish vendor-specific objective evidence of fair value, and while the Company routinely seeks third party evidence of fair value, meaningful data has generally been unavailable as the Company’s services are unique and visibility into competitors pricing is unavailable. As a result, the Company uses its best estimate of selling price to allocate arrangement consideration to its contractual service elements.
The Company has determined a best estimate of selling price by considering several external and internal factors including, but not limited to, pricing practices, profitability objectives, competition, customer demand, internal costs, and overall economic trends. Generally, the best estimate of selling price is consistent with the contractual arrangement fee for each element.
Revenue is recognized as cloud-based data analytics and data-driven intervention services are performed and information is delivered to clients, which generally align with the Company’s right to invoice its clients. Cloud- based data analytics services are considered performed when gaps in care, quality, data integrity, or financial performance, and summarized key analytics and benchmarking analytics reports are delivered to its clients, provided that all contractual performance requirements and other revenue recognition criteria are met. Cloud-based data-driven intervention services are considered performed upon completion, provided that all contractual performance requirements and other revenue recognition criteria are met.
F-12
Inovalon Holdings, Inc.
Notes to Consolidated Financial Statements (Continued)
2. SUMMARY OF SIGNIFICANT ACCOUNTING POLICIES (Continued)
The Company also generates revenue from data-driven advisory services and recognizes revenue for these services when persuasive evidence of an arrangement exists, services have been rendered, the contract price is fixed or determinable, and collectability is reasonably assured. The Company enters into arrangements for data-driven advisory services under time and materials, fixed-price, or retainer based contracts. Revenue for time and material contracts is recognized based upon contractually agreed upon billing rates applied to direct labor hours expended plus the costs of other items used in the performance of the contract. Revenues under fixed-price and retainer-based contracts are recognized ratably over the contract period or upon contract completion. Invoices to clients are generated in accordance with the terms of the applicable contract, which may not be directly related to the performance of services. Unbilled receivables are invoiced when the achievement of specific events as defined by each contract occurs. Unbilled receivables, if any, are classified as a current asset. Advanced billings to clients in excess of revenue earned are recorded as deferred revenue until the aforementioned revenue recognition criteria are met.
The Company also enters into multiple-element software arrangements, which are recognized under ASC 985-605, Software Revenue Recognition, when a software subscription license is provided to customers. Under these arrangements, post-contract support is provided, including help desk support and unspecified upgrades. Vendor-specific objective evidence of fair value has not been established for maintenance as maintenance is not renewed separately from the license fees. As a result, under these subscription software license agreements, revenue is recognized from the license of software ratably over the life of the agreement. The Company begins to recognize revenue upon execution of a signed agreement and delivery of the software, provided that the software license fees are fixed and determinable, and collection of the resulting receivable is reasonably assured.
Certain of the Company’s arrangements entitle a client to receive a refund if the Company fails to satisfy contractually specified performance obligations. The refund is limited to a portion or all of the consideration paid. In this case, revenue is recognized when performance obligations are satisfied.
The Company maintains an allowance, charged to revenue, which reflects the Company’s estimated future billing adjustments resulting from client concessions or resolutions of billing disputes.
Cost of Revenue—Cost of revenue consists primarily of employee-related expenses including salaries, benefits, discretionary incentive compensation, employment taxes, equity compensation costs, and severance for employees that provide direct revenue-generating services to clients. Cost of revenue also includes expenses associated with the integration and verification of data and other service costs incurred to fulfill the Company’s revenue contracts. Cost of revenue does not include allocated amounts for occupancy expense, depreciation and amortization.
Research and Development—Research and development expenses consist primarily of employee-related expenses. All such costs are expensed as incurred, except for certain internal use software development costs that are capitalized. Research and development excludes any allocation of occupancy expense, depreciation and amortization.
Selling and Marketing—Sales and marketing expense consists primarily of employee-related expenses including salaries, benefits, discretionary incentive compensation, employment taxes, severance and equity compensation costs for employees engaged in sales, sales support, business development, and marketing. Sales and marketing expense also includes operating expenses for marketing programs, research, trade shows and brand messages, and public relations costs. Sales and marketing expense excludes any allocation of occupancy expense, depreciation and amortization.
General and Administrative—General and administrative expense consists primarily of employee-related expenses including salaries, benefits, discretionary incentive compensation, employment taxes, severance and equity compensation costs, for employees who are responsible for management information systems, administration, human resources, finance, legal, and executive management. General and administrative expense also includes occupancy expenses (including rent, utilities, communications, and facilities maintenance), professional fees, consulting fees, insurance, travel, and other expenses. General and administrative expense excludes any allocation of depreciation and amortization.
Segments—The Company operates its business as one operating segment. The Company develops cloud-based data analytics and data-driven intervention platforms and provides related services to its clients in order to achieve meaningful insight and improvement in clinical and quality outcomes, utilization, and financial performance. The Company derives substantially all of its revenue from the sale and support of one group of similar products and related services—proprietary datasets, advanced integration technologies, sophisticated predictive analytics, and deep subject matter expertise that enable the Company to provide seamless, end-to-end platforms that bring the benefits of big data and large-scale analytics to clients. Operating segments are defined as components of an enterprise for which separate financial information is available and is evaluated regularly by the Company’s chief operating decision maker (“CODM”), in deciding how to allocate resources and in
F-13
Inovalon Holdings, Inc.
Notes to Consolidated Financial Statements (Continued)
2. SUMMARY OF SIGNIFICANT ACCOUNTING POLICIES (Continued)
assessing performance. In the process of allocating resources and assessing performance, the Company’s CODM, its chief executive officer, reviews financial information presented on a consolidated basis.
Income Taxes—The Company accounts for income taxes in accordance with ASC 740, Income Taxes, which prescribes the use of the asset and liability approach to the recognition of deferred tax assets and liabilities related to the expected future tax consequences of events that have been recognized in the Company’s financial statements or income tax returns. Deferred tax assets and liabilities are measured using enacted tax rates expected to apply to taxable income in the years in which those temporary differences are expected to be recovered or settled.
Valuation allowances are established, when necessary, to reduce deferred tax assets when it is more likely than not that a portion or all of a given deferred tax asset will not be realized. In accordance with ASC 740, income tax expense includes (i) deferred tax expense, which represents the net change in the deferred tax asset or liability balance during the period and any change in valuation allowances and (ii) current tax expense, which represents the amount of tax currently payable to or receivable from a taxing authority and amounts accrued for expected tax contingencies (including both tax and interest). ASC 740 prescribes a recognition threshold of more-likely-than-not, and a measurement attribute for all tax positions taken or expected to be taken on a tax return, in order for those positions to be recognized in the financial statements. The Company continually reviews tax laws, regulations and related guidance in order to properly record any uncertain tax liability positions. The Company adjusts these reserves in light of changing facts and circumstances. As a result of the Tax Cuts and Jobs Act of 2017 (the “Tax Act”), which was signed into law on December 22, 2017 and is effective January 1, 2018, the Company remeasured the ending deferred tax assets to reflect the decrease in the federal corporate tax rate resulting in a tax benefit. Refer to Note 14, “Income Taxes.”
Stock-Based Compensation—All stock-based awards, including employee stock option grants, restricted stock unit (“RSU”) grants, and restricted stock award (“RSA”) grants, are recorded at fair value as of the grant date in accordance with ASC 718, Compensation—Stock Compensation, and recognized in the statement of operations over the service period of the applicable award using the straight-line method.
The Company determines the fair value of its stock option awards on the date of grant, using the Black-Scholes option pricing model. The assumptions used in calculating the fair value of stock-based awards represent management’s best estimates.
The Company measures RSUs and RSAs that vest upon satisfaction of a service condition, a performance condition, or a liquidity condition, if such conditions are applicable, based on the fair market values of the underlying common stock on the dates of grant. RSUs are share awards that, upon vesting, will deliver to the holder shares of the Company’s common stock. Compensation expense is recognized based upon the satisfaction of the requisite service, liquidity condition as of that date, and or the probability of achievement of the specified performance conditions following the straight-line method.
Treasury Stock—The Company records treasury stock activities under the cost method whereby the cost of the acquired stock is recorded as treasury stock. The Company’s accounting policy upon the formal retirement of treasury stock is to deduct the par value from common stock and to reflect any excess of cost over par value as a reduction to additional paid-in capital (to the extent created by previous issuances of the shares) and then retained earnings.
Deferred Rent—Deferred rent consists of rent escalation payment terms, tenant improvement allowances and other incentives received from landlords related to the Company’s operating leases for its facilities. Rent escalation represents the difference between actual operating lease payments due and straight-line rent expense, which is recorded by the Company over the term of the lease, including any construction period. The excess is recorded as a deferred credit in the early periods of the lease, when cash payments are generally lower than straight-line rent expense, and is reduced in the later periods of the lease when payments begin to exceed the straight-line expense. Tenant allowances from landlords for tenant improvements are generally comprised of cash received from the landlord as part of the negotiated terms of the lease or reimbursements of moving costs. These cash payments are recorded as deferred rent from landlords and are amortized as a reduction of periodic rent expense, over the term of the applicable lease.
Recently Adopted Accounting Standards
In March 2016, the FASB issued ASU 2016-09, “Compensation-Stock Compensation (Topic 718): Improvements to Employee Share-Based Payment Accounting” (“ASU 2016-09”). ASU 2016-09 modifies and intends to improve and simplify several aspects of the accounting for share-based payment awards, including income tax consequences, and classification on the statement of cash flows, therefore the Company early adopted ASU 2016-09 during the fourth quarter of 2016. Early adoption of ASU 2016-09 required the Company to apply its provisions as of January 1, 2016. Amendments related to accounting for excess tax benefits have been adopted prospectively, resulting in recognition of excess tax benefits against income tax expenses rather than additional paid-in capital of approximately $0.9 million for the year ended December 31, 2016. Excess tax benefits
F-14
Inovalon Holdings, Inc.
Notes to Consolidated Financial Statements (Continued)
2. SUMMARY OF SIGNIFICANT ACCOUNTING POLICIES (Continued)
for stock-based payments are now included in net operating cash rather than net financing cash. The changes have been applied prospectively in accordance with the ASU and prior periods have not been adjusted. The Company elected to change its accounting policy to account for forfeitures as they occur. The change was applied on a modified retrospective basis with a cumulative effect adjustment to retained earnings of approximately $0.6 million, net of tax of approximately $0.2 million, as of January 1, 2016. The adoption of ASU 2016-09 did not materially impact the Company’s consolidated financial position, results of operations, equity or cash flows.
In January 2017, the FASB issued ASU 2017-01, Business Combinations (Topic 805): Clarifying the Definition of a Business. The new standard narrows the definition of a business and provides a framework for evaluation. This ASU is effective for financial statements issued for fiscal years beginning after December 15, 2017, including interim periods within those fiscal years. The Company will apply the requirements of the new standard beginning in the fourth quarter of 2017 on a prospective basis.
In January 2017, the FASB issued ASU 2017-04, Intangibles—Goodwill and Other (Topic 350): Simplifying the Test for Goodwill Impairment. The new standard simplifies the subsequent measurement of goodwill by eliminating the second step of the goodwill impairment test. This ASU will be applied prospectively and is effective for annual or interim goodwill impairment tests in fiscal years beginning after December 15, 2019. Early adoption is permitted for interim or annual goodwill impairment tests performed on testing dates after January 1, 2017. The Company early adopted the requirements of the new standard in the fourth quarter of 2017 as it performed its annual impairment analysis. The Company evaluated each of its reporting units based on current and forecasted financial information and finalized the valuations and impairment analysis during the fourth quarter of 2017, resulting in no impairment.
Recently Issued Accounting Standards
In May 2014, the Financial Accounting Standards Board (“FASB”) issued ASU 2014-09, Revenue from Contracts with Customers and subsequent clarifying guidance (“ASU 2014-09”). This revenue recognition guidance supersedes existing GAAP guidance, including most industry-specific guidance. The core principle is that an entity should recognize revenue to depict the transfer of promised goods or services to customers in an amount that reflects the consideration to which the entity expects to be entitled in exchange for those goods or services. The guidance identifies five steps to apply in achieving this principle. ASU 2014-09 is effective for fiscal years beginning after December 15, 2017. ASU 2014-09 may be applied either retrospectively or through the use of a modified-retrospective method. The Company adopted the new standard as of January 1, 2018 using the modified retrospective approach. The Company evaluated existing contracts and implemented policies and changes to our processes, including a process for future contract reviews, and internal control over financial reporting. The impacts of the new standard include accounting for arrangements that include variable consideration, capitalization of costs of commissions that were previously expensed as incurred, upfront contract costs and contract fulfillment costs. The Company is finalizing the calculation of the adjustment to retained earnings and currently expects the impact to be immaterial as the revenue recognition for our subscription licensing of our cloud-based data analytics, intervention and reporting platforms and related support services is materially consistent with our current revenue recognition model. The Company will provide additional disclosures as required by the new standard in the first quarter of 2018.
In February 2016, the FASB issued ASU. 2016-02, Leases (Topic 842) (“ASU 2016-02”). ASU 2016-02 requires the identification of arrangements that should be accounted for as leases by lessees. This guidance is effective for public companies for fiscal years, and interim periods within those fiscal years, beginning after December 15, 2018. In general, for lease arrangements exceeding a twelve month term, these arrangements will be recognized as assets and liabilities on the balance sheet of the lessee. Under ASU 2016-02, a right-of-use asset and lease obligation will be recorded for all leases, whether operating or financing, while the income statement will reflect lease expense for operating leases and amortization/interest expense for financing leases. The balance sheet amount recorded for existing leases at the date of adoption of ASU 2016-02 will be calculated using the applicable incremental borrowing rate at the date of adoption. In addition, ASU 2016-02 requires the use of the modified retrospective method, which will require adjustment to all comparative periods presented in the consolidated financial statements. The Company is currently assessing the impact that adopting this new accounting standard will have on its consolidated financial statements and note disclosures.
In August 2016, the FASB issued ASU 2016-15, Statement of Cash Flows (Topic 230): Classification of Certain Cash Receipts and Cash Payments (“ASU 2016-15”). The update amends the guidance in Accounting Standards Codification 230, Statement of Cash Flows, and clarifies how entities should classify certain cash receipts and cash payments on the statement of cash flows with the objective of reducing the existing diversity in practice related to eight specific cash flow issues. The amendments in this update are effective for annual periods beginning after December 15, 2017, and interim periods within those fiscal years. Early adoption is permitted. The Company plans to adopt the requirements of the new standard in the first quarter of 2018 and does not currently expect the adoption to have a material impact on its consolidated financial statements.
F-15
Inovalon Holdings, Inc.
Notes to Consolidated Financial Statements (Continued)
3. BUSINESS COMBINATIONS
2017 Acquisition
On July 6, 2017, the Company completed the acquisition of ComplexCare Solutions, Inc. and ComplexCare Solutions IPA, LLC (together, “CCS”). CCS is a company which provides technology-enabled interventions and member engagement coordination services for a number of payers and employers throughout the United States. The fair value included in the consolidated financial statements, in conformity with ASC No. 820, Fair Value Measurements and Disclosures, represent the Company’s best estimates and valuations. The final purchase price was allocated to identifiable assets acquired and liabilities assumed based upon valuation procedures performed to-date. The Company acquired all of the capital stock of CCS for approximately $4.5 million in cash and the settlement of an existing payable to CCS of $2.3 million. The Company acquired approximately $9.8 million of assets, including approximately $1.5 million of cash, and approximately $3.9 million of liabilities. The net assets acquired exceeded the consideration paid by approximately $1.4 million, and as such the Company recorded a bargain purchase gain in general and administrative expenses.
2016 Acquisition
On October 3, 2016, the Company completed its acquisition of Creehan Holding Co., Inc. (“Creehan”). Creehan, through its subsidiary Creehan & Company Corporation, is a leading provider of specialty pharmacy software solutions to the pharmaceutical industry. Pursuant to the terms of the Stock Purchase Agreement between the Company and Creehan (the “Stock Purchase Agreement”), Creehan became a wholly owned subsidiary of Inovalon.
Pursuant to the terms of the Stock Purchase Agreement, Inovalon acquired all of the issued and outstanding capital stock of Creehan for an aggregate purchase price of $130.0 million, which was comprised of $120.0 million in cash and $10.0 million in shares of Class A common stock of the Company. The Company completed the acquisition of Creehan through the use of cash on hand and the issuance of 651,355 shares of Class A common stock, subject to resale restrictions. Certain components, which are referred to below as contingent consideration, of the aggregate purchase price are subject to the achievement of financial performance objectives. The Company acquired Creehan for the assembled workforce, technology platform, client base, and to accelerate entry into the specialty pharmacy software market. Transaction costs in connection with the acquisition are expensed as incurred and are included in general and administrative expenses. The results of operations related to Creehan are included in our consolidated statements of operations beginning from the date of acquisition.
A summary of the final composition of the stated purchase price and fair value of the stated purchase price is as follows (in thousands):
Share Purchase Agreement purchase price | $ | 130,000 | |
Working capital adjustment | 755 | ||
Subtotal | 130,755 | ||
Fair value adjustments: | |||
Marketability restrictions on equity consideration | (2,236 | ) | |
Contingent consideration probability of achievement adjustment. | (12,400 | ) | |
Post-acquisition compensation expense | (5,952 | ) | |
Total fair value purchase price | $ | 110,167 | |
The Company finalized the working capital adjustment in the third quarter of 2017 resulting in an increase of approximately $0.4 million to the initial purchase price allocation. After adjusting for this difference the composition of the fair value of the consideration transferred is as follows (in thousands):
Cash | $ | 89,803 | |
Issuance of Class A common stock | 7,764 | ||
Contingent consideration | 12,600 | ||
Total fair value purchase price | $ | 110,167 | |
F-16
Inovalon Holdings, Inc.
Notes to Consolidated Financial Statements (Continued)
3. BUSINESS COMBINATIONS (Continued)
Recording of Assets Acquired and Liabilities Assumed
The Company finalized the fair value of acquired assets, assumed liabilities and tax related matters in the third quarter of 2017. The following table summarizes the purchase price allocation to assets acquired and liabilities assumed, including identification of measurement period adjustments (in thousands):
Recorded Value | |||
Cash and cash equivalents | $ | 861 | |
Accounts receivable | 9,048 | ||
Other current assets | 171 | ||
Property, equipment and capitalized software | 641 | ||
Intangible assets(1) | 50,900 | ||
Goodwill(2) | 51,362 | ||
Total assets acquired | 112,983 | ||
Current liabilities | (916 | ) | |
Deferred revenue | (1,900 | ) | |
Total liabilities assumed | (2,816 | ) | |
Net assets acquired | $ | 110,167 | |
______________________________________
(1) | Identifiable intangible assets were measured using a combination of an income approach and a market approach. |
(2) | Goodwill is the excess of the consideration transferred over the net assets recognized and represents the future economic benefits, primarily as a result of other assets acquired that could not be individually identified and separately recognized. Goodwill is not amortized. The goodwill attributable to the Creehan acquisition is deductible for tax purposes. |
The amounts attributed to identified intangible assets are summarized in the table below (in thousands):
Weighted Average Useful Life | Recorded Value | ||||
Customer relationships | 8 years | $ | 36,500 | ||
Tradename | 4 years | 4,000 | |||
Technology | 4 years | 8,800 | |||
In-process Research and Development | indefinite | 1,600 | |||
Total intangible assets | $ | 50,900 | |||
Acquisition-related costs were expensed as incurred. For the year ended December 31, 2016, the Company incurred acquisition-related costs of $1.6 million recognized within “General and administrative” expenses in the accompanying consolidated statements of operations.
Creehan Results and Pro Forma Impact of Acquisition
The following table presents revenue and loss before taxes of Creehan since the acquisition date, October 3, 2016, included in the consolidated statements of operations and includes amortization expense related to acquired intangible assets (in thousands):
Year Ended December 31, 2016 | |||
Revenue | $ | 8,106 | |
Loss before taxes | $ | (976 | ) |
F-17
Inovalon Holdings, Inc.
Notes to Consolidated Financial Statements (Continued)
3. BUSINESS COMBINATIONS (Continued)
The following table presents pro forma information, based on estimates and assumptions that the Company believes to be reasonable, for the Company as if the acquisition of Creehan had occurred at the beginning of the earliest period presented (unaudited, in thousands):
Year Ended December 31, | |||||||
2016 | 2015 | ||||||
Pro forma revenue | $ | 453,613 | $ | 464,646 | |||
Pro forma income before taxes | $ | 44,203 | $ | 115,331 | |||
The pro forma information provided in the table above is not necessarily indicative of the consolidated results of operations for future periods or the results that actually would have been realized had the acquisition been completed at the beginning of the periods presented.
The pro forma impact of the Creehan acquisition on current and prior quarters, subsequent to its acquisition for the three months ended December 31, 2016, were not material. The results of operations of Creehan have been included in our consolidated results from the date of acquisition.
2015 Acquisition
On September 1, 2015, pursuant to the provisions of the Share Purchase Agreement, between the Company and Avalere Health Inc. (“Avalere”), the Company acquired all of the issued and outstanding capital stock of Avalere. Avalere is a provider of data-driven advisory services and business intelligence solutions primarily to the pharmaceutical and life sciences industry, as well as within their extensive array of client relationships with payers, providers and research institutions. Certain portions of the stated purchase price of $140.0 million were contingent upon the achievement of financial and operational objectives, and other portions were subject to continued employment provisions. The Company completed the acquisition of Avalere through the use of cash on hand and the issuance of 235,737 shares of Class A common stock, subject to sale restrictions. The addition of Avalere, with its more than 200 pharmaceutical and life sciences clients, as well as an extensive array of client relationships with payers, providers and research institutions, is expected to expand Inovalon’s capabilities and client base into the expansive and adjacent markets of the pharmaceutical and life sciences industry.
A summary of the composition of the stated purchase price and fair value of the stated purchase price is as follows (in thousands):
Share Purchase Agreement purchase price | $ | 140,000 | |
Working capital adjustment | 3,112 | ||
Subtotal | 143,112 | ||
Fair Value Adjustments: | |||
Restricted stock marketability discount | (1,153 | ) | |
Performance objectives discount from maximum value | (700 | ) | |
Post-acquisition compensation expense | (16,357 | ) | |
Total fair value purchase price | $ | 124,902 | |
The composition of the fair value of the consideration transferred is as follows (in thousands):
Cash | $ | 118,755 | |
Issuance of Class A common stock | 3,847 | ||
Contingent consideration | 2,300 | ||
Total fair value purchase price | $ | 124,902 | |
Recording of Assets Acquired and Liabilities Assumed
Estimates of fair value included in the consolidated financial statements, in conformity with ASC 820, Fair Value Measurements and Disclosures, represent the Company’s best estimates and valuations. In accordance with ASC 805, Business Combinations, the allocation of the consideration value is subject to adjustment until the Company has completed its analysis, but not to exceed one year after the date of acquisition, which was September 1, 2015, to provide the Company with the time to complete the valuation of its assets and liabilities. As of December 31, 2015, the Company completed and finalized its analysis
F-18
Inovalon Holdings, Inc.
Notes to Consolidated Financial Statements (Continued)
3. BUSINESS COMBINATIONS (Continued)
and allocation of the consideration value to assets acquired and liabilities assumed. In addition, as discussed in Note 2, the Company early adopted the provisions of ASU 2015-16 and recorded measurement period adjustments that were identified in the process of finalizing the aforementioned analysis and allocation.
The following table summarizes the final purchase price allocation to assets acquired and liabilities assumed, including identification of measurement period adjustments (in thousands):
Preliminary Recorded Value | Measurement Period Adjustments | Final Recorded Value | |||||||||
Cash and cash equivalents | $ | 4,037 | $ | — | $ | 4,037 | |||||
Accounts receivable | 13,011 | (120 | ) | 12,891 | |||||||
Current assets | 1,958 | — | 1,958 | ||||||||
Property, equipment and capitalized software | 3,248 | — | 3,248 | ||||||||
Intangible assets(1) | 57,520 | 300 | 57,820 | ||||||||
Goodwill(2) | 74,238 | 1,226 | 75,464 | ||||||||
Deferred income taxes | 947 | (224 | ) | 723 | |||||||
Other assets | 224 | — | 224 | ||||||||
Total assets acquired | 155,183 | 1,182 | 156,365 | ||||||||
Current liabilities | (11,054 | ) | 108 | (10,946 | ) | ||||||
Deferred tax liability | (17,677 | ) | (686 | ) | (18,363 | ) | |||||
Deferred revenue | (1,600 | ) | — | (1,600 | ) | ||||||
Other liabilities | (554 | ) | — | (554 | ) | ||||||
Total liabilities assumed | (30,885 | ) | (578 | ) | (31,463 | ) | |||||
Net assets acquired | $ | 124,298 | $ | 604 | $ | 124,902 | |||||
_______________________________________
(1) | Identifiable intangible assets were measured using a combination of an income approach and a market approach. |
(2) | Goodwill is the excess of the consideration transferred over the net assets recognized and represents the future economic benefits, primarily as a result of other assets acquired that could not be individually identified and separately recognized. Goodwill is not amortized and is not deductible for tax purposes. |
The amounts attributed to identified intangible assets are summarized in the table below (in thousands):
Weighted Average Useful Life | Preliminary Recorded Value | Measurement Period Adjustments | Final Recorded Value | ||||||||||
Customer relationships | 10 years | $ | 45,800 | $ | — | $ | 45,800 | ||||||
Tradename | 10 years | 8,300 | — | 8,300 | |||||||||
Technology | 5 years | 2,600 | 300 | 2,900 | |||||||||
Non-compete agreements | 3 years | 820 | — | 820 | |||||||||
Total intangible assets | $ | 57,520 | $ | 300 | $ | 57,820 | |||||||
Acquisition-related costs were expensed as incurred. For the year ended December 31, 2015, the Company incurred acquisition-related costs of $1.5 million, respectively, recognized within “General and administrative” expenses in the accompanying consolidated statements of operations.
Avalere Results and Pro Forma Impact of Acquisition
The following table presents revenue and loss before taxes of Avalere since the acquisition date, September 1, 2015, included in the consolidated statements of operations (in thousands):
Year Ended December 31, 2015 | |||
Revenue | $ | 17,492 | |
Loss before taxes | $ | (29 | ) |
F-19
Inovalon Holdings, Inc.
Notes to Consolidated Financial Statements (Continued)
3. BUSINESS COMBINATIONS (Continued)
The following table presents pro forma information, based on estimates and assumptions that the Company believes to be reasonable, for the Company as if the acquisition of Avalere had occurred at the beginning of the earliest period presented (unaudited, in thousands):
Year Ended December 31, | |||
2015 | |||
Pro forma revenue | $ | 469,784 | |
Pro forma income before taxes | $ | 108,977 | |
The pro forma information provided in the table above is not necessarily indicative of the consolidated results of operations for future periods or the results that actually would have been realized had the acquisition been completed at the beginning of the periods presented.
4. NET INCOME PER SHARE
During September 2014, the Company completed a holding company reorganization. As part of the reorganization, the Company implemented a multi-class stock structure. The Company presents the impact on net income per share (“EPS”) by calculating EPS based on the authorized, issued and outstanding shares of Class A and Class B common stock. Holders of all outstanding classes of common stock participate ratably in earnings on an identical per share basis as if all shares were a single class.
The Company has issued RSAs of Class A common stock under the 2015 Omnibus Incentive Plan. The Company considers issued and unvested RSAs to be participating securities as the holders of these RSAs have a non-forfeitable right to dividends in the event of the Company’s declaration of a dividend on shares of Class A and Class B common stock. Subsequent to the issuance of the participating securities, the Company applied the two-class method required in calculating net income per share of Class A and Class B common stock.
Undistributed net income for a given period is apportioned to participating securities based on the weighted-average shares of each class of common stock outstanding during the applicable period as a percentage of the total weighted-average shares outstanding during the same period.
Under the two-class method, net income attributable to common stockholders is determined by allocating undistributed earnings, calculated as net income, less earnings attributable to participating securities. The net income per share attributable to common stockholders is allocated based on the contractual participation rights of the Class A common stock and Class B common stock as if the income for the period has been distributed. As the liquidation and dividend rights are identical for both classes of common stock, the net income attributable to common stockholders is allocated on a proportionate basis.
The Company has issued Class A common stock and Class B common stock. Holders of Class A common stock generally have the same rights, including rights to dividends, as holders of Class B common stock, except that holders of Class A common stock have one vote per share while holders of Class B common stock have ten votes per share. Each share of Class B common stock will convert into one share of Class A common stock immediately upon its sale or transfer. As such, basic and fully diluted earnings per share for Class A common stock and Class B common stock are the same.
Basic net income per share of common stock is computed by dividing the net income attributable to common stockholders by the weighted-average number of shares of common stock outstanding during the period. All participating securities are excluded from the basic weighted-average shares of common stock outstanding. Unvested RSAs are excluded from the calculation of the weighted-average shares of common stock until vesting occurs, as the restricted shares are subject to forfeiture and cancellation until vested. For purposes of the diluted net income per share attributable to common stockholders calculation, unvested shares of common stock resulting from RSAs are considered to be potentially dilutive shares of common stock.
Diluted net income per share attributable to common stockholders is computed by dividing net income attributable to common stockholders by the weighted-average shares outstanding, including potentially dilutive shares of common stock assuming the dilutive effect of potential shares of common stock for the period determined using the treasury stock method. Potentially dilutive securities also include stock options, restricted stock units, and shares to be purchased under the employee stock purchase plan. Under the treasury stock method, dilutive securities are assumed to be exercised at the beginning of the periods and as if funds obtained thereby were used to purchase common stock at the average market price during the period.
F-20
Inovalon Holdings, Inc.
Notes to Consolidated Financial Statements (Continued)
4. NET INCOME PER SHARE (Continued)
Securities are excluded from the computations of diluted net income per share if their effect would be anti-dilutive to earnings per share.
The numerators and denominators of the basic and diluted EPS computations, reconciliations of the weighted average shares outstanding, and resulting basic and diluted earnings per share for our common stock are calculated as follows (in thousands, except per share amounts):
Year Ended December 31, | |||||||||||
2017 | 2016 | 2015 | |||||||||
Basic | |||||||||||
Numerator: | |||||||||||
Net income | $ | 34,818 | $ | 27,104 | $ | 66,063 | |||||
Undistributed earnings allocated to participating securities | (990 | ) | (161 | ) | (49 | ) | |||||
Net income attributable to common stockholders—basic | $ | 33,828 | $ | 26,943 | $ | 66,014 | |||||
Denominator: | |||||||||||
Weighted average shares used in computing net income per share attributable to common stockholders—basic | 142,225 | 150,048 | 145,745 | ||||||||
Net income per share attributable to common stockholders—basic | $ | 0.24 | $ | 0.18 | $ | 0.45 | |||||
Diluted | |||||||||||
Numerator: | |||||||||||
Net income attributable to common stockholders—diluted | $ | 33,828 | $ | 26,943 | $ | 66,014 | |||||
Denominator: | |||||||||||
Number of shares used for basic EPS computation | 142,225 | 150,048 | 145,745 | ||||||||
Effect of dilutive securities | 512 | 907 | 2,530 | ||||||||
Weighted average shares used in computing net income per share attributable to common stockholders—diluted | 142,737 | 150,955 | 148,275 | ||||||||
Net income per share attributable to common stockholders—diluted | $ | 0.24 | $ | 0.18 | $ | 0.45 | |||||
The computation of diluted EPS does not include certain awards, on a weighted average basis, for the years ended December 31, 2017, 2016, and 2015, respectively, because their inclusion would have an anti-dilutive effect on EPS. The awards excluded because of their anti-dilutive effect are as follows (in thousands):
Year Ended December 31, | ||||||||
2017 | 2016 | 2015 | ||||||
Awards excluded from the computation of diluted net income per share because their inclusion would have been anti-dilutive | 88 | 44 | 645 | |||||
5. SHORT-TERM INVESTMENTS
As of December 31, 2017, short-term investments consisted of the following (in thousands):
Amortized Cost | Gross Unrealized Gains | Gross Unrealized Losses | Estimated Fair Value | ||||||||||||
Available-for-sale securities: | |||||||||||||||
Corporate notes and bonds | $ | 232,048 | $ | 3 | $ | (572 | ) | $ | 231,479 | ||||||
U.S. agency obligations | 15,341 | — | (99 | ) | 15,242 | ||||||||||
U.S. treasury securities | 20,735 | — | (168 | ) | 20,567 | ||||||||||
Total available-for-sale securities | $ | 268,124 | $ | 3 | $ | (839 | ) | $ | 267,288 | ||||||
F-21
Inovalon Holdings, Inc.
Notes to Consolidated Financial Statements (Continued)
5. SHORT-TERM INVESTMENTS (Continued)
As of December 31, 2016, short-term investments consisted of the following (in thousands):
Amortized Cost | Gross Unrealized Gains | Gross Unrealized Losses | Estimated Fair Value | ||||||||||||
Available-for-sale securities: | |||||||||||||||
Corporate notes and bonds | $ | 349,571 | $ | 36 | $ | (918 | ) | $ | 348,689 | ||||||
U.S. agency obligations | 34,864 | 22 | (78 | ) | 34,808 | ||||||||||
U.S. treasury securities | 53,681 | 6 | (100 | ) | 53,587 | ||||||||||
Commercial paper | 6,312 | — | (3 | ) | 6,309 | ||||||||||
Certificates of deposit | 1,921 | 1 | — | 1,922 | |||||||||||
Total available-for-sale securities | $ | 446,349 | $ | 65 | $ | (1,099 | ) | $ | 445,315 | ||||||
The following table summarizes the estimated fair value of our short-term investments, designated as available-for-sale and classified by the contractual maturity date of the securities as of the dates shown (in thousands):
December 31, | |||||||
2017 | 2016 | ||||||
Due in one year or less | $ | 204,725 | $ | 176,696 | |||
Due after one year through two years | 62,563 | 268,619 | |||||
Total | $ | 267,288 | $ | 445,315 | |||
The Company has certain available-for-sale securities in a gross unrealized loss position. The Company reviews its debt securities classified as short-term investments on a regular basis to evaluate whether or not any security has experienced an other-than-temporary decline in fair value. The Company considers factors such as the length of time and extent to which the market value has been less than the cost, the financial position and near-term prospects of the issuer and the Company’s intent to sell, or whether it is more likely than not the Company will be required to sell the investment before recovery of the investment’s amortized-cost basis. If the Company determines that an other-than-temporary decline exists, or if write downs related to credit losses are necessary, in one of these securities, the unrealized losses attributable to the respective investment would be reclassified to realized losses on short-term investments within the statement of operations. There were no impairments considered other-than-temporary as of December 31, 2017.
The following table shows the fair values and the gross unrealized losses of available-for-sale securities that were in a gross unrealized loss position, as of December 31, 2017, aggregated by investment category (in thousands):
Estimated Fair Value | Gross Unrealized Losses | ||||||
Corporate notes and bonds | $ | 223,088 | $ | (572 | ) | ||
U.S. agency obligations | 15,242 | (99 | ) | ||||
U.S. treasury securities | 20,567 | (168 | ) | ||||
$ | 258,897 | $ | (839 | ) | |||
F-22
Inovalon Holdings, Inc.
Notes to Consolidated Financial Statements (Continued)
6. FAIR VALUE MEASUREMENTS
The following table presents the fair value hierarchy for financial assets and liabilities measured at fair value on a recurring basis as of December 31, 2017 (in thousands):
Level 1 | Level 2 | Level 3 | Total | ||||||||||||
Cash Equivalents: | |||||||||||||||
Money market funds | $ | 162,347 | $ | — | $ | — | $ | 162,347 | |||||||
Short-term investments: | |||||||||||||||
Corporate notes and bonds | — | 231,479 | — | 231,479 | |||||||||||
U.S. agency obligations | — | 15,242 | — | 15,242 | |||||||||||
U.S. treasury securities | — | 20,567 | — | 20,567 | |||||||||||
Other Current Liabilities: | |||||||||||||||
Contingent consideration | — | — | (7,400 | ) | (7,400 | ) | |||||||||
Total | $ | 162,347 | $ | 267,288 | $ | (7,400 | ) | $ | 422,235 | ||||||
The following table presents the fair value hierarchy for financial assets and liabilities measured at fair value on a recurring basis as of December 31, 2016 (in thousands):
Level 1 | Level 2 | Level 3 | Total | ||||||||||||
Cash Equivalents: | |||||||||||||||
Money market funds | $ | 44,108 | $ | — | $ | — | $ | 44,108 | |||||||
Short-term investments: | |||||||||||||||
Corporate notes and bonds | — | 348,689 | — | 348,689 | |||||||||||
U.S. agency obligations | — | 34,808 | — | 34,808 | |||||||||||
U.S. treasury securities | — | 53,587 | — | 53,587 | |||||||||||
Commercial paper | — | 6,309 | — | 6,309 | |||||||||||
Certificates of deposit | — | 1,922 | — | 1,922 | |||||||||||
Other Current Liabilities: | |||||||||||||||
Contingent consideration | — | — | (12,600 | ) | (12,600 | ) | |||||||||
Total | $ | 44,108 | $ | 445,315 | $ | (12,600 | ) | $ | 476,823 | ||||||
The Company determines the fair value of its security holdings based on pricing from its pricing vendors. The valuation techniques used to measure the fair value of financial instruments having Level 2 inputs were derived from non-binding consensus prices that are corroborated by observable market data or quoted market prices for similar instruments. Such market prices may be quoted prices in active markets for identical assets (Level 1 inputs) or pricing determined using inputs other than quoted prices that are observable either directly or indirectly (Level 2 inputs). The Company performs procedures to ensure that appropriate fair values are recorded such as comparing prices obtained from other sources.
The following table presents our financial instruments measured at fair value using unobservable inputs (Level 3) as of the years ended December 31 (in thousands):
Fair Value Measurements Using Unobservable Inputs (Level 3) | |||||||
2017 | 2016 | ||||||
Balance, beginning of period | $ | (12,600 | ) | $ | (2,300 | ) | |
Fair value adjustment (recognized in general and administrative expenses) | 5,200 | — | |||||
Accretion expense (recognized in general and administrative expenses) | — | (706 | ) | ||||
Settlement (payment) of liability | — | 3,006 | |||||
Contingent consideration attributable to Creehan acquisition | — | (12,600 | ) | ||||
Total | $ | (7,400 | ) | $ | (12,600 | ) | |
F-23
Inovalon Holdings, Inc.
Notes to Consolidated Financial Statements (Continued)
7. PROPERTY, EQUIPMENT AND CAPITALIZED SOFTWARE
Property, equipment and capitalized software consisted of the following (in thousands):
December 31, | |||||||
2017 | 2016 | ||||||
Office and computer equipment | $ | 55,840 | $ | 42,530 | |||
Leasehold improvements | 10,096 | 12,480 | |||||
Purchased software | 26,425 | 14,421 | |||||
Capitalized software | 114,569 | 83,877 | |||||
Furniture and fixtures | 4,670 | 5,403 | |||||
Land | 390 | 390 | |||||
Buildings | 14,028 | 1,797 | |||||
Work in process | 16,323 | 3,966 | |||||
Total | 242,341 | 164,864 | |||||
Less: accumulated depreciation and amortization | (116,573 | ) | (88,444 | ) | |||
Property, equipment and capitalized software, net | $ | 125,768 | $ | 76,420 | |||
The Company leases certain office equipment under capital lease agreements, with bargain purchase options at the end of the lease term. Leased office equipment included in property and equipment at December 31, 2017 and 2016 was $0.6 million and $0.7 million, respectively.
The Company leases certain office space under a lease agreement that was determined to be a capital lease. This capital lease is classified as buildings within property and equipment. The total net amount of the capital lease as of December 31, 2017 was $12.0 million. There were no leases of office spaces that were determined to be capital leases in 2016.
Depreciation expense for the years ended December 31, 2017, 2016, and 2015 was $37.9 million, $28.1 million, and $19.2 million, respectively. Amortization of the capital leases included in depreciation expense was $0.3 million, $0.1 million, and $0.1 million, for the years ended December 31, 2017, 2016, and 2015, respectively. At December 31, 2017 and 2016, the Company had unamortized capitalized software costs, including costs classified as work in progress, of $54.2 million and $40.9 million, respectively.
At December 31, 2017 and 2016, work in process consisted primarily of purchased software licenses, computer equipment, and capitalized software, which was not placed into service.
8. GOODWILL AND INTANGIBLE ASSETS
Goodwill
Goodwill is primarily derived from the Company’s acquisitions of Creehan in 2016, Avalere in 2015, Catalyst Information Technologies, Inc. in 2009, and Medical Reliance Group, Inc. in 2006. Refer to Note 2 for a discussion of our accounting policy. Refer to Note 3 for further information regarding the goodwill that arose from the Company’s acquisition of Creehan during 2016 and Avalere during 2015.
The following table summarizes the activity related to the carrying value of our goodwill during the years ended December 31, 2017 and 2016 (in thousands):
Goodwill as of January 1, 2016 | $ | 137,733 | |
Adjustments recorded in connection with the acquisition of Avalere(1) | (4,163 | ) | |
Goodwill recorded in connection with the acquisition of Creehan | 50,987 | ||
Goodwill as of December 31, 2016 | 184,557 | ||
Adjustments recorded in connection with the acquisition of Creehan(2) | 375 | ||
Goodwill as of December 31, 2017 | $ | 184,932 | |
______________________________________
(1) | During 2016, the Company adjusted certain assets and liabilities related to the finalization of tax returns for Avalere and prefunded escrow-related amounts related to the settlement of a contingent consideration earn-out that was successfully achieved by Avalere. The adjustments had no impact on the Company’s revenues or expenses. Based on our assessments of |
F-24
Inovalon Holdings, Inc.
Notes to Consolidated Financial Statements (Continued)
8. GOODWILL AND INTANGIBLE ASSETS (Continued)
qualitative and quantitative factors, the adjustments were not considered to be material to our consolidated financial statements, individually or in the aggregate, to any previously issued consolidated financial statements.
(2) | During 2017, the Company finalized the working capital adjustments for Creehan. The adjustments had no impact on the Company’s revenues or expenses. Based on our assessments of qualitative and quantitative factors, the adjustments were not considered to be material to our consolidated financial statements, individually or in the aggregate, to any previously issued consolidated financial statements. |
Intangible Assets
Intangible assets at December 31, 2017 and 2016 were as follows (in thousands):
December 31, 2017 | ||||||||||||||
Gross | Accumulated Amortization | Net | Weighted Average Remaining Useful Life (years) | |||||||||||
Proprietary software technologies | $ | 16,077 | $ | (16,077 | ) | $ | — | — | ||||||
Trademark | 360 | (360 | ) | — | — | |||||||||
Database | 6,500 | (5,362 | ) | 1,138 | 1.8 | |||||||||
Customer relationships | 13,650 | (10,698 | ) | 2,952 | 7.4 | |||||||||
Avalere acquisition (see Note 3): | ||||||||||||||
Customer Relationships | 45,800 | (10,687 | ) | 35,113 | 7.8 | |||||||||
Tradename | 8,300 | (1,937 | ) | 6,363 | 7.8 | |||||||||
Technology | 2,900 | (1,353 | ) | 1,547 | 2.7 | |||||||||
Non-compete agreements | 820 | (638 | ) | 182 | 0.7 | |||||||||
Creehan acquisition (see Note 3): | ||||||||||||||
Customer Relationships | 36,500 | (5,703 | ) | 30,797 | 6.9 | |||||||||
Tradename | 4,000 | (1,250 | ) | 2,750 | 2.8 | |||||||||
Technology | 8,800 | (2,750 | ) | 6,050 | 2.8 | |||||||||
In-Process R&D | 1,600 | — | 1,600 | Indefinite | ||||||||||
CCS acquisition (see Note 3): | ||||||||||||||
Technology | 800 | (133 | ) | 667 | 2.5 | |||||||||
Tradename | 200 | (33 | ) | 167 | 2.5 | |||||||||
Total | $ | 146,307 | $ | (56,981 | ) | $ | 89,326 | |||||||
F-25
Inovalon Holdings, Inc.
Notes to Consolidated Financial Statements (Continued)
8. GOODWILL AND INTANGIBLE ASSETS (Continued)
December 31, 2016 | ||||||||||||||
Gross | Accumulated Amortization | Net | Weighted Average Remaining Useful Life (years) | |||||||||||
Proprietary software technologies | $ | 16,077 | $ | (16,077 | ) | $ | — | — | ||||||
Trademark | 360 | (360 | ) | — | — | |||||||||
Database | 6,500 | (4,713 | ) | 1,787 | 2.8 | |||||||||
Customer relationships | 13,650 | (10,304 | ) | 3,346 | 8.4 | |||||||||
Avalere acquisition (see Note 3): | ||||||||||||||
Customer Relationships | 45,800 | (6,107 | ) | 39,693 | 8.8 | |||||||||
Tradename | 8,300 | (1,107 | ) | 7,193 | 8.8 | |||||||||
Technology | 2,900 | (773 | ) | 2,127 | 3.7 | |||||||||
Non-compete agreements | 820 | (364 | ) | 456 | 1.7 | |||||||||
Creehan acquisition (see Note 3): | ||||||||||||||
Customer Relationships | 36,500 | (1,147 | ) | 35,353 | 7.9 | |||||||||
Tradename | 4,000 | (250 | ) | 3,750 | 3.8 | |||||||||
Technology | 8,800 | (556 | ) | 8,244 | 3.8 | |||||||||
In-Process R&D | 1,600 | — | 1,600 | Indefinite | ||||||||||
Total | $ | 145,307 | $ | (41,758 | ) | $ | 103,549 | |||||||
Amortization expense for the years ended December 31, 2017, 2016, and 2015 was $15.2 million, $9.2 million, and $3.4 million, respectively.
Estimated future amortization expense of intangible assets, based upon the Company’s intangible assets at December 31, 2017, is as follows (in thousands):
Amount | |||
Year ending December 31: | |||
2018 | $ | 15,312 | |
2019 | 14,967 | ||
2020 | 13,320 | ||
2021 | 10,366 | ||
2022 | 10,366 | ||
Thereafter | 23,395 | ||
Total | $ | 87,726 | |
9. CREDIT FACILITIES
On September 19, 2014, the Company entered into a Credit and Guaranty Agreement (“Credit Agreement”), with a group of lenders including Goldman Sachs Bank USA, as administrative agent, to provide credit facilities in the aggregate maximum principal amount of $400.0 million, consisting of a senior unsecured term loan facility in the original principal amount of $300.0 million (the “Term Loan Facility”), and a senior unsecured revolving credit facility in the maximum principal amount of $100.0 million (the “Revolving Credit Facility” and, the “Credit Facilities”).
F-26
Inovalon Holdings, Inc.
Notes to Consolidated Financial Statements (Continued)
9. CREDIT FACILITIES (Continued)
The Credit Facilities consisted of the following (in thousands):
December 31, 2017 | December 31, 2016 | ||||||
Revolving Credit Facility | $ | — | $ | — | |||
Term Loan Facility | 236,250 | 266,250 | |||||
Total Credit Facilities | 236,250 | 266,250 | |||||
Less: current portion | 45,000 | 30,000 | |||||
Non-current Credit Facilities | $ | 191,250 | $ | 236,250 | |||
The revolving credit facility became available to the Company on February 18, 2015, upon the consummation of its IPO.
The Company’s borrowing rate under the Credit Facilities is dependent on whether the Company elects Eurodollar loans or base rate loans. Interest accrues on Eurodollar loans at a defined Eurodollar rate, defined as the London Interbank Offer Rate (“LIBOR”) plus the applicable margin of 1.25%, as defined in the Credit Agreement. Interest is payable monthly in arrears.
The Credit Facility requires the Company to comply with specified financial covenants, including the maintenance of a $50.0 million minimum cash and cash equivalents balance as of each calendar quarter end. The minimum cash and cash equivalents balance is not required to be held with any of the group of lenders and may be commingled with the Company’s operating funds. The Credit Facility also contains various covenants, including affirmative covenants with respect to certain reporting requirements and maintaining certain business activities, and negative covenants that, among other things, may limit or impose restrictions on the Company’s ability to incur liens, incur additional indebtedness, make investments, make acquisitions and undertake certain additional actions. As of, and during, the year ended December 31, 2017, the Company was in compliance with the financial covenants under the Credit Agreement.
Scheduled maturity of the Credit Facilities follows (in thousands):
Amount | |||
2018 | $ | 45,000 | |
2019 | 191,250 | ||
Total | $ | 236,250 | |
10. COMMITMENTS AND CONTINGENCIES
Operating Leases—The Company leases office space and co-located data center facilities under operating lease arrangements, some of which contain renewal options. Future non-cancellable lease payments as of December 31, 2017 are as follows (in thousands):
Amount | |||
Year ending December 31, | |||
2018 | $ | 7,286 | |
2019 | 6,571 | ||
2020 | 3,200 | ||
2021 | 1,939 | ||
2022 | 1,939 | ||
Thereafter | 12,602 | ||
Total | $ | 33,537 | |
Total expense under operating leases was $11.3 million, $8.9 million, and $7.2 million, during the years ended December 31, 2017, 2016, and 2015, respectively. Certain operating leases contain rent escalation clauses, which are recorded on a straight-line basis over the initial term of the lease, with the difference between the rent paid and the straight-line rent recorded as a deferred rent liability. Lease incentives received from landlords are recorded as deferred rent liabilities and are amortized on a straight-line basis over the lease term as a reduction to rent expense. The deferred rent liability was $2.0 million and $2.5 million at December 31, 2017 and 2016, respectively.
F-27
Inovalon Holdings, Inc.
Notes to Consolidated Financial Statements (Continued)
10. COMMITMENTS AND CONTINGENCIES (Continued)
Capital Leases—The total capital lease liability at December 31, 2017 and 2016 was $12.4 million and $0.3 million, respectively. Future minimum lease payments as of December 31, 2017 are as follows (in thousands):
Amount | |||
Year ending December 31, | |||
2018 | $ | 458 | |
2019 | 1,015 | ||
2020 | 1,051 | ||
2021 | 1,090 | ||
2022 | 1,182 | ||
Thereafter | 10,091 | ||
Total minimum lease payments | 14,887 | ||
Less amount representing interest | (2,442 | ) | |
Present value of minimum lease payments | $ | 12,445 | |
Legal Proceedings—From time to time the Company is involved in various litigation matters arising out of the normal course of business. The Company consults with legal counsel on those issues related to litigation and seeks input from other experts and advisors with respect to such matters. Estimating the probable losses or a range of probable losses resulting from litigation, government actions and other legal proceedings is inherently difficult and requires an extensive degree of judgment, particularly where the matters involve indeterminate claims for monetary damages, may involve discretionary amounts, present novel legal theories, are in the early stages of the proceedings, or are subject to appeal. Whether any losses, damages or remedies ultimately resulting from such matters could reasonably have a material effect on the Company’s business, financial condition, results of operations, or cash flows will depend on a number of variables, including, for example, the timing and amount of such losses or damages (if any) and the structure and type of any such remedies. The Company’s management does not presently expect any litigation matters to have a material adverse impact on the condensed consolidated financial statements of the Company.
On June 24, 2016, a purported securities class action complaint (Xiang v. Inovalon Holdings, Inc., et.al., No. 1:16-cv-04923) was filed in the United States District Court for the Southern District of New York against the Company, certain officers, directors and underwriters in the Company’s initial public offering (the “Complaint”). The Complaint was brought on behalf of a purported class consisting of all persons or entities who purchased shares of the Company’s Class A common stock pursuant or traceable to the Registration Statement relating to the Company’s initial public offering on February 18, 2015. The Complaint asserted violations of Sections 11 and 15 of the Securities Act based on allegedly false or misleading statements and omissions with respect to, among other things, the Company’s revenues from sales in the city and state of New York and the Company’s effective tax rate. The Complaint sought certification as a class action and unspecified compensatory damages plus interest and attorneys’ fees. On June 28, 2016, a nearly identical complaint was filed in the same court captioned Patel v. Inovalon Holdings, Inc., et. al., No. 1:16-cv-05065. On July 5, 2016, the court consolidated the Xiang and Patel actions. On September 20, 2016, the court appointed a lead plaintiff and lead counsel. On December 21, 2016, lead plaintiff filed a consolidated class action complaint (the “Amended Complaint”) purporting to assert violations of Sections 11, 12(a)(2), and 15 of the Securities Act of 1933, as amended, based on allegedly false or misleading statements and omissions with respect to substantially the same topics as alleged in the Complaint. On February 21, 2017, and as required by the court’s individual practices, the Company invoked the pre-motion process required prior to filing a motion to dismiss. On May 23, 2017, the court issued a decision and order construing the pre-motion letter submitted by the defendants as a motion to dismiss, granting dismissal of the Section 12 claims against the individual defendants, but denying dismissal of the remaining claims. On June 6, 2017, defendants filed a joint motion for reconsideration and supporting memorandum of law seeking reconsideration of the court’s decision and arguing that plaintiff’s claims are time-barred. Also on June 6, 2017, defendants submitted a letter to the court requesting, in the alternative to the motion for reconsideration, a pre-motion conference concerning defendants’ anticipated motion for certification of an interlocutory appeal to resolve a controlling question of law. On July 11, 2017, the Company and its officers and directors filed their answer to the Amended Complaint denying that plaintiffs are entitled to any relief. On July 28, 2017, the court issued a decision and order denying both the motion for reconsideration and defendant’s request for an interlocutory appeal. On January 22, 2018, lead plaintiff filed its motion for class certification, and on February 12, 2018, defendants filed an opposition to such motion for class certification, which motion remains pending. The parties presently are engaged in discovery. The court has set October 22, 2018 as the deadline for the completion of all discovery. In light of, among other things, the early stage of the litigation, the Company is unable to predict the outcome of these
F-28
Inovalon Holdings, Inc.
Notes to Consolidated Financial Statements (Continued)
10. COMMITMENTS AND CONTINGENCIES (Continued)
consolidated actions and is unable to make a meaningful estimate of the amount or range of loss, if any, that could result from this proceeding.
On June 29, 2017, Virginia Rodriquez filed a putative shareholder derivative suit in the Supreme Court of the State of New York, County of Westchester, against certain of the Company’s present and former directors and officers (the “Derivative Complaint”). The Company was named as a nominal defendant. The Derivative Complaint makes allegations similar to the allegations in the securities class action Amended Complaint described above and asserts claims for breach of fiduciary duty, unjust enrichment, abuse of control and gross mismanagement, and seeks unspecified damages, an order directing the Company “to reform and improve” certain corporate governance and internal procedures, restitution from the defendants and disgorgement of all profits, benefits and other compensation received and costs and disbursements incurred in connection with the action, including attorneys’ fees. On September 12, 2017, the Company and the individual defendants filed a joint motion to dismiss the Derivative Complaint. As directed by the court, the parties submitted memoranda of law concerning only the forum selection provision contained in the Company’s Second Amended and Restated Certificate of Incorporation. On December 27, 2017, the court issued a decision and order granting the defendants’ joint motion to dismiss plaintiff’s Derivative Complaint on the basis of the forum selection provision.
11. STOCK-BASED COMPENSATION
On December 31, 2006, the Company and its stockholders established the 2007 Long-Term Incentive Plan (the “2007 Plan”), under which the Company’s Board of Directors, at its discretion, could grant stock options to employees and certain directors of the Company. During 2009, the Plan was amended and currently authorizes the grant of stock options or other equity instruments for up to 10,275,000 shares of common stock. The stock-based awards granted under the Plan generally expire at the earlier of a specified period after termination of service or the date specified by the Board of Directors at the date of grant, but not more than ten years from such grant date. Stock issued as a result of exercised stock options will be issued from the Company’s authorized available stock. Effective June 5, 2012, the 2007 Long-Term Incentive Plan changed its name to the Inovalon, Inc. 2007 Long-Term Incentive Plan. Options granted under the Plan may be incentive stock options or non-qualified stock options under the applicable provisions of the Internal Revenue Code. The 2007 Long-Term Incentive Plan was terminated upon completion of the IPO. Awards granted under the 2007 Long-Term Incentive Plan will remain outstanding until the earlier of exercise, forfeiture, cancellation or expiration.
On February 18, 2015, the date of the completion of the Company’s IPO, the Company’s 2015 Omnibus Incentive Plan (the “2015 Plan”) became effective. The 2015 Plan provides for the grant of incentive stock options, within the meaning of Section 422 of the Internal Revenue Code of 1986, as amended (the “Code”), to the Company’s employees and any parent and subsidiary employees, and for the grant of non-qualified stock options, stock appreciation rights, restricted stock, RSAs, RSUs, dividend equivalent rights, cash-based awards (including annual cash incentives and long-term cash incentives), and any combination thereof to the Company’s employees, directors, and consultants and to employees, directors, and consultants of certain affiliated entities. The Company reserved for issuance under the 2015 Plan shares of its Class A common stock equal to the sum of: (i) 7,335,430 shares of Class A common stock; and (ii) the number of shares of its Class A common stock underlying awards granted under the Company’s 2007 Long-Term Incentive Plan, which was terminated upon completion of the IPO, that are forfeited, canceled, or expire (whether voluntarily or involuntarily).
Stock Options
The Company uses the Black-Scholes option-pricing model to determine the estimated fair value for stock option awards. The Black-Scholes option-pricing model requires the use of estimates, including the fair market value of the Company’s common stock prior to the Company’s IPO, expected stock price volatility, expected term, estimated forfeitures and the risk-free interest rate. The fair value of stock option awards is amortized on a straight-line basis over the requisite service period of the awards, which is generally the vesting period.
Prior to the Company’s IPO, determining the fair value of the Company’s common stock required complex and subjective judgment and estimates. There is inherent uncertainty in making these judgments and estimates. Since the Company’s share price was not publicly quoted and lacked an active trading market prior to the Company’s IPO in February 2015, the Company’s Compensation Committee was required to estimate the fair value of the common stock at each meeting at which options were granted based on factors including, but not limited to, contemporaneous valuations of the Company’s common stock performed by an unrelated third-party specialist, the lack of marketability of the Company’s common stock, developments in the business, share repurchase arrangements, the status of the Company’s development and sales efforts, revenue growth, valuations of comparable companies, and additional objective and subjective factors relating to the Company’s business.
F-29
Inovalon Holdings, Inc.
Notes to Consolidated Financial Statements (Continued)
11. STOCK-BASED COMPENSATION (Continued)
Expected volatility was calculated as of each grant date based on reported data for several unrelated public companies within the Company’s industry that are considered to be comparable to the Company and for which historical information was available. The average expected term was determined under the simplified calculation as provided by the Securities and Exchange Commission’s Staff Accounting Bulletin No. 107, Share-Based Payment, which is the mid-point between the vesting date and the end of the contractual term. The dividend yield assumption of zero was based upon the fact that the Company does not have a formal dividend payment policy, the Company does not intend to pay cash dividends on its common stock in the future, and, to the extent the Company pays dividends in the future, there is no assurance that any such dividends will be comparable to those previously declared. Any declarations of dividends and the establishment of future record and payment dates are subject to the final determination of the Company’s Board of Directors. The risk-free interest rate was determined by reference to the U.S. Treasury yield curve rates with the remaining term commensurate with the expected life assumed at the date of grant. Forfeitures are recorded as adjustments to expense as they occur.
The Company did not grant any options during the years ended December 31, 2017, 2016 and 2015. Stock option activity is as follows:
Number of Shares Outstanding | Weighted- Average Exercise Price | Weighted- Average Grant-date Fair Value of Underlying Common Stock | Weighted- Average Remaining Contractual Life (in years) | Aggregate Intrinsic Value (in thousands) | |||||||||||
Balance at January 1, 2017 | 2,184,281 | $ | 7.32 | 5.7 | $ | 6,514 | |||||||||
Stock options granted | — | $ | — | — | |||||||||||
Stock options exercised | (660,868 | ) | $ | 7.13 | |||||||||||
Stock options cancelled | (210,103 | ) | $ | 6.97 | |||||||||||
Balance at December 31, 2017 | 1,313,310 | $ | 7.47 | 5.4 | $ | 9,895 | |||||||||
Exercisable at December 31, 2017 | 782,710 | $ | 7.48 | 4.7 | $ | 5,886 | |||||||||
Vested and expected to vest at December 31, 2017 | 1,313,310 | $ | 7.47 | 5.4 | $ | 9,895 | |||||||||
As of December 31, 2017, there is $2.8 million of total unrecognized compensation expense related to unvested stock options, and this expense is expected to be recognized over a weighted-average period of 1.4 years.
The aggregate intrinsic value in the table above represents the total intrinsic value (the difference between the fair value of the Company’s common stock and the exercise price, multiplied by the number of in-the-money options) that would have been received by the option holders had all option holders exercised their options. This amount is subject to change based on changes to the fair market value of the Company’s common stock. The total intrinsic value of options exercised during the years ended December 31, 2017, 2016 and 2015 was $4.2 million, $7.7 million, and $53.4 million, respectively.
Restricted Stock Units
In November 2014, the Company began issuing RSUs pursuant to the 2007 Plan. The Company uses the fair market value of the underlying common stock on the date of grant to determine the fair value of RSUs. The RSUs vest upon the satisfaction of both a service condition and a liquidity condition. The service condition for these awards is satisfied over five years. The liquidity condition is satisfied upon the occurrence of a qualifying event, defined as a change of control transaction or six months following the completion of the Company’s IPO. As of December 31, 2014, no stock-based compensation expense had been recognized for these RSUs because the qualifying events (described above) had not occurred. This six-month period following the IPO is not a substantive service condition and, accordingly, in 2015, the year in which the Company consummated its IPO, the Company recognized cumulative stock-based compensation expense for the portion of the RSUs that had met the service condition as of that date, following the straight-line method, net of estimated forfeitures. All remaining unrecognized stock-based compensation expense related to these RSUs is recorded over the remaining requisite service period using the straight-line method.
During 2015, the Company began granting RSUs pursuant to the 2015 Plan. These awards vest ratably over five years on each anniversary of the grant date. Upon vesting, the Company will deliver to the holder shares of the Company’s Class A common stock under the 2015 Plan. Pursuant to the terms of the awards, any unvested shares terminate upon the RSU holders’ separation from the Company. The Company recognizes stock-based compensation expense ratably over the requisite service period and records adjustments related to forfeitures as they occur.
F-30
Inovalon Holdings, Inc.
Notes to Consolidated Financial Statements (Continued)
11. STOCK-BASED COMPENSATION (Continued)
A summary of RSU activity is as follows:
Number of RSUs | Weighted Average Fair Value Per Unit | |||||
RSUs granted and unvested at January 1, 2017 | 293,489 | $ | 21.85 | |||
RSUs granted during 2017 | 45,625 | 13.70 | ||||
RSUs vested during 2017 | (87,444 | ) | 21.54 | |||
RSUs forfeited during 2017 | (30,732 | ) | 24.42 | |||
RSUs granted and unvested at December 31, 2017 | 220,938 | $ | 19.94 | |||
The weighted-average fair value of RSUs granted during the years ended December 31, 2017, 2016 and 2015 was $13.70, $0.00 and $30.64, respectively. During the years ended December 31, 2017, 2016 and 2015, these awards had an aggregate grant date fair value of $0.6 million, $0.0 million and $2.3 million, respectively. The total fair value of RSUs vested during the years ended December 31, 2017, 2016 and 2015 was $1.3 million, $1.5 million and $1.7 million, respectively. As of December 31, 2017, there was a total of $3.6 million in unrecognized compensation cost related to unvested RSUs, which are expected to be recognized over a weighted-average period of approximately 1.8 years.
Restricted Stock Awards
During 2015, the Company began granting RSAs pursuant to the 2015 Plan. RSAs granted to directors fully vest upon the one year anniversary of the award grant date, and RSAs granted to employees vest ratably over five years on each anniversary of the grant date. Upon vesting, the Company will deliver shares of the Company’s Class A common stock to the holders. Pursuant to the terms of the awards, any unvested shares terminate upon the RSA holders’ separation from the Company. The Company recognizes stock-based compensation expense for the RSAs following the straight-line method over the requisite service period. The Company records adjustments related to forfeitures as they occur.
In March 2017, the Company began issuing RSAs with performance conditions under the 2015 Plan. The awards have vesting conditions tied to the achievement of specified performance conditions, which have target performance levels that span from three to five years. Upon the conclusion of the performance period, the performance level achieved will be measured and the ultimate number of shares that vest will be determined. Stock-based compensation expense for these awards is recorded ratably over their vesting period, depending on the specific terms of the award and the probability of achievement of the specified performance conditions. During 2017, the Company granted 2.6 million RSAs, of which 1.2 million had performance vesting conditions.
A summary of RSA activity is as follows:
Number of RSAs | Weighted Average Fair Value Per Unit | |||||
RSAs granted and unvested at January 1, 2017 | 2,836,860 | $ | 14.47 | |||
RSAs granted during 2017 | 2,648,102 | 12.64 | ||||
RSAs vested during 2017 | (621,851 | ) | 14.42 | |||
RSAs forfeited during 2017 | (261,479 | ) | 14.35 | |||
RSAs granted and unvested at December 31, 2017 | 4,601,632 | $ | 13.43 | |||
The weighted-average fair value of an RSA granted during the years ended December 31, 2017, 2016 and 2015 was $12.64, $13.81 and $18.79, respectively. During the years ended December 31, 2017, 2016 and 2015, these awards had an aggregate grant date fair value of $33.5 million, $36.9 million and $11.2 million, respectively. The total fair value of RSAs vested during the years ended December 31, 2017, 2016 and 2015 was $9.3 million, $3.0 million and $0, respectively. As of December 31, 2017, there was a total of $56.0 million in unrecognized compensation cost, net of estimated forfeitures, related to unvested RSAs, which are expected to be recognized over a weighted-average period of approximately 3.7 years.
Employee Stock Purchase Plan
On February 18, 2015, the date of the completion of the Company’s IPO, the 2015 Employee Stock Purchase Plan (“2015 ESPP”) became effective. The 2015 ESPP provides (i) for six months purchase periods (commencing each March 1 and
F-31
Inovalon Holdings, Inc.
Notes to Consolidated Financial Statements (Continued)
11. STOCK-BASED COMPENSATION (Continued)
September 1) and (ii) that the purchase price for shares of Class A common stock purchased under the 2015 ESPP will be 85% of the fair market value of the Company’s Class A common stock on the last day of the applicable offering period. Eligible employees are able to select a rate of payroll deduction between 1% and 15% of their base cash compensation subject to a maximum payroll deduction per offering period of $7,500. The 2015 ESPP is intended to qualify as an employee stock purchase plan under Section 423 of the Code. The Company reserved 1,833,857 shares of Class A common stock for issuance under the 2015 ESPP. The following table summarizes the ESPP activity during the years shown:
Year Ended December 31, | |||||||||||
2017 | 2016 | 2015 | |||||||||
Shares purchased and issued | 49,247 | 61,184 | 30,689 | ||||||||
Weighted average discounted price per share | $ | 11.08 | $ | 14.03 | $ | 18.61 | |||||
Stock-based compensation expense (in thousands) | $ | 154 | $ | 140 | $ | 156 | |||||
12. EMPLOYEE BENEFIT PLANS
On June 1, 2007, the Company adopted a 401(k) Profit Sharing Plan and Trust (“401(k) Plan”). The 401(k) Plan was amended on February 1, 2010. The amended 401(k) Plan allows employees to become eligible to participate upon the completion of 30 days of service. The Company matches employee contributions up to 4.0% of their compensation and the employer contributions vest immediately.
During the years ended December 31, 2017, 2016, and 2015, total expense recorded for the Company’s matching 401(k) contributions were $5.2 million, $5.2 million, and $4.2 million, respectively.
13. STOCKHOLDERS’ EQUITY (DEFICIT)
On February 18, 2015, the Company completed its initial public offering of 22,222,222 shares of Class A common stock and, upon the underwriters’ exercise of their option to purchase additional shares, issued an additional 3,142,581 shares of Class A common stock for a total of 25,364,803 shares issued (the “IPO”). All of the shares issued in the IPO were primary shares offered by the Company as none of the Company’s stockholders sold any shares in the IPO. The offering price of the shares sold in the IPO was $27.00 per share, resulting in net proceeds to the Company, after the underwriters’ discounts and commissions and other expenses, payable by the Company, of approximately $639.1 million.
On May 4, 2016, the Company announced that its Board of Directors authorized a program to repurchase up to $100.0 million of Inovalon’s Class A common stock through December 31, 2017. Repurchases under the Company’s share repurchase program have been made in open-market or privately negotiated transactions. The Company funded repurchases through a combination of cash on hand, cash generated by operations and sales of short-term investments, if needed. On November 2, 2016, the Company announced that its Board of Directors authorized an expansion of the share repurchase program to repurchase up to an additional $100.0 million of shares of Inovalon’s Class A Common Stock (bringing the total to $200.0 million) through December 31, 2017. The share repurchase program did not obligate the Company to acquire any particular amount of Class A common stock. During the years ended December 31, 2017 and 2016, the Company repurchased 7,111,190 and 7,508,985 Class A common shares for $93.6 million and $106.2 million, respectively, at an average cost of $13.16 and $14.15 per share, respectively, excluding commissions. The share repurchase program expired on December 31, 2017.
14. INCOME TAXES
In December 2017, the Tax Act was enacted which includes a number of changes to existing U.S. tax laws that impact the Company, most notably a reduction of the U.S. corporate income tax rate from 35% to 21% for tax years beginning after December 31, 2017. The Tax Act also provides for the acceleration of depreciation for certain assets placed into service after September 27, 2017 and prospective changes beginning in 2018, including repeal of the domestic manufacturing deduction, acceleration of tax revenue recognition, capitalization of research and development expenditures, additional limitations on executive compensation and limitations on the deductibility of interest. As a result of the reduction in the U.S. corporate income tax rate from 35% to 21% under the Tax Act, the Company revalued its ending net deferred tax liabilities at December 31, 2017 and recognized a $15.5 million tax benefit in the Company’s consolidated statement of operations for the year ended December 31, 2017. The tax benefit recognized may be impacted if additional guidance is released.
F-32
Inovalon Holdings, Inc.
Notes to Consolidated Financial Statements (Continued)
14. INCOME TAXES (Continued)
The provision for income taxes consisted of the following (in thousands):
Year Ended December 31, | |||||||||||
2017 | 2016 | 2015 | |||||||||
Current: | |||||||||||
Federal | $ | 2,194 | $ | 7,480 | $ | 31,351 | |||||
State | 2,162 | 5,788 | 10,937 | ||||||||
Foreign (Puerto Rico) | 78 | 267 | 574 | ||||||||
Total current provision | 4,434 | 13,535 | 42,862 | ||||||||
Deferred: | |||||||||||
Federal | (8,333 | ) | (1,533 | ) | 4,708 | ||||||
State | 1,668 | (207 | ) | 1,078 | |||||||
Total deferred provision | (6,665 | ) | (1,740 | ) | 5,786 | ||||||
Total provision for income taxes | $ | (2,231 | ) | $ | 11,795 | $ | 48,648 | ||||
The provision for income taxes reconciles to the amount computed by applying the federal statutory rate, 35.0%, to income before income taxes as follows (in thousands, except percentages):
Year Ended December 31, | ||||||||||||||||||||
2017 | 2016 | 2015 | ||||||||||||||||||
Expected federal income tax | 35.0 | % | $ | 11,406 | 35.0 | % | $ | 13,650 | 35.0 | % | $ | 40,149 | ||||||||
State income taxes, net of federal income tax effect | 8.0 | % | 2,606 | 7.4 | % | 2,859 | 6.8 | % | 7,753 | |||||||||||
Permanent items | 0.3 | % | 88 | (0.9 | )% | (357 | ) | 0.3 | % | 390 | ||||||||||
Research and development tax credits | (2.6 | )% | (850 | ) | (1.9 | )% | (756 | ) | (0.8 | )% | (864 | ) | ||||||||
Excess tax benefits and stock-based compensation | (0.7 | )% | (243 | ) | (3.0 | )% | (1,165 | ) | — | % | — | |||||||||
Acquisition-related tax adjustments | (1.4 | )% | (445 | ) | (4.3 | )% | (1,686 | ) | — | % | — | |||||||||
Enactment of the Tax Act | (47.4 | )% | (15,461 | ) | — | % | — | — | % | — | ||||||||||
Other | 2.0 | % | 668 | (2.0 | )% | (750 | ) | 1.1 | % | 1,220 | ||||||||||
Income tax expense | (6.8 | )% | $ | (2,231 | ) | 30.3 | % | $ | 11,795 | 42.4 | % | $ | 48,648 | |||||||
F-33
Inovalon Holdings, Inc.
Notes to Consolidated Financial Statements (Continued)
14. INCOME TAXES (Continued)
Deferred income taxes reflect the net tax effects of temporary differences between the carrying amounts of assets and liabilities for financial reporting purposes and the amounts used for income tax purposes. Significant components of the Company’s deferred tax assets and liabilities were as follows (in thousands):
December 31, | |||||||
2017 | 2016 | ||||||
Components of deferred tax assets and liabilities | |||||||
Deferred tax assets: | |||||||
Accrued expenses and reserves | $ | 313 | $ | 3,135 | |||
Stock-based compensation | 3,040 | 2,849 | |||||
Deferred rent | 581 | 987 | |||||
Net operating loss carryforwards | 2,654 | 1,047 | |||||
Other | 758 | 904 | |||||
Total deferred tax assets | 7,346 | 8,922 | |||||
Deferred tax liabilities: | |||||||
Intangibles | 9,568 | 18,046 | |||||
Property, equipment and capitalized software | 21,564 | 23,108 | |||||
Prepaids and other | 2,639 | 2,083 | |||||
Total deferred tax liabilities | 33,771 | 43,237 | |||||
Net deferred tax liabilities before valuation allowance | 26,425 | 34,315 | |||||
Valuation Allowance | 217 | 238 | |||||
Net deferred tax liabilities | $ | 26,642 | $ | 34,553 | |||
Uncertain Tax Positions—During the years ended December 31, 2017, 2016, and 2015, changes in the liability for gross uncertain tax position, including interest, totaled $0.1 million, $0.1 million, and $0.0 million, respectively. The following table presents the changes in uncertain tax position (in thousands).
2017 | 2016 | 2015 | |||||||||
Uncertain tax position | |||||||||||
January 1 | $ | 80 | $ | — | $ | — | |||||
Gross increase in tax positions in prior period | 291 | 80 | — | ||||||||
Gross decrease in tax positions in prior period | (160 | ) | — | — | |||||||
Gross increase in tax positions from acquisitions | — | — | — | ||||||||
Settlement | (211 | ) | — | — | |||||||
Lapse of statute of limitations | — | — | — | ||||||||
Uncertain tax position at December 31 | $ | — | $ | 80 | $ | — | |||||
Net Operating Losses (“NOL”) carryforwards —At December 31, 2017 and 2016, we had U.S. federal and state NOL carryforwards of approximately $3.3 million and $1.0 million, respectively. These NOL carryforwards will expire by 2037.
While the Company believes it has adequately provided for all tax positions, amounts asserted by taxing authorities could differ from the Company’s accrued position. Accordingly, additional provisions on federal, state and foreign tax-related matters could be recorded in the future as revised estimates are made or the underlying matters are settled or otherwise resolved.
The Company is subject to taxation by the United States of America, various United States of America jurisdictions, and Puerto Rico. The number of years with open tax audits varies depending on the tax jurisdiction.
F-34
INOVALON HOLDINGS, INC.
Schedule II
Valuation and Qualifying Accounts and Reserves
(in thousands)
Allowance for Accounts Receivable | |||||||||||||||||||
Balance at Beginning of Year | Additions Charged Against Revenue | Additions Charged to Cost and Expense | Deductions | Balance at End of Year | |||||||||||||||
Year Ended December 31, 2017 | $ | 3,782 | $ | 8,886 | $ | — | $ | (10,630 | ) | $ | 2,038 | ||||||||
Year Ended December 31, 2016 | $ | 1,022 | $ | 3,792 | $ | — | $ | (1,032 | ) | $ | 3,782 | ||||||||
Year Ended December 31, 2015 | $ | 1,827 | $ | 1,126 | $ | — | $ | (1,931 | ) | $ | 1,022 | ||||||||
F-35