Attached files
| file | filename |
|---|---|
| EX-32.2 - EXHIBIT 32.2 - FIRST DATA CORP | a123117exhibit322.htm |
| EX-32.1 - EXHIBIT 32.1 - FIRST DATA CORP | a123117exhibit321.htm |
| EX-31.2 - EXHIBIT 31.2 - FIRST DATA CORP | a123117exhibit312.htm |
| EX-31.1 - EXHIBIT 31.1 - FIRST DATA CORP | a123117exhibit311.htm |
| EX-23.2 - EXHIBIT 23.2 - FIRST DATA CORP | a123117exhibit232.htm |
| EX-23.1 - EXHIBIT 23.1 - FIRST DATA CORP | a123117exhibit231.htm |
| EX-21 - EXHIBIT 21 - FIRST DATA CORP | a123117exhibit21.htm |
| EX-3.2 - EXHIBIT 3.2 - FIRST DATA CORP | a123117exhibit32.htm |
UNITED STATES
SECURITIES AND EXCHANGE COMMISSION
Washington, D.C. 20549
FORM 10-K
ý ANNUAL REPORT PURSUANT TO SECTION 13 OR 15(d) OF THE SECURITIES EXCHANGE ACT OF 1934
For the fiscal year ended December 31, 2017
OR
o TRANSITION REPORT PURSUANT TO SECTION 13 OR 15(d) OF THE SECURITIES EXCHANGE ACT OF 1934
For the transition period from to
Commission file number 001-11073

FIRST DATA CORPORATION
DELAWARE | 47-0731996 | |
(State of incorporation) | (I.R.S. Employer Identification No.) | |
225 LIBERTY STREET, 29th FLOOR, NEW YORK, NEW YORK 10281
(Address of principal executive offices) (Zip Code)
Registrant’s telephone number, including area code (800) 735-3362
Securities registered pursuant to Section 12(b) of the Act: None
Securities registered pursuant to Section 12(g) of the Act: None
Indicate by check mark if the registrant is a well-known seasoned issuer, as defined in Rule 405 of the Securities Act. Yes ý No o
Indicate by check mark if the registrant is not required to file reports pursuant to Section 13 or 15(d) of the Act. Yes o No ý
Indicate by check mark whether the registrant (1) has filed all reports required to be filed by Section 13 or 15(d) of the Securities Exchange Act of 1934 during the preceding 12 months (or for such shorter period that the registrant was required to file such reports), and (2) has been subject to such filing requirements for the past 90 days. Yes ý No o
Indicate by check mark whether the registrant has submitted electronically and posted on its corporate Web site, if any, every Interactive Data File required to be submitted and posted pursuant to Rule 405 of Regulation S-T (§ 232.405 of this chapter) during the preceding 12 months (or for such shorter period that the registrant was required to submit and post such files). Yes ý No o
Indicate by check mark if disclosure of delinquent filers pursuant to Item 405 of Regulation S-K (§ 229.405 of this chapter) is not contained herein, and will not be contained, to the best of registrant’s knowledge, in definitive proxy or information statements incorporated by reference in Part III of this Form 10-K or any amendment to this Form 10-K. o
Indicate by check mark whether the registrant is a large accelerated filer, an accelerated filer, a non-accelerated filer, or a smaller reporting company. See definition of “large accelerated filer,” “accelerated filer” and “smaller reporting company” in Rule 12b-2 of the Exchange Act.
Large accelerated filer x | Accelerated filer o | |
Non-accelerated filer o | Smaller Reporting Company o | |
Emerging Growth Company o | ||
If an emerging growth company, indicate by check mark if the registrant has elected not to use the extended transition period for complying with any new or revised financial accounting standards provided pursuant to Section 13(a) of the Exchange Act. o | ||
Indicate by check mark whether the registrant is a shell company (as defined in Rule 12b-2 of the Act). Yes o No ý
Indicate the number of shares outstanding of each of the issuer's classes of common stock, as of the latest practicable date.
Class | Outstanding at January 31, 2018 | |
Class A Common Stock, $0.01 par value per share | 482,944,477 shares | |
Class B Common Stock, $0.01 par value per share | 443,274,651 shares | |
As of June 30, 2017 (the last business day of the registrant's most recently completed second fiscal quarter), the aggregate market value of the Class A Common Stock held by non-affiliates of the registrant was $6.9 billion (based on the closing price of the registrant's Class A Common Stock on that date as reported on the New York Stock Exchange).
DOCUMENTS INCORPORATED BY REFERENCE
Portions of the registrant’s Proxy Statement for the Annual Meeting of Shareholders to be held on May 10, 2018 are incorporated by reference in Part III.
1
INDEX
PAGE NUMBER | |||
Unless otherwise indicated or the context otherwise requires, financial data in this Form 10-K reflects the consolidated business and operations of First Data Corporation and its consolidated subsidiaries. Unless the context otherwise requires, all references herein to “First Data,” “FDC,” the “Company,” “we,” “our,” or “us” refer to First Data Corporation and its consolidated subsidiaries.
Amounts in this Form 10-K and the consolidated financial statements included in this Form 10-K are presented in U.S. Dollars rounded to the nearest million, unless otherwise noted.
2
Forward-Looking Statements
Certain matters we discuss in this Form 10-K and in other public statements may constitute forward-looking statements. You can identify forward-looking statements because they contain words such as “believes,” “expects,” “may,” “will,” “should,” “seeks,” “intends,” “plans,” “estimates,” or “anticipates” or similar expressions which concern our strategy, plans, projections or intentions. Examples of forward-looking statements include, but are not limited to, all statements we make relating to revenue, earnings before net interest expense, income taxes, depreciation, and amortization (EBITDA), earnings, margins, growth rates, and other financial results for future periods. By their nature, forward-looking statements speak only as of the date they are made; are not statements of historical fact or guarantees of future performance; and are subject to risks, uncertainties, assumptions or changes in circumstances that are difficult to predict or quantify. Actual results could differ materially and adversely from our forward-looking statements due to a variety of factors, including the following: (1) adverse impacts from global economic, political, and other conditions affecting trends in consumer, business, and government spending; (2) our ability to anticipate and respond to changing industry trends, including technological changes and increasing competition; (3) our ability to successfully renew existing client contracts on favorable terms and obtain new clients; (4) our ability to prevent a material breach of security of any of our systems; (5) our ability to implement and improve processing systems to provide new products, improve functionality, and increase efficiencies; (6) the successful management of our merchant alliance program which involves several alliances not under our sole control and each of which acts independently of the others; (7) our successful management of credit and fraud risks in our business units and merchant alliances, particularly in the context of eCommerce and mobile markets; (8) consolidation among financial institution clients or other client groups that impacts our client relationships; (9) our ability to use our net operating losses without restriction to offset income for US tax purposes; (10) our ability to improve our profitability and maintain flexibility in our capital resources through the implementation of cost savings initiatives; (11) the acquisition or disposition of a material business or assets; (12) our ability to successfully value and integrate acquired businesses; (13) our high degree of leverage; (14) adverse impacts from currency exchange rates or currency controls imposed by any government or otherwise; (15) changes in the interest rate environment that increase interest on our borrowings or the interest rate at which we can refinance our borrowings; (16) the impact of new or changes in current laws, regulations, credit card association rules, or other industry standards; and (17) new lawsuits, investigations, or proceedings, or changes to our potential exposure in connection with pending lawsuits, investigations or proceedings, and various other factors discussed throughout this report, including but not limited to, Item 1 - Business, Item 1A - Risk Factors, and Item 7 - Management’s Discussion and Analysis of Financial Condition and Results of Operations. Except as required by law, we do not intend to revise or update any forward-looking statement as a result of new information, future developments or otherwise.
3
PART I
ITEM 1. BUSINESS
General
First Data Corporation sits at the center of global electronic commerce. We believe we offer our clients the most complete array of integrated solutions in the industry, covering their needs across next-generation commerce technologies, merchant acquiring, issuing, and network solutions. We serve our clients in over 100 countries, reaching over 6 million business locations and over 4,000 financial institutions. We believe we have the industry’s largest distribution network, driven by our partnerships with many of the world’s leading financial institutions, our direct sales force, and a network of distribution partners. We are the largest merchant acquirer, issuer processor, and independent network services provider in the world, enabling businesses to accept electronic payments, helping financial institutions issue credit, debit and prepaid cards, and routing secure transactions between them. In 2017, we processed 93 billion transactions globally, or approximately 3,000 per second. In our largest market, the United States, we processed approximately $2.1 trillion of payment volume, which represents over 10% of United States gross domestic product (GDP) last year.
We have operations and offices located within the United States (U.S.) (domestic) and outside of the U.S. (international) where sales, customer service and/or administrative personnel are based. Total revenues from processing domestic and international transactions as a percentage of total revenues and total long lived assets attributable to domestic and international operations as a percentage of total long lived assets, are displayed in the below table.
Year ended December 31, | ||||||||
2017 | 2016 | 2015 | ||||||
Total generated from processing transactions: | ||||||||
Domestic | 85 | % | 85 | % | 86 | % | ||
International | 15 | % | 15 | % | 14 | % | ||
Long-lived assets attributable to operations: | ||||||||
Domestic | 89 | % | 89 | % | 89 | % | ||
International | 11 | % | 11 | % | 11 | % | ||
No country outside the US is greater than 10% of our total revenues or long-lived assets during any of the years presented in the above table. Further financial information relating to our international and domestic revenues and long-lived assets is set forth in note 7 "Segment Information" to our consolidated financial statements in Part II, Item 8 of this Form 10-K.
Our business is characterized by transaction and account related fees, multi-year contracts, and a diverse client base, which allows us to grow alongside our clients. Our multi-year contracts allow us to achieve a high level of recurring revenues with the same clients. While the contracts typically do not specify fixed revenues to be realized thereunder, they do provide a framework for revenues to be generated based on volume of services provided during such contract's term. Our business also generally requires minimal incremental capital expenditures and working capital to support additional revenue within our existing business lines.
Products and Services Segments Information
We provide a range of solutions to businesses and financial institutions across the value chain of commerce-enabling services and technologies. We deliver our value-added solutions from a suite of proprietary technology products, software, cloud-based applications, processing services, security offerings, and customer support programs that we configure to meet our clients' individual needs.
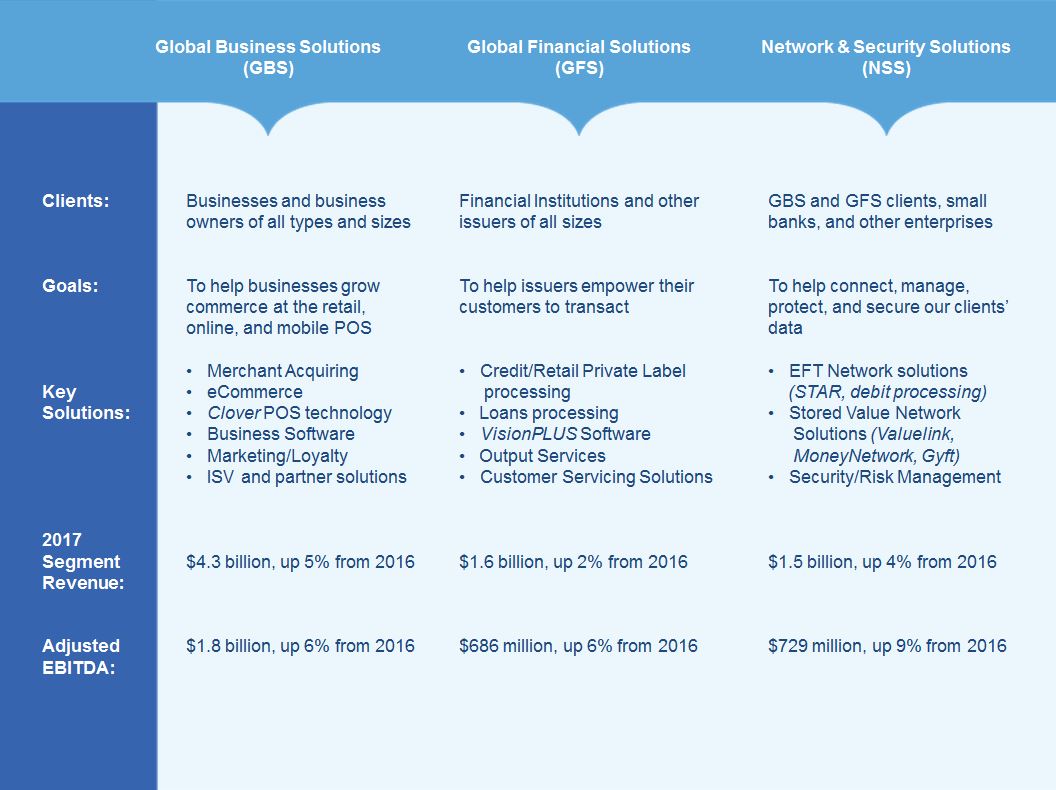
We operate three segments: Global Business Solutions (GBS), Global Financial Solutions (GFS), and Network & Security Solutions (NSS). Our segments are designed to establish global lines of businesses that support our global client base and allow us to further globalize our solutions while working seamlessly with our geographic teams across our regions: the United States and Canada (North America); Europe, Middle East, and Africa (EMEA); Latin America (LATAM); and Asia Pacific (APAC) and be supported by a corporate team focused on company-wide issues.
• | Global Business Solutions - GBS provides a wide-range of solutions to merchants. These solutions include retail point-of-sale merchant acquiring and eCommerce services as well as next-generation offerings such as mobile payment services, |
4
and our cloud-based Clover point-of-sale operating system, which includes a marketplace for proprietary and third-party business applications.
• | Global Financial Solutions - GFS provides technology solutions for bank and non-bank issuers. These solutions include general purpose credit, retail private label, commercial card, and loan processing within the United States and international markets, as well as licensed financial software systems, such as our VisionPLUS processing application. GFS also provides financial institutions with a suite of account services including card personalization and embossing, customer communications, remittance processing, professional services, and customer servicing, including call center solutions and back office processing. |
• | Network & Security Solutions - NSS provides a wide range of value-added solutions that we sell to clients in our GBS and GFS segments, smaller financial institutions, and other enterprise clients. These solutions include our EFT network solutions, such as our STAR Network, our debit card processing solutions, our Stored Value Network solutions, such as Money Network, Gift Solutions and our Security and Fraud solutions, such as TransArmor and TeleCheck. NSS also supports our other digital strategies, including online and mobile banking, and our business supporting mobile wallets. |
See "Item 7 - Management's Discussion and Analysis of Financial Condition and Results of Operations" for a detailed explanation of our operating results. Segment products and services are illustrated below:
The segments’ profit measure is a form of EBITDA (earnings before net interest expense, income taxes, depreciation, and amortization). A discussion of factors potentially affecting our operations is set forth in Item 7 “Management’s Discussion and Analysis of Financial Condition and Results of Operations” of this Form 10-K.
We do not have any significant customers that account for 10% or more of total consolidated revenues.
5
Overview of Payment Processing
The processing of a traditional card transaction includes two sub-processes: (1) capture and authorization and (2) clearing and settlement. Below is an illustrative diagram of the flow of a typical card transaction and an explanation of each step in the process.
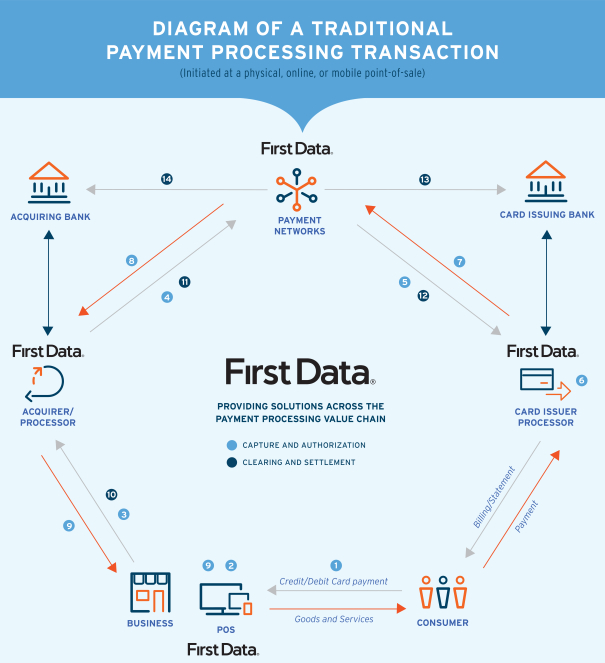
Capture and Authorization
In the capture and authorization process, the business obtains approval for payment from the card issuing bank. This process includes the following steps:
1. | Once the consumer is ready to make a purchase, he or she presents their card for payment; |
2. | The card is swiped in the Point-of-Sale (POS) device at the business location, which captures the account information contained on the card's magnetic stripe or Europay, MasterCard and Visa (EMV) - compliant chip; |
• | In a mobile commerce transaction facilitated by a mobile wallet, such as Apple Pay, the appropriate card details are stored virtually on an application on the phone and transmitted to the POS device through a chip equipped with near-field communication (NFC) technology; |
• | In an eCommerce transaction, the POS device is replaced by a virtual terminal application and the consumer types the card number into the check-out page of the online storefront. In some circumstances, an online wallet, such as PayPal, may be used to transmit the appropriate payment credentials; |
3. | The customer's card details are transmitted from the POS to the merchant acquirer, or the merchant acquirer's processor, via an internet connection or a phone line; |
6
• | In an eCommerce transaction, the information is encrypted and then transmitted to the merchant acquirer, or merchant acquirer's processor, via an online gateway; |
4. | The merchant acquirer, or the merchant acquirer's processor, identifies the appropriate payment network affiliated with the card, such as Visa, MasterCard, or STAR, and forwards the card details to the appropriate network; |
5. | The payment network receives the request for payment authorization, identifies the appropriate card issuing bank, and routes the transaction to the bank or its issuer processor; |
6. | The card issuing bank, or its issuer processor, receives the request and then executes a series of inquiries into its account systems to assess the potential risk of fraud for the transaction, establish that the account is in good standing, and verify that the cardholder has sufficient credit or adequate funds to cover the amount of the transaction; |
7. | The card issuing bank, or its issuer processor, approves or declines the transaction and sends back the response to the payment network. In this example the transaction is approved; |
8. | The payment network receives the approval and forwards the authorization to the merchant acquirer, or merchant acquirer's processor; and |
9. | The merchant acquirer, or merchant acquirer's processor, sends the authorization back to the POS device at the business location, which provides an approval confirmation and prints a receipt; |
• | In a mobile commerce transaction, the approval confirmation and receipt may also be transmitted to the consumer's mobile wallet application or to the consumer via email; |
• | In an eCommerce transaction, the authorization is sent to the online storefront, which communicates the approval to the consumer on the screen, and may provide the receipt for printing online or via email. |
Clearing and Settlement
In the clearing and settlement process, a request for payment is initiated, funds are transferred and the transaction is posted to the business owner's and the consumer's account statements. The clearing and settlement process includes the following steps:
10. | Typically at the end of the day, the business submits a batch of all of its approved authorizations to the merchant acquirer, or the merchant acquirer's processor, through a function on its POS device; |
• | In the case of an eCommerce business, the online storefront's gateway sends the batch to the merchant acquirer, or to the merchant acquirer's processor; |
11. | The merchant acquirer, or the merchant acquirer's processor, receives the batch, notes the final amounts due for settlement, and routes the batch of approved authorizations to each applicable payment network; |
12. | Each payment network sends the batch of approved authorizations to the applicable card issuing bank, or its issuer processor, which posts the transaction to the consumer's statement; |
13. | Typically within 48 hours, the payment network calculates net settlement positions for the merchant acquirer and the card issuing bank, sends advisements to the merchant acquirer and card issuing bank, and submits a fund transfer order to a settlement bank; and |
14. | The settlement bank facilitates the exchange of funds between the merchant acquirer and the card issuing bank; and the merchant acquirer transfers the funds to the business owner's account. |
Global Business Solutions Segment
The following table presents GBS information as a percentage of total segment revenue and segment EBITDA:
Year ended December 31, | |||||||||
2017 | 2016 | 2015 | |||||||
Segment revenue | 57 | % | 57 | % | 58 | % | |||
Segment EBITDA | 59 | % | 60 | % | 62 | % | |||
See note 7 "Segment Information" to our consolidated financial statements in Part II, Item 8 of this Form 10-K for a detail of segment revenue and segment EBITDA results.
Global Business Solutions Operations Our largest segment, GBS, provides businesses of all sizes and types with a wide range of solutions at the point of sale, including merchant acquiring, eCommerce, mobile commerce, POS, and other business solutions. We served approximately 3.6 million business locations in the United States and 2.7 million outside the United States. GBS' largest service is merchant acquiring, which facilitates the acceptance of commercial transactions at the POS, whether a retail transaction at a physical business location, a mobile commerce transaction through a mobile or tablet device, or an eCommerce transaction over the Internet. In 2017, we processed $2.1 trillion of payment volume in the United States and over $300 billion of payment volume outside the United States.
7
GBS employs a variety of go-to-market strategies. GBS operates direct sales teams and also partners with indirect non-bank sales forces, such as independent sales agents, independent sales organizations (ISOs), independent software vendors (ISVs), value added retailers (VARs), and payment services providers (PSPs) to sell our commerce solutions to Small and Medium Sized Business (SMBs). In addition, GBS leverages the powerful sales capabilities of its bank partners to go to market through several structures, including joint venture equity alliances, revenue sharing alliances, and referral agreements.
GBS segment revenues are primarily derived from processing credit and debit card transactions for merchants and other business clients and includes fees for providing processing, loyalty and software services, and sales and leases of POS devices. Revenues are generated from a variety of sources, including:
• | Discount fees charged to a merchant, net of credit and debit card interchange and assessment fees charged by the payment networks. The discount fee is typically either a percentage of the purchase amount or an interchange fee plus a fixed dollar amount; |
• | Processing fees charged to our alliances; |
• | Processing fees charged to merchant acquirers who have outsourced their transaction processing to us; |
• | Sales and leases of POS devices; |
• | Fees from providing reporting and other services; and |
• | Software fees such as security applications and Clover related fees. |
We typically provide these services as part of a broader commerce-enabling solution to our business clients across multiple channels, including:
• | Retail POS - Physical businesses or storefront locations, such as retailers, supermarkets, restaurants, and petroleum stations, with brick and mortar facilities; |
• | Mobile POS - Physical businesses with remote or wireless storefront locations, such as small retailers and service providers that use mobile devices to accept electronic payments; and |
• | Online POS (eCommerce) - Online businesses or website locations, such as retailers, digital content providers, and mobile app developers with Internet-based storefronts that can be accessed through a personal computer or a mobile device. |
Clover Operating System Clover is an open architecture, integrated POS operating system, with a full suite of integrated hardware and software offerings. With Clover, we have designed one of the largest open architecture platforms of commerce-enabling solutions and applications in the world. The family of Clover devices includes the Clover Station, Clover Mobile, Clover Mini, Clover Go, and now Clover Flex; each providing a broad range of next-generation features and software applications designed to help business clients conduct commerce.
Through December 31, 2017, we have shipped over 750,000 Clover devices and the current Clover platform processes approximately $50 billion in payment volume annually. Within Clover, we also offer a cloud-based Clover App Market for business applications. Our application marketplace is designed specifically to provide merchants with integrated software applications that they can download and install quickly and easily on their Clover devices. As of December 31, 2017, the Clover App Market has over 300 active applications. We already offer Clover throughout North America and within numerous countries in EMEA, and we are in the process of rolling Clover out to other international regions. Furthermore, we believe Clover improves client retention because it becomes core to our clients' businesses, and positions us as a value-added partner. For example, business owners may use applications in the Clover App Market to manage their employees' work schedules, operate customer loyalty programs, integrate transaction information directly into their accounting software, manage inventory, and provide analytics on their business.
Global Business Solutions Competition GBS competes with merchant acquirers that include Worldpay and Global Payments, in addition to financial institutions that provide acquiring and processing services to businesses on their own, such as Chase Paymentech Solutions, Elavon (a subsidiary of U.S. Bancorp), and Barclaycard. In many cases, our alliance and commercial partners compete against each other. Additionally, payment networks such as Visa and MasterCard are increasingly offering products and services that compete with our suite of solutions. Competitors of our next-generation services include PayPal, Braintree (a subsidiary of PayPal), CyberSource (a subsidiary of Visa Inc.), Adyen, and Stripe, along with integrated point of sale providers such as Micros, Square, and others.
The primary competitive factors impacting GBS are brand, data security, breadth of features and functionality, ease of technological integration, strength of financial institution partnerships, price, and servicing capability. Other factors impacting GBS include consolidation among large businesses and financial institutions, the pace of integrated point of sale solution development, and the creation of new payment methods and related technologies.
8
Global Business Solutions Seasonality GBS experiences a modest level of seasonality, with the first quarter representing the lowest level of sales and the fourth quarter representing the highest level of sales. Over the past eight quarters, GBS' quarterly revenue as a percentage of total yearly revenue has ranged between 24% and 26%.
Global Business Solutions Geographic Mix and Revenues GBS generates approximately 77% of its revenues from clients in our North America region, 13% from clients in the EMEA region, 6% from clients in our LATAM region, and 4% from clients in our APAC region. GBS revenues and earnings are impacted by the number of transactions and payment volume, the mix of consumer usage of credit cards, debit cards, and the size of the business.
Global Business Solutions Acquisitions and Dispositions On May 1, 2017, we acquired Accullink Inc. (Acculynk), a leading technology company that delivers eCommerce solutions for debit card acceptance, for $85 million, net of cash acquired. The acquisition included Acculynk's PaySecure debit routing technology and its range of other services.
On July 6, 2017, we acquired CardConnect Corp. (CardConnect) for $763 million, net of cash acquired. CardConnect is an innovative provider of payment processing and technology solutions and was one of our largest distribution partners. The transaction is expected to enable us to bring innovative partner management tools to improve merchant retention, accelerate our firm-wide independent software vendor (ISV) initiative and bring immediate capabilities in enterprise resource planning (ERP) integrated payment solutions to our customers.
On December 1, 2017, we acquired BluePay Holdings, Inc. (BluePay) for $759 million, net of cash acquired. BluePay is a provider of technology-enabled payment processing for merchants in the U.S. and Canada and was one of our largest distribution partners with a strong focus on software-enabled payments and card-not-present transactions. The transaction is expected to be highly complementary to our earlier acquisition of CardConnect and enhance our suite of innovative partner management tools to improve merchant retention, accelerate our firm-wide ISV initiative and bring immediate capabilities in ERP integrated payment solutions to our customers.
On September 30, 2016, we completed the sale of our Australian ATM business. Associated with the transaction, we recognized a $34 million loss on the sale.
See note 12 "Acquisitions and Dispositions" to our consolidated financial statements in Part II, Item 8 of this Form 10-K for more details relating to these acquisitions.
Global Financial Solutions Segment
The following table presents GFS information as a percentage of total segment revenue and segment EBITDA:
Year ended December 31, | ||||||||
2017 | 2016 | 2015 | ||||||
Segment revenue | 22 | % | 22 | % | 21 | % | ||
Segment EBITDA | 22 | % | 22 | % | 20 | % | ||
See note 7 "Segment Information" to our consolidated financial statements in Part II, Item 8 of this Form 10-K for a detail of segment revenue and segment EBITDA results.
Global Financial Solutions Operations GFS provides financial institutions, which include bank and non-bank issuers such as retailers with proprietary card portfolios, with a broad range of technology solutions that enable them to offer financial products and solutions to their customers. GFS serves over 1,400 clients globally and delivers value to clients through a variety of channels, including end-to-end outsourced processing, managed services, and various software delivery models utilizing our proprietary VisionPLUS solution. GFS services include credit card and loan account processing, commercial payments, customer communications, plastics solutions, remittance processing, customer servicing, and other products to support issuers. In 2017, we processed 11 billion transactions on our platforms. As of December 31, 2017, GFS managed 906 million card accounts on file in North America, up 6% over 2016 and 170 million card accounts on file outside North America, up 13% over 2016.
GFS clients include some of the world's largest financial institutions, which we serve in approximately 100 countries. Our largest service in GFS is outsourced issuer processing, which helps banks and non-bank issuers provide credit, commercial, and retail card programs to their account holders, as well as loan programs. GFS also provides licensed software solutions for financial processing activities to financial institutions globally. Depending on the market, our solutions are often bundled with related offerings, such as customer communications and personalization of plastic cards, settlement and back office support, outsourced
9
billing, remittance processing, and customer service support. As part of these solutions, we also provide professional services, including custom programming and development, to clients.
GFS revenues are primarily derived from outsourced processing services, print, plastics, and remittance services, and VisionPLUS software services provided to financial institutions. GFS' revenues are typically generated on the basis of number of total and active accounts on file, volume of customer communications, volume of plastics issued or license fees.
Outsourced Processing and Licensing Outsourced processing and licensing provide solutions to financial institutions and other issuers of credit, such as banks, group service providers, retailers, consumer finance companies, and credit unions. These services enable issuers to process transactions on behalf of customers. Depending on our clients' needs and the market, we deliver these solutions through our proprietary outsourced services platforms, software application licenses, or software-as-a-service hosted in the cloud. Services in our proprietary platform include transaction authorization and posting, account maintenance, and settlement. Our VisionPLUS software is used globally as both a processing solution and a licensed software solution that enables clients to process their own transactions, depending on the market. We also enable merchants and financial institutions to offer next generation payment solutions to their clients, such as Apple Pay, Android Pay, and Samsung Pay.
Revenues for outsourced issuer processing services are derived from fees payable under contracts that depend primarily on the number of cardholder accounts on file. More revenue is derived from active accounts (those accounts on file that had a balance or any monetary posting or authorization activity during a specified period) than inactive accounts. Revenues are also derived from licensing fees for our VisionPLUS application, as well as cardholder and data transactions and professional services such as custom programming and development.
Account Support Services Along with our processing and licensing solutions, we provide a variety of supporting services throughout the life cycle of each account. Services include processing a card application, initiating services for the cardholder to enable the cardholder to transact, accumulating the card's transactions into a monthly billing statement, and posting cardholder payments. Other services provided include customized communications to cardholders, plastics personalization and mailing, information verification associated with granting credit, debt collection, remittance processing, and customer service on behalf of financial institutions. We also provide programming and customization to enhance and tailor our solutions to clients' needs through professional services.
Global Financial Solutions Competition GFS competes with card issuer processors, such as Total System Services, Worldpay, Fidelity National Information Services, Fiserv, Worldline, and SIX Payment Services, as well as the card issuer processing businesses of the global payment networks such as Visa and Mastercard. In addition, we compete with various software or custom designed solutions that some financial institutions use to perform these services in-house.
The primary competitive factors impacting GFS are system performance and reliability, digital solutions, data security, breadth of features and functionality, disaster recovery capabilities and business continuity preparedness, platform scalability and flexibility, price, and servicing capability. Market events that impact GFS include financial institution consolidation and portfolio transactions between financial institutions.
Global Financial Solutions Seasonality GFS experiences a modest level of seasonality, with the first quarter representing the lowest level of sales and the fourth quarter representing the highest level of sales. Over the past eight quarters, GFS' quarterly revenue as a percentage of total yearly revenue has ranged between 24% and 26%.
Global Financial Solutions Geographic Mix and Revenues GFS generates 59% of its revenues from clients in our North America region, 27% from clients in our EMEA region, 8% from clients in our LATAM region, and 6% from clients in our APAC region. Within the United States, revenues are diversified across major financial institutions of various sizes and geographies across the country.
Global Financial Solutions Acquisitions and Dispositions On September 27, 2017, we divested all of our businesses in Lithuania, Latvia and Estonia for €73 million (approximately $85 million). Associated with the transaction, we recognized a $4 million loss on the sale.
See note 12 "Acquisitions and Dispositions" to our consolidated financial statements in Part II, Item 8 of this Form 10-K for more details relating to this disposition.
10
Network & Security Solutions Segment
The following table presents NSS information as a percentage of total segment revenue and segment EBITDA:
Year ended December 31, | ||||||||
2017 | 2016 | 2015 | ||||||
Segment revenue | 21 | % | 21 | % | 21 | % | ||
Segment EBITDA | 24 | % | 23 | % | 23 | % | ||
See note 7 "Segment Information" to our consolidated financial statements in Part II, Item 8 of this Form 10-K for a detail of segment revenue and segment EBITDA results.
Network & Security Solutions Operations NSS provides a range of network solutions and security, risk and fraud management solutions to business and financial institution clients in our GBS and GFS segments, and independently to financial institutions, businesses, governments, processors and other clients. Our EFT Network Solutions manages U.S. debit card and account processing solutions. Our STAR Network enables clients to encrypt, route, and decrypt PIN debit, PIN-less debit, and ATM transactions, and provide access to demand deposit accounts. In 2017, our STAR Network routed approximately 4.3 billion transactions in the United States. Our Stored Value Network Solutions facilitate stored value commerce, such as (1) closed-loop prepaid transactions, which are initiated by various types of prepaid cards issued by enterprises, such as retailers, that issue enterprise-branded cards that can generally be used only at the enterprise issuing the card or account, and (2) open-loop prepaid transactions, which are initiated by various types of prepaid cards issued by a bank and carry a network association brand, such as Visa, MasterCard and STAR, enabling them to be used at multiple merchant locations. NSS also includes our Online and Mobile Banking Solutions, Healthcare Solutions, and Government Solutions.
EFT Network Solutions enables our business and financial institution clients to route secure, encrypted data between themselves. Our STAR Network is connected to over 3,000 financial institutions and community banks, approximately 1.1 million POS and ATM locations, and numerous third-party payment processors, ATM processors, and card processors that participate in the network. When a business, a merchant acquirer, or an ATM owner acquires a STAR Network transaction, it sends the transaction data to the network switch, which is operated by us, which in turn routes the encrypted information to the appropriate financial institution for authorization. To be routed through the STAR Network, a transaction must be initiated with a card participating in the STAR Network at an ATM or POS device also participating in the STAR Network.
Revenues related to the STAR Network are derived from fees payable under contracts and negotiated rate structures but are driven more by the number of transactions processed than by accounts on file. In a situation in which a debit transaction uses our network and we are the debit card processor for the financial institution as well as the merchant acquirer for the business, we are eligible to receive one or more of the following:
• | a fee from the card issuing financial institution for running the transaction through the STAR Network; |
• | a fee from the card issuer for obtaining the authorization; |
• | a fee from the business for acquiring the transaction, recognized in GBS; and |
• | a network acquirer fee from the business for accessing the STAR Network. |
There are other possible configurations of transactions that result in us receiving multiple fees for a transaction, depending on the role we play.
Stored Value Network manages prepaid stored-value card issuance and processing services (i.e., gift cards) for retailers and others. The full-service stored-value/gift card program offers transaction processing services, card issuance, and customer service for over 200 national brands and several thousand small and mid-tier merchants. We also provide program management and processing services for association-branded, bank-issued, open loop (a card that can be used at multiple merchants), stored-value, reloadable, and one time prepaid card products. Revenues are generated from a variety of sources including processing fees for transactions processed and fees for card production and shipments.
Our commercial prepaid offerings are primarily sold to businesses and are comprised of:
• | Gift Solutions - Includes ValueLink, Gyft, and Transaction Wireless. |
◦ | ValueLink - Provides card and account issuing, program management, and transaction processing services for a range of prepaid card programs. Our closed-loop prepaid programs include gift, incentive, and rebate cards. We serve over 200 brands globally and several thousand SMBs. Our programs include reloadable and non- |
11
reloadable prepaid cards, and may be used with a variety of mobile applications.
◦ | Gyft - A leading digital platform that enables consumers to buy, send, manage, and redeem virtual closed-loop cards using mobile devices. The Gyft solution, combined with our leadership in prepaid issuing solutions, creates a unique combination to support growth in a rapidly expanding market for virtual cards. |
◦ | Transaction Wireless - A leading digital platform that enables businesses to sell virtual gift cards online, either to consumers through an integration with their eCommerce storefront, or to other businesses through a proprietary business-to-business solution. |
• | Payroll Solutions - Includes Money Network which provides open-loop electronic payroll distribution solutions that reduce or eliminate an employer's expense associated with traditional paper paychecks and helps employees without bank accounts avoid check cashing fees. The solution also provides important employee security as the funds are stored on the account, not as cash that can be lost or stolen. Money Network accounts can be used at any business location that accepts Visa, MasterCard, or STAR branded cards, includes a packet of checks to be used to pay bills and avoid the cost of money orders, and offers a web portal to track account activity. |
Security and Fraud Solutions provides a range of security, risk, and fraud management solutions that help businesses and financial institutions securely run and grow their business by protecting their data, managing risk, and preventing fraud. Our solutions include TransArmor, our encryption, tokenization, and PCI compliance solution for POS data in-transit, Fraud Predictor Plus, our solution to detect fraud at the POS through a machine-learning based predictive model, and TeleCheck, the industry-leading database of check-writers activity. Revenues for our security solutions are earned on a fee for licensed basis or per transaction.
TeleCheck offers check verification, settlement, and guarantee services using our proprietary database system to assist merchants in deciding whether accepting checks at the POS is a reasonable risk, or, further, to guarantee checks presented to merchants if they are approved. These services include risk management services, which utilize software, information, and analysis to assist the merchant in the decision process and include identity fraud prevention and reduction. Revenues are earned by charging merchant fees for check verification or guarantee services.
Network & Security Solutions Competition NSS competes with networks such as Visa, MasterCard, and Discover for debit network services, and with Fidelity National Information Services for debit network and check verification and guarantee services. We also face competition from regional operators of debit networks. Our portfolio of security and risk management solutions competes with a wide range of providers across multiple disciplines, including Visa, MasterCard, Voltage, Verisk, Equifax, Experian, TransUnion, and Fair Isaac.
The primary competitive factors impacting NSS are system performance and reliability, data security, breadth of features and functionality, platform scalability and flexibility, price, and financial institution consolidation. Other factors impacting NSS include increasingly powerful and affordable technology capacity, improved data management and analytic tools, and emergence of cloud-based delivery models.
Network & Security Solutions Seasonality NSS experiences a modest level of seasonality, with the first quarter representing the lowest level of sales and the fourth quarter representing the highest level of sales. Over the past eight quarters, NSS' quarterly revenue as a percentage of total yearly revenue has ranged between 23% and 26%.
Network & Security Solutions Geographic Mix and Revenues NSS is comprised of more than 95% domestic businesses.
Network & Security Solutions Acquisitions and Dispositions On October 2, 2017, we formed a digital banking joint venture, named Apiture, combining FDC and Live Oak Bancshares, Inc.'s digital banking platforms, products, and services, delivering innovative technology solutions tailored for financial institutions. Apiture is owned and managed equally between us and Live Oak Bancshares, Inc, as a result, the contributed digital banking business will no longer be consolidated into the our results.
In 2015, we acquired Transaction Wireless, Inc. (TWI) a provider of digital stored value products that offer gift card programs, loyalty incentives, and integrated marketing solutions for retailers, partners, and consumers.
See note 12 "Acquisitions and Dispositions" to our consolidated financial statements in Part II, Item 8 of this Form 10-K for more details relating to this acquisition and disposition.
12
Corporate
Corporate operations include corporate-wide governance functions such as our executive management team, tax, treasury, internal audit, corporate strategy, and certain accounting, human resources and legal costs related to supporting the corporate function. Costs incurred by Corporate that are attributable to a segment are allocated to the respective segment.
Global Regions
We currently have operations in 34 countries and serve businesses and financial institutions in over 100 countries around the world as illustrated on the following map:
We deliver our solutions throughout the world via four regions:
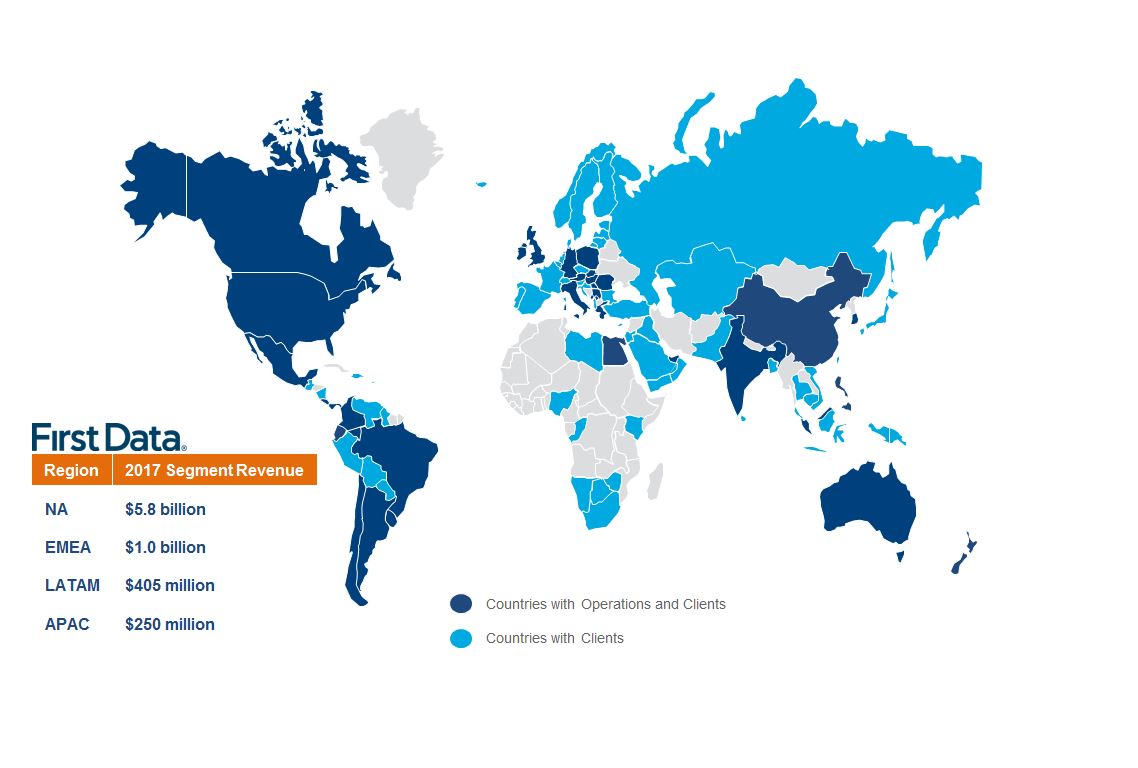
North America
North America (United States and Canada) is our largest region. We are the largest merchant acquirer, issuer processor, and third largest U.S. debit network. The United States is our largest market and accounts for the majority of our activity in the region. In 2017, we processed approximately 77 billion commercial transactions and processed $2.1 trillion of payment volume in the United States, representing over 10% of U.S. GDP.
Europe, Middle East, and Africa (EMEA)
We have operations in 17 countries and serve clients in 66 countries in this region. We are a leading acquirer processor in EMEA and provide our suite of next-generation commerce-enabling solutions to businesses and financial institutions of all sizes and types.
Latin America (LATAM)
We have operations in 7 countries and serve clients in 32 countries in this region. We are a leading merchant acquirer, issuer processor, and eCommerce processor to businesses and financial institutions of all sizes and types in the region.
13
Asia Pacific (APAC)
We have operations in 8 countries and serve clients in 17 countries in this region. We are a leading merchant acquirer, issuer processor, and eCommerce processor to businesses and financial institutions of all sizes and types in the region and have begun to introduce other commerce-enabling solutions in selected markets.
Intellectual Property
We own a global portfolio of trademarks, trade names, patents, and other intellectual property that are important to our future success. The only intellectual property rights that are individually material to us are the First Data trademark and trade name, and the STAR trademark and trade name. The First Data trademark and trade name are associated with quality and reliable electronic commerce and payments solutions. The STAR trademark and trade name are used in NSS. Financial institutions and merchants associate the STAR trademark and trade name with quality and reliable debit network services and processing services. Loss of the proprietary use of the First Data or STAR trademarks and trade names or a diminution in the perceived quality associated with these names could harm the growth of our businesses.
Employees and Labor
As of December 31, 2017, we had approximately 22,000 employees. The majority of the employees of our subsidiaries outside of the United States are subject to the terms of individual employment agreements. One of our wholly owned subsidiaries has approximately 1,900 employees in the United Kingdom, a portion of whom are members of the Unite trade union. Employees of our subsidiaries in Vienna, Austria; Frankfurt, Germany; and Nürnberg, Germany are also represented by local work councils. The Vienna workforce and a portion of the Frankfurt workforce are also covered by a union contract. Certain employees of our Korean subsidiary are represented by a Labor-Management council. In Brazil, all employees are unionized and covered by the terms of industry-specific collective agreements. Employees in certain other countries are also covered by the terms of industry-specific national collective agreements. None of our employees are otherwise represented by any labor organization in the United States. We believe that our relations with our employees and the labor organizations identified above are in good standing.
Available Information
Our principal executive offices are located at 225 Liberty Street, 29th Floor, New York, NY 10281, telephone (800) 735-3362. Our annual report on Form 10-K, quarterly reports on Form 10-Q, current reports on Form 8-K, and amendments to those reports are available free of charge to shareholders and other interested parties through the “Investor Relations” portion of our website at http://investor.firstdata.com as soon as reasonably practical after they are filed with the Securities and Exchange Commission (SEC). Information contained on, or that can be accessed through, our website is not incorporated by reference into this document, and you should not consider information on our website to be part of this document. The SEC maintains a website, www.sec.gov, which contains reports and other information filed electronically with the SEC by us. Various corporate governance documents, including our Audit Committee Charter, Governance, Compensation and Nominations Committee Charter, and Code of Ethics for Senior Financial Officers are available without charge through the “About Us” “Investor Relations” “Corporate Governance” portion of our investor relations website, listed above.
Government Regulations
Various aspects of our service areas are subject to U.S. federal, state, and local regulation, as well as regulation outside the United States. Failure to comply with regulations may result in the suspension or revocation of licenses or registrations, the limitation, suspension or termination of service, and/or the imposition of civil and criminal penalties, including fines. Certain of our services also are subject to rules promulgated by various payment networks and banking authorities as more fully described below.
The Dodd-Frank Act In July 2010, the Dodd-Frank Wall Street Reform and Consumer Protection Act of 2010 (Dodd-Frank Act) was signed into law in the United States. The Dodd-Frank Act has resulted in significant structural and other changes to the regulation of the financial services industry. Among other things, Title X of the Dodd-Frank Act established a new, independent regulatory agency known as the Consumer Financial Protection Bureau (CFPB) to regulate consumer financial products and services (including some offered by our clients). The CFPB may also have authority over us as a provider of services to regulated financial institutions in connection with consumer financial products. Recently the CFPB released rules amending federal Regulation E and Regulation Z. The rules clarify the regulatory prepaid landscape for consumer access to disclosures, fees and statements, error resolution, limited liability and overdrafts. The rules have an impact to our subsidiary Money Network Financial LLC (Money Network) for disclosure, fees and error resolution processing. Separately, under the Dodd-Frank Act, debit interchange transaction fees that a card issuer receives and are established by a payment card network for an electronic debit transaction are
14
now regulated by the Board of Governors of the Federal Reserve System (Federal Reserve Board), and must be “reasonable and proportional” to the cost incurred by the card issuer in authorizing, clearing, and settling the transaction. Effective October 1, 2011, the Federal Reserve Board capped debit interchange rates for card issuers operating in the United States with assets of $10 billion or more. In addition, the new regulations contain non-exclusivity provisions that ban debit payment card networks from prohibiting an issuer from contracting with any other payment card network that may process an electronic debit transaction involving an issuer’s debit cards and prohibit card issuers and payment networks from inhibiting the ability of merchants to direct the routing of debit card transactions over any network that can process the transaction. Beginning April 1, 2012, all debit card issuers in the United States were required to participate in at least two unaffiliated debit payment card networks. On April 1, 2013, the ban on network exclusivity arrangements became effective for prepaid card and healthcare debit card issuers, with certain exceptions for prepaid cards issued before that date.
Effective July 22, 2010, merchants were allowed to set minimum dollar amounts (not to exceed $10) for the acceptance of a credit card (while federal governmental entities and institutions of higher education may set maximum amounts for the acceptance of credit cards). They were also allowed to provide discounts or incentives to entice consumers to pay with an alternative payment method, such as cash, checks or debit cards. In addition, the Dodd-Frank Act created a new entity, the Financial Stability Oversight Council, and authorized it to require that a nonbank financial company that is deemed to pose a systemic risk to the U.S. financial system become subject to consolidated, prudential supervision by the Federal Reserve Board. At this point it is unclear whether we would be subject to additional systemic risk related oversight.
Association and Network Rules We are subject to rules of MasterCard, Visa, INTERAC, PULSE, and other payment networks. In order to provide processing services, a number of our subsidiaries are registered with Visa and/or MasterCard as service providers for member institutions. A number of subsidiaries outside the U.S. are direct members or associate members of Visa and MasterCard for purposes of conducting merchant acquiring. Various subsidiaries of ours are also processor level members of numerous debit and electronic benefits transaction networks or are otherwise subject to various network rules in connection with processing services and other services we provide. As such, we are subject to applicable card association, network, and national scheme rules that could subject us to fines or penalties. We are also subject to network operating rules promulgated by the National Automated Clearing House Association relating to payment transactions processed by us using the Automated Clearing House Network and to various state and federal laws regarding such operations, including laws pertaining to electronic benefits transaction.
Our subsidiary in Germany, TeleCash GmbH & Co. KG, is certified and regulated as a processor for domestic German debit card transactions by the Deutsche Kreditwirtschaft (DK), the German Banking Industry Committee. Failure to comply with the technical requirements set forth by the DK may result in suspension or termination of services.
Banking Regulations Because a number of our subsidiary businesses provide data processing services for financial institutions, we are subject to examination by the Federal Financial Institutions Examination Council (FFIEC), which examines large data processors in order to identify and mitigate risks associated with significant service providers.
FDR Limited is authorized and regulated in the United Kingdom by the Financial Conduct Authority, one of the two principal financial markets regulators in the United Kingdom. FDR Limited is authorized by the Financial Conduct Authority to arrange and advise on certain insurance contracts for the purpose of arranging insurance taken out by its issuer clients' cardholders. FDR Limited also has obtained permission from the Financial Conduct Authority in respect of certain consumer credit activities related to its issuer services and merchant terminal leasing businesses. As a firm authorized by the Financial Conduct Authority, FDR Limited is required to comply with certain prudential, conduct of business and reporting requirements.
As a result of the implementation of the Payment Services Directive (2007/64/EC) in the European Union (PSD), a number of our subsidiaries in GBS hold payment institution licenses in the European Union member states in which such subsidiaries do business. As payment institutions, we are subject to regulation and oversight in the applicable European Union member state, which includes (amongst other obligations) a requirement to maintain specified regulatory capital. The PSD was amended by a revised Payment Services Directive, known as PSD2 which was required to be transposed into national law by January 2018. Under PSD2, each subsidiary holding a payment institution license will need to submit by April 2018 a reauthorization application to the applicable regulatory authority and be approved to continue providing the licensed business activity.
First Data Trust Company, LLC (FDTC) engages in trust activities previously conducted by the trust department of a former banking subsidiary of ours and is subject to regulation, examination, and oversight by the Division of Banking of the Colorado Department of Regulatory Agencies. Since FDTC is not a “bank” under the Bank Holding Company Act of 1956, as amended (BHCA), our affiliation with FDTC does not cause us to be regulated as a bank holding company or financial holding company under the BHCA.
15
Further, several subsidiaries provide services such as factoring or settlement that make them subject to regulation by local banking agencies, including the National Bank of Slovakia, the National Bank of Poland, the Reserve Bank of Australia, and the German Federal Financial Supervision Agency.
Privacy and Information Security Regulations We provide services that may be subject to various state, federal, and foreign privacy laws and regulations, including, among others, the Gramm-Leach-Bliley Act, the Health Insurance Portability and Accountability Act, Directive 95/46/EC, the Australian Privacy Act, the Personal Information Protection and Electronic Documents Act in Canada, the Personal Data (Privacy) Ordinance in Hong Kong, the Malaysian Data Protection Act 2010, and the Singapore Data Protection Act 2012. These laws and their implementing regulations govern certain collection, processing, storage, use, and disclosure of personal information, can require notice to entities or individuals of privacy incidents, and provide individuals with certain rights relating to the use and disclosure of protected information. These laws also impose requirements for the safeguarding and proper destruction of personal information through the issuance of data security standards or guidelines. Certain federal and state laws impose similar privacy obligations and, in certain circumstances, obligations to notify affected individuals, state officers, the media, and consumer reporting agencies, as well as businesses and governmental agencies that own the information, of security breaches affecting personal information. In addition, there are state laws restricting the ability to collect and utilize certain types of information such as Social Security and driver’s license numbers. In February 2013, the European Commission proposed additional European Union-wide legislation regarding cyber security in the form of the proposed Network and Information Security Directive (NIS Directive). The NIS Directive is currently being considered by the two other main European Union legislative institutions, the Council of the European Union and the European Parliament. On June 29, 2015, the Council of the European Union announced that agreement had been reached in informal negotiations on the main principles of the NIS Directive. Similarly, the General Data Protection Regulation is slated to take effect throughout the European Union on May 25, 2018 and creates a range of new compliance obligations and increases financial penalties for non-compliance and extends the scope of the European Union data protection law to all companies processing data of European Union residents, regardless of the company’s location.
Credit Reporting and Debt Collections Regulations TeleCheck is subject to the Federal Fair Credit Reporting Act and various similar state laws based on TeleCheck’s maintenance of a database containing the check-writing histories of consumers and the use of that information in connection with its check verification and guarantee services.
The collection business within TRS Recovery Services, Inc. (TRS) is subject to the Federal Fair Debt Collection Practices Act and various similar state laws. TRS has licenses in a number of states in order to engage in collection in those states. In the United Kingdom, FDR Limited has a license under the Consumer Credit Act of 1974 (CCA) to enable it to undertake, among other things, credit administration and debt collections activities on behalf of its card issuing clients through calls and correspondence with the cardholders. FDR Limited is also licensed under the CCA to carry on the activity of a consumer hire business for the purpose of leasing point of sale devices to merchants.
TeleCheck and TRS are subject to regulation, supervision, and examination from the CFPB. Further regulations may be imposed in the future as state governments and federal agencies identify and consider supplementary consumer financial protection, including laws regulating activities with respect to current or emerging technology such as automated dialers or pre-recorded messaging or calls to cellular phones, which could impair the collection by TRS of returned checks and those purchased under TeleCheck’s guarantee services. Moreover, reducing or eliminating access to and use of information on drivers licenses, requiring blocking of access to credit reports or scores, mandating score or scoring methodology disclosure and proscribing the maintenance or use of consumer databases could reduce the effectiveness of TeleCheck’s risk management tools or otherwise increase its costs of doing business.
In addition, several of our subsidiaries are subject to comparable local laws regarding collection activities and obtaining credit reports.
Unfair Trade Practice Regulations We and our clients are subject to various federal, state, and international laws prohibiting unfair or deceptive trade practices, such as Section 5 of the Federal Trade Commission Act. Various regulatory enforcement agencies, including the Federal Trade Commission (FTC) and state attorneys general, have authority to take action against parties that engage in unfair or deceptive trade practices or violate other laws, rules, and regulations and to the extent we are processing payments for a client that may be in violation of laws, rules, and regulations, we may be subject to enforcement actions and incur losses and liabilities that may impact our business. For example, TeleCheck and TRS are subject to a consent decree with the FTC which, among other items, addresses the timeliness of certain actions that they take.
Anti-Money Laundering, Anti-Bribery, Sanctions, and Counter-Terrorist Regulations We are subject to anti-money laundering laws and regulations, including the Bank Secrecy Act, as amended by the USA PATRIOT Act of 2001 (collectively, BSA). Among other things, the BSA requires money services businesses (such as money transmitters, issuers of money orders and official checks, and providers of prepaid access) to develop and implement risk-based anti-money laundering programs, report
16
large cash transactions and suspicious activity, and to maintain transaction records. Money Network provides prepaid access for various open loop prepaid programs for which it is the program manager and therefore must meet the requirements of the Financial Crimes Enforcement Network (FinCEN), the agency that enforces the BSA. Recently FinCEN released rules requiring the collection and verification of beneficial owners holding equal to or greater than 25% equity interest. We will be required to comply with the new rules, which have a mandatory compliance date of May 2018.
We are also subject to anti-corruption laws and regulations, including the United States Foreign Corrupt Practices Act (FCPA) and other laws, that prohibit the making or offering of improper payments to foreign government officials and political figures and includes anti-bribery provisions enforced by the Department of Justice and accounting provisions enforced by the Securities and Exchange Commission (SEC). The FCPA has a broad reach and requires maintenance of appropriate records and adequate internal controls to prevent and detect possible FCPA violations. Many other jurisdictions where we conduct business also have similar anticorruption laws and regulations. We have policies, procedures, systems, and controls designed to identify and address potentially impermissible transactions under such laws and regulations.
We are also subject to certain economic and trade sanctions programs that are administered by the Treasury Department’s Office of Foreign Assets Control (OFAC), which prohibit or restrict transactions to or from or dealings with specified countries, their governments, and in certain circumstances, their nationals, and with individuals and entities that are specially-designated nationals of those countries, narcotics traffickers, and terrorists or terrorist organizations. Other group entities may be subject to additional local sanctions requirements in other relevant jurisdictions.
Similar anti-money laundering and counter terrorist financing and proceeds of crime laws apply to movements of currency and payments through electronic transactions and to dealings with persons specified in lists maintained by the country equivalents to OFAC lists in several other countries and require specific data retention obligations to be observed by intermediaries in the payment process. Our businesses in those jurisdictions are subject to those data retention obligations. In the European Union, for example, certain of our businesses are subject to requirements under the Third Money Laundering Directive (2005/60/EC) (MLD3) as implemented in relevant European Union member states. MLD3 was repealed and replaced by the Fourth Money Laundering Directive ((EU) 2015/849) (MLD4), when the latter entered into force on June 25, 2015. European Union member states were required to implement MLD4 into national law by June 26, 2017.
Money Transmission and Payment Instrument Licensing and Regulations We are subject to various U.S. federal, state, and foreign laws and regulations governing money transmission and the issuance and sale of payment instruments, including some of our prepaid products.
In the United States, most states license money transmitters and issuers of payment instruments. Many states exercise authority over the operations of our services related to money transmission and payment instruments and, as part of this authority, subject us to periodic examinations. Many states require, among other things, that proceeds from money transmission activity and payment instrument sales be invested in high-quality marketable securities before the settlement of the transactions. Such licensing laws also may cover matters such as regulatory approval of consumer forms, consumer disclosures and the filing of periodic reports by the licensee, and require the licensee to demonstrate and maintain levels of net worth. Many states also require money transmitters, issuers of payment instruments, and their agents to comply with federal and/or state anti-money laundering laws and regulations.
Escheatment Regulations We are subject to unclaimed or abandoned property (escheat) laws both in the United States and abroad that require us to turn over to certain government authorities the property of others held by us that has been unclaimed for a specified period of time such as, in the Integrated Payment Systems (IPS) business, payment instruments that have not been presented for payment or, in GBS, account balances that cannot be returned to a merchant following discontinuation of its relationship with us. A number of our subsidiaries hold property subject to escheat laws and we have an ongoing program to comply with those laws. We are subject to audit by individual U.S. states with regard to our escheatment practices.
Telephone Consumer Protection Act We are subject to the Federal Telephone Consumer Protection Act and various state laws to the extent we place telephone calls and short message service (SMS) messages to clients and consumers. The Telephone Consumer Protection Act regulates certain telephone calls and SMS messages placed using automatic telephone dialing systems or artificial or prerecorded voices. A number of our international subsidiaries are subject to equivalent laws in their jurisdictions.
Indirect Regulatory Requirements A number of our clients are financial institutions that are directly subject to various regulations and compliance obligations issued by the CFPB, the Office of the Comptroller of the Currency and other agencies responsible for regulating financial institutions. While these regulatory requirements and compliance obligations do not apply directly to us, many of these requirements materially affect the services we provide to our clients and us overall. To remain competitive, we expend significant resources to assist our clients in meeting their various compliance obligations, including the cost of updating our systems and services as necessary to allow our clients to comply with applicable laws and regulations, and the cost of dedicating sufficient
17
resources to assist our clients in meeting their new and enhanced oversight and audit requirements established by the CFPB, the Office of the Comptroller of the Currency and others. The banking agencies, including the Office of the Comptroller of the Currency, also have imposed requirements on regulated financial institutions to manage their third-party service providers. Among other things, these requirements include performing appropriate due diligence when selecting third-party service providers; evaluating the risk management, information security, and information management systems of third-party service providers; imposing contractual protections in agreements with third-party service providers (such as performance measures, audit and remediation rights, indemnification, compliance requirements, confidentiality and information security obligations, insurance requirements, and limits on liability); and conducting ongoing monitoring of the performance of third-party service providers. Accommodating these requirements applicable to our clients imposes additional costs and risks in connection with our financial institution relationships. We expect to expend significant resources on an ongoing basis in an effort to assist our clients in meeting their legal requirements.
Other Stored-value services we offer to issuers in the United States and internationally are subject to various federal, state, and foreign laws and regulations, which may include laws and regulations related to consumer and data protection, licensing, escheat, anti-money laundering, banking, trade practices and competition, and wage and employment. These laws and regulations are evolving, unclear, and sometimes inconsistent and subject to judicial and regulatory challenge and interpretation, and therefore the extent to which these laws and rules have application to, and their impact on, us, financial institutions, merchants or others is in flux. At this time we are unable to determine the impact that the clarification of these laws and their future interpretations, as well as new laws, may have on us, financial institutions, merchants or others in a number of jurisdictions. These services may also be subject to the rules and regulations of the various international, domestic and regional schemes, networks, and associations in which we and the card issuers participate.
In addition, the Housing Assistance Tax Act of 2008 included an amendment to the Internal Revenue Code that requires information returns to be made for each calendar year by merchant acquiring entities and third-party settlement organizations with respect to payments made in settlement of payment card transactions and third-party payment network transactions occurring in that calendar year. Reportable transactions are also subject to backup withholding requirements. We could be liable for penalties if we are not in compliance with these rules.
In December 2017, the United States enacted the Tax Cuts and Jobs Act of 2017. The new tax laws decrease the maximum corporate tax rate from 35% to 21% and more favorable tax treatment of earnings outside the U.S. that are repatriated to the U.S. The tax law also limits the amount of interest that may be deducted to determine taxable income to 30% of EBITDA until 2022 and 30% of EBIT after 2022. We expect the net result of the new tax law to be favorable as the benefit we receive from the reduction in the corporate tax rate is greater than the negative impact of the interest deductibility limit. We also expect that over time the amount of interest that is not deductible will decrease due to our efforts to reduce debt as well as increases in EBITDA and EBIT.
18
ITEM 1A. | RISK FACTORS |
The following are certain risks that could affect our business and our results of operations. The risks identified below are not all encompassing but should be considered in establishing an opinion of our future operations.
Business and Operational Risks
Global economic, political, and other conditions may adversely affect trends in consumer, business, and government spending, which may adversely impact the demand for our services and our revenue and profitability.
Financial services, payments, and technology industries in which we operate depend heavily upon the overall level of consumer, business, and government spending. A sustained deterioration in the general economic conditions (including distress in financial markets, turmoil in specific economies around the world, and additional government intervention), particularly in the United States or Europe, or increases in interest rates in key countries in which we operate may adversely affect our financial performance by reducing the number or average purchase amount of transactions involving payment cards. A reduction in the amount of consumer spending could result in a decrease of our revenue and profits.
Adverse economic trends may accelerate the timing, or increase the impact of, risks to our financial performance. Such trends may include, but are not limited to, the following:
• | Declining economies, foreign currency fluctuations, and the pace of economic recovery can change consumer spending behaviors, such as cross-border travel patterns, on which a significant portion of our revenues are dependent. |
• | Low levels of consumer and business confidence typically associated with recessionary environments and those markets experiencing relatively high unemployment, may cause decreased spending by cardholders. |
• | Budgetary concerns in the United States and other countries around the world could affect the United States and other specific sovereign credit ratings, impact consumer confidence and spending, and increase the risks of operating in those countries. |
• | Emerging market economies tend to be more volatile than the more established markets we serve in the United States and Europe, and adverse economic trends may be more pronounced in such emerging markets. |
• | Financial institutions may restrict credit lines to cardholders or limit the issuance of new cards to mitigate cardholder defaults. |
• | Uncertainty and volatility in the performance of our clients' businesses may make estimates of our revenues, rebates, incentives, and realization of prepaid assets less predictable. |
• | Our clients may decrease spending for value-added services. |
• | Government intervention, including the effect of laws, regulations, and /or government investments in our clients, may have potential negative effects on our business and our relationships with our clients or otherwise alter their strategic direction away from our products. |
A weakening in the economy could also force some retailers to close, resulting in exposure to potential credit losses and declines in transactions, and reduced earnings on transactions due to a potential shift to large discount merchants. Additionally, credit card issuers may reduce credit limits and become more selective in their card issuance practices. Changes in economic conditions could adversely impact our future revenues and profits and result in a downgrade of our debt ratings, which may lead to termination or modification of certain contracts and make it more difficult for us to obtain new business. Any of these developments could have a material adverse impact on our overall business and results of operations.
Our ability to anticipate and respond to changing industry trends and the needs and preferences of our clients and consumers may affect our competitiveness or demand for our products, which may adversely affect our operating results.
Financial services, payments, and technology industries are subject to rapid technological advancements, new products and services, including mobile payment applications, evolving competitive landscape, developing industry standards, and changing client and consumer needs and preferences. We expect that new services and technologies applicable to the financial services, payments, and technology industries will continue to emerge. These changes in technology may limit the competitiveness of and demand for our services. Also, our clients and their customers continue to adopt new technology for business and personal uses. We must anticipate and respond to these changes in order to remain competitive within our relative markets. For example, our ability to provide innovative point-of-sale technology to our merchant clients could have an impact on our Global Business Solutions business.
Failure to develop value-added services that meet the needs and preferences of our clients could have an adverse effect on our ability to compete effectively in our industry. Furthermore, clients' and their customers' potential negative reaction to our products
19
and services can spread quickly through social media and damage our reputation before we have the opportunity to respond. If we are unable to anticipate or respond to technological changes or evolving industry standards on a timely basis, our ability to remain competitive could be materially adversely affected.
Substantial and increasingly intense competition worldwide in the financial services, payments, and technology industries may materially and adversely affect our overall business and operations.
Financial services, payments, and technology industries are highly competitive and our payment solutions compete against all forms of financial services and payment systems, including cash and checks, and electronic, mobile, and eCommerce payment platforms. If we are unable to differentiate ourselves from our competitors, drive value for our clients and/or effectively align our resources with our goals and objectives, we may not be able to compete effectively. Our competitors may introduce their own value-added or other services or solutions more effectively than we do, which could adversely impact our growth. We also compete against new entrants that have developed alternative payment systems, eCommerce payment systems, and payment systems for mobile devices. Failure to compete effectively against any of these competitive threats could have a material adverse effect on us. In addition, the highly competitive nature of our industry could lead to increased pricing pressure which could have a material impact on our overall business and results of operations.
Potential changes in the competitive landscape, including disintermediation from other participants in the payments value chain, could harm our business.
We expect that the competitive landscape will continue to change, including:
• | Rapid and significant changes in technology, resulting in new and innovative payment methods and programs that could place us at a competitive disadvantage and that could reduce the use of our products. |
• | Competitors, clients, governments, and other industry participants may develop products that compete with or replace our value-added products and services. |
• | Participants in the financial services, payments, and technology industries may merge, create joint ventures, or form other business combinations that may strengthen their existing business services or create new payment services that compete with our services. |
• | New services and technologies that we develop may be impacted by industry-wide solutions and standards related to migration to EMV chip technology, tokenization, or other safety and security technologies. |
Failure to compete effectively against any of these competitive threats could have a material adverse effect on us.
Our Global Business Solutions business depends, in part, on our merchant relationships and alliances. If we are unable to maintain these relationships and alliances, our business may be adversely affected.
Our alliance structures take on different forms, including consolidated subsidiaries, equity method investments, and revenue sharing arrangements. Under our alliance program, a bank or other institution forms an alliance with us on an exclusive basis, either contractually or through a separate legal entity. Merchant contracts may be contributed to the alliance by us and/or the bank or institution. The banks and other institutions generally provide card association sponsorship, clearing, and settlement services and typically act as a merchant referral source when the institution has an existing banking or other relationship with such merchant. We provide transaction processing and related functions. Both we and our alliance partners may also provide management, sales, marketing, and other administrative services. The alliance structure allows us to be the processor for multiple financial institutions, any one of which may be selected by the merchant as its bank partner. Our Global Business Solutions business is dependent, in part, on our merchant relationships, alliances, and other distribution channels. We are working with our alliance partners to grow their businesses. There can be no guarantee that our efforts will be successful and that we will achieve growth in our merchant relationships, alliances, and other distribution channels. In addition, our contractual arrangements with our merchants and merchant alliance partners are for fixed terms and may also allow for early termination upon the occurrence of certain events. There can be no assurance that we will be able to renew our contractual arrangements with these merchants or merchant alliance partners on similar terms or at all. The loss of merchant relationships or alliance and financial institution partners could negatively impact our business and result in a reduction of our revenue and profit.
Risk Relating to Brexit
The implementation of the United Kingdom’s decision to exit the European Union (referred to as Brexit) could, among other outcomes, disrupt the free movement of goods, services, and people between the U.K. and the E.U., undermine bilateral cooperation in key policy areas, and significantly disrupt trade between the U.K. and the E.U. The effects of Brexit will depend in part on any agreements the U.K. makes to retain access to E.U. markets. These agreements could potentially disrupt the markets we serve and
20
the tax jurisdictions in which we operate and adversely change tax benefits or liabilities in these or other jurisdictions. In addition, Brexit could lead to legal uncertainty and potentially divergent national laws and regulations as the U.K. determines which E.U. laws to replace or replicate. Given the lack of comparable precedent, it is unclear what financial, trade, and legal implications the withdrawal of the U.K. from the E.U. will have and how such withdrawal will affect us.
In addition, Brexit may create additional uncertainty in currency exchange rate fluctuations that may result in the strengthening of the U.S. dollar against foreign currencies in which we conduct business. We translate revenue denominated in foreign currency into U.S. dollars for our financial statements. During periods of a strengthening dollar, our reported international revenue is reduced because foreign currencies translate into fewer U.S. dollars.
Any of these effects of Brexit, among others, could materially adversely affect our relationships with our existing and future clients and suppliers, which could have an adverse effect on our business, financial results, and business opportunities.
Failure to obtain new clients or renew client contracts on favorable terms could adversely affect results of operations and financial condition.
Most of our sales involve long-term contracts, which generally require a notice period prior to their scheduled expiration if a client chooses not to renew. Some of these contracts may also allow for early termination upon the occurrence of certain events such as a change in control. While a vast majority of our contracts remain in effect through their scheduled expiration, we may face pricing pressure in obtaining and retaining our larger clients. Some of our competitors may offer more attractive fees to our current and prospective clients, or other services that we do not offer. Larger clients may be able to seek lower prices from us when they renew a contract, when a contract is extended, or when the client’s business has significant volume changes. They may also reduce services if they decide to move services in-house. Further, our SMB clients may exert pricing pressure due to pricing competition or other economic needs or pressures such clients experience from their customers. On some occasions, this pricing pressure results in lower revenue from a client than we had anticipated based on our previous agreement with that client. This reduction in revenue could result in an adverse effect on our business, operating results, and financial condition.
For potential clients of our business segments, switching from one vendor of core processing or related software and services (or from an internally-developed system) to a new vendor is a significant undertaking. As a result, potential clients often resist change. We seek to overcome this resistance through strategies such as making investments to enhance the functionality of our software. However, there can be no assurance that our strategies for overcoming potential clients’ reluctance to change vendors will be successful, and this resistance may adversely affect our growth.
Security breaches or attacks on our systems may have a significant effect on our business.
In order to provide our services, we process, store, and transmit sensitive business information and personal consumer information, including, but not limited to, names, bankcard numbers, home or business addresses, social security numbers, driver's license numbers, and bank account numbers. Under the card network rules, various federal, state and international laws, and client contracts, we are responsible for information provided to us by financial institutions, merchants, ISOs, third-party service providers, and others. The confidentiality of such sensitive business information and personal consumer information that resides on our systems is critical to our business. We cannot be certain that the security measures and procedures we have in place to protect this sensitive data will be successful or sufficient to counter all current and emerging technology threats designed to breach our systems in order to gain access to confidential information. The increasing sophistication of cyber criminals and their continuous attempts to breach our system has increased the risk of a security breach of our systems. A breach of our products or systems processing or storing sensitive business information or personal consumer information could lead to claims against us, reputational damage, lost clients and lost revenue, substantial additional costs (including costs of notification of consumers, credit monitoring, card reissuance, contact centers and forensics), loss of our financial institution sponsorship, loss of clients' and their customers’ confidence, as well as imposition of fines and damages, or potential restrictions imposed by card networks on our ability to process transactions, all of which could have a material adverse effect on our revenues, profitability, financial condition, and future growth. In addition, as security threats continue to evolve we will be required to invest additional resources to modify the security of our systems. The level of required investment could have a material adverse effect on our results of operations.
We may experience breakdowns in our processing systems that could damage client relations and expose us to liability.
Our core business depends heavily on the reliability of our processing systems. A system outage could have a material adverse effect on our business, financial condition, and results of operations. Not only would we suffer damage to our reputation in the event of a system outage, but we may also be liable to third parties. Many of our contractual agreements with clients require us to pay penalties if our systems do not meet certain operating standards. To successfully operate our business, we must be able to protect our processing and other systems from interruption, including from events that may be beyond our control. Events that
21
could cause system interruptions include, but are not limited to, fire, natural disaster, unauthorized entry, power loss, telecommunications failure, computer viruses, terrorist acts, cyber attacks, and war. Although we have taken steps to protect against data loss and system failures, there is still risk that we may lose critical data or experience system failures. To help protect against these events, we perform the vast majority of disaster recovery operations ourselves, but we also utilize select third parties for certain operations, particularly outside of the United States. To the extent we outsource our disaster recovery, we are at risk of the vendor’s unresponsiveness or other failures in the event of breakdowns in our systems. In addition, our property and business interruption insurance may not be adequate to compensate us for all losses or failures that may occur.
Disruptions at other participants in the global financial system could prevent us from delivering our products and services.
The operations and systems of many participants in the global financial system are interconnected. Many of the transactions that involve our products and services rely on multiple participants in the global financial system to accurately move funds and communicate information to the next participant in the transaction chain. A disruption for any reason at one of the participants in the global financial system could impact our ability to obtain or provide information or cause funds to be moved in a manner to successfully deliver our products and services. Although we work with other participants to avoid any disruptions, there is no assurance that such efforts will be effective. Such a disruption could lead to the inability for us to deliver products and services, reputational damage, lost clients and lost revenue, loss of clients' and their customers' confidence, as well as additional costs, all of which could have a material adverse effect on our revenues, profitability, financial condition, and future growth.
We may experience software defects, computer viruses, and development delays, which could damage client relations, our potential profitability and expose us to liability.
Our products are based on sophisticated software and computing systems that often encounter development delays, and the underlying software may contain undetected errors, viruses, or defects. Defects in our software products and errors or delays in our processing of electronic transactions could result in additional development costs, diversion of technical and other resources from our other development efforts, loss of credibility with current or potential clients, harm to our reputation, fines imposed by card networks, or exposure to liability claims. In addition, we rely on technologies supplied to us by third parties that may also contain undetected errors, viruses or defects that could have a material adverse effect on our business, financial condition and results of operations. Although we attempt to limit our potential liability for warranty claims through disclaimers in our software documentation and limitation-of-liability provisions in our license and other agreements with our clients, we cannot assure that these measures will be successful in limiting our liability.
Our merchants may be unable to satisfy obligations for which we may also be liable.
We are subject to the risk of our merchants being unable to satisfy obligations for which we may also be liable. For example, we and our merchants acquiring alliances may be subject to contingent liability for transactions originally acquired by us that are disputed by the cardholder and charged back to the merchants. If we or the alliance is unable to collect this amount from the merchant because of the merchant’s insolvency or other reasons, we or the alliance will bear the loss for the amount of the refund paid to the cardholder. We have an active program to manage our credit risk and often mitigate our risk by obtaining collateral. It is possible, however, that a default on such obligations by one or more of our merchants could have a material adverse effect on our business. For further information on our merchant credit losses, see note 1 "Summary of Significant Policies" to our consolidated financial statements in Part II, Item 8 of this Form 10-K.
Fraud by merchants or others could have a material adverse effect on our business, financial condition, and results of operations.
We may be subject to potential liability for fraudulent electronic payment transactions or credits initiated by merchants or others. Examples of merchant fraud include when a merchant or other party knowingly uses a stolen or counterfeit credit, debit or prepaid card, card number, or other credentials to record a false sales transaction, processes an invalid card, or intentionally fails to deliver the merchandise or services sold in an otherwise valid transaction. Criminals are using increasingly sophisticated methods to engage in illegal activities such as counterfeiting and fraud. It is possible that incidents of fraud could increase in the future. Failure to effectively manage risk and prevent fraud would increase our chargeback liability or other liability. Increases in chargebacks or other liability could have a material adverse effect on our business, financial condition, and results of operations.
Future consolidation of financial institution clients or other client groups may adversely affect our financial condition.
Bank industry consolidation could affect existing and potential clients in our service areas. Our alliance strategy could also be negatively affected by consolidations, especially where the banks involved are committed to their internal merchant processing businesses that compete with us. Bank consolidation has led to an increasingly concentrated client base, resulting in a changing
22
client mix as well as increased price compression. Further consolidation in the bank industry or other client base could have a negative impact on us, including a loss of revenue and price compression.
We rely on various financial institutions to provide clearing services in connection with our settlement activities. If we are unable to maintain clearing services with these financial institutions and are unable to find a replacement, our business may be adversely affected.
We rely on various financial institutions to provide clearing services in connection with our settlement activities. If such financial institutions should stop providing clearing services or limit our volumes we must find other financial institutions to provide those services. If we are unable to find a replacement financial institution we may no longer be able to provide processing services to certain clients, which could negatively impact our revenue and earnings.
Because we rely on third-party vendors to provide products and services, we could be adversely impacted if they fail to fulfill their obligations.
Our business is dependent on third-party vendors to provide us with certain products and services. The failure of these vendors to perform their obligations in a timely manner could adversely affect our operations and profitability. In addition, if we are unable to renew our existing contracts with our most significant vendors, we might not be able to replace the related product or service at the same cost, which would negatively impact our profitability.
Changes in card association and debit network fees or products could increase costs or otherwise limit our operations.
From time to time, card associations and debit networks increase the organization and/or processing fees (known as interchange fees) that they charge. It is possible that competitive pressures will result in us absorbing a portion of such increases in the future, which would increase our operating costs, reduce our profit margin, and adversely affect our business, operating results, and financial condition. In addition, the various card associations and networks prescribe certain capital requirements. Any increase in the capital level required would further limit our use of capital for other purposes.
Our business may be adversely affected by geopolitical and other risks associated with operations outside of the United States and, as we continue to expand internationally, we may incur higher than anticipated costs and may become more susceptible to these risks.
We offer merchant acquiring, processing and issuing services outside of the United States, including in the United Kingdom, Germany, Argentina, Greece, India, and Brazil, where our principal non-U.S. operations are located. Our revenues derived from these and other non-U.S. operations are subject to additional risks, including those resulting from social and geopolitical instability and unfavorable political or diplomatic developments, all of which could negatively impact our financial results.
As we expand internationally and grow our non-U.S. client base, we may face challenges due to the presence of more established competitors and our lack of experience in such non-U.S. markets, and we may also incur higher than anticipated costs. If we are unable to successfully manage expenses relating to the international expansion of our business, our financial position and results of operations could be negatively impacted.
Cost savings initiatives may not produce the savings expected and may negatively impact our other initiatives and efforts to grow our business.
In recent years, we have implemented measures aimed at improving our profitability and maintaining flexibility in our capital resources, including restructuring efforts and the introduction of cost savings initiatives. We expect to continue to take measures to improve our profitability and cash flows from operating activities. However, there can be no assurance that the cost control measures will be successful. In addition, these and any future spending reductions, if any, may negatively impact our other initiatives or our efforts to grow our business, which may negatively impact our future results of operations and increase the burden on existing management, systems, and resources.
The ability to recruit, retain and develop qualified personnel is critical to our success and growth.
All of our businesses function at the intersection of rapidly changing technological, social, economic, and regulatory developments that requires a wide range of expertise and intellectual capital. For us to successfully compete and grow, we must retain, recruit, and develop the necessary personnel who can provide the needed expertise across the entire spectrum of our intellectual capital needs. In addition, we must develop our personnel to provide succession plans capable of maintaining continuity in our business. The market for qualified personnel, however, is competitive and we may not succeed in recruiting additional personnel or may
23
fail to effectively replace current personnel who depart with qualified or effective successors. Our effort to retain and develop personnel may also result in significant additional expenses, which could adversely affect our profitability. We cannot assure that key personnel, including executive officers, will continue to be employed or that we will be able to attract and retain qualified personnel in the future. Failure to retain or attract key personnel could have a material adverse effect on us.
Acquisitions and integrating such acquisitions create certain risks and may affect our operating results.
We have actively acquired businesses and may continue to make acquisitions of businesses or assets in the future. The acquisition and integration of businesses or assets involves a number of risks. The core risks are valuation (negotiating a fair price for the business), integration (managing the process of integrating the acquired company’s people, products, technology, and other assets to extract the value and synergies projected to be realized in connection with the acquisition), regulation (obtaining necessary regulatory or other government approvals that may be necessary to complete acquisitions), and diligence (identifying undisclosed or unknown liabilities or restrictions that will be assumed in the acquisition).
In addition, acquisitions outside of the United States often involve additional or increased risks including, for example:
• | managing geographically separated organizations, systems and facilities; |
• | integrating personnel with diverse business backgrounds and organizational cultures; |
• | complying with non-U.S. regulatory requirements; |
• | fluctuations in currency exchange rates; |
• | enforcement of intellectual property rights in some non-U.S. countries; |
• | difficulty entering new non-U.S. markets due to, among other things, consumer acceptance and business knowledge of these new markets; and |
• | general economic and political conditions. |
The process of integrating operations could cause an interruption of, or loss of momentum in, the activities of one or more of our combined businesses and the possible loss of key personnel. The diversion of management’s attention and any delays or difficulties encountered in connection with acquisitions and the integration of the two companies’ operations could have an adverse effect on our business, results of operations, financial condition or prospects.
Financial Risks
Our substantial leverage could adversely affect our ability to raise additional capital to fund our operations, limit our ability to react to changes in the economy or our industry, expose us to interest rate risk to the extent of our variable rate debt and prevent us from meeting our debt obligations.
We are highly leveraged. As of December 31, 2017, we had $19.2 billion of total debt. Our high degree of leverage could have important consequences, including:
• | increasing our vulnerability to adverse economic, industry or competitive developments; |
• | requiring a substantial portion of cash flow from operations to be dedicated to the payment of principal and interest on our indebtedness, therefore reducing our ability to use cash flow to fund our operations, capital expenditures, and future business opportunities; |
• | making it more difficult for us to satisfy our obligations with respect to our indebtedness, and any failure to comply with the obligations of our debt instruments, including restrictive covenants and borrowing conditions, could result in an event of default under the agreements governing such indebtedness; |
• | restricting us from making strategic acquisitions or causing us to make non-strategic divestitures; |
• | making it more difficult for us to obtain network sponsorship and clearing services from financial institutions or to obtain or retain other business with financial institutions; |
• | limiting our ability to obtain additional financing for working capital, capital expenditures, product development, debt service requirements, acquisitions, and general corporate or other purposes; and |
• | limiting our flexibility in planning for, or reacting to, changes in our business or market conditions and placing us at a competitive disadvantage compared to our competitors who are less highly leveraged and who, therefore, may be able to take advantage of opportunities that our leverage prevents us from exploiting. |
24
Our financial condition and results of operations are dependent in part upon our ongoing ability to refinance our maturing indebtedness at attractive interest rates.
Successful execution of our business strategy is dependent in part upon our ability to manage our capital structure to minimize interest expense and enhance free cash flow generation. Our senior secured revolving credit facility has $1.25 billion in commitments that are scheduled to mature in June 2020. In addition, approximately $1.7 billion of obligations under our existing long-term borrowings are scheduled to mature prior to December 31, 2020. We may not be able to refinance our senior secured credit facilities or our other existing indebtedness at or prior to their maturity at attractive rates of interest because of our high levels of debt, debt incurrence restrictions under our debt agreements or because of adverse conditions in credit markets generally.
An increase in interest rates may negatively impact our operating results and financial condition.
Certain of our borrowings, including borrowings under our senior secured credit facilities, are at variable rates of interest. An increase in interest rates would have a negative impact on our results of operations by causing an increase in interest expense.
As of December 31, 2017, we had $10.0 billion aggregate principal amount of variable rate long-term indebtedness, of which we have fixed interest rate collar contracts on $4.3 billion in notional amount. The interest rate collar contracts mitigate exposure to interest rate fluctuations, but are subject to contractual ceilings and floors. The interest rate collars provide for interest rate protection if one month LIBOR rises above 150 or 175 basis points. As a result, as of December 31, 2017, the impact of a 100 basis point increase in short-term interest rates on an annualized basis compared to the interest rates as of December 31, 2017, which for the one month LIBOR was 1.56%, and a corresponding and parallel shift in the remainder of the yield curve, would result in a $46 million increase in interest expense. See the discussion of our interest rate collar contracts in note 13 "Derivative Financial Instruments" to our consolidated financial statements in Part II, Item 8 of this Form 10-K.
Our debt agreements contain restrictions that limit our flexibility in operating our business.
The agreements governing our indebtedness contain various covenants that limit our ability to engage in specified types of transactions. These covenants limit our and certain of our subsidiaries' ability to, among other things:
• | incur additional indebtedness or issue certain preferred shares; |
• | pay dividends on, repurchase, or make distributions in respect of, our capital stock or make other restricted payments; |
• | make certain investments; |
• | sell certain assets; |
• | create liens; |
• | consolidate, merge, sell, or otherwise dispose of all or substantially all of our assets; and |
• | enter into certain transactions with our affiliates. |
A breach of any of these covenants could result in a default under one or more of these agreements, including as a result of cross-default provisions and, in the case of our senior secured revolving credit facility, permit the lenders to cease making loans to us. Upon the occurrence of an event of default under these agreements, the holders of our debt could elect to declare all amounts outstanding thereunder to be immediately due and payable and, in the case of our senior secured revolving credit facility, terminate all commitments to extend further credit. Such actions by these holders could cause cross-defaults under our other indebtedness. If we were unable to repay those amounts, the lenders under our senior secured credit facilities or holders of our senior secured notes could proceed against the collateral securing such debt. We have pledged a significant portion of our assets as collateral under our senior secured credit facilities and our senior secured notes. If the holders of our debt accelerate the repayment of borrowings, we may not have sufficient assets to repay our senior secured credit facilities or any other debt that may become due as a result of that acceleration and we could experience a material adverse effect on our financial condition and results of operations.
Our consolidated balance sheet includes significant amounts of goodwill and intangible assets. The impairment of a significant portion of these assets would negatively affect our financial condition and results of operations.
Our consolidated balance sheet includes goodwill and intangible assets that represent approximately 45% of our total assets as of December 31, 2017. These assets consist primarily of goodwill and client relationship intangible assets associated with our acquisitions. We also expect to engage in additional acquisitions, which may result in our recognition of additional goodwill and intangible assets. Under current accounting standards, we are required to amortize certain intangible assets over the useful life of the asset, while goodwill and certain other intangible assets are not amortized. On a regular basis we assess whether there have been impairments in the carrying value of goodwill and certain intangible assets. If the carrying value of the asset is determined to be impaired, then it is written down to fair value by a charge to operating earnings. An impairment of a significant portion of goodwill or intangible assets could have a material adverse effect on our financial condition and results of operations.
25
Our results of operations may be adversely affected by changes in foreign currency exchange rates.
We are subject to risks related to the changes in currency rates as a result of our investments in non-U.S. operations and from revenues generated in currencies other than the U.S. dollar. Revenue and profit generated by such non-U.S. operations will increase or decrease compared to prior periods as a result of changes in foreign currency exchange rates. From time to time, we utilize foreign currency forward contracts or other derivative instruments to mitigate the market value risks associated with foreign currency-denominated transactions. These hedge contracts may not, however, eliminate all of the risks related to foreign currency translation. In addition, we may become subject to exchange control regulations that restrict or prohibit the conversion of our other revenue currencies into U.S. dollars. Any of these factors could decrease the value of revenues and earnings we derive from our non-U.S. operations and have a material adverse impact on our business.
Unfavorable resolution of tax contingencies could adversely affect our results of operations and cash flows from operations.
Our tax returns and positions are subject to review and audit by federal, state, local, and international taxing authorities. An unfavorable outcome to a tax audit could result in higher tax expense, thereby negatively impacting our results of operations as well as our cash flows from operations. We have established contingency reserves for material, known tax exposures relating to deductions, transactions, and other matters involving some uncertainty as to the proper tax treatment of the item. These reserves reflect what we believe to be reasonable assumptions as to the likely final resolution of each issue if raised by a taxing authority. While we believe that the reserves are adequate to cover reasonably expected tax risks, there is no assurance that, in all instances, an issue raised by a tax authority will be finally resolved at a financial cost not in excess of any related reserve. An unfavorable resolution, therefore, could negatively impact our effective tax rate, financial position, results of operations, and cash flows in the current and/or future periods. Refer to note 8 "Income Taxes" to our consolidated financial statements included in Part II, Item 8 of this Form 10-K for more information.
Changes in tax laws and regulations could adversely affect our results of operations and cash flows from operations.
Our operations are subject to tax by federal, state, local, and international taxing jurisdictions. Changes in tax laws, in our significant tax jurisdictions could materially increase the amount of taxes we owe, thereby negatively impacting our results of operations as well as our cash flows from operations. For example, although we expect to benefit from the recently enacted changes in US tax laws, the limitations on the deductibility of interest expense in the U.S. negatively impact our effective tax rate, results of operations, and cash flows. We are working to reduce our net interest expense and increase our EBITDA in the U.S. However, to the extent we are unable to make enough progress, the negative impact will continue.
Regulatory and Legal Risks
Failure to comply with, or changes in, laws, regulations and enforcement activities may adversely affect the products, services, and markets in which we operate.
We and our clients are subject to laws and regulations that affect the electronic payments industry in the many countries in which our services are used. In particular, our clients are subject to numerous laws and regulations applicable to banks, financial institutions, and card issuers in the United States and abroad, and, consequently, we are at times affected by these federal, state, and local laws and regulations. The United States government has increased its scrutiny of a number of credit card and other loan practices, from which some of our clients derive significant revenue. Regulation of the payments industry, including regulations applicable to us and our clients, has increased significantly in recent years. Failure to comply with laws and regulations applicable to our business may result in the suspension or revocation of licenses or registrations, the limitation, suspension or termination of services, and/or the imposition of consent orders or civil and criminal penalties, including fines which could have an adverse effect on our results of operation and financial condition.
We are subject to U.S. and international financial services regulations, a myriad of consumer protection laws, economic sanctions, laws and regulations, and anti-corruption laws, escheat regulations and privacy and information security regulations to name only a few. Changes to legal rules and regulations, or interpretation or enforcement of them, could have a negative financial effect on us. In particular, changing regulations or standards in the area of privacy and data protection could also adversely impact us. For example, the General Data Protection Regulation (GDPR), which becomes effective in May 2018, extends the scope of the E.U. data protection law to all companies processing data of E.U. residents, regardless of the company’s location. The law requires companies to meet new requirements regarding the handling of personal data. Our efforts to comply with GDPR and other privacy and data protection laws may entail substantial expenses, may divert resources from other initiatives and projects, and could limit the services we are able to offer. Further, failure to meet GDPR requirements could result in fines, penalties, and reputational damage. The GDPR and other privacy and data protection laws may be interpreted and applied differently from country to country and may create inconsistent or conflicting requirements. Such regulations increase our compliance and administrative burden
26
significantly. In addition, E.U. laws and regulations are typically subject to different and potentially inconsistent interpretations by the countries that are members of the E.U., which can make compliance more costly and operationally difficult to manage. Moreover, the countries that are members of the E.U. may each have different and potentially inconsistent interpretations of regulations implementing the E.U. Payment Services, which could make compliance more costly and operationally difficult to manage.
Additionally, the Dodd-Frank Act significantly changed the United States financial regulatory system by, among other things, creating the CFPB to regulate consumer financial products and services (including many offered by our clients), restrict debit card fees paid by merchants to issuer banks and allow merchants to offer discounts for different payment methods. CFPB rules, examinations, and enforcement actions may require us to adjust our activities and may increase our compliance costs. The regulations under the Dodd-Frank Act require all debit card issuing financial institutions to participate in at least two, unaffiliated debit networks (banning exclusivity agreements between one debit network and one debit card issuer) and prohibit card issuers and payment networks from inhibiting the ability of merchants to choose among the enabled debit networks for the routing of each debit card transaction. Changes to the Dodd-Frank Act or regulations could adversely impact our debit network business. In addition, certain of our alliance partners are subject to regulation by federal and state authority and, as a result, could pass through some of those compliance obligations to us.
Failure to comply with the U.S. Foreign Corrupt Practices Act, anti-money laundering, economic and trade sanctions regulations, and similar laws could subject us to penalties and other adverse consequences.
We operate our business around the world, including in certain foreign countries with developing economies, where companies often engage in business practices that are prohibited by U.S. and U.K. regulations, including the FCPA and the U.K. Bribery Act. Such laws prohibit improper payments or offers of payments to foreign governments and their officials and political parties by the U.S. and other business entities for the purpose of obtaining or retaining business. We have implemented policies to discourage such practices; however, there can be no assurance that all of our employees, consultants, and agents, including those that may be based in or from countries where practices that violate U.S. laws may be customary, will not take actions in violation of our policies, for which we may be ultimately responsible.
In addition, we are subject to anti-money laundering laws and regulations, including the Bank Secrecy Act (BSA). Among other things, the BSA requires money services businesses (such as money transmitters and providers of prepaid access) to develop and implement risk-based anti-money laundering programs, report large cash transactions and suspicious activity, and maintain transaction records. Our subsidiary Money Network Financial LLC provides prepaid access for various open loop prepaid programs for which it is the program manager and therefore must meet the requirements of the Financial Crimes Enforcement Network, the agency that enforces the BSA.
We are also subject to certain economic and trade sanctions programs that are administered by the OFAC which prohibit or restrict transactions to or from or dealings with specified countries, their governments, and in certain circumstances, their nationals, and with individuals and entities that are specially-designated nationals of those countries, narcotics traffickers, and terrorists or terrorist organizations.
Similar anti-money laundering and counter terrorist financing and proceeds of crime laws apply to movements of currency and payments through electronic transactions and to dealings with persons specified in lists maintained by the country equivalents to OFAC lists in several other countries and require specific data retention obligations to be observed by intermediaries in the payment process. Our businesses in those jurisdictions are subject to those data retention obligations.
Failure to comply with any of these laws and regulations or changes in this regulatory environment, including changing interpretations and the implementation of new or varying regulatory requirements by the government, may result in significant financial penalties, reputational harm, or change the manner in which we currently conduct some aspects of our business, which could significantly affect our results of operations or financial condition.
Changes in credit card association or other network rules or standards could adversely affect our business.
In order to provide our transaction processing services, several of our subsidiaries are registered with Visa and MasterCard and other networks as members or service providers for member institutions. As such, we and many of our clients are subject to card association and network rules that could subject us or our clients to a variety of fines or penalties that may be levied by the card associations or networks for certain acts or omissions by us, acquiring clients, processing clients, and merchants. Visa, MasterCard, and other networks, some of which are our competitors, set the rules and standards with which we must comply. The termination of our member registration or our status as a certified service provider, or any changes in card association or other network rules or standards, including interpretation and implementation of the rules or standards, that increase the cost of doing business or limit
27
our ability to provide transaction processing services to or through our clients, could have an adverse effect on our business, results of operations, and financial condition.
Failure to protect our intellectual property rights and defend ourselves from potential patent infringement claims may diminish our competitive advantages or restrict us from delivering our services.
Our trademarks, patents, and other intellectual property are important to our future success. The First Data trademark and trade name and the STAR trademark and trade name are intellectual property rights which are individually material to us. These trademarks and trade names are widely recognized and associated with quality and reliable service. Loss of the proprietary use of the First Data or STAR trademarks and trade names or a diminution in the perceived quality associated with them could harm the growth of our businesses. We also rely on proprietary technology. It is possible that others will independently develop the same or similar technology. Further, we use open source architecture in connection with our solutions, in particular our Clover open architecture platform. Companies that incorporate open source platforms into their solutions have, from time to time, faced claims challenging the ownership of such platforms. As a result, we could be subject to suits by parties claiming ownership of what we believe to be open source software. We cannot guarantee that we can protect our trade secrets, know-how, or other proprietary information. Our patents could be challenged, invalidated or circumvented by others, and may not be of sufficient scope or strength to provide us with any meaningful protection or advantage. If we are unable to maintain the proprietary nature of our technologies, we could lose competitive advantages and be materially adversely affected. Additionally, the laws of certain non-U.S. countries where we do business or contemplate doing business in the future may not recognize intellectual property rights or protect them to the same extent as do the laws of the United States. Adverse determinations in judicial or administrative proceedings could prevent us from selling our services or prevent us from preventing others from selling competing services, and thereby may have a material adverse effect on the business and results of operations. Additionally, claims have been made, are currently pending, and other claims may be made in the future, with regard to our technology allegedly infringing on a patent or other intellectual property rights. Unfavorable resolution of these claims could either result in us being restricted from delivering the related product or service or result in a settlement that could be materially adverse to us.
Failure to comply with state and federal antitrust requirements could adversely affect our business.
Through our merchant alliances, we hold an ownership interest in several competing merchant acquiring businesses while serving as an electronic processor for those businesses. In order to satisfy state and federal antitrust requirements, we actively maintain an antitrust compliance program. Notwithstanding our compliance program, it is possible that perceived or actual violations of state or federal antitrust requirements could give rise to regulatory enforcement investigations or actions. Regulatory scrutiny of, or regulatory enforcement action in connection with, compliance with state and federal antitrust requirements could have a material adverse effect on our reputation and business.
We are the subject of various legal proceedings which could have a material adverse effect on our revenue and profitability.
We are involved in various litigation matters. We are also involved in or are the subject of governmental or regulatory agency inquiries or investigations and make voluntary self-disclosures to government or regulatory agencies from time to time. Our insurance or indemnities may not cover all claims that may be asserted against us, and any claims asserted against us, regardless of merit or eventual outcome, may harm our reputation. If we are unsuccessful in our defense in these litigation matters, or any other legal proceeding, we may be forced to pay damages or fines, enter into consent decrees, and/or change our business practices, any of which could have a material adverse effect on our revenue and profitability.
Our ability to utilize net operating loss carryforwards could be limited if we were to experience an ownership change as defined in the Internal Revenue Code.
Section 382 of the Internal Revenue Code of 1986, as amended (Code), contains rules that impose an annual limitation on the ability of a company with net operating loss carryforwards that undergoes an ownership change, which is generally any change in ownership of more than 50% of its stock (by value) over a three-year period, to utilize its net operating loss carryforwards in years after the ownership change. These rules generally operate by focusing on ownership changes among holders owning directly or indirectly 5% or more of the shares of stock of a company or any change in ownership arising from a new issuance of shares of stock by such company. If a company’s income in any year is less than the annual limitation prescribed by Section 382 of the Code, the unused portion of such limitation amount may be carried forward to increase the limitation (and net operating loss carryforward utilization) in subsequent tax years.
Our initial public offering in October 2015 and the subsequent follow-on secondary offering in September 2017 did not result in an ownership change within a three-year period for purposes of Section 382 of the Code. If, however, we were to undergo an ownership change as a result of future transactions involving our common stock, including a follow-on offering of our common
28
stock or purchases or sales of common stock between 5% holders, our ability to use our net operating loss carryforwards would be subject to the limitations of Section 382 of the Code. It is possible that a portion of our net operating loss carryforwards may expire before we would be able to use them. In the event we are unable to utilize our net operating loss carryforwards, there may be a negative impact on our financial position and results of operations.
In addition to the aforementioned federal income tax implications pursuant to Section 382 of the Code, most states follow the general provisions of Section 382 of the Code, either explicitly or implicitly resulting in separate state net operating loss limitations.
Risks Related to Ownership Structure
Kohlberg Kravis Roberts & Co. L.P. (KKR) controls us and its interests may conflict with ours or yours in the future.
KKR controls a majority of the combined voting power of our common stock. As a result, KKR has the ability to elect all of the members of our Board and thereby control our policies and operations, including the appointment of management, future issuances of our Class A common stock or other securities, the payment of dividends, if any, on our Class A common stock, the incurrence of debt by us, amendments to our amended and restated certificate of incorporation and amended and restated bylaws, and the entering into of extraordinary transactions and the interests of KKR may not in all cases be aligned with your interests.
In addition, KKR may have an interest in pursuing acquisitions, divestitures and other transactions that, in its judgment, could enhance its investment, even though such transactions might involve risks to you. For example, KKR could cause us to make acquisitions that increase our indebtedness or cause us to sell revenue-generating assets. KKR is in the business of making investments in companies and may from time to time acquire and hold interests in businesses that compete directly or indirectly with us. Our amended and restated certificate of incorporation provides that none of KKR or any director who is not employed by us (including any nonemployee director who serves as one of our officers in both his or her director and officer capacities) or his or her affiliates will have any duty to refrain from engaging, directly or indirectly, in the same business activities or similar business activities or lines of business in which we operate. KKR also may pursue acquisition opportunities that may be complementary to our business, and, as a result, those acquisition opportunities may not be available to us.
So long as a KKR affiliate continues to beneficially own a sufficient number of shares of Class B common stock, even if it beneficially owns significantly less than 50% of the shares of our outstanding common stock, it will continue to be able to effectively control our decisions. For example, if our Class B common stock amounted to 15% of our outstanding common stock, beneficial owners of our Class B common stock (including KKR), would collectively control 64% of the voting power of our common stock. The shares of our Class B common stock beneficially owned by a KKR affiliate may be transferred to an unrelated third party if the holders of a majority of the shares of Class B common stock have consented to such transfer in writing in advance.
In addition, KKR will be able to determine the outcome of all matters requiring stockholder approval and will be able to cause or prevent a change of control of our Company or a change in the composition of our Board and could preclude any acquisition of our Company. This concentration of voting control could deprive you of an opportunity to receive a premium for your shares of Class A common stock as part of a sale of our Company and ultimately might affect the market price of our Class A common stock.
ITEM 1B. | UNRESOLVED STAFF COMMENTS |
None.
ITEM 2. | PROPERTIES |
As of December 31, 2017, we and our subsidiaries owned or leased 79 domestic properties and 72 international properties. These facilities are used for operational, sales and administrative purposes, and are substantially all utilized.
Leased Facilities | Owned Facilities | ||||||||||
No. | Sq. Ft. | No. | Sq. Ft. | ||||||||
Facilities in the United States | 68 | 2,314,559 | 11 | 1,592,740 | |||||||
International Facilities | 64 | 1,062,884 | 8 | 409,899 | |||||||
• | Global Business Solutions’ principal operations are conducted in Atlanta, Georgia; New York, New York; Coral Springs, Florida; Hagerstown, Maryland; King of Prussia, Pennsylvania; Chicago, Illinois; Marietta, Georgia; London, United Kingdom; São Paulo, Brazil; Singapore, Singapore; Warsaw, Poland; and Buenos Aires, Argentina. |
29
• | Global Financial Solutions' principal operations are located in New York, New York; Omaha, Nebraska; Chesapeake, Virginia; London, United Kingdom; Warsaw, Poland; Buenos Aires, Argentina; Attica, Greece; and Frankfurt, Germany. |
• | Network & Security Solutions' principal operations are located in Atlanta, Georgia; Omaha, Nebraska; Sugar Land, Texas; Wilmington, Delaware; and Greenwood Village, Colorado. |
• | Our Corporate facilities include New York, New York and Atlanta, Georgia. |
We believe that our facilities are suitable and adequate for our current business; however, we periodically review our space requirements and may acquire new space to meet the needs of our businesses or consolidate and dispose of or sublet facilities which are no longer required.
ITEM 3. | LEGAL PROCEEDINGS |
From time to time, we are involved in various litigation matters arising in the ordinary course of our business. None of these matters, individually or in the aggregate, currently is material to us. Information with respect to this item may be found in note 14 “Commitments and Contingencies” to our consolidated financial statements in Part II, Item 8 of this Form 10-K.
ITEM 4. | MINE SAFETY DISCLOSURES |
Not applicable.
30
PART II
ITEM 5. | MARKET FOR REGISTRANT’S COMMON EQUITY, RELATED STOCKHOLDER MATTERS AND ISSUER PURCHASES OF EQUITY SECURITIES |
Our Class A common stock has traded on the New York Stock Exchange under the symbol "FDC" since October 15, 2015. Prior to that date, there was no public trading market for our common stock.
Price Range of Class A common stock
The information presented in the table below represents the high and low closing sales prices per share of Class A common stock as reported on the NYSE for the periods indicated. There is currently no established public trading market for our Class B common stock.
High | Low | |||||||
2016 | ||||||||
First Quarter | $ | 15.95 | $ | 8.67 | ||||
Second Quarter | $ | 13.34 | $ | 10.13 | ||||
Third Quarter | $ | 14.48 | $ | 10.66 | ||||
Fourth Quarter | $ | 15.53 | $ | 13.03 | ||||
2017 | ||||||||
First Quarter | $ | 16.63 | $ | 14.88 | ||||
Second Quarter | $ | 18.71 | $ | 14.81 | ||||
Third Quarter | $ | 19.04 | $ | 17.47 | ||||
Fourth Quarter | $ | 19.08 | $ | 15.97 | ||||
There were 25 holders of record of our Class A common stock and 22 holders of record of our Class B common stock as of December 31, 2017. The number of beneficial owners of our Class A common stock is substantially greater than the number of record holders, because a large portion of our Class A common stock is held in "street name" by banks and brokers.
Share Buy Back
In connection with the vesting of restricted stock awards, shares of Class A common stock are delivered to the Company by employees to satisfy tax withholding obligations. The following table summarizes such purchases of Class A common stock in the three months ended December 31, 2017:
Total Number of Shares Purchased | Average Price Paid Per Share | Total Number of Shares Purchased Under Announced Program | Approximate Dollar Value of Shares That May Yet Be Purchased Under Announced Programs | ||||||||||
October 1, 2017 through October 31, 2017 | — | — | — | — | |||||||||
November 1, 2017 through November 30, 2017 | — | — | — | — | |||||||||
December 1, 2017 through December 31, 2017 | 288,134 | (a) | $ | 16.71 | — | — | |||||||
(a) | Shares surrendered to the Company to satisfy tax withholding obligations in connection with the vesting of restricted stock awards issued to employees. |
Dividend Policy
Since our initial public offering (IPO) on October 15, 2015, we have not declared or paid any cash dividends on our common stock, and we have no current plan to do so. Because a significant portion of our operations is through our subsidiaries, our ability to pay dividends depends in part on our receipt of cash dividends from our operating subsidiaries, which may further restrict our ability to pay dividends as a result of the laws of their jurisdiction of organization, agreements of our subsidiaries or covenants under any existing and future outstanding indebtedness we or our subsidiaries incur. In addition, the senior secured revolving credit facility, senior secured term loan facility, and the indentures governing the senior notes limit our ability to pay dividends.
31
Stock Performance Graph
The following graph shows a comparison from October 15, 2015 (the date our Class A common stock commenced trading on the NYSE) through December 31, 2017 of the cumulative total return for our Class A common stock, the S&P 500 Index and the S&P Information Technology Index. Data for the S&P 500 Index and the S&P Information Technology Index assume reinvestment of dividends. Note that historic stock price performance is not necessarily indicative of future stock price performance.
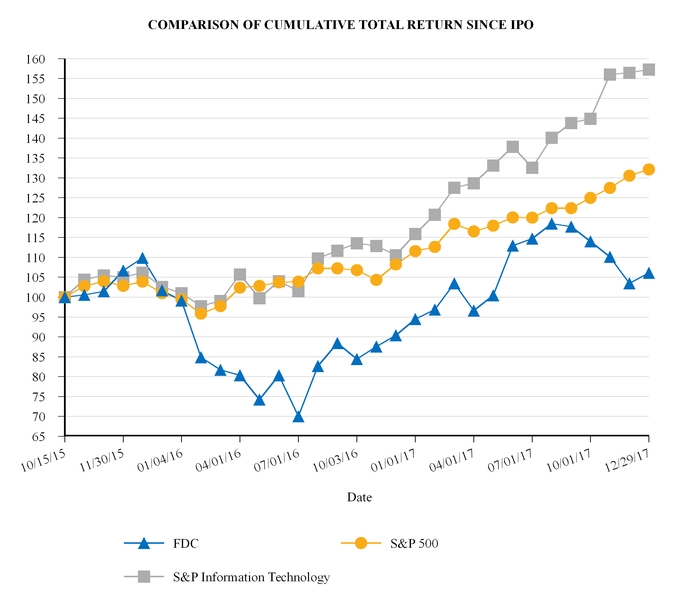
This performance graph shall not be deemed “soliciting material” or to be “filed” with the Securities and Exchange Commission for purposes of Section 18 of the Securities Exchange Act of 1934, as amended, or otherwise subject to the liabilities under that Section, and shall not be deemed to be incorporated by reference into any filing of First Data Corporation under the Securities Act of 1933, as amended.
ITEM 6. | SELECTED FINANCIAL DATA |
The following table sets forth our selected consolidated financial data as of the dates and for the periods indicated. The selected financial data as of December 31, 2017 and 2016 and for the years ended December 31, 2017, 2016, and 2015 have been derived from our audited consolidated financial statements and related notes appearing in Part II, Item 8 of this Form 10-K. The selected consolidated financial data as of December 31, 2015, 2014, and 2013 and for the years ended December 31, 2014 and 2013 have been derived from our audited consolidated financial statements and related notes thereto not included in this Form 10-K.
32
The results of operations for any period are not necessarily indicative of the results to be expected for any future period. The selected consolidated financial data set forth below should be read in conjunction with, and are qualified by reference to "Management's Discussion and Analysis of Financial Condition and Results of Operations" and the consolidated financial statements and related notes thereto included in Part II, Item 8 of this Form 10-K.
The notes to our consolidated financial statements in Part II, Item 8 of this Form 10-K contain additional information about various acquisitions, dispositions, and certain charges and benefits resulting from other operating expenses, and other income (expense) which affect the comparability of information presented. Amounts below include acquisitions since the date acquired.
December 31, | |||||||||||||||||||||
(in millions, except per share amounts) | 2017 | 2016 | 2015 | 2014 | 2013 | ||||||||||||||||
Statement of operations data (Year-end): | |||||||||||||||||||||
Revenues | $ | 12,052 | $ | 11,584 | $ | 11,451 | $ | 11,152 | $ | 10,809 | |||||||||||
Total revenues (excluding reimbursables) | 8,129 | 7,839 | 7,764 | 7,548 | 7,302 | ||||||||||||||||
Operating expenses (a) | 10,195 | 9,921 | 10,228 | 9,701 | 9,629 | ||||||||||||||||
Other operating expenses, net (b) | 143 | 61 | 53 | 13 | 56 | ||||||||||||||||
Total expenses (excluding reimbursables) | 6,415 | 6,237 | 6,594 | 6,110 | 6,178 | ||||||||||||||||
Interest expense, net | (937 | ) | (1,068 | ) | (1,537 | ) | (1,728 | ) | (1,856 | ) | |||||||||||
Net income (loss) | 1,664 | 660 | (1,268 | ) | (265 | ) | (775 | ) | |||||||||||||
Net income (loss) attributable to First Data Corporation | 1,465 | 420 | (1,481 | ) | (458 | ) | (952 | ) | |||||||||||||
Depreciation and amortization (c) | 1,073 | 1,061 | 1,133 | 1,163 | 1,212 | ||||||||||||||||
Net income (loss) per share (d): | |||||||||||||||||||||
Basic | $ | 1.60 | $ | 0.47 | $ | (7.70 | ) | $ | (458,000 | ) | $ | (952,000 | ) | ||||||||
Diluted | 1.56 | 0.46 | (7.70 | ) | (458,000 | ) | (952,000 | ) | |||||||||||||
Weighted-average common shares outstanding (d): | |||||||||||||||||||||
Basic (f) | 916 | 902 | 192 | — | — | ||||||||||||||||
Diluted (f) | 940 | 921 | 192 | — | — | ||||||||||||||||
Balance sheet data (As of year-end): | |||||||||||||||||||||
Total assets | $ | 48,269 | $ | 40,292 | $ | 34,362 | $ | 34,034 | $ | 34,962 | |||||||||||
Settlement assets | 20,363 | 14,795 | 8,150 | 7,557 | 7,553 | ||||||||||||||||
Total liabilities | 42,183 | 36,088 | 30,625 | 31,434 | 33,318 | ||||||||||||||||
Settlement obligations | 20,363 | 14,795 | 8,150 | 7,557 | 7,553 | ||||||||||||||||
Long-term borrowings | 17,927 | 18,131 | 18,737 | 20,697 | 22,499 | ||||||||||||||||
Other long-term liabilities (e) | 963 | 1,240 | 1,243 | 1,223 | 1,202 | ||||||||||||||||
Redeemable noncontrolling interest | 72 | 73 | 77 | 70 | 69 | ||||||||||||||||
Total equity | 6,014 | 4,131 | 3,660 | 2,530 | 1,575 | ||||||||||||||||
Cash flow data (Year-end): | |||||||||||||||||||||
Net cash provided by operating activities | $ | 2,047 | $ | 2,111 | $ | 795 | $ | 1,035 | $ | 715 | |||||||||||
Net cash used in investing activities | (1,950 | ) | (387 | ) | (685 | ) | (329 | ) | (353 | ) | |||||||||||
Net cash provided by (used in) financing activities | 9 | (1,734 | ) | (16 | ) | (743 | ) | (532 | ) | ||||||||||||
(a) | Operating expenses include Cost of services; Cost of products sold; Selling, general, and administrative; Depreciation and amortization; and Reimbursable debit network fees, postage and other. |
(b) | Other operating expenses, net includes restructuring, net; impairments; litigation and regulatory settlements; integration cost and other as applicable to the periods presented. See note 10 "Other Operating Expenses" to our consolidated financial statements in Part II, Item 8 of this Form 10-K for details. |
(c) | Includes amortization of initial payments for new contracts, which is recorded as a contra-revenue within “Transaction and processing service fees” and amortization related to equity method investments, which is netted within “Equity earnings in affiliates” in our consolidated statements of operations. |
(d) | As a result of the HoldCo Merger, all outstanding shares of FDH were converted into Class B common stock, which are entitled to ten votes per share. All of FDC's outstanding common stock was eliminated upon the merger. We accounted for the HoldCo Merger as a transfer of assets between entities under common control and have reflected the transactions impact on net loss per share and weighted-average shares on a prospective basis. |
(e) | Other long-term liabilities include Deferred tax liabilities. |
(f) Prior to our Initial Public Offering in 2015, we had 1,000 shares of common stock that was eliminated upon the merger with First Data Holdings.
33
ITEM 7. | MANAGEMENT’S DISCUSSION AND ANALYSIS OF FINANCIAL CONDITION AND RESULTS OF OPERATIONS |
The following contains management’s discussion and analysis of our financial condition and results of operations and should be read together with “Selected Financial Data,” included in Part II, Item 6 of this Form 10-K and our consolidated financial statements and related notes thereto included in Part II, Item 8 of this Form 10-K. This discussion contains forward-looking statements and involves numerous risks and uncertainties. Our actual results may differ materially from those anticipated in any forward-looking statements as a result of many factors, including those set forth under “Forward-Looking Statements,” “Risk Factors,” and elsewhere in this Form 10-K.
Year over year percent changes are calculated on whole-dollar values as management views this as a more accurate representation of our performance. As such, the values here-in may not recalculate due to rounding.
Executive Overview
First Data Corporation sits at the center of global electronic commerce. We believe we offer our clients the most complete array of integrated solutions in the industry, covering their needs across next generation commerce technologies, merchant acquiring, issuing, and network solutions. We serve our clients in over 100 countries, reaching approximately 6 million business locations over the course of a year and over 4,000 financial institutions. We believe we have the industry’s largest distribution network, driven by our partnerships with many of the world’s leading financial institutions, our direct sales force, and a network of distribution partners. We are the largest merchant acquirer, issuer processor, and independent network services provider in the world, enabling businesses to accept electronic payments, helping financial institutions issue credit, debit and prepaid cards, and routing secure transactions between them. In 2017, we processed 93 billion transactions globally, or approximately 3,000 transactions per second. In our largest market, the United States, we processed $2.1 trillion of payment volume, representing over 10% of United States gross domestic product (GDP) last year.
Our business is characterized by transaction related fees, multi-year contracts, and a diverse client base, which allows us to grow alongside our clients. Our multi-year contracts allow us to achieve a high level of recurring revenues with the same clients. While the contracts typically do not specify fixed revenues to be realized thereunder, they do provide a framework for revenues to be generated based on volume of services provided during such contracts term. Our business also generally requires minimal incremental capital expenditures and working capital to support additional revenue within our existing business lines.
Our Strategy
Our ability to grow our business is influenced by global expenditure growth, increasing our share in electronic payments and providing value-added products and services. We grow our business through diversification of product offerings such as credit, debit, prepaid, Clover, and our suite of security products. We believe we offer our clients the most complete array of integrated solutions in our industry, covering their needs across next-generation commerce technology, merchant acquiring, issuing, and network solutions. We believe this differentiates us from our competition and will continue to drive our growth in the future.
We work with a variety of partners to deliver our solutions. We help merchants by delivering data-driven insights and other services to help them grow and create better and secure purchase experiences for consumers across all commerce platforms. We assist merchants in day-to-day operations of their business via our Clover line of products which enables merchants to more efficiently run their businesses, build customer loyalty, and gain valuable insights that help grow their businesses. We provide financial institutions with solutions to help them grow their revenues, enhance customer satisfaction, and deliver their products more timely and efficiently.
We continue to execute on key initiatives:
◦ | Innovate for tomorrow's client needs |
◦ | Accelerate top line revenue growth |
◦ | Maintain positive operating leverage |
◦ | Generate significant free cash flow |
34
Components of Revenue
We generate revenue by providing commerce-enabling solutions. Set forth below is a description of our revenues by segment and factors impacting total revenues.
Global Business Solutions
Global Business Solutions (GBS) revenues are primarily derived from processing credit and debit card transactions for business clients and also include fees for providing processing, loyalty and software services, and sales and leases of POS devices. Revenues are generated from a variety of sources:
• | Discount fees, net of credit and debit card interchange and assessment fees charged by the payment networks. The discount fee is typically either a percentage of the purchase amount or an interchange fee plus a fixed dollar amount; |
• | Processing fees charged to our alliances; |
• | Processing fees charged to merchant acquirers who have outsourced their transaction processing to us; |
• | Sales and leases of POS devices; |
• | Fees from providing reporting and other services; and |
• | Software fees such as security and Clover related fees. |
A substantial portion of our business within GBS is conducted through merchant alliances between us and financial institutions. If we have management control over an alliance, then the alliance's financial statements are consolidated with ours and the related processing fees are treated as an intercompany transaction and eliminated upon consolidation. If we do not have management control over an alliance, we use the equity method of accounting. As a result, our consolidated revenues include processing fees charged to alliances accounted for under the equity method.
A large portion of GBS' revenue is derived from transaction and processing related services. This business is dependent on macroeconomic consumer trends and global economic conditions that affect the volume of consumer spending and the use of electronic payments and changes in these factors have in the past, impacted, and may in the future impact, our ability to grow this portion of the business. We have begun to implement recent initiatives, such as the introduction of several new products and expansion of our sales force, expanding through ISV partnerships, and expansion into new international markets in an effort to grow this business versus prior periods. We also completed acquisitions which have strengthened our presence in ISV and enterprise resource planning (ERP) integrated payment solutions.
Global Financial Solutions
Global Financial Solutions (GFS) revenues are derived from outsourced account processing services, customer communications, plastics personalization, remittance processing services, software solutions for clients to support in-house card processing, as well as other account services we provide to financial institutions. Revenues for GFS services are typically generated on the basis of number of total or active card accounts on file, volume of customer communications, volume of plastics personalized and mailed, volume of remittances processed, and license fees for our software solutions.
Network & Security Solutions
Network & Security Solutions (NSS) revenues are primarily derived from network services such as Electronic Funds Transfer (EFT) Network Solutions, Stored Value Network Solutions, Security and Fraud Management Solutions, and Government Solutions or Other.
Factors Affecting the Comparability of Our Results of Operations
As a result of a number of factors, our historical results of operations are not comparable from period to period and may not be comparable to our financial results of operations in future periods. Key factors affecting the comparability of our results of operations are summarized below.
35
Currency Impact
Although the majority of our revenue is earned in U.S. dollars, a portion of our revenues and expenses are in foreign currencies. As a result, changes in foreign currencies against the U.S. dollar can impact our results of operations. Additionally, we have intercompany debts in foreign currencies, which impacts our results of operations. We believe the presentation of constant currency provides relevant information and we use this non-GAAP financial measure to, among other things, evaluate our ongoing operations in relation to foreign currency fluctuations. The presentation of non-GAAP financial measures should not be considered in isolation or as a substitute for our related financial results prepared in accordance with GAAP (Generally Accepted Accounting Principles). For additional information on our constant currency calculation, see “Segment Results” within this Form 10-K.
Acquisitions and Dispositions
Acquisitions and dispositions over the past year have affected the comparability of our results. The largest acquisitions in 2017, CardConnect and BluePay, are being integrated into our Global Business Solutions segment and the results for the current period are included within the segment results.
Restructuring and Cost Management Initiatives
We continually evaluate our cost base and over the past three years have executed a number of restructuring initiatives, which have allowed us to streamline management, eliminate excess facilities, and work with our suppliers to lower costs. In connection with these initiatives, we have incurred restructuring charges of $83 million, $49 million and $53 million in 2017, 2016 and 2015, respectively. These Restructuring and Cost Management Initiatives have contributed to our 270 basis points EBITDA margin expansion over the past three years. The Company has ongoing expense management initiatives, which are expected to result in approximately $20 million in additional restructuring costs over the course of 2018. In connection with our focus on maintaining positive operating leverage, we will likely incur additional restructuring costs in the future. See note 10 “Other Operating Expenses” to our consolidated financial statements in Part II of this Form 10-K for additional information about our restructuring and cost savings initiatives.
Interest Expense
As a result of our capital market activities we have lowered the weighted-average interest rate of our outstanding debt from 5.0% as of December 31, 2016 to 4.8% as of December 31, 2017. Due to the current year acquisitions, we have increased our outstanding borrowings balance from $18.5 billion as of December 31, 2016 to $19.2 billion as of December 31, 2017. For the year ended December 31, 2017, we incurred $10 million in fees to modify existing long-term debt which is recorded within "Interest expense, net" in the consolidated statements of operations.
Debt Extinguishment Costs
We incurred $80 million, $70 million, and $1.1 billion of losses on debt extinguishment during the years ended December 31, 2017, 2016, and 2015, respectively.
Stock-Based Compensation Expense
The table below shows the stock-based compensation expense split between Cost of services and Selling, general, and administrative expense.
Year ended December 31, | ||||||||||||
(in millions) | 2017 | 2016 | 2015 | |||||||||
Cost of services | $ | 72 | $ | 112 | $ | 130 | ||||||
Selling, general, and administrative | 173 | 151 | 199 | |||||||||
Total | $ | 245 | $ | 263 | $ | 329 | ||||||
See note 4 “Stock Compensation Plans” to our consolidated financial statements in Part II, Item 8 of this Form 10-K for additional information about our stock compensation plans.
36
Management Fee Expenses
For the year ended December 31, 2015, we incurred approximately $100 million in KKR related expenses, of which $78 million related to the termination of our Management Agreement with KKR.
Results of Operations
Consolidated results should be read in conjunction with note 7 "Segment Information" to our consolidated financial statements in Part II, Item 8 of this Form 10-K, which provides more detailed discussions concerning certain components of our consolidated statements of operations. All significant intercompany accounts and transactions have been eliminated within the consolidated results.
Overview
Revenue for the year ended December 31, 2017 increased 4% to $12.1 billion from $11.6 billion in 2016 while operating profits increased 7% to $1.7 billion from $1.6 billion in 2016. On a constant currency basis, revenue increased 4%, driven primarily by our GBS segment. Foreign currency did not impact total revenue, however it negatively impacted operating profit by 1%.
Net income attributable to First Data Corporation for the year ended December 31, 2017 improved to $1.5 billion from $420 million during the same period in 2016. The improvement in net income is attributable to an income tax benefit of $810 million, lower interest expense of $131 million, and an increase in operating profit of $112 million driven by revenue growth, partially offset by a decrease in equity earnings of $38 million.
Net income attributable to First Data Corporation for the year ended December 31, 2016 improved to $420 million from a net loss of $1.5 billion during the same period in 2015. The improvement in net income is attributable to lower debt extinguishment charges of $1.0 billion, lower interest expense of $469 million, lower depreciation and amortization expense of $73 million, a $66 million decrease in stock-based compensation expense, and a $29 million gain on the Visa Europe share sale, partially offset by a $34 million loss on divestiture of an international business unit. Net income for the year ended December 31, 2016 also benefited by $100 million related to the termination of our management agreement with KKR, as well as overall expense savings as part of our announced expense management initiatives and improved operating results.
Segment Results
We operate three reportable segments: Global Business Solutions (GBS), Global Financial Solutions (GFS), and Network & Security Solutions (NSS). Our segments are designed to establish global lines of businesses that work seamlessly with our teams in our regions of North America (United States and Canada), EMEA (Europe, Middle East, and Africa), LATAM (Latin America and Caribbean region), and APAC (Asia Pacific).
The business segment measurements provided to and evaluated by the chief operating decision maker are computed in accordance with the principles listed below:
• | The accounting policies of the operating segments are the same as those described in the summary of significant accounting policies. |
• | Intersegment revenues are eliminated in the segment that sells directly to the end market. |
• | Segment revenue excludes reimbursable debit network fees, postage, and other revenue. |
• | Segment EBITDA includes equity earnings in affiliates and excludes depreciation and amortization expense, net income attributable to noncontrolling interests, other operating expenses, and other income (expense). Additionally, segment EBITDA is adjusted for items similar to certain of those used in calculating our compliance with debt covenants. The additional items that are adjusted to determine segment EBITDA: |
• | stock-based compensation and related expenses are excluded; and |
• | Kohlberg Kravis Roberts & Co. (KKR) related items including annual sponsor and other fees for management, consulting, financial, contract termination, and other advisory services are excluded. Upon our public offering on October 15, 2015, we are no longer required to pay management fees to KKR. |
37
• | For significant affiliates, segment revenue and segment EBITDA are reflected based on our proportionate share of the results of our investments in businesses accounted for under the equity method and consolidated subsidiaries with noncontrolling ownership interests. For other affiliates, we include equity earnings in affiliates, excluding amortization expense, in segment revenue and segment EBITDA. In addition, GBS measures reflect revenue-based commission payments to Independent Sales Organizations (ISOs) and sales channels, which are treated as an expense in the consolidated statements of operations, as contra revenue. |
• | Corporate operations include corporate-wide governance functions such as our executive management team, tax, treasury, internal audit, corporate strategy, and certain accounting, human resources and legal costs related to supporting the corporate function. Costs incurred by Corporate that are attributable to a segment are allocated to the respective segment. |
• | Certain measures exclude the estimated impact of foreign currency changes (constant currency). To present this information, monthly results during the periods presented for entities reporting in currencies other than U.S. dollars are translated into U.S. dollars at the average exchange rates in effect during the corresponding month of the prior fiscal year, rather than the actual average exchange rates in effect during the current fiscal year. Once translated, each month during the periods presented is added together to calculate the constant currency results for the periods presented. |
Operating revenues overview
Year ended December 31, | Percent Change | Reported Constant Currency Percent Change | ||||||||||||||||||||||
(in millions) | 2017 | 2016 | 2015 | 2017 vs. 2016 | 2016 vs. 2015 | 2017 vs. 2016 | 2016 vs. 2015 | |||||||||||||||||
Consolidated revenues | $ | 12,052 | $ | 11,584 | $ | 11,451 | 4 | % | 1 | % | 4 | % | 2 | % | ||||||||||
Adjustments: | ||||||||||||||||||||||||
Non wholly owned entities | (64 | ) | (80 | ) | (74 | ) | (20 | )% | 8 | % | NM | NM | ||||||||||||
Independent sales organizations (ISOs) commissions | (637 | ) | (618 | ) | (642 | ) | 3 | % | (4 | )% | NM | NM | ||||||||||||
Reimbursable debit network fees, postage, and other | (3,923 | ) | (3,745 | ) | (3,687 | ) | 5 | % | 2 | % | 5 | % | 2 | % | ||||||||||
Total segment revenues | $ | 7,428 | $ | 7,141 | $ | 7,048 | 4 | % | 1 | % | 4 | % | 3 | % | ||||||||||
Segment revenues: | ||||||||||||||||||||||||
Global Business Solutions | $ | 4,262 | $ | 4,063 | $ | 4,089 | 5 | % | (1 | )% | 5 | % | 2 | % | ||||||||||
Global Financial Solutions | 1,623 | 1,593 | 1,495 | 2 | % | 7 | % | 3 | % | 10 | % | |||||||||||||
Network & Security Solutions | 1,543 | 1,485 | 1,464 | 4 | % | 1 | % | 4 | % | 1 | % | |||||||||||||
NM represents not meaningful
38
Global Business Solutions segment results
The following table displays total segment revenue by region and illustrates, on a percentage basis, the impact of foreign currency fluctuations on revenue growth for the periods presented:
Year Ended December 31, 2016 | Core Growth (Decline) | Currency Impact(a) | Acquisitions/Dispositions(b) | Accounting Change(c) | Year Ended December 31, 2017 | Percent Change | Reported Constant Currency Percent Change | |||||||||||||||||||||||
(in millions) | ||||||||||||||||||||||||||||||
Revenues: | ||||||||||||||||||||||||||||||
North America | $ | 3,176 | $ | (61 | ) | (d) | $ | 1 | $ | 84 | $ | 62 | $ | 3,262 | 3 | % | 3 | % | ||||||||||||
EMEA | 550 | 25 | (e) | — | — | — | 575 | 5 | % | 5 | % | |||||||||||||||||||
LATAM | 178 | 101 | (f) | (6 | ) | — | — | 273 | 53 | % | 56 | % | ||||||||||||||||||
APAC | 159 | 21 | (g) | 3 | (31 | ) | — | 152 | (4 | )% | (6 | )% | ||||||||||||||||||
Total segment revenue | $ | 4,063 | $ | 86 | $ | (2 | ) | $ | 53 | $ | 62 | $ | 4,262 | 5 | % | 5 | % | |||||||||||||
(a) | Currency impact is the difference between the current year's actual results and the same year's results converted with the prior year's foreign exchange rate. Constant currency percentage change is a measure of revenue growth before foreign currency impact. |
(b) | North America revenue was impacted by acquisitions of CardConnect in July 2017 and BluePay in December 2017. The Acquisitions/Dispositions column includes July 2016 to December 2016 and December 2016 revenues for CardConnect and BluePay, respectively, and current period growth for CardConnect and BluePay is included in Core Growth (Decline). APAC balance represents revenue associated with the disposition of the Australian ATM business in September 2016. See note 12 "Acquisitions and Dispositions" to our consolidated financial statements in Part II, Item 8 of this Form 10-K for additional information. |
(c) | Effective January 2017, we changed our accounting for Clover hardware sales to recognize revenue upon shipment as opposed to deferring such revenue and recognizing over an established period, typically three years. Previously deferred revenue on hardware shipped in previous years continued to be amortized over the established period. See Deferred Revenue in note 1 "Summary of Significant Accounting Policies" to our consolidated financial statements for additional information. |
(d) | North America revenue decrease was driven by a decline in our bank alliances. The decline was partially attributed to $13 million of fee increases which occurred in 2016 which did not reoccur in 2017. |
(e) | EMEA revenue increased due to growth in United Kingdom of $9 million, related to growth in sales volumes, and in Germany and Austria of $9 million, related to growth in terminal hardware sales. |
(f) | LATAM revenue increased due to growth in Brazil of $62 million, related to increases in our active customer base and sales volumes, and growth in Argentina of $35 million. |
(g) | APAC revenue increased due to growth in India. |
Year Ended December 31, 2015 | Core Growth (Decline) | Currency Impact(a) | Acquisitions/ Dispositions(b) | Accounting Change | Year Ended December 31, 2016 | Percent Change | Reported Constant Currency Percent Change | |||||||||||||||||||||||
(in millions) | ||||||||||||||||||||||||||||||
Revenues: | ||||||||||||||||||||||||||||||
North America | $ | 3,204 | $ | (29 | ) | (c) | $ | 1 | $ | — | $ | — | $ | 3,176 | (1 | )% | (1 | )% | ||||||||||||
EMEA | 541 | 31 | (d) | (22 | ) | — | — | 550 | 2 | % | 6 | % | ||||||||||||||||||
LATAM | 164 | 71 | (e) | (57 | ) | — | — | 178 | 9 | % | 44 | % | ||||||||||||||||||
APAC | 180 | (5 | ) | (f) | (4 | ) | (12 | ) | — | 159 | (12 | )% | (10 | )% | ||||||||||||||||
Total segment revenue | $ | 4,089 | $ | 68 | $ | (82 | ) | $ | (12 | ) | $ | — | $ | 4,063 | (1 | )% | 2 | % | ||||||||||||
(a) | Currency impact is the difference between the current year's actual results and the same year's results converted with the prior year's foreign exchange rate. Constant currency percentage change is a measure of revenue growth before foreign currency impact. |
(b) | APAC revenue adjusted to exclude revenue associated with the disposition of the Australian ATM business in September 2016. See note 12 "Acquisitions and Dispositions" to our consolidated financial statements in Part II, Item 8 of this Form 10-K for additional information. |
(c) | North America revenue decrease was driven by lower hardware sales of $50 million, partially offset by an increase of $25 million in software sales as a result of growth in our merchant suite of products, including continued growth of our Transarmor Solution. Processing revenue remained flat as transaction growth of 7% was offset by lower blended yield. |
(d) | EMEA constant currency revenue increased as a result of volume growth and an approximate $10 million benefit from changes in interchange pricing during the first quarter of 2016. |
(e) | Revenue increase in our LATAM region was benefited by growth in Brazil and Argentina of $35 million and $30 million, respectively during 2016. Remaining growth in LATAM was driven by growth in Uruguay, Mexico and the Caribbean. |
(f) | Revenue in the APAC region was impacted by a decrease in ATM fees for the year ended December 31, 2016. |
39
The following table displays total merchant transactions for the periods presented:
Year ended December 31, | Percent Change | ||||||||||||||
(in millions) | 2017 | 2016 | 2015 | 2017 vs. 2016 | 2016 vs. 2015 | ||||||||||
Key indicators: | |||||||||||||||
North America merchant transactions(a) | 49,248 | 46,372 | 43,362 | 6 | % | 7 | % | ||||||||
International merchant transactions(b) | 9,760 | 8,246 | 6,826 | 18 | % | 21 | % | ||||||||
(a) | North American merchant transactions include acquired Visa and MasterCard credit and signature debit, American Express and Discover, PIN-debit, electronic benefits transactions, processed-only and gateway customer transactions at the Point of Sale (POS). North American merchant transactions reflect 100% of alliance transactions. |
(b) | International transactions include Visa, MasterCard, and other payment network merchant acquiring transactions for clients outside the U.S. and Canada. Transactions include credit, signature debit, PIN-debit POS, POS gateway, and Automated Teller Machine (ATM) transactions. |
North America transaction growth in 2017 compared to 2016 was driven by continued growth in consumer electronic payments spending. International transaction growth in 2017 compared to 2016 was driven by a 12% increase in EMEA, 28% increase in APAC, and a 47% increase in LATAM.
North America transaction growth in 2016 compared to 2015 was driven by growth in our alliances. International transaction growth in 2017 compared to 2016 was driven by a 14% increase in EMEA, 29% increase in APAC, and a 50% increase in LATAM.
Global Financial Solutions segment results
The following table displays total revenue by segment region and illustrates, on a percentage basis, the impact of foreign currency fluctuations on revenue growth.
Year Ended December 31, 2016 | Core Growth (Decline) | Currency Impact(a) | Dispositions(b) | Year Ended December 31, 2017 | Percent Change | Reported Constant Currency Percent Change | ||||||||||||||||||||
(in millions) | ||||||||||||||||||||||||||
Revenues: | ||||||||||||||||||||||||||
North America | $ | 956 | $ | (7 | ) | (c) | $ | — | $ | — | $ | 949 | (1 | )% | (1 | )% | ||||||||||
EMEA | 433 | 30 | (d) | (13 | ) | (6 | ) | 444 | 3 | % | 6 | % | ||||||||||||||
LATAM | 122 | 13 | (e) | (3 | ) | — | 132 | 9 | % | 12 | % | |||||||||||||||
APAC | 82 | 13 | (f) | 3 | — | 98 | 19 | % | 16 | % | ||||||||||||||||
Total segment revenue | $ | 1,593 | $ | 49 | $ | (13 | ) | $ | (6 | ) | $ | 1,623 | 2 | % | 3 | % | ||||||||||
(a) | Currency impact is the difference between the current year's actual results and the same year's results converted with the prior year's foreign exchange rate. Constant currency percentage change is a measure of revenue growth before foreign currency impact. |
(b) | Business disposition of Lithuania, Latvia and Estonia (i.e. the Baltics) in September 2017. See note 12 "Acquisitions and Dispositions" to our consolidated financial statements in Part II, Item 8 of this Form 10-K for additional information. |
(c) | North America revenue was driven by growth in account processing, offset by $20 million plastics revenue decline and a prior year one-time termination fee of $7 million. |
(d) | EMEA revenue increase was driven by $24 million of new business and existing client growth in the United Kingdom and $12 million of existing client growth in the Middle East & Africa, partially offset by attrition and lower volumes in the region. |
(e) | LATAM revenue increase was driven by $13 million of existing client growth in Argentina and $6 million of new business in Colombia, partially offset by a year over year decrease in license resolutions fees. |
(f) | APAC revenue increase was driven by professional services in Australia and Singapore of $6 million and $5 million respectively, as well as internal growth in Australia. |
40
Year Ended December 31, 2015 | Core Growth (Decline) | Currency Impact(a) | Dispositions | Year Ended December 31, 2016 | Percent Change | Reported Constant Currency Percent Change | ||||||||||||||||||||
(in millions) | ||||||||||||||||||||||||||
Revenues: | ||||||||||||||||||||||||||
North America | $ | 883 | $ | 73 | (b) | $ | — | $ | — | $ | 956 | 8 | % | 8 | % | |||||||||||
EMEA | 435 | 29 | (c) | (31 | ) | — | 433 | — | % | 7 | % | |||||||||||||||
LATAM | 102 | 43 | (d) | (23 | ) | — | 122 | 20 | % | 42 | % | |||||||||||||||
APAC | 75 | 8 | (e) | (1 | ) | — | 82 | 9 | % | 10 | % | |||||||||||||||
Total segment revenue | $ | 1,495 | $ | 153 | $ | (55 | ) | $ | — | $ | 1,593 | 7 | % | 10 | % | |||||||||||
(a) Currency impact is the difference between the current year's actual results and the same year's results converted with the prior year's foreign exchange rate. Constant currency percentage change is a measure of revenue growth before foreign currency impact.
(b) | North America revenue increase was driven by growth in our print business and our credit and retail card processing business. Our print business grew by $38 million principally due to a new enterprise win from an existing customer. Credit and retail processing grew by $44 million from an increase in card accounts on file split evenly between growth in existing customers and new business. In addition, our North America credit and retail processing business benefited by $7 million from a termination fee, principally in the fourth quarter. |
(c) | EMEA constant currency revenue increase was driven by new and existing business growth and professional services growth of $28 million in the United Kingdom and existing business growth of $14 million in the Middle East and Africa. Growth in professional services was partially offset by price compression in Greece. Greece price compression was driven by renewal of one large client in 2015. |
(d) | LATAM constant currency revenue increase was primarily driven by strong growth in Argentina of $20 million, which benefited by volume growth and inflation, an increase in VisionPLUS licensing revenues of $17 million mostly due to license fee resolutions, and an increase in Colombia of $6 million from a new processing deal. The remaining $4 million growth came from our Caribbean business due to higher processing and professional services revenue. |
(e) | APAC constant currency revenue increase was driven by professional services and a new processing client in Australia. |
The following table displays total card accounts for the periods presented:
Year ended December 31, | Percent Change | ||||||||||||||
(in millions) | 2017 | 2016 | 2015 | 2017 vs. 2016 | 2016 vs. 2015 | ||||||||||
Key indicators: | |||||||||||||||
North America card accounts on file(a) | 906 | 855 | 813 | 6 | % | 5 | % | ||||||||
International card accounts on file(b) | 170 | 151 | 135 | 13 | % | 12 | % | ||||||||
(a) | North America card accounts on file reflect the total number of bankcard credit and retail credit accounts as of the end of the periods presented. |
(b) | International card accounts on file reflect total bankcard and retail accounts outside the United States and Canada as of the end of the periods presented. 2015 International card accounts on file reflect an updated card account total. |
North America card accounts on file increased in 2017 compared to the same period in 2016 from growth in existing clients.
International accounts on file increased in 2017 compared to the same period in 2016 due to new business and growth of existing clients throughout all of our international regions.
North America card accounts on file increased in 2016 compared to 2015 from growth in existing clients. International accounts on file increased 2016 compared to 2015 due to new portfolios of existing clients throughout all of our international regions.
41
Network & Security Solutions segment results
The following table displays total revenue by product. Our Network & Security Solutions segment is comprised of more than 95% domestic businesses with no material foreign exchange impact on reported results.
Year Ended December 31, 2016 | Core Growth (Decline) | Dispositions(a) | Year Ended December 31, 2017 | Percent Change | |||||||||||||||
(in millions) | |||||||||||||||||||
Revenues: | |||||||||||||||||||
EFT Network | $ | 491 | $ | (4 | ) | (b) | $ | — | $ | 487 | (1 | )% | |||||||
Security and Fraud | 434 | 15 | (c) | — | 449 | 3 | % | ||||||||||||
Stored Value Network | 358 | 47 | (d) | — | 405 | 13 | % | ||||||||||||
Other | 202 | 7 | (e) | (7 | ) | 202 | — | % | |||||||||||
Total segment revenue | $ | 1,485 | $ | 65 | $ | (7 | ) | $ | 1,543 | 4 | % | ||||||||
(a) | Other revenue adjusted to exclude net revenue associated with business that was contributed to our digital banking joint venture with Live Oak on October 2, 2017 offset by our 50% of the joint ventures revenue. See note 12 "Acquisitions and Dispositions" to our consolidated financial statements in Part II, Item 8 of this Form 10-K for additional information. |
(b) | EFT Network revenue decreased due to increased transaction growth of $20 million offset by increased client incentives. |
(c) | Security and Fraud revenue increase was driven by growth in our Security and Fraud product categories, offset by declines within the Telecheck business of $14 million. |
(d) | Stored Value Network revenue increased due to higher rate and volume of $16 million and $24 million, respectively, and a $7 million benefit associated with a contract amendment. |
(e) | Growth was driven by our government business. |
Year Ended December 31, 2015 | Core Growth (Decline) | Dispositions | Year Ended December 31, 2016 | Percent Change | |||||||||||||||
(in millions) | |||||||||||||||||||
Revenues: | |||||||||||||||||||
EFT Network | $ | 491 | $ | — | (a) | $ | — | $ | 491 | — | % | ||||||||
Security and Fraud | 412 | 22 | (b) | — | 434 | 5 | % | ||||||||||||
Stored Value Network | 359 | (1 | ) | (c) | — | 358 | — | % | |||||||||||
Other | 202 | — | — | 202 | — | % | |||||||||||||
Total segment revenue | $ | 1,464 | $ | 21 | $ | — | $ | 1,485 | 1 | % | |||||||||
(a) | EFT Network revenue was relatively flat as STAR growth was offset by the impact of a long-term debit processing contract renewal which negatively impacted segment revenue by $14 million. |
(b) | Security and Fraud revenue increased due to growth from our suite of Security and Fraud products, partially offset by revenue declines within our TeleCheck business of $21 million. |
(c) | Stored Value Network revenue was flat driven by a change in contract terms for one client in the prior year for $10 million offset by increased volumes. |
The following table displays total network transactions for the periods presented:
Year ended December 31, | Percent Change | ||||||||||||||
(in millions) | 2017 | 2016 | 2015 | 2017 vs. 2016 | 2016 vs. 2015 | ||||||||||
Key indicators: | |||||||||||||||
Network transactions (EFT Network and Stored Value) (a) | 22,114 | 20,258 | 18,918 | 9 | % | 7 | % | ||||||||
(a) | Network transactions include the U.S. debit issuer processing transactions, STAR Network issuer transactions, and closed loop and open loop POS transactions. |
Network transaction growth for the year ended 2017 compared to the same periods in 2016 and 2016 compared to the same periods in 2015 was driven by growth in all network transaction categories.
Reimbursable debit network fees, postage, and other
Revenue increased in 2017 compared to 2016 due to transaction and volume growth related to debit network fees of $217 million partially offset by postage associated with output services.
Revenue increased in 2016 compared to 2015 due to transaction and volume growth related to debit network fees of $38 million and growth in print services.
42
Operating expenses overview
Year ended December 31, | Percent Change | Reported Constant Currency Percent Change | ||||||||||||||||||||||
(in millions) | 2017 | 2016 | 2015 | 2017 vs. 2016 | 2016 vs. 2015 | 2017 vs. 2016 | 2016 vs. 2015 | |||||||||||||||||
Cost of services (exclusive of items shown below) | $ | 2,763 | $ | 2,855 | $ | 2,871 | (3 | )% | (1 | )% | (3 | )% | 1 | % | ||||||||||
Cost of products sold | 359 | 337 | 356 | 7 | % | (5 | )% | 7 | % | (3 | )% | |||||||||||||
Selling, general, and administrative | 2,178 | 2,035 | 2,292 | 7 | % | (11 | )% | 7 | % | (10 | )% | |||||||||||||
Depreciation and amortization | 972 | 949 | 1,022 | 2 | % | (7 | )% | 2 | % | (6 | )% | |||||||||||||
Other operating expenses | 143 | 61 | 53 | 134 | % | 15 | % | 134 | % | 17 | % | |||||||||||||
Total expenses (excluding reimbursable items) | 6,415 | 6,237 | 6,594 | 3 | % | (5 | )% | 3 | % | (4 | )% | |||||||||||||
Reimbursable debit network fees, postage, and other | 3,923 | 3,745 | 3,687 | 5 | % | 2 | % | 5 | % | 2 | % | |||||||||||||
Total expenses | $ | 10,338 | $ | 9,982 | $ | 10,281 | 4 | % | (3 | )% | 4 | % | (2 | )% | ||||||||||
Cost of services
Year ended December 31, | Percent Change | Reported Constant Currency Percent Change | ||||||||||||||||||||||
(in millions) | 2017 | 2016 | 2015 | 2017 vs. 2016 | 2016 vs. 2015 | 2017 vs. 2016 | 2016 vs. 2015 | |||||||||||||||||
Salaries, wages, and bonus | $ | 1,437 | (a) | $ | 1,474 | $ | 1,478 | (2 | )% | — | % | |||||||||||||
Stock-based compensation | 72 | (b) | 112 | (d) | 130 | (35 | )% | (14 | )% | |||||||||||||||
Outside professional services | 258 | (c) | 264 | (e) | 250 | (2 | )% | 6 | % | |||||||||||||||
Software, telecommunication infrastructure, and repairs | 387 | (c) | 396 | (e) | 380 | (2 | )% | 4 | % | |||||||||||||||
Other | 609 | 609 | (f) | 633 | — | % | (4 | )% | ||||||||||||||||
Cost of services expense | $ | 2,763 | $ | 2,855 | $ | 2,871 | (3 | )% | (1 | )% | (3 | )% | 1 | % | ||||||||||
(a) | Expense decreased in 2017 compared to 2016 due to a $37 million decline in salaries and wages related to productivity improvements and enhancements. |
(b) | The decline in stock based compensation of $40 million resulted from a $34 million decrease relating to reallocation from cost of services to selling, general and administrative expenses to better align with our operations, $22 million decline in one-time expense related to our initial public offering in 2015, offset by an increase of $16 million in recurring stock-based compensation incurred over the vesting life of normal service-based stock awards. |
(c) | Outside professional services and Software, telecommunication, infrastructure and repairs expense decreased by $15 million due to benefits achieved through our cost initiatives. |
(d) | Stock compensation expense decreased in 2016 compared to 2015 by $18 million as a result of a $78 million one-time expense in 2015 related to our initial public offering, partially offset by an increase of $60 million in recurring stock-based compensation incurred over the vesting life of normal service-based stock awards. |
(e) | Outside professional services and Software, telecommunication, infrastructure and repairs expense increased by $30 million as we continue to invest in our core operating businesses. |
(f) | Other expenses declined as 2015 was negatively impacted by two client-related matters totaling $24 million. In addition, included within other expenses is an increase of approximately $25 million in merchant credit losses, partially offset by a decline of warranty expense within NSS of $10 million. Merchant credits losses increased due to higher fraud rates and charge-backs resulting from a liability shift post EMV. Warranty expense declined driven by lower volumes within our TeleCheck business. The remaining decline in other expense was driven by expense rationalization from our previously announced cost management initiatives. |
Cost of products sold
Cost of products sold expense increased in 2017 compared to 2016 due to hardware expenses, impacted by a $47 million change in accounting relating to our Clover terminals effective as of January 1, 2017. Cost of products sold decreased in 2016 compared to 2015 due to decline in hardware sales.
43
Selling, general, and administrative
Year ended December 31, | Percent Change | Reported Constant Currency Percent Change | ||||||||||||||||||||||
(in millions) | 2017 | 2016 | 2015 | 2017 vs. 2016 | 2016 vs. 2015 | 2017 vs. 2016 | 2016 vs. 2015 | |||||||||||||||||
Salaries, wages, bonus, and other | $ | 655 | $ | 659 | (e) | $ | 697 | (1 | )% | (5 | )% | |||||||||||||
Stock-based compensation | 173 | (a) | 151 | (f) | 199 | 15 | % | (24 | )% | |||||||||||||||
Independent sales organizations (ISOs) commissions | 637 | 618 | (g) | 642 | 3 | % | (4 | )% | ||||||||||||||||
Outside professional services | 219 | (b) | 182 | (h) | 295 | 20 | % | (38 | )% | |||||||||||||||
Commissions | 182 | (c) | 137 | (e) | 158 | 33 | % | (13 | )% | |||||||||||||||
Other | 312 | (d) | 288 | (e) | 301 | 8 | % | (4 | )% | |||||||||||||||
Selling, general, and administrative expense | $ | 2,178 | $ | 2,035 | $ | 2,292 | 7 | % | (11 | )% | 7 | % | (10 | )% | ||||||||||
(a) | Stock based compensation expense increased $22 million. The increase in stock based compensation of $22 million resulted from a $34 million increase relating to reallocation from cost of services to selling, general, and administrative expenses to better align with our operations, $18 million in recurring stock-based compensation incurred over the vesting life of normal service-based stock awards offset by $30 million decline in one-time expense related to our initial public offering in 2015. |
(b) | Outside Professional services expense increased $37 million due to higher legal and consulting fees. |
(c) | Commissions increase is attributed to the acquisitions of CardConnect and BluePay. |
(d) | Other expenses increased due to $15 million increase related to advertising expenses for marketing initiatives in 2017 and $11 million related to the acquisition of CardConnect and BluePay. |
(e) | Salaries, wages, bonus, and other decrease was driven by Commissions expense decline of $21 million and miscellaneous other expenses decline of $13 million, all driven by expense rationalization from our previously announced cost management initiatives. |
(f) | Stock based compensation expense declined $48 million. The decline in stock-based compensation resulted from a $124 million decline in one-time expense related to our initial public offering in 2015, partially offset by an increase of $76 million in recurring stock-based compensation incurred over the vesting life of normal service-based stock awards. |
(g) | Retail ISO commissions declined $24 million due to consolidation of Retail ISOs to Wholesale ISOs via acquisition. |
(h) | The Outside professional services expense decline was driven by a $100 million decline in KKR related expenses, of which $78 million related to termination of our Management Agreement with KKR during 2015. |
Depreciation and amortization
Year ended December 31, | Percent Change | |||||||||||||||||
(in millions) | 2017 | 2016 | 2015 | 2017 vs. 2016 | 2016 vs. 2015 | |||||||||||||
Depreciation expense | $ | 321 | $ | 300 | $ | 290 | 7 | % | 3 | % | ||||||||
Amortization expense | 651 | 649 | 732 | — | % | (11 | )% | |||||||||||
Depreciation and amortization | $ | 972 | $ | 949 | $ | 1,022 | 2 | % | (7 | )% | ||||||||
Depreciation expense increased due to higher capital expenditure investments, primarily relating to equipment under capital lease, over the past several years. Amortization expense increased in 2017 which was attributed to the CardConnect and BluePay acquisitions, offset partially by reduction in amortization expense on acquisition intangibles. Amortization expense in 2016 decreased due to a reduction in amortization expense on acquisition of intangibles.
Other operating expenses
Year ended December 31, | Percent Change | |||||||||||||||||
(in millions) | 2017 | 2016 | 2015 | 2017 vs. 2016 | 2016 vs. 2015 | |||||||||||||
Restructuring, net | $ | 83 | (a) | $ | 49 | $ | 53 | 70 | % | (8 | )% | |||||||
Deal and deal integration costs | 27 | (b) | — | — | NM | NM | ||||||||||||
Asset impairment | 13 | (c) | — | — | NM | NM | ||||||||||||
Other | 20 | (c) | 12 | (d) | — | 65 | % | NM | ||||||||||
Other operating expenses | $ | 143 | $ | 61 | $ | 53 | 134 | % | 15 | % | ||||||||
(a) | Other operating expenses increased in 2017 compared to 2016 as restructuring expense increased $34 million due to our ongoing expense management initiative. |
(b) | Deal and deal integration costs related to costs associated with the acquisitions of CardConnect and BluePay. |
44
(c) | Asset impairment and other costs increased $21 million due to the resolution of two customer related matters of $10 million, a $6 million loss on a prepaid asset related to an early contract terminated, and a write-down of abandoned technology. |
(d) | Other increased in 2016 compared to 2015 as we incurred a $10 million loss associated with the cash payout of certain long-term pension obligations and a $5 million loss from the settlement of a client related matter in 2016. |
Refer to note 10 “Other Operating Expenses” to our consolidated financial statements in Part II, Item 8 of this Form 10-K for details regarding other operating expenses.
Interest expense, net
Year ended December 31, | Percent Change | |||||||||||||||||
(in millions) | 2017 | 2016 | 2015 | 2017 vs. 2016 | 2016 vs. 2015 | |||||||||||||
Interest expense, net | $ | (937 | ) | $ | (1,068 | ) | $ | (1,537 | ) | (12 | )% | (31 | )% | |||||
Interest expense, net decreased due to lower weighted-average interest rates as a result of debt extinguishments and refinancing as well as lower average outstanding principal balances. Interest expense, net includes fees incurred to modify long-term debt in the amount of $10 million and $29 million for the years ended December 31, 2017 and 2016, respectively. Refer to note 2 "Borrowings" to our consolidated financial statements in Part II, Item 8 of this Form 10-K.
Loss on debt extinguishment
Year ended December 31, | Percent Change | |||||||||||||||||
(in millions) | 2017 | 2016 | 2015 | 2017 vs. 2016 | 2016 vs. 2015 | |||||||||||||
Loss on debt extinguishment | $ | (80 | ) | $ | (70 | ) | $ | (1,068 | ) | 14 | % | (93 | )% | |||||
Refer to note 2 “Borrowings” to our consolidated financial statements in Part II, Item 8 of this Form 10-K for additional information.
Other income
Year ended December 31, | ||||||||||||
(in millions) | 2017 | 2016 | 2015 | |||||||||
Investment gains | $ | 1 | $ | 35 | (a) | $ | — | |||||
Derivatives | — | (5 | ) | (b) | (17 | ) | ||||||
Divestitures, net gain (loss) | 18 | (c) | (34 | ) | 5 | |||||||
Non-operating foreign currency (loss) gains | (1 | ) | (d) | 19 | (d) | 41 | ||||||
Other miscellaneous (loss) income | (2 | ) | 2 | — | ||||||||
Other income | $ | 16 | $ | 17 | $ | 29 | ||||||
(a) | Investment gains in 2016 represent the sale of our share in Visa Europe (VE). Additionally in 2016, we sold our 49% minority interest in an international joint venture which resulted in a pretax gain of $7 million. |
(b) | The losses on derivatives in 2016 and 2015 are driven by fair value adjustments on our nondesignated interest rate contracts. See note 13 "Derivative Financial Instruments" to our consolidated financial statements in Part II, Item 8 of this Form 10-K for additional information on our derivative contracts. |
(c) | Divestitures, net gain (loss) in 2017 relates to our online banking business, which we contributed in exchange for a 50% ownership in Apiture, a joint venture, both of these businesses are reported within the NSS segment. The loss in 2016 represents the sale of our Australian ATM business on September 30, 2016. The Australian ATM business was reported as part of GBS. See note 12 "Acquisitions and Dispositions" to our consolidated financial statement in Part II, Item 8 of this Form 10-K for additional information on our significant divestitures. |
(d) | Non-operating foreign currency (loss) gain represents net gains and losses related to currency translations on our intercompany loans in all years as well as gains on euro-denominated debt in 2015. We designated all of our euro-denominated debt as a hedge against our net investment in euro business as of January 1, 2016, which would have eliminated income statement gains of $70 million prior to 2016, if the hedge was in place and fully effective during those periods. |
Income taxes
Year ended December 31, | |||||||||||||
(in millions) | 2017 | 2016 | 2015 | ||||||||||
Income tax (benefit) expense | $ | (729 | ) | $ | 81 | $ | 101 | ||||||
Effective income tax rate | (78 | )% | 11 | % | (9 | )% | |||||||
45
Our global effective tax rate differs from the statutory rates as a result of recognizing tax expense on income from certain foreign jurisdictions while recording no taxes on certain foreign losses subject to deferred tax valuation allowances. In 2017, the tax rate was also positively impacted by a $1.3 billion release of valuation allowances in the U.S. jurisdiction, partially offset by a $353 million negative impact of the reduction to our net deferred tax assets as a result of the enactment of the Tax Cuts and Jobs Act.
Following the recognition of significant deferred tax valuation allowances in 2012, we have regularly experienced substantial volatility in our effective tax rate in interim periods and across years. This has been due to deferred income tax benefits not being recognized in several jurisdictions, most notably in the United States. During 2017, the valuation allowance in the U.S. jurisdiction was released, creating a large tax rate benefit. This release of the valuation allowance should reduce most of the effective tax rate volatility in future periods.
Pre-tax income (loss) generated and the effective income tax rate in domestic and foreign jurisdictions for the years ended December 2017, 2016 and 2015 are as follows:
Year ended December 31, | |||||||||||||||||||||||||||||||||||||
2017 | 2016 | 2015 | |||||||||||||||||||||||||||||||||||
(in millions) | Domestic | Foreign | Total | Domestic | Foreign | Total | Domestic | Foreign | Total | ||||||||||||||||||||||||||||
Pre-tax income (loss) | $ | 484 | $ | 451 | $ | 935 | $ | 492 | $ | 249 | $ | 741 | $ | (1,332 | ) | $ | 165 | $ | (1,167 | ) | |||||||||||||||||
Income tax (benefit) expense | (827 | ) | 98 | (729 | ) | 40 | 41 | 81 | 21 | 80 | 101 | ||||||||||||||||||||||||||
Effective income tax rate | (171 | )% | 22 | % | (78 | )% | 8 | % | 16 | % | 11 | % | (2 | )% | 48 | % | (9 | )% | |||||||||||||||||||
The significant jurisdictions comprising our foreign income tax expense are Argentina, Brazil, Ireland and the UK. Effective income tax rates in these significant jurisdictions vary from local statutory rates due to valuation allowances and tax contingencies impacting certain jurisdictions. Given the significance of the pre-tax income (loss) in the U.S. compared to foreign jurisdictions, and the impact of the release of the valuation allowance in the U.S. jurisdiction, we do not believe changes in the mix of income between our foreign jurisdictions will significantly impact the overall results of operations.
From 2007 through 2015, we were in a net operating loss position in the U.S. federal and combined state jurisdictions. During 2016 and 2017, we generated profits in the U.S. jurisdiction, causing significant portions of these net operating losses to be utilized. As a result of this improved profitability, expected future performance, and the length of time remaining before the net operating losses will expire, we determined that it was more likely than not that our net deferred tax assets in the U.S. jurisdiction would be realized, and, therefore, we released the valuation allowance against these deferred tax assets. Despite the valuation allowance release in the U.S. jurisdiction, we continue to maintain the valuation allowance against deferred tax assets related to tax losses in many states and certain foreign countries. It is unlikely that our assessment regarding these valuation allowances will change in the foreseeable future.
On December 22, 2017, the Tax Cuts and Jobs Act (tax reform bill) was signed into law in the U.S. The provisions of the tax reform bill with the most significant implications to us were the reduction of the federal tax rate from 35% to 21%, the creation of a 100% participation exemption for foreign dividends, the enactment of a one-time transition tax on existing foreign earnings, limitations on the deductibility of interest expense, and the establishment of global intangible low-taxed income (GILTI) rules. The first three provisions impacted the year-ended December 31, 2017. Because our deferred tax assets exceed our deferred tax liabilities in the U.S., the reduction of the tax rate provided by the tax reform bill resulted in a negative impact to the tax rate of $194 million. The one-time transition tax coupled with the 100% participation exemption had an immaterial impact on the tax rate. Because we have historically repatriated our foreign earnings, our cumulative foreign deficits exceed our cumulative foreign profits, causing our one-time taxable inclusion under the transition tax rules to be zero. As a result of the future participation exemption, we determined that we will not have enough future foreign sourced income to utilize any foreign tax credit carryforwards, and have therefore determined that we will amend our 2010-2016 tax returns to elect to claim foreign tax deductions, rather than foreign tax credits. The deferred tax impact of changing our election from a credit to a deduction was $159 million. This change was assumed when determining the appropriate valuation allowance on our foreign tax credit carryforwards in prior years, and as a result, the decision to amend the returns had an immaterial net tax rate impact.
Overall, we expect the impact of the tax reform bill on future years to be positive. The reduction in the tax rate coupled with the participation exemption on foreign dividends will drive the tax rate lower than what would have been expected without passage of the tax reform bill. On the other hand, because of our significant interest expense in the U.S. and our relatively small investment in foreign tangible property, we expect the limitations on interest deductibility and the GILTI provisions to have a negative impact to our tax rate. Overall, we believe that the benefits of the lower tax rate and the participation exemption will exceed the negative
46
effect of the limits on interest deductibility and the GILTI provisions, but we are still in the process of evaluating these provisions for their full impact on future periods. Based upon our preliminary analysis, we are projecting our future tax rate to be in the mid-to-high 20% range. The reversal of the valuation allowance has no impact on First Data’s U.S. federal NOL balance, and we continue to estimate that it will be largely shielded from paying U.S. federal cash taxes through the end of 2020.
As permitted by Staff Accounting Bulletin No. 118, provisional amounts estimated based on information available as of December 31, 2017 are made for the adjustments to deferred tax assets and liabilities, the calculation of the transition tax, and certain valuation allowance assessments. These amounts are subject to change as we obtain information necessary to complete the calculations. We will recognize any changes to the provisional amounts as we refine our estimates and our interpretations of the application of the 2017 Tax Act.
We, or one or more of our subsidiaries, file income tax returns in the U.S. federal jurisdiction and various state and foreign jurisdictions. As of December 31, 2017, we were no longer subject to income tax examination by the U.S. federal jurisdiction for years before 2005. State and local examinations are substantially complete through 2006. Foreign jurisdictions generally remain subject to examination by their respective authorities from 2007 forward, none of which are considered major jurisdictions. Refer to note 8 "Income Taxes" to our consolidated financial statements in Part II, Item 8 of this Form 10-K for additional information.
Equity earnings in affiliates
Year ended December 31, | Percent Change | |||||||||||||||||
(in millions) | 2017 | 2016 | 2015 | 2017 vs. 2016 | 2016 vs. 2015 | |||||||||||||
Equity earnings in affiliates | $ | 222 | $ | 260 | $ | 239 | (15 | )% | 9 | % | ||||||||
Equity earnings in affiliates relate to the earnings of our merchant alliance partnerships and decreased in 2017 compared to 2016 due to a decline in the results of our North American joint ventures driven by significant decline in leadflow.
Equity earnings in affiliates relate to the earnings of our merchant alliance partnerships and increased in 2016 compared to 2015 due to revenue growth within our Wells Fargo Merchant Services joint venture and lower amortization expense of $14 million.
Net income attributable to noncontrolling interests and redeemable noncontrolling interest
Year ended December 31, | Percent Change | |||||||||||||||||
(in millions) | 2017 | 2016 | 2015 | 2017 vs. 2016 | 2016 vs. 2015 | |||||||||||||
Net income attributable to noncontrolling interests and redeemable noncontrolling interest | $ | 199 | $ | 240 | $ | 213 | (17 | )% | 13 | % | ||||||||
Net income attributable to noncontrolling interests and redeemable noncontrolling interest relates to the interest of our merchants in our consolidated merchant alliances and decreased in 2017 compared to 2016 due to a decline in the results of our North American joint ventures mainly due to significant decline in leadflow. Refer to note 5 “Stockholders' Equity and Redeemable Noncontrolling Interest" to our consolidated financial statements in Part II, Item 8 of this Form 10-K for additional information.
Net income attributable to noncontrolling interests and redeemable noncontrolling interest increased in 2016 compared to 2015 due to net volume growth within our Bank of America Merchant Services alliance.
47
Segment EBITDA Overview
The following table displays Segment EBITDA by segment for the periods indicated:
Year ended December 31, | Percent Change | Reported Constant Currency Percent Change | ||||||||||||||||||||||
(in millions) | 2017 | 2016 | 2015 | 2017 vs. 2016 | 2016 vs. 2015 | 2017 vs. 2016 | 2016 vs. 2015 | |||||||||||||||||
Segment EBITDA: | ||||||||||||||||||||||||
Global Business Solutions | $ | 1,824 | $ | 1,725 | $ | 1,681 | 6 | % | 3 | % | 6 | % | 5 | % | ||||||||||
Global Financial Solutions | 686 | 646 | 550 | 6 | % | 17 | % | 7 | % | 21 | % | |||||||||||||
Network & Security Solutions | 729 | 666 | 639 | 9 | % | 4 | % | 9 | % | 4 | % | |||||||||||||
Corporate | (167 | ) | (145 | ) | (140 | ) | 15 | % | 4 | % | 15 | % | 4 | % | ||||||||||
Total Segment EBITDA | $ | 3,072 | $ | 2,892 | $ | 2,730 | 6 | % | 6 | % | 7 | % | 8 | % | ||||||||||
The following table displays Segment EBITDA margin by segment for the periods indicated:
Year ended December 31, | Change | ||||||||||||
2017 | 2016 | 2015 | 2017 vs. 2016 | 2016 vs. 2015 | |||||||||
Segment EBITDA Margin: | |||||||||||||
Global Business Solutions | 42.8 | % | 42.5 | % | 41.1 | % | 30 | 140 | |||||
Global Financial Solutions | 42.3 | % | 40.6 | % | 36.8 | % | 170 | 380 | |||||
Network & Security Solutions | 47.2 | % | 44.8 | % | 43.6 | % | 240 | 120 | |||||
Total Segment EBITDA Margin | 41.4 | % | 40.5 | % | 38.7 | % | 90 | 180 | |||||
Global Business Solutions
Global Business Solutions Segment EBITDA increased 6% in 2017 compared to 2016 primarily driven by the impact of the revenue items noted previously within "Global Business Solutions segment results" above, the acquisition of CardConnect and BluePay, along with expense declines driven by expense management initiatives.
Global Business Solutions Segment EBITDA increased 3% in 2016 compared to 2015 primarily driven by the impact of the revenue items noted previously within "Global Business Solutions segment results" above, along with expense declines driven by our expense management initiatives. Currency translation negatively impacted segment adjusted EBITDA by approximately $40 million compared to the prior period.
Global Financial Solutions
Global Financial Solutions Segment EBITDA increased 6% in 2017 compared to 2016 due to the impact of the revenue items noted within "Global Financial Solutions segment results" above and lower expenses driven by $25 million of operational efficiencies and lower plastics volumes in North America partially offset by increased investment in the international regions. Currency translation negatively impacted segment adjusted EBITDA by approximately $7 million compared to the prior period.
Global Financial Solutions Segment EBITDA increased 17% in 2016 compared to 2015 due to the impact of the revenue items noted within "Global Financial Solutions segment results" above, which for the year ended December 31, 2016 includes $27 million from contract modifications and resolution of license fee disputes. The revenue growth was partially offset by an increase in variable expenses within our North America region. Currency translation negatively impacted segment adjusted EBITDA by approximately $20 million compared to the prior period.
Network & Security Solutions
Network & Security Solutions Segment EBITDA increased 9% in 2017 compared to 2016 due to the revenue items noted within "Network & Security Solutions segment results". In addition to revenue growth, expenses declined due to cost management initiatives in 2017.
48
Network & Security Solutions Segment EBITDA increased 4% in 2016 compared to 2015 due to the revenue items noted within "Network & Security Solutions segment results". In addition to revenue growth, expenses declined for the year ended December 31, 2016 by approximately $6 million due to expenses associated with strategic investments made during the first quarter of 2015.
Corporate
Corporate Segment EBITDA loss increased in 2017 compared to 2016 due to higher legal and incentive compensation related expenses.
Corporate Segment EBITDA loss increased modestly in 2016 compared to 2015 as a decrease in incentive compensation expense was partially offset by growth in technology and infrastructure costs.
Adjusted Net Income
Adjusted net income is a non-GAAP financial measure used by management that provides an alternative view of performance. Adjusted net income excludes amortization of acquisition-related intangibles, stock-based compensation, restructuring costs and other items affecting comparability and, therefore, are not reflective of continuing operating performance. Management believes that the presentation of adjusted net income provides users of our financial statements greater transparency into ongoing results of operations allowing them to better compare our results from period to period. This non-GAAP measure is not in accordance with, or an alternative to, measures prepared in accordance with GAAP and may be different from non-GAAP measures used by other companies. In addition, adjusted net income is not based on any comprehensive set of accounting rules or principles. Non-GAAP measures have limitations in that they do not reflect all of the amounts associated with our results of operations as determined in accordance with GAAP. These measures should only be used to evaluate our results of operations in conjunction with the corresponding GAAP measures.
The following table reconciles the reported net income presented in accordance with GAAP to the non-GAAP financial measure of adjusted net income for the years ended December 31, 2017 and 2016:
Year ended December 31, | Percent Change | ||||||||||||||||
(in millions) | 2017 | 2016 | 2015 | 2017 vs. 2016 | 2016 vs. 2015 | ||||||||||||
Net income (loss) attributable to First Data Corporation | $ | 1,465 | $ | 420 | $ | (1,481 | ) | NM | NM | ||||||||
Adjustments: | |||||||||||||||||
Stock-based compensation | 245 | 263 | 329 | (7 | )% | (20 | )% | ||||||||||
Loss on debt extinguishment | 80 | 70 | 1,068 | 14 | % | (93 | )% | ||||||||||
Amortization of acquisition intangibles and deferred financing costs(a) | 403 | 422 | 579 | (5 | )% | (27 | )% | ||||||||||
(Gain) loss on disposal of businesses | (18 | ) | 34 | — | NM | NM | |||||||||||
Gain on Visa Europe share sale | — | (29 | ) | — | NM | NM | |||||||||||
Restructuring | 83 | 49 | 53 | 69 | % | (8 | )% | ||||||||||
Intercompany foreign exchange gain (loss) | 1 | (19 | ) | 41 | NM | NM | |||||||||||
Fees paid on debt modification | 10 | 29 | — | (66 | )% | NM | |||||||||||
Impairment, litigation, and other(b) | 24 | 11 | 96 | 118 | % | (89 | )% | ||||||||||
Deal and deal integration costs | 27 | — | — | NM | NM | ||||||||||||
Mark-to-market adjustment for derivatives and euro-denominated debt | — | 5 | (53 | ) | (100 | )% | (109 | )% | |||||||||
Income tax on above items(c) | (895 | ) | (35 | ) | (11 | ) | NM | NM | |||||||||
Adjusted net income attributable to First Data Corporation | $ | 1,425 | $ | 1,220 | $ | 621 | 17 | % | 96 | % | |||||||
NM represents not meaningful
(a) | Represents amortization of intangibles established in connection with the 2007 Merger and acquisitions we have made since 2007, excluding the percentage of our consolidated amortization of acquisition intangibles related to non-wholly owned consolidated alliances equal to the portion of such alliances owned by our alliance partners. Also, includes amortization related to deferred financing costs of $10 million, $29 million and $6 million for the years ended December 31, 2017, 2016, and 2015, respectively. |
(b) | Represents impairments, non-normal course litigation and regulatory settlements, investments gains (losses), and other, as applicable to the periods presented. The 2015 balance includes a $78 million termination fee paid to KKR upon consummation of our initial public offering. |
(c) | The tax effect of the adjustments between our GAAP and adjusted results takes into account the tax treatment and related tax rate(s) that apply to each adjustment in the applicable tax jurisdiction(s). Generally, this results in a tax impact at the U.S. effective tax rate for certain adjustments, including the majority of amortization of intangible assets, deferred financing costs, stock compensation, and loss on debt extinguishment; whereas the tax impact of other adjustments, including restructuring expense, depends on whether the amounts are deductible in the respective tax jurisdictions and the applicable effective tax rate(s) in those jurisdictions. Income tax (expense) benefit also includes the impact of significant discrete tax items impacting Net income (loss) attributable to First Data Corporation. The significant change in income taxes in the current period is primarily driven by a $1,289 million tax benefit associated with the release of valuation allowances in the U.S. federal jurisdiction, partially offset by a $353 million tax expense associated with the impact of tax reform on our deferred tax assets. |
49
Adjusted net income for the year ended December 31, 2017 improved due to better operating performance and lower interest expense. Growth in depreciation partially offset adjusted net income for the year ended December 31, 2017.
Adjusted net income for the year ended December 31, 2016 improved due to better operating performance and lower interest expense.
Liquidity and Capital Resources
Our source of liquidity is principally cash generated from operating activities supplemented by our receivable securitization facility and, as necessary, on a short-term basis by borrowings against our senior secured revolving credit facility. We believe our current level of cash and short-term financing capabilities along with future cash flows from operations are sufficient to meet the ongoing needs of the business. To the extent future cash flows exceed the ongoing needs of the business, we may use all or a portion of the excess cash to reduce our debt balances.
Since our IPO which occurred in October 2015, we have executed various amendments and modifications to our debt agreements in an effort to lower our overall cost of debt and to extend debt maturities. Prior to 2017, we primarily used excess cash generated by the business and funds raised via the IPO to pay down certain tranches of debt. In 2017, we acquired 100% of CardConnect and BluePay for net consideration of $763 million and $759 million, respectively. For additional detail about these acquisitions, see note 12 "Acquisitions and Dispositions" to our consolidated financial statements in Part II, Item 8 of this Form 10-K for the year ended December 31, 2017.
Total borrowings and net debt
For the year ended December 31, 2017, net debt increased due to acquisitions. The chart below shows the net debt balances as of December 31, 2017 and 2016. Net debt is a non-GAAP measure defined as total long-term borrowings plus short-term and current portion of long-term borrowings at par value excluding lines of credit used for settlement purposes less cash and cash equivalents. We believe that net debt provides additional insight on the level and management of leverage. Net debt is not, and should not be viewed as, a substitute for total outstanding GAAP borrowings.
As of December 31, | ||||||||
(in millions) | 2017 | 2016 | ||||||
Total long-term borrowings | $ | 17,927 | $ | 18,131 | ||||
Total short-term and current portion of long-term borrowings | 1,271 | 358 | ||||||
Total borrowings | 19,198 | 18,489 | ||||||
Unamortized discount and unamortized deferred financing costs | 126 | 156 | ||||||
Total borrowings at par | 19,324 | 18,645 | ||||||
Less: settlement lines of credit and other arrangements | 205 | 84 | ||||||
Debt | 19,119 | 18,561 | ||||||
Less: cash and cash equivalents | 498 | 385 | ||||||
Net debt | $ | 18,621 | $ | 18,176 | ||||
Our current level of debt may limit our ability to get additional funding at our current funding rate beyond our revolving credit facility and receivable securitization facility if needed. Details regarding our debt structure are provided in note 2 "Borrowings" to our consolidated financial statements in Part II, Item 8 of this Form 10-K for the year ended December 31, 2017.
Credit ratings
As of February 20, 2018, our long-term corporate family rating from Moody’s was B1 (outlook stable). The long-term local issuer credit rating from Standard and Poor’s was B+ (outlook stable). The long-term issuer default rating from Fitch was B+ (outlook positive). A decrease in our credit ratings could affect our ability to access future financing at current funding rates, which could result in increased interest expense in the future.
Cash and cash equivalents
Investments (other than those included in settlement assets) with original maturities of three months or less (that are readily convertible to cash) are considered to be cash equivalents and are stated at cost, which approximates market value. As of December 31, 2017 and 2016, we held $498 million and $385 million in cash and cash equivalents, respectively.
50
The following table details the cash and cash equivalents as of December 31, 2017 and 2016:
As of December 31, 2017 | As of December 31, 2016 | ||||||||||||||||||||||
(in millions) | Available | Unavailable | Total | Available | Unavailable | Total | |||||||||||||||||
Domestic | $ | 50 | $ | 101 | (a) | $ | 151 | $ | 12 | $ | 102 | (a) | $ | 114 | |||||||||
International | 227 | 120 | (b) | 347 | 127 | 144 | (c) | 271 | |||||||||||||||
Total | $ | 277 | $ | 221 | $ | 498 | $ | 139 | $ | 246 | $ | 385 | |||||||||||
(a) | Represents cash held by two of our domestic entities that are not available to fund operations outside of these entities unless the Board of Directors of those respective entities declare a dividend. Also, one of these entities is subject to regulatory capital requirements that must be satisfied before a dividend may be declared. |
(b) | Consolidated foreign joint ventures held $110 million in cash and cash equivalents until the joint ventures' Board of Directors authorize a distribution. In addition, $10 million of the remaining unavailable cash and cash equivalents in our international subsidiaries is held in countries that have currency controls. |
(c) | Consolidated foreign joint ventures held $134 million in cash and cash equivalents until the joint ventures' Board of Directors authorize a distribution. In addition, $10 million of the remaining unavailable cash and cash equivalents in our international subsidiaries is held in countries that have currency controls. |
Cash flows
Year ended December 31, | ||||||||||||
Source/(use) (in millions) | 2017 | 2016 | 2015 | |||||||||
Net cash provided by operating activities | $ | 2,047 | $ | 2,111 | $ | 795 | ||||||
Net cash used in investing activities | (1,950 | ) | (387 | ) | (685 | ) | ||||||
Net cash provided by (used in) financing activities | 9 | (1,734 | ) | (16 | ) | |||||||
Cash flows from operating activities
The chart below reconciles the change in operating cash flows for the years ended December 31, 2016 to December 31, 2017 and December 31, 2015 to December 31, 2016:
Year ended December 31, | ||||||||
Source/(use) (in millions) | 2017 | 2016 | ||||||
Net cash provided by operating activities, previous period | $ | 2,111 | $ | 795 | ||||
Increases (decreases) in: | ||||||||
Net income, excluding other operating expenses and other income (a) | 270 | 840 | ||||||
Depreciation and amortization | 12 | (72 | ) | |||||
Working capital | (346 | ) | 548 | |||||
Net cash provided by operating activities, end of period | $ | 2,047 | $ | 2,111 | ||||
(a) | Excludes loss on debt extinguishment, stock-based compensation expense and other non-cash items. |
Our operating cash flow is significantly impacted by our level of debt. Approximately $0.9 billion, $1.0 billion, and $1.8 billion in cash interest, net of interest rate swap settlements, was paid during 2017, 2016, and 2015, respectively. The decrease in cash interest in 2017 compared to 2016 is due to lower spreads on term loan debt, lower payments on interest rate derivatives, and lower average outstanding principal balances, partially offset by higher LIBOR rates and a timing shift on bond coupon payments associated with bonds or term loans that were refinanced in both periods.
Refer to "Item 7A. Quantitative and Qualitative Disclosures about Market Risk" for a detailed discussion on how a 100 basis point increase in the applicable London Interbank Offered Rate (LIBOR) index on an annualized basis would impact our annual interest expense.
51
The table below represents the working capital change for the years ended December 31, 2017 compared to the same period in 2016:
Year ended December 31, | |||||||||||
Source/(use) (in millions) | 2017 | 2016 | Change | ||||||||
Accounts receivable, current and long term (a) | $ | (196 | ) | $ | (81 | ) | $ | (115 | ) | ||
Other assets, current and long term (b) | (36 | ) | 61 | (97 | ) | ||||||
Accounts payable and other liabilities, current and long term (c) | (82 | ) | 35 | (117 | ) | ||||||
Income tax accounts (d) | (16 | ) | 1 | (17 | ) | ||||||
Total working capital change | $ | (330 | ) | $ | 16 | $ | (346 | ) | |||
(a) | Decrease due to year-end timing and growth in pre-funding for one of our retail clients. |
(b) | Decrease resulted from $49 million related to inventory working capital initiative in 2016, $24 million in prepaid maintenance contacts, and interest rate swaps. |
(c) | Decrease is attributable to timing of payments. |
(d) | Decrease is related to income tax payments in 2017. |
The table below represents the working capital change for the years ended December 31, 2016 compared to the same period in 2015:
Year ended December 31, | |||||||||||
Source/(use) (in millions) | 2016 | 2015 | Change | ||||||||
Accounts receivable, current and long term (a) | $ | (81 | ) | $ | (184 | ) | $ | 103 | |||
Other assets, current and long term (b) | 61 | (199 | ) | 260 | |||||||
Accounts payable and other liabilities, current and long term (c) | 35 | (162 | ) | 197 | |||||||
Income tax accounts (d) | 1 | 13 | (12 | ) | |||||||
Total working capital change | $ | 16 | $ | (532 | ) | $ | 548 | ||||
(a) | Increase is driven by $102 million reclassification related to settlement activities to conform certain domestic and international businesses to our global policies. |
(b) | Increase due to $96 million from the settlement of cross-currency swaps in 2016 and the timing of working capital requirements and operational improvements impacting inventory levels. |
(c) | Increase is resulting from $271 million of accelerated interest payments in 2015 related to debt extinguishments offset by the non-recurrence of two supplier signing bonuses received in the prior year. |
(d) | Decrease related to income tax payments in 2016. |
Cash flows from investing activities
The table below summarizes the changes in investing activities for the years ended December 31, 2017 and 2016:
Year ended December 31, | |||||||||||
Source/(use) (in millions) | 2017 | 2016 | Change | ||||||||
Acquisitions (a) | $ | (1,607 | ) | $ | (6 | ) | $ | (1,601 | ) | ||
Dispositions (b) | 88 | 38 | 50 | ||||||||
Capital expenditures | (518 | ) | (477 | ) | (41 | ) | |||||
Other (c) | 87 | 58 | 29 | ||||||||
Net cash used in investing activities | $ | (1,950 | ) | $ | (387 | ) | $ | (1,563 | ) | ||
(a) | Decrease is related to acquisition of Acculynk, CardConnect and BluePay during 2017. For additional detail about these acquisitions, see note 12 "Acquisitions and Dispositions" to our consolidated financial statements in Part II, Item 8 of this Form 10-K for the year ended December 31, 2017. |
(b) | Increase driven by proceeds from our 2017 Baltics disposition offset by 2016 sale of the Australian ATM business. For additional detail about these dispositions, see note 12 "Acquisitions and Dispositions" to our consolidated financial statements in Part II, Item 8 of this Form 10-K for the year ended December 31, 2017. |
(c) | Other represents proceeds from maturity of net investment hedge, proceeds from sale of property and equipment, purchase of equity method investments, and other investing activities. |
52
The table below summarizes the changes in investing activities for the years ended December 31, 2016 and 2015:
Year ended December 31, | |||||||||||
Source/(use) (in millions) | 2016 | 2015 | Change | ||||||||
Acquisitions (a) | $ | (6 | ) | $ | (89 | ) | $ | 83 | |||
Dispositions (b) | 38 | 4 | 34 | ||||||||
Capital expenditures | (477 | ) | (602 | ) | 125 | ||||||
Other (c) | 58 | 2 | 56 | ||||||||
Net cash used in investing activities | $ | (387 | ) | $ | (685 | ) | $ | 298 | |||
(a) | Increase driven by the 2015 acquisitions of Spree, First Pay, and Transaction Wireless Inc. For additional detail about these acquisitions, see note 12 "Acquisitions and Dispositions" to our consolidated financial statements in Part II, Item 8 of this Form 10-K for the year ended December 31, 2017. |
(b) | Increase driven by the 2016 sale of the Australian ATM business. For additional detail about these dispositions, see note 12 "Acquisitions and Dispositions" to our consolidated financial statements in Part II, Item 8 of this Form 10-K for the year ended December 31, 2017. |
(c) | Increase is driven by 2016 sale of two facilities of $38 million, $27 million of cash received from our investment in Visa Europe. Change was partially offset by $17 million of proceeds from the sale of two facilities in 2015 and an investment in an international joint venture. |
Cash flows from financing activities
The table below summarizes the changes in financing activities for the years ended December 31, 2017 and 2016:
Year ended December 31, | |||||||||||
Source/(use) (in millions) | 2017 | 2016 | Change | ||||||||
Net debt transactions (a) | $ | 382 | $ | (1,335 | ) | $ | 1,717 | ||||
Proceeds from issuance of common stock | 50 | 23 | 27 | ||||||||
Other (b) | (423 | ) | (422 | ) | (1 | ) | |||||
Net cash provided by (used in) financing activities | $ | 9 | $ | (1,734 | ) | $ | 1,743 | ||||
(a) | We are regularly looking for opportunities to lower our interest expense and extend maturity dates. The increase in net debt transactions is due to the capital needs associated with acquiring BluePay and CardConnect. Details regarding our debt structure are provided in note 2 "Borrowings" to our consolidated financial statements in Part II, Item 8 of this Form 10-K for the year ended December 31, 2017. |
(b) | Other represents payment of call premiums and debt issuance cost, payment of taxes related to net settlement of equity awards, distributions and dividends paid to noncontrolling interests and redeemable noncontrolling interest and other financing activities. |
The table below summarizes the changes in financing activities for the years ended December 31, 2016 and 2015:
Year ended December 31, | |||||||||||
Source/(use) (in millions) | 2016 | 2015 | Change | ||||||||
Net debt transactions (a) | $ | (1,335 | ) | $ | (1,341 | ) | $ | 6 | |||
Proceeds from issuance of common stock (b) | 23 | 2,718 | (2,695 | ) | |||||||
Other (c) | (422 | ) | (1,393 | ) | 971 | ||||||
Net cash used in financing activities | $ | (1,734 | ) | $ | (16 | ) | $ | (1,718 | ) | ||
(a) | We are regularly looking for opportunities to lower our interest expense and extend maturity dates. Details regarding our debt structure are provided in note 2 "Borrowings" to our consolidated financial statements in Part II, Item 8 of this Form 10-K for the year ended December 31, 2017. |
(b) | Decrease driven by $2.7 billion of proceeds from our initial public offering in 2015. |
(c) | Increase due to payments of call premiums and debt fees related to 2015 debt extinguishments. |
Free Cash Flow
Free cash flow is a non-GAAP measure defined as cash flow provided by operating activities less capital expenditures, distributions to minority interests and other items. We consider free cash flow to be a liquidity measure that provides useful information to management and users of our financial statements about the amount of cash generated by the business which can then be used to, among other things, reduce outstanding debt and/or strategic acquisitions. Free cash flow is not, and should not be viewed as, a substitute for GAAP reported financial information.
53
The table below reconciles cash flow from operations to free cash flow for the years ended December 31, 2017 and 2016, respectively.
Year ended December 31, | ||||||||||||
Source/(use) (in millions) | 2017 | 2016 | Change | |||||||||
Net cash provided by operating activities (a)(c) | $ | 2,047 | $ | 2,111 | $ | (64 | ) | |||||
Capital expenditures | (518 | ) | (477 | ) | (41 | ) | ||||||
Distributions and dividends paid to noncontrolling interests, redeemable noncontrolling interest, and other (b)(c) | (170 | ) | (418 | ) | 248 | |||||||
Free cash flow | $ | 1,359 | $ | 1,216 | $ | 143 | ||||||
(a) | Net cash provided by operating activities decreased due to the items noted previously in the "Cash flows from operating activities" above. |
(b) | Distributions and dividends paid to noncontrolling interests and redeemable noncontrolling interest and other decreased due to $90 million received from the maturity of three net investment hedges in 2017, lower noncontrolling interest earnings, and the timing of distributions totaling $53 million. |
(c) | The year ended December 31, 2016 balance includes a $102 million reclassification related to settlement activities to conform certain domestic and international businesses to our global policies, which increased "Cash and cash equivalents" and decreased "Accounts receivable, net" in our consolidated balances sheets. Free cash flow excludes the impact of reclassification. |
The table below reconciles cash flow from operations to free cash flow for the years ended December 31, 2016 and 2015, respectively.
Year ended December 31, | ||||||||||||
Source/(use) (in millions) | 2016 | 2015 | Change | |||||||||
Net cash provided by operating activities (a)(c) | $ | 2,111 | $ | 795 | $ | 1,316 | ||||||
Capital expenditures (b) | (477 | ) | (602 | ) | 125 | |||||||
Distributions and dividends paid to noncontrolling interests, redeemable noncontrolling interest, and other(c) | (418 | ) | (312 | ) | (106 | ) | ||||||
Free cash flow | $ | 1,216 | $ | (119 | ) | $ | 1,335 | |||||
(a) | Net cash provided by operating activities increased due to the items noted previously in the "Cash flows from operating activities" above. |
(b) | Change in capital expenditures is due to a $132 million increase in new capital leases and other financing arrangements. Capital leases and other financing arrangements are reflected within "Short-term and current portion of long-term borrowings" and "Long-term borrowings" within the consolidated balance sheets. |
(c) | The year ended December 31, 2016 balance includes a $102 million reclassification related to settlement activities to conform certain domestic and international businesses to our global policies, which increased "Cash and cash equivalents" and decreased "Accounts receivable, net" in our consolidated balances sheets. Free cash flow excludes the impact of reclassification. |
Letters, lines of credit, and other
Total Available (a) | Total Outstanding | |||||||||||||||
As of December 31, | As of December 31, | |||||||||||||||
(in millions) | 2017 | 2016 | 2017 | 2016 | ||||||||||||
Letters of credit (b) | $ | 283 | $ | 250 | $ | 29 | $ | 41 | ||||||||
Lines of credit and other (c) | 546 | 489 | 205 | 84 | ||||||||||||
(a) | Total available without giving effect to amounts outstanding. |
(b) | Outstanding letters of credit are held in connection with lease arrangements, bankcard association agreements, and other security agreements. Letters of credit are issued against our revolving credit facility with a $250 million limit in 2017 and 2016. The largest amount of letters of credit outstanding during 2017 was approximately $44 million. All letters of credit expire on or prior to December 15, 2018 with a one-year renewal option. We expect to renew most of the letters of credit prior to expiration. On December 14, 2017, the Company executed a $33 million senior unsecured revolving credit facility maturing December 20, 2019, available for letters of credit. The interest rate associated with the credit facility was 1.85% for the year ended December 31, 2017. At the end of 2017, we were in the process of transitioning our letters of credit from the revolving credit facility to the senior unsecured credit facility. This resulted in duplicate letters of credit totaling $19 million, which are not included in the total outstanding balance above. |
(c) | As of December 31, 2017 we had $531 million of committed lines of credit as well as certain uncommitted lines of credit and other agreements that are available in various currencies to fund settlement and other activity. We cannot use these lines of credit for general corporate purposes. Certain of these arrangements are uncommitted but, as of the dates presented, we had borrowings outstanding against them. Increase due to year-end timing and growth in pre-funding for one of our retail clients. |
In the event one or more of the lines of credit becomes unavailable, we will utilize our existing cash, cash flows from operating activities, our receivable securitization facility or our senior secured revolving credit facility to meet our liquidity needs.
Guarantees and covenants All obligations under the senior secured revolving credit facility and our senior secured term loan facilities are unconditionally guaranteed by most of our existing and future, direct and indirect, wholly-owned, material domestic subsidiaries. The senior secured facilities contain a number of covenants that, among other things, restrict our ability to incur additional indebtedness; create liens; enter into sale-leaseback transactions; engage in mergers or consolidations; sell or transfer
54
assets; pay dividends and distributions or repurchase our capital stock; make investments, loans or advances; prepay certain indebtedness; make certain acquisitions; engage in certain transactions with affiliates; amend material agreements governing certain indebtedness; and change our lines of business. The senior secured facilities also require us to not exceed a maximum senior secured leverage ratio and contain certain customary affirmative covenants and events of default, including a change of control. The senior secured term loan facility also requires mandatory prepayments based on a percentage of excess cash flow generated by us if we exceed a certain leverage ratio.
All obligations under the senior secured notes, senior notes, and senior subordinated notes are similarly guaranteed in accordance with their terms by each of our domestic subsidiaries that guarantee obligations under our senior secured term loan facility described above. These notes and facilities also contain a number of covenants similar to those described for the senior secured obligations noted above.
Although all of the above described instruments of indebtedness contain restrictions on our ability to incur additional indebtedness, these restrictions are subject to numerous qualifications and exceptions, including the ability to incur indebtedness in connection with our settlement operations. We believe that the indebtedness that can be incurred under these exceptions as well as additional credit under the existing senior secured revolving credit facility are sufficient to satisfy our needs for the foreseeable future.
Covenant compliance Under the senior secured revolving credit and term loan facilities, certain limitations, restrictions, and defaults could occur if we are not able to satisfy and remain in compliance with specified financial ratios. We have agreed that we will not permit the Consolidated Senior Secured Debt to Covenant EBITDA Ratio (both as defined in the agreement) for any 12 month period (last four fiscal quarters) to be greater than 6.0 to 1.0.
The breach of this covenant could result in a default under the senior secured revolving credit facility and the senior secured term loan credit facility and the lenders could elect to declare all amounts borrowed due and payable. Any such acceleration could also result in a default under the indentures for the senior secured notes, senior notes, and senior subordinated notes. As of December 31, 2017, we were in compliance with all applicable covenants, including our sole financial covenant with Consolidated Senior Secured Debt of $12.3 billion, Covenant EBITDA of $3.5 billion and a Ratio of 3.49 to 1.0.
Covenant EBITDA is calculated by adjusting EBITDA to exclude unusual items as permitted in calculating covenant compliance under the credit facilities. Covenant EBITDA is further adjusted to add net income attributable to noncontrolling interests and redeemable noncontrolling interest of certain non wholly owned subsidiaries and exclude other miscellaneous adjustments that are used in calculating covenant compliance under the agreements governing our senior secured credit facilities. Because not all companies use identical calculations, this presentation of Covenant EBITDA may not be comparable to other similarly titled measures of other companies.
55
The calculation of Covenant EBITDA under our senior secured facilities was as follows:
(in millions) | Year Ended December 31, 2017 | |||
Net income attributable to First Data Corporation | $ | 1,465 | ||
Interest expense, net | 937 | |||
Income tax benefit | (729 | ) | ||
Depreciation and amortization | 1,073 | |||
EBITDA | 2,746 | |||
Loss on debt extinguishment | 80 | |||
Stock-based compensation | 245 | |||
Net income attributable to noncontrolling interests and redeemable noncontrolling interest | 199 | |||
Projected near-term cost savings and revenue enhancements (1) | 111 | |||
Restructuring, net | 83 | |||
Non-operating foreign currency (gains) and losses | 1 | |||
Equity entities taxes, depreciation and amortization (2) | 14 | |||
Divestitures, net | (18 | ) | ||
Other (3) | 62 | |||
Covenant EBITDA | $ | 3,523 | ||
(1) | Reflects cost savings and revenue enhancements we expect to realize as a result of specific actions as if they were achieved on the first day of the period. Includes cost savings initiatives associated with the business optimization projects and other technology initiatives. We may not realize the anticipated cost savings pursuant to our anticipated timetable or at all. |
(2) | Represents our proportional share of income taxes, depreciation, and amortization on equity method investments. |
(3) | Includes items such as deal and deal integration costs, pension losses, earn-outs, litigation and regulatory settlements, and other as applicable to the period presented. |
Off-Balance Sheet Arrangements
During 2017, 2016, and 2015, we did not engage in any off-balance sheet financing activities other than those included in the “Contractual Obligations” discussion below and those reflected in note 14 "Commitments and Contingencies" to our consolidated financial statements in Part II, Item 8 of this Form 10-K.
Contractual Obligations
Our contractual obligations as of December 31, 2017 were as follows:
Payments Due by Period | ||||||||||||||||||||
(in millions) | Total | Less than 1 year | 1-3 years | 3-5 years | After 5 years | |||||||||||||||
Borrowings (a) | $ | 22,806 | $ | 941 | $ | 3,101 | $ | 5,329 | $ | 13,435 | ||||||||||
Capital lease obligations (b) | 331 | 99 | 194 | 18 | 20 | |||||||||||||||
Operating leases | 346 | 63 | 104 | 74 | 105 | |||||||||||||||
Purchase obligations (c): | ||||||||||||||||||||
Technology and telecommunications (d) | 962 | 391 | 441 | 130 | — | |||||||||||||||
All other (e) | 50 | 29 | 12 | 5 | 4 | |||||||||||||||
Total (f) (g) | $ | 24,495 | $ | 1,523 | $ | 3,852 | $ | 5,556 | $ | 13,564 | ||||||||||
(a) | Includes future principal and cash interest payments on long-term borrowings through scheduled maturity dates. Includes $10.0 billion of variable rate debt, $4.3 billion of which is subject to fixed interest rate collar contracts which mitigate exposure to interest rate fluctuations, but are subject to contractual ceilings and floors. Borrowings and interest rate swaps are discussed in note 2 "Borrowings" and note 13 "Derivative Financial Instruments", respectively, to our consolidated financial statements in Part II, Item 8 of this Form 10-K. Interest payments for the variable rate debt and the associated interest rate swaps were calculated using interest rates as of December 31, 2017. |
(b) | Represents future payments on existing capital leases, including interest expense, through scheduled expiration dates. |
(c) | Many of our contracts contain clauses that allow us to terminate the contract with notice, and with or without a termination penalty. Termination penalties are generally an amount less than the original obligation. Certain contracts also have an automatic renewal clause if we do not provide written notification |
56
of our intent to terminate the contract. Obligations under certain contracts are usage-based and are, therefore, estimated in the above amounts. Historically, we have not had any significant defaults of our contractual obligations or incurred significant penalties for termination of our contractual obligations.
(d) | Technology and telecommunications represents obligations related to hardware purchases, including purchases of ATMs and terminals, as well as software licenses, hardware and software maintenance and support, technical consulting services, and telecommunications services. |
(e) | All other includes obligations related to materials, data, non-technical contract services, facility security, investor management fees, maintenance, and marketing promotions. |
(f) | We evaluate the need to make contributions to our pension plans after considering the funded status of the pension plans, movements in the discount rates, performance of the plan assets and related tax consequences. Expected contributions to our pension plan have not been included in the table as such amounts are dependent upon the considerations discussed above, and may result in a wide range of amounts. See note 15 "Employee Benefit Plans" to our consolidated financial statements in Part II, Item 8 of this Form 10-K. |
(g) | As of December 31, 2017, we had approximately $270 million of tax contingencies comprised of approximately $259 million reported in long-term income taxes payable in the “Other long-term liabilities” line of our consolidated balance sheets, including approximately $4 million of income tax liabilities for which The Western Union Company (Western Union) is required to indemnify us, and approximately $11 million recorded as an increase of our deferred tax liability. These amounts have been excluded from the table because the settlement period cannot be reasonably estimated. The timing of these payments will ultimately depend on the progress of tax examinations with the various tax authorities. |
Critical Accounting Policies
Goodwill: Goodwill represents the excess of cost over the fair value of net assets acquired, including identifiable intangible assets, and has been allocated to reporting units. Our reporting units are businesses at the operating segment level or one level below the operating segment level for which discrete financial information is prepared and regularly reviewed by management.
We test goodwill annually for impairment, as well as upon an indicator of impairment, by first performing a qualitative assessment at the reporting unit level for all reporting units with the exception of the GBS reporting unit for which we begin with a quantitative assessment. The qualitative assessment evaluates company, industry, and macroeconomic events and circumstances to determine if it is more likely than not that the fair value of the reporting unit is less than its carrying value. If it is determined through the qualitative assessment that it is more likely than not that the fair value is less than the carrying value, we proceed to a quantitative assessment.
For reporting units tested using a quantitative assessment, fair value is based on a discounted cash flow model involving several assumptions. When appropriate we consider assumptions that we believe a hypothetical marketplace participant would use in estimating future cash flows. The key assumptions include segment EBITDA growth and weighted-average cost of capital (discount rate). We determined segment EBITDA growth based on management estimates and business plans. Discount rate assumptions are based on an assessment of the risk inherent in future cash flows of the respective reporting unit as well as cost of debt and equity. If it is determined through quantitative assessment that the fair value is less than the carrying value, the amount by which the carrying value exceeds the fair value, limited to the amount of goodwill recorded and taking into consideration the effect of any tax deductible goodwill, is recorded as an impairment of goodwill.
An impairment charge of a reporting unit’s goodwill could have a material adverse effect on our financial results. An impairment charge may be caused by changes in the underlying business and economic conditions, the most relevant of which would be a deterioration in global economic conditions. Deterioration in global economic conditions could cause us to experience a decrease in our segment EBITDA. Furthermore, volatility in the debt markets which impacted our debt yields, could affect these estimates used in the analysis discussed above, which in turn could affect the fair value of the reporting unit. Thus, it is possible for reporting units that record impairments to record additional impairments in the future. All key assumptions and valuations are determined by and are the responsibility of management. The factors used in the impairment analysis are inherently subject to uncertainty. We believe that we have made reasonable estimates and assumptions to determine the fair value of our reporting units, if actual results are not consistent with these estimates and assumptions, goodwill and other intangible assets may be overstated which could trigger an impairment charge.
As of December 31, 2017, the carrying value of goodwill was $17.7 billion of which $15.1 billion related to our GBS reporting unit. As of October 1, 2017, the most recent impairment analysis date, our GBS reporting unit's fair value exceeded its carrying value by 13% and all other reporting units passed their respective qualitative assessments. Examples of events or circumstances that could reasonably be expected to negatively affect the underlying key assumptions and ultimately impact the estimated fair value of our reporting units may include such items as the following:
• | Global economic, political, and other conditions may adversely affect trends in consumer, business, and government spending, which may adversely impact the demand for our services and our revenue and profitability; |
• | Our ability to anticipate and respond to changing industry trends and the needs and preferences of our clients and consumers may affect our competitiveness or demand for our products, which may adversely affect our operating results; |
• | Substantial and increasingly intense competition worldwide in the financial services, payments, and technology industries may materially and adversely affect our overall business and operations; |
57
• | Potential changes in the competitive landscape, including disintermediation from other participants in the payments value chain, could harm our business; |
• | The market for our electronic commerce services is evolving and may not continue to develop or grow rapidly enough for us to maintain and increase our profitability; |
• | If we are unable to maintain merchant relationships and alliances, our business may be adversely affected; |
• | Failure to obtain new clients or renew client contracts on favorable terms could adversely affect results of operations and financial condition; and |
• | Cost savings initiatives may not produce the savings expected and may negatively impact our other initiatives and efforts to grow our business. |
See "Risk Factors" in Part I, Item 1A of this Form 10-K for further discussions of risks that could affect our business.
An additional analysis was performed for our GBS reporting unit, which sensitized the base discount rate by an additional 50 basis points. GBS passed by a margin of 5%. Refer to note 1 "Summary of Significant Accounting Policies" to our consolidated financial statements in Part II, Item 8 of this Form 10-K for additional information regarding goodwill.
Reserve for merchant credit losses and check guarantees: Our merchant clients (or those of our unconsolidated alliances) have the liability for any charges properly reversed by the cardholder. In the event, however, that we are not able to collect such amounts from the merchants due to merchant fraud, insolvency, bankruptcy or another reason, we may be liable for any such reversed charges. Our risk in this area primarily relates to situations where the cardholder has purchased goods or services to be delivered in the future and which have yet to be delivered.
Our obligation to stand ready to perform is minimal in relation to the total dollar volume processed. We require cash deposits, guarantees, letters of credit or other types of collateral from certain merchants to minimize this obligation. The amounts of collateral held by us and our unconsolidated alliances are as follows:
As of December 31, | ||||||||
(in millions) | 2017 | 2016 | ||||||
Cash and cash equivalents collateral | $ | 499 | $ | 494 | ||||
Collateral in the form of letters of credit | 133 | 134 | ||||||
Total collateral | $ | 632 | $ | 628 | ||||
We also utilize a number of systems and procedures to manage merchant risk. Despite these efforts, we historically have experienced some level of losses due to merchant defaults.
Our contingent obligation relates to imprecision in our estimates of required collateral. A provision for this obligation is recorded based primarily on historical experience of credit losses and other relevant factors such as economic downturns or increases in merchant fraud. The following table presents the aggregate merchant credit losses incurred compared to total dollar volumes processed:
Year ended December 31, | ||||||||||||
(in millions) | 2017 | 2016 | 2015 | |||||||||
First Data and consolidated and unconsolidated alliances credit losses | $ | 98 | $ | 93 | $ | 67 | ||||||
First Data and consolidated alliances credit losses | 89 | 83 | 55 | |||||||||
Total dollar volume processed (in billions) | 2,401 | 2,153 | 1,885 | |||||||||
The reserve recorded on our consolidated balance sheets relates to the business conducted by our consolidated subsidiaries. The reserve for unconsolidated alliances is recorded only in the alliances’ respective financial statements. We have not recorded any reserve for estimated losses in excess of reserves recorded by the unconsolidated alliances nor have we identified needs to do so. The following table presents the aggregate merchant credit loss reserves:
As of December 31, | ||||||||
(in millions) | 2017 | 2016 | ||||||
First Data and consolidated and unconsolidated alliances merchant credit loss reserves | $ | 33 | $ | 28 | ||||
First Data and consolidated alliances merchant credit loss reserves | 29 | 23 | ||||||
The credit loss reserves, both for us and our unconsolidated alliances, are comprised of amounts for known losses and a provision for losses incurred but not reported (IBNR). These reserves primarily are determined by performing a historical analysis of
58
chargeback loss experience. Other factors are considered that could affect that experience in the future. Such items include the general economy and economic challenges in a specific industry or those affecting certain types of clients. Once these factors are considered, we or the unconsolidated alliance establishes a rate (percentage) that is calculated by dividing the expected chargeback (credit) losses by dollar volume processed. This rate is then applied against the dollar volume processed each month and charged against earnings. The resulting reserve balance is then compared to requirements for known losses and estimates for IBNR items. Historically, this estimation process has proved to be materially accurate and we believe the recorded reserve approximates the fair value of the contingent obligation.
The majority of the TeleCheck business involves the guarantee of checks received by merchants. If the check is returned, TeleCheck is required to purchase the check from the merchant at its face value and pursue collection from the check writer. A provision for estimated check returns, net of anticipated recoveries, is recorded at the transaction inception based on recent history. The following table presents the estimate of losses on returned check and the fair value of check guarantees:
As of December 31, | ||||||||
(in millions) | 2017 | 2016 | ||||||
Estimate of losses on returned checks | $ | 4 | $ | 5 | ||||
Fair value of checks guaranteed | 14 | 17 | ||||||
The following table details the check guarantees of TeleCheck:
Year ended December 31, | ||||||||||||
2017 | 2016 | 2015 | ||||||||||
Aggregate face value of guaranteed checks (in billions) | $ | 26 | $ | 28 | $ | 32 | ||||||
Aggregate amount of checks presented for warranty (in millions) | 179 | 188 | 216 | |||||||||
Warranty losses net of recoveries and service fees (in millions) | 52 | 55 | 61 | |||||||||
The estimate of losses on returned checks is included in “Accounts payable and accrued liabilities” and the fair value of checks guaranteed is included in “Accounts receivable, net” in the consolidated balance sheets. The maximum potential future payments under the guarantees were approximately $456 million as of December 31, 2017 which represented an estimate of the total uncleared checks at that time.
Income taxes: The determination of our provision for income taxes requires management’s judgment in the use of estimates and the interpretation and application of complex tax laws. Judgment is also required in assessing the timing and amounts of deductible and taxable items. We establish contingency reserves for material, known tax exposures relating to deductions, transactions, and other matters involving some uncertainty as to the proper tax treatment of the item. Our reserves reflect our judgment as to the resolution of the issues involved if subject to judicial review. Several years may elapse before a particular matter, for which we have established a reserve, is audited and finally resolved or clarified. While we believe that our reserves are adequate to cover reasonably expected tax risks, issues raised by a tax authority may be finally resolved at an amount different than the related reserve. Such differences could materially increase or decrease our income tax provision in the current and/or future periods. When facts and circumstances change (including a resolution of an issue or statute of limitations expiration), these reserves are adjusted through the provision for income taxes in the period of change. Largely, as the result of the interest expense that we incur, in the U.S. we are currently in a tax net operating loss position. Judgment is required to determine whether some portion or all of the resulting deferred tax assets will not be realized. To the extent we determine that we will not realize the benefit of some or all of our deferred tax assets, then these assets are adjusted through our provision for income taxes in the period in which this determination is made.
We are currently in a tax net operating loss position in several jurisdictions in which we operate, including the United States, resulting in significant deferred tax assets. We establish a valuation allowance against our deferred tax assets when, based upon the weight of all available evidence, we believe it is more likely than not that some portion or all of the deferred tax assets will not be realized. We believe that a significant portion of the deferred tax assets will be realized because of the existence of sufficient taxable income within the carryforward period available under the tax law, but have established valuation allowances for those deferred tax assets that in our judgment will not be realized. In making this determination, we have considered the relative impact of all of the available positive and negative evidences regarding future sources of taxable income and tax planning strategies. However, there could be material impact to our effective tax rate if there is a significant change in our judgment. If and when our judgment changes, then the valuation allowances are adjusted through the provision for income taxes in the period in which this determination is made. Refer to note 8 "Income Taxes" to our consolidated financial statements in Part II, Item 8 of this Form 10-K for additional information regarding our income tax provision.
59
New Accounting Guidance
Refer to note 1 "Summary of Significant Accounting Policies" to our consolidated financial statements included in Part II, Item 8 of this Form 10-K for new accounting guidance.
ITEM 7A. | QUANTITATIVE AND QUALITATIVE DISCLOSURES ABOUT MARKET RISK |
We are exposed to market risk from changes in interest rates. Our assets include cash equivalents as well as both fixed and floating rate interest-bearing securities. These investments arise primarily from settlement funds held by us pending settlement.
Our interest rate-sensitive liabilities are our debt instruments. Our senior secured term loan facilities are subject to variable interest rates. As of December 31, 2017, we have $10 billion in variable rate debt, which includes $600 million on our accounts receivable securitization facility and also includes $272 million drawn on our revolving credit facility. Additionally, we have $4.3 billion in variable to fixed interest rate collar contracts, of which $1.5 billion expires in September 2018, $1.3 billion expires in January 2019, and the remaining $1.5 billion expires in September 2019. The interest rate collar contracts mitigate exposure to interest rate fluctuations, but are subject to contractual ceilings and floors. The interest rate collar contracts provide for interest rate protection if one month LIBOR rises above 150 basis points on the contracts expiring September 2018 and January 2019 and 175 basis points on the contracts expiring September 2019.
Based on the December 31, 2017 balances, a 100 basis point increase in short-term interest rates on an annualized basis compared to the interest rates as of December 31, 2017, which for one month LIBOR was 1.56%, and a corresponding and parallel shift in the remainder of the yield curve, would result in a decrease to pretax income of $46 million. This decrease is due to a $62 million increase in interest expense related to our balance of variable interest rate debt, net of interest rate collar contracts partially offset by a $16 million increase in interest income primarily on settlement assets. A decrease in interest rates would result in an increase to pretax income. Actual interest rates could change significantly more than 100 basis points. There are inherent limitations in the sensitivity analysis presented, primarily due to the assumption that interest rate movements are linear and instantaneous. As a result, the analysis is unable to reflect the potential effects of more complex market changes that could arise, which may positively or negatively affect income.
Foreign Currency Risk
We are exposed to changes in currency rates as a result of our investments in foreign operations and revenues and expenses generated in currencies other than the U.S. dollar. Revenue and profit generated by international operations will increase or decrease compared to prior periods as a result of changes in foreign currency exchange rates. Refer to note 13 "Derivative Financial Instruments" in our consolidated financial statements in Part II, Item 8 of this Form 10-K for additional information regarding the changes in foreign currency exchange rates.
A hypothetical uniform 10% weakening in the value of the U.S. dollar relative to all the currencies in which our revenues and profits are denominated would result in an increase to pretax income of approximately $51 million. This increase results from a $45 million increase related to foreign exchange on foreign currency earnings, assuming consistent operating results as the twelve months preceding December 31, 2017, and a $6 million increase related to foreign exchange on intercompany loans. Foreign exchange exposure on pretax income has increased from the prior year driven by significant growth in foreign pretax earnings. There are inherent limitations in the sensitivity analysis presented, primarily due to the assumption that foreign exchange movements are linear and instantaneous. As a result, the analysis is unable to reflect the potential effects of more complex market changes that could arise, which may positively or negatively affect income.
60
ITEM 8. | FINANCIAL STATEMENTS AND SUPPLEMENTARY DATA |
FIRST DATA CORPORATION
INDEX TO FINANCIAL STATEMENTS
COVERED BY REPORT OF INDEPENDENT REGISTERED PUBLIC ACCOUNTING FIRM
First Data Corporation and Subsidiaries: | |
Consolidated Financial Statements: | |
Schedules: | |
61
Report of Independent Registered Public Accounting Firm
The Board of Directors and Stockholders of First Data Corporation
Opinion on the Financial Statements
We have audited the accompanying consolidated balance sheets of First Data Corporation as of December 31, 2017 and 2016, and the related consolidated statements of operations, comprehensive income (loss), cash flows and equity for each of the three years in the period ended December 31, 2017, and the related notes and financial statement schedules listed in the Index at Item 15(a) (collectively referred to as the "financial statements"). In our opinion, the financial statements present fairly, in all material respects, the consolidated financial position of the Company at December 31, 2017 and 2016, and the consolidated results of its operations and its cash flows for each of the three years in the period ended December 31, 2017, in conformity with U.S. generally accepted accounting principles.
We also have audited, in accordance with the standards of the Public Company Accounting Oversight Board (United States) (PCAOB), the Company's internal control over financial reporting as of December 31, 2017, based on criteria established in Internal Control-Integrated Framework issued by the Committee of Sponsoring Organizations of the Treadway Commission (2013 framework), and our report dated February 20, 2018 expressed an unqualified opinion thereon.
Basis for Opinion
These financial statements are the responsibility of the Company's management. Our responsibility is to express an opinion on the Company’s financial statements based on our audits. We are a public accounting firm registered with the PCAOB and are required to be independent with respect to the Company in accordance with the U.S. federal securities laws and the applicable rules and regulations of the Securities and Exchange Commission and the PCAOB.
We conducted our audits in accordance with the standards of the PCAOB. Those standards require that we plan and perform the audit to obtain reasonable assurance about whether the financial statements are free of material misstatement, whether due to error or fraud. Our audits included performing procedures to assess the risks of material misstatement of the financial statements, whether due to error or fraud, and performing procedures that respond to those risks. Such procedures included examining, on a test basis, evidence regarding the amounts and disclosures in the financial statements. Our audits also included evaluating the accounting principles used and significant estimates made by management, as well as evaluating the overall presentation of the financial statements. We believe that our audits provide a reasonable basis for our opinion.
/s/ Ernst & Young LLP | |
EY or one of its predecessors began serving consecutively as the Company’s (or one of its predecessors) auditor in 1980. | |
Atlanta, Georgia | |
February 20, 2018 | |
62
FIRST DATA CORPORATION
CONSOLIDATED STATEMENTS OF OPERATIONS
Year ended December 31, | ||||||||||||
(in millions, except per share amounts) | 2017 | 2016 | 2015 | |||||||||
Revenues: | ||||||||||||
Transaction and processing service fees (a) | $ | 6,757 | $ | 6,600 | $ | 6,597 | ||||||
Product sales and other (a) | 1,372 | 1,239 | 1,167 | |||||||||
Total revenues (excluding reimbursable items) | 8,129 | 7,839 | 7,764 | |||||||||
Reimbursable debit network fees, postage, and other | 3,923 | 3,745 | 3,687 | |||||||||
Total revenues | 12,052 | 11,584 | 11,451 | |||||||||
Expenses: | ||||||||||||
Cost of services (exclusive of items shown below) | 2,763 | 2,855 | 2,871 | |||||||||
Cost of products sold | 359 | 337 | 356 | |||||||||
Selling, general, and administrative | 2,178 | 2,035 | 2,292 | |||||||||
Depreciation and amortization | 972 | 949 | 1,022 | |||||||||
Other operating expenses | 143 | 61 | 53 | |||||||||
Total expenses (excluding reimbursable items) | 6,415 | 6,237 | 6,594 | |||||||||
Reimbursable debit network fees, postage, and other | 3,923 | 3,745 | 3,687 | |||||||||
Total expenses | 10,338 | 9,982 | 10,281 | |||||||||
Operating profit | 1,714 | 1,602 | 1,170 | |||||||||
Interest expense, net | (937 | ) | (1,068 | ) | (1,537 | ) | ||||||
Loss on debt extinguishment | (80 | ) | (70 | ) | (1,068 | ) | ||||||
Other income | 16 | 17 | 29 | |||||||||
Income (loss) before income taxes and equity earnings in affiliates | 713 | 481 | (1,406 | ) | ||||||||
Income tax (benefit) expense | (729 | ) | 81 | 101 | ||||||||
Equity earnings in affiliates | 222 | 260 | 239 | |||||||||
Net income (loss) | 1,664 | 660 | (1,268 | ) | ||||||||
Less: Net income attributable to noncontrolling interests and redeemable noncontrolling interest | 199 | 240 | 213 | |||||||||
Net income (loss) attributable to First Data Corporation | $ | 1,465 | $ | 420 | $ | (1,481 | ) | |||||
Net income (loss) per share: | ||||||||||||
Basic | $ | 1.60 | $ | 0.47 | $ | (7.70 | ) | |||||
Diluted | $ | 1.56 | $ | 0.46 | $ | (7.70 | ) | |||||
Weighted-average common shares outstanding: | ||||||||||||
Basic | 916 | 902 | 192 | |||||||||
Diluted | 940 | 921 | 192 | |||||||||
(a) | Includes processing fees, administrative service fees, and other fees charged to merchant alliances accounted for under the equity method of $215 million, $198 million, and $205 million for the years ended December 31, 2017, 2016, and 2015, respectively. |
See notes to consolidated financial statements.
63
FIRST DATA CORPORATION
CONSOLIDATED STATEMENTS OF COMPREHENSIVE INCOME (LOSS)
Year ended December 31, | ||||||||||||
(in millions) | 2017 | 2016 | 2015 | |||||||||
Net income (loss) | $ | 1,664 | $ | 660 | $ | (1,268 | ) | |||||
Other comprehensive income (loss), net of tax: | ||||||||||||
Foreign currency translation adjustment | 201 | (153 | ) | (290 | ) | |||||||
Pension liability adjustments | 72 | 38 | (13 | ) | ||||||||
Derivative instruments | 9 | 3 | — | |||||||||
Marketable securities | — | — | 3 | |||||||||
Total other comprehensive income (loss), net of tax | 282 | (112 | ) | (300 | ) | |||||||
Comprehensive income (loss) | 1,946 | 548 | (1,568 | ) | ||||||||
Less: Comprehensive income attributable to noncontrolling interests and redeemable noncontrolling interest | 211 | 235 | 203 | |||||||||
Comprehensive income (loss) attributable to First Data Corporation | $ | 1,735 | $ | 313 | $ | (1,771 | ) | |||||
See notes to consolidated financial statements.
64
FIRST DATA CORPORATION
CONSOLIDATED BALANCE SHEETS
As of December 31, | ||||||||
(in millions, except par value) | 2017 | 2016 | ||||||
ASSETS | ||||||||
Current assets: | ||||||||
Cash and cash equivalents | $ | 498 | $ | 385 | ||||
Accounts receivable, net of allowance for doubtful accounts of $45 and $74 | 2,176 | 1,877 | ||||||
Settlement assets | 20,363 | 14,795 | ||||||
Prepaid expenses and other current assets | 335 | 360 | ||||||
Total current assets | 23,372 | 17,417 | ||||||
Property and equipment, net of accumulated depreciation of $1,588 and $1,416 | 951 | 883 | ||||||
Goodwill | 17,710 | 16,696 | ||||||
Customer relationships, net of accumulated amortization of $5,940 and $5,660 | 2,184 | 1,739 | ||||||
Other intangibles, net of accumulated amortization of $2,665 and $2,365 | 1,935 | 1,800 | ||||||
Investment in affiliates | 1,054 | 988 | ||||||
Other long-term assets | 1,063 | 769 | ||||||
Total assets | $ | 48,269 | $ | 40,292 | ||||
LIABILITIES AND EQUITY | ||||||||
Current liabilities: | ||||||||
Accounts payable and accrued liabilities | $ | 1,659 | $ | 1,564 | ||||
Short-term and current portion of long-term borrowings | 1,271 | 358 | ||||||
Settlement obligations | 20,363 | 14,795 | ||||||
Total current liabilities | 23,293 | 16,717 | ||||||
Long-term borrowings | 17,927 | 18,131 | ||||||
Deferred tax liabilities | 77 | 409 | ||||||
Other long-term liabilities | 886 | 831 | ||||||
Total liabilities | 42,183 | 36,088 | ||||||
Commitments and contingencies (See note 14) | ||||||||
Redeemable noncontrolling interest | 72 | 73 | ||||||
First Data Corporation stockholders' equity: | ||||||||
Class A Common stock, $0.01 par value; 1,600 shares authorized as of December 31, 2017 and December 31, 2016, 492 shares and 372 shares issued as of December 31, 2017 and December 31, 2016, respectively; and 482 shares and 368 shares outstanding as of December 31, 2017 and December 31, 2016, respectively | 5 | 4 | ||||||
Class B Common stock, $0.01 par value; 523 and 625 shares authorized as of December 31, 2017 and December 31, 2016, respectively; 443 shares and 544 shares issued and outstanding as of December 31, 2017 and December 31, 2016 respectively | 4 | 5 | ||||||
Preferred stock, $0.01 par value; 100 shares authorized as of December 31, 2017 and December 31, 2016 ; no shares issued and outstanding as of December 31, 2017 and December 31, 2016 | — | — | ||||||
Class A Treasury stock, at cost, 11 shares and 5 shares as of December 31, 2017 and December 31, 2016, respectively | (149 | ) | (61 | ) | ||||
Additional paid-in capital | 13,495 | 13,210 | ||||||
Accumulated loss | (9,059 | ) | (10,524 | ) | ||||
Accumulated other comprehensive loss | (1,144 | ) | (1,414 | ) | ||||
Total First Data Corporation stockholders' equity | 3,152 | 1,220 | ||||||
Noncontrolling interests | 2,862 | 2,911 | ||||||
Total equity | 6,014 | 4,131 | ||||||
Total liabilities and equity | $ | 48,269 | $ | 40,292 | ||||
See notes to consolidated financial statements.
65
FIRST DATA CORPORATION
CONSOLIDATED STATEMENTS OF CASH FLOWS
Year ended December 31, | ||||||||||||
(in millions) | 2017 | 2016 | 2015 | |||||||||
CASH FLOWS FROM OPERATING ACTIVITIES | ||||||||||||
Net income (loss) | $ | 1,664 | $ | 660 | $ | (1,268 | ) | |||||
Adjustments to reconcile to net cash provided by operating activities: | ||||||||||||
Depreciation and amortization (including amortization netted against equity earnings in affiliates and revenues) | 1,073 | 1,061 | 1,133 | |||||||||
Deferred income taxes | (853 | ) | (38 | ) | (7 | ) | ||||||
Charges related to other operating expenses and other income | 127 | 44 | 24 | |||||||||
Loss on debt extinguishment | 80 | 70 | 1,068 | |||||||||
Stock-based compensation expense | 245 | 263 | 329 | |||||||||
Other non-cash and non-operating items, net | 41 | 35 | 48 | |||||||||
(Decrease) increase in cash, excluding the effects of acquisitions and dispositions, resulting from changes in: | ||||||||||||
Accounts receivable, current and long term | (196 | ) | (81 | ) | (184 | ) | ||||||
Other assets, current and long term | (36 | ) | 61 | (199 | ) | |||||||
Accounts payable and other liabilities, current and long term | (82 | ) | 35 | (162 | ) | |||||||
Income tax accounts | (16 | ) | 1 | 13 | ||||||||
Net cash provided by operating activities | 2,047 | 2,111 | 795 | |||||||||
CASH FLOWS FROM INVESTING ACTIVITIES | ||||||||||||
Additions to property and equipment | (271 | ) | (232 | ) | (282 | ) | ||||||
Payments to secure customer service contracts, including outlays for conversion, and capitalized systems development costs | (247 | ) | (245 | ) | (320 | ) | ||||||
Acquisitions, net of cash acquired | (1,607 | ) | (6 | ) | (89 | ) | ||||||
Proceeds from dispositions | 88 | 38 | 4 | |||||||||
Proceeds from the maturity of net investment hedges | 90 | — | — | |||||||||
Proceeds from sale of property and equipment | — | 38 | 17 | |||||||||
Other investing activities, net | (3 | ) | 20 | (15 | ) | |||||||
Net cash used in investing activities | (1,950 | ) | (387 | ) | (685 | ) | ||||||
CASH FLOWS FROM FINANCING ACTIVITIES | ||||||||||||
Short-term borrowings, net | 823 | 205 | (31 | ) | ||||||||
Proceeds from issuance of long-term debt | 4,968 | 3,533 | 10,258 | |||||||||
Payment of call premiums and debt issuance cost | (63 | ) | (53 | ) | (1,062 | ) | ||||||
Principal payments on long-term debt | (5,409 | ) | (5,073 | ) | (11,568 | ) | ||||||
Payment of taxes related to net settlement of equity awards | (94 | ) | (61 | ) | — | |||||||
Proceeds from issuance of common stock | 50 | 23 | 2,718 | |||||||||
Distributions and dividends paid to noncontrolling interests and redeemable noncontrolling interest | (260 | ) | (316 | ) | (312 | ) | ||||||
Other financing activities, net | (6 | ) | 8 | (19 | ) | |||||||
Net cash provided by (used in) financing activities | 9 | (1,734 | ) | (16 | ) | |||||||
Effect of exchange rate changes on cash and cash equivalents | 7 | (34 | ) | (23 | ) | |||||||
Change in cash and cash equivalents | 113 | (44 | ) | 71 | ||||||||
Cash and cash equivalents at beginning of period | 385 | 429 | 358 | |||||||||
Cash and cash equivalents at end of period | $ | 498 | $ | 385 | $ | 429 | ||||||
SUPPLEMENTAL CASH FLOW INFORMATION: | ||||||||||||
Income tax payments, net of refunds received | $ | 142 | $ | 118 | $ | 95 | ||||||
Interest paid | 916 | 1,032 | 1,815 | |||||||||
Distributions received from equity method investments | 266 | 304 | 289 | |||||||||
NON-CASH TRANSACTIONS: | ||||||||||||
Capital leases, net of trade-ins | $ | 112 | $ | 136 | $ | 83 | ||||||
Other financing arrangements | $ | 102 | $ | 79 | $ | — | ||||||
See notes to consolidated financial statements.
66
FIRST DATA CORPORATION
CONSOLIDATED STATEMENTS OF EQUITY
First Data Corporation Stockholders' | |||||||||||||||||||||||||||||||||||||||||
Common Stock | Treasury Stock | Accumulated Other Comprehensive Income (Loss) | |||||||||||||||||||||||||||||||||||||||
(in millions) | Class A | Class B | Class A | Additional Paid-In Capital | Accumulated Loss | Noncontrolling Interest | |||||||||||||||||||||||||||||||||||
Shares | Amount | Shares | Amount | Shares | Amount | Total | |||||||||||||||||||||||||||||||||||
Balance, December 31, 2014 (a) | — | $ | — | — | $ | — | — | $ | — | $ | 9,906 | $ | (9,459 | ) | $ | (1,017 | ) | $ | 3,100 | $ | 2,530 | ||||||||||||||||||||
Dividends and distributions paid to noncontrolling interests (b) | — | — | — | — | — | — | — | — | — | (277 | ) | (277 | ) | ||||||||||||||||||||||||||||
Net income (loss) (c) | — | — | — | — | — | — | — | (1,481 | ) | — | 179 | (1,302 | ) | ||||||||||||||||||||||||||||
Other comprehensive loss | — | — | — | — | — | — | — | — | (290 | ) | (10 | ) | (300 | ) | |||||||||||||||||||||||||||
Adjustments to redemption value of redeemable noncontrolling interest | — | — | — | — | — | — | (8 | ) | — | — | — | (8 | ) | ||||||||||||||||||||||||||||
Stock compensation expense and other | — | — | — | — | — | — | 316 | — | — | — | 316 | ||||||||||||||||||||||||||||||
Cash dividends paid by First Data Corporation to former Parent | — | — | — | — | — | — | — | (4 | ) | — | — | (4 | ) | ||||||||||||||||||||||||||||
Holding company merger (a) | — | — | 719 | 7 | — | — | (20 | ) | — | — | — | (13 | ) | ||||||||||||||||||||||||||||
Initial Public Offering | 180 | 2 | — | — | — | — | 2,716 | 2,718 | |||||||||||||||||||||||||||||||||
Balance, December 31, 2015 (a) | 180 | 2 | 719 | 7 | — | — | 12,910 | (10,944 | ) | (1,307 | ) | 2,992 | 3,660 | ||||||||||||||||||||||||||||
Dividends and distributions paid to noncontrolling interests (b) | — | — | — | — | — | — | — | — | — | (283 | ) | (283 | ) | ||||||||||||||||||||||||||||
Net income (loss) (c) | — | — | — | — | — | — | — | 420 | — | 207 | 627 | ||||||||||||||||||||||||||||||
Other comprehensive loss | — | — | — | — | — | — | — | — | (107 | ) | (5 | ) | (112 | ) | |||||||||||||||||||||||||||
Adjustments to redemption value of redeemable noncontrolling interest | — | — | — | — | — | — | 4 | — | — | — | 4 | ||||||||||||||||||||||||||||||
Stock compensation expense | — | — | — | — | 263 | — | — | — | 263 | ||||||||||||||||||||||||||||||||
Stock activity under stock compensation plans and other | 188 | 2 | (175 | ) | (2 | ) | 5 | (61 | ) | 33 | — | — | — | (28 | ) | ||||||||||||||||||||||||||
Balance, December 31, 2016 | 368 | 4 | 544 | 5 | 5 | (61 | ) | 13,210 | (10,524 | ) | (1,414 | ) | 2,911 | 4,131 | |||||||||||||||||||||||||||
Dividends and distributions paid to noncontrolling interests (b) | — | — | — | — | — | — | — | — | — | (229 | ) | (229 | ) | ||||||||||||||||||||||||||||
Net income (loss) (c) | — | — | — | — | — | — | — | 1,465 | — | 168 | 1,633 | ||||||||||||||||||||||||||||||
Other comprehensive income | — | — | — | — | — | — | — | — | 270 | 12 | 282 | ||||||||||||||||||||||||||||||
Adjustment to redemption value of redeemable noncontrolling interest | — | — | — | — | — | — | 1 | — | — | — | 1 | ||||||||||||||||||||||||||||||
Stock compensation expense | — | — | — | — | — | — | 245 | — | — | — | 245 | ||||||||||||||||||||||||||||||
Stock activity under stock compensation plans and other | 114 | 1 | (101 | ) | (1 | ) | 6 | (88 | ) | 39 | — | — | — | (49 | ) | ||||||||||||||||||||||||||
Balance, December 31, 2017 | 482 | $ | 5 | 443 | $ | 4 | 11 | $ | (149 | ) | $ | 13,495 | $ | (9,059 | ) | $ | (1,144 | ) | $ | 2,862 | $ | 6,014 | |||||||||||||||||||
(a) | 1,000 shares relates to common stock without a class that was eliminated upon the merger with First Data Holdings. |
(b) | The total distribution presented in the consolidated statements of equity for the years ended December 31, 2017, 2016, and 2015 excludes $31 million, $33 million, and $35 million, respectively, in distributions paid to redeemable non-controlling interest not included in equity. |
(c) | The total net income (loss) presented in the consolidated statements of equity for the years ended December 31, 2017, 2016, and 2015 is $31 million different, $33 million different, and $34 million different, respectively, than the amount presented on the consolidated statements of operations due to the net income attributable to the redeemable noncontrolling interest not included in equity. |
See notes to consolidated financial statements.
67
FIRST DATA CORPORATION
NOTES TO THE CONSOLIDATED FINANCIAL STATEMENTS
Note 1: Summary of Significant Accounting Policies
Business Description
First Data Corporation (FDC or the Company) is a global leader in commerce-enabling technology and solutions for merchants, financial institutions, and card issuers. The Company provides merchant transaction processing and acquiring; credit, retail, and debit card issuing and processing; prepaid services; and check verification, settlement and guarantee services; as well as solutions to help clients grow their businesses including the Company's Clover line of payment solutions and related applications.
On October 15, 2015, the Company filed its Prospectus with the Securities and Exchange Commission pursuant to Rule 424(b). The Company issued 176,076,869 shares of Class A common stock and began trading on the New York Stock Exchange under the symbol "FDC".
On October 13, 2015, First Data Holdings Inc. (FDH), the Company's direct parent company, merged with and into First Data Corporation, with First Data Corporation being the surviving entity (HoldCo Merger). All outstanding shares of FDH were converted into Class B common stock, which are entitled to ten votes per share. All outstanding common stock of First Data Corporation were eliminated upon the merger. The Company accounted for the HoldCo Merger as a transfer of assets between entities under common control and reflected the transaction in its financial statements on a prospective basis.
On October 13, 2015, the Company amended its certificate of incorporation which affected a reverse stock split of the Company’s authorized, issued and outstanding Class B common stock, on the basis of 1 new share of Class B common stock for each 3.16091 old shares of common stock.
Consolidation
The accompanying consolidated financial statements include the accounts of the Company and its controlled subsidiaries. All significant intercompany accounts and transactions have been eliminated. Investments in unconsolidated affiliated companies are accounted for under the equity method and are included in “Investment in affiliates” in the accompanying consolidated balance sheets. The Company generally utilizes the equity method of accounting when it has an ownership interest of between 20% and 50% in an entity, provided the Company is able to exercise significant influence over the investee’s operations.
The Company consolidates an entity’s financial statements when the Company has a controlling financial interest in the entity. Control is normally established when ownership interests exceed 50% in an entity; however, when the Company does not exercise control over a majority-owned entity as a result of other investors having rights over the management and operations of the entity, the Company accounts for the entity under the equity method.
Use of Estimates
The preparation of financial statements in conformity with accounting principles generally accepted in the United States requires management to make estimates and assumptions that affect the amounts reported in the consolidated financial statements and accompanying notes. Actual results could differ from those estimates.
Presentation
Depreciation and amortization, presented as a separate line item on the Company’s consolidated statements of operations, does not include amortization of initial payments for new contracts which is recorded as contra-revenue within “Transaction and processing service fees.” Also not included is amortization related to equity method investments which is netted within “Equity earnings in affiliates.”
68
FIRST DATA CORPORATION
NOTES TO THE CONSOLIDATED FINANCIAL STATEMENTS (Continued)
The following table presents the amounts associated with such amortization for the periods presented:
Year ended December 31, | ||||||||||||
(in millions) | 2017 | 2016 | 2015 | |||||||||
Amortization of initial payments for new contracts | $ | 56 | $ | 65 | $ | 51 | ||||||
Amortization related to equity method investments | 45 | 47 | 60 | |||||||||
Revenue Recognition
The majority of the Company’s revenues are comprised of: 1) volume-based fees, which typically constitute a percentage of dollar volume processed; 2) fees per transaction processed; 3) fees per account on file during the period; or 4) some combination thereof.
The Company’s arrangements with clients often consist of multiple services and products (multiple-element arrangements). In accounting for multiple-element arrangements, the Company assesses the elements of the contract and whether each element has standalone value and allocates revenue to the various elements based on their estimated selling price as a component of total consideration for the arrangement. The selling price is based on current selling prices offered by the Company or another party for current products or management's best estimate of a selling price.
Revenue is comprised of fees charged to the client, net of interchange fees and assessments charged by the credit card associations, and is recognized at the time the client accepts a point of sale transaction. The fees charged to the client are a percentage of the credit card and debit card transaction’s dollar value, a fixed amount, or a combination of the two. Personal identification number based debit (PIN-debit) and PINless-debit network fees are recognized in “Reimbursable debit network fees, postage, and other” revenues and expenses in the consolidated statements of operations.
Interchange fees and assessments charged by credit card associations to the Company’s consolidated subsidiaries and network fees related to PIN-debit and PINless-debit transactions charged by debit networks were as follows for the periods presented:
Year ended December 31, | ||||||||||||
(in millions) | 2017 | 2016 | 2015 | |||||||||
Interchange fees and assessments | $ | 26,069 | $ | 23,810 | $ | 21,711 | ||||||
Debit network fees | 3,227 | 3,121 | 2,991 | |||||||||
The Company charges processing fees to its alliances. In situations where an alliance is accounted for under the equity method, the Company’s consolidated revenues include the processing fees charged to the alliance, as presented in the consolidated statements of operations within "Transaction and processing service fees".
Revenue from check verification, settlement, and guarantee services is recognized at the time of sale less the fair value of the guarantee. The fair value of the guarantee is deferred and recognized at the later of the Company being called upon to honor the guarantee or the expiration of the guarantee. Check verification fees generally are a fixed amount per transaction while check guarantee fees generally are a percentage of the check amount.
The purchase and sale of merchant contract portfolios is an ordinary element of the Company’s businesses, and therefore, the gains from selling these revenue-generating assets are included within “Product sales and other” in the consolidated statements of operations.
Fees based on cardholder accounts on file are recognized as the requisite services or period occurs. Fees for PIN-debit transactions where the Company is the debit card processor for the financial institution are recognized on a per transaction basis. Revenues for output services are derived primarily on a per piece basis and consist of fees for the production, materials, and postage related to mailing finished products and recognized as the services are provided.
The sale and leasing of POS devices (terminals) are reported in “Product sales and other” in the consolidated statements of operations. Revenue for terminals sold or sold under a sales-type lease transaction is recognized when the following four criteria are met: evidence of an agreement exists, delivery has occurred, the selling price or minimum lease payments are fixed or determinable, and collection of the selling price or minimum lease payments is reasonably assured. Revenue for operating leases is recognized on a straight-line basis over the lease term.
69
FIRST DATA CORPORATION
NOTES TO THE CONSOLIDATED FINANCIAL STATEMENTS (Continued)
Services not specifically described above are generally transaction based fees that are recognized at the time the transactions are processed or programming services that are either recorded as work is performed or are recognized over the life of the contract depending on the underlying business relationship.
Deferred Revenue
The Company records deferred revenue when it receives payments or invoices in advance of the delivery of products or the performance of services. The deferred revenue is recognized when underlying performance obligations are achieved. As of December 31, 2017 and 2016, current deferred revenue included within "Accounts payable and accrued liabilities" in the Company's consolidated balance sheets was $175 million and $149 million, respectively. As of December 31, 2017 and 2016, noncurrent deferred revenue included within "Other long-term liabilities" in the Company's consolidated balance sheets was $177 million and $184 million, respectively.
In January 2017, the Company determined that standalone value had been achieved for its Clover terminal devices, principally because a secondary market had been established. The Company accounted for the change on a prospective basis. Beginning January 1, 2017, the Company recognized revenue on sales of Clover terminal devices upon delivery, while Clover terminal devices sold prior to January 1, 2017 continued to be deferred over the term of the respective processing agreement. As of December 31, 2017, $36 million of the Company's deferred revenue represented sales of Clover terminal devices which did not have standalone value prior to the change in accounting.
Stock-Based Compensation
Stock-based compensation to employees is measured at the grant date fair values of the respective stock options and restricted stock awards. An estimate of forfeitures is applied when calculating compensation expense. To calculate the estimated forfeiture rate, the Company performed an analysis of all forfeitures over a five year period and continues to evaluate the actual forfeit rate compared to its estimate. The estimated forfeiture rate will be adjusted as actual forfeiture vary from the estimate, resulting in the recognition of compensation cost only for awards that vest. Any effect of a change in estimated forfeitures will be recognized through a cumulative catch-up adjustment. The Company recognizes compensation cost on service based awards with graded vesting on a straight-line basis over the requisite service period for the entire award. The Company recognizes compensation cost on performance-based restricted stock grants on a grant basis graded schedule. Refer to note 4 "Stock Compensation Plans" of these consolidated financial statements for details regarding the Company’s stock-based compensation plan.
Treasury Stock
In connection with the vesting of restricted stock awards or exercise of stock options, shares of Class A and Class B common stock are delivered to the Company by employees to satisfy tax withholding obligations. The Company accounts for treasury stock activities under the cost method whereby the cost of the acquired stock is recorded as treasury stock. Because Class B common stock converts automatically to Class A common stock upon any transfer, whether or not for value, except for certain transactions described in the Company's amended and restated certificate of incorporation, all shares of treasury stock reside as Class A.
Foreign Currency Translation
The U.S. dollar is the functional currency of the Company’s U.S.-based businesses and certain foreign-based businesses. Significant operations with a local currency as their functional currency include operations in the United Kingdom, Australia, Germany, Ireland, Greece, Brazil and Argentina. Foreign currency-denominated assets and liabilities for these units and other less significant operations are translated into U.S. dollars based on exchange rates prevailing at the end of the period, and revenues and expenses are translated at average exchange rates during each monthly period. The effects of foreign exchange gains and losses arising from the translation of assets and liabilities of those entities where the functional currency is not the U.S. dollar are included as a component of Other Comprehensive Income (Loss) (OCI). Intercompany loans are generally not considered invested on a long-term basis and such foreign currency gains and losses are included in "Other income" on the consolidated statements of operations. Transaction gains and losses related to operating assets and liabilities are included in “Cost of services” and “Selling, general, and administrative” in the consolidated statements of operations and were immaterial for all periods presented. Non-operating transaction gains and losses derived from non-operating assets and liabilities are included in “Other income” on the consolidated statements of operations and are separately disclosed in note 16 "Supplemental Financial Information" of these consolidated financial statements.
70
FIRST DATA CORPORATION
NOTES TO THE CONSOLIDATED FINANCIAL STATEMENTS (Continued)
Derivative Financial Instruments
The Company is exposed to various financial and market risks, including those related to changes in interest rates and foreign currency exchange rates, that exist as part of its ongoing business operations. The Company uses derivative instruments (i) to mitigate cash flow risks with respect to changes in interest rates (forecasted interest payments on variable rate debt), (ii) to maintain a desired ratio of fixed rate and floating rate debt, and (iii) to protect the net investment in certain foreign subsidiaries and/or affiliates with respect to changes in foreign currency exchange rates. The Company’s objective is to engage in risk management strategies that provide adequate downside protection.
Derivative instruments are entered into for periods consistent with related underlying exposures. The Company applies strict policies to manage each of these risks, including prohibition against derivatives trading, derivatives market-making or any other speculative activities.
The Company formally documents all relationships between hedging instruments and the underlying hedged items, as well as its risk management objective and strategy for undertaking various hedge transactions. This process includes linking all derivatives that have been designated as cash flow hedges to forecasted transactions and net investment hedges to the underlying investment in a foreign subsidiary or affiliate. For designated hedges, the Company formally assesses, both at inception of the hedge and on an ongoing basis, whether the hedge is highly effective in offsetting changes in cash flows or foreign currency exposure of the underlying hedged items. The Company also performs an assessment of the probability of the forecasted transactions on a periodic basis. If it is determined that a derivative ceases to be highly effective during the term of the hedge or if the forecasted transaction is no longer probable, the Company discontinues hedge accounting prospectively for such derivative.
The Company monitors the financial stability of its derivative counterparties and all counterparties are investment grade. The credit risk inherent in these agreements represents the possibility that a loss may occur from the nonperformance of a counterparty to the agreements. The Company performs a review at inception of the hedge, as circumstances warrant, and at least on a quarterly basis, of the credit risk of these counterparties. The Company also monitors the concentration of its contracts with individual counterparties. The Company’s exposures are in liquid currencies (primarily in U.S. dollars, euros, Australian dollars, British pounds, and Canadian dollars), so there is minimal risk that appropriate derivatives to maintain the hedging program would not be available in the future.
The Company recognizes all derivative financial instruments in the consolidated balance sheets as assets or liabilities at fair value. Such amounts are recorded in “Other current assets”, “Other long-term assets”, “Accounts payable and accrued liabilities” or “Other long-term liabilities” in the consolidated balance sheets. The Company’s policy is to present all derivative balances on a gross basis, without regard to counterparty master netting agreements or similar arrangements. Changes in fair value of derivative instruments are recognized immediately in "Other income" on the consolidated statements of operations unless the derivative is designated and qualifies as a hedge of future cash flows or a hedge of a net investment in a foreign operation. For derivatives that qualify as hedges of future cash flows, the effective portion of changes in fair value is recorded temporarily in equity as a component of OCI and then recognized in "Other income" in the consolidated statements of operations in the same period or periods during which the hedged item affects earnings. For derivatives that qualify as a hedge of a net investment in a foreign operation, the gain or loss is reported in OCI as part of the cumulative translation adjustment to the extent the hedge is effective. Any ineffective portions of cash flow hedges and net investment hedges are recognized in “Other income” in the consolidated statements of operations during the period of change. Additional discussion of derivative instruments is provided in note 13 "Derivative Financial Instruments" of these consolidated financial statements.
Noncontrolling and Redeemable Noncontrolling Interests
Noncontrolling interests represent the minority shareholders’ share of the net income or loss and equity in consolidated subsidiaries. The Company’s noncontrolling interests are presented pretax in the consolidated statements of operations as “Net income attributable to noncontrolling interests and redeemable noncontrolling interest” because the majority of the Company’s non wholly owned consolidated subsidiaries are flow through entities for tax purposes. Noncontrolling interests are presented as a component of equity in the consolidated balance sheets and reflect the original investments by these noncontrolling shareholders in the consolidated subsidiaries, along with their proportionate share of the earnings or losses of the subsidiaries, net of dividends or distributions. Noncontrolling interests that are redeemable at the option of the holder are presented outside of equity and are carried at their estimated redemption value. Refer to note 5 "Stockholders' Equity and Redeemable Noncontrolling Interest" of these consolidated financial statements for more information. A noncontrolling interest is recorded on the date of acquisition based on the total fair value of the acquired entity and the noncontrolling interest’s share of that value.
71
FIRST DATA CORPORATION
NOTES TO THE CONSOLIDATED FINANCIAL STATEMENTS (Continued)
Reserve for Merchant Credit Losses and Check Guarantees
With respect to the merchant acquiring business, the Company’s merchant customers (or those of its unconsolidated alliances) have the legal obligation to refund any charges properly reversed by the cardholder. In the event, however, that the Company is not able to collect such amounts from the merchants, the Company may be liable for any such reversed charges. The Company’s risk in this area primarily relates to situations where the cardholder has purchased goods or services to be delivered in the future.
The Company’s obligation to perform is minimal in relation to the total dollar volume processed. The Company requires cash deposits, guarantees, letters of credit or other types of collateral from certain merchants to minimize this obligation. Collateral held by the Company is classified within “Settlement assets” and the obligation to repay the collateral if it is not needed is classified within “Settlement obligations” on the Company’s consolidated balance sheets. The Company also utilizes a number of systems and procedures to manage merchant risk. Despite these efforts, the Company historically has experienced some level of losses due to merchant defaults. The amount of deposits and letters of credit held by the Company was $632 million and $628 million as of December 31, 2017 and 2016, respectively.
The Company’s contingent obligation relates to imprecision in its estimates of required collateral. A provision for this obligation is recorded based primarily on historical experience of credit losses and other relevant factors such as economic downturns or increases in merchant fraud. Merchant credit losses are included in “Cost of services” in the Company’s consolidated statements of operations. The amount of the reserves attributable to entities consolidated by the Company was $29 million and $23 million as of December 31, 2017 and 2016, respectively.
The majority of the TeleCheck business involves the guarantee of checks received by merchants. If the check is returned, TeleCheck is required to purchase the check from the merchant at its face value and pursue collection from the check writer. A provision for estimated check returns, net of anticipated recoveries, is recorded at the transaction inception based on recent history. The following table presents the estimate of losses on returned check and the fair value of check guarantees:
As of December 31, | ||||||||
(in millions) | 2017 | 2016 | ||||||
Estimate of losses on returned checks | $ | 4 | $ | 5 | ||||
Fair value of checks guaranteed | 14 | 17 | ||||||
The estimate of losses on returned checks is included in “Accounts payable and accrued liabilities” and the fair value of checks guaranteed is included in “Accounts receivable, net” in the consolidated balance sheets. The maximum potential future payments under the guarantees were approximately $456 million as of December 31, 2017 which represented an estimate of the total uncleared checks at that time.
Income Taxes
The Company and its domestic subsidiaries file a consolidated U.S. income tax return. The Company’s foreign operations file income tax returns in their local jurisdictions. Income taxes reflect the net tax effects of temporary differences between the financial reporting carrying amounts of assets and liabilities and the corresponding income tax amounts. The Company has deferred tax assets and liabilities and maintains valuation allowances where it is more likely than not that all or a portion of deferred tax assets will not be realized. To the extent the Company determines that it will not realize the benefit of some or all of its deferred tax assets, these deferred tax assets will be adjusted through the Company’s provision for income taxes in the period in which this determination is made.
The Company recognizes the tax benefits from uncertain tax positions only when it is more likely than not, based on the technical merits of the position, that the tax position will be sustained upon examination, including the resolution of any related appeals or litigation. The tax benefits recognized in the consolidated financial statements from such a position are measured as the largest benefit that has a greater than fifty percent likelihood of being realized upon ultimate resolution.
Cash and Cash Equivalents
Investments (other than those included in settlement assets) with original maturities of three months or less (that are readily convertible to cash) are considered to be cash equivalents and are stated at cost, which approximates market value. Cash and cash equivalents that were restricted from use due to regulatory requirements are included in “Other long-term assets” in the consolidated balance sheets and was $27 million and $30 million as of December 31, 2017 and 2016, respectively.
72
FIRST DATA CORPORATION
NOTES TO THE CONSOLIDATED FINANCIAL STATEMENTS (Continued)
Accounts Receivable and Leasing Receivables
Accounts receivable balances are stated net of allowance for doubtful accounts. The Company records allowances for doubtful accounts when it is probable that the accounts receivable balance will not be collected. Long-term accounts receivable balances are included in “Other long-term assets” in the consolidated balance sheets.
The Company has receivables associated with its POS terminal leasing businesses. Leasing receivables are included in “Accounts receivable” and “Other long-term assets” in the consolidated balance sheets. The Company recognizes interest income on its leasing receivables using the effective interest method. Interest income from leasing receivables is included in “Product sales and other” in the consolidated statements of operations. For direct financing leases, the interest rate used incorporates initial direct costs included in the net investment in the lease. For sales type leases, initial direct costs are expensed as incurred.
Property and Equipment
Property and equipment are stated at cost less accumulated depreciation. Depreciation expense is computed using the straight-line method over the lesser of the estimated useful life of the related assets (generally three years to 10 years for equipment, furniture, and leasehold improvements, and 30 years for buildings) or the lease term. Maintenance and repairs which do not extend the useful life of the respective assets are expensed as incurred.
The following table presents depreciation expense related to property and equipment, including equipment under capital lease:
Year ended December 31, | ||||
(in millions) | Amount | |||
2017 | $ | 321 | ||
2016 | 300 | |||
2015 | 290 | |||
Goodwill and Other Intangibles
Goodwill represents the excess of purchase price over tangible and intangible assets acquired less liabilities assumed arising from business combinations. Goodwill is generally allocated to reporting units based upon relative fair value (taking into consideration other factors such as synergies) when an acquired business is integrated into multiple reporting units. The Company’s reporting units are at the operating segment level or one level below the operating segment level for which discrete financial information is prepared and regularly reviewed by management. When a business within a reporting unit is disposed of, goodwill is allocated to the disposed business using the relative fair value method. Relative fair value is estimated using a discounted cash flow analysis.
The Company tests goodwill annually for impairment, as well as upon an indicator of impairment, at the reporting unit level. The Company performed its annual goodwill impairment test in the fourth quarters of 2017 and 2016. As of October 1, 2017, the most recent impairment analysis date, the fair value of each reporting unit exceeded its carrying value. The Company did not record any goodwill impairment charges in 2017, 2016, and 2015.
Customer relationships represent the estimated value of the Company’s relationships with customers, primarily merchants and financial institutions, to which it provides services. Customer relationships are amortized based on the pattern of undiscounted cash flows for the period as a percentage of total projected undiscounted cash flows. The Company selected this amortization method for these customer relationships based on a conclusion that the projected undiscounted cash flows could be reliably determined.
The Company capitalizes initial payments for new contracts, contract renewals, and conversion costs associated with customer processing relationships to the extent recoverable through cash flows from future operations, contractual minimums, and/or penalties in the case of early termination. The Company’s accounting policy is to limit the amount of capitalized costs for a given contract to the lesser of the estimated ongoing future cash flows from the contract or the termination fees the Company would receive in the event of early termination of the contract by the customer. The initial payments for new contracts and contract renewals are amortized over the term of the contract as a reduction of the associated revenue (transaction and processing service fees). Conversion costs are also amortized over the term of the contract but are recorded as an expense in “Depreciation and amortization” in the consolidated statements of operations.
The Company develops software that is used in providing processing services to customers. To a lesser extent, the Company also develops software to be sold or licensed to customers. Costs incurred during the preliminary project stage are expensed as incurred. Capitalization of costs begins when the preliminary project stage is completed and management, with the relevant authority,
73
FIRST DATA CORPORATION
NOTES TO THE CONSOLIDATED FINANCIAL STATEMENTS (Continued)
authorizes and commits to funding the project and it is probable that the project will be completed and the software will be used to perform the function intended. Capitalization of costs ceases when the software is substantially complete and ready for its intended use. Software development costs are amortized using the straight-line method over the estimated useful life of the software, which is generally 5 years. Software acquired in connection with business combinations is amortized using the straight-line method over the estimated useful life of the software which generally ranges from three years to 10 years.
In addition to capitalized contract and software development costs, other intangibles include copyrights, patents, purchased software, and trademarks acquired in business combinations. Other intangibles, except for the First Data trade name discussed in note 3 “Goodwill and Other Intangibles” of these consolidated financial statements, are amortized on a straight-line basis over the length of the contract or benefit period, which generally ranges from three years to 25 years.
Assets and Liabilities Measured at Fair Value on a Recurring Basis
Fair value is defined by accounting guidance as the price that would be received to sell an asset or paid to transfer a liability in an orderly transaction between market participants at the measurement date. The Company uses the hierarchy prescribed in the accounting guidance for fair value measurements, based upon the available inputs to the valuation and the degree to which they are observable or not observable in the market. The Company maximizes the use of relevant observable inputs and minimizes the use of unobservable inputs. The three levels in the hierarchy are as follows:
• | Level 1 Inputs—Quoted prices (unadjusted) for identical assets or liabilities in active markets that are accessible as of the measurement date. |
• | Level 2 Inputs—Inputs other than quoted prices within Level 1 that are observable either directly or indirectly, including but not limited to quoted prices in markets that are not active, quoted prices in active markets for similar assets or liabilities, and observable inputs other than quoted prices such as interest rates or yield curves. |
• | Level 3 Inputs—Unobservable inputs reflecting the Company’s own assumptions about the assumptions that market participants would use in pricing the asset or liability, including assumptions about risk. |
Assets and Liabilities Measured at Fair Value on a Non-Recurring Basis
During the years ended December 31, 2017 and 2016, the Company did not record any adjustments over $5 million to the carrying value of existing assets based on non-recurring fair value measurements, other than as discussed in note 10 "Other Operating Expenses."
Net Income (Loss) Per Share
Basic net income (loss) per share is calculated by dividing Net income (loss) attributable to First Data Corporation by the weighted-average shares outstanding during the period, without consideration for any potential dilutive shares. Diluted net income (loss) per share is computed by dividing Net income (loss) attributable to First Data Corporation by the weighted-average number of shares of common stock outstanding during the period increased to include the number of additional shares of common stock that would have been outstanding if the potentially dilutive securities had been issued. Potentially dilutive securities include outstanding stock options, unvested restricted stock and unvested restricted stock awards. The dilutive effect of potentially dilutive securities is reflected in diluted net income per share by application of the treasury stock method. Under the treasury stock method, an increase in the fair market value of the Company’s common stock can result in a greater dilutive effect from potentially dilutive securities. For any period where Net income (loss) attributable to First Data Corporation is presented, shares used in the diluted net income per share calculation represent basic shares because using diluted shares would be anti-dilutive.
Reclassifications
Certain amounts for prior years have been reclassified to conform with the current year financial statement presentation. During 2017, the Company revised its financial statements to reflect immaterial adjustments to its accounting for deferred income taxes. In the periods prior to 2015, the Company had incorrectly recorded deferred income tax assets on foreign currency translation adjustments included in other comprehensive income (loss) which the Company provided a full valuation. The adjustment resulted in a decrease of $88 million to the previously reported balances of "Accumulated Loss" and an offsetting increase to "Accumulated Other Comprehensive Income (Loss)" at December 31, 2014, and a reduction to deferred tax assets and related valuation allowance of $124 million at December 31, 2016. Additionally, the consolidated balance sheet as of December 31, 2016 reflects a $102 million reclassification related to settlement activities to conform certain domestic and international businesses to the Company's global policies, which increased "Cash and cash equivalents" and decreased "Accounts receivable". The consolidated statements
74
FIRST DATA CORPORATION
NOTES TO THE CONSOLIDATED FINANCIAL STATEMENTS (Continued)
of cash flows for the year ended December 31, 2016 reflects the reclassification of $102 million within “Net cash provided by operating activities”.
New Accounting Guidance
Revenue Recognition
In May 2014, the Financial Accounting Standards Board (FASB) issued guidance that requires companies to recognize revenue to depict the transfer of goods or services to customers in amounts that reflect the consideration to which the Company expects to be entitled in an exchange for those goods or services. It also requires enhanced disclosures about revenue, provides guidance for transactions that were not previously addressed comprehensively, and improves guidance for multiple-element arrangements. The FASB has subsequently issued several amendments to the standard, including clarification on accounting for licenses, identifying performance obligations, and principal versus agent consideration (reporting revenue gross vs. net).
Since the issuance of ASC 606 and ASC 340-40 (collectively, the New Revenue Standard) in May 2014, the Company has been preparing for the adoption of the New Revenue Standard. The Company has been monitoring the activity of the FASB and the Transition Resource Group as it relates to specific industry interpretive guidance and further overall interpretations and clarifications. The Company has completed two phases of its three-phase plan to-adopt and implement of the New Revenue Standard. Phase III has begun and includes activities such as running parallel reporting for impacted areas under the New and Current Revenue Standard (ASC 605), recording the accounting adjustments that were identified in Phase II, and revising the Company’s financial statement disclosures. This final phase will be completed during Q1 2018.
The Company adopted the New Revenue Standard using a modified retrospective basis on January 1, 2018. The Company expects the adoption to result in a cumulative adjustment to retained earnings of less than $100 million to apply the New Revenue Standard. This impact was principally driven by certain software arrangements being recognized sooner; changes related to costs to obtain customers, including the related amortization period; and the release of deferred revenue associated with Clover terminals that had previously lacked standalone value. Under the modified retrospective basis, the Company will not restate the prior consolidated financial statements presented for these effects.
The Company currently expects the most significant ongoing impact of adopting the New Revenue Standard in 2018 to be driven by changes in principal versus agent considerations, with the majority of the change overall in total revenues attributable to FDC reflecting our PIN-debit and PINless debit transactions on a net basis prospectively, as opposed to our gross presentation of $3.2 billion in 2017. The Company does not expect the adoption of the New Revenue Standard to have a material impact on net income. The Company will include additional disclosures of the amount by which each financial statement line item is affected during 2018, as compared to the guidance that was in effect before the change, and an explanation of the reasons for significant changes.
Leases
In February 2016, the FASB issued guidance which requires lessees to put most leases on their balance sheets. The guidance also modifies the classification criteria and the accounting for sales-type and direct financing leases for lessors and provides new presentation and disclosure requirements for both lessees and lessors. The standard is effective for financial statements issued for fiscal years beginning after December 15, 2018, and interim periods within those fiscal years. Early adoption is permitted in any interim or annual period subsequent to adoption of the preceding revenue recognition guidance. The Company is currently evaluating the impact of adoption of the new guidance on its consolidated financial statements.
Stock-based Compensation
In March 2016, the FASB issued guidance that will change some aspects of the accounting for stock-based payments to employees. Under the new guidance, companies will be required to record all excess tax benefits and tax deficiencies as income tax expense or benefit in the income statement and to present excess tax benefits as an operating activity on the statement of cash flows. The guidance may also change how companies account for forfeitures and an employee’s use of shares to satisfy the employer’s statutory income tax withholding obligation. The Company adopted the various amendments in its consolidated financial statements for the quarterly period ending March 31, 2017 with an effective date on January 1, 2017. The Company has elected to continue to estimate forfeitures expected to occur to determine the amount of compensation cost to be recognized in each period. The adoption of these amendments did not have a material effect on its consolidated financial statements as the Company still had income tax valuation allowances within the U.S. The Company released its U.S. valuation allowances in the fourth quarter of 2017 and as a result the Company could experience volatility in its income tax expense.
In May 2017, the FASB issued guidance that will clarify when changes to terms or conditions of a stock-based payment award must be accounted for as a modification. Under the new guidance, companies will only apply modification accounting guidance
75
FIRST DATA CORPORATION
NOTES TO THE CONSOLIDATED FINANCIAL STATEMENTS (Continued)
if the value, vesting conditions or classification of an award changes. This new guidance will be effective for fiscal years beginning after December 15, 2017 for all entities, including interim periods within those fiscal years with early adoption permitted. The guidance is adopted prospectively to awards modified on or after the adoption date. The Company will adopt the new guidance on January 1, 2018. The impact of adoption on the Company's consolidated financial statements is dependent on future changes to share-based compensation awards.
Credit Losses
In June 2016, the FASB issued guidance that will change the accounting for credit impairment. Under the new guidance, companies are required to measure all expected credit losses for financial instruments held at the reporting date based on historical experience, current conditions and reasonable supportable forecasts. This replaces the existing incurred loss model and is applicable to the measurement of credit losses on financial assets measured at amortized cost and applies to some off-balance sheet credit exposures. This new guidance will be effective for public companies for fiscal years beginning after December 15, 2019, including interim periods within those fiscal years. Early adoption is permitted for fiscal years beginning after December 15, 2018. The Company is currently evaluating the impact of the new guidance on its consolidated financial statements.
Statement of Cash Flows
In November 2016, the FASB issued guidance that will change the presentation of restricted cash and restricted cash equivalents on the statement of cash flows. Under the new guidance, companies will be required to include restricted cash and restricted cash equivalents with the cash and cash equivalents line item when reconciling beginning-of-period and end-of-period total amounts shown on the statement of cash flows. Given this change, transfers between cash, cash equivalents, and restricted cash and cash equivalents will not be reported as cash flow activities on the statement of cash flows. In addition, the guidance requires entities to disclose information about the nature of restrictions on its cash and cash equivalents, including restricted cash and cash equivalents. This new guidance will be effective for public companies for fiscal years beginning after December 15, 2017, including interim periods within those fiscal years with early adoption permitted, including adoption in an interim period. The guidance should be applied using a retrospective transition method to each period presented. The Company adopted the new guidance on January 1, 2018. The Company does not expect the adoption of this guidance to have a material impact on its consolidated financial statements.
Goodwill
In January 2017, the FASB issued guidance simplifying the test for goodwill impairment. This standard eliminates Step 2 from the goodwill impairment test, instead requiring an entity to recognize a goodwill impairment charge for the amount by which the goodwill carrying amount exceeds the reporting unit’s fair value. This guidance is effective for interim and annual goodwill impairment tests in fiscal years beginning after December 15, 2019, and early adoption is permitted. This guidance must be applied on a prospective basis. The Company adopted the new guidance during the fourth quarter of 2017 with no impact to its consolidated financial statements.
Pension Costs
In March 2017, the FASB issued guidance that requires employers that sponsor defined benefit plans for pensions and/or other post-retirement benefits to present the service cost component of net periodic benefit cost in the same income statement line item as other employee compensation costs arising from services rendered during the period. Only the service cost component will be eligible for capitalization in assets. Employers will present the other components of the net periodic benefit cost separately from the line item that includes the service cost and outside of any subtotal of operating income, if one is presented. These components will not be eligible for capitalization in assets. This new guidance will be effective for public companies for fiscal years beginning after December 15, 2017, including interim periods within those fiscal years with early adoption permitted, including adoption in an interim period. The Company plans to adopt the guidance on January 1, 2018. Upon adoption, the guidance requires changes to the presentation of the income statement to be applied retrospectively. Had the Company adopted on January 1, 2017, the impact on our financial statements at December 31, 2017 would have increased operating expense and decreased non-operating expense by less than $10 million.
Derivatives and Hedging
In August 2017, the FASB issued guidance to simplify the current application of hedge accounting. This standard is intended to better align a company’s risk management strategies and financial reporting for hedging relationships through changes to both designation and measurement for qualifying hedging relationships and more accurately presenting the economic effects in the financial statements. In addition, the new guidance establishes flexibility in the requirements to qualify and maintain hedge
76
FIRST DATA CORPORATION
NOTES TO THE CONSOLIDATED FINANCIAL STATEMENTS (Continued)
accounting. This guidance is effective for fiscal years beginning after December 15, 2018 and for interim periods therein, with early adoption permitted. The Company will adopt the new guidance on January 1, 2018. The Company does not expect the adoption of this guidance to have a material impact on the Company’s consolidated financial statements.
Note 2: Borrowings
As of December 31, | ||||||||
(in millions) | 2017 | 2016 | ||||||
Short-term borrowings: | ||||||||
Foreign lines of credit and other arrangements | $ | 205 | $ | 84 | ||||
Senior Secured Revolving Credit Facility June 2, 2020 at LIBOR plus 3.50% or a base rate plus 2.50% | 272 | — | ||||||
Receivable securitized loan at LIBOR plus 1.5% or a base rate equal to the highest of (i) the applicable lender's prime rate, or (ii) the federal funds rate plus 0.50% | 600 | 160 | ||||||
Unamortized deferred financing costs(a) | (3 | ) | (2 | ) | ||||
Total short-term borrowings | 1,074 | 242 | ||||||
Current portion of long-term borrowings: | ||||||||
Senior secured term loan facility due June 2020 at LIBOR plus 1.75% or a base rate plus 0.75% | 78 | — | ||||||
Other arrangements and capital lease obligations | 119 | 116 | ||||||
Total current portion of long-term borrowings | 197 | 116 | ||||||
Total short-term and current portion of long-term borrowings | 1,271 | 358 | ||||||
Long-term borrowings: | ||||||||
Senior secured term loan facility due April 2024 at LIBOR plus 2.25% or a base rate plus 1.25% | 3,892 | — | ||||||
Senior secured term loan facility due July 2022 at LIBOR plus 2.25% or a base rate plus 1.25% | 3,758 | — | ||||||
Senior secured term loan facility due June 2020 at LIBOR plus 1.75% or a base rate plus 0.75% | 1,404 | — | ||||||
Senior secured term loan facility due March 2021 at LIBOR and euro LIBOR plus 3.0% or, solely with respect to U.S. dollar-denominated term loans, a base rate plus 2.0% | — | 4,379 | ||||||
Senior secured term loan facility due July 2022 at LIBOR plus 3.0% or a base rate plus 2.0%, or solely with respect to euro-denominated term loans, euro LIBOR plus 3.25% | — | 3,583 | ||||||
6.75% Senior secured first lien notes due 2020 | — | 1,398 | ||||||
5.375% Senior secured first lien notes due 2023 | 1,210 | 1,210 | ||||||
5.0% Senior secured first lien notes due 2024 | 1,900 | 1,900 | ||||||
5.75% Senior secured second lien notes due 2024 | 2,200 | 2,200 | ||||||
7.0% Senior unsecured notes due 2023 | 3,400 | 3,400 | ||||||
Unamortized discount and unamortized deferred financing costs (a) | (123 | ) | (154 | ) | ||||
Other arrangements and capital lease obligations | 286 | 215 | ||||||
Total long-term borrowings (b) | 17,927 | 18,131 | ||||||
Total borrowings (c) | $ | 19,198 | $ | 18,489 | ||||
(a) | Unamortized deferred financing costs and certain lenders' fees associated with debt transactions were capitalized as discounts are amortized on a straight-line basis, which approximates the effective interest method, over the remaining term of the respective debt. |
(b) | As of December 31, 2017 and 2016, the fair value of the Company's long-term borrowings was $18.2 billion and $18.8 billion, respectively. The estimated fair value of the Company's long-term borrowings was primarily based on market trading prices and is considered to be a Level 2 measurement. |
(c) | The effective interest rate is not substantially different than the coupon rate on any of the Company's debt tranches. |
77
FIRST DATA CORPORATION
NOTES TO THE CONSOLIDATED FINANCIAL STATEMENTS (Continued)
Foreign Lines of Credit and Other Arrangements
As of December 31, 2017 and 2016, the Company had $546 million and $489 million, respectively, available under short-term lines of credit and other arrangements with foreign banks and alliance partners primarily to fund settlement activity. As of December 31, 2017 and 2016, this includes a $355 million committed line of credit for one of the Company's consolidated alliances. The remainder of these arrangements are primarily associated with international operations and are in various functional currencies, the most significant of which are the Australian dollar, the Polish zloty, and the euro. Of the amounts outstanding as of December 31, 2017 and 2016, $15 million and $10 million, respectively, were uncommitted. The weighted-average interest rate associated with foreign lines of credit was 2.9% and 2.6% for the years ended December 31, 2017 and 2016, respectively.
Senior Secured Revolving Credit Facility
The Company has a $1.25 billion senior secured revolving credit facility maturing on June 2, 2020. Up to $250 million of the senior secured revolving credit facility is available for letters of credit, of which $29 million and $41 million of letters of credit were issued under the facilities as of December 31, 2017 and 2016, respectively. As of December 31, 2017, $949 million remained available. Interest on the senior secured revolving credit facility is payable at a rate equal to, at Company’s option, either (a) LIBOR for deposits in the applicable currency plus 3.50% or (b) solely with respect to revolving loans denominated in U.S. dollars, a base rate plus 2.50%. The weighted-average interest rate on these facilities was 5.74% and 4.60% for the years ended December 31, 2017 and 2016, respectively. The commitment fee rate for the unused portion of the facility is 0.50% per year, though it may be reduced by the Company’s leverage ratio.
Receivable Securitization Agreement
The Company has a consolidated wholly-owned subsidiary, First Data Receivables, LLC (FDR). FDR and FDC entered into an agreement where certain wholly owned subsidiaries of FDC agreed to transfer and contribute receivables to FDR. FDR’s assets are not available to satisfy obligations of any other entities or affiliates of FDC. FDR's creditors will be entitled, upon its liquidation, to be satisfied out of FDR’s assets prior to any assets or value in FDR becoming available to FDR’s equity holders. As of December 31, 2017, the Company transferred $748 million in receivables to FDR as part of the securitization program and FDR utilized the receivables as collateral in borrowings of $600 million. As of December 31, 2017, the receivables held by FDR are recorded within “Accounts receivable, net” in the Company’s consolidated balance sheets. The weighted-average interest rate on the securitization facility was 2.8% for the year ended December 31, 2017.
Senior Unsecured Revolving Credit Facility
On December 14, 2017 the Company executed a $33 million senior unsecured revolving credit facility maturing December 20, 2019, available for letters of credit. The interest rate associated with the credit facility was 1.85% for the year ended December 31, 2017.
Senior Secured Term Loan Facility
The original terms of the Company’s senior secured term loan facilities required the Company to pay equal quarterly installments in aggregate annual amounts equal to 1% of the original principal amount. However, in conjunction with debt modifications and amendments over the last several years, proceeds from the issuance of the notes were used to prepay portions of the principal balances of the Company’s senior secured term loans which satisfied the future quarterly principal payments. Therefore, the Company made no scheduled principal payments during 2017 or 2016, for the senior secured term loan facility other than $70 million related to June 2020 senior secured term loan facility. The senior secured term loan facilities also require mandatory prepayments based on a percentage of excess cash flow generated by the Company if the Company does not satisfy the leverage ratio. All obligations under the senior secured loan facilities are fully and unconditionally guaranteed by most of the domestic, wholly owned material subsidiaries of the Company, subject to certain exceptions.
Senior Secured Term Loan Facility Due June 2020
On January 23, 2017, the Company incurred an aggregate principal amount of $1.3 billion in new U.S. dollar denominated term loans maturing on June 2, 2020. The interest rate applicable to the new term loans is either LIBOR plus 1.75% or a base rate plus 0.75%. The Company is required to make quarterly principal payments of 1.25% on the new term loans. The new term loans were utilized to pay down a portion of the existing 6.75% senior secured first lien notes. In connection with this transaction, the Company expensed $56 million in loss on debt extinguishment. In November 2017, the Company incurred additional debt of
78
FIRST DATA CORPORATION
NOTES TO THE CONSOLIDATED FINANCIAL STATEMENTS (Continued)
$250 million against this facility to partially fund the purchase of BluePay. The Company made principal payments of $70 million in 2017.
Senior Secured Term Loan Facility Due April 2024
On November 15, 2017, the Company refinanced approximately $3.9 billion of U.S. dollar-denominated senior secured term loans maturing on April 2024. The interest rate applicable to the new loan is either LIBOR plus 2.25% or a base rate plus 1.25%. The proceeds were utilized to pay down the existing March 2021 term loan facility. In connection with this transaction, the Company expensed $9 million in loss on debt extinguishment.
Senior Secured Term Loan Facility Due July 2022
On June 14, 2017, the Company refinanced approximately $2.7 billion of U.S. dollar-denominated senior secured term loans maturing on July 2022 and paid off approximately $1.0 billion of euro-denominated senior secured term loans maturing on March 2021 and July 2022. The U.S. dollar-denominated July 2022 term loan facility was upsized by $1.0 billion, to pay off the euro-denominated term loans. Post transaction, the U.S. dollar-denominated July 2022 term loan facility approximates $3.8 billion of U.S. dollar-denominated term loans maturing July 2022 at an interest rate of LIBOR plus 2.25% or a base rate plus 1.25%. In connection with this transaction, the Company expensed $9 million in loss on debt extinguishment and $4 million in debt issuance costs.
5.375% Senior Secured First Lien Notes
On August 11, 2015, the Company issued approximately $1.2 billion aggregate principal amount of 5.375% senior secured first lien notes due August 15, 2023. Interest on the notes will be payable semi-annually in cash each year, commencing on February 15, 2016. The Company may redeem the notes, in whole or in part, prior to August 15, 2018 at a price equal to 100% of the notes redeemed plus accrued and unpaid interest to the redemption date and a "make-whole premium". Thereafter, the Company may redeem the notes, in whole or in part, at established redemption prices.
5.0% Senior Secured First Lien Notes
On March 29, 2016, the Company issued additional $900 million aggregate principal amount to the existing $1.0 billion principal amount issued November 25, 2015 of 5.0% senior secured first lien notes due 2024. The Company may redeem the notes, in whole or in part, prior to January 15, 2019 at a price equal to 100% of the notes redeemed plus accrued and unpaid interest to the redemption date and a "make-whole premium". Thereafter, the Company may redeem the notes, in whole or in part, at established redemption prices.
5.75% Senior Secured Second Lien Notes
On November 25, 2015, the Company issued $2.2 billion aggregate principal amount of 5.75% senior secured second lien notes due January 15, 2024. Interest on the notes is payable semi-annually in cash on January 15 and July 15 of each year. The Company may redeem the notes, in whole or in part, prior to January 15, 2019 at a price equal to 100% of the notes redeemed plus accrued and unpaid interest to the redemption date and a "make-whole premium". Thereafter, the Company may redeem the notes, in whole or in part, at established redemption prices.
7.0% Senior Unsecured Notes Due 2023
On November 18, 2015, the Company issued $3.4 billion aggregate principal amount of 7.0% senior unsecured notes due December 1, 2023. Interest on the notes is payable semi-annually in cash on June 1 and December 1 of each year. The Company may redeem the notes, in whole or in part, prior to December 1, 2018 at a price equal to 100% of the notes redeemed plus accrued and unpaid interest to the redemption date and a "make-whole premium". Thereafter, the Company may redeem the notes, in whole or in part, at established redemption prices.
79
FIRST DATA CORPORATION
NOTES TO THE CONSOLIDATED FINANCIAL STATEMENTS (Continued)
Maturities
The following table presents the future aggregate annual maturities of the Company’s capital leases and long-term debt excluding unamortized discounts and deferred financing cost:
Year ended December 31, (in millions) | Par Amount | |||
2018 | $ | 197 | ||
2019 | 228 | |||
2020 | 1,404 | |||
2021 | 37 | |||
2022 | 3,759 | |||
Thereafter | 12,622 | |||
Total | $ | 18,247 | ||
Guarantees and Covenants
All obligations under the senior secured revolving credit facility and senior secured term loan facilities are unconditionally guaranteed by most of the existing and future, direct and indirect, wholly owned, material domestic subsidiaries of the Company. The senior secured facilities contain a number of covenants that, among other things, restrict the Company’s ability to incur additional indebtedness; create liens; enter into sale and leaseback transactions; engage in mergers or consolidations; sell or transfer assets; pay dividends and distributions or repurchase the Company’s capital stock; make investments, loans or advances; prepay certain indebtedness; make certain acquisitions; engage in certain transactions with affiliates; amend material agreements governing certain indebtedness; and change its lines of business. The senior secured facilities also require the Company to not exceed a maximum senior secured leverage ratio and contain certain customary affirmative covenants and events of default, including a change of control. The senior secured term loan facilities also require mandatory prepayments based on a percentage of excess cash flow generated by the Company. The Company is in compliance with all applicable covenants.
All senior secured notes are guaranteed on a senior secured basis by each of the Company’s existing and future direct and indirect wholly owned domestic subsidiaries that guarantees the Company’s senior secured credit facilities. Each of the guarantees of the notes is a general senior obligation of each guarantor and rank senior in right of payment to all existing and future subordinated indebtedness of the guarantor subsidiary, including the Company’s existing senior subordinated notes. The notes rank equal in right of payment with all existing and future senior indebtedness of the guarantor subsidiary but are effectively senior to the guarantees of the Company’s existing senior unsecured notes and the Company’s existing senior secured second lien notes to the extent of the Company’s and the guarantor subsidiary’s value of the collateral securing the notes. The 5.375% senior secured first lien notes and 5.0% senior secured first lien notes are effectively equal in right of payment with each other and the guarantees of the Company’s senior secured credit facilities. Each series of notes are effectively subordinated to any obligations secured by liens permitted under the indenture for the particular series of notes and structurally subordinated to any existing and future indebtedness and other liabilities of any subsidiary of a guarantor that is not also a guarantor of the notes.
All senior unsecured notes (i) rank senior in right of payment to all of the Company’s existing and future subordinated indebtedness, (ii) rank equally in right of payment to all of the existing and future senior indebtedness, (iii) are effectively subordinated in right of payment to all existing and future secured debt to the extent of the value of the assets securing such debt, and (iv) are structurally subordinated to all obligations of each subsidiary that is not a guarantor of the senior notes.
All obligations under the senior secured first lien notes, senior secured second lien notes, and senior unsecured notes also contain a number of covenants similar to those described for the senior secured obligations noted above. The Company is in compliance with all applicable covenants.
80
FIRST DATA CORPORATION
NOTES TO THE CONSOLIDATED FINANCIAL STATEMENTS (Continued)
Note 3: Goodwill and Other Intangibles
The following table presents changes to goodwill for the years ended December 31, 2016 and 2017:
(in millions) | Global Business Solutions | Global Financial Solutions | Network & Security Solutions | Totals | ||||||||||||
Balance as of January 1, 2016 | ||||||||||||||||
Goodwill | $ | 15,567 | $ | 2,054 | $ | 2,284 | $ | 19,905 | ||||||||
Accumulated impairment losses | (1,363 | ) | (683 | ) | (1,013 | ) | (3,059 | ) | ||||||||
14,204 | 1,371 | 1,271 | 16,846 | |||||||||||||
Acquisitions | 5 | — | — | 5 | ||||||||||||
Dispositions | (25 | ) | — | — | (25 | ) | ||||||||||
Other adjustments (primarily foreign currency) | (42 | ) | (88 | ) | — | (130 | ) | |||||||||
Balance as of December 31, 2016 | ||||||||||||||||
Goodwill | 15,505 | 1,966 | 2,284 | 19,755 | ||||||||||||
Accumulated impairment losses | (1,363 | ) | (683 | ) | (1,013 | ) | (3,059 | ) | ||||||||
14,142 | 1,283 | 1,271 | 16,696 | |||||||||||||
Acquisitions | 875 | — | — | 875 | ||||||||||||
Dispositions | — | (17 | ) | (48 | ) | (65 | ) | |||||||||
Other adjustments (primarily foreign currency) | 104 | 100 | — | 204 | ||||||||||||
Balance as of December 31, 2017 | ||||||||||||||||
Goodwill | 16,484 | 2,049 | 2,236 | 20,769 | ||||||||||||
Accumulated impairment losses | (1,363 | ) | (683 | ) | (1,013 | ) | (3,059 | ) | ||||||||
$ | 15,121 | $ | 1,366 | $ | 1,223 | $ | 17,710 | |||||||||
The intangible amortization expense associated with customer relationships and other intangibles, including amortization associated with investments in affiliates, was as follows for the periods indicated:
Year ended December 31, | ||||
(in millions) | Amount | |||
2017 | $ | 752 | ||
2016 | 761 | |||
2015 | 843 | |||
The carrying value of the First Data trade name is $604 million for both the years ended December 31, 2017 and 2016. Upon consideration of many factors, including the determination that there are no legal, regulatory or contractual provisions that limit the useful life of the First Data trade name, the Company determined that the First Data trade name had an indefinite useful life. The Company also considered the effects of obsolescence, demand, competition, other economic factors, and its ability to maintain and protect the trade name without significant expenditures. The First Data trade name is expected to contribute directly or indirectly to the future cash flows of the Company for an indefinite period. As an indefinite lived asset, the First Data trade name is not amortized but is reviewed annually for impairment until such time as it is determined to have a finite life. The First Data trade name was not impaired as of December 31, 2017 or 2016.
81
FIRST DATA CORPORATION
NOTES TO THE CONSOLIDATED FINANCIAL STATEMENTS (Continued)
The following table provides the components of other intangibles:
As of December 31, | ||||||||||||||||||||||||
2017 | 2016 | |||||||||||||||||||||||
Accumulated | Net of Accumulated | Accumulated | Net of Accumulated | |||||||||||||||||||||
(in millions) | Cost | Amortization | Amortization | Cost | Amortization | Amortization | ||||||||||||||||||
Customer relationships | $ | 8,124 | $ | (5,940 | ) | $ | 2,184 | $ | 7,399 | $ | (5,660 | ) | $ | 1,739 | ||||||||||
Other intangibles: | ||||||||||||||||||||||||
Conversion costs | $ | 302 | $ | (142 | ) | $ | 160 | $ | 248 | $ | (109 | ) | $ | 139 | ||||||||||
Contract costs | 324 | (179 | ) | 145 | 306 | (149 | ) | 157 | ||||||||||||||||
Software | 2,552 | (1,920 | ) | 632 | 2,236 | (1,726 | ) | 510 | ||||||||||||||||
Other, including trade names | 1,422 | (424 | ) | 998 | 1,375 | (381 | ) | 994 | ||||||||||||||||
Total other intangibles | $ | 4,600 | $ | (2,665 | ) | $ | 1,935 | $ | 4,165 | $ | (2,365 | ) | $ | 1,800 | ||||||||||
The estimated future aggregate amortization expense for the next five years is as follows:
Year ended December 31, | ||||
(in millions) | Amount (a) | |||
2018 | $ | 705 | ||
2019 | 615 | |||
2020 | 530 | |||
2021 | 399 | |||
2022 | 310 | |||
(a) Actual amortization expense will be higher due to future activity that generates new intangible balances.
The Company tests contract and conversion costs for recoverability on an annual basis by comparing the remaining expected undiscounted cash flows under the contract to the net book value. Any assets that are determined to be unrecoverable are written down to their fair value. In addition to this annual test, these assets and all other long lived assets are tested for impairment upon an indicator of potential impairment.
Note 4: Stock Compensation Plans
The Company provides stock-based compensation awards to its employees under the 2015 Omnibus Incentive Plan (stock plan). The total number of shares of Class A common stock that may be issued under the stock plan is 71 million, plus any shares of Class B common stock subject to outstanding awards granted under the Company's 2007 Equity Plan that are forfeited, terminated, canceled, expired unexercised, withheld in payment of the exercise price, or withheld to satisfy tax withholding obligations which automatically converted on a one-for-one basis into shares of Class A common stock. The stock plan allows for the Company to award an equity interest in the Company or an award that can be settled in cash measured by reference to the value of the Company's Class A common stock.
Total stock-based compensation expense recognized in the "Cost of services" and “Selling, general, and administrative” line items of the consolidated statements of operations resulting from stock options, non-vested restricted stock awards, and non-vested restricted stock units was as follows for the periods presented:
Year ended December 31, (in millions) | Cost of services | Selling, general, and administrative | Total | |||||||||
2017 (c) | $ | 72 | $ | 173 | $ | 245 | ||||||
2016 (a) (c) | 112 | 151 | 263 | |||||||||
2015 (b) (c) | 130 | 199 | 329 | |||||||||
(a) | Approximately $52 million of stock-based compensation expense was recognized in conjunction with the IPO. |
(b) Approximately $254 million was recognized in conjunction with the IPO and $14 million of stock-based compensation expense was recognized as a result of the departure of certain executive officers.
(c) Directly associated with our initial public offering, the Company incurred $254 million and $52 million in stock-based compensation expense during 2015 and 2016 respectively. During 2016, the Company incurred an increase of $136 million in ongoing stock-based compensation expense as employee awards
82
FIRST DATA CORPORATION
NOTES TO THE CONSOLIDATED FINANCIAL STATEMENTS (Continued)
were expensed over the requisite service period. During 2017, the stock-based compensation expense consists of ongoing employee award programs that will be expensed over the requisite service period.
On September 28, 2015, the Company authorized the grant of restricted stock awards, restricted stock units, and options to certain executives in connection with the consummation of its initial public offering and these awards were valued at approximately $120 million, resulting in incremental unrecognized compensation expense. Two-thirds of these grants are subject to time-based vesting conditions over five years and one-third are subject to a market-based vesting condition. Subject to the recipient’s continued service with the Company through the applicable vesting event, shares subject to market-based stock options and market-based restricted stock will fully vest on the date immediately following the date on which the closing trading price of a share of Class A common stock on the NYSE or other such primary exchange on which shares of Class A common stock are listed and traded has equaled or exceeded two times the per share price to the public in the offering for ten consecutive trading days.
Employee Stock Purchase Plan
The Company has an employee stock purchase plan under which the sale of 6.3 million shares of the Company's common stock is authorized. The price for shares purchased under the plan is 95% of the market value on the last day of each calendar quarter. For the years ended December 31, 2017, 2016 and 2015, the amount of shares issued under the plan were not material.
Stock Options
During the years ended December 31, 2017, 2016, and 2015, time-based options were granted under the stock plan. The time-based options have a contractual term of 10 years. Time-based options vest equally over a three to five year period from the date of issuance.
As of December 31, 2017, there was approximately $46 million of total unrecognized compensation expense related to stock options to be recognized over a weighted-average period of approximately two years.
The fair value of stock options granted for the years ended December 31, 2017, 2016, and 2015 were estimated at the date of grant using a Black-Scholes option pricing model with the following weighted-average assumptions:
Year ended December 31, | ||||||||||||
2017 | 2016 | 2015 | ||||||||||
Risk-free interest rate | 2.28 | % | 2.08 | % | 1.87 | % | ||||||
Dividend yield | — | — | — | |||||||||
Expected volatility | 38.97 | % | 41.33 | % | 55.15 | % | ||||||
Expected term (in years) | 7 | 7 | 7 | |||||||||
Fair value of options | $ | 7.52 | $ | 5.33 | $ | 8.68 | ||||||
Risk-free interest rate—The risk-free rate for stock options granted during the period was determined by using a zero-coupon U.S. Treasury rate for the periods that coincided with the expected terms listed above.
Expected dividend yield—No routine dividends are currently being paid, or are expected to be paid in future periods.
Expected volatility—As the Company does not have sufficient historical data due to its relatively short history of being publicly traded, the expected volatility is based on the historical volatilities of a group of guideline companies.
Expected term—The Company estimated the expected term by utilizing the “simplified method” as allowed by the SEC.
Fair value of stock—The Company determined the fair value based on discounted cash flows and comparison to a group of guideline companies prior to being publicly traded on October 15, 2015 and the Company's closing stock price thereafter.
83
FIRST DATA CORPORATION
NOTES TO THE CONSOLIDATED FINANCIAL STATEMENTS (Continued)
A summary of stock option activity for the years ended December 31, 2017 and 2016 was as follows:
(options in millions) | Options | Weighted-Average Exercise Price | Weighted-Average Remaining Contractual Term | Aggregate Intrinsic Value (in millions) | |||||||||
Outstanding as of December 31, 2015 | 41 | $ | 11.94 | ||||||||||
Granted | 2 | 12.62 | |||||||||||
Exercised | (2 | ) | 9.86 | ||||||||||
Canceled / Forfeited | (2 | ) | 15.39 | ||||||||||
Outstanding as of December 31, 2016 | 39 | $ | 12.00 | 6 years | $ | 98 | |||||||
Granted | — | — | |||||||||||
Exercised | (5 | ) | 9.94 | ||||||||||
Canceled / Forfeited | — | — | |||||||||||
Outstanding as of December 31, 2017 | 34 | $ | 12.27 | 6 years | $ | 150 | |||||||
Options exercisable as of December 31, 2017 | 24 | $ | 11.48 | 5 years | $ | 124 | |||||||
The total intrinsic value related to stock options exercised for the years ended December 31, 2017, 2016, and 2015 was $32 million, $6 million, and $4 million, respectively.
Restricted Stock Awards and Restricted Stock Units
The grant date fair value of each award is based on the closing stock price at the date of grant. Grants were made as incentive awards, which generally vest 20% on the first anniversary, 40% on the second anniversary, and the remaining 40% on the third anniversary. As of December 31, 2017, there was approximately $344 million of total unrecognized compensation expense related to restricted stock that will be recognized over the respective service period of approximately two years. During 2017, 2016, and 2015, the Company did not pay any significant cash amounts to repurchase stock awards from employees that terminated employment with the Company.
A summary of restricted stock award and restricted stock unit activity for the years ended December 31, 2017 and 2016 is as follows:
(awards/units in millions) | Awards/Units | Weighted-Average Grant-Date Fair Value | |||||
Non-vested as of December 31, 2015 | 32 | $ | 14.30 | ||||
Granted | 18 | 12.49 | |||||
Vested | (10 | ) | 13.91 | ||||
Canceled / Forfeited | (6 | ) | 13.74 | ||||
Non-vested December 31, 2016 | 34 | $ | 13.59 | ||||
Granted | 23 | 16.94 | |||||
Vested | (15 | ) | 13.86 | ||||
Canceled / Forfeited | (4 | ) | 14.11 | ||||
Non-vested as of December 31, 2017 (a) | 38 | $ | 15.47 | ||||
(a) | Includes 7 million of shares subject to market conditions. |
The total fair value of shares vested (measured as of the date of vesting) during the twelve months ended December 31, 2017, 2016, and 2015 was $204 million, $137 million, and $11 million, respectively.
84
FIRST DATA CORPORATION
NOTES TO THE CONSOLIDATED FINANCIAL STATEMENTS (Continued)
Note 5: Stockholders' Equity and Redeemable Noncontrolling Interest
Dividends
The Company’s senior secured revolving credit facility, senior secured term loan facility, and the indentures governing the senior secured notes, senior unsecured notes, and senior subordinated notes limit the Company's ability to pay dividends. The restrictions are subject to numerous qualifications and exceptions, including an exception that allows the Company to pay a dividend to repurchase, under certain circumstances, the equity of the Company's former parent, FDH, held by employees, officers and directors that were obtained in connection with the stock compensation plan. Prior to the Company filing its prospectus with the Securities and Exchange Commission and the merger with FDH, the Company paid cash dividends to FDH totaling $4 million during 2015. The Company has not paid any cash dividends since the IPO.
Other Comprehensive Income
The income tax effects allocated to and the cumulative balance of each component of OCI are as follows:
(in millions) | Beginning Balance | Pretax Gain (Loss) Amount | Tax (Benefit) Expense | Net-of- Tax Amount | Ending Balance | |||||||||||||||
As of December 31, 2017 | ||||||||||||||||||||
Foreign currency translation adjustment (a) | $ | (1,317 | ) | $ | 165 | $ | (24 | ) | $ | 189 | $ | (1,128 | ) | |||||||
Pension liability adjustments | (98 | ) | 93 | 21 | 72 | (26 | ) | |||||||||||||
Derivative instruments | 3 | 9 | — | 9 | 12 | |||||||||||||||
Marketable securities | (2 | ) | — | — | — | (2 | ) | |||||||||||||
$ | (1,414 | ) | $ | 267 | $ | (3 | ) | $ | 270 | $ | (1,144 | ) | ||||||||
As of December 31, 2016 | ||||||||||||||||||||
Foreign currency translation adjustment (a) | $ | (1,169 | ) | $ | (149 | ) | $ | (1 | ) | $ | (148 | ) | $ | (1,317 | ) | |||||
Pension liability adjustments (b) | (136 | ) | 34 | (4 | ) | 38 | (98 | ) | ||||||||||||
Derivative instruments | — | 3 | — | 3 | 3 | |||||||||||||||
Marketable securities | (2 | ) | — | — | — | (2 | ) | |||||||||||||
$ | (1,307 | ) | $ | (112 | ) | $ | (5 | ) | $ | (107 | ) | $ | (1,414 | ) | ||||||
As of December 31, 2015 | ||||||||||||||||||||
Foreign currency translation adjustment (a) | $ | (889 | ) | $ | (261 | ) | $ | 19 | $ | (280 | ) | $ | (1,169 | ) | ||||||
Pension liability adjustments | (123 | ) | (19 | ) | (6 | ) | (13 | ) | (136 | ) | ||||||||||
Marketable securities | (5 | ) | 3 | — | 3 | (2 | ) | |||||||||||||
$ | (1,017 | ) | $ | (277 | ) | $ | 13 | $ | (290 | ) | $ | (1,307 | ) | |||||||
(a) | Net-of-tax Foreign currency translation adjustment for the years ended December 31, 2017, 2016, and 2015 is different than the amount presented on the consolidated statements of comprehensive income (loss) by $12 million, $(5) million, and $(10) million, respectively, due to the foreign currency translation adjustment related to noncontrolling interests not included above. |
(b) | 2016 pretax benefit includes an approximate $10 million reclassification out of OCI to "Other operating expenses" in the consolidated statements of operations related to the lump sum cash payout of certain U.S. based pension liabilities. |
85
FIRST DATA CORPORATION
NOTES TO THE CONSOLIDATED FINANCIAL STATEMENTS (Continued)
Redeemable Noncontrolling Interest
The following table presents a summary of the redeemable noncontrolling interest activity:
(in millions) | Redeemable Noncontrolling Interest | |||
Balance as of January 1, 2015 | $ | 70 | ||
Distributions | (35 | ) | ||
Share of income | 34 | |||
Adjustment to redemption value of redeemable noncontrolling interest | 8 | |||
Balance as of December 31, 2015 | 77 | |||
Distributions | (33 | ) | ||
Share of income | 33 | |||
Adjustment to redemption value of redeemable noncontrolling interest | (4 | ) | ||
Balance as of December 31, 2016 | 73 | |||
Distributions | (31 | ) | ||
Share of income | 31 | |||
Adjustment to redemption value of redeemable noncontrolling interest | (1 | ) | ||
Balance as of December 31, 2017 | $ | 72 | ||
Note 6: Net Income (Loss) Per Share
Upon the HoldCo Merger, all outstanding shares of FDH's Class A Common Stock, Class B Common Stock, and Series A Voting Participating Convertible Preferred Stock (Series A Preferred Stock) automatically converted to identical shares of the Company's Class B Common Stock. Other than voting rights, this common stock has the same rights as the Class A Common Stock and therefore both are treated as the same class of stock for purposes of the net income (loss) per share calculation.
Basic net income (loss) per share is calculated by dividing net income (loss) attributable to FDC by the weighted-average shares outstanding during the period, without consideration for any potential dilutive shares. Diluted net income (loss) per share has been computed to give effect to the impact, if any, of shares issuable upon the assumed exercise of the Company’s common stock equivalents, which consist of outstanding stock options and unvested restricted stock. The dilutive effect of potentially dilutive securities is reflected in net income (loss) per share by application of the treasury stock method. Under the treasury stock method, an increase in the fair market value of the Company’s common stock can result in a greater dilutive effect from potentially dilutive securities.
86
FIRST DATA CORPORATION
NOTES TO THE CONSOLIDATED FINANCIAL STATEMENTS (Continued)
The following table sets forth the computation of the Company's basic and diluted net loss per share:
Year ended December 31, | ||||||||||||
(in millions, except per share amounts) | 2017 | 2016 | 2015 | |||||||||
Numerator: | ||||||||||||
Net income (loss) used in computing net income (loss) per share, basic and diluted | $ | 1,465 | $ | 420 | $ | (1,481 | ) | |||||
Denominator: | ||||||||||||
Shares used in computing net income (loss) per share, basic (a) | 916 | 902 | 192 | |||||||||
Effect of dilutive securities | 24 | 19 | — | |||||||||
Total dilutive securities | 940 | 921 | 192 | |||||||||
Basic net income (loss) per share | $ | 1.60 | $ | 0.47 | $ | (7.70 | ) | |||||
Diluted net income (loss) per share (b) | 1.56 | 0.46 | (7.70 | ) | ||||||||
Anti-dilutive shares excluded from diluted net income (loss) per share | 12 | 21 | 27 | |||||||||
(a) | 2015 weighted-average shares calculated using 1,000 shares outstanding prior to the HoldCo Merger and the filing of the Company's prospectus in October 2015 and the Class A and Class B common stock outstanding after these transactions. |
(b) | Potentially dilutive securities whose effect would have been antidilutive are excluded from the computation of diluted earnings per share. |
Note 7: Segment Information
Operating segments are defined as components of an enterprise about which separate financial information is available that is evaluated regularly by a company’s chief operating decision maker (CODM), or decision-making group, in deciding how to allocate resources and in assessing performance. The Company's CODM is its Chief Executive Officer. The Company is organized into three segments: Global Business Solutions, Global Financial Solutions, and Network & Security Solutions.
The business segment measurements provided to and evaluated by the CODM are computed in accordance with the principles listed below:
• | The accounting policies of the operating segments are the same as those described in the summary of significant accounting policies. |
• | Intersegment revenues are eliminated in the segment that sells directly to the end market. |
• | Segment revenue excludes reimbursable debit network fees, postage, and other revenue. |
• | Segment EBITDA excludes Depreciation and amortization expense, Other operating expenses, and Other income (expense). Additionally, segment EBITDA is adjusted for items similar to certain of those used in calculating the Company's compliance with debt covenants. The additional items that are adjusted to determine segment EBITDA are: |
• | stock-based compensation and related expense is excluded; and |
• | Kohlberg Kravis Roberts & Co. (KKR) related items including annual sponsor and other fees for management, consulting, financial, contract termination, and other advisory services are excluded. Upon the Company's public offering on October 15, 2015, the Company is no longer required to pay management fees to KKR. |
• | For significant affiliates, segment revenue and segment EBITDA are reflected based on the Company's proportionate share of the results of the Company's investments in businesses accounted for under the equity method and consolidated subsidiaries with noncontrolling ownership interests. For other affiliates, the Company includes equity earnings in affiliates, excluding amortization expense, in segment revenue and segment EBITDA. In addition, the Company's Global Business Solutions segment measures reflect revenue-based commission payments to Independent Sales Organizations (ISOs) and sales channels, which are treated as an expense in the consolidated statements of operations, as contra revenue. |
• | Corporate operations include corporate-wide governance functions such as the Company's executive management team, tax, treasury, internal audit, corporate strategy, and certain accounting, human resources and legal costs related to |
87
FIRST DATA CORPORATION
NOTES TO THE CONSOLIDATED FINANCIAL STATEMENTS (Continued)
supporting the corporate function. Costs incurred by Corporate that are attributable to a segment are allocated to the respective segment.
The following tables present the Company’s operating segment results for the years ended December 31, 2017, 2016, and 2015:
Year ended December 31, 2017 | ||||||||||||||||||||
(in millions) | Global Business Solutions | Global Financial Solutions | Network & Security Solutions | Corporate | Totals | |||||||||||||||
Revenues: | ||||||||||||||||||||
Transaction and processing service fees | $ | 3,299 | $ | 1,418 | $ | 1,348 | $ | — | $ | 6,065 | ||||||||||
Product sales and other | 933 | 205 | 195 | — | 1,333 | |||||||||||||||
Equity earnings in affiliates | 30 | — | — | — | 30 | |||||||||||||||
Total segment revenues | $ | 4,262 | $ | 1,623 | $ | 1,543 | $ | — | $ | 7,428 | ||||||||||
Depreciation and amortization | $ | 457 | $ | 352 | $ | 126 | $ | 12 | $ | 947 | ||||||||||
Segment EBITDA | 1,824 | 686 | 729 | (167 | ) | 3,072 | ||||||||||||||
Year ended December 31, 2016 | ||||||||||||||||||||
(in millions) | Global Business Solutions | Global Financial Solutions | Network & Security Solutions | Corporate | Totals | |||||||||||||||
Revenues: | ||||||||||||||||||||
Transaction and processing service fees | $ | 3,201 | $ | 1,372 | $ | 1,309 | $ | — | $ | 5,882 | ||||||||||
Product sales and other | 826 | 221 | 176 | — | 1,223 | |||||||||||||||
Equity earnings in affiliates | 36 | — | — | — | 36 | |||||||||||||||
Total segment revenues | $ | 4,063 | $ | 1,593 | $ | 1,485 | $ | — | $ | 7,141 | ||||||||||
Depreciation and amortization | $ | 435 | $ | 357 | $ | 115 | $ | 14 | $ | 921 | ||||||||||
Segment EBITDA | 1,725 | 646 | 666 | (145 | ) | 2,892 | ||||||||||||||
Year ended December 31, 2015 | ||||||||||||||||||||
(in millions) | Global Business Solutions | Global Financial Solutions | Network & Security Solutions | Corporate | Totals | |||||||||||||||
Revenues: | ||||||||||||||||||||
Transaction and processing service fees | $ | 3,209 | $ | 1,323 | $ | 1,322 | $ | — | $ | 5,854 | ||||||||||
Product sales and other | 845 | 172 | 142 | — | 1,159 | |||||||||||||||
Equity earnings in affiliates | 35 | — | — | — | 35 | |||||||||||||||
Total segment revenues | $ | 4,089 | $ | 1,495 | $ | 1,464 | $ | — | $ | 7,048 | ||||||||||
Depreciation and amortization | $ | 490 | $ | 393 | $ | 91 | $ | 25 | $ | 999 | ||||||||||
Segment EBITDA | 1,681 | 550 | 639 | (140 | ) | 2,730 | ||||||||||||||
88
FIRST DATA CORPORATION
NOTES TO THE CONSOLIDATED FINANCIAL STATEMENTS (Continued)
The following table presents a reconciliation of reportable segment amounts to the Company’s consolidated balances for the years ended December 31, 2017, 2016, and 2015:
Year ended December 31, | ||||||||||||
(in millions) | 2017 | 2016 | 2015 | |||||||||
Total segment revenues | $ | 7,428 | $ | 7,141 | $ | 7,048 | ||||||
Adjustments: | ||||||||||||
Non wholly-owned entities (a) | 64 | 80 | 74 | |||||||||
ISOs commission expense (b) | 637 | 618 | 642 | |||||||||
Reimbursable debit network fees, postage, and other | 3,923 | 3,745 | 3,687 | |||||||||
Consolidated revenues | $ | 12,052 | $ | 11,584 | $ | 11,451 | ||||||
Total segment EBITDA | $ | 3,072 | $ | 2,892 | $ | 2,730 | ||||||
Adjustments: | ||||||||||||
Non wholly-owned entities (a) | 30 | 30 | 26 | |||||||||
Depreciation and amortization | (972 | ) | (949 | ) | (1,022 | ) | ||||||
Interest expense, net | (937 | ) | (1,068 | ) | (1,537 | ) | ||||||
Loss on debt extinguishment | (80 | ) | (70 | ) | (1,068 | ) | ||||||
Other items (c) | (132 | ) | (71 | ) | (180 | ) | ||||||
Income tax benefit (expense) | 729 | (81 | ) | (101 | ) | |||||||
Stock-based compensation | (245 | ) | (263 | ) | (329 | ) | ||||||
Net income (loss) attributable to First Data Corporation | $ | 1,465 | $ | 420 | $ | (1,481 | ) | |||||
(a) | Net adjustment to reflect the Company's proportionate share of the results of the Company's investments in businesses accounted for under the equity method and consolidated subsidiaries with noncontrolling ownership interests. Segment revenue for the Company's significant affiliates is reflected based on the Company's proportionate share of the results of the Company's investments in businesses accounted for under the equity method and consolidated subsidiaries with noncontrolling ownership interests. For other affiliates, the Company includes equity earnings in affiliates, excluding amortization expense, in segment revenue. |
(b) | Reported within "Selling, general, and administrative expense" in the consolidated statements of operations. |
(c) | Includes restructuring, certain retention bonuses, non-normal course litigation and regulatory settlements, asset impairments, debt issuance expenses, KKR related items and “Other income" as presented in the consolidated statements of operations, which includes divestitures, derivative gains (losses), non-operating foreign currency gains (losses), and the gain on Visa Europe share sale. KKR related items represent KKR annual sponsorship fees for management, consulting, financial and other advisory services. Upon completing the IPO in October 2015, the Company is no longer obligated to pay KKR annual sponsorship fees. |
Total segment assets, capital expenditures, and investment in unconsolidated affiliates are not disclosed, as the Company's CODM does not utilize such information when allocating resources to the segment or when assessing the segments' performance.
The following tables presents a reconciliation of reportable segment depreciation and amortization amounts to the Company’s consolidated balances in the consolidated statements of cash flows for the years ended December 31, 2017, 2016, and 2015:
Year ended December 31, | ||||||||||||
(in millions) | 2017 | 2016 | 2015 | |||||||||
Segment depreciation and amortization | $ | 947 | $ | 921 | $ | 999 | ||||||
Adjustments for non-wholly owned entities | 70 | 75 | 83 | |||||||||
Amortization of initial payments for new contracts (a) | 56 | 65 | 51 | |||||||||
Total consolidated depreciation and amortization per consolidated statements of cash flows | 1,073 | 1,061 | 1,133 | |||||||||
Amortization of equity method investment (b) | (45 | ) | (47 | ) | (60 | ) | ||||||
Amortization of initial payments for new contracts (a) | (56 | ) | (65 | ) | (51 | ) | ||||||
Total consolidated depreciation and amortization per consolidated statements of operations | $ | 972 | $ | 949 | $ | 1,022 | ||||||
(a) | Included in "Transaction and processing service fees" as contra-revenue in the Company's consolidated statements of operations. |
(b) | Included in "Equity earnings in affiliates" in the Company's consolidated statements of operations. |
89
FIRST DATA CORPORATION
NOTES TO THE CONSOLIDATED FINANCIAL STATEMENTS (Continued)
The following tables presents revenues and long-lived assets by principal geographic area for the years ended December 31, 2017, 2016, and 2015:
(in millions) | United States | International | Total | |||||||||
Revenues: | ||||||||||||
2017 | $ | 10,201 | $ | 1,851 | $ | 12,052 | ||||||
2016 | 9,890 | 1,694 | 11,584 | |||||||||
2015 | 9,795 | 1,656 | 11,451 | |||||||||
Long-Lived Assets: | ||||||||||||
2017 | $ | 20,324 | $ | 2,456 | $ | 22,780 | ||||||
2016 | 18,846 | 2,272 | 21,118 | |||||||||
2015 | 19,400 | 2,316 | 21,716 | |||||||||
Note 8: Income Taxes
The components of pretax income and provision for income taxes for the years ended December 31, 2017, 2016, and 2015, consisted of the following:
Year ended December 31, | ||||||||||||
(in millions) | 2017 | 2016 | 2015 | |||||||||
Components of pretax income (loss): | ||||||||||||
Domestic | $ | 484 | $ | 492 | $ | (1,332 | ) | |||||
Foreign | 451 | 249 | 165 | |||||||||
$ | 935 | $ | 741 | $ | (1,167 | ) | ||||||
Provision for income taxes: | ||||||||||||
Federal | $ | (795 | ) | $ | 20 | $ | 7 | |||||
State and local | (32 | ) | 20 | 14 | ||||||||
Foreign | 98 | 41 | 80 | |||||||||
Income tax (benefit) expense | $ | (729 | ) | $ | 81 | $ | 101 | |||||
Effective income tax rate | (78 | )% | 11 | % | (9 | )% | ||||||
90
FIRST DATA CORPORATION
NOTES TO THE CONSOLIDATED FINANCIAL STATEMENTS (Continued)
The Company’s effective tax rates differ from statutory rates as follows:
Year ended December 31, | |||||||||
2017 | 2016 | 2015 | |||||||
Federal statutory rate | 35 | % | 35 | % | 35 | % | |||
State income taxes, net of federal income tax benefit | 2 | 2 | 3 | ||||||
Nontaxable income from noncontrolling interests | (7 | ) | (11 | ) | 6 | ||||
Impact of foreign operations (a) | (1 | ) | 13 | (1 | ) | ||||
Valuation allowances | (147 | ) | (35 | ) | (54 | ) | |||
Liability for unrecognized tax benefits | 2 | — | (2 | ) | |||||
Prior year adjustments (b) | (10 | ) | 3 | 4 | |||||
Enacted tax rate changes | 27 | (1 | ) | — | |||||
Other tax reform bill impact for foreign related items | 17 | — | — | ||||||
Equity Compensation | — | 5 | — | ||||||
Impact of divestiture | 2 | — | — | ||||||
Other | 2 | — | — | ||||||
Effective tax rate | (78 | )% | 11 | % | (9 | )% | |||
(a) | The impact of foreign operations includes the effects of earnings and profits adjustments, foreign losses, and differences between foreign tax expense and foreign taxes eligible for the U.S. foreign tax credit. |
(b) | Includes prior year true ups for certain foreign and state net operating loss carryforwards as a result of tax rate and restructuring changes. |
The Company’s income tax (benefits) provisions consisted of the following components:
Year ended December 31, | ||||||||||||
(in millions) | 2017 | 2016 | 2015 | |||||||||
Current: | ||||||||||||
Federal | $ | 8 | $ | 22 | $ | 5 | ||||||
State and local | 23 | 24 | 23 | |||||||||
Foreign | 93 | 73 | 80 | |||||||||
124 | 119 | 108 | ||||||||||
Deferred: | ||||||||||||
Federal | (803 | ) | (2 | ) | 2 | |||||||
State and local | (55 | ) | (4 | ) | (9 | ) | ||||||
Foreign | 5 | (32 | ) | — | ||||||||
(853 | ) | (38 | ) | (7 | ) | |||||||
Income tax (benefit) expense | $ | (729 | ) | $ | 81 | $ | 101 | |||||
Deferred tax assets and liabilities are recognized for the expected tax consequences of temporary differences between the book and tax bases of the Company’s assets and liabilities. Valuation allowances are recorded to reduce deferred tax assets when it is more likely than not that a tax benefit will not be realized. Deferred tax assets are included in "Other long-term assets" and deferred tax liabilities are included in "Deferred tax liabilities" on the Company’s consolidated balance sheets.
91
FIRST DATA CORPORATION
NOTES TO THE CONSOLIDATED FINANCIAL STATEMENTS (Continued)
The following table outlines the principal components of deferred tax items:
As of December 31, | ||||||||
(in millions) | 2017 | 2016 | ||||||
Deferred tax assets related to: | ||||||||
Reserves and other accrued expenses | $ | 66 | $ | — | ||||
Employee related liabilities | 121 | 176 | ||||||
Deferred revenues | 30 | 34 | ||||||
Net operating losses and tax credit carryforwards | 2,281 | 3,122 | ||||||
U.S. foreign tax credits on undistributed earnings | 39 | 252 | ||||||
Total deferred tax assets | 2,537 | 3,584 | ||||||
Valuation allowance | (1,214 | ) | (2,396 | ) | ||||
Realizable deferred tax assets | 1,323 | 1,188 | ||||||
Deferred tax liabilities related to: | ||||||||
Property, equipment, and intangibles | (772 | ) | (969 | ) | ||||
Reserves and other accrued expenses | — | (49 | ) | |||||
Pension obligations | (67 | ) | (4 | ) | ||||
Investment in affiliates and other | (209 | ) | (217 | ) | ||||
Tax on foreign undistributed earnings | (12 | ) | (252 | ) | ||||
Foreign exchange gain | (35 | ) | (91 | ) | ||||
Total deferred tax liabilities | (1,095 | ) | (1,582 | ) | ||||
Net deferred tax asset (liabilities) | $ | 228 | $ | (394 | ) | |||
The Company’s deferred tax assets and liabilities included in the consolidated balance sheets were as follows:
As of December 31, | ||||||||
(in millions) | 2017 | 2016 | ||||||
Deferred tax assets | $ | 305 | $ | 15 | ||||
Deferred tax liabilities | (77 | ) | (409 | ) | ||||
Net deferred tax asset (liabilities) | $ | 228 | $ | (394 | ) | |||
As of December 31, 2017 and 2016, the Company had recorded valuation allowances of $1.2 billion and $2.4 billion, respectively, against its net deferred tax assets. The decrease to the valuation allowance of $(1.2) billion in 2017 was primarily due to utilization of federal and state net operating losses and the release of the US federal and certain state valuation allowances due to improved performance.
92
FIRST DATA CORPORATION
NOTES TO THE CONSOLIDATED FINANCIAL STATEMENTS (Continued)
The following table presents the amounts of federal, state, and foreign net operating loss carryforwards, general business credit, and minimum tax credit carryforwards:
As of December 31, | ||||
(in millions) | 2017 | |||
Federal net operating loss carryforwards (a) | $ | 4,567 | ||
State net operating loss carryforwards (b) | 6,069 | |||
Foreign net operating loss carryforwards (c) | 3,403 | |||
General business credit carryforwards (d) | 12 | |||
Minimum tax credit carryforwards (e) | 30 | |||
(a) | Will expire if not utilized, for the years 2018, 2019, 2020 of $0.1 million, $0.8 million, $0.1 million, respectively, and the remaining through 2037. |
(b) | Will expire if not utilized, for the years 2018, 2019, 2020 of $90 million, $245 million, $192 million, respectively, and the remaining through 2037. |
(c) | Foreign net operating loss carryforwards of $74 million, if not utilized, will expire in years 2017 through 2035. The remaining foreign net operating loss carryforwards of $3.3 billion have an indefinite life. |
(d) | If not utilized, these carryforwards will expire in years 2027 through 2037. |
(e) | These carryforwards are refundable credits and will be utilized from 2018 through 2021. |
The Company intends to indefinitely invest its net equity in its foreign operations, with the exception of any undistributed foreign earnings in those jurisdictions with positive earnings. Under the U.S. tax reform law changes enacted during 2017, all existing positive earnings were deemed to be distributed, and future foreign earnings will not be taxed in the U.S. Accordingly, as of December 31, 2017, no provision had been made for U.S. federal and state income taxes on the cumulative amount of temporary differences related to investments in foreign subsidiaries. However, these earnings are subject to local country withholding tax upon distribution. Upon sale or liquidation of these investments, the Company would potentially be subject to U.S., state, and foreign income taxes and withholding taxes payable to the various foreign countries. The amount of unrecognized deferred tax liability related to investments in foreign subsidiaries is approximately $165 million as of December 31, 2017.
On December 22, 2017, the Tax Cuts and Jobs Act (tax reform bill) was signed into law in the U.S. The provisions of the tax reform bill with the most significant implications to the Company were the reduction of the federal tax rate from 35% to 21%, the creation of a 100% participation exemption for foreign dividends, the enactment of a one-time transition tax on existing foreign earnings, limitations on the deductibility of interest expense, and the establishment of global intangible low-taxed income (GILTI) rules. The first three provisions impacted the year-ended December 31, 2017. At December 31, 2017, the Company has not completed its accounting for the tax effects of enactment of the Act; however, in certain cases, the Company has made a reasonable estimate of the effects on its existing deferred tax balances, valuation allowance assessment for certain tax assets and the one-time transition tax. The Company recognized a provisional net tax expense of $353 million related to the tax reform bill, which is included as a component of income tax expense from continuing operations.
The Company remeasured certain deferred tax assets and liabilities based on the federal rate at which they are expected to reverse in the future, which is generally 21%. The Company also remeasured the state rate at which certain deferred tax assets and liabilities are expected to reverse in the future. Because the Company’s deferred tax assets exceed its deferred tax liabilities in the U.S., the reduction of the tax rate from 35% to 21% provided by the tax reform bill resulted in a negative impact to the tax rate of $194 million. The Company is still analyzing certain aspects of the Act and refining its calculations, which could potentially affect the measurement of these balances or potentially give rise to new deferred tax amounts.
The one-time transition tax coupled with the 100% participation exemption had an immaterial impact on the tax rate. Because the Company has historically repatriated its foreign earnings, the Company’s cumulative foreign deficits exceed its cumulative foreign profits, causing the one-time taxable inclusion under the transition tax rules to be zero. As a result of the future participation exemption, the Company determined that it will not have enough future foreign sourced income to utilize any foreign tax credit carryforwards, and has therefore determined that it will amend its 2010-2016 tax returns to elect to claim foreign tax deductions, rather than foreign tax credits. The deferred tax impact of changing the election from a credit to a deduction was $159 million. This change was assumed when determining the appropriate valuation allowance on the Company’s foreign tax credit carryforwards in prior years, and as a result, the decision to amend the returns had an immaterial net tax rate impact. The Company is still evaluating the overall impact of the one-time transition tax on the outside basis differences and cumulative temporary differences inherent in these subsidiaries as of December 31, 2017.
The tax reform bill subjects a U.S. shareholder to current tax on GILTI earned by certain foreign subsidiaries. The FASB Staff Q&A, Topic 740 No. 5, Accounting for Global Intangible Low-Taxed Income, states that an entity can make an accounting policy election to either recognize deferred taxes for temporary differences expected to reverse as GILTI in future years or provide for
93
FIRST DATA CORPORATION
NOTES TO THE CONSOLIDATED FINANCIAL STATEMENTS (Continued)
the tax expense related to GILTI in the year the tax is incurred. The Company has elected to recognize the tax on GILTI as a period expense in the period the tax is incurred.
A reconciliation of the unrecognized tax benefits was as follows:
(in millions) | Unrecognized Tax Benefits | |||
Balance as of January 1, 2015 | $ | 236 | ||
Increases for tax positions of prior years | 25 | |||
Decreases for tax positions of prior years | (4 | ) | ||
Increases for tax positions related to the current period | 1 | |||
Decreases for cash settlements with taxing authorities | (3 | ) | ||
Decreases due to the lapse of the applicable statute of limitations | (6 | ) | ||
Balance as of December 31, 2015 | 249 | |||
Increases for tax positions of prior years | 2 | |||
Decreases for tax positions of prior years | (1 | ) | ||
Increases for tax positions related to the current period | — | |||
Decreases for cash settlements with taxing authorities | (1 | ) | ||
Decreases due to the lapse of the applicable statute of limitations | (9 | ) | ||
Balance as of December 31, 2016 | 240 | |||
Increases for tax positions of prior years | 14 | |||
Decreases for tax positions of prior years | (10 | ) | ||
Decreases for tax positions related to the current period | (3 | ) | ||
Decreases for cash settlements with taxing authorities | (1 | ) | ||
Decreases due to the lapse of the applicable statute of limitations | (7 | ) | ||
Decreases due to change in tax rates | (13 | ) | ||
Balance as of December 31, 2017 | $ | 220 | ||
Most of the unrecognized tax benefits are included in “Other long-term liabilities” on the consolidated balance sheets, net of the federal benefit on state income taxes (approximately $12 million as of December 31, 2017). However, those unrecognized tax benefits that affect the federal consolidated tax years ending December 31, 2008 through December 31, 2017 are included in “Deferred tax liabilities” on the consolidated balance sheets, as these items reduce the Company’s net operating loss and credit carryforwards from those periods. The unrecognized tax benefits as of December 31, 2017, 2016, and 2015 included approximately $130 million, $133 million, and $136 million, respectively, of tax positions that, if recognized, would affect the effective tax rate.
The Company recognizes interest and penalties related to unrecognized tax benefits in “Income tax (benefit) expense” in the consolidated statements of operations. Cumulative accrued interest and penalties (net of related tax benefits) are not included in the ending balances of unrecognized tax benefits. Cumulative accrued interest and penalties are included in “Other long-term liabilities” on the consolidated balance sheets while the related tax benefits are included in “Deferred tax liabilities” on the consolidated balance sheets. The following table presents the approximate amounts associated with accrued interest expense and the cumulative accrued interest and penalties:
Year ended December 31, | ||||||||||||
(in millions) | 2017 | 2016 | 2015 | |||||||||
Current year accrued interest expense (net of related tax benefits) | $ | 6 | $ | 5 | $ | 7 | ||||||
Cumulative accrued interest and penalties (net of related tax benefits) | 60 | 48 | 45 | |||||||||
As of December 31, 2017, the Company anticipates it is reasonably possible that its liability for unrecognized tax benefits may decrease by approximately $134 million within the next 12 months as a result of the possible closure of federal tax audits, potential settlements with certain states and foreign countries, and the lapse of the statute of limitations in various state and foreign jurisdictions.
94
FIRST DATA CORPORATION
NOTES TO THE CONSOLIDATED FINANCIAL STATEMENTS (Continued)
The Company or one or more of its subsidiaries file income tax returns in the U.S. federal jurisdiction and various state and foreign jurisdictions. As of December 31, 2017, the Company was no longer subject to income tax examination by the U.S. federal jurisdiction for years before 2005. State and local examinations are substantially complete through 2006. Foreign jurisdictions generally remain subject to examination by their respective authorities from 2007 forward, none of which are considered major jurisdictions.
In September 2017, the Internal Revenue Service issued a directive pertaining to the research and development (R&D) tax credit. The Company incurred approximately $150 million of R&D expenses during 2017.
Under the Tax Allocation Agreement executed at the time of the spin-off of The Western Union Company (Western Union) on September 29, 2006, Western Union is responsible for and must indemnify the Company against all taxes, interest, and penalties that relate to Western Union for periods prior to the spin-off date. If Western Union were to agree to or be finally determined to owe any amounts for such periods but were to default in its indemnification obligation under the Tax Allocation Agreement, the Company, as parent of the tax filing group during such periods, generally would be required to pay the amounts to the relevant tax authority, resulting in a potentially material adverse effect on the Company’s financial position and results of operations. As of December 31, 2017, the Company had approximately $129 million of income taxes payable, including approximately $4 million of uncertain income tax liabilities, recorded related to Western Union for periods prior to the spin-off date. The Company has recorded a corresponding account receivable of equal amount from Western Union, which is included as a long-term account receivable in “Other long-term assets” on the Company’s consolidated balance sheets, reflecting the indemnification obligation. The uncertain income tax liabilities and corresponding receivable are based on information provided by Western Union regarding its tax contingency reserves for periods prior to the spin-off date. There is no assurance that a Western Union-related issue raised by the IRS or other tax authority will be finally resolved at a cost not in excess of the amount reserved and reflected in the Company’s uncertain income tax liabilities and corresponding receivable from Western Union. The Western Union contingent liability is in addition to the Company’s liability for unrecognized tax benefits discussed above.
The IRS completed its examination of the U.S. federal consolidated income tax returns of the Company for 2005 through 2007 and issued a 30-Day letter in October 2012. The 30-Day letter claims that the Company and its subsidiaries, which included Western Union during some of the years at issue, owe additional taxes with respect to a variety of adjustments. The Company and Western Union agree with several of the adjustments in the 30-Day letter, such adjustments representing tax due of approximately $40 million. This undisputed tax and associated interest due (pretax) of approximately $26 million through December 31, 2017, were fully reserved. The undisputed tax for which Western Union would be required to indemnify the Company is greater than the total tax due, such that settlement of the undisputed tax would result in a net refund to the Company. As to the adjustments that are disputed, such issues represent total taxes allegedly due of approximately $59 million, of which $40 million relates to the Company and $19 million relates to Western Union. The Company estimates that total interest due (pretax) on the disputed amounts is approximately $29 million through December 31, 2017, of which $17 million relates to the Company and $11 million relates to Western Union. As to the disputed issues, the Company and Western Union are contesting the asserted deficiencies with the Appeals Office of the IRS. In December, 2017, the Company was notified by the Appeals Office that the case had been forwarded to the Joint Committee on Taxation for review. The Company believes that it has adequately reserved for the disputed issues in its liability for unrecognized tax benefits described above and that final resolution of those issues will not have a material adverse effect on its financial position or results of operations.
Note 9: Related Party Transactions
Merchant Alliances
A substantial portion of the Company’s business within the Global Business Solutions segment is conducted through merchant alliances. Merchant alliances are alliances between the Company and financial institutions. If the Company has majority ownership and management control over an alliance, then the alliance’s financial statements are consolidated with those of the Company and the related processing fees are treated as an intercompany transaction and eliminated upon consolidation. If the Company does not have a controlling ownership interest in an alliance, it uses the equity method of accounting to account for its investment in the alliance. As a result, the Company’s consolidated revenues include processing fees charged to alliances accounted for under the equity method. No directors or officers of the Company have ownership interests in any of the alliances. The formation of each of these alliances generally involves the Company and the bank contributing contractual merchant relationships to the alliance and a cash payment from one owner to the other to achieve the desired ownership percentage for each. The Company and the bank enter into a long-term processing service agreement as part of the negotiation process. This agreement governs the Company’s provision of transaction processing services to the alliance. As of December 31, 2017 and 2016, the Company had $35 million and $27 million, respectively, of amounts due from unconsolidated merchant alliances included within "Accounts receivable, net" in the Company's consolidated balance sheets. As of December 31, 2017 and 2016, the Company had $6 million and $7 million,
95
FIRST DATA CORPORATION
NOTES TO THE CONSOLIDATED FINANCIAL STATEMENTS (Continued)
respectively, of amounts due to unconsolidated merchant alliances included within "Accounts payable and accrued liabilities" in the Company's consolidated balance sheets.
Management Agreement
In connection with the 2007 acquisition of the Company by affiliates of KKR, the Company entered into a management agreement with KKR and one of its affiliates (Management Agreement) pursuant to which KKR provided advisory services to the Company and received fees and reimbursements of related out-of-pocket expenses. The Management Agreement was terminated upon the consummation of the Company's initial public offering in October 2015 and FDC is no longer required to pay management fees to KKR. In the year ended December 31, 2015, the Company, inclusive of the termination fee paid in October 2015, paid $98 million of management fees to KKR.
Relationship with KKR Capital Markets
For the years ended December 31, 2017, 2016, and 2015, KKR Capital Markets LLC, an affiliate of KKR, acted as an arranger and bookrunner for various financing transactions under the existing credit agreements, and as an initial purchaser of certain existing notes issued by the Company, and received underwriter and transaction fees totaling $1.5 million, $17 million, and $25 million, respectively.
For the year ended December 31, 2015 KKR Capital Markets LLC also acted as a placement agent in the Company's initial public offering for placement of the Company's Class A common stock and in the private placement of shares of Holdings' Class B common stock. For the year ended December 31, 2015, the Company paid $19 million related to such services.
Note 10: Other Operating Expenses
The following table details the components of “Other operating expenses” in the consolidated statements of operations:
Year ended December 31, | ||||||||||||
(in millions) | 2017 | 2016 | 2015 | |||||||||
Restructuring, net | $ | 83 | $ | 49 | $ | 53 | ||||||
Deal and deal integration costs | 27 | — | — | |||||||||
Asset impairment | 13 | — | — | |||||||||
Other | 20 | 12 | — | |||||||||
Other operating expenses | $ | 143 | $ | 61 | $ | 53 | ||||||
Restructuring
During the years ended December 31, 2017, 2016, and 2015, the Company recorded restructuring charges in connection with ongoing expense management initiatives and the vast majority of costs incurred are severance related. The Company continues to evaluate operating efficiencies and could incur further restructuring costs beyond these initiatives.
A summary of net pretax benefits (charges), incurred by segment, for each period is as follows:
Year ended December 31, | ||||||||||||
(in millions) | 2017 | 2016 | 2015 | |||||||||
Global Business Solutions | $ | (36 | ) | $ | (9 | ) | $ | (20 | ) | |||
Global Financial Solutions | (17 | ) | (10 | ) | (11 | ) | ||||||
Network & Security Solutions | (8 | ) | (3 | ) | (3 | ) | ||||||
Corporate | (22 | ) | (27 | ) | (19 | ) | ||||||
Restructuring, net | $ | (83 | ) | $ | (49 | ) | $ | (53 | ) | |||
96
FIRST DATA CORPORATION
NOTES TO THE CONSOLIDATED FINANCIAL STATEMENTS (Continued)
The following table summarizes the Company’s utilization of restructuring accruals for the years ended December 31, 2016 and 2017:
(in millions) | Employee Severance | Other | ||||||
Remaining accrual as of January 1, 2016 | $ | 29 | $ | 1 | ||||
Restructuring, net | 33 | 16 | ||||||
Loss on sale of property and equipment, net | — | (13 | ) | |||||
Cash payments and other | (53 | ) | (4 | ) | ||||
Remaining accrual as of December 31, 2016 | 9 | — | ||||||
Restructuring, net | 83 | — | ||||||
Cash payments and other | (71 | ) | — | |||||
Remaining accrual as of December 31, 2017 | $ | 21 | $ | — | ||||
Deal and Deal Integration Costs
During 2017, the Company completed three acquisitions, the two largest were CardConnect and BluePay. In connection with these acquisitions, the Company incurred $27 million in deal and deal integration costs for the year ended December 31, 2017. Deal and deal integration costs include asset impairment of $9 million, banker fees and other costs to close the transaction of $7 million, and other integration costs. Refer to note 12 "Acquisitions and Dispositions" of these consolidated financial statements for details regarding the Company's acquisitions.
Asset Impairment
For the year ended December 31, 2017, the Company incurred $6 million loss on a prepaid asset related to an early contract terminated and a loss of $7 million related to write down of abandoned technology and property.
Other
For the year ended December 31, 2017, the Company incurred $10 million loss on two customer related matters and $10 million related to earnout expense associated with a previous acquisition.
For the year ended December 31, 2016, the Company incurred a $10 million loss related to the settlement of certain U.S.-based pension fund obligations.
Note 11: Settlement Assets and Obligations
Settlement assets and obligations result from the Company’s processing services and associated settlement activities, including settlement of payment transactions. Settlement assets are generated principally from merchant services transactions. Certain merchant settlement assets that relate to settlement obligations accrued by the Company are held by partner banks to which the Company does not have legal ownership but has the right to use to satisfy the related settlement obligation. The Company records corresponding settlement obligations for amounts payable to merchants and for payment instruments not yet presented for settlement.
97
FIRST DATA CORPORATION
NOTES TO THE CONSOLIDATED FINANCIAL STATEMENTS (Continued)
The principal components of the Company’s settlement assets and obligations were as follows:
As of December 31, | ||||||||
(in millions) | 2017 | 2016 | ||||||
Settlement assets: | ||||||||
Cash and cash equivalents | $ | 1,738 | $ | 1,620 | ||||
Due from card associations, bank partners, and merchants | 18,625 | 13,175 | ||||||
Total settlement assets | $ | 20,363 | $ | 14,795 | ||||
Settlement obligations: | ||||||||
Payment instruments outstanding | $ | 11 | $ | 12 | ||||
Card settlements due to merchants | 20,352 | 14,783 | ||||||
Total settlement obligations | $ | 20,363 | $ | 14,795 | ||||
The changes in settlement assets and obligations are presented on a net basis within operating activities in the consolidated statements of cash flows. However, because the changes in the settlement assets balance exactly offset changes in settlement obligations, the activity nets to zero.
Note 12: Acquisitions and Dispositions
Acculynk Acquisition
On May 1, 2017, the Company acquired 100% of Accullink Inc. (Acculynk), a leading technology company that delivers eCommerce solutions for debit card acceptance. The acquisition included Acculynk's PaySecure debit routing technology and its range of other services. The purchase price was approximately $85 million and Acculynk is reported as part of the Company's Global Business Solutions segment.
CardConnect Acquisition
On July 6, 2017, the Company acquired 100% of CardConnect Corp. (CardConnect) for $763 million in cash, net of cash acquired. CardConnect is an innovative provider of payment processing and technology solutions and was one of the Company's largest distribution partners. The transaction is expected to enable the Company to bring innovative partner management tools to improve merchant retention, accelerate the Company's firm-wide independent software vendor (ISV) initiative and bring immediate capabilities in enterprise resource planning (ERP) integrated payment solutions to its customers. CardConnect operations are reported as part of the Company's Global Business Solutions segment.
The acquisition was accounted for as business combination and this accounting is substantially complete. In addition to the purchase price, the Company issued $44 million in the form of stock based compensation to certain key employees of CardConnect, which is subject to service vesting conditions including continued employment with the Company. The value assigned to the common stock is being recorded as post-acquisition compensation expense and has been excluded from the total purchase price.
The following table summarizes the fair values of the assets acquired and liabilities assumed on the acquisition date. The excess of the purchase price over the net tangible and identifiable intangible assets' fair value was recorded as goodwill within the Company’s Global Business Solutions segment. The goodwill recognized was attributable to increased synergies that are expected to be achieved from the integration of CardConnect as well as potential revenue enhancements to the Company.
The Company accounted for the business combination as follows:
(in millions) | ||||
Other current assets | $ | 58 | ||
Property and equipment | 7 | |||
Intangible assets | 463 | |||
Goodwill | 432 | |||
Current liabilities | (58 | ) | ||
Deferred tax liabilities | (139 | ) | ||
98
FIRST DATA CORPORATION
NOTES TO THE CONSOLIDATED FINANCIAL STATEMENTS (Continued)
The following table sets forth the components of the intangible assets associated with the acquisition as of the acquisition date:
(in millions) | Acquisition-Date Fair Value | Useful Life (Years) | ||||
Agent relationships | $ | 296 | 18 | |||
Merchant relationships | 84 | 7 | ||||
Software systems | 39 | 5 | ||||
Residual buyouts | 23 | 4 | ||||
Trade name | 21 | 9 | ||||
$ | 463 | |||||
In connection with the closing of the acquisition, the Company incurred $6 million of transactions costs, which has been included as deal and deal integration costs within "Other operating expenses" in the consolidated statement of operations for the year ended December 31, 2017.
The revenue and earnings of CardConnect have been included in the Company’s results since the acquisition date and are not material to the Company’s consolidated financial results. Supplemental pro forma results of operations of the combined entities have not been presented as the financial impact to the Company’s consolidated financial statements would be immaterial.
BluePay Acquisition
On December 1, 2017, the Company acquired 100% of BluePay Holdings, Inc. (BluePay) for $759 million in cash, net of cash acquired. BluePay is a provider of technology-enabled payment processing for merchants in the U.S. and Canada and was one of the Company's largest distribution partners with a strong focus on software-enabled payments and card-not-present transactions. The transaction is expected to be highly complementary to the Company's earlier acquisition of CardConnect and enhance the Company's suite of innovative partner management tools to improve merchant retention, accelerate the Company's firm-wide ISV initiative and bring immediate capabilities in ERP integrated payment solutions to its customers. BluePay operations are reported as part of the Company's Global Business Solutions segment.
The acquisition was accounted for as business combination and this accounting is substantially complete. In addition to the purchase price, the Company issued $26 million in the form of stock based compensation to certain key employees of BluePay, which is subject to service vesting conditions including continued employment with the Company. The value assigned to the common stock will be recorded as post-acquisition compensation expense and has been excluded from the total purchase price.
The following table summarizes the fair values of the assets acquired and liabilities assumed on the acquisition date. The excess of the purchase price over the net tangible and identifiable intangible assets' fair value was recorded as goodwill within the Company’s Global Business Solutions segment. The goodwill recognized was attributable to increased synergies that are expected to be achieved from the integration of BluePay as well as potential revenue enhancements to the Company.
The Company accounted for the business combination as follows:
(in millions) | ||||
Other current assets | $ | 27 | ||
Property and equipment | 3 | |||
Intangible assets | 450 | |||
Goodwill | 389 | |||
Current liabilities | (25 | ) | ||
Deferred tax liabilities | (85 | ) | ||
99
FIRST DATA CORPORATION
NOTES TO THE CONSOLIDATED FINANCIAL STATEMENTS (Continued)
The following table sets forth the components of the intangible assets associated with the acquisition as of the acquisition date:
(in millions) | Acquisition-Date Fair Value | Useful Life (Years) | ||||
Agent relationships | $ | 195 | 18 | |||
Merchant relationships | 216 | 10 | ||||
Software systems | 27 | 5 | ||||
Trade name | 12 | 5 | ||||
$ | 450 | |||||
In connection with the closing of the acquisition, the Company incurred $1 million of transactions costs, which has been included as deal and deal integration costs within "Other operating expenses" in the consolidated statement of operations for the year ended December 31, 2017.
The revenue and earnings of BluePay have been included in the Company’s results since the acquisition date and are not material to the Company’s consolidated financial results. Supplemental pro forma results of operations of the combined entities have not been presented as the financial impact to the Company’s consolidated financial statements would be immaterial.
Baltics Divestiture
On September 27, 2017, the Company divested all of its businesses in Lithuania, Latvia and Estonia for €73 million (approximately $85 million), subject to closing adjustments. The businesses were reported within the GFS segment.
Online Banking
On October 2, 2017, the Company formed a digital banking joint venture, named Apiture, which combines FDC and Live Oak Bancshares, Inc. digital banking platforms, products, and services, delivering innovative technology solutions tailored for financial institutions. The joint venture will be accounted for as an equity method investment, as Apiture is owned and managed equally between the Company and Live Oak Bancshares, Inc. As a result, the contributed digital banking business will no longer be consolidated into the Company’s results. During the twelve months ended December 31, 2016, the Company’s digital banking business had revenue and operating income of $57 million and $11 million, respectively. Associated with the transaction, the Company recognized a $18 million gain on the formation of the joint venture, included within "Other income" in the consolidated statement of operations. The gain recognized represents the excess investment value over assets contributed.
2016 Dispositions
On September 30, 2016, the Company completed the sale of its Australian ATM business, which was reported as part of the Company's Global Business Solutions segment. Associated with the transaction, the Company recognized a $34 million loss on the sale, included within "Other income" in the consolidated statement of operations. The loss is comprised of investments of $72 million reduced by cash proceeds of $38 million. The cash proceeds are reflected within "Proceeds from dispositions" within the consolidated statement of cash flows.
2015 Acquisitions
On June 9, 2015, the Company acquired Transaction Wireless, Inc. (TWI) a provider of digital stored value products that offers gift card programs, loyalty incentives, and integrated marketing solutions for retailers, partners, and consumers. The purchase price was approximately $62 million in cash. The acquisition is reported in the Company's Network & Security Solutions segment.
In addition to TWI, the Company also completed an acquisition of a webstore builder as well as an acquisition of a wholesale independent sales organization, both of which are reported in the Company's Global Business Solutions segment.
Note 13: Derivative Financial Instruments
The Company enters into the following types of derivatives:
• | Floating to fixed interest rate collar contracts: The Company uses interest rate collar contracts to mitigate its exposure to interest rate fluctuations on interest payments related to variable rate debt. No payments or receipts are exchanged on interest |
100
FIRST DATA CORPORATION
NOTES TO THE CONSOLIDATED FINANCIAL STATEMENTS (Continued)
rate collar contracts unless interest rates rise or fall to exceed a predetermined ceiling or floor rate. The Company uses these contracts in a qualifying hedging relationship.
• | Foreign exchange contracts: The Company uses cross-currency swaps to protect the net investment in certain foreign subsidiaries and/or affiliates with respect to changes in foreign currency exchange rates. The Company uses these contracts in both qualifying and non-qualifying hedging relationships. |
The Company held the following derivative instruments as of the dates indicated:
As of December 31, | ||||||||||||||||||||||||||
2017 | 2016 | |||||||||||||||||||||||||
(in millions) | Notional Currency | Notional Value | Assets (a) | Liabilities (a) | Notional Currency | Notional Value | Assets (a) | Liabilities (a) | ||||||||||||||||||
Derivatives designated as hedges of net investments in foreign operations: | ||||||||||||||||||||||||||
Foreign exchange contracts (c) | AUD | 100 | $ | 28 | $ | — | AUD | 211 | $ | 57 | $ | — | ||||||||||||||
Foreign exchange contracts (b) | EUR | 915 | — | 76 | EUR | — | — | — | ||||||||||||||||||
Foreign exchange contracts (c) | GBP | 150 | — | 6 | GBP | 300 | 78 | — | ||||||||||||||||||
Foreign exchange contracts (c) | CAD | 95 | — | 2 | CAD | 130 | 9 | — | ||||||||||||||||||
28 | 84 | 144 | — | |||||||||||||||||||||||
Derivatives designated as cash flow hedges: | ||||||||||||||||||||||||||
Interest rate collar contracts (d) | USD | 4,300 | 12 | — | USD | 3,000 | 3 | — | ||||||||||||||||||
$ | 40 | $ | 84 | $ | 147 | $ | — | |||||||||||||||||||
(a) | The Company's derivatives are subject to master netting agreements to the extent that the swaps are with the same counterparty. The terms of those agreements require that the Company net settle the outstanding positions at the option of the counterparty upon certain events of default. |
(b) | The Company entered into new foreign exchange contracts with a notional value of EUR 915 million on June 14, 2017. |
(c) | Three cross-currency swaps matured in April 2017 (notional values of AUD 111 million, GBP 150 million and CAD 35 million). The Company received $90 million related to these swaps. |
(d) The Company entered into new interest rate collar contracts with a notional value of $1.3 billion and $1.5 billion expiring in January 2019 and September 2018, respectively. The Company's remaining $1.5 billion interest rate collar contract expires in September 2019.
The maximum length of time over which the Company is hedging its currency exposure of net investments in foreign operations, through utilization of foreign exchange contracts, is through June 2020.
The maximum length of time over which the Company is hedging its exposure to the variability in future cash flows for forecasted transactions related to the payment of variable interest on existing financial instruments is through September 2019.
As of December 31, 2017, the Company has not posted any collateral related to any of its derivative financial instruments.
Fair Value Measurement
The carrying amounts for the Company's derivative financial instruments are the estimated fair value of the financial instruments. The Company’s derivatives are not exchange listed and therefore the fair value is estimated under an income approach using Bloomberg analytics models that are based on readily observable market inputs. These models reflect the contractual terms of the derivatives, such as notional value and expiration date, as well as market-based observables including interest and foreign currency exchange rates, yield curves, and the credit quality of the counterparties. The models also incorporate the Company’s creditworthiness in order to appropriately reflect non-performance risk. Inputs to the derivative pricing models are generally observable and do not contain a high level of subjectivity and, accordingly, the Company’s derivatives were classified within Level 2 of the fair value hierarchy. While the Company believes its estimates result in a reasonable reflection of the fair value of these instruments, the estimated values may not be representative of actual values that could have been realized or that will be realized in the future.
101
FIRST DATA CORPORATION
NOTES TO THE CONSOLIDATED FINANCIAL STATEMENTS (Continued)
Effect of Derivative Instruments on the Consolidated Financial Statements
Derivative gains and (losses) were as follows for the periods indicated:
Year ended December 31, | ||||||||||||||||||||||||
2017 | 2016 | 2015 | ||||||||||||||||||||||
(in millions, pretax) | Interest Rate Contracts | Foreign Exchange Contracts | Interest Rate Contracts | Foreign Exchange Contracts | Interest Rate Contracts | Foreign Exchange Contracts | ||||||||||||||||||
Derivatives designated as hedging instruments: | ||||||||||||||||||||||||
(Loss) gain recognized in "Foreign currency translation adjustment" in the consolidated statements of comprehensive income (loss) (effective portion) | $ | — | $ | (98 | ) | $ | — | $ | 58 | $ | — | $ | 79 | |||||||||||
Gain recognized in "Derivative instruments" in the consolidated statements of comprehensive income (loss) (effective portion) (a) | 9 | — | 3 | — | — | — | ||||||||||||||||||
Derivatives not designated as hedging instruments: | ||||||||||||||||||||||||
(Loss) gain recognized in "Other income" in the consolidated statements of operations | $ | — | $ | — | $ | (5 | ) | $ | — | $ | (19 | ) | $ | 2 | ||||||||||
(a) | Interest rate collar contracts. |
Accumulated Derivative Gains and Losses
The following table summarizes activity in other comprehensive income for the years ended December 31, 2017, 2016, and 2015 related to derivative instruments classified as cash flow hedges and net investment hedges held by the Company:
Year ended December 31, | ||||||||||||
(in millions, after tax) | 2017 | 2016 | 2015 | |||||||||
Accumulated gain included in other comprehensive income (loss) at beginning of the period | $ | 177 | $ | 116 | $ | 67 | ||||||
(Decrease) increase in fair value of derivatives that qualify for hedge accounting, net of tax (a) (b) | (56 | ) | 61 | 49 | ||||||||
Accumulated gain included in other comprehensive income at end of the period | $ | 121 | $ | 177 | $ | 116 | ||||||
(a) | Gains are included in "Derivative instruments" and “Foreign currency translation adjustment” on the consolidated statements of comprehensive income (loss). |
(b) | Net of $33 million and $0 million tax benefit for the years ended December 31, 2017 and 2016, respectively. Net of $30 million of the tax expense for the year ended December 31, 2015. |
Note 14: Commitments and Contingencies
Operating Leases
The Company leases certain of its facilities and equipment under operating lease agreements, substantially all of which contain renewal options and escalation provisions. The Company incurred total rent expense of $80 million, $79 million, and $78 million for the years ended December 31, 2017, 2016, and 2015, respectively. Future minimum aggregate rental commitments as of December 31, 2017 under all noncancelable operating leases, net of sublease income are due in the following years:
102
FIRST DATA CORPORATION
NOTES TO THE CONSOLIDATED FINANCIAL STATEMENTS (Continued)
Year ended December 31, (in millions) | Amount | |||
2018 | $ | 63 | ||
2019 | 59 | |||
2020 | 45 | |||
2021 | 39 | |||
2022 | 35 | |||
Thereafter | 105 | |||
Total | $ | 346 | ||
Sublease income is earned from leased space and leased equipment, which the Company concurrently subleases to third parties with comparable time periods. For the years ended December 31, 2017, 2016, and 2015 sublease amounts totaled less than $5 million in the Company's obligations. In addition, the Company has certain guarantees embedded in leases and other agreements wherein the Company is required to relieve the counterparty in the event of changes in the tax code or rates. The Company believes the fair value of such guarantees is insignificant due to the likelihood and extent of the potential changes.
Letters of Credit
The Company has $29 million in outstanding letters of credit as of December 31, 2017, all of which were issued under the Company’s senior secured revolving credit facility and expire prior to December 15, 2018 with a 1 year renewal option. The letters of credit are held in connection with lease arrangements, bankcard association agreements, and other security agreements. The Company expects to renew most of the letters of credit prior to expiration.
Legal
The Company is involved in various legal proceedings. Accruals have been made with respect to these matters, where appropriate, which are reflected in the Company’s consolidated financial statements. The Company may enter into discussions regarding settlement of these matters, and may enter into settlement agreements, if it believes settlement is in the best interest of the Company. The matters discussed below, if decided adversely to or settled by the Company, individually or in the aggregate, may result in liability material to the Company’s financial condition and/or results of operations.
There are asserted claims against the Company where an unfavorable outcome is considered to be reasonably possible. These claims can generally be categorized in the following areas: (1) patent infringement which results from claims that the Company is using technology that has been patented by another party; (2) merchant customer matters often associated with alleged processing errors or disclosure issues and claims that one of the subsidiaries of the Company has violated a federal or state requirement regarding credit reporting or collection in connection with its check verification guarantee, and collection activities; and (3) other matters which may include issues such as employment. The Company's estimates of the possible ranges of losses in excess of any amounts accrued are $0 to $5 million for patent infringement, $0 to $165 million for merchant customer matters, and $0 to $5 million for other matters, resulting in a total estimated range of possible losses of $0 to $175 million for all of the matters described above.
The estimated range of reasonably possible losses is based on information currently available and involves elements of judgment and significant uncertainties. As additional information becomes available and the resolution of the uncertainties becomes more apparent, it is possible that actual losses may exceed even the high end of the estimated range.
Other
In the normal course of business, the Company is subject to claims and litigation, including indemnification obligations to purchasers of former subsidiaries. Management of the Company believes that such matters will not have a material adverse effect on the Company’s results of operations, liquidity or financial condition.
103
FIRST DATA CORPORATION
NOTES TO THE CONSOLIDATED FINANCIAL STATEMENTS (Continued)
Note 15: Employee Benefit Plans
Defined Contribution Plans
The Company maintains defined contribution benefit plans covering virtually all of the Company’s U.S. employees and defined contribution pension plans for international employees primarily in the United Kingdom and Australia. The plans provide tax-deferred amounts for each participant, consisting of employee elective contributions, Company matching and discretionary Company contributions. Effective January 1, 2014, the Company suspended matching contributions for all U.S. participants. As a result, the U.S. Plan is no longer a safe harbor plan.
The following table presents the aggregate amounts charged to expense in connection with these plans:
Year ended December 31, (in millions) | Amount | |||
2017 | $ | 10 | ||
2016 | 11 | |||
2015 | 12 | |||
Defined Benefit Plans
The Company has defined benefit pension plans which are frozen and covers certain full-time employees in the United Kingdom and the U.S. The Company also has separate plans covering certain employees located primarily in Germany, Greece, and Austria.
The Company contributed cash in the amount of $19 million, $19 million, and $12 million to defined benefit plans for the years ended December 31, 2017, 2016, and 2015, respectively.
The Company recognizes the funded status of its defined benefit pension plans, measured as the difference between the fair value of the plan assets and the projected benefit obligation, in the consolidated balance sheets, as follows:
As of December 31, | ||||||||
(in millions) | 2017 | 2016 | ||||||
U.K. plan: | ||||||||
Plan benefit obligations | $ | (686 | ) | $ | (713 | ) | ||
Fair value of plan assets | 891 | 808 | ||||||
Net pension assets (a) | 205 | 95 | ||||||
U.S. and other foreign plans: | ||||||||
Plan benefit obligations | (234 | ) | (222 | ) | ||||
Fair value of plan assets | 166 | 137 | ||||||
Net pension liabilities (b) | (68 | ) | (85 | ) | ||||
Funded status of the plans | $ | 137 | $ | 10 | ||||
(a) | Pension assets are included in “Other long-term assets” of the consolidated balance sheets. |
(b) | Pension liabilities are included in “Other long-term liabilities” of the consolidated balance sheets. |
The accumulated benefit obligation for all defined benefit pension plans was $920 million and $935 million as of December 31, 2017 and 2016, respectively.
Based on the valuation techniques described in note 1 "Summary of Significant Accounting Policies," as of December 31, 2017, Plan assets are comprised of approximately 20% of Level 1 securities, 80% of Level 2 securities, and an immaterial amount of Level 3 securities which comprise less than 1% of total plan assets.
The Plan paid benefits in the amount of $59 million, $39 million, and $41 million for the periods ended December 31, 2017, 2016, and 2015, respectively. The estimated future benefit payments, which reflect expected future service, are expected to be as follows:
104
FIRST DATA CORPORATION
NOTES TO THE CONSOLIDATED FINANCIAL STATEMENTS (Continued)
Year ended December 31, (in millions) | Amount | |||
2018 | $ | 47 | ||
2019 | 48 | |||
2020 | 49 | |||
2021 | 50 | |||
2022 | 52 | |||
2023-2027 | 282 | |||
The Company's post-retirement health care and other insurance benefits for retired employees are limited and not material.
Note 16: Supplemental Financial Information
Supplemental Consolidated Statements of Operations Information
The following table details the components of “Other income” on the consolidated statements of operations:
Year ended December 31, | ||||||||||||
(in millions) | 2017 | 2016 | 2015 | |||||||||
Investment gains | $ | 1 | $ | 35 | $ | — | ||||||
Derivatives | — | (5 | ) | (17 | ) | |||||||
Divestitures | 18 | (34 | ) | 5 | ||||||||
Non-operating foreign currency (loss) gains | (1 | ) | 19 | 41 | ||||||||
Other miscellaneous (expense) income | (2 | ) | 2 | — | ||||||||
Other income | $ | 16 | $ | 17 | $ | 29 | ||||||
Investment gains
On June 21, 2016, Visa Inc. (Visa) acquired Visa Europe (VE), of which the Company was a member and shareholder through certain subsidiaries. On June 21, 2016, the Company received cash of €24.2 million ($27 million equivalent at June 21, 2016) and Visa preferred stock which is convertible into Visa common shares. The Company will also receive a deferred payment three years after the closing date of the acquisition, valued at approximately €2.3 million ($2.6 million equivalent at June 21, 2016). As of June 21, 2016, the Class A common stock equivalent of the preferred stock was approximately $19 million. However, the preferred shares have been assigned a value of zero based on transfer restrictions and Visa's ability to adjust the conversion ratio dependent on the outcome of existing and potential litigations in the Visa Europe territory over the next 11 years.
Divestitures
See note 12 "Acquisitions and Dispositions" of these consolidated financial statements for more information on the Company's significant divestitures.
105
FIRST DATA CORPORATION
NOTES TO THE CONSOLIDATED FINANCIAL STATEMENTS (Continued)
Supplemental Consolidated Balance Sheet Information
As of December 31, | ||||||||
(in millions) | 2017 | 2016 | ||||||
Prepaid expenses and other current assets: | ||||||||
Prepaid expenses | $ | 156 | $ | 168 | ||||
Inventory | 98 | 77 | ||||||
Other | 81 | 115 | ||||||
Total Prepaid expenses and other current assets | $ | 335 | $ | 360 | ||||
Property and equipment: | ||||||||
Land | $ | 58 | $ | 56 | ||||
Buildings | 270 | 269 | ||||||
Leasehold improvements | 96 | 89 | ||||||
Equipment and furniture | 1,508 | 1,386 | ||||||
Equipment under capital lease | 607 | 499 | ||||||
Property and equipment | 2,539 | 2,299 | ||||||
Less: Accumulated depreciation | (1,588 | ) | (1,416 | ) | ||||
Total Property and equipment, net of accumulated depreciation | $ | 951 | $ | 883 | ||||
Accounts payable and accrued liabilities: | ||||||||
Accounts payable | $ | 247 | $ | 206 | ||||
Accrued interest expense | 154 | 169 | ||||||
Other accrued expenses | 712 | 685 | ||||||
Other | 546 | 504 | ||||||
Total Accounts payable and accrued liabilities | $ | 1,659 | $ | 1,564 | ||||
Note 17: Investment in Affiliates
Segment results include the Company’s proportionate share of income from affiliates, which consist of unconsolidated investments accounted for under the equity method of accounting. The most significant of these affiliates are related to the Company’s merchant bank alliance program.
A merchant alliance, as it pertains to investments accounted for under the equity method, is an agreement between the Company and a financial institution that combines the processing capabilities and management expertise of the Company with the visibility and distribution channel of the bank. The alliance acquires credit and debit card transactions from merchants. The Company provides processing and other services to the alliance and charges fees to the alliance primarily based on contractual pricing. These fees have been separately identified on the face of the consolidated statements of operations.
As of December 31, 2017, there were sixteen affiliates accounted for under the equity method of accounting, comprised of five merchant alliances and eleven strategic investments in companies in related markets.
The Wells Fargo alliance met the Significant Subsidiary test provided in Regulations S-X Rule 1-02 (w) in that the Company's equity earnings of this alliance exceeded 20% of the Company's consolidated income from continuing operations before income taxes for the year ended December 31, 2017.
106
FIRST DATA CORPORATION
NOTES TO THE CONSOLIDATED FINANCIAL STATEMENTS (Continued)
A summary of financial information for the merchant alliances and other affiliates accounted for under the equity method of accounting is presented below:
As of December 31, | ||||||||
(in millions) | 2017 | 2016 | ||||||
Total current assets | $ | 5,427 | $ | 4,070 | ||||
Total long-term assets | 239 | 84 | ||||||
Total assets | $ | 5,666 | $ | 4,154 | ||||
Total current liabilities | $ | 5,347 | $ | 3,994 | ||||
Total long-term liabilities | 8 | 9 | ||||||
Total liabilities | $ | 5,355 | $ | 4,003 | ||||
The primary components of assets and liabilities are settlement-related accounts similar to those described in note 11 "Settlement Assets and Obligations" of these consolidated financial statements.
Year ended December 31, | ||||||||||||
(in millions) | 2017 | 2016 | 2015 | |||||||||
Net operating revenues | $ | 1,374 | $ | 1,434 | $ | 1,424 | ||||||
Operating expenses | 712 | 666 | 666 | |||||||||
Operating income | $ | 662 | $ | 768 | $ | 758 | ||||||
Net income | $ | 646 | $ | 749 | $ | 744 | ||||||
FDC equity earnings | 222 | 260 | 239 | |||||||||
The formation of a merchant alliance accounted for under the equity method of accounting generally involves the Company and/or a financial institution contributing merchant contracts to the alliance and a cash payment from one owner to the other to achieve the desired ownership percentages. The asset amounts reflected above are owned by the alliances and other equity method investees and do not include any of such payments made by the Company. The amount by which the total of the Company’s investments in affiliates exceeded its proportionate share of the investees’ net assets was approximately $0.9 billion and $1.0 billion as of December 31, 2017 and 2016, respectively.
The non-goodwill portion of this amount is considered an identifiable intangible asset that is amortized. The estimated future amortization expense for these intangible assets as of December 31, 2017 is as follows:
Year ended December 31, (in millions) | Amount | |||
2018 | $ | 29 | ||
2019 | 4 | |||
These amounts assume that these alliances continue as they currently exist. Much of the difference between the Company's proportionate share of the investees’ net income and the Company's equity earnings noted above relates to this amortization.
107
FIRST DATA CORPORATION
NOTES TO THE CONSOLIDATED FINANCIAL STATEMENTS (Continued)
Note 18: Selected Quarterly Financial Results (Unaudited)
The following tables show a summary of the Company’s quarterly financial information for each of the four quarters of 2017 and 2016:
2017 | ||||||||||||||||
(in millions, except per share amounts) | First | Second | Third | Fourth | ||||||||||||
Revenues | $ | 2,801 | $ | 3,025 | $ | 3,076 | $ | 3,150 | ||||||||
Expenses | 2,474 | 2,556 | 2,658 | 2,650 | ||||||||||||
Operating profit | $ | 327 | $ | 469 | $ | 418 | $ | 500 | ||||||||
Net income (loss) | $ | 79 | $ | 243 | $ | 340 | $ | 1,002 | ||||||||
Net income (loss) attributable to First Data Corporation | 36 | 185 | 296 | 948 | ||||||||||||
Net income (loss) per share: | ||||||||||||||||
Basic | 0.04 | 0.20 | 0.32 | 1.03 | ||||||||||||
Diluted | 0.04 | 0.20 | 0.31 | 1.00 | ||||||||||||
2016 | ||||||||||||||||
(in millions, except per share amounts) | First | Second | Third | Fourth | ||||||||||||
Revenues | $ | 2,777 | $ | 2,928 | $ | 2,936 | $ | 2,943 | ||||||||
Expenses | 2,539 | 2,498 | 2,482 | 2,463 | ||||||||||||
Operating profit | $ | 238 | $ | 430 | $ | 454 | $ | 480 | ||||||||
Net (loss) income | $ | (6 | ) | $ | 215 | $ | 200 | $ | 251 | |||||||
Net (loss) income attributable to First Data Corporation | (56 | ) | 152 | 132 | 192 | |||||||||||
Net (loss) income per share: | ||||||||||||||||
Basic | (0.06 | ) | 0.17 | 0.15 | 0.21 | |||||||||||
Diluted | (0.06 | ) | 0.17 | 0.14 | 0.21 | |||||||||||
(Sum of the quarters may not tie to FY due to rounding)
The change in net income during the fourth quarter of 2017 was primarily driven by the release of a valuation allowances associated with the Company's deferred tax assets.
Note 19: Subsequent Events
In January 2018, the Company stopped adjusting ISO Commissions Expense to revenue for segment reporting purposes. See note 7 "Segment Information" to our consolidated financial statements in Part II, Item 8 of this Form 10-K.
108
FIRST DATA CORPORATION
SCHEDULE II—Valuation and Qualifying Accounts
Additions | Deductions | ||||||||||||||||||||
Description (in millions) | Balance at Beginning of Period | Charged to Costs and Expenses | Reclassifications from Other Accounts (a) | Write-offs Against Assets | Balance at End of Period | ||||||||||||||||
Year ended December 31, 2017 deducted from receivables | $ | 87 | $ | 82 | $ | 1 | $ | 116 | $ | 54 | |||||||||||
Year ended December 31, 2016 deducted from receivables | 83 | 85 | 1 | 82 | 87 | ||||||||||||||||
Year ended December 31, 2015 deducted from receivables | 72 | 79 | 3 | 71 | 83 | ||||||||||||||||
(a) | Amounts related to reclassifications from "Accounts payable and accrued liabilities" to "Allowance for doubtful accounts" in the Company's consolidated balance sheets. |
109
ITEM 9. | CHANGES IN AND DISAGREEMENTS WITH ACCOUNTANTS ON ACCOUNTING AND FINANCIAL DISCLOSURE |
None.
ITEM 9A. | CONTROLS AND PROCEDURES |
Evaluation of Disclosure Controls and Procedures
We have evaluated, under the supervision of our Chief Executive Officer and our Chief Financial Officer, the effectiveness of disclosure controls and procedures as of December 31, 2017. This is done in order to ensure that information we are required to disclose in reports that are filed or submitted under the Securities Exchange Act of 1934 is recorded, processed, summarized, and reported within the time periods specified in SEC rules and forms.
Management’s Report on Internal Control over Financial Reporting
Report of Management
Our management is responsible for establishing and maintaining adequate internal control over financial reporting as defined in Rules 13a-15(f) and 15d-15(f) under the Securities Exchange Act of 1934. Our internal control over financial reporting is designed to provide reasonable assurance regarding the reliability of financial reporting and the preparation of financial statements for external purposes in accordance with generally accepted accounting principles.
Internal Control over Financial Reporting
Management is also responsible for establishing and maintaining effective internal control over financial reporting. Internal control over financial reporting is a process designed to provide reasonable assurance regarding the reliability of financial reporting and the preparation of financial statements for external purposes in accordance with U.S. generally accepted accounting principles. The Company’s internal control over financial reporting includes those policies and procedures that (1) pertain to the maintenance of records that, in reasonable detail, accurately and fairly reflect the transactions and dispositions of the assets of the Company; (2) provide reasonable assurance that transactions are recorded as necessary to permit preparation of financial statements in accordance with U.S. generally accepted accounting principles, and that receipts and expenditures of the Company are being made only in accordance with authorizations of management and directors of the Company; and (3) provide reasonable assurance regarding prevention or timely detection of unauthorized acquisition, use, or disposition of the Company’s assets that could have a material effect on the financial statements. Management recognizes that there are inherent limitations in the effectiveness of any internal control over financial reporting, including the possibility of human error and the circumvention or overriding of internal control. Accordingly, even effective internal control over financial reporting can provide only reasonable assurance with respect to financial statement preparation. Further, because of changes in conditions, the effectiveness of internal control over financial reporting may vary over time.
In order to ensure that the Company’s internal control over financial reporting is effective, management regularly assesses such controls and did so most recently as of December 31, 2017. This assessment was based on criteria for effective internal control over financial reporting described in Internal Control- Integrated Framework issued by the Committee of Sponsoring Organizations of the Treadway Commission (2013 framework). Based on this assessment, management believes the Company maintained effective internal control over financial reporting as of December 31, 2017.
Changes in Internal Control over Financial Reporting
In July 2017 and December 2017, we completed our acquisitions of CardConnect and BluePay, which are being integrated into our Global Business Solutions segment. As part of our ongoing integration activities, we are continuing to augment our company-wide controls to reflect the risks inherent in the acquisitions. Also, following the October 2017 announcement of the closure of our Denver and Houston locations, we commenced the migration of the majority of our tax and treasury activities and Telecheck business as well as portions of other functions. This migration continues to present transitional risks to maintaining adequate internal controls over financial reporting. Other than with respect to these acquisitions and closures, there were no changes in our internal control over financial reporting during the last fiscal quarter that has materially affected, or is reasonably likely to materially affect our internal control over financial reporting.
110
Report of Independent Registered Public Accounting Firm
The Board of Directors and Stockholders of First Data Corporation
Opinion on Internal Control over Financial Reporting
We have audited First Data Corporation’s internal control over financial reporting as of December 31, 2017, based on criteria established in Internal Control-Integrated Framework issued by the Committee of Sponsoring Organizations of the Treadway Commission (2013 framework) (the COSO criteria). In our opinion, First Data Corporation maintained, in all material respects, effective internal control over financial reporting as of December 31, 2017, based on the COSO criteria.
We also have audited, in accordance with the standards of the Public Company Accounting Oversight Board (United States) (PCAOB), the accompanying consolidated balance sheets of First Data Corporation as of December 31, 2017 and 2016, and the related consolidated statements of operations, comprehensive income (loss), cash flows and equity for each of the three years in the period ended December 31, 2017, and the related notes and financial statement schedules listed in the Index at Item 15(a) (collectively referred to as the "financial statements") of the Company and our report dated February 20, 2018 expressed an unqualified opinion thereon.
Basis for Opinion
The Company’s management is responsible for maintaining effective internal control over financial reporting and for its assessment of the effectiveness of internal control over financial reporting included in the accompanying Management’s Report on Internal Control over Financial Reporting. Our responsibility is to express an opinion on the Company’s internal control over financial reporting based on our audit. We are a public accounting firm registered with the PCAOB and are required to be independent with respect to the Company in accordance with the U.S. federal securities laws and the applicable rules and regulations of the Securities and Exchange Commission and the PCAOB.
We conducted our audit in accordance with the standards of the PCAOB. Those standards require that we plan and perform the audit to obtain reasonable assurance about whether effective internal control over financial reporting was maintained in all material respects.
Our audit included obtaining an understanding of internal control over financial reporting, assessing the risk that a material weakness exists, testing and evaluating the design and operating effectiveness of internal control based on the assessed risk, and performing such other procedures as we considered necessary in the circumstances. We believe that our audit provides a reasonable basis for our opinion.
Definition and Limitations of Internal Control Over Financial Reporting
A company’s internal control over financial reporting is a process designed to provide reasonable assurance regarding the reliability of financial reporting and the preparation of financial statements for external purposes in accordance with generally accepted accounting principles. A company’s internal control over financial reporting includes those policies and procedures that (1) pertain to the maintenance of records that, in reasonable detail, accurately and fairly reflect the transactions and dispositions of the assets of the company; (2) provide reasonable assurance that transactions are recorded as necessary to permit preparation of financial statements in accordance with generally accepted accounting principles, and that receipts and expenditures of the company are being made only in accordance with authorizations of management and directors of the company; and (3) provide reasonable assurance regarding prevention or timely detection of unauthorized acquisition, use, or disposition of the company’s assets that could have a material effect on the financial statements.
Because of its inherent limitations, internal control over financial reporting may not prevent or detect misstatements. Also, projections of any evaluation of effectiveness to future periods are subject to the risk that controls may become inadequate because of changes in conditions, or that the degree of compliance with the policies or procedures may deteriorate.
/s/ Ernst & Young LLP | |
Atlanta, Georgia | |
February 20, 2018 | |
111
ITEM 9B. | OTHER INFORMATION |
On February 15, 2018, the Board of Directors approved Amended and Restated By-laws to clarify that it may modify its committee structure from time to time such as by splitting the Governance, Compensation and Nominations Committee into two separate committees. A copy of the Amended and Restated By-laws is attached as Exhibit 3.2 to this Form 10-K.
PART III
ITEM 10. | DIRECTORS, EXECUTIVE OFFICERS, AND CORPORATE GOVERNANCE |
All information required by this Item is incorporated by reference to our Proxy Statement for the 2018 Annual Meeting of Shareholders to be filed with the U.S. Securities and Exchange Commission (SEC) within 120 days after December 31, 2017 and is incorporated herein by reference.
ITEM 11. | EXECUTIVE COMPENSATION |
The information required by this Item is incorporated by reference to our Proxy Statement for the 2018 Annual Meeting of Shareholders to be filed with the SEC within 120 days after December 31, 2017 and is incorporated herein by reference.
ITEM 12. | SECURITY OWNERSHIP OF CERTAIN BENEFICIAL OWNERS AND MANAGEMENT AND RELATED STOCKHOLDER MATTERS |
The information required by this Item is incorporated by reference to our Proxy Statement for the 2018 Annual Meeting of Shareholders to be filed with the SEC within 120 days after December 31, 2017 and is incorporated herein by reference.
ITEM 13. | CERTAIN RELATIONSHIPS AND RELATED TRANSACTIONS, AND DIRECTOR INDEPENDENCE |
The information required by this Item is incorporated by reference to our Proxy Statement for the 2018 Annual Meeting of Shareholders to be filed with the SEC within 120 days after December 31, 2017 and is incorporated herein by reference.
ITEM 14. | PRINCIPAL ACCOUNTANT FEES AND SERVICES |
The information required by this Item is incorporated by reference to our Proxy Statement for the 2018 Annual Meeting of Shareholders to be filed with the SEC within 120 days after December 31, 2017 and is incorporated herein by reference.
112
PART IV
ITEM 15. | EXHIBITS, FINANCIAL STATEMENT SCHEDULES |
(a) | The following documents are filed as part of this report: |
(1) | Financial Statements |
(2) | Financial Statement Schedules |
(3) Those exhibits required by Item 601 of Regulation S-K and by paragraph (b) below.
(b) | The following exhibits are filed as part of this Annual Report or, where indicated, were filed and are incorporated by reference: |
Incorporated by Reference | ||||||||||
Exhibit Number | Exhibit Description | Form | File Number | Exhibit Number | Filing Date | |||||
8-K | 1-11073 | 3.1 | 10/19/2015 | |||||||
8-K | 1-11073 | 3.1 | 12/27/2016 | |||||||
8-K | 1-11073 | 3.1 | 12/21/2017 | |||||||
3.2 (1) | ||||||||||
8-K | 1-11073 | 10.2 | 8/20/2012 | |||||||
8-K | 1-11073 | 10.2 | 10/2/2012 | |||||||
8-K | 1-11073 | 4.1 | 8/13/2015 | |||||||
8-K | 1-11073 | 4.1 | 11/20/2015 | |||||||
10-Q | 1-11073 | 10.8 | 11/14/2007 | |||||||
113
10-K | 1-11073 | 10.16 | 3/19/2013 | |||||||
S-1 | 1-11073 | 10.18 | 7/20/2015 | |||||||
10-K | 1-11073 | 10.21 | 3/10/2014 | |||||||
10-K | 1-11073 | 10.10 | 2/27/2015 | |||||||
10-Q | 1-11073 | 10.6 | 11/14/2007 | |||||||
8-K | 1-11073 | 10.3 | 5/25/2010 | |||||||
S-1 | 1-11073 | 10.16 | 7/20/2015 | |||||||
S-1 | 1-11073 | 10.17 | 7/20/2015 | |||||||
8-K | 1-11073 | 10.2 | 5/25/2010 | |||||||
8-K | 1-11073 | 10.1 | 10/19/2015 | |||||||
S-1/A | 1-11073 | 10.21 | 10/1/2015 | |||||||
S-1/A | 1-11073 | 10.22 | 10/1/2015 | |||||||
10-K | 1-11073 | 10.16 | 2/25/2016 | |||||||
10-K | 1-11073 | 10.17 | 2/25/2016 | |||||||
10-Q | 1-11073 | 10.2 | 5/8/2017 | |||||||
10-Q | 1-11073 | 10.1 | 11/9/2016 | |||||||
10-Q | 1-11073 | 10.2 | 11/9/2016 | |||||||
10-Q | 1-11073 | 10.3 | 11/9/2016 | |||||||
10-Q | 1-11073 | 10.1 | 5/11/2016 | |||||||
S-1/A | 1-11073 | 10.23 | 10/1/2015 | |||||||
114
10-K | 1-11073 | 10.11 | 2/27/2015 | |||||||
8-K | 1-11073 | 10.1 | 7/24/2017 | |||||||
S-4 | 1-11073 | 10.25 | 8/13/2008 | |||||||
8-K | 1-11073 | 10.1 | 9/24/2015 | |||||||
8-K | 1-11073 | 10.1 | 1/7/2016 | |||||||
8-K | 1-11073 | 10.1 | 7/6/2017 | |||||||
8-K | 1-11073 | 10.2 | 1/7/2016 | |||||||
10-K | 1-11073 | 10.28 | 2/24/2017 | |||||||
8-K | 1-11073 | 10.2 | 7/6/2017 | |||||||
21 (1) | ||||||||||
115
23.1 (1) | ||||||||||
23.2 (1) | ||||||||||
31.1 (1) | ||||||||||
31.2 (1) | ||||||||||
32.1 (1) | ||||||||||
32.2 (1) | ||||||||||
101.INS (1) | XBRL Instance Document | |||||||||
101.SCH (1) | XBRL Taxonomy Extension Schema Document | |||||||||
101.CAL (1) | XBRL Taxonomy Extension Calculation Linkbase Document | |||||||||
101.DEF (1) | XBRL Taxonomy Extension Definitions Linkbase Document | |||||||||
101.LAB (1) | XBRL Taxonomy Extension Label Linkbase Document | |||||||||
101.PRE (1) | XBRL Taxonomy Extension Presentation Linkbase Document | |||||||||
(1) | Filed herewith |
* | Management contracts and compensatory plans and arrangements required to be filed as exhibits pursuant to Item 15(b) of this report. |
(c) | The following financial statements are included in this annual report pursuant to Regulations S-X Rule 3-09: |
(1) | Wells Fargo Merchant Services, LLC |
(A Joint Venture)
Financial Statements
December 31, 2017, 2016 and 2015
(With Independent Auditors’ Report Thereon)
116
WELLS FARGO MERCHANT SERVICES, LLC |
(A Joint Venture) |
Financial Statements |
For the years ended December 31, 2017 and 2016 |
(With Independent Auditors’ Report Thereon) |
117
WELLS FARGO MERCHANT SERVICES, LLC
(A Joint Venture)
Financial Statements
December 31, 2017, 2016 and 2015
Table of Contents
Page | ||
Independent Auditors’ Report | 119 | |
Balance Sheet | 121 | |
Statement of Revenues and Expenses | 122 | |
Statement of Members’ Equity | 123 | |
Statement of Cash Flows | 124 | |
Notes to Financial Statements | 125 | |
118

KPMG LLP
Suite 1400
55 Second Street
San Francisco, CA 94105
Independent Auditors’ Report
The Members and Board of Directors
Wells Fargo Merchant Services, LLC:
We have audited the accompanying financial statements of Wells Fargo Merchant Services, LLC (the Company), which comprise the balance sheet as of December 31, 2017 and 2016, and the related statements of revenues and expenses, members’ equity, and cash flows for the years in the three-year period ended December 31, 2017, and the related notes to the financial statements.
Management’s Responsibility for the Financial Statements
Management is responsible for the preparation and fair presentation of these financial statements in accordance with U.S. generally accepted accounting principles; this includes the design, implementation, and maintenance of internal control relevant to the preparation and fair presentation of financial statements that are free from material misstatement, whether due to fraud or error.
Auditors’ Responsibility
Our responsibility is to express an opinion on these financial statements based on our audits. We conducted our audits in accordance with auditing standards generally accepted in the United States of America. Those standards require that we plan and perform the audit to obtain reasonable assurance about whether the financial statements are free from material misstatement.
An audit involves performing procedures to obtain audit evidence about the amounts and disclosures in the financial statements. The procedures selected depend on the auditors’ judgment, including the assessment of the risks of material misstatement of the financial statements, whether due to fraud or error. In making those risk assessments, the auditor considers internal control relevant to the entity’s preparation and fair presentation of the financial statements in order to design audit procedures that are appropriate in the circumstances, but not for the purpose of expressing an opinion on the effectiveness of the entity’s internal control. Accordingly, we express no such opinion. An audit also includes evaluating the appropriateness of accounting policies used and the reasonableness of significant accounting estimates made by management, as well as evaluating the overall presentation of the financial statements.
We believe that the audit evidence we have obtained is sufficient and appropriate to provide a basis for our audit opinion.
KPMG LLP is a Delaware limited liability partnership,
the U.S. member firm of KPMG International Cooperative
(“KPMG International”), a Swiss entity.
119
Opinion
In our opinion, the financial statements referred to above present fairly in all material respects, the financial position of Wells Fargo Merchant Services, LLC as of December 31, 2017 and 2016, and the results of its operations and its cash flows for each of the years in the three-year period ended December 31, 2017 in accordance with U.S. generally accepted accounting principles.

San Francisco, California February 12, 2018
120
WELLS FARGO MERCHANT SERVICES, LLC
(A Joint Venture)
Balance Sheet
December 31, 2017 and 2016
(Dollars in thousands, unless otherwise noted)
Assets | 2017 | 2016 | |||||
Cash and cash equivalents | $ | 41,455 | $ | 35,527 | |||
Settlement assets | 3,638,373 | 2,416,073 | |||||
Accounts receivable, net of reserve for merchant credit losses of | 569,143 | 490,666 | |||||
$5.4 million in 2017 and $5.4 million 2016 | |||||||
Intangibles | 751 | 797 | |||||
Other assets | 614 | 1,038 | |||||
Total assets | $ | 4,250,336 | $ | 2,944,101 | |||
Liabilities and Members’ Equity | |||||||
Settlement liabilities | $ | 3,576,837 | $ | 2,328,205 | |||
Accounts payable and accrued expenses | 71,376 | 62,391 | |||||
Interchange payable to Wells Fargo Bank, N.A. | 478,819 | 414,122 | |||||
Related party payable to First Data Merchant Services Corporation | 7,973 | 8,295 | |||||
Distribution payable to Wells Fargo Bank, N.A. | 66,444 | 75,898 | |||||
Distribution payable to First Data Merchant Services Corporation | 44,296 | 50,599 | |||||
Total liabilities | 4,245,745 | 2,939,510 | |||||
Members’ equity | 4,591 | 4,591 | |||||
Total liabilities and members’ equity | $ | 4,250,336 | $ | 2,944,101 | |||
See accompanying notes to financial statements.
121
WELLS FARGO MERCHANT SERVICES, LLC
(A Joint Venture)
Statement of Revenues and Expenses
December 31, 2017, 2016 and 2015
(Dollars in thousands, unless otherwise noted)
2017 | 2016 | 2015 | |||||||||
Revenues: | |||||||||||
Card services revenue, net of $6.8 billion, $5.5 billion and $4.3 billion in interchange and assessments in 2017, 2016 and 2015, respectively | $ | 731,843 | $ | 786,803 | $ | 762,608 | |||||
Product sales revenue | 29,032 | 50,359 | 70,635 | ||||||||
Other revenue | 84,951 | 69,030 | 60,777 | ||||||||
Net revenue | 845,826 | 906,192 | 894,020 | ||||||||
Expenses: | |||||||||||
Cost of card services | 249,362 | 222,790 | 202,769 | ||||||||
Cost of product sold | 12,016 | 15,536 | 21,464 | ||||||||
Selling, general and administrative | 135,964 | 135,546 | 145,197 | ||||||||
Other expenses | 11,819 | 9,721 | 11,160 | ||||||||
Total expenses | 409,161 | 383,593 | 380,590 | ||||||||
Net operating income | 436,665 | 522,599 | 513,430 | ||||||||
Interest income | 1,528 | 788 | 695 | ||||||||
Net income | $ | 438,193 | $ | 523,387 | $ | 514,125 | |||||
See accompanying notes to financial statements.
122
WELLS FARGO MERCHANT SERVICES, LLC
(A Joint Venture)
Statement of Members' Equity
December 31, 2017, 2016 and 2015
(Dollars in thousands, unless otherwise noted)
Wells Fargo Bank, N.A. | First Data Merchant Services Corporation | Total | |||||||||
Members’ equity at December 31, 2014 | $ | 2,755 | $ | 1,836 | $ | 4,591 | |||||
Net income | 308,475 | 205,650 | 514,125 | ||||||||
Distributions to members | (308,475 | ) | (205,650 | ) | (514,125 | ) | |||||
Members’ equity at December 31, 2015 | 2,755 | 1,836 | 4,591 | ||||||||
Net income | 314,032 | 209,355 | 523,387 | ||||||||
Distributions to members | (314,032 | ) | (209,355 | ) | (523,387 | ) | |||||
Members’ equity at December 31, 2016 | 2,755 | 1,836 | 4,591 | ||||||||
Net income | 262,916 | 175,277 | 438,193 | ||||||||
Distributions to members | (262,916 | ) | (175,277 | ) | (438,193 | ) | |||||
Members’ equity at December 31, 2017 | $ | 2,755 | $ | 1,836 | $ | 4,591 | |||||
See accompanying notes to financial statements.
123
WELLS FARGO MERCHANT SERVICES, LLC
(A Joint Venture)
Statement of Cash Flows
December 31, 2017, 2016 and 2015
(Dollars in thousands, unless otherwise noted)
2017 | 2016 | 2015 | |||||||||
Cash flows from operating activities: | |||||||||||
Net income | $ | 438,193 | $ | 523,387 | $ | 514,125 | |||||
Adjustments to reconcile net income to net cash provided | |||||||||||
by operating activities: | |||||||||||
Amortization of intangibles | 398 | 322 | 318 | ||||||||
Provisions for credit losses | 12,361 | 12,220 | 13,108 | ||||||||
Changes in operating assets and liabilities: | |||||||||||
Settlement assets | (1,222,299 | ) | (1,158,042 | ) | (212,497 | ) | |||||
Accounts receivable, net of reserve for merchant credit losses | (90,838 | ) | (102,059 | ) | (97,490 | ) | |||||
Other assets | 424 | (895 | ) | (132 | ) | ||||||
Settlement liabilities | 1,248,632 | 1,156,390 | 194,672 | ||||||||
Accounts payable and accrued expenses | 8,985 | 18,439 | 13,487 | ||||||||
Interchange Payable to Wells Fargo Bank, N.A. | 64,697 | 73,685 | 59,455 | ||||||||
Related Party Payable to First Data Merchant Services Corporation | (322 | ) | (14,905 | ) | 9,536 | ||||||
Net cash provided by operating activities | 460,231 | 508,542 | 494,582 | ||||||||
Cash flows from investing activities: | |||||||||||
Signing bonus on executed contract | (352 | ) | (662 | ) | (296 | ) | |||||
Net cash used in investing activities | (352 | ) | (662 | ) | (296 | ) | |||||
Cash flows from financing activities: | |||||||||||
Distributions to members | (453,951 | ) | (524,442 | ) | (506,600 | ) | |||||
Net cash used in financing activities | (453,951 | ) | (524,442 | ) | (506,600 | ) | |||||
Increase/(Decrease) in cash and cash equivalents | 5,928 | (16,562 | ) | (12,314 | ) | ||||||
Cash and cash equivalents at beginning of year | 35,527 | 52,089 | 64,403 | ||||||||
Cash and cash equivalents at end of year | $ | 41,455 | $ | 35,527 | $ | 52,089 | |||||
See accompanying notes to financial statements.
124
WELLS FARGO MERCHANT SERVICES, LLC
(A Joint Venture)
Notes to the Financial Statements
December 31, 2017, 2016 and 2015
(Dollars in thousands, unless otherwise noted)
(1) | Business Description |
Wells Fargo Merchant Services, LLC (the Company) is a joint venture between First Data Merchant Services Corporation (FDMS) and Wells Fargo Bank, N.A. (Wells Fargo). FDMS is a fully owned subsidiary of First Data Corporation. The Company was established pursuant to the terms of an alliance agreement (the Membership Agreement) dated November 1, 1993, as amended and a Limited Liability Company Agreement dated September 1, 1997, as amended. The Membership Agreement will terminate on December 31, 2019. FDMS and Wells Fargo are here-in-after referred to, individually, as a Member or, collectively, as Members.
The Company is engaged in processing and funds transfer services related to the authorization, processing, and settlement of credit and debit card transactions for merchants. A majority of its revenue is based on the dollar amount of transactions processed. The Company primarily provides services to merchant customers within all 50 states, with a significant concentration in California. The Company is operationally dependent on both FDMS and Wells Fargo. The Company’s primary operations are conducted through FDMS. The Company’s funding and settlement are primarily conducted through Wells Fargo. The majority of the bank accounts used for daily operations are with Wells Fargo.
(2) | Summary of Significant Accounting Policies |
(a) | Use of Estimates |
The preparation of financial statements in conformity with U.S. generally accepted accounting principles requires management to make estimates and assumptions that affect the reported amounts of assets and liabilities and disclosures of contingent assets and liabilities at the date of the financial statements and the reported amounts of revenues and expenses during the reporting period. Actual results could differ from the estimates. Items subject to such estimates and assumptions include the reserve for merchant credit and fee losses.
(b) | Settlement Assets and Liabilities |
1) The Company has a fiduciary responsibility to its merchant customers as it relates to the transfer of funds from a cardholder’s issuing bank, via the VISA, MasterCard, American Express or Discover card companies (the Card Networks) and the Accel, AFFN, Alaska Option, ATH, CULIANCE, Interlink, Jeanie, Maestro, NYCE, Pulse, NETS, Shazam, and Star Debit Networks (the Debit Networks). The Company records such amounts due from the issuing banks, Card Networks and Debit Networks within the balance sheet caption settlement assets while the related liability, settlement liabilities, represents amounts due to merchants. Pursuant to the Card Networks’ and Debit Networks’ rules, such fiduciary funds are not available to support the operations of the Company.
2) When a cardholder or a credit issuing institution disputes a transaction, within the Card Network guidelines, the Company’s merchant customers have a liability for the disputed charges. However, in the case of merchant fraud, insolvency or bankruptcy, the Company may also be liable. Fee receivables that are ultimately deemed as uncollectable are charged-off against the merchant credit and loss reserve.
The Company’s determination of the level of the reserve is calculated based on the level of sales volumes multiplied by loss factors taking into consideration charge-offs, recoveries and merchant collateral and rests upon various judgments and assumptions, including the review of historical data and a specific analysis of receivables due from merchants. Our charge-off policy is to fully charge down the balance when the receivable is 60 days past due. The Company requires cash deposits, guarantees, letters of credit or other types of collateral by certain merchants to minimize its credit risk. Included in the balance sheet’s settlement assets is $78 million and $124.1 million in Merchant collateral, as of December 31, 2017 and 2016, respectively. Merchant collateral represents restricted cash held by the Company in a Wells Fargo bank account. The reserve for merchant credit losses is a valuation allowance for probable losses inherent as of the balance sheet date. The Company considers the reserve for merchant credit losses adequate to cover losses inherent in the portfolio as of December 31, 2017 and 2016.
125
WELLS FARGO MERCHANT SERVICES, LLC
(A Joint Venture)
Notes to the Financial Statements
December 31, 2017, 2016 and 2015
(Dollars in thousands, unless otherwise noted)
(c) | Cash and Cash Equivalents |
The Company considers all highly liquid investments with a maturity of three months or less when purchased to be cash equivalents. At December 31, 2017 and 2016, the majority of the Company’s cash and cash equivalents were held in Wells Fargo accounts and are FDIC insured.
(d) | Intangibles |
The Company capitalizes initial payments for new contracts, contract renewals and conversion costs associated with customer processing relationships to the extent recoverable through future operations, contractual minimums and/or penalties in the case of early termination. The Company’s accounting policy is to limit the amount of capitalized costs for a given contract to the lesser of the estimated ongoing future cash flows from the contract or the termination fees the Company would receive in the event of early termination of the contract by the customer. The company amortizes intangibles over the period of the contract.
(e) | Accounts Payable and Accrued Expenses |
The Company accrues for certain expenses that have been incurred. These estimates are classified within accounts payable and accrued expenses in the balance sheet.
126
WELLS FARGO MERCHANT SERVICES, LLC
(A Joint Venture)
Notes to the Financial Statements
December 31, 2017, 2016 and 2015
(Dollars in thousands, unless otherwise noted)
(f) | Income Taxes |
No provision is made in the accounts of the Company for federal or state income taxes because all items of income and expense and other items affecting taxable income are allocated to the Members for inclusion in their income tax returns.
In accounting for income taxes, the Company follows the guidance in FASB ASC 740 (formerly FASB Interpretation No. 48), as amended by ASU 2009-06, Accounting for Uncertainty in Income Taxes. ASC 740 requires the Company to determine whether a tax position of the Company is more likely than not to be sustained upon examination by the applicable taxing authority, including resolution of any related appeals or ligation processes, based on the technical merits of the position. The tax benefit to be recognized is measured as the largest amount of benefit that is greater than fifty percent likely of being realized upon ultimate settlement which could result in the Company recording a tax liability that would reduce net assets. ASC 740 also provides guidance on thresholds, measurement, de-recognition, classification, interest and penalties, accounting in interim periods, disclosure, and transition that is intended to provide better financial statement comparability among different entities. As an LLC and pass-through entity, the Company does not incur tax expense and is not required to record a tax provision related to uncertain tax positions, in accordance with the recognition, measurement, classification, and disclosure requirements of ASC 740-10. The U.S. is the major tax jurisdiction for the Company. The tax returns of the Company can be examined by the relevant taxing authorities until the applicable statute of limitations has expired, which is generally three to four years from the date the return is initially filed, depending on the specific jurisdiction. Based on analysis by the Company, there were no material positions identified which did not meet the "more likely than not" standard as of and for the years ended December 31, 2017 and 2016.
(g) | Members’ Equity |
An equity account is maintained for each Member. In certain instances, the Members may be required to make additional contributions to the Company. Such contributions will be determined on a pro-rata basis in accordance with each Member’s membership interest at the time of the request and will be added to the Member’s equity account. Membership interest is defined as the ownership percentage of the Company by each member.
127
WELLS FARGO MERCHANT SERVICES, LLC
(A Joint Venture)
Notes to the Financial Statements
December 31, 2017, 2016 and 2015
(Dollars in thousands, unless otherwise noted)
(h) | Revenue Recognition |
The Company recognizes card services revenues from its transaction processing and authorization services as such services are performed. The revenues from transaction processing and authorization services are included in card services revenue in the statement of revenue and expenses. The Company recognizes revenue when the price is fixed or determinable, persuasive evidence of an arrangement exists, the service is performed and collectability of the resulting receivable is reasonably assured. Certain revenues are recorded net of certain costs not controlled by the Company, including interchange and assessment fees charged by the Card Networks. These revenues totaled $7.1 billion, $6 billion and $4.7 billion for the years ended December 31, 2017, 2016 and 2015 and associated costs totaled $6.8 billion, $5.5 billion and $4.3 billion for the years ended December 31, 2017, 2016 and 2015.
Debit revenues are recorded gross and are included within card services revenue in the statement of revenues and expenses. Debit network fees are recorded within cost of card services in the statement of revenues and expenses. Debit revenues are recognized as such services are performed. Debit network fees totaled $121.9 million, $110.1 million and $105.2 million for the years ended December 31, 2017, 2016 and 2015 and associated revenues totaled $153.8 million, $139.5 million and $126.9 million for the years ended December 2017, 2016 and 2015.
The Company recognizes product revenue from merchant referred leases, rentals and sales as such services are performed. These revenues totaled $29 million, $50.4 million and $70.6 million for the years ended December 31, 2017, 2016 and 2015 and are classified within Product Revenue. The Company records expense associated with the corresponding charge from affiliates of FDMS. These expenses totaled $12 million, $15.5 million and $21.5 million for the years ended December 31, 2017, 2016 and 2015 and are classified within Cost of product sold.
In addition to the above, the Company recognizes other fees for services as such services are performed. The other revenue caption on the statement of revenues and expenses includes relevant items such as monthly fees, new account fees, income from cash advances, chargeback fees, supply fees and early termination fees.
(i) | Comprehensive Income |
For the year ended December 31, 2017, 2016 and 2015 net income equals comprehensive income.
(j) New Accounting Pronouncements
Revenue Recognition
In May 2014, the Financial Accounting Standards Board (FASB) issued guidance that requires companies to recognize revenue to depict the transfer of goods or services to customers in amounts that reflect the consideration to which the Company expects to be entitled in an exchange for those goods or services. It also requires enhanced disclosures about revenue, provides guidance for transactions that were not previously addressed comprehensively, and improves guidance for multiple-element arrangements. The FASB has subsequently issued several amendments to the standard, including clarification on accounting for licenses, identifying performance obligations, and principal versus agent consideration (reporting revenue gross vs. net). The Company has not yet determined the effect of the new standard on its current policies for revenue recognition, its presentation of revenue in the financial statements or additional disclosures as it is not required to implement the new standard until January 1, 2019.
Leases
In February 2016, the FASB issued guidance which requires lessees to put most leases on their balance sheets. The guidance also modifies the classification criteria and the accounting for sales-type and direct financing leases for lessors and provides new presentation and disclosure requirements for both lessees and lessors. The standard is effective for financial statements issued by public business entities for fiscal years beginning after December 15,
128
2018, and interim periods within those fiscal years. Early adoption is permitted in any interim or annual period subsequent to adoption of the preceding revenue recognition guidance. The Company is currently evaluating the impact of adoption of the new guidance on its financial statements.
Credit Losses
In June 2016, the FASB issued guidance that will change the accounting for credit impairment. Under the new guidance, companies are required to measure all expected credit losses for financial instruments held at the reporting date based on historical experience, current conditions and reasonable supportable forecasts. This replaces the existing incurred loss model and is applicable to the measurement of credit losses on financial assets measured at amortized cost and applies to some off-balance sheet credit exposures. This new guidance will be effective for public business entities for fiscal years beginning after December 15, 2019, including interim periods within those fiscal years. Early adoption is permitted for fiscal years beginning after December 15, 2018.
Statement of Cash Flows
In November 2016, the FASB issued guidance that will change the presentation of restricted cash and restricted cash equivalents on the statement of cash flows. Under the new guidance, companies will be required to include restricted cash and restricted cash equivalents with the cash and cash equivalents line item when reconciling beginning-of-period and end-of-period total amounts shown on the statement of cash flows. Given this change, transfers between cash, cash equivalents, and restricted cash and cash equivalents will not be reported as cash flow activities on the statement of cash flows. In addition, the guidance requires entities to disclose information about the nature of restrictions on its cash and cash equivalents, including restricted cash and cash equivalents. The new guidance will be effective for public business entities for fiscal years beginning after December 15, 2017, including interim periods within those fiscal years. The Company is currently evaluating the impact of the new guidance on its financial statements.
129
WELLS FARGO MERCHANT SERVICES, LLC
(A Joint Venture)
Notes to the Financial Statements
December 31, 2017, 2016 and 2015
(Dollars in thousands, unless otherwise noted)
(3) | Intangibles |
Following is a summary of the Company’s intangibles for the years ended December 31, 2017, 2016 and 2015:
Intangible Assets, Gross of Accumulated Amortization | Accumulated Amortization | Intangible Assets, Net of Accumulated Amortization | ||||||
Beginning balance as of January 1, 2017 | $ | 2,544 | $ | (1,747) | $ | 797 | ||
Additions | 352 | — | 352 | |||||
Retirements | — | — | — | |||||
Amortization | — | (398) | (398) | |||||
Ending balance as of December 31, 2017 | $ | 2,896 | $ | (2,145) | $ | 751 | ||
Beginning balance as of January 1, 2016 | $ | 2,266 | $ | (1,809) | $ | 457 | ||
Additions | 662 | — | 662 | |||||
Retirements | (384) | 384 | — | |||||
Amortization | — | (322) | (322) | |||||
Ending balance as of December 31, 2016 | $ | 2,544 | $ | (1,747) | $ | 797 | ||
Beginning balance as of January 1, 2015 | $ | 2,309 | $ | (1,830) | $ | 479 | ||
Additions | 296 | — | 296 | |||||
Retirements | (339) | 339 | — | |||||
Amortization | — | (318) | (318) | |||||
Ending balance as of December 31, 2015 | $ | 2,266 | $ | (1,809) | $ | 457 | ||
For the years ended December 31, 2017, 2016 and 2015, amortization expense of $398, $322, and $318, respectively, is included in other expenses in the statement of revenues and expenses.
(4) | Related Party Transactions |
The Company’s primary operations are conducted through FDMS. FDMS charges the Company fees for services provided pursuant to an operating agreement (the Operating Agreement) dated January 31, 2000, as amended and restated. The Members also agreed to perform certain additional management functions (the Additional Services) of the Company, for which they will be reimbursed by the Company. These fees are included in cost of card services, cost of product sold (including expenses associated with merchant referred leases, rentals and sales from affiliates of FDMS) and selling, general and administrative expenses within the statement of revenue and expense for both Members. The financial statements may not necessarily be indicative of the financial position that would have existed, or the results of operations or cash flows that would have occurred had the Company operated as an independent enterprise. During the years ended December 31, 2017, 2016 and 2015, the Company reimbursed FDMS and Wells Fargo for performing the Additional Services as follows:
130
WELLS FARGO MERCHANT SERVICES, LLC
(A Joint Venture)
Notes to the Financial Statements
December 31, 2017, 2016 and 2015
(Dollars in thousands, unless otherwise noted)
2017 | |||||
First Data Merchant Services, Corporation | Wells Fargo Bank, NA | ||||
Cost of card services | $ | 107,971 | $ | — | |
Cost of product sold | 12,016 | — | |||
Selling, general and administrative | 7,997 | 127,967 | |||
Total | $ | 127,984 | $ | 127,967 | |
2016 | |||||
First Data Merchant Services, Corporation | Wells Fargo Bank, NA | ||||
Cost of card services | $ | 92,161 | $ | — | |
Cost of product sold | 15,536 | — | |||
Selling, general and administrative | 11,766 | 123,780 | |||
Total | $ | 119,463 | $ | 123,780 | |
2015 | |||||
First Data Merchant Services, Corporation | Wells Fargo Bank, NA | ||||
Cost of card services | $ | 76,686 | $ | — | |
Cost of product sold | 21,464 | — | |||
Selling, general and administrative | 14,324 | 130,873 | |||
Total | $ | 112,474 | $ | 130,873 | |
Included in the balance sheets at December 31, 2017 and 2016 is a payable to FDMS of $7,973 and $8,295, respectively. These balances primarily consist of selling, general and administrative costs, cost of card services, and cost of product sold owed to FDMS which are partially offset by net revenue owed to WFMS for the contributed portfolio. These balances are settled monthly, one month in arrears.
Included in the balance sheets at December 31, 2017 and 2016 is a payable to Wells Fargo of $478,819 and $414,122, respectively, which is primarily attributable to non-interest bearing advances, made by Wells Fargo to the Company, to fund interchange settlements with Card Networks. These payable amounts are settled monthly, one month in arrears.
(5) | Allocation and Distribution of Income to Members |
Profits and losses of the Company are allocated in accordance with each Member’s Interest. Distributions of allocated income to the Members are made on a quarterly basis, subject to consent of the Members. Income distributed shall equal 100% of the distributable funds, as defined in the Membership Agreement, unless a smaller percentage is agreed to by the Members.
131
WELLS FARGO MERCHANT SERVICES, LLC
(A Joint Venture)
Notes to the Financial Statements
December 31, 2017, 2016 and 2015
(Dollars in thousands, unless otherwise noted)
(6) | Termination of Company |
The Company can be terminated in the event of certain termination events, set forth in the Membership Agreement with an effective date of January 1, 2014. These include merger or acquisition of either of the Members, and various other performance criteria. If the Company is terminated prior to December 31, 2019, based on who initiates the termination, an early termination fee may apply in accordance with the provisions and criteria of the agreement.
(7) | Limited Liability of Members |
The Members of a Delaware limited liability company are generally not liable for the acts and omissions of the Company, much in the same manner as the shareholders, officers and directors of a corporation are generally not liable for the acts and omissions of the corporation. Such liability is generally limited by the provisions of the Delaware Limited Liability Company Act and by applicable case law.
(8) | Fair Value of Financial Instruments |
FASB ASC 825, Financial Instruments, requires the disclosure of the fair value of financial instruments, including assets and liabilities recognized in the balance sheets. Management estimates that the aggregate fair value of financial instruments recognized in the balance sheets (including receivables, payables and merchant collateral) approximates their carrying value; as such financial instruments are short-term in nature or carry floating rates of interest.
(9) | Guarantees and Reserve for Merchant Credit Losses |
Under the card companies’ rules, when a merchant processor acquires card transactions, it has certain liabilities for the transactions. This liability arises from disputes between cardholders and merchants due to the cardholders’ dissatisfaction with merchandise quality or the merchants’ service, which are not resolved with the merchant. In such cases, the transactions are charged back to the respective merchants and the related purchase amounts are refunded to the cardholders by the card issuer. If the merchant does not fund the refund due to insolvency, bankruptcy or other extraneous reasons, the Company, in certain circumstances is liable for the full amount of the transaction. This liability is considered a guarantee under FASB ASC 460, Guarantees.
The Company’s legal obligation under these rules is to settle any individual chargeback for which an individual merchant fails to fulfill as noted above. Contractually, the maximum exposure for this obligation is the total amount of transactions processed for the preceding four month period for all merchants, which in the case of the Company is in the billions of dollars. It should be noted that the Company has not experienced material chargeback loss activity as a result of merchant processing activities and advises that caution should be used when assessing the maximum exposure described above. The Company records a provision for this estimated obligation based upon a number of factors which include historical losses, credit risk of specific customers and other relevant factors. As shown below, for the years ended December 2017, 2016 and 2015, the Company incurred aggregate merchant credit losses of $12,367, $11,982 and $12,430, net of recoveries, on total processed volumes. The Company calculates its provision and evaluates the appropriateness of its reserves on a monthly basis.
132
WELLS FARGO MERCHANT SERVICES, LLC
(A Joint Venture)
Notes to the Financial Statements
December 31, 2017, 2016 and 2015
(Dollars in thousands, unless otherwise noted)
The following is the activity related to the reserve for merchant credit losses for the years ended December 31, 2017, 2016 and 2015:
Beginning balance as of January 1, 2017 | $ | 5,423 | |
Provisions for credit loss | 12,361 | ||
Charge-offs, net of recoveries of $840 | (12,367 | ) | |
Ending balance as of December 31, 2017 | $ | 5,417 | |
Beginning balance as of January 1, 2016 | $ | 5,185 | |
Provisions for credit loss | 12,220 | ||
Charge-offs, net of recoveries of $797 | (11,982 | ) | |
Ending balance as of December 31, 2016 | $ | 5,423 | |
Beginning balance as of January 1, 2015 | $ | 4,507 | |
Provisions for credit loss | 13,108 | ||
Charge-offs, net of recoveries of $696 | (12,430 | ) | |
Ending balance as of December 31, 2015 | $ | 5,185 | |
(10) | Commitments and Contingencies |
The Company is involved in various legal proceedings. Accruals have been made with respect to these matters, where appropriate, which are reflected in the Company’s financial statements. The Company may enter into discussions regarding settlement of these matters and may enter into settlement agreements, if it believes settlement is in the best interest of the Company. The matters discussed below, if decided adversely to or settled by the Company, individually or in the aggregate, may result in liability material to the Company’s financial condition and/or results of operations. There are asserted claims against the Company where an unfavorable outcome is considered to be reasonably possible. These claims can generally be categorized as matters related to our merchant business.
The Company’s estimates of the possible ranges of losses in excess of any amounts accrued are $0 to $17 million for merchant and other matters. The estimated range of reasonably possible losses was based on information currently available and involves elements of judgment and significant uncertainties. As additional information becomes available and the resolution of the uncertainties becomes more apparent, it is possible that actual losses may exceed the high end of the estimated range.
(11) | Subsequent Events |
The Company has evaluated the subsequent events from the balance sheet date through February 12, 2018, the date at which the financial statements were available to be issued, and determined that there are no other items to disclose.
133
Pursuant to the requirements of Section 13 or 15(d) of the Securities Exchange Act of 1934, the registrant has duly caused this report to be signed on its behalf by the undersigned, thereunto duly authorized.
FIRST DATA CORPORATION | ||
(Registrant) | ||
By: | /S/ FRANK BISIGNANO | |
Frank Bisignano | ||
Chief Executive Officer | ||
Date: | February 20, 2018 | |
134
Pursuant to the requirements of the Securities Exchange Act of 1934, this report has been signed below by the following persons on behalf of the registrant and in the capacities and on the dates indicated:
Name | Title | Date | ||
/S/ FRANK BISIGNANO | Chief Executive Officer and Director | February 20, 2018 | ||
Frank Bisignano | (principal executive officer) | |||
/S/ HIMANSHU A. PATEL | Executive Vice President, Chief Financial Officer | February 20, 2018 | ||
Himanshu A. Patel | (principal financial officer) | |||
/S/ MATTHEW CAGWIN | Senior Vice President, Corporate Controller and Chief Accounting Officer | February 20, 2018 | ||
Matthew Cagwin | (principal accounting officer) | |||
/S/ HENRIQUE DE CASTRO | Director | February 20, 2018 | ||
Henrique De Castro | ||||
/S/ HENRY R. KRAVIS | Director | February 20, 2018 | ||
Henry R. Kravis | ||||
/S/ HEIDI G. MILLER | Director | February 20, 2018 | ||
Heidi G. Miller | ||||
/S/ JAMES E. NEVELS | Director | February 20, 2018 | ||
James E. Nevels | ||||
/S/ SCOTT C. NUTTALL | Director | February 20, 2018 | ||
Scott C. Nuttall | ||||
/S/ TAGAR C. OLSON | Director | February 20, 2018 | ||
Tagar C. Olson | ||||
/S/ JOSEPH J. PLUMERI | Director | February 20, 2018 | ||
Joseph J. Plumeri | ||||
/S/ BARBARA A. YASTINE | Director | February 20, 2018 | ||
Barbara A. Yastine | ||||
135