Attached files
| file | filename |
|---|---|
| EX-99.1 - EX-99.1 - Matson, Inc. | ex-99d1.htm |
| 8-K - 8-K - Matson, Inc. | f8-k.htm |
Exhibit 99.2
|
|
Fourth Quarter and Full Year 2017 Earnings Conference Call |
|
|
Forward Looking Statements Statements made during this call and presentation that set forth expectations, predictions, projections or are about future events are based on facts and situations that are known to us as of today, February 20, 2018. We believe that our expectations and assumptions are reasonable. Actual results may differ materially, due to risks and uncertainties, such as those described on pages 11-18 of our 2016 Form 10-K filed on February 24, 2017, and other subsequent filings by Matson with the SEC. Statements made during this call and presentation are not guarantees of future performance. We do not undertake any obligation to update our forward-looking statements. |
|
|
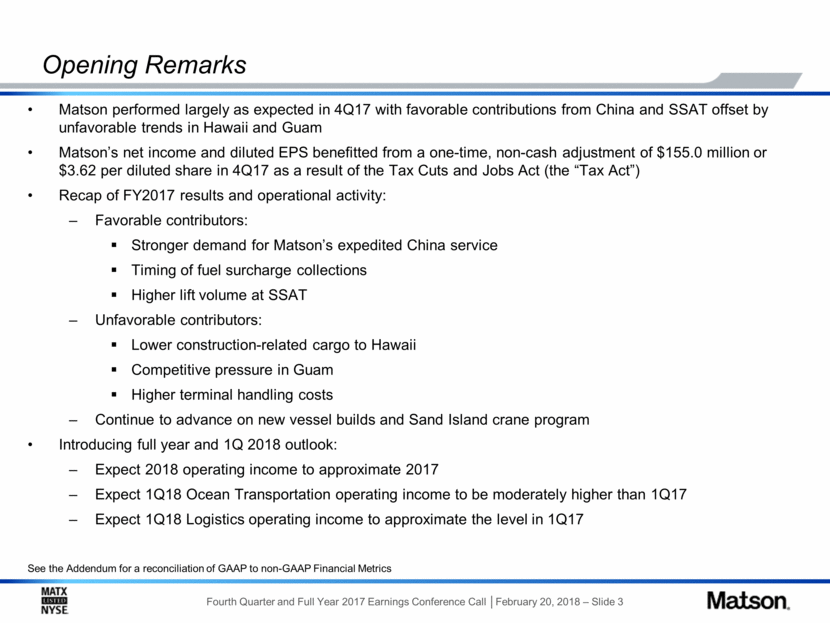
Opening Remarks Matson performed largely as expected in 4Q17 with favorable contributions from China and SSAT offset by unfavorable trends in Hawaii and Guam Matson’s net income and diluted EPS benefitted from a one-time, non-cash adjustment of $155.0 million or $3.62 per diluted share in 4Q17 as a result of the Tax Cuts and Jobs Act (the “Tax Act”) Recap of FY2017 results and operational activity: Favorable contributors: Stronger demand for Matson’s expedited China service Timing of fuel surcharge collections Higher lift volume at SSAT Unfavorable contributors: Lower construction-related cargo to Hawaii Competitive pressure in Guam Higher terminal handling costs Continue to advance on new vessel builds and Sand Island crane program Introducing full year and 1Q 2018 outlook: Expect 2018 operating income to approximate 2017 Expect 1Q18 Ocean Transportation operating income to be moderately higher than 1Q17 Expect 1Q18 Logistics operating income to approximate the level in 1Q17 See the Addendum for a reconciliation of GAAP to non-GAAP Financial Metrics |
|
|
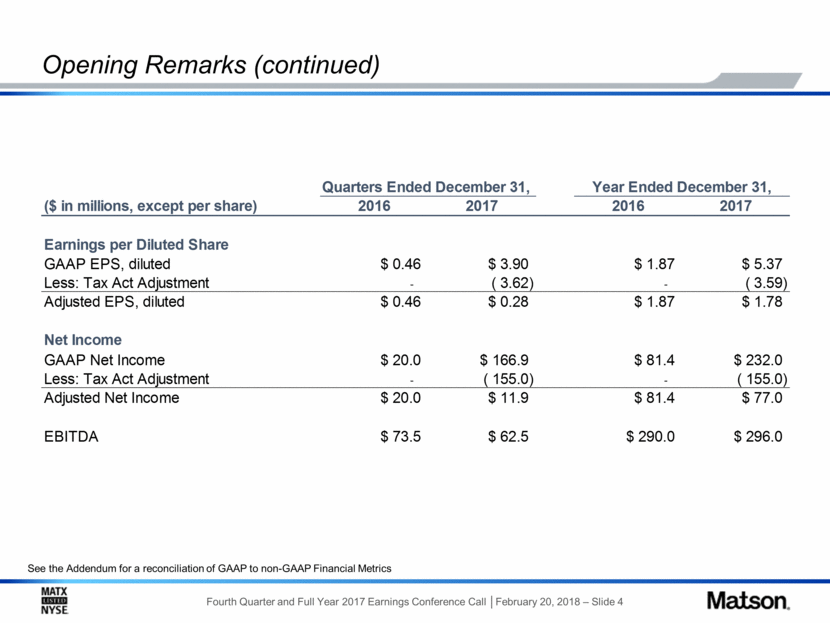
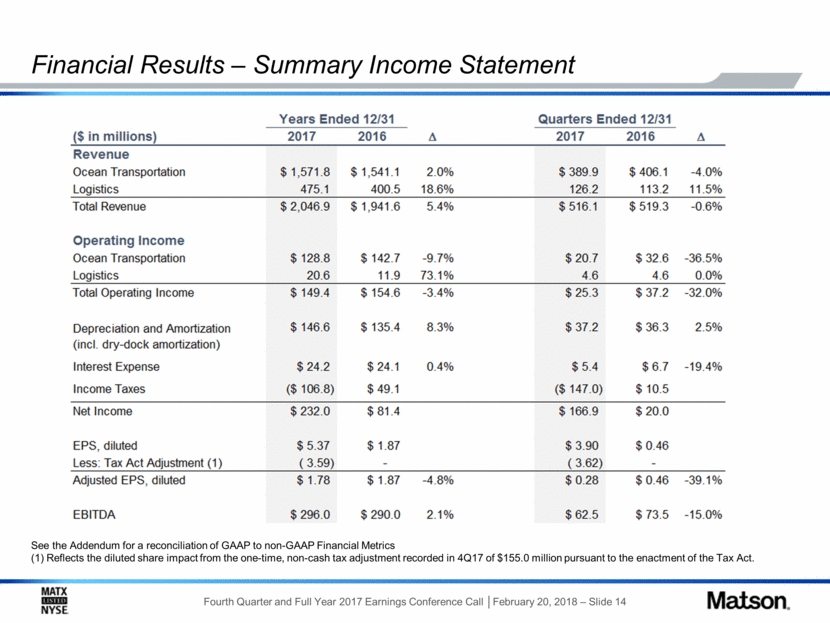
Opening Remarks (continued) See the Addendum for a reconciliation of GAAP to non-GAAP Financial Metrics Quarters Ended December 31, Year Ended December 31, ($ in millions, except per share) 2016 2017 2016 2017 Earnings per Diluted Share GAAP EPS, diluted $ 0.46 $ 3.90 $ 1.87 $ 5.37 Less: Tax Act Adjustment - ( 3.62) - ( 3.59) Adjusted EPS, diluted $ 0.46 $ 0.28 $ 1.87 $ 1.78 Net Income GAAP Net Income $ 20.0 $ 166.9 $ 81.4 $ 232.0 Less: Tax Act Adjustment - ( 155.0) - ( 155.0) Adjusted Net Income $ 20.0 $ 11.9 $ 81.4 $ 77.0 EBITDA $ 73.5 $ 62.5 $ 290.0 $ 296.0Fourth Quarter and Full Year 2017 Earnings Conference Call │February 20, 2018 – Slide 4 Opening Remarks (continued) See the Addendum for a reconciliation of GAAP to non-GAAP Financial Metrics Quarters Ended December 31, Year Ended December 31, ($ in millions, except per share) 2016 2017 2016 2017 Earnings per Diluted Share GAAP EPS, diluted $ 0.46 $ 3.90 $ 1.87 $ 5.37 Less: Tax Act Adjustment - ( 3.62) - ( 3.59) Adjusted EPS, diluted $ 0.46 $ 0.28 $ 1.87 $ 1.78 Net Income GAAP Net Income $ 20.0 $ 166.9 $ 81.4 $ 232.0 Less: Tax Act Adjustment - ( 155.0) - ( 155.0) Adjusted Net Income $ 20.0 $ 11.9 $ 81.4 $ 77.0 EBITDA $ 73.5 $ 62.5 $ 290.0 $ 296.0 |
|
|
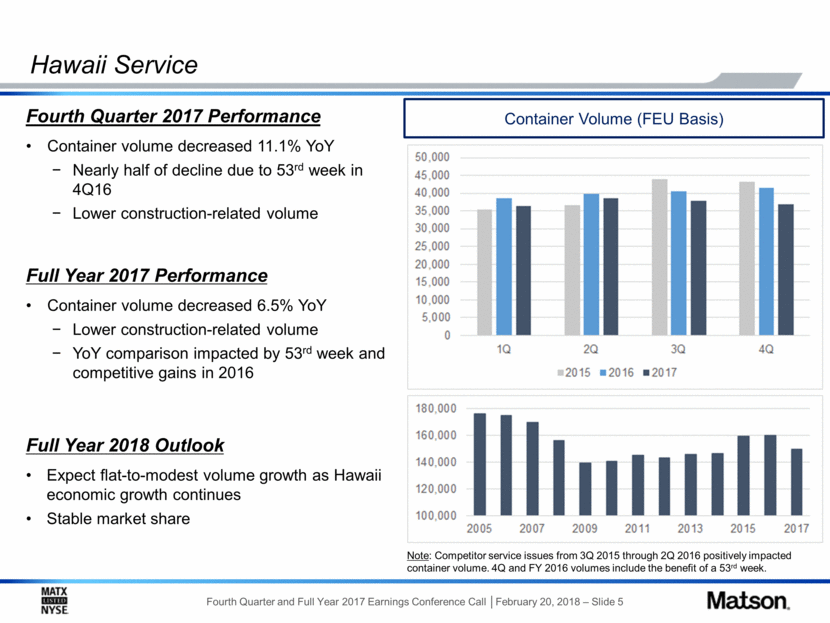
Hawaii Service Fourth Quarter 2017 Performance Container volume decreased 11.1% YoY Nearly half of decline due to 53rd week in 4Q16 Lower construction-related volume Full Year 2018 Outlook Expect flat-to-modest volume growth as Hawaii economic growth continues Stable market share Container Volume (FEU Basis) Note: Competitor service issues from 3Q 2015 through 2Q 2016 positively impacted container volume. 4Q and FY 2016 volumes include the benefit of a 53rd week. Full Year 2017 Performance Container volume decreased 6.5% YoY Lower construction-related volume YoY comparison impacted by 53rd week and competitive gains in 2016 50,000 45,000 40,000 35,000 30,000 25,000 20,000 15,000 10,000 5,000 0 1Q 2Q 3Q 4Q 2015 2016 2017 180,000 160,000 140,000 120,000 100,000 2005 2007 2009 2011 2013 2015 2017 |
|
|
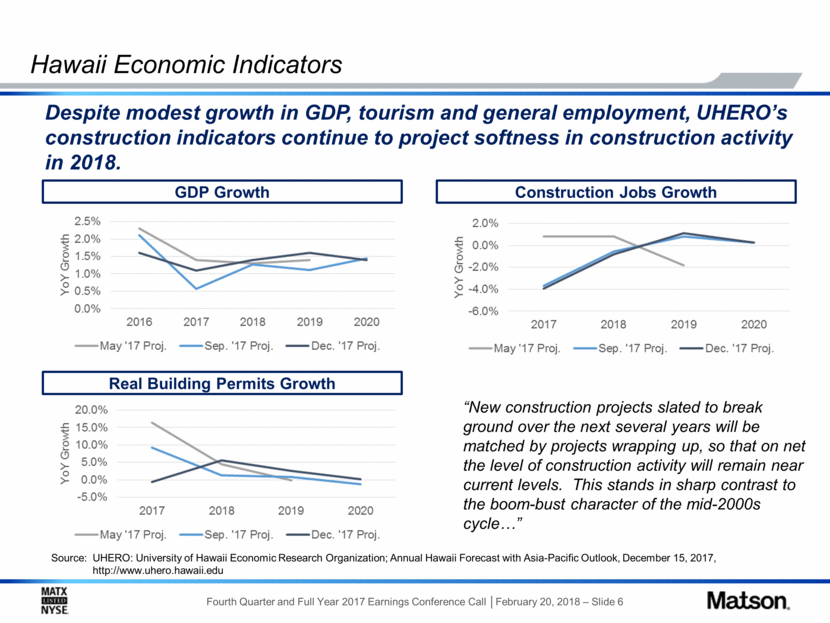
Hawaii Economic Indicators Source: UHERO: University of Hawaii Economic Research Organization; Annual Hawaii Forecast with Asia-Pacific Outlook, December 15, 2017, http://www.uhero.hawaii.edu GDP Growth Construction Jobs Growth Real Building Permits Growth Despite modest growth in GDP, tourism and general employment, UHERO’s construction indicators continue to project softness in construction activity in 2018. “New construction projects slated to break ground over the next several years will be matched by projects wrapping up, so that on net the level of construction activity will remain near current levels. This stands in sharp contrast to the boom-bust character of the mid-2000s cycle ” 2.5% 2.0% 1.5% 1.0% 0.5% 0.0% 2016 2017 2018 2019 2020 2.0% 0.0% -2.0% -4.0% -6.0% 2016 2017 2018 2019 2020 2016 2017 2018 2019 2020 20.0% 15.0% 10.0% 0.0% -5.0% may17 proj sep17 proj Dec17 proj |
|
|
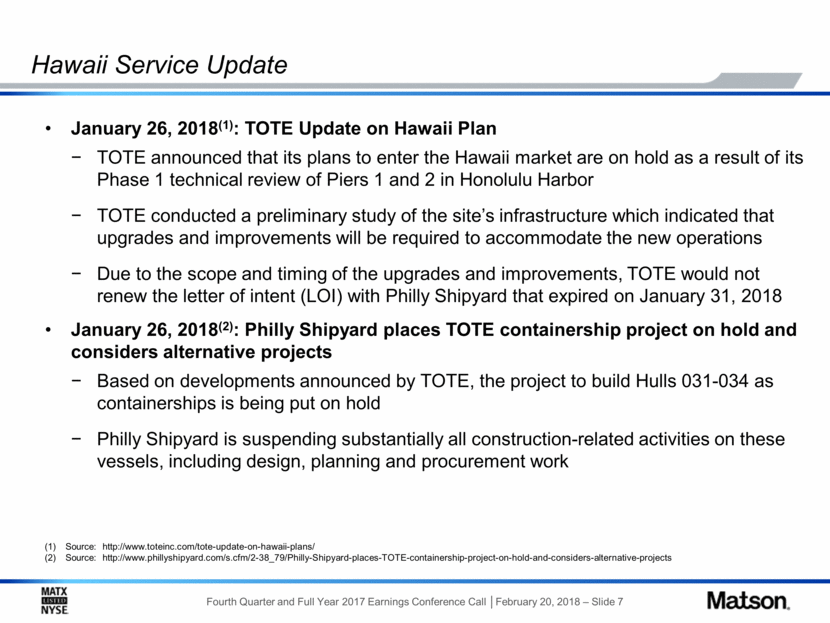
Hawaii Service Update January 26, 2018(1): TOTE Update on Hawaii Plan TOTE announced that its plans to enter the Hawaii market are on hold as a result of its Phase 1 technical review of Piers 1 and 2 in Honolulu Harbor TOTE conducted a preliminary study of the site’s infrastructure which indicated that upgrades and improvements will be required to accommodate the new operations Due to the scope and timing of the upgrades and improvements, TOTE would not renew the letter of intent (LOI) with Philly Shipyard that expired on January 31, 2018 January 26, 2018(2): Philly Shipyard places TOTE containership project on hold and considers alternative projects Based on developments announced by TOTE, the project to build Hulls 031-034 as containerships is being put on hold Philly Shipyard is suspending substantially all construction-related activities on these vessels, including design, planning and procurement work Source: http://www.toteinc.com/tote-update-on-hawaii-plans/ Source: http://www.phillyshipyard.com/s.cfm/2-38_79/Philly-Shipyard-places-TOTE-containership-project-on-hold-and-considers-alternative-projects |
|
|
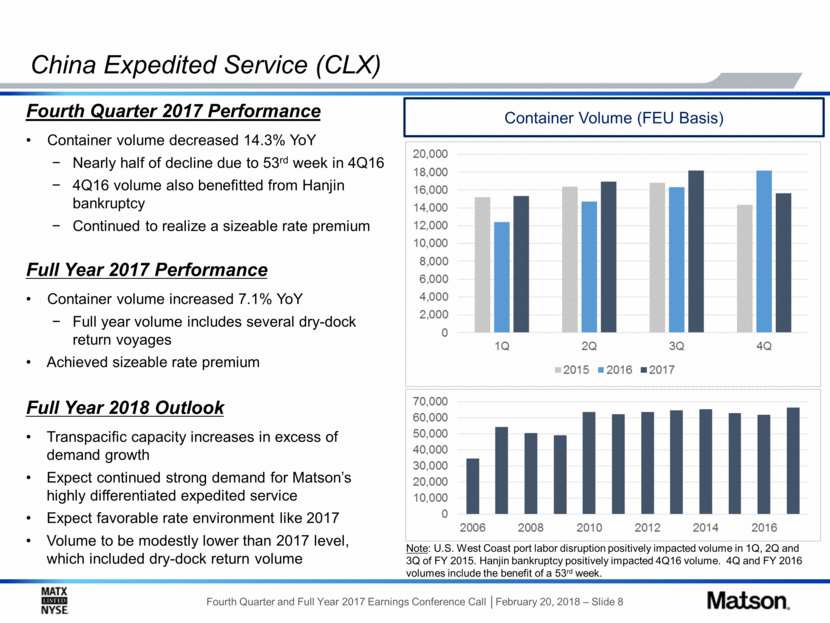
China Expedited Service (CLX) Fourth Quarter 2017 Performance Container volume decreased 14.3% YoY Nearly half of decline due to 53rd week in 4Q16 4Q16 volume also benefitted from Hanjin bankruptcy Continued to realize a sizeable rate premium Full Year 2018 Outlook Transpacific capacity increases in excess of demand growth Expect continued strong demand for Matson’s highly differentiated expedited service Expect favorable rate environment like 2017 Volume to be modestly lower than 2017 level, which included dry-dock return volume Container Volume (FEU Basis) Note: U.S. West Coast port labor disruption positively impacted volume in 1Q, 2Q and 3Q of FY 2015. Hanjin bankruptcy positively impacted 4Q16 volume. 4Q and FY 2016 volumes include the benefit of a 53rd week. Full Year 2017 Performance Container volume increased 7.1% YoY Full year volume includes several dry-dock return voyages Achieved sizeable rate premium20,000 18,000 16,000 14,000 12,000 10,000 8,000 6,000 4,000 2,000 0 1Q 2Q 3Q 4Q 70,000 60,000 50,000 40,000 30,000,20,000 10,000 0, |
|
|
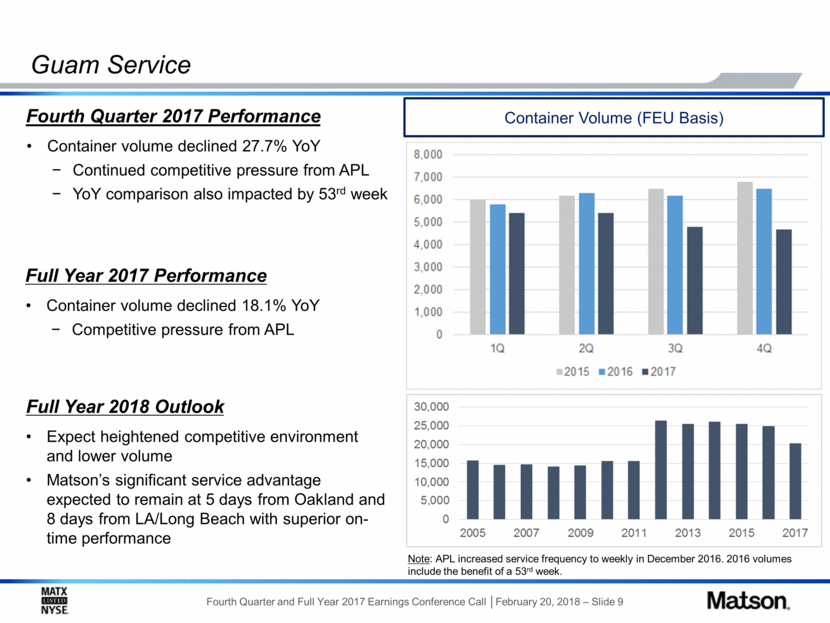
Guam Service Fourth Quarter 2017 Performance Container volume declined 27.7% YoY Continued competitive pressure from APL YoY comparison also impacted by 53rd week Full Year 2018 Outlook Expect heightened competitive environment and lower volume Matson’s significant service advantage expected to remain at 5 days from Oakland and 8 days from LA/Long Beach with superior on-time performance Container Volume (FEU Basis) Note: APL increased service frequency to weekly in December 2016. 2016 volumes include the benefit of a 53rd week. Full Year 2017 Performance Container volume declined 18.1% YoY Competitive pressure from APL 8,000 7,000 6,000 4,000 5,000 3,000 2,000 1,000 1Q 2Q 3Q 4Q 30,000 25,000 50,000 20,000 15,000,5,000 10,000 0, 2015 2007 2009 2011 2013 2015 2017
|
|
|
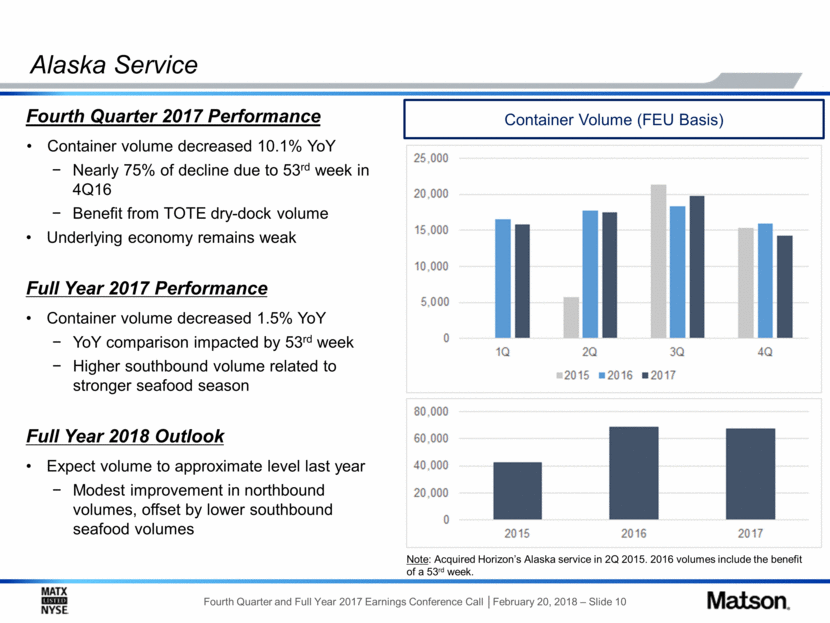
Alaska Service Fourth Quarter 2017 Performance Container volume decreased 10.1% YoY Nearly 75% of decline due to 53rd week in 4Q16 Benefit from TOTE dry-dock volume Underlying economy remains weak Full Year 2018 Outlook Expect volume to approximate level last year Modest improvement in northbound volumes, offset by lower southbound seafood volumes Container Volume (FEU Basis) Note: Acquired Horizon’s Alaska service in 2Q 2015. 2016 volumes include the benefit of a 53rd week. Full Year 2017 Performance Container volume decreased 1.5% YoY YoY comparison impacted by 53rd week Higher southbound volume related to stronger seafood season 80,000 60,000 40,000 20,000 1Q 2Q 3Q 4Q 80,000 60,000 40,000 20,000 0, 2015 2016 2017
|
|
|
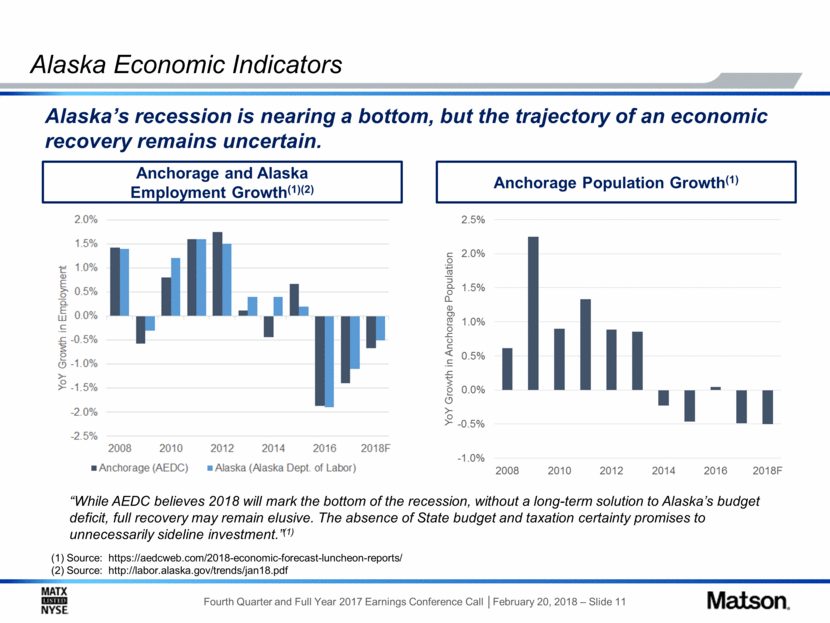
Alaska Economic Indicators (1) Source: https://aedcweb.com/2018-economic-forecast-luncheon-reports/ (2) Source: http://labor.alaska.gov/trends/jan18.pdf Anchorage and Alaska Employment Growth(1)(2) Anchorage Population Growth(1) Alaska’s recession is nearing a bottom, but the trajectory of an economic recovery remains uncertain. “While AEDC believes 2018 will mark the bottom of the recession, without a long-term solution to Alaska’s budget deficit, full recovery may remain elusive. The absence of State budget and taxation certainty promises to unnecessarily sideline investment.”(1) 2.0 1.5 1.0 0.5 0.0 -1.0 -1.5 -2.0 -2.5 2008 2010 2012 2014 2016 2018F yoy Growth in employment 2.5 2.0 1.5 1.0 0.5 0.0 -0.5 -1.0 2008 2010 2012 2014 2016 2018F yoy Growth in employmentAnchotrage population |
|
|
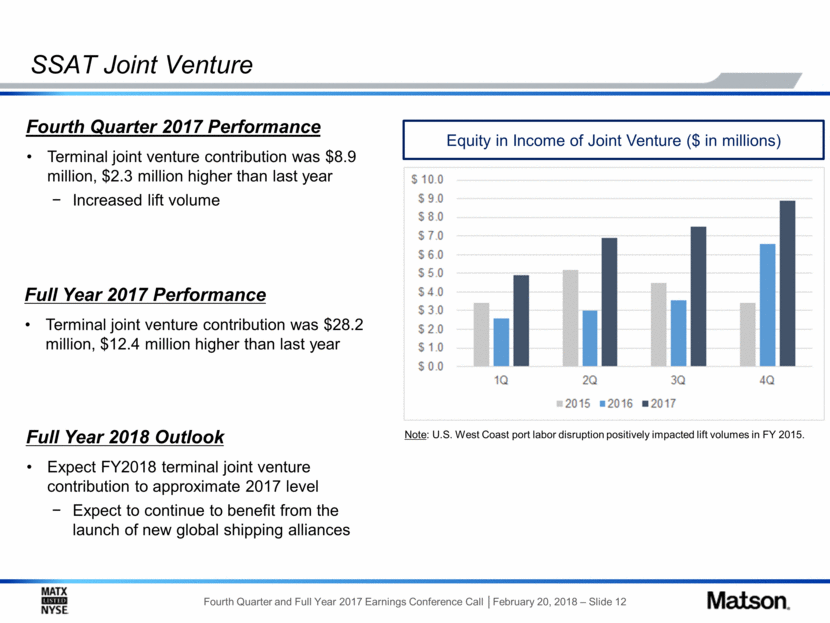
SSAT Joint Venture Fourth Quarter 2017 Performance Terminal joint venture contribution was $8.9 million, $2.3 million higher than last year Increased lift volume Full Year 2018 Outlook Expect FY2018 terminal joint venture contribution to approximate 2017 level Expect to continue to benefit from the launch of new global shipping alliances Equity in Income of Joint Venture ($ in millions) Note: U.S. West Coast port labor disruption positively impacted lift volumes in FY 2015. Full Year 2017 Performance Terminal joint venture contribution was $28.2 million, $12.4 million higher than last year 10.0 9.0 8.0 7.0 6.0 5.0 4.0 3.0 2.0 1.0 0.0 1Q 2Q 3Q 4Q 2015 2016 2017 |
|
|
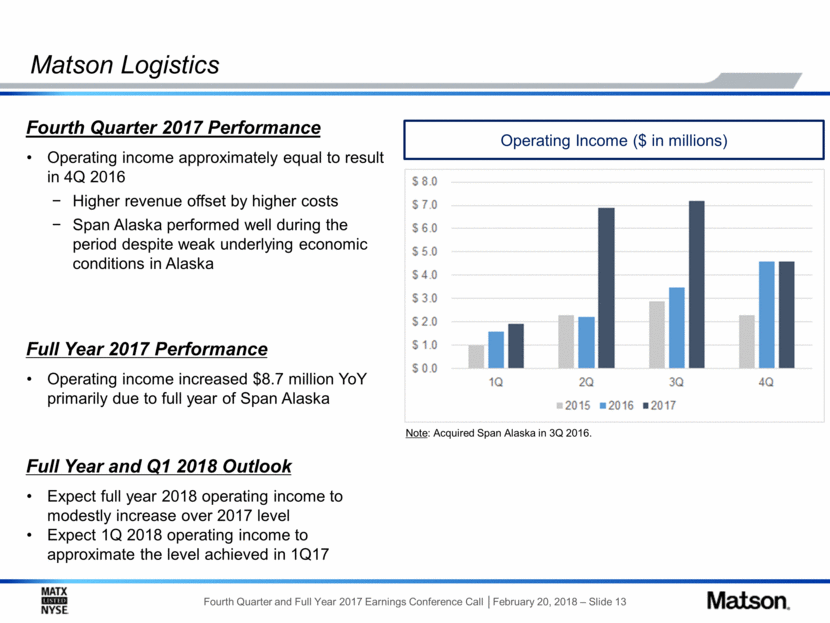
Matson Logistics Fourth Quarter 2017 Performance Operating income approximately equal to result in 4Q 2016 Higher revenue offset by higher costs Span Alaska performed well during the period despite weak underlying economic conditions in Alaska Full Year 2017 Performance Operating income increased $8.7 million YoY primarily due to full year of Span Alaska Operating Income ($ in millions) Note: Acquired Span Alaska in 3Q 2016. Full Year and Q1 2018 Outlook Expect full year 2018 operating income to modestly increase over 2017 level Expect 1Q 2018 operating income to approximate the level achieved in 1Q17 8.0 7.0 6.0 5.0 4.0 3.0 2.0 1.0 0.0 1Q 2Q 3Q 4Q 2015 2016 2017 |
|
|
Financial Results – Summary Income Statement See the Addendum for a reconciliation of GAAP to non-GAAP Financial Metrics (1) Reflects the diluted share impact from the one-time, non-cash tax adjustment recorded in 4Q17 of $155.0 million pursuant to the enactment of the Tax Act. |
|
|
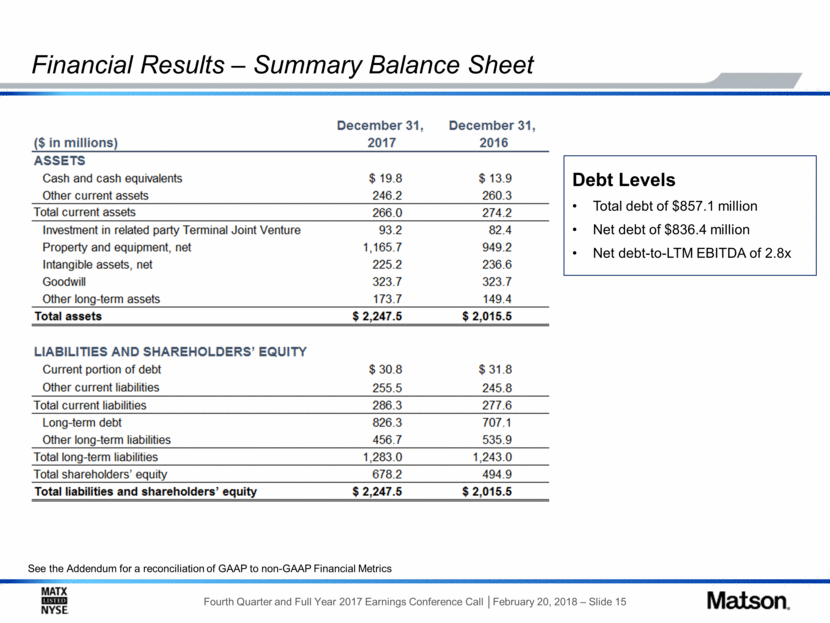
Financial results – Summary Balance Sheet ($ in millions) December 31 , 2017 December 31 , 2016 ASSETS Cash and cash equivalents $ 19.8 $ 13.9 Other current assets 246.2 260.3 Total current assets 266.0 274.2 Investment in related party Terminal Joint Venture 93.2 82.4 Property and equipment, net 1,165.7 949.2 Intangible assets, net 225.2 236.6 Goodwill 323.7 323.7 Other long-term assets 173.7 149.4 Total assets $ 2,247.5 $2,015.5 Debt Levels Total dept of $857.1 million Net debt of $836.4 million Net debt-to-LTM EBITDA of 2.8x LIABILITIES AND SHAREHOLDER’S EQUITY Current portion of debt $30.8 $ 31.8 Other current liabilities 255.5 245.8 Total currents liabilities 286.3 277.6 Long-term-debt826.3 707.1 Other long-term liabilities 456.7 535.9 Total long-term liabilities 1,283.0 1,243.0 Total sahreholders’ equity 678.2 94.9 Total liabilities abd shareholders’ equity $2,247.5 $ 2,015.5 see the Addendum for a reconciliation of GAAP to non-GAAP Financial Matrics MATX LISTED NYSE FOURTH Quarter and Full Year 2017 Earnings Conference Call | February 20, 2018 – Slide 15 MATSON. |
|
|
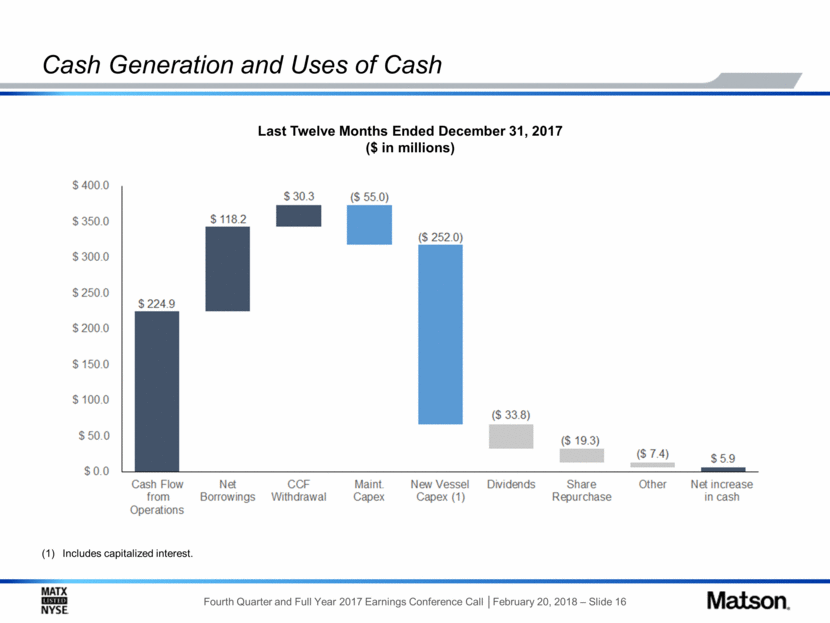
Cash Generation and Uses of Cash Includes capitalized interest. Last Twelve Months Ended December 31, 2017 ($ in millions) 400.0 350.0 300.0 250.0 200.0 150.0 100.0 50.0 0.0 224.9 118.2 30.3 (55.0) (252.0) (33.8) (19.3) (7.4) 5.9 cash flow from operations Net Borrowings CCF Withdrawal maint.capex new vessel capex(1) divdends share repurchase other net increase in cash |
|
|
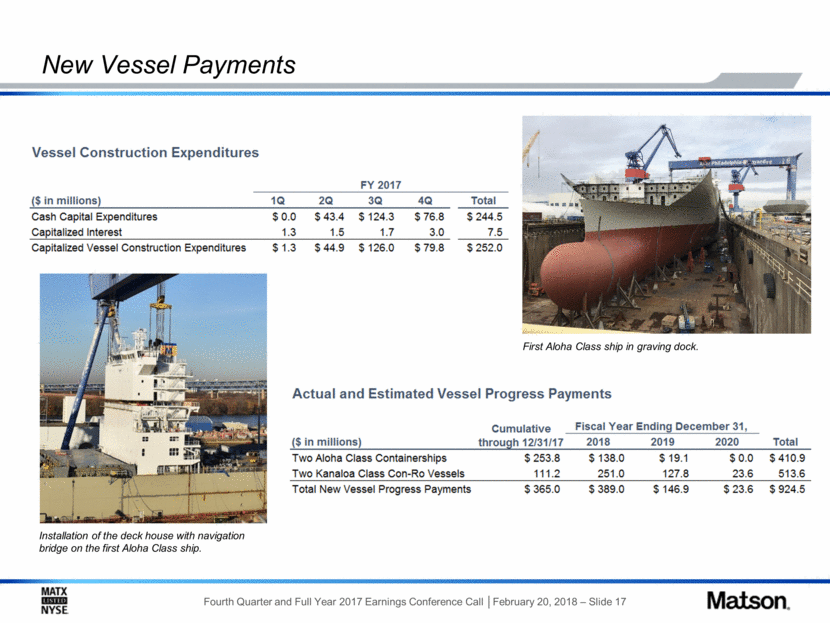
New Vessel Payments First Aloha Class ship in graving dock. Installation of the deck house with navigation bridge on the first Aloha Class ship. Vessel Construction Expenditures FY 2017 ($ in millions) 1Q 2Q 3Q 4Q Total Cash Capital Expenditures $ 0.0 $ 43.4 $ 124.3 $ 76.8 $ 244.5 Capitalizes Interest 1.3 1.5 1.7 3.0 7.5 Capitalized Vessel Construction Expenditures $ 1.3 $ 44.9 $ 126.0 $ 79.8 $ 252.0 First Aloha Class Ship in graving dock. Actual and Estimated Vessel Progress Payments Fiscal Year Ending December 31, ($ in millions) Cumulative through 12/31/17 2018 2019 2020 Total Two Aloha Class Containerships $ 253.8 $ 138.0 $ 19.1 $ 0.0 $ 140.9 Two Kanaloa Class Con-Ro Vessels 111.2 251.0 127.8 23.6 513.6 Total New Vessel Progress Payments $ 365.0 $ 389.0 $ 146.9 $ 23.6 $ 924.5 Installation of the deck house with navigation bridge on the first Aloha Class Ship MATX LISTED NYSE FOURTH Quarter and Full Year 2017 Earnings Conference Call | February 20, 2018 – Slide 17 MATSON. |
|
|
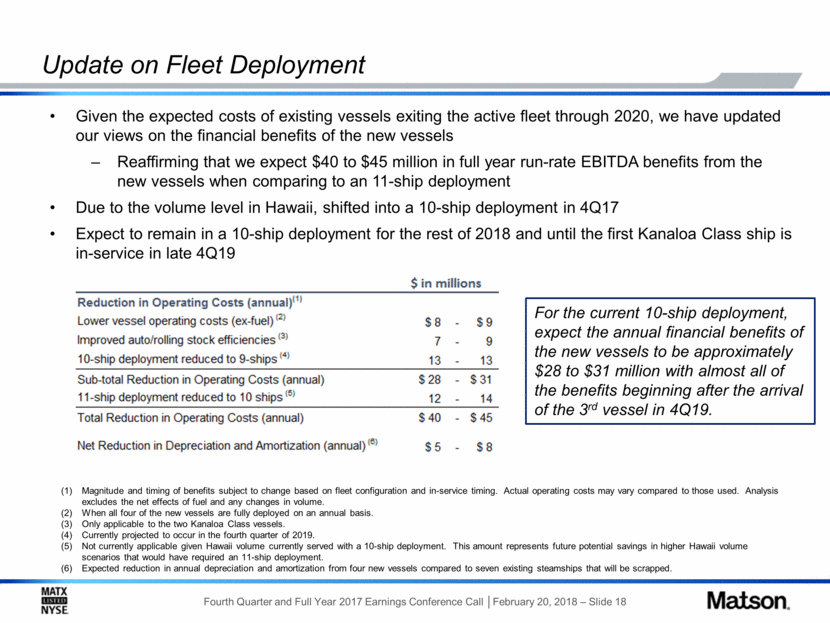
Update on Fleet Deployment Magnitude and timing of benefits subject to change based on fleet configuration and in-service timing. Actual operating costs may vary compared to those used. Analysis excludes the net effects of fuel and any changes in volume. When all four of the new vessels are fully deployed on an annual basis. Only applicable to the two Kanaloa Class vessels. Currently projected to occur in the fourth quarter of 2019. Not currently applicable given Hawaii volume currently served with a 10-ship deployment. This amount represents future potential savings in higher Hawaii volume scenarios that would have required an 11-ship deployment. Expected reduction in annual depreciation and amortization from four new vessels compared to seven existing steamships that will be scrapped. Given the expected costs of existing vessels exiting the active fleet through 2020, we have updated our views on the financial benefits of the new vessels Reaffirming that we expect $40 to $45 million in full year run-rate EBITDA benefits from the new vessels when comparing to an 11-ship deployment Due to the volume level in Hawaii, shifted into a 10-ship deployment in 4Q17 Expect to remain in a 10-ship deployment for the rest of 2018 and until the first Kanaloa Class ship is in-service in late 4Q19 For the current 10-ship deployment, expect the annual financial benefits of the new vessels to be approximately $28 to $31 million with almost all of the benefits beginning after the arrival of the 3rd vessel in 4Q19. $ in millions Reduction in Operating Costs (annual)(1) Lower vessel operating costs (ex-fuel)(2) $ 8 - $ 9 Improved auto/rolling stock efficiencies(3) 7 – 9 10-ship deployment reduction to 9-ships(4) 13 – 3 Sub-total Reduction in Operating Costs (annual) $ 28 - $ 31 11-Ship deployment reduced to 10 ships(5) 12 – 14 Total Reduction in Operating Costs (annual) $ 40 - $ 45 Net Reduction in Depreciation and Amortization (annual)(6) $ 5 - $ 8 For the current 10-ship deployment, expect the annual financial benefits of the new vessel to be approximately $28 to 31 million with almost all of the benefits beginning after the arrival of thr 3rd vessel in 4Q19 MATX LISTED NYSE FOURTH Quarter and Full Year 2017 Earnings Conference Call | February 20, 2018 – Slide 18 MATSON. |
|
|
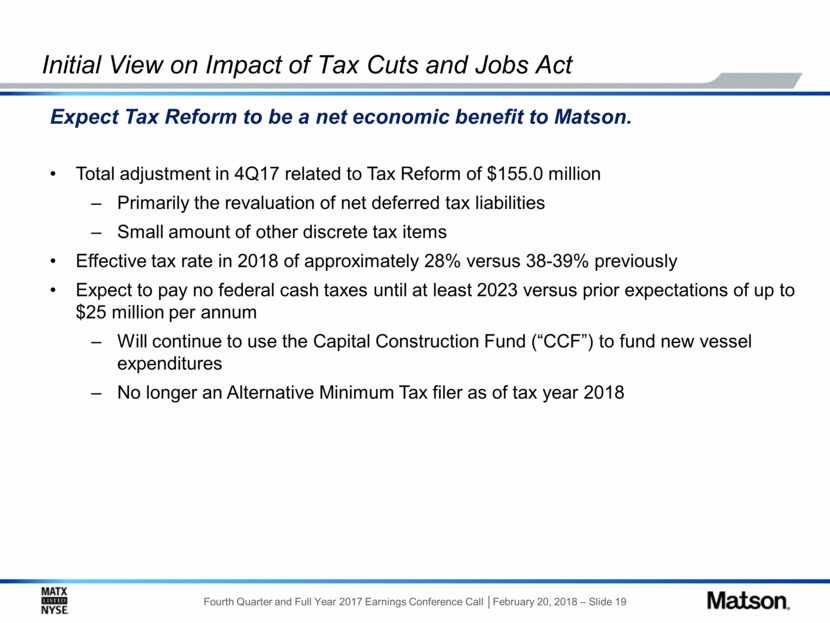
Initial View on Impact of Tax Cuts and Jobs Act Total adjustment in 4Q17 related to Tax Reform of $155.0 million Primarily the revaluation of net deferred tax liabilities Small amount of other discrete tax items Effective tax rate in 2018 of approximately 28% versus 38-39% previously Expect to pay no federal cash taxes until at least 2023 versus prior expectations of up to $25 million per annum Will continue to use the Capital Construction Fund (“CCF”) to fund new vessel expenditures No longer an Alternative Minimum Tax filer as of tax year 2018 Expect Tax Reform to be a net economic benefit to Matson. |
|
|
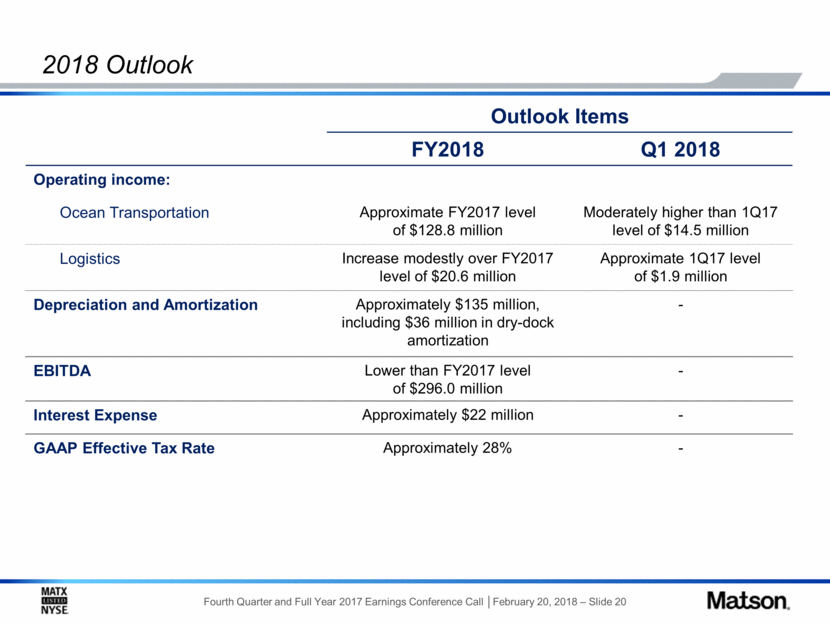
2018 Outlook Outlook Items FY2018 Q1 2018 Operating income: Ocean Transportation Approximate FY2017 leve; of $128.8 million Moderately higher than 1Q17 level of $14.5 million Logistics Increase modestly over FY2017 level of $20.6 million Approximate 1Q17 level of $1.9 million Depreciation and Amortizaton Approximately $135 million including $36 million in dry-dock amortization – EBITDA Lower than FY2017 level of $296.0 million – Interest Expense Approximately $22 million – GAAp Effective Tax Rate Approximately 20% - MATX LISTED NYSE FOURTH Quarter and Full Year 2017 Earnings Conference Call | February 20, 2018 – Slide 20 MATSON. |
|
|
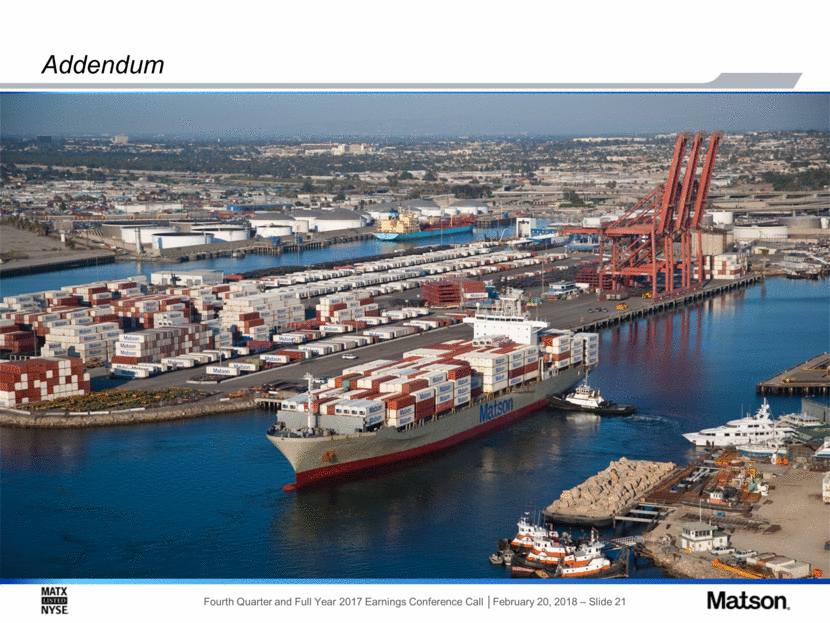
Addendum |
|
|
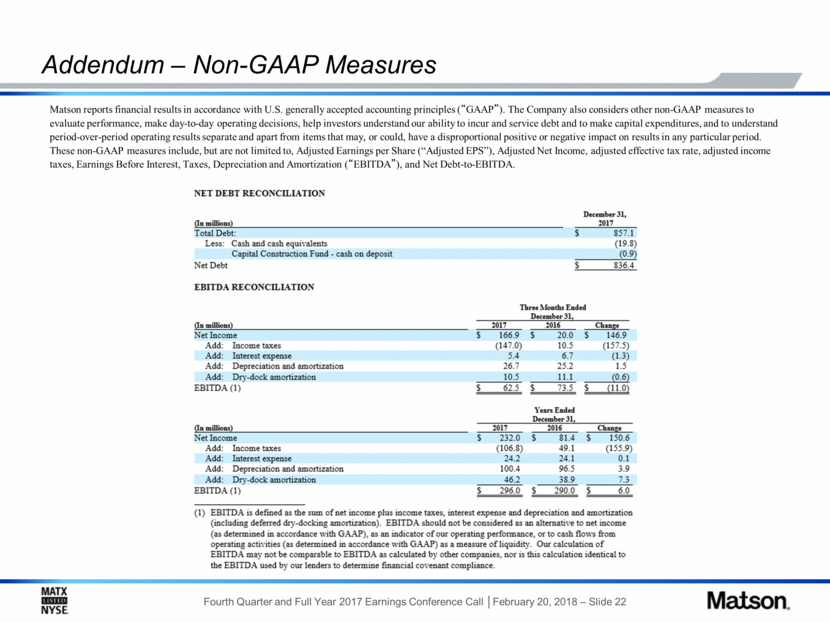
Addendum – Non-GAAP Measures Matson reports financial results in accordance with U.S. generally accepted accounting principles (“GAAP”). The Company also considers other non-GAAP measures to evaluate performance, make day-to-day operating decisions, help investors understand our ability to incur and service debt and to make capital expenditures, and to understand period-over-period operating results separate and apart from items that may, or could, have a disproportional positive or negative impact on results in any particular period. These non-GAAP measures include, but are not limited to, Adjusted Earnings per Share (“Adjusted EPS”), Adjusted Net Income, adjusted effective tax rate, adjusted income taxes, Earnings Before Interest, Taxes, Depreciation and Amortization (“EBITDA”), and Net Debt-to-EBITDA. Addendum – Non-GAAP Measures NET DEBT RECONCILIATION (In million) December 31, 2017 Total Debt $857.1 Less: Cash and Cash equivalents (19.8) Capital Contruction Fund – cash on deposit (0.9) Net Deby $ 836.4 EBITDA RECONCILIATION Three Months Ended December 31, (In million) 2017 2016 Change Net Income $ 166.9 $ 20.0 $ 146.9 Add: Income taxes (147.0) 10.5 (157.5) Add: Interest expense 5.4 6.7 (1.3) Add: Depreciation and amortization 26.7 25.2 1.5 Add: Dry-dock amortization 10.5 11.1 (0.6) EBITDA (1) $ 62.5 $ 73.5 $ (11.0) Years Ended December 31, 2017 2016 Change Net Income $ 232.0 $ 81. $ 150.6 Add: Income taxes (106.8) 49.1 (155.9) Add: Interest expense 24.2 24.1 0.1 Add: Depreciation and amortization 100.4 96.5 3.9 Add: Dry-dock amortization 46.2 38.9 7.3 EBITDA (1) $ 296.0 $ 290.0 $ 6.0 MATX LISTED NYSE FOURTH Quarter and Full Year 2017 Earnings Conference Call | February 20, 2018 – Slide 22 MATSON. |

