Attached files
| file | filename |
|---|---|
| EX-31.2 - EXHIBIT 31.2 - MAXLINEAR INC | exhibit312-2017123110xk.htm |
| EX-32.1 - EXHIBIT 32.1 - MAXLINEAR INC | exhibit321-2017123110xk.htm |
| EX-31.1 - EXHIBIT 31.1 - MAXLINEAR INC | exhibit311-2017123110xk.htm |
| EX-23.2 - EXHIBIT 23.2 - MAXLINEAR INC | exhibit232-2017123110xk.htm |
| EX-23.1 - EXHIBIT 23.1 - MAXLINEAR INC | exhibit231-2017123110xk.htm |
| EX-21.1 - EXHIBIT 21.1 - MAXLINEAR INC | exhibit211-2017123110xk.htm |
UNITED STATES
SECURITIES AND EXCHANGE COMMISSION
Washington, D.C. 20549
FORM 10-K
þ | ANNUAL REPORT PURSUANT TO SECTION 13 OR 15(d) OF THE SECURITIES EXCHANGE ACT OF 1934 |
For the Fiscal Year Ended December 31, 2017
OR
¨ | TRANSITION REPORT PURSUANT TO SECTION 13 OR 15(d) OF THE SECURITIES EXCHANGE ACT OF 1934 |
For the Transition Period From to
Commission file number: 001-34666
MaxLinear, Inc.
(Exact name of Registrant as specified in its charter)
Delaware | 14-1896129 | |
(State or other jurisdiction of incorporation or organization) | (I.R.S. Employer Identification No.) | |
5966 La Place Court, Suite 100 Carlsbad, California | 92008 | |
(Address of principal executive offices) | (Zip Code) | |
(760) 692-0711
(Registrant’s telephone number, including area code)
Securities registered pursuant to Section 12(b) of the Act:
Title of each class | Name of the exchange on which registered | |
Common Stock, $0.0001 par value | New York Stock Exchange | |
Securities registered pursuant to Section 12(g) of the Act: None
Indicate by check mark if the registrant is a well-known seasoned issuer, as defined in Rule 405 of the Securities Act. Yes ¨ No þ
Indicate by check mark if the registrant is not required to file reports pursuant to Section 13 or Section 15(d) of the Act. Yes ¨ No þ
Indicate by check mark whether the Registrant (1) has filed all reports required to be filed by Section 13 or 15(d) of the Securities Exchange Act of 1934 during the preceding 12 months (or for such shorter period that the Registrant was required to file such reports), and (2) has been subject to such filing requirements for the past 90 days. Yes þ No ¨
Indicate by check mark whether the registrant has submitted electronically and posted on its corporate Web site, if any, every Interactive Data File required to be submitted and posted pursuant to Rule 405 of Regulation S-T (§232.405 of this chapter) during the preceding 12 months (or for such shorter period that the registrant was required to submit and post such files). Yes þ No ¨
Indicate by check mark if disclosure of delinquent filers pursuant to Item 405 of Regulation S-K (§229.405 of this chapter) is not contained herein, and will not be contained, to the best of the Registrant’s knowledge, in definitive proxy or information statements incorporated by reference in Part III of this Form 10-K or any amendment to this Form 10-K. þ
Indicate by check mark whether the registrant is a large accelerated filer, an accelerated filer, a non-accelerated filer, a smaller reporting company, or emerging growth company. See the definitions of “large accelerated filer,” “accelerated filer”, “smaller reporting company,” and “emerging growth company” in Rule 12b-2 of the Exchange Act.
Large accelerated filer | þ | Accelerated filer | ¨ | |||
Non-accelerated filer | ¨ (Do not check if a smaller reporting company) | Smaller reporting company | ¨ | |||
Emerging growth company | ¨ | |||||
If an emerging growth company, indicate by check mark if the registrant has elected not to use the extended transition period for complying with any new or revised financial accounting standards provided pursuant to Section 13(a) of the Exchange Act. ¨
Indicate by check mark whether the registrant is a shell company (as defined in Rule 12b-2 of the Exchange Act). Yes ¨ No þ
The aggregate market value of the registrant’s common stock, $0.0001 par value per share, held by non-affiliates of the registrant on June 30, 2017, the last business day of the registrant’s most recently completed second fiscal quarter, was $1.7 billion (based on the closing sales price of the registrant’s common stock on that date). Shares of the registrant’s common stock held by each officer and director and each person known to the registrant to own 10% or more of the outstanding voting power of the registrant have been excluded in that such persons may be deemed to be affiliates. This determination of affiliate status with respect to the foregoing calculation is not a determination for other purposes.
As of February 12, 2018, the registrant has 67,409,788 shares of common stock, par value $0.0001, outstanding.
_________________________________________
DOCUMENTS INCORPORATED BY REFERENCE
Information required by Part III of this Form 10-K is incorporated by reference to the registrant’s proxy statement (the “Proxy Statement”) for the 2018 annual meeting of stockholders, which proxy statement will be filed with the Securities and Exchange Commission within 120 days after the end of the fiscal year covered by this Form 10-K.
MAXLINEAR, INC.
TABLE OF CONTENTS
Page | ||
Item 1. | ||
Item 1A. | ||
Item 1B. | ||
Item 2. | ||
Item 3. | ||
Item 4. | ||
Item 5. | ||
Item 6. | ||
Item 7. | ||
Item 7A. | ||
Item 8. | ||
Item 9. | ||
Item 9A. | ||
Item 9B. | ||
Item 10. | ||
Item 11. | ||
Item 12. | ||
Item 13. | ||
Item 14. | ||
Item 15. | ||
2
MAXLINEAR, INC.
PART I
Forward-Looking Statements
The information in this Annual Report on Form 10-K for the fiscal year ended December 31, 2017, or this Form 10-K, contains forward-looking statements and information within the meaning of Section 27A of the Securities Act of 1933 and Section 21E of the Securities Exchange Act of 1934, which are subject to the “safe harbor” created by those sections. These forward-looking statements include, but are not limited to, statements concerning our strategy, future operations, future financial position, future revenues, projected costs, prospects and plans and objectives of management. The words “anticipates,” “believes,” “estimates,” “expects,” “intends,” “may,” “plans,” “projects,” “will,” “would” and similar expressions are intended to identify forward-looking statements, although not all forward-looking statements contain these identifying words. We may not actually achieve the plans, intentions or expectations disclosed in our forward-looking statements and you should not place undue reliance on our forward-looking statements. Actual results or events could differ materially from the plans, intentions and expectations disclosed in the forward-looking statements that we make. These forward-looking statements involve risks and uncertainties that could cause our actual results to differ materially from those in the forward-looking statements, including, without limitation, the risks set forth in Part I, Item 1A, “Risk Factors” in this Form 10-K. We do not assume any obligation to update any forward-looking statements except as required by law.
ITEM 1. | BUSINESS |
Corporate Information
We incorporated in the State of Delaware in September 2003. Our executive offices are located at 5966 La Place Court, Suite 100, Carlsbad, California 92008, and our telephone number is (760) 692-0711. In this Form 10-K, unless the context otherwise requires, the “Company,” “we,” “us” and “our” refer to MaxLinear, Inc. and its wholly owned subsidiaries. Our website address is www.maxlinear.com. The contents of our website are not incorporated by reference into this Form 10-K. We provide free of charge through a link on our website access to our Annual Reports on Form 10-K, Quarterly Reports on Form 10-Q and Current Reports on Form 8-K, as well as amendments to those reports, as soon as reasonably practical after the reports are electronically filed with, or furnished to, the Securities and Exchange Commission, or SEC. Refer to Intellectual Property Rights section below for a list of our trademarks and trade names. All other trademarks and trade names appearing in this Form 10-K are the property of their respective owners.
Overview
We are a provider of radio frequency, or RF, high-performance analog, and mixed-signal communications systems-on-chip solutions for the connected home, wired and wireless infrastructure, and industrial and multi-market applications. Our customers include electronics distributors, module makers, original equipment manufacturers, or OEMs, and original design manufacturers, or ODMs, who incorporate our products in a wide range of electronic devices including cable DOCSIS broadband modems and gateways; wireline connectivity devices for in-home networking applications; RF transceivers and modems for wireless carrier access and backhaul infrastructure; fiber-optic modules for data center, metro, and long-haul transport networks; video set-top boxes and gateways; hybrid analog and digital televisions, direct broadcast satellite outdoor and indoor units; and power management and interface products used in these and a range of other markets. We are a fabless integrated circuit design company whose products integrate all or substantial portions of a broadband communication system.
We combine our high-performance RF and mixed-signal semiconductor design skills with our expertise in digital communications systems, software, high-performance analog, and embedded systems to provide highly integrated semiconductor devices and platform-level solutions that are manufactured using a range of semiconductor manufacturing processes, including low-cost complementary metal oxide semiconductor, or CMOS, process technology, Silicon Germanium, Gallium Arsenide, BiCMOS and Indium Phosphide process technologies. Our ability to design analog and mixed-signal circuits in CMOS allows us to efficiently combine analog and digital signal processing functionality in the same integrated circuit. As a result, our solutions have high levels of functional integration and performance, small silicon die size, and low power consumption. Moreover, with our recent acquisition of Exar Corporation, we are uniquely positioned to offer customers a combination of proprietary CMOS-based radio system architectures that provide the benefits of superior RF system performance, along with high-performance analog interface and power management solutions that enable shorter design cycles,
3
significant design flexibility and low system cost across a wide range of broadband communications, wired and wireless infrastructure, and industrial and multimarket applications.
During 2017, we sold our products to 286 end customers. For the year ended December 31, 2017, our net revenue was $420.3 million as compared to $387.8 million in the year ended December 31, 2016.
Recent Developments
On March 29, 2017, each share of our then outstanding Class A common stock and Class B common stock and shares underlying our then outstanding stock options, restricted stock units and restricted stock awards automatically converted into a single class of our common stock or rights to receive shares of a single class of our common stock pursuant to the terms of our Fifth Amended and Restated Certificate of Incorporation. The conversion had no impact on the total number of issued and outstanding shares of our capital stock; the Class A shares and Class B shares converted into an equivalent number of shares of our common stock. In addition, the conversion did not increase the total number of authorized shares of our common stock, which prior to the conversion was, and remains, 550,000,000 shares. However, our total number of authorized shares of capital stock was reduced from 1,575,000,000 to 1,509,554,147, to account for the retirement of the Class A shares and Class B shares that were outstanding at the time of the conversion. Following the conversion, our authorized capital stock includes 441,123,947 Class A shares and 493,430,200 Class B shares, which represents Class A shares and Class B shares that were authorized but unissued at the time of the conversion. No additional Class A shares or Class B shares will be issued following the conversion.
Following the conversion, each share of our common stock is entitled to one vote per share and otherwise has the same designations, rights, powers and preferences as the Class A common stock prior to the conversion. In addition, holders of our common stock vote as a single class of stock on any matter that is submitted to a vote of our stockholders. Prior to the conversion, the holders of our Class A and Class B common stock had identical voting rights, except that holders of Class A common stock were entitled to one vote per share and holders of Class B common stock were entitled to ten votes per share with respect to transactions that would result in a change of control of our company or that relate to our equity incentive plans. In addition, holders of Class B common stock had the exclusive right to elect two members of our Board of Directors, each referred to as a Class B Director. The shares of our Class B common stock were not publicly traded. Each share of our Class B common stock was convertible at any time at the option of the holder into one share of Class A common stock and in most instances automatically converted upon sale or other transfer.
On April 4, 2017, we consummated the transactions contemplated by a share and asset acquisition agreement with Marvell Semiconductor Inc., or Marvell, to purchase certain assets and assume certain liabilities of Marvell’s G.hn business, including its Spain legal entity, for aggregate cash consideration of $21.0 million. We also hired certain employees of the G.hn business outside of Spain and assumed employment obligations of the Spanish entity we acquired, which is now a subsidiary of MaxLinear. The assets acquired include, among other things, patents and other intellectual property, a workforce-in-place and other intangible assets, as well as tangible assets that include but are not limited to production masks and other production related assets, inventory and other property and equipment. The liabilities assumed include, among other things, product warranty obligations and accrued vacation and severance obligations for employees who joined MaxLinear and its subsidiaries as a result of the transaction. The acquired assets and assumed liabilities, together with the employees, represent a business as defined in ASC 805, Business Combinations. We integrated the acquired assets and employees into our existing business.
In April 2017, our subsidiary in Singapore began operating under certain tax incentives in Singapore, which are generally effective through March 2022 and may be extended through March 2027. Under these incentives, qualifying income derived from certain sales of our integrated circuits is taxed at a concessionary rate over the incentive period. We also receive a reduced withholding tax rate on certain intercompany royalty payments made by our Singapore subsidiary during the incentive period. Such incentives are conditional upon our meeting certain minimum employment and investment thresholds within Singapore over time, and we may be required to return certain tax benefits in the event the Company does not achieve compliance related to that incentive period. We currently believe that we will be able to satisfy these conditions without material risk. Primarily because of our Singapore net operating losses and our full valuation allowance in Singapore, we do not believe the incentives will have a material impact on our income tax position in the year ending December 31, 2018.
On May 12, 2017, pursuant to the March 28, 2017 Agreement and Plan of Merger, Eagle Acquisition Corporation, a Delaware corporation and wholly-owned subsidiary of MaxLinear, merged with and into Exar Corporation, or Exar, with Exar surviving as a wholly owned subsidiary of MaxLinear. Under this Agreement and Plan of Merger, we agreed to acquire Exar's outstanding common stock for $13.00 per share in cash. We also assumed certain of Exar's stock-based awards in the merger. We paid aggregate cash consideration of $688.1 million, including $12.7 million of cash paid to settle certain stock-based
4
awards that were not assumed by us in the merger. We funded the transaction with cash from the balance sheet of the combined companies, including $235.8 million of cash from Exar, and the net proceeds of approximately $416.8 million under a secured term loan facility in an aggregate principal amount of $425.0 million. The facility is available (i) to finance the Merger, refinance certain existing indebtedness of Exar and its subsidiaries, and fund all related transactions, (ii) to pay fees and expenses incurred in connection therewith and (iii) for working capital and general corporate purposes. The term loan facility has a seven-year term and the term loans bear interest at either an Adjusted LIBOR or an Adjusted Base Rate, plus a fixed applicable margin. In November 2017, to hedge a substantial portion of our interest rate risk, we entered into a fixed-for-floating interest rate swap agreement with an amortizing notional amount to swap a substantial portion of our variable rate LIBOR interest payments under the outstanding term loans for fixed interest payments bearing an interest rate of 1.74685%. Our outstanding debt is still subject to a 2.5% fixed applicable margin during the term of the loan. As a result of entering the swap, the interest rate on a substantial portion of our long-term debt is effectively fixed at approximately 4.25%.
Exar is a designer and developer of high-performance analog mixed-signal integrated circuits and sub-system solutions. The merger significantly furthers our strategic goals of increasing revenue scale, diversifying revenues by end customers and addressable markets, and expanding our analog and mixed-signal footprint on existing tier-one customer platforms. Exar adds a diverse portfolio of high-performance analog and mixed-signal products constituting power management and interface technologies that are ubiquitous functions in wireless and wireline communications infrastructure, broadband access, industrial, enterprise networking, and automotive platforms. We intend to leverage combined technological expertise, cross-selling opportunities and distribution channels to significantly expand our serviceable addressable market. For a discussion of specific risks and uncertainties that could affect our ability to achieve these and other strategic objectives of our acquisitions, please refer to Part I, Item 1A, “Risk Factors” under the subsection captioned “Risks Relating to Recent Acquisitions.”
Industry Background
Over the last two decades, the availability of ubiquitous internet connectivity has resulted in an exponential growth in data content consumption, delivery, and distribution. The rapid rise of social media, the increasing popularity of new broadcast video delivery services such as Netflix, Amazon Prime, and Hulu, new high definition multimedia content, and expanding 4G/5G wireless data access have led to an explosion in data traffic and created an insatiable demand for data bandwidth. Increasingly, industrial, enterprise, and home devices, such as, high-efficiency environmentally friendly or "green" lighting, smart appliances in the connected home, commercial air-conditioning, video surveillance equipment, manufacturing machinery, and point-of-sale asset tracking systems are being connected over the internet, collectively referred to as the Internet of Things, or IoT. Society's drive towards increased energy efficiency and productivity gains is inextricably linked to an expanding interconnected world of devices and people. The sheer amount of information generated and made available for further processing in a IoT world necessitates the continuous upgrade of network bandwidth capacity and associated equipment. Cloud based computing services for storage, big data analytics, and internet data traffic management require massive high-speed data processing and data sharing between servers, switches, and routers within large hyperscale and enterprise data centers. As a result, the growth in demand for fatter and faster data pipes (higher data capacity and lower data latency networks) inside the home, into the home, and throughout the cloud and wired and wireless communications network infrastructure is unprecedented. The elimination of data capacity and speed bottlenecks inside networks is heavily reliant on wide spectrum or broadband, high frequency circuits, and digital signal processing algorithms that can improve spectrum utilization efficiency, and can be integrated into cost effective, low power, mixed-signal system-on-chip semiconductor solutions. We believe that several of these trends are key drivers across multiple of our target markets. We believe they present significant revenue growth opportunities for the Company. These trends include the following:
• | Connected Home: Competing cable, satellite, and other broadband video and data service providers differentiate their services by offering consumers with bundled video, voice, and broadband data access, referred to as triple-play services. These services include advanced features, such as, channel guide information, video-on-demand, DVR, and picture-in-picture viewing. Many of today’s service provider home gateway set-top boxes enable consumers to simultaneously access and manage multimedia content from multiple locations and screens in the home. These home gateway or set-top box devices are required to simultaneously receive, demodulate, and decode multiple signals spread across several channels of frequency bandwidth over a wide frequency range. In traditional set-top box architectures, each simultaneously accessed spectrum of signal is processed by a dedicated RF receiver and transmitter. In the emerging cable and satellite home gateway or media servers, content is delivered from the gateway/server to “thin” or remote IP clients that do not have traditional TV tuners. Each of these gateways and clients necessarily includes a broadband RF transceiver SoC based on MoCA, G.hn, or WiFi home data connectivity standards. As a result, the number of RF transceivers required in each gateway or client is greatly increased. For example, in order to deliver the increasing data bandwidth requirements of the home, cable |
5
MSOs have begun initial deployments of DOCSIS 3.1 equipment and services, which enable channel bonding or the concurrent reception of multiple channels of frequency bands, resulting in a higher aggregate “sum of the channels” bandwidth available to cable subscribers. With the increasing popularity of accessing multimedia content over-the-top, or OTT, via broadband-enabled streaming services, consumers are augmenting OTT multimedia content services with free over-the-air (OTA) terrestrial TV broadcast programming (also referred to as “Cord Cutting”). Therefore, cord-cutting OTT streaming media platforms also require one or more terrestrial TV RF receiver and demodulator SoC solutions.
• | Infrastructure: The demand for “faster and fatter” data pipes and equipment in enterprise and telecommunications infrastructure markets is being primarily driven by the explosion of data traffic generated by mobile devices, OTT streaming video services, and cloud computing and data analytics. |
Inside hyper-scale data centers, high speed optical interconnect products provide the interconnect function between the servers to the top-of-rack switch, which is also connected to the core-router. Through a hierarchy of switches and routers, servers not only connect to each other horizontally inside the data center, but are also connected to the external transport network. High speed interconnect products are also present inside the service provider's metro and long-haul high-speed fiber-optic connections of the transport network. Data center links and equipment are also consistently being upgraded for performance and speed. Currently, while server connections are transitioning from 1Gbps to 10Gbps links, routers and switches are moving from 10/40Gbps to 100Gbps, and to 400Gbps interconnect speeds. Likewise, as data traffic demand continues to grow, the number of servers and a server’s capacity to process massive amounts of data is poised to increase dramatically. Cloud services and machine learning are dependent upon the ability to interconnect vast numbers of servers and storage inside a data center as efficiently as possible, enabling the entire data center to act as a single computing or data processing unit. For this reason, improving the bandwidth of data center networking technology within and between data centers is critical to the data center technology roadmap. At the same time, the cooling of these large scale and densely configured data centers requires extremely low power and highly integrated large bandwidth interconnect solutions.
Within wireless access and backhaul infrastructure, the increasing data traffic from 3G/4G/5G wireless access enabled smartphones and IoT devices requires extremely high bandwidth capacity wireless backhaul and fronthaul point-to-point transport links. As a result, microwave wireless backhaul and fronthaul transport links are migrating to millimeter wave operating frequencies, where a large increase in available spectrum improves data capacity more than tenfold. The finite, and fractured wireless spectrum designated for 5G access is being used more efficiently by increasing the complexity of radio transceivers to be able to aggregate multiple non-contiguous channels of spectrum. At the same time, these complex radio transceivers are feeding antenna arrays that can direct wireless signals more efficiently to the target user, vastly improving coverage (range) and maximum data rates. 5G Wireless technology improves data rates and spectral efficiency by deploying antenna arrays consisting of multiple antenna elements and an equivalent large number of radio transceivers per each base-station. Increasing the density of 5G wireless cells geographically, for capacity and coverage, not only requires more base-stations per unit cell, but it also entails the upgrade of the wireless and optical backhaul transport network connecting the cells. The rollout of 5G functionality within base-stations presents unprecedented technical challenges in radio transceiver design. It involves larger bandwidth spectrum handling capability; extremely high operating radio frequency range; support of antenna array functionality; and the ability to transport high speed data to and from the base-station, all the while consuming extremely low power.
In cable infrastructure, in order to deliver extremely high data bandwidth to homes and businesses, conventional copper and analog broadband networks are being upgraded to deploy digital fiber deeper or closer to the subscriber premises. Currently, the deep optical fiber is being locally terminated at fiber nodes, which “passively” convert the optical signals to electrical signals to be transported over the coaxial cable network that connects to the end subscriber premises. Coaxial cable networks are not only ubiquitous, but are also extremely expensive to replace with fiber which extends all the way to the subscriber premises. As a result, service providers are striving to extract greater data bandwidth capacity from their existing coaxial cable networks. In the cable DOCSIS3.1 network configuration, new fiber node installations are required to support proactive “network monitoring” (“active fiber notes”), continually monitoring and optimizing spectrum usage in the coaxial cable, to deliver up to 10Gbps of available data capacity to any subscriber. Innovation in radio frequency broadband circuits and signal processing is necessary to meet the cost, power consumption, and size constraints of existing and new fiber node installations.
6
Increasing bandwidth severely stresses the limits of current semiconductor device technology, and drives up power consumption. The costly thermal constraints imposed by the additional power dissipation has made it impractical to push more data bandwidth or throughput inside network switches and other interconnects using existing communication signaling techniques. To surmount these challenges, design innovation in broadband analog circuits, and digital signal processing are required for network systems to reach higher data rates at much lower power consumption per unit bandwidth of data capacity.
• | Industrial & Multi-Market: Through the acquisition of Exar, we have gained over 40 years of proven technical competency serving the connected world. Increasingly, in the industrial world, manufacturing equipment and appliances are connected to each other and to the cloud to better optimize utilization, improve power consumption, and plant management. Legacy equipment and new installations need to communicate with each other via newer and older connectivity protocol standards. This in turn creates opportunities for the growth of interface products, and interface bridge products supporting multiple protocols. We believe the Exar interface product portfolio, which consists of serial interface, universal serial bus (USB), universal asynchronous receiver transmitter (UARTS), peripheral interconnect express (PCIe) devices, data converters, power management integrated chips (PMICs), and force touch sensing modules, creates new growth vectors across communications, industrial and multiple other end markets. |
The development of broadband, low power, integrated communication systems-on-chip solutions is at the heart of competitiveness across a range of different businesses spanning broadband wireline access, mobile data services, hyperscale cloud data centers providing search, social networking and OTT streaming services, and cloud computation and storage markets. The proliferation of high frequency, high bandwidth, low power applications with advanced features has led to a rapid increase in the demand for systems that require multiple radio-frequency, mixed-signal, and high-performance analog and digital signal processing transceiver SoCs.
Challenges Faced by Providers of Systems and RF Transceivers and Optical Interconnects
The performance requirements of high bandwidth spectrum-efficient applications consisting of broadband data access and connectivity at home, 4G/5G wireless access and backhaul communications network infrastructure, and high-speed optical interconnect applications in data center, metro, and long-haul telecom transport are extremely stringent. In particular, designing and implementing high-frequency, high-bandwidth RF transceiver systems is extremely challenging owing to the high operating frequency ranges and the spectrally scattered wide frequency bands across which the communication signal is transmitted. As a result, system designers encounter significantly more sources of interference than in the case of traditional narrow band, low-frequency communication systems. Traditional implementation of narrow band single-channel RF transceivers entails conventional radio system architectures that requires expensive discrete components, and are fabricated in costly special purpose semiconductor technologies, such as silicon germanium, gallium arsenide, and RF enhanced CMOS process technologies.
The key challenges of capturing and processing high quality broadband communications signals include:
• | Receiving single or multiple RF/digital communications signals spanning multiple frequency bands over a wide spectrum. Many of the advanced high data rate applications require the simultaneous RF reception of multiple channels or frequency bands in order to first aggregate, and then subsequently demodulate the data signal, which is spread over discrete disparate frequency bands. Likewise, high data rate transmission is achieved by disaggregating the user's data signal and transmitting it over multiple available frequency bands spanning a wide frequency spectrum. For example, in the cable set-top box and broadband gateway markets, it is necessary to support the simultaneous reception of multiple channels of high definition video, voice, and data applications in many system designs. OEMs meet these stringent requirements via multiple narrow or wideband RF receivers, each of which is dedicated to the reception of a single frequency band. An alternate, but highly challenging approach involves Full Spectrum Capture (FSCTM) receiver SoCs which can receive and digitize the entire available RF frequency spectrum in the transmission medium. They can then select and aggregate the relevant frequency bands over which the data is spread using analog and mixed-signal digital co-processing techniques. In conventional architectures, use of discrete multiple RF receivers is costly or unviable due to increased design complexity, overall cost, circuit board space, power consumption and heat dissipation. In addition, such implementations suffer from signal integrity issues, reliability, signal interference, and thermal challenges owing to the proximity of sensitive multiple RF receivers and discrete components in a limited PCB footprint. |
7
• | Signal Clarity Performance Requirements. In communications systems, performance is limited by the quality of the received/transmitted signal, which is referred to as the signal-to-noise ratio or dynamic range of the transceiver. The signal-to-noise ratio measures the strength of the desired signal relative to the total noise and undesired signal energy in the same channel. High definition satellite and terrestrial digital video, high capacity 5G wireless cellular data networks operating across non-contiguous wireless spectrum bands, and wired coaxial cable and power-line networks require broadband RF transceivers with large dynamic range. These transceiver systems are required to isolate the desired signals from the undesired signals, which are invariably present in the wide operating frequency range. The undesired signals not only include the noise generated by extraneous radio waves, but also interference produced by home appliances, enterprise communications equipment, and other wireless networking systems. For example, in broadband television reception, traditional RF transceiver implementations utilize expensive discrete components, such as band-pass filters, resonance elements, and varactor diodes to separate the desired signals from the interfering signals. In high speed mobile environments, diversity combining of radio signals and multi-user MIMO, in which the desired signal is spread over multiple frequency bands, is achieved using multiple RF transceivers. Analog and digital signal processing is employed to reconstruct the original signal and to improve the signal-to-noise ratio. While diversity combining of radio signals significantly improves signal-to-noise ratio, it requires sophisticated RF, analog and digital signal co-processing, and software expertise. Broadband reception and diversity combining of RF signals in mobile environments are extremely difficult to implement due to the stringent size, cost, and power consumption constraints. Also, higher order modulation of communication signals, which enables maximization of data capacity in a finite spectrum, requires extremely high signal-to-noise or dynamic range, which greatly increases the difficulty of implementing broadband systems. |
• | Power Consumption. Power consumption is an important consideration in consumer, broadband operator, and wired and wireless infrastructure applications. For example, in battery-operated devices such as notebooks, and voice-enabled cable modems with backup battery requirements to support E911 services, long battery life is a differentiating device attribute. In wireless infrastructure applications, the cost of provisioning power to base-station antenna towers and the operating cost attributable to energy consumption is extremely high. In wired optical infrastructure, such as data centers, the cost and technical challenges of cooling larger scale, densely configured data centers are quite significant. In many multiple transceiver system designs, a majority of the system’s overall power consumption can be ascribed to RF transceiver and related components. Providers of RF transceivers and RF transceiver digital signal processing SoCs are confronted with the design challenge of lowering power consumption while improving the device performance. |
• | Size. The size of electronic components, such as RF transceivers and digital signal processing SoCs, is a key consideration for system designers and the service providers that deploy them. Given the proliferation of the number of RF transceivers in broadband applications such as service provider video and data gateway markets, size is a determining factor in the selection of a silicon vendor’s component. In wired optical infrastructure applications inside data centers, rapidly increasing network server and switch face-plate density trends are aggressively driving reduction of the size of interconnects. In wireless infrastructure, space on the base-station radio towers, where the radios and modems are mounted, is highly constrained and is extremely expensive to procure. In 5G wireless access, the deployment of massive MIMO and antenna arrays and cell densification for coverage and capacity greatly increase the number of radio transceivers required in each base-station radio tower, as well as the number of base-stations in a cell. |
There are also challenges that are specific to the processing of high-speed optical interconnect signals in our target data center, metro and long-haul telecommunications transport markets.
• | Optical Fiber Channel Impairments. The optical properties of the fiber material result in impairments to the optical signal as it propagates along the fiber. These impairments include not only the loss of light intensity, but also the adverse modal, chromatic, and polarization dispersion effects on light during its propagation in the fiber. These impairments degrade signal integrity, which not only reduces the maximum data throughput, but also limits the distance over which data can propagate over passive fiber. Further, electrical signal impairments are introduced in the process of conversion of optical signals to electrical signals. Therefore, RF transceivers and PHY SoCs present inside optical modules are required to correct both electrical and optical signal impairments at both ends of the fiber termination. |
• | Optical Device Technology. The state of the art in optical device technology today lags the rapidly increasing speed requirements of data traffic within cloud data centers and optical transport links between telecom data |
8
centers. So, there are severe physical limits to the conversion of electrical signals to optical signals and vice versa at extremely high speeds. These limitations arise from bandwidth, nonlinearities, and noise properties in lasers, modulators, and photo detectors used in optical modules.
• | Form Factor. The form factor of the face plates in server, storage, switch, and networking racks in data centers limits the amount of heat that can be dissipated within an enclosure. The power consumption of electrical and optical devices inside the transceivers, to which optical fibers are connected, has been dramatically increasing. This imposes severe and costly thermal design challenges in the development of systems. As data rates have increased dramatically, the physical form of the face plates and connectors incorporating optical devices have not scaled rapidly enough to accommodate the corresponding increase in power density. |
Our RF and Mixed-Signal Platform Solutions
We are a provider of radio-frequency, or RF, high performance analog, and mixed-signal communications systems-on-chip solutions for the connected home, wired and wireless infrastructure, and industrial and multi-market applications. We are a fabless integrated circuit design company whose products integrate all or substantial portions of a broadband communication system. In most cases, these products are designed on a single silicon-die, using standard digital CMOS processes and conventional packaging technologies. This enables our solutions to achieve superior power, performance, and cost advantages relative to our industry competition. Our customers include electronics distributors, module makers, original equipment manufacturers (OEMs), and original design manufacturers (ODMs), who incorporate the Company’s products in a wide range of electronic devices. Examples of such end market electronic devices incorporating our products include cable DOCSIS broadband modems and gateways; wireline connectivity devices for in-home networking applications; RF transceivers and modems for wireless carrier access and backhaul infrastructure; fiber-optic modules for data center, metro, and long-haul transport networks; video set-top boxes and gateways; hybrid analog and digital televisions, direct broadcast satellite outdoor and indoor units; and power management and interface products used in these and a range of other markets.
Our products exemplify our core integrated circuit design and communications systems engineering capabilities:
• | Proprietary broadband/RF, analog and mixed-signal transceiver front ends. Our analog and mixed-signal IC designers implement complex broadband radio transceiver front ends in standard silicon CMOS processes. Our ability to integrate complex RF/Analog and mixed-signal circuits in standard CMOS processes enables single-die integration of a complete digital signal processing communication system. This results in state-of-the-art performance, highest energy efficiency or lowest power, smallest form factor, and the lowest manufacturing cost of a target function. Our high performance mixed-signal design capability, which involves the high-speed conversion of signals precisely and efficiently between analog and digital domains, is core to all our products and market applications. Our mixed-signal capabilities have allowed us to design Full Spectrum Capture™ (FSC) receivers which digitize wide swaths of frequency spectrum. For example, in cable DOCSIS3.1 data gateways, our single-chip FSC receivers digitize the entire cable spectrum and aggregate multiple frequency bands or channels using analog and digital signal co-processing to enable multi-gigabit data services. Our architectural and circuit innovations have resulted in a 100-fold reduction in power per unit bandwidth in broadband DOCSIS cable modems, while increasing the total data throughput by an even greater factor. In our latest products, which address the emerging 400Gbps high speed optical interconnect applications inside the data center, our transceivers digitize and aggregate 4 lanes of 100Gps of high-speed data signals coming across the fiber, delivering 400Gbps of data throughput. Our microwave backhaul RF transceiver constitutes the industry’s first single-chip CMOS implementation. It not only has the capability to receive signals spanning an extremely wide 5GHz to 45GHz frequency range, but it is also able to aggregate signals spread over multiple disparate frequency bands to support multi-gigabit-per-second data speeds. As a result, wireless backhaul outdoor units incorporating our solution have the lowest power consumption, smallest form factor, superior performance, and the lowest system cost of any wireless backhaul outdoor unit of which we are aware. |
• | Advanced digital signal processing ASIC design and algorithms. Our signal processing algorithm and digital ASIC design expertise is at the core of our ability to employ digital signal processing to enable breakthroughs in CMOS analog RF front-end design and vice-versa. For example, impairments introduced by analog systems such as power amplifiers and photonics devices are canceled using sophisticated digital signal processing algorithms to achieve superior signal quality, reduce power consumption, and improve the speed of operation. Communication systems across a range of our current and future target markets share common signal processing functions, such as efficient error control coding, compensation for transmission medium or channel induced impairments, and digital |
9
processing of wideband signals. So, algorithmic breakthroughs in one application are directly applicable to other product areas.
• | Architecture and system design for highly-integrated end-to-end communication systems on a single-chip. Our novel design techniques tradeoff individual signal path circuit level performance to optimize the overall system performance. Our holistic system level design approach eliminates costly, and power-hungry overdesign of individual circuit elements in the signal path. As a result, we are able to address more complex customer problems that require a deeper understanding of the customer’s end product. Many of our products not only integrate the entire physical layer (PHY), but also implement complete protocol stacks. Examples of these products include our fully integrated single-chip solutions for in-home wireline connectivity, namely G.hn and MoCA solutions. The integration of entire systems on a single-chip reduces the number of external board-level components, decreases board space, improves performance, simplifies customers’ product design, and significantly reduces power consumption. |
• | Low-power design methodology. Reduced power consumption is extremely important to our end products and markets. The superior energy efficiency of our products reflects our years of cumulative experience and R&D investment in system architecture, semiconductor device modeling, and integrated circuit design expertise. At extremely high data rates, when electrical signals transit on and off the chip, there is a severe penalty in speed and power consumption. Therefore, significant reduction in power consumption of a device requires minimization of signal transitions between multiple chips. Our ability to achieve the highest levels of integration of all analog/RF and digital signal processing functionality on the same chip minimizes power consumption by eliminating such signal transitions. Our solutions disproportionately impact our end-customer’s product power dissipation, such as in cable modems, cable FDX fiber nodes, 400Gbps optical transceiver modules, and large 5G antenna radio transceiver arrays. Low power dissipation not only simplifies costly thermal design, but also eliminates the need for bulky fans and other cooling aids. This in turn improves end customer product reliability, increases the density of product features that can be supported in a compact footprint, and reduces overall system cost. |
• | Embedded systems architecture. Our products contain complex integrated CPU subsystems. These subsystems typically include multiple low-power microprocessor cores, bus and peripherals, memory controllers, and interrupt processing. In addition to signal processing and supervisory activity functions, we also implement multiple layers of real-time embedded firmware and protocol stacks on a single-chip. We believe our expertise and track record of successfully developing widely deployed, reliable embedded protocols for networking applications are essential to the evolution of connected home products of the future. Our firmware design capability is critical to the ease of use of our products in end customer platforms. |
• | Scalable Platform. Our products share a highly modular, core radio system and digital signal processing architecture, which enables us to offer fully integrated broadband RF transceiver based digital communication SoC solutions. They meet the stringent performance requirements of a wide variety of end market applications and standards. This contrasts to legacy solutions that require significant customization to conform to the various regional standards, technical performance and product feature requirements. As a result, our customers can minimize their design resources required to develop applications for multiple target markets using our “platform” solutions. In addition, we can deploy our engineering resources more efficiently to both diversify and address larger communications end markets. |
Our Strategy
Our objective is to be the leading provider of highly integrated mixed-signal RF transceivers and SoCs for the connected home, wired and wireless infrastructure, and industrial and multi-market applications. In the future, we aim to leverage our core analog and digital signal co-processing competency to expand into other communications markets with similar performance requirements. The key elements of our strategy are:
• | Extend Technology Leadership in RF Transceivers and RF Transceiver + Digital Signal Processing SoCs. We believe that our success thus far is largely attributable to our RF and mixed-signal design capability, as well as advanced digital design expertise. We have leveraged this core competency to develop high-performance, low-cost semiconductor solutions for broadband communications applications spanning the connected home, wireless access and backhaul network infrastructure, and high-speed fiber-optic modules for data center, metro, and long-haul infrastructure markets. The broadband market presents significant opportunities for innovation through the further integration of RF and mixed-signal functionality with digital signal processing capability in CMOS |
10
process technology. By doing so, we believe we will be able to deliver products with lower power consumption, superior performance, and increased cost benefits to system designers and service providers. We believe that our core competencies and design expertise in this market will enable us to acquire more customers and design wins over time. We will continue to invest in this capability and strive to be an innovation leader in this market.
• | Leverage and Expand our Existing Customer Base. We target customers who are leaders in their respective markets. We intend to continue to focus on sales to customers who are leaders in our current target markets, and to build on our relationships with these leading customers to define and enhance our product roadmap. By solving the specific problems faced by our customers, we can minimize the risks associated with our customers’ adoption of our new integrated circuit products, and reduce the length of time from the start of product design to customer revenue. Further, engaging with market leaders will enable us to participate in emerging technology trends and new industry standards. |
• | Target Additional High-Growth Markets. Our core competency is in RF analog and mixed-signal integrated circuit design in CMOS process technology. Several of the technological challenges involved in developing RF solutions for video broadcasting and broadband reception are common to a majority of broader communications markets. We intend to leverage our core competency in developing highly integrated RF transceiver and RF transceiver SoCs in standard CMOS process technology to address additional markets within broadband communications, communications infrastructure, and connectivity markets that we believe offer high growth potential. |
• | Expand Global Presence. Due to the global nature of our supply chain and customer locations, we intend to continue to expand our sales, design and technical support organization both in the United States and overseas. In particular, we expect to increase the number of employees in Asia, Europe and the United States to provide regional support to our increasing base of customers. We believe that our customers will increasingly expect this kind of local capability and support. |
• | Attract and Retain Top Talent. We are committed to recruiting and retaining highly talented personnel with proven expertise in the design, development, marketing and sales of communications integrated circuits. We believe that we have assembled a high-quality team in all the areas of expertise required at a integrated circuit design company. We provide an attractive work environment for all of our employees. We believe that our ability to attract the best engineers is a critical component of our future growth and success in our chosen markets. |
Products
Our products are integrated into a wide range of electronic devices, including cable, terrestrial, and satellite video set-top boxes and gateways, cable DOCSIS data and voice gateways, hybrid analog and digital televisions, smartphones, direct broadcast satellite outdoor units, optical modules for data center, metro, and long-haul transport network applications, RF transceivers and modem solutions for wireless carrier infrastructure applications, wireline connectivity devices for in-home networking applications and last-mile broadband access, and power management and interface products for enterprise networking, infrastructure, industrial, and multi-market applications.
We provide our customers with guidelines, known as reference designs, so that they can efficiently use our products in their product designs. We currently provide the following types of semiconductors:
• | RF Receivers. These semiconductor products combine RF receiver technology that traditionally required multiple external discrete components, such as very high frequency, or VHF, and ultra-high frequency, or UHF, tracking filters, surface acoustic wave, or SAW, filters, intermediate-frequency, or IF, amplifiers, low noise amplifiers and transformers. All of these external components have been either eliminated or integrated into a single semiconductor produced entirely in standard CMOS process technology. |
• | RF Receiver SoCs. These semiconductor products combine the functionality of RF receivers, and demodulators in a single chip. In some configurations, these products may incorporate multiple RF receivers and single or multiple demodulators in a single chip to provide application or market specific solutions to customers. |
• | Wireless Infrastructure Backhaul RF Receivers and Modem SoC's. These semiconductor products reside in wireless operator system deployments to enable communication between various metro network rings. The RF receiver is capable of receiving and transmitting signals spanning 5-45 GHz and passes the signal to the back-end modem device, which modulates one or more carrier wave signals to encode digital information for transmission and demodulate signals to decode the transmitted information. The increasing amounts of data and video content |
11
being consumed on mobile devices are creating new opportunities for innovative and efficient modem and RF receiver SoCs.
• | Laser Modulator Drivers. These semiconductor products reside in optical modules and provide a constant current source that delivers exactly the current to the laser diode that it needs to operate for a particular application |
• | Transimpedance Amplifiers. These semiconductor products reside in optical modules and provide current-to-voltage conversion, converting the low-level current of a sensor to a voltage. |
• | Clock and Data Recovery Circuits. These semiconductor products generate a clock from an approximate frequency reference, and then phase-aligns to the transitions in the data stream with a phase-locked loop, or PLL. |
• | Interface solutions. These differentiated bridging connectivity products include USB, ethernet, PCIe, as well as UARTs, and serial transceiver devices which serve data and telecommunications, networking and storage, industrial control and embedded applications and facilitate and optimize the interface between systems and across networks. |
• | Power Management. These DC/DC voltage conversion and supervision products are designed to support the needs of various infrastructure, broadband, industrial and embedded system applications, including traditional linear, switching power management solutions and universal PMICs. Our proprietary and patented programmable power technology enables customers to reduce product development cycles, provides a flexible and configurable solution for control of critical attributes of the power management system and enables the system architect to design products that significantly reduce wasted energy. |
• | Data encryption and compression. These products offer some of the industry's lowest noise and distortion amplifiers and lowest power consumption high speed analog-to-digital converters, or ADCs. They include instrumentation, low noise, high speed and hybrid amplifiers, as well as high speed ADCs and digital-to-analog converters. Our amplifier and data converter products are designed to meet the needs of various industrial, medical, and video applications. |
Customers
We sell our products, directly and indirectly, to original equipment manufacturers, or OEMs, module makers and original design manufacturers, or ODMs, and we refer to these as our end customers. By providing a highly integrated reference design solution that our customers can incorporate in their products with minimal modifications, we enable our customers to design cost-effective high-performance SoC-based solutions rapidly. In the year ended December 31, 2017, we sold our products to 286 end customers. A significant portion of our sales to these and other customers are through distributors based in Asia.
A significant portion of our net revenue has historically been generated by a limited number of customers. In the years ended December 31, 2017, 2016 and 2015, ten customers accounted for approximately 58%, 74% and 76% of our net revenue, respectively. In the years ended December 31, 2017, 2016 and 2015, Arris Group, Inc., or Arris, represented 25%, 27% and 28% of our net revenue. Sales to Arris as a percentage of net revenue include sales to Pace, which was acquired by Arris in January 2016, for the year ended December 31, 2016. In the years ended December 31, 2016 and 2015, Technicolor (which includes Cisco, Inc.'s, or Cisco, former connected devices business), represented 10% and 13% of net revenue, respectively. In 2017, Technicolor represented less than 10% of our net revenue. In November 2015, Technicolor acquired Cisco's connected devices business. The 2015 net revenue percentage did not include 1% for Technicolor.
Products shipped to Asia accounted for 89%, 93% and 91% of our net revenue in the years ended December 31, 2017, 2016 and 2015, respectively. Products shipped to China and Taiwan accounted for 71% and 7%, respectively, of our net revenue in the year ended December 31, 2017. Products shipped to China and Taiwan accounted for 78% and 6%, respectively, of our net revenue in the year ended December 31, 2016. Products shipped to China and Taiwan accounted for 77% and 8%, respectively, of our net revenue in the year ended December 31, 2015. Although a large percentage of our products are shipped to Asia, we believe that a significant number of the systems designed by these customers and incorporating our semiconductor products are then sold outside Asia. For example, we believe revenue generated from sales of our digital terrestrial set-top box products during the years ended December 31, 2017, 2016 and 2015 related principally to sales to Asian set-top box manufacturers delivering products into Europe, Middle East, and Africa, or EMEA markets. Similarly, revenue generated from sales of our cable modem products during the years ended December 31, 2017, 2016 and 2015 related principally to sales to Asian ODM’s and contract manufacturers delivering products into European and North American markets. To date, all of our sales have been denominated in United States dollars. See Note 13 to our consolidated financial statements, included in Part IV,
12
Item 15 of this Report for a discussion of total revenue by geographical region for the years ended December 31, 2017, 2016 and 2015.
Sales and Marketing
We sell our products worldwide through multiple channels, using our direct sales force, third party sales representatives, and a network of domestic and international distributors. We have direct sales personnel covering the United States, Europe and Asia, and operate customer engineering support offices in Carlsbad, Irvine, and San Jose in California; Tokyo in Japan; Shanghai and Shenzhen in China; Hsinchu in Taiwan; Seoul in South Korea; Bangalore in India; Burnaby in Canada; Herzliya in Israel; and Paterna in Spain. We also employ a staff of field applications engineers to provide direct engineering support locally to some of our customers.
Our distributors are independent entities that assist us in identifying and servicing customers in a particular territory, usually on a non-exclusive basis. Sales through distributors accounted for approximately 34%, 19% and 13% of our net revenue in the years ended December 31, 2017, 2016 and 2015, respectively.
Our sales cycles typically require a significant amount of time and a substantial expenditure of resources before we can realize revenue from the sale of products, if any. Our typical sales cycle consists of a multi-month sales and development process involving our customers’ system designers and management. The typical time from early engagement by our sales force to actual product introduction ranges from nine to twelve months for the consumer market, to as much as 18 to 24 months for the cable and satellite markets, and 36 months or longer for industrial, wired and wireless infrastructure markets. If successful, this process culminates in a customer’s decision to use our products in its system, which we refer to as a design-win. Volume production may begin within three to twelve months after a design-win, depending on the complexity of our customer’s product and other factors upon which we may have little or no influence. Once our products have been incorporated into a customer’s design, they are likely to be used for the life cycle of the customer’s product. Thus, a design-win may result in an extended period of revenue generation. Conversely, a design-loss to our competitors, may adversely impact our financial results for an extended period of time.
We generally receive purchase orders from our customers approximately six to twenty-six weeks prior to the scheduled product delivery date. Because of the scheduling requirements of our foundries and assembly and test contractors, we generally provide our contractors production forecasts six to twelve months in advance and place firm orders for products with our suppliers up to twenty-six weeks prior to the anticipated delivery date, in some cases without a purchase order from our own customers. Our standard warranty provides that products containing defects in materials, workmanship or product performance may be returned for a refund of the purchase price or for replacement, at our discretion.
Manufacturing
We use third-party foundries and assembly and test contractors to manufacture, assemble and test our products. This outsourced manufacturing approach allows us to focus our resources on the design, sale and marketing of our products. Our engineers work closely with our foundries and other contractors to increase yield, lower manufacturing costs and improve product quality.
Wafer Fabrication. We utilize an increasing range of process technologies to manufacture our products, from standard CMOS to more exotic processes including SiGe and GaAs. Within this range of processes, we use a variety of process technology nodes ranging from 0.18µ down to 14 nanometer. We depend on independent silicon foundry manufacturers to support our wafer fabrication requirements. Our key foundry partners include United Microelectronics Corporation or UMC in Taiwan and Singapore, Taiwan Semiconductor Manufacturing Corporation or TSMC in Taiwan, Semiconductor Manufacturing International Corporation or SMIC in China, Global Foundries Inc. in Singapore, Tower-Jazz Semiconductor in Newport Beach California, and WIN Semiconductor in Taiwan.
Assembly/packaging and Test. Upon completion of the silicon processing at the foundry, we forward the finished silicon wafers to independent assembly/packaging and test service subcontractors. The majority of our assembly/packaging and test requirements are supported by the following independent subcontractors: Advanced Semiconductor Engineering or ASE in Taiwan (assembly/packaging and test), Giga Solution Technology Co. Ltd. in Taiwan (test only), Amkor Technology in Korea, Philippines, and China (assembly/packaging and test), United Test and Assembly Center or UTAC Holdings Ltd. in Singapore and China (assembly/packaging and test), SIGURD Microelectronics Corp. in Taiwan (test only), and Unisem (M) Berhad in China (assembly/packaging only).
13
Quality Assurance. We have implemented significant quality assurance procedures to assure high levels of product quality for our customers. We closely monitor the work-in-progress information and production records maintained by our suppliers, and communicate with our third-party contractors to assure high levels of product quality and an efficient manufacturing time cycle. Upon successful completion of the quality assurance procedures, all of our products are stored and shipped to our customers or distributors directly from our third-party contractors in accordance with our shipping instructions.
Research and Development
We believe that our future success depends on our ability to both improve our existing products and to develop new products for both existing and new markets. We direct our research and development efforts largely to the development of new high-performance, mixed-signal RF transceivers and SOCs for the connected home, wired and wireless infrastructure, and industrial and multi-market applications. We target applications that require stringent overall system performance and low power consumption. As new and challenging communication applications proliferate, we believe that many of these applications may benefit from our SoC solutions combining analog and mixed-signal processing with digital signal processing functions. We have assembled a team of highly skilled semiconductor and embedded software design engineers with expertise in broadband RF, mixed-signal and high-performance analog integrated circuit design, digital signal processing, communications systems and SoC design. As of December 31, 2017, we had approximately 512 employees in our research and development group. Our engineering design teams are located in Carlsbad, Irvine, and San Jose in California; Shenzhen in China; Hsinchu in Taiwan; Bangalore in India; Burnaby in Canada; Herzliya in Israel and Paterna in Spain. Our research and development expense was $112.3 million, $97.7 million and $85.4 million in 2017, 2016 and 2015, respectively.
Competition
We compete with both established and development-stage semiconductor companies that design, manufacture and market analog and mixed-signal broadband RF receivers, optical interconnects, high-performance interface, data and video compression and encryption, and power management products. Our competitors include companies with much longer operating histories, greater name recognition, access to larger customer bases and substantially greater financial, technical and operational resources, as well as smaller companies specializing in narrow markets, to internal or vertically integrated engineering groups within certain of our customers. In addition, our industry is experiencing substantial consolidation. As a result, our competitors are increasingly large multi-national semi-conductor companies with substantial market influence. Our competitors may develop products that are similar or superior to ours. We consider our primary competitors to be companies with a proven track record of supporting market leaders and the technical capability to develop and bring to market competing broadband RF receiver and RF receiver SoC, modem, and optical interconnect products. Our primary merchant semiconductor competitors include Silicon Labs, NXP Semiconductors N.V (which is currently subject to a potential acquisition by Qualcomm Technologies, Inc.), RDA Microelectronics, Inc., MediaTek, Inc., Broadcom Ltd, Rafael Microelectronics, Inc., Inphi Corporation, M/A-COM Technology Solutions Holdings, Inc., Semtech Corporation, Qorvo Inc., Microsemi Corporation, Texas Instruments, Sigma Designs, Inc., HiSilicon Technologies Co., Ltd., Analog Devices, Integrated Device Technology, Inc. Renesas Electronics Corporation, Maxim Integrated Products, Inc., Monolithic Power Systems, Microchip Technology, Inc., Ambarella, Inc., and Infineon Technologies AG. Because our products often are building block semiconductors which provide functions that in some cases can be integrated into more complex integrated circuits, we also face competition from manufacturers of integrated circuits, some of which may be existing customers or platform partners that develop their own integrated circuit products. If we cannot offer an attractive solution for applications where our competitors offer more fully integrated products, we may lose significant market share to our competitors. Certain of our competitors have fully-integrated tuner/demodulator/video processing solutions targeting high-performance cable, satellite, or DTV applications, and thereby potentially provide customers with smaller and cheaper solutions. Some of our targeted customers for our optical interconnect solutions are module makers who are vertically integrated, where we compete with internally supplied components, and we compete with much larger analog and mixed-signal catalog competitors in the multi-market high-performance analog markets.
The market for RF, mixed-signal and high-performance analog semiconductor products is highly competitive, and we believe that it will grow more competitive as a result of continued technological advances. We believe that the principal competitive factors in our markets include the following:
• | product performance; |
• | features and functionality; |
• | energy efficiency; |
• | size; |
14
• | ease of system design; |
• | customer support; |
• | product roadmap; |
• | reputation; |
• | reliability; and |
• | price. |
We believe that we compete favorably as measured against each of these criteria. However, our ability to compete in the future will depend upon the successful design, development and marketing of compelling RF, mixed-signal and high-performance analog semiconductor integrated solutions for high growth communications markets. In addition, our competitive position will depend on our ability to continue to attract and retain talent while protecting our intellectual property.
Intellectual Property Rights
Our success and ability to compete depend, in part, upon our ability to establish and adequately protect our proprietary technology and confidential information. To protect our technology and confidential information, we rely on a combination of intellectual property rights, including patents, trade secrets, copyrights and trademarks. We also protect our proprietary technology and confidential information through the use of internal and external controls, including contractual protections with employees, contractors, business partners, consultants and advisors. Protecting mask works, or the “topography” or semiconductor material designs, of our integrated circuit products is of particular importance to our business and we seek to prevent or limit the ability of others to copy, reproduce or distribute our mask works.
We have 1129 issued patents and 294 patent applications pending in the United States. We also have 42 issued foreign patents and 17 other pending foreign patent applications, based on our issued patents and pending patent applications in the United States.
We are the owner of approximately 22 trademarks that have been registered and/or allowed for registration in the United States. We own foreign counterparts (including approximately 33 foreign registrations) of certain of these registered trademarks in Australia, Canada, Chile, China, the EU, India, Israel, Japan, Korea, Singapore and Taiwan. We also claim common law rights in certain other trademarks that are not registered.
We may not gain any competitive advantages from our patents and other intellectual property rights. Our existing and future patents may be circumvented, designed around, blocked or challenged as to inventorship, ownership, scope, validity or enforceability. It is possible that we may be provided with information in the future that could negatively affect the scope or enforceability of either our present or future patents. Furthermore, our pending and future patent applications may or may not be granted under the scope of the claims originally submitted in our patent applications. The scope of the claims submitted or granted may or may not be sufficiently broad to protect our proprietary technologies. Moreover, we have adopted a strategy of seeking limited patent protection with respect to the technologies used in or relating to our products.
We are a party to a number of license agreements for various technologies, such as a license agreement with Intel Corporation relating to demodulator technologies that are licensed specifically for use in our products for cable set-top boxes. The agreement was originally entered into with Texas Instruments but was subsequently assigned to Intel Corporation as part of Intel Corporation’s acquisition of Texas Instruments’ cable modem product line in 2010. The license agreement with Intel Corporation has a perpetual term, but Intel Corporation may terminate the agreement for any uncured material breach or in the event of bankruptcy. If the agreement is terminated, we would not be able to manufacture or sell products that contain the demodulator technology licensed from Intel Corporation, and there would be a delay in the shipment of our products containing the technology until we found a replacement for the demodulator technology in the marketplace on commercially reasonable terms or we developed the demodulator technology itself. We believe we could find a substitute for the currently licensed demodulator technology in the marketplace on commercially reasonable terms or develop the demodulator technology ourselves. In either case, obtaining new licenses or replacing existing technology could have a material adverse effect on our business, as described in “Risk Factors — Risks Related to Our Business — We utilize a significant amount of intellectual property in our business. If we are unable to protect our intellectual property, our business could be adversely affected.”
15
The semiconductor industry is characterized by frequent litigation and other vigorous offensive and protective enforcement actions over rights to intellectual property. Moreover, there are numerous patents in the semiconductor industry, and new patents are being granted rapidly worldwide. Our competitors may obtain patents that block or limit our ability to develop new technology and/or improve our existing products. If our products were found to infringe any patents or other intellectual property rights held by third parties, we could be prevented from selling our products or be subject to litigation fees, statutory fines and/or other significant expenses. We may be required to initiate litigation in order to enforce any patents issued to us, or to determine the scope or validity of a third-party’s patent or other proprietary rights. We may in the future be contacted by third parties suggesting that we seek a license to intellectual property rights that they may believe we are infringing. In addition, in the future, we may be subject to lawsuits by third parties seeking to enforce their own intellectual property rights, as described in “Risk Factors — Risks Related to Our Business — We have settled in the past and are currently a party to intellectual property litigation and may face additional claims of intellectual property infringement. Current litigation and any future litigation could be time-consuming, costly to defend or settle and result in the loss of significant rights” and in “Item 3 — Legal Proceedings.”
Employees
As of December 31, 2017, we had approximately 753 employees, including 512 in research and development, 99 in sales and marketing, 36 in operations and semiconductor technology and 106 in administration. None of our employees is represented by a labor organization or under any collective bargaining arrangement, and we have never had a work stoppage. We consider our employee relations to be good.
Backlog
Our sales are made primarily pursuant to standard purchase orders. Because industry practice allows customers to reschedule, or in some cases, cancel orders on relatively short notice, we do not believe that backlog is a good indicator of our future sales.
Geographic Information
For the years ended December 31, 2017, 2016 and 2015, 89%, 93% and 91%, respectively, of our net revenue was generated from products shipped to Asia, including 71%, 78% and 77%, respectively, from products shipped to China, while 2%, 2% and 4%, respectively of our net revenues was generated from shipments within the United States. As of December 31, 2017, 84% and 16% of our long-lived assets were located within the United States and Singapore, respectively. As of December 31, 2016, 55% and 39% of our long-lived assets were located within the United States and Singapore, respectively.
Seasonality
The semiconductor industry is highly cyclical and is characterized by constant and rapid technological change, rapid product obsolescence and price erosion, evolving technical standards, short product life cycles and wide fluctuations in product supply and demand. From time to time, these and other factors, together with changes in general economic conditions, cause significant upturns and downturns in the industry, and in our business in particular.
In addition, our operating results are subject to substantial quarterly and annual fluctuations due to a number of factors, such as the overall demand volatility for semiconductor solutions across a diverse range of communications, industrial and multimarket applications, the timing of receipt, reduction or cancellation of significant orders, the gain or loss of significant customers, market acceptance of our products and our customers’ products, our ability to timely develop, introduce and market new products and technologies, the availability and cost of products from our suppliers, new product and technology introductions by competitors, intellectual property disputes and the timing and extent of product development costs.
ITEM 1A. | RISK FACTORS |
This Annual Report on Form 10-K, or Form 10-K, including any information incorporated by reference herein, contains forward-looking statements within the meaning of Section 27A of the Securities Act of 1933, as amended, referred to as the Securities Act, and Section 21E of the Securities Exchange Act of 1934, as amended, referred to as the Exchange Act. In some cases, you can identify forward-looking statements by terms such as “may,” “will,” “should,” “expect,” “plan,” “intend,” “forecast,” “anticipate,” “believe,” “estimate,” “predict,” “potential,” “continue” or the negative of these terms or other comparable terminology. The forward-looking statements contained in this 10-K involve known and unknown risks, uncertainties and situations that may cause our or our industry’s actual results, level of activity, performance or achievements to be materially different from any future results, levels of activity, performance or achievements expressed or implied by these statements. These factors include those listed below in this Item 1A and those discussed elsewhere in this Form 10-K. We
16
encourage investors to review these factors carefully. We may from time to time make additional written and oral forward-looking statements, including statements contained in our filings with the SEC. We do not undertake to update any forward-looking statement that may be made from time to time by or on behalf of us, whether as a result of new information, future events or otherwise, except as required by law.
Before you invest in our securities, you should be aware that our business faces numerous financial and market risks, including those described below, as well as general economic and business risks. The following discussion provides information concerning the material risks and uncertainties that we have identified and believe may adversely affect our business, our financial condition and our results of operations. Before you decide whether to invest in our securities, you should carefully consider these risks and uncertainties, together with all of the other information included in this Form 10-K and in our other public filings, which could materially affect our business, financial condition or future results.
During 2017, we acquired the G.hn business of Marvell and Exar Corporation. For the risks relating to our recent acquisitions, please refer to the section of these risk factors captioned “Risks Relating to Our Recent Acquisitions.”
Risks Related to Our Business
We face intense competition and expect competition to increase in the future, which could have an adverse effect on our revenue, revenue growth rate, if any, and market share.
The global semiconductor market in general, and the connected home, wired and wireless infrastructure, and broader industrial and communications analog and mixed-signal markets in particular, are highly competitive. We compete in different target markets to various degrees on the basis of a number of principal competitive factors, including our products’ performance, features and functionality, energy efficiency, size, ease of system design, customer support, product roadmap, reputation, reliability and price. We expect competition to increase and intensify as a result of industry consolidation and the resulting creation of larger semiconductor companies. Large semiconductor companies resulting from industry consolidation could enjoy substantial market power, which they could exert through, among other things, aggressive pricing that could adversely affect our customer relationships and revenues. In addition, we expect the internal resources of large, integrated original equipment manufacturers, or OEMs, may continue to enter our markets. Increased competition could result in price pressure, reduced profitability and loss of market share, any of which could materially and adversely affect our business, revenue, revenue growth rates and operating results.
As our products are integrated into a variety of communications and industrial platforms, our competitors range from large, international merchant semiconductor companies offering a wide range of semiconductor products to smaller companies specializing in narrow markets, to internal or vertically integrated engineering groups within certain of our customers. Our primary merchant semiconductor competitors include Silicon Labs, NXP Semiconductors N.V (which is currently subject to a potential acquisition by Qualcomm Technologies, Inc.), RDA Microelectronics, Inc., MediaTek. Inc., Broadcom Ltd, Rafael Microelectronics, Inc., Inphi Corporation, M/A-COM Technology Solutions Holdings, Inc., Semtech Corporation, Qorvo Inc., Microsemi Corporation, Texas Instruments, Sigma Designs, Inc., HiSilicon Technologies Co., Ltd., Analog Devices, Integrated Device Technology, Inc. Renesas Electronics Corporation, Maxim Integrated Products, Inc., Monolithic Power Systems, Microchip Technology, Inc., Ambarella, Inc., and Infineon Technologies AG. It is quite likely that competition in the markets in which we participate will increase in the future as existing competitors improve or expand their product offerings. In addition, it is quite likely that a number of other public and private companies are in the process of developing competing products for our current and target markets. Because our products often are building block semiconductors which provide functions that in some cases can be integrated into more complex integrated circuits, we also face competition from manufacturers of integrated circuits, some of which may be existing customers or platform partners that develop their own integrated circuit products. If we cannot offer an attractive solution for applications where our competitors offer more fully integrated products, we may lose significant market share to our competitors. Certain of our competitors have fully-integrated tuner/demodulator/video processing solutions targeting high-performance cable, satellite, or DTV applications, and thereby potentially provide customers with smaller and cheaper solutions. Some of our targeted customers for our optical interconnect solutions are module makers who are vertically integrated, where we compete with internally supplied components, and we compete with much larger analog and mixed-signal catalog competitors in the multi-market high-performance analog markets.
Our ability to compete successfully depends on factors both within and outside of our control, including industry and general economic trends. During past periods of downturns in our industry, competition in the markets in which we operate intensified as manufacturers of semiconductors reduced prices in order to combat production overcapacity and high inventory levels. Many of our competitors have substantially greater financial and other resources with which to withstand similar adverse economic or market conditions in the future. Moreover, the competitive landscape is changing as a result of intense
17
consolidation within our industry as some of our competitors have merged with or been acquired by other competitors, and other competitors have begun to collaborate with each other. These developments may materially and adversely affect our current and future target markets and our ability to compete successfully in those markets.
We depend on a limited number of customers, that have undergone or are undergoing consolidation and who themselves are dependent on a consolidating set of service provider customers, for a substantial portion of our revenue, and the loss of, or a significant reduction in orders from one or more of our major customers could have a material adverse effect on our revenue and operating results. In addition, Exar's business is substantially dependent on distributor agreements.
For fiscal 2017, one customer accounted for 25% of our net revenue, and our ten largest customers accounted for 58% of our net revenue. For fiscal 2016, two customers accounted for approximately 37% of our net revenue, and our ten largest customers collectively accounted for approximately 74% of our net revenue. For fiscal 2015, two customers accounted for approximately 41% of our net revenue, and our ten largest customers collectively accounted for approximately 76% of our net revenue. We expect that our operating results for the foreseeable future will continue to show a substantial but declining percentage of sales dependent on a relatively small number of customers and on the ability of these customers to sell products that incorporate our RF receivers or RF receiver SoCs, digital STB video SoCs, DBS ODU receiver SOCs, and MoCA®, G.hn connectivity solutions and high-performance analog solutions. In the future, these customers may decide not to purchase our products at all, may purchase fewer products than they did in the past, or may defer or cancel purchases or otherwise alter their purchasing patterns. Factors that could affect our revenue from these large customers include the following:
• | substantially all of our sales to date have been made on a purchase order basis, which permits our customers to cancel, change or delay product purchase commitments with little or no notice to us and without penalty; |
• | some of our customers have sought or are seeking relationships with current or potential competitors which may affect their purchasing decisions; and |
• | service provider and OEM consolidation across cable, satellite, and fiber markets could result in significant changes to our customers’ technology development and deployment priorities and roadmaps, which could affect our ability to forecast demand accurately and could lead to increased volatility in our business. |
In addition, delays in development could impair our relationships with our strategic customers and negatively impact sales of the products under development. Moreover, it is possible that our customers may develop their own products or adopt a competitor’s solution for products that they currently buy from us. If that happens, our sales would decline and our business, financial condition and results of operations could be materially and adversely affected.
Our relationships with some customers may deter other potential customers who compete with these customers from buying our products. To attract new customers or retain existing customers, we may offer these customers favorable prices on our products. In that event, our average selling prices and gross margins would decline. The loss of a key customer, a reduction in sales to any key customer or our inability to attract new significant customers could seriously impact our revenue and materially and adversely affect our results of operations.
Exar derived a substantial portion of its business from two distributors, and we anticipate that sales of our products through these distributors will continue to account for a significant portion of our revenues from sales of Exar's integrated circuit products. In addition, Exar's agreements with these distributors provide protection against price reduction on their inventories of our products. The loss of either or both of these distributors could have a material adverse effect on our business and results of operations, and price reductions associated with their inventories of our products could have a substantial adverse effect on our operating results in the event of a dramatic decline in selling prices for these products.
A significant portion of our revenue is attributable to demand for our products in markets for connected home solutions, and development delays and consolidation trends among cable and satellite television operators could adversely affect our future revenues and operating results.
For fiscal 2017, 2016 and 2015, revenue directly attributable to connected home applications accounted for approximately 69%, 89% and 98% of our net revenue, respectively. Delays in the development of, or unexpected developments in the connected home markets could have an adverse effect on order activity by original equipment manufacturers in these markets and, as a result, on our business, revenue, operating results and financial condition. In addition, consolidation trends among pay-TV and broadband operators may continue, which could have a material adverse effect on our future operating results and financial condition. Most recently, we experienced sharper than previously anticipated declines in our legacy video SoC revenues as a result of the acquisition of Time Warner Cable by Charter Communications.
18
If we fail to penetrate new applications and markets, our revenue, revenue growth rate, if any, and financial condition could be materially and adversely affected.
We sell most of our products to manufacturers of cable broadband voice and data modems and gateways, pay-TV set-top boxes and gateways into cable and satellite operator markets, satellite outdoor units or LNB’s, optical modules for long-haul and metro telecommunications markets, and RF transceivers and modem solutions for wireless infrastructure markets. With the acquisition of Exar, we expanded our product offerings to include power management and interface technologies which are ubiquitous functions in new and existing markets such as wireless and wireline communications infrastructure, broadband access, industrial, enterprise network, and automotive applications. Our future revenue growth, if any, will depend in part on our ability to further penetrate into, and expand beyond, these markets with analog and mixed-signal solutions targeting the markets for high-speed optical interconnects for data center, metro, and long-haul optical modules, telecommunications wireless infrastructure, and cable DOCSIS 3.1 network infrastructure products. Each of these markets presents distinct and substantial risks. If any of these markets do not develop as we currently anticipate, or if we are unable to penetrate them successfully, it could materially and adversely affect our revenue and revenue growth rate, if any.
Broadband data modems and gateways and pay-TV and satellite set-top boxes and video gateways continue to represent our largest North American and European revenue generator. The North American and European pay-TV market is dominated by only a few OEMs, including Technicolor, Arris Group, Inc., Compal Broadband Networks, Humax Co., Ltd., and Samsung Electronics Co., Ltd. These OEMs are large multinational corporations with substantial negotiating power relative to us and are undergoing significant consolidation. Securing design wins with any of these companies requires a substantial investment of our time and resources. Even if we succeed, additional testing and operational certifications will be required by the OEMs’ customers, which include large pay-TV television companies such as Comcast Corporation, Liberty Global plc, Spectrum, Sky, AT&T and EchoStar Corporation. In addition, our products will need to be compatible with other components in our customers’ designs, including components produced by our competitors or potential competitors. There can be no assurance that these other companies will support or continue to support our products.
If we fail to penetrate these or other new markets upon which we target our resources, our revenue and revenue growth rate, if any, likely will decrease over time and our financial condition could suffer.
We may be unable to make the substantial and productive research and development investments that are required to remain competitive in our business.
The semiconductor industry requires substantial investment in research and development in order to develop and bring to market new and enhanced technologies and products. Many of our products originated with our research and development efforts, which we believe have provided us with a significant competitive advantage. For fiscal 2017, our research and development expense was $112.3 million. For fiscal 2016, our research and development expense was $97.7 million. For fiscal 2015, our research and development expense was $85.4 million. For fiscal 2017 and 2016, we continued to increase our research and development expenditures as part of our strategy of devoting focused research and development efforts on the development of innovative and sustainable product platforms. We are committed to investing in new product development internally in order to stay competitive in our markets and plan to maintain research and development and design capabilities for new solutions in advanced semiconductor process nodes such as 28nm and 16nm and beyond. We do not know whether we will have sufficient resources to maintain the level of investment in research and development required to remain competitive as semiconductor process nodes continue to shrink and become increasingly complex. In addition, we cannot assure you that the technologies that are the focus of our research and development expenditures will become commercially successful.
We may not sustain our growth rate, and we may not be able to manage future growth effectively.
We have been experiencing significant growth in a short period of time. Our net revenue increased from approximately $300.4 million in 2015, to $387.8 million in 2016 and $420.3 million in 2017, in part due to acquisitions. We may not achieve similar growth rates in future periods. You should not rely on our operating results for any prior quarterly or annual periods as an indication of our future operating performance. If we are unable to maintain adequate revenue growth, our financial results could suffer and our stock price could decline.
To manage our growth successfully and handle the responsibilities of being a public company, we believe we must effectively, among other things:
• | recruit, hire, train and manage additional qualified engineers for our research and development activities, especially in the positions of design engineering, product and test engineering and applications engineering; |
19
• | add sales personnel and expand customer engineering support offices; |
• | implement and improve our administrative, financial and operational systems, procedures and controls; and |
• | enhance our information technology support for enterprise resource planning and design engineering by adapting and expanding our systems and tool capabilities, and properly training new hires as to their use. |
If we are unable to manage our growth effectively, we may not be able to take advantage of market opportunities or develop new products and we may fail to satisfy customer requirements, maintain product quality, execute our business plan, or respond to competitive pressures.
The complexity of our products could result in unforeseen delays or expenses caused by undetected defects or bugs, which could reduce the market acceptance of our new products, damage our reputation with current or prospective customers and adversely affect our operating costs.
Highly complex products like our broadband RF receivers and RF receiver SoCs, physical medium devices for optical modules, RF transceiver and modem solutions for wireless infrastructure markets, and high-performance analog solutions may contain defects and bugs when they are first introduced or as new versions are released. Where any of our products, including legacy acquired products, contain defects or bugs, or have reliability, quality or compatibility problems, we may not be able to successfully correct these problems. Consequently, our reputation may be damaged and customers may be reluctant to buy our products, which could materially and adversely affect our ability to retain existing customers and attract new customers, and our financial results. In addition, these defects or bugs could interrupt or delay sales to our customers. If any of these problems are not found until after we have commenced commercial production of a new product (as in the case of the legacy Entropic products experiencing warranty claims), we may be required to incur additional development costs and product recall, repair or replacement costs, and our operating costs could be adversely affected. These problems may also result in warranty or product liability claims against us by our customers or others that may require us to make significant expenditures to defend these claims or pay damage awards. In the event of a warranty claim, we may also incur costs if we compensate the affected customer. We maintain product liability insurance, but this insurance is limited in amount and subject to significant deductibles. There is no guarantee that our insurance will be available or adequate to protect against all claims. We also may incur costs and expenses relating to a recall of one of our customers’ products containing one of our devices. The process of identifying a recalled product in devices that have been widely distributed may be lengthy and require significant resources, and we may incur significant replacement costs, contract damage claims from our customers and reputational harm. Costs or payments made in connection with warranty and product liability claims and product recalls could materially affect our financial condition and results of operations.
Average selling prices of our products could decrease rapidly, which would have a material adverse effect on our revenue and gross margins.
We may experience substantial period-to-period fluctuations in future operating results due to the erosion of our average selling prices. From time to time, we have reduced the average unit price of our products due to competitive pricing pressures, new product introductions by us or our competitors, and for other reasons, and we expect that we will have to do so again in the future. In particular, we believe that industry consolidation has provided a number of larger semiconductor companies with substantial market power, which has had an adverse impact on selling prices in some of our markets. If we are unable to offset any reductions in our average selling prices by increasing our sales volumes or introducing new products with higher margins, our revenue and gross margins will suffer. To support our gross margins, we must develop and introduce new products and product enhancements on a timely basis and continually reduce our and our customers’ costs. Our inability to do so would cause our revenue and gross margins to decline. In addition, under Exar's agreements with key distributors, we provide protection for reductions in selling prices of the distributors' inventory, which could have a significant adverse effect on our operating results if the selling prices for those products fell dramatically.
If we fail to develop and introduce new or enhanced products on a timely basis, our ability to attract and retain customers could be impaired and our competitive position could be harmed.
We operate in a dynamic environment characterized by rapidly changing technologies and industry standards and technological obsolescence. To compete successfully, we must design, develop, market and sell new or enhanced products that provide increasingly higher levels of performance and reliability and meet the cost expectations of our customers. The introduction of new products by our competitors, the market acceptance of products based on new or alternative technologies, or the emergence of new industry standards could render our existing or future products obsolete. Our failure to anticipate or timely develop new or enhanced products or technologies in response to technological shifts could result in decreased revenue
20
and our competitors winning more competitive bid processes, known as “design wins.” In particular, we may experience difficulties with product design, manufacturing, marketing or certification that could delay or prevent our development, introduction or marketing of new or enhanced products. If we fail to introduce new or enhanced products that meet the needs of our customers or penetrate new markets in a timely fashion, we will lose market share and our operating results will be adversely affected.
In particular, we believe that we will need to develop new products in part to respond to changing dynamics and trends in our end user markets, including (among other trends) consolidation among cable and satellite operators, potential industry shifts away from the hardware devices and other technologies that incorporate our products, and changes in consumer television viewing habits and how consumers access and receive broadcast content and digital broadband services. We cannot predict how these trends will continue to develop or how or to what extent they may affect our future revenues and operating results. We believe that we will need to continue to make substantial investments in research and development in an attempt to ensure a product roadmap that anticipates these types of changes; however, we cannot provide any assurances that we will accurately predict the direction in which our markets will evolve or that we will be able to develop, market, or sell new products that respond to such changes successfully or in a timely manner, if at all.
We have settled in the past and are currently a party to intellectual property litigation and may face additional claims of intellectual property infringement. Current litigation and any future litigation could be time-consuming, costly to defend or settle and result in the loss of significant rights.
The semiconductor industry is characterized by companies that hold large numbers of patents and other intellectual property rights and that vigorously pursue, protect and enforce intellectual property rights. Third parties have in the past and may in the future assert against us and our customers and distributors their patent and other intellectual property rights to technologies that are important to our business. In particular, from time to time, we receive correspondence from competitors seeking to engage us in discussions concerning potential claims against us, and we receive correspondence from customers seeking indemnification for potential claims related to infringement claims asserted against down-stream users of our products. We investigate these requests as received and could be required to enter license agreements with respect to third party intellectual property rights or indemnify third parties, either of which could have an adverse effect on our future operating results.
On January 21, 2014, CrestaTech Technology Corporation, or CrestaTech, filed a complaint for patent infringement against us in the United States District Court of Delaware, or the District Court Litigation. In its complaint, CrestaTech alleges that we infringe U.S. Patent Nos. 7,075,585, or the ‘585 Patent and 7,265,792, or the ‘792 Patent. In addition to asking for compensatory damages, CrestaTech alleges willful infringement and seeks a permanent injunction. CrestaTech also names Sharp Corporation, Sharp Electronics Corp. and VIZIO, Inc. as defendants based upon their alleged use of our television tuners.
On January 28, 2014, CrestaTech filed a complaint with the U.S. International Trade Commission, or ITC, again naming, among others, us, Sharp, Sharp Electronics, and VIZIO, or the ITC Investigation. On May 16, 2014, the ITC granted CrestaTech’s motion to file an amended complaint adding six OEM Respondents, namely, SIO International, Inc., Hon Hai Precision Industry Co., Ltd., Wistron Corp., Wistron Infocomm Technology (America) Corp., Top Victory Investments Ltd. and TPV International (USA), Inc. which are collectively referred to with us, Sharp and VIZIO as the Company Respondents. CrestaTech’s ITC complaint alleged a violation of 19 U.S.C. § 1337 through the importation into the United States, the sale for importation, or the sale within the United States after importation of MaxLinear’s accused products that CrestaTech alleged infringe the same two patents asserted in the Delaware action. Through its ITC complaint, CrestaTech sought an exclusion order preventing entry into the United States of certain of our television tuners and televisions containing such tuners from Sharp, Sharp Electronics, and VIZIO. CrestaTech also sought a cease and desist order prohibiting the Company Respondents from engaging in the importation into, sale for importation into, the sale after importation of, or otherwise transferring within the United States certain of our television tuners or televisions containing such tuners.
On March 10, 2014, the court stayed the District Court Litigation pending resolution of the ITC Investigation. Per the Court’s request, on April 19, 2017, the parties submitted a status report in the District Court Litigation. In their report, the parties suggested that the District Court Litigation remain stayed pending the Federal Circuit’s decision in the appeal of the ‘585 IPRs, and any subsequent appeal thereof, as more fully described below. Because the Federal Court appeals described below have concluded, the parties are to file a joint status report in the District Court Litigation.
On December 15, 2014, the ITC held a trial in the ITC Investigation. On February 27, 2015, the Administrative Law Judge, or the ALJ, issued a written Initial Determination, or ID, ruling that the Company Respondents do not violate Section 1337 in connection with CrestaTech’s asserted patents because CrestaTech failed to satisfy the economic prong of the domestic
21
industry requirement pursuant to Section 1337(a)(2). In addition, the ID stated that certain of our television tuners and televisions incorporating those tuners manufactured and sold by certain customers infringe three claims of the ‘585 Patent (claims 10, 12 and 13), and these three claims were not determined to be invalid. On April 30, 2015, the ITC issued a notice indicating that it intended to review portions of the ID finding no violation of Section 1337, including the ID’s findings of infringement with respect to, and validity of, the ‘585 Patent, and the ID’s finding that CrestaTech failed to establish the existence of a domestic industry within the meaning of Section 1337.
The ITC subsequently issued its opinion, which terminated its investigation. The opinion affirmed the findings of the ALJ that no violation of Section 1337 had occurred because CrestaTech had failed to establish the economic prong of the domestic industry requirement. The ITC also affirmed the ALJ's finding of infringement with respect to the three claims of the '585 Patent that were not held to be invalid.
On November 30, 2015, CrestaTech filed an appeal of the ITC decision with the United States Court of Appeals for the Federal Circuit, or the Federal Circuit. On March 7, 2016, CrestaTech voluntarily dismissed its appeal, resulting in a final determination of the ITC Investigation in our favor.
In addition, we have filed four petitions for inter partes review, or IPR, by the US Patent Office, two for each of the CrestaTech patents asserted against us. The Patent Trial and Appeal Board, or the PTAB, did not institute two of these IPRs as being redundant to IPRs filed by another party that were already underway for the same CrestaTech patent. The remaining two petitions were instituted or instituted-in-part meaning, together with the IPRs filed by third parties, there were six IPR proceedings instituted involving the two CrestaTech patents asserted against us.
In October 2015, the PTAB issued final decisions in two of the six pending IPR proceedings (one for each of the two asserted patents), holding that all of the reviewed claims are unpatentable. Included in these decisions was one of the three claims of the ‘585 Patent (claim 10) mentioned above in connection with the ITC’s final decision. CrestaTech appealed the PTAB’s decisions at the Federal Circuit. On November 8, 2016, the Federal Circuit issued an opinion affirming the PTAB’s finding of unpatentability.
In August 2016, the PTAB issued final written decisions in the remaining four pending IPR proceedings (two for each of the asserted patents), holding that many of the reviewed claims - including the two remaining claims of the ‘585 Patent which the ITC held were infringed - are unpatentable. The parties have appealed the two decisions related to the ‘585 Patent; however, no appeals were filed as to the PTAB’s rulings for the ‘792 Patent. The Federal Circuit heard oral argument on these appeals on December 4, 2017. On December 7, the Federal Circuit issued a Rule 36 affirmance in one of the ‘585 appeals, affirming that the two remaining claims that the ITC had ruled were valid and infringed (claims 12 and 13) are unpatentable. On January 25, 2018, the Federal Circuit issued its ruling in the other ‘585 appeal, vacating the Board’s ruling that certain claims were not unpatenable and remanding to the Board for further analysis of whether CrestaTech is estopped from arguing and/or has waived the right to argue whether six dependent claims are patentable.
As a result of these IPR decisions, all 13 claims that CrestaTech asserted against us in the ITC Investigation have been found to be unpatentable by the PTAB and the Federal Circuit.
On March 18, 2016, CrestaTech filed a petition for Chapter 7 bankruptcy in the Northern District of California. As a result of this proceeding, all rights in the CrestaTech asserted patents, including the right to control the pending litigation, were assigned to CF Crespe LLC, or CF Crespe. CF Crespe is now the named party in the pending IPRs, the Federal Circuit appeal and District Court Litigation.
We cannot predict the outcome of any appeal by CF Crespe or CrestaTech, the District Court Litigation, or the IPRs. Any adverse determination in the District Court Litigation could have a material adverse effect on our business and operating results.
Claims that our products, processes or technology infringe third-party intellectual property rights, regardless of their merit or resolution and including the CrestaTech claims, are costly to defend or settle and could divert the efforts and attention of our management and technical personnel. In addition, many of our customer and distributor agreements require us to indemnify and defend our customers or distributors from third-party infringement claims and pay damages in the case of adverse rulings. Claims of this sort also could harm our relationships with our customers or distributors and might deter future customers from doing business with us. In order to maintain our relationships with existing customers and secure business from new customers, we have been required from time to time to provide additional assurances beyond our standard terms. If any future proceedings result in an adverse outcome, we could be required to:
22
• | cease the manufacture, use or sale of the infringing products, processes or technology; |
• | pay substantial damages for infringement; |
• | expend significant resources to develop non-infringing products, processes or technology; |
• | license technology from the third-party claiming infringement, which license may not be available on commercially reasonable terms, or at all; |
• | cross-license our technology to a competitor to resolve an infringement claim, which could weaken our ability to compete with that competitor; or |
• | pay substantial damages to our customers or end users to discontinue their use of or to replace infringing technology sold to them with non-infringing technology. |
Any of the foregoing results could have a material adverse effect on our business, financial condition, and results of operations.
We utilize a significant amount of intellectual property in our business. If we are unable to protect our intellectual property, our business could be adversely affected.
Our success depends in part upon our ability to protect our intellectual property. To accomplish this, we rely on a combination of intellectual property rights, including patents, copyrights, trademarks and trade secrets in the United States and in selected foreign countries where we believe filing for such protection is appropriate. Effective patent, copyright, trademark and trade secret protection may be unavailable, limited or not applied for in some countries. Some of our products and technologies are not covered by any patent or patent application. We cannot guarantee that:
• | any of our present or future patents or patent claims will not lapse or be invalidated, circumvented, challenged or abandoned; |
• | our intellectual property rights will provide competitive advantages to us; |
• | our ability to assert our intellectual property rights against potential competitors or to settle current or future disputes will not be limited by our agreements with third parties; |
• | any of our pending or future patent applications will be issued or have the coverage originally sought; |
• | our intellectual property rights will be enforced in jurisdictions where competition may be intense or where legal protection may be weak; |
• | any of the trademarks, copyrights, trade secrets or other intellectual property rights that we presently employ in our business will not lapse or be invalidated, circumvented, challenged or abandoned; or |
• | we will not lose the ability to assert our intellectual property rights against or to license our technology to others and collect royalties or other payments. |
In addition, our competitors or others may design around our protected patents or technologies. Effective intellectual property protection may be unavailable or more limited in one or more relevant jurisdictions relative to those protections available in the United States, or may not be applied for in one or more relevant jurisdictions. If we pursue litigation to assert our intellectual property rights, an adverse decision in any of these legal actions could limit our ability to assert our intellectual property rights, limit the value of our technology or otherwise negatively impact our business, financial condition and results of operations.
Monitoring unauthorized use of our intellectual property is difficult and costly. Unauthorized use of our intellectual property may have occurred or may occur in the future. Although we have taken steps to minimize the risk of this occurring, any such failure to identify unauthorized use and otherwise adequately protect our intellectual property would adversely affect our business. Moreover, if we are required to commence litigation, whether as a plaintiff or defendant as has occurred with CrestaTech, not only will this be time-consuming, but we will also be forced to incur significant costs and divert our attention and efforts of our employees, which could, in turn, result in lower revenue and higher expenses.
23
We also rely on customary contractual protections with our customers, suppliers, distributors, employees and consultants, and we implement security measures to protect our trade secrets. We cannot assure you that these contractual protections and security measures will not be breached, that we will have adequate remedies for any such breach or that our suppliers, employees or consultants will not assert rights to intellectual property arising out of such contracts.
In addition, we have a number of third-party patent and intellectual property license agreements. Some of these license agreements require us to make one-time payments or ongoing royalty payments. Also, a few of our license agreements contain most-favored nation clauses or other price restriction clauses which may affect the amount we may charge for our products, processes or technology. We cannot guarantee that the third-party patents and technology we license will not be licensed to our competitors or others in the semiconductor industry. In the future, we may need to obtain additional licenses, renew existing license agreements or otherwise replace existing technology. We are unable to predict whether these license agreements can be obtained or renewed or the technology can be replaced on acceptable terms, or at all.
When we settled a trademark dispute with Linear Technology Corporation, we agreed not to register the “MAXLINEAR” mark or any other marks containing the term “LINEAR”. We may continue to use “MAXLINEAR” as a corporate identifier, including to advertise our products and services, but may not use that mark on our products. The agreement does not affect our ability to use our registered trademark “MxL”, which we use on our products. Due to our agreement not to register the “MAXLINEAR” mark, our ability to effectively prevent third parties from using the “MAXLINEAR” mark in connection with similar products or technology may be affected. If we are unable to protect our trademarks, we may experience difficulties in achieving and maintaining brand recognition and customer loyalty.
We may be subject to information technology failures, including data protection breaches and cyber-attacks, that could disrupt our operations, damage our reputation and adversely affect our business, operations, and financial results.
We rely on our information technology systems for the effective operation of our business and for the secure maintenance and storage of confidential data relating to our business and third-party businesses. Although we have implemented security controls to protect our information technology systems, experienced programmers or hackers may be able to penetrate our security controls, and develop and deploy viruses, worms and other malicious software programs that compromise our confidential information or that of third parties and cause a disruption or failure of our information technology systems. In addition, we have in the past and may in the future be subject to "phishing" attacks in which third parties send emails purporting to be from reputable companies in order to obtain personal information and infiltrate our systems to initiate wire transfers or otherwise obtain proprietary or confidential information. A number of large, public companies have recently experienced losses based on phishing attacks. Any compromise of our information technology systems could result in the unauthorized publication of our confidential business or proprietary information, result in the unauthorized release of customer, supplier or employee data, result in a violation of privacy or other laws, expose us to a risk of litigation, cause us to incur direct losses if attackers access our bank or investment accounts, or damage our reputation. The cost and operational consequences of implementing further data protection measures either as a response to specific breaches or as a result of evolving risks, could be significant. In addition, our inability to use or access our information systems at critical points in time could adversely affect the timely and efficient operation of our business. Any delayed sales, significant costs or lost customers resulting from these technology failures could adversely affect our business, operations and financial results.
Third parties with which we conduct business, such as foundries, assembly and test contractors, and distributors, have access to certain portions of our sensitive data. In the event that these third parties do not properly safeguard our data that they hold, security breaches could result and negatively impact our business, operations and financial results.
We rely on a limited number of third parties to manufacture, assemble and test our products, and the failure to manage our relationships with our third-party contractors successfully could adversely affect our ability to market and sell our products.
We do not have our own manufacturing facilities. We operate an outsourced manufacturing business model that utilizes third-party foundry and assembly and test capabilities. As a result, we rely on third-party foundry wafer fabrication, including sole sourcing for many components or products. Currently, the majority of our products are manufactured by United Microelectronics Corporation, or UMC, Global Foundries, Semiconductor Manufacturing International Corporation, or SMIC, Taiwan Semiconductor Manufacturing Corp, or TSMC, Tower-Jazz Semiconductor, and WIN Semiconductor at foundries in Taiwan, Singapore, Malaysia, China, and the United States. We also use third-party contractors for all of our assembly and test operations.
Relying on third party manufacturing, assembly and testing presents significant risks to us, including the following:
24
• | failure by us, our customers, or their end customers to qualify a selected supplier; |
• | capacity shortages during periods of high demand; |
• | reduced control over delivery schedules and quality; |
• | shortages of materials; |
• | misappropriation of our intellectual property; |
• | limited warranties on wafers or products supplied to us; and |
• | potential increases in prices. |
The ability and willingness of our third-party contractors to perform is largely outside our control. If one or more of our contract manufacturers or other outsourcers fails to perform its obligations in a timely manner or at satisfactory quality levels, our ability to bring products to market and our reputation could suffer. For example, in the event that manufacturing capacity is reduced or eliminated at one or more facilities, including as a response to the recent worldwide decline in the semiconductor industry, manufacturing could be disrupted, we could have difficulties fulfilling our customer orders and our net revenue could decline. In addition, if these third parties fail to deliver quality products and components on time and at reasonable prices, we could have difficulties fulfilling our customer orders, our net revenue could decline and our business, financial condition and results of operations would be adversely affected.
Additionally, our manufacturing capacity may be similarly reduced or eliminated at one or more facilities due to the fact that our fabrication and assembly and test contractors are all located in the Pacific Rim region, principally in China, Taiwan, Singapore and Malaysia. The risk of earthquakes in these geographies is significant due to the proximity of major earthquake fault lines, and Taiwan in particular is also subject to typhoons and other Pacific storms. Earthquakes, fire, flooding, or other natural disasters in Taiwan or the Pacific Rim region, or political unrest, war, labor strikes, work stoppages or public health crises, such as outbreaks of H1N1 flu, in countries where our contractors’ facilities are located could result in the disruption of our foundry, assembly or test capacity. Any disruption resulting from these events could cause significant delays in shipments of our products until we are able to shift our manufacturing, assembly or test from the affected contractor to another third-party vendor. There can be no assurance that alternative capacity could be obtained on favorable terms, if at all.
We do not have any long-term supply contracts with our contract manufacturers or suppliers, and any disruption in our supply of products or materials could have a material adverse effect on our business, revenue and operating results.
We currently do not have long-term supply contracts with any of our third-party vendors, including but, not limited to UMC, Global Foundries, SMIC, TSMC, Tower-Jazz Semiconductor, and WIN Semiconductor. We make substantially all of our purchases on a purchase order basis, and our contract manufacturers are not required to supply us products for any specific period or in any specific quantity. Foundry capacity may not be available when we need it or at reasonable prices. Availability of foundry capacity has in the past been reduced from time to time due to strong demand. Foundries can allocate capacity to the production of other companies’ products and reduce deliveries to us on short notice. It is possible that foundry customers that are larger and better financed than we are, or that have long-term agreements with our foundry, may induce our foundry to reallocate capacity to them. This reallocation could impair our ability to secure the supply of components that we need. We generally place orders for products with some of our suppliers approximately four to five months prior to the anticipated delivery date, with order volumes based on our forecasts of demand from our customers. Accordingly, if we inaccurately forecast demand for our products, we may be unable to obtain adequate and cost-effective foundry or assembly capacity from our third-party contractors to meet our customers’ delivery requirements, or we may accumulate excess inventories. On occasion, we have been unable to adequately respond to unexpected increases in customer purchase orders and therefore were unable to benefit from this incremental demand. None of our third-party contractors has provided any assurance to us that adequate capacity will be available to us within the time required to meet additional demand for our products.
We may have difficulty accurately predicting our future revenue and appropriately budgeting our expenses particularly as we seek to enter new markets where we may not have prior experience.
Our recent operating history has focused on developing integrated circuits for specific terrestrial, cable and satellite television, and broadband voice and data applications, and as part of our strategy, we seek to expand our addressable market into new product categories. For example, we previously expanded into the market for satellite set-top and gateway boxes and outdoor units and physical medium devices for the optical interconnect markets, and through the Broadcom and Microsemi
25
business line acquisitions in 2016, we have entered the markets for wireless telecommunications infrastructure. Through the acquisition of the G.hn business of Marvell in April 2017, we have expanded into the wired whole-home broadband connectivity market. With our acquisition of Exar in May 2017, we also entered the markets for power management and interface technologies which are ubiquitous functions in wireless and wireline communications infrastructure, broadband access, industrial, enterprise network, and automotive applications. Our limited operating experience in these new markets or potential markets we may enter, combined with the rapidly evolving nature of our markets in general, substantial uncertainty concerning how these markets may develop and other factors beyond our control, reduces our ability to accurately forecast quarterly or annual revenue. If our revenue does not increase as anticipated, we could incur significant losses due to our higher expense levels if we are not able to decrease our expenses in a timely manner to offset any shortfall in future revenue.
If we are unable to attract, train and retain qualified personnel, especially our design and technical personnel, we may not be able to execute our business strategy effectively.
Our future success depends on our ability to retain, attract and motivate qualified personnel, including our management, sales and marketing and finance, and especially our design and technical personnel. We do not know whether we will be able to retain all of these personnel as we continue to pursue our business strategy. Historically, we have encountered difficulties in hiring and retaining qualified engineers because there is a limited pool of engineers with the expertise required in our field. Competition for these personnel is intense in the semiconductor industry. As the source of our technological and product innovations, our design and technical personnel represent a significant asset. The loss of the services of one or more of our key employees, especially our key design and technical personnel, or our inability to retain, attract and motivate qualified design and technical personnel, could have a material adverse effect on our business, financial condition and results of operations.
Our business would be adversely affected by the departure of existing members of our senior management team.
Our success depends, in large part, on the continued contributions of our senior management team. None of our senior management team is bound by written employment contracts to remain with us for a specified period. In addition, we have not entered into non-compete agreements with members of our senior management team. The loss of any member of our senior management team could harm our ability to implement our business strategy and respond to the rapidly changing market conditions in which we operate.
Our customers require our products and our third-party contractors to undergo a lengthy and expensive qualification process which does not assure product sales.
Prior to purchasing our products, our customers require that both our products and our third-party contractors undergo extensive qualification processes, which involve testing of the products in the customer’s system and rigorous reliability testing. This qualification process may continue for six months or more. However, qualification of a product by a customer does not assure any sales of the product to that customer. Even after successful qualification and sales of a product to a customer, a subsequent revision our solutions, or changes in our customer’s manufacturing process or our selection of a new supplier may require a new qualification process, which may result in delays and in us holding excess or obsolete inventory. After our products are qualified, it can take six months or more before the customer commences volume production of components or devices that incorporate our products. Despite these uncertainties, we devote substantial resources, including design, engineering, sales, marketing and management efforts, to qualifying our products with customers in anticipation of sales. If we are unsuccessful or delayed in qualifying any of our products with a customer, sales of this product to the customer may be precluded or delayed, which may impede our growth and cause our business to suffer.
We are subject to risks associated with our distributors’ product inventories and product sell-through. Should any of our distributors cease or be forced to stop distributing our products, our business would suffer.
We currently sell a significant portion of our products to customers through our distributors, who maintain their own inventories of our products. For fiscal 2017, sales through distributors accounted for 34% of our net revenue. For fiscal 2016, sales through distributors accounted for 19% of our net revenue. For fiscal 2015, sales through distributors accounted for 13% of our net revenue. For some of these distributor transactions, revenue is not currently recognized until product is shipped to the end customer and the amount that will ultimately be collected is fixed or determinable. Upon shipment of product to these distributors, title to the inventory transfers to the distributor and the distributor is invoiced, generally with 30 to 60 day terms. On shipments to our distributors where revenue is not recognized, we record a trade receivable for the selling price as there is a legally enforceable right to payment, relieving the inventory for the carrying value of goods shipped since legal title has passed to the distributor, and record the corresponding gross profit in the consolidated balance sheet as a component of deferred revenue and deferred profit, representing the difference between the receivable recorded and the cost of
26
inventory shipped. Effective January 1, 2018, all distributor sales are recognized upon shipment to the distributor under U.S. generally accepted accounting principles and estimates of future pricing credits and/or stock rotation rights will reduce revenue recognized to the net amount before the actual amounts are known. If our estimates of such credits and rights are materially understated it could cause subsequent adjustments that negatively impact our revenues and gross profits in a future period.
If our distributors are unable to sell an adequate amount of their inventories of our products in a given quarter to manufacturers and end users, or if they decide to decrease their inventories of our products for any reason, our sales through these distributors and our revenue may decline. In addition, if some distributors decide to purchase more of our products than are required to satisfy end customer demand in any particular quarter, inventories at these distributors would grow in that quarter. These distributors likely would reduce future orders until inventory levels realign with end customer demand, which could adversely affect our product revenue.
Our reserve estimates with respect to the products stocked by our distributors are based principally on reports provided to us by our distributors, typically on a weekly basis. To the extent that this resale and channel inventory data is inaccurate or not received in a timely manner, we may not be able to make reserve estimates accurately or at all.
We are subject to order and shipment uncertainties, and differences between our estimates of customer demand and product mix and our actual results could negatively affect our inventory levels, sales and operating results.
Our revenue is generated on the basis of purchase orders with our customers rather than long-term purchase commitments. In addition, our customers can cancel purchase orders or defer the shipments of our products under certain circumstances. Our products are manufactured using a silicon foundry according to our estimates of customer demand, which requires us to make separate demand forecast assumptions for every customer, each of which may introduce significant variability into our aggregate estimate. We have limited visibility into future customer demand and the product mix that our customers will require, which could adversely affect our revenue forecasts and operating margins. Moreover, because our target markets are relatively new, many of our customers have difficulty accurately forecasting their product requirements and estimating the timing of their new product introductions, which ultimately affects their demand for our products. Historically, because of this limited visibility, actual results have been different from our forecasts of customer demand. Some of these differences have been material, leading to excess inventory or product shortages and revenue and margin forecasts above those we were actually able to achieve. These differences may occur in the future, and the adverse impact of these differences between forecasts and actual results could grow if we are successful in selling more products to some customers. In addition, the rapid pace of innovation in our industry could render significant portions of our inventory obsolete. Excess or obsolete inventory levels could result in unexpected expenses or increases in our reserves that could adversely affect our business, operating results and financial condition. Conversely, if we were to underestimate customer demand or if sufficient manufacturing capacity were unavailable, we could forego revenue opportunities, potentially lose market share and damage our customer relationships. In addition, any significant future cancellations or deferrals of product orders or the return of previously sold products due to manufacturing defects could materially and adversely impact our profit margins, increase our write-offs due to product obsolescence and restrict our ability to fund our operations.
Winning business is subject to lengthy competitive selection processes that require us to incur significant expenditures. Even if we begin a product design, customers may decide to cancel or change their product plans, which could cause us to generate no revenue from a product and adversely affect our results of operations.
We are focused on securing design wins to develop RF receivers and RF receiver SoCs, MoCA and G.hn SoCs, DBS-ODU SoCs, physical medium devices for optical modules, interface and power management devices, and SoC solutions targeting infrastructure opportunities within the telecommunications, wireless, industrial and multimarket and broadband operator markets for use in our customers’ products. These selection processes typically are lengthy and can require us to incur significant design and development expenditures and dedicate scarce engineering resources in pursuit of a single customer opportunity. We may not win the competitive selection process and may never generate any revenue despite incurring significant design and development expenditures. These risks are exacerbated by the fact that some of our customers’ products likely will have short life cycles. Failure to obtain a design win could prevent us from offering an entire generation of a product, even though this has not occurred to date. This could cause us to lose revenue and require us to write off obsolete inventory, and could weaken our position in future competitive selection processes. After securing a design win, we may experience delays in generating revenue from our products as a result of the lengthy development cycle typically required. Our customers generally take a considerable amount of time to evaluate our products. The typical time from early engagement by our sales force to actual product introduction runs from nine to twelve months for the consumer market, to as much as 18 to 24 months for the satellite markets, and 36 months or longer for industrial, wired and wireless infrastructure markets. The delays inherent in these lengthy sales cycles increase the risk that a customer will decide to cancel, curtail, reduce or delay its product plans, causing us
27
to lose anticipated sales. In addition, any delay or cancellation of a customer’s plans could materially and adversely affect our financial results, as we may have incurred significant expense and generated no revenue. Finally, our customers’ failure to successfully market and sell their products could reduce demand for our products and materially and adversely affect our business, financial condition and results of operations. If we were unable to generate revenue after incurring substantial expenses to develop any of our products, our business would suffer.
Our operating results are subject to substantial quarterly and annual fluctuations and may fluctuate significantly due to a number of factors that could adversely affect our business and our stock price.
Our revenue and operating results have fluctuated in the past and are likely to fluctuate in the future. These fluctuations may occur on a quarterly and on an annual basis and are due to a number of factors, many of which are beyond our control. These factors include, among others:
• | changes in end-user demand for the products manufactured and sold by our customers; |
• | the receipt, reduction or cancellation of significant orders by customers; |
• | fluctuations in the levels of component inventories held by our customers; |
• | the gain or loss of significant customers; |
• | market acceptance of our products and our customers’ products; |
• | our ability to develop, introduce and market new products and technologies on a timely basis; |
• | the timing and extent of product development costs; |
• | new product announcements and introductions by us or our competitors; |
• | incurrence of research and development and related new product expenditures; |
• | seasonality or cyclical fluctuations in our markets; |
• | currency fluctuations; |
• | fluctuations in IC manufacturing yields; |
• | significant warranty claims, including those not covered by our suppliers; |
• | changes in our product mix or customer mix; |
• | intellectual property disputes; |
• | loss of key personnel or the shortage of available skilled workers; |
• | impairment of long-lived assets, including masks and production equipment; and |
• | the effects of competitive pricing pressures, including decreases in average selling prices of our products. |
These factors are difficult to forecast, and these, as well as other factors, could materially adversely affect our quarterly or annual operating results. We typically are required to incur substantial development costs in advance of a prospective sale with no certainty that we will ever recover these costs. A substantial amount of time may pass between a design win and the generation of revenue related to the expenses previously incurred, which can potentially cause our operating results to fluctuate significantly from period to period. In addition, a significant amount of our operating expenses are relatively fixed in nature due to our significant sales, research and development costs. Any failure to adjust spending quickly enough to compensate for a revenue shortfall could magnify its adverse impact on our results of operations.
We are subject to the cyclical nature of the semiconductor industry.
The semiconductor industry is highly cyclical and is characterized by constant and rapid technological change, rapid product obsolescence and price erosion, evolving standards, short product life cycles and wide fluctuations in product supply and demand. Any future downturns may result in diminished product demand, production overcapacity, high inventory levels
28
and accelerated erosion of average selling prices. Furthermore, any upturn in the semiconductor industry could result in increased competition for access to third-party foundry and assembly capacity. We are dependent on the availability of this capacity to manufacture and assemble all of our products. None of our third-party foundry or assembly contractors has provided assurances that adequate capacity will be available to us in the future. A significant downturn or upturn could have a material adverse effect on our business and operating results.
The use of open source software in our products, processes and technology may expose us to additional risks and harm our intellectual property.
Our products, processes and technology sometimes utilize and incorporate software that is subject to an open source license. Open source software is typically freely accessible, usable and modifiable. Certain open source software licenses require a user who intends to distribute the open source software as a component of the user’s software to disclose publicly part or all of the source code to the user’s software. In addition, certain open source software licenses require the user of such software to make any derivative works of the open source code available to others on unfavorable terms or at no cost. This can subject previously proprietary software to open source license terms.
While we monitor the use of all open source software in our products, processes and technology and try to ensure that no open source software is used in such a way as to require us to disclose the source code to the related product, processes or technology when we do not wish to do so, such use could inadvertently occur. Additionally, if a third party software provider has incorporated certain types of open source software into software we license from such third party for our products, processes or technology, we could, under certain circumstances, be required to disclose the source code to our products, processes or technology. This could harm our intellectual property position and have a material adverse effect on our business, results of operations and financial condition.
We rely on third parties to provide services and technology necessary for the operation of our business. Any failure of one or more of our partners, vendors, suppliers or licensors to provide these services or technology could have a material adverse effect on our business.
We rely on third-party vendors to provide critical services, including, among other things, services related to accounting, billing, human resources, information technology, network development, network monitoring, in-licensing and intellectual property that we cannot or do not create or provide ourselves. We depend on these vendors to ensure that our corporate infrastructure will consistently meet our business requirements. The ability of these third-party vendors to successfully provide reliable and high quality services is subject to technical and operational uncertainties that are beyond our control. While we may be entitled to damages if our vendors fail to perform under their agreements with us, our agreements with these vendors limit the amount of damages we may receive. In addition, we do not know whether we will be able to collect on any award of damages or that these damages would be sufficient to cover the actual costs we would incur as a result of any vendor’s failure to perform under its agreement with us. Any failure of our corporate infrastructure could have a material adverse effect on our business, financial condition and results of operations. Upon expiration or termination of any of our agreements with third-party vendors, we may not be able to replace the services provided to us in a timely manner or on terms and conditions, including service levels and cost, that are favorable to us and a transition from one vendor to another vendor could subject us to operational delays and inefficiencies until the transition is complete.
Additionally, we incorporate third-party technology into and with some of our products, and we may do so in future products. The operation of our products could be impaired if errors occur in the third-party technology we use. It may be more difficult for us to correct any errors in a timely manner if at all because the development and maintenance of the technology is not within our control. There can be no assurance that these third parties will continue to make their technology, or improvements to the technology, available to us, or that they will continue to support and maintain their technology. Further, due to the limited number of vendors of some types of technology, it may be difficult to obtain new licenses or replace existing technology. Any impairment of the technology or our relationship with these third parties could have a material adverse effect on our business.
Unanticipated changes in our tax rates or unanticipated tax obligations could affect our future results.
We are subject to income taxes in the United States, Singapore and various other foreign jurisdictions. The amount of income taxes we pay is subject to our interpretation and application of tax laws in jurisdictions in which we file. Changes in current or future laws or regulations, the imposition of new or changed tax laws or regulations or new interpretations by taxing authorities or courts could affect our results of operations and lead to volatility with respect tax expenses and liabilities from period to period. The application of tax laws and related regulations is subject to legal and factual interpretation, judgment and
29
uncertainty. We cannot determine whether any legislative proposals may be enacted into law or what, if any, changes may be made to such proposals prior to their being enacted into law. If U.S. or international tax laws change in a manner that increases our tax obligation, it could result in a material adverse impact on our net income and our financial position. Furthermore, such material adverse impact may extend beyond one fiscal year. For example, on December 22, 2017, the Tax Cuts and Jobs Act, or the Tax Act, was enacted into U.S. tax law. Also on December 22, 2017, the SEC issued guidance in Staff Accounting Bulletin No. 118, or SAB 118, to address certain fact patterns where the accounting for changes in tax laws or tax rates under ASC Topic 740 is incomplete upon issuance of an entity's financial statements for the reporting period in which the Tax Act is enacted. As permitted in SAB 118, in 2017, we have taken a measurement period approach and reported certain provisional amounts, based on reasonable estimates, for certain tax effects in which the accounting under ASC 740 is incomplete. Such provisional amounts are subject to adjustment during a limited measurement period, not to extend one year beyond the tax law enactment date, until the accounting under ASC 740 is complete. We have also made required supplemental disclosures to accompany the provisional amounts, including the reasons for the incomplete accounting, the additional information or analysis that is needed, and other information relevant to why the registrant was not able to complete the accounting required under ASC 740 in a timely manner. Adjustments to such reported provisional amounts could result in a material adverse impact on our net income and our financial position in 2018.
We are subject to examinations and tax audits. There can be no assurance that the outcome from these audits will not have an adverse effect on our operating results or financial position.
We adopted amendments to U.S. generally accepted accounting principles related to stock-based compensation in the second quarter of 2016 and included excess tax benefits associated with employee stock-based compensation in income tax expense. However, since the amount of such excess tax benefits and deficiencies depend on the fair market value of our common stock, our income tax provision is subject to volatility in our stock price and in the future, could unfavorably affect our future effective tax rate.
Our future effective tax rate could be unfavorably affected by unanticipated changes in the valuation of our deferred tax assets and liabilities, and the ultimate use and depletion of these various tax credits and net operating loss carryforwards. Changes in our effective tax rate, including those from enactment of the Tax Act in 2017, could have a material adverse impact on our results of operations. We record a valuation allowance to reduce our net deferred tax assets to the amount that we believe is more likely than not to be realized. In making such determination, the Company considers all available positive and negative evidence quarterly, including scheduled reversals of deferred tax liabilities, projected future taxable income, tax planning strategies, and recent financial performance. To the extent we believe it is more likely than not that some portion of our deferred tax assets will not be realized, we record a valuation allowance against the deferred tax asset. Realization of our deferred tax assets is dependent primarily upon future taxable income in the applicable jurisdiction. During the quarter ended June 30, 2017, we released the valuation allowance against U.S. federal deferred tax assets. Based upon our review of all positive and negative evidence, we concluded that a full valuation allowance should continue to be recorded against our state and certain foreign net deferred tax assets at December 31, 2017. On a periodic basis we evaluate our deferred tax assets for realizability. The impact of releasing some or all of such valuation allowance in a future period could be material in the period in which such release occurs.
Our corporate income tax liability could materially increase if tax incentives we have negotiated in Singapore cease to be effective or applicable or if we are challenged on our use of such incentives.
Effective in the second quarter of 2017, we began to operate under certain favorable tax incentives in Singapore which are effective through March 2022 and may be extended through March 2027, and generally are dependent on our meeting certain headcount and investment thresholds. Such incentives allow certain qualifying income earned in Singapore to be taxed at reduced rates and are conditional upon our meeting certain employment and investment thresholds over time. If we fail to satisfy the conditions for receipt of these tax incentives, or to the extent US or other tax authorities challenge our operation under these favorable tax incentive programs or our intercompany transfer pricing agreements, our taxable income could be taxed at higher federal or foreign statutory rates and our income tax liability and expense could materially increase beyond our projections. Each of our Singapore tax incentives is separate and distinct from the others, and may be granted, withheld, extended, modified, truncated, complied with or terminated independently without any effect on the other incentives. Absent these tax incentives, our corporate income tax rate in Singapore is expected to be the 17% statutory tax rate. We are also subject to operating and other compliance requirements to maintain our favorable tax incentives. If we fail to comply with such requirements, we could lose the tax benefits and could possibly be required to refund previously realized material tax benefits. Additionally, in the future, we may fail to qualify for renewal of our favorable tax incentives or such incentives may not be available to us, which could also cause our future taxable income to increase and be taxed at higher statutory rates. Loss of one more of our tax incentives could cause us to modify our tax strategies and our operational structure, which could cause
30
disruption in our business and have a material adverse impact on our results of operations. Further, there can be no guarantee that such modification in our tax strategy will yield tax incentives as favorable as those we have negotiated with Singapore. Our interpretations and conclusions regarding the tax incentives are not binding on any taxing authority, and if our assumptions about tax and other laws are incorrect or if these tax incentives are substantially modified or rescinded we could suffer material adverse tax and other financial consequences, which would increase our expenses, reduce our profitability and adversely affect our cash flows.
Global economic conditions, including factors that adversely affect consumer spending for the products that incorporate our integrated circuits, could adversely affect our revenues, margins, and operating results.
Our products are incorporated in numerous consumer devices, and demand for such products will ultimately be driven by consumer demand for products such as televisions, personal computers, automobiles, cable modems, smartphones, and set-top boxes. Many of these purchases are discretionary. Global economic volatility and economic volatility in the specific markets in which the devices that incorporate our products are ultimately sold can cause extreme difficulties for our customers and third-party vendors in accurately forecasting and planning future business activities. This unpredictability could cause our customers to reduce spending on our products, which would delay and lengthen sales cycles. Furthermore, during challenging economic times our customers may face challenges in gaining timely access to sufficient credit, which could impact their ability to make timely payments to us. These events, together with economic volatility that may face the broader economy and, in particular, the semiconductor and communications industries, may adversely affect, our business, particularly to the extent that consumers decrease their discretionary spending for devices deploying our products.
Our business, financial condition and results of operations could be adversely affected by the political and economic conditions of the countries in which we conduct business and other factors related to our international operations.
We sell our products throughout the world. Products shipped to Asia accounted for 89% of our net revenue in the year ended December 31, 2017. In addition, approximately 51% of our employees are located outside of the United States as of December 31, 2017. The majority of our products are manufactured, assembled and tested in Asia, and all of our major distributors are located in Asia. Multiple factors relating to our international operations and to particular countries in which we operate could have a material adverse effect on our business, financial condition and results of operations. These factors include:
• | changes in political, regulatory, legal or economic conditions; |
• | restrictive governmental actions, such as restrictions on the transfer or repatriation of funds and foreign investments and trade protection measures, including export duties and quotas and customs duties and tariffs; |
• | disruptions of capital and trading markets; |
• | changes in import or export licensing requirements; |
• | transportation delays; |
• | civil disturbances or political instability; |
• | geopolitical turmoil, including terrorism, war or political or military coups; |
• | public health emergencies; |
• | differing employment practices and labor standards; |
• | limitations on our ability under local laws to protect our intellectual property; |
• | local business and cultural factors that differ from our customary standards and practices; |
• | nationalization and expropriation; |
• | changes in tax laws; |
• | currency fluctuations relating to our international operating activities; and |
• | difficulty in obtaining distribution and support. |
31
In addition to a significant portion of our wafer supply coming from Taiwan, Singapore, China and Malaysia, substantially all of our products undergo packaging and final testing in Taiwan, Singapore, China, South Korea, and the Philippines. Any conflict or uncertainty in these countries, including due to natural disaster or public health or safety concerns, could have a material adverse effect on our business, financial condition and results of operations. In addition, if the government of any country in which our products are manufactured or sold sets technical standards for products manufactured in or imported into their country that are not widely shared, it may lead some of our customers to suspend imports of their products into that country, require manufacturers in that country to manufacture products with different technical standards and disrupt cross-border manufacturing relationships which, in each case, could have a material adverse effect on our business, financial condition and results of operations. We also are subject to risks associated with international political conflicts involving the U.S. government. For example, in 2008, we were instructed by the U.S. Department of Homeland Security to cease using Polar Star International Company Limited, a distributor based in Hong Kong, that delivered third-party products, to a political group that the U.S. government did not believe should have been provided with the products in question. As a result, we immediately ceased all business operations with that distributor. Similarly, we ceased business operations with entities affiliated with ZTE Corp. when the Bureau of Industry and Security at the U.S. Department of Commerce imposed an export licensing requirement, which was subsequently suspended through March 28, 2017. Such suspension was lifted as of March 29, 2017. We cannot provide assurances that similar disruptions in the future of distribution arrangements or the imposition of governmental prohibitions on selling our products to particular customers will not adversely affect our revenues and operating results. Loss of a key distributor or customer under similar circumstances could have an adverse effect on our business, revenues and operating results.
If we suffer losses to our facilities or distribution system due to catastrophe, our operations could be seriously harmed.
Our facilities and distribution system, and those of our third-party contractors, are subject to risk of catastrophic loss due to fire, flood or other natural or man-made disasters. A number of our facilities and those of our contract manufacturers are located in areas with above average seismic activity. The risk of an earthquake in the Pacific Rim region or Southern California is significant due to the proximity of major earthquake fault lines. Any catastrophic loss to any of these facilities would likely disrupt our operations, delay production, shipments and revenue and result in significant expenses to repair or replace the facility. The majority of the factories we use for foundry, assembly and test, and warehousing services, are located in Asia. Our corporate headquarters is located in Southern California.
Our business is subject to various governmental regulations, and compliance with these regulations may cause us to incur significant expenses. If we fail to maintain compliance with applicable regulations, we may be forced to recall products and cease their manufacture and distribution, and we could be subject to civil or criminal penalties.
Our business is subject to various international and U.S. laws and other legal requirements, including packaging, product content, labor, import/export control regulations, and the Foreign Corrupt Practices Act. These regulations are complex, change frequently and have generally become more stringent over time. We may be required to incur significant costs to comply with these regulations or to remedy violations. Any failure by us to comply with applicable government regulations could result in cessation of our operations or portions of our operations, product recalls or impositions of fines and restrictions on our ability to conduct our operations. In addition, because many of our products are regulated or sold into regulated industries, we must comply with additional regulations in marketing our products.
Our products and operations are also subject to the rules of industrial standards bodies, like the International Standards Organization, as well as regulation by other agencies, such as the U.S. Federal Communications Commission. If we fail to adequately address any of these rules or regulations, our business could be harmed.
For example, the SEC adopted a final rule to implement Section 1502 of the Dodd-Frank Wall Street Reform and Consumer Protection Act, which requires disclosures concerning the use of conflict minerals, generally tantalum, tin, gold, or tungsten that originated in the Democratic Republic of the Congo or an adjoining country. These disclosures are required whether or not these products containing conflict minerals are manufactured by us or third parties. Verifying the source of any conflict minerals in our products has created and will continue to create additional costs in order to comply with the new disclosure requirements and we may not be able to certify that the metals in our products are conflict free, which may create issues with our customers. In addition, the new rule may affect the pricing, sourcing and availability of minerals used in the manufacture of our products.
We must conform the manufacture and distribution of our semiconductors to various laws and adapt to regulatory requirements in all countries as these requirements change. If we fail to comply with these requirements in the manufacture or
32
distribution of our products, we could be required to pay civil penalties, face criminal prosecution and, in some cases, be prohibited from distributing our products in commerce until the products or component substances are brought into compliance.
Investor confidence may be adversely impacted if we are unable to comply with Section 404 of the Sarbanes-Oxley Act of 2002, and as a result, our stock price could decline.
We are subject to rules adopted by the Securities Exchange Commission, or SEC, pursuant to Section 404 of the Sarbanes-Oxley Act of 2002, or Sarbanes-Oxley Act, which require us to include in our Annual Report on Form 10-K our management’s report on, and assessment of the effectiveness of, our internal controls over financial reporting.
If we fail to maintain the adequacy of our internal controls, there is a risk that we will not comply with all of the requirements imposed by Section 404. Moreover, effective internal controls, particularly those related to revenue recognition, are necessary for us to produce reliable financial reports and are important to helping prevent financial fraud. Any of these possible outcomes could result in an adverse reaction in the financial marketplace due to a loss of investor confidence in the reliability of our consolidated financial statements and could result in investigations or sanctions by the SEC, the New York Stock Exchange, or NYSE, or other regulatory authorities or in stockholder litigation. Any of these factors ultimately could harm our business and could negatively impact the market price of our securities. Ineffective control over financial reporting could also cause investors to lose confidence in our reported financial information, which could adversely affect the trading price of our common stock.
Our disclosure controls and procedures are designed to provide reasonable assurance of achieving their objectives. However, our management, including our principal executive officer and principal financial officer, does not expect that our disclosure controls and procedures will prevent all error and all fraud. A control system, no matter how well conceived and operated, can provide only reasonable, not absolute, assurance that the objectives of the control system are met. Further, the design of a control system must reflect the fact that there are resource constraints, and the benefits of controls must be considered relative to their costs. Because of the inherent limitations in all control systems, no evaluation of controls can provide absolute assurance that all control issues and instances of fraud, if any, have been detected.
Our products must conform to industry standards in order to be accepted by end users in our markets.
Generally, our products comprise only a part or parts of a communications device. All components of these devices must uniformly comply with industry standards in order to operate efficiently together. We depend on companies that provide other components of the devices to support prevailing industry standards. Many of these companies are significantly larger and more influential in driving industry standards than we are. Some industry standards may not be widely adopted or implemented uniformly, and competing standards may emerge that may be preferred by our customers or end users. If larger companies do not support the same industry standards that we do, or if competing standards emerge, market acceptance of our products could be adversely affected, which would harm our business.
Products for communications applications are based on industry standards that are continually evolving. Our ability to compete in the future will depend on our ability to identify and ensure compliance with these evolving industry standards. The emergence of new industry standards could render our products incompatible with products developed by other suppliers. As a result, we could be required to invest significant time and effort and to incur significant expense to redesign our products to ensure compliance with relevant standards. If our products are not in compliance with prevailing industry standards for a significant period of time, we could miss opportunities to achieve crucial design wins. We may not be successful in developing or using new technologies or in developing new products or product enhancements that achieve market acceptance. Our pursuit of necessary technological advances may require substantial time and expense.
Risks Relating to Our Common Stock
Our management team may use our available cash and cash equivalents in ways with which you may not agree or in ways which may not yield a return.
We use our cash and cash equivalents for general corporate purposes, including working capital and for repayment of outstanding long-term debt. We may also use a portion of these assets to acquire complementary businesses, products, services or technologies. Our management has considerable discretion in the application of our cash and cash equivalents, and resources, and you will not have the opportunity to assess whether these liquid assets are being used in a manner that you deem best to maximize your return. We may use our available resources for corporate purposes that do not increase our operating results or market value. In addition, in the future our cash and cash equivalents, and resources may be placed in investments that do not produce significant income or that may lose value.
33
Anti-takeover provisions in our charter documents and under Delaware law could make an acquisition of us more difficult, limit attempts by our stockholders to replace or remove our current management and limit the market price of our common stock.
Provisions in our certificate of incorporation and bylaws, as amended and restated, may have the effect of delaying or preventing a change of control or changes in our management. These provisions provide for the following:
• | authorize our Board of Directors to issue, without further action by the stockholders, up to 25,000,000 shares of undesignated preferred stock; |
• | require that any action to be taken by our stockholders be effected at a duly called annual or special meeting and not by written consent; |
• | specify that special meetings of our stockholders can be called only by our Board of Directors, our Chairman of the Board of Directors, or our President; |
• | establish an advance notice procedure for stockholder approvals to be brought before an annual meeting of our stockholders, including proposed nominations of persons for election to our Board of Directors; |
• | establish that our Board of Directors is divided into three classes, Class I, Class II and Class III, with each class serving staggered terms; |
• | provide that our directors may be removed only for cause; |
• | provide that vacancies on our Board of Directors may be filled only by a majority of directors then in office, even though less than a quorum; |
• | specify that no stockholder is permitted to cumulate votes at any election of directors; and |
• | require supermajority votes of the holders of our common stock to amend specified provisions of our charter documents. |
These provisions may frustrate or prevent any attempts by our stockholders to replace or remove our current management by making it more difficult for stockholders to replace members of our Board of Directors, which is responsible for appointing the members of our management. In addition, because we are incorporated in Delaware, we are governed by the provisions of Section 203 of the Delaware General Corporation Law, which generally prohibits a Delaware corporation from engaging in any of a broad range of business combinations with any “interested” stockholder for a period of three years following the date on which the stockholder became an “interested” stockholder.
Our share price may be volatile as a result of limited trading volume and other factors.
Our common stock began trading on the New York Stock Exchange in March 2010. An active public market for our shares on the New York Stock Exchange may not be sustained. In particular, we have experienced limited trading volumes and liquidity in the past, and similar issues in the future could limit the ability of stockholders to purchase or sell our common stock in the amounts and at the times they wish. Trading volume in our common stock is sometimes modest relative to our total outstanding shares, and the price of our common stock may fluctuate substantially (particularly in percentage terms) without regard to news about us or general trends in the stock market. An inactive market may also impair our ability to raise capital to continue to fund operations by selling shares and may impair our ability to acquire other companies or technologies by using our shares as consideration.
In addition, the trading price of our common stock could become highly volatile and could be subject to wide fluctuations in response to various factors, some of which are beyond our control. These factors include those discussed in this “Risk Factors” section of the Annual Report on Form 10-K and others such as:
• | actual or anticipated fluctuations in our financial condition and operating results; |
• | overall conditions in the semiconductor market; |
• | addition or loss of significant customers; |
• | changes in laws or regulations applicable to our products; |
34
• | actual or anticipated changes in our growth rate relative to our competitors; |
• | announcements of technological innovations by us or our competitors; |
• | announcements by us or our competitors of significant acquisitions, strategic partnerships, joint ventures or capital commitments; |
• | additions or departures of key personnel; |
• | competition from existing products or new products that may emerge; |
• | issuance of new or updated research or reports by securities analysts; |
• | fluctuations in the valuation of companies perceived by investors to be comparable to us; |
• | disputes or other developments related to proprietary rights, including patents, litigation matters and our ability to obtain intellectual property protection for our technologies; |
• | the recently completed acquisitions may not be accretive and may cause dilution to our earnings per shares; |
• | announcement or expectation of additional financing efforts; |
• | sales of our common stock by us or our stockholders; |
• | share price and volume fluctuations attributable to inconsistent trading volume levels of our shares; and |
• | general economic and market conditions. |
Furthermore, the stock markets recently have experienced extreme price and volume fluctuations that have affected and continue to affect the market prices of equity securities of many companies. These fluctuations often have been unrelated or disproportionate to the operating performance of those companies. These broad market and industry fluctuations, as well as general economic, political and market conditions such as recessions, interest rate changes or international currency fluctuations, may negatively impact the market price of our common stock. In the past, companies that have experienced volatility in the market price of their stock have been subject to securities class action litigation. We have been and may continue to be the target of this type of litigation in the future. Securities litigation against us could result in substantial costs and divert our management’s attention from other business concerns, which could seriously harm our business.
If securities or industry analysts do not publish research or reports about our business, or publish negative reports about our business, our share price and trading volume could decline.
The trading market for our common stock depends in part on the research and reports that securities or industry analysts publish about us or our business. We do not have any control over these analysts. If one or more of the analysts who cover us downgrade our shares or change their opinion of our shares, our share price would likely decline. If one or more of these analysts cease coverage of our Company or fail to regularly publish reports on us, we could lose visibility in the financial markets, which could cause our share price or trading volume to decline.
Future sales of our common stock in the public market could cause our share price to decline.
Sales of a substantial number of shares of our common stock in the public market, or the perception that these sales might occur, could depress the market price of our common stock and could impair our ability to raise capital through the sale of additional equity securities. As of December 31, 2017, we had 67.4 million shares of common stock outstanding.
All shares of common stock are freely tradable without restrictions or further registration under the Securities Act of 1933, as amended, or the Securities Act.
Our Executive Incentive Bonus Plan permits the settlement of awards under the plan in the form of shares of its common stock. We have issued shares of our common stock to settle such bonus awards for our employees, including executives, for the 2014, 2015 and 2016 performance periods, and we intend to continue this practice in the foreseeable future. We issued 0.2 million shares of our common stock for the July 1, 2016 to December 31, 2016 performance period on February 17, 2017. These shares may be freely sold in the public market immediately following the issuance of such shares and the issuance of such shares may have an adverse effect on our share price once they are issued.
35
We do not intend to pay dividends for the foreseeable future.
We have never declared or paid any cash dividends on our common stock and do not intend to pay any cash dividends in the foreseeable future. We anticipate that we will retain all of our future earnings for use in the development of our business and for general corporate purposes. Any determination to pay dividends in the future will be at the discretion of our Board of Directors. Accordingly, investors must rely on sales of their common stock after price appreciation, which may never occur, as the only way to realize any future gains on their investments.
Risks Relating to Our Recent Acquisitions
Our actual financial and operating results could differ materially from any expectations or guidance provided by us concerning future results, including (without limitation) expectations or guidance with respect to the financial impact of any cost savings and other potential synergies resulting from our recent acquisitions.
We currently expect to continue realizing material cost savings and other synergies as a result of recent acquisitions, including Exar, and as a result, we currently believe that these acquisitions will continue to be accretive to our free cash-flow and reported non-GAAP earnings per share, excluding upfront non-recurring charges, transaction related expenses, and the amortization of purchased intangible assets. The expectations and guidance we have provided with respect to the potential financial impact of the acquisitions are subject to numerous assumptions, however, including assumptions derived from our diligence efforts concerning the status of and prospects for Exar and the other acquired businesses, which we did not control at the time of our diligence, and assumptions relating to the near-term prospects for the semiconductor industry generally and the markets for the legacy acquired products in particular. In addition, Exar's target markets, customer relationships, and operations generally differ substantially from those of MaxLinear. Accordingly, relative to prior material acquisitions such as our 2015 acquisition of Entropic, we do not expect to be able to realize synergies in the same relative amounts or timeframes. We expect the integration of Exar to present substantial incremental challenges relative to prior acquisitions that could materially and adversely affect our ability to realize the currently anticipated financial, operational, and strategic benefits of the acquisition. Additional assumptions we have made that could affect currently anticipated results relate to numerous matters, including (without limitation) the following:
• | projections of future revenues of Exar and the other legacy acquired businesses, particularly given Exar's historical distributor channel focus and dependency; |
• | the anticipated financial performance of legacy acquired products and products currently in development; |
• | anticipated cost savings and other synergies associated with the acquisitions, including potential revenue synergies; |
• | our capital structure following the acquisitions; |
• | the amount of goodwill and intangibles that resulted from the acquisitions; |
• | certain other purchase accounting adjustments that we have recorded in our financial statements in connection with the acquisitions and any subsequent adjustments as we finalize our purchase price allocation of Exar; |
• | acquisition costs, including restructuring charges and transactions costs that we incurred to our financial, legal, and accounting advisors; and |
• | our ability to maintain, develop, and deepen relationships with customers of Exar and the other legacy acquired businesses. |
We cannot provide any assurances with respect to the accuracy of our assumptions, including our assumptions with respect to future revenues or revenue growth rates, if any, of Exar and the other legacy acquired businesses, and we cannot provide assurances with respect to our ability to realize further cost savings that we currently anticipate. Risks and uncertainties that could cause our actual results to differ materially from currently anticipated results include, but are not limited to, risks relating to our ability to integrate Exar and the other legacy acquired businesses successfully; currently unanticipated incremental costs that we may incur in connection with integrating the acquired companies; risks relating to our ability to continue to realize incremental revenues from the acquisitions in the amounts that we currently anticipate; risks relating to the willingness of legacy acquired customers and other partners to continue to conduct business with MaxLinear; and numerous risks and uncertainties that affect the semiconductor industry generally and the markets for our products and those of Exar and the other legacy acquired businesses specifically. Any failure to integrate Exar and the other legacy acquired businesses
36
successfully and to continue to realize the financial benefits we currently anticipate from the acquisitions would have a material adverse impact on our future operating results and financial condition and could materially and adversely affect the trading price or trading volume of our common stock.
In addition to our recent acquisitions, we may, from time to time, make additional business acquisitions or investments, which involve significant risks.
In addition to the acquisitions of Exar and the G.hn business of Marvell Technology Group Ltd., or Marvell, which we completed in the second quarter of fiscal 2017, we also acquired the wireless infrastructure backhaul business of Broadcom Corporation, which we completed in the third quarter of fiscal 2016, the wireless infrastructure access business of Microsemi Storage Solutions, Inc., formerly known as PMC-Sierra, Inc., which we completed in the second quarter of fiscal 2016, Entropic Communications, Inc., or Entropic, which we completed in the second quarter of fiscal 2015, and Physpeed, Co., Ltd., or Physpeed which we completed in the fourth quarter of fiscal 2014. We may, from time to time, make acquisitions, enter into alliances or make investments in other businesses to complement our existing product offerings, augment our market coverage or enhance our technological capabilities. However, any such transactions could result in:
• | issuances of equity securities dilutive to our existing stockholders; |
• | substantial cash payments; |
• | the incurrence of substantial debt and assumption of unknown liabilities; |
• | large one-time write-offs; |
• | amortization expenses related to intangible assets; |
• | a limitation on our ability to use our net operating loss carryforwards; |
• | the diversion of management's time and attention from operating our business to acquisition integration challenges; |
• | stockholder or other litigation relating to the transaction; |
• | adverse tax consequences; and |
• | the potential loss of key employees, customers and suppliers of the acquired businesses. |
Additionally, in periods subsequent to an acquisition, we must evaluate goodwill and acquisition-related intangible assets for impairment. If such assets are found to be impaired, they will be written down to estimated fair value, with a charge against earnings.
Integrating acquired organizations and their products and services, including the integration of completed acquisitions, may be expensive, time-consuming and a strain on our resources and our relationships with employees, customers, distributors and suppliers, and ultimately may not be successful. The benefits or synergies we may expect from the acquisition of complementary or supplementary businesses may not be realized to the extent or in the time frame we initially anticipate. Some of the risks that may affect our ability to successfully integrate acquired businesses include those associated with:
• | failure to successfully further develop the acquired products or technology; |
• | conforming the acquired company’s standards, policies, processes, procedures and controls with our operations; |
• | coordinating new product and process development, especially with respect to highly complex technologies; |
• | loss of key employees or customers of the acquired company; |
• | hiring additional management and other critical personnel; |
• | in the case of foreign acquisitions, the need to integrate operations across different cultures and languages and to address the particular economic, currency, political and regulatory risks associated with specific countries; |
• | increasing the scope, geographic diversity and complexity of our operations; |
37
• | consolidation of facilities, integration of the acquired company’s accounting, human resource and other administrative functions and coordination of product, engineering and sales and marketing functions; |
• | the geographic distance between the companies; |
• | liability for activities of the acquired company before the acquisition, including patent and trademark infringement claims, violations of laws, commercial disputes, tax liabilities and other known and unknown liabilities; and |
• | litigation or other claims in connection with the acquired company, including claims for terminated employees, customers, former stockholders or other third parties. |
On or about August 2, 2016, Trango Systems, Inc., or Trango, filed a complaint in the Superior Court of California, County of San Diego, Central Division, against defendants Broadcom Corporation, Inc., or Broadcom, and us, collectively, Defendants. Trango is a purchaser that alleges various fraud, breach of contract, and interference with economic relations claims in connection with the discontinuance of a chip line we acquired from Broadcom in 2016. Trango seeks unspecified general and special damages, pre-judgment interest, expenses and costs, attorneys’ fees, punitive damages, and unspecified injunctive and equitable relief. We intend to vigorously defend against the lawsuit. On June 23, 2017, the Court sustained our demurrer to each cause of action in the second amended complaint, filed on or about December 6, 2016. Trango filed its third amended complaint on or about July 13, 2017. On August 17, 2017 we filed a demurrer to each cause of action against us in the third amended complaint, as well as a motion to strike certain allegations. Trango’s oppositions to our demurrer and motion to strike are currently due on February 8, 2018 and the court hearing on our demurrer and motion to strike is scheduled for February 23, 2018. Discovery in the matter is currently delayed pending resolution of the demurrer and motion to strike.
Also, on April 18, 2017, The Vladimir Gusinsky Revocable Trust filed a complaint in the United States District Court for the Northern District of California against Exar, its board of directors, MaxLinear, and Eagle Acquisition Corporation (a wholly owned subsidiary of MaxLinear). Another similar lawsuit was filed by Richard E. Marshall on April 25, 2017. The Marshall lawsuit did not name MaxLinear or Eagle Acquisition Corp. as defendants. The complaints generally alleged that the merger with Exar offered inadequate consideration to Exar’s shareholders and that the Schedule 14D-9 filed by Exar in connection with the merger omitted material information. The complaints purported to bring class claims for violation of sections 14(e), 14(d), and 20(a) of the Securities Exchange Act of 1934 and SEC Rule 14d-9. The complaints sought certification of a class; an injunction barring the merger or, if defendants enter into the merger, an order rescinding it or awarding rescissory damages; declaratory relief; and plaintiff’s costs, including attorneys’ fees and experts’ fees.
On or about May 3, 2017, the parties to the above-referenced lawsuits reached an agreement whereby plaintiffs voluntarily dismissed the claims brought by Mr. Marshall and The Vladimir Gusinsky Revocable Trust with prejudice (but without prejudice as to other members of the putative class), defendants made certain supplemental disclosures, and the plaintiffs would receive a mootness fee. On May 3, 2017, Exar made the supplemental disclosures contemplated by this agreement. On October 24, 2017, the parties entered a Settlement Agreement Regarding Claim for Mootness Fees pursuant to which we agreed to pay counsel for the plaintiffs a mootness fee. We have now paid the fee, and with the execution of the settlement agreement, this litigation has been resolved.
We cannot predict the outcome of the Trango litigation. Any adverse determination in the Trango litigation could have a material adverse effect on our business and operating results.
Failure to integrate our business and operations successfully with those of acquired businesses in the expected time-frame or otherwise may adversely affect our operating results and financial condition.
Our history of acquiring businesses is recent, and prior to our acquisition of Exar, we had never pursued an acquisition of that size and complexity. We may complete larger-scale acquisitions in the future. The success of our recent and future acquisitions depends, in substantial part, on our ability to integrate acquired businesses and operations efficiently and successfully with those of MaxLinear and to realize fully the anticipated benefits and potential synergies from combining our companies, including, among others, cost savings from eliminating duplicative functions; potential operational efficiencies in our respective supply chains and in research and development investments; and potential revenue growth resulting from the addition of acquired product portfolios. If we are unable to achieve these objectives, the anticipated benefits and potential synergies from the acquisitions may not be realized fully, or may take longer to realize than expected. Any failure to timely realize these anticipated benefits would have a material adverse effect on our business, operating results, and financial condition and could also have a material and adverse effect on the trading price or trading volume of our common stock.
38
We completed our recent acquisitions in April 2015, April 2016, July 2016, April 2017 and May 2017. While we believe the integration process is substantially complete for our acquisitions which we closed in 2016 and prior, we are in the process of integrating our 2017 acquisitions. We have incurred material restructuring costs in recent periods, some of which included employees from acquired businesses. To the extent we acquire additional businesses in the future, we cannot ensure that integration objectives will not adversely affect our operating results. In connection with the integration process, we could experience the loss of key customers, decreases in revenues relative to current expectations and increases in operating costs, as well as the disruption of our ongoing businesses, any or all of which could limit our ability to achieve the anticipated benefits and potential synergies from the acquisitions and have a material adverse effect on our business, operating results, and financial condition.
Our business relationships, including customer relationships, and those of our acquired businesses may be subject to disruption due to uncertainty associated with the acquisitions.
In response to the completion of our recent acquisitions, customers, vendors, licensors, and other third parties with whom we do business or the acquired entities did business or otherwise have relationships may experience uncertainty associated with the acquisitions, and this uncertainty could materially affect their decisions with respect to existing or future business relationships with us. As a result, we are in many instances unable to evaluate the impact of the acquisition on certain assumed contract rights and obligations, including intellectual property rights.
These business relationships may be subject to disruption as customers and others may elect to delay or defer purchase or design-win decisions or switch to other suppliers due to the uncertainty about the direction of our offerings, any perceived unwillingness on our part to support existing legacy acquired products, or any general perceptions by customers or other third parties that impute operational or business challenges to us arising from the acquisitions. In addition, customers or other third parties may attempt to negotiate changes in existing business relationships, which may result in additional obligations imposed on us. These disruptions could have a material adverse effect on our business, operating results, and financial condition. Any loss of customers, customer products, design win opportunities, or other important strategic relationships could have a material adverse effect on our business, operating results, and financial condition and could have a material and adverse effect on the trading price or trading volume of our common stock.
In connection with the acquisition of Exar, we incurred $425.0 million of secured term loan indebtedness. We have since entered into an interest rate swap to hedge a substantial portion of our exposure to rising interest rates applicable to such indebtedness. We have not previously carried long-term indebtedness, which will adversely affect our operating results and cash-flows as we satisfy our underlying interest and principal payment obligations. We also have not previously engaged in hedging arrangements, which are subject to fair value measurement and hedge accounting rules and related documentation requirements. If we are unable to maintain favorable cash flow hedge accounting and changes in fair value of our interest rate swap are recorded in earnings, it may adversely affect our operating results.
MaxLinear financed the acquisition of Exar in part with a secured term loan facility in an aggregate principal amount of approximately $425.0 million. In November 2017, to hedge most of our existing interest rate risk, we entered into a fixed-for-floating interest rate swap agreement with an amortizing notional amount to swap a substantial portion of our variable rate LIBOR interest payments under the outstanding term loans for fixed interest payments bearing an interest rate of 1.74685%. Our outstanding debt is still subject to a 2.5% fixed applicable margin during the term of the loan. As a result of entering the swap, the interest rate on a substantial portion of our long-term debt is effectively fixed at approximately 4.25%. As of December 31, 2017, we had approximately $355.0 million of outstanding principal under the secured term loan facility. The term loan facility is secured by a first priority security interest in MaxLinear’s assets, subject to certain customary exceptions, as well as pledges of our equity interests in certain subsidiaries. Prior to the Exar acquisition, we had not previously carried long-term debt on our balance sheet and have financed our operations principally through working capital generated from operations as well as sales and issuances of our equity securities. Our indebtedness will continue to adversely affect our operating expenses through interest payment obligations and will continue to adversely affect our ability to use cash generated from operations as we repay interest and principal under the term loans. In addition, although the term loan provisions do not include financial covenants, they do include operational covenants that may adversely affect our ability to engage in certain activities, including certain financing and acquisition transactions, stock repurchases, guarantees, and similar transactions, without obtaining the consent of the lenders, which may or may not be forthcoming. Accordingly, outstanding indebtedness could adversely affect our operational freedom or ability to pursue strategic transactions that we would otherwise consider to be in the best interests of stockholders.
39
Specifically, our indebtedness could have important consequences to investors in our common stock, including the following:
• | our ability to obtain any necessary financing in the future for working capital, capital expenditures, debt service requirements, or other purposes may be limited or financing may be unavailable; |
• | a substantial portion of our cash flows must be dedicated to the payment of principal and interest on our indebtedness and other obligations and will not be available for use in our business; |
• | our level of indebtedness could limit our flexibility in planning for, or reacting to, changes in our business and the markets in which we operate; |
• | our high degree of indebtedness will make us more vulnerable to changes in general economic conditions and/or a downturn in our business, thereby making it more difficult for us to satisfy our obligations; |
• | we are subject to a fixed rate of interest as a result of entering into a fixed-for-floating interest rate swap agreement in November 2017 to hedge against the potential that the interest rates applicable to our term loan will increase. Our interest rate under the term loan varies based on a fixed margin over either an adjusted LIBOR or an adjusted base rate. Interest rates, including LIBOR, have recently increased and may continue to increase in future periods. However, interest rate trends are inherently difficult to predict and interest rates may significantly increase or decrease over a short period of time. If interest rates were to decrease substantially, we would pay higher interest expense than market and, as a result, could seek to terminate or modify the terms of the swap prior to its maturity which could result in termination or other fees and the fair value of our interest rate swap may also decrease substantially; |
• | we are also still subject to variable interest rate risk on the principal balance in excess of the notional amount of the interest rate swap because our interest rate under the term loan varies based on a fixed margin over either an adjusted LIBOR or an adjusted base rate. Interest rates, including LIBOR, have recently increased and may continue to increase in future periods. If interest rates were to increase substantially, it would adversely affect our operating results and could affect our ability to service the term loan indebtedness; and |
• | our interest rate swap is accounted for as a cash flow hedge, which allows any changes in fair value of the interest rate swap to be classified in other comprehensive income rather than in earnings so long as the hedge is effective. To maintain our cash flow hedge accounting, we must keep contemporaneous documentation of the hedge, test hedge effectiveness during the term of swap and maintain a certain level of hedge effectiveness. If our hedge is deemed ineffective, we would be required to recognize changes in the fair value of the interest rate swap in earnings, which could adversely affect our operating results. |
If we fail to make required debt payments, or if we fail to comply with other covenants in our debt service agreements, we would be in default under the terms of these agreements. Subject to customary cure rights, any default would permit the holders of the indebtedness to accelerate repayment of this debt and could cause defaults under other indebtedness that we have, any of which could have a material adverse effect on the trading price of our common stock.
We used substantially all of Exar’s available cash resources, proceeds from our term loan facility, and a sizeable portion of our cash resources to complete the acquisition and distribute the cash consideration payable to Exar stockholders. As a result, our available liquidity after the acquisition was reduced at the same time that the scope of our operations and cash requirements have increased, and we may be required to seek additional financing.
Under the terms of the merger agreement and in order to implement the distribution of the cash merger consideration to Exar’s stockholders, we were required to fund the balance of the cash merger consideration from our own cash and cash equivalents, cash and equivalents currently held by Exar, and the proceeds from the term loan facility. Consequently, substantially all of Exar’s available cash was used in connection with the acquisition, and our overall liquidity after completion of the acquisition was materially reduced relative to our prior liquidity even though we incurred substantial expenses and expect to incur additional restructuring costs as we integrate Exar’s business and operations. To the extent our cash needs are more than we currently anticipate, our board of directors and management may determine to seek financing to enhance our liquidity, which could involve the issuance of additional debt or equity securities. We cannot provide any assurances that additional financing will be available to us when and as needed or on terms that we believe to be commercially reasonable. To the extent we issue debt securities, such indebtedness would have rights that are senior to holders of equity securities and could contain covenants that restrict our operations. Any equity financing would be dilutive to our current stockholders. If we determine that
40
we require funding as a result of the acquisition but cannot obtain such funding on terms we consider to be reasonable, we may seek other methods to reduce our use of cash, including reductions in our research and development spending, which would be expected to have an adverse long-term effect on our business, operating results, and financial condition.
Servicing our indebtedness will require a significant amount of cash, and we may not have sufficient cash flow from our business to pay our substantial indebtedness.
In connection with the term loan facility, we incurred $425.0 million in aggregate principal amount of senior indebtedness, of which approximately $355.0 million remained outstanding at December 31, 2017. Our substantial indebtedness may increase our vulnerability to any generally adverse economic and industry conditions.
Our ability to make scheduled payments of the principal and interest when due, or to refinance our borrowings under the term loan facility, will depend on our future performance, which is subject to economic, financial, competitive and other factors beyond our control. Our business may not continue to generate cash flow from operations in the future sufficient to satisfy our obligations under our indebtedness, and any future indebtedness we may incur and to make necessary capital expenditures. If we are unable to generate such cash flow, we may be required to adopt one or more alternatives, such as reducing or delaying investments or capital expenditures, selling assets, refinancing or obtaining additional equity capital on terms that may be onerous or highly dilutive. Our ability to refinance the term loans or existing or future indebtedness will depend on the capital markets and our financial condition at such time. We may not be able to engage in any of these activities or engage in these activities on desirable terms, which could result in a default on the loan facility or future indebtedness.
We may still incur substantially more debt or take other actions, which would intensify the risks discussed immediately above.
We and our subsidiaries may, subject to any limitations in the terms of the term loan facility, incur additional debt, secure existing or future debt, recapitalize our debt or take a number of other actions that are not limited by the terms of our term loans that could have the effect of diminishing our ability to make payments under the indebtedness when due. If we incur any additional debt, the related risks that we and our subsidiaries face could intensify.
As part of a business unit divestiture, Exar agreed to indemnify the buyer of the business unit for an amount that could be up to the full purchase price received for breaches of representations and warranties, covenants and other matters under the applicable purchase agreement. If Exar were required to make payments in satisfaction of these indemnification obligations, it could have a material adverse effect on our operating results and financial condition.
Under the terms of the purchase agreement relating to the divested business unit, Exar agreed to indemnify the purchaser of the business unit for breaches of representations and warranties and covenants and for certain other matters. Exar also agreed to place $5.0 million of the total purchase price into an escrow account for a period of 18 months to partially secure its indemnification obligations under the purchase agreement; of this amount, $0.4 million has been released through December 31, 2017. In addition, Exar’s indemnification obligations for breaches of representations and warranties survive for 12 months from the closing of the sale transaction, except for breaches of representations and warranties covering intellectual property, which survive for 18 months, and breaches of representations and warranties of certain fundamental representations, which survive until the expiration of the applicable statute of limitations. Exar’s maximum indemnification obligation for breaches of representations and warranties, other than intellectual property and fundamental representations, is $13.6 million, its maximum indemnification obligation for breaches of intellectual property representations is $34.0 million, and its maximum indemnity obligation for breaches of fundamental representations is the full purchase price amount (approximately $136.0 million). The aggregate amount recovered by the purchaser in accordance with the indemnification provisions with respect to matters that are subject to the intellectual property representations, together with the aggregate amount recovered by the purchaser in accordance with the indemnification provisions with respect to matters that are subject to the general representations and warranties (other than fundamental representations), will in no event exceed $34.0 million.
We and Exar may have difficulty motivating and retaining key Exar personnel in light of the acquisition.
Uncertainty about the effect of the acquisition on our employees and those of Exar may have an adverse effect on MaxLinear. This uncertainty may impair our ability to retain and motivate them. Employee retention may be particularly challenging as our employees may experience frustrations during the integration process and uncertainty about their future roles with us following completion of the acquisition. MaxLinear must be successful at retaining and motivating key employees in order for the benefits of the transaction to be fully realized. If key employees depart because of issues relating to the uncertainty and difficulty of integration, we may incur significant costs in identifying, hiring, and retaining replacements for departing
41
employees, which could substantially reduce or delay our ability to realize the anticipated benefits of the acquisition and could have a material adverse effect on our business, operating results, and financial condition.
We have incurred and expect to continue to incur substantial expenses related to the operational integration of our recent acquisitions.
We have incurred and expect to continue to incur substantial expenses in connection with integrating the operations, technologies, and business systems of MaxLinear and acquired businesses. Business systems integration between the companies requires, and we expect it to continue to require into the foreseeable future, substantial management attention, including integration of information management, purchasing, accounting and finance, sales, and regulatory compliance functions. Numerous factors beyond our control could affect the total cost or the timing of expected integration expenses. Moreover, many of the expenses that will be incurred are by their nature difficult to estimate accurately at the present time. These expenses could, particularly in the near term, reduce the savings that we expect to achieve from the elimination of duplicative expenses and the realization of economies of scale and cost savings related to the integration of the businesses. These integration expenses have resulted in MaxLinear’s taking significant charges against earnings following the completion of the acquisitions.
We have recorded goodwill that could become impaired and adversely affect our future operating results.
Our business acquisitions are accounted for under the acquisition method of accounting by MaxLinear in accordance with accounting principles generally accepted in the United States. Under the acquisition method of accounting, the assets and liabilities of acquired businesses are recorded, as of completion, at their respective fair values and added to our assets and liabilities. Our reported financial condition and results of operations after completion of the acquisition reflect acquired businesses' balances and results but are not restated retroactively to reflect the historical financial position or results of operations of acquired businesses for periods prior to the acquisition. As a result, comparisons of future results against prior period results will be more difficult for investors.
Under the acquisition method of accounting, the total purchase price is allocated to net tangible assets and identifiable intangible assets of acquired businesses based on their fair values as of the date of completion of the acquisition. The excess of the purchase price over those fair values is recorded as goodwill. Our acquisitions have resulted in the creation of goodwill based upon the application of the acquisition method of accounting. To the extent the value of goodwill or other intangible assets become impaired, we may be required to incur material charges relating to such impairment. We conduct our annual goodwill impairment analysis on October 31 each year, or more frequently if we believe indicators of impairment exist. In addition, there can be no guarantee that acquired intangible assets, particularly in-process research and development, will generate revenues or profits that we include in our forecast that is the basis for their fair values as of the acquisition date. Any such impairment charges relating to goodwill or other intangible assets could have a material impact on our operating results in future periods, and the announcement of a material impairment could have an adverse effect on the trading price and trading volume of our common stock. For example, in the year ended December 31, 2017, we recognized IPR&D impairment losses of $2.0 million related principally to acquired Exar assets, in the year ended December 31, 2016, we recognized IPR&D impairment losses of $1.3 million related principally to acquired wireless infrastructure access assets, and in the year ended December 31, 2015, we recognized IPR&D impairment losses of $21.6 million related principally to acquired Entropic assets. As of December 31, 2017, our balance sheet reflected goodwill of $238.0 million and other intangible assets of $315.0 million, including IPR&D intangible assets of $4.4 million, and we could recognize impairment charges in the future.
ITEM 1B. | UNRESOLVED STAFF COMMENTS |
None.
ITEM 2. | PROPERTIES |
Our corporate headquarters occupy approximately 68,000 square feet in Carlsbad, California under a lease that expires in June 2022. A full range of business and engineering functions are represented at our corporate headquarters, including a laboratory for research and development and manufacturing operations. In addition to our principal office spaces in Carlsbad, we have leased facilities in Irvine, California; San Jose, California; Bangalore, India; Singapore; Taiwan; Shenzhen and Shanghai, China; Burnaby, Canada; Herzliya, Israel; and in Paterna, Spain.
42
ITEM 3. | LEGAL PROCEEDINGS |
CrestaTech Litigation
On January 21, 2014, CrestaTech Technology Corporation, or CrestaTech, filed a complaint for patent infringement against us in the United States District Court of Delaware, or the District Court Litigation. In its complaint, CrestaTech alleges that we infringe U.S. Patent Nos. 7,075,585, or the '585 Patent and 7,265,792, or the '792 Patent. In addition to asking for compensatory damages, CrestaTech alleges willful infringement and seeks a permanent injunction. CrestaTech also names Sharp Corporation, Sharp Electronics Corp. and VIZIO, Inc. as defendants based upon their alleged use of our television tuners.
On January 28, 2014, CrestaTech filed a complaint with the U.S. International Trade Commission, or ITC, again naming, among others, us, Sharp, Sharp Electronics, and VIZIO, or the ITC Investigation. On May 16, 2014, the ITC granted CrestaTech’s motion to file an amended complaint adding six OEM Respondents, namely, SIO International, Inc., Hon Hai Precision Industry Co., Ltd., Wistron Corp., Wistron Infocomm Technology (America) Corp., Top Victory Investments Ltd. and TPV International (USA), Inc. which are collectively referred to with us, Sharp and VIZIO as the Company Respondents. CrestaTech’s ITC complaint alleged a violation of 19 U.S.C. § 1337 through the importation into the United States, the sale for importation, or the sale within the United States after importation of MaxLinear’s accused products that CrestaTech alleged infringe the same two patents asserted in the Delaware action. Through its ITC complaint, CrestaTech sought an exclusion order preventing entry into the United States of certain of our television tuners and televisions containing such tuners from Sharp, Sharp Electronics, and VIZIO. CrestaTech also sought a cease and desist order prohibiting the Company Respondents from engaging in the importation into, sale for importation into, the sale after importation of, or otherwise transferring within the United States certain of our television tuners or televisions containing such tuners.
On March 10, 2014, the court stayed the District Court Litigation pending resolution of the ITC Investigation. Per the Court’s request, on April 19, 2017, the parties submitted a status report in the District Court Litigation. In their report, the parties suggested that the District Court Litigation remain stayed pending the Federal Circuit’s decision in the appeal of the ‘585 IPRs, and any subsequent appeal thereof, as more fully described below. Because the Federal Court appeals described below have concluded, the parties are to file a joint status report in the District Court Litigation.
On December 15, 2014, the ITC held a trial in the ITC Investigation. On February 27, 2015, the Administrative Law Judge, or the ALJ, issued a written Initial Determination, or ID, ruling that the Company Respondents do not violate Section 1337 in connection with CrestaTech’s asserted patents because CrestaTech failed to satisfy the economic prong of the domestic industry requirement pursuant to Section 1337(a)(2). In addition, the ID stated that certain of our television tuners and televisions incorporating those tuners manufactured and sold by certain customers infringe three claims of the ‘585 Patent (claims 10, 12 and 13), and these three claims were not determined to be invalid. On April 30, 2015, the ITC issued a notice indicating that it intended to review portions of the ID finding no violation of Section 1337, including the ID’s findings of infringement with respect to, and validity of, the ‘585 Patent, and the ID’s finding that CrestaTech failed to establish the existence of a domestic industry within the meaning of Section 1337.
The ITC subsequently issued its opinion, which terminated its investigation. The opinion affirmed the findings of the ALJ that no violation of Section 1337 had occurred because CrestaTech had failed to establish the economic prong of the domestic industry requirement. The ITC also affirmed the ALJ's finding of infringement with respect to the three claims of the '585 Patent that were not held to be invalid.
On November 30, 2015, CrestaTech filed an appeal of the ITC decision with the United States Court of Appeals for the Federal Circuit, or the Federal Circuit. On March 7, 2016, CrestaTech voluntarily dismissed its appeal, resulting in a final determination of the ITC Investigation in our favor.
In addition, we have filed four petitions for inter partes review, or IPR, by the US Patent Office, two for each of the CrestaTech patents asserted against us. The Patent Trial and Appeal Board, or the PTAB, did not institute two of these IPRs as being redundant to IPRs filed by another party that were already underway for the same CrestaTech patent. The remaining two petitions were instituted or instituted-in-part meaning, together with the IPRs filed by third parties, there were six IPR proceedings instituted involving the two CrestaTech patents asserted against us.
In October 2015, the PTAB issued final decisions in two of the six pending IPR proceedings (one for each of the two asserted patents), holding that all of the reviewed claims are unpatentable. Included in these decisions was one of the three claims of the ‘585 Patent (claim 10) mentioned above in connection with the ITC’s final decision. CrestaTech appealed the PTAB’s decisions at the Federal Circuit. On November 8, 2016, the Federal Circuit issued an opinion affirming the PTAB’s finding of unpatentability.
43
In August 2016, the PTAB issued final written decisions in the remaining four pending IPR proceedings (two for each of the asserted patents), holding that many of the reviewed claims - including the two remaining claims of the ‘585 Patent which the ITC held were infringed - are unpatentable. The parties have appealed the two decisions related to the ‘585 Patent; however, no appeals were filed as to the PTAB’s rulings for the ‘792 Patent. The Federal Circuit heard oral argument on these appeals on December 4, 2017. On December 7, the Federal Circuit issued a Rule 36 affirmance in one of the '585 appeals, affirming that the two remaining claims that the ITC had ruled were valid and infringed (claims 12 and 13) are unpatentable. On January 25, 2018, the Federal Circuit issued its ruling in the other ‘585 appeal, vacating the Board’s ruling that certain claims were not unpatentable and remanding to the Board for further analysis of whether CrestaTech is estopped from arguing and/or has waived the right to argue whether six dependent claims are patentable.
As a result of these IPR decisions, all 13 claims that CrestaTech asserted against us in the ITC Investigation have been found to be unpatentable by the PTAB and the Federal Circuit.
On March 18, 2016, CrestaTech filed a petition for Chapter 7 bankruptcy in the Northern District of California. As a result of this proceeding, all rights in the CrestaTech asserted patents, including the right to control the pending litigation, were assigned to CF Crespe LLC, or CF Crespe. CF Crespe is now the named party in the pending IPRs, the Federal Circuit appeal and District Court Litigation.
We cannot predict the outcome of any appeal by CF Crespe or CrestaTech, the District Court Litigation, or the IPRs. Any adverse determination in the District Court Litigation could have a material adverse effect on our business and operating results.
Trango Systems, Inc. Litigation
On or about August 2, 2016, Trango Systems, Inc., or Trango, filed a complaint in the Superior Court of California, County of San Diego, Central Division, against defendants Broadcom Corporation, Inc., or Broadcom, and us, collectively, Defendants. Trango is a purchaser that alleges various fraud, breach of contract, and interference with economic relations claims in connection with the discontinuance of a chip line we acquired from Broadcom in 2016. Trango seeks unspecified general and special damages, pre-judgment interest, expenses and costs, attorneys’ fees, punitive damages, and unspecified injunctive and equitable relief. We intend to vigorously defend against the lawsuit. On June 23, 2017, the Court sustained our demurrer to each cause of action in the second amended complaint, filed on or about December 6, 2016. Trango filed its third amended complaint on or about July 13, 2017. On August 17, 2017 we filed a demurrer to each cause of action against us in the third amended complaint, as well as a motion to strike certain allegations. Trango’s oppositions to our demurrer and motion to strike are currently due on February 8, 2018 and the court hearing on our demurrer and motion to strike is scheduled for February 23, 2018. Discovery in the matter is currently stayed pending resolution of the demurrer and motion to strike.
We cannot predict the outcome of the Trango Systems, Inc. litigation. Any adverse determination in the Trango Systems, Inc. litigation could have a material adverse effect on our business and operating results.
Exar Shareholder Litigation
On April 18, 2017, The Vladimir Gusinsky Revocable Trust filed a complaint in the United States District Court for the Northern District of California against Exar, its board of directors, MaxLinear, and Eagle Acquisition Corporation (a wholly owned subsidiary of MaxLinear), captioned The Vladimir Gusinsky Rev. Trust v. Exar Corp. et al., No. 5:17-CV-2150-SI (N.D. Cal.). On April 25, 2017, Richard E. Marshall filed a complaint in United States District Court for the Northern District of California against Exar and its board of directors, captioned Marshall v. Exar Corp. et al., No. 3:17-CV-02334 (N.D. Cal.). MaxLinear and Eagle Acquisition Corp. were not named as defendants in the Marshall action. The complaints generally alleged that the merger with Exar offered inadequate consideration to Exar’s shareholders and that the Schedule 14D-9 filed by Exar in connection with the merger omitted material information. The complaints purported to bring class claims for violation of sections 14(e), 14(d), and 20(a) of the Securities Exchange Act of 1934 and SEC Rule 14d-9. The complaints sought certification of a class; an injunction barring the merger or, if defendants enter into the merger, an order rescinding it or awarding rescissory damages; declaratory relief; and plaintiff’s costs, including attorneys’ fees and experts’ fees.
On or about May 3, 2017, the parties to the above-referenced lawsuits reached an agreement whereby plaintiffs voluntarily dismissed the claims brought by Mr. Marshall and The Vladimir Gusinsky Revocable Trust with prejudice (but without prejudice as to other members of the putative class), defendants made certain supplemental disclosures, and the plaintiffs would receive a mootness fee. On May 3, 2017, Exar made the supplemental disclosures contemplated by this agreement. On October 24, 2017, the parties entered a Settlement Agreement Regarding Claim for Mootness Fees pursuant to
44
which we agreed to pay counsel for the plaintiffs a mootness fee. We have now paid the fee, and with the execution of the settlement agreement, this litigation has been resolved.
Other Matters
In addition, from time to time, we are subject to threats of litigation or actual litigation in the ordinary course of business, some of which may be material. Other than the CrestaTech and Trango litigation described above, we believe that there are no other currently pending litigation matters that, if determined adversely by us, would have a material effect on our business or that would not be covered by our existing liability insurance.
ITEM 4. | MINE SAFETY DISCLOSURES |
Not applicable.
45
PART II — FINANCIAL INFORMATION
ITEM 5. | MARKET FOR REGISTRANT’S COMMON EQUITY, RELATED STOCKHOLDER MATTERS AND ISSUER PURCHASES OF EQUITY SECURITIES |
Market Information and Holders
In March 2010, we completed the initial public offering of our Class A common stock. Our common stock (formerly Class A common stock) is traded on the New York Stock Exchange, or the NYSE, under the symbol MXL. The following table sets forth, for the periods indicated, the high and low sale prices for our common stock (formerly Class A common stock) as reported by the NYSE:
Year Ended December 31, 2017 | |||||||
High | Low | ||||||
First Quarter (January 1, 2017 to March 31, 2017) | $ | 28.05 | $ | 21.44 | |||
Second Quarter (April 1, 2017 to June 30, 2017) | $ | 32.19 | $ | 26.62 | |||
Third Quarter (July 1, 2017 to September 30, 2017) | $ | 28.80 | $ | 20.67 | |||
Fourth Quarter (October 1, 2017 to December 31, 2017) | $ | 27.25 | $ | 23.02 | |||
Year Ended December 31, 2016 | |||||||
High | Low | ||||||
First Quarter (January 1, 2016 to March 31, 2016) | $ | 18.62 | $ | 13.49 | |||
Second Quarter (April 1, 2016 to June 30, 2016) | $ | 20.91 | $ | 15.86 | |||
Third Quarter (July 1, 2016 to September 30, 2016) | $ | 22.36 | $ | 17.30 | |||
Fourth Quarter (October 1, 2016 to December 31, 2016) | $ | 22.70 | $ | 18.37 | |||
On December 29, 2017, the last reported sales price of our common stock was $26.42 and, according to our transfer agent, as of February 12, 2018, there were 76 record holders of our common stock. We believe we have approximately 21,000 beneficial holders of our common stock.
Dividend Policy
We have never declared or paid cash dividends on our common stock. We currently intend to retain all available funds and any future earnings for use in the operation of our business and do not anticipate paying any dividends on our common stock in the foreseeable future. Any future determination to declare dividends will be made at the discretion of our Board of Directors and will depend on our financial condition, operating results, capital requirements, general business conditions and other factors that our Board of Directors may deem relevant.
46
Stock Performance Graph
Notwithstanding any statement to the contrary in any of our previous or future filings with the SEC, the following information relating to the price performance of our common stock shall not be deemed “filed” with the SEC or “Soliciting Material” under the Exchange Act, or subject to Regulation 14A or 14C, or to liabilities of Section 18 of the Exchange Act except to the extent we specifically request that such information be treated as soliciting material or to the extent we specifically incorporate this information by reference.
The graph below compares the cumulative total stockholder return on our common stock with the cumulative total return on The NYSE Composite Index and The Philadelphia Semiconductor Index. The period shown commences on December 31, 2012 and ends on December 31, 2017, the end of our last fiscal year. The graph assumes an investment of $100 on December 31, 2012, and the reinvestment of any dividends.
The comparisons in the graph below are required by the Securities and Exchange Commission and are not intended to forecast or be indicative of possible future performance of our common stock.
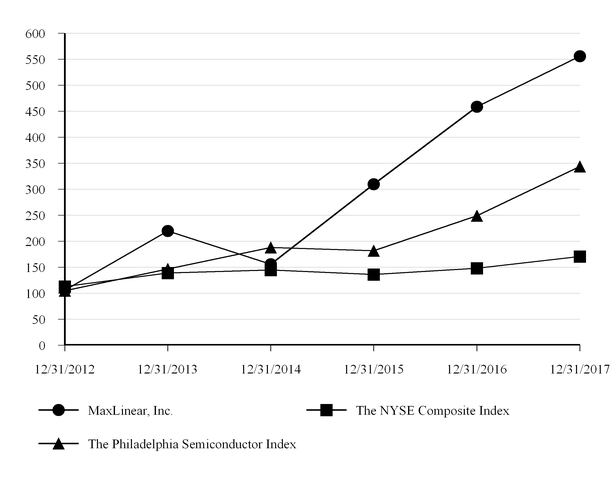
Recent Sales of Unregistered Securities
In the years ended December 31, 2017, 2016 and 2015, we issued an aggregate of 0.1 million, 0.2 million and 0.2 million shares, respectively, of our Class B common stock to certain employees upon the exercise of options awarded under our 2004 Stock Plan. We received aggregate proceeds of approximately $0.1 million, $0.4 million and $0.4 million as a result of the exercise of these options in the years ended December 31, 2017, 2016 and 2015, respectively.
The sales and issuances of securities in the transactions described above were deemed to be exempt from registration prior to the conversion under the Securities Act of 1933, as amended, in reliance upon Rule 701 promulgated under Section 3(b) of the Securities Act of 1933, as amended, as transactions pursuant to compensatory benefit plans and contracts relating to compensation as provided under Rule 701. The recipients of securities in each transaction represented their intentions to acquire
47
the securities for investment only and not with a view to or for sale in connection with any distribution thereof and appropriate legends were affixed to the securities issued in these transactions. All recipients had adequate access, through employment or other relationships, to information about us. All certificates representing the securities issued in these transactions included appropriate legends setting forth that the securities had not been offered or sold pursuant to a registration statement and describing the applicable restrictions on transfer of the securities. None of the foregoing transactions involved any underwriters, underwriting discounts or commissions, or any public offering.
On March 29, 2017, all Class B common stock underlying then outstanding Class B stock options under the 2004 Stock Plan were converted on a one-for-one basis to a single class of common stock. We subsequently registered the underlying shares post-conversion with the U.S. Securities and Exchange Commission on Form S-8, which we filed on March 30, 2017. Prior to the conversion, each share of our Class B common stock was convertible at any time at the option of the holder into one share of our Class A common stock. In addition, each share of our Class B common stock would have converted automatically into one share of Class A common stock upon any transfer, whether or not for value, except for certain transfers described in our certificate of incorporation.
Recent Repurchases of Equity Securities
On February 16, 2017, we repurchased 12,500 shares of Class A common stock from a member of our board of directors, Steven C. Craddock, at $26.76 per share, which represents the closing price of our Class A common stock on the date of repurchase, for aggregate proceeds of $0.3 million. These shares were immediately cancelled upon repurchase. Such repurchase was approved by our Board of Directors. No plan or agreement exists with respect to future repurchases, either from Mr. Craddock or other directors.
The following table sets forth our repurchases of equity securities for the year ended December 31, 2017:
Period | (a) Total number of shares (or units) purchased | (b) Average price paid per share (or unit) | (c) Total number of shares (or units) purchased as part of publicly announced plans or programs | (d) Maximum number (or approximate dollar value) of shares (or units) that may yet be purchased under the plans or programs | ||||||||
January 1, 2017 to January 31, 2017 | — | — | — | — | ||||||||
February 1, 2017 to February 28, 2017 | 12,500 | $ | 26.76 | — | — | |||||||
March 1, 2017 to March 31, 2017 | — | — | — | — | ||||||||
April 1, 2017 to April 30, 2017 | — | — | — | — | ||||||||
May 1, 2017 to May 31, 2017 | — | — | — | — | ||||||||
June 1, 2017 to June 30, 2017 | — | — | — | — | ||||||||
July 1, 2017 to July 31, 2017 | — | — | — | — | ||||||||
August 1, 2017 to August 31, 2017 | — | — | — | — | ||||||||
September 1, 2017 to September 30, 2017 | — | — | — | — | ||||||||
October 1, 2017 to October 31, 2017 | — | — | — | — | ||||||||
November 1, 2017 to November 30, 2017 | — | — | — | — | ||||||||
December 1, 2017 to December 31, 2017 | — | — | — | — | ||||||||
Total | 12,500 | — | — | |||||||||
48
ITEM 6. | SELECTED FINANCIAL DATA |
We have derived the selected consolidated statement of operations data for the years ended December 31, 2017, 2016 and 2015 and selected consolidated balance sheet data as of December 31, 2017 and 2016 from our consolidated financial statements and related notes included elsewhere in this report. We have derived the consolidated statement of operations data for the years ended December 31, 2014 and 2013 and the consolidated balance sheet data as of December 31, 2015, 2014 and 2013 from our consolidated financial statements not included in this report. Our historical results are not necessarily indicative of the results to be expected for any future period. The following selected consolidated financial data should be read in conjunction with “Management’s Discussion and Analysis of Financial Condition and Results of Operations” and our consolidated financial statements and related notes included elsewhere in this report.
Years Ended December 31, | |||||||||||||||||||
2017 | 2016 | 2015 | 2014 | 2013 | |||||||||||||||
(in thousands, except per share amounts) | |||||||||||||||||||
Consolidated Statement of Operations Data: | |||||||||||||||||||
Net revenue | $ | 420,318 | $ | 387,832 | $ | 300,360 | $ | 133,112 | $ | 119,646 | |||||||||
Cost of net revenue | 212,355 | 157,842 | 144,937 | 51,154 | 46,683 | ||||||||||||||
Gross profit | 207,963 | 229,990 | 155,423 | 81,958 | 72,963 | ||||||||||||||
Operating expenses: | |||||||||||||||||||
Research and development | 112,279 | 97,745 | 85,405 | 56,625 | 53,132 | ||||||||||||||
Selling, general and administrative | 105,831 | 64,454 | 77,981 | 34,191 | 32,181 | ||||||||||||||
IPR&D impairment losses | 2,000 | 1,300 | 21,600 | — | — | ||||||||||||||
Restructuring charges | 9,524 | 3,432 | 14,086 | — | — | ||||||||||||||
Total operating expenses | 229,634 | 166,931 | 199,072 | 90,816 | 85,313 | ||||||||||||||
Income (loss) from operations | (21,671 | ) | 63,059 | (43,649 | ) | (8,858 | ) | (12,350 | ) | ||||||||||
Interest income | 274 | 572 | 275 | 236 | 222 | ||||||||||||||
Interest expense | (10,378 | ) | (104 | ) | (100 | ) | (15 | ) | (4 | ) | |||||||||
Other income (expense), net | (2,223 | ) | 163 | 568 | (108 | ) | (199 | ) | |||||||||||
Total interest and other income (expense), net | (12,327 | ) | 631 | 743 | 113 | 19 | |||||||||||||
Income (loss) before income taxes | (33,998 | ) | 63,690 | (42,906 | ) | (8,745 | ) | (12,331 | ) | ||||||||||
Provision (benefit) for income taxes | (24,811 | ) | 2,398 | (575 | ) | (1,704 | ) | 402 | |||||||||||
Net income (loss) | $ | (9,187 | ) | $ | 61,292 | $ | (42,331 | ) | $ | (7,041 | ) | $ | (12,733 | ) | |||||
Net income (loss) per share: | |||||||||||||||||||
Basic | $ | (0.14 | ) | $ | 0.96 | $ | (0.79 | ) | $ | (0.19 | ) | $ | (0.37 | ) | |||||
Diluted | $ | (0.14 | ) | $ | 0.91 | $ | (0.79 | ) | $ | (0.19 | ) | $ | (0.37 | ) | |||||
Shares used to compute net income (loss) per share: | |||||||||||||||||||
Basic | 66,252 | 63,781 | 53,378 | 36,472 | 34,012 | ||||||||||||||
Diluted | 66,252 | 67,653 | 53,378 | 36,472 | 34,012 | ||||||||||||||
As of December 31, | |||||||||||||||||||
2017 | 2016 | 2015 | 2014 | 2013 | |||||||||||||||
(in thousands) | |||||||||||||||||||
Consolidated Balance Sheet Data: | |||||||||||||||||||
Cash, cash equivalents, restricted cash, and short- and long-term investments, available-for-sale | $ | 74,412 | $ | 136,805 | $ | 130,498 | $ | 79,351 | $ | 86,354 | |||||||||
Working capital | 124,918 | 158,304 | 134,170 | 67,668 | 56,558 | ||||||||||||||
Total assets | 824,862 | 422,652 | 334,505 | 135,711 | 124,929 | ||||||||||||||
Total stockholders’ equity | 387,424 | 352,424 | 262,924 | 99,102 | 86,674 | ||||||||||||||
49
ITEM 7. | MANAGEMENT'S DISCUSSION AND ANALYSIS OF FINANCIAL CONDITION AND RESULTS OF OPERATIONS |
Forward-Looking Statements
The following discussion and analysis of the financial condition and results of our operations should be read in conjunction with the consolidated financial statements and related notes included elsewhere in this report. This discussion contains forward-looking statements that involve risks and uncertainties. Our actual results could differ materially from those discussed below. Factors that could cause or contribute to such differences include, but are not limited to, those identified below, and those discussed in the section titled “Risk Factors” included elsewhere in this report.
Overview
We are a provider of radio frequency, or RF, high-performance analog, and mixed-signal communications systems-on-chip solutions for the connected home, wired and wireless infrastructure, and industrial and multi-market applications. Our customers include electronics distributors, module makers, original equipment manufacturers, or OEMs, and original design manufacturers, or ODMs, who incorporate the Company’s products in a wide range of electronic devices including cable DOCSIS broadband modems and gateways; wireline connectivity devices for in-home networking applications; RF transceivers and modems for wireless carrier access and backhaul infrastructure; fiber-optic modules for data center, metro, and long-haul transport networks; video set-top boxes and gateways; hybrid analog and digital televisions, direct broadcast satellite outdoor and indoor units; and power management and interface products used in these and a range of other markets. We are a fabless integrated circuit design company whose products integrate all or substantial portions of a broadband communication system.
Our net revenue has grown from approximately $0.6 million in fiscal 2006 to $420.3 million in fiscal 2017. In fiscal 2017, our net revenue was derived primarily from sales of RF receivers and RF receiver systems-on-chip and connectivity solutions into broadband operator voice and data modems and gateways and connectivity adapters, global analog and digital RF receiver products for analog and digital pay-TV applications, radio and modem solutions into wireless carrier access and backhaul infrastructure platforms, high-speed optical interconnect solutions sold into optical modules for data-center, metro and long-haul networks, and high-performance interface and power management solutions into a broad range of communications, industrial, automotive and multi-market applications. Our ability to achieve revenue growth in the future will depend, among other factors, on our ability to further penetrate existing markets; our ability to expand our target addressable markets by developing new and innovative products; and our ability to obtain design wins with device manufacturers, in particular manufacturers of set-top boxes, data modems, and gateways for the broadband service provider and Pay-TV industries, manufacturers selling into the smartphone market, storage networking market, cable infrastructure market, industrial and automotive markets, and optical module and telecommunications infrastructure markets.
Products shipped to Asia accounted for 89%, 93% and 91% of net revenue during the years ended December 31, 2017, 2016 and 2015, respectively. Although a large percentage of our products is shipped to Asia, we believe that a significant number of the systems designed by these customers and incorporating our semiconductor products are then sold outside Asia. For example, we believe revenue generated from sales of our digital terrestrial set-top box products during the years ended December 31, 2017, 2016 and 2015 related principally to sales to Asian set-top box manufacturers delivering products into Europe, Middle East, and Africa, or EMEA markets. Similarly, revenue generated from sales of our cable modem products during the years ended December 31, 2017, 2016 and 2015 related principally to sales to Asian ODMs and contract manufacturers delivering products into European and North American markets. To date, most of our sales have been denominated in United States dollars. There is a growing portion of our business, related specifically to our high-speed optical interconnect products, that are shipped to, and are ultimately consumed in Asian markets, with the majority of these products being purchased by end customers in China.
A significant portion of our net revenue has historically been generated by a limited number of customers. In the year ended December 31, 2017, one of our customers, Arris, accounted for 25% of our net revenue, and our ten largest customers collectively accounted for 58% of our net revenue. In the year ended December 31, 2016, two of our customers, Arris and Technicolor (which includes Cisco's former connected devices business), accounted for 37% of our net revenue, and our ten largest customers collectively accounted for 74% of our net revenue. Sales to Arris as a percentage of revenue include sales to Pace, which was acquired by Arris in January 2016, for the year ended December 31, 2016. In the year ended December 31, 2015, two of our customers, Arris, and Technicolor (which includes Cisco's former connected devices business), accounted for 41% of our net revenue, and our ten largest customers collectively accounted for 76% of our net revenue. In November 2015, Technicolor completed its purchase of Cisco’s connected devices business. For the year ended December 31, 2015, the revenue percentage did not include the 1% revenue percentage for Technicolor. For certain customers, we sell multiple products into disparate end user applications such as cable modems, satellite set-top boxes and broadband gateways.
50
Our business depends on winning competitive bid selection processes, known as design wins, to develop semiconductors for use in our customers’ products. These selection processes are typically lengthy, and as a result, our sales cycles will vary based on the specific market served, whether the design win is with an existing or a new customer and whether our product being designed in our customer’s device is a first generation or subsequent generation product. Our customers’ products can be complex and, if our engagement results in a design win, can require significant time to define, design and result in volume production. Because the sales cycle for our products is long, we can incur significant design and development expenditures in circumstances where we do not ultimately recognize any revenue. We do not have any long-term purchase commitments with any of our customers, all of whom purchase our products on a purchase order basis. Once one of our products is incorporated into a customer’s design, however, we believe that our product is likely to remain a component of the customer’s product for its life cycle because of the time and expense associated with redesigning the product or substituting an alternative chip. Product life cycles in our target markets will vary by application. For example, in the hybrid television market, a design-in can have a product life cycle of 9 to 18 months. In the terrestrial retail digital set-top box market, a design-in can have a product life cycle of 18 to 24 months. In the cable operator modem and satellite gateway sectors, a design-in can have a product life cycle of 24 to 48 months. In the industrial and wired and wireless infrastructure markets, a design-in can have a product life cycle of 24 to 60 months and beyond.
On April 30, 2015, the Company completed its acquisition of Entropic. Pursuant to the terms of the merger agreement or merger agreements dated as of February 3, 2015, by and among MaxLinear, Entropic, and two wholly-owned subsidiaries of the Company, all of the Entropic outstanding shares were converted into the right to receive consideration consisting of cash and shares of our Class A common stock. We paid an aggregate of $111.1 million in cash and issued an aggregate of 20.4 million shares of our Class A common stock to the stockholders of Entropic. In addition, we assumed all outstanding Entropic stock options and unvested restricted stock units that were held by continuing service providers (as defined in the merger agreement). The Company used Entropic’s cash and cash equivalents to fund a significant portion of the cash portion of the merger consideration and, to a lesser extent, our own cash and cash equivalents.
On April 28, 2016, we entered into an asset purchase agreement with Microsemi Storage Solutions, Inc., formerly known as PMC-Sierra, Inc., or Microsemi, and consummated the transactions contemplated by the asset purchase agreement. We paid cash consideration of $21.0 million for the purchase of certain wireless access assets of Microsemi's wireless infrastructure access business, and assumed certain specified liabilities. The assets acquired include, among other things, radio frequency and analog/mixed signal patents and other intellectual property, in-production and next-generation RF transceiver designs, a workforce-in-place, and other intangible assets, as well as tangible assets that include but are not limited to production masks and other production related assets, inventory, and other property, plant, and equipment. The liabilities assumed include, among other things, product warranty obligations and accrued vacation and severance obligations for employees of the wireless infrastructure access business that were rehired by the Company.
On May 9, 2016, we entered into a definitive agreement to purchase certain assets and assume certain liabilities of the wireless infrastructure backhaul business of Broadcom Corporation, or Broadcom. On July 1, 2016, we consummated the transactions contemplated by the purchase agreement and paid aggregate cash consideration of $80.0 million and hired certain employees of the wireless infrastructure backhaul business. The assets acquired include, among other things, digital baseband, radio frequency, or RF, and analog/mixed signal patents and other intellectual property, in-production and next-generation digital baseband and RF transceiver integrated circuit and reference platform designs, a workforce-in-place, and other intangible assets, as well as tangible assets that include but are not limited to production masks and other production related assets, inventory, and other property and equipment. The liabilities assumed include, among other things, product warranty obligations, liabilities for technologies acquired, and a payable to Broadcom as reimbursement of costs associated with the termination of those employees of the wireless infrastructure backhaul business who were not hired by MaxLinear upon the closing of the acquisition. For more information, please refer to Note 3 of our consolidated financial statements.
The acquired assets and liabilities, together with the rehired employees for each of these acquisitions, represent businesses as defined in ASC 805, Business Combinations. We have integrated the acquired assets and rehired employees into our existing business.
Recent Developments
On March 29, 2017, each share of our then outstanding Class A common stock and Class B common stock and shares underlying our then outstanding stock options, restricted stock units and restricted stock awards automatically converted into a single class of our common stock or rights to receive shares of a single class of our common stock pursuant to the terms of our Fifth Amended and Restated Certificate of Incorporation. The conversion had no impact on the total number of issued and outstanding shares of our capital stock; the Class A shares and Class B shares converted into an equivalent number of shares of our common stock. In addition, the conversion did not increase the total number of authorized shares of our common stock,
51
which prior to the conversion was, and remains, 550,000,000 shares. However, our total number of authorized shares of capital stock was reduced from 1,575,000,000 to 1,509,554,147, to account for the retirement of the Class A shares and Class B shares that were outstanding at the time of the conversion. Following the conversion, our authorized capital stock includes 441,123,947 Class A shares and 493,430,200 Class B shares, which represents Class A shares and Class B shares that were authorized but unissued at the time of the conversion. No additional Class A shares or Class B shares will be issued following the conversion.
Following the conversion, each share of our common stock is entitled to one vote per share and otherwise has the same designations, rights, powers and preferences as the Class A common stock prior to the conversion. In addition, holders of our common stock vote as a single class of stock on any matter that is submitted to a vote of our stockholders. Prior to the conversion, the holders of our Class A and Class B common stock had identical voting rights, except that holders of Class A common stock were entitled to one vote per share and holders of Class B common stock were entitled to ten votes per share with respect to transactions that would result in a change of control of our company or that relate to our equity incentive plans. In addition, holders of Class B common stock had the exclusive right to elect two members of our Board of Directors, each referred to as a Class B Director. The shares of our Class B common stock were not publicly traded. Each share of our Class B common stock was convertible at any time at the option of the holder into one share of Class A common stock and in most instances automatically converted upon sale or other transfer.
On April 4, 2017, we consummated the transactions contemplated by a share and asset acquisition agreement with Marvell Semiconductor Inc., or Marvell, to purchase certain assets and assume certain liabilities of Marvell’s G.hn business, including its Spain legal entity, for aggregate cash consideration of $21.0 million. We also hired certain employees of the G.hn business outside of Spain and assumed employment obligations of the Spanish entity we acquired, which is now a subsidiary of MaxLinear. The assets acquired include, among other things, patents and other intellectual property, a workforce-in-place and other intangible assets, as well as tangible assets that include but are not limited to production masks and other production related assets, inventory and other property and equipment. The liabilities assumed include, among other things, product warranty obligations and accrued vacation and severance obligations for employees who joined MaxLinear and its subsidiaries as a result of the transaction. The acquired assets and assumed liabilities, together with the employees, represent a business as defined in ASC 805, Business Combinations. We are integrating the acquired assets and employees into our existing business.
In April 2017, our subsidiary in Singapore began operating under certain tax incentives in Singapore, which are generally effective through March 2022 and may be extended through March 2027. Under these incentives, qualifying income derived from certain sales of our integrated circuits is taxed at a concessionary rate over the incentive period. We also receive a reduced withholding tax rate on certain intercompany royalty payments made by our Singapore subsidiary during the incentive period. Such incentives are conditional upon our meeting certain minimum employment and investment thresholds within Singapore over time, and we may be required to return certain tax benefits in the event the Company does not achieve compliance related to that incentive period. We currently believe that we will be able to satisfy these conditions without material risk. Primarily because of our Singapore net operating losses and our full valuation allowance in Singapore, we do not believe the incentives will have a material impact on our income tax position in the year ending December 31, 2018.
On May 12, 2017, pursuant to the March 28, 2017 Agreement and Plan of Merger, Eagle Acquisition Corporation, a Delaware corporation and wholly-owned subsidiary of MaxLinear merged with and into Exar Corporation, or Exar, with Exar surviving as a wholly owned subsidiary of MaxLinear. Under this Agreement and Plan of Merger, we agreed to acquire Exar's outstanding common stock for $13.00 per share in cash. We also assumed certain of Exar's stock-based awards in the merger. We paid aggregate cash consideration of $688.1 million, including $12.7 million of cash paid to settle certain stock-based awards that were not assumed by us in the merger. We funded the transaction with cash from the balance sheet of the combined companies, including $235.8 million of cash from Exar, and the net proceeds of approximately $416.8 million under a secured term loan facility in an aggregate principal amount of $425.0 million. The facility is available (i) to finance the Merger, refinance certain existing indebtedness of Exar and its subsidiaries, and fund all related transactions, (ii) to pay fees and expenses incurred in connection therewith and (iii) for working capital and general corporate purposes. The term loan facility has a seven-year term and the term loans bear interest at either an Adjusted LIBOR or an Adjusted Base Rate, plus a fixed applicable margin.
Exar is a designer and developer of high-performance analog mixed-signal integrated circuits and sub-system solutions. The merger significantly furthers our strategic goals of increasing revenue scale, diversifying revenues by end customers and addressable markets, and expanding our analog and mixed-signal footprint on existing tier-one customer platforms. Exar adds a diverse portfolio of high-performance analog and mixed-signal products constituting power management and interface technologies that are ubiquitous functions in wireless and wireline communications infrastructure, broadband access, industrial, enterprise networking, and automotive platforms. We intend to leverage combined technological expertise, cross-selling opportunities and distribution channels to significantly expand our serviceable addressable market. For a discussion of specific
52
risks and uncertainties that could affect our ability to achieve these and other strategic objectives of our acquisitions, please refer to Part I, Item 1A, “Risk Factors” under the subsection captioned “Risks Relating to Recent Acquisitions.”
Critical Accounting Policies and Estimates
Management’s discussion and analysis of our financial condition and results of operations is based upon our financial statements which are prepared in accordance with accounting principles that are generally accepted in the United States. The preparation of these financial statements requires us to make estimates and judgments that affect the reported amounts of assets and liabilities, related disclosure of contingent assets and liabilities at the date of the financial statements, and the reported amounts of revenues and expenses during the reporting period. We continually evaluate our estimates and judgments, the most critical of which are those related to revenue recognition, allowance for doubtful accounts, inventory valuation, income taxes and stock-based compensation. We base our estimates and judgments on historical experience and other factors that we believe to be reasonable under the circumstances. Materially different results can occur as circumstances change and additional information becomes known.
We believe that the following accounting policies involve a greater degree of judgment and complexity than our other accounting policies. Accordingly, these are the policies we believe are the most critical to understanding and evaluating our consolidated financial condition and results of operations.
Revenue Recognition
Revenue is generated from sales of our integrated circuits. We recognize revenue when all of the following criteria are met: 1) there is persuasive evidence that an arrangement exists, 2) delivery of goods has occurred, 3) the sales price is fixed or determinable and 4) collectability is reasonably assured. Title to product transfers to customers either when it is shipped to or received by the customer, based on the terms of the specific agreement with the customer.
Revenue is recorded based on the facts at the time of sale. Transactions for which we cannot reliably estimate the amount that will ultimately be collected at the time the product has shipped and title has transferred to the customer are deferred until the amount that is probable of collection can be determined. Items that are considered when determining the amounts that will be ultimately collected are a customer’s overall creditworthiness and payment history, customer rights to return unsold product, customer rights to price protection, customer payment terms conditioned on sale or use of product by the customer, or extended payment terms granted to a customer.
A portion of our revenues are generated from sales made through distributors, some of which are under agreements allowing for pricing credits and/or stock rotation rights of return. Pricing credits to our distributors may result from our price protection and unit rebate provisions, among other factors. These pricing credits and/or stock rotation rights prevent us from being able to reliably estimate the final sales price of the inventory sold and the amount of inventory that could be returned pursuant to these agreements. As a result, for some sales through distributors, we have determined that it does not meet all of the required revenue recognition criteria at the time we deliver our products to distributors as the final sales price is not fixed or determinable. For such sales, revenue is not recognized until product is shipped to the end customer, which is when the amount that will ultimately be collected is fixed or determinable. Upon shipment of product to these distributors, title to the inventory transfers to the distributor and the distributor is invoiced, generally with 30 to 60 day terms. On shipments to our distributors where revenue is not recognized, we record a trade receivable for the selling price as there is a legally enforceable right to payment, relieving the inventory for the carrying value of goods shipped since legal title has passed to the distributor, and record the corresponding gross profit in our consolidated balance sheet as a component of deferred revenue and deferred profit, representing the difference between the receivable recorded and the cost of inventory shipped. We also accept orders or amendments to orders with non-cancellable and non-refundable, or NCNR, terms with fixed pricing. For such transactions, revenue is not deferred. As of January 1, 2018, all sales to distributors will be recognized upon shipment and estimates of future pricing credits and/or stock rotation rights from the Company's distributors will reduce related revenues. If our estimates of such credits and rights are materially inaccurate, it may result in adjustments that affect future revenues and gross profits.
We record reductions in revenue for estimated pricing adjustments related to price protection agreements with our end customers in the same period that the related revenue is recorded. Price protection pricing adjustments are recorded at the time of sale as a reduction to revenue and an increase in our accrued liabilities. The amount of these reductions is based on specific criteria included in the agreements and other factors known at the time. We accrue 100% of potential price protection adjustments at the time of sale and do not apply a breakage factor. We de-recognize the accrual for unclaimed price protection amounts as specific programs contractually end or when we believe unclaimed amounts are no longer subject to payment and will not be paid.
53
Revenues from sales through our distributors accounted for 34%, 19% and 13% of net revenue for the years ended December 31, 2017, 2016 and 2015, respectively.
Allowance for Doubtful Accounts
We perform ongoing credit evaluations of our customers and assess each customers’ credit worthiness. We monitor collections and payments from our customers and maintain an allowance for doubtful accounts based upon our historical experience, our anticipation of uncollectible accounts receivable and any specific customer collection issues that we have identified. While our credit losses have historically been insignificant, we may experience higher credit loss rates in the future than we have in the past. Our receivables are concentrated with relatively few customers. Therefore, a significant change in the liquidity or financial position of any one significant customer could make collection of our accounts receivable more difficult, require us to increase our allowance for doubtful accounts and negatively affect our working capital.
Inventory Valuation
We assess the recoverability of our inventory based on assumptions about demand and market conditions. Forecasted demand is determined based on historical sales and expected future sales. Inventory is stated at the lower of cost or net realizable value. Cost approximates actual cost on a first-in, first-out basis and net realizable value is the estimated selling price in the ordinary course of business, less reasonably predictable costs of completion, disposal and transportation. We reduce our inventory to its lower of cost or net realizable value on a part-by-part basis to account for its obsolescence or lack of marketability. Reductions are calculated as the difference between the cost of inventory and its net realizable value based upon assumptions about future demand, market conditions and costs. Once established, these adjustments are considered permanent and are not revised until the related inventory is sold or disposed of. If actual market conditions are less favorable than those projected by management, additional inventory write-downs may be required that may adversely affect our operating results. If actual market conditions are more favorable, we may have higher gross profits when products are sold.
Production Masks
Production masks with alternative future uses or discernible future benefits are capitalized and amortized over their estimated useful life of two years. To determine if the production mask has alternative future uses or benefits, we evaluate risks associated with developing new technologies and capabilities, and the related risks associated with entering new markets. Production masks that do not meet the criteria for capitalization are expensed as research and development costs.
Business Combinations
We apply the provisions of ASC 805, Business Combinations, in accounting for our acquisitions. ASC 805 requires us to recognize separately from goodwill the assets acquired and the liabilities assumed, at the acquisition date fair values. Goodwill as of the acquisition date is measured as the excess of consideration transferred over the acquisition date fair values of the net assets acquired and the liabilities assumed. While we use our best estimates and assumptions to accurately value assets acquired and liabilities assumed at the acquisition date as well as contingent consideration, where applicable, our estimates are inherently uncertain and subject to refinement. As a result, during the measurement period, which may be up to one year from the acquisition date, we record adjustments to the assets acquired and liabilities assumed with the corresponding offset to goodwill. Upon the conclusion of the measurement period or final determination of the values of assets acquired or liabilities assumed, whichever comes first, any subsequent adjustments are recorded to the consolidated statements of operations.
Costs to exit or restructure certain activities of an acquired company or our internal operations are accounted for as termination and exit costs pursuant to ASC 420, Exit or Disposal Cost Obligations, and are accounted for separately from the business combination. A liability for costs associated with an exit or disposal activity is recognized and measured at its fair value in the consolidated statement of operations in the period in which the liability is incurred. When estimating the fair value of facility restructuring activities, assumptions are applied regarding estimated sub-lease payments to be received, which can differ materially from actual results. This may require us to revise our initial estimates which may materially affect the results of operations and financial position in the period the revision is made.
For a given acquisition, we may identify certain pre-acquisition contingencies as of the acquisition date and may extend our review and evaluation of these pre-acquisition contingencies throughout the measurement period in order to obtain sufficient information to assess whether we include these contingencies as a part of the fair value estimates of assets acquired and liabilities assumed and, if so, to determine their estimated amounts.
54
If we cannot reasonably determine the fair value of a pre-acquisition contingency (non-income tax related) by the end of the measurement period, which is generally the case given the nature of such matters, we will recognize an asset or a liability for such pre-acquisition contingency if (i) it is probable that an asset existed or a liability had been incurred at the acquisition date and (ii) the amount of the asset or liability can be reasonably estimated. Subsequent to the measurement period, changes in estimates of such contingencies will affect earnings and could have a material effect on results of operations and financial position.
In addition, uncertain tax positions and tax related valuation allowances assumed in connection with a business combination are initially estimated as of the acquisition date. We reevaluate these items quarterly based upon facts and circumstances that existed as of the acquisition date with any adjustments to the preliminary estimates being recorded to goodwill if identified within the measurement period. Subsequent to the measurement period or final determination of the estimated value of the tax allowance or contingency, whichever comes first, changes to these uncertain tax positions and tax related valuation allowances will affect the income taxes provision (benefit) in the consolidated statement of operations and could have a material impact on the results of operations and financial position.
Goodwill and Intangible Assets
Goodwill is the excess of the purchase price over the fair value of identifiable net assets acquired in business combinations accounted for under the acquisition method. Intangible assets represent purchased intangible assets including developed technology and in-process research and development, or IPR&D, and technologies acquired or licensed from other companies, customer relationships, noncompete covenants, backlog, and trademarks and tradenames. Purchased finite-lived intangible assets are capitalized and amortized over their estimated useful lives. Technologies acquired or licensed from other companies, customer relationships, noncompete covenants, backlog, and trademarks and tradenames are capitalized and amortized over the greater of the terms of the agreement, or estimated useful life. We capitalize IPR&D projects acquired as part of a business combination. On completion of each project, IPR&D assets are reclassified to developed technology and amortized over their estimated useful lives.
Impairment of Goodwill and Long-Lived Assets
Goodwill is not amortized but is tested for impairment using either a qualitative assessment, and/or the two-step method as needed. This involves comparing the fair value of each reporting unit, which we have determined to be the entity itself, with its carrying amount, including goodwill. If the fair value of a reporting unit exceeds the carrying amount, the goodwill of the reporting unit is considered not impaired and the second step of the impairment test is unnecessary. If the carrying amount of a reporting unit exceeds its fair value, the second step of the impairment test is performed to measure the amount of impairment loss, if any. We test by reporting unit, goodwill and other indefinite-lived intangible assets for impairment at October 31 each year or more frequently if we believe indicators of impairment exist.
During development, IPR&D is not subject to amortization and is tested for impairment annually or more frequently if events or changes in circumstances indicate that the asset might be impaired. We review indefinite-lived intangible assets each year for impairment using a qualitative assessment, followed by a quantitative assessment, as needed, each year as of October 31, the date of our annual goodwill impairment review, or whenever events or changes in circumstances indicate the carrying value may not be recoverable. Recoverability of indefinite-lived intangible assets is measured by comparing the carrying amount of the asset to its fair value. In certain cases, we utilize the relief-from-royalty method when appropriate, and a fair value will be obtained based on analysis over the costs saved by owning the right instead of leasing it. Once an IPR&D project is complete, it becomes a finite-lived intangible asset and is evaluated for impairment both immediately prior to its change in classification and thereafter in accordance with our policy for long-lived assets.
We regularly review the carrying amount of our long-lived assets subject to depreciation and amortization, as well as the useful lives, to determine whether indicators of impairment may exist which warrant adjustments to carrying values or estimated useful lives. An impairment loss would be recognized when the sum of the expected future undiscounted net cash flows is less than the carrying amount of the asset. Should impairment exist, the impairment loss would be measured based on the excess of the carrying amount of the asset over the asset’s fair value.
Income Taxes
We provide for income taxes utilizing the asset and liability approach of accounting for income taxes. Under this approach, deferred taxes represent the future tax consequences expected to occur when the reported amounts of assets and liabilities are recovered or paid. Deferred taxes are presented net as noncurrent. The provision for income taxes generally represents income taxes paid or payable for the current year plus the change in deferred taxes during the year. Deferred taxes
55
result from the differences between the financial and tax bases of our assets and liabilities and are adjusted for changes in tax rates and tax laws when changes are enacted. Valuation allowances are recorded to reduce deferred tax assets when a judgment is made that is considered more likely than not that a tax benefit will not be realized. A decision to record a valuation allowance results in an increase in income tax expense or a decrease in income tax benefit. If the valuation allowance is released in a future period, income tax expense will be reduced accordingly.
The calculation of tax liabilities involves dealing with uncertainties in the application of complex global tax regulations. The impact of an uncertain income tax position is recognized at the largest amount that is “more likely than not” to be sustained upon audit by the relevant taxing authority. An uncertain income tax position will not be recognized if it has less than a 50% likelihood of being sustained. If the estimate of tax liabilities proves to be less than the ultimate assessment, a further charge to expense would result.
In assessing the realizability of deferred tax assets, management considers whether it is more likely than not that some portion or all of the deferred tax assets will be realized. The ultimate realization of deferred tax assets is dependent upon the generation of future taxable income during the periods in which those temporary differences become deductible. We continue to assess the need for a valuation allowance on the deferred tax asset by evaluating both positive and negative evidence that may exist. Any adjustment to the net deferred tax asset valuation allowance would be recorded in the income statement for the period that the adjustment is determined to be required.
On December 22, 2017, the Tax Cuts and Jobs Act, or the Tax Act, was enacted into U.S. tax law. Also on December 22, 2017, the SEC issued guidance in Staff Accounting Bulletin No. 118, or SAB 118, to address certain fact patterns where the accounting for changes in tax laws or tax rates under ASC Topic 740 is incomplete upon issuance of an entity's financial statements for the reporting period in which the Tax Act is enacted. As permitted in SAB 118, in 2017, we have taken a measurement period approach and reported certain provisional amounts, based on reasonable estimates, for certain tax effects in which the accounting under ASC 740 is incomplete. Such provisional amounts are subject to adjustment during a limited measurement period, not to extend one year beyond the tax law enactment date, until the accounting under ASC 740 is complete. We have also made required supplemental disclosures in the notes to the accompanying consolidated financial statements to accompany the provisional amounts, including the reasons for the incomplete accounting, the additional information or analysis that is needed, and other information relevant to why we were not able to complete the accounting required under ASC 740 in a timely manner.
Stock-Based Compensation
We measure the cost of employee services received in exchange for equity incentive awards, including restricted stock units and restricted stock awards, employee stock purchase rights and stock options, based on the grant date fair value of the award. We calculate the fair value of restricted stock units and restricted stock awards based on the fair market value of our common stock on the grant date. We use the Black-Scholes valuation model to calculate the fair value of stock options and employee stock purchase rights granted to employees. Stock-based compensation expense is recognized over the period during which the employee is required to provide services in exchange for the award, which is usually the vesting period. We recognize compensation expense over the vesting period using the straight-line method and classify these amounts in the statements of operations based on the department to which the related employee reports. We calculate the weighted-average expected life of options using the simplified method as prescribed by guidance provided by the Securities and Exchange Commission. This decision was based on the lack of historical data due to our limited number of stock option exercises under the 2010 Equity Incentive Plan. We will continue to assess the appropriateness of the use of the simplified method as we develop a history of option exercises.
Recently Adopted Accounting Pronouncements
In July 2015, the FASB issued ASU No. 2015-11, Simplifying the Measurement of Inventory, which requires inventory to be subsequently measured using the lower of cost and net realizable value. Net realizable value is the estimated selling prices in the ordinary course of business, less reasonably predictable costs of completion, disposal and transportation. ASU 2015-11 was effective for us beginning in the first quarter of fiscal year 2017 and has been applied prospectively. The adoption of ASU No. 2015-11 in 2017 did not have a material impact on our consolidated financial position and results of operations for the year ended December 31, 2017.
In March 2016, the FASB issued ASU No. 2016-09, Improvements to Share-Based Compensation to simplify certain aspects of accounting for share-based payment transactions associated with income taxes, classification as equity or liabilities, and classification on the statement of cash flows. The amendments in this update were effective for us for fiscal years
56
beginning with fiscal year 2017. The new guidance required, among other things, excess tax benefits and tax deficiencies to be recorded on a prospective basis in the income statement in the provision for income taxes when awards vest or are settled. On the statement of cash flows, excess tax benefits must be classified along with other income tax cash flows as an operating activity on either a prospective transition method or a retrospective transition method. Also, because excess tax benefits are no longer recognized in additional paid-in capital, the assumed proceeds from applying the treasury stock method when computing earnings per share is amended to exclude the amount of excess tax benefits that would be recognized in additional paid-in capital. We adopted ASU No. 2016-09 during the quarter ended June 30, 2016, as previously described in our Form 10-Q for the period ended June 30, 2016 filed with the Securities Exchange Commission on August 8, 2016. There was no cumulative effect on retained earnings in the consolidated balance sheet upon adoption since we had a full valuation allowance against U.S. deferred tax assets at the time of adoption. We elected to continue to estimate forfeitures of share-based awards resulting in no impact to stock-based compensation expense, and we are also continuing to classify cash paid when directly withholding shares for tax withholding purposes in cash flows from financing activities. On the statement of cash flows, excess tax benefits were classified along with other income tax cash flows as an operating activity upon adoption on a prospective basis.
In October 2016, the FASB issued ASU No. 2016-16, Income Taxes (Topic 740) to improve the accounting for the income tax consequences of intra-entity transfers of assets other than inventory. Prior accounting guidance prohibits the recognition of current and deferred income taxes for an intra-entity asset transfer until the asset has been sold to an outside party. The FASB decided that an entity should recognize the income tax consequences of an intra-entity transfer of an asset other than inventory when the transfer occurs. The amendments in this update should be applied on a modified retrospective basis through a cumulative-effect adjustment directly to retained earnings as of the beginning of the period of adoption. The amendments in this update are effective for us beginning in the first quarter of fiscal 2018, including interim reporting periods. Early adoption is permitted as of the first quarter of fiscal 2017, or the beginning of the annual reporting period only. We elected to early adopt the amendments in this update beginning in the three months ended March 31, 2017. Due to a full valuation allowance on U.S. and certain foreign deferred tax assets at the time of adoption, the adoption of the amendments in this update did not have a material impact on our consolidated financial position and results of operations for the year ended December 31, 2017.
In November 2016, the FASB issued ASU No. 2016-18, Statement of Cash Flows (Topic 230): Restricted Cash. The amendments in this update require that a statement of cash flows explain the change during the period in the total of cash, cash equivalents, and amounts generally described as restricted cash or restricted cash equivalents. Therefore, amounts generally described as restricted cash and restricted cash equivalents should be included with cash and cash equivalents when reconciling the beginning-of-period and end-of-period total amounts shown on the statement of cash flows. When cash, cash equivalents, and amounts generally described as restricted cash or restricted cash equivalents are presented in more than one line item within the statement of financial position, an entity shall, for each period that a statement of financial position is presented, disclose the line items and amounts of cash, cash equivalents, and amounts generally described as restricted cash or restricted cash equivalents disaggregated by the line item in which they appear within the statement of financial position, with a sum to the total amount of cash, cash equivalents, restricted cash and restricted cash equivalents. The amendments in this update are effective for us beginning in fiscal 2018, including interim periods within that year and should be applied using a retrospective transition method to each period presented. Early adoption is permitted, including adoption in an interim period. If an entity early adopts in an interim period, any adjustments should be reflected as of the beginning of the fiscal year that includes the interim period. We elected to early adopt the amendments in this update in 2017. The adoption did not have a material impact on our consolidated cash flows for the years ended December 31, 2017, 2016 and 2015.
In January 2017, the FASB issued ASU No. 2017-01, Business Combinations (Topic 805): Clarifying the Definition of a Business. The amendments in this update clarify the definition of a business with the objective of adding guidance to assist entities with evaluating whether transactions should be accounted for as acquisitions of assets or businesses and provides a screen to determine when a set is not a business. The screen requires that when substantially all of the fair value of the gross assets acquired (or disposed of) is concentrated in a single identifiable asset or a group of similar identifiable assets, the set is not a business. This screen reduces the number of transactions that need to be further evaluated. If the screen is not met, the amendments in this update (1) require that to be considered a business, a set must include, at a minimum, an input and a substantive process that together significantly contribute to the ability to create output and (2) remove the evaluation of whether a market participant could replace missing elements. The amendments in this update are effective for us beginning in the first quarter of 2018 and are required to be applied prospectively on or after the effective date. No disclosures are required at transition. Early application is allowed for transactions for which the acquisition date occurs before the issuance date or effective date of the amendments, only when the transaction has not been reported in financial statements that have been issued or made available for issuance. We elected to early adopt the amendments in this update for 2017 acquisitions. Such adoption
57
did not have a material impact on our consolidated financial position and results of operations for the year ended December 31, 2017.
On December 22, 2017, the U.S. government enacted comprehensive tax legislation commonly referred to as the Tax Cuts and Jobs Act, or the Tax Act. The Tax Act makes broad and complex changes to the U.S. tax code. On December 22, 2017, the U.S. Securities and Exchange Commission Staff, or SEC Staff, issued guidance in Staff Accounting Bulletin No. 118, or SAB 118, to address certain fact patterns where the accounting for changes in tax laws or tax rates under ASC Topic 740 is incomplete upon issuance of an entity's financial statements for the reporting period in which the Tax Act is enacted. As permitted in SAB 118, in 2017, we have taken a measurement period approach and reported certain provisional amounts, based on reasonable estimates, for certain tax effects in which the accounting under ASC 740 is incomplete. Such provisional amounts are subject to adjustment during a limited measurement period, not to extend one year beyond the tax law enactment date, until the accounting under ASC 740 is complete. We have also made required supplemental disclosures in the notes to the accompanying consolidated financial statements to accompany the provisional amounts, including the reasons for the incomplete accounting, the additional information or analysis that is needed, and other information relevant to why we were not able to complete the accounting required under ASC 740 in a timely manner. Adjustments to such reported provisional amounts could result in a material adverse impact to our consolidated financial position and results of operations in 2018.
Recently Issued Accounting Pronouncements
In May 2014, the Financial Accounting Standards Board, or FASB, issued Accounting Standards Update, or ASU No. 2014-09, Revenue from Contracts with Customers (Topic 606), which provides for new accounting guidance related to revenue recognition. This new standard will replace all current U.S. GAAP guidance on this topic and eliminate all industry-specific guidance. The new revenue recognition standard provides a unified model to determine when and how revenue is recognized. The core principle is that a company should recognize revenue to depict the transfer of promised goods or services to customers in an amount that reflects the consideration for which the entity expects to be entitled in exchange for those goods or services. This guidance is effective for us beginning on January 1, 2018 and can be applied either retrospectively to each period presented or as a cumulative-effect adjustment as of the date of adoption. We plan to apply the guidance prospectively with an adjustment to retained earnings for the cumulative effect of adoption. Adoption of the amendments in this guidance will accelerate the timing of our revenue and related cost recognition on products sold via some distributors, which will change from the sell-through method to the sell-in method under this guidance. We will also be required to estimate the effects of pricing credits to its distributors from contractual price protection and unit rebate provisions, as well as stock rotation rights. We performed an assessment of the impact of adopting this new accounting standard on our consolidated financial position and results of operations. The impact of adoption of this new accounting standard for the year ending December 31, 2018 will vary depending on the level of inventory remaining at the adoption date and at the end of the year of adoption at distributors for which we currently recognize revenue on a sell-through basis, and therefore could have a material impact on our revenues for the year ending December 31, 2018. The impact to retained earnings as of January 1, 2018 is not material. As a result of applying the guidance prospectively with an adjustment to retained earnings in the Company's consolidated financial statements for the cumulative effect of adoption, revenues that would have been recognized on a sell-through basis for the amount of deferred revenue and profit remaining as of the adoption date will not be recognized in earnings for any period.
In January 2016, the FASB issued ASU No. 2016-01, Recognition and Measurement of Financial Assets and Financial Liabilities. The amendments in this update include a requirement to measure equity investments (except equity method investments) at fair value with changes in fair value recognized in net income; previously changes in fair value were recognized in other comprehensive income. The amendments in this update are effective for us beginning in the first quarter of fiscal year 2018. Based on the Company's current corporate investment plans, the adoption of the amendments in this update are not expected to have a material impact on our consolidated financial position and results of operations.
In February 2016, the FASB issued ASU No. 2016-02, Leases (Topic 842). The amendments in this update require a lessee to recognize in the statement of financial position a liability to make lease payments (the lease liability) and a right-of-use asset representing its right to use the underlying asset for the lease term for all leases with terms greater than twelve months. For leases less than twelve months, an entity is permitted to make an accounting policy election by class of underlying asset not to recognize lease assets and lease liabilities. If a lessee makes this election, it should recognize lease expense for such leases generally on a straight-line basis over the lease term. The amendments in this update are effective for us for fiscal years beginning with fiscal year 2019, including interim periods within those years, with early adoption permitted. We are currently in the process of evaluating the impact of adoption of the amendments in this update on our consolidated financial position and results of operations; however, adoption of the amendments in this update is expected to have a material impact on our
58
consolidated financial position, including an increase in assets and liabilities representing the present value of our future lease payments.
In March 2016, the FASB issued ASU No. 2016-08, Principal versus Agent Considerations (Reporting Revenue Gross versus Net) to clarify the revenue recognition implementation guidance on principal versus agent considerations. The amendments in this update clarify that when another party is involved in providing goods or services to a customer, an entity that is the principal has obtained control of a good or service before it is transferred to a customer, and provides indicators to assist an entity in determining whether it controls a specified good or service prior to the transfer to the customer. An entity that is the principal recognizes revenue in the gross amount of consideration to which it expects to be entitled in exchange for the specified good or service transferred to the customer, whereas an agent recognizes revenue in the amount of any fee or commission to which it expects to be entitled in exchange for arranging for the specified good or service to be provided by the other party. The amendments in this update are effective for us beginning in the first quarter of fiscal year 2018, concurrent with the new revenue recognition standard. The adoption of the amendments in this update will not have a material impact on our consolidated financial position and results of operations.
In August 2016, the FASB issued ASU No. 2016-15, Classification of Certain Cash Receipts and Cash Payments to eliminate the diversity in practice regarding the presentation and classification of certain cash receipts and cash payments, including, among other things, contingent consideration payments made following a business combination and proceeds from the settlement of insurance claims in the statement of cash flows. Cash payments not made soon after the acquisition date up to the amount of the contingent consideration liability recognized at the acquisition date should be classified as financing activities, with any excess payments classified as operating activities, whereas cash payments made soon after the acquisition date to settle the contingent consideration should be classified as investing activities. Cash proceeds received from settlement of insurance claims should be classified on the basis of the nature of the related losses. The amendments in this update are effective for us for fiscal years beginning with fiscal year 2018, including interim periods within those years, with early adoption permitted. The impact of adoption of this guidance on our consolidated statement of cash flows will depend on the materiality and timing of any future contingent consideration payments and proceeds from settlement of insurance claims.
In December 2016, the FASB issued ASU No. 2016-19, Technical Corrections and Improvements. The new standard is intended to provide clarity to the Accounting Standards Codification, or ASC, or correct unintended application of the guidance that is not expected to have a significant effect on current accounting practice or create a significant administrative cost to most entities. ASU No. 2016-19 is effective for us in annual and interim fiscal reporting periods in 2018 with respect to the amendments that require transition guidance, and early adoption is permitted. All other amendments were effective on issuance. We do not believe that adoption of the amendments that require transition guidance will have a material impact on our consolidated financial statements.
In January 2017, the FASB issued ASU No. 2017-04, Intangibles—Goodwill and Other (Topic 350): Simplifying the Test for Goodwill Impairment, to simplify the subsequent measurement of goodwill by eliminating Step 2 from the goodwill impairment test. An entity no longer will determine goodwill impairment by calculating the implied fair value of goodwill by assigning the fair value of a reporting unit to all of its assets and liabilities as if the reporting unit had been acquired in a business combination. Instead, under the amendments in this update, an entity should perform its annual, or interim, goodwill impairment test by comparing the fair value of a reporting unit with its carrying amount. The FASB also eliminated the requirements for any reporting unit with a zero or negative carrying amount to perform a qualitative assessment and, if it fails that qualitative test, to perform Step 2 of the goodwill impairment test. The amendments in this update are effective for us beginning with fiscal year 2020, including interim periods, with early adoption permitted for interim or annual goodwill impairment tests performed on testing dates after January 1, 2017. The adoption of the amendments in this update is not expected to have a material impact on our consolidated financial position and results of operations.
In May 2017, the FASB issued ASU No. 2017-09, Compensation—Stock Compensation (Topic 718): Scope of Modification Accounting to provide clarity and reduce both (1) diversity in practice and (2) cost and complexity when applying the guidance in Topic 718, Compensation—Stock Compensation, to a change to the terms or conditions of a share-based payment award. The amendments in this update require us to account for the effects of a modification in a stock-based award unless the fair value, vesting conditions and classification of the modified award is the same as those of the original award immediately before the original award is modified. If the modification does not affect any of the inputs to the valuation technique that the entity uses to value the award, the entity is not required to estimate the value immediately before and after the modification. The amendments in this update are effective for us for fiscal years beginning with fiscal year 2018, including interim periods within those years, with early adoption permitted in any interim period. The amendments in this update should
59
be applied prospectively to an award modified on or after the adoption date. The adoption of this guidance is not expected have a material impact on our consolidated financial position and results of operations.
In August 2017, the FASB issued ASU 2017-12, Derivatives and Hedging (Topic 815), which is intended to improve accounting for hedging activities by expanding and refining hedge accounting for both nonfinancial and financial risk components and aligning the recognition and presentation of the effects of the hedging instrument and the hedged item in the financial statements. The amendments in this update are effective for us for fiscal years beginning with fiscal year 2019, including interim periods within those years, with early adoption permitted in any interim period. The amendments in this update should be applied prospectively. We are currently evaluating the expected impact of the amendments, but do not expect these to have a material impact on our consolidated financial statements upon adoption.
In September 2017, the FASB issued ASU No. 2017-13, Revenue Recognition (Topic 605), Revenue from Contracts with Customers (Topic 606), Leases (Topic 840), and Leases (Topic 842): Amendments to SEC Paragraphs Pursuant to the Staff Announcement at the July 20, 2017 EITF Meeting and Rescission of Prior SEC Staff Announcements and Observer Comments. The amendments in this update modify or supersede certain selected SEC paragraphs in the revenue and leases sections of the Codification and moves other paragraphs, upon adoption of ASC Topic 606 or ASC Topic 842. The amendments also provide updated guidance on the effective date of ASC 606, Revenue from Contracts with Customers, and ASC 842, Leases for certain entities that are considered public business entities only because their financial statements or financial information is required to be included in another entity’s SEC filing, but does not change the effective dates for us and other public business entities. The amendments in this update should be applied upon adoption of ASC Topics 606 and 842, respectively. The adoption of this guidance is not expected have a material impact on our consolidated financial position and results of operations.
Results of Operations
The following describes the line items set forth in our consolidated statements of operations.
Net Revenue. Net revenue is generated from sales of radio-frequency, mixed-signal and high-performance analog integrated circuits for the connected home, wired and wireless infrastructure, and industrial and multi-market applications. A significant portion of our customers purchases products indirectly from us through distributors.
Cost of Net Revenue. Cost of net revenue includes the cost of finished silicon wafers processed by third-party foundries; costs associated with our outsourced packaging and assembly, test and shipping; costs of personnel, including stock-based compensation, and equipment associated with manufacturing support, logistics and quality assurance; amortization of acquired developed technology intangible assets and inventory step-ups to fair value; amortization of certain production mask costs; cost of production load boards and sockets; and an allocated portion of our occupancy costs.
Research and Development. Research and development expense includes personnel-related expenses, including stock-based compensation, new product engineering mask costs, prototype integrated circuit packaging and test costs, computer-aided design software license costs, intellectual property license costs, reference design development costs, development testing and evaluation costs, depreciation expense and allocated occupancy costs. Research and development activities include the design of new products, refinement of existing products and design of test methodologies to ensure compliance with required specifications. All research and development costs are expensed as incurred.
Selling, General and Administrative. Selling, general and administrative expense includes personnel-related expenses, including stock-based compensation, amortization of certain acquired intangible assets, third-party sales commissions, field application engineering support, travel costs, professional and consulting fees, legal fees, depreciation expense and allocated occupancy costs.
IPR&D Impairment Losses. IPR&D impairment losses consist of charges resulting from the impairment of acquired in-process research and development technology intangible assets during the period.
Restructuring Charges. Restructuring charges consist of severance, lease and leasehold impairment charges, and other charges related to restructuring plans.
Interest and Other Income (Expense), Net. Interest and other income (expense), net includes interest income, interest expense and other income (expense). Interest income consists of interest earned on our cash, cash equivalents, restricted cash and investment balances. Interest expense consists of interest accrued on debt. Other income (expense) generally consists of income (expense) generated from non-operating transactions.
60
Income Tax Provision (Benefit). We make certain estimates and judgments in determining income tax expense for financial statement purposes, including certain provisional estimates in the year ended December 31, 2017 for certain tax effects of the Tax Act for which accounting under ASC 740 is incomplete, as permitted under SAB 118. These estimates and judgments occur in the calculation of certain tax assets and liabilities, which arise from differences in the timing of recognition of revenue and expenses for tax and financial statement purposes and the realizability of assets in future years.
The following table sets forth our consolidated statement of operations data as a percentage of net revenue for the periods indicated:
Years Ended December 31, | ||||||||
2017 | 2016 | 2015 | ||||||
Net revenue | 100 | % | 100 | % | 100 | % | ||
Cost of net revenue | 51 | 41 | 48 | |||||
Gross profit | 49 | 59 | 52 | |||||
Operating expenses: | ||||||||
Research and development | 27 | 25 | 28 | |||||
Selling, general and administrative | 25 | 17 | 26 | |||||
IPR&D impairment losses | — | — | 7 | |||||
Restructuring charges | 2 | 1 | 5 | |||||
Total operating expenses | 54 | 43 | 66 | |||||
Income (loss) from operations | (5 | ) | 16 | (14 | ) | |||
Total interest and other income (expense), net | (3 | ) | — | — | ||||
Income (loss) before income taxes | (8 | ) | 16 | (14 | ) | |||
Income tax provision (benefit) | (6 | ) | — | — | ||||
Net income (loss) | (2 | )% | 16 | % | (14 | )% | ||
Net Revenue
Years Ended December 31, | % Change | ||||||||||||||||
2017 | 2016 | 2015 | 2017 | 2016 | |||||||||||||
(dollars in thousands) | |||||||||||||||||
Connected home | $ | 288,610 | $ | 346,990 | $ | 294,251 | (17 | )% | 18 | % | |||||||
% of net revenue | 69 | % | 89 | % | 98 | % | |||||||||||
Infrastructure | 71,779 | 37,411 | 4,075 | 92 | % | 818 | % | ||||||||||
% of net revenue | 17 | % | 10 | % | 1 | % | |||||||||||
Industrial and multi-market | 59,929 | 3,431 | 2,034 | 1,647 | % | 69 | % | ||||||||||
% of net revenue | 14 | % | 1 | % | 1 | % | |||||||||||
Total net revenue | $ | 420,318 | $ | 387,832 | $ | 300,360 | 8 | % | 29 | % | |||||||
Net revenue increased $32.5 million to $420.3 million for the year ended December 31, 2017, as compared to $387.8 million for the year ended December 31, 2016. The decrease in connected home net revenue of $58.4 million was primarily driven by the anticipated declines in Entropic's satellite analog channel-stacking solutions for the satellite pay-TV market and inclusion of its legacy video SoC revenue, which declined significantly year-over-year, which were partially offset by increased cable modem and data gateway sales. We expect year-over-year revenue declines in the legacy video SoC and satellite analog channel-stacking products to no longer be significant moving forward, as these products are near the end of their life cycles. The increase in infrastructure revenues of $34.4 million primarily related to the incremental contribution of shipments from our wireless infrastructure backhaul business, which we acquired from Broadcom in July 2016, and from power management and data encryption products acquired from Exar in May 2017, which were partially offset by year-over-year declines in our high-speed interconnect products serving the Chinese Metro market infrastructure build-outs. The increase in industrial and multi-market revenue of $56.5 million was primarily related to the incremental contribution of shipments from Exar.
61
Net revenue increased $87.5 million to $387.8 million in the year ended December 31, 2016, as compared to $300.4 million in the year ended December 31, 2015. The increase in connected home net revenue of $52.7 million was primarily driven by increased cable and satellite RF receivers, digital channel-stacking, and both satellite and cable MoCA product shipments. The increase in infrastructure revenues of $33.3 million was primarily driven by the continued ramp of high-speed interconnect product shipments as well as contributions from our wireless access acquisition starting in May 2016 and our wireless backhaul acquisition starting in July 2016. The increase in industrial and multi-market revenues of $1.4 million was primarily related to a modest increase in products serving multi-market applications.
Cost of Net Revenue and Gross Profit
Years Ended December 31, | % Change | ||||||||||||||||
2017 | 2016 | 2015 | 2017 | 2016 | |||||||||||||
(dollars in thousands) | |||||||||||||||||
Cost of net revenue | $ | 212,355 | $ | 157,842 | $ | 144,937 | 35 | % | 9 | % | |||||||
% of net revenue | 51 | % | 41 | % | 48 | % | |||||||||||
Gross profit | 207,963 | 229,990 | 155,423 | (10 | )% | 48 | % | ||||||||||
% of net revenue | 49 | % | 59 | % | 52 | % | |||||||||||
Cost of net revenue increased $54.5 million to $212.4 million for the year ended December 31, 2017, as compared to $157.8 million for the year ended December 31, 2016. The increase was primarily driven by increased inventory step-up amortization of $19.9 million and acquired intangible amortization of $16.8 million primarily related to recent acquisitions of Exar in May 2017, the G.hn business acquired from Marvell in April 2017, and the wireless infrastructure businesses acquired from Microsemi and Broadcom in April 2016 and July 2016, respectively, and higher sales. The decrease in gross profit percentage for the year ended December 31, 2017, as compared to the year ended December 31, 2016, was due to a decrease in sales of higher margin products and the previously mentioned increase in amortization of inventory step-up and intangible amortization.
Cost of net revenue increased $12.9 million to $157.8 million for the year ended December 31, 2016, as compared to $144.9 million for the year ended December 31, 2015. This increase was primarily driven by higher sales and a $4.3 million increase in amortization of purchased intangible assets costs related to our wireless infrastructure access and backhaul acquisitions during 2016, partially offset by a decrease in amortization of inventory step-up of $8.6 million and reductions in our average manufacturing costs. The increase in gross profit percentages for the year ended December 31, 2016, as compared to the year ended December 31, 2015, was due to an increase in sales of higher margin products and the previously mentioned reduction in amortization of inventory step-up.
We currently expect that gross profit percentage will fluctuate in the future, from period-to-period, based on changes in product mix, average selling prices, and average manufacturing costs.
Research and Development
Years Ended December 31, | % Change | ||||||||||||||||
2017 | 2016 | 2015 | 2017 | 2016 | |||||||||||||
(dollars in thousands) | |||||||||||||||||
Research and development | $ | 112,279 | $ | 97,745 | $ | 85,405 | 15 | % | 14 | % | |||||||
% of net revenue | 27 | % | 25 | % | 28 | % | |||||||||||
Research and development expense increased $14.5 million to $112.3 million for the year ended December 31, 2017 from $97.7 million in the year ended December 31, 2016. The increase was primarily due to increases in payroll-related expense of $11.2 million, computer-aided design tools expense of $2.1 million, and depreciation expense of $1.9 million related to our recent acquisitions of Exar in May 2017, the G.hn business acquired from Marvell in April 2017, and the wireless infrastructure businesses acquired from Microsemi and Broadcom in April 2016 and July 2016. These increases were partially offset by lower prototype expenses of $1.2 million due to timing of projects.
62
Research and development expense increased $12.3 million to $97.7 million for the year ended December 31, 2016, as compared to $85.4 million for the year ended December 31, 2015. The increase was primarily due to increases in headcount-related expense and occupancy expense of $9.4 million related to our acquisitions of the wireless infrastructure access business from Microsemi, and the wireless infrastructure backhaul business from Broadcom. Year-on-year increases in prototype expense, design tools expense, and depreciation expense of $3.2 million were primarily due to a higher number of projects.
We expect our research and development expenses to increase as we continue to focus on expanding our product portfolio and enhancing existing products.
Selling, General and Administrative
Years Ended December 31, | % Change | ||||||||||||||||
2017 | 2016 | 2015 | 2017 | 2016 | |||||||||||||
(dollars in thousands) | |||||||||||||||||
Selling, general and administrative | $ | 105,831 | $ | 64,454 | $ | 77,981 | 64 | % | (17 | )% | |||||||
% of net revenue | 25 | % | 17 | % | 26 | % | |||||||||||
Selling, general and administrative expense increased $41.4 million to $105.8 million for the year ended December 31, 2017, as compared to $64.5 million for the year ended December 31, 2016. The increase was primarily due to an increase in intangible amortization expense of $21.9 million, payroll-related expenses of $9.7 million, professional fees of $7.8 million and occupancy expenses of $1.2 million related to our merger and acquisition activities from our recent acquisitions of Exar Corporation in May 2017, the G.hn business acquired from Marvell in April 2017, and the wireless infrastructure businesses acquired from Microsemi and Broadcom in April 2016 and July 2016.
Selling, general and administrative expense decreased $13.5 million to $64.5 million for the year ended December 31, 2016, as compared to $78.0 million for the year ended December 31, 2015. The decrease was primarily due to a decrease of $18.0 million in intangible amortization expense related to acquired product backlog and a decrease in legal expense of $3.0 million related to the Entropic acquisition in the prior year. This decrease was partially offset by an increase in headcount-related expense of $3.5 million due to higher average full-time-equivalent headcount compared to prior year as a result of the Entropic acquisition. Commission expense increased $1.0 million due to higher sales and outside services, accounting expense, travel expense, and other expenses increased by $2.9 million.
We expect selling, general and administrative expenses to decrease or remain flat in the near-term; however, our expenses may increase in the future when we expand our sales and marketing organization to enable expansion into existing and new markets.
IPR&D Impairment Losses
Years Ended December 31, | % Change | ||||||||||||||
2017 | 2016 | 2015 | 2017 | 2016 | |||||||||||
(dollars in thousands) | |||||||||||||||
IPR&D impairment losses | $ | 2,000 | $ | 1,300 | $ | 21,600 | 54% | (94)% | |||||||
% of net revenue | — | % | — | % | 7 | % | |||||||||
IPR&D impairment losses increased $0.7 million to $2.0 million for the year ended December 31, 2017, compared to $1.3 million for the year ended December 31, 2016. IPR&D impairment losses decreased $20.3 million to $1.3 million for the year ended December 31, 2016, compared to $21.6 million for the year ended December 31, 2015.
IPR&D impairment losses in 2017 consisted of acquired IPR&D technology of Exar Corporation. IPR&D impairment losses in 2016 consisted of acquired IPR&D technology of the wireless infrastructure access business. IPR&D impairment losses in 2015 consisted of acquired IPR&D technology of Physpeed and Entropic.
63
Restructuring charges
Years Ended December 31, | % Change | ||||||||||||||
2017 | 2016 | 2015 | 2017 | 2016 | |||||||||||
(dollars in thousands) | |||||||||||||||
Restructuring charges | $ | 9,524 | $ | 3,432 | $ | 14,086 | 178% | (76)% | |||||||
% of net revenue | 2 | % | 1 | % | 5 | % | |||||||||
Restructuring charges increased $6.1 million to $9.5 million for the year ended December 31, 2017, compared to $3.4 million for the year ended December 31, 2016. Restructuring charges decreased $10.7 million to $3.4 million for the year ended December 31, 2016, compared to $14.1 million for the year ended December 31, 2015.
Restructuring charges in 2017 primarily consisted of $5.1 million of incremental stock-based compensation from the acceleration of certain stock-based awards we assumed from Exar Corporation due to change in control provisions upon termination or diminution of authority of former Exar executives, other severance-related charges of $3.2 million, and lease restructuring charges of $1.0 million related to exiting certain redundant facilities. Restructuring charges in 2016 consisted of employee severance and stock compensation expenses of $1.0 million, lease and leasehold impairment charges of $2.3 million, and contract restructuring of $0.1 million. Lease restructuring charges in 2016 primarily related to adjustments to the estimates of net present value of the remaining lease obligation for actual sublease income and period costs associated with certain vacated facilities, including commissions to brokers involved in subleasing property, under lease arrangements assumed in connection with the Entropic acquisition, and exiting certain other leased facilities. Restructuring charges in 2015 consisted of employee severance and stock compensation expenses of $5.5 million, lease and leasehold impairment charges of $8.2 million, and contract restructuring of $0.4 million that were primarily related to eliminating redundant positions and exiting Entropic facilities.
Interest and Other Income (Expense)
Years Ended December 31, | % Change | ||||||||||||||||
2017 | 2016 | 2015 | 2017 | 2016 | |||||||||||||
(dollars in thousands) | |||||||||||||||||
Interest and other income (expense), net | $ | (12,327 | ) | $ | 631 | $ | 743 | (2,054 | )% | (15 | )% | ||||||
% of net revenue | (3 | )% | — | % | — | % | |||||||||||
Interest and other income (expense), net reversed by $13.0 million from the year ended December 31, 2016, becoming a net expense of $12.3 million for the year ended December 31, 2017. The decrease in interest and other income (expense), net was primarily due to interest expense of $10.4 million related to interest charges on debt outstanding under the Exar acquisition term loan facility during 2017, as well as increases in other expenses related to fluctuations in foreign currency transactions as a result of increased activities from existing and recently acquired foreign subsidiaries.
Interest and other income (expense), net decreased $0.1 million to $0.6 million of income for the year ended December 31, 2016 from $0.7 million of income for the year ended December 31, 2015 due to fluctuations in foreign currency transactions, partially offset by an increase in interest income due to higher average cash and investment balances held during 2016.
Provision (Benefit) for Income Taxes
Years Ended December 31, | % Change | ||||||||||||||||
2017 | 2016 | 2015 | 2017 | 2016 | |||||||||||||
(dollars in thousands) | |||||||||||||||||
Provision (benefit) for income taxes | $ | (24,811 | ) | $ | 2,398 | $ | (575 | ) | (1,135 | )% | (517 | )% | |||||
% of pre-tax income (loss) | 73 | % | 4 | % | 1 | % | |||||||||||
The income tax benefit for the year ended December 31, 2017 was $24.8 million or approximately 73% of pre-tax loss compared to an income tax provision of $2.4 million or approximately 4% of pre-tax income for the year ended December 31, 2016. The income tax benefit in the year ended December 31, 2015 was $0.6 million or approximately 1% of pre-tax loss.
64
On December 22, 2017, the U.S. government enacted comprehensive tax legislation commonly referred to as the Tax Cuts and Jobs Act, or the Tax Act, which included the reduction of the U.S. federal corporate tax rate from 35% to 21%. Additionally, in April 2017, our subsidiary in Singapore began operating under certain tax incentives in Singapore, which reduced our Singapore corporate tax rate from 17% to a concessionary rate as described in more detail below. The income tax benefit for the year ended December 31, 2017 primarily related to the release of the federal valuation allowance in 2017, partially offset by certain discrete tax effects related to initial intercompany royalties from our Singapore subsidiary to our U.S. parent and the impacts of reductions in our U.S. federal corporate tax rates under the Tax Act and reductions to our foreign corporate tax rates on our deferred income taxes in Singapore as a result of the concessionary income tax rates in Singapore. The income tax benefit for the year ended December 31, 2017 includes provisional estimates for certain tax effects of the Tax Act for which accounting under ASC 740 is incomplete. Provisional amounts related to the Tax Act are subject to adjustment during a one year measurement period and accordingly, such adjustments could have a material impact on our income tax provision (benefit) for 2018.
Of the federal valuation allowance of $61.6 million as of December 31, 2016, we released $51.2 million during the year ended December 31, 2017 based upon our review of all available positive and negative evidence. Additionally, our federal valuation allowance has also been reduced as a result of the reduction of the U.S. federal corporate tax rate. We continue to maintain a valuation allowance to offset state and certain federal and foreign deferred tax assets, as realization of such assets does not meet the more-likely-than-not threshold required under accounting guidelines. In making such determination, we consider all available positive and negative evidence quarterly, including scheduled reversals of deferred tax liabilities, projected future taxable income, tax planning strategies, and recent financial performance. Based upon our review of all positive and negative evidence, as of December 31, 2017, we concluded that a valuation allowance should continue to be recorded against our state deferred tax assets, certain federal deferred tax assets, and deferred tax assets in certain foreign jurisdictions where we have cumulative losses or otherwise are not expected to utilize certain tax attributes. We are closely assessing the need for a valuation allowance on the deferred tax assets by evaluating positive and negative evidence that may exist. In the future, we could remove some or all of the valuation allowance against our state and certain federal and foreign deferred tax assets if we meet the more-likely-than-not threshold at such time.
In April 2017, our subsidiary in Singapore began operating under certain tax incentives in Singapore, which are generally effective through March 2022 and may be extended through March 2027. Under these incentives, qualifying income derived from certain sales of our integrated circuits is taxed at a concessionary rate over the incentive period. We also receive a reduced withholding tax rate on certain intercompany royalty payments made by our Singapore subsidiary during the incentive period. Such incentives are conditional upon our meeting certain minimum employment and investment thresholds within Singapore over time, and we may be required to return certain tax benefits in the event we do not achieve compliance related to that incentive period. We currently believe that we will be able to satisfy these conditions without material risk. Primarily because of our Singapore net operating losses and our full valuation allowance in Singapore, we do not believe the incentives will have a material impact on our income tax position in the period ending 2018.
The provision for income taxes for the year ended December 31, 2016 primarily related to federal alternative minimum tax due to our limitation on use of net operating losses, credit carryforwards, state income taxes, and income taxes in certain foreign jurisdictions. Certain significant or unusual items are separately recognized in the quarter during which they occur and can be a source of variability in the effective tax rates from quarter to quarter. During 2016, we adopted ASU No. 2016-09, Improvements to Share-Based Compensation, which resulted in the recognition of net excess tax benefits on share-based awards within the provision for income taxes in the consolidated statement of operations. For the year ended December 31, 2016, the impact of including net excess tax benefits was to reduce the provision for income taxes by $8.3 million in the consolidated statement of operations.
The benefit for income taxes for the year ended December 31, 2015 primarily related to the release of valuation allowance in connection with the Entropic and Physpeed acquisitions, respectively, partially offset by income taxes in foreign jurisdictions and accruals for tax contingencies.
Liquidity and Capital Resources
As of December 31, 2017, we had cash and cash equivalents of $71.9 million, restricted cash of $2.5 million, and net accounts receivable of $66.1 million. Additionally, as of December 31, 2017, our working capital was $124.9 million.
Our primary uses of cash are to fund operating expenses, purchases of inventory, and the acquisition of businesses, property and equipment and intangible assets. We also use cash to pay down outstanding debt. Our cash and cash equivalents are impacted by the timing of when we pay expenses as reflected in the change in our outstanding accounts payable and accrued
65
expenses. Cash used to fund operating expenses in our consolidated statements of cash flows excludes the impact of non-cash items such as stock-based compensation, amortization and depreciation of acquired intangible assets and property and equipment, and amortization of step-ups of acquired inventory to fair value. Cash used to fund acquisitions of businesses and other capital purchases is included in investing activities in our consolidated statements of cash flows. Cash used to pay down outstanding debt is included in financing activities in our consolidated statements of cash flows.
Our primary sources of cash are cash receipts on accounts receivable from our shipment of products to distributors and direct customers. Aside from the growth in amounts billed to our customers, net cash collections of accounts receivable are impacted by the efficiency of our cash collections process, which can vary from period to period depending on the payment cycles of our major distributor customers, and relative linearity of shipments period-to-period. In 2017, we also received net proceeds from borrowings associated with the Exar acquisition which are included in financing activities in our consolidated statements of cash flows. The credit agreement permits us to request incremental loans in an aggregate principal amount not to exceed the sum of $160.0 million (subject to adjustments for any voluntary prepayments), plus an unlimited amount that is subject to pro forma compliance with certain secured leverage ratio and total leverage ratio tests. We have not requested any incremental loans to date.
Following is a summary of our working capital, cash and cash equivalents, restricted cash and investments for the periods indicated:
December 31, | |||||||
2017 | 2016 | ||||||
(in thousands) | |||||||
Working capital | $ | 124,918 | $ | 158,304 | |||
Cash and cash equivalents | $ | 71,872 | $ | 81,086 | |||
Short-term restricted cash | 1,476 | 614 | |||||
Long-term restricted cash | 1,064 | 1,196 | |||||
Short-term investments | — | 47,918 | |||||
Long-term investments | — | 5,991 | |||||
Total cash and cash equivalents, restricted cash and investments | $ | 74,412 | $ | 136,805 | |||
Following is a summary of our cash flows provided by (used in) operating activities, investing activities and financing activities for the periods indicated:
Years Ended December 31, | |||||||||||
2017 | 2016 | 2015 | |||||||||
(in thousands) | |||||||||||
Net cash provided by operating activities | $ | 75,064 | $ | 117,317 | $ | 55,041 | |||||
Net cash used in investing activities | (432,151 | ) | (101,313 | ) | (11,059 | ) | |||||
Net cash provided by (used in) by financing activities | 347,021 | (670 | ) | 4,003 | |||||||
Effect of exchange rates on cash and cash equivalents | 1,582 | (394 | ) | (725 | ) | ||||||
Net increase (decrease) in cash and cash equivalents | $ | (8,484 | ) | $ | 14,940 | $ | 47,260 | ||||
Cash Flows from Operating Activities
Net cash provided by operating activities was $75.1 million for the year ended December 31, 2017. Net cash provided by operating activities consisted of $89.8 million in non-cash expenses, partially offset by net loss of $9.2 million and $5.6 million in changes in operating assets and liabilities, respectively. Non-cash items included in net loss for the year ended December 31, 2017 primarily included depreciation and amortization expense of $66.7 million, stock-based compensation of $32.7 million, amortization of step-up to fair value of acquired inventory of $25.6 million, loss on foreign currency of $2.2 million, and impairment charges on intangible assets of $2.0 million, partially offset by deferred income taxes of $31.8 million and excess tax benefits on stock-based awards of $8.6 million.
66
Net cash provided by operating activities was $117.3 million for the year ended December 31, 2016. Net cash provided by operating activities consisted of net income of $61.3 million, $48.2 million in non-cash operating expenses, and $7.8 million in changes in operating assets and liabilities. Non-cash items included in net income for the year ended December 31, 2016 primarily included depreciation and amortization expense of $26.7 million, stock-based compensation of $21.8 million, amortization of step-up to fair value of acquired inventory of $5.6 million, impairment charges on intangible assets of $1.3 million, and impairment and restructuring on leases of $0.4 million, partially offset by excess tax benefits on stock-based award of $8.3 million.
Net cash provided by operating activities was $55.0 million for the year ended December 31, 2015. Net cash provided by operating activities consisted of $103.1 million in non-cash operating expenses, partially offset by a net loss of $42.3 million and changes in operating assets and liabilities of $5.7 million. Non-cash items included in net loss for the year ended December 31, 2015 primarily included depreciation and amortization expense of $40.6 million, impairment charges on intangible assets of $21.6 million, stock based compensation of $19.3 million, amortization of inventory step up of $14.2 million, and impairment and restructuring on leases of $8.2 million, partially offset by deferred income taxes of $1.9 million.
Cash Flows from Investing Activities
Net cash used in investing activities was $432.2 million for the year ended December 31, 2017. Net cash used in investing activities primarily consisted of $452.3 million in cash used in the acquisition of Exar, net of cash acquired, $21.0 million in cash used in the acquisition of the G.hn business, $30.6 million in purchases of securities, $7.5 million in purchases of property and equipment, and $5.4 million in purchases of intangible assets, partially offset by $84.5 million in maturities of securities.
Net cash used in investing activities was $101.3 million for the year ended December 31, 2016. Net cash used in investing activities primarily consisted of $101.0 million cash used in our acquisitions of the wireless infrastructure access and backhaul businesses, $90.3 million in purchases of securities, and $8.5 million in purchases of property and equipment, partially offset by $98.9 million in maturities of securities.
Net cash used in investing activities was $11.1 million for the year ended December 31, 2015. Net cash used in investing activities consisted of $73.4 million in purchases of securities, $3.6 million used in our acquisition of Entropic, net of cash acquired, and $3.0 million in purchases of property and equipment, partially offset by $69.0 million in maturities of securities.
Cash Flows from Financing Activities
Net cash provided by financing activities was $347.0 million for the year ended December 31, 2017. Net cash provided by financing activities primarily consisted of $416.8 million in net proceeds from borrowings under a term loan we entered in connection with the acquisition of Exar and $12.1 million in net proceeds from issuance of common stock, partially offset by $70.0 million in aggregate prepayments of principal on outstanding debt and $11.5 million in minimum tax withholding paid on behalf of employees for restricted stock units.
Net cash used in financing activities was $0.7 million for the year ended December 31, 2016. Net cash used in financing activities primarily consisted of $7.3 million in minimum tax withholding paid on behalf of employees for restricted stock units, partially offset by $6.6 million in net proceeds from issuance of common stock.
Net cash provided by financing activities was $4.0 million for the year ended December 31, 2015. Net cash provided by financing activities primarily consisted of $10.0 million in net proceeds from issuance of common stock, partially offset by $5.1 million in minimum tax withholding paid on behalf of employees for restricted stock units.
67
We believe that our $71.9 million of cash and cash equivalents at December 31, 2017 will be sufficient to fund our projected operating requirements for at least the next twelve months. On April 4, 2017, we used $21.0 million of cash to purchase the G.hn business of Marvell. On May 12, 2017, we paid aggregate cash consideration of $688.1 million, including $12.7 million of cash paid to settle certain stock-based awards that were not assumed by MaxLinear, in the acquisition and merger of Exar. We funded the transaction with cash from the balance sheet of the combined companies and the net proceeds of approximately $416.8 million from $425.0 million of transaction debt. We have repaid $70.0 million of Exar-related transaction debt to date. The credit agreement permits the Company to request incremental loans in an aggregate principal amount not to exceed the sum of $160.0 million (subject to adjustments for any voluntary prepayments), plus an unlimited amount that is subject to pro forma compliance with certain secured leverage ratio and total leverage ratio tests. Incremental loans are subject to certain additional conditions, including obtaining additional commitments from the lenders then party to the credit agreement or new lenders. The term loan facility has a seven-year term and bears interest at either an Adjusted LIBOR or an Adjusted Base Rate, at our option, plus a fixed applicable margin.
In 2016, we used we used an aggregate of $101.0 million of cash to purchase the wireless infrastructure access and backhaul businesses of Microsemi and Broadcom, respectively. Our cash and cash equivalents in recent years have been favorably affected by our implementation of an equity-based bonus program for our employees, including executives. In connection with that bonus program, in February 2017, we issued 0.2 million freely-tradable shares of our Class A common stock in settlement of bonus awards for the July 1, 2016 to December 31, 2016 performance period. We expect to implement a similar equity-based plan for fiscal 2017, but our compensation committee retains discretion to effect payment in cash, stock, or a combination of cash and stock.
Notwithstanding the foregoing, we may need to raise additional capital or incur additional indebtedness to fund strategic initiatives or operating activities, particularly if we continue to pursue acquisitions. Our future capital requirements will depend on many factors, including our rate of revenue growth, the expansion of our engineering, sales and marketing activities, the timing and extent of our expansion into new territories, the timing of introductions of new products and enhancements to existing products, the continuing market acceptance of our products, and potential material investments in, or acquisitions of, complementary businesses, services or technologies. Additional funds may not be available on terms favorable to us or at all. If we are unable to raise additional funds when needed, we may not be able to sustain our operations.
Warranties and Indemnifications
In connection with the sale of products in the ordinary course of business, we often make representations affirming, among other things, that our products do not infringe on the intellectual property rights of others, and agree to indemnify customers against third-party claims for such infringement. Further, our certificate of incorporation and bylaws require us to indemnify our officers and directors against any action that may arise out of their services in that capacity, and we have also entered into indemnification agreements with respect to all of our directors and certain controlling persons.
Off-Balance Sheet Arrangements
As part of our ongoing business, we do not participate in transactions that generate relationships with unconsolidated entities or financial partnerships, such as entities often referred to as structured finance or special purpose entities, or SPEs, which would have been established for the purpose of facilitating off-balance sheet arrangements or other contractually narrow or limited purposes. As of December 31, 2017, we were not involved in any unconsolidated SPE transactions.
68
Contractual Obligations
As of December 31, 2017, future minimum payments under long-term debt, non-cancelable operating leases, inventory purchase obligations and other obligations are as follows:
Payments due | |||||||||||||||||||
Total | Less than 1 year | 1-3 years | 3-5 years | More than 5 years | |||||||||||||||
(in thousands) | |||||||||||||||||||
Long-term debt | $ | 355,000 | $ | — | $ | — | $ | — | $ | 355,000 | |||||||||
Operating lease obligations | 42,464 | 9,155 | 18,402 | 14,149 | 758 | ||||||||||||||
Inventory purchase obligations | 34,979 | 34,979 | — | — | — | ||||||||||||||
Other obligations | 19,330 | 7,758 | 11,542 | 30 | — | ||||||||||||||
Total | $ | 451,773 | $ | 51,892 | $ | 29,944 | $ | 14,179 | $ | 355,758 | |||||||||
Other obligations consist of contractual payments due for software licenses.
ITEM 7A. | QUANTITATIVE AND QUALITATIVE DISCLOSURES ABOUT MARKET RISK |
Market risk represents the risk of loss that may impact our financial position due to adverse changes in financial market prices and rates. Our market risk exposure is primarily a result of fluctuations in foreign currency exchange rates and interest rates. We do not hold or issue financial instruments for trading purposes.
Foreign Currency Risk
To date, our international customer and vendor agreements have been denominated mostly in United States dollars. Accordingly, we have limited exposure to foreign currency exchange rates and do not enter into foreign currency hedging transactions. The functional currency of certain foreign subsidiaries is the local currency. Accordingly, the effects of exchange rate fluctuations on the net assets of these foreign subsidiaries’ operations are accounted for as translation gains or losses in accumulated other comprehensive income (loss) within stockholders’ equity. A hypothetical change of 100 basis points in such foreign currency exchange rates would result in a change to translation gain/loss in accumulated other comprehensive income of approximately $0.3 million.
Interest Rate Risk
On May 12, 2017, we entered into a credit agreement with certain lenders and a collateral agent in connection with the acquisition of Exar. The credit agreement provides for an initial secured term B loan facility (the “Initial Term Loan”) in an aggregate principal amount of $425.0 million. As of December 31, 2017, aggregate borrowings under the Initial Term Loan were $355.0 million. The credit agreement permits the Company to request incremental loans in an aggregate principal amount not to exceed the sum of $160.0 million (subject to adjustments for any voluntary prepayments), plus an unlimited amount that is subject to pro forma compliance with certain secured leverage ratio and total leverage ratio tests. Incremental loans are subject to certain additional conditions, including obtaining additional commitments from the lenders then party to the credit agreement or new lenders. The term loan facility has a seven-year term and bears interest at either an Adjusted LIBOR or an Adjusted Base Rate, at our option, and, in each case, plus a fixed applicable margin. In November 2017, to hedge a substantial portion of our existing interest rate risk with respect to the term loans, we entered into a fixed-for-floating interest rate swap agreement with an amortizing notional amount to swap some of our variable rate interest payments under our term loans for fixed interest payments bearing an interest rate of 1.74685% through October 2020. Our outstanding debt is still subject to a 2.5% fixed applicable margin during the term of the loan. As a result of entering the swap, the interest rate on a substantial portion of our long-term debt is effectively fixed at approximately 4.25%. However, interest rate trends are inherently difficult to predict and interest rates may significantly increase or decrease over a short period of time. Should interest rates trend below that of our fixed swap interest rate, we may pay higher interest expense than market and seek to terminate or modify the terms of the swap prior to its maturity which could result in termination or other fees. We are also still subject to a variable amount of interest on the principal balance in excess of the notional amount of the interest rate swap and could be adversely impacted by rising interest rates in the future. If LIBOR interest rates had increased by 1000 basis points during the periods presented, the rate increase would have resulted in an increase of approximately $1.5 million to interest expense.
69
ITEM 8. | FINANCIAL STATEMENTS AND SUPPLEMENTARY DATA |
The financial statements and supplementary data required by this item are included in Part IV, Item 15 of this Report.
ITEM 9. | CHANGES IN AND DISAGREEMENTS WITH ACCOUNTANTS ON ACCOUNTING AND FINANCIAL DISCLOSURE |
None.
ITEM 9A. | CONTROLS AND PROCEDURES |
Evaluation of Disclosure and Procedures
We maintain disclosure controls and procedures that are designed to ensure that information required to be disclosed in our periodic reports filed with the SEC is recorded, processed, summarized and reported within the time periods specified in the rules and forms of the SEC and that such information is accumulated and communicated to our management, including our principal executive officer and principal financial officer, as appropriate, to allow for timely decisions regarding required disclosure. In designing and evaluating the disclosure controls and procedures, management recognizes that any controls and procedures, no matter how well designed and operated, can provide only reasonable assurance of achieving the desired control objectives, and no evaluation of controls and procedures can provide absolute assurance that all control issues and instances of fraud, if any, within a company have been detected. Management is required to apply its judgment in evaluating the cost-benefit relationship of possible controls and procedures.
As required by Rule 13a-15(b) of the Securities Exchange Act of 1934, as amended, or the Exchange Act, prior to filing this Form 10-K, we carried out an evaluation, under the supervision and with the participation of our management, including our principal executive officer and principal financial officer, of the effectiveness of the design and operation of our disclosure controls and procedures (as defined in Rules 13a-15(e) and 15d-15(e) of the Exchange Act) as of the end of the period covered by this Form 10-K. Based on their evaluation, our principal executive officer and principal financial officer concluded that our disclosure controls and procedures were effective as of the end of the period covered by this Form 10-K.
Management’s Annual Report on Internal Controls over Financial Reporting
Our management, including our principal executive officer and principal financial officer, is responsible for establishing and maintaining adequate internal control over financial reporting, as defined in Rules 13a-15(f) and 15d-15(f) under the Exchange Act. Our management, including our principal executive officer and principal financial officer, evaluated the effectiveness of our internal control over financial reporting based on criteria established in the Internal Control — Integrated Framework (2013) issued by the Committee of Sponsoring Organizations of the Treadway Commission (COSO). Based upon that evaluation, management concluded that our internal control over financial reporting was effective as of December 31, 2017. Management's evaluation of the effectiveness of our internal control over financial reporting as of December 31, 2017 did not include internal controls over financial reporting that had not yet been integrated for a portion of Exar, which we merged with in a business combination in May 2017. Assessment of a recently acquired business may be omitted from management’s report on internal control over financial reporting in the year of acquisition under SEC guidelines. That portion of Exar comprised approximately 5% of our total assets as of December 31, 2017 and approximately 19% of total revenues for the year ended December 31, 2017. The effectiveness of our internal control over financial reporting as of December 31, 2017 has been audited by Grant Thornton LLP, an independent registered public accounting firm, and Grant Thornton LLP has issued a report on our internal control over financial reporting, as stated within their report which is included herein.
70
Changes in Internal Control over Financial Reporting
An evaluation was performed under the supervision and with the participation of our management, including our principal executive officer and principal financial officer, to determine whether any change in our internal control over financial reporting occurred during the fiscal quarter ended December 31, 2017 that materially affected, or is reasonably likely to materially affect, our internal control over financial reporting. On May 12, 2017, we completed the acquisition of Exar and, as a result, we have been integrating the processes, systems, and controls relating to Exar into our existing system of internal control over financial reporting in accordance with our integration plans through the fiscal quarter ended December 31, 2017. We expect to complete the integration of the internal controls over financial reporting related to Exar in 2018. There were no other changes in our internal control over financial reporting identified in connection with the evaluation required by paragraph (d) of Rule 13a-15 or Rule 15d-15 of the Securities Exchange Act of 1934, as amended, that has materially affected, or is reasonably likely to materially affect, our internal control over financial reporting.
71
REPORT OF INDEPENDENT REGISTERED PUBLIC ACCOUNTING FIRM
The Board of Directors and Stockholders
MaxLinear, Inc.
Opinion on internal control over financial reporting
We have audited the internal control over financial reporting of MaxLinear, Inc. (a Delaware corporation) and subsidiaries (the “Company”) as of December 31, 2017, based on criteria established in the 2013 Internal Control—Integrated Framework issued by the Committee of Sponsoring Organizations of the Treadway Commission (COSO). In our opinion, the Company maintained, in all material respects, effective internal control over financial reporting as of December 31, 2017, based on criteria established in the 2013 Internal Control—Integrated Framework issued by COSO.
We also have audited, in accordance with the standards of the Public Company Accounting Oversight Board (United States) (“PCAOB”), the consolidated financial statements of the Company as of and for the year ended December 31, 2017, and our report dated February 20, 2018 expressed an unqualified opinion on those financial statements.
Basis for opinion
The Company’s management is responsible for maintaining effective internal control over financial reporting and for its assessment of the effectiveness of internal control over financial reporting, included in the accompanying Management’s Annual Report on Internal Control over Financial Reporting (“Management's Report”). Our responsibility is to express an opinion on the Company’s internal control over financial reporting based on our audit. We are a public accounting firm registered with the PCAOB and are required to be independent with respect to the Company in accordance with the U.S. federal securities laws and the applicable rules and regulations of the Securities and Exchange Commission and the PCAOB.
We conducted our audit in accordance with the standards of the PCAOB. Those standards require that we plan and perform the audit to obtain reasonable assurance about whether effective internal control over financial reporting was maintained in all material respects. Our audit included obtaining an understanding of internal control over financial reporting, assessing the risk that a material weakness exists, testing and evaluating the design and operating effectiveness of internal control based on the assessed risk, and performing such other procedures as we considered necessary in the circumstances. We believe that our audit provides a reasonable basis for our opinion.
Our audit of, and opinion on, the Company’s internal control over financial reporting does not include the internal control over financial reporting for the portion not yet integrated of Exar Corporation, a wholly-owned subsidiary, whose financial statements reflect total assets and revenues constituting 5% and 19% percent, respectively, of the related consolidated financial statement amounts as of and for the year ended December 31, 2017. As indicated in in the accompanying Management’s Report, Exar Corporation was acquired during 2017. Management’s assertion on the effectiveness of the Company’s internal control over financial reporting excluded internal control over financial reporting of Exar Corporation.
Definition and limitations of internal control over financial reporting
A company’s internal control over financial reporting is a process designed to provide reasonable assurance regarding the reliability of financial reporting and the preparation of financial statements for external purposes in accordance with generally accepted accounting principles. A company’s internal control over financial reporting includes those policies and procedures that (1) pertain to the maintenance of records that, in reasonable detail, accurately and fairly reflect the transactions and dispositions of the assets of the company; (2) provide reasonable assurance that transactions are recorded as necessary to permit preparation of financial statements in accordance with generally accepted accounting principles, and that receipts and expenditures of the company are being made only in accordance with authorizations of management and directors of the company; and (3) provide reasonable assurance regarding prevention or timely detection of unauthorized acquisition, use, or disposition of the company’s assets that could have a material effect on the financial statements.
72
Because of its inherent limitations, internal control over financial reporting may not prevent or detect misstatements. Also, projections of any evaluation of effectiveness to future periods are subject to the risk that controls may become inadequate because of changes in conditions, or that the degree of compliance with the policies or procedures may deteriorate.
/s/ Grant Thornton LLP
Newport Beach, California
February 20, 2018
ITEM 9B. | OTHER INFORMATION |
None.
73
PART III
ITEM 10. | DIRECTORS, EXECUTIVE OFFICERS AND CORPORATE GOVERNANCE |
The information required by Item 10 with respect to our directors and executive officers will be either (i) included in an amendment to this Annual Report on Form 10-K or (ii) incorporated by reference to our Definitive Proxy Statement to be filed in connection with our 2018 Annual Meeting of Stockholders, or the 2018 Proxy Statement. Such amendment in the 2018 Proxy Statement will be filed with the Securities and Exchange Commission no later than 120 days after December 31, 2017.
Item 405 of Regulation S-K calls for disclosure of any known late filing or failure by an insider to file a report required by Section 16(a) of the Exchange Act. This information will be contained under the caption “Related Person Transactions and Section 16(a) Beneficial Ownership Reporting Compliance” in either an amendment to this Annual Report on Form 10-K or the 2018 Proxy Statement and is incorporated herein by reference.
Code of Conduct
We have adopted a code of ethics and employee conduct that applies to our board of directors and all of our employees, including our chief executive officer and principal financial officer.
Our code of conduct is available at our website by visiting www.maxlinear.com and clicking through “Investors,” “Corporate Governance,” and “Code of Conduct.” When required by the rules of the New York Stock Exchange, or NYSE, or the Securities and Exchange Commission, or SEC, we will disclose any future amendment to, or waiver of, any provision of the code of conduct for our chief executive officer and principal financial officer or any member or members of our board of directors on our website within four business days following the date of such amendment or waiver.
The information required by Item 10 with respect to our audit committee is incorporated by reference from the information set forth under the caption “Corporate Governance and Board of Directors — Board Committees” in either an amendment to this Annual Report on Form 10-K or the 2018 Proxy Statement.
ITEM 11. | EXECUTIVE COMPENSATION |
The information required by Item 11 is incorporated by reference from the information set forth under the captions “Compensation of Non-Employee Directors” and “Executive Compensation" in either an amendment to this Annual Report on Form 10-K or our 2018 Proxy Statement.
ITEM 12. | SECURITY OWNERSHIP OF CERTAIN BENEFICAL OWNERS AND MANAGEMENT AND RELATED STOCKHOLDER MATTERS |
The information required by Item 12 is incorporated by reference from the information set forth under the captions “Executive Compensation — Equity Compensation Plan Information” and “Security Ownership” in either an amendment to this Annual Report on Form 10-K or our 2018 Proxy Statement.
ITEM 13. | CERTAIN RELATIONSHIPS AND RELATED TRANSACTIONS, AND DIRECTOR INDEPENDENCE |
The information required by Item 13 is incorporated by reference from the information set forth under the captions “Corporate Governance and Board of Directors — Director Independence” and “Related Person Transactions and Section 16(a) Beneficial Ownership Reporting Compliance” in either an amendment to this Annual Report on Form 10-K or our 2018 Proxy Statement.
ITEM 14. | PRINCIPAL ACCOUNTING FEES AND SERVICES |
The information required by Item 14 is incorporated by reference from the information set forth under the caption “Proposal Number 3 — Ratification of Appointment of Independent Registered Public Accounting Firm” in either an amendment to this Annual Report on Form 10-K or our 2018 Proxy Statement.
74
PART IV — FINANCIAL INFORMATION
ITEM 15. | EXHIBITS, FINANCIAL STATEMENT SCHEDULES |
a) Documents filed as part of the report
1. Financial Statements
Our consolidated financial statements are attached hereto and listed on the Index to Consolidated Financial Statements set forth on page F-1 of this Annual Report on Form 10-K.
2. Financial Statement Schedules
Schedule II. Valuation and Qualifying Accounts —Years ended December 31, 2017, 2016 and 2015
All other schedules are omitted as the required information is inapplicable, or the information is presented in the financial statements or related notes.
SCHEDULE II – VALUATION AND QUALIFYING ACCOUNTS (in thousands):
Classification | Balance at beginning of year | Additions (deductions) charged to expenses | Other Additions | (Deductions) | Balance at end of year | |||||||||||||||
Allowance for doubtful accounts | ||||||||||||||||||||
2017 | $ | 87 | $ | 133 | $ | 27 | $ | (174 | ) | $ | 73 | |||||||||
2016 | 236 | 87 | — | (236 | ) | 87 | ||||||||||||||
2015 | 57 | 179 | — | — | 236 | |||||||||||||||
Warranty reserves | ||||||||||||||||||||
2017 | $ | 860 | $ | 492 | $ | 122 | $ | (533 | ) | $ | 941 | |||||||||
2016 | 157 | 335 | 489 | (121 | ) | 860 | ||||||||||||||
2015 | 60 | 193 | 37 | (133 | ) | 157 | ||||||||||||||
Valuation allowance for deferred tax assets | ||||||||||||||||||||
2017 | $ | 100,284 | $ | (50,881 | ) | $ | 35,158 | $ | — | $ | 84,561 | |||||||||
2016 | 98,535 | — | 8,410 | (6,661 | ) | 100,284 | ||||||||||||||
2015 | 29,399 | 69,136 | — | — | 98,535 | |||||||||||||||
75
3. Exhibits
Exhibit Number | Exhibit Title | |
2.1 | ||
2.2 | ||
3.1 | ||
3.2 | ||
3.3 | ||
3.4 | ||
4.1 | ||
+10.1 | ||
+10.2 | ||
+10.3 | ||
+10.4 | ||
+10.5 | ||
+10.6 | ||
+10.7 | ||
+10.8 | ||
+10.9 | ||
+10.12 | ||
+10.13 | ||
10.14 | ||
76
†10.15 | ||
†10.16 | ||
+†10.17 | ||
†10.18 | ||
†10.19 | ||
†10.20 | ||
+10.21 | ||
+10.22 | ||
10.23 | ||
10.24 | ||
10.26 | ||
10.28 | ||
10.29 | ||
10.30 | ||
+10.31 | ||
+10.32 | ||
10.33 | ||
10.34 | ||
10.35 | ||
77
+10.36 | ||
+10.37 | ||
10.38 | ||
10.39 | ||
10.40 | ||
*11.1 | ||
*21.1 | ||
*23.1 | ||
*23.2 | ||
*24.1 | ||
*31.1 | ||
*31.2 | ||
#*32.1 | ||
101.INS | XBRL Instance Document | |
101.SCH | XBRL Taxonomy Extension Schema Document | |
101.CAL | XBRL Taxonomy Extension Calculation Linkbase Document | |
101.DEF | XBRL Taxonomy Extension Definition Linkbase Document | |
101.LAB | XBRL Taxonomy Extension Label Linkbase Document | |
101.PRE | XBRL Taxonomy Extension Presentation Linkbase Document | |
* | Filed herewith. |
# | In accordance with Item 601(b)(32)(ii) of Regulation S-K and SEC Release No. 33-8238 and 34-47986, Final Rule: Management’s Reports on Internal Control Over Financial Reporting and Certification of Disclosure in Exchange Act Periodic Reports, the certifications furnished pursuant to this item will not be deemed “filed” for purposes of Section 18 of the Exchange Act (15 U.S.C. 78r), or otherwise subject to the liability of that section. Such certification will not be deemed to be incorporated by reference into any filing under the Securities Act or the Exchange Act, except to the extent that the registrant specifically incorporates it by reference. |
+ | Indicates a management contract or compensatory plan. |
† | Confidential treatment has been requested and received for certain portions of these exhibits. |
(b) Exhibits
The exhibits filed as part of this report are listed in Item 15(a)(3) of this Form 10-K.
(c) Schedules
The financial statement schedules required by Regulation S-X and Item 8 of this form are listed in Item 15(a)(2) of this Form 10-K.
78
SIGNATURES
Pursuant to the requirements of Section 13 or 15 (d) of the Securities Exchange Act of 1934, the registrant has duly caused this report to be signed on its behalf by the undersigned, thereunto duly authorized.
MAXLINEAR, INC. | |||||||
(Registrant) | |||||||
By: | /s/ KISHORE SEENDRIPU, PH.D | ||||||
Kishore Seendripu, Ph.D | |||||||
President and Chief Executive Officer | |||||||
Date: | February 20, 2018 | (Principal Executive Officer) | |||||
POWER OF ATTORNEY
KNOW ALL PERSONS BY THESE PRESENTS, that each person whose signature appears below constitutes and appoints Kishore Seendripu, Ph.D. and Adam C. Spice, and each of them, his true and lawful attorneys-in-fact and agents, with full power of substitution and resubstitution, to sign any and all amendments (including post-effective amendments) to this Annual Report on Form 10-K and to file the same, with all exhibits thereto and other documents in connection therewith, with the Securities and Exchange Commission, granting unto each of said attorneys-in-fact and agents, full power and authority to do and perform each and every act and thing requisite and necessary to be done in connection therewith, as fully to all intents and purposes as he or she might or could do in person, hereby ratifying and confirming all that each of said attorneys-in-facts and agents, or his substitute or substitutes, or any of them, shall do or cause to be done by virtue hereof.
Pursuant to the requirements of the Securities Exchange Act of 1934, this report has been signed below by the following persons on behalf of the registrant and in the capacities and on the dates indicated:
Signature | Title | Date | ||
/s/ KISHORE SEENDRIPU, PH.D | President and Chief Executive Officer | February 20, 2018 | ||
Kishore Seendripu, Ph.D | (Principal Executive Officer) | |||
/s/ ADAM C. SPICE | Chief Financial Officer | February 20, 2018 | ||
Adam C. Spice | (Principal Financial Officer) | |||
/s/ CONNIE KWONG | Corporate Controller | February 20, 2018 | ||
Connie Kwong | (Principal Accounting Officer) | |||
/s/ THOMAS E. PARDUN | Lead Director | February 20, 2018 | ||
Thomas E. Pardun | ||||
/s/ STEVEN C. CRADDOCK | Director | February 20, 2018 | ||
Steven C. Craddock | ||||
/s/ ALBERT J. MOYER | Director | February 20, 2018 | ||
Albert J. Moyer | ||||
/s/ DONALD E. SCHROCK | Director | February 20, 2018 | ||
Donald E. Schrock | ||||
/s/ THEODORE TEWSBURY | Director | February 20, 2018 | ||
Theodore Tewksbury | ||||
79
MaxLinear, Inc.
Index to Consolidated Financial Statements
F-1
REPORT OF INDEPENDENT REGISTERED PUBLIC ACCOUNTING FIRM
The Board of Directors and Stockholders
MaxLinear, Inc.
Opinion on the financial statements
We have audited the accompanying consolidated balance sheets of MaxLinear, Inc. (a Delaware corporation) and subsidiaries (the “Company”) as of December 31, 2017 and 2016, the related consolidated statements of operations, comprehensive income (loss), stockholders' equity and cash flows for each of the two years in the period ended December 31, 2017, and the related notes and schedule listed in the Index at Item 15(a)(2) (collectively referred to as the "financial statements"). In our opinion, the financial statements present fairly, in all material respects, the financial position of the Company as of December 31, 2017 and 2016, and the results of its operations and its cash flows for each of the two years in the period ended December 31, 2017, in conformity with accounting principles generally accepted in the United States of America.
We also have audited, in accordance with the standards of the Public Company Accounting Oversight Board (United States) ("PCAOB"), the Company's internal control over financial reporting as of December 31, 2017, based on criteria established in the 2013 Internal Control-Integrated Framework issued by the Committee of Sponsoring Organizations of the Treadway Commission ("COSO") and our report dated February 20, 2018 expressed an unqualified opinion.
Basis for opinion
These financial statements are the responsibility of the Company’s management. Our responsibility is to express an opinion on the Company’s financial statements based on our audits. We are a public accounting firm registered with the PCAOB and are required to be independent with respect to the Company in accordance with the U.S. federal securities laws and the applicable rules and regulations of the Securities and Exchange Commission and the PCAOB.
We conducted our audits in accordance with the standards of the PCAOB. Those standards require that we plan and perform the audit to obtain reasonable assurance about whether the financial statements are free of material misstatement, whether due to error or fraud. Our audits included performing procedures to assess the risks of material misstatement of the financial statements, whether due to error or fraud, and performing procedures that respond to those risks. Such procedures include examining, on a test basis, evidence supporting the amounts and disclosures in the financial statements. Our audits also included evaluating the accounting principles used and significant estimates made by management, as well as evaluating the overall presentation of the financial statements. We believe that our audits provide a reasonable basis for our opinion.
/s/ Grant Thornton LLP
We have served as the Company's auditor since 2016.
Newport Beach, California
February 20, 2018
F-2
REPORT OF INDEPENDENT REGISTERED PUBLIC ACCOUNTING FIRM
The Board of Directors and Stockholders of MaxLinear, Inc.
We have audited the accompanying consolidated statements of operations, comprehensive loss, stockholders' equity and cash flows of MaxLinear, Inc. for the year ended December 31, 2015. Our audit also included the financial statement schedule for the year ended December 31, 2015 listed in the Index at Item 15(a)(2). These financial statements and schedule are the responsibility of the Company's management. Our responsibility is to express an opinion on these financial statements and schedule based on our audit.
We conducted our audit in accordance with the standards of the Public Company Accounting Oversight Board (United States). Those standards require that we plan and perform the audit to obtain reasonable assurance about whether the financial statements are free of material misstatement. An audit includes examining, on a test basis, evidence supporting the amounts and disclosures in the financial statements. An audit also includes assessing the accounting principles used and significant estimates made by management, as well as evaluating the overall financial statement presentation. We believe that our audit provides a reasonable basis for our opinion.
In our opinion, the financial statements referred to above present fairly, in all material respects, the consolidated results of its operations and its cash flows for the year ended December 31, 2015, in conformity with U.S. generally accepted accounting principles. Also, in our opinion, the related financial statement schedule for year ended December 31, 2015, when considered in relation to the basic financial statements taken as a whole, presents fairly in all material respects the information set forth therein.
/s/ Ernst & Young LLP
Irvine, California
February 17, 2016
F-3
MAXLINEAR, INC.
CONSOLIDATED BALANCE SHEETS
(in thousands, except par value amounts)
See accompanying notes.
December 31, | December 31, | ||||||
2017 | 2016 | ||||||
Assets | |||||||
Current assets: | |||||||
Cash and cash equivalents | $ | 71,872 | $ | 81,086 | |||
Short-term restricted cash | 1,476 | 614 | |||||
Short-term investments, available-for-sale | — | 47,918 | |||||
Accounts receivable, net | 66,099 | 50,487 | |||||
Inventory | 53,434 | 26,583 | |||||
Prepaid expenses and other current assets | 8,423 | 6,159 | |||||
Total current assets | 201,304 | 212,847 | |||||
Long-term restricted cash | 1,064 | 1,196 | |||||
Property and equipment, net | 22,658 | 20,549 | |||||
Long-term investments, available-for-sale | — | 5,991 | |||||
Intangible assets, net | 315,045 | 104,261 | |||||
Goodwill | 237,992 | 76,015 | |||||
Deferred tax assets | 39,878 | 116 | |||||
Other long-term assets | 6,921 | 1,677 | |||||
Total assets | $ | 824,862 | $ | 422,652 | |||
Liabilities and stockholders’ equity | |||||||
Current liabilities: | |||||||
Accounts payable | $ | 16,939 | $ | 6,757 | |||
Deferred revenue and deferred profit | 4,362 | 5,991 | |||||
Accrued price protection liability | 21,571 | 15,176 | |||||
Accrued expenses and other current liabilities | 20,306 | 16,358 | |||||
Accrued compensation | 13,208 | 10,261 | |||||
Total current liabilities | 76,386 | 54,543 | |||||
Deferred rent | 4,885 | 9,656 | |||||
Long-term debt | 347,609 | — | |||||
Other long-term liabilities | 8,558 | 6,029 | |||||
Total liabilities | 437,438 | 70,228 | |||||
Commitments and contingencies | |||||||
Stockholders’ equity: | |||||||
Preferred stock, $0.0001 par value; 25,000 shares authorized, no shares issued or outstanding | — | — | |||||
Common stock, $0.0001 par value; 550,000 shares authorized, 67,400 shares issued and outstanding at December 31, 2017 and 550,000 shares authorized, no shares issued or outstanding at December 31, 2016, respectively | 7 | — | |||||
Class A common stock, $0.0001 par value; 441,124 shares authorized, no shares issued and outstanding at December 31, 2017 and 500,000 shares authorized, 58,363 shares issued and outstanding at December 31, 2016, respectively | — | 6 | |||||
Class B common stock, $0.0001 par value; 493,430 shares authorized, no shares issued and outstanding at December 31, 2017 and 500,000 shares authorized, 6,668 shares issued and outstanding at December 31, 2016, respectively | — | 1 | |||||
Additional paid-in capital | 455,497 | 413,909 | |||||
Accumulated other comprehensive income (loss) | 1,039 | (1,560 | ) | ||||
Accumulated deficit | (69,119 | ) | (59,932 | ) | |||
Total stockholders’ equity | 387,424 | 352,424 | |||||
Total liabilities and stockholders’ equity | $ | 824,862 | $ | 422,652 | |||
F-4
MAXLINEAR, INC.
CONSOLIDATED STATEMENTS OF OPERATIONS
(in thousands, except per share data)
Years Ended December 31, | |||||||||||
2017 | 2016 | 2015 | |||||||||
Net revenue | $ | 420,318 | $ | 387,832 | $ | 300,360 | |||||
Cost of net revenue | 212,355 | 157,842 | 144,937 | ||||||||
Gross profit | 207,963 | 229,990 | 155,423 | ||||||||
Operating expenses: | |||||||||||
Research and development | 112,279 | 97,745 | 85,405 | ||||||||
Selling, general and administrative | 105,831 | 64,454 | 77,981 | ||||||||
IPR&D impairment losses | 2,000 | 1,300 | 21,600 | ||||||||
Restructuring charges | 9,524 | 3,432 | 14,086 | ||||||||
Total operating expenses | 229,634 | 166,931 | 199,072 | ||||||||
Income (loss) from operations | (21,671 | ) | 63,059 | (43,649 | ) | ||||||
Interest income | 274 | 572 | 275 | ||||||||
Interest expense | (10,378 | ) | (104 | ) | (100 | ) | |||||
Other income (expense), net | (2,223 | ) | 163 | 568 | |||||||
Total interest and other income (expense), net | (12,327 | ) | 631 | 743 | |||||||
Income (loss) before income taxes | (33,998 | ) | 63,690 | (42,906 | ) | ||||||
Income tax provision (benefit) | (24,811 | ) | 2,398 | (575 | ) | ||||||
Net income (loss) | $ | (9,187 | ) | $ | 61,292 | $ | (42,331 | ) | |||
Net income (loss) per share: | |||||||||||
Basic | $ | (0.14 | ) | $ | 0.96 | $ | (0.79 | ) | |||
Diluted | $ | (0.14 | ) | $ | 0.91 | $ | (0.79 | ) | |||
Shares used to compute net income (loss) per share: | |||||||||||
Basic | 66,252 | 63,781 | 53,378 | ||||||||
Diluted | 66,252 | 67,653 | 53,378 | ||||||||
See accompanying notes.
F-5
MAXLINEAR, INC.
CONSOLIDATED STATEMENTS OF COMPREHENSIVE INCOME (LOSS)
(in thousands)
Years Ended December 31, | |||||||||||
2017 | 2016 | 2015 | |||||||||
Net income (loss) | $ | (9,187 | ) | $ | 61,292 | $ | (42,331 | ) | |||
Other comprehensive income (loss), net of tax: | |||||||||||
Unrealized gain (loss) on investments, net of tax of $0 in 2017, $27 in 2016 and $0 in 2015 | (55 | ) | 11 | (93 | ) | ||||||
Less: Reclassification adjustments of unrealized gain, net of tax of $0 in 2017, 2016 and 2015 | 55 | — | 21 | ||||||||
Unrealized gain (loss) on investments, net of tax | — | 11 | (72 | ) | |||||||
Foreign currency translation adjustments, net of tax benefit of $202 in 2017, $39 in 2016 and $184 in 2015(1) | 2,122 | (749 | ) | (725 | ) | ||||||
Foreign currency translation adjustments, net of tax | 2,122 | (749 | ) | (725 | ) | ||||||
Unrealized gain on interest rate swap, net of tax of $257 in 2017, $0 in 2016, and $0 in 2015 | 477 | — | — | ||||||||
Unrealized gain on interest rate swap, net of tax | 477 | — | — | ||||||||
Other comprehensive income (loss) | 2,599 | (738 | ) | (797 | ) | ||||||
Total comprehensive income (loss) | $ | (6,588 | ) | $ | 60,554 | $ | (43,128 | ) | |||
___________________________
(1) | Tax amount recognized in Other Long-Term Liabilities of the Consolidated Balance Sheets as part of long-term deferred tax liabilities. |
See accompanying notes.
F-6
MAXLINEAR, INC.
CONSOLIDATED STATEMENTS OF STOCKHOLDERS' EQUITY
(in thousands, except share amounts)
Common Stock | Class A Common Stock | Class B Common Stock | Additional Paid-In Capital | Accumulated Other Comprehensive Income (Loss) | Accumulated Deficit | Total Stockholders’ Equity | |||||||||||||||||||||||||||||||
Shares | Amount | Shares | Amount | Shares | Amount | ||||||||||||||||||||||||||||||||
Balance at December 31, 2014 | — | $ | — | 30,927 | $ | 3 | 6,984 | $ | 1 | $ | 177,912 | $ | (25 | ) | $ | (78,789 | ) | $ | 99,102 | ||||||||||||||||||
Shares repurchased | — | — | — | — | — | — | — | — | (101 | ) | (101 | ) | |||||||||||||||||||||||||
Conversion of Class B common stock to Class A common stock | — | — | 500 | — | (500) | — | — | — | — | — | |||||||||||||||||||||||||||
Common stock issued pursuant to equity awards, net | — | — | 3,420 | — | 181 | — | 6,603 | — | — | 6,603 | |||||||||||||||||||||||||||
Issuance of common stock for merger with Entropic Communications, Inc. | — | — | 20,373 | 2 | — | — | 177,559 | — | — | 177,561 | |||||||||||||||||||||||||||
Employee stock purchase plan | — | — | 517 | — | — | — | 3,619 | — | — | 3,619 | |||||||||||||||||||||||||||
Stock-based compensation | — | — | — | — | — | — | 19,268 | — | — | 19,268 | |||||||||||||||||||||||||||
Other comprehensive loss | — | — | — | — | — | — | — | (797 | ) | — | (797 | ) | |||||||||||||||||||||||||
Net loss | — | — | — | — | — | — | — | — | (42,331 | ) | (42,331 | ) | |||||||||||||||||||||||||
Balance at December 31, 2015 | — | — | 55,737 | 5 | 6,665 | 1 | 384,961 | (822 | ) | (121,221 | ) | 262,924 | |||||||||||||||||||||||||
Shares repurchased | — | — | — | — | — | — | — | — | (3 | ) | (3 | ) | |||||||||||||||||||||||||
Conversion of Class B common stock to Class A common stock | — | — | 3 | — | (3 | ) | — | — | — | — | — | ||||||||||||||||||||||||||
Common stock issued pursuant to equity awards, net | — | — | 2,344 | 1 | 6 | — | 2,839 | — | — | 2,840 | |||||||||||||||||||||||||||
Employee stock purchase plan | — | — | 279 | — | — | — | 4,134 | — | — | 4,134 | |||||||||||||||||||||||||||
Stock-based compensation | — | — | — | — | — | — | 21,975 | — | — | 21,975 | |||||||||||||||||||||||||||
Other comprehensive loss | — | — | — | — | — | — | — | (738 | ) | — | (738 | ) | |||||||||||||||||||||||||
Net income | — | — | — | — | — | — | — | — | 61,292 | 61,292 | |||||||||||||||||||||||||||
Balance at December 31, 2016 | — | — | 58,363 | 6 | 6,668 | 1 | 413,909 | (1,560 | ) | (59,932 | ) | 352,424 | |||||||||||||||||||||||||
Shares repurchased and cancelled | — | — | (13 | ) | — | — | — | (334 | ) | — | — | (334 | ) | ||||||||||||||||||||||||
Conversion of Class B common stock to Class A common stock | — | — | 163 | — | (163 | ) | — | — | — | — | — | ||||||||||||||||||||||||||
Conversion of Class A and B common stock to common stock | 65,446 | 7 | (58,876 | ) | (6 | ) | (6,570 | ) | (1 | ) | — | — | — | — | |||||||||||||||||||||||
Common stock issued pursuant to equity awards, net | 1,738 | — | 363 | — | 65 | — | 398 | — | — | 398 | |||||||||||||||||||||||||||
Vested stock-based awards assumed in acquisition | — | — | — | — | — | — | 4,613 | — | — | 4,613 | |||||||||||||||||||||||||||
Employee stock purchase plan | 216 | — | — | — | — | — | 4,308 | — | — | 4,308 | |||||||||||||||||||||||||||
Stock-based compensation | — | — | — | — | — | — | 32,603 | — | — | 32,603 | |||||||||||||||||||||||||||
Other comprehensive income | — | — | — | — | — | — | — | 2,599 | — | 2,599 | |||||||||||||||||||||||||||
Net loss | — | — | — | — | — | — | — | — | (9,187 | ) | (9,187 | ) | |||||||||||||||||||||||||
Balance at December 31, 2017 | 67,400 | $ | 7 | — | $ | — | — | $ | — | $ | 455,497 | $ | 1,039 | $ | (69,119 | ) | $ | 387,424 | |||||||||||||||||||
See accompanying notes.
F-7
MAXLINEAR, INC.
CONSOLIDATED STATEMENTS OF CASH FLOWS
(in thousands)
See accompanying notes.
Years Ended December 31, | |||||||||||
2017 | 2016 | 2015 | |||||||||
Operating Activities | |||||||||||
Net income (loss) | $ | (9,187 | ) | $ | 61,292 | $ | (42,331 | ) | |||
Adjustments to reconcile net income (loss) to cash provided by operating activities: | |||||||||||
Amortization and depreciation | 66,738 | 26,703 | 40,641 | ||||||||
Impairment of IPR&D assets | 2,000 | 1,300 | 21,600 | ||||||||
Provision for losses on accounts receivable | 133 | 87 | 178 | ||||||||
Amortization of investment premiums, net | (60 | ) | 169 | 554 | |||||||
Amortization of inventory step-up | 25,557 | 5,641 | 14,244 | ||||||||
Amortization of debt issuance costs | 763 | — | — | ||||||||
Stock-based compensation | 32,668 | 21,765 | 19,268 | ||||||||
Deferred income taxes | (31,767 | ) | 101 | (1,906 | ) | ||||||
Loss on disposal of property and equipment | 168 | 366 | 74 | ||||||||
(Gain) loss on sale of available-for-sale securities | 38 | (50 | ) | (21 | ) | ||||||
Change in fair value of contingent consideration | — | 220 | 130 | ||||||||
Impairment of long-lived assets | — | — | 153 | ||||||||
Impairment of lease | — | 388 | 8,163 | ||||||||
(Gain) loss on foreign currency | 2,153 | (216 | ) | — | |||||||
Excess tax benefits on stock-based awards | (8,559 | ) | (8,291 | ) | — | ||||||
Changes in operating assets and liabilities, net of acquisitions: | |||||||||||
Accounts receivable | (4,377 | ) | (8,175 | ) | 5,160 | ||||||
Inventory | (1,788 | ) | 9,846 | (6,247 | ) | ||||||
Prepaid expenses and other assets | 1,272 | 402 | 4,495 | ||||||||
Accounts payable, accrued expenses and other current liabilities | (1,918 | ) | 3,249 | (22,033 | ) | ||||||
Accrued compensation | 1,567 | 5,609 | 5,320 | ||||||||
Deferred revenue and deferred profit | (1,629 | ) | 1,925 | 454 | |||||||
Accrued price protection liability | 6,395 | (4,850 | ) | 6,522 | |||||||
Other long-term liabilities | (5,103 | ) | (164 | ) | 623 | ||||||
Net cash provided by operating activities | 75,064 | 117,317 | 55,041 | ||||||||
Investing Activities | |||||||||||
Purchases of property and equipment | (7,468 | ) | (8,512 | ) | (2,996 | ) | |||||
Proceeds from sale of property and equipment | 30 | — | — | ||||||||
Purchases of intangible assets | (5,378 | ) | (390 | ) | (100 | ) | |||||
Cash used in acquisition, net of cash acquired | (473,304 | ) | (101,000 | ) | (3,615 | ) | |||||
Purchases of available-for-sale securities | (30,577 | ) | (90,307 | ) | (73,377 | ) | |||||
Maturities of available-for-sale securities | 84,546 | 98,896 | 69,029 | ||||||||
Net cash used in investing activities | (432,151 | ) | (101,313 | ) | (11,059 | ) | |||||
Financing Activities | |||||||||||
Repurchases of common stock | (334 | ) | (3 | ) | (101 | ) | |||||
Net proceeds from issuance of common stock | 12,052 | 6,649 | 9,950 | ||||||||
Minimum tax withholding paid on behalf of employees for restricted stock units | (11,543 | ) | (7,316 | ) | (5,141 | ) | |||||
Equity issuance costs | — | — | (705 | ) | |||||||
Net proceeds from the issuance of debt | 416,846 | — | — | ||||||||
Repayment of debt | (70,000 | ) | — | — | |||||||
Net cash provided by (used in) financing activities | 347,021 | (670 | ) | 4,003 | |||||||
Effect of exchange rate changes on cash and cash equivalents | 1,582 | (394 | ) | (725 | ) | ||||||
Increase (decrease) in cash, cash equivalents and restricted cash | (8,484 | ) | 14,940 | 47,260 | |||||||
Cash, cash equivalents and restricted cash at beginning of period | 82,896 | 67,956 | 20,696 | ||||||||
Cash, cash equivalents and restricted cash at end of period | $ | 74,412 | $ | 82,896 | $ | 67,956 | |||||
Supplemental disclosures of cash flow information: | |||||||||||
Cash paid for interest | $ | 8,843 | $ | — | $ | — | |||||
Cash paid for income taxes | $ | 9,435 | $ | 1,583 | $ | 41 | |||||
Supplemental disclosures of non-cash investing and financing activities: | |||||||||||
Issuance of accrued share-based bonus plan | $ | 3,314 | $ | 7,649 | $ | 5,459 | |||||
Lease incentive for leasehold improvements | $ | — | $ | 61 | $ | 4,255 | |||||
Issuance of restricted stock units to Physpeed continuing employees | $ | 818 | $ | 1,061 | $ | — | |||||
F-8
MAXLINEAR, INC. NOTES TO CONSOLIDATED FINANCIAL STATEMENTS (in thousands, except per share amounts and percentage data) | ||
1. Organization and Summary of Significant Accounting Policies
Description of Business
MaxLinear, Inc. was incorporated in Delaware in September 2003. MaxLinear, Inc., together with its wholly owned subsidiaries, collectively referred to as MaxLinear, or the Company, is a provider of radio-frequency, high-performance analog and mixed-signal communications systems-on-chip solutions for the connected home, wired and wireless infrastructure, and industrial and multi-market applications. MaxLinear's customers include electronics distributors, module makers, original equipment manufacturers, or OEMs, and original design manufacturers, or ODMs, who incorporate the Company’s products in a wide range of electronic devices including cable DOCSIS broadband modems and gateways; wireline connectivity devices for in-home networking applications; RF transceivers and modems for wireless carrier access and backhaul infrastructure; fiber-optic modules for data center, metro, and long-haul transport networks; video set-top boxes and gateways; hybrid analog and digital televisions, direct broadcast satellite outdoor and indoor units; and power management and interface products used in these and a range of other markets. The Company is a fabless integrated circuit design company whose products integrate all or substantial portions of a broadband communication system.
Basis of Presentation and Principles of Consolidation
The consolidated financial statements include the accounts of MaxLinear, Inc. and its wholly owned subsidiaries and have been prepared in accordance with accounting principles generally accepted in the United States of America, or GAAP. All intercompany transactions and investments have been eliminated in consolidation. Certain prior period amounts have been reclassified to conform with the current period presentation. Such reclassifications include the separate presentation of short-and long-term restricted cash and deferred tax assets on the consolidated balance sheets, and interest expense on the consolidated statements of operations.
The functional currency of certain foreign subsidiaries is the local currency. Accordingly, assets and liabilities of these foreign subsidiaries are translated at the current exchange rate at the balance sheet date and historical rates for equity. Revenue and expense components are translated at weighted average exchange rates in effect during the period. Gains and losses resulting from foreign currency translation are included as a component of stockholders’ equity. Foreign currency transaction gains and losses are included in the results of operations, and to date, have not been material.
Use of Estimates
The preparation of consolidated financial statements in conformity with GAAP requires management to make estimates and assumptions that affect the amounts reported in the consolidated financial statements and accompanying notes of the consolidated financial statements. The Company continually evaluates its estimates and judgments, the most critical of which are those related to revenue recognition, allowance for doubtful accounts, inventory valuation, income taxes and stock-based compensation. Actual results could differ from those estimates.
Business Combinations
The Company applies the provisions of ASC 805, Business Combinations, in accounting for its acquisitions. It requires the Company to recognize separately from goodwill the assets acquired and the liabilities assumed, at the acquisition date fair values. Goodwill as of the acquisition date is measured as the excess of consideration transferred over the acquisition date fair values of the net assets acquired and the liabilities assumed. While the Company uses its best estimates and assumptions to accurately value assets acquired and liabilities assumed at the acquisition date as well as contingent consideration, where applicable, its estimates are inherently uncertain and subject to refinement. As a result, during the measurement period, which may be up to one year from the acquisition date, the Company records adjustments to the assets acquired and liabilities assumed with the corresponding offset to goodwill. Upon the conclusion of the measurement period or final determination of the values of assets acquired or liabilities assumed, whichever comes first, any subsequent adjustments are recorded to the consolidated statements of operations.
F-9
MAXLINEAR, INC. NOTES TO CONSOLIDATED FINANCIAL STATEMENTS (in thousands, except per share amounts and percentage data) | ||
Costs to exit or restructure certain activities of an acquired company or the Company's internal operations are accounted for as termination and exit costs pursuant to ASC 420, Exit or Disposal Cost Obligations, and are accounted for separately from the business combination. A liability for costs associated with an exit or disposal activity is recognized and measured at its fair value in the consolidated statement of operations in the period in which the liability is incurred. When estimating the fair value of facility restructuring activities, assumptions are applied regarding estimated sub-lease payments to be received, which can differ materially from actual results. This may require the Company to revise its initial estimates which may materially affect the results of operations and financial position in the period the revision is made.
For a given acquisition, the Company may identify certain pre-acquisition contingencies as of the acquisition date and may extend its review and evaluation of these pre-acquisition contingencies throughout the measurement period in order to obtain sufficient information to assess whether the Company includes these contingencies as a part of the fair value estimates of assets acquired and liabilities assumed and, if so, to determine their estimated amounts.
If the Company cannot reasonably determine the fair value of a pre-acquisition contingency (non-income tax related) by the end of the measurement period, which is generally the case given the nature of such matters, the Company will recognize an asset or a liability for such pre-acquisition contingency if: (i) it is probable that an asset existed or a liability had been incurred at the acquisition date and (ii) the amount of the asset or liability can be reasonably estimated. Subsequent to the measurement period, changes in estimates of such contingencies will affect earnings and could have a material effect on the Company's results of operations and financial position.
In addition, uncertain tax positions and tax related valuation allowances assumed in connection with a business combination are initially estimated as of the acquisition date. The Company reevaluates these items quarterly based upon facts and circumstances that existed as of the acquisition date with any adjustments to the preliminary estimates being recorded to goodwill if identified within the measurement period. Subsequent to the end of the measurement period or final determination of the estimated value of the tax allowance or contingency, whichever comes first, changes to these uncertain tax positions and tax related valuation allowances will affect the income tax provision (benefit) in the consolidated statement of operations and could have a material impact on the results of operations and financial position.
Cash and Cash Equivalents
The Company considers all liquid investments with a maturity of three months or less when purchased to be cash equivalents. Cash equivalents are recorded at cost, which approximates market value.
Restricted Cash
As of December 31, 2017 and 2016, the Company has restricted cash of $2.5 million and $1.8 million, respectively. The cash is on deposit in connection with guarantees for certain office leases.
Accounts Receivable
The Company performs ongoing credit evaluations of its customers and assesses each customer's credit worthiness. The Company monitors collections and payments from its customers and maintains an allowance for doubtful accounts based upon its historical experience, its anticipation of uncollectible accounts receivable and any specific customer collection issues that the Company has identified. As of December 31, 2017 and 2016, the Company has an allowance for doubtful accounts of $0.1 million and $0.1 million, respectively.
Inventory
The Company assesses the recoverability of its inventory based on assumptions about demand and market conditions. Forecasted demand is determined based on historical sales and expected future sales. Inventory is stated at the lower of cost or net realizable value. Cost approximates actual cost on a first-in, first-out basis and net realizable value is the estimated selling price in the ordinary course of business, less reasonably predictable costs of completion, disposal and transportation. The Company reduces its inventory to its lower of cost or net realizable value on a part-by-part basis to account for its obsolescence or lack of marketability. Reductions are calculated as the difference between the cost of inventory and its net realizable value based upon assumptions about future demand, market conditions and costs. Once established, these adjustments are considered permanent and are not revised until the related inventory is sold or disposed of.
F-10
MAXLINEAR, INC. NOTES TO CONSOLIDATED FINANCIAL STATEMENTS (in thousands, except per share amounts and percentage data) | ||
Investments, Available-for-Sale
The Company classifies all investments as available-for-sale, as the sale of such investments may be required prior to maturity to implement management strategies. These investments are carried at fair value, with unrealized gains and losses reported as accumulated other comprehensive income until realized. The cost of debt securities is adjusted for amortization of premiums and accretion of discounts to maturity. Such amortization and accretion, as well as interest and dividends, are included in interest income. Realized gains and losses from the sale of available-for-sale investments, if any, are determined on a specific identification basis and are also included in interest income.
Fair Value of Financial Instruments
The carrying amount of cash and cash equivalents, restricted cash, accounts receivable, accounts payable and accrued expenses and compensation are considered to be representative of their respective fair value because of the short-term nature of these accounts. Investment securities, available-for-sale, and the interest rate swap are carried at fair value.
Property and Equipment
Property and equipment is carried at cost and depreciated over the estimated useful lives of the assets, ranging from two to five years, using the straight-line method. Leasehold improvements are stated at cost and amortized over the shorter of the estimated useful lives of the assets or the lease term.
Production Masks
Production masks with alternative future uses or discernible future benefits are capitalized and amortized over their estimated useful life of two years. To determine if the production mask has alternative future uses or benefits, the Company evaluates risks associated with developing new technologies and capabilities, and the related risks associated with entering new markets. Production masks that do not meet the criteria for capitalization are expensed as research and development costs.
Goodwill and Intangible Assets
Goodwill is the excess of the purchase price over the fair value of identifiable net assets acquired in business combinations accounted for under the acquisition method. Intangible assets represent purchased intangible assets including developed technology, in-process research and development, or IPR&D, technologies acquired or licensed from other companies, customer relationships, non-compete covenants, backlog, and trademarks and tradenames. Purchased finite-lived intangible assets are capitalized and amortized over their estimated useful lives. Technologies acquired or licensed from other companies, customer relationships, non-compete covenants, backlog, and trademarks and tradenames are capitalized and amortized over the lesser of the terms of the agreement, or estimated useful life. The Company capitalizes IPR&D projects acquired as part of a business combination. On completion of each project, IPR&D assets are reclassified to developed technology and amortized over their estimated useful lives.
Impairment of Goodwill and Long-Lived Assets
Goodwill is not amortized but is tested for impairment using either a qualitative assessment, and/or the two-step method as needed. Step one is the identification of potential impairment. This involves comparing the fair value of each reporting unit, which the Company has determined to be the entity itself, with its carrying amount, including goodwill. If the fair value of a reporting unit exceeds the carrying amount, the goodwill of the reporting unit is considered not impaired and the second step of the impairment test is unnecessary. If the carrying amount of a reporting unit exceeds its fair value, the second step of the impairment test is performed to measure the amount of impairment loss, if any. The Company tests by reporting unit, goodwill and other indefinite-lived intangible assets for impairment as of October 31 each year or more frequently if it believes indicators of impairment exist.
During development, IPR&D is not subject to amortization and is tested for impairment annually or more frequently if events or changes in circumstances indicate that the asset might be impaired. The Company reviews indefinite-lived intangible assets for impairment using a qualitative assessment, followed by a quantitative assessment, as needed, each year as of October 31, the date of its annual goodwill impairment review, or whenever events or changes in circumstances indicate the carrying value may not be recoverable. Recoverability of indefinite-lived intangible assets is measured by comparing the carrying amount of the asset to its fair value. In certain cases, the Company utilizes the relief-from-royalty method when appropriate, and a fair value will be obtained based on analysis over the costs saved by owning the right instead of leasing it.
F-11
MAXLINEAR, INC. NOTES TO CONSOLIDATED FINANCIAL STATEMENTS (in thousands, except per share amounts and percentage data) | ||
Once an IPR&D project is complete, it becomes a finite-lived intangible asset and is evaluated for impairment both immediately prior to its change in classification and thereafter in accordance with the Company's policy for long-lived assets.
The Company regularly reviews the carrying amount of its long-lived assets subject to depreciation and amortization, as well as the useful lives, to determine whether indicators of impairment may exist which warrant adjustments to carrying values or estimated useful lives. An impairment loss would be recognized when the sum of the expected future undiscounted net cash flows is less than the carrying amount of the asset. Should impairment exist, the impairment loss would be measured based on the excess of the carrying amount of the asset over the asset’s fair value.
During 2017, 2016 and 2015, the Company identified impairment of IPR&D of $2.0 million, $1.3 million and $21.6 million, respectively. Refer to Goodwill and Intangible Assets, Note 5 for more information.
Revenue Recognition
Revenue is generated from sales of the Company’s integrated circuits. The Company recognizes revenue when all of the following criteria are met: 1) there is persuasive evidence that an arrangement exists, 2) delivery of goods has occurred, 3) the sales price is fixed or determinable and 4) collectability is reasonably assured. Title to product transfers to customers either when it is shipped to or received by the customer, based on the terms of the specific agreement with the customer.
Revenue is recorded based on the facts at the time of sale. Transactions for which the Company cannot reliably estimate the amount that will ultimately be collected at the time the product has shipped and title has transferred to the customer are deferred until the amount that is probable of collection can be determined. Items that are considered when determining the amounts that will be ultimately collected are: a customer’s overall creditworthiness and payment history; customer rights to return unsold product; customer rights to price protection; customer payment terms conditioned on sale or use of product by the customer; or extended payment terms granted to a customer.
A portion of the Company’s revenues are generated from sales made through distributors, some of which are under agreements allowing for pricing credits and/or stock rotation rights of return. Pricing credits to the Company’s distributors may result from its price protection and unit rebate provisions, among other factors. These pricing credits and/or stock rotation rights prevent the Company from being able to reliably estimate the final sales price of the inventory sold and the amount of inventory that could be returned pursuant to these agreements. As a result, for some sales through distributors, the Company has determined that it does not meet all of the required revenue recognition criteria at the time it delivers its products to distributors as the final sales price is not fixed or determinable. For such sales, revenue is not recognized until product is shipped to the end customer, which is when the amount that will ultimately be collected is fixed or determinable. Upon shipment of product to these distributors, title to the inventory transfers to the distributor and the distributor is invoiced, generally with 30 to 60 day terms. On shipments to the Company’s distributors where revenue is not recognized, the Company records a trade receivable for the selling price as there is a legally enforceable right to payment, relieving the inventory for the carrying value of goods shipped since legal title has passed to the distributor, and records the corresponding gross profit in the consolidated balance sheet as a component of deferred revenue and deferred profit, representing the difference between the receivable recorded and the cost of inventory shipped. The Company also accepts orders or amendments to orders with non-cancellable and non-refundable, or NCNR, terms with fixed pricing. For such transactions, revenue is not deferred. As of January 1, 2018, all sales to distributors will be recognized upon shipment and estimates of future pricing credits and/or stock rotation rights from the Company’s distributors will reduce related revenues. If our estimates of such credits and rights are materially inaccurate, it may result in adjustments that affect future revenues and gross profits.
The Company records reductions in revenue for estimated pricing adjustments related to price protection agreements with the Company’s end customers in the same period that the related revenue is recorded. Price protection pricing adjustments are recorded at the time of sale as a reduction to revenue and an increase in the Company’s accrued liabilities. The amount of these reductions is based on specific criteria included in the agreements and other factors known at the time. The Company accrues 100% of potential price protection adjustments at the time of sale and does not apply a breakage factor. The Company de-recognizes the accrual for unclaimed price protection amounts as specific programs contractually end and when the Company believes unclaimed amounts are no longer subject to payment and will not be paid. See Note 7 for a summary of the Company's price protection activity.
Revenues from sales through the Company’s distributors accounted for 34%, 19% and 13% of net revenue for the years ended December 31, 2017, 2016 and 2015, respectively.
F-12
MAXLINEAR, INC. NOTES TO CONSOLIDATED FINANCIAL STATEMENTS (in thousands, except per share amounts and percentage data) | ||
Warranty
The Company generally provides a warranty on its products for a period of one to three years. The Company makes estimates of product return rates and expected costs to replace the products under warranty at the time revenue is recognized based on historical warranty experience and any known product warranty issues. If actual return rates and/or replacement costs differ significantly from these estimates, adjustments to recognize additional cost of net revenue may be required in future periods. As of December 31, 2017 and 2016, the Company has warranty reserves of $0.9 million and $0.9 million based on the Company’s estimates.
Segment Information
The Company operates in one segment as it has developed, marketed and sold primarily only one class of similar products, radio-frequency, mixed-signal and high-performance analog integrated circuits for the connected home, wired and wireless infrastructure markets and industrial and multi-market applications.
Operating segments are defined as components of an enterprise about which separate financial information is available that is evaluated regularly by the chief operating decision maker, or decision making group, in deciding how to allocate resources and in assessing performance. The Company’s chief operating decision maker is its Chief Executive Officer. The Company’s Chief Executive Officer reviews financial information presented on a consolidated basis for purposes of allocating resources and evaluating financial performance. The Company has one business activity and there are no segment managers who are held accountable for operations, operating results and plans for products or components below the consolidated unit level. Accordingly, the Company reports as a single operating segment.
Stock-based Compensation
The Company measures the cost of employee services received in exchange for equity incentive awards, including restricted stock units and restricted stock awards, employee stock purchase rights and stock options based on the grant date fair value of the award. The Company calculates the fair value of restricted stock units and restricted stock awards based on the fair market value of its common stock on the grant date. The Company uses the Black-Scholes valuation model to calculate the fair value of stock options and employee stock purchase rights granted to employees. Stock-based compensation expense is recognized over the period during which the employee is required to provide services in exchange for the award, which is usually the vesting period. The Company recognizes compensation expense over the vesting period using the straight-line method and classifies these amounts in the consolidated statements of operations based on the department to which the related employee reports.
Research and Development
Costs incurred in connection with the development of the Company’s technology and future products are charged to research and development expense as incurred.
Derivatives and Hedging Activities
The Company records derivatives in the consolidated balance sheets at fair value. Hedge accounting is applied to derivatives designated in a hedging relationship. A derivative designated as a hedge of a forecasted transaction is carried at fair value with the effective portion of a derivative’s gain or loss recorded in other comprehensive income (i.e., a separate component of shareholders’ equity) and subsequently recognized in earnings in the same period or periods the hedged forecasted transaction affects earnings. The ineffective portion of a derivative’s gain or loss is recorded in earnings as it occurs. Changes in certain terms of the hedged transactions, including the selection of interest rate from one-month LIBOR to another rate could cause ineffectiveness in the derivatives and result in reclassification of amounts in accumulated other comprehensive income (loss) into earnings.
Income Taxes
The Company provides for income taxes utilizing the asset and liability approach of accounting for income taxes. Under this approach, deferred taxes represent the future tax consequences expected to occur when the reported amounts of assets and liabilities are recovered or paid. Deferred taxes are presented net as noncurrent. The provision for income taxes generally represents income taxes paid or payable for the current year plus the change in deferred taxes during the year. Deferred taxes result from the differences between the financial and tax bases of the Company’s assets and liabilities and are adjusted for changes in tax rates and tax laws when changes are enacted. Valuation allowances are recorded to reduce deferred tax assets
F-13
MAXLINEAR, INC. NOTES TO CONSOLIDATED FINANCIAL STATEMENTS (in thousands, except per share amounts and percentage data) | ||
when a judgment is made that is considered more likely than not that a tax benefit will not be realized. A decision to record a valuation allowance results in an increase in income tax expense or a decrease in income tax benefit. If the valuation allowance is released in a future period, income tax expense will be reduced accordingly.
The calculation of tax liabilities involves dealing with uncertainties in the application of complex global tax regulations. The impact of an uncertain income tax position is recognized at the largest amount that is “more likely than not” to be sustained upon audit by the relevant taxing authority. An uncertain income tax position will not be recognized if it has less than a 50% likelihood of being sustained. If the estimate of tax liabilities proves to be less than the ultimate assessment, a further charge to expense would result.
In assessing the realizability of deferred tax assets, management considers whether it is more likely than not that some portion or all of the deferred tax assets will be realized. The ultimate realization of deferred tax assets is dependent upon the generation of future taxable income during the periods in which those temporary differences become deductible. The Company continually assesses the need for a valuation allowance on the deferred tax asset by evaluating both positive and negative evidence that may exist. Any adjustment to the net deferred tax asset valuation allowance would be recorded in the income statement for the period that the adjustment is determined to be required.
On December 22, 2017, the Tax Cuts and Jobs Act, or the Tax Act, was enacted into U.S. tax law. Also on December 22, 2017, the SEC issued guidance in Staff Accounting Bulletin No. 118, or SAB 118, to address certain fact patterns where the accounting for changes in tax laws or tax rates under ASC Topic 740 is incomplete upon issuance of an entity's financial statements for the reporting period in which the Tax Act is enacted. As permitted in SAB 118, in 2017, the Company has taken a measurement period approach and reported certain provisional amounts, based on reasonable estimates, for certain tax effects in which the accounting under ASC 740 is incomplete. Such provisional amounts are subject to adjustment during a limited measurement period, not to extend one year beyond the tax law enactment date, until the accounting under ASC 740 is complete. The Company has also made required supplemental disclosures to accompany the provisional amounts, including the reasons for the incomplete accounting, the additional information or analysis that is needed, and other information relevant to why the Company was not able to complete the accounting required under ASC 740 in a timely manner (Note 10).
Comprehensive Income (Loss)
Comprehensive income (loss) is defined as the change in equity (net assets) of a business entity during a period from transactions and other events and circumstances from non-owner sources. Other comprehensive income (loss) includes certain changes in equity that are excluded from net income (loss), such as unrealized holding gains and losses on available-for-sale investments, net of tax, foreign currency translation gains and losses, and unrealized gains and losses from interest rate hedging activities.
The following table summarizes the balances in accumulated other comprehensive income (loss) by component:
Available for Sale Investments | Cumulative Translation Adjustments | Interest Rate Hedge | Total | ||||||||||||
(in thousands) | |||||||||||||||
Balance at December 31, 2017 | $ | — | $ | 562 | $ | 477 | $ | 1,039 | |||||||
Balance at December 31, 2016 | $ | 55 | $ | (1,615 | ) | $ | — | $ | (1,560 | ) | |||||
Net Income (Loss) per Share
Basic net income (loss) per share is computed by dividing net income (loss) attributable to the Company by the weighted average number of shares of common stock outstanding during the period. For diluted net income (loss) per share, net income (loss) attributable to the Company is divided by the sum of the weighted average number of shares of common stock outstanding and the potential number of shares of dilutive common stock outstanding during the period.
Litigation and Settlement Costs
Legal costs are expensed as incurred. The Company is involved in disputes, litigation and other legal actions in the ordinary course of business. The Company continually evaluates uncertainties associated with litigation and records a charge equal to at least the minimum estimated liability for a loss contingency when both of the following conditions are met: (i)
F-14
MAXLINEAR, INC. NOTES TO CONSOLIDATED FINANCIAL STATEMENTS (in thousands, except per share amounts and percentage data) | ||
information available prior to issuance of the financial statements indicates that it is probable that an asset had been impaired or a liability had been incurred at the date of the financial statements and (ii) the loss or range of loss can be reasonably estimated.
Recently Adopted Accounting Pronouncements
In July 2015, the FASB issued ASU No. 2015-11, Simplifying the Measurement of Inventory, which requires inventory to be subsequently measured using the lower of cost and net realizable value. Net realizable value is the estimated selling prices in the ordinary course of business, less reasonably predictable costs of completion, disposal and transportation. ASU 2015-11 was effective for the Company beginning in the first quarter of fiscal year 2017 and has been applied prospectively. The adoption of ASU No. 2015-11 by the Company in 2017 did not have a material impact on the Company's consolidated financial position and results of operations for the year ended December 31, 2017.
In March 2016, the FASB issued ASU No. 2016-09, Improvements to Share-Based Compensation to simplify certain aspects of accounting for share-based payment transactions associated with income taxes, classification as equity or liabilities, and classification on the statement of cash flows. The amendments in this update were effective for the Company for fiscal years beginning with fiscal year 2017. The new guidance required, among other things, excess tax benefits and tax deficiencies to be recorded on a prospective basis in the income statement in the provision for income taxes when awards vest or are settled. On the statement of cash flows, excess tax benefits must be classified along with other income tax cash flows as an operating activity on either a prospective transition method or a retrospective transition method. Also, because excess tax benefits are no longer recognized in additional paid-in capital, the assumed proceeds from applying the treasury stock method when computing earnings per share is amended to exclude the amount of excess tax benefits that would be recognized in additional paid-in capital. The Company adopted ASU No. 2016-09 during the quarter ended June 30, 2016, as previously described in the Company's Form 10-Q for the period ended June 30, 2016 filed with the Securities Exchange Commission on August 8, 2016. There was no cumulative effect on retained earnings in the consolidated balance sheet upon adoption since the Company had a full valuation allowance against U.S. deferred tax assets at the time of adoption. The Company elected to continue to estimate forfeitures of share-based awards resulting in no impact to stock-based compensation expense, and is also continuing to classify cash paid by the Company when directly withholding shares for tax withholding purposes in cash flows from financing activities. On the statement of cash flows, excess tax benefits were classified along with other income tax cash flows as an operating activity upon adoption on a prospective basis.
In October 2016, the FASB issued ASU No. 2016-16, Income Taxes (Topic 740) to improve the accounting for the income tax consequences of intra-entity transfers of assets other than inventory. Prior accounting guidance prohibits the recognition of current and deferred income taxes for an intra-entity asset transfer until the asset has been sold to an outside party. The FASB decided that an entity should recognize the income tax consequences of an intra-entity transfer of an asset other than inventory when the transfer occurs. The amendments in this update should be applied on a modified retrospective basis through a cumulative-effect adjustment directly to retained earnings as of the beginning of the period of adoption. The amendments in this update are effective for the Company beginning in the first quarter of fiscal 2018, including interim reporting periods. Early adoption is permitted as of the first quarter of fiscal 2017, or the beginning of the annual reporting period only. The Company elected to early adopt the amendments in this update beginning in the three months ended March 31, 2017. Due to a full valuation allowance on U.S. and certain foreign deferred tax assets at the time of adoption, the adoption of the amendments in this update did not have a material impact on the Company’s consolidated financial position and results of operations for the year ended December 31, 2017.
In November 2016, the FASB issued ASU No. 2016-18, Statement of Cash Flows (Topic 230): Restricted Cash. The amendments in this update require that a statement of cash flows explain the change during the period in the total of cash, cash equivalents, and amounts generally described as restricted cash or restricted cash equivalents. Therefore, amounts generally described as restricted cash and restricted cash equivalents should be included with cash and cash equivalents when reconciling the beginning-of-period and end-of-period total amounts shown on the statement of cash flows. When cash, cash equivalents, and amounts generally described as restricted cash or restricted cash equivalents are presented in more than one line item within the statement of financial position, an entity shall, for each period that a statement of financial position is presented, disclose the line items and amounts of cash, cash equivalents, and amounts generally described as restricted cash or restricted cash equivalents disaggregated by the line item in which they appear within the statement of financial position, with a sum to the total amount of cash, cash equivalents, restricted cash and restricted cash equivalents. The amendments in this update are effective for the Company beginning in fiscal 2018, including interim periods within that year and should be applied using a retrospective transition method to each period presented. Early adoption is permitted, including adoption in an interim period. If an entity early adopts in an interim period, any adjustments should be reflected as of the beginning of the fiscal year that
F-15
MAXLINEAR, INC. NOTES TO CONSOLIDATED FINANCIAL STATEMENTS (in thousands, except per share amounts and percentage data) | ||
includes the interim period. The Company elected to early adopt the amendments in this update in 2017. The adoption did not have a material impact on the Company’s consolidated cash flows for the years ended December 31, 2017, 2016 and 2015.
In January 2017, the FASB issued ASU No. 2017-01, Business Combinations (Topic 805): Clarifying the Definition of a Business. The amendments in this update clarify the definition of a business with the objective of adding guidance to assist entities with evaluating whether transactions should be accounted for as acquisitions of assets or businesses and provides a screen to determine when a set is not a business. The screen requires that when substantially all of the fair value of the gross assets acquired (or disposed of) is concentrated in a single identifiable asset or a group of similar identifiable assets, the set is not a business. This screen reduces the number of transactions that need to be further evaluated. If the screen is not met, the amendments in this update (1) require that to be considered a business, a set must include, at a minimum, an input and a substantive process that together significantly contribute to the ability to create output and (2) remove the evaluation of whether a market participant could replace missing elements. The amendments in this update are effective for the Company beginning in the first quarter of 2018 and are required to be applied prospectively on or after the effective date. No disclosures are required at transition. Early application is allowed for transactions for which the acquisition date occurs before the issuance date or effective date of the amendments, only when the transaction has not been reported in financial statements that have been issued or made available for issuance. The Company has elected to early adopt the amendments in this update for 2017 acquisitions. Such adoption did not have a material impact on the Company’s consolidated financial position and results of operations for the year ended December 31, 2017.
On December 22, 2017, the U.S. government enacted comprehensive tax legislation commonly referred to as the Tax Cuts and Jobs Act, or the Tax Act. The Tax Act makes broad and complex changes to the U.S. tax code (Note 10). On December 22, 2017, the U.S. Securities and Exchange Commission Staff, or SEC Staff, issued guidance in Staff Accounting Bulletin No. 118, or SAB 118, to address certain fact patterns where the accounting for changes in tax laws or tax rates under ASC Topic 740 is incomplete upon issuance of an entity's financial statements for the reporting period in which the Tax Act is enacted. As permitted in SAB 118, in 2017, the Company has taken a measurement period approach and reported certain provisional amounts, based on reasonable estimates, for certain tax effects in which the accounting under ASC 740 is incomplete. Such provisional amounts are subject to adjustment during a limited measurement period, not to extend one year beyond the tax law enactment date, until the accounting under ASC 740 is complete. The Company has also made required supplemental disclosures (Note 10) to accompany the provisional amounts, including the reasons for the incomplete accounting, the additional information or analysis that is needed, and other information relevant to why the Company was not able to complete the accounting required under ASC 740 in a timely manner. Adjustments to such reported provisional amounts could result in a material adverse impact the Company’s consolidated financial position and results of operations in 2018.
Recently Issued Accounting Pronouncements
In May 2014, the Financial Accounting Standards Board, or FASB, issued Accounting Standards Update, or ASU No. 2014-09, Revenue from Contracts with Customers (Topic 606), which provides for new accounting guidance related to revenue recognition. This new standard will replace all current U.S. GAAP guidance on this topic and eliminate all industry-specific guidance. The new revenue recognition standard provides a unified model to determine when and how revenue is recognized. The core principle is that a company should recognize revenue to depict the transfer of promised goods or services to customers in an amount that reflects the consideration for which the entity expects to be entitled in exchange for those goods or services. This guidance is effective for the Company on January 1, 2018 and can be applied either retrospectively to each period presented or as a cumulative-effect adjustment as of the date of adoption. The Company plans to apply the guidance prospectively with an adjustment to retained earnings for the cumulative effect of adoption. Adoption of the amendments in this guidance will accelerate the timing of the Company’s revenue and related cost recognition on products sold via some distributors, which will change from the sell-through method to the sell-in method under this guidance. The Company will also be required to estimate the effects of pricing credits to its distributors from contractual price protection and unit rebate provisions, as well as stock rotation rights. The Company has performed an assessment of the impact of adopting this new accounting standard on its consolidated financial position and results of operations. The impact of adoption of this new accounting standard for the year ending December 31, 2018 will vary depending on the level of inventory remaining at the adoption date and at the end of the year of adoption at distributors for which the Company currently recognizes revenue on a sell-through basis, and therefore could have a material impact on the Company's revenues for the year ending December 31, 2018. The impact to retained earnings as of January 1, 2018 is not material. As a result of applying the guidance prospectively with an adjustment to retained earnings in the Company's consolidated financial statements for the cumulative effect of adoption, revenues that would have been recognized on a sell-through basis for the amount of deferred revenue and profit remaining as of the adoption date will not be recognized in earnings for any period.
F-16
MAXLINEAR, INC. NOTES TO CONSOLIDATED FINANCIAL STATEMENTS (in thousands, except per share amounts and percentage data) | ||
In January 2016, the FASB issued ASU No. 2016-01, Recognition and Measurement of Financial Assets and Financial Liabilities. The amendments in this update include a requirement to measure equity investments (except equity method investments) at fair value with changes in fair value recognized in net income; previously changes in fair value were recognized in other comprehensive income. The amendments in this update are effective for the Company beginning in the first quarter of fiscal year 2018. Based on the Company's current corporate investment plans, the adoption of the amendments in this update are not expected to have a material impact on the Company's consolidated financial position and results of operations.
In February 2016, the FASB issued ASU No. 2016-02, Leases (Topic 842). The amendments in this update require a lessee to recognize in the statement of financial position a liability to make lease payments (the lease liability) and a right-of-use asset representing its right to use the underlying asset for the lease term for all leases with terms greater than twelve months. For leases less than twelve months, an entity is permitted to make an accounting policy election by class of underlying asset not to recognize lease assets and lease liabilities. If a lessee makes this election, it should recognize lease expense for such leases generally on a straight-line basis over the lease term. The amendments in this update are effective for the Company for fiscal years beginning with fiscal year 2019, including interim periods within those years, with early adoption permitted. The Company is currently in the process of evaluating the impact of adoption of the amendments in this update on the Company’s consolidated financial position and results of operations; however, adoption of the amendments in this update is expected to have a material impact on the Company's consolidated financial position, including an increase in assets and liabilities representing the present value of our future lease payments.
In March 2016, the FASB issued ASU No. 2016-08, Principal versus Agent Considerations (Reporting Revenue Gross versus Net) to clarify the revenue recognition implementation guidance on principal versus agent considerations. The amendments in this update clarify that when another party is involved in providing goods or services to a customer, an entity that is the principal has obtained control of a good or service before it is transferred to a customer, and provides indicators to assist an entity in determining whether it controls a specified good or service prior to the transfer to the customer. An entity that is the principal recognizes revenue in the gross amount of consideration to which it expects to be entitled in exchange for the specified good or service transferred to the customer, whereas an agent recognizes revenue in the amount of any fee or commission to which it expects to be entitled in exchange for arranging for the specified good or service to be provided by the other party. The amendments in this update are effective for the Company beginning in the first quarter of fiscal year 2018, concurrent with the new revenue recognition standard. The adoption of the amendments in this update will not have a material impact on the Company's consolidated financial position and results of operations.
In August 2016, the FASB issued ASU No. 2016-15, Classification of Certain Cash Receipts and Cash Payments to eliminate the diversity in practice regarding the presentation and classification of certain cash receipts and cash payments, including, among other things, contingent consideration payments made following a business combination and proceeds from the settlement of insurance claims in the statement of cash flows. Cash payments not made soon after the acquisition date up to the amount of the contingent consideration liability recognized at the acquisition date should be classified as financing activities, with any excess payments classified as operating activities, whereas cash payments made soon after the acquisition date to settle the contingent consideration should be classified as investing activities. Cash proceeds received from settlement of insurance claims should be classified on the basis of the nature of the related losses. The amendments in this update are effective for fiscal years beginning with fiscal year 2018, including interim periods within those years, with early adoption permitted. The impact of adoption of this guidance on the Company's consolidated statement of cash flows will depend on the materiality and timing of any future contingent consideration payments and proceeds from settlement of insurance claims.
In December 2016, the FASB issued ASU No. 2016-19, Technical Corrections and Improvements. The new standard is intended to provide clarity to the Accounting Standards Codification, or ASC, or correct unintended application of the guidance that is not expected to have a significant effect on current accounting practice or create a significant administrative cost to most entities. ASU No. 2016-19 is effective for the Company in annual and interim fiscal reporting periods in 2018 with respect to the amendments that require transition guidance, and early adoption is permitted. All other amendments were effective on issuance. The Company does not believe that adoption of the amendments that require transition guidance will have a material impact on the Company's consolidated financial statements.
In January 2017, the FASB issued ASU No. 2017-04, Intangibles—Goodwill and Other (Topic 350): Simplifying the Test for Goodwill Impairment, to simplify the subsequent measurement of goodwill by eliminating Step 2 from the goodwill impairment test. An entity no longer will determine goodwill impairment by calculating the implied fair value of goodwill by assigning the fair value of a reporting unit to all of its assets and liabilities as if the reporting unit had been acquired in a business combination. Instead, under the amendments in this update, an entity should perform its annual, or interim, goodwill
F-17
MAXLINEAR, INC. NOTES TO CONSOLIDATED FINANCIAL STATEMENTS (in thousands, except per share amounts and percentage data) | ||
impairment test by comparing the fair value of a reporting unit with its carrying amount. The FASB also eliminated the requirements for any reporting unit with a zero or negative carrying amount to perform a qualitative assessment and, if it fails that qualitative test, to perform Step 2 of the goodwill impairment test. The amendments in this update are effective for the Company beginning with fiscal year 2020, including interim periods, with early adoption permitted for interim or annual goodwill impairment tests performed on testing dates after January 1, 2017. The adoption of the amendments in this update is not expected to have a material impact on the Company's consolidated financial position and results of operations.
In May 2017, the FASB issued ASU No. 2017-09, Compensation—Stock Compensation (Topic 718): Scope of Modification Accounting to provide clarity and reduce both (1) diversity in practice and (2) cost and complexity when applying the guidance in Topic 718, Compensation—Stock Compensation, to a change to the terms or conditions of a share-based payment award. The amendments in this update require the Company to account for the effects of a modification in a stock-based award unless the fair value, vesting conditions and classification of the modified award is the same as those of the original award immediately before the original award is modified. If the modification does not affect any of the inputs to the valuation technique that the entity uses to value the award, the entity is not required to estimate the value immediately before and after the modification. The amendments in this update are effective for the Company for fiscal years beginning with fiscal year 2018, including interim periods within those years, with early adoption permitted in any interim period. The amendments in this update should be applied prospectively to an award modified on or after the adoption date. The adoption of this guidance is not expected to have a material impact on the Company's consolidated financial position and results of operations.
In August 2017, the FASB issued ASU 2017-12, Derivatives and Hedging (Topic 815), which is intended to improve accounting for hedging activities by expanding and refining hedge accounting for both nonfinancial and financial risk components and aligning the recognition and presentation of the effects of the hedging instrument and the hedged item in the financial statements. The amendments in this update are effective for the Company for fiscal years beginning with fiscal year 2019, including interim periods within those years, with early adoption permitted in any interim period. The amendments in this update should be applied prospectively. The Company is currently evaluating the expected impact of the amendments, but does not expect these to have a material impact on its consolidated financial statements upon adoption.
In September 2017, the FASB issued ASU No. 2017-13, Revenue Recognition (Topic 605), Revenue from Contracts with Customers (Topic 606), Leases (Topic 840), and Leases (Topic 842): Amendments to SEC Paragraphs Pursuant to the Staff Announcement at the July 20, 2017 EITF Meeting and Rescission of Prior SEC Staff Announcements and Observer Comments. The amendments in this update modify or supersede certain selected SEC paragraphs in the revenue and leases sections of the Codification and moves other paragraphs, upon adoption of ASC Topic 606 or ASC Topic 842. The amendments also provide updated guidance on the effective date of ASC 606, Revenue from Contracts with Customers, and ASC 842, Leases for certain entities that are considered public business entities only because their financial statements or financial information is required to be included in another entity’s SEC filing, but does not change the effective dates for the Company and other public business entities. The amendments in this update should be applied upon adoption of ASC Topics 606 and 842, respectively. The adoption of this guidance is not expected have a material impact on the Company's consolidated financial position and results of operations.
2. Net Income (Loss) Per Share
Basic earnings per share, or EPS, is calculated by dividing net income (loss) by the weighted-average number of common shares outstanding for the period, without consideration for common stock equivalents. Diluted EPS is computed by dividing net income (loss) by the weighted-average number of common shares outstanding for the period and the weighted-average number of dilutive common stock equivalents outstanding for the period determined using the treasury-stock method. For purposes of this calculation, common stock options, restricted stock units and restricted stock awards are considered to be common stock equivalents and are only included in the calculation of diluted EPS when their effect is dilutive. In periods in which the Company has a net loss, dilutive common stock equivalents are excluded from the calculation of diluted EPS.
F-18
MAXLINEAR, INC. NOTES TO CONSOLIDATED FINANCIAL STATEMENTS (in thousands, except per share amounts and percentage data) | ||
The table below presents the computation of basic and diluted earnings per share:
Years Ended December 31, | |||||||||||
2017 | 2016 | 2015 | |||||||||
(in thousands, except per share amounts) | |||||||||||
Numerator: | |||||||||||
Net income (loss) | $ | (9,187 | ) | $ | 61,292 | $ | (42,331 | ) | |||
Denominator: | |||||||||||
Weighted average common shares outstanding—basic | 66,252 | 63,781 | 53,378 | ||||||||
Dilutive common stock equivalents | — | 3,872 | — | ||||||||
Weighted average common shares outstanding—diluted | 66,252 | 67,653 | 53,378 | ||||||||
Net income (loss) per share: | |||||||||||
Basic | $ | (0.14 | ) | $ | 0.96 | $ | (0.79 | ) | |||
Diluted | $ | (0.14 | ) | $ | 0.91 | $ | (0.79 | ) | |||
The Company excluded 0.8 million common stock equivalents resulting from outstanding equity awards for the year ended December 31, 2016 from the calculation of diluted net income per share due to their anti-dilutive nature. For the years ended December 31, 2017 and 2015, the Company incurred net losses and accordingly excluded 4.5 million and 3.0 million common stock equivalents, respectively, which represented all potentially dilutive securities from diluted net loss per share as the impact was anti-dilutive.
3. Business Combinations
Acquisition of Exar Corporation
On May 12, 2017, pursuant to the March 28, 2017 Agreement and Plan of Merger, Eagle Acquisition Corporation, a Delaware corporation and wholly-owned subsidiary of MaxLinear, merged with and into Exar Corporation, or Exar, with Exar surviving as a wholly owned subsidiary of MaxLinear. Under this Agreement and Plan of Merger, the Company agreed to acquire all of Exar's outstanding common stock for $13.00 per share in cash. MaxLinear also assumed certain of Exar's stock-based awards in the merger. MaxLinear paid aggregate cash consideration of $688.1 million including $12.7 million of cash paid to settle certain stock-based awards that were not assumed by MaxLinear in the merger. The Company funded the transaction with cash from the balance sheet of the combined companies, including $235.8 million of cash from Exar, and the net proceeds of approximately $416.8 million from $425.0 million of transaction debt (Note 8).
Exar is a designer and developer of high-performance analog mixed-signal integrated circuits and sub-system solutions. The merger significantly furthers the Company's strategic goals of increasing revenue scale, diversifying revenues by end customers and addressable markets, and expanding its analog and mixed-signal footprint on existing tier-one customer platforms. Exar adds a diverse portfolio of high performance analog and mixed-signal products constituting power management and interface technologies that are ubiquitous functions in wireless and wireline communications infrastructure, broadband access, industrial, enterprise networking, and automotive platforms. The Company intends to leverage combined technological expertise, cross-selling opportunities and distribution channels to significantly expand its serviceable addressable market.
F-19
MAXLINEAR, INC. NOTES TO CONSOLIDATED FINANCIAL STATEMENTS (in thousands, except per share amounts and percentage data) | ||
The following table summarizes the fair value of purchase price consideration to acquire Exar (in thousands):
Acquisition Consideration | Amount | |||
Cash (1) | $ | 688,114 | ||
Fair value of vested stock-based awards assumed (2) | 4,613 | |||
Total | $ | 692,727 | ||
__________________
(1) | Cash consideration paid includes 51,953,635 shares ultimately tendered at $13.00 per share, or an aggregate total of $675.4 million, plus $12.7 million of cash paid to settle certain outstanding stock-based awards which were not assumed by MaxLinear in the merger. |
(2) | MaxLinear assumed certain of Exar's outstanding stock-based awards as part of the merger, and estimated the fair value of such assumed stock-based awards. The portion allocated to purchase price consideration represents the vested assumed stock-based awards. The fair value of the MaxLinear equivalent stock options included in stock-based awards assumed was estimated using the Black-Scholes valuation model utilizing certain assumptions (Note 9). Such assumptions are based on MaxLinear’s best estimates, which impact the fair value of the options calculated under the Black-Scholes methodology and, ultimately, the total consideration recorded for the acquisition. |
The following is an allocation of purchase price as of the May 12, 2017 closing date under the acquisition method of accounting. The purchase price allocation is based upon a preliminary estimate of the fair value of the assets acquired and the liabilities assumed by MaxLinear in the acquisition (in thousands):
Description | Amount | ||
Preliminary purchase price allocation: | |||
Cash | $ | 235,810 | |
Accounts receivable | 11,363 | ||
Inventory | 48,536 | ||
Prepaid expenses and other current assets | 2,288 | ||
Property and equipment | 3,442 | ||
Identifiable intangible assets | 249,500 | ||
Deferred tax assets | 7,493 | ||
Other assets | 5,434 | ||
Accounts payable | (12,385 | ) | |
Accrued expenses and other current liabilities | (10,464 | ) | |
Accrued compensation | (5,253 | ) | |
Other long-term liabilities | (3,030 | ) | |
Identifiable net assets acquired | 532,734 | ||
Goodwill | 159,993 | ||
Total purchase price | $ | 692,727 | |
The fair value of inventories acquired from Exar included an acquisition accounting fair market value step-up of $24.3 million. The Company recognized $24.3 million amortization of Exar inventory step-up in cost of sales in the consolidated statement of operations for the year ended December 31, 2017. Included in other assets in the Exar purchase price allocation is $5.0 million held in escrow pertaining to indemnification obligations under the purchase agreement associated with the November 9, 2016 divestiture of a business unit by Exar (Note 12).
F-20
MAXLINEAR, INC. NOTES TO CONSOLIDATED FINANCIAL STATEMENTS (in thousands, except per share amounts and percentage data) | ||
The following table presents details of the acquired identifiable intangible assets of Exar:
Estimated Useful Life (in years) | Fair Value (in thousands) | |||||
Developed technology | 7.0 | $ | 120,900 | |||
Trademarks and tradenames | 6.0 | 12,100 | ||||
Customer-related intangible | 5.0 | 96,300 | ||||
Product backlog | 0.5 | 3,600 | ||||
Finite-lived intangible assets | 6.0 | 232,900 | ||||
In-process research and development | N/A | 16,600 | ||||
Total intangible assets | $ | 249,500 | ||||
Acquisition of Certain Assets and Assumption of Certain Liabilities of the G.hn business of Marvell Semiconductor, Inc.
On April 4, 2017, the Company consummated the transactions contemplated by a share and asset acquisition agreement with Marvell Semiconductor, Inc., or Marvell, to purchase certain assets and assume certain liabilities of Marvell’s G.hn business, including its Spain legal entity, for aggregate cash consideration of $21.0 million. The Company also hired certain employees of the G.hn business outside of Spain and assumed employment obligations of the Spanish entity acquired, which is now a subsidiary of MaxLinear. The assets acquired include, among other things, patents and other intellectual property, a workforce-in-place and other intangible assets, as well as tangible assets that include but are not limited to production masks and other production related assets, inventory and other property and equipment. The liabilities assumed include, among other things, product warranty obligations and accrued vacation and severance obligations for employees of Marvell that were acquired or hired by the Company upon close of the acquisition. The acquired assets and assumed liabilities, together with the employees who joined MaxLinear and its subsidiaries as a result of the transaction, represent a business as defined in ASC 805, Business Combinations. The Company has integrated the acquired assets and employees into the Company's existing business. The acquisition of the G.hn business expands the Company's footprint in existing connected-home markets including the wired whole-home broadband connectivity market.
The following table summarizes the fair value of purchase price consideration to acquire the G.hn business (in thousands):
Acquisition Consideration | Amount | |||
Cash | $ | 21,000 | ||
F-21
MAXLINEAR, INC. NOTES TO CONSOLIDATED FINANCIAL STATEMENTS (in thousands, except per share amounts and percentage data) | ||
The following is an allocation of purchase price as of the April 4, 2017 closing date under the acquisition method of accounting. The purchase price allocation is based upon an estimate of the fair value of the assets acquired and the liabilities assumed by MaxLinear in the acquisition (in thousands):
Description | Amount | ||
Purchase price allocation: | |||
Inventory | $ | 2,084 | |
Prepaid expenses and other current assets | 147 | ||
Property and equipment | 3,277 | ||
Identifiable intangible assets | 12,600 | ||
Deferred tax assets | 875 | ||
Other assets | 28 | ||
Accounts payable | (1 | ) | |
Accrued expenses | (234 | ) | |
Accrued compensation | (2 | ) | |
Other long-term liabilities | (99 | ) | |
Identifiable net assets acquired | 18,675 | ||
Goodwill | 2,325 | ||
Total purchase price | $ | 21,000 | |
The Company has completed its purchase price allocation accounting associated with this acquisition. The fair value of inventories acquired included an acquisition accounting fair market value step-up of $1.2 million. The Company recognized $1.2 million amortization of inventory step-up in cost of sales in the consolidated statement of operations for the year ended December 31, 2017.
The following table presents details of the acquired identifiable intangible assets of the G.hn business:
Estimated Useful Life (in years) | Fair Value (in thousands) | |||||
Developed technology | 7.0 | $ | 7,100 | |||
Customer-related intangibles | 1.8 | 4,800 | ||||
Covenant not-to-compete | 3.0 | 200 | ||||
Product backlog | 0.8 | 500 | ||||
Total identifiable intangible assets | 4.7 | $ | 12,600 | |||
Assumptions in the Allocations of Purchase Price
Management prepared the purchase price allocations for Exar and the G.hn businesses, and in doing so considered or relied in part upon reports of a third party valuation expert to calculate the fair value of certain acquired assets, which primarily included identifiable intangible assets, inventory, and property and equipment. Estimates of fair value require management to make significant estimates and assumptions which are preliminary and subject to change upon finalization of the valuation analysis. The goodwill recognized is attributable primarily to the acquired workforce, expected synergies, and other benefits that MaxLinear believes will result from integrating the operations of Exar and the G.hn business with the operations of MaxLinear. Certain liabilities and deferred taxes included in the purchase price allocations are based on management's best estimates of the amounts to be paid or settled and based on information available at the time the purchase price allocations were prepared. Adjustments between the preliminary purchase price allocations initially recorded as reflected in the Company’s interim condensed consolidated financial statements as of June 30, 2017 and the amounts reflected as of December 31, 2017 have not been material. Updates to and/or completion of the estimates of certain tax-related assets acquired and liabilities assumed from Exar upon completion of the Company's evaluation of certain income tax positions of Exar may result in changes to the recorded amounts of assets and liabilities, with corresponding adjustments to goodwill amounts in subsequent reporting periods. We expect to complete the purchase price allocation for Exar within 12 months of the acquisition date.
The fair value of the identified intangible assets acquired from Exar and the G.hn business was estimated using an income approach. Under the income approach, an intangible asset's fair value is equal to the present value of future economic
F-22
MAXLINEAR, INC. NOTES TO CONSOLIDATED FINANCIAL STATEMENTS (in thousands, except per share amounts and percentage data) | ||
benefits to be derived from ownership of the asset. Indications of value are developed by discounting future net cash flows to their present value at market-based rates of return. More specifically, the fair value of the developed technology, IPR&D and backlog assets was determined using the multi-period excess earnings method, or MPEEM. MPEEM is an income approach to fair value measurement attributable to a specific intangible asset being valued from the asset grouping’s overall cash-flow stream. MPEEM isolates the expected future discounted cash-flow stream to its net present value. Significant factors considered in the calculation of the developed technology and IPR&D intangible assets were the risks inherent in the development process, including the likelihood of achieving technological success and market acceptance. Each project was analyzed to determine the unique technological innovations, the existence and reliance on core technology, the existence of any alternative future use or current technological feasibility and the complexity, cost, and time to complete the remaining development. Future cash flows for each project were estimated based on forecasted revenue and costs, taking into account the expected product life cycles, market penetration, and growth rates. Developed technology will begin amortization immediately and IPR&D will begin amortization upon the completion of each project. If any of the projects are abandoned, the Company will be required to impair the related IPR&D asset.
In connection with the acquisitions of Exar and the G.hn business, the Company has assumed liabilities related to product quality issues, warranty claims and contract obligations which are included in accrued expenses and other current liabilities in the purchase price allocations above. The Company has also assumed a purchase agreement that includes an indemnification clause from Exar related to a November 9, 2016 business unit divestiture by Exar. Exar’s indemnification obligations for breaches of representations and warranties survive for 12 months from the closing of the divestiture, except for breaches of representations and warranties covering intellectual property, which survive for 18 months, and breaches of representations and warranties of certain fundamental representations, which survive until the expiration of the applicable statute of limitations. The amount of the indemnification could be up to the full purchase price received for breaches of representations and warranties, covenants and other matters under the applicable purchase agreement (Note 12).
Goodwill recorded in connection with the acquisitions of Exar and the G.hn business was $160.0 million and $2.3 million, respectively. The Company does not expect to deduct any of the acquired goodwill for tax purposes.
Proforma Combined Financial Information
The following table presents unaudited pro forma combined financial information for each of the periods presented, as if the 2017 acquisitions of Exar and the G.hn business had occurred at the beginning of fiscal year 2016:
Years Ended December 31, | |||||||
2017 | 2016 | ||||||
(in thousands) | |||||||
Net revenue – proforma combined | $ | 456,822 | $ | 499,801 | |||
Net income (loss) – proforma combined | $ | 16,682 | $ | (42,345 | ) | ||
The following adjustments were included in the unaudited pro forma combined net revenues:
Years Ended December 31, | |||||||
2017 | 2016 | ||||||
(in thousands) | |||||||
Net revenue | $ | 420,318 | $ | 387,832 | |||
Add: Net revenue – acquired businesses | 36,504 | 111,969 | |||||
Net revenues – proforma combined | $ | 456,822 | $ | 499,801 | |||
F-23
MAXLINEAR, INC. NOTES TO CONSOLIDATED FINANCIAL STATEMENTS (in thousands, except per share amounts and percentage data) | ||
The following unaudited adjustments were included in the unaudited pro forma combined net income (loss):
Years Ended December 31, | |||||||
2017 | 2016 | ||||||
(in thousands) | |||||||
Net income (loss) | $ | (9,187 | ) | $ | 61,292 | ||
Add: Results of operations – acquired businesses | (8,916 | ) | (3,417 | ) | |||
Less: Proforma adjustments | |||||||
Depreciation of property and equipment | 1,792 | (645 | ) | ||||
Amortization of intangible assets | (8,045 | ) | (44,075 | ) | |||
Amortization of inventory step-up | 25,557 | (25,557 | ) | ||||
Impairment of intangible assets | — | 1,519 | |||||
Acquisition and integration expenses | 17,342 | (17,342 | ) | ||||
Interest expense | (2,863 | ) | (14,120 | ) | |||
Income taxes | 1,002 | — | |||||
Net income (loss) – proforma combined | $ | 16,682 | $ | (42,345 | ) | ||
Net income (loss) per share – proforma combined: | |||||||
Basic | $ | 0.25 | $ | (0.66 | ) | ||
Diluted | $ | 0.24 | $ | (0.66 | ) | ||
Shares used to compute net income (loss) per share – proforma combined: | |||||||
Basic | 66,252 | 63,781 | |||||
Diluted | 69,665 | 63,781 | |||||
The pro forma combined financial information for the year ended December 31, 2016 includes aggregate non-recurring adjustments of $29.6 million consisting of aggregate amortization of inventory step-up of $25.5 million and amortization of intangible assets of $4.1 million from the Exar and G.hn businesses, for which the related assets have useful lives of less than one year, and excludes impairment of intangible assets of $1.5 million included in Exar's historical results of operations.
The pro forma combined financial information is presented for illustrative purposes only and is not necessarily indicative of the consolidated results of operations of the consolidated business had the acquisitions of Exar and the G.hn business actually occurred at the beginning of fiscal year 2016 or of the results of future operations of the consolidated business. The unaudited pro forma financial information does not reflect any operating efficiencies and cost saving that may be realized from the integration of the acquisitions in the Company's consolidated statements of operations.
For the year ended December 31, 2017, $85.7 million of revenue and $52.0 million of gross profit, excluding $37.8 million of amortization of acquired intangible assets and the inventory fair-value step-up of Exar and the G.hn business since the acquisition dates are included in the Company's consolidated statement of operations. Such amounts exclude revenue of $6.1 million and related gross profit of $4.7 million that would have been recorded by Exar on a sell-through basis had deferred revenue and deferred profit as of the May 12, 2017 acquisition date not been eliminated in the purchase price allocation as a result of acquisition accounting.
Acquisition and integration-related costs of $10.0 million related to the acquisitions of Exar and the G.hn business were included in selling, general, and administrative expenses in the Company's statement of operations for the year ended December 31, 2017.
Acquisition of Certain Assets and Assumption of Certain Liabilities of the Wireless Infrastructure Backhaul Business of Broadcom Corporation
On July 1, 2016, the Company consummated the transactions contemplated by an asset purchase agreement entered into with Broadcom Corporation. The Company paid cash consideration of $80.0 million for the purchase of certain assets of
F-24
MAXLINEAR, INC. NOTES TO CONSOLIDATED FINANCIAL STATEMENTS (in thousands, except per share amounts and percentage data) | ||
Broadcom's wireless infrastructure backhaul business, and the assumption of certain liabilities. The acquired assets and assumed liabilities, together with employees who joined MaxLinear and its subsidiaries as a result of the transaction, represent a business as defined in ASC 805, Business Combinations. The Company has integrated the acquired assets and employees into the Company's existing business. In the year ended December 31, 2017, the Company recorded an adjustment to decrease certain assumed liabilities and a corresponding decrease to goodwill of $0.3 million related to this acquisition (Note 5). The Company has completed its purchase price allocation accounting associated with this acquisition.
Acquisition of Certain Assets and Assumption of Certain Liabilities of the Wireless Infrastructure Access Business of Microsemi Storage Solutions, Inc. (formerly known as PMC-Sierra, Inc.)
On April 28, 2016, the Company entered into an asset purchase agreement with Microsemi Storage Solutions, Inc., formerly known as PMC-Sierra, Inc., or Microsemi, and consummated the transactions contemplated by the asset purchase agreement. The Company paid cash consideration of $21.0 million for the purchase of certain wireless access assets of Microsemi's wireless infrastructure access business, and assumed certain liabilities. The acquired assets and assumed liabilities, together with employees who joined MaxLinear and its subsidiaries as a result of the transaction, represent a business as defined in ASC 805, Business Combinations. The Company has integrated the acquired assets and employees into the Company's existing business.
Acquisition of Entropic Communications, Inc.
On April 30, 2015, the Company completed its acquisition of Entropic Communications, Inc., or Entropic, for aggregate consideration of $289.4 million, which was comprised of the equity value of shares of the Company's common stock that were issued in the transaction of $173.8 million, the portion of outstanding equity awards deemed to have been earned as of April 30, 2015 of $4.5 million and cash of $111.1 million.
Acquisition of Physpeed, Co., Ltd.
On October 31, 2014, the Company acquired 100% of the outstanding common shares of Physpeed Co., Ltd., or Physpeed, a privately held developer of high-speed physical layer interconnect products addressing enterprise and telecommunications infrastructure market applications. The Company paid $9.3 million in cash in exchange for all outstanding shares of capital stock and equity of Physpeed.
The following disclosures regarding this acquisition are for the years ended December 31, 2017, 2016 and 2015.
Earn-Out
The definitive merger agreement also provided for potential earn-out consideration of up to $0.75 million to the former shareholders of Physpeed for the achievement of certain 2015 and 2016 revenue milestones. The contingent earn-out consideration had an estimated fair value of $0.3 million at the date of acquisition. The 2015 earn-out was determined by multiplying $0.375 million by a 2015 revenue percentage that is defined in the definitive merger agreement. The 2016 earn-out is determined by multiplying $0.375 million by a 2016 revenue percentage that is defined in the definitive merger agreement and was fully earned as of December 31, 2016. The fair value of the earn-out was $0.4 million at December 31, 2016 (Note 6). During the year ended December 31, 2017, the Company paid $0.375 million for the 2016 earn out. During the year ended December 31, 2016, the Company paid $0.2 million for the 2015 earn out.
Restricted Stock Units
The Company agreed to grant restricted stock units, or RSUs, under its equity incentive plan to Physpeed continuing employees if certain 2016 revenue targets were met contingent upon continued employment. Qualifying revenues are the net revenues directly attributable to sales of Physpeed products or the Company’s provision of non-recurring engineering services exclusively with respect to the Physpeed products. In February 2017, the Company settled the remaining obligations of $1.6 million related to the 2016 revenue period by issuing 0.86 million restricted stock units and through payment of $0.76 million in cash.
4. Restructuring Activity
From time to time, the Company approves and implements restructuring plans as a result of acquisitions, internal resource alignment, and cost saving measures. Such restructuring plans include terminating employees, vacating certain leased facilities, and cancellation of contracts.
F-25
MAXLINEAR, INC. NOTES TO CONSOLIDATED FINANCIAL STATEMENTS (in thousands, except per share amounts and percentage data) | ||
The following table presents the activity related to the plans, which is included in restructuring charges in the consolidated statements of operations:
Years Ended December 31, | |||||||||||
2017 | 2016 | 2015 | |||||||||
(in thousands) | |||||||||||
Employee separation expenses | $ | 8,353 | $ | 1,038 | $ | 5,533 | |||||
Lease related expenses | 1,025 | 2,264 | 8,163 | ||||||||
Other | 146 | 130 | 390 | ||||||||
$ | 9,524 | $ | 3,432 | $ | 14,086 | ||||||
Included in employee separation expenses for the year ended December 31, 2017 is stock-based compensation from the acceleration of certain stock-based awards we assumed from Exar due to existing change in control provisions upon termination or diminution of authority of former Exar executives of $5.1 million and other severance-related charges of $3.2 million. Lease related and other charges for the 2017 period related to exiting certain redundant facilities. The lease related restructuring charges in the 2016 period include adjustments to the estimates of net present value of the remaining lease obligation associated with certain vacated facilities that are under lease arrangements assumed in connection with the Entropic acquisition, and exiting certain other leased facilities. Restructuring charges in 2015 primarily related to eliminating redundant positions and exiting Entropic facilities. Total sublease income related to leased facilities the Company ceased using was approximately $2.1 million and $1.3 million for the for the years ended December 31, 2017 and 2016, respectively. The Company does not expect to incur additional material costs related to 2017 restructuring plans.
The following table presents a roll-forward of the Company's restructuring liability for the years ended December 31, 2017 and 2016. The restructuring liability is included in accrued expenses and other current liabilities in the consolidated balance sheets.
Employee Separation Expenses | Lease Related Expenses | Other | Total | |||||||||||||
(in thousands) | ||||||||||||||||
Liability as of December 31, 2015 | $ | 75 | $ | 2,030 | $ | 1,311 | $ | 3,416 | ||||||||
Restructuring charges | 1,038 | 2,264 | 130 | 3,432 | ||||||||||||
Cash payments | (1,047 | ) | (4,039 | ) | (1,338 | ) | (6,424 | ) | ||||||||
Non-cash charges | (66 | ) | 244 | (66 | ) | 112 | ||||||||||
Liability as of December 31, 2016 | — | — | 499 | 37 | 536 | |||||||||||
Transfers from deferred rent | — | 4,405 | — | 4,405 | ||||||||||||
Restructuring charges | 8,353 | 1,025 | 146 | 9,524 | ||||||||||||
Assumed in acquisition | — | — | 70 | 70 | ||||||||||||
Cash payments | (2,984 | ) | (2,861 | ) | (146 | ) | (5,991 | ) | ||||||||
Non-cash charges | (5,130 | ) | (375 | ) | — | (5,505 | ) | |||||||||
Liability as of December 31, 2017 | $ | 239 | $ | 2,693 | $ | 107 | $ | 3,039 | ||||||||
5. Goodwill and Intangible Assets
Goodwill
Goodwill arises from the acquisition method of accounting for business combinations and represents the excess of the purchase price over the fair value of the net tangible assets and other identifiable intangible assets acquired. The fair values of net tangible assets and intangible assets acquired are based upon preliminary valuations and the Company's estimates and assumptions are subject to change within the measurement period (potentially up to one year from the acquisition date). During the year ended December 31, 2017, the Company adjusted its allocation of purchase price for the acquisition of the wireless infrastructure backhaul business (Note 3) related to a decrease in an assumed liability and a corresponding decrease in goodwill of $0.3 million, which is reflected in "adjustments" in the table below.
F-26
MAXLINEAR, INC. NOTES TO CONSOLIDATED FINANCIAL STATEMENTS (in thousands, except per share amounts and percentage data) | ||
The following table presents the changes in the carrying amount of goodwill for the periods indicated:
Years Ended December 31, | |||||||
2017 | 2016 | ||||||
(in thousands) | |||||||
Beginning balance | $ | 76,015 | $ | 49,779 | |||
Acquisitions | 162,318 | 26,236 | |||||
Adjustments | (341 | ) | — | ||||
Ending balance | $ | 237,992 | $ | 76,015 | |||
The Company performs an annual goodwill impairment assessment on October 31st each year. In evaluating goodwill, the Company utilizes a two-step quantitative assessment. Step one is the identification of potential impairment. This involves comparing the fair value of each reporting unit, which the Company has determined to be the entity itself, with its carrying amount, including goodwill. If the fair value of a reporting unit exceeds the carrying amount, the goodwill of the reporting unit is considered not impaired and the second step of the impairment test is unnecessary. If the carrying amount of a reporting unit exceeds its fair value, the second step of the impairment test is performed to measure the amount of impairment loss, if any.
The Company determined there were no indications of impairment associated with goodwill. As a result, no goodwill impairment was recognized as of October 31, 2017. In addition to its annual review, the Company performs a test of impairment when indicators of impairment are present. As of December 31, 2017, there were no indications of impairment of the Company's goodwill balances.
Acquired Intangibles
Finite-lived Intangible Assets
The following table sets forth the Company’s finite-lived intangible assets resulting from business acquisitions and other purchases, which continue to be amortized:
December 31, 2017 | December 31, 2016 | ||||||||||||||||||||||||
Weighted Average Useful Life (in Years) | Gross Carrying Amount | Accumulated Amortization | Net Carrying Amount | Gross Carrying Value | Accumulated Amortization | Net Carrying Amount | |||||||||||||||||||
(in thousands) | |||||||||||||||||||||||||
Licensed technology | 3.7 | $ | 2,070 | $ | (575 | ) | $ | 1,495 | $ | 3,311 | $ | (2,957 | ) | $ | 354 | ||||||||||
Developed technology | 6.9 | 241,561 | (39,252 | ) | 202,309 | 77,800 | (13,550 | ) | 64,250 | ||||||||||||||||
Trademarks and trade names | 6.1 | 13,800 | (1,992 | ) | 11,808 | 1,700 | (405 | ) | 1,295 | ||||||||||||||||
Customer relationships | 4.6 | 121,100 | (26,661 | ) | 94,439 | 20,000 | (4,782 | ) | 15,218 | ||||||||||||||||
Covenants non-compete | 3.0 | 1,100 | (506 | ) | 594 | 900 | (156 | ) | 744 | ||||||||||||||||
6.1 | $ | 379,631 | $ | (68,986 | ) | $ | 310,645 | $ | 103,711 | $ | (21,850 | ) | $ | 81,861 | |||||||||||
The following table sets forth amortization expense associated with finite-lived intangible assets, which is included in the consolidated statements of operations as follows:
Years Ended December 31, | ||||||||||||
2017 | 2016 | 2015 | ||||||||||
(in thousands) | ||||||||||||
Cost of net revenue | $ | 25,316 | $ | 8,512 | $ | 4,263 | ||||||
Research and development | 551 | 619 | 679 | |||||||||
Selling, general and administrative | 28,827 | 6,953 | 24,989 | |||||||||
$ | 54,694 | $ | 16,084 | $ | 29,931 | |||||||
F-27
MAXLINEAR, INC. NOTES TO CONSOLIDATED FINANCIAL STATEMENTS (in thousands, except per share amounts and percentage data) | ||
Amortization of finite-lived intangible assets in cost of net revenue in the consolidated statements of operations results primarily from acquired developed technology.
The following table sets forth the Company’s activities related to finite-lived intangible assets resulting from acquisitions, other additions, transfers to developed technology from IPR&D, and the related amortization of acquired finite-lived intangible assets:
Years Ended December 31, | |||||||
2017 | 2016 | ||||||
(in thousands) | |||||||
Beginning balance | $ | 81,861 | $ | 48,155 | |||
Acquisitions | 245,500 | 46,300 | |||||
Other additions | 5,378 | 390 | |||||
Transfers to developed technology from IPR&D | 32,600 | 3,100 | |||||
Amortization | (54,694 | ) | (16,084 | ) | |||
Ending balance | $ | 310,645 | $ | 81,861 | |||
The Company regularly reviews the carrying amounts of its long-lived assets subject to depreciation and amortization, as well as the related useful lives, to determine whether indicators of impairment may exist which warrant adjustments to carrying values or estimated useful lives. An impairment loss is recognized when the sum of the expected future undiscounted net cash flows is less than the carrying amount of the asset. Should impairment exist, the impairment loss is measured based on the excess of the carrying amount of the asset over the asset’s fair value. During the years ended December 31, 2017 and 2016, no impairment losses related to finite-lived intangible assets were recognized.
The following table presents future amortization of the Company’s finite-lived intangible assets at December 31, 2017:
Amortization (in thousands) | |||
2018 | $ | 68,041 | |
2019 | 57,191 | ||
2020 | 56,325 | ||
2021 | 55,542 | ||
2022 | 38,012 | ||
Thereafter | 35,534 | ||
Total | $ | 310,645 | |
Indefinite-lived Intangible Assets
The following table sets forth the Company’s activities related to the indefinite-lived intangible assets resulting from additions to IPR&D through acquisitions, transfers to developed technology from IPR&D and impairment losses:
Years Ended December 31, | |||||||
2017 | 2016 | ||||||
(in thousands) | |||||||
Beginning balance | $ | 22,400 | $ | 3,200 | |||
Acquisitions | 16,600 | 23,600 | |||||
Transfers to developed technology from IPR&D | (32,600 | ) | (3,100 | ) | |||
Impairment losses | $ | (2,000 | ) | $ | (1,300 | ) | |
Ending balance | $ | 4,400 | $ | 22,400 | |||
The Company performs its annual assessment of indefinite-lived intangible assets on October 31 each year or more frequently if events or changes in circumstances indicate that the asset might be impaired utilizing a qualitative test as a precursor to the quantitative test comparing the fair value of the assets with their carrying amount. Based on the qualitative test,
F-28
MAXLINEAR, INC. NOTES TO CONSOLIDATED FINANCIAL STATEMENTS (in thousands, except per share amounts and percentage data) | ||
if it is more likely than not that indicators of impairment exists, the Company proceeds to perform a quantitative analysis. Based on the Company’s assessment as of October 31, 2017, no additional impairment of indefinite-lived intangible assets was recorded during the year ended December 31, 2017. Impairment losses from indefinite lived intangible assets of $2.0 million for the year ended December 31, 2017 was recognized in the three months ended September 30, 2017 and related to a single IPR&D project of Exar, which was abandoned. Impairment losses from indefinite lived intangible assets of $1.3 million for the year ended December 31, 2016 related to the Company's abandonment of IPR&D of the wireless infrastructure access business.
The Company also recorded $21.6 million in IPR&D impairment losses during the year ended December 31, 2015, of which $17.8 million related to partial impairment of an IPR&D asset acquired from Entropic and $3.8 million related to impairment of an IPR&D asset acquired from Physpeed.
6. Financial Instruments
The composition of financial instruments is as follows:
Fair Value at December 31, 2017 | |||
(in thousands) | |||
Assets | |||
Interest rate swap | $ | 734 | |
December 31, 2016 | |||||||||||||||
Amortized Cost | Gross Unrealized | Fair Value | |||||||||||||
Gains | Losses | ||||||||||||||
(in thousands) | |||||||||||||||
Assets | |||||||||||||||
Money market funds | $ | 39,181 | $ | — | $ | — | $ | 39,181 | |||||||
Government debt securities | 28,025 | — | (32 | ) | 27,993 | ||||||||||
Corporate debt securities | 25,923 | — | (7 | ) | 25,916 | ||||||||||
93,129 | — | (39 | ) | 93,090 | |||||||||||
Less amounts included in cash and cash equivalents | (39,181 | ) | — | — | (39,181 | ) | |||||||||
$ | 53,948 | $ | — | $ | (39 | ) | $ | 53,909 | |||||||
Fair Value at December 31, 2016 | |||
(in thousands) | |||
Liabilities | |||
Contingent consideration | $ | 375 | |
As of December 31, 2017, the Company did not hold any investments in securities. As of December 31, 2016, the Company held 25 government and corporate debt securities with an aggregate fair value of $42.2 million that were in an unrealized loss position for less than 12 months. The gross unrealized losses of $0.04 million at December 31, 2016 represent temporary impairments on government and corporate debt securities related to multiple issuers, and were primarily caused by fluctuations in U.S. interest rates. The Company evaluated securities for other-than-temporary impairment on a quarterly basis. Impairment is evaluated considering numerous factors, and their relative significance varies depending on the situation. Factors considered include the length of time and extent to which fair value has been less than the cost basis, the financial condition and near-term prospects of the issuer; including changes in the financial condition of the security’s underlying collateral; any downgrades of the security by a rating agency; nonpayment of scheduled interest, or the reduction or elimination of dividends; as well as our intent and ability to hold the security in order to allow for an anticipated recovery in fair value.
All of the Company’s long-term available-for-sale securities were due between 1 and 2 years as of December 31, 2016.
F-29
MAXLINEAR, INC. NOTES TO CONSOLIDATED FINANCIAL STATEMENTS (in thousands, except per share amounts and percentage data) | ||
The fair values of the Company’s financial instruments are the amounts that would be received in an asset sale or paid to transfer a liability in an orderly transaction between unaffiliated market participants and are recorded using a hierarchical disclosure framework based upon the level of subjectivity of the inputs used in measuring assets and liabilities. The levels are described below:
Level 1: Quoted prices (unadjusted) in active markets that are accessible at the measurement date for assets or liabilities.
Level 2: Observable prices that are based on inputs not quoted on active markets, but corroborated by market data.
Level 3: Unobservable inputs are used when little or no market data is available.
The Company classifies its financial instruments within Level 1 or Level 2 of the fair value hierarchy on the basis of valuations using quoted market prices or alternate pricing sources and models utilizing market observable inputs, respectively. The Company’s money market funds were valued based on quoted prices for the specific securities in an active market and were therefore classified as Level 1. The government and corporate debt securities and interest rate swap have been valued on the basis of valuations provided by third-party pricing services, as derived from standard valuation or pricing models. The pricing services may use a consensus price which is a weighted average price based on multiple sources or mathematical calculations to determine the valuation for a security, or may use market based observable inputs for the interest rate swap over the term of the swap, including one month LIBOR-based yield curves and have been classified as Level 2. The Company reviews Level 2 inputs and fair value for reasonableness and the values may be further validated by comparison to independent pricing sources. In addition, the Company reviews third-party pricing provider models, key inputs and assumptions and understands the pricing processes at its third-party providers in determining the overall reasonableness of the fair value of its Level 2 financial instruments. The Company also considers the risk of nonperformance by assessing the swap counterparty's credit risk in the estimate of fair value of the interest rate swap. As of December 31, 2017 and 2016, the Company has not made any adjustments to the prices obtained from its third party pricing providers. The contingent liability is classified as Level 3 as of December 31, 2016 and is valued using an internal rate of return model. The assumptions used in preparing the internal rate of return model include estimates for future revenues related to Physpeed products and services and a discount factor of 1 at December 31, 2016. The contingent liability was settled in the year ended December 31, 2017. The assumptions used in preparing the internal rate of return model include estimates for outcome if milestone goals are achieved, the probability of achieving each outcome and discount rates. There were no significant changes in any of the unobservable inputs used in the fair value measurement of contingent consideration, and the resultant fair value.
The following table presents a summary of the Company’s financial instruments that are measured on a recurring basis:
Fair Value Measurements at December 31, 2017 | |||||||||||||||
Balance at December 31, 2017 | Quoted Prices in Active Markets for Identical Assets (Level 1) | Significant Other Observable Inputs (Level 2) | Significant Unobservable Inputs (Level 3) | ||||||||||||
(in thousands) | |||||||||||||||
Assets | |||||||||||||||
Interest rate swap | $ | 734 | $ | — | $ | 734 | $ | — | |||||||
F-30
MAXLINEAR, INC. NOTES TO CONSOLIDATED FINANCIAL STATEMENTS (in thousands, except per share amounts and percentage data) | ||
Fair Value Measurements at December 31, 2016 | |||||||||||||||
Balance at December 31, 2016 | Quoted Prices in Active Markets for Identical Assets (Level 1) | Significant Other Observable Inputs (Level 2) | Significant Unobservable Inputs (Level 3) | ||||||||||||
(in thousands) | |||||||||||||||
Assets | |||||||||||||||
Money market funds | $ | 39,181 | $ | 39,181 | $ | — | $ | — | |||||||
Government debt securities | 27,993 | — | 27,993 | — | |||||||||||
Corporate debt securities | 25,916 | — | 25,916 | — | |||||||||||
$ | 93,090 | $ | 39,181 | $ | 53,909 | $ | — | ||||||||
Liabilities | |||||||||||||||
Contingent consideration | $ | 375 | $ | — | $ | — | $ | 375 | |||||||
$ | 375 | $ | — | $ | — | $ | 375 | ||||||||
The following table summarizes the activity in Level 3 financial instruments for contingent consideration:
Fair Value at December 31, | |||||||
2017 | 2016 | ||||||
(in thousands) | |||||||
Contingent consideration (1) | |||||||
Beginning balance | $ | 375 | $ | 395 | |||
Physpeed earn-out payment | (375 | ) | (240 | ) | |||
Loss recognized in earnings (2) | — | 220 | |||||
Ending balance | $ | — | $ | 375 | |||
Net loss for the period included in earnings attributable to contingent consideration held at the end of the period: | $ | — | $ | 220 | |||
______________
(1) | In connection with the acquisition of Physpeed, the Company recorded contingent consideration based upon the expected achievement of certain 2015 and 2016 revenue milestones. Changes to the fair value of contingent consideration due to changes in assumptions used in preparing the valuation model are recorded in selling, general and administrative expense in the statements of operations. |
(2) | Changes to the estimated fair value of contingent consideration were primarily due to revisions to the Company's expectations of earn-out achievement. |
The following table summarizes activity for the interest rate swap:
Fair Value at December 31, | |||||||
2017 | 2016 | ||||||
(in thousands) | |||||||
Interest rate swap asset | |||||||
Beginning balance | $ | — | $ | — | |||
Income recognized in other comprehensive income (loss) | 734 | — | |||||
Ending balance | $ | 734 | $ | — | |||
There were no transfers between Level 1, Level 2 or Level 3 fair value hierarchy categories in the years ended December 31, 2017 and 2016.
F-31
MAXLINEAR, INC. NOTES TO CONSOLIDATED FINANCIAL STATEMENTS (in thousands, except per share amounts and percentage data) | ||
Financial Instruments Not Recorded at Fair Value on a Recurring Basis
Some of the Company’s financial instruments are not measured at fair value on a recurring basis but are recorded at amounts that approximate fair value due to their liquid or short-term nature. Such financial assets and financial liabilities include: cash and cash equivalents, restricted cash, net receivables, certain other assets, accounts payable, accrued expenses, accrued compensation costs, and other current liabilities.
The Company’s long-term debt is not recorded at fair value on a recurring basis, but is measured at fair value for disclosure purposes (Note 8).
7. Balance Sheet Details
Cash, cash equivalents, restricted cash and investments consist of the following:
December 31, 2017 | December 31, 2016 | ||||||
(in thousands) | |||||||
Cash and cash equivalents | $ | 71,872 | $ | 81,086 | |||
Short-term restricted cash | 1,476 | 614 | |||||
Long-term restricted cash | 1,064 | 1,196 | |||||
Total cash, cash equivalents and restricted cash | 74,412 | 82,896 | |||||
Short-term investments | — | 47,918 | |||||
Long-term investments | — | 5,991 | |||||
$ | 74,412 | $ | 136,805 | ||||
Inventory consists of the following:
December 31, 2017 | December 31, 2016 | ||||||
(in thousands) | |||||||
Work-in-process | $ | 21,823 | $ | 13,947 | |||
Finished goods | 31,611 | 12,636 | |||||
$ | 53,434 | $ | 26,583 | ||||
Property and equipment consist of the following:
Useful Life (in Years) | December 31, 2017 | December 31, 2016 | |||||||
(in thousands) | |||||||||
Furniture and fixtures | 5 | $ | 2,105 | $ | 1,983 | ||||
Machinery and equipment | 3 -5 | 33,462 | 27,028 | ||||||
Masks and production equipment | 2 | 11,470 | 9,153 | ||||||
Software | 3 | 4,695 | 3,625 | ||||||
Leasehold improvements | 1 -5 | 14,340 | 11,635 | ||||||
Construction in progress | N/A | 639 | 39 | ||||||
66,711 | 53,463 | ||||||||
Less accumulated depreciation and amortization | (44,053 | ) | (32,914 | ) | |||||
$ | 22,658 | $ | 20,549 | ||||||
Depreciation expense for the years ended December 31, 2017, 2016 and 2015 was $12.0 million, $10.6 million and $10.8 million, respectively.
F-32
MAXLINEAR, INC. NOTES TO CONSOLIDATED FINANCIAL STATEMENTS (in thousands, except per share amounts and percentage data) | ||
Deferred revenue and deferred profit consist of the following:
December 31, 2017 | December 31, 2016 | ||||||
(in thousands) | |||||||
Deferred revenue—rebates | $ | 156 | $ | 464 | |||
Deferred revenue—distributor transactions | 5,341 | 7,987 | |||||
Deferred cost of net revenue—distributor transactions | (1,135 | ) | (2,460 | ) | |||
$ | 4,362 | $ | 5,991 | ||||
Accrued price protection liability consists of the following activity:
Years Ended December 31, | |||||||
2017 | 2016 | ||||||
(in thousands) | |||||||
Beginning balance | $ | 15,176 | $ | 20,026 | |||
Charged as a reduction of revenue | 46,520 | 43,931 | |||||
Reversal of unclaimed rebates | (101 | ) | (1,303 | ) | |||
Payments | (40,024 | ) | (47,478 | ) | |||
Ending balance | $ | 21,571 | $ | 15,176 | |||
Accrued expenses and other current liabilities consist of the following:
December 31, 2017 | December 31, 2016 | ||||||
(in thousands) | |||||||
Accrued technology license payments | $ | 4,500 | $ | 5,850 | |||
Accrued professional fees | 1,497 | 1,620 | |||||
Accrued engineering and production costs | 2,378 | 1,232 | |||||
Accrued restructuring | 3,039 | 536 | |||||
Accrued royalty | 1,206 | 846 | |||||
Accrued leases | 1,105 | 1,560 | |||||
Accrued customer credits | 2,667 | 1,207 | |||||
Other | 3,914 | 3,507 | |||||
$ | 20,306 | $ | 16,358 | ||||
F-33
MAXLINEAR, INC. NOTES TO CONSOLIDATED FINANCIAL STATEMENTS (in thousands, except per share amounts and percentage data) | ||
8. Debt and Interest Rate Swap
Debt
As of December 31, 2017, the carrying amount of the Company's long-term debt consists of the following:
December 31, 2017 | |||
(in thousands) | |||
Principal | $ | 355,000 | |
Less: | |||
Unamortized debt discount | (1,930 | ) | |
Unamortized debt issuance costs | (5,461 | ) | |
Net carrying amount of long-term debt | 347,609 | ||
Less: current portion of long-term debt | — | ||
Long-term debt, non-current portion | $ | 347,609 | |
On May 12, 2017, the Company entered into a credit agreement with certain lenders and a collateral agent in connection with the acquisition of Exar (Note 3). The credit agreement provides for an initial secured term B loan facility (the “Initial Term Loan”) in an aggregate principal amount of $425.0 million. The credit agreement permits the Company to request incremental loans in an aggregate principal amount not to exceed the sum of $160.0 million (subject to adjustments for any voluntary prepayments), plus an unlimited amount that is subject to pro forma compliance with certain secured leverage ratio and total leverage ratio tests. Incremental loans are subject to certain additional conditions, including obtaining additional commitments from the lenders then party to the credit agreement or new lenders.
Loans under the credit agreement bear interest, at the Company’s option, at a rate equal to either (i) a base rate equal to the highest of (x) the federal funds rate, plus 0.50%, (y) the prime rate then in effect and (z) an adjusted LIBOR rate determined on the basis of a one- three- or six-month interest period, plus 1.0% or (ii) an adjusted LIBOR rate, subject to a floor of 0.75%, in each case, plus an applicable margin of 2.50% in the case of LIBOR rate loans and 1.50% in the case of base rate loans. Commencing on September 30, 2017, the Initial Term Loan will amortize in equal quarterly installments equal to 0.25% of the original principal amount of the Initial Term Loan, with the balance payable on the maturity date. The Initial Term Loan has a term of seven years and will mature on May 12, 2024, at which time all outstanding principal and accrued and unpaid interest on the Initial Term Loan must be repaid. The Company is also required to pay fees customary for a credit facility of this size and type.
The Company is required to make mandatory prepayments of the outstanding principal amount of term loans under the credit agreement with the net cash proceeds from the disposition of certain assets and the receipt of insurance proceeds upon certain casualty and condemnation events, in each case, to the extent not reinvested within a specified time period, from excess cash flow beyond stated threshold amounts, and from the incurrence of certain indebtedness. The Company has the right to prepay its term loans under the credit agreement, in whole or in part, at any time without premium or penalty, subject to certain limitations and a 1.0% soft call premium applicable during the first six months for the loan term. The Company exercised its right to prepay and made aggregate prepayments of principal of $70.0 million in the year ended December 31, 2017.
The Company’s obligations under the credit agreement are required to be guaranteed by certain of its domestic subsidiaries meeting materiality thresholds set forth in the credit agreement. Such obligations, including the guaranties, are secured by substantially all of the assets of the Company and the subsidiary guarantors pursuant to a security agreement with the collateral agent.
The credit agreement contains customary affirmative and negative covenants, including covenants limiting the ability of the Company and its restricted subsidiaries to, among other things, incur debt, grant liens, undergo certain fundamental changes, make investments, make certain restricted payments, and sell assets, in each case, subject to limitations and exceptions. As of December 31, 2017, the Company was in compliance with such covenants. The credit agreement also contains customary events of default that include, among other things, certain payment defaults, cross defaults to other indebtedness, covenant defaults, change in control defaults, judgment defaults, and bankruptcy and insolvency defaults. If an event of default exists, the lenders may require immediate payment of all obligations under the credit agreement, and may
F-34
MAXLINEAR, INC. NOTES TO CONSOLIDATED FINANCIAL STATEMENTS (in thousands, except per share amounts and percentage data) | ||
exercise certain other rights and remedies provided for under the credit agreement, the other loan documents and applicable law.
For the year ended December 31, 2017, the weighted average effective interest rate on long-term debt was approximately 4.1%.
The debt is carried at its principal amount, net of unamortized debt discount and issuance costs, and is not adjusted to fair value each period. The issuance date fair value of the liability component of the debt in the amount of $398.5 million was determined using a discounted cash flow analysis, in which the projected interest and principal payments were discounted back to the issuance date of the term loan at a market interest rate for nonconvertible debt of 4.6%, which represents a Level 3 fair value measurement. The debt discount of $2.1 million and debt issuance costs of $6.0 million are being amortized to interest expense using the effective interest method from the issuance date through the contractual maturity date of the term loan of May 12, 2024. During the year ended December 31, 2017, the Company recognized amortization of debt discount of $0.2 million and debt issuance costs of $0.6 million to interest expense. The approximate fair value of the term loan as of December 31, 2017 was $360.0 million, which was estimated on the basis of inputs that are observable in the market and which is considered a Level 2 measurement method in the fair value hierarchy.
As of December 31, 2017, the remaining principal balance on the term loan of $355 million is due on May 12, 2024 at the maturity date on the term loan.
Interest Rate Swap
In November 2017, the Company entered into a fixed-for-floating interest rate swap with an amortizing notional amount to swap a substantial portion of variable rate LIBOR interest payments under its term loans for fixed interest payments bearing an interest rate of 1.74685%. The Company's outstanding debt is still subject to a 2.5% fixed applicable margin during the term of the loan. The interest rate swap is designated as a cash flow hedge of a portion of floating rate interest payments on long-term debt and effectively fixes the interest rate on a substantial portion of the Company’s long-term debt at approximately 4.25%. Accordingly, the Company applies cash flow hedge accounting to the interest rate swap and it is recorded at fair value as an asset or liability and the effective portion of changes in the fair value of the interest rate swap, as measured quarterly, are reported in other comprehensive income (loss). As of December 31, 2017, the fair value of the interest rate swap asset was $0.7 million (Note 6) and is included in other long-term assets in the consolidated balance sheet. The increase in fair value related to the interest rate swap asset included in other comprehensive income for the year ended December 31, 2017 was $0.7 million. The interest rate swap expires in October 2020 and the total $0.7 million of unrealized gain recorded in accumulated other comprehensive income at December 31, 2017 is not expected to be recorded as interest expense over the next twelve months.
9. Stock-Based Compensation and Employee Benefit Plans
Common Stock
As of December 31, 2017, 67,400,379 shares of common stock were issued and outstanding. As of December 31, 2016, 58,363,482 shares of Class A common stock and 6,668,380 shares of Class B common stock were issued and outstanding.
On March 29, 2017, each share of the Company’s then outstanding Class A common stock and Class B common stock automatically converted into a single class of common stock pursuant to the terms of the Company’s Amended and Restated Certificate of Incorporation. Also on March 29, 2017, the shares underlying outstanding stock options, restricted stock units and restricted stock awards automatically converted to rights to receive shares of a single class of common stock. The conversion had no impact on the total number of issued and outstanding shares of capital stock; the Class A shares and Class B shares converted into an equivalent number of shares of common stock. The board of directors approved a reduction in the Company’s total number of authorized shares of capital stock by 65,445,853 from 1,575,000,000 to 1,509,554,147 to account for the 58,876,053 shares of Class A common stock and 6,569,800 shares of Class B common stock retired upon conversion, such that the authorized number of shares of Class A common stock is 441,123,947 and the authorized number of shares of Class B common stock is 493,430,200. No additional Class A shares or Class B shares will be issued following the conversion. The authorized number of shares of common stock and preferred stock remain unchanged at 550,000,000 shares and 25,000,000 shares, respectively.
Following the conversion, each share of common stock is entitled to one vote per share and otherwise has the same designations, rights, powers and preferences as the Class A common stock prior to the conversion. In addition, holders of the common stock vote as a single class of stock on any matter that is submitted to a vote of stockholders. Prior to the conversion, the holders of the Company’s Class A and Class B common stock had identical voting rights, except that holders of Class A common stock were entitled to one vote per share and holders of Class B common stock were entitled to ten votes per share with respect
F-35
MAXLINEAR, INC. NOTES TO CONSOLIDATED FINANCIAL STATEMENTS (in thousands, except per share amounts and percentage data) | ||
to transactions that would result in a change of control of the Company or that relate to the Company’s equity incentive plans. In addition, holders of Class B common stock had the exclusive right to elect two members of the Company’s Board of Directors, each referred to as a Class B Director. The shares of Class B common stock were not publicly traded. Each share of Class B common stock was convertible at any time at the option of the holder into one share of Class A common stock and in most instances automatically converted upon sale or other transfer.
Employee Benefit Plans
At December 31, 2017, the Company had stock-based compensation awards outstanding under the following plans: the 2004 Stock Plan, the 2010 Equity Incentive Plan, as amended, or 2010 Plan, and the 2010 Employee Stock Purchase Plan, or ESPP, and plans under which equity incentive awards were assumed in connection with the acquisitions of Entropic in 2015 and Exar Corporation in 2017. All current stock awards are issued under the 2010 Plan and ESPP.
2010 Equity Incentive Plan
The 2010 Plan provides for the grant of incentive stock options, non-statutory stock options, restricted stock awards, restricted stock unit awards, stock appreciation rights, performance-based stock awards, and other forms of equity compensation, or collectively, stock awards. The aggregate number of shares of common stock that may be issued pursuant to stock awards under the 2010 Plan will increase by any shares subject to stock options or other awards granted under the 2004 Stock Plan that expire or otherwise terminate without having been exercised in full and shares issued pursuant to awards granted under the 2004 Stock Plan that are forfeited to or repurchased by the Company. In addition, the number of shares of common stock reserved for issuance will automatically increase on the first day of each fiscal year, equal to the lesser of: 2,583,311 shares of the Company’s common stock; four percent (4%) of the outstanding shares of the Company’s common stock on the last day of the immediately preceding fiscal year; or such lesser amount as the Company’s board of directors may determine. Options granted will generally vest over a four year period and the term can be from seven to ten years. As of December 31, 2017, the number of shares reserved for issuance under the 2010 Plan is 11,956,531 shares.
2010 Employee Stock Purchase Plan
The ESPP authorizes the issuance of shares of the Company’s common stock pursuant to purchase rights granted to the Company’s employees. The number of shares of the Company’s common stock reserved for issuance will automatically increase on the first day of each fiscal year, equal to the least of: 968,741 shares of the Company’s common stock; one and a quarter percent (1.25%) of the outstanding shares of the Company’s common stock on the first day of the fiscal year; or such lesser amount as may be determined by the Company's board of directors or a committee appointed by the Company's board of directors to administer the ESPP. The ESPP is implemented through a series of offerings of purchase rights to eligible employees. Under the ESPP, the Company may specify offerings with a duration of not more than 27 months, and may specify shorter purchase periods within each offering. Each offering will have one or more purchase dates on which shares of the Company’s common stock will be purchased for employees participating in the offering. An offering may be terminated under certain circumstances. Generally, all regular employees, including executive officers, employed by the Company may participate in the ESPP and may contribute up to 15% of their earnings for the purchase of the Company’s common stock under the ESPP. Unless otherwise determined by the Company’s board of directors, common stock will be purchased for accounts of employees participating in the ESPP at a price per share equal to the lower of (a) 85% of the fair market value of a share of the Company’s common stock on the first date of an offering or (b) 85% of the fair market value of a share of the Company’s common stock on the date of purchase. As of December 31, 2017, the number of shares of common stock reserved for issuance under the ESPP is 1,714,141 shares.
F-36
MAXLINEAR, INC. NOTES TO CONSOLIDATED FINANCIAL STATEMENTS (in thousands, except per share amounts and percentage data) | ||
Employee Incentive Bonus
In May 2013, the Company's compensation committee amended its Executive Incentive Bonus Plan to permit the settlement of awards under the plan in any combination of cash or shares of its common stock. Additionally, the Company settles a majority of bonus awards for all other employees in common stock. When bonus awards are settled in common stock issued under the 2010 Plan, the number of shares issuable to plan participants is determined based on the closing sales price of the Company's common stock as determined in trading on the New York Stock Exchange on the date approved by the Board of Directors. In February 2017, the Company issued 0.2 million freely-tradable shares of its Class A common stock in settlement of bonus awards to employees, including executives, for the July 1, 2016 to December 31, 2016 performance period. In August 2016, the Company issued 0.2 million freely-tradable shares of its Class A common stock in settlement of bonus awards to employees, including executives, for the January 1, 2016 to June 30, 2016 performance period. In May 2016, the Company issued 0.2 million shares of its Class A common stock in settlement of bonus awards to employees, including executives, for the July 1, 2015 to December 31, 2015 performance period. In August 2015, the Company issued 0.3 million freely-tradable shares of our Class A common stock in settlement of bonus awards to employees, including executives, for the January 1, 2015 to June 30, 2015 performance period. At December 31, 2017, an accrual of $7.1 million was recorded for bonus awards for employees for the January 1, 2017 to December 31, 2017 performance period, which the Company intends to settle in shares of its common stock to be issued under its 2010 Equity Incentive Plan, as amended, with the number of shares issuable to plan participants determined based on the closing sales price of the Company’s common stock as determined in trading on the New York Stock Exchange at a date to be determined. The Company's compensation committee retains discretion to effect payment in cash, stock, or a combination of cash and stock.
Stock-Based Compensation
Stock-based compensation expense is classified in the consolidated statements of operations based on the department to which the related employee reports. The Company recognized stock-based compensation in the statements of operations as follows:
Years Ended December 31, | |||||||||||
2017 | 2016 | 2015 | |||||||||
(in thousands) | |||||||||||
Cost of net revenue | $ | 332 | $ | 210 | $ | 213 | |||||
Research and development | 16,190 | 14,403 | 13,205 | ||||||||
Selling, general and administrative | 11,016 | 7,152 | 5,850 | ||||||||
Restructuring expense | 5,130 | — | — | ||||||||
$ | 32,668 | $ | 21,765 | $ | 19,268 | ||||||
The total unrecognized compensation cost related to unvested restricted stock units and restricted stock awards as of December 31, 2017 was $52.9 million, and the weighted average period over which these equity awards are expected to vest is 2.50 years. The total unrecognized compensation cost related to unvested stock options as of December 31, 2017 was $6.4 million, and the weighted average period over which these equity awards are expected to vest is 1.90 years.
Restricted Stock Units and Restricted Stock Awards
The Company calculates the fair value of restricted stock units and restricted stock awards based on the fair market value of the Company’s common stock (formerly Class A common stock) on the grant date. Stock-based compensation expense is recognized over the vesting period using the straight-line method.
F-37
MAXLINEAR, INC. NOTES TO CONSOLIDATED FINANCIAL STATEMENTS (in thousands, except per share amounts and percentage data) | ||
A summary of the Company’s restricted stock unit and restricted stock award activity for the year ended December 31, 2017 is as follows:
Number of Shares (in thousands) | Weighted-Average Grant-Date Fair Value per Share | |||||
Outstanding at December 31, 2016 | 3,670 | $ | 14.67 | |||
Granted | 1,514 | 27.11 | ||||
Assumed in acquisition | 250 | 31.12 | ||||
Vested | (1,763 | ) | 16.21 | |||
Canceled | (488 | ) | 20.36 | |||
Outstanding at December 31, 2017 | 3,183 | 20.13 | ||||
Employee Stock Purchase Rights and Stock Options
The Company uses the Black-Scholes valuation model to calculate the fair value of employee stock purchase rights and stock options granted to employees. Stock-based compensation expense is recognized over the vesting period using the straight-line method.
During the year ended December 31, 2017, there were 216,302 shares of common stock purchased under the ESPP at a weighted average price of$19.71.
Employee Stock Purchase Rights
The fair values of employee stock purchase rights were estimated at their respective grant date using the following assumptions:
Years Ended December 31, | ||||||||
2017 | 2016 | 2015 | ||||||
Weighted-average grant date fair value per share | $6.20 - $7.46 | $5.85 - $6.20 | $2.25 - $5.02 | |||||
Risk-free interest rate | 0.60 - 1.39% | 0.38 - 0.6% | 0.09 - 0.33% | |||||
Dividend yield | — | % | — | % | — | % | ||
Expected term (in years) | 0.38 - 0.50 | 0.50 | 0.50 | |||||
Volatility | 29.56 - 49.94% | 49.94 - 53.94% | 32.65 - 59.14% | |||||
Stock Options
A summary of the Company’s stock option activity for the year ended December 31, 2017 is as follows:
Number of Options (in thousands) | Weighted-Average Exercise Price | Weighted-Average Contractual Term (in years) | Aggregate Intrinsic Value (in thousands) | |||||||||
Outstanding at December 31, 2016 | 3,025 | $ | 6.78 | |||||||||
Assumed in acquisition | 1,135 | 17.44 | ||||||||||
Exercised | (835 | ) | 9.42 | |||||||||
Canceled | (255 | ) | 19.50 | |||||||||
Outstanding at December 31, 2017 | 3,069 | $ | 8.95 | 2.58 | $ | 53,686 | ||||||
Vested and expected to vest at December 31, 2017 | 3,025 | $ | 8.84 | 2.54 | $ | 53,243 | ||||||
Exercisable at December 31, 2017 | 2,613 | $ | 7.86 | 2.17 | $ | 48,548 | ||||||
No stock options were granted by the Company during the year ended December 31, 2017. On May 12, 2017, the Company assumed certain stock options and restricted stock units from Exar. The Company estimated the fair value of such assumed equity awards, of which the vested portion was allocated to purchase price (Note 3) and the unvested portion allocated
F-38
MAXLINEAR, INC. NOTES TO CONSOLIDATED FINANCIAL STATEMENTS (in thousands, except per share amounts and percentage data) | ||
to future unrecognized compensation expense to be recognized over the remaining service period of the awards. The fair value of assumed stock options were estimated at the acquisition date using the following assumptions:
Year Ended December 31, | |||
2017 | |||
Weighted-average grant date fair value per share | $ | 31.12 | |
Risk-free interest rate | 1.29% - 1.99% | ||
Dividend yield | — | % | |
Expected term (in years) | 1.6 - 6.0 | ||
Volatility | 45.39% - 50.32% | ||
The risk-free interest rate assumption was based on the United States Treasury’s rates for U.S. Treasury zero-coupon bonds with maturities similar to those of the expected term of the award being valued. The assumed dividend yield was based on the Company’s expectation of not paying dividends in the foreseeable future. The expected term of the option is based on the remaining vesting period and contractual term of the options, using the simplified method, which was selected due to the Company's limited history of stock option exercises. Estimated volatility incorporates historical volatility over the expected term based on the Company's daily closing stock prices.
The intrinsic value of stock options exercised during 2017, 2016 and 2015 was $16.3 million, $6.5 million, and $6.6 million, respectively. Cash received from exercise of stock options was $7.9 million, $3.6 million and $8.2 million during the years ended December 31, 2017, 2016 and 2015, respectively. The tax benefit from stock options exercised was $11.9 million, $5.7 million, and $6.1 million during the years ended December 31, 2017, 2016 and 2015, respectively.
10. Income Taxes
The domestic and international components of income (loss) before income tax provision (benefit) are presented as follows:
Years Ended December 31, | |||||||||||
2017 | 2016 | 2015 | |||||||||
(in thousands) | |||||||||||
Domestic | $ | 42,580 | $ | 75,778 | $ | (44,094 | ) | ||||
Foreign | (76,578 | ) | (12,088 | ) | 1,188 | ||||||
Income (loss) before income taxes | $ | (33,998 | ) | $ | 63,690 | $ | (42,906 | ) | |||
F-39
MAXLINEAR, INC. NOTES TO CONSOLIDATED FINANCIAL STATEMENTS (in thousands, except per share amounts and percentage data) | ||
The income tax provision (benefit) consists of the following:
Years Ended December 31, | |||||||||||
2017 | 2016 | 2015 | |||||||||
(in thousands) | |||||||||||
Current: | |||||||||||
Federal | $ | 13,470 | $ | 1,216 | $ | — | |||||
State | 26 | (11 | ) | 16 | |||||||
Foreign | 1,784 | 1,092 | 942 | ||||||||
Total current | 15,280 | 2,297 | 958 | ||||||||
Deferred: | |||||||||||
Federal | 19,451 | 17,492 | (13,759 | ) | |||||||
State | (4,668 | ) | (8,271 | ) | (1,034 | ) | |||||
Foreign | (3,697 | ) | (2,459 | ) | 126 | ||||||
Valuation allowance release due to acquisition | — | — | (1,757 | ) | |||||||
Change in valuation allowance | (51,177 | ) | (6,661 | ) | 14,891 | ||||||
Total deferred | (40,091 | ) | 101 | (1,533 | ) | ||||||
Total income tax provision (benefit) | $ | (24,811 | ) | $ | 2,398 | $ | (575 | ) | |||
The actual income tax provision (benefit) differs from the amount computed using the federal statutory rate as follows:
Years Ended December 31, | |||||||||||
2017 | 2016 | 2015 | |||||||||
(in thousands) | |||||||||||
Provision (benefit) at statutory rate | $ | (11,899 | ) | $ | 22,294 | $ | (14,588 | ) | |||
State income taxes (net of federal benefit) | 17 | (13 | ) | 275 | |||||||
Research and development credits | (8,153 | ) | (9,076 | ) | (2,083 | ) | |||||
Foreign rate differential | 23,666 | 2,888 | (62 | ) | |||||||
Stock compensation | (5,713 | ) | (5,756 | ) | 549 | ||||||
Foreign deemed dividend | — | 51 | 279 | ||||||||
Transaction costs | 553 | 749 | 1,329 | ||||||||
Uncertain tax positions | 1,993 | (1,204 | ) | 600 | |||||||
Foreign tax credits | (5 | ) | (72 | ) | (144 | ) | |||||
Permanent and other | 813 | (802 | ) | 96 | |||||||
Foreign unremitted earnings | (1,368 | ) | — | — | |||||||
Tax Act | 25,205 | — | — | ||||||||
Other tax rate changes | 1,257 | — | — | ||||||||
Valuation allowance release due to acquisition | — | — | (1,757 | ) | |||||||
Valuation allowance | (51,177 | ) | (6,661 | ) | 14,931 | ||||||
Total income tax provision (benefit) | $ | (24,811 | ) | $ | 2,398 | $ | (575 | ) | |||
F-40
MAXLINEAR, INC. NOTES TO CONSOLIDATED FINANCIAL STATEMENTS (in thousands, except per share amounts and percentage data) | ||
The components of the deferred income tax assets are as follows:
December 31, | |||||||
2017 | 2016 | ||||||
(in thousands) | |||||||
Deferred tax assets: | |||||||
Net operating loss carryforwards | $ | 77,355 | $ | 19,524 | |||
Research and development credits | 69,668 | 58,170 | |||||
Accrued expenses and other | 10,506 | 13,387 | |||||
Accrued compensation | 2,444 | 2,073 | |||||
Stock-based compensation | 2,659 | 3,451 | |||||
Intangible assets | — | 8,575 | |||||
162,632 | 105,180 | ||||||
Less valuation allowance | (84,560 | ) | (100,284 | ) | |||
78,072 | 4,896 | ||||||
Deferred tax liabilities: | |||||||
Fixed assets | (1,777 | ) | (2,202 | ) | |||
Intangible assets | (35,981 | ) | — | ||||
Unremitted foreign earnings | (436 | ) | (2,909 | ) | |||
Net deferred tax assets (liabilities) | $ | 39,878 | $ | (215 | ) | ||
At December 31, 2017, the Company had federal, state and foreign tax net operating loss carryforwards of approximately $301.7 million, $106.3 million and $88.1 million, respectively. The federal, state and foreign tax loss carryforwards will begin to expire in 2020, 2018 and 2022 respectively, unless previously utilized.
At December 31, 2017, the Company had federal, state and foreign tax credit carryforwards of approximately $31.8 million, $81.4 million and $5.2 million, respectively. The federal and foreign tax credit carryforwards will begin to expire in 2023 and 2018 respectively, unless previously utilized. The state tax credit carryforwards do not expire. The Company also has foreign incentive deductions of approximately $22.0 million that do not expire.
In addition, the Company has federal alternative minimum tax credit carryforwards of approximately $1.4 million that will be refundable in future years, due to the Tax Cuts and Jobs Act described below.
The Company utilizes the asset and liability method of accounting for income taxes, under which deferred taxes are determined based on temporary differences between the financial statement and tax basis of assets and liabilities using tax rates expected to be in effect during the years in which the temporary differences reverse. The Company records a valuation allowance to reduce its deferred taxes to the amount it believes is more likely than not to be realized. In making such determination, the Company considers all available positive and negative evidence quarterly, including scheduled reversals of deferred tax liabilities, projected future taxable income, tax planning strategies, and recent financial performance. Forming a conclusion that a valuation allowance is not required is difficult when there is negative evidence such as cumulative losses in recent years. Based upon the Company's review of all positive and negative evidence, the Company released the valuation allowance against certain of its federal deferred tax assets during the year ended December 31, 2017. Of the federal valuation allowance of $61.6 million as of December 31, 2016, the Company released $51.2 million during the year ended December 31, 2017. The Company continues to have a valuation allowance on its state deferred taxes, certain of its federal deferred tax assets, and certain foreign deferred tax assets in jurisdictions where the Company has cumulative losses or otherwise is not expected to utilize certain tax attributes. The Company does not incur expense or benefit in certain tax free jurisdictions in which it operates.
Income tax positions must meet a more-likely-than-not threshold to be recognized. Income tax positions that previously failed to meet the more-likely-than-not threshold are recognized in the first subsequent financial reporting period in which that threshold is met. Previously recognized tax positions that no longer meet the more-likely-than-not threshold are derecognized in the first financial reporting period in which that threshold is no longer met. The Company records potential penalties and interest accrued related to unrecognized tax benefits within the consolidated statements of operations as income tax expense. At December 31, 2017, the Company’s unrecognized tax benefits totaled $63.1 million, $50.6 million of which, if recognized at a
F-41
MAXLINEAR, INC. NOTES TO CONSOLIDATED FINANCIAL STATEMENTS (in thousands, except per share amounts and percentage data) | ||
time when the valuation allowance no longer exists, would affect the effective tax rate. At December 31, 2017, the Company had accrued approximately $1.6 million of interest and penalties. The Company does not expect its unrecognized tax benefits to change significantly over the next 12 months, other than through potential adjustments that could result from the evaluation of certain income tax positions in finalizing the purchase accounting for Exar (Note 3).
The following table summarizes the changes to the unrecognized tax benefits during 2017, 2016 and 2015:
(in thousands) | |||
Balance as of December 31, 2014 | $ | 10,808 | |
Additions based on tax positions related to the current year | 2,585 | ||
Additions related to acquisition | 13,733 | ||
Decreases based on tax positions of prior year | (1,073 | ) | |
Balance as of December 31, 2015 | $ | 26,053 | |
Additions based on tax positions related to the current year | 2,025 | ||
Decreases based on tax positions of prior year | (4,661 | ) | |
Balance as of December 31, 2016 | $ | 23,417 | |
Additions based on tax positions related to the current year | 3,037 | ||
Additions related to acquisitions | 37,090 | ||
Decreases based on tax positions of prior year | (458 | ) | |
Balance as of December 31, 2017 | $ | 63,086 | |
The Company is subject to federal and state income tax in the United States and is also subject to income tax in certain other foreign tax jurisdictions. At December 31, 2017, the statutes of limitations for the assessment of federal, state, and foreign income taxes are closed for the years before 2014, 2013 and 2010, respectively.
In April 2017, the Company's subsidiary in Singapore began operating under certain tax incentives in Singapore, which are generally effective through March 2022, and are conditional upon meeting certain employment and investment thresholds in Singapore. Under the incentives, qualifying income derived from certain sales of the Company's integrated circuits is taxed at a concessionary rate over the incentive period, and there are reduced Singapore withholding taxes on certain intercompany royalties during the incentive period. Primarily because of the Company's Singapore net operating losses and a full valuation allowance in Singapore, the incentives did not have a material impact on the Company's income tax expense in 2017.
On December 22, 2017, the U.S. government enacted comprehensive tax legislation commonly referred to as the Tax Cuts and Jobs Act, or the Tax Act. Changes include, but are not limited to, a corporate tax rate decrease from 35% to 21% effective for tax years beginning in 2018, the transition of U.S international taxation from a worldwide tax system to a territorial system, which includes a new federal tax on global intangible low-taxed income (Global Minimum Tax or GMT), and a one-time transition tax on the mandatory deemed repatriation of cumulative foreign earnings as of December 31, 2017. The Company has calculated its best estimate of the impact of the Tax Act in its 2017 income tax benefit in accordance with its understanding of the Tax Act and guidance available as of the date of this filing.
In addition, the SEC Staff issued SAB 118, which provides guidance on accounting for the tax effects of the Tax Act. SAB 118 provides a measurement period that should not extend beyond one year from the Tax Act enactment date for companies to complete the accounting under ASC 740. In accordance with SAB 118, a company must reflect the income tax effects of those aspects of the Act for which the accounting under ASC 740 is complete. To the extent that a company’s accounting for certain income tax effects of the Tax Act is incomplete but it is able to determine a reasonable estimate, it must record a provisional estimate in the financial statements. If a company cannot determine a provisional estimate to be included in the financial statements, it should continue to apply ASC 740 on the basis of the provisions of the tax laws that were in effect immediately before the enactment of the Tax Act.
The Company's accounting for the following elements of the Tax Act is incomplete. However, the Company was able to make reasonable estimates of certain effects and, therefore, recorded provisional adjustments. The provisional amounts described below are subject to revisions as the Company completes its analysis of the Tax Act, collects and prepares necessary data, and interprets any additional guidance issued by the U.S. Treasury Department, Internal Revenue Service, or IRS, FASB, and other standard-setting and regulatory bodies. Adjustments to the provisional amounts may materially impact the
F-42
MAXLINEAR, INC. NOTES TO CONSOLIDATED FINANCIAL STATEMENTS (in thousands, except per share amounts and percentage data) | ||
Company's consolidated income tax provision (benefit) and effective tax rates in the period(s) in which such adjustments are made. The Company's accounting for the tax effects of the Tax Act will be completed during the one-year measurement period.
Reduction of US federal corporate tax rate: For certain of its deferred tax assets and liabilities, the Company has recorded a provisional decrease of $15.7 million, with a corresponding net adjustment to deferred income tax expense of $15.7 million for the year ended December 31, 2017. This is net of a related provisional reduction in valuation allowance of $8.7 million. This provisional estimate may be affected by other analyses related to the Tax Act, including, but not limited to, the Company's calculation of deemed repatriation of deferred foreign income and the state tax effect of adjustments made to federal temporary differences, the deductibility of amounts related to covered officers and adjustments to temporary differences, as well as changes to the Company's valuation allowance and effects related to the finalization of purchase accounting for Exar.
Deemed Repatriation Transition Tax: The Company recorded approximately $0.8 million for the transition tax, which may generally be paid over eight years. However, the Company is continuing to gather additional information, awaiting additional guidance from the relevant authorities, and performing additional analyses to more precisely determine past earnings and foreign tax amounts and will update this provisional estimate when such work is completed within the one-year measurement period.
Valuation allowances: The Company must assess whether its valuation allowance analyses are affected by various aspects of the Tax Act (e.g., deemed repatriation of deferred foreign income, GMT inclusions, new categories of FTCs). Since, as discussed herein, the Company has recorded provisional amounts related to certain portions of the Tax Act, any corresponding determination of the need for or change in a valuation allowance is also provisional.
Beginning in 2018, the Tax Act generally provides a 100% federal deduction for dividends received from foreign subsidiaries. Nevertheless, companies must still apply the guidance of ASC Topic 740 to account for the tax consequences of outside basis differences and other tax impacts of their investments in non-U.S. subsidiaries, including potential foreign withholding taxes on distributions. While the Company has recorded a provisional amount for the federal transition tax on the deemed repatriated earnings that were previously indefinitely reinvested, the Company was unable to determine a reasonable estimate of the remaining tax liability, if any, under the Tax Act for its remaining outside basis differences or to evaluate how the Tax Act will affect the Company's existing accounting position to indefinitely reinvest unremitted foreign earnings. Therefore, the Company has not included a provisional amount for this item in its consolidated financial statements for fiscal 2017. The Company will record amounts, as necessary, for this item beginning in the first reporting period during the measurement period in which the Company obtains necessary information and is able to analyze and prepare a reasonable estimate.
Under U.S. GAAP, the Company is allowed to make an accounting policy choice with respect to the GMT of either (1) treating taxes due on future U.S. inclusions in taxable income related to GMT as a current-period expense when incurred or (2) as a component of deferred income taxes. The Company will make its accounting policy election for this item when its analysis is complete, during the measurement period.
11. Employee Retirement Plan
The Company has a 401(k) defined contribution retirement plan (the 401(k) Plan) covering all eligible employees. Participants may voluntarily contribute on a pre-tax basis an amount not to exceed a maximum contribution amount pursuant to Section 401(k) of the Internal Revenue Code. The Company is not required to contribute, nor has it contributed, to the 401(k) Plan for any of the periods presented.
F-43
MAXLINEAR, INC. NOTES TO CONSOLIDATED FINANCIAL STATEMENTS (in thousands, except per share amounts and percentage data) | ||
12. Commitments and Contingencies
Lease Commitments and Other Contractual Obligations
The Company leases facilities and certain equipment under operating lease arrangements expiring at various years through fiscal 2023. Certain of our leases contain standard rent escalation and renewal clauses. As of December 31, 2017, future minimum payments under non-cancelable operating leases, inventory purchase and other obligations are as follows:
Operating Leases | Inventory Purchase Obligations | Other Obligations | Total | ||||||||||||
(in thousands) | |||||||||||||||
2018 | $ | 9,155 | $ | 34,979 | $ | 7,758 | $ | 51,892 | |||||||
2019 | 9,117 | — | 7,761 | 16,878 | |||||||||||
2020 | 9,285 | — | 3,781 | 13,066 | |||||||||||
2021 | 9,146 | — | 30 | 9,176 | |||||||||||
2022 | 5,003 | — | — | 5,003 | |||||||||||
Thereafter | 758 | — | — | 758 | |||||||||||
Total minimum payments | $ | 42,464 | $ | 34,979 | $ | 19,330 | $ | 96,773 | |||||||
Other obligations consist of contractual payments due for software licenses.
The total rental expense for all operating leases was $4.2 million, $2.9 million and $2.4 million for the years ended December 31, 2017, 2016 and 2015, respectively.
The Company has subleased certain facilities that it ceased using in connection with a restructuring plan (Note 4). Such subleases expire at various years through fiscal 2023. As of December 31, 2017, future minimum rental income under non-cancelable subleases are as follows:
Amount | ||||
(in thousands) | ||||
2018 | $ | 2,875 | ||
2019 | 3,604 | |||
2020 | 4,088 | |||
2021 | 4,152 | |||
2022 | 879 | |||
Thereafter | 352 | |||
Total minimum rental income | $ | 15,950 | ||
Total sublease income related to leased facilities the Company ceased using in connection with a restructuring plan for the years ended December 31, 2017, 2016 and 2015 was approximately $2.1 million, $1.3 million and $0, respectively (Note 4).
Exar iML Divestiture Indemnification
Under the terms of the purchase agreement relating to the November 9, 2016 divestiture of Integrated Memory Logic Limited, or iML, by Exar, Exar agreed to indemnify the purchaser of the business unit for breaches of representations and warranties and covenants and for certain other matters. Exar also agreed to place $5.0 million of the total purchase price into an escrow account for a period of 18 months to partially secure its indemnification obligations under the purchase agreement. In addition, Exar’s indemnification obligations for breaches of representations and warranties survive for 12 months from the closing of the sale transaction, except for breaches of representations and warranties covering intellectual property, which survive for 18 months, and breaches of representations and warranties of certain fundamental representations, which survive until the expiration of the applicable statute of limitations. Exar’s maximum indemnification obligation for breaches of representations and warranties, other than intellectual property and fundamental representations, is $13.6 million, its maximum
F-44
MAXLINEAR, INC. NOTES TO CONSOLIDATED FINANCIAL STATEMENTS (in thousands, except per share amounts and percentage data) | ||
indemnification obligation for breaches of intellectual property representations is $34.0 million, and is maximum indemnity obligation for breaches of fundamental representations is the full purchase price amount (approximately $136.0 million). The aggregate amount recovered by the purchaser in accordance with the indemnification provisions with respect to matters that are subject to the intellectual property representations, together with the aggregate amount recovered by the buyer in accordance with the indemnification provisions with respect to matters that are subject to the general representations and warranties (other than fundamental representations), will in no event exceed $34.0 million. If the Company were required to make payments in satisfaction of these indemnification obligations, it could have a material adverse effect on the Company's financial condition and results of operations.
CrestaTech Litigation
On January 21, 2014, CrestaTech Technology Corporation, or CrestaTech, filed a complaint for patent infringement against the Company in the United States District Court of Delaware, or the District Court Litigation. In its complaint, CrestaTech alleges that the Company infringes U.S. Patent Nos. 7,075,585, or the '585 Patent and 7,265,792, or the '792 Patent. In addition to asking for compensatory damages, CrestaTech alleges willful infringement and seeks a permanent injunction. CrestaTech also names Sharp Corporation, Sharp Electronics Corp. and VIZIO, Inc. as defendants based upon their alleged use of the Company's television tuners.
On January 28, 2014, CrestaTech filed a complaint with the U.S. International Trade Commission, or ITC, again naming, among others, MaxLinear, Sharp, Sharp Electronics, and VIZIO, or the ITC Investigation. On May 16, 2014, the ITC granted CrestaTech’s motion to file an amended complaint adding six OEM Respondents, namely, SIO International, Inc., Hon Hai Precision Industry Co., Ltd., Wistron Corp., Wistron Infocomm Technology (America) Corp., Top Victory Investments Ltd. and TPV International (USA), Inc. which are collectively referred to with MaxLinear, Sharp and VIZIO as the Company Respondents. CrestaTech’s ITC complaint alleged a violation of 19 U.S.C. § 1337 through the importation into the United States, the sale for importation, or the sale within the United States after importation of MaxLinear’s accused products that CrestaTech alleged infringe the same two patents asserted in the Delaware action. Through its ITC complaint, CrestaTech sought an exclusion order preventing entry into the United States of certain of the Company's television tuners and televisions containing such tuners from Sharp, Sharp Electronics, and VIZIO. CrestaTech also sought a cease and desist order prohibiting the Company Respondents from engaging in the importation into, sale for importation into, the sale after importation of, or otherwise transferring within the United States certain of the Company's television tuners or televisions containing such tuners.
On March 10, 2014, the court stayed the District Court Litigation pending resolution of the ITC Investigation. Per the Court’s request, on April 19, 2017, the parties submitted a status report in the District Court Litigation. In their report, the parties suggested that the District Court Litigation remain stayed pending the Federal Circuit’s decision in the appeal of the ‘585 IPRs, and any subsequent appeal thereof, as more fully described below. Because the Federal Court appeals described below have concluded, the parties are to file a joint status report in the District Court Litigation.
On December 15, 2014, the ITC held a trial in the ITC Investigation. On February 27, 2015, the Administrative Law Judge, or the ALJ, issued a written Initial Determination, or ID, ruling that the Company Respondents do not violate Section 1337 in connection with CrestaTech’s asserted patents because CrestaTech failed to satisfy the economic prong of the domestic industry requirement pursuant to Section 1337(a)(2). In addition, the ID stated that certain of the Company's television tuners and televisions incorporating those tuners manufactured and sold by certain customers infringe three claims of the ‘585 Patent claims 10, 12 and 13), and these three claims were not determined to be invalid. On April 30, 2015, the ITC issued a notice indicating that it intended to review portions of the ID finding no violation of Section 1337, including the ID’s findings of infringement with respect to, and validity of, the ‘585 Patent, and the ID’s finding that CrestaTech failed to establish the existence of a domestic industry within the meaning of Section 1337.
The ITC subsequently issued its opinion, which terminated its investigation. The opinion affirmed the findings of the ALJ that no violation of Section 1337 had occurred because CrestaTech had failed to establish the economic prong of the domestic industry requirement. The ITC also affirmed the ALJ's finding of infringement with respect to the three claims of the '585 Patent that were not held to be invalid.
On November 30, 2015, CrestaTech filed an appeal of the ITC decision with the United States Court of Appeals for the Federal Circuit, or the Federal Circuit. On March 7, 2016, CrestaTech voluntarily dismissed its appeal, resulting in a final determination of the ITC Investigation in the Company's favor.
In addition, the Company has filed four petitions for inter partes review, or IPR, by the US Patent Office, two for each of the CrestaTech patents asserted against the Company. The Patent Trial and Appeal Board, or the PTAB, did not institute two of these IPRs as being redundant to IPRs filed by another party that were already underway for the same CrestaTech patent. The
F-45
MAXLINEAR, INC. NOTES TO CONSOLIDATED FINANCIAL STATEMENTS (in thousands, except per share amounts and percentage data) | ||
remaining two petitions were instituted or instituted-in-part meaning, together with the IPRs filed by third parties, there were six IPR proceedings instituted involving the two CrestaTech patents asserted against the Company.
In October 2015, the PTAB issued final decisions in two of the six pending IPR proceedings (one for each of the two asserted patents), holding that all of the reviewed claims are unpatentable. Included in these decisions was one of the three claims of the ‘585 Patent (claim 10) mentioned above in connection with the ITC’s final decision. CrestaTech appealed the PTAB’s decisions at the Federal Circuit. On November 8, 2016, the Federal Circuit issued an opinion affirming the PTAB’s finding of unpatentability.
In August 2016, the PTAB issued final written decisions in the remaining four pending IPR proceedings (two for each of the asserted patents), holding that many of the reviewed claims - including the two remaining claims of the ‘585 Patent which the ITC held were infringed - are unpatentable. The parties have appealed the two decisions related to the ‘585 Patent; however, no appeals were filed as to the PTAB's rulings for the ‘792 Patent. The Federal Circuit heard oral argument on these appeals on December 4, 2017. On December 7, the Federal Circuit issued a Rule 36 affirmance in one of the '585 appeals, affirming that the two remaining claims that the ITC had ruled were valid and infringed (claims 12 and 13) are unpatentable. On January 25, 2018, the Federal Circuit issued its ruling in the other ‘585 appeal, vacating the Board’s ruling that certain claims were not unpatentable and remanding to the Board for further analysis of whether CrestaTech is estopped from arguing and/or has waived the right to argue whether six dependent claims are patentable.
As a result of these IPR decisions, all 13 claims that CrestaTech asserted against the Company in the ITC Investigation have been found to be unpatentable by the PTAB and the Federal Circuit.
On March 18, 2016, CrestaTech filed a petition for Chapter 7 bankruptcy in the Northern District of California. As a result of this proceeding, all rights in the CrestaTech asserted patents, including the right to control the pending litigation, were assigned to CF Crespe LLC, or CF Crespe. CF Crespe is now the named party in the pending IPRs, the Federal Circuit appeal and District Court Litigation.
The Company cannot predict the outcome of any appeal by CF Crespe or CrestaTech, the District Court Litigation, or the IPRs. Any adverse determination in the District Court Litigation could have a material adverse effect on the Company's business and operating results.
Trango Systems, Inc. Litigation
On or about August 2, 2016, Trango Systems, Inc., or Trango, filed a complaint in the Superior Court of California, County of San Diego, Central Division, against defendants Broadcom Corporation, Inc., or Broadcom, and the Company, collectively, Defendants. Trango is a purchaser that alleges various fraud, breach of contract, and interference with economic relations claims in connection with the discontinuance of a chip line the Company acquired from Broadcom in 2016. Trango seeks unspecified general and special damages, pre-judgment interest, expenses and costs, attorneys’ fees, punitive damages, and unspecified injunctive and equitable relief. The Company intends to vigorously defend against the lawsuit. On June 23, 2017, the Court sustained the Company's demurrer to each cause of action in the second amended complaint filed on or about December 6, 2016. Trango filed its third amended complaint on or about July 13, 2017. On August 17, 2017 the Company filed a demurrer to each cause of action against the Company in the third amended complaint, as well as a motion to strike certain allegations. Trango’s oppositions to the Company's demurrer and motion to strike are currently due on February 8, 2018 and the court hearing on the Company's demurrer and motion to strike is scheduled for February 23, 2018. Discovery in the matter is currently stayed pending resolution of the demurrer and motion to strike.
The Company cannot predict the outcome of the Trango Systems, Inc. litigation. Any adverse determination in the Trango Systems, Inc. litigation could have a material adverse effect on the Company's business and operating results.
Exar Shareholder Litigation
On April 18, 2017, The Vladimir Gusinsky Revocable Trust filed a complaint in the United States District Court for the Northern District of California against Exar, its board of directors, MaxLinear, and Eagle Acquisition Corporation (a wholly owned subsidiary of MaxLinear), captioned The Vladimir Gusinsky Rev. Trust v. Exar Corp. et al., No. 5:17-CV-2150-SI (N.D. Cal.). On April 25, 2017, Richard E. Marshall filed a complaint in United States District Court for the Northern District of California against Exar and its board of directors, captioned Marshall v. Exar Corp. et al., No. 3:17-CV-02334 (N.D. Cal.). MaxLinear and Eagle Acquisition Corp. were not named as defendants in the Marshall action. The complaints generally alleged that the merger with Exar offered inadequate consideration to Exar’s shareholders and that the Schedule 14D-9 filed by Exar in connection with the merger omitted material information. The complaints purported to bring class claims for violation
F-46
MAXLINEAR, INC. NOTES TO CONSOLIDATED FINANCIAL STATEMENTS (in thousands, except per share amounts and percentage data) | ||
of sections 14(e), 14(d), and 20(a) of the Securities Exchange Act of 1934 and SEC Rule 14d-9. The complaints sought certification of a class; an injunction barring the merger or, if defendants enter into the merger, an order rescinding it or awarding rescissory damages; declaratory relief; and plaintiff’s costs, including attorneys’ fees and experts’ fees.
On or about May 3, 2017, the parties to the above-referenced lawsuits reached an agreement whereby plaintiffs voluntarily dismissed the claims brought by Mr. Marshall and The Vladimir Gusinsky Revocable Trust with prejudice (but without prejudice as to other members of the putative class), defendants made certain supplemental disclosures, and the plaintiffs would receive a mootness fee. On May 3, 2017, Exar made the supplemental disclosures contemplated by this agreement. On October 24, 2017, the parties entered a Settlement Agreement Regarding Claim for Mootness Fees pursuant to which the Company agreed to pay counsel for the plaintiffs a mootness fee. The Company has now paid the fee, and with the execution of the settlement agreement, this litigation has been resolved.
Other Matters
In addition, from time to time, the Company is subject to threats of litigation or actual litigation in the ordinary course of business, some of which may be material. Other than the CrestaTech and Trango litigation described above, the Company believes that there are no other currently pending litigation matters that, if determined adversely by the Company, would have a material effect on the Company's business or that would not be covered by the Company's existing liability insurance.
13. Concentration of Credit Risk, Significant Customers and Geographic Information
Financial instruments, which potentially subject the Company to concentrations of credit risk, consist primarily of cash and cash equivalents and accounts receivable. Collateral is generally not required for customer receivables. The Company limits its exposure to credit loss by placing its cash with high credit quality financial institutions. At times, such deposits may be in excess of insured limits. The Company has not experienced any losses on its deposits of cash and cash equivalents.
Significant Customers
The Company markets its products and services to manufacturers of a wide range of electronic devices (Note 1). The Company makes periodic evaluations of the credit worthiness of its customers.
Customers comprising greater than 10% of net revenues for each of the periods presented are as follows:
Years Ended December 31, | ||||||||
2017 | 2016 | 2015 | ||||||
Percentage of total net revenue | ||||||||
Customer A | 25 | % | 27 | % | 28 | % | ||
Customer B | * | 10 | % | 13 | % | |||
* Represents less than 10% of the net revenue for the respective period.
Balances greater than 10% of accounts receivable, based on the Company's billings to the contract manufacturer customers, are as follows:
December 31, | |||||
2017 | 2016 | ||||
Percentage of gross accounts receivable | |||||
Customer C | 17 | % | 17 | % | |
Customer D | 10 | % | 15 | % | |
Customer E | * | 12 | % | ||
* Represents less than 10% of the gross accounts receivable for the respective period end.
F-47
MAXLINEAR, INC. NOTES TO CONSOLIDATED FINANCIAL STATEMENTS (in thousands, except per share amounts and percentage data) | ||
Suppliers comprising greater than 10% of total inventory purchases are as follows:
Years ended December 31, | ||||||||
2017 | 2016 | 2015 | ||||||
Vendor A | 21 | % | 16 | % | 12 | % | ||
Vendor B | 16 | % | 13 | % | 14 | % | ||
Vendor C | 15 | % | 11 | % | 11 | % | ||
Vendor D | 14 | % | 11 | % | 11 | % | ||
Vendor E | 11 | % | 18 | % | 22 | % | ||
Vendor F | * | 12 | % | 11 | % | |||
* Represents less than 10% of the inventory purchases for the respective period.
Geographic Information
The Company's consolidated net revenues by geographic area based on ship-to location are as follows (in thousands):
Years Ended December 31, | ||||||||||||||||||||
2017 | 2016 | 2015 | ||||||||||||||||||
Amount | % of total net revenue | Amount | % of total net revenue | Amount | % of total net revenue | |||||||||||||||
Asia | $ | 372,103 | 89 | % | $ | 360,325 | 93 | % | $ | 274,169 | 91 | % | ||||||||
United States | 10,829 | 2 | % | 9,181 | 2 | % | 10,819 | 4 | % | |||||||||||
Rest of world | 37,386 | 9 | % | 18,326 | 5 | % | 15,372 | 5 | % | |||||||||||
Total | $ | 420,318 | 100 | % | $ | 387,832 | 100 | % | $ | 300,360 | 100 | % | ||||||||
The products shipped to individual countries representing greater than 10% of net revenue for each of the periods presented are as follows:
Years Ended December 31, | ||||||||
2017 | 2016 | 2015 | ||||||
Percentage of total net revenue | ||||||||
China | 71 | % | 78 | % | 77 | % | ||
The determination of which country a particular sale is allocated to is based on the destination of the product shipment. No other individual country in Asia Pacific, United States, or the rest of the world accounted for more than 10% of net revenue during these periods.
Long-lived assets, which consists of property and equipment, intangible assets, and goodwill, by geographic area are as follows (in thousands):
As of December 31, | |||||||||||||
2017 | 2016 | ||||||||||||
Amount | % of total | Amount | % of total | ||||||||||
United States | $ | 481,638 | 84 | % | $ | 111,336 | 55 | % | |||||
Singapore | 92,414 | 16 | % | 78,318 | 39 | % | |||||||
Rest of world | 1,643 | — | % | 11,171 | 6 | % | |||||||
Total | $ | 575,695 | 100 | % | $ | 200,825 | 100 | % | |||||
F-48
MAXLINEAR, INC. NOTES TO CONSOLIDATED FINANCIAL STATEMENTS (in thousands, except per share amounts and percentage data) | ||
14. Selected Quarterly Financial Data (Unaudited)
The following table presents the Company’s unaudited quarterly financial data for each of the eight quarters in the period ended December 31, 2017. In management’s opinion, this information has been presented on the same basis as the audited consolidated financial statements included in a separate section of this report, and all necessary adjustments, consisting only of normal recurring adjustments, have been included in the amounts below to present fairly the unaudited quarterly results when read in conjunction with the audited consolidated financial statements and related notes. The operating results for any quarter should not be relied upon as necessarily indicative of results for any future period.
Year Ended December 31, 2017 | |||||||||||||||
First Quarter | Second Quarter | Third Quarter | Fourth Quarter | ||||||||||||
(in thousands, except per share amounts) | |||||||||||||||
Net revenue | $ | 88,841 | $ | 104,175 | $ | 113,581 | $ | 113,721 | |||||||
Gross profit | $ | 52,924 | $ | 51,104 | $ | 51,842 | $ | 52,093 | |||||||
Net income (loss) | $ | 8,463 | $ | 10,965 | $ | (9,167 | ) | $ | (19,448 | ) | |||||
Net income (loss) per share: | |||||||||||||||
Basic | $ | 0.13 | $ | 0.17 | $ | (0.14 | ) | $ | (0.29 | ) | |||||
Diluted | $ | 0.12 | $ | 0.16 | $ | (0.14 | ) | $ | (0.29 | ) | |||||
Year Ended December 31, 2016 | |||||||||||||||
First Quarter | Second Quarter | Third Quarter | Fourth Quarter | ||||||||||||
(in thousands, except per share amounts) | |||||||||||||||
Net revenue | $ | 102,685 | $ | 101,687 | $ | 96,324 | $ | 87,136 | |||||||
Gross profit | $ | 61,170 | $ | 62,913 | $ | 55,504 | $ | 50,403 | |||||||
Net income | $ | 20,681 | $ | 22,584 | $ | 9,679 | $ | 8,348 | |||||||
Net income per share: | |||||||||||||||
Basic | $ | 0.33 | $ | 0.36 | $ | 0.15 | $ | 0.13 | |||||||
Diluted | $ | 0.31 | $ | 0.33 | $ | 0.14 | $ | 0.12 | |||||||
F-49