Attached files
| file | filename |
|---|---|
| 8-K - FORM 8-K - DEVON ENERGY CORP/DE | d541284d8k.htm |
| EX-99.3 - EX-99.3 - DEVON ENERGY CORP/DE | d541284dex993.htm |
| EX-99.1 - EX-99.1 - DEVON ENERGY CORP/DE | d541284dex991.htm |
Highlights & CEO Perspective 2 2020 Vision: Strategic Priorities 3 2020 Vision: 3-Year Outlook 4 2018 Detailed Guidance 6 Q4 2017 Key Modeling Stats 8 Q4 2017 Operating Results 9 Delaware Basin11 STACK15 Rockies19 Cash Flow Generating Assets21 Q4 2017 Operations Report February 20, 2018 NYSE: DVN devonenergy.com Exhibit 99.2
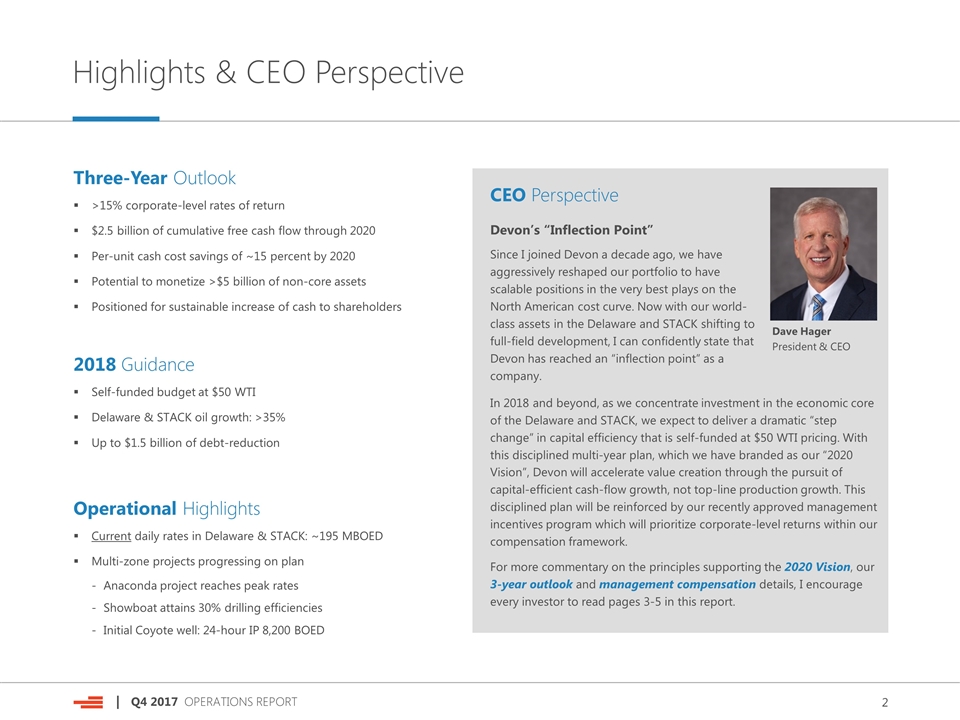
Highlights & CEO Perspective Dave Hager President & CEO Three-Year Outlook >15% corporate-level rates of return $2.5 billion of cumulative free cash flow through 2020 Per-unit cash cost savings of ~15 percent by 2020 Potential to monetize >$5 billion of non-core assets Positioned for sustainable increase of cash to shareholders 2018 Guidance Self-funded budget at $50 WTI Delaware & STACK oil growth: >35% Up to $1.5 billion of debt-reduction Operational Highlights Current daily rates in Delaware & STACK: ~195 MBOED Multi-zone projects progressing on plan Anaconda project reaches peak rates Showboat attains 30% drilling efficiencies Initial Coyote well: 24-hour IP 8,200 BOED CEO Perspective Devon’s “Inflection Point” Since I joined Devon a decade ago, we have aggressively reshaped our portfolio to have scalable positions in the very best plays on the North American cost curve. Now with our world-class assets in the Delaware and STACK shifting to full-field development, I can confidently state that Devon has reached an “inflection point” as a company. In 2018 and beyond, as we concentrate investment in the economic core of the Delaware and STACK, we expect to deliver a dramatic “step change” in capital efficiency that is self-funded at $50 WTI pricing. With this disciplined multi-year plan, which we have branded as our “2020 Vision”, Devon will accelerate value creation through the pursuit of capital-efficient cash-flow growth, not top-line production growth. This disciplined plan will be reinforced by our recently approved management incentives program which will prioritize corporate-level returns within our compensation framework. For more commentary on the principles supporting the 2020 Vision, our 3-year outlook and management compensation details, I encourage every investor to read pages 3-5 in this report.
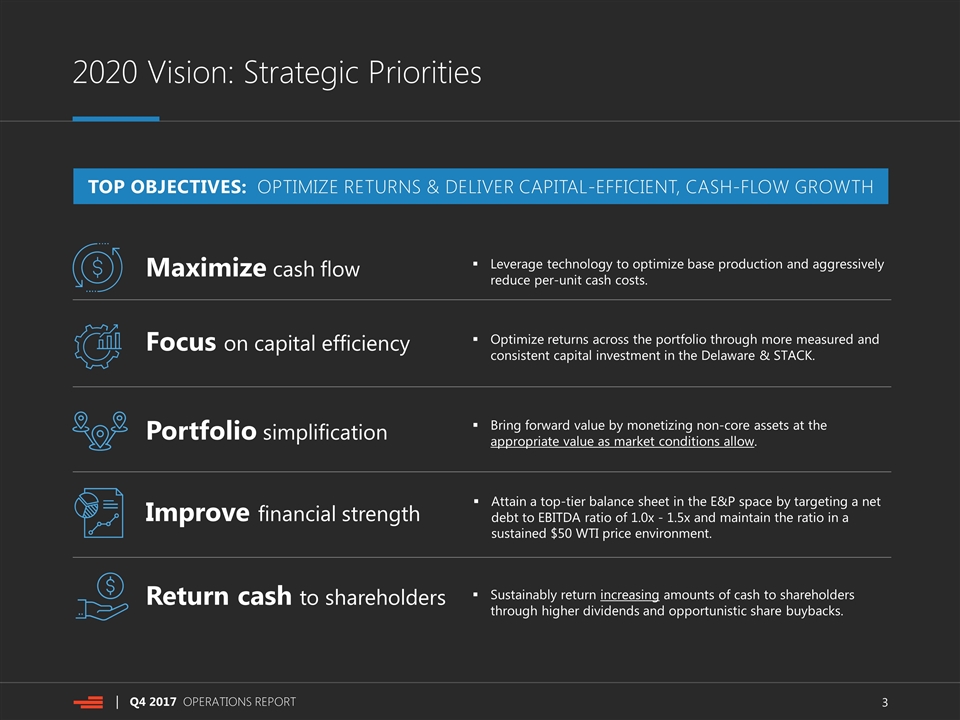
2020 Vision: Strategic Priorities Leverage technology to optimize base production and aggressively reduce per-unit cash costs. Optimize returns across the portfolio through more measured and consistent capital investment in the Delaware & STACK. Bring forward value by monetizing non-core assets at the appropriate value as market conditions allow. Sustainably return increasing amounts of cash to shareholders through higher dividends and opportunistic share buybacks. Maximize cash flow Focus on capital efficiency Portfolio simplification Improve financial strength Return cash to shareholders TOP OBJECTIVES: OPTIMIZE RETURNS & DELIVER CAPITAL-EFFICIENT, CASH-FLOW GROWTH Attain a top-tier balance sheet in the E&P space by targeting a net debt to EBITDA ratio of 1.0x - 1.5x and maintain the ratio in a sustained $50 WTI price environment.
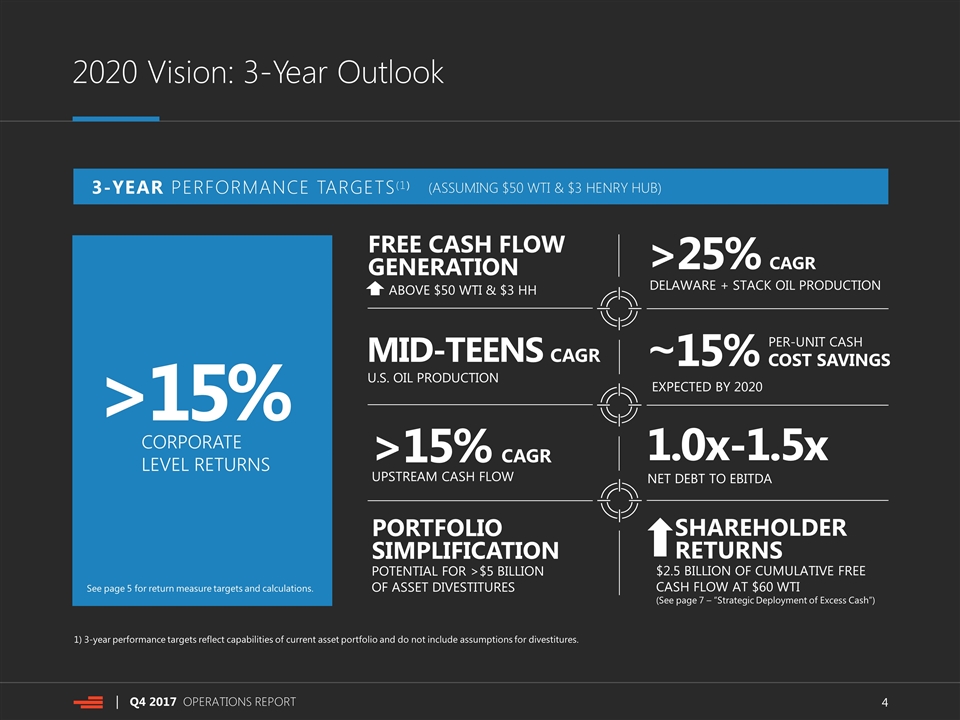
2020 Vision: 3-Year Outlook >15% CORPORATE LEVEL RETURNS >25% CAGR DELAWARE + STACK OIL PRODUCTION FREE CASH FLOW GENERATION ABOVE $50 WTI & $3 HH ~15% COST SAVINGS EXPECTED BY 2020 PORTFOLIO SIMPLIFICATION POTENTIAL FOR >$5 BILLION OF ASSET DIVESTITURES 1.0x-1.5x NET DEBT TO EBITDA >15% CAGR UPSTREAM CASH FLOW PER-UNIT CASH SHAREHOLDER RETURNS $2.5 BILLION OF CUMULATIVE FREE CASH FLOW AT $60 WTI (See page 7 – “Strategic Deployment of Excess Cash”) MID-TEENS CAGR U.S. OIL PRODUCTION 1) 3-year performance targets reflect capabilities of current asset portfolio and do not include assumptions for divestitures. See page 5 for return measure targets and calculations. 3-YEAR PERFORMANCE TARGETS(1) (ASSUMING $50 WTI & $3 HENRY HUB)
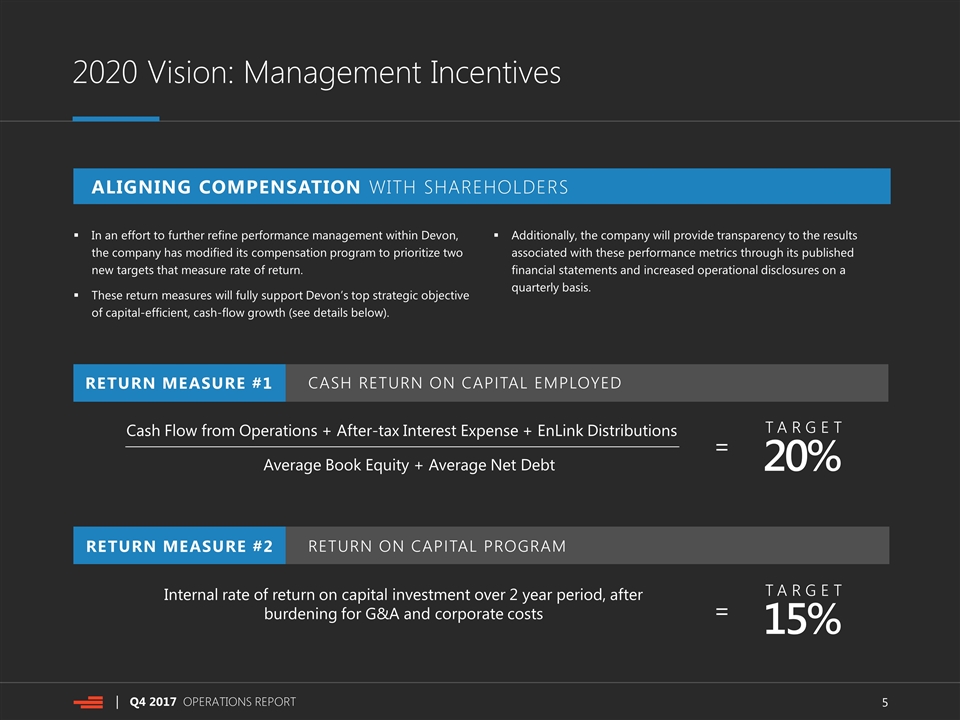
2020 Vision: Management Incentives In an effort to further refine performance management within Devon, the company has modified its compensation program to prioritize two new targets that measure rate of return. These return measures will fully support Devon’s top strategic objective of capital-efficient, cash-flow growth (see details below). Additionally, the company will provide transparency to the results associated with these performance metrics through its published financial statements and increased operational disclosures on a quarterly basis. ALIGNING COMPENSATION WITH SHAREHOLDERS Cash Flow from Operations + After-tax Interest Expense + EnLink Distributions Average Book Equity + Average Net Debt Internal rate of return on capital investment over 2 year period, after burdening for G&A and corporate costs RETURN MEASURE #1 CASH RETURN ON CAPITAL EMPLOYED RETURN MEASURE #2 RETURN ON CAPITAL PROGRAM = 20% TARGET = 15% TARGET
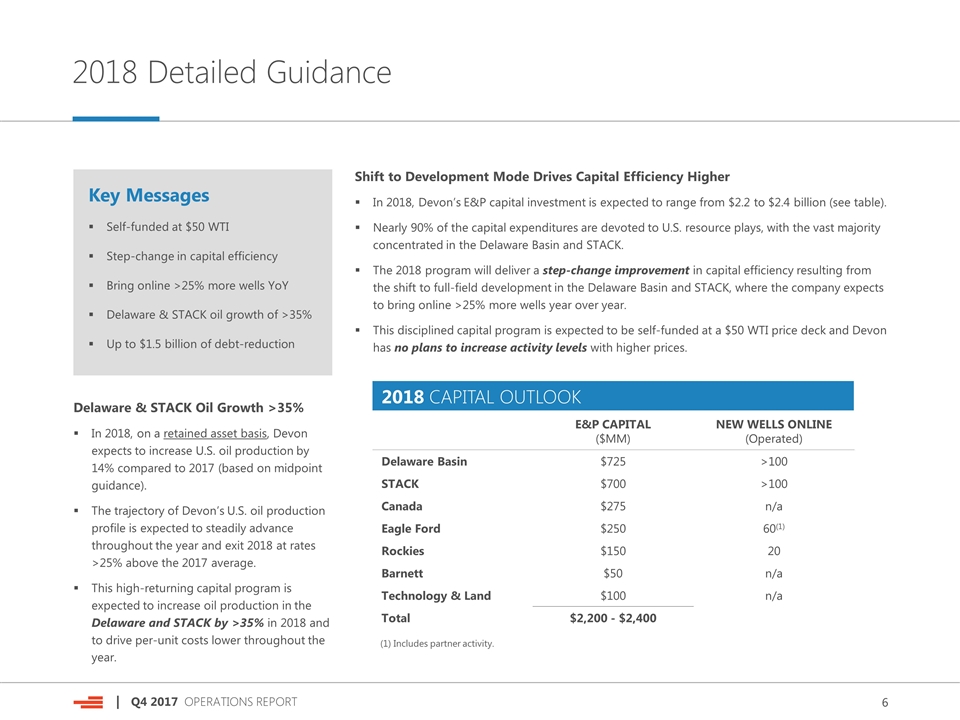
2018 Detailed Guidance Shift to Development Mode Drives Capital Efficiency Higher In 2018, Devon’s E&P capital investment is expected to range from $2.2 to $2.4 billion (see table). Nearly 90% of the capital expenditures are devoted to U.S. resource plays, with the vast majority concentrated in the Delaware Basin and STACK. The 2018 program will deliver a step-change improvement in capital efficiency resulting from the shift to full-field development in the Delaware Basin and STACK, where the company expects to bring online >25% more wells year over year. This disciplined capital program is expected to be self-funded at a $50 WTI price deck and Devon has no plans to increase activity levels with higher prices. Delaware & STACK Oil Growth >35% In 2018, on a retained asset basis, Devon expects to increase U.S. oil production by 14% compared to 2017 (based on midpoint guidance). The trajectory of Devon’s U.S. oil production profile is expected to steadily advance throughout the year and exit 2018 at rates >25% above the 2017 average. This high-returning capital program is expected to increase oil production in the Delaware and STACK by >35% in 2018 and to drive per-unit costs lower throughout the year. Key Messages Self-funded at $50 WTI Step-change in capital efficiency Bring online >25% more wells YoY Delaware & STACK oil growth of >35% Up to $1.5 billion of debt-reduction 2018 CAPITAL OUTLOOK E&P CAPITAL ($MM) NEW WELLS ONLINE (Operated) Delaware Basin $725 >100 STACK $700 >100 Canada $275 n/a Eagle Ford $250 60(1) Rockies $150 20 Barnett $50 n/a Technology & Land $100 n/a Total $2,200 - $2,400 (1) Includes partner activity.
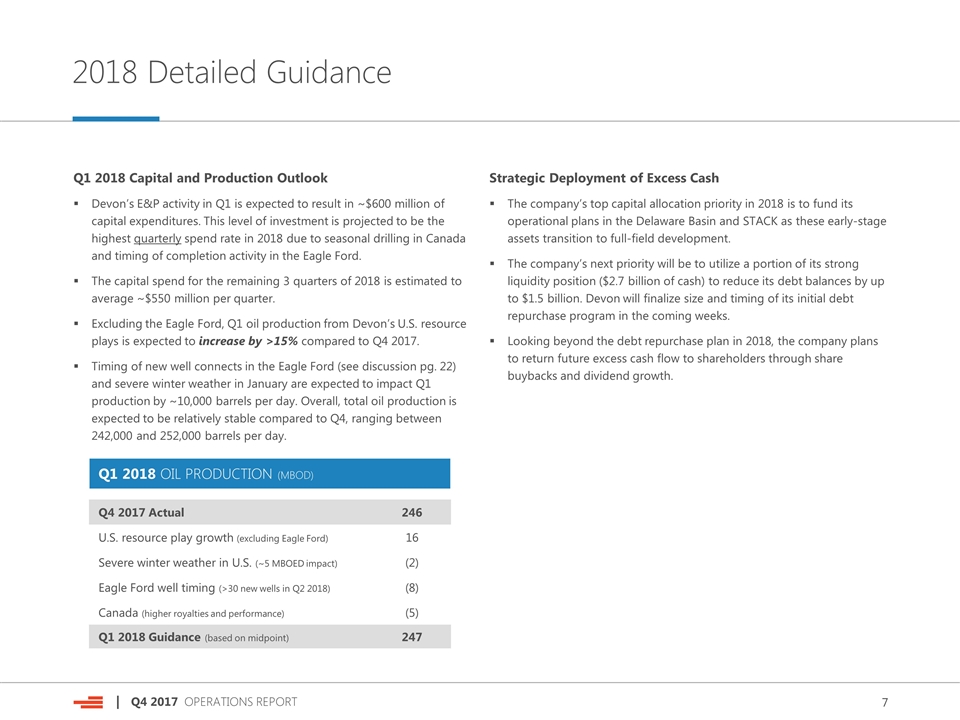
2018 Detailed Guidance Strategic Deployment of Excess Cash The company’s top capital allocation priority in 2018 is to fund its operational plans in the Delaware Basin and STACK as these early-stage assets transition to full-field development. The company’s next priority will be to utilize a portion of its strong liquidity position ($2.7 billion of cash) to reduce its debt balances by up to $1.5 billion. Devon will finalize size and timing of its initial debt repurchase program in the coming weeks. Looking beyond the debt repurchase plan in 2018, the company plans to return future excess cash flow to shareholders through share buybacks and dividend growth. Q1 2018 Capital and Production Outlook Devon’s E&P activity in Q1 is expected to result in ~$600 million of capital expenditures. This level of investment is projected to be the highest quarterly spend rate in 2018 due to seasonal drilling in Canada and timing of completion activity in the Eagle Ford. The capital spend for the remaining 3 quarters of 2018 is estimated to average ~$550 million per quarter. Excluding the Eagle Ford, Q1 oil production from Devon’s U.S. resource plays is expected to increase by >15% compared to Q4 2017. Timing of new well connects in the Eagle Ford (see discussion pg. 22) and severe winter weather in January are expected to impact Q1 production by ~10,000 barrels per day. Overall, total oil production is expected to be relatively stable compared to Q4, ranging between 242,000 and 252,000 barrels per day. Q1 2018 OIL PRODUCTION (MBOD) Q4 2017 Actual 246 U.S. resource play growth (excluding Eagle Ford) 16 Severe winter weather in U.S. (~5 MBOED impact) (2) Eagle Ford well timing (>30 new wells in Q2 2018) (8) Canada (higher royalties and performance) (5) Q1 2018 Guidance (based on midpoint) 247
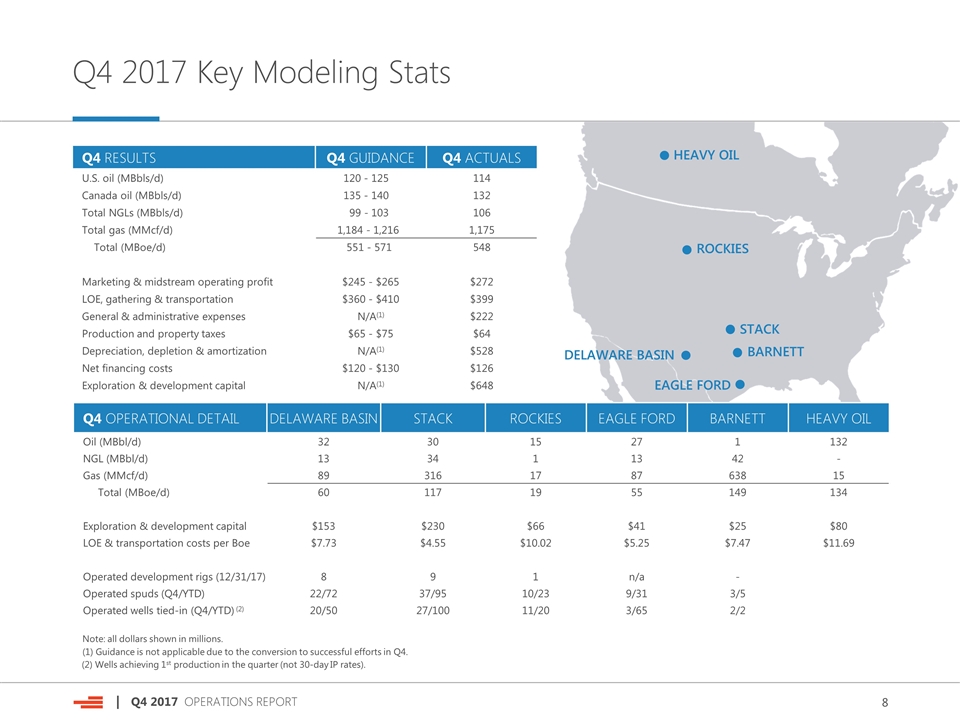
Q4 2017 Key Modeling Stats Q4 RESULTS Q4 GUIDANCE Q4 ACTUALS U.S. oil (MBbls/d) 120 - 125 114 Canada oil (MBbls/d) 135 - 140 132 Total NGLs (MBbls/d) 99 - 103 106 Total gas (MMcf/d) 1,184 - 1,216 1,175 Total (MBoe/d) 551 - 571 548 Marketing & midstream operating profit $245 - $265 $272 LOE, gathering & transportation $360 - $410 $399 General & administrative expenses N/A(1) $222 Production and property taxes $65 - $75 $64 Depreciation, depletion & amortization N/A(1) $528 Net financing costs $120 - $130 $126 Exploration & development capital N/A(1) $648 (1) Guidance is not applicable due to the conversion to successful efforts in Q4. (2) Wells achieving 1st production in the quarter (not 30-day IP rates). Q4 OPERATIONAL DETAIL DELAWARE BASIN STACK ROCKIES EAGLE FORD BARNETT HEAVY OIL Oil (MBbl/d) 32 30 15 27 1 132 NGL (MBbl/d) 13 34 1 13 42 - Gas (MMcf/d) 89 316 17 87 638 15 Total (MBoe/d) 60 117 19 55 149 134 Exploration & development capital $153 $230 $66 $41 $25 $80 LOE & transportation costs per Boe $7.73 $4.55 $10.02 $5.25 $7.47 $11.69 Operated development rigs (12/31/17) 8 9 1 n/a - Operated spuds (Q4/YTD) 22/72 37/95 10/23 9/31 3/5 Operated wells tied-in (Q4/YTD) (2) 20/50 27/100 11/20 3/65 2/2 Note: all dollars shown in millions. BARNETT STACK EAGLE FORD DELAWARE BASIN ROCKIES HEAVY OIL
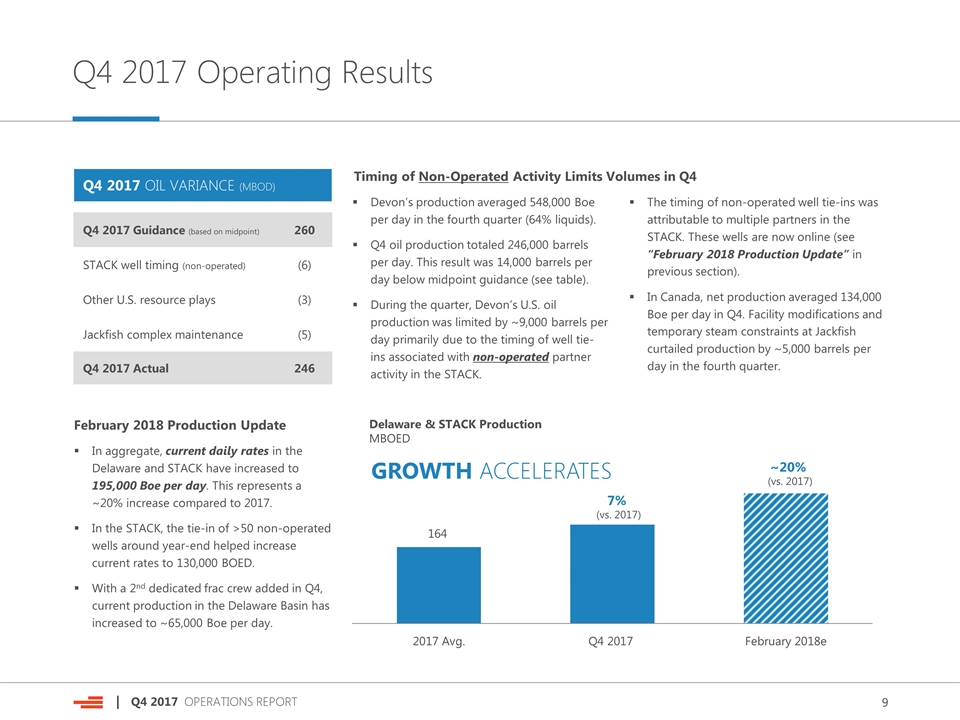
Q4 2017 Operating Results Devon’s production averaged 548,000 Boe per day in the fourth quarter (64% liquids). Q4 oil production totaled 246,000 barrels per day. This result was 14,000 barrels per day below midpoint guidance (see table). During the quarter, Devon’s U.S. oil production was limited by ~9,000 barrels per day primarily due to the timing of well tie-ins associated with non-operated partner activity in the STACK. February 2018 Production Update In aggregate, current daily rates in the Delaware and STACK have increased to 195,000 Boe per day. This represents a ~20% increase compared to 2017. In the STACK, the tie-in of >50 non-operated wells around year-end helped increase current rates to 130,000 BOED. With a 2nd dedicated frac crew added in Q4, current production in the Delaware Basin has increased to ~65,000 Boe per day. Timing of Non-Operated Activity Limits Volumes in Q4 The timing of non-operated well tie-ins was attributable to multiple partners in the STACK. These wells are now online (see “February 2018 Production Update” in previous section). In Canada, net production averaged 134,000 Boe per day in Q4. Facility modifications and temporary steam constraints at Jackfish curtailed production by ~5,000 barrels per day in the fourth quarter. 164 Delaware & STACK Production MBOED GROWTH ACCELERATES 7% (vs. 2017) ~20% (vs. 2017) Q4 2017 OIL VARIANCE (MBOD) Q4 2017 Guidance (based on midpoint) 260 STACK well timing (non-operated) (6) Other U.S. resource plays (3) Jackfish complex maintenance (5) Q4 2017 Actual 246
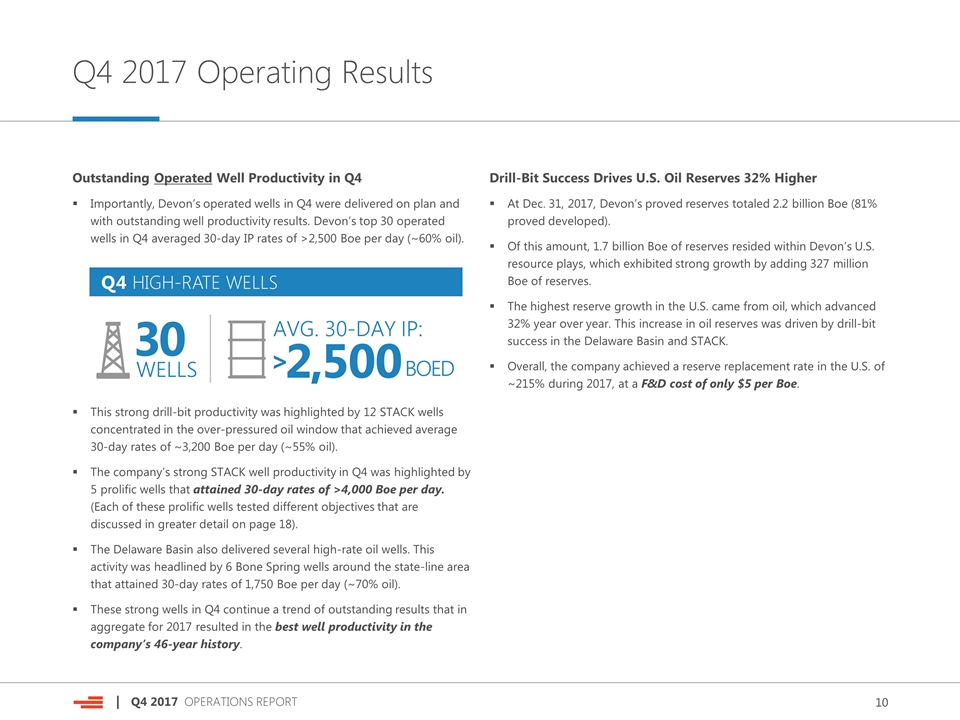
Q4 2017 Operating Results Drill-Bit Success Drives U.S. Oil Reserves 32% Higher At Dec. 31, 2017, Devon’s proved reserves totaled 2.2 billion Boe (81% proved developed). Of this amount, 1.7 billion Boe of reserves resided within Devon’s U.S. resource plays, which exhibited strong growth by adding 327 million Boe of reserves. The highest reserve growth in the U.S. came from oil, which advanced 32% year over year. This increase in oil reserves was driven by drill-bit success in the Delaware Basin and STACK. Overall, the company achieved a reserve replacement rate in the U.S. of ~215% during 2017, at a F&D cost of only $5 per Boe. Outstanding Operated Well Productivity in Q4 Importantly, Devon’s operated wells in Q4 were delivered on plan and with outstanding well productivity results. Devon’s top 30 operated wells in Q4 averaged 30-day IP rates of >2,500 Boe per day (~60% oil). This strong drill-bit productivity was highlighted by 12 STACK wells concentrated in the over-pressured oil window that achieved average 30-day rates of ~3,200 Boe per day (~55% oil). The company’s strong STACK well productivity in Q4 was highlighted by 5 prolific wells that attained 30-day rates of >4,000 Boe per day. (Each of these prolific wells tested different objectives that are discussed in greater detail on page 18). The Delaware Basin also delivered several high-rate oil wells. This activity was headlined by 6 Bone Spring wells around the state-line area that attained 30-day rates of 1,750 Boe per day (~70% oil). These strong wells in Q4 continue a trend of outstanding results that in aggregate for 2017 resulted in the best well productivity in the company’s 46-year history. Q4 HIGH-RATE WELLS 30 WELLS 2,500 > AVG. 30-DAY IP: BOED
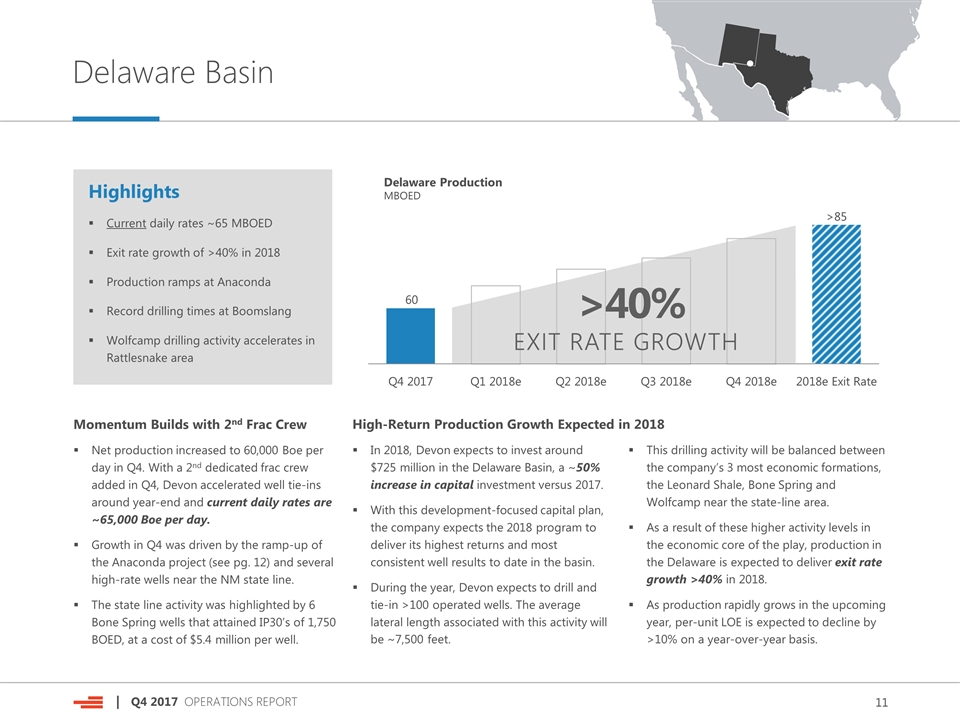
Delaware Basin Highlights Current daily rates ~65 MBOED Exit rate growth of >40% in 2018 Production ramps at Anaconda Record drilling times at Boomslang Wolfcamp drilling activity accelerates in Rattlesnake area Momentum Builds with 2nd Frac Crew Net production increased to 60,000 Boe per day in Q4. With a 2nd dedicated frac crew added in Q4, Devon accelerated well tie-ins around year-end and current daily rates are ~65,000 Boe per day. Growth in Q4 was driven by the ramp-up of the Anaconda project (see pg. 12) and several high-rate wells near the NM state line. The state line activity was highlighted by 6 Bone Spring wells that attained IP30’s of 1,750 BOED, at a cost of $5.4 million per well. In 2018, Devon expects to invest around $725 million in the Delaware Basin, a ~50% increase in capital investment versus 2017. With this development-focused capital plan, the company expects the 2018 program to deliver its highest returns and most consistent well results to date in the basin. During the year, Devon expects to drill and tie-in >100 operated wells. The average lateral length associated with this activity will be ~7,500 feet. High-Return Production Growth Expected in 2018 This drilling activity will be balanced between the company’s 3 most economic formations, the Leonard Shale, Bone Spring and Wolfcamp near the state-line area. As a result of these higher activity levels in the economic core of the play, production in the Delaware is expected to deliver exit rate growth >40% in 2018. As production rapidly grows in the upcoming year, per-unit LOE is expected to decline by >10% on a year-over-year basis. Delaware Production MBOED EXIT RATE GROWTH >40%
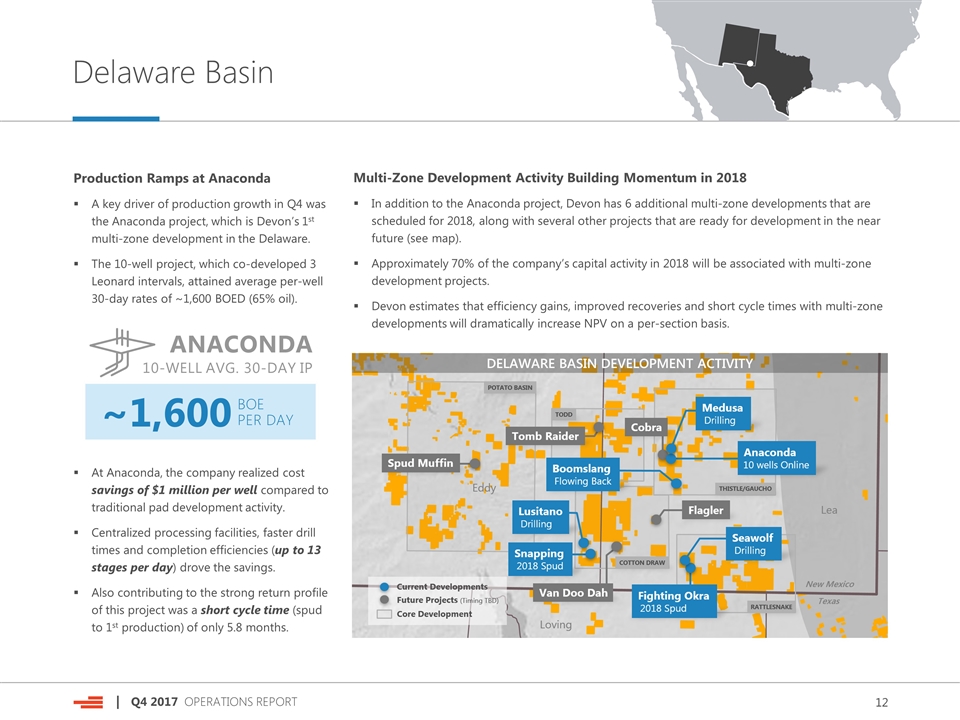
DELAWARE BASIN DEVELOPMENT ACTIVITY Delaware Basin Production Ramps at Anaconda A key driver of production growth in Q4 was the Anaconda project, which is Devon’s 1st multi-zone development in the Delaware. The 10-well project, which co-developed 3 Leonard intervals, attained average per-well 30-day rates of ~1,600 BOED (65% oil). At Anaconda, the company realized cost savings of $1 million per well compared to traditional pad development activity. Centralized processing facilities, faster drill times and completion efficiencies (up to 13 stages per day) drove the savings. Also contributing to the strong return profile of this project was a short cycle time (spud to 1st production) of only 5.8 months. Multi-Zone Development Activity Building Momentum in 2018 In addition to the Anaconda project, Devon has 6 additional multi-zone developments that are scheduled for 2018, along with several other projects that are ready for development in the near future (see map). Approximately 70% of the company’s capital activity in 2018 will be associated with multi-zone development projects. Devon estimates that efficiency gains, improved recoveries and short cycle times with multi-zone developments will dramatically increase NPV on a per-section basis. ANACONDA 10-WELL AVG. 30-DAY IP ~1,600 BOE PER DAY
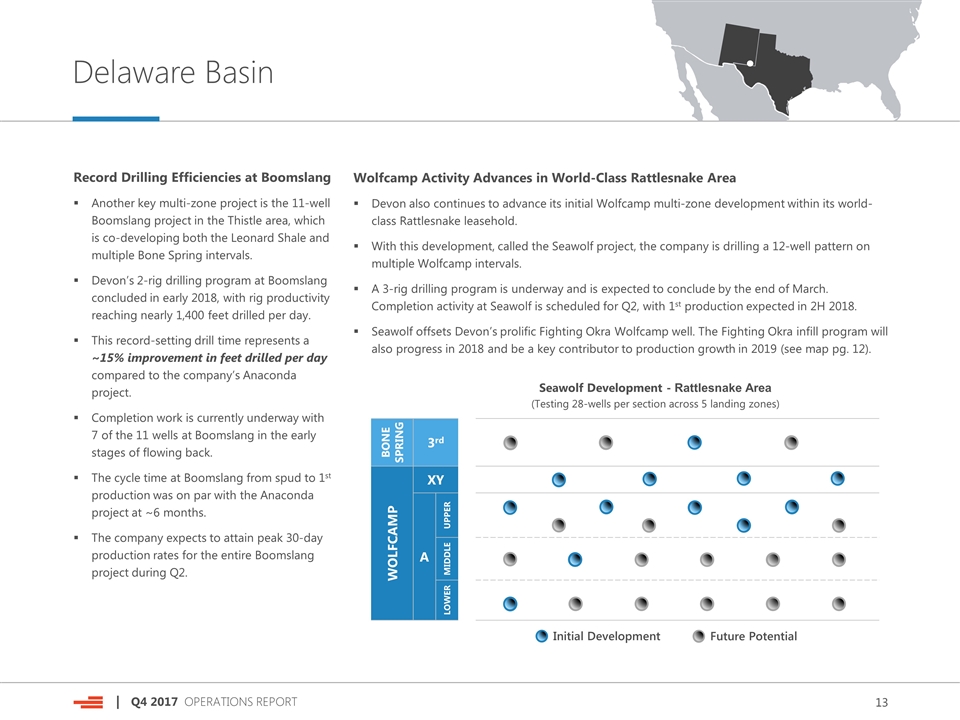
Delaware Basin Record Drilling Efficiencies at Boomslang Another key multi-zone project is the 11-well Boomslang project in the Thistle area, which is co-developing both the Leonard Shale and multiple Bone Spring intervals. Devon’s 2-rig drilling program at Boomslang concluded in early 2018, with rig productivity reaching nearly 1,400 feet drilled per day. This record-setting drill time represents a ~15% improvement in feet drilled per day compared to the company’s Anaconda project. Completion work is currently underway with 7 of the 11 wells at Boomslang in the early stages of flowing back. The cycle time at Boomslang from spud to 1st production was on par with the Anaconda project at ~6 months. The company expects to attain peak 30-day production rates for the entire Boomslang project during Q2. Wolfcamp Activity Advances in World-Class Rattlesnake Area Devon also continues to advance its initial Wolfcamp multi-zone development within its world-class Rattlesnake leasehold. With this development, called the Seawolf project, the company is drilling a 12-well pattern on multiple Wolfcamp intervals. A 3-rig drilling program is underway and is expected to conclude by the end of March. Completion activity at Seawolf is scheduled for Q2, with 1st production expected in 2H 2018. Seawolf offsets Devon’s prolific Fighting Okra Wolfcamp well. The Fighting Okra infill program will also progress in 2018 and be a key contributor to production growth in 2019 (see map pg. 12). BONE SPRING 3rd WOLFCAMP XY A UPPER MIDDLE LOWER Seawolf Development - Rattlesnake Area (Testing 28-wells per section across 5 landing zones) Initial Development Future Potential
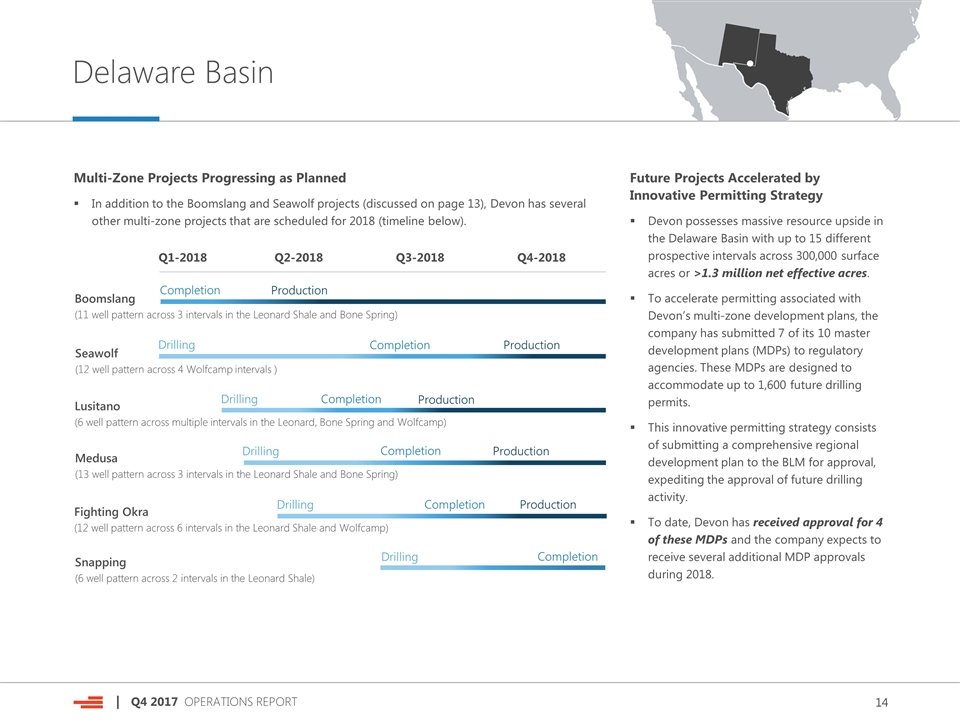
Delaware Basin Future Projects Accelerated by Innovative Permitting Strategy Devon possesses massive resource upside in the Delaware Basin with up to 15 different prospective intervals across 300,000 surface acres or >1.3 million net effective acres. To accelerate permitting associated with Devon’s multi-zone development plans, the company has submitted 7 of its 10 master development plans (MDPs) to regulatory agencies. These MDPs are designed to accommodate up to 1,600 future drilling permits. This innovative permitting strategy consists of submitting a comprehensive regional development plan to the BLM for approval, expediting the approval of future drilling activity. To date, Devon has received approval for 4 of these MDPs and the company expects to receive several additional MDP approvals during 2018. Multi-Zone Projects Progressing as Planned In addition to the Boomslang and Seawolf projects (discussed on page 13), Devon has several other multi-zone projects that are scheduled for 2018 (timeline below). Q1-2018 Q2-2018 Q3-2018 Q4-2018 Boomslang (11 well pattern across 3 intervals in the Leonard Shale and Bone Spring) Drilling Completion Production Drilling Completion Production Drilling Completion Fighting Okra (12 well pattern across 6 intervals in the Leonard Shale and Wolfcamp) Completion Production Production Seawolf (12 well pattern across 4 Wolfcamp intervals ) Lusitano (6 well pattern across multiple intervals in the Leonard, Bone Spring and Wolfcamp) Drilling Completion Medusa (13 well pattern across 3 intervals in the Leonard Shale and Bone Spring) Production Snapping (6 well pattern across 2 intervals in the Leonard Shale) Drilling Completion
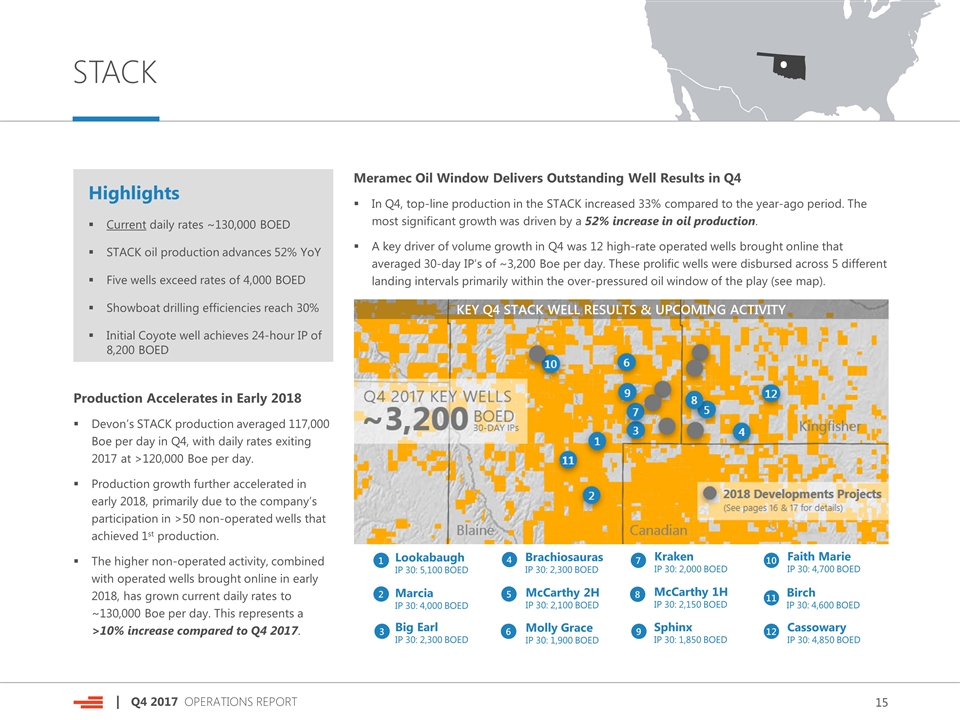
STACK Highlights Current daily rates ~130,000 BOED STACK oil production advances 52% YoY Five wells exceed rates of 4,000 BOED Showboat drilling efficiencies reach 30% Initial Coyote well achieves 24-hour IP of 8,200 BOED Production Accelerates in Early 2018 Devon’s STACK production averaged 117,000 Boe per day in Q4, with daily rates exiting 2017 at >120,000 Boe per day. Production growth further accelerated in early 2018, primarily due to the company’s participation in >50 non-operated wells that achieved 1st production. The higher non-operated activity, combined with operated wells brought online in early 2018, has grown current daily rates to ~130,000 Boe per day. This represents a >10% increase compared to Q4 2017. In Q4, top-line production in the STACK increased 33% compared to the year-ago period. The most significant growth was driven by a 52% increase in oil production. A key driver of volume growth in Q4 was 12 high-rate operated wells brought online that averaged 30-day IP’s of ~3,200 Boe per day. These prolific wells were disbursed across 5 different landing intervals primarily within the over-pressured oil window of the play (see map). Meramec Oil Window Delivers Outstanding Well Results in Q4 11 McCarthy 2H IP 30: 2,100 BOED 12 McCarthy 1H IP 30: 2,150 BOED Kraken IP 30: 2,000 BOED Molly Grace IP 30: 1,900 BOED 1 2 3 4 5 Lookabaugh IP 30: 5,100 BOED Cassowary IP 30: 4,850 BOED Faith Marie IP 30: 4,700 BOED Birch IP 30: 4,600 BOED Brachiosauras IP 30: 2,300 BOED 6 7 8 9 10 Big Earl IP 30: 2,300 BOED Sphinx IP 30: 1,850 BOED Marcia IP 30: 4,000 BOED KEY Q4 STACK WELL RESULTS & UPCOMING ACTIVITY
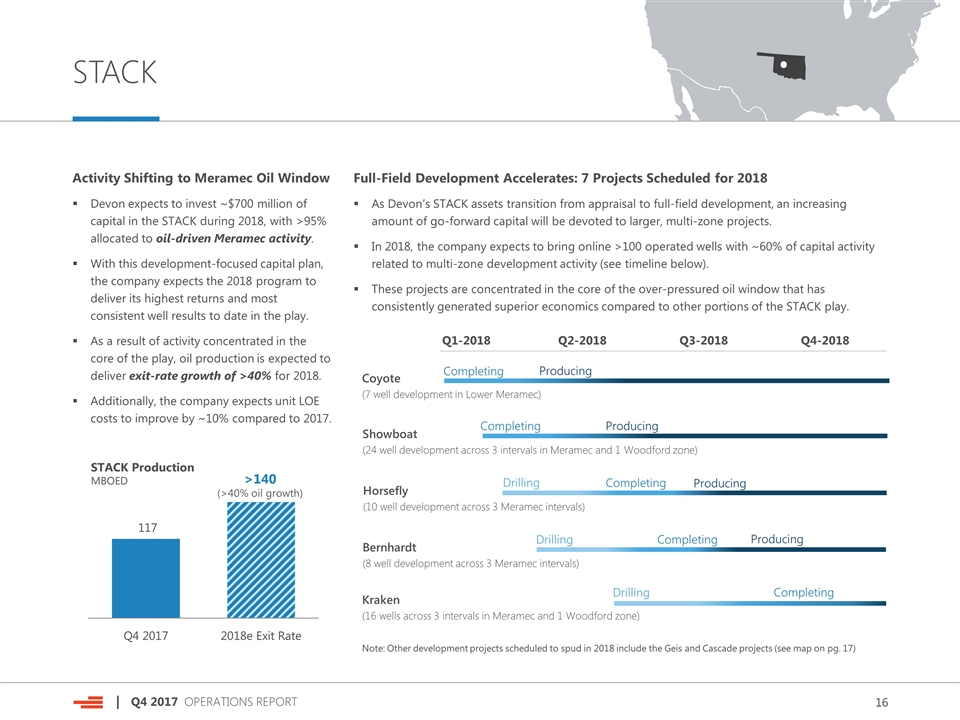
STACK Full-Field Development Accelerates: 7 Projects Scheduled for 2018 As Devon’s STACK assets transition from appraisal to full-field development, an increasing amount of go-forward capital will be devoted to larger, multi-zone projects. In 2018, the company expects to bring online >100 operated wells with ~60% of capital activity related to multi-zone development activity (see timeline below). These projects are concentrated in the core of the over-pressured oil window that has consistently generated superior economics compared to other portions of the STACK play. Q1-2018 Q2-2018 Q3-2018 Q4-2018 Showboat (24 well development across 3 intervals in Meramec and 1 Woodford zone) Drilling Completing Producing Drilling Completing Producing Coyote (7 well development in Lower Meramec) Drilling Completing Kraken (16 wells across 3 intervals in Meramec and 1 Woodford zone) Completing Producing Horsefly (10 well development across 3 Meramec intervals) Bernhardt (8 well development across 3 Meramec intervals) Producing Completing Activity Shifting to Meramec Oil Window Devon expects to invest ~$700 million of capital in the STACK during 2018, with >95% allocated to oil-driven Meramec activity. With this development-focused capital plan, the company expects the 2018 program to deliver its highest returns and most consistent well results to date in the play. As a result of activity concentrated in the core of the play, oil production is expected to deliver exit-rate growth of >40% for 2018. Additionally, the company expects unit LOE costs to improve by ~10% compared to 2017. Note: Other development projects scheduled to spud in 2018 include the Geis and Cascade projects (see map on pg. 17) STACK Production MBOED >140 (>40% oil growth)
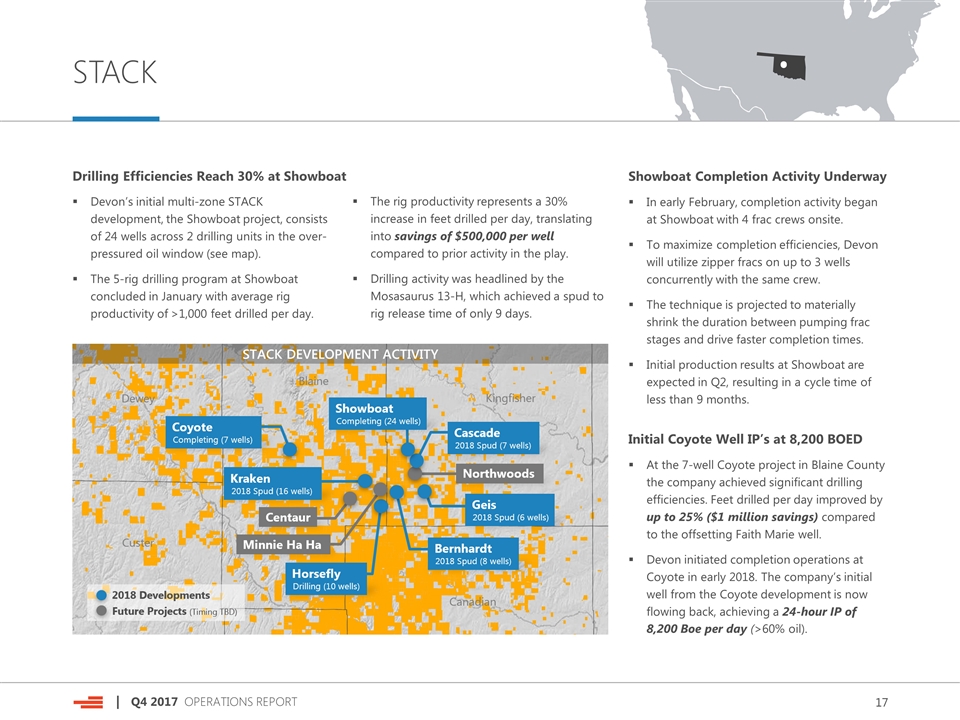
STACK DEVELOPMENT ACTIVITY STACK Drilling Efficiencies Reach 30% at Showboat Devon’s initial multi-zone STACK development, the Showboat project, consists of 24 wells across 2 drilling units in the over-pressured oil window (see map). The 5-rig drilling program at Showboat concluded in January with average rig productivity of >1,000 feet drilled per day. The rig productivity represents a 30% increase in feet drilled per day, translating into savings of $500,000 per well compared to prior activity in the play. Drilling activity was headlined by the Mosasaurus 13-H, which achieved a spud to rig release time of only 9 days. Showboat Completion Activity Underway In early February, completion activity began at Showboat with 4 frac crews onsite. To maximize completion efficiencies, Devon will utilize zipper fracs on up to 3 wells concurrently with the same crew. The technique is projected to materially shrink the duration between pumping frac stages and drive faster completion times. Initial production results at Showboat are expected in Q2, resulting in a cycle time of less than 9 months. Initial Coyote Well IP’s at 8,200 BOED At the 7-well Coyote project in Blaine County the company achieved significant drilling efficiencies. Feet drilled per day improved by up to 25% ($1 million savings) compared to the offsetting Faith Marie well. Devon initiated completion operations at Coyote in early 2018. The company’s initial well from the Coyote development is now flowing back, achieving a 24-hour IP of 8,200 Boe per day (>60% oil).
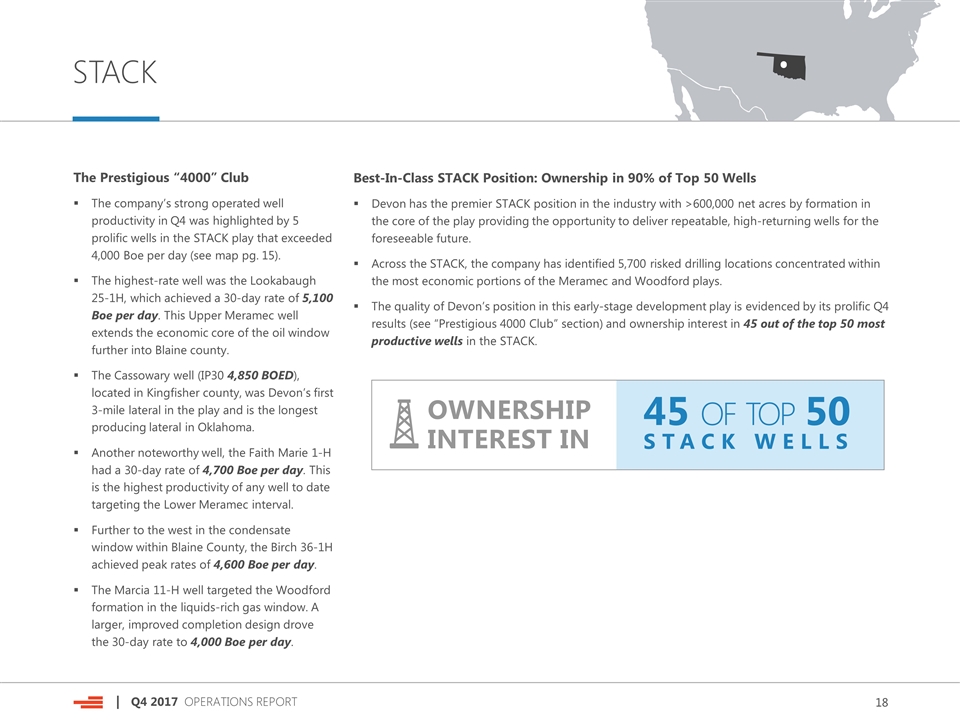
STACK Best-In-Class STACK Position: Ownership in 90% of Top 50 Wells Devon has the premier STACK position in the industry with >600,000 net acres by formation in the core of the play providing the opportunity to deliver repeatable, high-returning wells for the foreseeable future. Across the STACK, the company has identified 5,700 risked drilling locations concentrated within the most economic portions of the Meramec and Woodford plays. The quality of Devon’s position in this early-stage development play is evidenced by its prolific Q4 results (see “Prestigious 4000 Club” section) and ownership interest in 45 out of the top 50 most productive wells in the STACK. The Prestigious “4000” Club The company’s strong operated well productivity in Q4 was highlighted by 5 prolific wells in the STACK play that exceeded 4,000 Boe per day (see map pg. 15). The highest-rate well was the Lookabaugh 25-1H, which achieved a 30-day rate of 5,100 Boe per day. This Upper Meramec well extends the economic core of the oil window further into Blaine county. The Cassowary well (IP30 4,850 BOED), located in Kingfisher county, was Devon’s first 3-mile lateral in the play and is the longest producing lateral in Oklahoma. Another noteworthy well, the Faith Marie 1-H had a 30-day rate of 4,700 Boe per day. This is the highest productivity of any well to date targeting the Lower Meramec interval. Further to the west in the condensate window within Blaine County, the Birch 36-1H achieved peak rates of 4,600 Boe per day. The Marcia 11-H well targeted the Woodford formation in the liquids-rich gas window. A larger, improved completion design drove the 30-day rate to 4,000 Boe per day. 45 OF TOP 50 STACK WELLS OWNERSHIP INTEREST IN
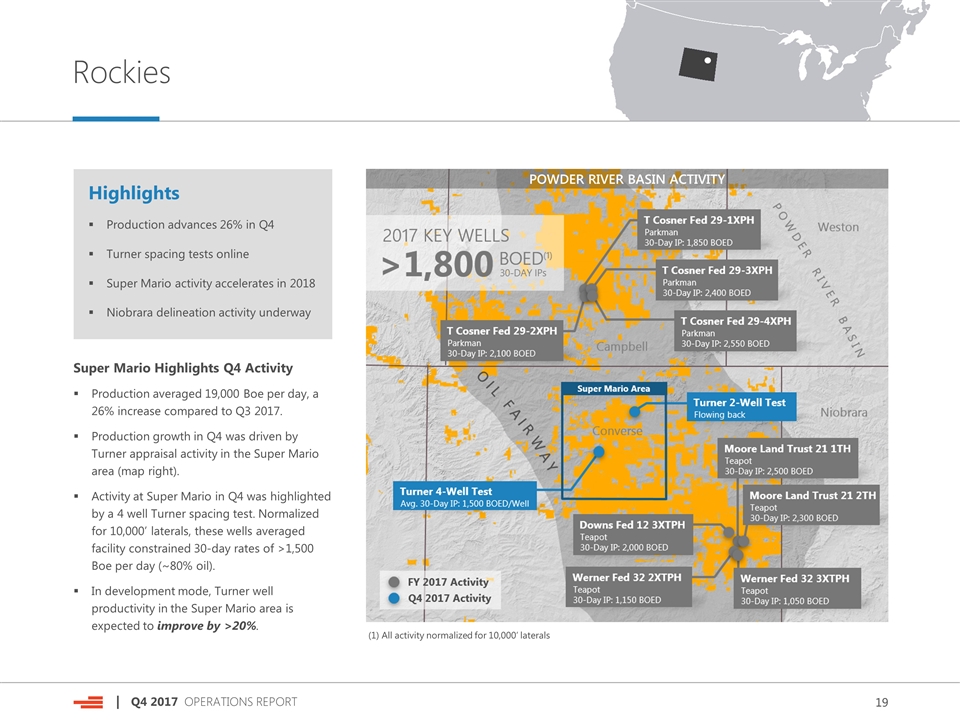
Rockies Highlights Production advances 26% in Q4 Turner spacing tests online Super Mario activity accelerates in 2018 Niobrara delineation activity underway Super Mario Highlights Q4 Activity Production averaged 19,000 Boe per day, a 26% increase compared to Q3 2017. Production growth in Q4 was driven by Turner appraisal activity in the Super Mario area (map right). Activity at Super Mario in Q4 was highlighted by a 4 well Turner spacing test. Normalized for 10,000’ laterals, these wells averaged facility constrained 30-day rates of >1,500 Boe per day (~80% oil). In development mode, Turner well productivity in the Super Mario area is expected to improve by >20%. POWDER RIVER BASIN ACTIVITY (1) All activity normalized for 10,000’ laterals
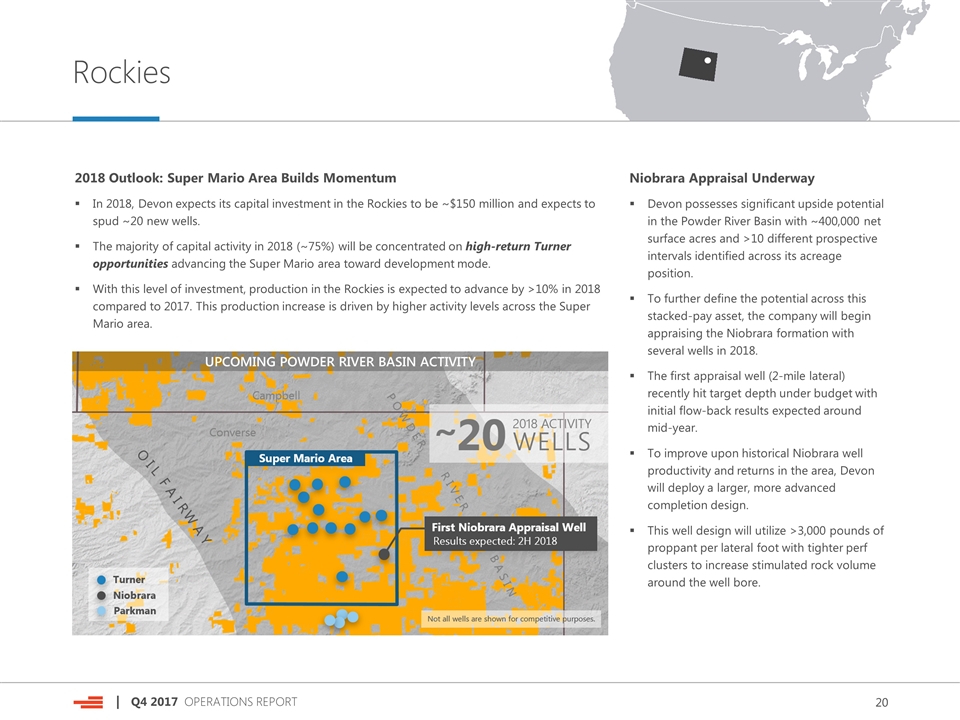
Rockies Niobrara Appraisal Underway Devon possesses significant upside potential in the Powder River Basin with ~400,000 net surface acres and >10 different prospective intervals identified across its acreage position. To further define the potential across this stacked-pay asset, the company will begin appraising the Niobrara formation with several wells in 2018. The first appraisal well (2-mile lateral) recently hit target depth under budget with initial flow-back results expected around mid-year. To improve upon historical Niobrara well productivity and returns in the area, Devon will deploy a larger, more advanced completion design. This well design will utilize >3,000 pounds of proppant per lateral foot with tighter perf clusters to increase stimulated rock volume around the well bore. 2018 Outlook: Super Mario Area Builds Momentum In 2018, Devon expects its capital investment in the Rockies to be ~$150 million and expects to spud ~20 new wells. The majority of capital activity in 2018 (~75%) will be concentrated on high-return Turner opportunities advancing the Super Mario area toward development mode. With this level of investment, production in the Rockies is expected to advance by >10% in 2018 compared to 2017. This production increase is driven by higher activity levels across the Super Mario area. UPCOMING POWDER RIVER BASIN ACTIVITY
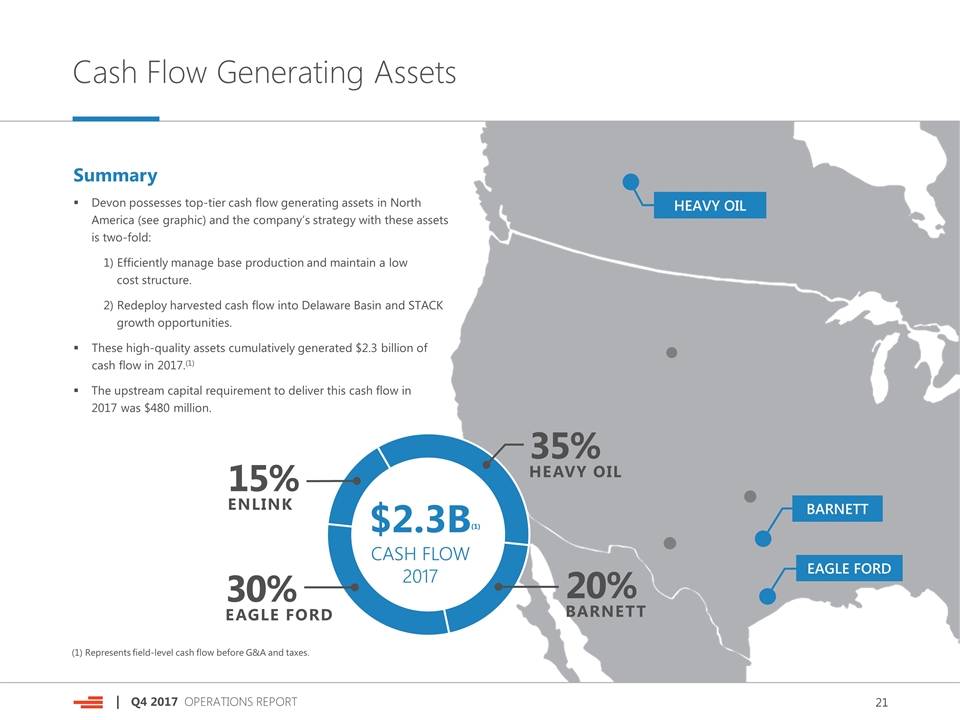
Cash Flow Generating Assets Summary Devon possesses top-tier cash flow generating assets in North America (see graphic) and the company’s strategy with these assets is two-fold: 1) Efficiently manage base production and maintain a low cost structure. 2) Redeploy harvested cash flow into Delaware Basin and STACK growth opportunities. These high-quality assets cumulatively generated $2.3 billion of cash flow in 2017.(1) The upstream capital requirement to deliver this cash flow in 2017 was $480 million. HEAVY OIL BARNETT EAGLE FORD 30% EAGLE FORD 20% BARNETT 15% ENLINK $2.3B(1) CASH FLOW 2017 35% HEAVY OIL (1) Represents field-level cash flow before G&A and taxes.
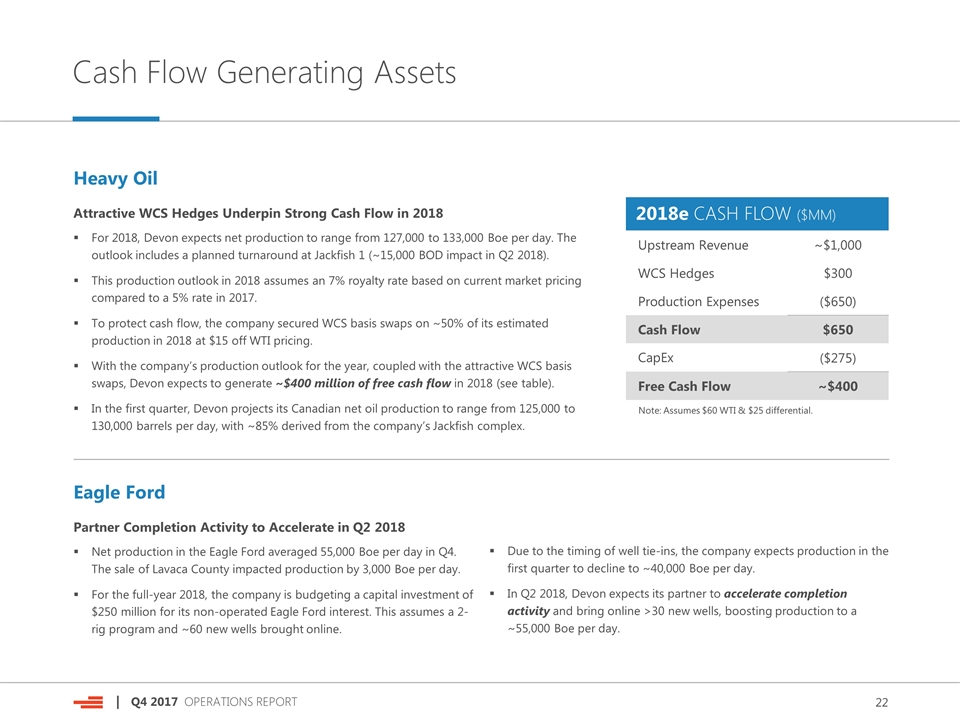
Cash Flow Generating Assets Eagle Ford Partner Completion Activity to Accelerate in Q2 2018 Net production in the Eagle Ford averaged 55,000 Boe per day in Q4. The sale of Lavaca County impacted production by 3,000 Boe per day. For the full-year 2018, the company is budgeting a capital investment of $250 million for its non-operated Eagle Ford interest. This assumes a 2-rig program and ~60 new wells brought online. Due to the timing of well tie-ins, the company expects production in the first quarter to decline to ~40,000 Boe per day. In Q2 2018, Devon expects its partner to accelerate completion activity and bring online >30 new wells, boosting production to a ~55,000 Boe per day. Heavy Oil Attractive WCS Hedges Underpin Strong Cash Flow in 2018 For 2018, Devon expects net production to range from 127,000 to 133,000 Boe per day. The outlook includes a planned turnaround at Jackfish 1 (~15,000 BOD impact in Q2 2018). This production outlook in 2018 assumes an 7% royalty rate based on current market pricing compared to a 5% rate in 2017. To protect cash flow, the company secured WCS basis swaps on ~50% of its estimated production in 2018 at $15 off WTI pricing. With the company’s production outlook for the year, coupled with the attractive WCS basis swaps, Devon expects to generate ~$400 million of free cash flow in 2018 (see table). In the first quarter, Devon projects its Canadian net oil production to range from 125,000 to 130,000 barrels per day, with ~85% derived from the company’s Jackfish complex. 2018e CASH FLOW ($MM) Upstream Revenue ~$1,000 WCS Hedges $300 Production Expenses ($650) Cash Flow $650 CapEx ($275) Free Cash Flow ~$400 Note: Assumes $60 WTI & $25 differential.
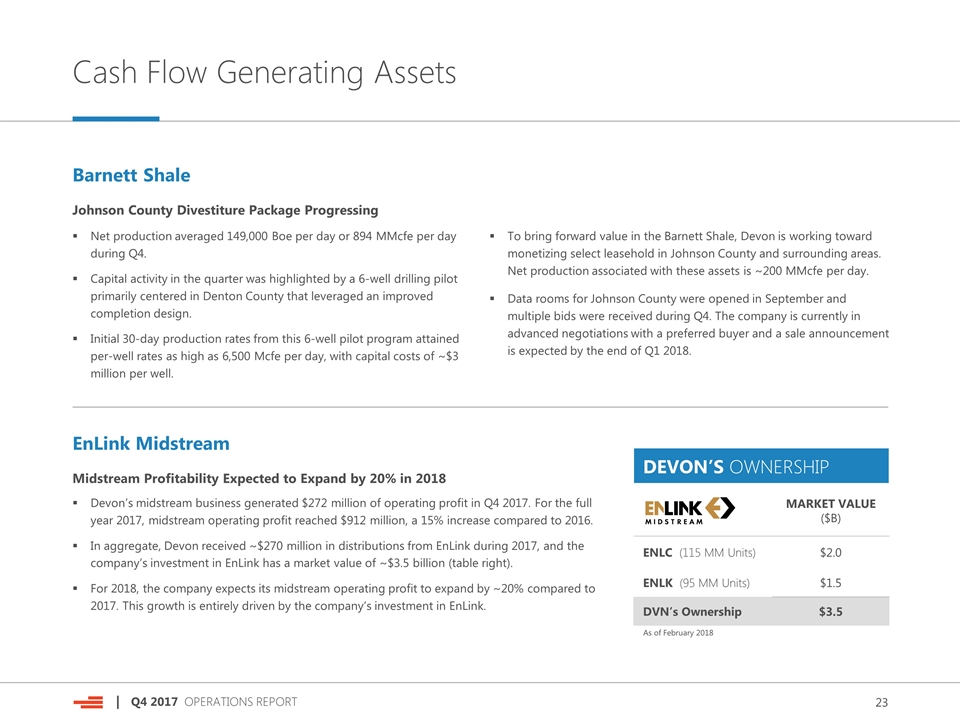
Cash Flow Generating Assets Barnett Shale Johnson County Divestiture Package Progressing Net production averaged 149,000 Boe per day or 894 MMcfe per day during Q4. Capital activity in the quarter was highlighted by a 6-well drilling pilot primarily centered in Denton County that leveraged an improved completion design. Initial 30-day production rates from this 6-well pilot program attained per-well rates as high as 6,500 Mcfe per day, with capital costs of ~$3 million per well. To bring forward value in the Barnett Shale, Devon is working toward monetizing select leasehold in Johnson County and surrounding areas. Net production associated with these assets is ~200 MMcfe per day. Data rooms for Johnson County were opened in September and multiple bids were received during Q4. The company is currently in advanced negotiations with a preferred buyer and a sale announcement is expected by the end of Q1 2018. EnLink Midstream Midstream Profitability Expected to Expand by 20% in 2018 Devon’s midstream business generated $272 million of operating profit in Q4 2017. For the full year 2017, midstream operating profit reached $912 million, a 15% increase compared to 2016. In aggregate, Devon received ~$270 million in distributions from EnLink during 2017, and the company’s investment in EnLink has a market value of ~$3.5 billion (table right). For 2018, the company expects its midstream operating profit to expand by ~20% compared to 2017. This growth is entirely driven by the company’s investment in EnLink. DEVON’S OWNERSHIP MARKET VALUE ($B) ENLC (115 MM Units) $2.0 ENLK (95 MM Units) $1.5 DVN’s Ownership $3.5 As of February 2018
Contacts & Investor Notices Investor Relations Contacts Scott CoodyChris Carr VP, Investor RelationsSupervisor, Investor Relations 405-552-4735405-228-2496 Email: investor.relations@dvn.com Forward-Looking Statements This presentation includes "forward-looking statements" as defined by the Securities and Exchange Commission (the “SEC”). Such statements include those concerning strategic plans, expectations and objectives for future operations, and are often identified by use of the words “expects,” “believes,” “will,” “would,” “could,” “forecasts,” “projections,” “estimates,” “plans,” “expectations,” “targets,” “opportunities,” “potential,” “anticipates,” “outlook” and other similar terminology. All statements, other than statements of historical facts, included in this presentation that address activities, events or developments that the Company expects, believes or anticipates will or may occur in the future are forward-looking statements. Such statements are subject to a number of assumptions, risks and uncertainties, many of which are beyond the control of the Company. Statements regarding our business and operations are subject to all of the risks and uncertainties normally incident to the exploration for and development and production of oil and gas. These risks include, but are not limited to: the volatility of oil, gas and NGL prices; uncertainties inherent in estimating oil, gas and NGL reserves; the extent to which we are successful in acquiring and discovering additional reserves; the uncertainties, costs and risks involved in oil and gas operations; regulatory restrictions, compliance costs and other risks relating to governmental regulation, including with respect to environmental matters; risks related to our hedging activities; counterparty credit risks; risks relating to our indebtedness; cyberattack risks; our limited control over third parties who operate our oil and gas properties; midstream capacity constraints Investor Notices and potential interruptions in production; the extent to which insurance covers any losses we may experience; competition for leases, materials, people and capital; our ability to successfully complete mergers, acquisitions and divestitures; and any of the other risks and uncertainties identified in our Form 10-K and our other filings with the SEC. Investors are cautioned that any such statements are not guarantees of future performance and that actual results or developments may differ materially from those projected in the forward-looking statements. The forward-looking statements in this presentation are made as of the date of this presentation, even if subsequently made available by Devon on its website or otherwise. Devon does not undertake any obligation to update the forward-looking statements as a result of new information, future events or otherwise. Use of Non-GAAP Information This presentation may include non-GAAP financial measures. Such non-GAAP measures are not alternatives to GAAP measures, and you should not consider these non-GAAP measures in isolation or as a substitute for analysis of our results as reported under GAAP. For additional disclosure regarding such non-GAAP measures, including reconciliations to their most directly comparable GAAP measure, please refer to Devon’s fourth-quarter 2017 earnings release at www.devonenergy.com. Cautionary Note to Investors The SEC permits oil and gas companies, in their filings with the SEC, to disclose only proved, probable and possible reserves that meet the SEC's definitions for such terms, and price and cost sensitivities for such reserves, and prohibits disclosure of resources that do not constitute such reserves. This presentation may contain certain terms, such as resource potential, potential locations, risked and unrisked locations, estimated ultimate recovery (EUR), exploration target size and other similar terms. These estimates are by their nature more speculative than estimates of proved, probable and possible reserves and accordingly are subject to substantially greater risk of being actually realized. The SEC guidelines strictly prohibit us from including these estimates in filings with the SEC. Investors are urged to consider closely the disclosure in our Form 10-K, available at www.devonenergy.com. You can also obtain this form from the SEC by calling 1-800-SEC-0330 or from the SEC’s website at www.sec.gov.
