Attached files
| file | filename |
|---|---|
| 8-K - 8-K - SOUTHWEST IOWA RENEWABLE ENERGY, LLC | form8k.htm |
Exhibit 99.1

201 Annua Meeting Fisca ea 201 eview

FORWARD-LOOKING STATEMENTS AND DISCLAIMER This presentation contains certain forward-looking statements within the meaning of the Private SecuritiesLitigation Reform Act of 1995. Such statements are made in good faith by Southwest Iowa RenewableEnergy, LLC (“SIRE,” “us” or “we”) and are identified by including terms such as “may,” “will,” “should,”“expects,” “anticipates,” “estimates,” “plans,” or similar language. In connection with these safe-harbor provisions, SIRE has identified in its annual report on Form 10-K, and in its other filings with the SEC, important factors that could cause actual results to differ materially from those contained in any forward-looking statement made by or on behalf of SIRE, including, without limitation, the risk and nature of ourbusiness and the effects of general economic conditions on us. We may experience significantfluctuations in future operating results due to a number of economic conditions, including, but notlimited to, competition in the ethanol industry, commodity market risks, financial market risks, counter-party risks, and risks associated with changes to federal policy or regulation. The cautionary statements and risk factors in this disclaimer and our Form 10-K expressly qualify all of SIRE’s forward-looking statements inthis presentation. The forward-looking statements contained in this presentation are included in thesafe harbor protection provided by Section 27A of the Securities Act of 1933. SIRE further cautions thatsuch factors are not exhaustive or exclusive. SIRE does not undertake to update any forward-lookingstatement which may be made from time to time by or on behalf of SIRE unless an update is required byapplicable securities laws.

Focus for 2017 • Return to Shareholders • Operate Safely • Operate Profitably • Manage Risk • Operate Plant at High Volume When Margins Allow • Continue Retiring Debt Quickly • Plan for 2017 thru 2020
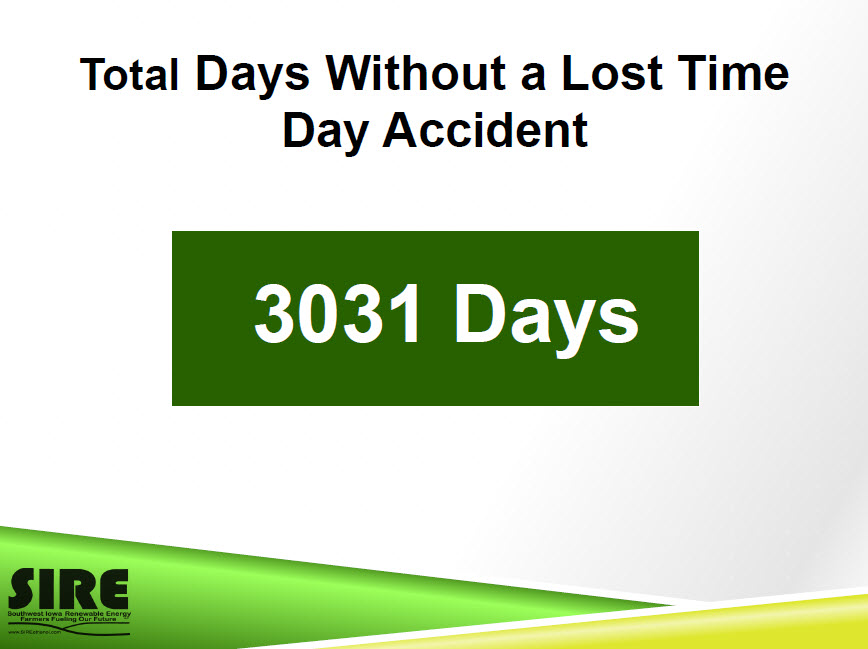
Total Days Without a Lost Time Day Accident 3031 Days
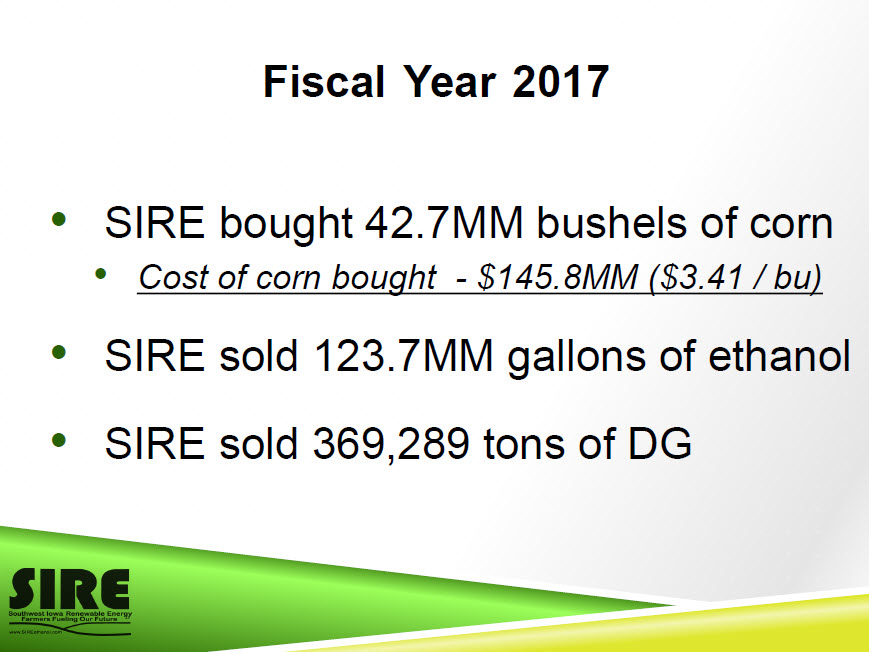
Fiscal Year 2017 • SIRE bought 42.7MM bushels of corn • Cost of corn bought - $145.8MM ($3.41 / bu) • SIRE sold 123.7MM gallons of ethanol • SIRE sold 369,289 tons of DG

Net Income In Millions $ $16.00 $14.00 $12.00 $10.00 $8.00 $6.00 $4.00 $2.00 $- $13.76 FYE 9/30/15 $5.09 FYE 9/30/16 $13.45 FYE 9/30/17 $1.18 QE 12/31/17

EBITDA In Millions $ $30.00 $25.00 $20.00 $15.00 $10.00 $5.00 $- $27.29 $18.27 $26.62 $4.63 FYE 9/30/15 FYE 9/30/16 FYE 9/30/17 QE 12/31/17

Ethanol Production In Millions of Gallons 130 110 90 70 50 30 10 123.0 FYE 9/30/15 122.3 FYE 9/30/16 124.1 FYE 9/30/17 31.7 QE 12/31/17

Bank Debt In Millions $ $140.00 $124.10 $120.00 $100.00 $80.00 $60.00 $40.00 $20.00 $- 9/30/13 $56.71 $30.89 9/30/14 9/30/15 $27.36 $16.10 9/30/16 9/30/17 Subdebt Bank Debt $9.00 12/31/17

Costs In Dollars per gallon $0.60 Depreciation Interest $0.50 Operations $0.40$0.30 $0.20 $0.10 $- 9/30/15 9/30/16 9/30/17 12/31/17

Book Value per Share Per Unit (12/31/17 less $500 accrued distribution) $9,000 $8,000 $7,602 $7,000 $6,000 $5,000 $4,000 $3,000 $2,000 $1,000 9/30/15 $8,403 $7,734 9/30/16 9/30/17 $7,992 12/31/17

UNITS TRADED # Number of Shares Price Per Share 2/6/2018 3 $5,353 2/2/2018 3 $5,500 2/2/2018 3 $5,500 2/2/2018 3 $5,353 10/19/2017 11 $5,200 10/5/2017 8 $5,400 10/5/2017 4 $5,400 10/5/2017 2 $5,400 10/5/2017 10 $5,400 10/5/2017 2 $5,400 # SOURCE WWW.SIREETHANOL.COM\INVESTOR RELATIONS

NEW COOLING TOWER

NEW HAMMERMILLS
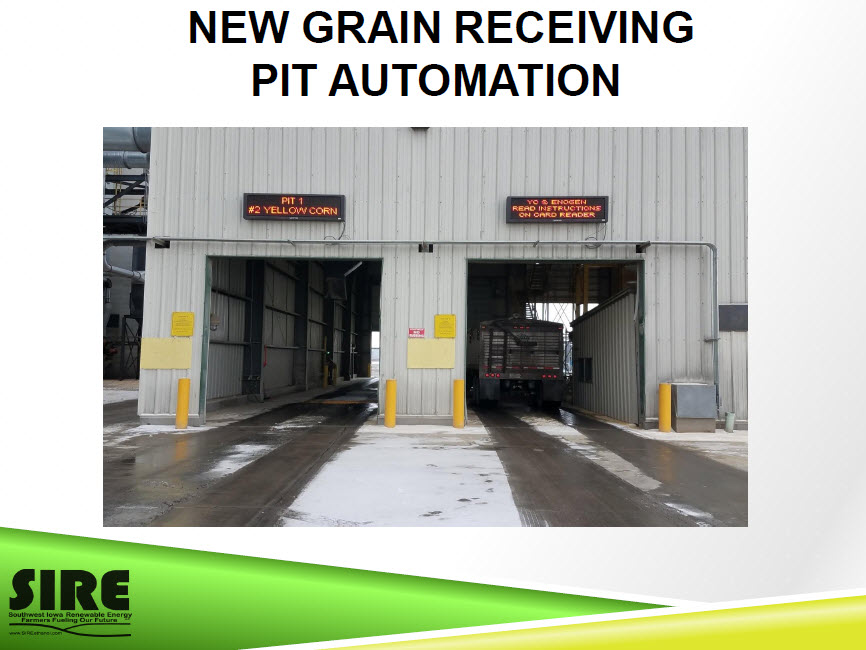
NEW GRAIN RECEIVING PIT AUTOMATION

NEW EtOH TRUCK LOADOUT

2017 - OVER A BILLION GALLONS SOLD
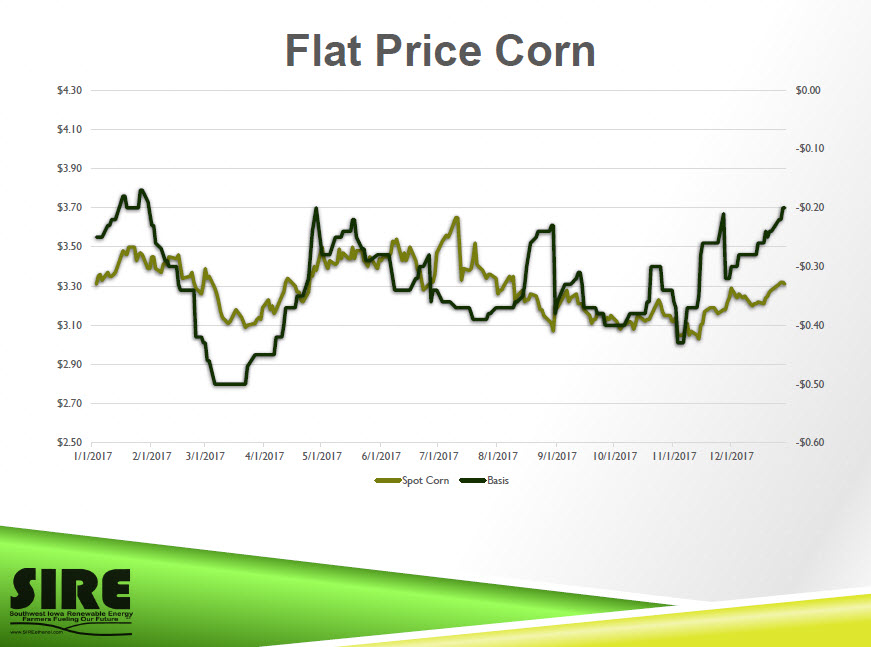
Flat Price Corn $4.30 $0.00 $4.10 -$0.10 $3.90 $3.70 -$0.20 $3.50 -$0.30 $3.30 $3.10 -$0.40 $2.90 -$0.50 $2.70 $2.50 -$0.60 1/1/2017 2/1/2017 3/1/2017 4/1/2017 5/1/2017 6/1/2017 7/1/2017 8/1/2017 9/1/2017 10/1/2017 11/1/2017 12/1/2017 Spot Corn Basis

DDG Price & Relationship to Corn $190.00 190% $170.00 170% $150.00 150% $130.00 130% $110.00 110% $90.00 90% $70.00 70% $50.00 50% 1/1/2017 2/1/2017 3/1/2017 4/1/2017 5/1/2017 6/1/2017 7/1/2017 8/1/2017 9/1/2017 10/1/2017 11/1/2017 12/1/2017 Spot DDG Value to Corn

Ethanol Price & Production $3.00 1200 $2.50 1000 $2.00 800 $1.50 600 $1.00 400 $0.50 200 $0.00 0 Ethanol Production (Thousand Barrels per Day) Iowa Ethanol Price

Financial Summary February 2018

Operational Information FYE 9/30/15 FYE 9/30/16 FYE 9/30/17 QE 12/31/17 Gallons Sold (millions) 122.4 122.0 123.7 30.0 Average Price/Gallon $1.53 $1.42 $1.44 $1.31 Bushels Ground(millions) Net Cost of CornGround 43.0 42.9 $155.6 $151.3 42.4 10.7 $142.1 $34.4 Yield (Ethanol/Bushel) 2.86 2.85 2.93 2.96 Yield (Corn Oil/Bushel) 0.76 0.79 0.85 0.89

Financial Highlights (millions, except per gallon) FYE 9/30/15 FYE 9/30/16 FYE 9/30/17 QE 12/31/17 Revenue $242.1 $223.3 $219.8 $50.5 Cost of Corn $155.6 $151.3 $142.1 $34.4 Crush Margin / Gallon $0.71 $0.56 $0.64 $0.59 EBITDA $27.3 $18.3 $26.6 $4.6 Net Income $13.8 $5.1 $13.4 $1.2

Financial Highlights (millions) FYE 9/30/15 FYE 9/30/16 FYE 9/30/17 QE 12/31/17 Bank Debt $30.9 $27.4 $16.1 $9.0 Bank Debt/Gallon $0.25 $0.22 $0.13 $0.07 Bank Debt-Repayment Interest Payments $(0.9) $3.5 $1.9 $1.3 $11.3 $7.1 $1.1 $0.2

Financial Highlights (millions, except per unit) Calendar Calendar Calendar Month Cumulative 12/31/15 12/31/16 12/31/17 01/16/18 To Date Distributions $13.3 $3.3 $4.5 $6.7 $28.9 Taxable Income Tax Loss Carryforward $9.9 $16.9 $64.1 $47.2 $13.6 N/A N/A $33.6 N/A N/A Tax Loss Carryforward $4,809 $3,543 $2,524 N/A N/A per Unit Distribution % of Prior Year 23% 34% 27% 49% N/A Taxable Income
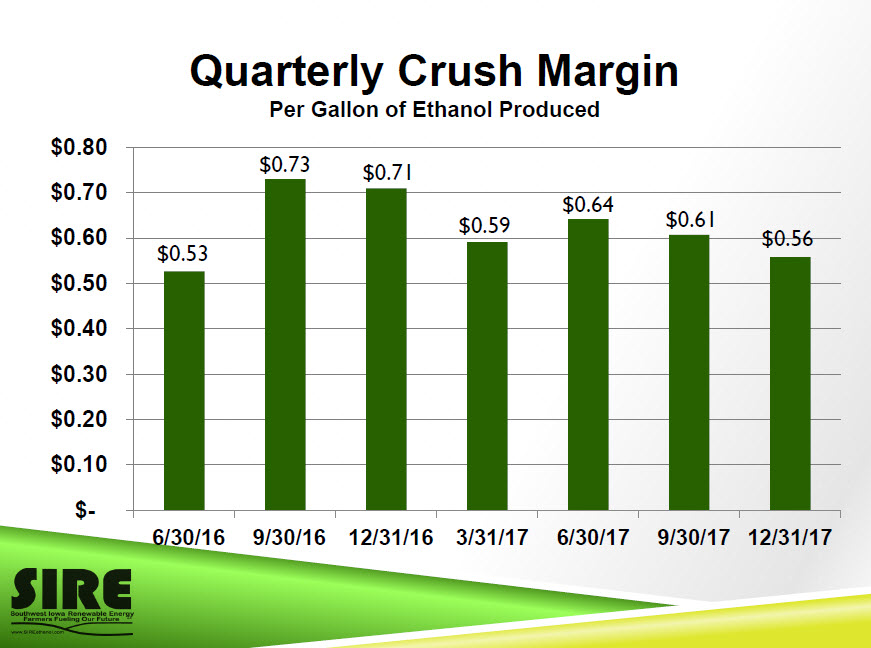
Quarterly Crush Margin Per Gallon of Ethanol Produced $0.80 $0.70 $0.60 $0.50 $0.40 $0.30 $0.20 $0.10 $- $0.73 $0.53 6/30/16 9/30/16 $0.71 $0.64 $0.59 12/31/16 3/31/17 6/30/17 $0.61 $0.56 9/30/17 12/31/17
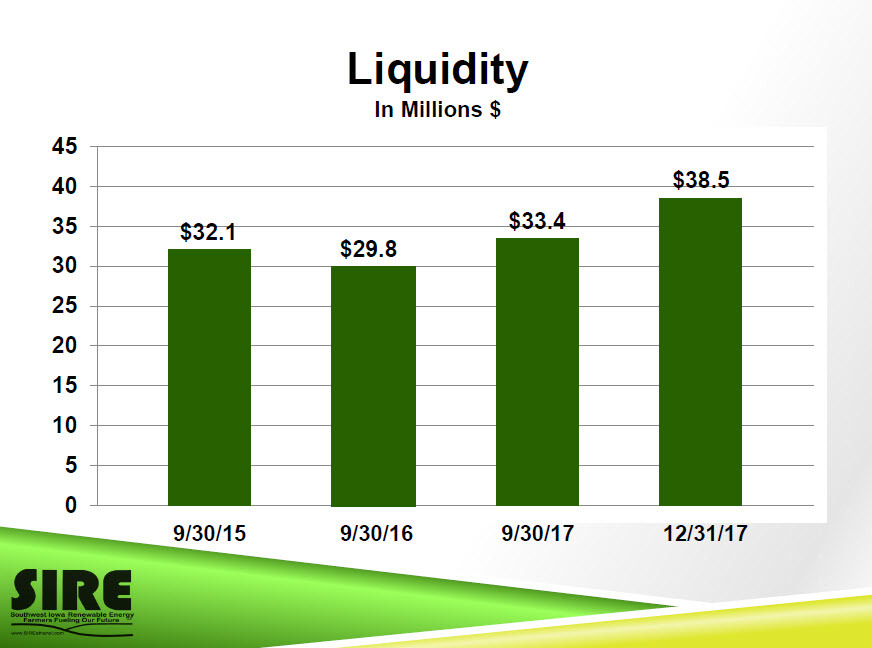
Liquidity In Millions $ 45 40 35 30 25 20 15 10 5 0 $32.1 $29.8 9/30/15 9/30/16 $38.5 $33.4 9/30/17 12/31/17
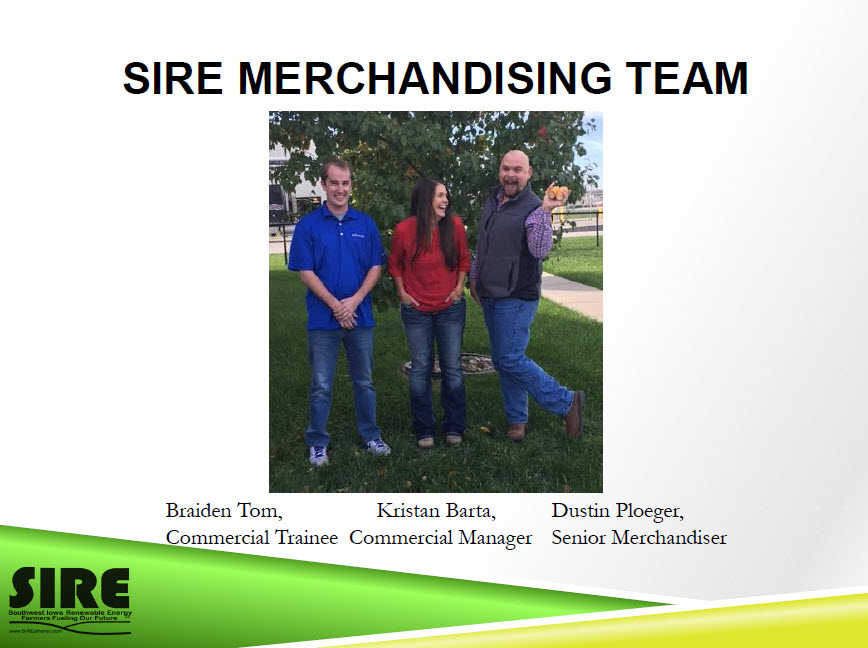
SIRE MERCHANDISING TEAM Braiden Tom, Kristan Barta, Dustin Ploeger, Commercial Trainee Commercial Manager Senior Merchandiser

2018 CORN REVIEW • Acres • Yield • Usage • Stocks • Local Markets
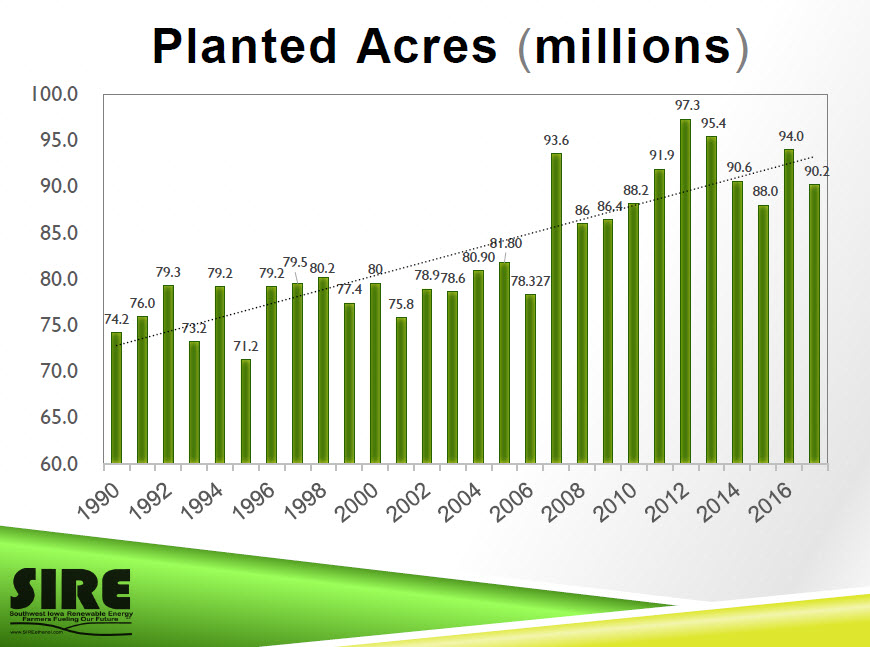
Planted Acres (millions) 100.0 97.3 95.4 95.0 90.0 85.0 93.6 86 86.4 81.80 94.0 91.9 90.6 90.2 88.2 88.0 80.0 75.0 70.0 65.0 60.0 79.3 76.0 74.2 79.5 79.2 79.2 73.2 71.2 80.90 80.2 80 78.978.6 77.4 75.8 78.327

180.0 Yield (bushels per acre) 171.0 176.6 174.6 170.0 160.4 160.0 164.7 151.1 168.4 158.1 150.0 140.0 138.6 134.4 148.0 153.8 152.8 149.1 147.2 142.3 136.9 138.2 130.0 120.0 110.0 100.0 90.0 80.0 131.5 118.5 108.6 100.7 133.8 127.2 126.6 113.5 129.4 123.1

Total Supply (millions) 18,000 16,00014,000 12,000 10,0008,0006,000 4,0002,000 0

Total Usage (millions) 8,000 7,0006,0005,0004,0003,0002,0001,000 0 Food, Alcohol & Industrial Feed & Residual EXPORTS
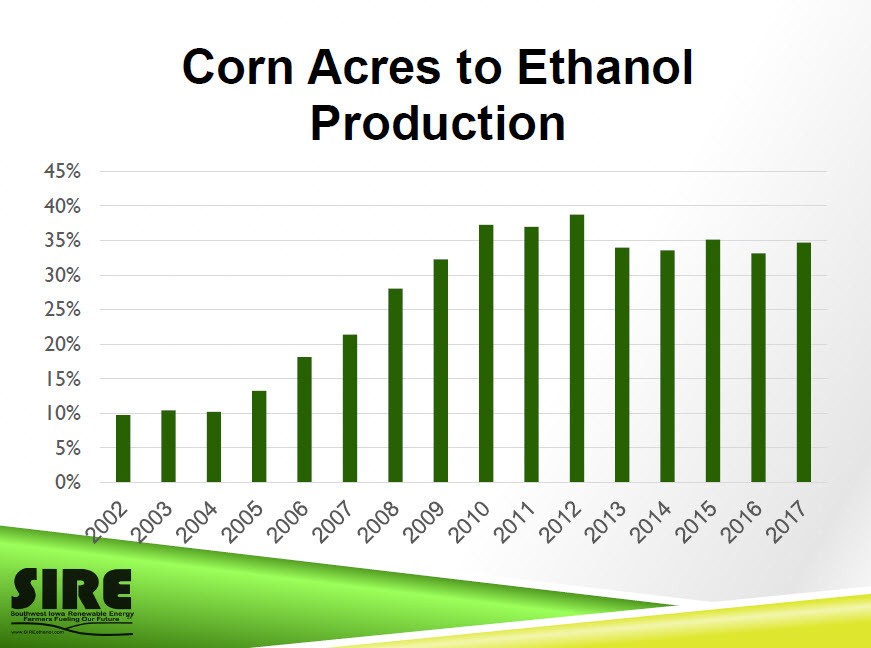
Corn Acres to Ethanol Production 45% 40%35%30%25%20%15%10% 5% 0%

SIRE CORN 2018 • 48 Million Bushels to Buy • Flat Price, Deferred pricing, Basis contracts, HTA’s,Alliance Advantage, On Farm Pick-Up. • Enogen / EGQS Program • Competitive market for our local producers while buyingthe best netback for SIRE.
SIRE CORN 2018 • Expecting largely uneventful basis moves - but seasonal • Selling outside of Harvest has been slow and predictable • Watch for quick-ship opportunities based on logistics • Local markets are anticipating producers carrying lengthinto the summer months (similar to last year)
SIRE STRENGTHS • Our greatest strength in corn merchandising comes from our shareholder base - we value your business!!!

Industry Statistics

ETHANOL STOCKS 2009 - 2017

ETHANOL PRODUCTION 2005-2018
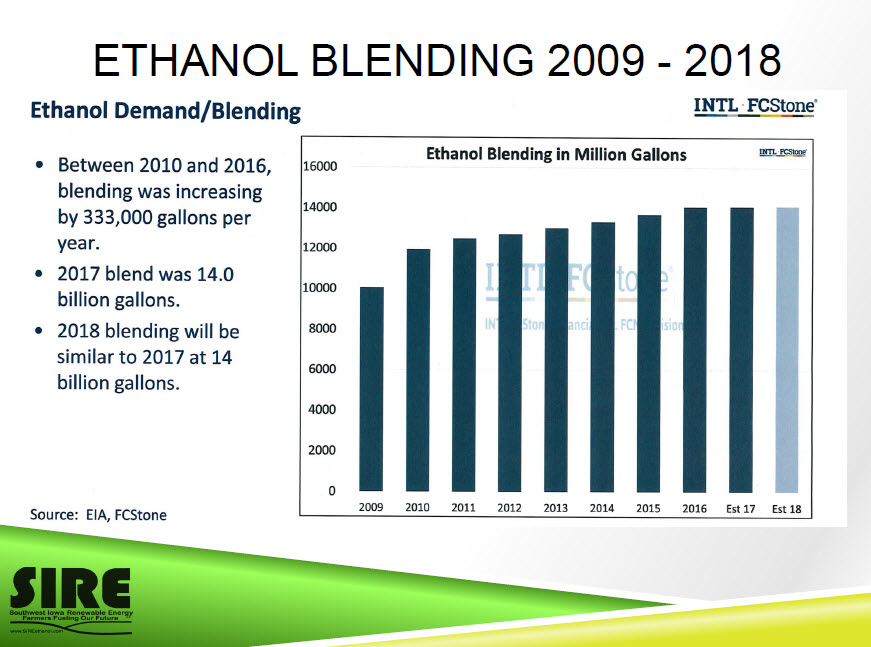
ETHANOL BLENDING 2009 - 2018

ETHANOL BLEND WALL 2008 - 2017

ETHANOL EXPORTS 2010 - 2018
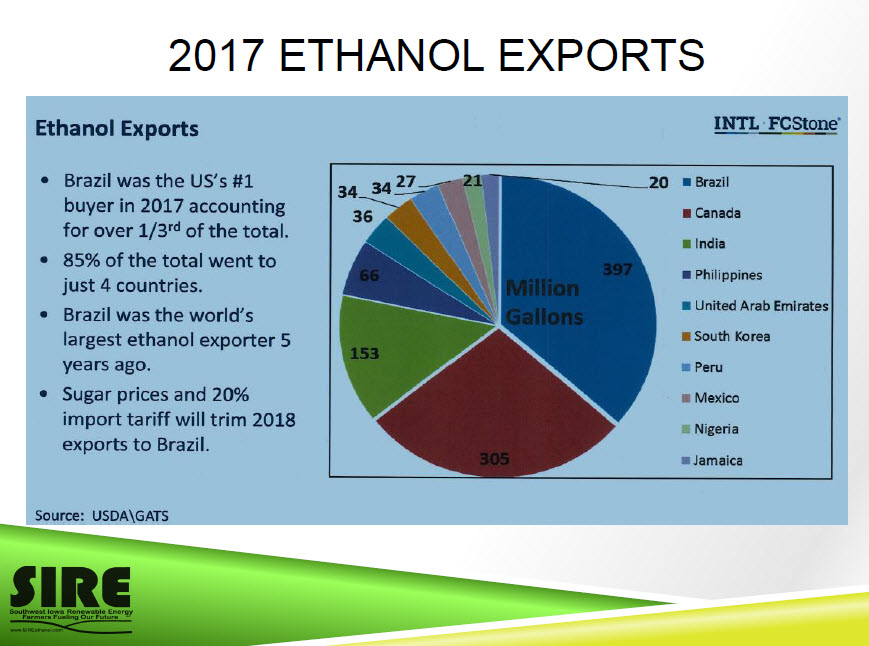
2017 ETHANOL EXPORTS
Focus for 2018 ✓ Operate Safely ✓ Return to Shareholders✓ Operate Profitably✓ Manage Risk ✓ Operate Plant at High Volume When Margins Allow✓ Continue Retiring Debt ✓ Maintain and Improve Plant Efficiency and Reliability with Reinvestment in the Plant ✓ Analyze expansion plans/diversification✓ Plan for 2018 thru 2021 ✓ Questions ?

THANK YOU!