Attached files
| file | filename |
|---|---|
| EX-99.1 - PRESS RELEASE - PORTLAND GENERAL ELECTRIC CO /OR/ | exhibit9912017annualpressr.htm |
| 8-K - FORM 8-K - PORTLAND GENERAL ELECTRIC CO /OR/ | a8-k2017annualpressrelease.htm |

Portland
General
Electric
Earnings
Conference Call
Fourth Quarter and
Full-Year 2017
Exhibit 99.2

Cautionary Statement
Information Current as of February 16, 2018
Except as expressly noted, the information in this presentation is current as of February 16, 2018 — the date on which PGE filed its
Annual Report on Form 10-K for the year ended December 31, 2017 — and should not be relied upon as being current as of any
subsequent date. PGE undertakes no duty to update this presentation, except as may be required by law.
Forward-Looking Statements
Statements in this news release that relate to future plans, objectives, expectations, performance, events and the like may constitute
“forward-looking statements” within the meaning of the Private Securities Litigation Reform Act of 1995, Section 27A of the Securities Act
of 1933, as amended, and Section 21E of the Securities Exchange Act of 1934, as amended. Forward-looking statements include
statements regarding earnings guidance; statements regarding future load, hydro conditions and operating and maintenance costs;
statements concerning implementation of the company’s integrated resource plan; statements concerning future compliance with
regulations limiting emissions from generation facilities and the costs to achieve such compliance; as well as other statements containing
words such as “anticipates,” “believes,” “intends,” “estimates,” “promises,” “expects,” “should,” “conditioned upon,” and similar expressions.
Investors are cautioned that any such forward-looking statements are subject to risks and uncertainties, including reductions in demand for
electricity; the sale of excess energy during periods of low demand or low wholesale market prices; operational risks relating to the
company’s generation facilities, including hydro conditions, wind conditions, disruption of fuel supply, and unscheduled plant outages,
which may result in unanticipated operating, maintenance and repair costs, as well as replacement power costs; failure to complete capital
projects on schedule or within budget, or the abandonment of capital projects, which could result in the company’s inability to recover
project costs; the costs of compliance with environmental laws and regulations, including those that govern emissions from thermal power
plants; changes in weather, hydroelectric and energy markets conditions, which could affect the availability and cost of purchased power
and fuel; changes in capital market conditions, which could affect the availability and cost of capital and result in delay or cancellation of
capital projects; the outcome of various legal and regulatory proceedings; and general economic and financial market conditions. As a
result, actual results may differ materially from those projected in the forward-looking statements. All forward-looking statements included
in this news release are based on information available to the company on the date hereof and such statements speak only as of the date
hereof. The company assumes no obligation to update any such forward-looking statement. Prospective investors should also review the
risks and uncertainties listed in the company’s most recent annual report on form 10-K and the company’s reports on forms 8-K and 10-Q
filed with the United States Securities and Exchange Commission, including management’s discussion and analysis of financial condition
and results of operations and the risks described therein from time to time.
2

Leadership
Presenting
Today
Jim Lobdell
Senior VP
of Finance,
CFO & Treasurer
Maria Pope
President & CEO
On Today's Call
• Financial performance
• Accomplishments
• Economic Update
• Energy Imbalance Market participation
• 2016 Integrated Resource Plan
• 2019 General Rate Case
• Tax reform
• Financial update
• Earnings guidance
3

2017 Earnings Results
NI in millions Q4 2017 Q4 2016 FY 2017 FY 2016
Net Income $42 $61 $187 $193
Diluted EPS $0.48 $0.68 $2.10 $2.16
Non-GAAP Diluted EPS $0.67 $0.68 $2.29 $2.16
2016 EPS:
$2.16
2017 EPS:
$2.10
Non-GAAP 2017 EPS:
$2.29
4
Q1
Q1
Q2 Q2
Q3
Q4
Q3
Q4
Non-
GAAP
EPS:
$0.67
Tax
Reform
$0.19 Q1
Q2
Q4

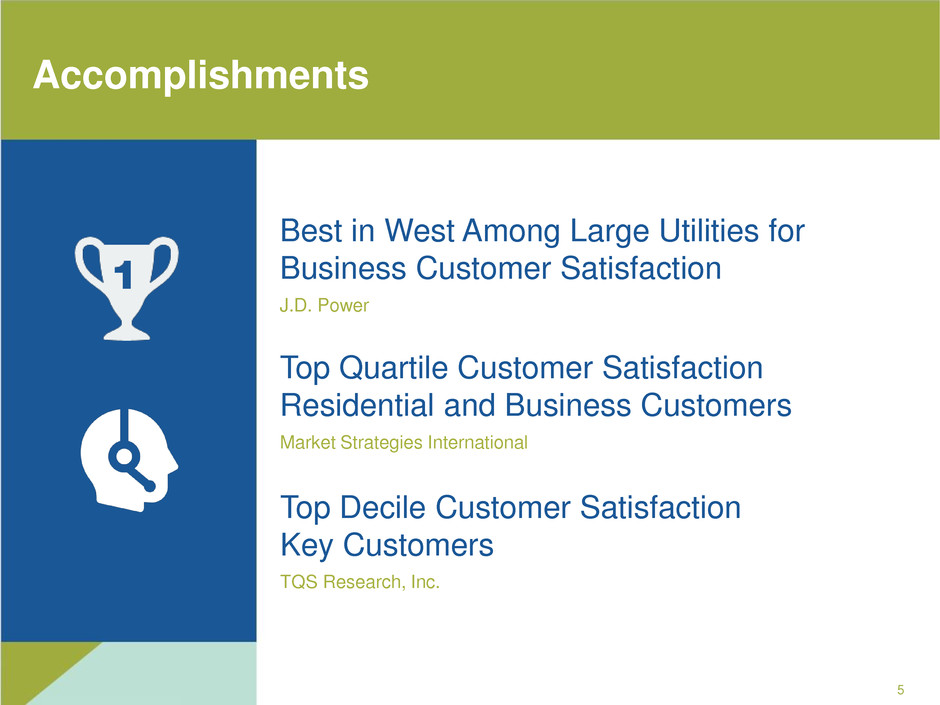
Accomplishments
Best in West Among Large Utilities for
Business Customer Satisfaction
J.D. Power
Top Quartile Customer Satisfaction
Residential and Business Customers
Market Strategies International
5
Top Decile Customer Satisfaction
Key Customers
TQS Research, Inc.

• Oregon's job market in 2017 was
the strongest on record, with
full-year total unemployment a
record-low 4.0%1
• Oregon's annual GDP growth
averaged 3.3% over the past
two decades2
• Residential customer base
increased approximately 1.3%
over the past year
Economic Update
(1) Oregon Office of Economic Analysis
(2) U.S. Bureau of Economic Analysis
6

Western Energy Imbalance Market
7
Completed first full quarter as a market participant, marking an important step as we
continue to invest in clean, reliable energy
• Captured lowest-cost resources available
throughout six participating states
• Better managed short-term variations
of our customers' load and variable
renewable generation
• Analyzing participation in the potential
expansion of the California ISO's
day-ahead market

8
2016 Integrated Resource Plan
A flexible, balanced plan that reflects our commitment to a low-carbon future and
in keeping with the Oregon Clean Electricity Plan -- process includes continuing
dialog with OPUC staff and stakeholders
Renewable Procurement
• Procurement of renewables (100 MWa) to meet Oregon Clean Electricity Plan
• RFP process to commence in early 2018; decision expected by year-end
• Potential benchmark resource identified
Capacity Need
Executed contracts for 300 MWs through bilateral procurement processes:
• 200 MW of annual-capacity with five-year terms beginning 2021
• 100 MW of seasonal peak capacity during summer and winter periods with a five-
year term beginning 2019
Timeline:
• December 2017: IRP acknowledged
• Q1 2018: Initiate RFP process
• End of 2018: Complete Renewable RFP

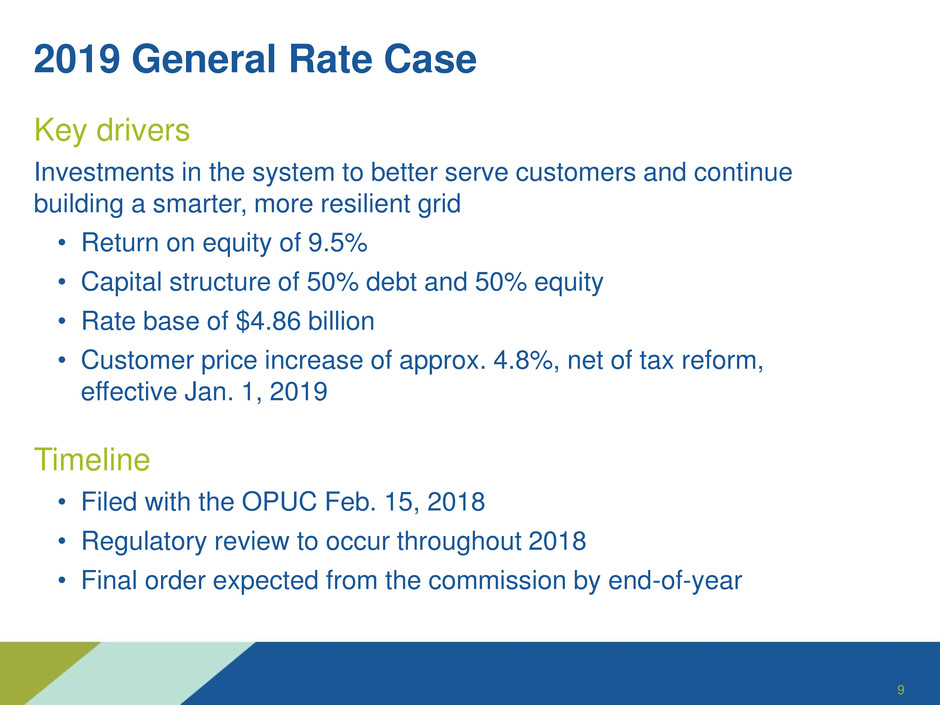
2019 General Rate Case
9
Key drivers
Investments in the system to better serve customers and continue
building a smarter, more resilient grid
• Return on equity of 9.5%
• Capital structure of 50% debt and 50% equity
• Rate base of $4.86 billion
• Customer price increase of approx. 4.8%, net of tax reform,
effective Jan. 1, 2019
Timeline
• Filed with the OPUC Feb. 15, 2018
• Regulatory review to occur throughout 2018
• Final order expected from the commission by end-of-year

Tax Reform
• Filed a deferral application with the OPUC
▪ Defer regulatory items with a 2017 and 2018 financial impact
into future years
▪ Proposed that any refund be subject to an earnings test, tied to
ROE
• Cash flow and credit metrics remain strong
10

2017 Earnings Bridge
Earnings per diluted share
11
2016 Weather Storm
Service
Restoration
Carty D&A PTCs Employee
Benefits &
Other
Deferred Tax
Remeasure-
ment
2017
$2.29
$2.29 Non-GAAP EPS
Excluding the
remeasurement of
deferred taxes

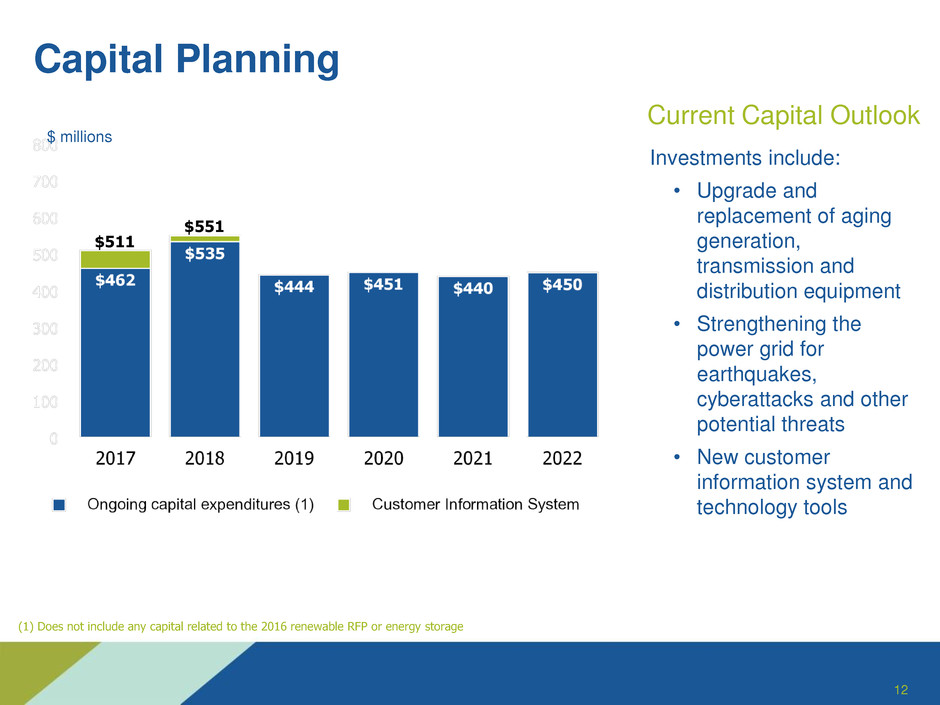
Capital Planning
12
(1) Does not include any capital related to the 2016 renewable RFP or energy storage
Current Capital Outlook
Investments include:
• Upgrade and
replacement of aging
generation,
transmission and
distribution equipment
• Strengthening the
power grid for
earthquakes,
cyberattacks and other
potential threats
• New customer
information system and
technology tools
$511
$551
$ millions

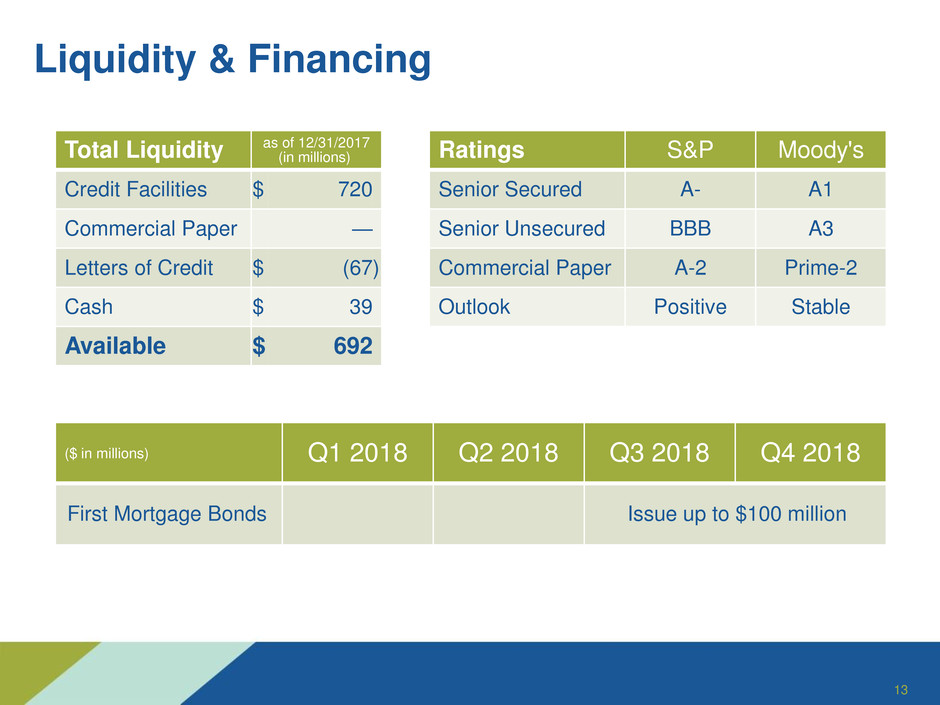
Liquidity & Financing
Total Liquidity as of 12/31/2017 (in millions)
Credit Facilities $ 720
Commercial Paper —
Letters of Credit $ (67 )
Cash $ 39
Available $ 692
Ratings S&P Moody's
Senior Secured A- A1
Senior Unsecured BBB A3
Commercial Paper A-2 Prime-2
Outlook Positive Stable
($ in millions) Q1 2018 Q2 2018 Q3 2018 Q4 2018
First Mortgage Bonds Issue up to $100 million
13

Guidance & Assumptions
2018 EPS
Guidance:
$2.10
-
$2.25
• Retail deliveries decline between 0% and 1%,
weather-adjusted
• Warmer-than-normal weather in January
• Average hydro conditions for the year
• Wind generation for the year based on five
years of historic levels or forecast studies
when historical data is not available
• Normal thermal plant operations
• Operating and maintenance costs between
$575 and $595 million
• Depreciation and amortization expense
between $365 and $385 million
• Assumes OPUC approval of the customer
information and meter data management
systems deferral application.
14

2018 Key Initiatives
15
• Maintain our high level of Operational Excellence
• Invest in reliable and clean energy
• Build a smarter, more resilient grid
