Attached files
| file | filename |
|---|---|
| EX-32.2 - EXHIBIT 32.2 - ENBRIDGE ENERGY PARTNERS LP | eep12312017exhibit322.htm |
| EX-32.1 - EXHIBIT 32.1 - ENBRIDGE ENERGY PARTNERS LP | eep12312017exhibit321.htm |
| EX-31.2 - EXHIBIT 31.2 - ENBRIDGE ENERGY PARTNERS LP | eep12312017exhibit312.htm |
| EX-31.1 - EXHIBIT 31.1 - ENBRIDGE ENERGY PARTNERS LP | eep12312017exhibit311.htm |
| EX-21.1 - EXHIBIT 21.1 - ENBRIDGE ENERGY PARTNERS LP | eep12312017-exhibit211.htm |
UNITED STATES
SECURITIES AND EXCHANGE COMMISSION
Washington, D.C. 20549
_______________________________
FORM 10-K
_______________________________
x | ANNUAL REPORT PURSUANT TO SECTION 13 OR 15(d) OF THE SECURITIES EXCHANGE ACT OF 1934 | |
For the fiscal year ended December 31, 2017 or
o | TRANSITION REPORT PURSUANT TO SECTION 13 OR 15(d) OF THE SECURITIES EXCHANGE ACT OF 1934 | |
For the transition period from to
Commission file number 1-10934
_______________________________
ENBRIDGE ENERGY PARTNERS, L.P.
(Exact Name of Registrant as Specified in Its Charter)
_______________________________
Delaware | 39-1715850 | |
(State or Other Jurisdiction of Incorporation or Organization) | (I.R.S. Employer Identification No.) | |
5400 Westheimer Court Houston, Texas 77056
(Address of Principal Executive Offices) (Zip Code)
Registrant’s telephone number, including area code (713) 627-5400
_______________________________
Securities registered pursuant to Section 12(b) of the Act:
Title of each class | Name of each exchange on which registered | |
Class A common units | New York Stock Exchange | |
Securities registered pursuant to Section 12(g) of the Act: NONE
_______________________________
Indicate by check mark if the registrant is a well-known seasoned issuer, as defined in Rule 405 of the Securities Act.Yes x No o
Indicate by check mark if the registrant is not required to file reports pursuant to Section 13 or Section 15(d) of the Act.Yes o No x
Indicate by check mark whether the registrant (1) has filed all reports required to be filed by Section 13 or 15(d) of the Securities Exchange Act of 1934 during the preceding 12 months (or for such shorter period that the registrant was required to file such reports), and (2) has been subject to such filing requirements for the past 90 days.Yes x No o
Indicate by check mark whether the registrant has submitted electronically and posted on its corporate Web site, if any, every Interactive Data File required to be submitted and posted pursuant to Rule 405 of Regulation S-T (§232.405 of this chapter) during the preceding 12 months (or for such shorter period that the registrant was required to submit and post such files).Yes x No o
Indicate by check mark if disclosure of delinquent filers pursuant to Item 405 of Regulation S-K (§229.405) is not contained herein, and will not be contained, to the best of the registrant’s knowledge, in definitive proxy or information statements incorporated by reference in Part III of this Form 10-K or any amendment to this Form 10-K. x
Indicate by check mark whether the registrant is a large accelerated filer, an accelerated filer, a non-accelerated filer, a smaller reporting company or emerging growth company. See the definitions of “large accelerated filer,” “accelerated filer” and “smaller reporting company” and "emerging growth company" in Rule 12b-2 of the Exchange Act. (Check one):
Large Accelerated Filer x | Accelerated Filer o | |
Non-Accelerated Filer o (Do not check if a smaller reporting company) | Smaller reporting company o | |
Emerging growth company o | ||
If an emerging growth company, indicate by check mark if the registrant has elected not to use the extended transition period for complying with any new or revised financial accounting standards provided pursuant to Section 13(a) of the Exchange Act. o
Indicate by check mark whether the registrant is a shell company (as defined in Rule 12b-2 of the Exchange Act).Yes o No x
The aggregate market value of the registrant’s Class A common units held by non-affiliates computed by reference to the price at which the common equity was last sold on June 30, 2017, was $5,223,268,544.
As of February 13, 2018 the registrant has 326,517,110 Class A common units outstanding.
DOCUMENTS INCORPORATED BY REFERENCE: NONE
TABLE OF CONTENTS
Page | ||
In this report, unless the context requires otherwise, references to “we,” “us,” “our” or the “Partnership” are intended to mean Enbridge Energy Partners, L.P. and its consolidated subsidiaries. We refer to our general partner, Enbridge Energy Company, Inc., as our “General Partner.” References to “Enbridge” refer collectively to Enbridge Inc., and its subsidiaries other than us. References to “Enbridge Management” refer to Enbridge Energy Management, L.L.C., the delegate of our General Partner that manages our business and affairs.
This Annual Report on Form 10-K includes forward-looking statements, which are statements that frequently use words such as “anticipate,” “believe,” “consider,” “continue,” “could,” “estimate,” “evaluate,” “expect,” “explore,” “forecast,” “intend,” “may,” “opportunity,” “plan,” “position,” “projection,” “should,” “strategy,” “target,” “will” and similar words. Although we believe that such forward-looking statements are reasonable based on currently available information, such statements involve risks, uncertainties and assumptions and are not guarantees of performance. Future actions, conditions or events and future results of operations may differ materially from those expressed in these forward-looking statements. Any forward-looking statement made by us in this Annual Report on Form 10-K speaks only as of the date on which it is made, and we undertake no obligation to publicly update any forward-looking statement. Many of the factors that will determine these results are beyond our ability to control or predict. Specific factors that could cause actual results to differ from those in the forward-looking statements include: (1) the effectiveness of the various actions we have taken resulting from our strategic review process; (2) changes in the demand for the supply of, forecast data for, and price trends related to crude oil and liquid petroleum, including the rate of development of the Alberta Oil Sands; (3) our ability to successfully complete and finance expansion projects; (4) the effects of competition, in particular, by other pipeline systems; (5) shut-downs or cutbacks at our facilities or refineries, petrochemical plants, utilities or other businesses for which we transport products or to whom we sell products; (6) hazards and operating risks that may not be covered fully by insurance, including those related to Line 6B, (7) any fines, penalties and injunctive relief assessed in connection with any crude oil release; (8) changes in or challenges to our tariff rates; (9) changes in laws or regulations to which we are subject, including compliance with environmental and operational safety regulations that may increase costs of system integrity testing and maintenance; and (10) permitting at federal, state and local level or renewals of rights of way. Forward-looking statements regarding sponsor support transactions or sales of assets (to Enbridge or otherwise) are further qualified by the fact that Enbridge is under no obligation to provide additional sponsor support and neither Enbridge nor any third party is under any obligation to offer to buy or sell us assets, and we are under no obligation to buy or sell any such assets. As a result, we do not know when or if any such transactions will occur. Any statements regarding sponsor expectations or intentions are based on information communicated to us by Enbridge, but there can be no assurance that these expectations or intentions will not change in the future.
For additional factors that may affect results, see “Item 1A. Risk Factors” included elsewhere in this Annual Report on Form 10-K, which is available to the public over the Internet at the United States Securities and Exchange Commission’s (the SEC), website (www.sec.gov) and at our website (www.enbridgepartners.com).
i
GLOSSARY
The following abbreviations, acronyms and terms used in this Annual Report on Form 10-K are defined below:
Alberta Clipper Pipeline | The pipeline that runs from the Canadian international border near Neche, North Dakota to Superior, Wisconsin on our Lakehead System | |
AOCI | Accumulated other comprehensive income | |
ASU | Accounting Standards Update | |
Bpd | Barrels per day | |
CERCLA | Comprehensive Environmental Response, Compensation, and Liability Act | |
CFTC | Commodity Futures Trading Commission | |
CIAC | Contributions in aid of construction | |
Credit Facilities | 364-day Credit Facility and the senior unsecured revolving Credit Facility | |
DAPL | Dakota Access Pipeline | |
EA interests | Partnership interests of the OLP related to all the assets, liabilities and operations of the Eastern Access Projects | |
Eastern Access Projects | Multiple expansion projects that will provide increased access to refineries in the United States Upper Midwest and in Canada in the provinces of Ontario and Quebec for light crude oil produced in western Canada and the United States | |
EBITDA | Earnings Before Interest, Taxes, Depreciation and Amortization | |
EES | Enbridge Employee Services Inc., a subsidiary of our General Partner | |
Enbridge | Enbridge Inc., of Calgary, Alberta, Canada, the ultimate parent of the General Partner | |
Enbridge Management | Enbridge Energy Management, L.L.C. | |
Enbridge System | Canadian portion of the liquid petroleum mainline system | |
EP Act | Energy Policy Act of 1992 | |
EPA | United States Environmental Protection Agency | |
ETCOP | Energy Transfer Crude Oil Pipeline | |
EUS | Enbridge (U.S.) Inc. | |
Exchange Act | Securities Exchange Act of 1934, as amended | |
FERC | Federal Energy Regulatory Commission | |
FSM | Facility Surcharge Mechanism | |
General Partner | Enbridge Energy Company, Inc., the general partner of the Partnership | |
IEPC | Illinois Extension Pipeline Company, L.L.C. | |
ICA | Interstate Commerce Act | |
IDUs | Incentive Distribution Units | |
IRS | Internal Revenue Service | |
ISDA® | International Swaps and Derivatives Association, Inc. | |
i-units | Special class of our limited partner interests | |
Lakehead System | United States portion of the liquid petroleum Mainline system | |
LIBOR | London Interbank Offered Rate — British Bankers’ Association’s average settlement rate for deposits in United States dollars | |
Mainline System | The combined liquid petroleum pipeline operations of our Lakehead System and the Enbridge system, which is a crude oil and liquid petroleum pipeline system extending from western Canada through the upper and lower Great Lakes region of the United States to eastern Canada | |
MarEn | MarEn Bakken Company LLC | |
MEP | Midcoast Energy Partners, L.P. | |
Mid-Continent System | Crude oil pipelines and storage facilities located in the Mid-Continent region of the United States and includes the Cushing tank farm | |
MLP | Master Limited Partnership | |
MNPUC | Minnesota Public Utilities Commission | |
MPC | Marathon Petroleum Corporation | |
ii
NCI | Noncontrolling interest(s) | |
NGLs | Natural gas liquids | |
NDPC | North Dakota Pipeline Company, L.L.C. | |
Bakken Assets | Liquids petroleum pipeline gathering system and common carrier pipeline in the Upper Midwest United States that serves the Bakken formation within the Williston basin | |
NYSE | New York Stock Exchange | |
OLP | Enbridge Energy, Limited Partnership, also referred to as the Lakehead Partnership | |
OPA | Oil Pollution Act | |
PADD II | Consists of Illinois, Indiana, Iowa, Kansas, Kentucky, Michigan, Minnesota, Missouri, Nebraska, North Dakota, Ohio, Oklahoma, South Dakota, Tennessee and Wisconsin | |
PADD III | Consists of Alabama, Arkansas, Louisiana, Mississippi, New Mexico and Texas | |
PADD IV | Consists of Colorado, Idaho, Montana, Utah and Wyoming | |
PADD V | Consists of Alaska, Arizona, California, Hawaii, Nevada, Oregon and Washington | |
Partnership Agreement | Seventh Amended and Restated Agreement of Limited Partnership of Enbridge Energy Partners, L.P., also referred to as our partnership agreement | |
Partnership | Enbridge Energy Partners, L.P. and its consolidated subsidiaries | |
PHMSA | Pipeline and Hazardous Materials Safety Administration | |
SEC | United States Securities and Exchange Commission | |
Series AC interests | Partnership interests of the OLP related to all the assets, liabilities and operations of the Alberta Clipper Pipeline | |
Series EA interests | Partnership interests of the OLP related to all the assets, liabilities and operations of the Eastern Access Projects | |
Series ME interests | Partnership interests of the OLP related to all the assets, liabilities and operations of the U.S. Mainline Expansion projects | |
Southern Access | Southern Access Pipeline, a 42-inch pipeline that runs from Superior, Wisconsin to Flanagan, Illinois on our Lakehead System | |
U.S. GAAP | United States Generally Accepted Accounting Principles | |
U.S. L3R Program | The United States Line 3 Replacement Program | |
U.S. Mainline Expansion projects | Multiple projects that will expand access to new markets in North America for growing production from western Canada and the Bakken Formation | |
VIE(s) | Variable interest entity(entities) | |
WCSB | Western Canadian Sedimentary Basin | |
iii
PART I.
ITEM 1. BUSINESS
OVERVIEW
We are a publicly traded Delaware limited partnership that owns and operates crude oil and liquid petroleum transportation and storage assets in the United States of America. Our Class A common units are traded on the New York Stock Exchange (NYSE), under the symbol “EEP”
The following chart shows our organization and ownership structure as of December 31, 2017. The ownership percentages referred to below illustrate the relationships between us, Enbridge Energy Management, L.L.C., or Enbridge Management, Enbridge Energy Company, Inc., or our General Partner, and Enbridge Inc., or Enbridge, and its affiliates:
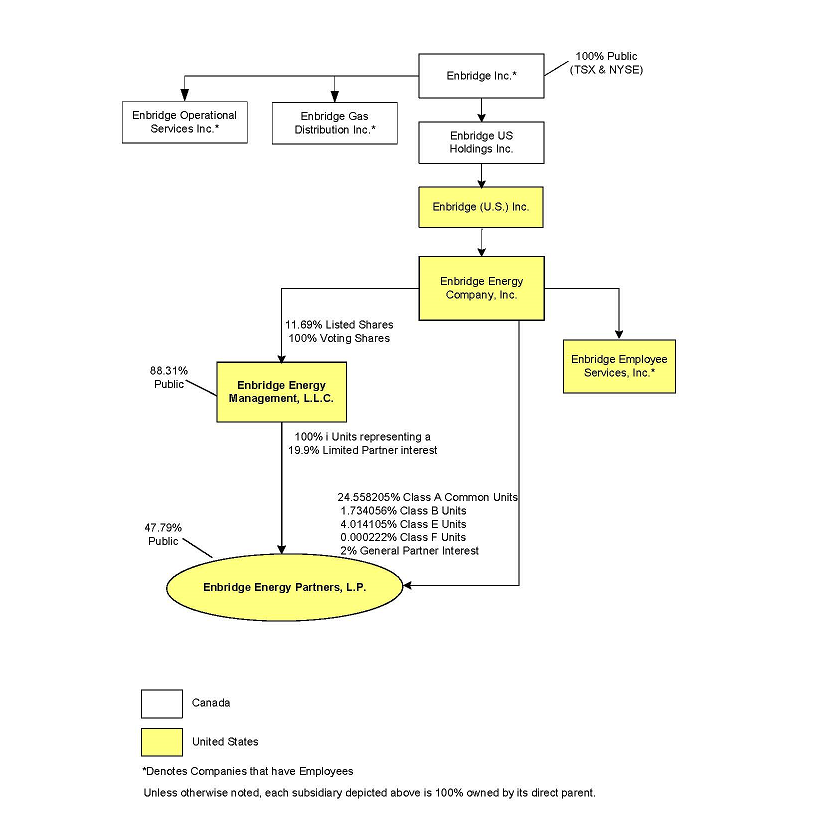
1
We were formed in 1991 by Enbridge Energy Company, Inc., the general partner of the Partnership (General Partner), initially to own and operate the Lakehead System, which is the United States portion of a crude oil and liquid petroleum pipeline system extending from western Canada through the upper and lower Great Lakes region of the United States to eastern Canada (Mainline System). A subsidiary of Enbridge Inc. (Enbridge) owns the Canadian portion of the Mainline system. Enbridge is the ultimate parent of our General Partner.
Enbridge Energy Management, L.L.C. (Enbridge Management) is a Delaware limited liability company that was formed in May 2002 to manage our business and affairs. Under a delegation of control agreement, our General Partner delegated substantially all of its power and authority to manage our business and affairs to Enbridge Management. Our General Partner, through its direct ownership of the voting shares of Enbridge Management, elects all of the directors of Enbridge Management. Enbridge Management is the sole owner of our i-units.
MIDCOAST GAS GATHERING AND PROCESSING DISPOSITION
In 2001, the Partnership acquired the East Texas system, which was the Partnership's first entry into the natural gas gathering and processing business. The Partnership continued expanding its natural gas assets, including the acquisition of the Midcoast system in 2002 and the acquisition of the North Texas system in 2003. In 2013, we formed Midcoast Energy Partners, L.P. (MEP) to serve as our primary vehicle for owning and growing our natural gas and NGL midstream business. MEP completed its initial public offering in 2013, and we continued to own all of the equity interests in MEP’s general partner, a majority limited partner interest in MEP and a minority limited partner interest in MEP’s operating subsidiary, Midcoast Operating, L.P. (Midcoast Operating).
On April 27, 2017, our General Partner acquired, for cash, all of the outstanding publicly held Class A common units of MEP, and shortly thereafter MEP ceased to be a publicly traded partnership. On June 28, 2017, we completed the sale of all of our ownership interest in our Midcoast gas gathering and processing business to our General Partner (the Midcoast Disposition). The sale included our 48.4% limited partnership interest in Midcoast Operating, our 51.9% limited partnership interest in MEP and our 100% interest in Midcoast Holdings, L.L.C., the general partner of MEP.
The natural gas business included natural gas and NGL gathering and transportation pipeline systems, natural gas processing and treating facilities, condensate stabilizers and an NGL fractionation facility, as well as rail and liquids marketing operations. The natural gas assets were primarily located in Texas and Oklahoma. The core basins are known as the East Texas basin, the Fort Worth basin and the Anadarko basin.
CONCLUSION AND RESULTS OF STRATEGIC REVIEW
On April 28, 2017, we announced the conclusion of our strategic review and undertook steps to position us as a pure-play liquids pipeline Master Limited Partnership (MLP) with a low-risk commercial profile, stable cash flows, a strong balance sheet, healthy distribution coverage, visible growth and limited external capital needs. Among the actions implemented as a result of the strategic review, we reduced our quarterly distribution from $0.583 per unit to $0.35 per unit or from $2.33 per unit to $1.40 per unit on an annualized basis, redeemed our outstanding Series 1 Preferred Units at a face value of $1.2 billion, commenced the sale of our interests in our Midcoast gas gathering and processing business, which was sold to our General Partner on June 28, 2017, repaid the deferred distribution balance on our Series 1 Preferred Units, restructured our capital structure and modified our incentive distribution rights and finalized a joint funding arrangement for our investment in the Bakken Pipeline System. See Part II. Item 7. Management’s Discussion and Analysis of Financial Condition and Results of Operations — Strategic Review for further detail.
BUSINESS
We manage our business in one segment - Liquids. The remainder of our business is presented as “Other” and consists of certain unallocated corporate costs. The following describes the operations of our business. For financial information, see Part II. Item 8. Financial Statements and Supplementary Data — Note 5 - Segment Information.
LIQUIDS
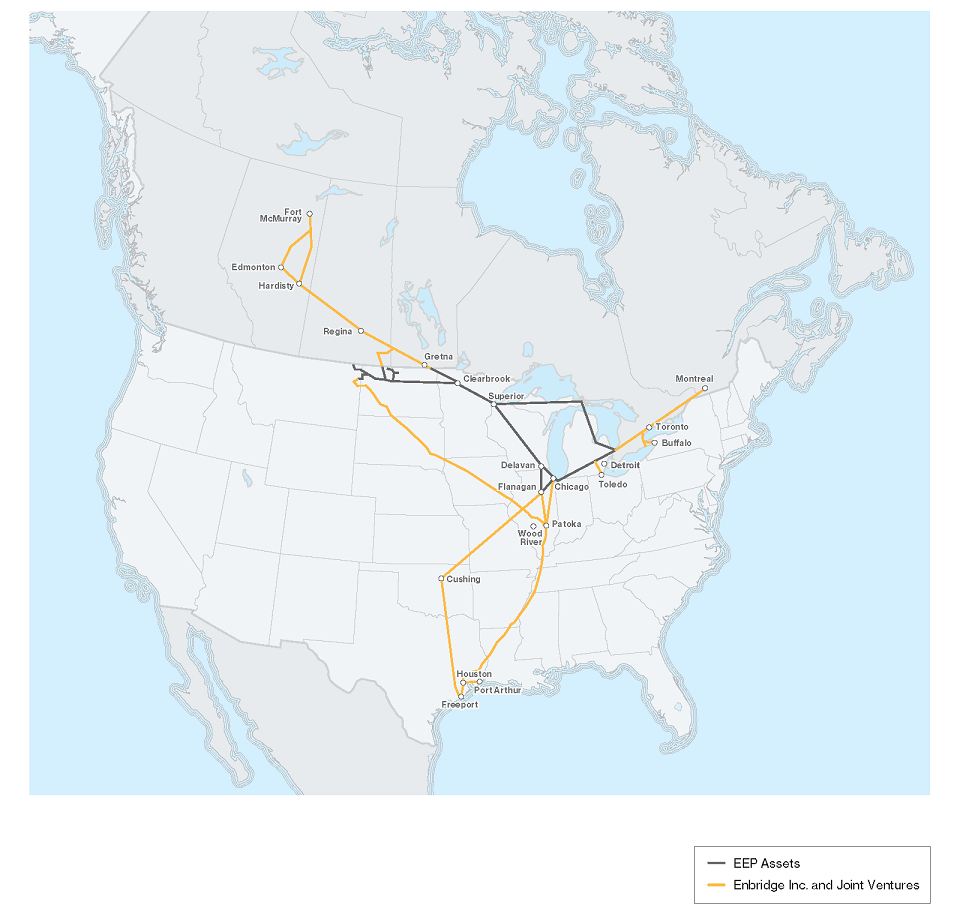
The map below presents the locations of our current Liquids systems’ assets and projects being constructed. The map also depicts some liquids pipelines assets owned by other Enbridge affiliates and projects being constructed to provide an understanding of how they interconnect with our Liquids systems.
2
The following discussion provides an overview of North American production that is transported on our pipelines and the projects that we are pursuing to connect the growing supplies of this production to key refinery markets in the United States.
In 2017, we transported production from the Western Canadian Sedimentary Basin (WCSB) and the North Dakota Bakken formation. Western Canadian crude oil is an important source of supply for the United States. According to the latest available data for 2017 from the United States Department of Energy’s (DOE), Energy Information Administration (EIA), Canada supplied approximately 3.4 million barrels per day (Bpd), of crude oil to the United States, the largest source of United States imports. Over half of the Canadian crude oil moving into the United States was transported on the Enbridge Mainline system. The Canadian Association of Petroleum Producers (CAPP), a trade association representing a majority of our Lakehead System’s customers, forecasted as of June 2017 that future production from the Alberta oil sands will continue to experience steady growth during the next two decades with an additional 1 million Bpd of production by 2030, based on a subset of currently approved applications and announced expansions. We are well positioned to deliver growing volumes of crude oil that are expected from the WCSB to our existing as well as new markets.
3
Along with Enbridge, we are actively working with our customers to develop transportation options that will alleviate capacity constraints in addition to providing access to new markets in the United States. Our market strategy is to provide safe, timely, economic, competitive and integrated transportation solutions to connect growing supplies of North American crude oil production to key refinery markets in the United States and Canada. Together, with Enbridge, we believe that our existing and future plans advance our collective vision of being one of the leading energy delivery companies in North America. In addition to this vision, we have advanced our Operational Risk Management Program.
We have a multi-billion dollar growth program underway, with projects coming into service through 2019, in addition to options to increase our economic interest in projects that are jointly funded by us and Enbridge. This growth program includes expansions to our Mainline system as well as replacement of the Line 3 pipeline to ensure WCSB production has efficient and reliable access to markets in the United States Midwest and beyond. For further details regarding our growth program, refer to Part II. Item 7. Management’s Discussion and Analysis of Financial Condition and Results of Operations — Growth Projects - Commercially Secured Projects
The United States Line 3 Replacement Program (U.S. L3R Program) will support the safety and operational reliability of the system, enhance system flexibility and allow us and Enbridge to optimize throughput from western Canada into Superior, Wisconsin. The U.S. L3R Program is expected to achieve the original capacity of approximately 760,000 Bpd. This project, along with the other projects on the Mainline, will provide increased market access for producers to refineries in the United States upper-Midwest, eastern Canada, and the United States Gulf Coast refining centers. For further details regarding our projects, refer to Part II. Item 7. Management’s Discussion and Analysis of Financial Condition and Results of Operations — Results of Operations - By Segment.
In February 2017, we completed the acquisition of an effective 27.6% equity interest in the Bakken Pipeline System through our joint venture with Marathon Petroleum Corporation (MPC). This system was placed into service on June 1, 2017 and will further enhances our strategy of providing efficient market access solutions for Bakken production, while providing the opportunity for the implementation of joint tolls with the Energy Transfer Crude Oil Pipeline (ETCOP), enhancing market access opportunities for our customers and creating a new flow path through the Mainline system to the eastern United States Gulf Coast. Refer to Part II. Item 7. Management’s Discussion and Analysis of Financial Condition and Results of Operations — Recent Developments for further details.
Our Liquids business includes the operations of our Lakehead System, Bakken Assets (formerly our North Dakota system) and Mid-Continent Systems. The following table provides selected information regarding our Liquids systems:
Pipeline Length (miles) | Storage Tanks | Storage Capacity (million barrels)(1) | Pump Stations | ||||||||
Lakehead | 4,212 | 77 | 18 | 74 | |||||||
Mid-Continent | — | 84 | 20 | — | |||||||
Bakken | 660 | 24 | 2 | 12 | |||||||
Total | 4,872 | 185 | 40 | 86 | |||||||
____________
(1) | Represents nominal shell capacity. |
Lakehead System
4
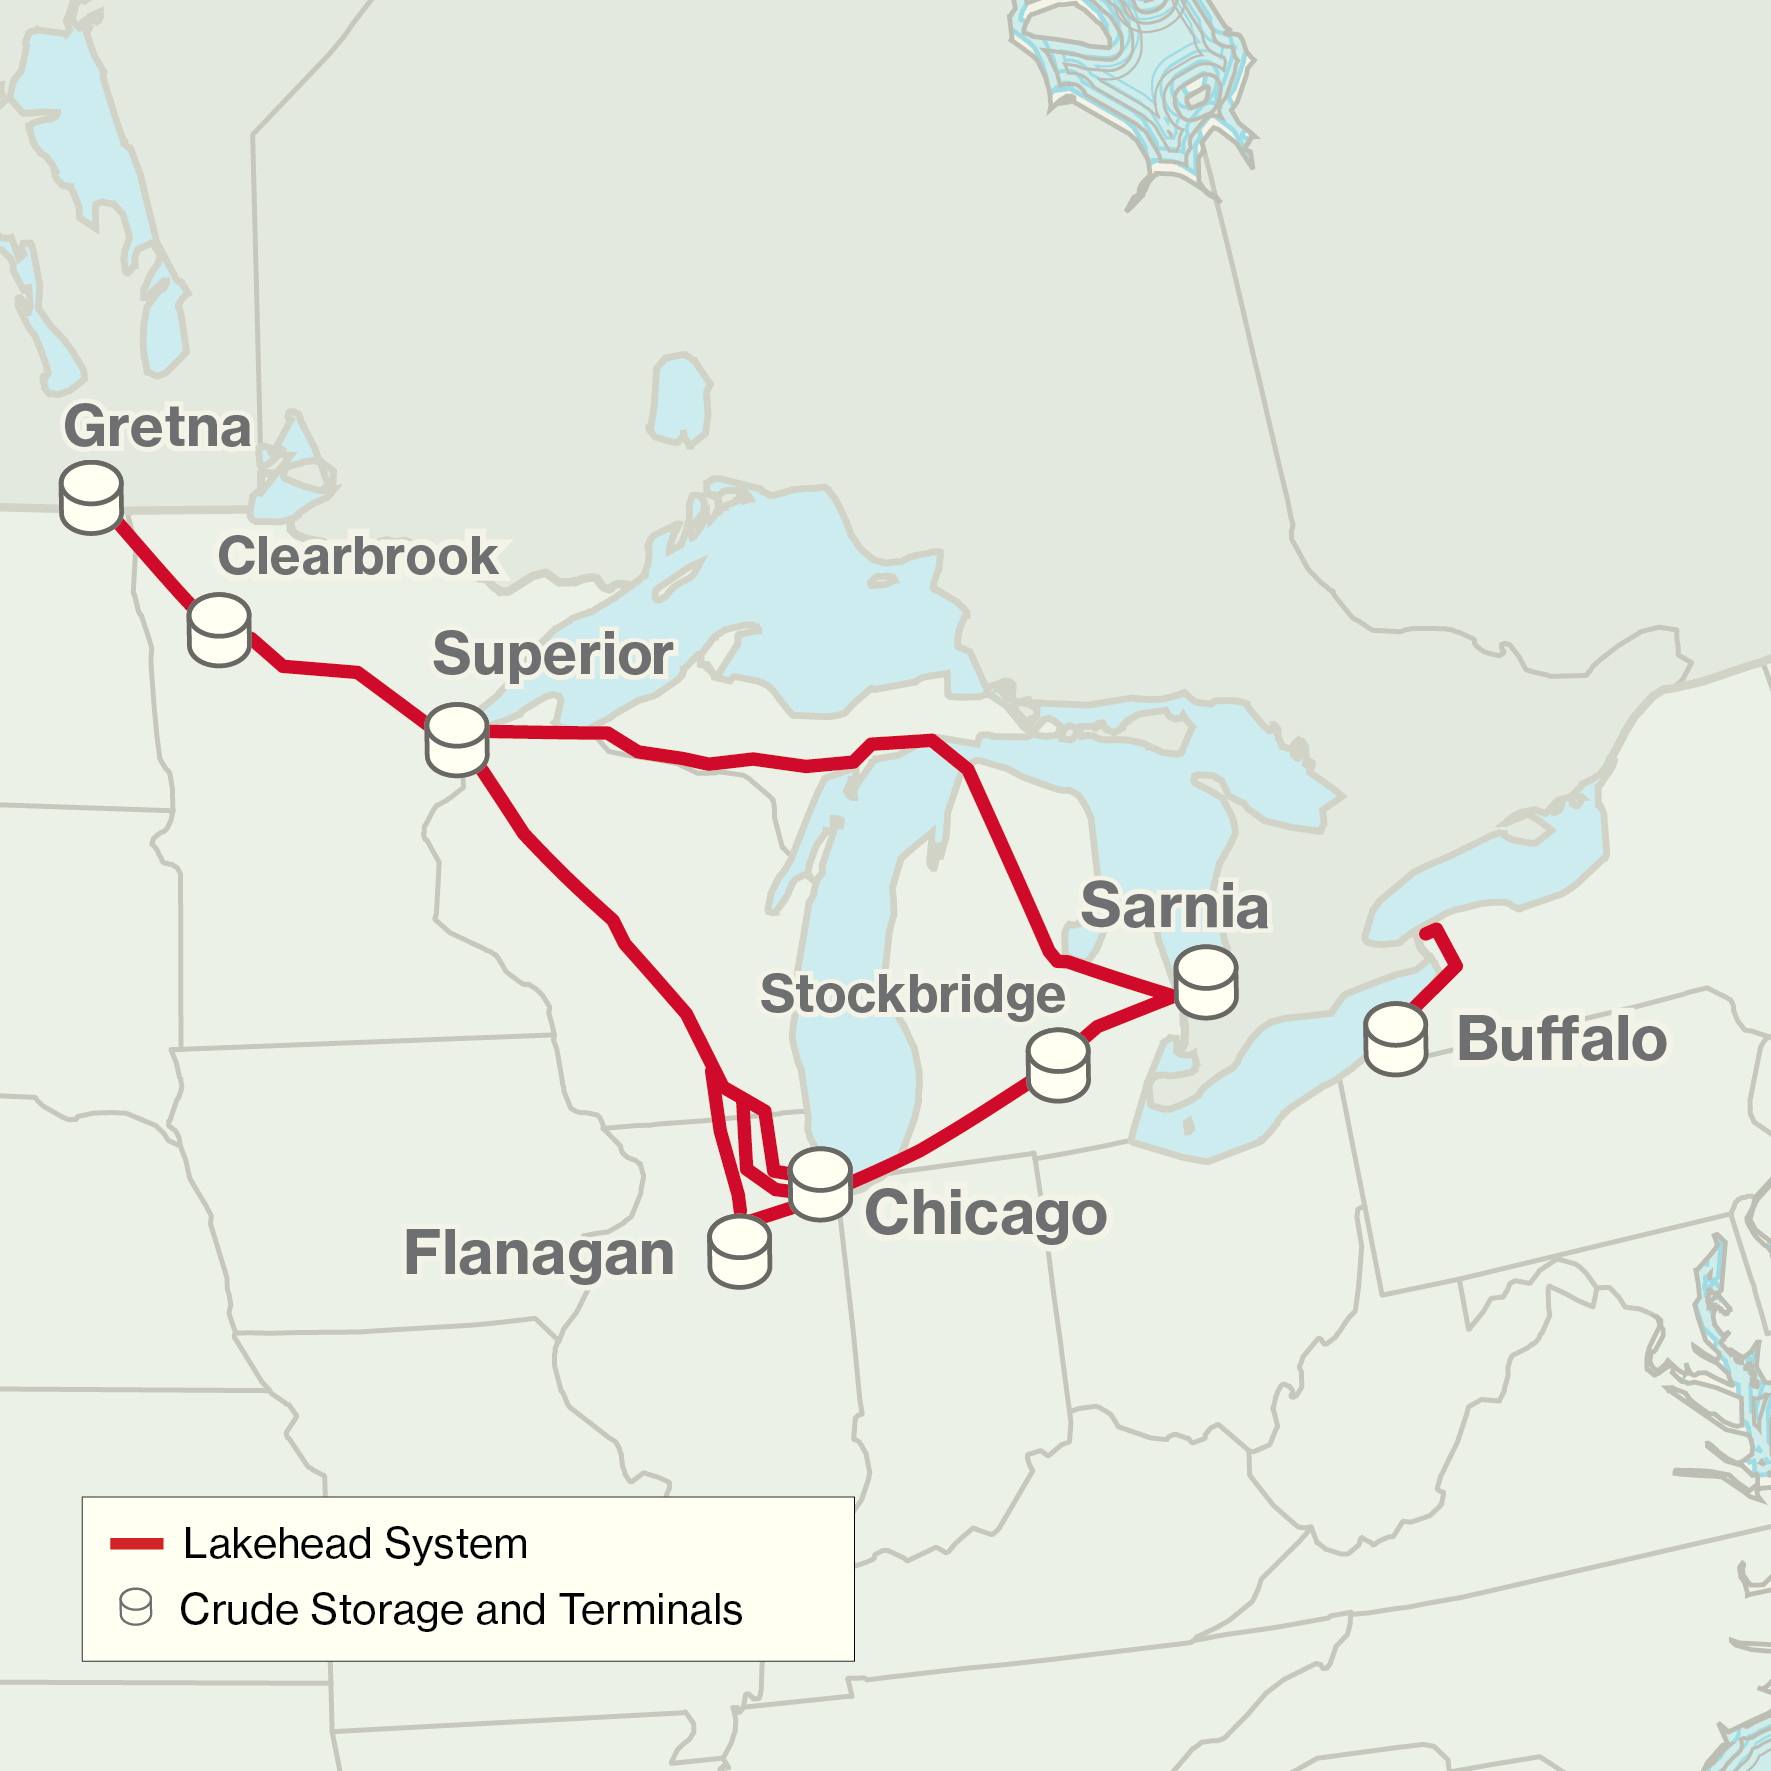
Our Lakehead System, together with the Enbridge system in Canada, form the Mainline system, which has been in operation for over 60 years and forms the longest liquid petroleum pipeline system in the world. The Mainline system operates in a segregated, or batch mode allowing the transportation of over 39 oil commodities typically classified as light, medium, or heavy crude oil, condensate, and natural gas liquids (NGLs). The Mainline system serves all of the major refining centers in the Great Lakes and Midwest regions of the United States and the provinces of Ontario and Quebec, Canada. The Lakehead System is the United States portion of the Mainline system. It is an interstate common carrier pipeline system regulated by the Federal Energy Regulatory Commission (FERC) and is the primary transporter of crude oil and liquid petroleum from western Canada to the United States.
Over the past seven years, we have completed the largest pipeline expansion program in our history in order to accommodate the growing upstream supply that will feed our completed downstream market access projects. Our customers have long development timelines and need assurance that an adequate pipeline infrastructure will be in place in time to transport the additional production resulting from completion of their projects. We have successfully completed several projects over the years and have substantially completed our Mainline Expansion Project and commenced construction on components of the United States Line 3 Replacement Program, which will provide the needed incremental market access for both our producer and refiner customers located in our primary target markets.
Our Lakehead System is strategically interconnected to multiple refining centers and transportation hubs located within Petroleum Administration for Defense Districts (PADD), such as: Chicago, Illinois; Patoka, Illinois; and Cushing, Oklahoma (PADDII). In addition, we are also strategically connected to the largest U.S. refining center in the United States Gulf Coast through other pipelines owned by Enbridge and its affiliates. WCSB production in excess of Western Canadian demand moves on existing pipelines into primarily PADD II, with secondary markets including: the United States Gulf Coast (PADD III); the Rocky Mountain states (PADD IV); the Anacortes area of Washington state (PADD V); and Eastern Canada (Ontario and Quebec).The Lakehead System mainly serves the PADD II market directly and the PADD III market indirectly. Bakken production in excess of local demand primarily moves on existing pipelines into PADD II or is transported by rail to coastal Canadian and United States refining markets. The United States Gulf Coast continues to be an attractive market for WCSB producers due to the market’s large refining capacity designed to process heavy crude oil. The forecasted long-term incremental growth of Canadian oil sands and Bakken production
5
provides stability for existing pipeline throughputs to historical markets as well as creating new growth opportunities available to both us and our competitors.
Customers
Our Lakehead System operates under month-to-month transportation arrangements with our shippers. During 2017, approximately 40 shippers tendered crude oil and liquid petroleum for delivery through our Lakehead System. We consider multiple companies that are controlled by a common entity to be a single shipper for purposes of determining the number of shippers delivering crude oil and liquid petroleum on our Lakehead System. Our customers include integrated oil companies, major independent oil producers, refiners and marketers. For further details regarding revenues from our largest third party customers see Part II. Item 8. Financial Statements and Supplementary Data — Note 5 - Segment Information
Supply and Demand
Our Lakehead System is part of the longest crude oil pipeline in the world and is a critical component of the North American crude oil supply pipeline network. Lakehead is well positioned as the primary transporter of western Canadian crude oil and continues to benefit from past and anticipated future crude oil production growth from the Alberta Oil Sands, as well as recent development in tight oil production in North Dakota. Aside from the receipt locations on the Mainline system within Canada, our Lakehead System receives injections from locations within the United States. Clearbrook, Minnesota is the receipt location for United States Bakken production, and other United States sources are received at Lewiston, Michigan and Mokena, Illinois.
Crude oil originating from the WCSB comprises the majority of Lakehead System deliveries. According to Natural Resources Canada (NRCan), Canada is currently ranked third in the world for total proved reserves, just behind Venezuela and Saudi Arabia, respectively. NRCan estimates that 97% of Canada’s total proved reserves are attributed to Alberta’s oil sands bitumen, with the remainder being conventional oil sources. The Alberta Energy Regulator, estimates 166.6 billion total barrels, or approximately 165 billion and 1.6 billion barrels of established proved bitumen and conventional reserves, respectively, remain for the region. The National Energy Board (NEB) estimates that total production from the WCSB averaged approximately 4.0 million Bpd in 2017 and 3.6 million in 2016. Furthermore, these production levels are expected to grow in the future, as previously discussed.
The growth forecast in the oil sands will be primarily driven by steam assisted gravity drainage (SAGD), projects in the long-term. Mining projects are the main contributor to near-term growth, with other development projects on hold until prices recover and well economics improve. Based on projects currently under construction in western Canada, the incremental productive capacity that would have access to our systems is reported to increase over the next three years by approximately 404,000 Bpd.
Lakehead throughput volumes are primarily supplied by crude oil produced in the Canadian oil sands and Bakken resource plays. North Dakota’s Bakken/Three Forks resource play has become a major component of United States domestic supply. In 2017, production averaged 1.1 million Bpd and is expected to remain at that level through 2018. Forecasts of western Canadian crude oil supply are periodically completed by Enbridge, CAPP and the NEB, among others. The June 2017 CAPP forecast predicts western Canada oil sands production is expected to grow by 1 million Bpd to 3.7 million Bpd by 2030. This compares with an expected increase of 30,000 Bpd from conventional production sources over the same time frame. Compared to the 2016 forecast, CAPP kept its oil sands production forecast at 3.7 million Bpd due to the low oil price environment and constraints arising from oil sands cost competitiveness and delays in project schedules. The production growth forecasted out of our primary supply markets requires additional pipeline capacity.
PADD II is the primary demand market for our Lakehead System. Deliveries on our Lakehead System are negatively affected by periodic maintenance, other competitive transportation alternatives, or refinery turnarounds and other shutdowns at producing plants that supply crude oil. Based on growth in western Canada and Bakken crude oil supply and Lakehead operational performance improvements, deliveries on our Lakehead System are expected to be higher than the 2.7 million Bpd of actual deliveries experienced during 2017.
The latest data available from the EIA shows that total PADD II demand was 3.7 million Bpd. PADD II produced 1.7 million Bpd and imported 2.4 million Bpd from Canada and other regions located in the United States, with exports comprising the remaining difference between PADD II supply and demand. Imports from Canada comprised 99% of total PADD II crude oil imports, with approximately 65% or 1.5 million Bpd transported on our Lakehead System. The remaining barrels were imported via competitor pipelines from Alberta and offshore sources via the United States Gulf Coast or regional transfers from PADD III or PADD IV.
6
Lakehead System deliveries for 2017 were approximately 99,000 Bpd higher than delivery volumes for 2016. Total deliveries from our Lakehead System averaged 2.7 million Bpd in 2017, meeting approximately 71% of the refinery capacity in the greater Chicago area; 81% of the Minnesota refinery capacity; and 81% of Ontario refinery capacity. Refinery configurations and crude oil requirements within PADD II continue to create an attractive market for western Canada and Bakken supply. Crude oil demand in PADD II averaged 3.7 million Bpd, an increase of 134,000 Bpd from 2016, while overall refining utilization grew to 94% from 92% when compared to the prior year.
Competition
WCSB crude oil competes with local and imported crude oil. Of all the pipeline systems that transport crude oil out of Canada, the Mainline system transported approximately half of all Canadian crude oil imports into the United States in 2017.
Given the expected increase in crude oil production from the Alberta Oil Sands over the next 10 years, alternative transportation proposals have been presented to crude oil producers. Competitors’ proposals to WCSB and Bakken shippers include expanding, twinning, extending and building new pipeline assets. These proposals and projects are in various stages of regulatory approval.
Transportation of crude oil by rail has also emerged as a competitor primarily due to the lack of pipeline capacity for the WCSB and Bakken regions. As a result, a significant amount of rail loading capacity has been constructed and is proposed in both markets. Rail transportation becomes less competitive, however, as crude oil price differentials narrow between key markets due to high transportation costs relative to cost of transportation by pipeline.
These competing alternatives for delivering western Canada crude oil into the United States and other markets could erode shipper support for further expansion of our Lakehead System. Accordingly, competition could also impact throughput on and utilization of the Mainline system. The Mainline system, however, offers significant cost savings and flexibility to shippers.
Deliveries for our Lakehead System over the past five years were as follows:
2017 | 2016 | 2015 | 2014 | 2013 | ||||||||||
(thousands of Bpd) | ||||||||||||||
United States | ||||||||||||||
Light crude oil | 416 | 492 | 500 | 496 | 473 | |||||||||
Medium and heavy crude oil | 1,606 | 1,471 | 1,364 | 1,167 | 948 | |||||||||
NGL | 5 | 5 | 5 | 6 | 6 | |||||||||
Total United States | 2,027 | 1,968 | 1,869 | 1,669 | 1,427 | |||||||||
Canada | ||||||||||||||
Light crude oil | 464 | 427 | 294 | 298 | 247 | |||||||||
Medium and heavy crude oil | 108 | 100 | 77 | 72 | 76 | |||||||||
NGL | 74 | 79 | 75 | 74 | 66 | |||||||||
Total Canada | 646 | 606 | 446 | 444 | 389 | |||||||||
Total Deliveries | 2,673 | 2,574 | 2,315 | 2,113 | 1,816 | |||||||||
Barrel miles (billions per year) | 756 | 724 | 640 | 582 | 487 | |||||||||
7
Mid-Continent System
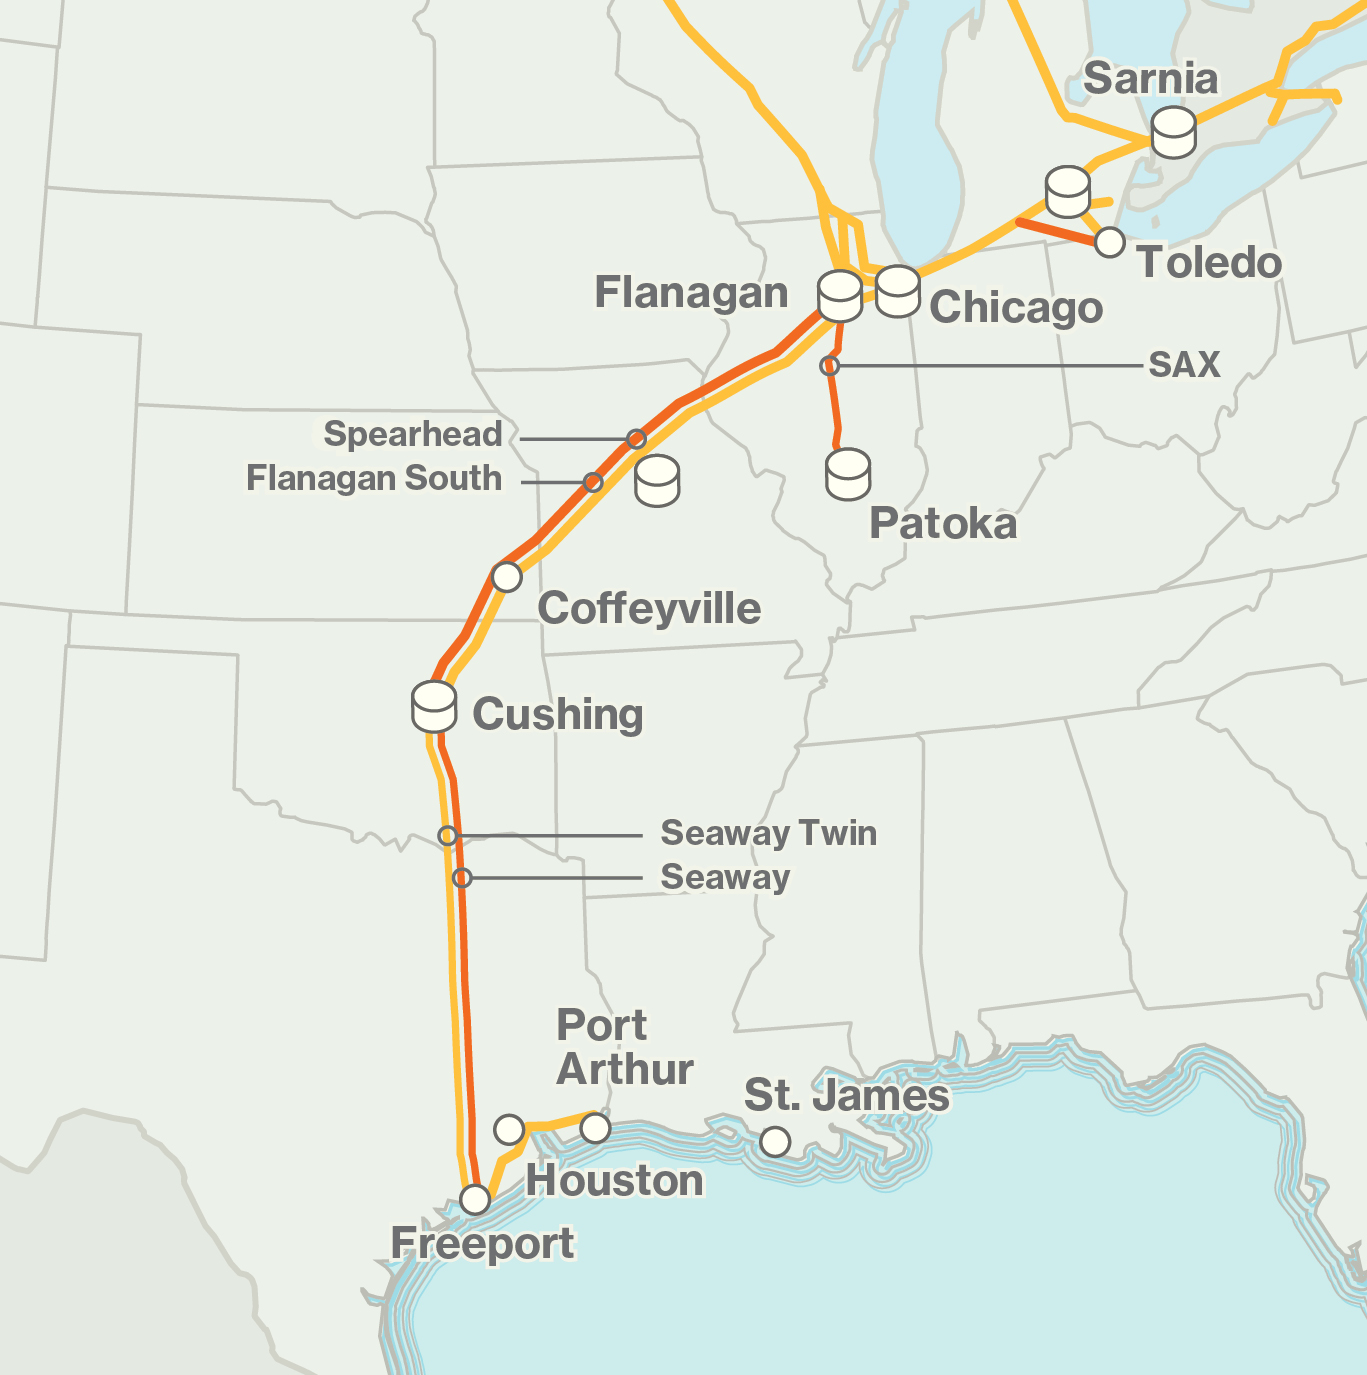
Our Mid-Continent System, which we have owned since 2004, is located within PADD II and is comprised of storage terminals at Cushing, Oklahoma.
The storage terminals consist of over 80 individual storage tanks ranging in size from 78,000 to 570,000 barrels. The total storage shell capacity of our Mid-Continent System is approximately 20 million barrels. A portion of the storage facilities are used for operational purposes, while we contract the remainder of the facilities with various crude oil market participants for their term storage requirements. Contract fees include fixed monthly storage fees, throughput fees for receiving and delivering crude to and from connecting pipelines and terminals and blending fees.
The Cushing Terminal continues to change with market dynamics and we are well positioned to capitalize on potential growth projects. We also see long-term strategic value for the terminals and plan to expand both its capacity and connectivity as market conditions improve.
In December 2016, we entered into an agreement to sell the Ozark Pipeline system to a subsidiary of MPLX LP. On March 1, 2017, we completed the sale of the Ozark Pipeline system to a subsidiary of MPLX LP for cash proceeds of approximately $220 million. For more information, refer to Part II. Item 8. Financial Statements and Supplementary Data — Note 9 - Property, Plant and Equipment.
Customers
Our Mid-Continent System operates under long-term storage arrangements with shippers. These arrangements are up to 10 years in length and include producers, refiners and marketers. Storage utilization depends on a variety of factors, including price differentials, supply and apportionment among others.
Supply and Demand
Demand for storage capacity at Cushing, Oklahoma has remained high as customers continue to value the flexibility and optionality available with this service as well as the superior connectivity that our terminal offers. Our storage
8
terminals rely on demand for storage service from numerous oil market participants. Producers, refiners, marketers and traders value our storage capacity in Cushing, Oklahoma for a number of different reasons, including batch scheduling, stream quality control, inventory management, blending and speculative trading opportunities.
Competition
Competitors to our storage facilities at Cushing, Oklahoma include large integrated oil companies, private entities and other midstream energy partnerships. Many of these competitors have the capability to expand in the future and be competitive on quality of service, reliability, increased connectivity and price.
Bakken Assets
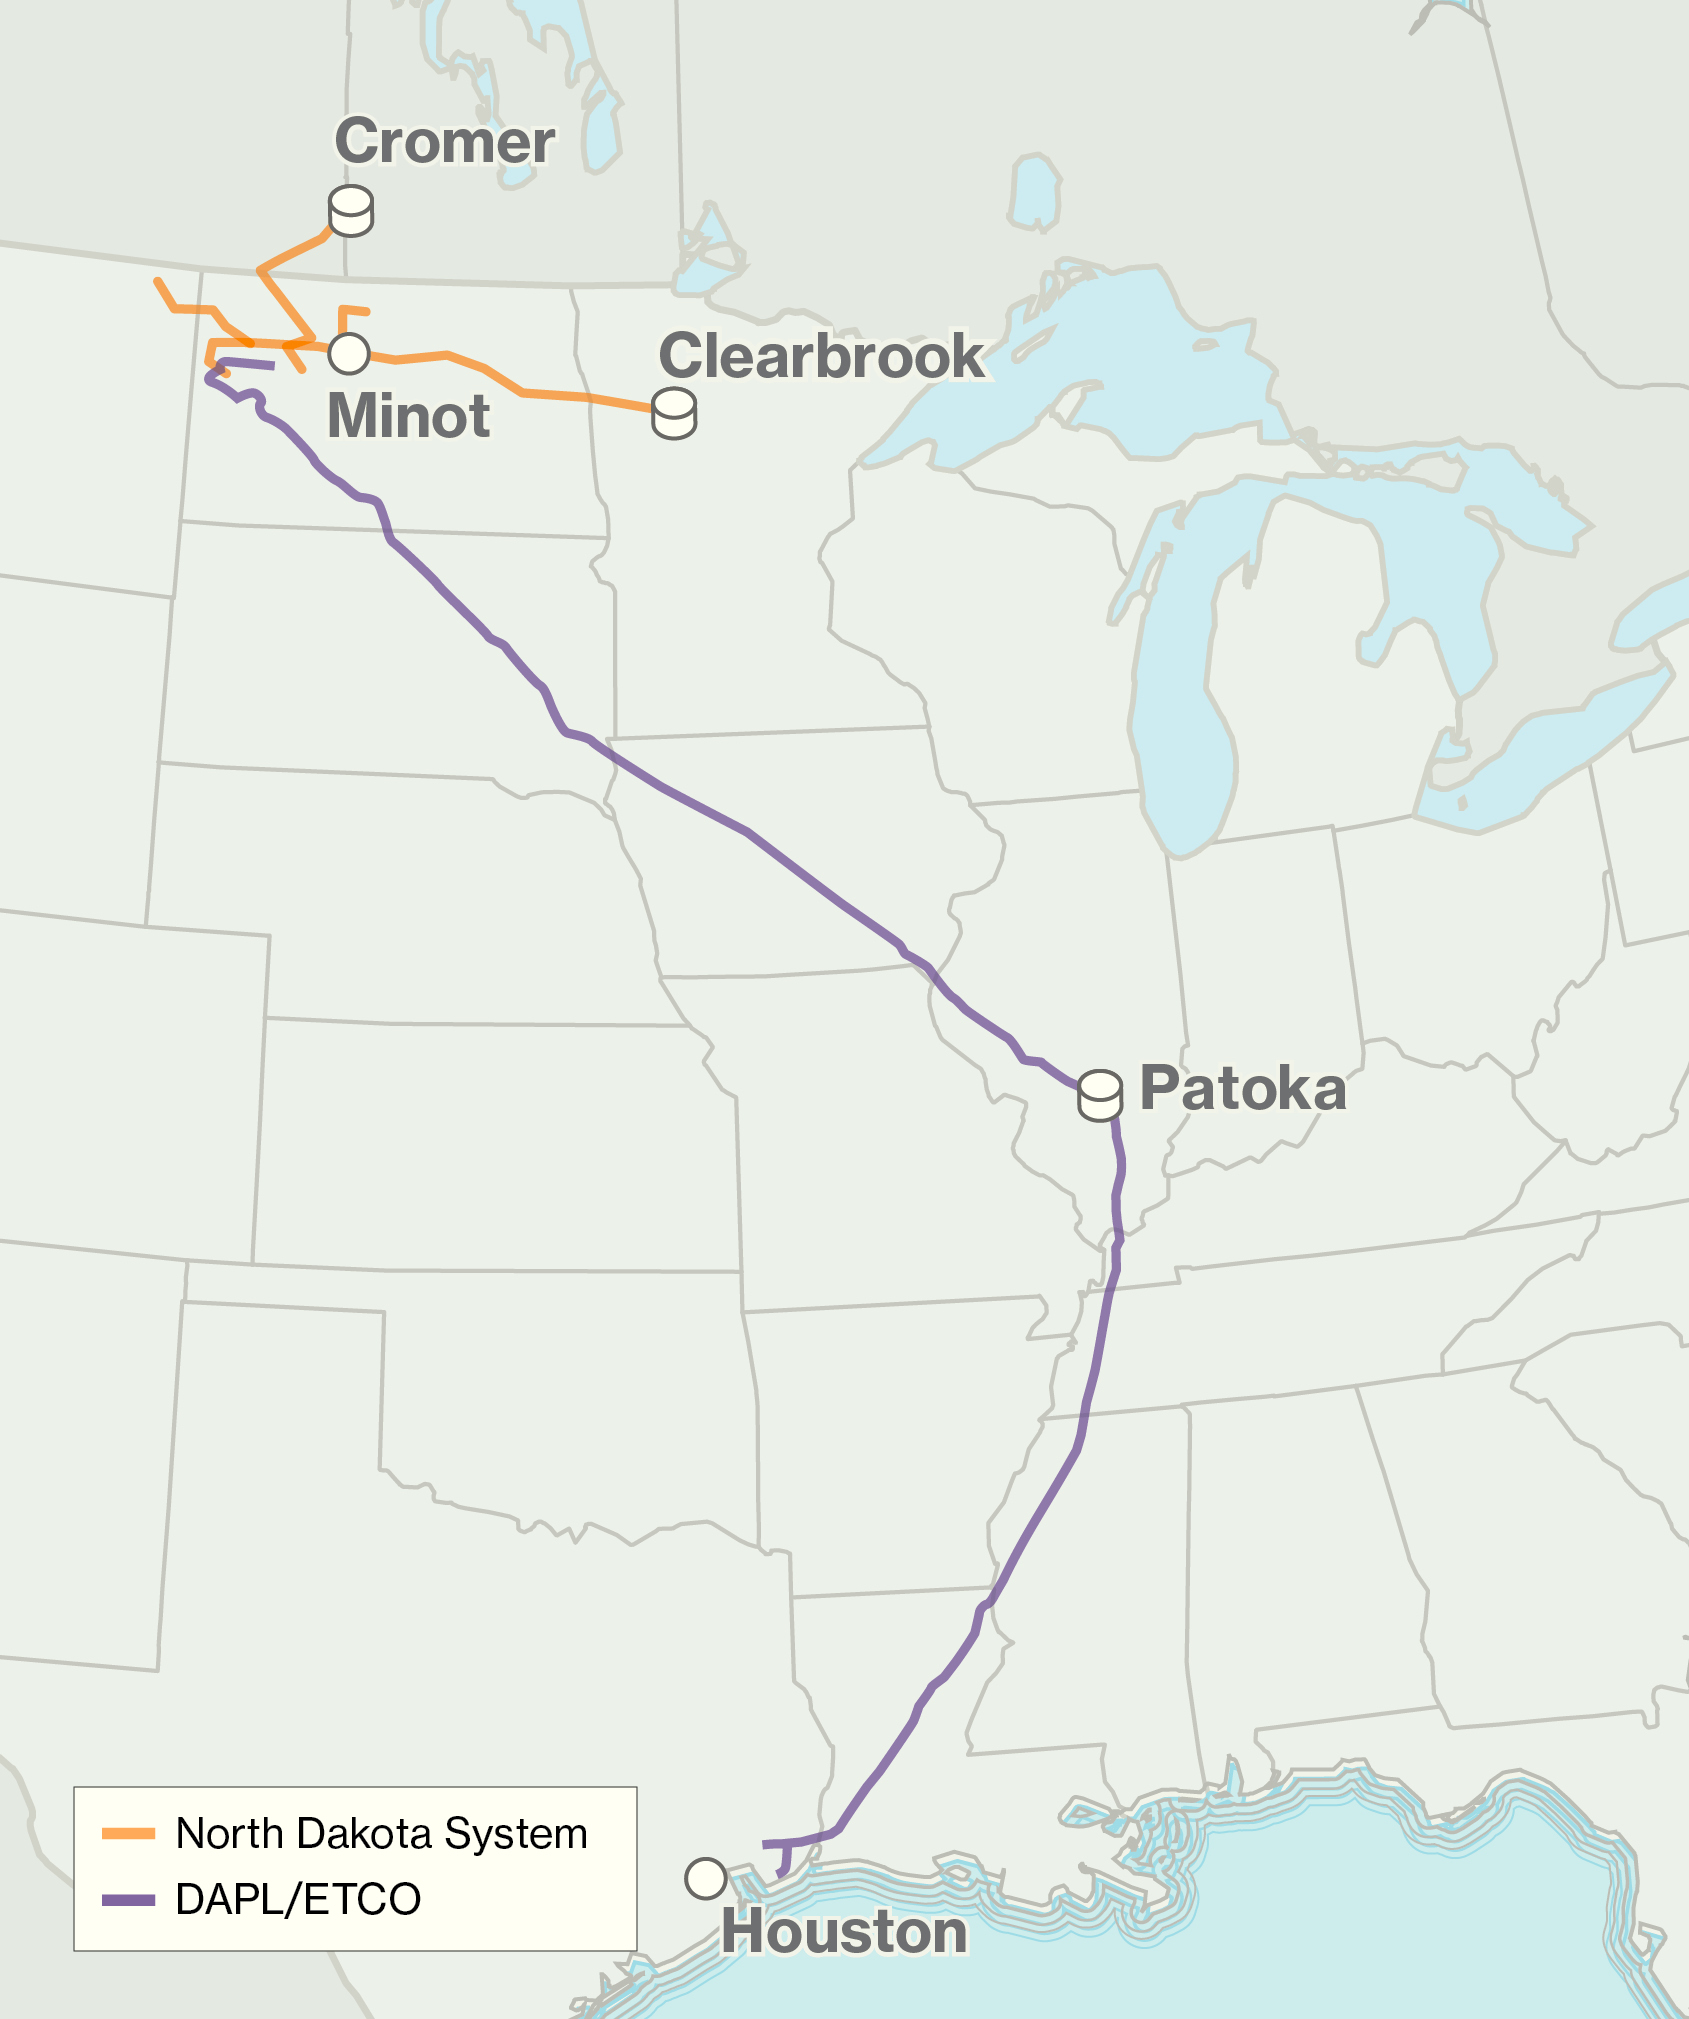
Our Bakken Assets consist of the North Dakota System and the Bakken Pipeline System. The North Dakota System is a joint operation that includes both a Canadian and United States portion. The United States portion of the North Dakota System is comprised of a crude oil gathering and interstate pipeline transportation system servicing the Williston Basin in North Dakota and Montana, which includes the Bakken and Three Forks formations. The gathering pipelines collect crude oil from nearly 80 different receipt facilities located throughout western North Dakota and eastern Montana, with delivery to Clearbrook for service on the Lakehead System or a variety of interconnecting pipeline and rail export facilities. The United States interstate portion of the pipeline extends from Berthold, North Dakota to the International Boundary near North Portal, North Dakota and connects to the Bakken Canadian entity at the border to bring crude oil into Cromer, Manitoba (the Bakken System).
9
Traditionally, the majority of our pipeline deliveries have been made into interconnecting pipelines at Clearbrook, Minnesota where two other pipelines originate: (i) a third-party pipeline serving St. Paul, Minnesota refinery markets; and (ii) our Lakehead System providing further pipeline transportation on the Enbridge system into the Great Lakes, eastern Canada and United States Midwest refinery markets that include Cushing, Oklahoma, Patoka, Illinois, and other pipelines delivering crude oil to the United States Gulf Coast. We have significantly increased the pipeline capacity of our North Dakota System through a series of projects in recent years while continuing to serve the system’s traditional markets in order to provide an array of market options and services.
On February 15, 2017, we announced the closing of our acquisition of an effective 27.6% ownership interest in the Bakken Pipeline System. We formed a joint venture with MPC to acquire a passive 49% equity interest in Bakken Pipeline Investments LLC (BPI) an affiliate of Energy Transfer Partners, L.P. and Sunoco Logistics Partners L.P., which owns 75% of the Bakken Pipeline System. We and MPC indirectly hold a 75% and 25%, respectively of our 49% passive interest in BPI. The Bakken Pipeline System connects the Bakken formation in North Dakota to markets in eastern PADD II and the United States Gulf Coast, providing customers with access to premium markets at a competitive cost. The Bakken Pipeline System consists of the Dakota Access Pipeline (DAPL) and the Energy Transfer Crude Oil Pipeline projects (ETCOP). DAPL consists of 1,172 miles of 30-inch pipeline from the Bakken/Three Forks production area in North Dakota to Patoka, Illinois. Initial capacity is in excess of 470,000 Bpd of crude oil with the potential to be expanded to 570,000 Bpd. The Energy Transfer Crude Oil Pipeline consists of 62 miles of new 30-inch diameter pipe, 686 miles of converted 30-inch diameter pipe and 40 miles of converted 24-inch diameter pipe from Patoka, Illinois to Nederland, Texas. The Bakken Pipeline System is anchored by long-term throughput commitments from a number of producers.
Customers
Customers of our North Dakota System include refiners of crude oil, producers of crude oil and purchasers of crude oil at the wellhead, such as marketers, that require crude oil gathering and transportation services. Producers range in size from small independent owner/operators to large integrated oil companies. During 2017, approximately 304 shippers tendered crude oil for service on our North Dakota System.
Supply and Demand
Similar to our Lakehead System, our North Dakota System depends upon demand for crude oil in the Great Lakes and Midwest regions of the United States and the ability of crude oil producers to maintain their crude oil production and exploration activities. The state of North Dakota reported production levels of 1.1 million Bpd as of November 2017 with projections remaining at that level through 2018.
Competition
Due to the growth in production from these formations over the last several years, competition has increased substantially. Traditional competitors of our North Dakota System include refiners, integrated oil companies, interstate and intrastate pipelines or their affiliates and other crude oil gatherers. Many crude oil producers in the oil fields served by our North Dakota System have alternative gathering facilities available to them or have the ability to build their own assets, including their own rail loading facilities.
Currently, the primary competition to our North Dakota System is DAPL. As discussed, we purchased a minority stake in the Bakken Pipeline System, including DAPL, which entered into service June 1, 2017.
SEASONALITY
Drilling activities of producers within areas of our liquids pipeline network increase in winter months as the ground on which their drilling rigs are placed is frozen and inaccessible terrain becomes available. Western Canada typically experiences an increase in production during the winter months to align with consumer demand for refined products. Demand for crude oil diminishes into the spring and early fall as mid-west and gulf coast refineries undergo maintenance and turnaround activities. Seasonality exposure on the Enbridge Mainline is typically limited to light barrels as strong heavy supply and demand have resulted in the Mainline being oversubscribed (apportioned) for heavy capacity. In addition, system optimization initiatives in 2017 have further improved Enbridge’s utilization on the Mainline system. These initiatives have added flexibility to allocate crude to various lines further mitigating any seasonality risk on light throughputs. In addition, any further exposure to fluctuations in revenue as a result of seasonality is partially mitigated on our Lakehead System through authoritative accounting provisions applicable to regulated operations.
REGULATION
10
REGULATION BY THE FERC OF INTERSTATE COMMON CARRIER LIQUIDS PIPELINES
The FERC regulates the interstate pipeline transportation of crude oil, petroleum products, and other liquids such as NGLs. Our Lakehead System, North Dakota and Bakken Systems are our primary interstate common carrier liquids pipelines subject to regulation by the FERC under the Interstate Commerce Act (ICA), the Energy Policy Act of 1992 (EP Act), and rules and orders promulgated thereunder. As common carriers in interstate commerce, these pipelines provide service to any shipper who makes a reasonable request for transportation services, provided that the shipper satisfies the conditions and specifications contained in the applicable tariff. The ICA requires us to maintain tariffs on file with the FERC that set forth the rates we charge for providing transportation services on our interstate common carrier pipelines, as well as the rules and regulations governing these services.
The ICA gives the FERC the authority to regulate the rates we can charge for service on interstate common carrier pipelines. The ICA requires, among other things, that such rates be “just and reasonable” and that they not be unduly discriminatory or unduly preferential to certain shippers. The ICA permits interested parties to challenge newly proposed or changed rates and authorizes the FERC to suspend the effectiveness of such rates for a period of up to seven months and to investigate the rates to determine if they are just and reasonable. If the FERC finds the new or changed rate unlawful, it is authorized to require the carrier to refund, with interest, the amount of any revenues in excess of the amount that would have been collected during the term of the investigation at the rate properly determined to be lawful. The FERC also may investigate, upon complaint or on its own motion, rates that are already in effect and may order a carrier to change its rates prospectively. Upon an appropriate showing, a shipper may obtain reparations for damages sustained for a period of up to two years prior to the filing of a complaint.
In October 1992, Congress passed the EP Act, which deemed petroleum pipeline rates that were in effect for the 365-day period ending on the date of enactment, or that were in effect on the 365th day preceding enactment and had not been subject to complaint, protest or investigation during the 365-day period, to be just and reasonable under the ICA (i.e., “grandfathered”). The EP Act also limited the circumstances under which a complaint can be made against such grandfathered rates. In order to challenge grandfathered rates, a party must show: (i) that it was contractually barred from challenging the rates during the relevant 365-day period; (ii) that there has been a substantial change after the date of enactment of the EP Act in the economic circumstances of the pipeline or in the nature of the services that were the basis for the rate, or (iii) that the rate is unduly discriminatory or unduly preferential.
The FERC determined our Lakehead System rates are not covered by the grandfathering provisions of the EP Act because they were subject to challenge prior to the effective date of the statute. The rates for our North Dakota System in effect at the time of the EP Act should be found to be subject to the grandfathering provisions of the EP Act because those rates were not suspended or subject to protest or complaint during the 365-day period established by the EP Act.
The EP Act required the FERC to issue rules establishing a simplified and generally applicable ratemaking methodology for petroleum pipelines and to streamline procedures in petroleum pipeline proceedings. The FERC responded to this mandate by issuing Order No. 561 which adopted an indexing rate methodology for petroleum pipelines. Under these regulations, which became effective January 1, 1995, petroleum pipelines are able to change their rates within prescribed ceiling levels that are tied to an inflation index. Rate increases made within the ceiling levels may be protested, but such protests generally must show that the rate increase resulting from application of the index is substantially in excess of the pipeline’s increase in costs. If the indexing methodology results in a reduced ceiling level that is lower than a pipeline’s filed rate, Order No. 561 requires the pipeline to reduce its rate to comply with the lower ceiling, although a pipeline is not required to reduce its rate below the level grandfathered under the EP Act. Under Order No. 561, a pipeline must as a general rule utilize the indexing methodology to change its rates. The FERC, however, uses cost-of-service ratemaking, market-based rates and settlement rates as alternatives to the indexing approach in certain specified circumstances.
The tariff rates for our Lakehead System are set using a combination of the FERC indexing rules (which apply to the base rates on that system) and FERC-approved surcharges for particular projects that were approved under the FERC’s settlement rules. The tariff rates for the North Dakota and Bakken Systems are set through a combination of the FERC indexing rules and contractual agreements.
The inflation index applied to those rates subject to the FERC indexing rules is determined by a formula that is established by FERC and is subject to review every five years. On December 18, 2015, the FERC set the index for the period from July 2016 through June 2021 at Producer Price Index for Finished Goods plus 1.23 percentage points. Based on this formula, the index resulted in an increase of approximately 0.2% for 2017 and a decrease of approximately 2.0% for 2016.
11
On October 20, 2016, the FERC issued an Advanced Notice of Proposed Rulemaking (ANOPR) seeking comments on proposed changes to its review of oil pipeline index rate filings and reporting requirements. Specifically, the FERC proposes to reject increases to indexed rates and indexed rate ceilings if certain criteria are met. Such rate increase rejections would be outright and would not be prompted by a shipper protest (as is the case currently) or involve a hearing into the merits of the rate increase. An ANOPR is an initial step taken by a regulatory agency to obtain comments from impacted parties. Before issuing a final rule regarding these issues the FERC must also undertake a Notice of Proposed Rulemaking (NOPR) process. Given the fact that the FERC did not have quorum for much of 2017, no action was taken regarding this ANOPR in 2017. It is unclear when this issue will be resolved.
FERC ALLOWANCE FOR INCOME TAXES IN INTERSTATE COMMON CARRIER PIPELINE RATES
Under current FERC policy, pipelines regulated by the FERC that are owned by entities organized as MLPs, may include an income tax allowance in their cost-of-service rates to the extent the income generated from regulated activities was subject to an actual or potential income tax liability. Pursuant to this policy, a FERC-regulated pipeline that is a tax pass-through entity seeking such an income tax allowance must establish that its owners, partners or members have an actual or potential income tax obligation on the partnership’s income from regulated activities. Whether a particular pipeline’s owners have an actual or potential income tax liability is reviewed by the FERC on a case-by-case basis. The MLP income tax allowance is relevant to those Lakehead projects whose costs are recovered on a cost-of-service based mechanism and would also be relevant to the extent any of our FERC regulated oil pipeline systems were to file cost-of-service rates. Entitlement to an income tax allowance is assessed under the FERC policy statement and the facts existing at the relevant time.
The current FERC income tax allowance policy has recently been drawn into question by a decision of the United States Court of Appeals (D.C. Circuit). In its July 1, 2016 decision in the United Airlines case the court found that the FERC had failed to demonstrate that its income tax policy statement - in conjunction with its rate of return policy statement - does not result in double recovery of taxes for partnerships and asked the FERC to establish an income tax recovery mechanism for which it can demonstrate that there is no double recovery. It is unclear at this point whether the current FERC income tax policy will be upheld or whether the FERC will need to change its policy and if so what the new mechanism might look like. On December 15, 2016 in Docket No. PL17-1-000, the FERC issued its Inquiry Regarding the Commission’s Policy for Recovery of Income Tax Costs, in which the FERC requested comments regarding how to address any double recovery resulting from the FERC’s current income tax allowance and rate of return policies. During 2017, numerous parties filed comments in response to the FERC’s request but the FERC has not yet acted on the comments. It is unclear when this issue will be resolved.
Further, effective January 2018, the "Tax Cuts and Jobs Act" (TCJA) changed several provisions of the federal tax code, including a reduction in the maximum corporate tax rate. Following the TCJA being signed into law, filings have been made at FERC requesting that FERC require pipelines regulated by FERC to lower their transportation rates to account for lower taxes. FERC may enact other regulations or issue further requests to pipelines regarding the impact of the corporate tax rate change on the rates. However, FERC’s establishment of a just and reasonable rate is based on many components, and the reduction in the corporate tax rate may only impact two of such components, the allowance for income taxes and the amount for accumulated deferred income taxes. Because our existing jurisdictional rates were established based on a higher corporate tax rate, FERC or our shippers may challenge these rates in the future, and the resulting new rate may be lower than the rates we currently charge.
ACCOUNTING FOR PIPELINE ASSESSMENT COSTS
The FERC’s policies describe how FERC-regulated companies should account for costs associated with implementing the pipeline integrity management requirements of the United States Department of Transportation (DOT) and the Pipeline and Hazardous Materials Safety Administration (PHMSA). FERC regulated companies are generally required to recognize costs incurred for performing pipeline assessments that are part of a pipeline integrity management program as a maintenance expense in the period in which the costs are incurred. Costs for items such as rehabilitation projects designed to extend the useful life of the system can continue to be capitalized to the extent permitted under the existing rules. Consistent with the FERC’s policies, we expense all internal inspection costs for all our pipeline systems, whether or not they are subject to the FERC’s regulation. Refer to Part II. Item 8. Financial Statements and Supplementary Data — Note 2 - Significant Accounting Policies included in our consolidated financial statements of this Annual Report on Form 10-K for additional discussion.
OTHER REGULATION
The governments of the United States and Canada have, by treaty, agreed to reduce barriers to foreign trade and stimulate the flow of goods and services between the United States and Canada, which includes the passage of oil
12
and natural gas through the pipelines of one country across the territory of the other. Individual international border crossing points require United States government permits that may be terminated or amended at the discretion of the United States Government. These permits provide that pipelines may be inspected by or subject to orders issued by federal and, on occasion, state government agencies.
Safety Regulation and Environmental
GENERAL
Our transmission pipelines, storage facilities and railcar operations are subject to extensive environmental, operational and safety regulation at the federal and state level. The added costs imposed by regulations are generally no different than those imposed on our competitors. The failure to comply with such rules and regulations can result in substantial penalties and/or enforcement actions and added operational costs.
PIPELINE SAFETY AND TRANSPORTATION REGULATION
Our transmission pipelines are subject to regulation by the DOT and the PHMSA, under the Pipeline Safety Act (PSA), specifically Volume 49 of the Code of Federal Regulations, Part 195 (hazardous liquids). The regulations pertain to the design, installation, testing, construction, operation, replacement and management of transmission pipeline facilities. PHMSA is the agency charged with regulating the safe transportation of hazardous materials under all modes of transportation, including interstate and intrastate pipelines. Periodically the PSA has been reauthorized and amended, imposing new mandates on the regulator to promulgate new regulations and imposing direct mandates on operators of pipelines. The most recent reauthorization occurred in 2016.
The National Transportation Safety Board (NTSB) has recommended that the PHMSA make a number of changes to its rules. Congress also has mandated that PHMSA adopt regulations to implement these recommendations, along with a number of additional regulatory measures. While we cannot predict the outcome of legislative or regulatory initiatives, such legislative and regulatory changes could have a material effect on our operations, particularly by extending through more stringent and comprehensive safety regulations (such as integrity management requirements) to pipelines and gathering lines not previously subject to such requirements. While we expect any legislative or regulatory changes to allow us time to become compliant with new requirements, costs associated with compliance may have a material effect on our operations.
We expect to incur increasing regulatory compliance costs, based on the intensification of the regulatory environment and upcoming changes to regulations as outlined above.
In addition to regulatory changes, costs may be incurred when there is an accidental release of a commodity transported by our system, or a regulatory inspection identifies a deficiency in our required programs.
When hydrocarbons are released into the environment or violations identified during an inspection, PHMSA may issue a civil penalty or enforcement action, which can require internal inspections, pipeline pressure reductions and other methods to manage or verify the integrity of a pipeline in the affected area. In addition, NTSB may perform an investigation of a significant accident to determine the probable cause and issue safety recommendations to prevent future accidents. Any release that results in an enforcement action or NTSB investigation, such as those associated with Line 6B near Marshall, Michigan could have a material impact on system throughput or compliance costs.
Where we have identified instances of non-compliance with respect to our pipeline and railcar operations, we have taken actions to remediate the situations. Nevertheless, significant operating expenses and capital expenditure could be incurred in the future if additional safety measures are required or if safety standards are raised and exceed the capabilities of our current pipeline control system or other safety equipment.
ENVIRONMENTAL REGULATION
General
Our operations are subject to complex federal, state and local laws and regulations relating to the protection of health and the environment, including laws and regulations that govern the handling, storage and release of crude oil and other liquid hydrocarbon materials. As with the pipeline and processing industry in general, complying with current and anticipated environmental laws and regulations increases our overall cost of doing business, including our capital costs to construct, maintain and upgrade equipment and facilities. While these laws and regulations affect our
13
maintenance capital expenditures and net income, we believe that they do not affect our competitive position since the operations of our competitors are generally similarly affected.
In addition to compliance costs, violations of environmental laws or regulations can result in the imposition of significant administrative, civil and criminal fines and penalties and, in some instances, injunctions, banning or delaying certain activities.
There are also risks of accidental releases into the environment associated with our operations, such as releases or spills of crude oil, NGLs, or other substances from our pipelines or storage facilities. Such accidental releases could, to the extent not insured, subject us to substantial liabilities arising from environmental cleanup and restoration costs, claims made by neighboring landowners and other third parties for personal injury and property damage and fines, penalties or damages for related violations of environmental laws or regulations.
Although we are entitled, in certain circumstances, to indemnification from third parties for environmental liabilities relating to assets we acquired from those parties, these contractual indemnification rights are limited, and accordingly, we may be required to bear substantial environmental expenses. However, we believe that through our due diligence process, we identify and manage substantial issues.
Air and Water Emissions
Our operations are subject to the Clean Air Act (CAA), the Clean Water Act (CWA) and comparable state and local statutes. We believe we are in material compliance with these laws and regulations. We anticipate that we will incur costs over the next several years for air pollution control equipment and spill prevention measures in connection with maintaining our existing facilities and obtaining permit approvals for any new or acquired facilities.
In June 2016, the United States Environmental Protection Agency (EPA) issued final rules specific to the oil and gas industry to regulate methane and volatile organic compound (VOC) emissions from new and modified facilities in transportation and storage, gathering and boosting, production and processing facilities, including fugitive emission leak detection and repair requirements. On April 19, 2017, the EPA announced its intent to administratively reconsider the methane rules, staying a June 3, 2017 effective date for certain provisions for 90 days. Petitioners challenged the administrative stay in the D.C. Circuit, and on July 3, 2017, the D.C. Circuit granted relief for the petitioners, which had the impact of making the previously-stayed rules effective. These methane regulations remain in effect until possible revision or repeal by separate EPA rulemaking in the future, which action is likely to be challenged in the courts. In November 2016, the EPA issued an Oil and Gas Information Collection Request (ICR) covering methane and VOC emissions from the oil and gas industry. Enbridge received notification of the request on November 22, 2016, but in March 2017 before we were required to respond, the EPA subsequently withdrew the ICR.
In June 2015, the EPA and the United States Army Corps of Engineers (Army Corps) published a final rule to clarify the federal jurisdictional reach over wetlands and waterbodies. This regulation is the subject of numerous ongoing legal challenges. The United States Sixth Circuit Court of Appeals stayed implementation of the rule nationwide in October 2015 pending review, but on January 22, 2018, the United States Supreme Court held that legal challenges to the rule must first be heard at the district court level rather than the appellate court level. Additionally, the EPA and the Army Corps proposed a rulemaking in June 2017 to repeal the June 2015 rule, and they announced their intent to issue a new rule defining the reach of federal jurisdiction. On February 6, 2018 the EPA and Army Corps issued a final rule amending the effective date of the 2015 rule to February 6, 2020. Challenges to this rule have been filed and remain pending in various federal courts. As a result, future implementation of the June 2015 rule is uncertain at this time. If implemented, this final rule has the potential to increase our operating and capital costs to construct, maintain and upgrade equipment and facilities.
The Oil Pollution Act (OPA) was enacted in 1990 and amends parts of the CWA and other statutes as they pertain to the prevention of and response to oil spills. Under the OPA, we could be subject to strict, joint and potentially unlimited liability for removal costs and other consequences of an oil spill from our facilities into navigable waters, along shorelines or in an exclusive economic zone of the United States. The OPA also imposes certain spill prevention, control and countermeasure requirements for many of our non-pipeline facilities, such as the preparation of detailed oil spill emergency response plans and the construction of dikes or other containment structures to prevent contamination of navigable or other waters in the event of an oil overflow, rupture or release. For our liquid pipeline facilities, the OPA imposes requirements for emergency plans to be prepared, submitted and approved by the DOT. For our non-transportation facilities, such as storage tanks that are not integral to our pipeline transportation system, the OPA regulations are promulgated by the EPA.
14
For all proposed rules, we will continue to track the progress through involvement in industry groups and will comply with any regulatory requirements that enter into force. We do not expect a material effect on our financial statements as a result of compliance efforts.
Hazardous Substances and Waste Management
The Comprehensive Environmental Response, Compensation, and Liability Act (CERCLA, or the “Superfund” law) and similar state laws impose liability without regard to fault or the legality of the original conduct, on certain classes of persons, including the owners or operators of waste disposal sites and companies that disposed or arranged for disposal of hazardous substances found at such sites. We may generate some wastes that fall within the definition of a “hazardous substance.” We may, therefore, be subject to strict, joint and several liability under CERCLA for all or part of any costs required to clean up and restore sites at which such wastes have been disposed, for damages to natural resources, and for the cost of certain health studies. In addition, it is not uncommon for neighboring landowners and other third parties to file claims for personal injury and property damage allegedly caused by hazardous substances or other pollutants released into the environment. Analogous state laws may apply to a broader range of substances than CERCLA and, in some instances, may offer fewer exemptions from liability. We have not received any notification that we may be potentially responsible for material cleanup costs under CERCLA or similar state laws.
Site Remediation
We own and operate a number of pipelines, gathering systems, and storage facilities that have been used to transport, distribute, store and process crude oil and other petroleum products. Many of our facilities were previously owned and operated by third parties whose handling, disposal and release of petroleum and waste materials were not under our control. The age of the facilities, combined with the past operating and waste disposal practices, which were standard for the industry and regulatory regime at the time, have resulted in soil and groundwater contamination at some facilities due to historical spills and releases. Such contamination is not unusual within the petroleum industry. Historical contamination found on, under or originating from our properties may be subject to CERCLA, the Resource Conservation & Recovery Act and analogous state laws as described above.
Under these laws, we could incur substantial expense to remediate such contamination, including contamination caused by prior owners and operators. In addition, Enbridge Management, as the entity with managerial responsibility for us, could also be liable for such costs to the extent that we are unable to fulfill our obligations. We have conducted site investigations at some of our facilities to assess historical environmental issues, and we are currently addressing soil and groundwater contamination at various facilities through remediation and monitoring programs, with oversight by the applicable governmental agencies where appropriate.
Endangered Species
New projects may require approvals and environmental analyses under federal or state laws, including the National Environmental Policy Act and the Endangered Species Act, that result in prohibitions on activities that can result in harm to specific species of plants and animals. The often lengthy regulatory review and project approval process, as well as prohibitions or requirements for capital expenditures to reduce a facility’s impacts on a species, may result in increased costs and liabilities that could materially and negatively affect the viability of a project.
EMPLOYEES
Neither we nor Enbridge Management have any employees. Our General Partner has delegated to Enbridge Management, pursuant to a delegation of control agreement, substantially all of the responsibility for our day-to-day management and operation. Our General Partner, however, retains certain functions and approval rights over our operations. To fulfill its management obligations, Enbridge Management has entered into agreements with Enbridge and several of its affiliates to provide Enbridge Management with the necessary services and support personnel who act on Enbridge Management’s behalf as its agents. We are ultimately responsible for reimbursing these service providers based on the costs that they incur in performing these services.
INSURANCE
Our operations are subject to many hazards inherent in the liquid petroleum gathering, treating, processing and transportation industry. Our assets may experience physical damage as a result of an accident or natural disaster. These hazards can also cause personal injury and loss of life, severe damage to and destruction of property and equipment, pollution or environmental damage, and suspension of operations. We are included in the comprehensive insurance program maintained by Enbridge for its subsidiaries. This program includes insurance coverage in types
15
and amounts and with terms and conditions that are generally consistent with coverage considered customary for our industry.
In the event of multiple insurable incidents occur which exceed coverage limits within the same insurance period, the total insurance coverage will be allocated among the Enbridge entities on an equitable basis based on an insurance allocation agreement we have entered into with Enbridge and other Enbridge subsidiaries.
We can make no assurance that the insurance coverage we maintain will be available or adequate for any particular risk or loss or that we will be able to maintain adequate insurance in the future at rates we consider reasonable. Although we believe that our assets are adequately covered by insurance, a substantial uninsured loss could have a material adverse effect on our financial position, results of operations and cash flows.
TAXATION
We are not a taxable entity for United States federal income tax purposes. Generally, United States federal and state income taxes on our taxable income are borne by our individual partners through the allocation of our taxable income. In a limited number of states, an income tax is imposed upon us and generally, not our individual partners. The income tax that we bear is reflected in our consolidated financial statements. The allocation of taxable income to our individual partners may vary substantially from net income reported in our consolidated statements of income.
AVAILABLE INFORMATION
We make available free of charge on or through our Internet website http://www.enbridgepartners.com our Annual Reports on Form 10-K, Quarterly Reports on Form 10-Q, Current Reports on Form 8-K and other information statements, and if applicable, amendments to those reports filed or furnished pursuant to Section 13(a) of the Securities Exchange Act of 1934, as amended, or Exchange Act, as soon as reasonably practicable after we electronically file such material with the SEC. Information contained on our website is not part of this report.
ITEM 1A. RISK FACTORS
We encourage you to consider carefully the risk factors described below, in addition to the other information contained in or incorporated by reference into this Annual Report on Form 10-K.
RISKS RELATED TO OUR BUSINESS
WE MAY NOT HAVE SUFFICIENT CASH FLOWS TO ENABLE US TO CONTINUE TO PAY DISTRIBUTIONS AT THE CURRENT LEVEL.
We may not have sufficient available cash from operating surplus each quarter to enable us to pay distributions at the current level. As part of our previously completed strategic review, which concluded in April 2017, we considered the sustainability of our level of distributions, which had been adversely affected the performance of our natural gas business, cyclical downturns and other factors. Upon completion of the strategic review, we announced several actions intended to strengthen our financial position and outlook, including a reduction in our quarterly distribution.
The amount of cash we are able to distribute depends on the amount of cash we generate from our operations, which can fluctuate quarterly based upon a number of factors, including:
• | the operating performances of our assets; |
• | commodity prices; |
• | our ability to bring new assets into service at its expected time and projected cost; |
• | actions of governmental regulatory bodies; |
• | the level of capital expenditures we make; |
• | the amount of cash reserves established by Enbridge Management; |
• | our ability to access capital markets and borrow money; |
• | our debt service requirements and restrictions in our credit agreements; |
• | fluctuations in our working capital needs; and |
16
• | the cost of acquisitions; and |
• | actions of regulators. |
In addition, the amount of cash we distribute depends primarily on our cash flow rather than net income or net loss. Therefore, we may make cash distributions for periods in which we record net losses or may make no distributions for periods in which we record net income. Other than the requirement in our partnership agreement to distribute all of our available cash each quarter, we have no legal obligation to declare quarterly cash distributions, and our General Partner has considerable discretion to determine the amount of our available cash each quarter. In addition, our General Partner may change our cash distribution policy at any time, subject to the requirement in our partnership agreement to distribute all of our available cash quarterly.
OUR ACTUAL CONSTRUCTION AND DEVELOPMENT COSTS COULD EXCEED OUR FORECAST, AND OUR CASH FLOW FROM CONSTRUCTION AND DEVELOPMENT PROJECTS MAY NOT BE IMMEDIATE, WHICH MAY LIMIT OUR ABILITY TO MAINTAIN OR INCREASE CASH DISTRIBUTIONS.
Our strategy contemplates significant expenditures for the development, construction or other acquisition of energy infrastructure assets. The construction of new assets involves numerous regulatory, environmental, legal, political, federal, state and local permitting, material and labor cost and operational risks that are difficult to predict and beyond our control. As a result, we may not be able to complete our projects at the costs currently estimated or within the time periods we have projected. If we experience material cost overruns, we will have to finance these overruns using one or more of the following methods:
• | using cash from operations; |
• | delaying other planned projects; |
• | incurring additional indebtedness; or |
• | issuing additional equity. |
Any or all of these methods may not be available when needed or may adversely affect our future results of operations and cash flows.
Our revenues and cash flows may not increase immediately on our expenditure of funds on a particular project. For example, if we build a new pipeline or expand an existing facility, the design, construction, development and installation may occur over an extended period of time and we may not receive any material increase in revenue or cash flow from that project until after it is placed in service and customers begin using the systems. In addition, circumstances may occur from time to time, such as the inability to obtain a necessary permit, which could cause us to cancel a project. If our revenues and cash flow do not increase at projected levels because of substantial unanticipated delays, project cancellations or other factors, we may not meet our obligations as they become due, and we may need to reduce or re-prioritize our capital budget, sell non-strategic assets, access the capital markets or reassess our level of distributions to unitholders to meet our capital and other requirements.
OUR ABILITY TO ACCESS CAPITAL AND CREDIT MARKETS ON ATTRACTIVE TERMS TO OBTAIN FUNDING FOR OUR CAPITAL PROJECTS AND ACQUISITIONS MAY BE LIMITED.
Our ability to fund our capital projects and make acquisitions depends on whether we can access the necessary financing to fund these activities. Domestic and international economic conditions affect the functioning of capital markets and the availability of credit. Adverse economic conditions, such as the depressed levels of commodity prices experienced since the fall of 2014, can result in weakness and volatility in the capital markets, which in turn can limit, temporarily or for extended periods, our ability to raise capital through equity or debt offerings. Additionally, the availability and cost of obtaining credit commitments from lenders can change as economic conditions and banking regulations reduce the credit that lenders have available or are willing to lend. These conditions, can make it difficult to obtain funding for our capital needs from the capital markets on acceptable economic terms. As a result, we may be required to revise the timing and scope of capital projects as necessary to adapt to prevailing market and economic conditions.
Due to these factors, we cannot be certain that funding for our capital needs will be available from bank credit arrangements or capital markets on acceptable terms, if needed and to the extent required. If funding is not available when needed, or is available only on unfavorable terms, we may be unable to implement our development plan, enhance our existing business, complete acquisitions and construction projects, take advantage of business
17
opportunities or respond to competitive pressures, any of which could have a material adverse effect on our revenues and results of operations.
A DOWNGRADE IN OUR CREDIT RATING COULD REQUIRE US TO PROVIDE COLLATERAL FOR OUR HEDGING LIABILITIES AND NEGATIVELY IMPACT OUR INTEREST COSTS AND BORROWING CAPACITY UNDER OUR CREDIT FACILITIES.
Standard & Poor’s Global Ratings (S&P), Dominion Bond Rating System (DBRS) and Moody’s Investors Service Inc., (Moody’s) rate our non-credit enhanced, senior unsecured debt. Although we are not aware of current plans by the ratings agencies to lower their respective ratings on such debt, we cannot be assured that such credit ratings will not be downgraded.
Currently, we are parties to certain International Swaps and Derivatives Association, Inc., (ISDA®) agreements associated with the derivative financial instruments we use to manage our exposure to fluctuations in commodity prices. These ISDA® agreements require us to provide assurances of performance if our counterparties’ exposure to us exceeds certain levels or thresholds. We generally provide letters of credit to satisfy such requirements. No letters of credit were provided as of December 31, 2017 as assurances of performance for our then outstanding derivative financial instruments. In the event that our credit ratings were to decline to the lowest level of investment grade, as determined by S&P and Moody’s, we would be required to provide letters of credit in substantially greater amounts to satisfy the requirements of our ISDA® agreements. For example, if our credit ratings had been at the lowest level of investment grade at December 31, 2017, we would have been required to provide additional letters of credit in the aggregate amount of $12 million. The amounts of any letters of credit we would have to establish under the terms of our ISDA® agreements would reduce the amount that we are able to borrow under our Credit Facilities.
OUR ACQUISITION STRATEGY MAY BE UNSUCCESSFUL IF WE INCORRECTLY PREDICT THE OPERATING RESULTS OF ACQUIRED ASSETS, ARE UNABLE TO IDENTIFY AND COMPLETE FUTURE ACQUISITIONS OR DO NOT SUCCESSFULLY INTEGRATE ACQUIRED ASSETS OR BUSINESSES.
The acquisition of complementary energy delivery assets is a component of our strategy. Acquisitions present various risks and challenges, including:
• | the risk of incorrect assumptions regarding the future results of the acquired operations or expected cost reductions or other synergies expected to be realized as a result of acquiring such operations; |
• | a decrease in liquidity as a result of utilizing significant amounts of available cash or borrowing capacity to finance an acquisition; |
• | the loss of critical customers or employees at the acquired business; |
• | the assumption of unknown liabilities for which we are not fully and adequately indemnified; |
• | the risk of failing to effectively integrate the operations or management of acquired assets or businesses or a significant delay in such integration; and |
• | diversion of management’s attention from existing operations. |
In addition, we may be unable to identify acquisition targets or consummate acquisitions in the future.
OUR FINANCIAL PERFORMANCE COULD BE ADVERSELY AFFECTED IF OUR PIPELINE SYSTEMS ARE USED LESS.
Our financial performance depends to a large extent on the volumes transported on our liquids pipeline systems. Decreases in the volumes transported by our systems can directly and adversely affect our revenues and results of operations. The volume transported on our pipelines can be influenced by factors beyond our control including:
• | competition; |
• | regulatory action; |
• | weather conditions; |
• | storage levels; |
• | alternative energy sources; |
• | decreased demand; |
• | fluctuations in energy commodity prices; |
18
• | environmental or other governmental regulations; |
• | shareholder activism or activities by non-governmental organization to restrict the exploration, development or production of crude oil by our customers; |
• | economic conditions; |
• | supply disruptions; |
• | availability of supply connected to our pipeline systems; and |
• | availability and adequacy of infrastructure to move, treat and refine supply into and out of our systems. |
As an example, the volume of shipments on our Lakehead System depends heavily on the supplies of western Canadian crude oil. Insufficient supplies of western Canadian crude oil that limit shipments on our Lakehead System, which occurred in mid-2016 due to extreme wildfires in northeastern Alberta, will adversely affect our business. Decreases in crude oil exploration and production activities in western Canada and other factors, including supply disruption, higher development costs and competition, could reduce volumes transported growth of our Lakehead System. The volume of crude oil that we transport on our Lakehead System, as well as the North Dakota and Bakken Systems, also depends on the demand for crude oil in the Great Lakes and Midwest regions of the United States and the volumes of crude oil and refined products delivered by others into these regions and the province of Ontario. As well, there are supply driven risks around our North Dakota and Bakken System, as lower commodity prices can reduce drilling and result in decrease volumes on our systems.
In addition, our ability to increase deliveries to expand our Lakehead System in the future depends on increased supplies of western Canadian crude oil. We expect that any potential growth in future supplies of western Canadian crude oil will come from the development of oil sands projects in Alberta. Full utilization of additional capacity as a result of our Alberta Clipper and Southern Access pipelines and future expansions of our Lakehead System will largely depend on these anticipated increases in crude oil production from oil sands projects. A reduction in demand for crude oil or a decline in crude oil prices may make certain oil sands projects uneconomical since development costs for production of crude oil from oil sands are greater than development costs for production of conventional crude oil. Oil sands producers may cancel or delay plans to expand their facilities, as some oil sands producers have done in recent years, if crude oil prices are at levels that do not support expansion. Any cancellation or delay of oil sands projects could directly impact our Lakehead System with potential indirect impacts on our Mid-Continent, North Dakota and Bakken Systems. Additionally, measures adopted by the government of the province of Alberta to increase its share of revenues from oil sands development coupled with a decline in crude oil prices could reduce the volume growth we have anticipated in expanding the capacity of our crude oil pipelines.
OUR FINANCIAL PERFORMANCE MAY BE ADVERSELY AFFECTED BY RISK ASSOCIATED WITH THE ALBERTA OIL SANDS.
Our Lakehead System is highly dependent on sustained production from the Alberta oil sands. Alberta oil sands producers face a number of challenges that must be managed effectively to allow for sustained growth in the sector. Factors and risks affecting the oil sands industry include:
• | reduced crude oil prices; |
• | cost inflation; |
• | labor availability; |
• | environmental and regulatory impact; |
• | reputation management; |
• | changing policy and regulation; and |
• | commodity price volatility. |
Adverse developments or trends involving these and other related factors could affect oil sands development or production levels and result in decreased volumes on the Lakehead System, and our failure to effectively anticipate, manage or respond to these risks could result in significant capital expenditures or increased operating costs or otherwise negatively affect our operating results or financial condition.
COMPETITION MAY REDUCE OUR REVENUES.
19
Our Lakehead System faces current and potentially future competition from other pipelines for transporting western Canadian crude oil, which may reduce our volumes and the associated revenues. Lower volumes will increase our transportation rates where those rates are determined using a cost-of-service methodology, and higher rates may result in even greater competitive pressure from these competing pipelines and such increases in transportation rates could result in rates that are higher than competitive conditions will otherwise permit. In addition, our Lakehead System competes with other crude oil and refined product pipelines and other methods of delivering crude oil and refined products to the refining centers of Minneapolis-St. Paul, Chicago, Detroit, Toledo, Buffalo, and Sarnia, and the refinery market and pipeline hub located in the Patoka/Wood River area of southern Illinois. Refineries in the markets served by our Lakehead System compete with refineries in western Canada, the province of Ontario and the Rocky Mountain region of the United States for supplies of western Canadian crude oil.
OUR LIQUIDS SEGMENT RESULTS MAY BE ADVERSELY AFFECTED BY COMMODITY PRICE VOLATILITY.
Volatility in commodity prices can impact production volumes in the oil sands region of western Canada and the Bakken region of North Dakota, our two primary crude oil supply basins.
The relatively high costs and large up front capital investments required by oil sands projects involves significant assumptions concerning short-term and long-term crude oil fundamentals including world supply and demand, North American supply and demand, and price outlook among many other factors. As oil sands production is long-term in nature, the long-term outlook is significant to a producer’s investment decision. These decisions may impact the annual rate of future supply growth from the oil sands region.
While current oil sands projects are not as sensitive to short-term declines in crude oil prices, a protracted decline in crude oil prices, such as has been experienced since the fall of 2014, could result in delay or cancellation of future projects. In addition, wide commodity price spreads have impacted producer netbacks and margins in the past years that largely resulted from insufficient pipeline infrastructure and takeaway capacity from producing regions in Alberta. Combined with high labor and operating costs, this has forced some producers to reconsider or defer projects until a more favorable climate for infrastructure development can be forecast.
Tight sands and shale oil production in any basin in North America such as the Bakken or the Permian will be comparatively more sensitive to the short-term changes in crude oil prices due to the sharp declining production profile associated with individual tight sands and shale oil wells. Accordingly, during periods of comparatively low prices, supply growth from the North Dakota basin may be lower, which may impact volumes on our pipeline system including impacts on our minority stake on the Bakken Pipeline System, which consists of DAPL and ETCOP.
WE FACE RISKS ASSOCIATED WITH ACTIONS TAKEN IN CONNECTION WITH OUR STRATEGIC REVIEW.
Our previously announced strategic review was completed in April 2017. In connection with the completion of our strategic review, the following actions were taken in an effort to strengthen our financial position and outlook:
• | the reduction of our quarterly distributions from $0.583 per unit to $0.35 per unit; |
• | the sale of our Midcoast gas gathering the processing business to our General Partner; |
• | the finalization of the joint funding arrangement with our General Partner for our investment in the Bakken Pipeline System; |
• | the redemption of Series 1 Preferred Units held by our General Partner and the repayment of the deferred distribution balance owned to our General Partner and; |
• | the restructuring of our capital structure and modification of our incentive distribution rights through the irrevocable waiver by a wholly-owned subsidiary of our General Partner of all of that subsidiary's Class D units and Incentive Distribution Units (IDUs) for new Class F units. |
There can be no assurance that the actions we took as a result of our strategic review will be successful or deliver their anticipated benefits. We may be exposed to new and unforeseen risks and challenges, and it may be difficult to predict the success of such endeavors or the impacts to our unit holders.
CHANGES IN, OR CHALLENGES TO, OUR RATES COULD HAVE A MATERIAL ADVERSE EFFECT ON OUR FINANCIAL CONDITION AND RESULTS OF OPERATIONS.
20
The rates charged by several of our pipeline systems are regulated by the FERC or state regulatory agencies, or both. If one of these regulatory agencies, on its own initiative or due to challenges by third parties, were to lower our tariff rates, the profitability of our pipeline businesses would suffer.
Under current policy, the FERC permits interstate pipelines that are subject to cost of service regulation to include an income tax allowance when calculating their regulated rates. The FERC’s income tax allowance policy has been the subject of challenge, and we cannot predict whether the FERC or a reviewing court will alter the existing policy. On December 15, 2016, the FERC issued a Notice of Inquiry (NOI) requesting energy industry input on how the FERC should address income tax allowances in cost-based rates proposed by pipeline companies organized as part of a MLP. The FERC’s current policy permits pipelines and storage companies to include a tax allowance in the cost-of-service used as the basis for calculating their regulated rates. For pipelines and storage companies owned by partnerships or limited liability company interests, the current tax allowance policy reflects the actual or potential income tax liability on the FERC’s jurisdictional income attributable to all partnership or limited liability company interests if the ultimate owner of the interest has an actual or potential income tax liability on such income. The FERC issued the NOI in response to a remand from the United States Court of Appeals for the D.C. Circuit in United Airlines v. FERC, in which the court determined that the FERC had not justified its conclusion that an oil pipeline organized as a partnership would not “double recover” its taxes under the current policy by both including a tax allowance in its cost-based rates and earning a Return on Equity (ROE) calculated on a pre-tax basis. We cannot predict whether the FERC will successfully justify its conclusion that there is no double recovery of taxes under these circumstances or whether the FERC will modify its current policy on either income tax allowances or ROE calculations for pipeline companies organized as part of a MLP. However, any modification that reduces or eliminates an income tax allowance for pipeline companies organized as a part of a MLP or decreases the ROE for such pipelines could result in an adverse impact on our revenues associated with the transportation and storage services we provide pursuant to cost-based rates.
Effective January 2018, the United States legislation referred to as the Tax Cuts and Jobs Act (the TCJA) changed several provisions of the federal tax code, including a reduction in the maximum corporate tax rate. This tax rate change is expected to cause us to reduce the income tax allowance component of tolls in our FERC regulated cost-of-service based Facility Surcharge Mechanism (FSM) projects. Impacts of tax reform will be reflected in Lakehead's FSM toll filing for rates effective April 1, 2018. Further, there is a risk that our other FERC regulated pipelines may be required to lower their transportation rates to reflect the TCJA. This risk could materialize through either a FERC initiated requirement or through a shipper seeking to have the rates of a specific pipeline reduced.
We believe that the rates we charge for transportation services on our interstate common carrier pipelines are just and reasonable under the ICA. However, because the rates that we charge are subject to review upon an appropriately supported protest or complaint, or a regulator’s own initiative, we cannot predict what rates we will be allowed to charge in the future for service on our interstate common carrier pipelines. Furthermore, because rates charged for transportation services must be competitive with those charged by other transporters, the rates set forth in our tariffs will be determined based on competitive factors in addition to regulatory considerations. Competition from other pipeline systems may prevent us from raising our tariff rates even if regulatory agencies permit us to do so.
INCREASED REGULATION AND REGULATORY SCRUTINY MAY REDUCE OUR REVENUES.
Our interstate pipelines are subject to FERC regulation of terms and conditions of service. Action by the FERC on currently pending regulatory matters, including the FERC’s proposed changes issued on October 20, 2016, in Docket No. RM17-1, as well as matters arising in the future could adversely affect our ability to establish or charge rates that would increase revenues and cover future costs. Specifically, in Docket No. RM17-1, the FERC proposes a new policy that would deny proposed index increases if a pipeline’s Form No. 6 reflects revenues that exceed the total cost-of-service by fifteen percent for both of the prior two years or if the proposed index increases exceed by five percent the annual cost changes reported on the pipeline’s most recently filed Form 6. Additionally, in that proceeding, the FERC proposes to require pipelines to provide more specific data on its Form 6. The Commission has not issued an order on these proposals, but such changes could result in an adverse impact on our ability to increase FERC regulated rates and accordingly revenues associated with the transportation and storage services we provide pursuant to indexed-based rates. We cannot assure unitholders that our pipeline systems will be able to recover all of their costs through existing or future rates.
OUR RISK MANAGEMENT POLICIES CANNOT ELIMINATE ALL RISK. IN ADDITION, ANY NON-COMPLIANCE WITH OUR RISK MANAGEMENT POLICIES COULD RESULT IN SIGNIFICANT FINANCIAL LOSSES.
21
We use derivative financial instruments to manage the risks associated with market fluctuations in commodity prices and interest rates, as well as to reduce volatility to our cash flows. Based on our risk management policies, all of our derivative financial instruments are associated with an underlying asset, liability and/or forecasted transaction and are not entered into with the objective of speculating on commodity prices or interest rates. These policies cannot, however, eliminate all risk of unauthorized trading and other speculative activity. Although this activity is monitored independently by our risk management function, we remain exposed to the risk of non-compliance with our risk management policies. We can provide no assurance that our risk management function will detect and prevent all unauthorized trading and other violations of our risk management policies and procedures, particularly if deception, collusion or other intentional misconduct is involved, and any such violations could result in significant financial losses and have a material adverse effect on our financial condition, results of operations and cash flows and our ability to make cash distributions to our unitholders.
COMPLIANCE WITH ENVIRONMENTAL AND OCCUPATIONAL SAFETY LAWS AND REGULATIONS MAY EXPOSE US TO SIGNIFICANT COSTS AND LIABILITIES.
Our crude oil and liquid petroleum gathering, transportation and storage operations are subject to foreign, federal, state, provincial and local laws and regulations relating to environmental protection and operational and worker safety. Numerous governmental authorities have the power to enforce compliance with the laws and regulations they administer and permits they issue, oftentimes imposing stringent requirements and necessitating capital expenditures or increased operating costs to achieve compliance, especially when activity is in the presence of environmentally sensitive receptors such as water crossings, wetlands and endangered species. Our failure to comply with these laws, regulations and operating permits may result in the assessment of administrative, civil and criminal penalties, the imposition of remedial obligations or the occurrence of delays in the permitting or performance of projects and the issuance of injunctions limiting or preventing some or all of our operations. Our operation of liquid petroleum gathering, storage and transportation facilities exposes us to the risk of incurring significant environmental and safety-related costs and liabilities. Additionally, operational modifications, including pipeline restrictions, necessary to comply with regulatory requirements and resulting from our handling of crude oil and liquid petroleum, historical environmental contamination, accidental releases or upsets, regulatory enforcement, litigation or occupational safety and health incidents can also result in significant cost or limit revenues and volumes. Further, environmental and occupational safety laws and regulations, including but not limited to pipeline safety, wastewater discharge and air emission requirements, continue to become more stringent over time, particularly those related to the oil and gas industry. We may incur joint and several strict liability under these environmental laws and regulations in connection with discharges or releases of liquid petroleum and crude oil and wastes on, under or from our properties and facilities, many of which have been used for gathering or storage activities for a number of years, oftentimes by third parties not under our control. Private parties, including the owners of properties through which our gathering systems pass and facilities where our liquid petroleum and crude oil or wastes are taken for reclamation or disposal, may also have the right to pursue legal actions to enforce compliance as well as to seek damages for non-compliance with environmental laws and regulations or for personal injury or property damage.
Moreover, public interest in the protection of the environment has increased dramatically in recent years and the trend of more expansive and stringent environmental legislation and regulations applied to the hazardous liquid transportation, gathering and storage industry could continue, resulting in increased costs of doing business and consequently affecting profitability. For example, in October 2015, the EPA issued a final rule under the federal CAA, lowering the National Ambient Air Quality Standard (NAAQS) for ground-level ozone to 70 parts per billion under both the primary and secondary standards.
The EPA published a final rule in November 2017 with attainment designations for only some areas, with other designations to be announced at a later date. State implementation of these revised standards could result in stricter permitting requirements, delay or prohibit our ability to obtain such permits and result in increased expenditures for pollution control equipment, the costs of which could be significant. In a second example, in June 2015, the EPA and the Army Corps issued a new rule to clarify the federal jurisdictional reach over waters of the United States. The rule has been challenged in numerous courts on the grounds that it unlawfully expands the reach of the Clean Water Act. The United States Sixth Circuit Court of Appeals stayed implementation of the rule nationwide in October 2015 pending review, but on January 22, 2018, the United States Supreme Court held that legal challenges to the rule must first be heard at the district court level rather than the appellate court level. Additionally, following the issuance of a presidential executive order to review the rule, the EPA and the Army Corps proposed a rulemaking to repeal the rule in June 2017. The EPA and Army Corps also announced their intent to issue a new rule defining the reach of federal jurisdiction. On February 6, 2018 the EPA and Army Corps issued a final rule amending the effective date of the 2015 rule to February 6, 2020. Challenges to this rule have been filed and remain pending in various federal courts. As a result, future
22
implementation of the rule is uncertain at this time. If the June 2015 rule is implemented, we could face increased costs and delays with respect to obtaining permits for dredge and fill activities in wetland areas and water crossings in connection with any expansion activities. We may not be able to recover these costs of compliance from insurance or through higher rates.
THE ADOPTION AND IMPLEMENTATION OF CLIMATE CHANGE LEGISLATION OR REGULATIONS RESTRICTING EMISSIONS OF GREENHOUSE GASES MAY EXPOSE US TO SIGNIFICANT COSTS AND LIABILITIES.
Climate change continues to attract considerable public and scientific attention. As a result, numerous proposals have been made and could continue to be made at the international, federal, state and provincial levels of government to monitor and limit emissions of greenhouse gases (GHGs), which include carbon dioxide and methane. These efforts have included consideration of cap-and-trade programs, carbon taxes and GHG reporting and tracking programs, and regulations that directly limit GHG emissions from certain sources.
At the United States federal level, no comprehensive climate change legislation has been implemented to date. However, the EPA has adopted rules under authority of the federal CAA that, among other things, establish Potential for Significant Deterioration (PSD) construction and Title V operating permit reviews for GHG emissions from certain large stationary sources that are also potential major sources of certain principal, or criteria, pollutant emissions, which reviews could require securing PSD permits at covered facilities emitting GHGs and meeting "best available control technology" standards for those GHG emissions. The EPA has also adopted rules requiring the monitoring and annual reporting of GHG emissions from certain petroleum system sources in the United States, including, among others, onshore and offshore production and onshore processing, transmission, storage and distribution facilities. In October 2015, the EPA amended and expanded the GHG reporting requirements to all segments of the oil industry, including gathering, compression and boosting facilities as well as completions and workovers from hydraulically fractured oil wells, and in January 2016, the EPA proposed additional revisions to leak detection methodology to align the reporting rules with the new source performance standards. The EPA also has begun directly regulating emissions of methane, a GHG, from oil and natural gas operations, commencing with a final rule in 2012 establishing new source performance standards known as Subpart OOOO on certain equipment and processes and expanding those requirements in 2016 with added new source performance standards, known as Subpart OOOOa, that require certain new, modified or reconstructed facilities in the oil and natural gas sector to reduce methane gas and VOC emissions. On April 19, 2017, however, the EPA announced its intent to administratively reconsider the methane rules, staying a June 3, 2017 effective date for certain provisions for 90 days. Petitioners challenged the administrative stay in the D.C. Circuit, and on July 3, 2017, the D.C. Circuit granted relief for the petitioners, which had the impact of making the previously-stayed rules effective. The EPA also proposed a rule-making in June 2017 to stay the methane rules for two years and to revisit their implementation in their entirety. These methane regulations remain in effect until possible revision or repeal by separate EPA rulemaking in the future, which action is also likely to be challenged in the courts.
On the international level, in December 2015, the United States was one of many countries at the 21st Conference of the Parties of the United Nations Framework Convention on Climate Change in Paris, France. The resulting Paris Agreement requires member countries to review and “represent a progression” in their intended nationally determined contributions, which set GHG emission reduction goals every five years. The Paris Agreement was signed by the United States in April 2016 and entered into force in November 2016; however, in August 2017, the United States State Department officially informed the United Nations of the intent of the United States to withdraw from the agreement, with the earliest possible effective date of withdrawal being November 4, 2020. Despite the planned withdrawal, certain United States city and state governments have announced their intention to satisfy their proportionate obligations under the Paris Agreement.
The adoption and implementation of any international, federal, state or provincial legislation or regulations that require reporting of GHGs or otherwise restrict emissions of GHGs could result in increased compliance costs, such as costs to purchase and operate emissions control systems, to acquire emissions allowances or comply with new regulatory or reporting requirements. Any such legislation or regulatory programs could also increase the cost of consuming, and thereby reduce demand for, oil and natural gas, which could reduce volumes on our pipeline systems. One or more of these developments could have an adverse effect on our business, financial condition and results of operation. Additionally, some scientists have concluded that increasing concentrations of GHG in the atmosphere may produce climate changes that have significant physical effects, such as increased frequency and severity of storms, droughts, and floods and other climate events. Finally, notwithstanding potential risks related to climate change, the International Energy Agency, an autonomous intergovernmental organization involved in international energy policy, estimates that global energy demand will continue to rise and will not peak until after 2040 and oil and gas will continued
23
to represent a substantial percentage of global energy use over that time. However, recent activism directed at shifting funding away from companies with energy-related assets could result in limitations or restrictions on certain sources of funding for the energy sector.
LAWS AND REGULATIONS REGARDING HYDRAULIC FRACTURING COULD RESULT IN REDUCTIONS OR DELAYS IN PRODUCTION ACTIVITIES BY OUR CUSTOMERS THAT MAY REDUCE OUR REVENUES DUE TO DECREASED VOLUMES TRANSPORTED ON OUR PIPELINES.
Hydraulic fracturing is an essential and common practice used to stimulate production of crude oil from dense subsurface rock formations such as shales. Many of our customers routinely apply hydraulic-fracturing techniques in many of their United States onshore crude oil drilling and completion programs. The process involves the injection of water, sand or alternative proppant and chemical additives under pressure into a targeted subsurface formation to fracture the surrounding rock and stimulate production.
Hydraulic fracturing is typically regulated by state oil commissions and similar agencies. However, several federal agencies have also asserted regulatory authority over certain aspects of the process. For example, in 2014, the EPA asserted regulatory authority under the Safe Drinking Water Act’s Underground Injection Control program over hydraulic fracturing activities involving the use of diesel and issued guidance covering such activities. Additionally, the Bureau of Land Management (BLM) published a final rule in 2015 that establishes new or more stringent standards for performing hydraulic fracturing on federal and Indian land. This rule has been the subject of re-review and litigation and, most recently, in July 2017, the BLM published a proposed rule to rescind the 2015 final rule. The timing of a final rulemaking that would rescind the 2015 rule is uncertain and as a result of these developments and likely legal challenges, future implementation of the BLM rule is uncertain at this time. Also, from time to time, legislation has been introduced, but not enacted, in the United States Congress to provide for federal regulation of hydraulic fracturing and to require disclosure of the chemicals used in the fracturing process. In addition, a number of federal entities have reviewed various environmental issues associated with hydraulic fracturing with, for example, the EPA releasing a final report on the potential impacts of hydraulic fracturing on drinking water resources in December 2016, with the report concluding that “water cycle” activities associated with hydraulic fracturing may impact drinking water resources under some circumstances. Certain states where our infrastructure is used by our customers, have adopted and other states are considering adopting, regulations that could impose new or more stringent permitting, disclosure, or other regulatory requirements on hydraulic-fracturing operations, including subsurface water disposal. States also could elect to prohibit high volume hydraulic fracturing altogether, following the approach taken by the State of New York. In addition to state laws, local land use restrictions, such as city ordinances, may restrict drilling in general and/or hydraulic fracturing in particular. In the event that new federal restrictions on the hydraulic fracturing process are adopted in areas where our customers operate, those customers may incur significant additional costs or permitting requirements to comply with such federal requirements, and could experience added delays or curtailment in the pursuit of exploration, development, or production activities, which could reduce demand for our services and have a material adverse effect on our business, financial condition and results of operations.
PIPELINE OPERATIONS INVOLVE NUMEROUS RISKS THAT MAY ADVERSELY AFFECT OUR BUSINESS AND FINANCIAL CONDITIONS.
Operation of complex pipeline systems, gathering and storage operations involves many risks, hazards and uncertainties. These events include adverse weather conditions, accidents, the breakdown or failure of equipment or processes, the performance of the facilities below expected levels of capacity and efficiency and catastrophic events such as explosions, fires, earthquakes, hurricanes, floods, landslides or other similar events beyond our control. These types of catastrophic events could result in loss of human life, significant damage to property, environmental pollution and impairment of our operations, any of which could also result in substantial losses for which insurance may not be sufficient or available and for which we may bear a part or all of the cost. In addition, we could be subject to significant fines and penalties from regulators in connection with such events. For pipeline and storage assets located near populated areas, including residential communities, commercial business centers, industrial sites and other public gathering locations, the level of damage resulting from these catastrophic events could be greater.
OUR ASSETS VARY IN AGE AND WERE CONSTRUCTED OVER MANY DECADES WHICH MAY CAUSE OUR INSPECTION, MAINTENANCE AND REPAIR COSTS TO INCREASE IN THE FUTURE. IN ADDITION, THERE COULD BE SERVICE INTERRUPTIONS DUE TO UNKNOWN EVENTS OR CONDITIONS, OR INCREASED DOWNTIME ASSOCIATED WITH OUR PIPELINES THAT COULD HAVE A MATERIAL AND ADVERSE EFFECT ON OUR BUSINESS AND RESULTS OF OPERATIONS.
24
Our pipelines vary in age and were constructed over many decades. Pipelines are generally long-lived assets, and pipeline construction and coating techniques have changed over time. Depending on the era of construction, some assets will require more frequent inspections, which could result in increased maintenance or repair expenditures in the future. Any significant increase in these expenditures could adversely affect our results of operations, financial position or cash flows, as well as our ability to make distributions to our unitholders. Additionally, there could be service interruptions due to unknown events or conditions, or increased downtime associated with our pipelines that could have a material and adverse effect on our business and financial results.
MEASUREMENT ADJUSTMENTS ON OUR PIPELINE SYSTEM CAN BE MATERIALLY IMPACTED BY CHANGES IN ESTIMATION, COMMODITY PRICES AND OTHER FACTORS.
Oil measurement adjustments occur as part of the normal operations associated with our liquid petroleum pipelines. The three types of oil measurement adjustments that routinely occur on our systems include:
• | physical, which results from evaporation, shrinkage, differences in measurement (including sediment and water measurement) between receipt and delivery locations and other operational conditions; |
• | degradation resulting from mixing at the interface within our pipeline systems or terminals and storage facilities between higher quality light crude oil and lower quality heavy crude oil in pipelines; and |
• | revaluation, which is a function of crude oil prices, the level of our carriers’ inventory and the inventory positions of customers. |
Quantifying oil measurement adjustments is inherently difficult because physical measurements of volumes are not practical as products continuously move through our pipelines and virtually all of our pipeline systems are located underground. In our case, measuring and quantifying oil measurement losses is especially difficult because of the length of our pipeline systems and the number of different grades of crude oil and types of crude oil products we transport. Accordingly, we utilize engineering-based models and operational assumptions to estimate product volumes in our system and associated oil measurement losses.
WE DO NOT OWN A MAJORITY OF THE LAND ON WHICH OUR PIPELINES ARE LOCATED, WHICH COULD RESULT IN INCREASED COSTS AND DISRUPTIONS TO OUR OPERATIONS.
We do not own a majority of the land on which our pipelines are located; as a result, we are subject to the possibility of more onerous terms and increased costs to retain necessary land use or we could be required to re-route portions of our pipelines if we do not have valid leases or rights-of-way or if such rights-of-way lapse or terminate. We obtain the rights to construct and operate our pipelines on land owned by third parties and governmental agencies (including but not limited to Native American lands), and some of our agreements may grant us those rights for only a specific period of time. We are unable to predict the outcome of discussions with third parties, the governmental agencies, the appropriate Native American tribes, the tribes’ governing bodies, or the United States Bureau of Indian Affairs with respect to future arrangements or changes in applicable laws and the resulting costs, fees, bonds and taxes related to these leases, easements and rights-of-way, or grants of land rights. In the context of certain types of allotted lands owned by Native American tribes or formerly owned by individual Indian landowners, a recent decision issued in May 2017 by the federal Tenth Circuit Court of Appeals held that tribal ownership of even a very small fractional interest in allotted land bars condemnation of any interest in the allotment. Consequently, in such scenarios, we would be unable to condemn such allotted lands in order to expand operations or to obtain pipeline rights-of-way where the existing rights-of-way may soon lapse or terminate. We cannot guarantee that we will always be able to renew existing rights-of-way or obtain new rights-of-way on favorable terms or without experiencing significant delayed and costs. Any loss of rights with respect to our real property, through our inability to renew right-of-way contracts or otherwise, could have a material adverse effect on our business, results of operations, and financial position.
In addition, our industry is subject to activism and activities by non-governmental organizations seeking to restrict the exploration, development and production of crude oil by our customers generally and by oil sands producers in particular. These activists and organizations as well as others concerned with environmental impacts of pipeline routes have used political pressure to influence the timing of and whether such permits are granted which could impact future pipeline development. Our loss of these rights, through our inability to obtain or renew right-of-way contracts or otherwise, could interfere with or block expansion or development projects and could have a material adverse effect on our business, financial condition, results of operations and our ability to make cash distributions to our unitholders.
25
TERRORIST ATTACKS AND THREATS, ESCALATION OF MILITARY ACTIVITY IN RESPONSE TO THESE ATTACKS OR ACTS OF WAR, AND OTHER CIVIL UNREST OR ACTIVISM COULD HAVE A MATERIAL ADVERSE EFFECT ON OUR BUSINESS, FINANCIAL CONDITION AND RESULTS OF OPERATIONS.
Terrorist attacks and threats, escalation of military activity or acts of war, or other civil unrest or activism may have significant effects on general economic conditions, fluctuations in consumer confidence and spending and market liquidity, each of which could materially and adversely affect our business. Future terrorist attacks, rumors or threats of war, actual conflicts involving the United States or its allies, or military or trade disruptions may significantly affect our operations and those of our customers. Strategic targets, such as energy-related assets, may be at greater risk of future attacks than other targets in the United States. In addition, increased environmental activism against pipeline construction and operation could potentially result in work delays, reduced volumes on our pipeline systems, denial or delay of permits and rights-of-way and additional legislative or regulatory burdens. Finally, the disruption or a significant increase in energy prices could result in government-imposed price controls. It is possible that any of these occurrences, or a combination of them, could have a material adverse effect on our business, financial condition and results of operations.
CYBER-ATTACKS OR SECURITY BREACHES COULD HAVE A MATERIAL ADVERSE EFFECT ON OUR BUSINESS, FINANCIAL CONDITION AND RESULTS OF OPERATIONS.
Our business is dependent upon information systems and other digital technologies for controlling our plants and pipelines, processing transactions and summarizing and reporting results of operations. The secure processing, maintenance and transmission of information is critical to our operations. A security breach of our network or systems could result in improper operation of our assets, potentially including delays in the delivery or availability of our customers’ products, contamination or degradation of the products we transport, store or distribute, or releases of hydrocarbon products for which we could be held liable. Furthermore, we collect and store sensitive data in the ordinary course of our business, including personal identification information of our employees as well as our proprietary business information and that of our customers, suppliers, investors and other stakeholders. We conduct cyber security audits from time to time and continuously monitor our systems in an effort to mitigate the risk of cyber-attacks or security breaches. Enbridge has a Cybersecurity controls framework in place which has been derived from the NIST Cybersecurity Framework and ISO 27001 standards. We monitor our control effectiveness in an increasing threat landscape and continuously take action to improve our security posture. We have implemented a 7X24 security operations center to monitor, detect and investigate any anomalous activity in our network together with an incident response process that we test on a monthly basis. We conduct independent cyber security audits and penetration tests on a regular basis to test that our preventative and detective controls are working as designed. Despite our security measures, our information systems may become the target of cyber-attacks or security breaches (including employee error, malfeasance or other breaches), which could compromise our network or systems and result in the release or loss of the information stored therein, misappropriation of assets, disruption to our operations or damage to our facilities. Enbridge's current insurance coverage programs do not contain specific coverage for cyber-attacks or security breaches. As a result of a cyber-attack or security breach, we could also be liable under laws that protect the privacy of personal information, subject to regulatory penalties, experience damage to our reputation or a loss of consumer confidence in our products and services, or incur additional costs for remediation and modification or enhancement of our information systems to prevent future occurrences, all of which could have a material and adverse effect on our business, financial condition or results of operations.
WE ARE EXPOSED TO CREDIT RISKS OF OUR CUSTOMERS, AND ANY MATERIAL NONPAYMENT OR NONPERFORMANCE BY OUR KEY CUSTOMERS COULD ADVERSELY AFFECT OUR CASH FLOW AND RESULTS OF OPERATIONS.
Some of our customers may experience financial problems that could have a significant effect on their creditworthiness. Severe financial problems encountered by our customers could limit our ability to collect amounts owed to us, or to enforce performance of obligations under contractual arrangements. In addition, many of our customers finance their activities through cash flow from operations, the incurrence of debt or the issuance of equity. The combination of reduction of cash flow resulting from declines in commodity prices, a reduction in borrowing bases under reserve-based credit facility and the lack of availability of debt or equity financing may result in a significant reduction of our customers’ liquidity and limit their ability to make payment or perform on their obligations to us. Furthermore, some of our customers may be highly leveraged and subject to their own operating and regulatory risks, which increases the risk that they may default on their obligations to us. Financial problems experienced by our customers could result in the impairment of our assets, reduction of our operating cash flows and may also reduce or curtail their future use of our products and services, which could reduce our revenues.
26
OUR PIPELINE SAFETY AND PIPELINE INTEGRITY PROGRAMS MAY IMPOSE SIGNIFICANT COSTS AND LIABILITIES ON US, WHILE INCREASED REGULATORY REQUIREMENTS RELATED TO THE INTEGRITY OF OUR PIPELINE SYSTEMS MAY REQUIRE US TO SPEND ADDITIONAL MONEY TO COMPLY WITH SUCH REQUIREMENTS.
Certain of our pipelines are subject to regulation by the federal PHMSA under the Hazardous Liquid Pipeline Safety Act (HLPSA) with respect to crude oil, as has been amended by the Pipeline Safety Improvement Act of 2002, the Pipeline Inspection, Protection, Enforcement and Safety Act of 2006, the Pipeline Safety, Regulatory Certainty, and Job Creation Act of 2011 (2011 Pipeline Safety Act) and the Protecting Our Infrastructure of Pipelines and Enhancing Safety Act of 2016 (2016 Pipeline Safety Act). The HLPSA governs the design, installation, testing, construction, operation, replacement and management of crude oil pipeline facilities.
These laws have resulted in the adoption of rules by PHMSA, that, among other things, require transportation pipeline operators to implement integrity management programs, including more frequent inspections, correction of identified anomalies and other measures to ensure pipeline safety in High Consequence Areas (HCAs), such as high population areas, areas unusually sensitive to environmental damage and commercially navigable waterways. These rules require operators of covered pipelines to:
• | perform ongoing assessments of pipeline integrity; |
• | identify and characterize applicable threats to pipeline segments that could impact a high consequence area; |
• | improve data collection, integration and analysis; |
• | repair and remediate the pipeline as necessary; and |
• | implement preventive and mitigating actions. |
In addition, states have adopted regulations similar to existing PHMSA regulations for certain intrastate hazardous liquid pipelines, which regulations may impose more stringent requirements than found under federal law. New laws or regulations adopted by PHMSA may impose more stringent requirements applicable to integrity management programs and other pipeline safety aspects of our operations, which could cause us to incur increased capital and operating costs and operational delays.
The HLPSA was amended by the 2011 Pipeline Safety Act which became law in January 2012. The 2011 Pipeline Safety Act increased the penalties for safety violations, established additional safety requirements for newly constructed pipelines and required studies of safety issues that could result in the adoption of new regulatory requirements by PHMSA for existing pipelines. More recently, in June 2016, the 2016 Pipeline Safety Act was passed, extending PHMSA’s statutory mandate through 2019 and, among other things, requiring PHMSA to complete certain of its outstanding mandates under the 2011 Pipeline Safety Act. The 2016 Act also empowers PHMSA to address imminent hazards by imposing emergency restrictions, prohibitions and safety measures on owners and operators of hazardous liquid pipeline facilities without prior notice or an opportunity for a hearing. PHMSA issued interim regulations in October 2016 to implement the agency’s expanded authority to address unsafe pipeline conditions or practices that pose an imminent hazard to life, property, or the environment.
The adoption of new or amended regulations by PHMSA that result in more stringent or costly pipeline integrity management or safety standards could have a significant adverse effect on our results of operations. For example, in January 2017, PHMSA finalized regulations for hazardous liquid pipelines that significantly extend and expand the reach of certain PHMSA integrity management requirements, including periodic assessments, leak detection and repairs, regardless of the pipeline’s proximity to a HCA. The final rule also requires all pipelines in or affecting an HCA to be capable of accommodating in line inspection tools within the next 20 years. In addition, the final rule extends annual and accident reporting requirements to gravity lines and all gathering lines and also imposes inspection requirements on pipelines in areas affected by extreme weather events and natural disasters, such as hurricanes, landslides, floods, earthquakes, or other similar events that are likely to damage infrastructure. This final rule has not, however, been published in the Federal Register. The Office of Management & Budget’s Office of Information and Regulatory Affairs’ Unified Regulatory Agenda projects publication of the final rule in the first half of 2018, but the timing for implementation of this rule remains uncertain. The safety enhancement requirements and other provisions of the 2016 Pipeline Safety Act as well as any implementation of PHMSA rules thereunder could require us to install new or modified safety controls, pursue additional capital projects, or conduct maintenance programs on an accelerated basis, any or all of which tasks could result in our incurring increased operating costs or operational delays that could have a material adverse effect on our results of operations or financial position.
27
Additionally, effective April 2017, PHMSA adopted a final rule increasing the maximum administrative civil penalties for violation of the pipeline safety laws and regulations to $209,002 per violation per day and up to $2,090,022 for a related series of violations. Federal and state legislative and regulatory initiatives relating to pipeline safety that require the use of new or more stringent safety controls or result in more stringent enforcement of applicable legal requirements could subject us to increased capital costs, operational delays and costs of operation.
RISKS ARISING FROM OUR PARTNERSHIP STRUCTURE AND RELATIONSHIPS WITH OUR GENERAL PARTNER AND ENBRIDGE MANAGEMENT
THE INTERESTS OF ENBRIDGE MAY DIFFER FROM OUR INTERESTS AND THE INTERESTS OF OUR UNITHOLDERS, AND THE BOARD OF DIRECTORS OF ENBRIDGE MANAGEMENT MAY CONSIDER THE INTERESTS OF ALL PARTIES TO A CONFLICT, NOT JUST THE INTERESTS OF OUR UNITHOLDERS, IN MAKING IMPORTANT BUSINESS DECISIONS.
Enbridge indirectly owns all of the shares of our General Partner and all of the voting shares of Enbridge Management, and elects all of the directors of both companies. Furthermore, some of the directors and officers of our General Partner and Enbridge Management are also directors and officers of Enbridge. Consequently, conflicts of interest could arise between our unitholders and Enbridge.
Our partnership agreement limits the fiduciary duties of our General Partner to our unitholders. These restrictions allow our General Partner to resolve conflicts of interest by considering the interests of all of the parties to the conflict, including Enbridge Management’s interests, our interests and those of our General Partner. In addition, these limitations reduce the rights of our unitholders under our partnership agreement to sue our General Partner or Enbridge Management, its delegate, should its directors or officers act in a way that, were it not for these limitations of liability, would constitute breaches of their fiduciary duties.
We do not have any employees. In managing our business and affairs, we rely on employees of Enbridge, and its affiliates, who act on behalf of and as agents for us. A decrease in the availability of employees from Enbridge could adversely affect us.
OUR PARTNERSHIP AGREEMENT AND THE DELEGATION OF CONTROL AGREEMENT LIMIT THE FIDUCIARY DUTIES THAT ENBRIDGE MANAGEMENT AND OUR GENERAL PARTNER OWE TO OUR UNITHOLDERS AND RESTRICT THE REMEDIES AVAILABLE TO OUR UNITHOLDERS FOR ACTIONS TAKEN BY ENBRIDGE MANAGEMENT AND OUR GENERAL PARTNER THAT MIGHT OTHERWISE CONSTITUTE A BREACH OF A FIDUCIARY DUTY.
Our partnership agreement contains provisions that modify the fiduciary duties that our General Partner would otherwise owe to our unitholders under state fiduciary duty law. Through the delegation of control agreement, these modified fiduciary duties also apply to Enbridge Management as the delegate of our General Partner. For example, our partnership agreement:
• | permits our General Partner to make a number of decisions, including the determination of which factors it will consider in resolving conflicts of interest, in its “sole discretion.” This entitles our General Partner to consider only the interests and factors that it desires, and it has no duty or obligation to give consideration to any interest of, or factors affecting, us, our affiliates or any unitholder; |
• | provides that any standard of care and duty imposed on our General Partner will be modified, waived or limited as required to permit our General Partner to act under our partnership agreement and to make any decision pursuant to the authority prescribed in our partnership agreement, so long as such action is reasonably believed by the General Partner to be in our best interests; and |
• | provides that our General Partner and its directors and officers will not be liable for monetary damages to us or our unitholders for any acts or omissions if they acted in good faith. |
These and similar provisions in our partnership agreement may restrict the remedies available to our unitholders for actions taken by Enbridge Management or our General Partner that might otherwise constitute a breach of a fiduciary duty.
28
POTENTIAL CONFLICTS OF INTEREST MAY ARISE AMONG ENBRIDGE AND ITS SHAREHOLDERS, ON THE ONE HAND, AND US AND OUR UNITHOLDERS AND ENBRIDGE MANAGEMENT AND ITS SHAREHOLDERS, ON THE OTHER HAND. BECAUSE THE FIDUCIARY DUTIES OF THE DIRECTORS OF OUR GENERAL PARTNER AND ENBRIDGE MANAGEMENT HAVE BEEN MODIFIED, THE DIRECTORS MAY BE PERMITTED TO MAKE DECISIONS THAT BENEFIT ENBRIDGE AND ITS SHAREHOLDERS OR ENBRIDGE MANAGEMENT AND ITS SHAREHOLDERS MORE THAN US AND OUR UNITHOLDERS.
Conflicts of interest may arise from time to time among Enbridge and its shareholders, on the one hand, and us and our unitholders and Enbridge Management and its shareholders, on the other hand. Conflicts of interest may also arise from time to time between us and our unitholders, on the one hand, and Enbridge Management and its shareholders, on the other hand. In managing and controlling us as the delegate of our General Partner, Enbridge Management may consider the interests of all parties to a conflict and may resolve those conflicts by making decisions that benefit Enbridge and its shareholders or Enbridge Management and its shareholders more than us and our unitholders. The following decisions, among others, could involve conflicts of interest:
• | whether we or Enbridge will pursue certain acquisitions or other business opportunities; |
• | whether we will issue additional units or other equity securities or whether we will purchase outstanding units; |
• | whether we or Enbridge Management will issue additional shares or other equity securities; |
• | the amount of payments to Enbridge and its affiliates for any services rendered for our benefit; |
• | the amount of costs that are reimbursable to Enbridge Management or Enbridge and its affiliates by us; |
• | the enforcement of obligations owed to us by Enbridge Management, our General Partner or Enbridge, including obligations regarding competition between Enbridge and us; and |
• | the retention of separate counsel, accountants or others to perform services for us and Enbridge Management. |
In these and similar situations, any decision by Enbridge Management may benefit one group more than another, and in making such decisions, Enbridge Management may consider the interests of all groups, as well as other factors, in deciding whether to take a particular course of action.
In other situations, Enbridge may take certain actions, including engaging in businesses that compete with us or are adverse to us and our unitholders. For example, although Enbridge and its subsidiaries are generally restricted from engaging in any business that is in direct material competition with our businesses, that restriction is subject to the following significant exceptions:
• | Enbridge and its subsidiaries are not restricted from continuing to engage in businesses, including the normal development of such businesses, in which they were engaged at the time of our initial public offering in December 1991; |
• | such restriction is limited geographically only to those routes and products for which we provided transportation at the time of our initial public offering; |
• | Enbridge and its subsidiaries are not prohibited from acquiring any business that materially and directly competes with us as part of a larger acquisition, so long as the majority of the value of the business or assets acquired, in Enbridge’s reasonable judgment, is not attributable to the competitive business; and |
• | Enbridge and its subsidiaries are not prohibited from acquiring any business that materially and directly competes with us if that business is first offered for acquisition to us and the board of directors of Enbridge Management and our unitholders determine not to pursue the acquisition. |
As a result of these exceptions, Enbridge and its subsidiaries would be permitted to transport crude oil and liquid petroleum over routes that are not the same as our Lakehead System, even if such transportation is in direct material competition with our business.
AFFILIATES OF OUR GENERAL PARTNER ARE NOT LIMITED IN THEIR ABILITY TO COMPETE WITH US, WHICH COULD LIMIT COMMERCIAL ACTIVITIES OR OUR ABILITY TO ACQUIRE ADDITIONAL ASSETS OR BUSINESSES.
Affiliates of our General Partner are not prohibited from owning assets or engaging in businesses that compete directly or indirectly with us. In addition, Enbridge and its affiliates may acquire, construct or dispose of additional transmission, storage and gathering or other assets in the future, without any obligation to offer us the opportunity to purchase or construct any of those assets. Each of these entities is a large, established participant in the midstream
29
energy business and each has significantly greater resources and experience than we have, which may make it more difficult for us to compete with these entities with respect to commercial activities as well as for acquisition candidates. As a result, competition from these entities could adversely affect our results of operations and available cash.
WE CAN ISSUE ADDITIONAL COMMON OR OTHER CLASSES OF UNITS, INCLUDING ADDITIONAL i-UNITS TO ENBRIDGE MANAGEMENT WHEN IT ISSUES ADDITIONAL SHARES, WHICH WOULD DILUTE THE OWNERSHIP INTEREST OF OUR UNITHOLDERS.
The issuance of additional common or other classes of units by us, including the issuance of additional i-units to Enbridge Management when it issues additional shares may have the following effects:
• | The amount available for distributions on each unit may decrease; |
• | The relative voting power of each previously outstanding unit may decrease; and |
• | The market price of the Class A common units may decline. |
Additionally, the public sale by our General Partner of a significant portion of the Class A or Class B common units or Class E units that it or its subsidiary currently owns could reduce the market price of the Class A common units. Our partnership agreement allows the General Partner to cause us to register for public sale any units held by the General Partner or its affiliates. A public or private sale of the Class A or Class B common units or Class E units currently held by our General Partner or its subsidiary could absorb some of the trading market demand for the outstanding Class A common units.
HOLDERS OF OUR LIMITED PARTNER INTEREST HAVE LIMITED VOTING RIGHTS.
Our unitholders have limited voting rights on matters affecting our business, which may have a negative effect on the price at which our common units trade. In particular, the unitholders did not elect our General Partner or the directors of our General Partner or Enbridge Management and have no rights to elect our General Partner or the directors of our General Partner or Enbridge Management on an annual or other continuing basis. Furthermore, if unitholders are not satisfied with the performance of our General Partner, they may find it difficult to remove our General Partner. Under the provisions of our partnership agreement, our General Partner may be removed upon the vote of at least 66.67% of the outstanding common units (excluding the units held by the General Partner and its affiliates) and a majority of the outstanding i-units voting together as a separate class (excluding the number of i-units corresponding to the number of shares of Enbridge Management held by our General Partner and its affiliates). Such removal must, however, provide for the election and succession of a new general partner, who may be required to purchase the departing general partner interest in us in order to become the successor general partner. Such restrictions may limit the flexibility of the limited partners in removing our general partner, and removal may also result in the general partner interest in us held by the departing general partner being converted into Class A common units.
THE NYSE DOES NOT REQUIRE A PUBLICLY-TRADED PARTNERSHIP LIKE US TO COMPLY WITH CERTAIN OF ITS CORPORATE GOVERNANCE REQUIREMENTS.
Our Class A common units are listed on the NYSE. The NYSE does not require us to have, and we do not intend to have, a majority of independent directors on the boards of our General Partner or Enbridge Management, or to establish a compensation committee or nominating and corporate governance committee. In addition, any future issuance of additional Class A common units or other securities, including to affiliates, will not be subject to the NYSE’s shareholder approval rules that apply to corporations. Accordingly, holders of our Class A common units will not have the same protections afforded to shareholders of most corporations that are subject to all of the NYSE corporate governance requirements.
WE ARE A HOLDING COMPANY AND DEPEND ENTIRELY ON OUR OPERATING SUBSIDIARIES' DISTRIBUTIONS TO SERVICE OUR DEBT OBLIGATIONS.
We are a holding company with no material operations. If we cannot or do not receive cash distributions from our operating subsidiaries, we will not be able to meet our debt service obligations. Our operating subsidiaries may from time to time incur additional indebtedness under agreements that contain restrictions, which could further limit each operating subsidiaries’ ability to make distributions to us.
The debt securities we issue and any guarantees issued by any of our subsidiaries that are guarantors will be structurally subordinated to the claims of the creditors of any of our operating subsidiaries who are not guarantors of
30
the debt securities. Holders of the debt securities will not be creditors of our operating subsidiaries who have not guaranteed the debt securities. The claims to the assets of these non-guarantor operating subsidiaries derive from our own ownership interest in those operating subsidiaries. Claims of our non-guarantor operating subsidiaries’ creditors will generally have priority as to the assets of such operating subsidiaries over our own ownership interest claims and will therefore have priority over the holders of our debt, including the debt securities. Our non-guarantor operating subsidiaries’ creditors may include:
• | general creditors; |
• | trade creditors; |
• | secured creditors; |
• | taxing authorities; and |
• | creditors holding guarantees. |
ENBRIDGE MANAGEMENT'S DISCRETION IN ESTABLISHING OUR CASH RESERVES GIVES IT THE ABILITY TO REDUCE THE AMOUNT OF CASH AVAILABLE FOR DISTRIBUTION TO OUR UNITHOLDERS.
Enbridge Management may establish cash reserves for us that in its reasonable discretion are necessary to fund our future operating and capital expenditures, provide for the proper conduct of business, and comply with applicable law or agreements to which we are a party or to provide funds for future distributions to partners. These cash reserves affect the amount of cash available for distribution to holders of our common units.
WE DO NOT INSURE AGAINST ALL POTENTIAL LOSSES AND COULD BE SERIOUSLY HARMED BY UNEXPECTED LIABILITIES OR BY THE INABILITY OF OUR INSURERS TO SATISFY OUR CLAIMS.
Our assets and operations are covered under insurance programs maintained by Enbridge for its subsidiaries and affiliates. Enbridge’s comprehensive insurance programs are maintained on a consolidated basis to include the operations of its subsidiaries, including us. We are not fully insured against all risks inherent to our business, including environmental accidents that might occur. If a significant accident or event occurs that is not fully insured, it could adversely affect our operations and financial condition. In addition, we may not be able to maintain or obtain insurance of the type and amount we desire at reasonable rates. Changes in the insurance markets occasionally make it more difficult for us to obtain certain types of coverage at reasonable rates and we may elect to self-insure a portion of our asset portfolio. In addition, we do not maintain offshore business interruption insurance. There can be no assurance that we will be able to obtain the levels or types of insurance we would otherwise have obtained prior to these market changes or that the insurance coverage we do obtain will not contain large deductibles or fail to cover certain hazards or cover all potential losses. The occurrence of any operating risks not fully covered by insurance could have a material adverse effect on our cash flows, financial condition and results of operations. In addition, in the event there is a total or partial loss of our assets or storage facilities, any insurance proceeds that we may receive in respect thereof may not be sufficient in any particular situation to effect a restoration of our assets or facilities to the condition that existed prior to such loss or sufficient to satisfy our obligations under the notes. In addition, in the unlikely event that multiple insurable incidents that, in the aggregate, exceed coverage limits and occur within the same insurance period, the total insurance coverage will be allocated among the Enbridge entities covered thereby on an equitable basis based on an insurance allocation agreement we have entered into with Enbridge and other Enbridge subsidiaries.
TOTAL INSURANCE COVERAGE FOR MULTIPLE INSURABLE INCIDENTS EXCEEDING COVERAGE LIMITS WOULD BE ALLOCATED BY OUR GENERAL PARTNER ON AN EQUITABLE BASIS.
We are included in the comprehensive insurance program that is maintained by Enbridge for its subsidiaries and affiliates. If multiple insurable incidents occur which exceed coverage limits within the same insurance period, the total insurance coverage will be allocated among the Enbridge entities on an equitable basis based on an insurance allocation agreement the Partnership has entered into with Enbridge, and other Enbridge subsidiaries. As a result, we could be exposed to losses for which insurance coverage is not available.
RISKS RELATED TO OUR DEBT AND OUR ABILITY TO MAKE DISTRIBUTIONS
AGREEMENTS RELATING TO OUR DEBT RESTRICT OUR ABILITY TO MAKE DISTRIBUTIONS, WHICH COULD ADVERSELY AFFECT THE VALUE OF OUR CLASS A COMMON UNITS, AND OUR ABILITY TO INCUR ADDITIONAL DEBT AND OTHERWISE MAINTAIN FINANCIAL AND OPERATING FLEXIBILITY.
31
We are prohibited from making distributions to our unitholders during (i) the existence of certain defaults under our Credit Facilities or (ii) during a period in which we have elected to defer interest payments on the Junior Notes, subject to limited exceptions as set forth in the related indenture. Further, the agreements governing our Credit Facilities may prevent us from engaging in transactions or capitalizing on business opportunities that we believe could be beneficial to us by requiring us to comply with various covenants, including the maintenance of certain financial ratios and restrictions on:
• | incurring additional debt; |
• | entering into mergers or consolidations or sales of assets; and |
• | granting liens. |
Although the indentures governing our senior notes do not limit our ability to incur additional debt, they impose restrictions on our ability to enter into mergers or consolidations and sales of all or substantially all of our assets, to incur liens to secure debt and to enter into sale and leaseback transactions. A breach of any restriction under our Credit Facilities or our indentures could permit the holders of the related debt to declare all amounts outstanding under those agreements immediately due and payable and, in the case of our Credit Facilities, terminate all commitments to extend further credit. Any subsequent refinancing of our current debt or any new indebtedness incurred by us or our subsidiaries could have similar or greater restrictions.
UNITHOLDERS MAY HAVE LIABILITY TO REPAY DISTRIBUTIONS THAT WERE WRONGFULLY DISTRIBUTED TO THEM.
Under certain circumstances, unitholders may have to repay amounts wrongfully returned or distributed to them. Under Section 17-607 of the Delaware Revised Uniform Limited Partnership Act, we may not make a distribution to our partners if the distribution would cause our liabilities to exceed the fair value of our assets. Delaware law provides that for a period of three years from the date of an impermissible distribution, limited partners who received the distribution and who knew at the time of the distribution that it violated Delaware law will be liable to the limited partnership for the distribution amount. Substituted limited partners are liable both for the obligations of the assignor to make contributions to the partnership that were known to the substituted limited partner at the time it became a limited partner and for those obligations that were unknown if the liabilities could have been determined from the partnership agreement. Neither liabilities to partners on account of their partnership interest nor liabilities that are non-recourse to the partnership are counted for purposes of determining whether a distribution is permitted.
TAX RISKS TO COMMON UNITHOLDERS
OUR TAX TREATMENT DEPENDS ON OUR STATUS AS A PARTNERSHIP FOR FEDERAL INCOME TAX PURPOSES, AND NOT BEING SUBJECT TO A MATERIAL AMOUNT OF ENTITY-LEVEL TAXATION. IF THE INTERNAL REVENUE SERVICES (IRS), WERE TO TREAT US AS A CORPORATION FOR FEDERAL INCOME TAX PURPOSES, WHICH WOULD SUBJECT US TO ENTITY-LEVEL TAXATION, OR IF WE WERE OTHERWISE SUBJECTED TO A MATERIAL AMOUNT OF ADDITIONAL ENTITY-LEVEL TAXATION FOR STATE TAX PURPOSES, THEN OUR DISTRIBUTABLE CASH FLOW TO OUR UNITHOLDERS WOULD BE SUBSTANTIALLY REDUCED.
The anticipated after-tax economic benefit of an investment in our common units depends largely on our being treated as a partnership for federal income tax purposes.
Despite the fact that we are organized as a limited partnership under Delaware law, it is possible in certain circumstances for a publicly-traded partnership such as ours to be treated as a corporation for federal income tax purposes. A change in our business or a change in current law could cause us to be treated as a corporation for federal income tax purposes or otherwise subject us to taxation as an entity.
Section 7704 of the Internal Revenue Code of 1986 (the Internal Revenue Code) provides that publicly-traded partnerships will, as a general rule, be taxed as corporations. An exception exists, however, with respect to a publicly-traded partnership for which 90% or more of the gross income for every taxable year consists of “qualifying income.” If less than 90% of our gross income for any taxable year is qualifying income, we will be taxed as a corporation under Section 7704 of the Internal Revenue Code for federal income tax purposes for that taxable year and all subsequent tax years. Although we do not believe that we will be treated as a corporation for federal income tax purposes based on our current operations, the IRS could disagree with the positions we take. We have not requested, and do not plan
32
to request, a ruling from the IRS with respect to our treatment as a partnership for federal income tax purposes or any other tax matter affecting us.
If we were treated as a corporation for federal income tax purposes, we would pay federal income tax on our taxable income at the corporate tax rate, which is currently 21% and would likely pay state and local income tax at varying rates. Distributions would generally be taxed again as corporate dividends (to the extent of our current and accumulated earnings and profits), and no income, gains, losses, deductions, or credits would flow through to our unitholders. Because a tax would be imposed upon us as a corporation, our distributable cash flow would be substantially reduced.
In addition, changes in current state law may subject us to additional entity-level taxation by individual states. Because of widespread state budget deficits and other reasons, several states are evaluating ways to subject partnerships to entity-level taxation through the imposition of state income, franchise and other forms of taxation.
Imposition of any such taxes may substantially reduce the cash we have available for distribution. Therefore, if we were treated as a corporation for federal income tax purposes or otherwise subjected to a material amount of entity-level taxation for state tax purposes, there would be a material reduction in the anticipated cash flow and after-tax return to our unitholders, likely causing a substantial reduction in the value of our common units.
Our partnership agreement provides that, if a law is enacted that subjects us to entity-level taxation, the minimum quarterly distribution amount and the target distribution levels will be adjusted to reflect the impact of that law on us.
THE TAX TREATMENT OF PUBLICLY-TRADED PARTNERSHIPS OR AN INVESTMENT IN OUR UNITS COULD BE SUBJECT TO POTENTIAL LEGISLATIVE, JUDICIAL, OR ADMINISTRATIVE CHANGES AND DIFFERING INTERPRETATIONS, POSSIBLY ON A RETROACTIVE BASIS.
The present federal income tax treatment of publicly-traded partnerships, including us, or an investment in our common units may be modified by administrative, legislative or judicial changes or differing interpretations at any time. From time to time, members of Congress have proposed and considered substantive changes to the existing United States federal income tax laws that affect publicly-traded partnerships. Although there is no current legislative proposal, a prior legislative proposal would have eliminated the qualifying income exception to the treatment of all publicly traded partnerships as corporations upon which we rely for our treatment as a partnership for United States federal income tax purposes.
Any modification to the federal income tax laws and interpretations thereof may or may not be retroactively applied and could make it more difficult or impossible to meet the exception for us to be treated as a partnership for federal income tax purposes. We are unable to predict whether similar legislative or regulatory changes or other proposals will ultimately be enacted.
On January 24, 2017, the United States Treasury Department issued final regulations concerning which activities give rise to qualifying income within the meaning of Section 7704 of the Internal Revenue Code (the “Final Regulations”). The Final Regulations are effective as of January 19, 2017, and apply to taxable years beginning on or after January 19, 2017. We do not believe the Final Regulations affect our ability to qualify as a publicly traded partnership for United States federal income tax purposes. It is possible, however, that a change in law could affect us, and any such changes could negatively impact the value of an investment in our common units. You are urged to consult with your own tax advisor with respect to the status of regulatory or administrative developments and proposals and their potential effect on your investment in our common units.
OUR UNITHOLDERS' SHARE OF OUR INCOME WILL BE TAXABLE TO THEM FOR FEDERAL INCOME TAX PURPOSES EVEN IF THEY DO NOT RECEIVE ANY CASH DISTRIBUTIONS FROM US.
Because a unitholder will be treated as a partner to whom we will allocate taxable income that could be different in amount than the cash we distribute, a unitholders allocable share of our taxable income will be taxable to the unitholder. This allocation of taxable income may require the payment of federal income taxes and, in some cases, state and local income taxes, even if the unitholder receives no cash distributions from us. Our unitholders may not receive cash distributions from us equal to their share of our taxable income or even equal to the actual tax liability resulting from that income.
33
IF THE IRS CONTESTS THE FEDERAL INCOME TAX POSITIONS WE TAKE, THE MARKET FOR OUR COMMON UNITS MAY BE ADVERSELY IMPACTED AND THE COST OF ANY IRS CONTEST WILL REDUCE OUR DISTRIBUTABLE CASH FLOW TO OUR UNITHOLDERS.
We have not requested a ruling from the IRS with respect to our treatment as a partnership for federal income tax purposes or any other matter affecting us. The IRS may adopt positions that differ from the positions we have taken or may take, and the IRS’s positions may ultimately be sustained. It may be necessary to resort to administrative or court proceedings to sustain some or all of our positions and such positions may not ultimately be sustained. Any contest with the IRS, and the outcome of any IRS contest, may have a materially adverse impact on the market for our common units and the price at which they trade. In addition, our costs of any contest with the IRS will be borne indirectly by our unitholders and our General Partner because the costs will reduce our distributable cash flow.
TAX GAINS OR LOSSES ON THE DISPOSITION OF OUR COMMON UNITS COULD BE MORE OR LESS THAN EXPECTED.
If our unitholders sell common units, they will recognize a gain or loss for federal income tax purposes equal to the difference between the amount realized and their tax basis in those common units. Because distributions in excess of a unitholder’s allocable share of our net taxable income decrease the tax basis of the unitholder’s common units, the amount, if any, of such prior excess distributions with respect to the common units a unitholder sells will, in effect, become taxable income to the unitholder if the unitholder sells such common units at a price greater than the unitholder’s tax basis in those common units, even if the price received is less than the original cost. In addition, because the amount realized includes a unitholder’s share of our nonrecourse liabilities, a unitholder that sells common units may incur a tax liability in excess of the amount of cash received from the sale.
A substantial portion of the amount realized from a unitholder’s sale of our common units, whether or not representing gain, may be taxed as ordinary income to such unitholder due to potential recapture items, including depreciation recapture. Thus, a unitholder may recognize both ordinary income and capital loss from the sale of common units if the amount realized on a sale of such common units is less than such unitholder’s adjusted basis in the common units. Net capital loss may only offset capital gains and, in the case of individuals, up to $3,000 of ordinary income per year. In the taxable period in which a unitholder sells its common units, such unitholder may recognize ordinary income from our allocations of income and gain to such unitholder prior to the sale and from recapture items that generally cannot be offset by any capital loss recognized upon the sale of common units.
UNITHOLDERS MAY BE SUBJECT TO LIMITATION ON THEIR ABILITY TO DEDUCT INTEREST EXPENSE INCURRED BY US.
In general, we are entitled to a deduction for interest paid or accrued on indebtedness properly allocable to our trade or business during our taxable year. However, under the Tax Cuts and Jobs Act, for taxable years beginning after December 31, 2017, our deduction for “business interest” is limited to the sum of our business interest income and 30% of our “adjusted taxable income.” For the purposes of this limitation, our adjusted taxable income is computed without regard to any business interest expense or business interest income, and in the case of taxable years beginning before January 1, 2022, any deduction allowable for depreciation, amortization, or depletion.
TAX-EXEMPT ENTITIES FACE UNIQUE TAX ISSUES FROM OWNING OUR COMMON UNITS THAT MAY RESULT IN ADVERSE TAX CONSEQUENCES TO THEM.
Investment in common units by tax-exempt entities, such as employee benefit plans and individual retirement accounts (known as IRAs) raises issues unique to them. For example, virtually all of our income allocated to organizations that are exempt from federal income tax, including IRAs and other retirement plans, will be unrelated business taxable income (UBTI), and will be taxable to them. Further, with respect to taxable years beginning after December 31, 2017, a tax-exempt entity with more than one unrelated trade or business (including by attribution from investment in a partnership such as ours that is engaged in one or more unrelated trade or business) is required to compute the UBTI of such tax-exempt entity separately with respect to each such trade or business (including for purposes of determining any net operating loss deduction). As a result, for years beginning after December 31, 2017, it may not be possible for tax-exempt entities to utilize losses from an investment in our partnership to offset UBTI from another unrelated trade or business and vice versa. Tax-exempt entities should consult a tax advisor before investing in our common units.
34
NON-UNITED STATES UNITHOLDERS WILL BE SUBJECT TO UNITED STATES TAXES AND WITHHOLDING WITH RESPECT TO THEIR INCOME AND GAIN FROM OWNING OUR UNITS.
Non-United States unitholders are generally taxed and subject to income tax filing requirements by the United States on income effectively connected with a United States trade or business (“effectively connected income”). Income allocated to our unitholders and any gain from the sale of our units will generally be considered to be “effectively connected” with a United States trade or business. As a result, distributions to non-United States persons will be reduced by withholding taxes at the highest applicable effective tax rate, and a non-United States unitholder who sells or otherwise disposes of a unit will also be subject to United States federal income tax on the gain realized from the sale or disposition of that unit.
The Tax Cuts and Jobs Act imposes a withholding obligation of 10% of the amount realized upon a non-United States unitholder’s sale or exchange of an interest in a partnership that is engaged in a United States trade or business. However, due to challenges of administering a withholding obligation applicable to open market trading and other complications, the IRS has temporarily suspended the application of this withholding rule to open market transfers of interest in publicly traded partnerships pending promulgation of regulations or other guidance that resolves the challenges. It is not clear if or when such regulations or other guidance will be issued. If you are a non-United States person, you should consult a tax advisor before investing in our common units.
WE TREAT EACH PURCHASER OF COMMON UNITS AS HAVING THE SAME TAX BENEFITS WITHOUT REGARD TO THE ACTUAL COMMON UNITS PURCHASED. THE IRS MAY CHALLENGE THIS TREATMENT, WHICH COULD RESULT IN MORE TAX TO COMMON UNIT HOLDERS AND MAY ADVERSELY AFFECT THE VALUE OF THE COMMON UNITS.
Because we cannot match transferors and transferees of common units and because of other reasons, we have adopted depreciation and amortization positions that may not conform to all aspects of existing Treasury Regulations. A successful IRS challenge to those positions could adversely affect the amount of tax benefits available to our unitholders. A successful IRS challenge could also affect the timing of these tax benefits or the amount of gain from the sale of common units and could have a negative impact on the value of our common units or result in audit adjustments to our unitholders’ tax returns.
WE GENERALLY PRORATE OUR ITEMS OF INCOME, GAINS, LOSSES AND DEDUCTION BETWEEN TRANSFERORS AND TRANSFEREES OF OUR UNITS EACH MONTH BASED UPON THE OWNERSHIP OF OUR UNITS ON THE FIRST DAY OF EACH MONTH, INSTEAD OF ON THE BASIS OF THE DATE A PARTICULAR UNIT IS TRANSFERRED. THE IRS MAY CHALLENGE THIS TREATMENT, WHICH COULD CHANGE THE ALLOCATION OF ITEMS OF INCOME, GAINS, LOSSES AND DEDUCTION AMONG OUR UNITHOLDERS.
We generally prorate our items of income, gain, loss and deduction between transferors and transferees of our units each month (the “Allocation Date”) based upon the ownership of our units on the first day of each month, instead of on the basis of the date a particular unit is transferred. Similarly, we generally allocate certain deductions for depreciation of capital additions, gain or loss realized on a sale or other disposition of our assets and, in the discretion of the general partner, any other extraordinary item of income, gain, loss or deduction based upon ownership on the Allocation Date. Treasury Regulations allow a similar monthly simplifying convention, but such regulations do not specifically authorize the use of the proration method we have adopted. If the IRS were to challenge our method or new Treasury Regulations were issued, we may be required to change the allocation of items of income, gain, loss and deduction among our unitholders.
A UNITHOLDER WHOSE COMMON UNITS ARE THE SUBJECT OF A SECURITIES LOAN, (FOR EXAMPLE, A LOAN TO A "SHORT SELLER" TO COVER A SHORT SALE OF COMMON UNITS), MAY BE CONSIDERED AS HAVING DISPOSED OF THOSE COMMON UNITS. IF SO, THE UNITHOLDER WOULD NO LONGER BE TREATED FOR TAX PURPOSES AS A PARTNER WITH RESPECT TO THOSE COMMON UNITS DURING THE PERIOD OF THE LOAN AND MAY BE REQUIRED TO RECOGNIZE GAINS OR LOSSES FROM THE DISPOSITION.
Because there are no specific rules governing the United States federal income tax consequence of loaning a partnership interest, a unitholder whose common units are the subject of a securities loan may be considered as having disposed of the loaned common units. In that case, the unitholder may no longer be treated for federal income tax purposes as a partner with respect to those common units during the period of the loan and the unitholder may be required to recognize gain or loss from such disposition. Moreover, during the period of the loan, any of our income, gain, loss or deduction with respect to those common units may not be reportable by the unitholder and any cash
35
distributions received by the unitholder as to those common units could be fully taxable as ordinary income. Unitholders desiring to assure their status as partners and avoid the risk of gain recognition from a securities loan are urged to consult a tax advisor to determine whether it is advisable to modify any applicable brokerage account agreements to prohibit their brokers from borrowing their common units.
WE HAVE ADOPTED CERTAIN VALUATION METHODOLOGIES FOR FEDERAL INCOME TAX PURPOSES THAT MAY RESULT IN A SHIFT OF INCOME, GAINS, LOSSES AND DEDUCTION BETWEEN OUR GENERAL PARTNER AND OUR UNITHOLDERS. THE IRS MAY CHALLENGE THIS TREATMENT, WHICH COULD ADVERSELY AFFECT THE VALUE OF THE COMMON UNITS.
When we issue additional units or engage in certain other transactions, we determine the fair market value of our assets and allocate any unrealized gain or loss attributable to our assets to the capital accounts of our unitholders and our General Partner. Our methodology may be viewed as understating the value of our assets. In that case, there may be a shift of income, gain, loss and deduction between certain unitholders and our General Partner, which may be unfavorable to such unitholders. Moreover, under our valuation methods, subsequent purchasers of common units may have a greater portion of their Internal Revenue Code Section 743(b) adjustment allocated to our tangible assets and a lesser portion allocated to our intangible assets. The IRS may challenge our valuation methods, or our allocation of the Section 743(b) adjustment attributable to our tangible and intangible assets, and allocations of taxable income, gain, loss and deduction between our General Partner and certain of our unitholders.
A successful IRS challenge to these methods or allocations could adversely affect the timing or amount of taxable income or loss being allocated to our unitholders. It also could affect the amount of gains recognized from our unitholders' sale of common units and could have a negative impact on the value of the common units or result in audit adjustments to our unitholders' tax returns without the benefit of additional deductions.
AS A RESULT OF INVESTING IN OUR COMMON UNITS, UNITHOLDERS MAY BECOME SUBJECT TO STATE AND LOCAL TAXES AND RETURN FILING REQUIREMENTS IN JURISDICTIONS WHERE WE OPERATE OR OWN OR ACQUIRE PROPERTIES.
In addition to federal income taxes, our unitholders will likely be subject to other taxes, including state and local taxes, unincorporated business taxes and estate, inheritance or intangible taxes that are imposed by the various jurisdictions in which we conduct business or control property now or in the future, even if they do not live in any of those jurisdictions. Our unitholders will likely be required to file state and local income tax returns and pay state and local income taxes in some or all of these various jurisdictions. Further, our unitholders may be subject to penalties for failure to comply with those requirements. We currently own assets and conduct business in several states. Most of these states currently impose a personal income tax on individuals, corporations and other entities. As we make acquisitions or expand our business, we may control assets or conduct business in additional states that impose a personal income tax. It is a unitholder’s responsibility to file all federal, state and local tax returns.
IF THE IRS MAKES AUDIT ADJUSTMENTS TO OUR INCOME TAX RETURNS FOR TAX YEARS BEGINNING AFTER DECEMBER 31, 2017, IT (AND SOME STATES) MAY ASSESS AND COLLECT ANY TAXES, (INCLUDING ANY APPLICABLE PENALTIES AND INTEREST), RESULTING FROM SUCH AUDIT ADJUSTMENTS DIRECTLY FROM US, IN WHICH CASE OUR CASH AVAILABLE FOR DISTRIBUTION TO OUR UNITHOLDERS MIGHT BE SUBSTANTIALLY REDUCED AND OUR CURRENT AND FORMER UNITHOLDERS MAY BE REQUIRED TO INDEMNIFY US IN THE AMOUNT OF ANY TAXES, (INCLUDING ANY APPLICABLE PENALTIES AND INTEREST), RESULTING FROM SUCH AUDIT ADJUSTMENTS THAT WERE PAID ON SUCH UNITHOLDERS' BEHALF.
Pursuant to the Bipartisan Budget Act of 2015, for tax years beginning after December 31, 2017, if the IRS makes audit adjustments to our income tax returns, it (and some states) may assess and collect any taxes (including any applicable penalties and interest) resulting from such audit adjustments directly from us. To the extent possible under the new rules, our general partner may elect to either pay the taxes (including any applicable penalties and interest) directly to the IRS or, if we are eligible, issue a revised information statement to each unitholder and former unitholder with respect to an audited and adjusted return. Although our general partner may elect to have our unitholders and former unitholders take such audit adjustment into account and pay any resulting taxes (including applicable penalties or interest in accordance with their interests in us during the tax year under audit pay any resulting taxes (including applicable penalties or interest), there can be no assurance that such election will be practical, permissible or effective in all circumstances and the manner in which the election is made and implemented has yet to be determined. As a result, our current unitholders may bear some or all of the tax liability resulting from such audit adjustment, even if such unitholders did not own units in us during the tax year under audit. If, as a result of any such audit adjustment,
36
we are required to make payments of taxes, penalties and interest, our cash available for distribution to our unitholders might be substantially reduced and our current and former unitholders may be required to indemnify us in the amount of any taxes (including any applicable penalties and interest) resulting from such audit adjustments that were paid on such unitholders’ behalf. These rules are not applicable to us for tax years beginning on or prior to December 31, 2017.
ITEM 2. PROPERTIES
Descriptions of our properties and maps depicting the locations of our liquids systems are included in Part I. Item 1. Business.
In general, our systems are located on land owned by others and are operated under perpetual easements and rights-of-way, licenses, leases or permits that have been granted by private land owners, public authorities, railways or public utilities. Our liquids systems have pumping stations, tanks, terminals and certain other facilities that are located on land that is owned by us in fee and/or used by us under easements, licenses, leases or permits.
ITEM 3. LEGAL PROCEEDINGS
We are a participant in various legal proceedings arising in the ordinary course of business. Some of these proceedings are covered, in whole or in part, by insurance. We believe the outcome of all these proceedings will not, individually or in the aggregate, have a material adverse effect on our financial condition. The disclosures included in Part II. Item 8. Financial Statements and Supplementary Data, under Note 21 - Commitments and Contingencies, address the matters required by this item and are incorporated herein by reference.
BRINCKERHOFF v. ENBRIDGE ENERGY CO., INC. ET AL.
On July 20, 2015, plaintiff Peter Brinckerhoff (the Plaintiff), individually and as trustee of the Peter R. Brinckerhoff Trust, filed a Verified Class Action and Derivative Complaint in the Court of Chancery of the State of Delaware against our General Partner, Enbridge, Enbridge Management, Enbridge Pipelines (Alberta Clipper) L.L.C., the OLP, us, and the following individuals: Jeffrey A. Connelly, Rebecca B. Roberts, Dan A. Westbrook, J. Richard Bird, J. Herbert England, C. Gregory Harper, D. Guy Jarvis, Mark A. Maki, and John K. Whelen, (collectively, the Director Defendants). The initial Complaint asserted both class action claims on behalf of holders of our Class A Common Units, as well as derivative claims brought on behalf of us. The Plaintiff’s claims arose out of the January 2, 2015 repurchase by us of our General Partner’s 66.67% interest in the pipeline that runs from the Canadian international border near Neche, North Dakota to Superior, Wisconsin on our Lakehead System (Alberta Clipper Pipeline), known as the 2015 Transaction. First, the Plaintiff alleged that the 2015 Transaction improperly amended without Public Unitholder consent the Sixth Amended and Restated Agreement of Limited Partnership (the LPA) so as to allocate to the Public Unitholders gross income that should have been allocated to the General Partner (the Special Tax Allocation). Second, the Plaintiff alleged that we paid an unfair price for our General Partner’s 66.67% interest in the Alberta Clipper Pipeline such that the 2015 Transaction breached the LPA because it was not fair and reasonable to the Partnership. The initial Complaint asserted claims for breach of fiduciary duty, breach of the covenant of good faith and fair dealing, breach of residual fiduciary duties, tortious interference, aiding and abetting, and rescission and reformation.
On April 29, 2016, the Court of Chancery granted Enbridge’s and the Director Defendants’ motion to dismiss and dismissed the case in its entirety. On May 26, 2016 the Plaintiff appealed that dismissal to the Delaware Supreme Court. On March 20, 2017, the Delaware Supreme Court reversed in part and affirmed in part the ruling of the Court of Chancery. Specifically, the Delaware Supreme Court affirmed that the enactment of the Special Tax Allocation did not breach the LPA, but reversed on the question of whether the Plaintiff had adequately alleged that the price we paid in the 2015 Transaction, including the Special Tax Allocation component, was fair and reasonable to the Partnership. On November 15, 2017, Plaintiff filed a Verified Second Amended Complaint (the Second Amended Complaint). The Second Amended Complaint added Piper Jaffray & Co. as successor to Simmons & Company International (Simmons) as a direct Defendant. Simmons acted as the financial advisor to our Special Committee in the 2015 Transaction. The Second Amended Complaint also revised many of the allegations against Enbridge and the Director Defendants. All Defendants have moved to dismiss the Second Amended Complaint. The parties are currently in discovery, with trial currently scheduled in the fourth quarter of 2018.
ITEM 4. MINE SAFETY DISCLOSURES
37
Not applicable.
38
PART II.
ITEM 5. MARKET FOR REGISTRANT’S COMMON EQUITY, RELATED UNITHOLDER MATTERS AND ISSUER PURCHASES OF EQUITY SECURITIES
Our Class A common units are listed and traded on the NYSE, the principal market for the Class A common units, under the symbol “EEP.” The quarterly price ranges per Class A common unit and cash distributions paid per unit for 2017 and 2016 are summarized as follows:
First | Second | Third | Fourth | ||||||||||||
2017 Quarters | |||||||||||||||
High | $ | 26.17 | $ | 19.64 | $ | 16.63 | $ | 16.34 | |||||||
Low | $ | 16.95 | $ | 14.68 | $ | 13.87 | $ | 12.25 | |||||||
Cash distributions paid | $ | 0.583 | $ | 0.350 | $ | 0.350 | $ | 0.350 | |||||||
2016 Quarters | |||||||||||||||
High | $ | 24.22 | $ | 23.46 | $ | 25.49 | $ | 26.37 | |||||||
Low | $ | 14.27 | $ | 16.86 | $ | 21.97 | $ | 21.78 | |||||||
Cash distributions paid | $ | 0.583 | $ | 0.583 | $ | 0.583 | $ | 0.583 | |||||||
On February 13, 2018, the last reported sales price of our Class A common units on the NYSE was $13.54. As of January 26, 2018, there were approximately 824 registered holders of record of Class A common units. There is no established public trading market for our Class B common units, Class E units or Class F units all of which are held directly or indirectly by our General Partner, or our i-units, all of which are held by Enbridge Management. For further details regarding our distributions refer to Part II. Item 8. Financial Statements and Supplementary Data — Note 16 - Partners' Capital.
39
ITEM 6. SELECTED FINANCIAL DATA
The following table sets forth, for the periods and at the dates indicated, the summary historical financial data. The table is derived, and should be read in conjunction with, our audited consolidated financial statements and notes thereto included in Item 8. Financial Statements and Supplementary Data. See also Item 7. Management’s Discussion and Analysis of Financial Condition and Results of Operations.
December 31, | |||||||||||||||||||
2017 (1)(2) | 2016 (1) | 2015 (1) | 2014 (1) | 2013 (1) | |||||||||||||||
(in millions, except per unit amounts) | |||||||||||||||||||
Statement of Income Data: | |||||||||||||||||||
Operating revenues(2) | $ | 2,428 | $ | 2,516 | $ | 2,303 | $ | 2,070 | $ | 1,524 | |||||||||
Operating income(3) | 1,121 | 481 | 964 | 934 | 375 | ||||||||||||||
Income from continuing operations(3) | 708 | 116 | 739 | 596 | 143 | ||||||||||||||
Income (loss) from discontinued operations, net of tax | (57 | ) | (157 | ) | (285 | ) | 144 | 17 | |||||||||||
Net income (loss) | 651 | (41 | ) | 454 | 740 | 160 | |||||||||||||
Net income (loss) - controlling interests | 245 | (162 | ) | 132 | 372 | 5 | |||||||||||||
Net income (loss) from continuing operations | 237 | (268 | ) | 119 | 74 | (123 | ) | ||||||||||||
Net income (loss) attributable to common units and i-units | 200 | (377 | ) | (85 | ) | 218 | 5 | ||||||||||||
Net income (loss) per common unit and i-unit (basic and diluted) from continuing operations | 0.60 | (0.77 | ) | 0.35 | 0.23 | (0.39 | ) | ||||||||||||
Net income (loss) per common unit and i-unit (basic and diluted) | 0.50 | (1.08 | ) | (0.25 | ) | 0.67 | (0.33 | ) | |||||||||||
Cash distributions paid per limited partner unit(4) | 1.633 | 2.332 | 2.306 | 2.197 | 2.174 | ||||||||||||||
Statement of Financial Position Data: | |||||||||||||||||||
Total assets(5) | $ | 14,828 | $ | 18,110 | $ | 18,774 | $ | 17,727 | $ | 14,881 | |||||||||
Long-term debt, excluding current maturities | 6,366 | 7,066 | 6,838 | 5,895 | 4,421 | ||||||||||||||
Loans from General Partner and affiliate | 610 | 750 | — | — | 306 | ||||||||||||||
Due to General Partner and affiliates | — | 328 | 238 | 148 | 47 | ||||||||||||||
Other long-term liabilities | 178 | 197 | 189 | 169 | 20 | ||||||||||||||
____________
(1) | On June 28, 2017, we completed the sale of all our interest in our Midcoast gas gathering and processing business to our General Partner. This sale represents a strategic shift in our business and as a result, the results of operations and financial position of our natural gas business from the periods presented are reflected as discontinued operations. |
(2) | Our statements of income and financial position reflect the following dispositions: |
Date of Disposition | Description of Disposition | |
December 2017 | The disposition of unnecessary pipe related to the Sandpiper Project | |
March 2017 | The disposition of the Ozark Pipeline system | |
(3) | Operating income for the year ended December 31, 2016, were impacted by a $757 million asset impairment charge in relation to the Sandpiper project as discussed in Item 8. Financial Statements and Supplementary Data — Note 9 - Property, Plant and Equipment. |
(4) | On April 28, 2017, we announced the conclusion of our strategic review. As a result, of the strategic review we reduced our quarterly distributions from $0.583 per unit to $0.35 per unit, as discussed in Item 7. Management’s Discussion and Analysis of Financial Condition and Results of Operations. |
(5) | Total assets for the years ended December 31, 2016, 2015, 2014, and 2013 are inclusive of amounts attributable to our interest in our Midcoast gas gathering and processing business which was sold to our General Partner on June 28, 2017. |
40
ITEM 7. MANAGEMENT’S DISCUSSION AND ANALYSIS OF FINANCIAL CONDITION AND RESULTS OF OPERATIONS
The following discussion and analysis of our financial condition and results of operations is based on and should be read in conjunction with our consolidated financial statements and the accompanying notes included in Item 8. Financial Statements and Supplementary Data of this Annual Report on Form 10-K.
RECENT DEVELOPMENTS
US TAX REFORM
On December 22, 2017, United States legislation referred to as the "Tax Cuts and Jobs Act" (the TCJA) was signed into law. Substantially all of the provisions of the TCJA are effective for taxable years beginning after December 31, 2017. The TCJA includes significant changes to the Internal Revenue Code of 1986 (as amended, the Code), including amendments which significantly change the taxation of individual and business entities. The most significant change included in the TCJA is a reduction in the corporate federal income tax rate from 35% to 21%.
This tax rate change is expected to cause us to reduce the income tax allowance component of the tolls in our FERC regulated cost-of-service based Facility Surcharge Mechanism (FSM) projects. Impacts of tax reform will be realized in the first quarter of 2018 and will be reflected in Lakehead’s FSM toll filing for rates effective April 1, 2018. The total annual impact to us is expected to be approximately $55 million per year, net of noncontrolling interests (NCI).
ALBERTA CLIPPER (LINE 67) PRESIDENTIAL PERMIT
On October 16, 2017, we received a Presidential Permit for Line 67, following a nearly five-year process of review. Line 67 currently operates under an existing Presidential Permit that was issued by the United States Department of State in 2009 and the 2017 Presidential Permit authorizes us to fully utilize its capacity across the border.
Line 67 is a key component of the Lakehead System, which United States refineries rely on to provide vital products to consumers across the Midwest United States. Refer to Growth Projects — Regulatory Matters — Lakehead System Mainline Expansion for further information.
BAKKEN PIPELINE SYSTEM
On February 15, 2017, through our joint venture with MPC, we completed the acquisition of an effective 27.6% interest in the Bakken Pipeline System for a purchase price of $1.5 billion, initially funded through the Enbridge (U.S.) Inc. (EUS) Credit Agreement. On April 27, 2017, we finalized the joint funding arrangement with our General Partner for our effective interest in the Bakken Pipeline System. Under the terms of the arrangement, our General Partner owns 75% and we own 25% of Enbridge Holdings (DakTex) L.L.C. (DakTex) our investment subsidiary, which in turn owns the joint venture with MPC. We also have a five-year option to acquire an additional 20% interest in DakTex at net book value. With the finalization of the joint funding arrangement, we repaid the $1.5 billion outstanding under the EUS Credit Agreement and terminated the credit agreement. For further information on the EUS Credit Agreement refer to Item 8. Financial Statements and Supplementary Data — Note 20 - Related Party Transactions .
The Bakken Pipeline System, which consists of DAPL and ETCOP, was placed into service June 1, 2017. It transports crude oil from the Bakken formation in North Dakota to markets in eastern PADD II, and the United States Gulf Coast. DAPL consists of 1,172 miles of 30-inch pipeline from the Bakken/Three Forks production area in North Dakota to Patoka, Illinois. It is expected to deliver in excess of 470,000 Bpd of crude oil and has the potential to be expanded to 570,000 Bpd. ETCOP consists of 62 miles of new 30-inch diameter pipe, 686 miles of converted 30-inch diameter pipe, and 40 miles of converted 24-inch diameter pipe from Patoka, Illinois to Nederland, Texas.
STRATEGIC REVIEW
On April 28, 2017, we announced the conclusion of our strategic review and undertook steps to position us as a pure-play liquids pipeline MLP with a low-risk commercial profile, stable cash flows, a strong balance sheet, healthy distribution coverage, visible growth and limited external capital needs. We implemented the following actions to strengthen our financial position and outlook:
41
• | The reduction of our quarterly distribution from $0.583 per unit to $0.35 per unit or from $2.33 per unit to $1.40 per unit on an annualized basis; |
• | Issuance of approximately 64 million Class A common units to our General Partner at a price of $18.66 per Class A common unit; |
• | The redemption of our outstanding Series 1 Preferred Units held by the General Partner at face value of $1.2 billion which was funded with the proceeds from the issuance of Class A common units to our General Partner; |
• | The sale of all of our interests in our Midcoast gas gathering and processing business which closed on June 28, 2017, to our General Partner for $2.3 billion, including cash consideration of $1.3 billion and $953 million of existing outstanding indebtedness at MEP. A portion of these proceeds were used for other restructuring actions including the repayment of deferred distributions on our Series 1 Preferred Units; |
• | Subsequent to the Midcoast sale on June 28, 2017, we repaid $357 million in deferred distribution balance on our Series 1 Preferred Units owed to our General Partner; |
• | The restructuring of our capital structure and modification of our incentive distribution rights through the irrevocable waiver by a wholly-owned subsidiary of our General Partner of all of that subsidiary’s 66 million Class D units and 1,000 IDUs in consideration for issuance of a new class of units, Class F units. These units are entitled to (i) 13% of all distributions of available cash in excess of $0.295 per unit, but less than or equal to $0.35 per unit, and (ii) 23% of all distributions of available cash in excess of $0.35 per unit; and |
• | The finalization of the joint funding arrangement for our investment in the Bakken Pipeline System in which our General Partner owns 75% interest and we own 25% interest with an option to acquire an additional 20% interest from our General Partner at net book value. |
Also, on January 26, 2017, we announced three strengthening actions to alleviate short-term capital expenditure requirements and enhanced our cash flows as follows:
• | We entered into a joint funding arrangement with our General Partner for the U.S. L3R Program whereby our General Partner paid approximately $450 million for a 99% interest in the project, including our share of the construction costs to date and other incremental amounts; |
• | We acquired an additional 15% interest in the Eastern Access Projects, at its book value of approximately $360 million, which is now in service. We utilized the funds received from the joint funding arrangement for the U.S. L3R Program to exercise our option under the Eastern Access joint funding arrangement; and |
• | MEP entered into the merger agreement with our General Partner, whereby, on April 27, 2017, our General Partner acquired, for cash, all the outstanding publicly held Class A common units of MEP. |
Our business outlook as a pure-play liquids pipeline MLP remains strong. The Lakehead System is expected to continue to deliver stable, low-risk regulated cash flow and the volume outlook on the North Dakota assets is expected to remain strong. Our cash flow growth is expected to be underpinned by various sources, including higher contracted volumes on the Bakken Pipeline System and higher toll surcharges on our existing 25% interest in the Mainline Expansion Project when it fully enters service. In addition, we hold purchase options under existing joint funding arrangements to acquire additional interests in the Bakken Pipeline System, the Mainline Expansion Project and the Line 3 Replacement Project. For further details regarding our joint funding arrangement, refer to Item 8. Financial Statements and Supplementary Data — Note 20 - Related Party Transactions.
42
RESULTS OF OPERATIONS — OVERVIEW
We provide services to our customers and returns for our unitholders through our liquids business, which consists of interstate pipeline transportation and storage of crude oil and liquid petroleum. Our liquids business is conducted through three systems: Lakehead System, Mid-Continent System and Bakken Assets. These systems largely consist of FERC regulated interstate crude oil and liquid petroleum pipelines, gathering systems and storage facilities. The Lakehead System, together with the Enbridge system in Canada, forms the longest liquid petroleum pipeline system in the world. Our Liquids systems generate revenues primarily from charging shippers a rate per barrel to gather, transport and store crude oil and liquid petroleum.
On June 28, 2017 our General Partner acquired all of our ownership interests in our Midcoast gas gathering and processing business through the acquisition of all of our 48.4% interest in Midcoast Operating, all of our ownership interests in Midcoast Holdings, L.L.C., and all of our limited partnership interests in MEP. For further details regarding the Midcoast sale, refer to Item 8. Financial Statements and Supplementary Data — Note 7 - Dispositions and Discontinued Operations.
The results of our Midcoast gas gathering and processing business are included in “Loss from discontinued operations” in our consolidated statements of income.
The following table reflects our results of operations:
December 31, | |||||||||||
2017 | 2016 | 2015 | |||||||||
(in millions) | |||||||||||
Operating revenues | $ | 2,428 | $ | 2,516 | $ | 2,303 | |||||
Operating expenses | |||||||||||
Operating and administrative | 355 | 283 | 344 | ||||||||
Operating and administrative – affiliate | 294 | 291 | 294 | ||||||||
Power | 290 | 277 | 260 | ||||||||
Depreciation and amortization | 442 | 427 | 378 | ||||||||
Gain on sale of assets | (74 | ) | — | — | |||||||
Asset impairment | — | 757 | 63 | ||||||||
1,307 | 2,035 | 1,339 | |||||||||
Operating income | 1,121 | 481 | 964 | ||||||||
Interest expense | (525 | ) | (413 | ) | (292 | ) | |||||
Allowance for equity used during construction | 47 | 46 | 70 | ||||||||
Other income | 57 | 1 | — | ||||||||
Income from continuing operations before income tax | 700 | 115 | 742 | ||||||||
Income tax benefit (expense) | 8 | 1 | (3 | ) | |||||||
Income from continuing operations | 708 | 116 | 739 | ||||||||
Loss from discontinued operations, net of tax | (57 | ) | (157 | ) | (285 | ) | |||||
Net income (loss) | 651 | (41 | ) | 454 | |||||||
Net income attributable to noncontrolling interest | (369 | ) | (26 | ) | (221 | ) | |||||
Series 1 preferred unit distributions | (29 | ) | (90 | ) | (90 | ) | |||||
Accretion of discount on Series 1 preferred units | (8 | ) | (5 | ) | (11 | ) | |||||
Net income (loss) attributable to general and limited partner ownership interests in Enbridge Energy Partners, L.P. | $ | 245 | $ | (162 | ) | $ | 132 | ||||
YEAR ENDED DECEMBER 31, 2017 COMPARED TO YEAR ENDED DECEMBER 31, 2016
Operating Revenue
Operating revenues decreased $88 million for the year ended December 31, 2017 when compared to the corresponding 2016 period. The decrease was mainly driven by:
43
• | Lower operating revenue from our North Dakota System resulting from lower volumes and tolls on our Bakken System due to the expiration of the Phase 5 Looping and Phase 6 Mainline surcharges at the end of 2016 and lower operating revenue from our Berthold rail facility; |
• | Lower operating revenue from our Mid-Continent System as a result of the sale of the Ozark Pipeline on March 1, 2017, lower Cushing Terminal activity and fixed storage contracts; partially offset by |
• | Higher operating revenue from the Lakehead System due to increased flow-through of recoverable operating costs attributable to higher throughput on the Lakehead System. |
Operating Expenses
Operating expenses decreased $728 million for the year ended December 31, 2017 when compared to the corresponding 2016 period. The decrease was mainly driven by:
• | The absence in 2017 of a one-time impairment loss of $757 million that occurred in 2016 related to the withdrawal of our regulatory application on the Sandpiper Project; |
• | Gain on the sale of unnecessary pipe related to the Sandpiper Project; |
• | Lower Mid-Continent operating expenses resulting from the sale of Ozark Pipeline on March 1, 2017; partially offset by |
• | Higher Lakehead System pass-through power costs driven by higher throughput and other operating expenses which will be partially recoverable in 2018. |
Interest Expense
Interest expense increased $112 million for the year ended December 31, 2017 when compared to the corresponding 2016 period. The increase was mainly driven by:
• | The termination of interest rate swaps due to a high probability that the long-term debt associated with the interest rate swaps would not be raised, resulting in the reclassification of realized losses to interest expense from accumulated other comprehensive income (AOCI). |
Other Income
Other income increased $56 million for the year ended December 31, 2017 when compared to the corresponding 2016 period. The increase was mainly driven by:
• | Equity earnings from our interest in the Bakken Pipeline System, which was placed into service on June 1, 2017 |
Loss from discontinued operations, net of tax
Our loss from discontinued operations decreased $100 million when compared to the corresponding 2016 period. The decrease was mainly driven by:
• | The sale of our Midcoast gas gathering and processing business during the second half of 2017 to our General Partner resulting in the absence of full year of losses from our Midcoast gas gathering and processing business. |
Income attributable to noncontrolling interests (NCI)
Income attributable to NCI increased $343 million when compared to the corresponding 2016 period. The increase was mainly driven by:
• | The absence in 2017 of a one-time impairment loss of $757 million that occurred in 2016 related to the withdrawal of our regulatory application on the Sandpiper Project of which $267 million was attributable to NCI; |
• | The sale of all our interest in our Midcoast gas gathering and processing business resulting in the absence of losses attributable to NCI; and |
• | The finalization of a joint funding arrangement with our General Partner whereby our General Partner owns 75% of DakTex, our consolidated subsidiary, which holds our equity investment in MarEn Bakken Company LLC (MarEn) resulting in an increase to NCI. |
Series 1 Preferred Units Distribution
Distribution to Series 1 Preferred Units decreased $61 million when compared to the corresponding 2016 period. The decrease was mainly driven by:
44
• | The April 27, 2017, redemption of our outstanding Series 1 Preferred Units resulting in the absence of a full year of distribution. The Series 1 Preferred Units received a full year of distribution in 2016. |
YEAR ENDED DECEMBER 31, 2016 COMPARED TO YEAR ENDED DECEMBER 31, 2015
Operating Revenue
Operating revenues increased $213 million for the year ended December 31, 2016 when compared to the corresponding 2015 period. The increase was mainly driven by:
• | Increased surcharge revenue from projects subject to regulatory accounting. This increase is a result of placing $1.6 billion of additional assets into service on the Lakehead System in 2015. |
• | Partially offset by a decrease on the North Dakota System due to lower average rates and lower rail revenues. The lower rail revenues were attributable to expired contracts on the Berthold rail facility. |
Operating Expenses
Operating expenses increased $696 million for the year ended December 31, 2016 when compared to the corresponding 2015 period. The increase was mainly driven by:
• | An asset impairment of $757 million in relation to the withdrawal of our regulatory application on the Sandpiper Project in 2016; partially offset by |
• | The absence in 2016 of an asset impairment of $63 million to write-off the remaining carrying value of our Berthold rail facility due to contracts that were not renewed. |
Interest Expense
Interest expense increased $121 million for the year ended December 31, 2016 when compared to the corresponding 2015 period. The increase was mainly driven by:
• | An increase in our average outstanding debt balance during the year ended December 31, 2016, which includes $1.6 billion of senior unsecured notes that were issued in October 2015. |
Allowance for equity used during construction
Allowance for equity used during construction (AEDC) decreased $24 million for the year ended December 31, 2016 when compared to the corresponding 2015 period. The decrease was mainly driven by:
• | A reduction in outstanding capital projects as the Eastern Access project was completed and placed into service in June 2016. |
Loss from discontinued operations, net of tax
Our loss from discontinued operations decreased $128 million when compared to the corresponding 2015 period. The decrease was mainly driven by:
• | The absence in 2016 of a goodwill impairment charge recorded in 2015 of $247 million due to sustained and prolonged reductions in drilling activities due to low prices for natural gas and NGLs; partially offset by; |
• | Lower margins primarily due to decreases in commodity prices and the resulting decrease in volumes from reduced drilling activities. |
Income attributable to NCI
Income attributable to NCI decreased $195 million when compared to the corresponding 2015 period. The decrease was mainly driven by:
• | A one-time asset impairment in 2016 of $757 million in relation to the withdrawal of our regulatory application on the Sandpiper Project of which $267 million was attributable to NCI; partially offset by; |
• | Higher earnings attributable to both the Eastern Access and United States Mainline Expansion projects. |
DERIVATIVE TRANSACTIONS AND HEDGING ACTIVITIES
Contractual arrangements expose us to market risks associated with changes in (i) commodity prices where we receive crude oil in return for the services we provide or (ii) interest rates on our variable rate debt. Our unhedged commodity position is fully exposed to fluctuations in commodity prices, which can be significant during periods of price volatility. We use derivative financial instruments such as futures, forwards, swaps, options and other financial
45
instruments with similar characteristics, to manage the risks associated with market fluctuations in commodity prices and interest rates, as well as to reduce variability in our cash flows. Based on our risk management policies, all of our derivative financial instruments are employed in connection with an underlying asset, liability and/or forecasted transaction and are not entered into with the objective of speculating on commodity prices or interest rates. Derivative financial instruments that do not receive hedge accounting under the provisions of authoritative accounting guidance create volatility in our earnings that can be significant. However, these fluctuations in earnings do not affect our cash flow. Cash flow is only affected when we settle the derivative instrument.
We record all derivative instruments in our consolidated financial statements at fair market value pursuant to the requirements of applicable authoritative accounting guidance. We record changes in the fair value of our derivative financial instruments that do not receive hedge accounting in our consolidated statements of income as follows:
• | Commodity-based derivatives — “Transportation and other services” |
• | Interest rate derivatives — “Interest expense, net” |
The changes in fair value of our derivatives are also presented as a reconciling item on our consolidated statements of cash flows. The following table presents the net changes in fair value associated with our derivative financial instruments:
December 31, | |||||||||||
2017 | 2016 | 2015 | |||||||||
(in millions) | |||||||||||
Liquids segment: | |||||||||||
Non-qualified hedges | $ | (3 | ) | $ | (9 | ) | $ | (16 | ) | ||
Other: | |||||||||||
Interest rate hedge ineffectiveness | 50 | (7 | ) | 99 | |||||||
Derivative fair value net gains (losses) | $ | 47 | $ | (16 | ) | $ | 83 | ||||
RESULTS OF OPERATIONS — BY SEGMENT
SEGMENT RESULTS
Management evaluates segment performance based on earnings before interest, taxes and depreciation and amortization (EBITDA). We consider segment EBITDA the indicator of our segment's operating performance from its continuing operations, as it represents the results of our operations without regard to financing methods or capital structures. Our segment EBITDA may not be comparable to similarly titled measures of other companies because other companies may not calculate EBITDA in the same manner.
LIQUIDS
Our Liquids segment includes the operations of our Lakehead System, Mid-Continent System and Bakken Assets. We provide a detailed description of each of these systems in Part I. Item 1. Business. The following table sets forth the operating results and statistics of our Liquids segment assets for the periods presented:
46
December 31, | |||||||||||
2017 | 2016 | 2015 | |||||||||
(in millions) | |||||||||||
Operating Results: | |||||||||||
Operating revenues | $ | 2,428 | $ | 2,516 | $ | 2,303 | |||||
Operating expenses: | |||||||||||
Operating and administrative | (637 | ) | (564 | ) | (609 | ) | |||||
Power | (290 | ) | (277 | ) | (260 | ) | |||||
Gain on sale of assets | 74 | — | — | ||||||||
Asset impairment | — | (757 | ) | (63 | ) | ||||||
Allowance for equity used during construction | 47 | 46 | 70 | ||||||||
Other income | 52 | — | — | ||||||||
EBITDA | $ | 1,674 | $ | 964 | $ | 1,441 | |||||
Operating Statistics: | |||||||||||
Lakehead System: | |||||||||||
United States(1) | 2,027 | 1,968 | 1,869 | ||||||||
Canada(1) | 646 | 606 | 446 | ||||||||
Total Lakehead System delivery volumes(1) | 2,673 | 2,574 | 2,315 | ||||||||
Barrel miles (billions) | 756 | 724 | 640 | ||||||||
Average haul (miles) | 775 | 768 | 757 | ||||||||
Mid-Continent System delivery volumes(1) | 24 | 188 | 212 | ||||||||
Bakken Assets: | |||||||||||
North Dakota System to Clearbrook(1) | 214 | 216 | 208 | ||||||||
Bakken System to Cromer(1) | 115 | 136 | 88 | ||||||||
Total Bakken Assets delivery volumes(1) | 329 | 352 | 296 | ||||||||
Total Liquids segment delivery volumes(1) | 3,026 | 3,114 | 2,823 | ||||||||
____________
(1) | Average barrels per day in thousands. |
Year ended December 31, 2017 compared to year ended December 31, 2016
EBITDA increased $710 million for the year ended December 31, 2017 as compared to the year ended December 31, 2016. The increase in EBITDA was primarily due to the following items:
• | The absence in 2017 of an asset impairment loss of $757 million in 2016 on our Sandpiper Project as noted below. |
• | A decrease in Lakehead System EBITDA as a result of a lower Lakehead System Local Toll, the expiry of the Line 2B hydrotest surcharge at the end of 2016 and higher operating costs which will be partially recoverable in 2018. |
• | EBITDA from our North Dakota System was consistent year over year with EBITDA from our interest in the Bakken Pipeline System, which was placed into service in June 2017, offsetting lower EBITDA resulting from lower volumes and tolls on our Bakken System due to the expiration of the Phase 5 Looping and Phase 6 Mainline surcharges at the end of 2016 and lower EBITDA from our Berthold rail facility due to expiration of customer contracts. |
• | Lower EBITDA from our Mid-Continent System as a result of the sale of the Ozark Pipeline on March 1, 2017 and to lower Cushing Terminal activity and fixed storage contracts. |
Year ended December 31, 2016 compared to year ended December 31, 2015
EBITDA decreased $477 million for the year ended December 31, 2016 when compared to the corresponding 2015 period. The decrease in EBITDA was primarily due to the following items:
47
• | We recognized an asset impairment loss of $757 million in 2016 due to the withdrawal of our regulatory application on the Sandpiper Project. In 2015, we recognized an asset impairment loss of $63 million to write-off the remaining carrying value of our Berthold rail facility due to contracts that were not renewed in 2015. |
• | Further contributing to the decrease was lower rail revenues primarily attributable expired contracts on the Berthold rail facility and greater qualifying volumes credits related to the Lakehead toll revenues. |
• | Partially offsetting the decrease in EBITDA was increased surcharge revenue for projects subject to regulatory accounting. The increase is attributable to placing $1.6 billion of additional assets into service on the Lakehead System in 2015 and lower operating and administrative expenses due to lower pipeline integrity costs related to hydrostatic test on Line 2B in 2015. There were no such costs incurred for the year ended December 31, 2016. |
GROWTH PROJECTS – COMMERCIALLY SECURED PROJECTS
We currently have a multi-billion dollar growth program underway, with projects expected to come into service in 2019, in addition to options to increase our economic interest in projects that are jointly funded by Enbridge and us.
The table and discussion below summarizes our commercially secured projects for the Liquids segment. Expenditures to date reflect total cumulative expenditures incurred from the inception of the projects to December 31, 2017.
Projects | Ownership Interest | Total Estimated Capital Costs(1) | Expenditures to Date(2) | Status | Expected In-Service Date | ||||||
Lakehead System Mainline Expansion - Line 61(3)(4) | 25 | % | 0.4 billion | 0.4 billion | Substantially Complete | 2H -2019 | |||||
U.S. Line 3 Replacement Program(5) | 1% | 2.9 billion | 0.7 billion | Under construction | 2H -2019 | ||||||
____________
(1) | These amounts are estimates and are subject to upward or downward adjustment based on various factors. |
(2) | Expenditures to date reflect total cumulative expenditures incurred from inception of the project up to December 31, 2017. |
(3) | Jointly funded 25% by us and 75% by our General Partner under the Mainline Expansion Joint Funding Arrangement. Estimated capital costs are presented at 100% before our General Partner’s contributions. |
(4) | Estimated in-service date will be adjusted to coincide with the in-service date of the U.S. L3R Program. |
(5) | The Conflicts Committee and Board of Directors approved a joint funding arrangement with our General Partner for the U.S. L3R Program. The General Partner will fund 99% and we will fund 1% of the capital cost of the U.S. L3R Program. |
The following commercially secured growth projects are expected to be placed in 2019:
• | Lakehead System Mainline Expansion - The remaining scope of the project includes the Southern Access expansion between Superior, Wisconsin and Flanagan, Illinois that will increase capacity from 950,000 Bpd to 1,200,000 Bpd, which was substantially completed in June of 2017. We currently anticipate an in-service date in second half of 2019 for this phase to more closely align with the anticipated in-service date for the U.S. L3R Program. For additional updates on the project, refer to Growth Projects - Regulatory Matters. |
• | U.S. Line 3 Replacement Program - replacement of the existing Line 3 crude oil pipeline between Neche, North Dakota and Superior, Wisconsin. The U.S. L3R Program, along with the Canadian L3R Program, will support the safety and operational reliability of the mainline system, enhance system flexibility, and allow us to optimize throughput on the mainline. The L3R Program is expected to achieve the original capacity of approximately 760,000 Bpd. Construction commenced on the Wisconsin portion of the U.S. L3R Program in late June 2017 and will be substantially complete in February 2018. For additional updates on the project, refer to Growth Projects - Regulatory Matters. |
48
GROWTH PROJECTS - REGULATORY MATTERS
LAKEHEAD SYSTEM MAINLINE EXPANSION
On October 16, 2017, the United States Department of State issued a Presidential Permit to us to operate Line 67 at its design capacity of 888,889 Bpd at the international border of the United States and Canada near Neche, North Dakota.
U.S. LINE 3 REPLACEMENT PROGRAM
We are in the process of obtaining the appropriate permits for constructing the U.S. L3R Program in Minnesota. The project requires both a Certificate of Need (Certificate) and an approval of the pipeline’s route (Route Permit) from the MNPUC. The MNPUC found both the Certificate and Route Permit applications for the U.S. L3R Program through Minnesota to be complete. On February 1, 2016, the Minnesota Public Utilities Commission (MNPUC) issued a written order requiring the Minnesota Department of Commerce (DOC) to prepare an Environmental Impact Statement (EIS) before the Certificate and Route Permit processes commence. The DOC issued the final EIS on August 17, 2017. The MNPUC determined the final EIS to be inadequate in four specific areas on December 7, 2017. The DOC provided a supplemental EIS on February 12, 2018 and the MNPUC will determine its adequacy in the second quarter of 2018. Progress continues with the parallel Certificate and Route Permit dockets, with public and evidentiary hearings now complete. The MNPUC is expected to issue a ruling in the second quarter of 2018. Construction of the Wisconsin portion of the U.S. Line 3 Replacement program began in late June 2017 and will be mechanically complete by February 2018.
REGULATORY PERMITTING
Our multi-billion dollar growth program includes investments in joint ventures as described above and organic growth projects. In recent years, proposed projects in our industry have faced unexpected extensions in the regulatory permitting process, which has created delays in and uncertainty related to timing of certain projects. Delays in the in service dates of our projects may have a significant impact on our forecasts and our financial results.
In addition environmental and indigenous opposition to the construction and operation of pipelines has impacted the industry, including us. We undertake extensive engagements with all stakeholders that are impacted by our projects in order to meet the needs of the public and ensure that issues are identified and managed. This effort includes land owners, communities, all levels of government and Tribal leadership, regulators and permitting agencies.
LIQUIDITY AND CAPITAL RESOURCES
GENERAL
Our primary operating cash requirements consist of normal operating expenses, maintenance capital expenditures, funding requirements associated with environmental costs, distributions to our partners and payments associated with our risk management activities. We expect to fund our current and future short-term cash requirements for these items from our operating cash flows supplemented as necessary by issuances of commercial paper and borrowings under our Credit Facilities. Margin requirements associated with our derivative transactions are generally supported by letters of credit issued under our Credit Facilities.
We expect to initially fund our long-term cash requirements for expansion projects and acquisitions, as well as retire our maturing and callable debt, first from operating cash flows and then from issuances of commercial paper and borrowings on our Credit Facilities. We expect to obtain permanent financing as needed through the issuance of additional equity and debt securities, which we will use to repay amounts initially drawn to fund these activities although there can be no assurance that such financings will be available on favorable terms, if at all.
In the past, when we had attractive growth opportunities in excess of our own capital raising capabilities, our General Partner provided supplementary funding, or participated directly in projects, to enable us to undertake such opportunities. If in the future we have attractive growth opportunities that exceed capital raising capabilities, we could seek similar arrangements from our General Partner, but there can be no assurance that this funding can be obtained.
AVAILABLE LIQUIDITY
Our primary source of short-term liquidity is provided by our $1.5 billion commercial paper program, which is supported by our $2.0 billion multi-year unsecured revolving credit facility (Credit Facility) and our $625 million credit agreement (364-Day Credit Facility) together providing approximately $2.6 billion of committed bank Credit Facilities. We access our commercial paper program primarily to provide temporary financing for our operating activities, capital
49
expenditures and acquisitions when the interest rates available to us for commercial paper are more favorable than the rates available under our Credit Facilities. At December 31, 2017, we had approximately $1.2 billion in available credit under the terms of our Credit Facilities.
We are also party to certain financing arrangement with affiliates under an unsecured revolving 364-day credit agreement with EUS. The EUS 364-day Credit Facility is a committed senior unsecured revolving credit facility that permits aggregate borrowings of up to, at any one time outstanding, $750 million. Additionally, we entered into the EUS Credit Agreement, for the sole purpose of providing interim financing for our investment in the Bakken Pipeline System. On April 27, 2017, we finalized the joint funding arrangement with our General Partner with respect to our investment in the Bakken Pipeline System. As a result of the joint funding arrangement, we repaid the outstanding balance of $1.5 billion under the EUS Credit Agreement and terminated the agreement. For further details on our financing arrangements with affiliates refer to Item 8. Financial Statements and Supplementary Data — Note 20 - Related Party Transactions
At December 31, 2017, we had a working capital deficit of approximately $0.6 billion. We had approximately $1.3 billion of consolidated liquidity, which we expect to be sufficient, to meet our ongoing operational, investing and financing needs as described above, as well as the funding requirements associated with the environmental remediation costs resulting from the crude oil release on Line 6B.
The following table sets forth the consolidated liquidity available to us at December 31, 2017.
December 31, | |||
(in millions) | |||
Cash and cash equivalents | $ | 35 | |
Total capacity under the Credit Facilities | 2,625 | ||
Total capacity under the EUS 364-day Credit Facility | 750 | ||
Less: Amounts outstanding under the Credit Facilities | 150 | ||
Amounts outstanding under the EUS 364-day Credit Facility | 610 | ||
Principal amount of commercial paper outstanding | 1,303 | ||
Letters of credit outstanding | 1 | ||
Total | $ | 1,346 | |
CAPITAL RESOURCES
Debt and Equity Securities
Execution of our growth strategy and completion of our planned construction projects contemplate accessing the capital markets to obtain the necessary funding for these activities. We have issued a balanced combination of debt and equity securities to fund our expansion projects and acquisitions. Our organic growth projects and targeted acquisitions will require additional permanent capital and may require us to bear the cost of constructing and acquiring assets before we begin to realize a return on them. From time to time, if the capital markets are constrained, our ability and willingness to complete future debt and equity offerings may be limited, which in turn, could affect our ability to execute our growth strategy or complete our planned construction projects. The timing of any future debt and equity offerings will depend on various factors, including prevailing market conditions, interest rates, our financial condition and our credit ratings at the time.
Our current shelf registration statement on Form S-3, which would allow us to issue an unlimited amount of equity and debt securities in underwritten public offerings expires in February of 2018. Unless we seek, and receive a waiver from the SEC, no further issuances will be made under this shelf registration statement and a new shelf registration statement would not be expected to be filed until August of 2018, at the earliest. The delay in filing a new shelf registration statement is due to the late filing of pro forma financial information after the sale of our Midcoast gas gathering and processing business to our General Partner. Until a new shelf registration statement on Form S-3 is filed with the SEC, any issuances of debt or equity securities in underwritten public offerings would utilize a different form of registration statement or we could seek to issue debt securities in a private placement.
50
Commercial Paper
Our commercial paper program provides for the issuance of up to an aggregate principal amount $1.5 billion of commercial paper and is supported by our Credit Facilities.
Credit Facilities
Our primary Credit Facility permits aggregate borrowings of up to, at any one time outstanding, $2.0 billion with a letter of credit subfacility and a swing line subfacility. On October 2, 2017, we extended the maturity date attributable to the Credit Facility to September 26, 2022; however, $185 million of the commitments will expire on September 26, 2020 and $175 million will expire on September 26, 2018. In 2016, we amended the Credit Facility to increase the lending commitments by $25 million from $1,975 million. Loans under the Credit Facility accrue interest either at a eurocurrency rate or at a base rate, in each case, plus an applicable margin.
The 364-day Credit Facility, permits aggregate borrowings of up to $625 million: (i) on a revolving basis for a 364-day period, extendible annually at the lenders’ discretion, and (ii) for a 364-day term on a non-revolving basis following the expiration of all revolving periods. On June 30, 2017, the termination date was extended to June 29, 2018, which has a term out option that could extend maturity of outstanding borrowings to June 28, 2019.
At December 31, 2017, our Credit Facilities provided an aggregate amount of approximately $2.6 billion of bank credit, which we use to fund our general activities and working capital needs.
In addition, the EUS 364-day Credit Facility permits aggregate borrowing of up to, at any one time outstanding, $750 million. We entered into an agreement with EUS on July 25, 2017, whereby the termination date was extended to July 24, 2018. The EUS 364-day Credit Facility is discussed in Item 8. Financial Statements and Supplementary Data — Note 20 - Related Party Transactions.
As of December 31, 2017, we were in compliance with the terms of all of our financial covenants under the Credit Facilities.
Issuance of Class A Common Units
The following table presents the net proceeds from our Class A common unit issuances for the year ended December 31, 2017 and 2015. There were no issuances of Class A common units for the years ended December 31, 2016.
Issuance Date | Number of Class A common unit Issued | Price per Class A common units | Net Proceeds to the Partnership(1) | General Partner Contribution(2) | Net Proceeds Including General Partner Contribution | ||||||||||||||
(in millions, except units and per unit amounts) | |||||||||||||||||||
April, 2017 | 64,308,682 | $ | 18.66 | $ | 1,200 | $ | 24 | $ | 1,224 | ||||||||||
March, 2015 | 8,000,000 | $ | 36.70 | $ | 289 | $ | 6 | $ | 295 | ||||||||||
____________
(1) | Net of underwriters’ fees and discounts, commissions and issuance expenses. |
(2) | Contributions made by the General Partner to maintain its 2% general partner interest. |
The proceeds from the April 2017 issuance were used to redeem in full our $1.2 billion of outstanding Series 1 Preferred Units held by our General Partner.
The proceeds from the March 2015 offering were used to fund a portion of our capital expansion projects and for general partnership purposes.
Senior Notes
Our senior notes represent our unsecured obligations that rank equally in right of payment with all of our existing and future unsecured and unsubordinated indebtedness. Our senior notes are structurally subordinated to all existing and future indebtedness and other liabilities, including trade payables of our subsidiaries and the $200 million of senior notes issued by the OLP (the OLP Notes). The OLP Notes represent unsecured obligations that are structurally senior to our senior notes. All of the OLP Notes pay interest semi-annually. For further details regarding the OLP Notes, refer to Item 8. Financial Statements and Supplementary Data — Note 13 - Debt.
51
Junior Subordinated Notes
The $400 million in principal amount of our fixed to floating rate, junior subordinated notes due 2067 (the Junior Notes) represent our unsecured obligations that are subordinate in right of payment to all of our existing and future senior indebtedness. Prior to October 1, 2017, the Junior Notes bore interest at a fixed annual rate of 8.05%, exclusive of any discounts or interest rate hedging activities, payable semi-annually in arrears on April 1 and October 1 of each year. Effective October 1, 2017, the Junior Notes bear interest at a variable rate equal to the three month LIBOR for the related interest period increased by 3.798%, payable quarterly in arrears on January 1, April 1, July 1 and October 1 of each year beginning January 1, 2018. We may elect to defer interest payments on the Junior Notes for up to ten consecutive years on one or more occasions, but not beyond the final repayment date. Until paid, any interest we elect to defer will bear interest at the prevailing interest rate, compounded quarterly. For further details regarding the junior subordinated notes, refer to Item 8. Financial Statements and Supplementary Data — Note 13 - Debt.
Joint Funding Arrangements
In order to obtain capital, we have explored, and may continue to explore, numerous options, including joint funding arrangements. For certain of our joint funding arrangements currently in place, we have an option to increase our ownership of certain assets. For further details regarding our existing joint funding arrangements, including the option periods and exercise price of certain options held by us, refer to Item 8. Financial Statements and Supplementary Data — Note 20 - Related Party Transactions.
Sale of Accounts Receivable
We and certain of our subsidiaries were parties to a receivable purchase agreement (Receivables Agreement), with an indirect, wholly-owned subsidiary of Enbridge. On April 27, 2017, we terminated our Receivables Agreement with the indirect, wholly-owned subsidiary of Enbridge in exchange for a one-time $5 million payment to us. As a result, of this termination we discontinued the sale of our receivables balance. Prior to termination of the Receivables Agreement, the Enbridge subsidiary would purchase on a monthly basis, for cash, current accounts receivable and accrued receivables (the receivables) of the respective subsidiaries initially up to a monthly maximum of $450 million. Following the sale and transfer of the receivables to the Enbridge subsidiary, the receivables were deposited in an account of that subsidiary, and ownership and control were vested in that subsidiary. The Enbridge subsidiary had no recourse against us with respect to the receivables acquired from these operating subsidiaries under the terms of and subject to the conditions stated in the Receivables Agreement.
For further details regarding the Receivable Agreement, refer to Item 8. Financial Statements and Supplementary Data — Note 20 - Related Party Transactions.
CASH REQUIREMENTS
Capital Spending
We incurred capital expenditures of $586 million for the year ended December 31, 2017, including $40 million of maintenance capital expenditures. Of those capital expenditures, $300 million was financed by contributions from our General Partner via joint funding arrangements. At December 31, 2017, we had approximately $252 million in outstanding purchase commitments attributable to capital projects for the construction of assets that will be recorded as property, plant and equipment in the future.
Acquisitions
On February 15, 2017, through our joint venture with MPC we acquired an effective 27.6% interest in the Bakken Pipeline System. We funded the $1.5 billion acquisition through a bridge loan provided by an affiliate of our General Partner. On April 27, 2017, our Board of Directors finalized the joint funding arrangement with our General Partner with respect to our investment in the Bakken Pipeline System. We used the amounts received from the finalization of the joint funding arrangement plus additional borrowing from our existing facility to repay the $1.5 billion outstanding and subsequently terminated the bridge loan provided by an affiliate of our General Partner. For further details regarding our funding arrangements refer to Item 8. Financial Statements and Supplementary Data — Note 20 - Related Party Transactions
Forecasted Expenditures
We estimate our capital expenditures based upon our strategic operating and growth plans, which are also dependent upon our ability to produce or otherwise obtain the financing necessary to accomplish our growth objectives. For the year ended December 31, 2018. we forecast total expenditures of approximately $780 million, inclusive of $40 million related to maintenance capital. We expect to fund $362 million and the remaining $418 million will be funded
52
by our General Partner based on our joint funding arrangements for the U.S. L3R Program, Eastern Access Projects, and Mainline Expansion Projects. Although we anticipate making these expenditures in 2018, these estimates may change due to factors beyond our control, including weather-related issues, construction timing, regulatory permitting, changes in supplier prices or poor economic conditions, which may adversely affect our ability to access the capital markets. Additionally, our estimates may also change as a result of decisions made at a later date to revise the scope of a project or undertake a particular capital program or an acquisition of assets.
Distributions
We make quarterly distributions to our General Partner and the holders of our limited partner interests in an amount equal to our “available cash.” As defined in our partnership agreement, “available cash” represents for any calendar quarter, the sum of all of our cash receipts plus reductions in cash reserves established in prior quarters less cash disbursements and additions to cash reserves in that calendar quarter. We establish reserves to provide for the proper conduct of our business, to stabilize distributions to our unitholders and the General Partner and, as necessary, to comply with the terms of any of our agreements or obligations. Enbridge Management, as the delegate of our General Partner under the delegation of control agreement, computes the amount of our “available cash.”
Enbridge Management, as the owner of our i-units, does not receive distributions in cash. Instead, each time that we make a cash distribution to our limited partners and General Partner, the number of i-units owned by Enbridge Management and the percentage of our total units owned by Enbridge Management will increase automatically under the provisions of our partnership agreement with the result that the number of i-units owned by Enbridge Management will equal the number of Enbridge Management’s listed and voting shares that are then outstanding. The amount of this increase in i-units is determined by dividing the cash amount distributed per common unit by the average price of one of Enbridge Management’s listed shares on the NYSE for the 10 trading day period immediately preceding the ex-dividend date for Enbridge Management’s shares multiplied by the number of shares outstanding on the record date. The cash equivalent amount of the additional i-units is treated as if it had actually been distributed for purposes of determining the distributions to be made to our General Partner.
For purposes of calculating the sum of all distributions of available cash, the cash equivalent amount of the additional i-units that are issued when a distribution of cash is made to our General Partner and limited partner interests is treated as a distribution of available cash. As set forth in our partnership agreement, we will not make cash distributions on our i-units, but instead will distribute additional i-units such that cash is retained and used in our operations and to finance a portion of our capital expansion projects. During 2017, we distributed a total of 7,941,650 i-units through quarterly distributions to Enbridge Management, compared with 8,571,429 and 4,980,552 in 2016 and 2015, respectively.
The following table represents cash we have retained in our business since January 2015 from the in-kind distribution of additional i-units:
53
Distribution Payment Date | Amount Retained for Distribution to i-units Holders(1) | Retained from General Partner(2) | Total Cash Retained | |||||||||
(in millions) | ||||||||||||
2017 | ||||||||||||
November 14 | $ | 30 | $ | 1 | $ | 31 | ||||||
August 14 | 29 | 1 | 30 | |||||||||
May 15 | 30 | 1 | 31 | |||||||||
February 14 | 48 | 1 | 49 | |||||||||
$ | 137 | $ | 4 | $ | 141 | |||||||
2016 | ||||||||||||
November 14 | $ | 47 | $ | 1 | $ | 48 | ||||||
August 12 | 45 | 1 | 46 | |||||||||
May 13 | 44 | 1 | 45 | |||||||||
February 12 | 43 | 1 | 44 | |||||||||
$ | 179 | $ | 4 | $ | 183 | |||||||
2015 | ||||||||||||
November 13 | $ | 41 | $ | 1 | $ | 42 | ||||||
August 14 | 41 | 1 | 42 | |||||||||
May 15 | 40 | 1 | 41 | |||||||||
February 13 | 39 | 1 | 40 | |||||||||
$ | 161 | $ | 4 | $ | 165 | |||||||
____________
(1) | We issued 1,000 i-units to Enbridge Management, the sole owner of our i-units, during 2017 in lieu of cash distributions. |
(2) | We retained an amount equity to 2% of the i-unit distribution from our General Partner to maintain its 2% general partner interest in us. |
On April 28, 2017, we announced the reduction of our quarterly distribution from $0.583 per unit to $0.35 per unit or from $2.33 per unit to $1.40 on an annualized basis. Our annual cash distribution rate was $1.63 per unit, as the distribution declared for the three months ended December 31, 2016, was distributed as cash in the first quarter of 2017 at $0.583 per unit. Subsequent distributions were distributed at $0.35 per unit.
We expect that all cash distributions will be paid out of operating cash flows over the long term. However, from time to time, we may temporarily borrow under our Credit Facilities or use cash retained by issuance of payment in-kind distributions for the purpose of paying cash distributions. We may do this until we realize the full impact of assets being developed on operations or to respond to short-term aberrations in our performance caused by market disruption events or depressed commodity prices. As various projects are under construction, we expect our coverage ratio to weaken as assets under construction do not generate cash flow until they enter service and we are bearing the related financial costs. We expect that our major capital expansion projects will be accretive to distributable cash flow when they are operational and the coverage ratio to then improve.
Amendment of OLP Limited Partnership Agreement
On July 30,2015, the partners amended and restated the limited partnership agreement of the OLP pursuant to which our General Partner temporarily did not receive Series EA and ME (the Series) distributions from the quarter ended June 30, 2015, through the quarter ended March 31, 2016. The General Partner's capital funding contribution requirements for each of those two Series, commencing in August 2015, were reduced by the amount of its foregone cash distributions from the respective Series, until the earlier of December 31, 2016 and the date aggregate reductions in capital contributions for such Series are equal to the foregone cash distributions from such Series. As of December 31, 2016, capital contributions offsets foregone cash distributions.
Distribution to Series EA Interests
54
The following table presents distributions paid by the OLP for the years ended December 31, 2017, 2016, and 2015, to our General Partner and its affiliate, representing the noncontrolling interest in the Series EA, and to us, as the holders of the Series EA general and limited partner interests. The distributions were declared by the board of directors of Enbridge Management, acting on behalf of Enbridge Pipelines (Lakehead), L.L.C., the managing general partner of the OLP and the Series EA interests.
Distribution Declaration Date | Distribution Payment Date | Amount Paid to EEP | Amount Paid to the noncontrolling interest | Total Series EA Distribution | ||||||||||
(in millions of dollars) | ||||||||||||||
2017 | ||||||||||||||
October 25 | November 14 | $ | 35 | $ | 51 | $ | 86 | |||||||
July 28 | August 14 | 33 | 50 | 83 | ||||||||||
April 27 | May 15 | 29 | 62 | 91 | ||||||||||
January 26 | February 14 | 23 | 69 | 92 | ||||||||||
$ | 120 | $ | 232 | $ | 352 | |||||||||
2016 | ||||||||||||||
October 28 | November 14 | $ | 22 | $ | 65 | $ | 87 | |||||||
July 28 | August 12 | 21 | 63 | 84 | ||||||||||
April 29 | May 13 | 79 | — | 79 | ||||||||||
January 29 | February 12 | 79 | — | 79 | ||||||||||
$ | 201 | $ | 128 | $ | 329 | |||||||||
2015 | ||||||||||||||
October 30 | November 13 | $ | 76 | $ | — | $ | 76 | |||||||
July 30 | August 14 | 76 | — | 76 | ||||||||||
April 30 | May 15 | 18 | 52 | 70 | ||||||||||
January 29 | February 13 | 22 | 67 | 89 | ||||||||||
$ | 192 | $ | 119 | $ | 311 | |||||||||
Distribution to Series ME Interests
The following table presents distributions paid by the OLP for the years ended December 31, 2017, 2016, and 2015, to our General Partner and its affiliate, representing the noncontrolling interest in the Series ME, and to us, as the holders of the Series ME general and limited partner interests. The distributions were declared by the board of directors of Enbridge Management, acting on behalf of Enbridge Pipelines (Lakehead), L.L.C., the managing general partner of the OLP and the Series ME interests.
55
Distribution Declaration Date | Distribution Payment Date | Amount Paid to EEP | Amount Paid to the noncontrolling interest | Total Series ME Distribution | ||||||||||
(in millions of dollars) | ||||||||||||||
2017 | ||||||||||||||
October 25 | November 14 | $ | 15 | $ | 44 | $ | 59 | |||||||
July 28 | August 14 | 14 | 41 | 55 | ||||||||||
April 27 | May 15 | 13 | 38 | 51 | ||||||||||
January 26 | February 14 | 14 | 43 | 57 | ||||||||||
$ | 56 | $ | 166 | $ | 222 | |||||||||
2016 | ||||||||||||||
October 28 | November 14 | $ | 15 | $ | 44 | $ | 59 | |||||||
July 28 | August 12 | 13 | 40 | $ | 53 | |||||||||
April 29 | May 13 | 43 | — | $ | 43 | |||||||||
January 29 | February 12 | 41 | — | $ | 41 | |||||||||
$ | 112 | $ | 84 | $ | 196 | |||||||||
2015 | ||||||||||||||
October 30 | November 13 | $ | 32 | $ | — | $ | 32 | |||||||
July 30 | August 14 | 20 | — | $ | 20 | |||||||||
April 30 | May 15 | 1 | 5 | $ | 6 | |||||||||
January 29 | February 13 | 2 | 5 | $ | 7 | |||||||||
$ | 55 | $ | 10 | $ | 65 | |||||||||
Distribution from Enbridge Holdings (DakTex) L.L.C.
The following table presents distributions paid by Enbridge Holdings (DakTex) L.L.C. (DakTex) during the years ended December 31, 2017, to our General Partner and its affiliates, representing noncontrolling interest in Class A units of DakTex, and to us, as the holders of the remaining Class A units of DakTex.
Distribution Declaration Date | Distribution Payment Date | Amount Paid to EEP | Amount Paid to the noncontrolling interest | Total DakTex Distribution | ||||||||||
(in millions of dollars) | ||||||||||||||
2017 | ||||||||||||||
December 19 | December 28 | $ | 11 | $ | 32 | $ | 43 | |||||||
September 25 | September 29 | 10 | 31 | 41 | ||||||||||
$ | 21 | $ | 63 | $ | 84 | |||||||||
Distribution from MEP
The following table presents distributions paid by MEP during the years ended December 31, 2017, 2016, 2015, and prior to its sale to our General Partner on June 28, 2017, representing the noncontrolling interest in MEP and to us for our ownership of Class A common units. No distributions were made after the sale.
56
Distribution Declaration Date | Distribution Payment Date | Amount Paid to EEP | Amount Paid to the noncontrolling interest | Total MEP Distribution | ||||||||||
(in millions of dollars) | ||||||||||||||
2017 | ||||||||||||||
January 26 | February 14 | 9 | 8 | 17 | ||||||||||
$ | 9 | $ | 8 | $ | 17 | |||||||||
2016 | ||||||||||||||
October 27 | November 14 | $ | 9 | $ | 8 | $ | 17 | |||||||
July 27 | August 12 | 9 | 7 | 16 | ||||||||||
April 28 | May 13 | 9 | 8 | 17 | ||||||||||
January 28 | February 12 | 9 | 7 | 16 | ||||||||||
$ | 36 | $ | 30 | $ | 66 | |||||||||
2015 | ||||||||||||||
October 29 | November 13 | $ | 9 | $ | 8 | $ | 17 | |||||||
July 29 | August 14 | 9 | 7 | 16 | ||||||||||
April 29 | May 15 | 9 | 7 | 16 | ||||||||||
January 28 | February 13 | 8 | 8 | 16 | ||||||||||
$ | 35 | $ | 30 | $ | 65 | |||||||||
ENVIRONMENTAL
Lakehead Line 6B Crude Oil Release
During 2017, our cash flows were affected by the approximately $76 million we paid for the environmental remediation, restoration and cleanup activities resulting from the crude oil release that occurred in 2010 on Line 6B of our Lakehead System. For more information regarding cost estimates and fines and penalties, refer to Item 8. Financial Statements and Supplementary Data — Note 21 - Commitments and Contingencies.
DERIVATIVE ACTIVITIES
For information about the timing and expected settlement amounts of our outstanding commodity and interest rate derivative financial instruments, refer to Item 8. Financial Statements and Supplementary Data — Note 17 - Derivative Financial Instruments and Hedging Activities.
SUMMARY OF OBLIGATIONS AND COMMITMENTS
The following table summarizes the principal amount of our obligations and commitments at December 31, 2017:
Payments Due by Period | |||||||||||||||||||||||||||
2018 | 2019 | 2020 | 2021 | 2022 | Thereafter | Total | |||||||||||||||||||||
(in millions of dollars) | |||||||||||||||||||||||||||
Annual debt maturities(1) | $ | 500 | $ | 500 | $ | 1,000 | $ | 600 | $ | 1,453 | $ | 2,850 | $ | 6,903 | |||||||||||||
Interest obligations(2) | 324 | 280 | 243 | 208 | 183 | 3,414 | 4,652 | ||||||||||||||||||||
Purchase commitments(3) | 255 | — | — | — | — | — | 255 | ||||||||||||||||||||
Power commitments(4) | 26 | 25 | 24 | 10 | 10 | 257 | 352 | ||||||||||||||||||||
Operating leases | 3 | 3 | 2 | 1 | 1 | — | 10 | ||||||||||||||||||||
Right-of-way | 2 | 2 | 2 | 2 | 2 | 36 | 46 | ||||||||||||||||||||
Product purchase obligations(5) | 32 | 16 | 15 | 8 | — | — | 71 | ||||||||||||||||||||
Other long-term liabilities(6) | — | — | 1 | 1 | 1 | 6 | 9 | ||||||||||||||||||||
Total | $ | 1,142 | $ | 826 | $ | 1,287 | $ | 830 | $ | 1,650 | $ | 6,563 | $ | 12,298 | |||||||||||||
57
(1) | Represents scheduled future maturities of our consolidated third-party debt principal obligations excluding any discounts. For information regarding our consolidated debt obligations, see Item 8. Financial Statements and Supplementary Data — Note 13 - Debt. |
(2) | Estimated cash payments for third-party interest exclude adjustments for derivative agreements and cash payments for interest on variable-rate debt. We borrow and repay at varying amounts and interest rates. For more information on our debt obligations, see Item 8. Financial Statements and Supplementary Data, — Note 13 - Debt. |
(3) | Represents commitments to purchase materials, primarily pipe from third-party suppliers in connection with our growth projects. |
(4) | Represents commitments to purchase power, including certain power commitments with obligations that are dependent on variable components. For these commitments, we only included the determinable portion of our commitment based on the contracted usage requirement and the current applicable contract rate. |
(5) | Represents long-term product purchase commitments to purchase drag reducing agents. |
(6) | Includes non-current portion of capital leases. We are unable to estimate deferred income taxes (see Item 8. Financial Statements and Supplementary Data — Note 18 - Income Taxes) since cash payments for income taxes are determined primarily by taxable income for each discrete fiscal year. We are also unable to estimate asset retirement obligations (see Item 8. Financial Statements and Supplementary Data — Note 14 - Asset Retirement Obligations), environmental liabilities (see Item 8. Financial Statements and Supplementary Data — Note 21 - Commitments and Contingencies) and hedges payable (see Item 8. Financial Statements and Supplementary Data — Note 17 - Derivative Financial Instruments and Hedging Activities) due to the uncertainty as to the amount and, or, timing of when cash payments will be required. |
CASH FLOW ANALYSIS
The following table summarizes the changes in cash flows by operating, investing and financing for each of the years indicated:
For the year ended December 31, | |||||||||||
2017 | 2016 | 2015 | |||||||||
(in millions of dollars) | |||||||||||
Total cash provided by (used in): | |||||||||||
Operating activities | $ | 671 | $ | 1,189 | $ | 824 | |||||
Investing activities | (524 | ) | (1,030 | ) | (1,929 | ) | |||||
Financing activities | (213 | ) | (188 | ) | 1,037 | ||||||
Net decrease in cash and cash equivalents | (66 | ) | (29 | ) | (68 | ) | |||||
Cash and cash equivalents at beginning of year | 101 | 130 | 198 | ||||||||
Cash and cash equivalents at end of year | $ | 35 | $ | 101 | $ | 130 | |||||
Year ended December 31, 2017 compared to year ended December 31, 2016
Operating Activities
Net cash provided by our operating activities decreased $518 million for the year ended December 31, 2017, compared to the same period in 2016, primarily due to decreased cash from net income after non-cash adjustments, as well as greater cash outflows from net changes in operating assets and liabilities. Decreased cash from net income after non-cash adjustments totaled $290 million and was primarily due to the termination of interest rate swaps due to a high probability that the long-term debt associated with them would not be raised.
Cash outflows from net changes in operating assets and liabilities increased $228 million. The increase of cash outflows from net changes in operating assets and liabilities is primarily attributable to the termination of the Receivables Agreement in the second quarter of 2017. Our operating assets and liabilities fluctuate in the normal course of business due to various factors, including timing of cash payments and receipts.
Investing Activities
Net cash used in our investing activities during the year ended December 31, 2017, decreased by $506 million compared to the same period in 2016, primarily due to cash inflows of $1,310 million received from the sale of the Midcoast assets as well as cash inflows of $329 million from the sale of the Ozark Pipeline system during the first quarter 2017 and the sale of unnecessary pipe in relation to the Sandpiper Project during 2017. Further, contributing to cash inflows were lower spending on capital projects of $418 million compared to the same period in 2016 as the remaining expansion of the Eastern Access Project was placed into service in June 2016. The increase in cash inflows was partially offset by outflows of $1,579 million from the acquisition of the Bakken Pipeline System.
Financing Activities
58
Net cash used in our financing activities increased $25 million for the year ended December 31, 2017 compared to the same period in 2016 primarily due to the following:
• | Net repayments on sources of short-term financing of $426 million; |
• | Net repayments of $140 million under the EUS 364-day Credit Facility; |
• | Cash outflow of $1,557 million used in the redemption of the Series 1 preferred units and payment of the deferred distribution on these units as we had no such redemptions for the year ended December 31, 2016; |
• | Cash outflow of $360 million as a result of the acquisition of additional 15% interest in the Eastern Access Projects as we had no such acquisitions on projects under joint funding arrangements for the twelve months ended December 31, 2016; and |
• | Increased cash distributions to NCI of $345 million due to suspension of cash distributions to our General Partner on the Series EA and ME during the twelve months ended December 31, 2016. Distributions resumed during the twelve months ended December 31, 2017. |
These increases in net cash used in our financing activities were partially offset by the following:
• | Net proceeds of $1,225 million received from the issuance of Class A units as we had no such issuances for the twelve months ended December 31, 2016; and |
• | Increased contributions from NCI of $1,386 million as a result of the finalization of the joint funding arrangement with our General Partner with respect to our investment in the Bakken Pipeline System whereby our General Partner acquired 75% of DakTex and contribution from our General Partner to fund their equity portion of construction cost in relation to various joint funding arrangements. |
Year ended December 31, 2016 compared to year ended December 31, 2015
Operating Activities
Net cash provided by our operating activities increased $365 million during the year ended December 31, 2016, compared with the same period in 2015, primarily due to decreased cash from net income after non-cash adjustments, as well as greater cash outflows from net changes in operating assets and liabilities. Increased cash from net income after non-cash adjustments totaled $486 million and was primarily due to increased volumes and rates on our liquids systems from new systems placed into service.
Investing Activities
Net cash used in our investing activities decreased by $899 million during the year ended December 31, 2016, compared with 2015, primarily due to decreased spending on capital projects and acquisitions.
Financing Activities
Net cash provided by our financing activities decreased $1,225 million for the year ended December 31, 2016, compared with 2015, primarily due to:
• | Decreased cash provided by the issuance of debt of $1.6 billion, after debt issuance costs, primarily due to debt issued during 2015, with no such issuances in 2016; |
• | Decreased cash provided by contributions from our NCI of $723 million due to foregone cash distributions to our General Partner on the Series EA and ME interests; |
• | Decreased cash of $300 million due to a repayment of senior notes during the year ended December 31, 2016, with no such repayments during the same period in 2015; partially offset by |
• | Increased cash of $750 million from borrowings from General Partner and affiliates on the EUS 364-day Credit Facility during the year ended December 31, 2016, with no such borrowings during the same period in 2015. |
LEGAL AND OTHER UPDATES
DAKOTA ACCESS PIPELINE
In February 2017, the Standing Rock Sioux Tribe and the Cheyenne River Sioux Tribe (the Tribes) filed motions with the United States District Court for the District of Columbia (the Court) contesting the validity of the process used by the United States Army Corps of Engineers (Army Corps) to permit DAPL. The plaintiffs requested the Court order the operator to shut down the pipeline until the appropriate regulatory process is completed.
On June 14, 2017, the Court ruled that the Army Corps did not sufficiently weigh the degree to which the project's effects would be highly controversial and the Army Corps failed to adequately consider the impact of an oil spill on the hunting and fishing rights of the Tribes and on environmental justice. The Court ordered the Army Corps to reconsider those components of its environmental analysis. On October 11, 2017, the Court issued an order that allows DAPL to
59
continue operating while the Army Corps completes the additional environmental review required by the Court's June 14, 2017 order and the Court ordered DAPL to implement certain interim measures pending the Army Corps' supplemental analysis.
RENEWAL OF LINE 5 EASEMENT
On January 4, 2017, the Tribal Council of the Bad River Band of Lake Superior Tribe of Chippewa Indians (the Band) issued a press release indicating that the Band had passed a resolution not to renew its interest in certain Line 5 easements through the Bad River Reservation. Line 5 is included within the Lakehead System. The Band’s resolution calls for decommissioning and removal of the pipeline from all Bad River tribal lands and watershed and could impact Enbridge’s ability to operate the pipeline on the Reservation. Since the Band passed the resolution, the parties have agreed to ongoing discussions with the objective of understanding and resolving the Band’s concerns on a long-term basis.
OFF-BALANCE SHEET ARRANGEMENTS
We have no significant off-balance sheet arrangements.
CRITICAL ACCOUNTING POLICIES AND ESTIMATES
Our selection and application of accounting policies is an important process that has developed as our business activities have evolved and as new accounting pronouncements have been issued. Accounting decisions generally involve an interpretation of existing accounting principles and the use of judgment in applying those principles to the specific circumstances existing in our business. We believe the proper implementation and consistent application of all applicable accounting principles is critical. However, not all situations we encounter are specifically addressed in the accounting literature. In such cases, we must use our best judgment to implement accounting policies that clearly and accurately present the substance of these situations. We accomplish this by analyzing similar situations and the accounting guidance governing them and consulting with experts about the appropriate interpretation and application of the accounting literature to these situations.
In addition to the above, certain amounts included in or affecting our consolidated financial statements and related disclosures must be estimated, requiring us to make certain assumptions with respect to values or conditions that cannot be known with certainty at the time the consolidated financial statements are prepared. These estimates affect the reported amounts of assets, liabilities, revenues, expenses and related disclosures with respect to contingent assets and liabilities. The basis for our estimates is historical experience, consultation with experts and other sources we believe to be reliable. While we believe our estimates are appropriate, actual results can and often do differ from these estimates. Any effect on our business, financial position, results of operations and cash flows resulting from revisions to these estimates are recorded in the period in which the facts that give rise to the revision become known.
For a summary of our significant accounting policies, refer to Item 8. Financial Statements and Supplementary Data — Note 2 - Significant Accounting Policies. We believe our critical accounting policies discussed in the following paragraphs address the more significant judgments and estimates we use in the preparation of our consolidated financial statements. Each of these areas involve complex situations and a high degree of judgment either in the application and interpretation of existing accounting literature or in the development of estimates that affect our consolidated financial statements. Our management has discussed the development and selection of the critical accounting policies and estimates related to the reported amounts of assets, liabilities, revenues and expenses and disclosure of contingent liabilities with the Audit, Finance & Risk Committee of Enbridge Management’s board of directors.
Liquids Revenue Recognition
Our Liquids revenues are primarily derived from three sources: interstate transportation of crude oil and liquid petroleum under tariffs regulated by the FERC, ship-or-pay agreements and contract storage revenues related to our crude oil storage assets. The tariffs established for our interstate pipelines specify the amounts to be paid by shippers for transportation services we provide between receipt and delivery locations and the general terms and conditions of transportation services on the respective pipeline systems. We generally do not own the crude oil and liquid petroleum that we transport or store, and therefore, we do not assume significant direct commodity price risk. Some long-term take-or-pay contracts contain make-up rights. Make-up rights are granted when minimum volume commitments are not fulfilled during the period but under certain circumstances can be used to offset overages in future periods, subject to expiration periods. We recognize revenue associated with make-up rights at the earlier of when the make-up volume is shipped, the make-up right expires, or when it is determined that the likelihood that the shipper will utilize the make-
60
up right is remote. The “remote” determination is a matter of management judgment that requires us to make assumptions regarding, for example, general economic conditions impacting our assets, remaining capacity on the pipeline, shipper history and other factors. Such assumptions are subject to uncertainty, and changes in conditions used to make these assumptions could result in significant changes in the timing of our revenue recognition on these contracts.
Revenue Recognition and the Estimation of Revenues
In general, we recognize revenue when delivery has occurred or services have been rendered, pricing is determinable and collectability is reasonably assured. We estimate our current month revenue and commodity costs to permit the timely preparation of our consolidated financial statements. We generally cannot compile actual billing information nor obtain actual vendor invoices within a timeframe that would permit the recording of this actual data before our preparation of the consolidated financial statements. As a result, we record an estimate each month for our operating revenues and commodity costs based on the best available volume and price data for crude oil delivered and received, along with an adjustment of the prior month’s estimate to equal the prior month’s actual data. As a result, there is one month of estimated data recorded in our operating revenues and commodity costs for each period reported. We believe that the assumptions underlying these estimates will not be significantly different from the actual amounts due to the routine nature of these estimates and the consistency of our processes.
Regulated Operations
The rates for a number of our projects follow cost-of-service ratemaking methodologies in accordance with FERC’s authoritative guidance. The FERC exercises statutory authority over matters such as construction, rates and ratemaking and agreements with customers. To recognize the economic effects of the actions of the regulator, the timing of recognition of certain revenues and expenses in these operations may differ from that otherwise expected under United States Generally Accepted Accounting Principles (U.S. GAAP) for non-rate-regulated entities. Key determinants in the ratemaking process are:
• | Costs of providing service, including depreciation expense; |
• | Allowed rate of return, including the equity component of the capital structure and related income taxes; |
• | Contract and volume throughput assumptions. |
The allowed rate of return is determined in each rate case and may impact our profitability. The rates for a number of our projects are based on a cost-of-service recovery model that follows the regulators’ authoritative guidance. Under the cost-of-service tolling methodology, we calculate tolls based on forecast volumes and cost. A difference between forecast and actual results causes an over or under recovery in any given year. Regulatory assets represent amounts that are expected to be recovered from customers in future periods through rates. Regulatory liabilities represent amounts that are expected to be refunded to customers in future periods through rates.
To the extent that the regulator’s actions differ from our expectations, the timing and amount of recovery or settlement of regulatory balances could differ significantly from those recorded. In the absence of rate regulation, we would generally not recognize regulatory assets or liabilities and the earnings impact would be recorded in the period the expenses are incurred or revenues are earned. A regulatory asset or liability is recognized in respect of deferred income taxes when it is expected the amounts will be recovered or settled through future regulator-approved rates.
Asset Impairment
We evaluate the recoverability of our property, plant and equipment and intangible assets when events or circumstances such as economic obsolescence, the business climate, legal and other factors indicate we may not recover the carrying amount of the assets. We continually monitor our businesses, the market and business environments to identify indicators that could suggest an asset may not be recoverable. We evaluate the asset for recoverability by estimating the undiscounted future cash flows expected to be derived from operating the asset as a going concern. These cash flow estimates require us to make projections and assumptions for many years into the future for pricing, demand, competition, operating cost, contract renewals and other factors. If the total of the undiscounted future cash flows is less than the carrying amount of the property, plant and equipment or intangible assets, we calculate fair value based on the discounted cash flows and write the assets down to the extent that the fair value does not support its carrying amount to fair value. We recognize an impairment loss when the carrying amount of the asset exceeds its fair value as determined by quoted market prices in active markets or present value techniques. The determination of the fair value using present value techniques requires us to make projections and assumptions regarding future cash flows and weighted average cost of capital. Any changes we make to these projections and assumptions could result in significant revisions to our evaluation of the recoverability of our property, plant and equipment and the recognition of an impairment loss in our consolidated statements of income.
61
We periodically review our expansion projects for impairment by evaluating their costs incurred to date, the progress made against schedule, and our expectations of future economic, regulatory and political conditions that would impact the overall recoverability of our projects’ costs. During the year ended December 31, 2016, we decided to discontinue the Sandpiper Project due to difficulties in obtaining all the necessary permits and regulatory approvals, the delayed progress of the project to date, and our expectations of near term demand for the pipeline as well as the future political and regulatory environment in the United States and, thus, withdrew our regulatory applications pending with the Minnesota Public Utilities Commission. As a result, we evaluated the capital costs spent to date related to the Sandpiper Project for impairment and recognized an impairment of $757 million. The Sandpiper Project had not been placed into service, and the estimated remaining fair value of $55 million was based on the estimated price that would be received to sell unused pipe, land and other related equipment in its current condition, considering current market conditions for sale of these assets. The valuation considered a range of potential selling prices from various alternatives that could be used to dispose of these assets. We utilized market data from comparable transactions in determining the fair value and considered current market conditions and the length of time it would take to sell the unused pipe and related equipment. These assumptions, and in particular the estimated length of time to sell the unused pipe and related equipment, are subject to uncertainty and could be negatively impacted by changes in demand for pipe, the degree of customization in pipe and related equipment needed for other pipeline projects, saturation in the market for pipe due to other cancelled or delayed projects or other factors. During 2017, we disposed of substantially all of the remaining assets.
We believe the assumptions used in evaluating recoverability of our assets are appropriate and result in reasonable estimates of the fair values of our assets. However, the assumptions used are subject to uncertainty, and declines in the future performance or cash flows of our assets, changes in business conditions, such as commodity prices and drilling, or increases to our weighted average cost of capital assumptions due to changes in credit or equity markets may result in the recognition of impairment charges, which could be significant.
Commitments, Contingencies and Environmental Liabilities
We expense or capitalize, as appropriate, expenditures for ongoing compliance with environmental regulations that relate to past or current operations. We expense amounts we incur for remediation of existing environmental contamination caused by past operations that do not benefit future periods by preventing or eliminating future contamination. We record liabilities for environmental matters when assessments indicate that remediation efforts are probable, and the costs can be reasonably estimated. Estimates of environmental liabilities are based on currently available facts, existing technology and presently enacted laws and regulations taking into consideration the likely effects of inflation and other factors. These amounts also consider prior experience in remediating contaminated sites, other companies’ clean-up experience and data released by government organizations. Our estimates are subject to revision in future periods based on actual costs or new information and are included in “Environmental liabilities” and “Other long-term liabilities” in our consolidated statements of financial position at their undiscounted amounts. We always have the potential of incurring additional costs in connection with environmental liabilities due to variations in any or all of the categories described above, including modified or revised requirements from regulatory agencies, in addition to fines and penalties, as well as expenditures associated with litigation and settlement of claims. We evaluate recoveries from insurance coverage separately from the liability and, when recovery is probable, we record and report an asset separately from the associated liability in our consolidated financial statements.
We recognize liabilities for other commitments and contingencies when, after fully analyzing the available information, we determine it is either probable that an asset has been impaired, or that a liability has been incurred and the amount of impairment or loss can be reasonably estimated. When a range of probable loss can be estimated, we accrue the most likely amount, or if no amount is more likely than another, we accrue the minimum of the range of probable loss. We expense legal costs associated with loss contingencies as such costs are incurred. We believe that the estimates discussed herein are reasonable, however actual results could differ and it could result in material adjustments in results of operations between periods.
CHANGES IN ACCOUNTING POLICY
ADOPTION OF NEW STANDARDS
Clarifying the Definition of a Business in an Acquisition
Effective January 1, 2017, we early adopted ASU 2017-01 on a prospective basis. The new standard was issued with the objective of adding guidance to assist entities with evaluating whether transactions should be accounted for
62
as acquisitions (disposals) of assets or businesses. The adoption of the pronouncement did not have a material impact on our consolidated financial statements.
Accounting for Intra-Entity Asset Transfers
Effective January 1, 2017, we early adopted ASU 2016-16 on a modified retrospective basis. The new standard was issued with the intent of improving the accounting for the income tax consequences of intra-entity asset transfers other than inventory. Under the new guidance, an entity should recognize the income tax consequences of an intra-entity transfer of an asset, other than inventory, when the transfer occurs. The adoption of the pronouncement did not have a material impact on our consolidated financial statements.
Simplifying the Embedded Derivatives Analysis for Debt Instruments
Effective January 1, 2017, we adopted ASU 2016-06 on a modified retrospective basis. The new guidance simplifies the embedded derivative analysis for debt instruments containing contingent call or put options. The adoption of the pronouncement did not have a material impact on our consolidated financial statements.
FUTURE ACCOUNTING POLICY CHANGES
Improvements to Accounting for Hedging Activities
ASU 2017-12 was issued in August 2017 with the objective of better aligning a company’s risk management activities and the resulting hedge accounting reflected in the financial statements. The accounting update allows cash flow hedging of contractually specified components in financial and non-financial items. Under the new guidance, hedge ineffectiveness is no longer required to be measured and hedging instruments’ fair value changes will be recorded in the same income statement line as the hedged item. The ASU also allows the initial quantitative hedge effectiveness assessment to be performed at any time before the end of the quarter in which the hedge is designated. After initial quantitative testing is performed, an ongoing qualitative effectiveness assessment is permitted. The accounting update is effective January 1, 2019 and is to be applied on a modified retrospective basis. We are currently assessing the impact of the new standard on the consolidated financial statements.
Simplifying Cash Flow Classification
ASU 2016-15 was issued in August 2016 with the intent of reducing diversity in practice of how certain cash receipts and cash payments are classified in the Consolidated Statement of Cash Flows. The new guidance addresses eight specific presentation issues. The accounting update is effective January 1, 2018 and will be applied on a retrospective basis. We assessed each of the eight specific presentation issues and the adoption of this ASU does not have a material impact on our consolidated financial statements.
Accounting for Credit Losses
ASU 2016-13 was issued in June 2016 with the intent of providing financial statement users with more useful information about the expected credit losses on financial instruments and other commitments to extend credit held by a reporting entity at each reporting date. Current treatment uses the incurred loss methodology for recognizing credit losses that delays the recognition until it is probable a loss has been incurred. The accounting update adds a new impairment model, known as the current expected credit loss model, which is based on expected losses rather than incurred losses. Under the new guidance, an entity recognizes as an allowance its estimate of expected credit losses, which the Financial Accounting Standards Board believes will result in more timely recognition of such losses. We are currently assessing the impact of the new standard on our consolidated financial statements. The accounting update is effective January 1, 2020.
Recognition of Leases
ASU 2016-02 was issued in February 2016 with the intent to increase transparency and comparability among organizations. It requires lessees of operating lease arrangements to recognize lease assets and lease liabilities on the statement of financial position and disclose additional key information about lease agreements. The accounting update also replaces the current definition of a lease and requires that an arrangement be recognized as a lease when a customer has the right to obtain substantially all of the economic benefits from the use of an asset, as well as the right to direct the use of the asset. We are currently gathering a complete inventory of our lease contracts in order to assess the impact of the new standard on our consolidated financial statements. The accounting update is effective January 1, 2019 and will be applied using a modified retrospective approach.
Recognition and Measurement of Financial Assets and Liabilities
ASU 2016-01 was issued in January 2016 with the intent to address certain aspects of recognition, measurement, presentation and disclosure of financial assets and liabilities. Investments in equity securities, excluding equity method
63
and consolidated investments, are no longer classified as trading or available-for-sale securities. All investments in equity securities with readily determinable fair values are classified as investments at fair value through net income. Investments in equity securities without readily determinable fair values are measured using the fair value measurement alternative and are recorded at cost minus impairment, if any, plus or minus changes resulting from observable price changes in orderly transactions for an identical or similar investment of the same issuer. Investments in equity securities measured using the fair value measurement alternative are reviewed for indicators of impairment each reporting period. Fair value of financial instruments for disclosure purposes is measured using exit price. The accounting update is effective January 1, 2018 and will be applied on a prospective basis. We do not expect the adoption of this accounting update to have a material impact on our consolidated financial statements.
Revenue from Contracts with Customers
ASU 2014-09 was issued in 2014 with the intent of significantly enhancing consistency and comparability of revenue recognition practices across entities and industries. The new standard establishes a single, principles-based five-step model to be applied to all contracts with customers and introduces new and enhanced disclosure requirements. It also requires the use of more estimates and judgments than the present standards in addition to additional disclosures .The new standard is effective January 1, 2018. The new standard permits either a full retrospective method of adoption with restatement of all prior periods presented, or a modified retrospective method with the cumulative effect of applying the new standard recognized as an adjustment to opening retained earnings balances in the period of adoption. We have decided to adopt the new standard using the modified retrospective method.
We have reviewed our revenue contracts in order to evaluate the effect of the new standard on its revenue recognition practices. Based on this assessment, the application of the standard will result in the following changes to our financial statements and revenue recognition methods:
• | Estimates of variable consideration which will be required under the new standard as well as the allocation of the transaction price for certain revenue contracts may result in changes to the pattern or timing of revenue recognition for those contracts. |
• | Certain payments received from customers to offset the cost of constructing assets required to provide services to those customers, referred to as Contributions in Aid of Construction (CIAC’s) were previously recorded as reductions of property, plant and equipment regardless of whether the amounts were imposed by regulation or negotiated. Under the new standard, negotiated CIACs are deemed to be advance payments for services and must be recognized when those future services are provided. Negotiated CIACs will be accounted for as deferred revenue and recognized over the term of the associated revenue contract. |
After conducting this assessment, we determined that any necessary adjustments to our partners' capital account as of January 1, 2018 would be immaterial.
We have also developed and tested processes to generate the disclosures which will be required under the new standard commencing in first quarter of 2018.
SUBSEQUENT EVENTS
DISTRIBUTION TO PARTNERS
On January 31, 2018, the board of directors of Enbridge Management declared a distribution payable to our partners on February 14, 2018. The distribution was paid to unitholders of record as of February 7, 2018 and consisted of our available cash of $162 million at December 31, 2017, or $0.35 per limited partner unit. Of this distribution, $130 million was paid in cash, $31 million was distributed in i-units to our i-unitholder, Enbridge Management, and due to the i-unit distribution, $0.6 million was retained from our General Partner from amounts otherwise distributable to it in respect of its general partner interest and limited partner interest to maintain its 2% general partner interest.
DISTRIBUTION TO SERIES EA INTERESTS
On January 31, 2018, the board of directors of Enbridge Management, acting on behalf of Enbridge Pipelines (Lakehead) L.L.C., the managing general partner of the OLP and a holder of the Series EA interests, declared a distribution payable to the holders of the Series EA general and limited partner interests. The OLP paid $50 million to the noncontrolling interest in the Series EA, while $34 million was paid to us.
DISTRIBUTION TO SERIES ME INTERESTS
On January 31, 2018, the board of directors of Enbridge Management, acting on behalf of Enbridge Pipelines (Lakehead) L.L.C., the managing general partner of the OLP and a holder of the Series ME interests, declared a
64
distribution payable to the holders of the Series ME general and limited partner interests. The OLP paid $44 million to the noncontrolling interest in the Series ME, while $15 million was paid to us.
65
ITEM 7A. QUANTITATIVE AND QUALITATIVE DISCLOSURES ABOUT MARKET RISK
INTEREST RATE RISK
We utilize both fixed and variable interest rate debt and are exposed to market risk resulting from the variable interest rates on our Credit Facility. To the extent that we frequently issue and re-issue commercial paper at short-term interest rates and have amounts drawn under our Credit Facility at floating rates of interest, our earnings and cash flows are exposed to changes in interest rates. This exposure is managed through periodically refinancing floating-rate bank debt with long-term fixed rate debt and through the use of interest rate derivative financial instruments including futures, forwards, swaps, options and other financial instruments with similar characteristics. We do not have any material exposure to movements in foreign exchange rates as virtually all of our revenues and expenses are denominated in USD. To the extent that a material foreign exchange exposure arises, we intend to hedge such exposure using derivative financial instruments.
Our net income and cash flows are subject to volatility stemming from changes in interest rates on our variable rate debt obligations. Our interest rate risk exposure does not exist within our segment, but exists at the corporate level where our fixed and variable rate debt obligations are issued. We use derivative financial instruments (i.e., futures, forwards, swaps, options and other financial instruments with similar characteristics) to manage the risks associated with market fluctuations in interest rates, as well as to reduce volatility to our cash flows. Based on our risk management policies, all of our derivative financial instruments are employed in connection with an underlying asset, liability and/or forecasted transaction and are not entered into with the objective of speculating.
The table below provides information about our derivative financial instruments that we use to hedge the interest payments on our variable rate debt obligations that are sensitive to changes in interest rates and to lock in the interest rate on anticipated issuances of debt in the future. For interest rate swaps, the table presents notional amounts, the rates charged on the underlying notional amounts and weighted average interest rates paid by expected maturity dates. Notional amounts are used to calculate the contractual payments to be exchanged under the contract. Weighted average variable rates are based on implied forward rates in the yield curve at December 31, 2017.
Date of Maturity & Contract Type | Accounting Treatment | Notional | Average Fixed Rate(1) | Fair Value(2) at | |||||||||||||
December 31, 2017 | December 31, 2016 | ||||||||||||||||
(in millions, except rates) | |||||||||||||||||
Contracts matured in 2017 | |||||||||||||||||
Interest Rate Swaps – Pay Fixed | Cash Flow Hedge | $ | 500 | 2.21 | % | $ | — | $ | (1 | ) | |||||||
Contracts maturing in 2018 | |||||||||||||||||
Interest Rate Swaps – Pay Fixed | Cash Flow Hedge | $ | 810 | 2.24 | % | $ | — | $ | (9 | ) | |||||||
Contracts maturing in 2019 | |||||||||||||||||
Interest Rate Swaps – Pay Fixed | Cash Flow Hedge | $ | 620 | 2.96 | % | $ | (6 | ) | $ | (7 | ) | ||||||
Contracts settled prior to maturity(3) | |||||||||||||||||
2017 - Pre-issuance Hedges | Cash Flow Hedge | $ | 1,000 | 4.07 | % | $ | — | $ | (136 | ) | |||||||
2018 - Pre-issuance Hedges | Cash Flow Hedge | $ | 350 | 3.08 | % | $ | — | $ | (13 | ) | |||||||
____________
(1) | Interest rate derivative contracts are based on the one-month or three-month LIBOR. |
(2) | The fair value is determined from quoted market prices at December 31, 2017 and 2016, respectively, discounted using the swap rate for the respective periods to consider the time value of money. Fair values are presented in millions of dollars and exclude credit valuation adjustment gains of approximately nil and $1 million at December 31, 2017 and 2016, respectively. |
(3) | Includes reclassification of $168 million loss related to the termination of long-term interest rate swaps as not highly probable to issue long-term debt. |
COMMODITY PRICE RISK
As a result of the Midcoast sale, our net income and cash flows are no longer subject to volatility stemming from fluctuation in the prices of natural gas, NGLs, condensates and fractionation margins.
66
Our net income and cash flows are subject to volatility stemming from fluctuations in commodity prices of crude oil. We use derivative financial instruments, such as futures, forwards, swaps, options and other financial instruments with similar characteristics, to manage the risks associated with market fluctuations in interest rates and commodity prices, as well as to reduce volatility in our cash flows. Actively traded external market quotes, data from pricing services and published indices are used to value our derivative instruments. Our portfolio of derivative financial instruments is largely comprised of crude oil sales. Based on our risk management policies, all of our derivative financial instruments are employed in connection with an underlying asset, liability and/or forecasted transaction and are not entered into with the objective of speculating on commodity prices.
The following transaction types do not qualify for hedge accounting and contribute to the volatility of our income and cash flows:
Commodity Price Exposures:
• | Crude Oil Contracts — We use forward contracts to hedge a portion of the crude oil length inherent in the operation of our pipelines, which we subsequently sell at market rates. These hedges create a fixed sales price for the crude oil that we will receive in the future. We elected not to designate these derivative financial instruments as cash flow hedges, and as a result, will experience some additional volatility associated with fluctuations in crude oil prices until the underlying transactions are settled or offset. |
In all instances related to the commodity exposures described above, the underlying physical purchase and sale of the commodity is accounted for on a historical cost or net realizable value basis.
The following table provides summarized information about the fair values of expected cash flows of our outstanding commodity based swaps and physical contracts at December 31, 2017 and 2016.
At December 31, 2017 | At December 31, 2016 | |||||||||||||||||||||||||||
Wtd. Average Price(2) | Fair Value(3) | Fair Value(3) | ||||||||||||||||||||||||||
Commodity | Notional(1) | Receive | Pay | Asset | Liability | Asset | Liability | |||||||||||||||||||||
Portion of contracts matured in 2017 | ||||||||||||||||||||||||||||
Swaps: | ||||||||||||||||||||||||||||
Receive fixed/pay variable | Crude Oil | 123,832 | $ | 51.91 | $ | 51.98 | $ | — | $ | — | $ | — | $ | (2 | ) | |||||||||||||
Portion of contracts maturing in 2018 | ||||||||||||||||||||||||||||
Swaps: | ||||||||||||||||||||||||||||
Receive fixed/pay variable | Crude Oil | 498,955 | $ | 50.71 | $ | 59.31 | $ | — | $ | (4 | ) | $ | — | $ | — | |||||||||||||
Portion of contracts maturing in 2019 | ||||||||||||||||||||||||||||
Swaps: | ||||||||||||||||||||||||||||
Receive fixed/pay variable | Crude Oil | 353,685 | $ | 55.22 | $ | 55.86 | $ | — | $ | (1 | ) | $ | — | $ | — | |||||||||||||
____________
(1) | Volumes of crude oil are measured in barrel of liquids (Bbl). |
(2) | Weighted average prices received and paid are in $/Bbl for crude oil. |
(3) | The fair value is determined based on quoted market prices at December 31, 2017 and 2016, respectively, discounted using the swap rate for the respective periods to consider the time value of money. Fair values exclude credit valuation adjustment gains of nil at December 31, 2017 and 2016, as well as cash collateral received. |
COUNTERPARTY CREDIT RISK
We are subject to the risk of loss resulting from the possibility that the counterparties of our hedging contracts may prove unable or unwilling to perform their obligations under the contracts, particularly during periods of weak and volatile economic conditions. The ISDA® agreements and associated credit support, which govern our financial derivative transactions, contain no credit rating downgrade triggers that would accelerate the maturity dates of our outstanding transactions. A change in ratings is not an event of default under these instruments, and the maintenance of a specific minimum credit rating is not a condition to transacting under the ISDA® agreements. In the event of a credit downgrade, additional collateral may be required to be posted under the agreement if we are in a liability position
67
to our counterparty, but the agreement will not automatically terminate and require immediate settlement of all future amounts due.
The ISDA® agreements, in combination with our master netting agreements, and credit arrangements governing our interest rate and commodity swaps require that collateral be posted per tiered contractual thresholds based on the credit rating of each counterparty. These agreements will require additional collateral postings of up to 100% on net liability positions in the event of a credit downgrade below investment grade. When we are holding an asset position, our counterparties are likewise required to post collateral on their liability (our asset) exposures, also determined by tiered contractual collateral thresholds. Automatic termination clauses which exist are related only to non-performance activities, such as the refusal to post collateral when contractually required to do so.
The table below summarizes our derivative balances by counterparty credit quality (negative amounts represent our net obligations to pay the counterparty):
December 31, | |||||||
2017 | 2016 | ||||||
(in millions) | |||||||
Counterparty Credit Quality(1) | |||||||
AA | $ | (4 | ) | $ | (79 | ) | |
A | (7 | ) | (59 | ) | |||
Lower than A | — | (29 | ) | ||||
$ | (11 | ) | $ | (167 | ) | ||
____________
(1) | As determined by nationally-recognized statistical ratings organizations. |
68
ITEM 8. FINANCIAL STATEMENTS AND SUPPLEMENTARY DATA
INDEX TO CONSOLIDATED FINANCIAL STATEMENTS,
SUPPLEMENTARY INFORMATION AND
CONSOLIDATED FINANCIAL STATEMENT SCHEDULES
ENBRIDGE ENERGY PARTNERS, L.P.
Page | |
69
REPORT OF INDEPENDENT REGISTERED PUBLIC ACCOUNTING FIRM
To the Board of Directors and Unitholders of Enbridge Energy Partners, L.P.:
Opinions on the Financial Statements and Internal Control over Financial Reporting
We have audited the accompanying consolidated statements of financial position of Enbridge Energy Partners, L.P. and its subsidiaries (the “Partnership”) as of December 31, 2017 and 2016, and the related consolidated statements of income, of comprehensive income, of partners’ capital and of cash flows for each of the three years in the period ended December 31, 2017, including the related notes (collectively referred to as the “consolidated financial statements”). We also have audited the Partnership’s internal control over financial reporting as of December 31, 2017, based on criteria established in Internal Control - Integrated Framework (2013) issued by the Committee of Sponsoring Organizations of the Treadway Commission (“COSO”).
In our opinion, the consolidated financial statements referred to above present fairly, in all material respects, the financial position of the Partnership as of December 31, 2017 and 2016, and the results of their operations and their cash flows for each of the three years in the period ended December 31, 2017 in conformity with accounting principles generally accepted in the United States of America. Also in our opinion, the Partnership maintained, in all material respects, effective internal control over financial reporting as of December 31, 2017, based on criteria established in Internal Control - Integrated Framework (2013) issued by the COSO.
Basis for Opinions
The Partnership’s management is responsible for these consolidated financial statements, for maintaining effective internal control over financial reporting, and for its assessment of the effectiveness of internal control over financial reporting, included in Management’s Report on Internal Control over Financial Reporting appearing under Item 9A of the Partnership’s 2017 Annual Report on Form 10-K. Our responsibility is to express opinions on the Partnership’s consolidated financial statements and on the Partnership’s internal control over financial reporting based on our audits. We are a public accounting firm registered with the Public Company Accounting Oversight Board (United States) (“PCAOB”) and are required to be independent with respect to the Partnership in accordance with the U.S. federal securities laws and the applicable rules and regulations of the Securities and Exchange Commission and the PCAOB.
We conducted our audits in accordance with the standards of the PCAOB. Those standards require that we plan and perform the audits to obtain reasonable assurance about whether the consolidated financial statements are free of material misstatement, whether due to error or fraud, and whether effective internal control over financial reporting was maintained in all material respects.
Our audits of the consolidated financial statements included performing procedures to assess the risks of material misstatement of the consolidated financial statements, whether due to error or fraud, and performing procedures that respond to those risks. Such procedures included examining, on a test basis, evidence regarding the amounts and disclosures in the consolidated financial statements. Our audits also included evaluating the accounting principles used and significant estimates made by management, as well as evaluating the overall presentation of the consolidated financial statements. Our audit of internal control over financial reporting included obtaining an understanding of internal control over financial reporting, assessing the risk that a material weakness exists, and testing and evaluating the design and operating effectiveness of internal control based on the assessed risk. Our audits also included performing such other procedures as we considered necessary in the circumstances. We believe that our audits provide a reasonable basis for our opinions.
Definition and Limitations of Internal Control over Financial Reporting
A company’s internal control over financial reporting is a process designed to provide reasonable assurance regarding the reliability of financial reporting and the preparation of financial statements for external purposes in accordance with generally accepted accounting principles. A company’s internal control over financial reporting includes those policies and procedures that (i) pertain to the maintenance of records that, in reasonable detail, accurately and fairly reflect the transactions and dispositions of the assets of the company; (ii) provide reasonable assurance that transactions are recorded as necessary to permit preparation of financial statements in accordance with generally accepted accounting principles, and that receipts and expenditures of the company are being made only in accordance with authorizations of management and directors of the company; and (iii) provide reasonable assurance regarding
70
prevention or timely detection of unauthorized acquisition, use, or disposition of the company’s assets that could have a material effect on the financial statements.
Because of its inherent limitations, internal control over financial reporting may not prevent or detect misstatements. Also, projections of any evaluation of effectiveness to future periods are subject to the risk that controls may become inadequate because of changes in conditions, or that the degree of compliance with the policies or procedures may deteriorate.
/s/PricewaterhouseCoopers LLP
Houston, Texas
February 15, 2018
We have served as the Partnership’s auditor since 1991.
71
ENBRIDGE ENERGY PARTNERS, L.P.
CONSOLIDATED STATEMENTS OF INCOME
(in millions, except per unit amounts)
Year ended December 31, | 2017 | 2016 | 2015 | ||||||||
Operating revenues: | |||||||||||
Transportation and other services | $ | 2,316 | $ | 2,409 | $ | 2,173 | |||||
Transportation and other services – affiliate | 112 | 107 | 130 | ||||||||
Total operating revenues | 2,428 | 2,516 | 2,303 | ||||||||
Operating expenses: | |||||||||||
Operating and administrative | 355 | 283 | 344 | ||||||||
Operating and administrative – affiliate | 294 | 291 | 294 | ||||||||
Power | 290 | 277 | 260 | ||||||||
Depreciation and amortization | 442 | 427 | 378 | ||||||||
Gain on sale of assets | (74 | ) | — | — | |||||||
Asset impairment | — | 757 | 63 | ||||||||
Total operating expenses | 1,307 | 2,035 | 1,339 | ||||||||
Operating income | 1,121 | 481 | 964 | ||||||||
Interest expense, net | (525 | ) | (413 | ) | (292 | ) | |||||
Allowance for equity used during construction | 47 | 46 | 70 | ||||||||
Other income | 57 | 1 | — | ||||||||
Income before income taxes | 700 | 115 | 742 | ||||||||
Income tax benefit (expense) | 8 | 1 | (3 | ) | |||||||
Income from continuing operations | 708 | 116 | 739 | ||||||||
Loss from discontinued operations, net of tax | (57 | ) | (157 | ) | (285 | ) | |||||
Net income (loss) | 651 | (41 | ) | 454 | |||||||
Net income attributable to noncontrolling interests | (369 | ) | (26 | ) | (221 | ) | |||||
Series 1 preferred unit distributions | (29 | ) | (90 | ) | (90 | ) | |||||
Accretion of discount on Series 1 preferred units | (8 | ) | (5 | ) | (11 | ) | |||||
Net income (loss) - controlling interests | 245 | (162 | ) | 132 | |||||||
Net income (loss) attributable to common units and i-units: | |||||||||||
Income (loss) from continuing operations | 237 | (268 | ) | 119 | |||||||
Loss from discontinued operations | (37 | ) | (109 | ) | (204 | ) | |||||
Net income (loss) attributable to common units and i-units | $ | 200 | $ | (377 | ) | $ | (85 | ) | |||
Net income (loss) per common unit and i-unit (basic and diluted): | |||||||||||
Income (loss) from continuing operations | 0.60 | (0.77 | ) | 0.35 | |||||||
Loss from discontinued operations | (0.10 | ) | (0.31 | ) | (0.60 | ) | |||||
Net income (loss) per common unit and i-unit | $ | 0.50 | $ | (1.08 | ) | $ | (0.25 | ) | |||
Weighted average common units and i-units outstanding (basic and diluted) | 400 | 348 | 339 | ||||||||
Cash Distributions paid per limited partner unit outstanding | 1.633 | 2.332 | 2.306 | ||||||||
The accompanying notes are an integral part of these consolidated financial statements.
72
ENBRIDGE ENERGY PARTNERS, L.P.
CONSOLIDATED STATEMENTS OF COMPREHENSIVE INCOME
(in millions)
For the year ended December 31, | |||||||||||
2017 | 2016 | 2015 | |||||||||
Net income (loss) | $ | 651 | $ | (41 | ) | $ | 454 | ||||
Other comprehensive income (loss), net of tax | |||||||||||
Change in cash flow hedges | (68 | ) | (8 | ) | (186 | ) | |||||
Reclassification to earnings on cash flow hedges | 208 | 39 | 22 | ||||||||
Other comprehensive income (loss), net of tax | 140 | 31 | (164 | ) | |||||||
Comprehensive income (loss) | 791 | (10 | ) | 290 | |||||||
Comprehensive income attributable to noncontrolling interests | (369 | ) | (26 | ) | (221 | ) | |||||
Series 1 preferred unit distributions | (29 | ) | (90 | ) | (90 | ) | |||||
Accretion of discount on Series 1 preferred units | (8 | ) | (5 | ) | (11 | ) | |||||
Other comprehensive loss allocated to noncontrolling interest | — | — | 6 | ||||||||
Comprehensive income (loss) attributable to common units and i-units | $ | 385 | $ | (131 | ) | $ | (26 | ) | |||
The accompanying notes are an integral part of these consolidated financial statements.
73
ENBRIDGE ENERGY PARTNERS, L.P.
CONSOLIDATED STATEMENTS OF CASH FLOWS
(in millions)
For the year ended December 31, | |||||||||||
2017 | 2016 | 2015 | |||||||||
Operating activities: | |||||||||||
Net income from continuing operations | $ | 708 | $ | 116 | $ | 739 | |||||
Adjustments to reconcile net income to net cash provided by operating activities: | |||||||||||
Depreciation and amortization | 442 | 427 | 378 | ||||||||
Changes in unrealized (gain) loss on derivative instruments, net | (47 | ) | 16 | (83 | ) | ||||||
Environmental costs, net of recoveries | 14 | 10 | 6 | ||||||||
Distributions from investments in joint venture | 52 | — | — | ||||||||
Equity earnings from investments in joint venture | (52 | ) | — | — | |||||||
Gain on sale of assets | (74 | ) | — | — | |||||||
Allowance for equity used during construction | (47 | ) | (46 | ) | (70 | ) | |||||
Amortization of debt issuance and hedging costs | 37 | 40 | 17 | ||||||||
Asset impairment | — | 757 | 63 | ||||||||
Other | (4 | ) | (1 | ) | 21 | ||||||
Settlement of interest rate derivatives | — | — | (238 | ) | |||||||
Changes in operating assets and liabilities | (358 | ) | (130 | ) | (9 | ) | |||||
Net cash provided by operating activities | 671 | 1,189 | 824 | ||||||||
Net cash (used in) provided by discontinued operations | (171 | ) | 227 | 207 | |||||||
Investing activities: | |||||||||||
Capital expenditures | (606 | ) | (1,024 | ) | (1,926 | ) | |||||
Changes in restricted cash | 13 | 3 | 37 | ||||||||
Proceeds from the sale of assets | 329 | — | — | ||||||||
Proceeds from the sale of Midcoast assets | 1,310 | — | — | ||||||||
Investments in joint venture | (1,598 | ) | — | — | |||||||
Distributions from investments in joint ventures in excess of cumulative earnings | 32 | — | — | ||||||||
Asset acquisitions | — | — | (41 | ) | |||||||
Other | (4 | ) | (9 | ) | 1 | ||||||
Net cash used in investing activities | (524 | ) | (1,030 | ) | (1,929 | ) | |||||
Net cash used in discontinued operations | (14 | ) | (37 | ) | (197 | ) | |||||
Financing activities: | |||||||||||
Redemption of Series 1 preferred units | (1,200 | ) | — | — | |||||||
Payment of Series 1 preferred unit dividends | (357 | ) | — | — | |||||||
Net proceeds from Class A issuances | 1,225 | — | 295 | ||||||||
Distributions to partners | (605 | ) | (798 | ) | (771 | ) | |||||
Repayments to General Partner and affiliates | (1,640 | ) | — | (306 | ) | ||||||
Repayments of Debt | — | (300 | ) | — | |||||||
Borrowings from General Partner and affiliates | 1,500 | 750 | — | ||||||||
Net (repayments) borrowings under credit facilities | (1,115 | ) | 155 | (50 | ) | ||||||
Net commercial paper borrowings (repayments) | 910 | 66 | (286 | ) | |||||||
Acquisition of noncontrolling interest in subsidiary | (360 | ) | — | — | |||||||
Sale of noncontrolling interest in subsidiary | 450 | — | — | ||||||||
Contributions from noncontrolling interests | 1,485 | 99 | 822 | ||||||||
Distributions to noncontrolling interest | (504 | ) | (159 | ) | (242 | ) | |||||
Proceeds from issuance of debt, net of discounts | — | — | 1,600 | ||||||||
Debt issuance costs | — | — | (25 | ) | |||||||
Other | (2 | ) | (1 | ) | — | ||||||
Net cash provided by (used in) financing activities | (213 | ) | (188 | ) | 1,037 | ||||||
Net cash (used in) provided by discontinued operations | 229 | (201 | ) | 8 | |||||||
Net decrease in cash and cash equivalents | (66 | ) | (29 | ) | (68 | ) | |||||
Cash disposed as part of the Midcoast sale | (51 | ) | — | — | |||||||
Cash and cash equivalents at beginning of year - continuing operations | 101 | 130 | 198 | ||||||||
Cash and cash equivalents at beginning of year - discontinued operations | 7 | 18 | — | ||||||||
Cash and cash equivalents at end of year - continuing operations | $ | 35 | $ | 101 | $ | 130 | |||||
Cash and cash equivalents at end of year - discontinued operations | $ | — | $ | 7 | $ | 18 | |||||
Supplementary cash flow information(1) | |||||||||||
Interest paid | $ | 543 | $ | 371 | $ | 350 | |||||
Property, plant and equipment non-cash accruals | $ | 79 | $ | 100 | $ | 311 | |||||
(1) No income taxes were paid for the year ending December 31, 2017, 2016, and 2015. | |||||||||||
The accompanying notes are an integral part of these consolidated financial statements.
74
ENBRIDGE ENERGY PARTNERS, L.P.
CONSOLIDATED STATEMENTS OF FINANCIAL POSITION
(in millions, except number of units)
December 31, | |||||||
2017 | 2016 | ||||||
ASSETS | |||||||
Current assets: | |||||||
Cash and cash equivalents | $ | 35 | $ | 101 | |||
Restricted cash | — | 14 | |||||
Receivables, trade and other | 65 | 6 | |||||
Due from General Partner and affiliates | 101 | 88 | |||||
Accrued receivables | 105 | 19 | |||||
Other current assets | 24 | 34 | |||||
Current assets related to discontinued operations | — | 139 | |||||
330 | 401 | ||||||
Property, plant and equipment, net | 12,896 | 12,608 | |||||
Equity investment in joint venture | 1,565 | — | |||||
Other assets, net | 37 | 119 | |||||
Assets held for sale | — | 207 | |||||
Non-current assets related to discontinued operations | — | 4,775 | |||||
Total assets | $ | 14,828 | $ | 18,110 | |||
LIABILITIES AND PARTNERS’ CAPITAL | |||||||
Current liabilities: | |||||||
Accounts payable and other | $ | 173 | $ | 348 | |||
Due to General Partner and affiliates | 48 | 175 | |||||
Interest payable | 85 | 90 | |||||
Environmental liabilities | 23 | 100 | |||||
Property and other taxes payable | 106 | 89 | |||||
Current portion of long-term debt | 500 | — | |||||
Current liabilities related to discontinued operations | — | 300 | |||||
935 | 1,102 | ||||||
Long-term debt | 6,366 | 7,066 | |||||
Loans from General Partner and affiliate | 610 | 750 | |||||
Due to General Partner and affiliates | — | 328 | |||||
Other long-term liabilities | 178 | 197 | |||||
Non-current liabilities related to discontinued operations | — | 844 | |||||
8,089 | 10,287 | ||||||
Commitments and contingencies | |||||||
Partners’ capital: | |||||||
Series 1 preferred units (48,000,000 authorized and issued at December 31, 2016) | — | 1,192 | |||||
Class D units (66,100,000 authorized and issued at December 31, 2016) | — | 2,518 | |||||
Class E units (18,114,975 authorized and issued at December 31, 2017 and 2016) | 774 | 778 | |||||
Class A common units (326,517,110 and 262,208,428 outstanding at December 31, 2017 and 2016, respectively) | 860 | — | |||||
Class B common units (7,825,500 authorized and issued at December 31, 2017 and 2016) | — | — | |||||
i-units (89,798,818 and 81,857,168 authorized and issued at December 31, 2017 and 2016, respectively) | — | — | |||||
Class F units (1,000 authorized and issued at December 31, 2017) | 267 | — | |||||
Incentive distribution units (1,000 authorized and issued at December 31, 2016) | — | 495 | |||||
General Partner | 68 | (667 | ) | ||||
Accumulated other comprehensive loss | (199 | ) | (339 | ) | |||
Total Enbridge Energy Partners, L.P. partners’ capital | 1,770 | 3,977 | |||||
Noncontrolling interests | 4,969 | 3,543 | |||||
Noncontrolling interests - discontinued operations | — | 303 | |||||
Total Partners’ capital | 6,739 | 7,823 | |||||
Total Liabilities and Partners' capital | $ | 14,828 | $ | 18,110 | |||
Note 10 - Variable Interest Entities (VIEs)
The accompanying notes are an integral part of these consolidated financial statements.
75
ENBRIDGE ENERGY PARTNERS, L.P.
CONSOLIDATED STATEMENTS OF PARTNERS CAPITAL
(in millions)
For the year ended December, 31 | ||||||||||||
2017 | 2016 | 2015 | ||||||||||
Series 1 preferred units: | ||||||||||||
Beginning balance | $ | 1,192 | $ | 1,187 | $ | 1,176 | ||||||
Redemption of preferred units | (1,200 | ) | — | — | ||||||||
Net income | 29 | 90 | 90 | |||||||||
Distribution payable | (29 | ) | (90 | ) | (90 | ) | ||||||
Accretion of discount on preferred units | 8 | 5 | 11 | |||||||||
Ending balance | — | 1,192 | 1,187 | |||||||||
Class D units: | ||||||||||||
Beginning balance | 2,518 | 2,518 | 2,517 | |||||||||
Waiver of Class D units | (2,479 | ) | — | — | ||||||||
Net income | — | 154 | 153 | |||||||||
Distributions | (39 | ) | (154 | ) | (152 | ) | ||||||
Ending balance | — | 2,518 | 2,518 | |||||||||
Class E units: | ||||||||||||
Beginning balance | 778 | 778 | — | |||||||||
Net income | 25 | 42 | 42 | |||||||||
Issuance of Class E Units | — | — | 768 | |||||||||
Distributions | (29 | ) | (42 | ) | (32 | ) | ||||||
Ending balance | 774 | 778 | 778 | |||||||||
Class A common units: | ||||||||||||
Beginning balance | — | — | 236 | |||||||||
Net income | 126 | 612 | 311 | |||||||||
Issuances of units | 1,200 | — | 289 | |||||||||
Allocation of fair value to Class D and Class E units | — | — | (236 | ) | ||||||||
Distributions | (496 | ) | (612 | ) | (600 | ) | ||||||
Sale of noncontrolling interest in subsidiary | 29 | — | — | |||||||||
Other | 1 | — | — | |||||||||
Ending balance | 860 | — | — | |||||||||
Class B common units: | ||||||||||||
Beginning balance | — | — | — | |||||||||
Net income | 12 | 18 | 18 | |||||||||
Sale of noncontrolling interest in subsidiary | 1 | — | — | |||||||||
Distributions | (13 | ) | (18 | ) | (18 | ) | ||||||
Ending balance | — | — | — | |||||||||
i-units: | ||||||||||||
Beginning balance | — | 213 | 713 | |||||||||
Net loss | (9 | ) | (213 | ) | (380 | ) | ||||||
Allocation of fair value to Class D and Class E units | — | — | (120 | ) | ||||||||
Sale of noncontrolling interest in subsidiary | 9 | — | — | |||||||||
Ending balance | — | — | 213 | |||||||||
Class F units: | ||||||||||||
Beginning balance | — | — | — | |||||||||
Issuance of Class F units | 263 | — | — | |||||||||
Net income | 15 | — | — | |||||||||
Distributions | (11 | ) | — | — | ||||||||
Ending balance | 267 | — | — | |||||||||
The accompanying notes are an integral part of these consolidated financial statements.
76
ENBRIDGE ENERGY PARTNERS, L.P.
CONSOLIDATED STATEMENTS OF PARTNERS CAPITAL – (continued)
(millions of dollars)
For the year ended December, 31 | ||||||||||||
2017 | 2016 | 2015 | ||||||||||
Incentive distribution units: | ||||||||||||
Beginning balance | 495 | 495 | 493 | |||||||||
Waiver of incentive distribution units | (490 | ) | — | — | ||||||||
Net income | — | 21 | 19 | |||||||||
Distributions | (5 | ) | (21 | ) | (17 | ) | ||||||
Ending balance | — | 495 | 495 | |||||||||
General Partner: | ||||||||||||
Beginning balance | (667 | ) | 147 | 198 | ||||||||
Net income (loss) | 76 | (797 | ) | (32 | ) | |||||||
Issuances of units | 24 | — | 6 | |||||||||
Allocation of fair value to Class D and Class E units | — | — | (8 | ) | ||||||||
Waiver of Class D units and incentive distribution units and creation of F units | 2,969 | — | — | |||||||||
Issuance of Class F units | (263 | ) | — | — | ||||||||
Contributions | 68 | — | — | |||||||||
Allocation of distributions to General and limited partner | (1 | ) | — | — | ||||||||
Sale of Midcoast assets | (2,127 | ) | — | — | ||||||||
Distributions | (12 | ) | (17 | ) | (17 | ) | ||||||
Sale of noncontrolling interest in subsidiary | 1 | — | — | |||||||||
Ending balance | 68 | (667 | ) | 147 | ||||||||
Accumulated other comprehensive income: | ||||||||||||
Beginning balance | (339 | ) | (370 | ) | (206 | ) | ||||||
Changes in fair value of derivative financial instruments reclassified to earnings | 208 | 39 | 22 | |||||||||
Changes in fair value of derivative financial instruments recognized in other comprehensive loss | (68 | ) | (8 | ) | (186 | ) | ||||||
Ending balance | (199 | ) | (339 | ) | (370 | ) | ||||||
Noncontrolling interests: | ||||||||||||
Beginning balance | 3,846 | 3,944 | 3,609 | |||||||||
Capital contributions | 1,504 | 118 | 863 | |||||||||
Allocation of fair value of Class E units | — | — | (404 | ) | ||||||||
Sale of noncontrolling interest in subsidiary | 411 | — | — | |||||||||
Acquisition of noncontrolling interest in subsidiary | (360 | ) | — | — | ||||||||
Sale of Midcoast assets | (297 | ) | — | — | ||||||||
Net income | 369 | 26 | 221 | |||||||||
Other comprehensive income (loss), net of tax | — | — | (6 | ) | ||||||||
Distributions to noncontrolling interests | (504 | ) | (242 | ) | (339 | ) | ||||||
Ending balance | 4,969 | 3,846 | 3,944 | |||||||||
Total partners’ capital at end of year | $ | 6,739 | $ | 7,823 | $ | 8,912 | ||||||
The accompanying notes are an integral part of these consolidated financial statements.
77
ENBRIDGE ENERGY PARTNERS, L.P.
NOTES TO THE CONSOLIDATED FINANCIAL STATEMENTS
1. BUSINESS OVERVIEW
General Business Description
We, together with our consolidated subsidiaries, are a publicly-traded Delaware limited partnership. We are a geographically and operationally diversified organization that provides crude oil and liquid petroleum gathering, transportation and storage services. We hold our assets in a series of limited liability companies and limited partnerships that we own either directly or indirectly. Our Class A common units are traded on the NYSE, under the symbol “EEP.”
We were formed in 1991 by our General Partner, which is an indirect, wholly-owned subsidiary of Enbridge. We own and operate the crude oil and liquid petroleum transportation assets of the OLP, which owns the United States portion of a crude oil and liquid petroleum pipeline system extending from western Canada through the upper and lower Great Lakes region of the United States to eastern Canada.
Midcoast Energy Partners, L.P.
On April 27, 2017, MEP completed its merger with our General Partner under the terms of the Merger Agreement previously announced on January 26, 2017. Our General Partner acquired for cash, subject to terms and conditions thereof, all of the outstanding publicly held Class A common units of MEP at a price of $8 per common unit for an aggregate transaction value of $170 million. The public interest acquired by our General Partner represented an approximate 25% effective interest in our natural gas gathering and processing business. MEP ceased to be a publicly traded entity.
On June 28, 2017, we sold all of our ownership interest in our Midcoast gas gathering and processing business to our General Partner (the Midcoast sale). The sale of this ownership interest represents a strategic shift in our business and meets the criteria for classification as discontinued operations and as a result, the results of operations, cash flows and financial position of our natural gas business for the current and prior periods are reflected as discontinued operations. For further information refer to Note 7 - Dispositions and Discontinued Operations.
Enbridge Energy Management, L.L.C.
Enbridge Management is a Delaware limited liability company that was formed in May 2002. Our General Partner, through its direct ownership of the voting shares of Enbridge Management, elects all of its directors. Enbridge Management’s listed shares are traded on the NYSE under the symbol “EEQ.” Enbridge Management owns all of a special class of our limited partner interests that we refer to as i-units and derives all of its earnings from its investment in us.
Enbridge Management’s principal activity is managing our business and affairs pursuant to a delegation of control agreement among our General Partner, Enbridge Management and us. The delegation of control agreement provides that Enbridge Management will not amend or propose to amend our partnership agreement, allow a merger or consolidation involving us, allow a sale or exchange of all or substantially all of our assets or dissolve or liquidate us without the approval of our General Partner. In accordance with its limited liability company agreement, Enbridge Management’s activities are restricted to being our limited partner and managing our business and affairs.
Enbridge Inc.
Enbridge is the indirect parent of our General Partner, and its common shares are publicly traded on the NYSE in the United States and the Toronto Stock Exchange (TSX), in Canada under the symbol “ENB.” Enbridge is an energy transportation and distribution company, with a focus on crude oil and liquids pipelines, natural gas pipelines and natural gas distribution. At December 31, 2017 and 2016, Enbridge and its consolidated subsidiaries held an effective 34.6% and 41.7% outstanding ownership interest in us, respectively, through its ownership in Enbridge Management and our General Partner.
SEGMENTS AND TRANSACTIONS
As noted above, On June 28, 2017, we completed the Midcoast sale which resulted in the discontinuation of the natural gas business and the elimination of our Natural Gas segment. As a result, we conduct our business through one operating segment: Liquids
Liquids
78
ENBRIDGE ENERGY PARTNERS, L.P.
NOTES TO THE CONSOLIDATED FINANCIAL STATEMENTS
1. BUSINESS OVERVIEW – (continued)
Our Liquids segment includes the Lakehead System, Mid-Continent Systems and Bakken Assets. Our Lakehead System consists of a series of interstate common carrier crude oil and liquid petroleum pipelines that are regulated by the FERC, and storage assets, all of which are located in the Great Lakes and Midwest regions of the United States. Our Lakehead System, together with the Enbridge system in Canada owned by Enbridge, forms the longest liquid petroleum pipeline in the world. The Lakehead System, consists of approximately 4,212 miles of pipe and 74 pump stations, has been in operation for more than 60 years and is the primary transporter of crude oil and liquid petroleum from western Canada to the United States. The Lakehead System primarily serves all the major refining centers in the Great Lakes and Midwest regions of the United States and the province of Ontario, Canada. Our Bakken Assets which contain our North Dakota crude oil system is approximately 660 miles long, has 12 pump stations, multiple delivery points and storage facilities. The North Dakota System connects directly into the Lakehead System in the state of Minnesota. Our Mid-Continent System consists of approximately 20 million barrels of storage capacity, which serve refineries in the United States Mid-Continent region from Cushing, Oklahoma.
The remainder of our business operation is presented as "Other," and consists of unallocated corporate costs.
2. SIGNIFICANT ACCOUNTING POLICIES
Basis of Presentation and Use of Estimates
These consolidated financial statements are prepared in accordance with U.S. GAAP. The preparation of financial statements in conformity with U.S. GAAP requires management to make estimates and assumptions that affect the reported amounts of assets, liabilities, revenues and expenses, as well as the disclosure of contingent assets and liabilities in the consolidated financial statements. We regularly evaluate these estimates utilizing historical experience, consultation with experts and other methods we consider reasonable in the circumstances. Nevertheless, actual results may differ significantly from these estimates. We record the effect of any revisions to these estimates in our consolidated financial statements in the period in which the facts that give rise to the revision become known. Amounts are stated in United States dollars unless otherwise noted.
Principles of Consolidation
The consolidated financial statements include our accounts and accounts of our subsidiaries and VIEs for which we are the primary beneficiary. Upon inception of a contractual agreement, we perform an assessment to determine whether the arrangement contains a variable interest in a legal entity and whether that legal entity is a VIE. Where we conclude we are the primary beneficiary of a VIE, we consolidate the accounts of that VIE.
We assess all aspects of our interests in an entity and use judgment when determining if we are the primary beneficiary. The primary beneficiary has both the power to direct the activities of the VIE that most significantly impact the entity’s economic performance and the obligation to absorb losses or the right to receive benefits from the VIE that could potentially be significant to the VIE. Other qualitative factors that are considered include decision-making responsibilities, the VIE capital structure, risk and rewards sharing, contractual agreements with the VIE, voting rights and level of involvement of other parties. A reassessment of the primary beneficiary conclusion is conducted when there are changes in the facts and circumstances related to a VIE.
All significant intercompany accounts and transactions are eliminated upon consolidation. Ownership interests in subsidiaries represented by other parties that do not control the entity are presented in the consolidated financial statements as activities and balances attributable to NCI. Investments and entities over which we exercise significant influence are accounted for using the equity method.
Regulation
Our interstate liquids pipelines are subject to regulation by FERC and various state authorities. Regulatory bodies exercise statutory authority over matters such as construction, rates and ratemaking and agreements with customers. For example, the recovery of construction, operating and other costs associated with portions of our Lakehead System are subject to the authoritative accounting provisions applicable to regulated operations. To recognize the economic effects of the actions of the regulator, the timing of recognition of certain revenues and expenses in these operations may differ from that otherwise expected under U.S. GAAP for non rate-regulated entities.
79
ENBRIDGE ENERGY PARTNERS, L.P.
NOTES TO THE CONSOLIDATED FINANCIAL STATEMENTS
2. SIGNIFICANT ACCOUNTING POLICIES – (continued)
Under our cost-of-service recovery model, the difference between forecast used to calculate the tolls and actual results causes an over or under recovery in any given year that is deferred through a revenue adjustment and is returned to or recovered from shippers through future rate adjustments in the following year. Due to these over or under recovery adjustments made in accordance with the FERC’s authoritative guidance, we recognize assets and liabilities for regulatory purposes. The assets and liabilities that we recognize for regulatory purposes are recorded on a net basis in “Other current assets” or “Accounts payable and other,” respectively, on our consolidated statements of financial position. The net regulatory asset or liability balance is comprised of the cumulative over and under recovery adjustments made during the prior calendar year, less any amortizations and the cumulative over and under recovery adjustments made during current calendar year to date. We track regulatory assets and liabilities by vintage and our regulatory assets and liabilities are amortized on a straight-line basis over a one-year recovery period. Accordingly, amortization for a net regulatory asset or liability arising from over and under recovery adjustments related to any given calendar year does not begin until January of the following year.
Allowance for Funds Used During Construction
AFUDC is included in the cost of property, plant and equipment and is depreciated over future periods as part of the total cost of the related asset. AFUDC includes both an interest component and, if approved by the regulator, a cost of equity component, which are both capitalized based on rates set out in a regulatory agreement. In the absence of rate regulation, we would capitalize interest using a capitalization rate based on our cost of borrowing, whereas the capitalized equity component, the corresponding earnings during the construction phase and the subsequent depreciation would not be recognized.
Revenue Recognition and the Estimation of Revenues
We generally do not own the crude oil and liquid petroleum that we transport or store and therefore, we do not assume significant direct commodity price risk. Revenues are primarily derived from three sources: interstate transportation of crude oil and liquid petroleum under tariffs regulated by the FERC, ship-or-pay agreements and contract storage revenues related to our crude oil storage assets.
The tariffs established for our interstate pipelines specify the amounts to be paid by shippers for transportation services we provide between receipt and delivery locations and the general terms and conditions of transportation services on the respective pipeline systems. We recognize revenue upon delivery of products to our customers, when pricing is determinable and collectability is reasonably assured.
We recognize contract storage revenues based on contractual terms under which customers pay for the option to use available storage capacity and/or a fee based on storage volumes. We recognize revenues as storage services are rendered, when pricing is determinable and collectability is reasonably assured.
Revenues are all recorded in “Transportation and other services” and “Transportation and other services — affiliate” on our consolidated statements of income.
Estimation of Revenue
In order to permit the timely preparation of our consolidated financial statements, we estimate our current month revenue and commodity costs. We generally cannot compile actual billing information nor obtain actual vendor invoices within a timeframe that would permit the recording of this actual data before our preparation of the consolidated financial statements. As a result, we record an estimate each month for our operating revenues based on the best available volume and price data for crude oil delivered and received, along with an adjustment of the prior month’s estimate to equal the prior month’s actual data. As a result, there is one month of estimated data recorded in our operating revenues and commodity costs for each of the years ended December 31, 2017, 2016 and 2015. We believe that the assumptions underlying these estimates are not significantly different from the actual amounts due to the routine nature of these estimates and the stability of our processes.
Derivative Financial Instruments
We use derivative financial instruments (i.e., futures, forwards, swaps, options and other financial instruments with similar characteristics) to manage our exposure to changes in commodity prices and interest rates. We record all derivative financial instruments at fair market value in our consolidated statements of financial position.
80
ENBRIDGE ENERGY PARTNERS, L.P.
NOTES TO THE CONSOLIDATED FINANCIAL STATEMENTS
2. SIGNIFICANT ACCOUNTING POLICIES – (continued)
For those instruments that qualify for hedge accounting, the accounting treatment is dependent on the intended use and designation of each instrument. We record changes in the fair value of our derivative financial instruments that are not designated for hedge accounting in our consolidated statements of income as follows:
• | Commodity-based derivatives — “Transportation and other services” |
• | Interest rate derivatives — “Interest expense, net” |
Qualified Hedges
We may use cash flow hedges to manage our exposure to changes in commodity prices and interest rates. To qualify for cash flow hedge accounting treatment, very specific requirements must be met in terms of hedge structure, hedge objective and hedge documentation. At inception, we formally document the relationship between the hedging instrument and the hedged item, the risk management objective and the method used for assessing and testing correlation and hedge effectiveness. We also assess, both at the inception of the hedge and on an on-going basis, whether the derivatives that are used in our hedging transactions are highly effective in offsetting changes in cash flows of the hedged item. Furthermore, we regularly assess the creditworthiness of our counterparties to manage against the risk of default. If we determine that a derivative is no longer highly effective as a hedge, we discontinue hedge accounting prospectively by including changes in the fair value of the derivative in current earnings.
The effective portion of the change in fair value of a cash flow hedge is recorded in other comprehensive income (loss) and is reclassified into earnings when the hedge item impacts earnings. Any ineffective portion of a cash flow hedge’s change in fair value is recognized each period in earnings. Gains and losses deferred in AOCI related to cash flow hedges for which hedge accounting has been discontinued remain in AOCI until the underlying physical transaction occurs unless it is probable that the forecasted transaction will not occur by the end of the originally specified time period or within an additional two month period of time thereafter. Although we retain the ability to designate commodity hedges for cash flow hedge accounting, as of December 31, 2017, we have no commodity hedges designated as cash flow hedges.
Non-Qualified Hedges
We have derivative financial instruments associated with our commodity activities where the hedge structure does not meet the requirements to apply hedge accounting. As a result, these derivative financial instruments do not qualify for hedge accounting and are referred to as non-qualifying. These non-qualifying derivative financial instruments are marked-to-market each period with the change in fair value, representing unrealized gains and losses, included in “Transportation and other services” in our consolidated statements of income. These mark-to-market adjustments produce a degree of earnings volatility that can often be significant from period to period, but have no cash flow impact relative to changes in market prices. The cash flow impact occurs when the underlying physical transaction takes place in the future and the associated financial instrument contract settlement is made. Although we retain the ability to designate commodity hedges for cash flow accounting, as of December 31, 2017, we have no remaining commodity hedges that are designated. As such, all commodity hedges are marked-to-market with the changes in fair value recorded in earnings each period. Designated interest rate derivative financial instruments continue to be reported in AOCI.
Fair Value Measurements
We apply the authoritative accounting provisions for measuring fair value to our derivative instruments and disclosures associated with our outstanding commodity activities. Fair value is defined as the expected price we would receive to sell an asset or pay to transfer a liability in an orderly transaction with market participants at the measurement date.
We employ a hierarchy which prioritizes the inputs we use to measure recurring fair value into three distinct categories based upon whether such inputs are observable in active markets or unobservable. We classify assets and liabilities in their entirety based on the lowest level of input that is significant to the fair value measurement. Our methodology for categorizing assets and liabilities that are measured at fair value pursuant to this hierarchy gives the highest priority to unadjusted quoted prices in active markets and the lowest level to unobservable inputs as outlined below:
81
ENBRIDGE ENERGY PARTNERS, L.P.
NOTES TO THE CONSOLIDATED FINANCIAL STATEMENTS
2. SIGNIFICANT ACCOUNTING POLICIES – (continued)
• | Level 1 — We include in this category the fair value of assets and liabilities that we measure based on unadjusted quoted prices in active markets that are accessible at the measurement date for identical, unrestricted assets or liabilities. We consider active markets as those in which transactions for the assets or liabilities occur with sufficient frequency and volume to provide pricing information on an ongoing basis. The fair value of our assets and liabilities included in this category consists primarily of exchange-traded derivative instruments. |
• | Level 2 — We include in this category the fair value of assets and liabilities that we measure with either directly or indirectly observable inputs as of the measurement date, where pricing inputs are other than quoted prices in active markets for the identical instrument. This category includes both OTC transactions valued using exchange traded pricing information in addition to assets and liabilities that we value using either models or other valuation methodologies derived from observable market data. These models are primarily industry-standard models that consider various inputs including: (a) quoted prices for assets and liabilities; (b) time value; (c) volatility factors; and (d) current market and contractual prices for the underlying instruments, as well as other relevant economic measures. Substantially all of these inputs are observable in the marketplace throughout the full term of the assets and liabilities, can be derived from observable data, or are supported by observable levels at which transactions are executed in the marketplace. |
• | Level 3 — We include in this category the fair value of assets and liabilities that we measure based on prices or valuation techniques that require inputs which are both significant to the fair value measurement and less observable from objective sources (i.e., values supported by lesser volumes of market activity). We may also use these inputs with internally developed methodologies that result in our best estimate of the fair value. Level 3 assets and liabilities primarily include derivative instruments for which we do not have sufficient corroborating market evidence, such as binding broker quotes, to support classifying the asset or liability as Level 2. Additionally, Level 3 valuations may utilize modeled pricing inputs to derive forward valuations, which may include some or all of the following inputs: non-binding broker quotes, time value, volatility, correlation and extrapolation methods. |
We record all derivative financial instruments in our consolidated financial statements at fair market value, which we adjust on a recurring basis each period for changes in the fair market value and refer to as marking to market, or mark-to-market. The fair market value of these derivative financial instruments reflects the estimated amounts that we would pay to transfer a liability or receive to sell an asset in an orderly transaction with market participants to terminate or close the contracts at the reporting date, taking into account the current unrealized losses or gains on open contracts. We apply a mid-market pricing convention, which we refer to as the “market approach,” to value substantially all of our derivative instruments.
Our assets are adjusted for the non-performance risk of our counterparties using their current credit default swap spread rates. Likewise, in the case of our liabilities, our nonperformance risk is considered in the valuation and is also adjusted using a credit adjustment model incorporating inputs such as credit default swap rates, bond spreads, and default probabilities.
Our credit exposure for OTC derivatives is directly with our counterparty and continues until the maturity or termination of the contracts. As appropriate, valuations are adjusted for various factors such as credit and liquidity considerations. Actively traded external market quotes, data from pricing services and published indices are also used to value our derivative instruments. We may use these inputs along with internally developed methodologies that result in our best estimates of fair value.
Transaction Costs
Transaction costs are incremental costs directly related to the acquisition of a financial asset or the issuance of a financial liability. We incur transaction costs primarily from the issuance of debt and accounts for these costs as a deduction from Long-term debt on the Statements of Financial Position. These costs are amortized using the effective interest rate method over the term of the related debt instrument and are recorded in Interest expense.
Equity Investments
Equity investments over which we exercise significant influence, but do not have controlling financial interests, are accounted for using the equity method. Equity investments are initially measured at cost and are adjusted for our
82
ENBRIDGE ENERGY PARTNERS, L.P.
NOTES TO THE CONSOLIDATED FINANCIAL STATEMENTS
2. SIGNIFICANT ACCOUNTING POLICIES – (continued)
proportionate share of undistributed equity earnings or loss. Equity investments are increased for contributions made to and decreased for distributions received from the investees. To the extent an equity investee undertakes activities necessary to commence its planned principal operations; we capitalize interest costs associated with its investment during such period.
Income Taxes
We are not a taxable entity for United States federal income tax purposes or for the majority of states that impose an income tax. Taxes on our net income generally are borne by our unitholders through the allocation of taxable income. Our income tax expense results from the enactment of franchise tax laws by the State of Texas that apply to entities organized as partnerships. This tax is computed on our modified gross margin and we have determined the tax to be an income tax as set forth in authoritative accounting literature.
We recognize deferred income tax assets and liabilities for temporary differences between the relevant basis of our assets and liabilities for financial reporting and tax purposes. We record the impact of changes in tax legislation on deferred income tax liabilities and assets in the period the legislation is enacted.
We recognize the tax effects of any uncertain tax positions as the largest amount that will more likely than not be realized upon ultimate settlement with a taxing authority having full knowledge of the position and all relevant facts. We recognize accrued interest income related to unrecognized tax benefits in interest income when the related unrecognized tax benefits are recognized.
Net income for financial statement purposes may differ significantly from taxable income of unitholders as a result of differences between the tax basis and financial reporting basis of assets and liabilities and the taxable income allocation requirements under our partnership agreement. The aggregate difference in the basis of our net assets for financial and tax reporting purposes cannot be readily determined because information regarding each partner’s tax attributes in us is not available.
Cash and Cash Equivalents
Cash equivalents are defined as all highly marketable securities with original maturities of three months or less when purchased. The carrying value of cash and cash equivalents approximates fair value because of the short term to maturity of these investments.
Restricted Cash
Cash and cash equivalents that are restricted as to withdrawal or usage, in accordance with specific commercial arrangements, are presented as “Restricted cash” on our consolidated statements of financial position.
Oil Measurement Adjustments
Oil measurement adjustments occur as part of the normal operations associated with our liquid petroleum operations. The three types of oil measurement adjustments that routinely occur on our systems include:
• | Physical, which result from evaporation, shrinkage, differences in measurement (including sediment and water measurement) between receipt and delivery locations and other operational conditions; |
• | Degradation, resulting from mixing at the interface within our pipeline systems or terminal and storage facilities between higher quality light crude oil and lower quality heavy crude oil in pipelines; and |
• | Revaluation, which are a function of crude oil prices, the level of our carriers’ inventory and the inventory positions of customers. |
Quantifying oil measurement adjustments are difficult because: (i) physical measurements of volumes are not practical, as products continuously move through our pipelines, which are primarily located underground; (ii) the extensive length of our pipeline systems; and (iii) the numerous grades and types of crude oil products we carry. We utilize engineering-based models and operational assumptions to estimate product volumes in our systems and associated oil measurement adjustments. Material changes in our assumptions may result in revisions to our oil measurement estimates in the period determined. Oil measurement adjustments are included within the “Operating and administrative” line item of our consolidated statements of income.
83
ENBRIDGE ENERGY PARTNERS, L.P.
NOTES TO THE CONSOLIDATED FINANCIAL STATEMENTS
2. SIGNIFICANT ACCOUNTING POLICIES – (continued)
Property, Plant and Equipment
We record property, plant and equipment at historical cost. We capitalize expenditures in excess of a minimum rule, which have a useful life greater than one year for: (i) assets purchased or constructed; (ii) existing assets that are replaced, improved or the useful lives have been extended; or (iii) all land, regardless of cost. Maintenance and repair costs, including any planned major maintenance activities, are expensed as incurred. Expenditures for project development are capitalized if they are expected to have a future benefit. During construction, we capitalize direct costs, such as labor and materials, and other costs, such as direct overhead and interest at our weighted average cost of debt.
We depreciate property, plant and equipment on a straight-line basis over the lesser of its estimated useful life or the estimated remaining lives of the crude oil production in the basins the assets serve. Upon disposition of distinct assets, we recognize any gains or losses in our consolidated statements of income. For largely homogeneous groups of assets with comparable useful lives, we record depreciation using the group method of depreciation whereby similar assets are grouped and depreciated as a group. Under this method, when group assets are retired or otherwise disposed of, gains and losses are not reflected in our consolidated statements of income but are recorded as an adjustment to accumulated depreciation.
Impairment
We evaluate the recoverability of our long-lived assets when events or circumstances such as economic obsolescence, the business climate, legal and other factors indicate we may not recover the carrying amount of the assets. We evaluate the asset for recoverability by estimating the undiscounted future cash flows expected to be derived from operating the asset as a going concern. If the carrying amount of the asset exceeds the sum of the undiscounted future cash flows, we recognize an impairment loss in the amount of the excess carrying amount of the asset over its fair value.
Asset Retirement Obligations
Legal obligations exist for a minority of our right-of-way agreements due to requirements or landowner options that compel us to remove the pipe at final abandonment. Sufficient data exists with certain pipeline systems to reasonably estimate the cost of abandoning or retiring a pipeline system. However, in some cases, there is insufficient information to reasonably determine the timing and/or method of settlement for estimating the fair value of the asset retirement obligation. In these cases, the asset retirement obligation cost is considered indeterminate because there is no data or information that can be derived from past practice, industry practice, our intentions, or the estimated economic life of the asset. Useful lives of most pipeline systems are primarily derived from available supply resources and ultimate consumption of those resources by end users. Variables can affect the remaining lives of the assets which preclude us from making a reasonable estimate of the asset retirement obligation. Indeterminate asset retirement obligation costs will be recognized in the period in which sufficient information exists to allow us to reasonably estimate potential settlement dates and methods.
We record a liability for the fair value of asset retirement obligations and conditional asset retirement obligations that we can reasonably estimate, on a discounted basis. We collectively refer to asset retirement obligations and conditional asset retirement obligations as ARO. Typically, we record an ARO at the time the assets are installed or acquired, if a reasonable estimate of fair value can be made. In connection with establishing an ARO, we capitalize the costs as part of the carrying value of the related assets. We recognize an ongoing expense for the interest component of the liability as part of depreciation expense resulting from changes in the value of the ARO due to the passage of time. We depreciate the initial capitalized costs over the useful lives of the related assets. We extinguish the liabilities for an ARO when assets are taken out of service or otherwise abandoned.
Commitments, Contingencies and Environmental Liabilities
We expense or capitalize, as appropriate, expenditures for ongoing compliance with environmental regulations that relate to past or current operations. We expense amounts we incur for remediation of existing environmental contamination caused by past operations that do not benefit future periods by preventing or eliminating future contamination. We record liabilities for environmental matters when assessments indicate that remediation efforts are probable, and the costs can be reasonably estimated. Estimates of environmental liabilities are based on currently
84
ENBRIDGE ENERGY PARTNERS, L.P.
NOTES TO THE CONSOLIDATED FINANCIAL STATEMENTS
2. SIGNIFICANT ACCOUNTING POLICIES – (continued)
available facts, existing technology and presently enacted laws and regulations taking into consideration the likely effects of inflation and other factors. These amounts also consider prior experience in remediating contaminated sites, other companies’ clean-up experience and data released by government organizations. Our estimates are subject to revision in future periods based on actual costs or new information and are included in “Environmental liabilities” and “Other long-term liabilities” in our consolidated statements of financial position at their undiscounted amounts. We always have the potential of incurring additional costs in connection with environmental liabilities due to variations in any or all of the categories described above, including modified or revised requirements from regulatory agencies, in addition to fines and penalties, as well as expenditures associated with litigation and settlement of claims. We evaluate recoveries from insurance coverage separately from the liability and, when recovery is probable, we record and report an asset separately from the associated liability in our consolidated financial statements.
We recognize liabilities for other commitments and contingencies when, after fully analyzing the available information, we determine it is either probable that an asset has been impaired, or that a liability has been incurred and the amount of impairment or loss can be reasonably estimated. When a range of probable loss can be estimated, we accrue the most likely amount, or if no amount is more likely than another, we accrue the minimum of the range of probable loss. We expense legal costs associated with loss contingencies as such costs are incurred.
3. CHANGES IN ACCOUNTING POLICY
Adoption of New Standards
Clarifying the Definition of a Business in an Acquisition
Effective January 1, 2017, we early adopted Accounting Standards Update (ASU) 2017-01 on a prospective basis. The new standard was issued with the objective of adding guidance to assist entities with evaluating whether transactions should be accounted for as acquisitions (disposals) of assets or businesses. The adoption of the pronouncement did not have a material impact on our consolidated financial statements.
Accounting for Intra-Entity Asset Transfers
Effective January 1, 2017, we early adopted ASU 2016-16 on a modified retrospective basis. The new standard was issued with the intent of improving the accounting for the income tax consequences of intra-entity asset transfers other than inventory. Under the new guidance, an entity should recognize the income tax consequences of an intra-entity transfer of an asset, other than inventory, when the transfer occurs. The adoption of the pronouncement did not have a material impact on our consolidated financial statements.
Simplifying the Embedded Derivatives Analysis for Debt Instruments
Effective January 1, 2017, we adopted ASU 2016-06 on a modified retrospective basis. The new guidance simplifies the embedded derivative analysis for debt instruments containing contingent call or put options. The adoption of the pronouncement did not have a material impact on our consolidated financial statements.
Future Accounting Policy Changes
Improvements to Accounting for Hedging Activities
ASU 2017-12 was issued in August 2017 with the objective of better aligning a company’s risk management activities and the resulting hedge accounting reflected in the financial statements. The accounting update allows cash flow hedging of contractually specified components in financial and non-financial items. Under the new guidance, hedge ineffectiveness is no longer required to be measured and hedging instruments’ fair value changes will be recorded in the same income statement line as the hedged item. The ASU also allows the initial quantitative hedge effectiveness assessment to be performed at any time before the end of the quarter in which the hedge is designated. After initial quantitative testing is performed, an ongoing qualitative effectiveness assessment is permitted. The accounting update is effective January 1, 2019 and is to be applied on a modified retrospective basis. We are currently assessing the impact of the new standard on the consolidated financial statements.
Simplifying Cash Flow Classification
85
ENBRIDGE ENERGY PARTNERS, L.P.
NOTES TO THE CONSOLIDATED FINANCIAL STATEMENTS
3. CHANGES IN ACCOUNTING POLICY – (continued)
ASU 2016-15 was issued in August 2016 with the intent of reducing diversity in practice of how certain cash receipts and cash payments are classified in the Consolidated Statement of Cash Flows. The new guidance addresses eight specific presentation issues. The accounting update is effective January 1, 2018 and will be applied on a retrospective basis. We assessed each of the eight specific presentation issues and the adoption of this ASU does not have a material impact on our consolidated financial statements.
Accounting for Credit Losses
ASU 2016-13 was issued in June 2016 with the intent of providing financial statement users with more useful information about the expected credit losses on financial instruments and other commitments to extend credit held by a reporting entity at each reporting date. Current treatment uses the incurred loss methodology for recognizing credit losses that delays the recognition until it is probable a loss has been incurred. The accounting update adds a new impairment model, known as the current expected credit loss model, which is based on expected losses rather than incurred losses. Under the new guidance, an entity recognizes as an allowance its estimate of expected credit losses, which the Financial Accounting Standards Board believes will result in more timely recognition of such losses. We are currently assessing the impact of the new standard on our consolidated financial statements. The accounting update is effective January 1, 2020.
Recognition of Leases
ASU 2016-02 was issued in February 2016 with the intent to increase transparency and comparability among organizations. It requires lessees of operating lease arrangements to recognize lease assets and lease liabilities on the statement of financial position and disclose additional key information about lease agreements. The accounting update also replaces the current definition of a lease and requires that an arrangement be recognized as a lease when a customer has the right to obtain substantially all of the economic benefits from the use of an asset, as well as the right to direct the use of the asset. We are currently gathering a complete inventory of our lease contracts in order to assess the impact of the new standard on our consolidated financial statements. The accounting update is effective January 1, 2019 and will be applied using a modified retrospective approach.
Recognition and Measurement of Financial Assets and Liabilities
ASU 2016-01 was issued in January 2016 with the intent to address certain aspects of recognition, measurement, presentation and disclosure of financial assets and liabilities. Investments in equity securities, excluding equity method and consolidated investments, are no longer classified as trading or available-for-sale securities. All investments in equity securities with readily determinable fair values are classified as investments at fair value through net income. Investments in equity securities without readily determinable fair values are measured using the fair value measurement alternative and are recorded at cost minus impairment, if any, plus or minus changes resulting from observable price changes in orderly transactions for an identical or similar investment of the same issuer. Investments in equity securities measured using the fair value measurement alternative are reviewed for indicators of impairment each reporting period. Fair value of financial instruments for disclosure purposes is measured using exit price. The accounting update is effective January 1, 2018 and will be applied on a prospective basis. We do not expect the adoption of this accounting update to have a material impact on our consolidated financial statements.
Revenue from Contracts with Customers
ASU 2014-09 was issued in 2014 with the intent of significantly enhancing consistency and comparability of revenue recognition practices across entities and industries. The new standard establishes a single, principles-based five-step model to be applied to all contracts with customers and introduces new and enhanced disclosure requirements. It also requires the use of more estimates and judgments than the present standards in addition to additional disclosures .The new standard is effective January 1, 2018. The new standard permits either a full retrospective method of adoption with restatement of all prior periods presented, or a modified retrospective method with the cumulative effect of applying the new standard recognized as an adjustment to opening retained earnings in the period of adoption. We have decided to adopt the new standard using the modified retrospective method.
We have reviewed our revenue contracts in order to evaluate the effect of the new standard on its revenue recognition practices. Based on this assessment, the application of the standard will result in the following changes to our financial statements and revenue recognition methods:
86
ENBRIDGE ENERGY PARTNERS, L.P.
NOTES TO THE CONSOLIDATED FINANCIAL STATEMENTS
3. CHANGES IN ACCOUNTING POLICY – (continued)
• | Estimates of variable consideration which will be required under the new standard as well as the allocation of the transaction price for certain revenue contracts may result in changes to the pattern or timing of revenue recognition for those contracts. |
• | Certain payments received from customers to offset the cost of constructing assets required to provide services to those customers, referred to as CIACs were previously recorded as reductions of property, plant and equipment regardless of whether the amounts were imposed by regulation or negotiated. Under the new standard, negotiated CIACs are deemed to be advance payments for services and must be recognized when those future services are provided. Negotiated CIACs will be accounted for as deferred revenue and recognized over the term of the associated revenue contract. |
After conducting this assessment, we determined that any necessary adjustments to our partners' capital account as of January 1, 2018 would be immaterial.
We have also developed and tested processes to generate the disclosures which will be required under the new standard commencing in first quarter of 2018.
4. NET INCOME PER LIMITED PARTNER UNIT
We allocate our net income to our Class E units equal to the distributions that they receive. We also allocate any earnings in excess of distributions to our General Partner and limited partners owning Class A and B common units and i-units utilizing the distribution formula for available cash specified in our partnership agreement. We allocate any distributions in excess of earnings for the period to our General Partner and limited partners owning Class A and B common units and i-units based on their sharing of losses of 2% and 98%, respectively, as set forth in our partnership agreement. Prior to April 27, 2017, we allocated distributions to the General Partner and limited partners based upon the distribution rates and percentages set forth in the following table:
Distribution Targets | Portion of Quarterly Distribution Per Unit | Percentage Distributed to General Partner and IDUs(1) | Percentage Distributed to Limited partners | |||
Minimum Quarterly Distribution | Up to $0.5435 | 2% | 98% | |||
First Target Distribution | > $0.5435 | 25% | 75% | |||
____________
(1) | For distributions in excess of the Minimum Quarterly Distribution, this percentage includes both the General Partner’s distributions of 2% and the distribution to the Incentive Distribution Unit holder, a wholly-owned subsidiary of our General Partner. |
Equity Restructuring Transaction
On April 27, 2017, a wholly-owned subsidiary of our General Partner irrevocably waived all of its rights associated with its 66 million Class D units and its 1,000 IDUs in exchange for the issuance of 1,000 Class F units. The irrevocable waiver is effective with respect to distributions declared with a record date after April 27, 2017. The Class F units are entitled to receive an incentive distribution for amounts distributed in excess of the Minimum Quarterly Distribution as described in the following table:
Distribution Targets | Portion of Quarterly Distribution Per Unit | Percentage Distributed to General Partner and Class F Units(1) | Percentage Distributed to Limited Partners |
Minimum Quarterly Distribution | Up to $0.295 | 2% | 98% |
First Target Distribution | > $0.295 to $0.35 | 15% | 85% |
Over First Target Distribution | > $0.35 | 25% | 75% |
(1) | For distribution in excess of the Minimum Quarterly Distribution, this percentage includes both the General Partner's distribution of 2% and the distribution to the Class F units. |
Alberta Clipper Drop Down
87
ENBRIDGE ENERGY PARTNERS, L.P.
NOTES TO THE CONSOLIDATED FINANCIAL STATEMENTS
4. NET INCOME PER LIMITED PARTNER UNIT – (continued)
On January 2, 2015, we completed a transaction to acquire from our General Partner the remaining 66.7% interest in the United States portion of the Alberta Clipper Pipeline. The consideration consisted of issuance to the General Partner of 18,114,975 units of a new class of limited partner interests designated as Class E units.
We determined basic and diluted net income (loss) per common unit and i-unit as follows:
For the year ended December 31, | |||||||||||
2017 | 2016 | 2015 | |||||||||
(in millions, except per unit amounts) | |||||||||||
Continuing operations: | $ | 708 | $ | 116 | $ | 739 | |||||
Net income | |||||||||||
Less: Net income attributable to: | |||||||||||
Noncontrolling interest | 388 | 72 | 297 | ||||||||
Series 1 preferred unit distributions | 29 | 90 | 90 | ||||||||
Accretion of discount on Series 1 preferred units | 8 | 5 | 11 | ||||||||
Net income (loss) attributable to general and limited partner interests in Enbridge Energy Partners, L.P. - continuing operations | 283 | (51 | ) | 341 | |||||||
Distributions: | |||||||||||
Incentive distributions(1) | (15 | ) | (21 | ) | (19 | ) | |||||
Distributed earnings attributed to our General Partner | (13 | ) | (21 | ) | (21 | ) | |||||
Distributed earnings attributed to Class D and Class E units(1) | (25 | ) | (196 | ) | (195 | ) | |||||
Total distributed earnings to our General Partner, Class D, Class E units Class F units and IDUs | (53 | ) | (238 | ) | (235 | ) | |||||
Total distributed earnings attributed to our common units and i-units | (589 | ) | (814 | ) | (791 | ) | |||||
Total distributed earnings | (642 | ) | (1,052 | ) | (1,026 | ) | |||||
Overdistributed earnings | $ | (359 | ) | $ | (1,103 | ) | $ | (685 | ) | ||
Discontinued operations: | |||||||||||
Net loss | $ | (57 | ) | $ | (157 | ) | $ | (285 | ) | ||
Less: Net loss attributable to: | |||||||||||
Noncontrolling interest | (19 | ) | (46 | ) | (76 | ) | |||||
Net loss attributable to general and limited partner interests in Enbridge Energy Partners, L.P. - discontinued operations | $ | (38 | ) | $ | (111 | ) | $ | (209 | ) | ||
Weighted average common units and i-units outstanding | 400 | 348 | 339 | ||||||||
Basic and diluted earnings per unit: | |||||||||||
Distributed earnings per common unit and i-unit - continuing operations(2) | 1.48 | 2.34 | 2.33 | ||||||||
Overdistributed earnings per common unit and i-unit(3) | (0.88 | ) | (3.11 | ) | (1.98 | ) | |||||
Net income (loss) per common unit and i-unit (basic and diluted) - continuing operations(4) | 0.60 | (0.77 | ) | 0.35 | |||||||
Net loss per common unit and i-unit (basic and diluted) - discontinued operations(4) | (0.10 | ) | (0.31 | ) | (0.60 | ) | |||||
Net income (loss) per common unit and i-unit (basic and diluted) | 0.50 | (1.08 | ) | (0.25 | ) | ||||||
____________
(1) | For the year ended December 31, 2017, Class D units and IDUs were not entitled to distributions as the wholly-owned subsidiary of our General Partner irrevocably waived its rights associated with the Class D units and IDUs; for the years ended December 31, 2016 and 2015, incentive distributions were made to IDUs and Class D units. |
(2) | Represents the total distributed earnings to common units and i-units divided by the weighted average number of common units and i-units outstanding for the period. |
88
ENBRIDGE ENERGY PARTNERS, L.P.
NOTES TO THE CONSOLIDATED FINANCIAL STATEMENTS
4. NET INCOME PER LIMITED PARTNER UNIT – (continued)
(3) | Represents the common units’ and i-unit’s share (98%) of distributions in excess of earnings divided by the weighted average number of common units and i-units outstanding for the period and overdistributed earnings allocated to the common units and i-units based on the distribution waterfall that is outlined in our partnership agreement. |
(4) | For the years ended December 31, 2017, 2016 and 2015, 43,201,310 anti-dilutive Preferred Units, 66,100,000 anti-dilutive Class D units and 18,114,975 anti-dilutive Class E units were excluded from the if-converted method of calculating diluted earnings per unit. |
5. SEGMENT INFORMATION
Effective December 31, 2017, we revised our segment-level profit measure to earnings before interest, income taxes and depreciation and amortization from the previous measure of operating income (loss). The presentation of the prior year's tables has been revised in order to align with the current presentation.
Our business has one operating segment, defined as a component of the enterprise, about which financial information is available and evaluated regularly by our Chief Operating Decision Maker, collectively comprised of our senior management, in deciding how resources are allocated and performance is assessed.
Our reportable segment is a business unit that offers services and products and are managed based on our operating strategy. We have segregated our business activity in one operating segment: Liquids. The remainder of our business operations is presented as "Other" and consists of certain unallocated corporate costs.
As of and for the year ended December 31, 2017 | |||||||||||||||
Total Revenues(1) | Segment EBITDA/Consolidated Earnings Before Income Taxes | Capital and Investment Expenditures | Total Assets | ||||||||||||
(in millions) | |||||||||||||||
Liquids | $ | 2,428 | $ | 1,674 | $ | 586 | $ | 14,819 | |||||||
Total reportable segment | 2,428 | 1,674 | 586 | 14,819 | |||||||||||
Other | (7 | ) | 9 | ||||||||||||
Depreciation and amortization | (442 | ) | |||||||||||||
Interest expense, net | (525 | ) | |||||||||||||
Earnings before income tax expense | 700 | ||||||||||||||
Income tax benefit | 8 | ||||||||||||||
Net income from continuing operations | 708 | ||||||||||||||
Net loss from discontinued operations(2) | (57 | ) | |||||||||||||
Total consolidated | $ | 2,428 | $ | 651 | $ | 586 | $ | 14,828 | |||||||
____________
(1) | There were no intersegment revenues for the year ended December 31, 2017. |
(2) | The operating results of our disposed Natural Gas segment are included in discontinued operations as a result of the Midcoast sale to our General Partner. For further information refer to Note 7 - Dispositions and Discontinued Operations. |
89
ENBRIDGE ENERGY PARTNERS, L.P.
NOTES TO THE CONSOLIDATED FINANCIAL STATEMENTS
5. SEGMENT INFORMATION – (continued)
As of and for the year ended December 31, 2016 | |||||||||||||||
Total Revenues(1) | Segment EBITDA/Consolidated Earnings Before Income Taxes | Capital and Investment Expenditures | Total Assets(3) | ||||||||||||
(in millions) | |||||||||||||||
Liquids | $ | 2,516 | $ | 964 | $ | 797 | $ | 13,031 | |||||||
Total reportable segment | 2,516 | 964 | 797 | 13,031 | |||||||||||
Other | (9 | ) | 165 | ||||||||||||
Depreciation and amortization | (427 | ) | |||||||||||||
Interest expense, net | (413 | ) | |||||||||||||
Earnings before income tax expense | 115 | ||||||||||||||
Income tax benefit | 1 | ||||||||||||||
Net income from continuing operations | 116 | ||||||||||||||
Net loss from discontinued operations(2) | (157 | ) | |||||||||||||
Total consolidated | $ | 2,516 | $ | (41 | ) | $ | 797 | $ | 13,196 | ||||||
____________
(1) | There were no intersegment revenues for the year ended December 31, 2016. |
(2) | The operating results of our disposed Natural Gas segment are included in discontinued operations as a result of the Midcoast sale to our General Partner. For further information refer to Note 7 - Dispositions and Discontinued Operations. |
(3) | Comparative information excludes assets from discontinued operations. For further information refer to Note 7 - Dispositions and Discontinued Operations. |
As of and for the year ended December 31, 2015 | |||||||||||
Total Revenues(1) | Segment EBITDA/Consolidated Earnings Before Income Taxes | Capital and Investment Expenditures | |||||||||
(in millions) | |||||||||||
Liquids | $ | 2,303 | $ | 1,441 | $ | 1,976 | |||||
Total reportable segment | 2,303 | 1,441 | 1,976 | ||||||||
Other | (29 | ) | |||||||||
Depreciation and amortization | (378 | ) | |||||||||
Interest expense, net | (292 | ) | |||||||||
Earnings before income tax expense | 742 | ||||||||||
Income tax expense | (3 | ) | |||||||||
Net income from continuing operations | 739 | ||||||||||
Net loss from discontinued operations(2) | (285 | ) | |||||||||
Total consolidated | $ | 2,303 | $ | 454 | $ | 1,976 | |||||
____________
(1) | There were no intersegment revenues for the year ended December 31, 2015. |
(2) | The operating results of our disposed Natural Gas segment are included in discontinued operations as a result of the Midcoast sale to our General Partner. For further information refer to Note 7 - Dispositions and Discontinued Operations |
Substantially all of our consolidated revenues are earned in the United States and derived from a wide customer base. For the year ended December 31, 2017, we had two non-affiliated customers that accounted for $392 million and $239 million, or 16.9% and 10.3% of our third-party revenues. For the years ended December 31, 2016 and 2015, our largest non-affiliated customer accounted for $257 million and $338 million, or 10.7% and 15.6% of our third-party
90
ENBRIDGE ENERGY PARTNERS, L.P.
NOTES TO THE CONSOLIDATED FINANCIAL STATEMENTS
5. SEGMENT INFORMATION – (continued)
revenues, respectively. No other customers accounted for 10% or more of our third-party revenues during the years ended December 31, 2016 and 2015.
6. REGULATORY MATTERS
Financial Statement Effects
Our over and under recovery revenue adjustments and net regulatory asset amortization for the years ended December 31, 2017, 2016, and 2015 are as follows:
For the year ended December 31, | |||||||||||
2017 | 2016 | 2015 | |||||||||
(in millions) | |||||||||||
Net regulatory asset balance at beginning of year | $ | 12 | $ | 30 | $ | 6 | |||||
Current year under recovery adjustments | 3 | 12 | 30 | ||||||||
Amortization of prior year regulatory asset | (12 | ) | (30 | ) | (6 | ) | |||||
Net regulatory asset balance at end of year | $ | 3 | $ | 12 | $ | 30 | |||||
Other Contractual Obligations
Alberta Clipper Pipeline Property Taxes
A portion of the rates we charge our customers includes an estimate for annual property taxes. If the estimated property tax we collect from our customers is higher or lower than the actual property tax imposed, we are contractually obligated to refund to our customers or entitled to collect from our customers 50% of the property tax over or under recovery, respectively and amortize the asset or liability on a straight line basis as an adjustment to revenue in the following year.
Allowance for Equity Used During Construction
We are permitted to capitalize and recover costs for rate-making purposes that include AEDC. In connection with construction of the Eastern Access, Mainline Expansion and Line 3 Replacement projects, we recorded $47 million, $46 million, and $70 million of AEDC on our consolidated statements of income at December 31, 2017, 2016 and 2015, respectively, with corresponding amounts to “Property, plant and equipment, net” on our consolidated statements of financial position for the respective periods.
Tax Reform
On December 22, 2017, United States legislation referred to as the "Tax Cuts and Jobs Act" (The TCJA) was signed into law. The TCJA includes a reduction in the corporate federal income tax rate from 35% to 21%. This tax rate change is expected to cause us to reduce the income tax allowance component of the tolls in its FERC regulated cost-of-service based Facility Surcharge Mechanism (FSM) projects. Impacts of tax reform will be realized in the first quarter of 2018 and will be reflected in Lakehead’s FSM toll filing for rates effective April 1, 2018. The TCJA had no material impact on our net regulatory asset balance at December 31, 2017.
7. DISPOSITIONS AND DISCONTINUED OPERATIONS
Dispositions
For the year ended December 31, 2017, we sold unnecessary pipe related to the Sandpiper Project for cash proceeds of approximately $112 million. A gain on disposal of $63 million before tax was included in “Gain on sale of assets” on our consolidated statements of income. These assets were part of our Liquids segment.
On March 1, 2017, we completed the sale of the Ozark Pipeline system to a subsidiary of MPLX LP for cash proceeds of approximately $220 million, including reimbursement costs. A gain on disposal of $11 million before tax
91
ENBRIDGE ENERGY PARTNERS, L.P.
NOTES TO THE CONSOLIDATED FINANCIAL STATEMENTS
7. DISPOSITIONS AND DISCONTINUED OPERATIONS – (continued)
was included in “Gain on sale of assets” on our consolidated statements of income. These assets were part of our Liquids segment.
Discontinued Operations
Sale of Natural Gas Business
On June 28, 2017, we completed the sale of all of our ownership interest in our Midcoast gas gathering and processing business to our General Partner for $2.3 billion, which included cash consideration of $1.3 billion and outstanding indebtedness at MEP of $953 million. This sale included our 48.4% limited partnership interest in Midcoast Operating, our 51.9% limited partnership interest in MEP, and our 100% interest in Midcoast Holdings, L.L.C., MEP’s general partner. We recorded no gain or loss on the sale as this transaction was between entities under common control of Enbridge. The carrying value of the net assets sold was $4.3 billion. As a result of the transaction, partners’ capital decreased by $2.1 billion, all of which was allocated to the General Partner’s capital account. NCI in MEP of $297 million was eliminated.
The following table presents the operating results from discontinued operations of our Midcoast gas gathering and processing business, which have been segregated from our continuing operations in our consolidated statements of income:
For the year ended December 31, | |||||||||||
2017 | 2016 | 2015 | |||||||||
Operating revenues: | |||||||||||
Commodity sales | $ | 1,094 | $ | 1,786 | $ | 2,647 | |||||
Transportation and other services | 67 | 180 | 196 | ||||||||
1,161 | 1,966 | 2,843 | |||||||||
Operating expenses: | |||||||||||
Commodity costs | 1,010 | 1,660 | 2,373 | ||||||||
Operating and administrative | 134 | 294 | 355 | ||||||||
Depreciation and amortization | 74 | 154 | 158 | ||||||||
Asset impairment | — | 11 | 12 | ||||||||
Goodwill impairment | — | — | 227 | ||||||||
1,218 | 2,119 | 3,125 | |||||||||
Operating loss | (57 | ) | (153 | ) | (282 | ) | |||||
Interest expense, net | (18 | ) | (33 | ) | (30 | ) | |||||
Other income | 19 | 31 | 29 | ||||||||
Loss before income taxes | (56 | ) | (155 | ) | (283 | ) | |||||
Income tax expense | (1 | ) | (2 | ) | (2 | ) | |||||
Net loss from discontinued operations, net of tax | $ | (57 | ) | $ | (157 | ) | $ | (285 | ) | ||
92
ENBRIDGE ENERGY PARTNERS, L.P.
NOTES TO THE CONSOLIDATED FINANCIAL STATEMENTS
7. DISPOSITIONS AND DISCONTINUED OPERATIONS – (continued)
The following table presents the major classes of assets and liabilities for discontinued operations of our Midcoast gas gathering and processing business as presented in the consolidated statement of financial position:
December 31, | |||
2016 | |||
(in millions) | |||
Current assets related to discontinued operations: | |||
Cash and cash equivalents | $ | 7 | |
Restricted cash | 11 | ||
Receivables, trade and other, net of allowance for doubtful accounts | 9 | ||
Due from General Partner and affiliates | 2 | ||
Accrued receivables | 21 | ||
Inventory | 28 | ||
Other current assets | 61 | ||
$ | 139 | ||
Non-current assets related to discontinued operations: | |||
Property, plant and equipment, net | $ | 4,114 | |
Equity investment in joint venture | 361 | ||
Intangible assets, net | 252 | ||
Other assets, net | 48 | ||
$ | 4,775 | ||
December 31, | |||
2016 | |||
(in millions) | |||
Current liabilities related to discontinued operations: | |||
Accounts payable and other | $ | 67 | |
Due to General Partner and affiliates | 39 | ||
Accrued purchases | 172 | ||
Property and other taxes payable | 17 | ||
Interest payable | 5 | ||
$ | 300 | ||
Non-current liabilities related to discontinued operations: | |||
Long-term debt | $ | 818 | |
Other long-term liabilities | 26 | ||
$ | 844 | ||
8. OTHER CURRENT ASSETS
93
ENBRIDGE ENERGY PARTNERS, L.P.
NOTES TO THE CONSOLIDATED FINANCIAL STATEMENTS
8. OTHER CURRENT ASSETS – (continued)
December 31, | |||||||
2017 | 2016 | ||||||
(in millions) | |||||||
Regulatory assets | $ | 3 | $ | 12 | |||
Prepaid expenses and other | 15 | 16 | |||||
Inventory | 2 | 3 | |||||
Other | 4 | 3 | |||||
Total other current assets | $ | 24 | $ | 34 | |||
9. PROPERTY, PLANT AND EQUIPMENT
Weighted Average Depreciation Rate | December 31, | ||||||||
2017 | 2016 | ||||||||
(in millions) | |||||||||
Land | — | $ | 78 | $ | 79 | ||||
Rights-of-way | 2.92% | 477 | 473 | ||||||
Pipelines | 2.76% | 8,731 | 8,571 | ||||||
Pumping equipment, buildings and tanks | 3.16% | 5,144 | 4,866 | ||||||
Vehicles, office furniture and equipment | 3.35% | 167 | 148 | ||||||
Construction in progress | 1,109 | 864 | |||||||
Total property, plant and equipment | 15,706 | 15,001 | |||||||
Accumulated depreciation | (2,810 | ) | (2,393 | ) | |||||
Property, plant and equipment, net | $ | 12,896 | $ | 12,608 | |||||
Depreciation expense for the years ended December 31, 2017, 2016, and 2015, was $421 million, $408 million, and $366 million, respectively.
On March 1, 2017, we completed the sale of the Ozark Pipeline system to a subsidiary of MPLX LP, refer to Note 7 - Dispositions and Discontinued Operations for further details. At December 31, 2016, the assets had a carrying value of $207 million, which was reclassified from "Property, plant and equipment, net" to "Assets held for sale" on our consolidated statements of financial position and measured at the lower of the carrying value or fair value less costs to sell, which did not result in a fair value adjustment. We ceased recognizing depreciation expense on these assets upon reclassification.
On September 1, 2016, we announced that we applied for the withdrawal of regulatory applications pending with the MNPUC for the Sandpiper Project, included in our Liquids segment. In connection with this announcement and other factors, we evaluated the project for impairment. As a result of the analysis, we recognized an impairment loss of $757 million for the year ended December 31, 2016. Of that amount, $267 million was attributable to NCI. The estimated remaining fair value of $55 million of the Sandpiper Project was based on the estimated price that would be received to sell unnecessary pipe, land and other related equipment in its current condition, considering the current market conditions for sale of these assets. The valuation considered a range of potential selling prices from various alternatives that could be used to dispose of these assets. The estimated fair value, excluding $3 million in land, was reclassified to “Other assets, net.” During 2017, we disposed of substantially all of the remaining assets. Refer to Note 7 - Dispositions and Discontinued Operations for further details regarding the sale of unnecessary pipe related to the Sandpiper Project.
During the year ended December 31, 2015, due to contracts that would not be renewed after 2016, we recorded an impairment loss of $63 million to write-off the remaining carrying value of our Berthold rail facility.
94
ENBRIDGE ENERGY PARTNERS, L.P.
NOTES TO THE CONSOLIDATED FINANCIAL STATEMENTS
9. PROPERTY, PLANT AND EQUIPMENT – (continued)
10. VARIABLE INTEREST ENTITIES
Consolidated Variable Interest Entities
Enbridge Energy, Limited Partnership
OLP is a Delaware limited partnership that has established several series of partnership interests. As of December 31, 2017, we owned, directly or indirectly, 100% of the general partner interests in each series of OLP, as well as 100% of the Series LH and Series AC limited partner interests in OLP. In addition, including our ownership of the general partner interests, we directly and indirectly owned 40%, 25% and 1% of the Series EA, Series ME and Series L3R interests in OLP. Our General Partner owns the remaining 60%, 75% and 99% interests in Series EA, Series ME and Series L3R interests in OLP.
We are the primary beneficiary of OLP because (i) through our ownership of the general partner interests in each of the OLP’s series and our limited partner interests in each series, we have the power to direct the activities that most significantly impact OLP’s economic performance; and (ii) we have the obligation to absorb losses and the right to receive residual returns that potentially could be significant to OLP. In addition, we are the entity within the related party group that is most closely associated with OLP.
As of December 31, 2017 and 2016, our consolidated statements of financial position include total assets of $11,676 million and $11,387 million, respectively, and total liabilities of $633 million and $760 million, respectively, related to OLP. Only the assets of OLP can be used to settle OLP’s obligations.
We currently do not have any obligation to provide financial support to OLP, although from time to time, we may provide certain indemnities and guarantees for payment of specified liabilities to third parties in the event that OLP becomes in default under contracts with those third parties.
North Dakota Pipeline Company, L.L.C.
North Dakota Pipeline Company, L.L.C.(NDPC), is a Delaware limited liability company. As of December 31, 2017, we directly owned 100% of the Class A units and 62.5% of the Class B units in NDPC. Williston Basin Pipeline LLC (Williston), an affiliate of MPC, owns the remaining 37.5% of Class B units in NDPC, which were used to fund the Sandpiper Project.
We are the primary beneficiary of NDPC because (i) through our 100% ownership in NDPC’s Class A units and majority ownership in its Class B units, we have the power to direct the activities that most significantly impact NDPC’s economic performance; and (ii) we have the obligation to absorb losses and the right to receive residual returns that potentially could be significant to NDPC.
As of December 31, 2017 and 2016, our consolidated statements of financial position include total assets of $1,004 million and $1,045 million, respectively, and total liabilities of $41 million and $53 million, respectively, related to NDPC. Only the assets of NDPC can be used to settle NDPC’s obligations.
We currently do not have any obligation to provide financial support to NDPC, although from time to time we may provide certain indemnities and guarantees for payment of specified liabilities to third parties in the event that NDPC becomes in default under contracts with those third parties.
Enbridge Holdings (DakTex) L.L.C.
On April 27, 2017, we finalized the joint funding arrangement with our General Partner with respect to our equity investment in the Bakken Pipeline System, held through our investment subsidiary, Enbridge Holdings (DakTex) L.L.C. (DakTex). DakTex is now owned 75% by our General Partner and 25% by us. DakTex owns a 75% equity interest in MarEn. For more information regarding our equity investment, refer to Note 11 - Equity Investments in Joint Ventures.
95
ENBRIDGE ENERGY PARTNERS, L.P.
NOTES TO THE CONSOLIDATED FINANCIAL STATEMENTS
10. VARIABLE INTEREST ENTITIES – (continued)
DakTex is considered a variable interest entity consolidated by us. We have authority as managing member to exclusively manage the business and affairs of DakTex, subject to certain protective voting rights and are subject to removal as managing member only upon certain fundamental changes.
We are the primary beneficiary of DakTex because (i) as the managing partner we have the power to direct the activities of DakTex that most significantly impact its economic performance; and (ii) we have the obligation to absorb losses and the right to receive residual returns that potentially could be significant to DakTex.
As of December 31, 2017, our consolidated statements of financial position include total assets of 1,547 million. DakTex does not have any liabilities. Its sole asset is its investment in MarEn.
The following table includes assets to be used to settle liabilities of our consolidated VIEs and liabilities of our consolidated VIEs for which creditors do not have recourse to our general credit as the primary beneficiary. These assets and liabilities are included in our consolidated statements of financial position.
December 31, | |||||||
2017 | 2016 | ||||||
(in millions) | |||||||
ASSETS | |||||||
Cash and cash equivalents | $ | 35 | $ | 37 | |||
Receivables, trade and other | 62 | 2 | |||||
Due from General Partner and affiliates | 90 | 74 | |||||
Accrued receivables | 101 | 17 | |||||
Other current assets | 22 | 33 | |||||
Property, plant and equipment, net | 12,333 | 12,153 | |||||
Equity investment in joint venture | 1,547 | — | |||||
Other assets, net | 37 | 116 | |||||
LIABILITIES | |||||||
Accounts payable and other | 147 | 168 | |||||
Due to General Partner and affiliates | 37 | 102 | |||||
Interest payable | 4 | 4 | |||||
Environmental liabilities | 23 | 100 | |||||
Property and other taxes payable | 102 | 87 | |||||
Current portion of long-term debt | 100 | — | |||||
Long-term debt | 100 | 199 | |||||
Other long-term liabilities | $ | 161 | $ | 153 | |||
11. EQUITY INVESTMENTS IN JOINT VENTURES
The following table presents our equity investment in a joint venture with MPC and ownership interest in MarEn.
Ownership Interest | December 31, | |||||||||
2017 | 2016 | |||||||||
(in millions) | ||||||||||
MarEn Bakken Company LLC | 75 | % | $ | 1,565 | $ | — | ||||
96
ENBRIDGE ENERGY PARTNERS, L.P.
NOTES TO THE CONSOLIDATED FINANCIAL STATEMENTS
11. EQUITY INVESTMENTS IN JOINT VENTURES – (continued)
On February 15, 2017, our joint venture with MCP, MarEn, closed its acquisition of an interest in the Bakken Pipeline System with Bakken Holdings Company LLC, and affiliate of Energy Transfer Partners, L.P. and Sunoco Logistics Partners L.P., to acquire a 49% equity interest in BPI, which owns 75% of the Bakken Pipeline System. Under this arrangement, we and MPC indirectly hold 75% and 25%, respectively, of MarEn's 49% interest in BPI. The purchase price of our effective 27.6% interest in the Bakken Pipeline System was $1.5 billion.
The Bakken Pipeline System was placed in to service on June 1 2017, which consists of DAPL and ETCOP. It connects the Bakken formation in North Dakota to markets in eastern PADD II and the United States Gulf Coast. For further details regarding out funding arrangement, refer to Note 20 - Related Party Transactions.
We account for our investment in MarEn under the equity method of accounting. For the year ended December 31, 2017, we recognized $52 million in "Other income" in our consolidated statements of income representing our equity earnings for this investment, net of amortization of the excess of the purchase price over the underlying net book value (basis difference).
Our equity investment includes basis difference of the investees' assets at the purchase date, which is comprised of $14 million in goodwill and $931 million in amortizable assets included within the Liquids segment. For the year ended December 31, 2017, we amortized $23 million, which was recorded as a reduction to equity earnings.
Our 75% aggregate investment in and earnings from MarEn is presented in "Equity investment in joint venture" on our consolidated statements financial position and "Other income" on our consolidated statements of income, respectively. The joint venture is included in our Liquids segment. The following tables present summarized balance sheet information as at December 31, 2017 and summarized income statement information for the year ended December 31, 2017.
December 31, | ||||
2017 | ||||
(in millions) | ||||
Non-current assets | $ | 2,062 | ||
Total equity | $ | 2,062 | ||
December 31, | ||||
2017 | ||||
(in millions) | ||||
Income from equity investment | $ | 99 | ||
Amortization of basis difference | (30 | ) | ||
Net income | $ | 69 | ||
97
12. ACCOUNTS PAYABLE AND OTHER
December 31, | |||||||
2017 | 2016 | ||||||
(in millions) | |||||||
Short-term portion of derivative liabilities | $ | 9 | $ | 146 | |||
Accounts payable | 74 | 78 | |||||
Accrued liabilities | 62 | 55 | |||||
Contractor holdbacks | 9 | 44 | |||||
Deferred credits | 13 | 14 | |||||
Other current liabilities | 2 | 6 | |||||
Accrued purchases | 4 | 5 | |||||
Total accounts payable and other | $ | 173 | $ | 348 | |||
13. DEBT
The following table presents the primary components of our outstanding indebtedness with third parties and the interest rates associated with each component as of December 31, 2017 and 2016, before the effect of our interest rate hedging activities. Our indebtedness with related parties is discussed in Note 20 - Related Party Transactions.
98
ENBRIDGE ENERGY PARTNERS, L.P.
NOTES TO THE CONSOLIDATED FINANCIAL STATEMENTS
13. DEBT – (continued)
December 31, | |||||||
2017 | 2016 | ||||||
(in millions) | |||||||
EEP debt obligations: | |||||||
Commercial Paper(1) | $ | 1,303 | $ | 393 | |||
Credit Facilities due 2018 – 2022 (2) | 150 | 1,265 | |||||
6.500% senior notes due April 2018 | 400 | 400 | |||||
9.875% senior notes due March 2019 | 500 | 500 | |||||
5.200% senior notes due March 2020 | 500 | 500 | |||||
4.375% senior notes due October 2020 | 500 | 500 | |||||
4.200% senior notes due September 2021 | 600 | 600 | |||||
5.875% senior notes due October 2025 | 500 | 500 | |||||
5.950% senior notes due June 2033 | 200 | 200 | |||||
6.300% senior notes due December 2034 | 100 | 100 | |||||
7.500% senior notes due April 2038 | 400 | 400 | |||||
5.500% senior notes due September 2040 | 550 | 550 | |||||
7.375% senior notes due October 2045 | 600 | 600 | |||||
Fixed to floating rate junior subordinated notes due 2067 (3) | 400 | 400 | |||||
OLP debt obligations: | |||||||
7.000% senior notes due October 2018 | 100 | 100 | |||||
7.125% senior notes due October 2028 | 100 | 100 | |||||
Total debt | 6,903 | 7,108 | |||||
Unamortized discount | (6 | ) | (6 | ) | |||
Current portion of long-term debt | (500 | ) | — | ||||
Unamortized debt issuance costs | (31 | ) | (36 | ) | |||
Long-term debt | $ | 6,366 | $ | 7,066 | |||
____________
(1) | Individual issuances of commercial paper generally mature in 90 days or less, but are supported by our Credit Facilities and are therefore considered long-term debt as we have the ability and intent to refinance these long-term. The weighted average interest rate was 2.276%. |
(2) | The interest rate was 2.744% |
(3) | Effective October 1, 2017, the Junior Note bore interest at a variable rate equal to three months LIBOR for the related interest period increased by 3.798%. For the three months ended December 31, 2017, the LIBOR rate was 1.335%. |
Commercial Paper
Our commercial paper program provides for the issuance of up to an aggregate principal amount $1.5 billion of commercial paper and is supported by the availability of long-term committed credit facilities and therefore have been classified as long-term debt for the years ended December 31, 2017 and 2016, respectively,
Credit Facilities
The following table provides details of our committed Credit Facilities at December 31, 2017:
Maturity Dates(1) | Total Facilities | Draws(2) (3) (4) | Available | ||||||||||
(in millions) | |||||||||||||
Enbridge Energy Partners, L.P. | 2018 – 2022 | $ | 2,625 | $ | 1,453 | $ | 1,172 | ||||||
____________
99
ENBRIDGE ENERGY PARTNERS, L.P.
NOTES TO THE CONSOLIDATED FINANCIAL STATEMENTS
13. DEBT – (continued)
(1) | Includes $175 million and $185 million of commitments that expire in 2018 and 2020, respectively. |
(2) | Includes facility draws, letters of credit and commercial paper issuances that are back-stopped by the credit facility and excludes our credit agreement with EUS (the EUS 364-day Credit Facility.) |
(3) | Under our commercial paper program, we had net borrowings of approximately $0.9 billion as of December 31, 2017, which includes gross borrowings of $12.9 billion and gross repayments of $12.0 billion |
(4) | Under our Credit Facilities, we had net repayments of approximately $1.1 billion as of December 31, 2017, which includes gross borrowings of $1.9 billion and gross repayments of $3.0 billion |
At December 31, 2017, we had approximately $2.6 billion of committed bank Credit Facilities, which we use to fund our general activities and working capital needs.
In addition to the committed bank credit facilities noted above, we maintain a $175 million uncommitted letter of credit facility. For the year ended December 31, 2017 and 2016, $174 million and $71 million, respectively, were unutilized under this arrangement.
Senior Notes
Our senior notes represent unsecured obligations that rank equally in right of payment with all of our existing and future unsecured and unsubordinated indebtedness. Our senior notes have varying maturities and terms and are structurally subordinated to all existing and future indebtedness and other liabilities, including trade payables of our subsidiaries and the $200 million of senior notes issued by the OLP. The borrowings under our senior notes are non-recourse to our General Partner and Enbridge Management. We either pay or accrue interest semi-annually on our senior notes.
The OLP has $200 million of senior notes outstanding representing unsecured obligations that are structurally senior to our senior notes, which we refer to as the OLP Notes. The OLP Notes consist of $100 million of 7.000% senior notes due in 2018 and $100 million of 7.125% senior notes due 2028. All of the OLP Notes pay interest semi-annually.
The OLP Notes do not contain any covenants restricting the OLP from issuing additional indebtedness. The OLP Notes are subject to make-whole redemption rights and were issued under an indenture (the OLP Indenture) containing certain covenants that restrict our ability, with certain exceptions, to sell, convey, transfer, lease or otherwise dispose of all or substantially all of our assets, except in accordance with the OLP Indenture. We were in compliance with these covenants at December 31, 2017.
On October 6, 2015, we closed a public offering of $1.6 billion of senior unsecured notes, comprised of $500 million aggregate principal amount of notes due October 15, 2020, $500 million aggregate principal amount of senior notes due October 15, 2025 and $600 million aggregate principal amount of notes due October 15, 2045 for net proceeds of approximately $1.6 billion after deducting underwriting discounts and commissions and offering expenses. In connection with the offering, we paid $315 million to settle certain pre-issuance hedges. Of that amount, a loss of $76 million was recognized in interest expense from ineffectiveness. The remaining loss of $238 million recorded in AOCI will be amortized as interest expense over a period of eight to ten years. As the pre-issuance hedge was designed to hedge the interest rate risk associated with the new debt, we have elected to classify the $238 million effective portion of the cash settlement, along with the $76 million of ineffectiveness included in interest expense, as “Net cash provided by operating activities” in the consolidated statement of cash flows.
Junior Subordinated Notes
The $400 million in principal amount of our fixed to floating rate, junior subordinated notes due 2067 (the Junior Notes) represent our unsecured obligations that are subordinate in right of payment to all of our existing and future senior indebtedness. Prior to October 1, 2017, the Junior Notes bore interest at a fixed annual rate of 8.05%, exclusive of any discounts or interest rate hedging activities, payable semi-annually in arrears on April 1 and October 1 of each year. Effective October 1, 2017, the Junior Notes bear interest at a variable rate equal to the three month LIBOR for the related interest period increased by 3.798%, payable quarterly in arrears on January 1, April 1, July 1 and October 1 of each year beginning January 1, 2018. We may elect to defer interest payments on the Junior Notes for up to ten consecutive years on one or more occasions, but not beyond the final repayment date. Until paid, any interest we elect
100
ENBRIDGE ENERGY PARTNERS, L.P.
NOTES TO THE CONSOLIDATED FINANCIAL STATEMENTS
13. DEBT – (continued)
to defer will bear interest at the prevailing interest rate, compounded quarterly. Post October 31, 2017, we may redeem the Junior Notes in whole at any time, or in part at a redemption price equal to the principal amount plus accrued and unpaid interest on the Junior Notes. Our right to optionally redeem the Junior Notes is also limited by our obligation to repay the Junior Notes on the scheduled maturity date which is limited by the Replacement Capital Covenants (Replacement Capital Covenants), which limits the types of financing sources we can use to redeem the Junior Notes in the same manner as to repay the Junior Notes, as outlined above.
The Junior Notes do not restrict our ability to incur additional indebtedness. However, with limited exceptions, during any period we elect to defer interest payments on the Junior Notes, we cannot make cash distribution payments or liquidate any of our equity securities, nor can we or our subsidiaries make any principal and interest payments for any debt that ranks equally with or junior to the Junior Notes.
Debt Covenants
The Credit Facilities and the EUS 364-day Credit Facility contain, among other affirmative and negative covenants, certain financial covenants. A failure to comply with these covenants could result in an event of default under the Credit Facilities, which would prohibit us from declaring or making distributions to our unitholders and would permit acceleration of, and termination of our access to, our indebtedness under the Credit Facilities and the EUS 364-day Credit Facility, and may cause acceleration of our outstanding senior notes. Although we expect to be able to comply with these covenants under each of our Credit Facilities and the EUS 364-day Credit Facility, there can be no assurance that in the future we will be able to do so or that our lenders will be willing to waive such non-compliance or further amend such covenants. As of December 31, 2017, we were in compliance with the terms of all of our financial covenants under the Credit Facilities and the EUS 364-day Credit Facility.
Interest Cost
Our interest cost for the years ended December 31, 2017, 2016 and 2015 is comprised of the following:
For the year ended December 31, | |||||||||||
2017 | 2016 | 2015 | |||||||||
(in millions) | |||||||||||
Term notes (1) | $ | 531 | $ | 428 | $ | 307 | |||||
Commercial paper and credit facility draws | 38 | 33 | 24 | ||||||||
Less: Interest capitalized | (44 | ) | (48 | ) | (39 | ) | |||||
Interest expense, net | $ | 525 | $ | 413 | $ | 292 | |||||
____________
(1) | For the year ended December 31, 2017, interest expense includes reclassification of $168 million loss related to the termination of long-term interest rate swaps as not highly probable to issue long-term debt. |
14. ASSET RETIREMENT OBLIGATIONS
Our AROs relate mostly to the retirement of our crude oil and liquid petroleum pipelines and storage facilities.
A reconciliation of movements to our ARO liabilities is as follows:
101
ENBRIDGE ENERGY PARTNERS, L.P.
NOTES TO THE CONSOLIDATED FINANCIAL STATEMENTS
14. ASSET RETIREMENT OBLIGATIONS – (continued)
December 31, | |||||||
2017 | 2016 | ||||||
(in millions) | |||||||
Balance at beginning of year | $ | 98 | $ | 100 | |||
Revisions in estimates | 3 | (1 | ) | ||||
Accretion expense | 5 | 1 | |||||
Liabilities settled | — | (2 | ) | ||||
Balance at end of year | $ | 106 | $ | 98 | |||
ARO liabilities of $2 million and $104 million are included in "Accounts payable and other" and "Other long-term liabilities," respectively, on our consolidated statements of financial position.
15. NONCONTROLLING INTERESTS
The following tables present additional information regarding NCI as presented on our consolidated statements of financial position and net income (loss) attributable to NCI as presented on our consolidated statements of income:
December 31, | |||||||
2017 | 2016 | ||||||
(in millions) | |||||||
Eastern Access Interests(1) | $ | 1,465 | $ | 1,892 | |||
U.S. Mainline Expansion Interests(1) | 1,643 | 1,621 | |||||
North Dakota Pipeline Company Interests(2) | 15 | 30 | |||||
Line 3 Replacement Interests(1) | 686 | — | |||||
Enbridge Holdings (DakTex) L.L.C. Interests(3) | 1,160 | — | |||||
Total | $ | 4,969 | $ | 3,543 | |||
____________
(1) | Represents the NCI in the OLP arising from the joint funding arrangements with our General Partner and its affiliate to finance certain expansion projects on our Lakehead System, which we refer to as the Eastern Access Project, Mainline Expansion Project and U.S. Line 3 Replacement Program. |
(2) | Represents the NCI in NDPC arising from our agreement with Williston, an affiliate of MPC. |
(3) | Represents the NCI in DakTex arising from the joint funding arrangement with our General Partner to finance our investment in the Bakken Pipeline System through our equity investment in MarEn. |
For the year ended December 31, | |||||||||||
2017 | 2016 | 2015 | |||||||||
(in millions) | |||||||||||
Alberta Clipper Interests | $ | — | $ | — | $ | (1 | ) | ||||
Eastern Access Interests | 152 | 205 | 190 | ||||||||
U.S. Mainline Expansion Interests | 147 | 138 | 108 | ||||||||
North Dakota Pipeline Company Interests(1) | 21 | (271 | ) | — | |||||||
Line 3 Replacement Interests | 29 | — | — | ||||||||
Enbridge Holdings (DakTex) L.L.C. Interests | 39 | — | — | ||||||||
Midcoast Energy Partners, L.P. - Discontinued Operations | (19 | ) | (46 | ) | (76 | ) | |||||
Total | $ | 369 | $ | 26 | $ | 221 | |||||
____________
(1) | Inclusive of impairment on the Sandpiper Project attributable to NCI for the year ending December 31, 2016. For further details, see Note 9 - Property, Plant and Equipment. |
102
ENBRIDGE ENERGY PARTNERS, L.P.
NOTES TO THE CONSOLIDATED FINANCIAL STATEMENTS
15. NONCONTROLLING INTERESTS – (continued)
On June 28, 2017, we completed the Midcoast sale to our General Partner, reducing our NCI in MEP to nil upon the closing of the sale. For further details refer to Note 7 - Dispositions and Discontinued Operations.
On April 27, 2017, we finalized the previously announced joint funding arrangement with our General Partner for our investment in the Bakken Pipeline System. Our equity investment in MarEn is held by our consolidated subsidiary, DakTex. Under the terms of the agreement, our General Partner contributed approximately $1.14 billion in exchange for Class A units in DakTex to obtain its 75% ownership interest while we retain the remaining 25%. NCI represent our General Partner’s 75% interest. For further details refer to Note 20 - Related Party Transactions.
On January 26, 2017, we entered into a joint funding arrangement with our General Partner for the U.S. L3R Program. Under the term of the arrangement, our General Partner will fund 99% and we will fund 1% of the capital costs of the U.S. L3R Program. The carrying amount of our 99% interest in the project at the transaction date was $411 million and was recorded as an increase to NCI. The $40 million difference between the cash received and the carrying amount was recorded as an increase to the capital accounts of our common units, i-units, and General Partner interest on a pro-rated basis. For further details, refer to Note 20 - Related Party Transactions.
On January 26, 2017, we exercised our option under the Eastern Access Project joint funding arrangement to acquire an additional 15% interest in the Eastern Access Project, at its book value of approximately $360 million, which is now in service. This transaction reduced NCI by approximately $360 million. We and our General Partner own 40% and 60% of the partnership interest in Series EA of the OLP, which we refer to as the EA interest, respectively. For further details, refer to Note 20 - Related Party Transactions.
16. PARTNERS' CAPITAL
Our authorized share capital consists of an unlimited number of common shares with no par value.
103
ENBRIDGE ENERGY PARTNERS, L.P.
NOTES TO THE CONSOLIDATED FINANCIAL STATEMENTS
16. PARTNERS' CAPITAL – (continued)
2017 | Series 1 preferred units | Class D units | Class E units | Class F units | Class A common units | Class B common units | i-units | Incentive distribution units | ||||||||
Balance at beginning of year | 48,000,000 | 66,100,000 | 18,114,975 | — | 262,208,428 | 7,825,500 | 81,857,168 | 1,000 | ||||||||
Waiver of units | (48,000,000 | ) | (66,100,000 | ) | — | — | — | — | — | (1,000 | ) | |||||
Issuances | — | — | — | 1,000 | 64,308,682 | — | — | — | ||||||||
Distributions | — | — | — | — | — | — | 7,941,650 | — | ||||||||
Balance at end of year | — | — | 18,114,975 | 1,000 | 326,517,110 | 7,825,500 | 89,798,818 | — | ||||||||
2016 | ||||||||||||||||
Balance at beginning of year | 48,000,000 | 66,100,000 | 18,114,975 | — | 262,208,428 | 7,825,500 | 73,285,739 | 1,000 | ||||||||
Distributions | — | — | — | — | — | — | 8,571,429 | — | ||||||||
Balance at end of year | 48,000,000 | 66,100,000 | 18,114,975 | — | 262,208,428 | 7,825,500 | 81,857,168 | 1,000 | ||||||||
2015 | ||||||||||||||||
Balance at beginning of year | 48,000,000 | 66,100,000 | — | — | 254,208,428 | 7,825,500 | 68,305,187 | 1,000 | ||||||||
Issuances | — | — | 18,114,975 | — | 8,000,000 | — | — | — | ||||||||
Distributions | — | — | — | — | — | — | 4,980,552 | — | ||||||||
Balance at end of year | 48,000,000 | 66,100,000 | 18,114,975 | — | 262,208,428 | 7,825,500 | 73,285,739 | 1,000 | ||||||||
Our capital accounts are comprised of a 2% general partner interest and 98% limited partner interests. Our limited partner interests at December 31, 2017, include Class E units, Class F units, Class A and Class B common units, and i-units. We refer to our Class A and Class B common units collectively as common units. Our limited partners have limited rights of ownership as provided for under our partnership agreement and, as discussed below, the right to participate in our distributions. Our General Partner manages our operations, subject to a delegation of control agreement with Enbridge Management, and participates in our distributions.
Issuance of Class A Units
On April 27, 2017, we funded the redemption of the Series 1 Preferred Units through the issuance of 64 million Class A common units to our General Partner at a price of $18.66 per Class A common unit. The Class A common units were recognized on April 27, 2017, at fair value. The fair value of the Class A common units was $18.57 per unit, the market closing price on April 27, 2017, resulting in a $1.2 billion increase to the Class A unit capital account.
The following table presents the net proceeds from our Class A common unit issuances for the year ended December 31, 2017 and 2015. There were no issuances of Class A common units for the years ended December 31, 2016.
104
ENBRIDGE ENERGY PARTNERS, L.P.
NOTES TO THE CONSOLIDATED FINANCIAL STATEMENTS
16. PARTNERS' CAPITAL – (continued)
Issuance Date | Number of Class A common unit Issued | Offering Price per Class A common units | Net Proceeds to the Partnership(1) | General Partner Contribution(2) | Net Proceeds Including General Partner Contribution | ||||||||||||||
(in millions, except units and per unit amounts) | |||||||||||||||||||
April, 2017 | 64,308,682 | $ | 18.66 | $ | 1,200 | $ | 24 | $ | 1,224 | ||||||||||
March, 2015 | 8,000,000 | $ | 36.70 | $ | 289 | $ | 6 | $ | 295 | ||||||||||
(1) | Net of underwriters’ fees and discounts, commissions and issuance expenses. |
(2) | Contributions made by the General Partner to maintain its 2% general partner interest. |
The proceeds from the April 2017 issuance were used to redeem in full our $1.2 billion of outstanding Series 1 Preferred Units held by our General Partner.
The proceeds from the March 2015 offering were used to fund a portion of our capital expansion projects and for general partnership purposes.
Redemption of Series 1 Preferred Units
On April 27, 2017, we redeemed all of our outstanding Series 1 Preferred Units held by our General Partner at face value of $1.2 billion in cash. The remaining unamortized beneficial conversion feature discount of $9 million was recorded against the capital balance of the General Partner. Additionally, we repaid $357 million in deferred distributions on the Series 1 Preferred Units owed to our General Partner upon the closing of the Midcoast sale.
Simplification of Incentive Distributions
On April 27, 2017, a wholly-owned subsidiary of our General Partner irrevocably waived all of its rights associated with its 66 million Class D units and 1,000 IDUs, in exchange for the issuance of 1,000 Class F units. The waiving of the Class D units and IDUs by a wholly-owned subsidiary of our General Partner represents an extinguishment, resulting in a de-recognition of the Class D units and IDUs at their carrying value. The Class F units were recorded at their fair value of $263 million and the difference between the fair value of the Class F units and the de-recognized Class D units and IDUs were recorded as an increase of $2.7 billion to our General Partner’s capital account. We determined the fair value of the Class F units using an income approach on the basis of discounted cash flows from expected quarterly distributions.
Alberta Clipper Drop Down
On January 2, 2015, we completed a transaction (the Drop Down) pursuant to which we acquired the remaining 66.7% interest in the United States segment of the Alberta Clipper Pipeline from our General Partner. The consideration consisted of approximately 18,114,975 Class E units representing limited partner interests issued to the General Partner. The Class E units were issued at a notional value of $38.31 per unit, determined based on a trailing five-day volume weighted average of our Class A common units as of the date we entered into a contribution agreement with our General Partner outlining the terms of the Drop Down and repaid outstanding borrowings of $306 million to the General Partner.
The Class E units are entitled to the same distributions as Class A common units held by the public and are convertible into Class A common units on a one-for-one basis at the General Partner’s option. The Class E units are redeemable at our option after 30 years, if not earlier converted by the General Partner. The Class E units have a liquidation preference equal to their notional value at December 23, 2014 of $38.31 per unit, which is also the liquidation value of the units. If the aggregate EBITDA attributable to the Series AC interest in the OLP for calendar years 2015 and 2016 is less than $266 million, then 1,305,142 of the Class E units were to be cancelled by us. Aggregate EBITDA exceeded the threshold, and therefore no Class E units were cancelled.
In addition, during each taxable year during the period from January 1, 2015 through December 31, 2037 in which a majority of the Class E units issued on the closing date of the Drop Down remain outstanding, holders of Class A common units and Class B common units will be specially allocated items of gross income that would otherwise be allocated to holders of Class E units, to the extent that such an amount of gross income exists, in an annual amount
105
ENBRIDGE ENERGY PARTNERS, L.P.
NOTES TO THE CONSOLIDATED FINANCIAL STATEMENTS
16. PARTNERS' CAPITAL – (continued)
equal to $40 million. The annual amount of such allocation will be reduced to $20 million for each taxable year beginning after December 31, 2037.
We recorded the Drop Down as an equity transaction. No loss on the acquisition of the remaining ownership interests in Alberta Clipper was recognized in our consolidated statement of income or comprehensive income. We reduced the carrying value of the related NCI in Alberta Clipper of $404 million to zero. In addition, we recorded the Class E units at their fair value of $768 million. We determined the fair value of the Class E units using a market approach based upon the closing price of the Class A common units as of January 2, 2015, adjusted for differences in specific rights such as the liquidation preference granted to the Class E units and other economic factors that would affect the fair value of the Class E units.
The difference of $364 million between the fair value of the Class E units and the carrying value of the NCI in Alberta Clipper was recorded as a reduction to the carrying amounts of the capital accounts of the Class A and Class B common units, the i-units and the General Partner interest on a pro-rated basis. The recording of this transaction reduced the carrying values of the Class A and Class B common units below zero. Our partnership agreement requires that such capital account deficits are brought back to zero, or “cured,” by additional allocations from the capital accounts of the i-units and General Partner interest on a pro-rated basis. As a result the i-units’ and General Partner interest’s capital balances were reduced by $47 million and $1 million, respectively, to cure the deficit balances in the Class A and Class B common units. This initial curing did not impact earnings allocated to either the i-units or the General Partner interest.
Class B common units
All of our outstanding Class B common units are held by our General Partner and have rights similar to our Class A common units, except with respect to certain allocations of taxable income. Class B common units are not publicly traded.
i-units
The i-units are a separate class of our limited partner interests, all of which are owned by Enbridge Management and are not publicly traded.
Enbridge Management, as the owner of our i-units, votes together with the holders of the common units as a single class. However, the i-units vote separately as a class on the following matters:
• | Any proposed action that would cause us to be treated as a corporation for United States federal income tax purposes; |
• | Amendments to our partnership agreement that would have a material adverse effect on the holder of our i-units, unless, under our partnership agreement, the amendment could be made by our General Partner without a vote of holders of any class of units; |
• | The removal of our General Partner and the election of a successor general partner; and |
• | The transfer by our General Partner of its general partner interest to a non-affiliated person that requires a vote of holders of units under our partnership agreement and the admission of that person as a general partner. |
In all cases, Enbridge Management will vote or refrain from voting its i-units in the same manner that owners of Enbridge Management’s listed shares vote or refrain from voting their listed shares. Furthermore, under the terms of our partnership agreement, we agree that we will not, except in liquidation, make a distribution on an i-unit other than in additional i-units or a security that has in all material respects the same rights and privileges as the i-units.
Curing
Our limited partnership agreement does not permit capital deficits to accumulate in the capital accounts of any limited partner and thus requires that such capital account deficits be “cured” by additional allocations from the positive capital accounts of the common units, i-units, and our General Partner, generally on a pro-rated basis.
106
ENBRIDGE ENERGY PARTNERS, L.P.
NOTES TO THE CONSOLIDATED FINANCIAL STATEMENTS
16. PARTNERS' CAPITAL – (continued)
For the year ended December 31, 2017, the carrying amounts for the capital accounts of the Class B common units were reduced below zero due to distributions to limited partners in excess of earnings and were subsequently cured. Class A units and i-units had positive capital balances and therefore, as outlined in the partnership agreement, we allocated earnings of $71 million to our General Partner to recover previous curing allocations made by the General Partner.
For the year ended December 31, 2016 , the carrying amounts for the capital accounts of the Class A and Class B common units were reduced below zero due to distributions to limited partners in excess of earnings attributable to such limited partners. As a result, the capital balance of the i-units and our General partner interests were reduced by $126 million and $790 million, respectively, to cure the applicable deficit balance.
Distributions
Our partnership agreement requires us to distribute 100% of our “available cash”, which is generally defined in our partnership agreement as the sum of all cash receipts plus reductions in cash reserves established in prior quarters less cash disbursements and additions to cash reserves in that calendar quarter. Enbridge Management, as delegate of our General Partner under the delegation of control agreement, computes the amount of our “available cash.” Typically, our General Partner and owners of our common units will receive distributions in cash. We also retain reserves to provide for the proper conduct of our business, to stabilize distributions to our unitholders and our General Partner and, as necessary, to comply with the terms of our agreements or obligations (including any reserves required under debt instruments for future principal and interest payments and for future capital expenditures). We make distributions to our partners no later than 45 days following the end of each calendar quarter in accordance with their respective percentage interests.
Our General Partner is granted discretion by our partnership agreement, which discretion has been delegated to Enbridge Management, subject to the approval of our General Partner in certain cases, to establish, maintain and adjust reserves for future operating expenses, debt service, maintenance capital expenditures, and distributions for the next four quarters. These reserves are not restricted by magnitude, but only by type of future cash requirements with which they can be associated. When Enbridge Management determines our quarterly distributions, it considers current and expected reserve needs along with current and expected cash flows to identify the appropriate sustainable distribution level.
Distributions of our available cash are generally made 98% to holders of our limited partner units and 2% to our General Partner. However, distributions are subject to the payment of incentive distributions to our General Partner to the extent that certain target levels of distributions to the unitholders are achieved. Effective April 27, 2017, the wholly-owned subsidiary of our General Partner irrevocable waived all of its rights associated with its 66 million Class D units and 1,000 IDUs, in exchange for the issuance of 1,000 Class F units. Refer to Note 4 - Net Income Per Limited Partner Unit for further details regarding our distributions.
As set forth in our partnership agreement, cash distributions declared on our i-units will be paid by a distribution of additional i-units such that the cash is retained and used in our operations and to finance a portion of our capital expansion projects.
Enbridge Management, as holder of the i-units, does not receive distributions in cash. Instead, each time that we make a cash distribution in respect to our General Partner interest, Class A common units, Class B common units and Class E units, the number of i-units owned by Enbridge Management and the percentage of our total units owned by Enbridge Management will increase automatically under the provisions of our partnership agreement with the result that the number of i-units owned by Enbridge Management will equal the number of Enbridge Management’s listed and voting shares that are then outstanding. The amount of this increase in i-units is determined by dividing the cash amount distributed per common unit by the average price of one of Enbridge Management’s listed shares on the NYSE for the 10 trading day period immediately preceding the ex-dividend date for Enbridge Management’s shares multiplied by the number of shares outstanding on the record date. The cash equivalent amount of the additional i-units is treated as if it had actually been distributed for purposes of determining the distributions to be made to our General Partner.
107
ENBRIDGE ENERGY PARTNERS, L.P.
NOTES TO THE CONSOLIDATED FINANCIAL STATEMENTS
16. PARTNERS' CAPITAL – (continued)
Distribution to Partners'
The following table sets forth our distributions, as approved by the board of directors of Enbridge Management, during the years ended December 31, 2017, 2016 and 2015.
Distribution Declaration Date | Record Date | Distribution Payment Date | Distribution per Unit | Cash Available for Distribution | Amount of Distribution of i-units to i-unit Holders(1) | Retained from General Partner(2) | Distribution of Cash | |||||||||||||||||
(in millions, except per unit amounts) | ||||||||||||||||||||||||
2017 | ||||||||||||||||||||||||
October 27 | November 7 | November 14 | $ | 0.350 | $ | 161 | $ | 30 | $ | 1 | $ | 130 | ||||||||||||
July 28 | August 7 | August 14 | $ | 0.350 | 160 | 29 | 1 | 130 | ||||||||||||||||
April 27 | May 8 | May 15 | $ | 0.350 | 160 | 30 | 1 | 129 | ||||||||||||||||
January 26 | February 7 | February 14 | $ | 0.583 | 265 | 48 | 1 | 216 | ||||||||||||||||
$ | 746 | $ | 137 | $ | 4 | $ | 605 | |||||||||||||||||
2016 | ||||||||||||||||||||||||
October 28 | November 7 | November 14 | $ | 0.583 | $ | 264 | $ | 47 | $ | 1 | $ | 216 | ||||||||||||
July 28 | August 5 | August 12 | $ | 0.583 | 262 | 45 | 1 | 216 | ||||||||||||||||
April 29 | May 6 | May 13 | $ | 0.583 | 261 | 44 | 1 | 216 | ||||||||||||||||
January 29 | February 5 | February 12 | $ | 0.583 | 260 | 43 | 1 | 216 | ||||||||||||||||
$ | 1,047 | $ | 179 | $ | 4 | $ | 864 | |||||||||||||||||
2015 | ||||||||||||||||||||||||
October 30 | November 6 | November 13 | $ | 0.583 | $ | 259 | $ | 41 | $ | 1 | $ | 217 | ||||||||||||
July 30 | August 7 | August 14 | $ | 0.583 | 258 | 41 | 1 | $ | 216 | |||||||||||||||
April 30 | May 8 | May 15 | $ | 0.570 | 250 | 40 | 1 | $ | 209 | |||||||||||||||
January 29 | February 6 | February 13 | $ | 0.570 | 234 | 39 | 1 | $ | 194 | |||||||||||||||
$ | 1,001 | $ | 161 | $ | 4 | $ | 836 | |||||||||||||||||
____________
(1) | We issued 7,941,650, 8,571,429 and 4,980,552 i-units to Enbridge Management, L.L.C., the sole owner of our i-units, during 2017, 2016 and 2015, respectively, in lieu of cash distributions. |
(2) | We retained an amount equal to 2% of the i-unit distribution from our General Partner to maintain its 2% general partner interest in us. |
17. DERIVATIVE FINANCIAL INSTRUMENTS AND HEDGING ACTIVITIES
Our net income and cash flows are subject to volatility stemming from changes in interest rates on our variable rate debt obligations and fluctuations in commodity prices of crude oil. As a result of the Midcoast sale, our net income and cash flows are no longer subject to volatility stemming from fluctuation in the prices of natural gas, NGLs, condensates and fractionation margins. Our interest rate risk exposure results from changes in interest rates on our variable rate debt. Our exposure to commodity price risk exists within our Liquids segment. We use derivative financial instruments, such as futures, forwards, swaps, options and other financial instruments with similar characteristics, to manage the risks associated with market fluctuations in interest rates and commodity prices, as well as to reduce volatility in our cash flows. Based on our risk management policies, all of our derivative financial instruments, including those that are not designated for hedge accounting treatment, are employed in connection with an underlying asset, liability or forecasted transaction and are not entered into with the objective of speculating on interest rates or commodity prices. We have hedged a portion of our exposure to the variability in future cash flows associated with the risks discussed above in future periods in accordance with our risk management policies. Our derivative instruments that are designated for hedge accounting under authoritative guidance are classified as cash flow hedges.
Derivative Positions
108
ENBRIDGE ENERGY PARTNERS, L.P.
NOTES TO THE CONSOLIDATED FINANCIAL STATEMENTS
17. DERIVATIVE FINANCIAL INSTRUMENTS AND HEDGING ACTIVITIES – (continued)
Our derivative financial instruments are included at their fair values in the consolidated statements of financial position as follows:
December 31, | |||||||
2017 | 2016 | ||||||
(in millions) | |||||||
Accounts payable and other | (9 | ) | (146 | ) | |||
Other long-term liabilities | (2 | ) | (21 | ) | |||
$ | (11 | ) | $ | (167 | ) | ||
The changes in the liabilities associated with our derivatives are primarily attributable to the effects of new derivative transactions we have entered at prevailing market prices, settlement of maturing derivatives and the change in forward market prices of our remaining hedges. Our portfolio of derivative financial instruments is largely comprised of interest rate contracts and crude oil sales contracts.
The table below summarizes our derivative balances by counterparty credit quality (any negative amounts represent our net obligations to pay the counterparty).
December 31, | |||||||
2017 | 2016 | ||||||
(in millions) | |||||||
Counterparty Credit Quality(1) | |||||||
AA | $ | (4 | ) | $ | (79 | ) | |
A | (7 | ) | (59 | ) | |||
Lower than A | — | (29 | ) | ||||
$ | (11 | ) | $ | (167 | ) | ||
____________
(1) | As determined by nationally-recognized statistical ratings organizations. |
When credit thresholds are met pursuant to the terms of our ISDA®, financial contracts, we have the right to require collateral from our counterparties. We include any cash collateral received or posted in the balances listed above. At December 31, 2017 and 2016, we did not have any cash collateral. Cash collateral is classified as “Restricted cash” in our consolidated statements of financial position.
We provided no letters of credit relating to our liability exposure pursuant to margin threshold in effect at December 31, 2017. We provided letters of credit totaling $120 million at December 31, 2016, under our ISDA® agreements. The ISDA® agreements and associated credit support, which govern our financial derivative transactions, contain no credit rating downgrade triggers that would accelerate the maturity dates of our outstanding transactions. A change in ratings is not an event of default under these instruments, and the maintenance of a specific minimum credit rating is not a condition to transacting under the ISDA® agreements. In the event of a credit downgrade, additional collateral may be required to be posted under the agreement if we are in a liability position to our counterparty, but the agreement will not automatically terminate and require immediate settlement of all future amounts due.
The ISDA® agreements, in combination with our master netting agreements, and credit arrangements governing our interest rate and commodity swaps require that collateral be posted per tiered contractual thresholds based on the credit rating of each counterparty. We generally provide letters of credit to satisfy such collateral requirements under our ISDA® agreements. These agreements will require additional collateral postings of up to 100% on net liability positions in the event of a credit downgrade below investment grade. Automatic termination clauses which exist are related only to non-performance activities, such as the refusal to post collateral when contractually required to do so. When we are holding an asset position, our counterparties are likewise required to post collateral on their liability (our
109
ENBRIDGE ENERGY PARTNERS, L.P.
NOTES TO THE CONSOLIDATED FINANCIAL STATEMENTS
17. DERIVATIVE FINANCIAL INSTRUMENTS AND HEDGING ACTIVITIES – (continued)
asset) exposures, also determined by tiered contractual collateral thresholds. Counterparty collateral may consist of cash or letters of credit, both of which must be fulfilled with immediately available funds.
In the event that our credit ratings were to decline below the lowest level of investment grade, as determined by S&P and Moody’s, we would be required to provide additional amounts under our existing letters of credit to meet the requirements of our ISDA® agreements. For example, if our credit ratings had been below the lowest level of investment grade at December 31, 2017 we would have been required to provide additional letters of credit in the amount of $12 million related to our positions.
At December 31, 2017 and 2016, we had credit concentrations in the following industry sectors, as presented below:
December 31, | |||||||
2017 | 2016 | ||||||
(in millions) | |||||||
United States financial institutions and investment banking entities | $ | (7 | ) | $ | (122 | ) | |
Non-United States financial institutions | (4 | ) | (45 | ) | |||
$ | (11 | ) | $ | (167 | ) | ||
Gross derivative balances are presented below before the effects of collateral received or posted and without the effects of master netting arrangements. Both our assets and liabilities are adjusted for non-performance risk, which is statistically derived. This credit valuation adjustment model considers existing derivative asset and liability balances in conjunction with contractual netting and collateral arrangements, current market data such as credit default swap rates and bond spreads and probability of default assumptions to quantify an adjustment to fair value. For credit modeling purposes, collateral received is included in the calculation of our assets, while any collateral posted is excluded from the calculation of the credit adjustment. Our credit exposure for these OTC derivatives is directly with our counterparty and continues until the maturity or termination of the contracts.
Effect of Derivative Instruments on the Consolidated Statements of Financial Position
Asset Derivatives | Liability Derivatives | ||||||||||||||||
Fair Value at December 31, | Fair Value at December 31, | ||||||||||||||||
Financial Position Location | 2017 | 2016 | 2017 | 2016 | |||||||||||||
(in millions) | |||||||||||||||||
Derivatives designated as hedging instruments:(1) | |||||||||||||||||
Interest rate contracts | Accounts payable and other | $ | — | $ | — | $ | (5 | ) | $ | (144 | ) | ||||||
Interest rate contracts | Other long-term liabilities | — | — | (1 | ) | (21 | ) | ||||||||||
— | — | (6 | ) | (165 | ) | ||||||||||||
Derivatives not designated as hedging instruments: | |||||||||||||||||
Commodity contracts | Accounts payable and other | — | — | (4 | ) | $ | (2 | ) | |||||||||
Commodity contracts | Other long-term liabilities | — | — | (1 | ) | — | |||||||||||
— | — | (5 | ) | (2 | ) | ||||||||||||
Total derivative instruments | $ | — | $ | — | $ | (11 | ) | $ | (167 | ) | |||||||
____________
(1) | Includes items currently designated as hedging instruments. Excludes the portion of de-designated hedges which may have a component remaining in AOCI. |
Accumulated Other Comprehensive Income
We record the change in fair value of our effective cash flow hedges in AOCI until the derivative financial instruments are settled, at which time they are reclassified to earnings. As of December 31, 2017 and 2016, we included in AOCI
110
ENBRIDGE ENERGY PARTNERS, L.P.
NOTES TO THE CONSOLIDATED FINANCIAL STATEMENTS
17. DERIVATIVE FINANCIAL INSTRUMENTS AND HEDGING ACTIVITIES – (continued)
unrecognized losses of approximately $192 million and $223 million, respectively, associated with derivative financial instruments that qualified for and were classified as cash flow hedges of forecasted transactions that were subsequently de-designated, settled, or terminated. These losses are reclassified to earnings over the periods during which the originally hedged forecasted transactions affect earnings.
No commodity hedges were de-designated during the year ended December 31, 2017 and 2016. We estimate that approximately $36 million, representing unrealized net losses from our cash flow hedging activities based on pricing and positions at December 31, 2017, will be reclassified from AOCI to earnings during the next 12 months.
Effect of Derivative Instruments on the Consolidated Statements of Income and Accumulated Other Comprehensive Income
Derivatives in Cash Flow Hedging Relationships | Amount of Gain (Loss) Recognized in AOCI on Derivative (Effective Portion) | Location of Gain (Loss) Reclassified from AOCI to Earnings (Effective Portion) | Amount of Gain (Loss) Reclassified from AOCI to Earnings (Effective Portion)(1) | Location of Gain (Loss) Recognized in Earnings on Derivative (Ineffective Portion and Amount Excluded from Effectiveness Testing)(1) | Amount of Gain (Loss) Recognized in Earnings on Derivative (Ineffective Portion and Amount Excluded from Effectiveness Testing)(2) | |||||||||||
(in millions) | ||||||||||||||||
For the year ended December 31, 2017 | ||||||||||||||||
Interest rate contracts | $ | 109 | Interest expense | $ | (208 | ) | Interest expense | $ | 50 | |||||||
Total | $ | 109 | $ | (208 | ) | $ | 50 | |||||||||
For the year ended December 31, 2016 | ||||||||||||||||
Interest rate contracts | $ | (1 | ) | Interest expense | $ | (39 | ) | Interest expense | $ | (7 | ) | |||||
Total | $ | (1 | ) | $ | (39 | ) | $ | (7 | ) | |||||||
For the year ended December 31, 2015 | ||||||||||||||||
Interest rate contracts | $ | 87 | Interest expense | $ | (22 | ) | Interest expense | $ | 99 | |||||||
Total | $ | 87 | $ | (22 | ) | $ | 99 | |||||||||
____________
(1) | Includes reclassification of $168 million loss related to the termination of long-term interest rate swaps as not highly probable to issue long-term debt. |
(2) | Includes only the ineffective portion of derivatives that are designated as hedging instruments and does not include net gains or losses associated with derivatives that do not qualify for hedge accounting treatment. |
Components of Accumulated Other Comprehensive Income
Cash Flow Hedges | |||||||
2017 | 2016 | ||||||
(in millions) | |||||||
Balance at January 1 | $ | (339 | ) | $ | (370 | ) | |
Other comprehensive income before reclassifications | (68 | ) | (8 | ) | |||
Amounts reclassified from AOCI(1)(2) | 208 | 39 | |||||
Net other comprehensive income | 140 | 31 | |||||
Balance at December 31 | $ | (199 | ) | $ | (339 | ) | |
____________
(1) | For additional details on the amounts reclassified from AOCI, reference the Reclassifications from Accumulated Other Comprehensive Income table below. |
(2) | Includes reclassification of $168 million loss related to the termination of long-term interest rate swaps as not highly probable to issue long-term debt. |
Reclassifications from Accumulated Other Comprehensive Income
111
ENBRIDGE ENERGY PARTNERS, L.P.
NOTES TO THE CONSOLIDATED FINANCIAL STATEMENTS
17. DERIVATIVE FINANCIAL INSTRUMENTS AND HEDGING ACTIVITIES – (continued)
For the year ended December 31, | |||||||||||
2017 | 2016 | 2015 | |||||||||
(in millions) | |||||||||||
Losses on cash flow hedges: | |||||||||||
Interest Rate Contracts(1) | $ | 208 | $ | 39 | $ | 22 | |||||
Total Reclassifications from AOCI | $ | 208 | $ | 39 | $ | 22 | |||||
____________
(1) | Loss reported within “Interest expense, net” in the consolidated statements of income. |
Effect of Derivative Instruments on Consolidated Statements of Income
Derivatives Not Designated as Hedging Instruments | Location of Gain (Loss) Recognized in Earnings | December 31, | ||||||||||||
2017 | 2016 | 2015 | ||||||||||||
Amount of Gain (Loss) Recognized in Earnings(1)(2) | ||||||||||||||
(in millions) | ||||||||||||||
Commodity contracts | Transportation and other services(3) | $ | (3 | ) | $ | (3 | ) | $ | 11 | |||||
Total | $ | (3 | ) | $ | (3 | ) | $ | 11 | ||||||
____________
(1) | Does not include settlements associated with derivative instruments that settle through physical delivery. |
(2) | Includes only net gains or losses associated with those derivatives that do not receive hedge accounting treatment and does not include the ineffective portion of derivatives that are designated as hedging instruments. |
(3) | Includes settlement gains of nil, $6 million, and $27 million for the years ended December 31, 2017, 2016 and 2015, respectively. |
We record the fair market value of our derivative financial and physical instruments in the consolidated statements of financial position as current and long-term assets or liabilities on a gross basis. However, the terms of the ISDA®, which govern our financial contracts and our other master netting agreements, allow the parties to elect in respect of all transactions under the agreement, in the event of a default and upon notice to the defaulting party, for the non-defaulting party to set-off all settlement payments, collateral held and any other obligations (whether or not then due), which the non-defaulting party owes to the defaulting party. The effect of the rights of set-off are outlined below.
Offsetting of Financial Liabilities and Derivative Liabilities
As of December 31, 2017 | |||||||||||||||||||
Gross Amount of Recognized Liabilities | Gross Amount Offset in the Statement of Financial Position | Net Amount of Liabilities Presented in the Statement of Financial Position | Gross Amount Not Offset in the Statement of Financial Position | Net Amount | |||||||||||||||
(in millions) | |||||||||||||||||||
Description: | |||||||||||||||||||
Derivatives | $ | (11 | ) | $ | — | $ | (11 | ) | $ | — | $ | (11 | ) | ||||||
112
ENBRIDGE ENERGY PARTNERS, L.P.
NOTES TO THE CONSOLIDATED FINANCIAL STATEMENTS
17. DERIVATIVE FINANCIAL INSTRUMENTS AND HEDGING ACTIVITIES – (continued)
As of December 31, 2016 | |||||||||||||||||||
Gross Amount of Recognized Liabilities | Gross Amount Offset in the Statement of Financial Position | Net Amount of Liabilities Presented in the Statement of Financial Position | Gross Amount Not Offset in the Statement of Financial Position | Net Amount | |||||||||||||||
(in millions) | |||||||||||||||||||
Description: | |||||||||||||||||||
Derivatives | $ | (167 | ) | $ | — | $ | (167 | ) | $ | — | $ | (167 | ) | ||||||
Inputs to Fair Value Derivative Instruments
The following table sets forth by level within the fair value hierarchy our financial assets and liabilities that were accounted for at fair value on a recurring basis as of December 31, 2017 and 2016. We classify financial assets and liabilities in their entirety based on the lowest level of input that is significant to the fair value measurement. Our assessment of the significance of a particular input to the fair value measurement requires judgment and may affect our valuation of the financial assets and liabilities and their placement within the fair value hierarchy. For the periods ended December 31, 2017 and 2016, we did not have any Level 3 derivative instruments.
December 31, 2017 | December 31, 2016 | ||||||
Level 2 | Level 2 | ||||||
(in millions) | |||||||
Interest rate contracts | $ | (6 | ) | $ | (165 | ) | |
Commodity contracts: | |||||||
Financial | (5 | ) | (2 | ) | |||
$ | (11 | ) | $ | (167 | ) | ||
Qualitative Information about Level 2 Fair Value Measurements
We categorize, as Level 2, the fair value of assets and liabilities that we measure with either directly or indirectly observable inputs as of the measurement date, where pricing inputs are other than quoted prices in active markets for the identical instrument. This category includes both OTC transactions valued using exchange traded pricing information in addition to assets and liabilities that we value using either models or other valuation methodologies derived from observable market data. These models are primarily industry-standard models that consider various inputs including: (i) quoted prices for assets and liabilities; (ii) time value; and (iii) current market and contractual prices for the underlying instruments, as well as other relevant economic measures. Substantially all of these inputs are observable in the marketplace throughout the full term of the assets and liabilities, can be derived from observable data, or are supported by observable levels at which transactions are executed in the marketplace.
Fair Value Measurements of Commodity Derivatives
The following table provides summarized information about the fair values of expected cash flows of our outstanding commodity based swaps and physical contracts at December 31, 2017 and 2016.
113
ENBRIDGE ENERGY PARTNERS, L.P.
NOTES TO THE CONSOLIDATED FINANCIAL STATEMENTS
17. DERIVATIVE FINANCIAL INSTRUMENTS AND HEDGING ACTIVITIES – (continued)
At December 31, 2017 | At December 31, 2016 | ||||||||||||||||||||||||
Wtd. Average Price(2) | Fair Value(3) | Fair Value(3) | |||||||||||||||||||||||
Commodity | Notional(1) | Receive | Pay | Asset | Liability | Asset | Liability | ||||||||||||||||||
Portion of contracts matured in 2017 | |||||||||||||||||||||||||
Swaps: | |||||||||||||||||||||||||
Receive fixed/pay variable | Crude Oil | 123,832 | $ | 51.91 | $ | 51.98 | $ | — | $ | — | $ | — | $ | (2 | ) | ||||||||||
Portion of contracts maturing in 2018 | |||||||||||||||||||||||||
Swaps: | |||||||||||||||||||||||||
Receive fixed/pay variable | Crude Oil | 498,955 | $ | 50.71 | $ | 59.31 | $ | — | $ | (4 | ) | $ | — | $ | — | ||||||||||
Portion of contracts maturing in 2019 | |||||||||||||||||||||||||
Swaps: | |||||||||||||||||||||||||
Receive fixed/pay variable | Crude Oil | 353,685 | $ | 55.22 | $ | 55.86 | $ | — | $ | (1 | ) | $ | — | $ | — | ||||||||||
____________
(1) | Volumes of crude oil are measured in Bbl. |
(2) | Weighted average prices received and paid are in $/Bbl for crude oil. |
(3) | The fair value is determined based on quoted market prices at December 31, 2017 and 2016, respectively, discounted using the swap rate for the respective periods to consider the time value of money. Fair values exclude credit valuation adjustment gains of nil at December 31, 2017 and 2016, as well as cash collateral received. |
Fair Value Measurements of Interest Rate Derivatives
We enter into interest rate swaps, caps and derivative financial instruments with similar characteristics to manage the cash flow associated with future interest rate movements on our indebtedness. The following table provides information about our current interest rate derivatives for the specified periods.
Date of Maturity & Contract Type | Accounting Treatment | Notional | Average Fixed Rate(1) | Fair Value(2) at | |||||||||||||
December 31, 2017 | December 31, 2016 | ||||||||||||||||
(in millions) | |||||||||||||||||
Contracts matured in 2017 | |||||||||||||||||
Interest Rate Swaps – Pay Fixed | Cash Flow Hedge | $ | 500 | 2.21 | % | $ | — | $ | (1 | ) | |||||||
Contracts maturing in 2018 | |||||||||||||||||
Interest Rate Swaps – Pay Fixed | Cash Flow Hedge | $ | 810 | 2.24 | % | $ | — | $ | (9 | ) | |||||||
Contracts maturing in 2019 | |||||||||||||||||
Interest Rate Swaps – Pay Fixed | Cash Flow Hedge | $ | 620 | 2.96 | % | $ | (6 | ) | $ | (7 | ) | ||||||
Contracts settled prior to maturity | |||||||||||||||||
2017 - Pre-issuance Hedges | Cash Flow Hedge | $ | 1,000 | 4.07 | % | $ | — | $ | (136 | ) | |||||||
2018 - Pre-issuance Hedges | Cash Flow Hedge | $ | 350 | 3.08 | % | $ | — | $ | (13 | ) | |||||||
____________
(1) | Interest rate derivative contracts are based on the one-month or three-month LIBOR. |
(2) | The fair value is determined from quoted market prices at December 31, 2017 and 2016, respectively, discounted using the swap rate for the respective periods to consider the time value of money. Fair values are presented in millions of dollars and exclude credit valuation adjustment gains of approximately nil and $1 million at December 31, 2017 and 2016, respectively. |
Fair Value Measurements of Other Financial Instruments
The carrying amounts of our outstanding commercial paper, borrowings under our Credit Facilities, and the EUS 364-day Credit Facility approximate their fair values at December 31, 2017 and 2016, respectively, due to the short-
114
ENBRIDGE ENERGY PARTNERS, L.P.
NOTES TO THE CONSOLIDATED FINANCIAL STATEMENTS
17. DERIVATIVE FINANCIAL INSTRUMENTS AND HEDGING ACTIVITIES – (continued)
term nature and frequent repricing of the amounts outstanding under these obligations. The fair value of our outstanding commercial paper and borrowings under our Credit Facilities and the EUS 364-day Credit Facility are included with our long-term debt obligations above since we have the ability and the intent to refinance the amounts outstanding on a long-term basis.
The approximate fair value of our fixed-rate debt obligations was $5.8 billion and $6.1 billion at December 31, 2017 and 2016, respectively. We determined the approximate fair values using a standard methodology that incorporates pricing points that are obtained from independent, third-party investment dealers who actively make markets in our debt securities. We use these pricing points to calculate the present value of the principal obligation to be repaid at maturity and all future interest payment obligations for any debt outstanding. The fair value of our long-term debt obligations is categorized as Level 2 within the fair value hierarchy.
18. INCOME TAXES
We compute our income tax expense by applying a Texas state franchise tax rate to modified gross margin. Subsequent to the Midcoast sale, we are no longer subject to the Texas Margin Tax since all of our Texas activity was a result of owning these assets.
For the years ended December 31, 2017, 2016 and 2015, our Texas state franchise tax rate was 0.4%. Our income tax expense is summarized below:
For the year ended December 31, | |||||||||||
2017 | 2016 | 2015 | |||||||||
(in millions) | |||||||||||
Current state | $ | (5 | ) | $ | 3 | $ | 4 | ||||
Deferred state | (3 | ) | (4 | ) | (1 | ) | |||||
Total income tax (benefit) expense | $ | (8 | ) | $ | (1 | ) | $ | 3 | |||
Our effective tax rate is calculated by dividing the income tax expense by the pretax net book income or loss. The income base for calculating our income tax expense is modified gross margin for Texas rather than pretax net book income or loss. As a result, this difference is the only reconciling item between the statutory and effective income tax rate. Our effective tax rate is as follows:
For the year ended December 31, | |||||||||||
2017 | 2016 | 2015 | |||||||||
(in millions) | |||||||||||
Income before income tax | $ | 700 | $ | 115 | $ | 742 | |||||
State income tax (benefit) expense | $ | (8 | ) | $ | (1 | ) | $ | 3 | |||
Effective income tax rate | (1.1 | )% | (0.9 | )% | 0.4 | % | |||||
Accounting for Uncertainty in Income Taxes
The following is a reconciliation of our beginning and ending balance of unrecognized tax benefits in millions:
December 31, | |||||||||||
2017 | 2016 | 2015 | |||||||||
(in millions) | |||||||||||
Unrecognized tax benefits at January 1 | $ | 39 | $ | 37 | $ | 33 | |||||
Additions for tax positions taken in current period | 1 | 2 | 4 | ||||||||
Lapses of statute of limitations | (6 | ) | — | — | |||||||
Unrecognized tax benefits at December 31 | $ | 34 | $ | 39 | $ | 37 | |||||
115
ENBRIDGE ENERGY PARTNERS, L.P.
NOTES TO THE CONSOLIDATED FINANCIAL STATEMENTS
18. INCOME TAXES – (continued)
As of December 31, 2017, 2016 and 2015, the entire balance of unrecognized tax benefits would favorably affect our effective tax rate in future periods if recognized. It is reasonably possible that our liability for unrecognized tax benefits will not change during the next twelve months. We also recognized interest accrued related to unrecognized tax benefits and penalties as income tax expense. As of December 31, 2017, we accrued penalties of $1 million and interest of $1 million. As of December 31, 2016, we accrued penalties of $2 million and interest of $1 million. Furthermore, we recognize accrued interest income related to unrecognized tax benefits in interest income when the related unrecognized tax benefits are recognized. As such, at December 31, 2017 and 2016, $1 million and $1 million of accrued interest income, respectively, has not been included in the balance of unrecognized tax benefits.
Our tax years are generally open to examination by the IRS and state revenue authorities for calendar years ended December 31, 2017, 2016 and 2015.
US TAX REFORM
On December 22, 2017, United States legislation referred to as the "Tax Cuts and Jobs Act" (the TCJA) was signed into law. Substantially all of the provisions of the TCJA are effective for taxable years beginning after December 31, 2017. The TCJA includes significant changes to the Internal Revenue Code of 1986 (as amended, the Code), including amendments which significantly change the taxation of individual and business entities. The most significant change included in the TCJA is a reduction in the corporate federal income tax rate from 35% to 21%. Changes in the Code from the TCJA did not have a material impact on our financial statements in 2017.
19. CHANGES IN OPERATING ASSETS AND LIABILITIES
Changes in our working capital accounts are shown in the following table:
For the year ended December 31, | ||||||||
2017 | 2016 | 2015 | ||||||
(in millions) | ||||||||
Receivables, trade and other | (59 | ) | 6 | 18 | ||||
Due from General Partner and affiliates | (26 | ) | (42 | ) | (31 | ) | ||
Accrued receivables | (86 | ) | 3 | 9 | ||||
Inventory | 1 | — | 10 | |||||
Current and long-term other assets | 47 | 8 | (40 | ) | ||||
Due to General Partner and affiliates | (127 | ) | (14 | ) | 28 | |||
Accounts payable and other | (26 | ) | (76 | ) | 5 | |||
Environmental liabilities | (91 | ) | (19 | ) | (44 | ) | ||
Accrued purchases | (2 | ) | 3 | 2 | ||||
Interest payable | (5 | ) | (4 | ) | 24 | |||
Current income tax payable | 1 | (2 | ) | — | ||||
Property and other taxes payable | 15 | 7 | 10 | |||||
Changes in operating assets and liabilities | (358 | ) | (130 | ) | (9 | ) | ||
116
20. RELATED PARTY TRANSACTIONS
Administrative and Workforce Related Services
We do not directly employ any of the individuals responsible for managing or operating our business nor do we have any directors. Enbridge and its affiliates provide management and we obtain managerial, administrative, operational and workforce related services from our General Partner, Enbridge Management and affiliates of Enbridge pursuant to service agreements among our General Partner, Enbridge Management, affiliates of Enbridge, and us. Pursuant to these service agreements, we have agreed to reimburse our General Partner, Enbridge Management and affiliates of Enbridge, for the cost of managerial, administrative, operational and director services they provide to us. Where directly attributable, the cost of all compensation, benefits expenses and employer expenses for these employees are charged directly by Enbridge to the appropriate affiliate. Enbridge does not record any profit or margin for the administrative and operational services charged to us.
The affiliate amounts incurred by us for services received pursuant to the services agreements are reflected in “Operating and administrative — affiliate” on our consolidated statements of income.
Enbridge and its affiliates allocated direct workforce costs to us for our construction projects of $17 million and $28 million for the year ended December 31, 2017 and 2016, respectively, that we recorded as additions to “Property, plant and equipment, net” on our consolidated statements of financial position.
Service Agreements
Our General Partner, Enbridge Management, Enbridge and affiliates of Enbridge provide managerial, administrative, operational and director services to us pursuant to service agreements and we reimburse them for the costs of those services. Through an operational services agreement among Enbridge and Enbridge Operational Services, Inc., whom we refer to as the Canadian service provider, and us, we are charged for the services of Enbridge employees resident in Canada. Through a general and administrative services agreement among us, our General Partner, Enbridge Management and Enbridge Employee Services, Inc.(EES), we are charged for the services of employees resident in the United States. The charges related to these service agreements are included in “Operating and administrative — affiliate” expenses on our consolidated statements of income.
Operational Services Agreement
We are charged an amount by the Canadian service providers for services we are provided under the operational services agreement. The amount we are charged is established as part of the annual budget and agreed upon by us and the Canadian service providers. The amount we are charged is computed based on an estimate of the pro-rated reimbursement of each Canadian service provider’s estimated annual departmental costs, net of amounts charged to other affiliates and amounts identifiable as costs of that Canadian service provider.
The total amount we reimbursed the Canadian service providers pursuant to the operational services agreement for the years ended December 31, 2017, 2016 and 2015, was $133 million, $106 million, $131 million, respectively.
General and Administrative Services Agreement
We, Enbridge Management and our General Partner receive services from EES under the general and administrative services agreement. Under this agreement, EES provides services to us, Enbridge Management and our General Partner and charges each recipient for services, on a monthly basis, the actual costs that it incurs for those services. Our General Partner and Enbridge Management may request that EES provide special additional general services for which each, as appropriate, agrees to pay costs and expenses incurred by EES in connection with providing the special additional general services.
The total amount reimbursed by us for services received pursuant to the general and administrative services agreement for the years ended December 31, 2017, 2016 and 2015, was $201 million, $229 million, $216 million, respectively.
Enbridge Pipelines (FSP) LLC Cushing Terminal Transfer
117
ENBRIDGE ENERGY PARTNERS, L.P.
NOTES TO THE CONSOLIDATED FINANCIAL STATEMENTS
20. RELATED PARTY TRANSACTIONS – (continued)
In August 2017, Enbridge Pipelines (FSP) L.L.C., (FSP), a wholly-owned subsidiary of our General Partner, completed an asset transfer of a capital project which involved modification and upgrades to the existing Cushing terminal facilities that are owned by our subsidiary, Enbridge Storage (Cushing) L.L.C. The transfer of assets was accounted for as a transaction between entities under common control as both FSP and we are related through common ownership by the General Partner. The assets were transferred at cost of $68 million and were recognized as a capital contribution from our General Partner.
Sale of Accounts Receivable
We and certain of our subsidiaries were parties to a receivables purchase agreement (the Receivables Agreement), with an indirect, wholly-owned subsidiary of Enbridge. On April 27, 2017, we terminated our Receivables Agreement with the indirect, wholly-owned subsidiary of Enbridge in exchange for a one-time $5 million payment to us, which was recorded within “Other income” in our consolidated statements of income.
As a result of the termination of the Receivables Agreement we discontinued the sale of our receivables balance. For the year ended December 31, 2017 and 2016, we sold and derecognized receivables of $473 million and $1,773 million, respectively to an indirect, wholly-owned subsidiary of Enbridge and received cash proceeds of $472 million and $1,772 million, respectively.
Consideration for the receivables sold was equivalent to the carrying value of the receivables less a discount for credit risk. The difference between the carrying value of the receivables sold and the cash proceeds received was recognized in “Operating and administrative - affiliate” expense in our consolidated statements of income. For the year ended December 31, 2017, 2016, and 2015 the expense stemming from the discount on the receivables sold was not material.
As of December 31, 2017, we had no remaining derecognized receivables that had not been collected on behalf of the Enbridge subsidiary. As of December 31, 2016, we had $156 million of receivables, which had been sold and derecognized that had not been collected on behalf of the Enbridge subsidiary.
Lease and Storage Services Agreement
We have an agreement with Illinois Extension Pipeline Company, L.L.C.(IEPC) an equity method investment of our General Partner, pursuant to which IEPC built two storage tanks at our storage facility in Flanagan, Illinois. We lease the tanks from IEPC and operate them. IEPC will pay us operating fees for the operation of the tanks. For the year ended December 31, 2017, IEPC paid no operating fees to us.
General Partner Equity Transactions
Our General Partner owns an effective 2% general partner interest in us. The cash distributions we make to our General Partner exclude an amount equal to 2% of the i-units, which we retain from the General Partner to maintain its 2% general partner interest in us.
Our General Partner’s outstanding ownership interests on us at December 31, 2017 and 2016, and the total distributions we paid to the General Partner for the years ending December 31, 2017, 2016 and 2015 were as follows:
118
ENBRIDGE ENERGY PARTNERS, L.P.
NOTES TO THE CONSOLIDATED FINANCIAL STATEMENTS
20. RELATED PARTY TRANSACTIONS – (continued)
General Partner’s Ownership Interests | Cash Distributions Paid to General Partner | |||||||||||||||||||||||
(in units) | (percentage)(1) | (in millions) | ||||||||||||||||||||||
Type of Unit | 2017 | 2016 | 2017 | 2016 | 2017 | 2016 | 2015 | |||||||||||||||||
Series 1 preferred units(2) | — | 48,000,000 | — | % | 9.7 | % | $ | — | $ | — | $ | — | ||||||||||||
Class D units | — | 66,100,000 | — | % | 13.3 | % | $ | 39 | $ | 154 | $ | 152 | ||||||||||||
Class E units | 18,114,975 | 18,114,975 | 4.0 | % | 3.7 | % | $ | 29 | $ | 42 | $ | 32 | ||||||||||||
Class A common units | 110,827,018 | 46,518,336 | 24.6 | % | 9.4 | % | $ | 143 | $ | 109 | $ | 107 | ||||||||||||
Class B common units | 7,825,500 | 7,825,500 | 1.7 | % | 1.6 | % | $ | 13 | $ | 18 | $ | 18 | ||||||||||||
Class F units | 1,000 | — | — | % | — | % | $ | 11 | $ | — | $ | — | ||||||||||||
IDUs | — | 1,000 | — | % | — | % | $ | 5 | $ | 21 | $ | 17 | ||||||||||||
General Partner interest | — | — | 2.0 | % | 2.0 | % | $ | 12 | $ | 17 | $ | 17 | ||||||||||||
Enbridge Management shares (Listed and Voting)(3) | 10,494,464 | 9,566,358 | 2.3 | % | 2.0 | % | $ | — | $ | — | $ | — | ||||||||||||
Total | 147,262,957 | 196,126,169 | 34.6 | % | 41.7 | % | 252 | 361 | 343 | |||||||||||||||
____________
(1) | Represents the General Partners' interest in our total outstanding units. |
(2) | For each of the years ended December 31, 2017, 2016 and 2015, total distributions of $29 million, $90 million and $90 million were accrued for the series 1 preferred units in the consolidated statements of financial position. |
(3) | For the years ended December 31, 2017, 2016, and 2015, we made total non-cash distributions of $16 million, $21 million, and $19 million, respectively, to the Listed and Voting Shares of Enbridge Management owned by the General Partner. |
Financing Transactions with Affiliates
EUS Credit Agreement
In connection with our investment in the Bakken Pipeline System, on February 15, 2017, we entered into the EUS Credit Agreement. The EUS Credit Agreement was a committed senior unsecured revolving credit facility that permitted aggregate borrowings of up to $1.5 billion, for the purpose of funding our investment in the Bakken Pipeline System. On April 27, 2017, we re-paid the facility in full and terminated the EUS Credit Agreement.
EUS 364-day Credit Facility
We are party to an unsecured revolving 364-day credit agreement (the EUS 364-day Credit Facility), with EUS. The EUS 364-day Credit Facility is a committed senior unsecured revolving credit facility that permits aggregate borrowings of up to, $750 million. As of December 31, 2017, we had $610 million outstanding under this facility, excluding any accrued interest to date.
Joint Funding Arrangement for Bakken Pipeline
On April 27, 2017, we finalized the joint funding arrangement with our General Partner with respect to our investment in the Bakken Pipeline System. Under the terms of the arrangement, our General Partner owns 75% and we own 25% of DakTex, with an option for us to increase our interest by 20% at a price equal to net book value, at any time during the five years subsequent to the June 1, 2017 in-service date of the Bakken Pipeline System. As part of the transaction, DakTex distributed approximately $1.1 billion to us. We used these distribution proceeds plus additional borrowings of $0.4 billion from our existing EUS 364-day Credit Facility to repay the $1.5 billion outstanding under the EUS Credit Agreement). We terminated the EUS Credit Agreement subsequent to the repayment.
Joint Funding Arrangement for Line 3 Replacement
On January 26, 2017, our Board of Directors approved a joint funding arrangement with our General Partner for the U.S. L3R Program. Under the terms of the arrangement, our General Partner will fund 99% and we will fund 1% of the capital cost of the U.S. L3R Program. We have an option to increase our interest in the U.S. L3R Program assets up to 40% in the United States portion at book value at any time up to four years after the project goes into service. Our General Partner paid $450 million for its 99% interest in the project, including our share of the construction costs to date and other incremental amounts. The carrying amount of our 99% interest in the project at the transaction date
119
ENBRIDGE ENERGY PARTNERS, L.P.
NOTES TO THE CONSOLIDATED FINANCIAL STATEMENTS
20. RELATED PARTY TRANSACTIONS – (continued)
was $411 million and was recorded as an increase to NCI. The $40 million difference between the cash received and the carrying amount was recorded as an increase to the capital accounts of our common units, i-units, and General Partner interest on a pro-rated basis.
Our General Partner made equity contributions totaling $247 million to the OLP for the twelve months ended December 31, 2017, to fund its equity portion of the construction costs associated with the U.S. L3R Program.
Joint Funding Arrangement for Eastern Access Projects
We have a joint funding arrangement with the General Partner that established an additional series of partnership interests in the OLP (the EA interests). The EA interests were created to finance the Eastern Access Projects to increase access to refineries in the United States Upper Midwest and in Ontario, Canada for light crude oil produced in western Canada and the United States.
On January 26, 2017, we exercised our option under the Eastern Access joint funding arrangement to acquire an additional 15% interest in the Eastern Access Project, thereby increasing our ownership interest from 25% to 40% and reducing the interest of our General Partner from 75% to 60%, respectively. The exercise of our option occurred at book value of approximately $360 million and reduced NCI by approximately $360 million. The Eastern Access Project was placed into service in June 2016.
Our General Partner made equity contributions totaling $13 million, $14 million and $119 million to the OLP for the years ended December 31, 2017, 2016 and 2015, respectively to fund its equity portion of the construction costs associated with the Eastern Access Projects.
Joint Funding Arrangement for U.S. Mainline Expansion Projects
The OLP has a series of partnership interests referred to as the ME interests. The ME interests were created to finance the Mainline Expansion Projects to increase access to the markets of North Dakota and western Canada for light oil production on our Lakehead System between Neche, North Dakota and Superior, Wisconsin. Our General Partner owns 75% of the ME interests, and the projects are jointly funded by our General Partner at 75% and us at 25%, with an option for us to increase our ownership interest by an additional 15% at cost, under the Mainline Expansion joint funding arrangement.
Our General Partner made equity contributions totaling $41 million, $90 million and $673 million to the OLP for the years ended December 31, 2017, 2016 and 2015, respectively, to fund its equity portion of the construction costs associated with the U.S. Mainline Expansion Projects. During December 2015, the OLP made equity distributions of $72 million to our General Partner, representing return of capital for excess capital funds contributed by our General Partner to the U.S. Mainline Expansion Projects. This is included in “Distributions to noncontrolling interest” presented in our statement of cash flows.
Distributions
Distribution to Series AC Interests
There were no distributions paid by the OLP during the years ended December 31, 2017 and December 31, 2016 with respect to the Series AC Units. The following table presents the distributions paid by the OLP during the years ended December 31, 2015, to our General Partner and its affiliate, representing the noncontrolling interest in the Series AC, and to us, as the holders of the Series AC general and limited partner interests. The distributions were declared by the board of directors of Enbridge Management, acting on behalf of Enbridge Pipelines (Lakehead) L.L.C., the managing general partner of the OLP and the Series AC interests. Pursuant to the OLP’s partnership agreement, the final ownership distribution for the Series AC interests was distributed to Series AC partners of record as of the last day of the fourth quarter of 2014.
Distribution Declaration Date | Distribution Payment Date | Amount Paid to Partnership | Amount Paid to the noncontrolling interest | Total Series AC Distribution | ||||||||||
(in millions) | ||||||||||||||
2015 | ||||||||||||||
January 29 | February 13 | $ | 14 | $ | 27 | $ | 41 | |||||||
120
ENBRIDGE ENERGY PARTNERS, L.P.
NOTES TO THE CONSOLIDATED FINANCIAL STATEMENTS
20. RELATED PARTY TRANSACTIONS – (continued)
Amendment of OLP Limited Partnership Agreement
On July 30, 2015, the partners amended and restated the limited partnership agreement of the OLP pursuant to which our General Partner temporarily did not receive Series EA and ME (the Series) distributions from the quarter ended June 30, 2015, through the quarter ended March 31, 2016. The General Partner's capital funding contribution requirements for each of those two Series, commencing in August 2015, were reduced by the amount of its foregone cash distributions from the respective Series, until the earlier of December 31, 2016 and the date aggregate reductions in capital contributions for such Series are equal to the foregone cash distributions from such Series. As of December 31, 2016, capital contributions offsets foregone cash distributions.
Distribution to Series EA Interests
The following table presents distributions paid by the OLP during the years ended December 31, 2017, 2016 and 2015, to our General Partner and its affiliate, representing the noncontrolling interest in the Series EA, and to us, as the holders of the Series EA general and limited partner interests. The distributions were declared by the board of directors of Enbridge Management, acting on behalf of Enbridge Pipelines (Lakehead), L.L.C., the managing general partner of the OLP and the Series EA interests .
Distribution Declaration Date | Distribution Payment Date | Amount Paid to EEP | Amount Paid to the noncontrolling interest | Total Series EA Distribution | ||||||||||
(in millions) | ||||||||||||||
2017 | ||||||||||||||
October 25 | November 14 | $ | 35 | $ | 51 | $ | 86 | |||||||
July 28 | August 14 | 33 | 50 | 83 | ||||||||||
April 27 | May 15 | 29 | 62 | 91 | ||||||||||
January 26 | February 14 | 23 | 69 | 92 | ||||||||||
$ | 120 | $ | 232 | $ | 352 | |||||||||
2016 | ||||||||||||||
October 28 | November 14 | $ | 22 | $ | 65 | $ | 87 | |||||||
July 28 | August 12 | 21 | 63 | 84 | ||||||||||
April 29 | May 13 | 79 | — | 79 | ||||||||||
January 29 | February 12 | 79 | — | 79 | ||||||||||
$ | 201 | $ | 128 | $ | 329 | |||||||||
2015 | ||||||||||||||
October 30 | November 13 | $ | 76 | $ | — | $ | 76 | |||||||
July 30 | August 14 | 76 | — | 76 | ||||||||||
April 30 | May 15 | 18 | 52 | 70 | ||||||||||
January 29 | February 13 | 22 | 67 | 89 | ||||||||||
$ | 192 | $ | 119 | $ | 311 | |||||||||
Distribution to Series ME Interests
The following table presents distributions paid by the OLP during the years ended December 31, 2017, 2016 and 2015, to our General Partner and its affiliate, representing the noncontrolling interest in the Series ME, and to us, as the holders of the Series ME general and limited partner interests. The distributions were declared by the board of directors of Enbridge Management, acting on behalf of Enbridge Pipelines (Lakehead), L.L.C., the managing general partner of the OLP and the Series ME interests.
121
ENBRIDGE ENERGY PARTNERS, L.P.
NOTES TO THE CONSOLIDATED FINANCIAL STATEMENTS
20. RELATED PARTY TRANSACTIONS – (continued)
Distribution Declaration Date | Distribution Payment Date | Amount Paid to EEP | Amount Paid to the noncontrolling interest | Total Series ME Distribution | ||||||||||
(in millions) | ||||||||||||||
2017 | ||||||||||||||
October 25 | November 14 | $ | 15 | $ | 44 | $ | 59 | |||||||
July 28 | August 14 | 14 | 41 | 55 | ||||||||||
April 27 | May 15 | 13 | 38 | 51 | ||||||||||
January 26 | February 14 | 14 | 43 | 57 | ||||||||||
$ | 56 | $ | 166 | $ | 222 | |||||||||
2016 | ||||||||||||||
October 28 | November 14 | $ | 15 | $ | 44 | $ | 59 | |||||||
July 28 | August 12 | 13 | 40 | 53 | ||||||||||
April 29 | May 13 | 43 | — | 43 | ||||||||||
January 29 | February 12 | 41 | — | 41 | ||||||||||
$ | 112 | $ | 84 | $ | 196 | |||||||||
2015 | ||||||||||||||
October 30 | November 13 | $ | 32 | $ | — | $ | 32 | |||||||
July 30 | August 14 | 20 | — | 20 | ||||||||||
April 30 | May 15 | 1 | 5 | 6 | ||||||||||
January 29 | February 13 | 2 | 5 | 7 | ||||||||||
$ | 55 | $ | 10 | $ | 65 | |||||||||
Distribution from DakTex
The following table presents distributions paid by DakTex during the year ended December 31, 2017, to our General Partner and its affiliates, representing NCI in Class A units of DakTex, and to us, as the holders of the remaining Class A units of DakTex.
Distribution Declaration Date | Distribution Payment Date | Amount Paid to EEP | Amount Paid to the noncontrolling interest | Total DakTex Distribution | ||||||||||
(in millions) | ||||||||||||||
2017 | ||||||||||||||
December 19 | December 28 | $ | 11 | $ | 32 | $ | 43 | |||||||
September 25 | September 29 | 10 | 31 | 41 | ||||||||||
$ | 21 | $ | 63 | $ | 84 | |||||||||
We along with our General Partner made capital contributions of $440 million to DakTex for the year ended December 31, 2017. Equity income for the year ended December 31, 2017, was $52 million, of which 75% is attributable to our General Partner and recorded as part of NCI.
Distribution from MEP
The following table presents distributions paid by MEP during the years ended December 31, 2017, 2016 and 2015, to its public Class A common unitholders, representing the noncontrolling interest in MEP, and to us for our ownership of Class A common units.
122
ENBRIDGE ENERGY PARTNERS, L.P.
NOTES TO THE CONSOLIDATED FINANCIAL STATEMENTS
20. RELATED PARTY TRANSACTIONS – (continued)
Distribution Declaration Date | Distribution Payment Date | Amount Paid to EEP | Amount Paid to the noncontrolling interest | Total MEP Distribution | ||||||||||
(in millions) | ||||||||||||||
2017 | ||||||||||||||
January 26 | February 14 | $ | 9 | $ | 8 | $ | 17 | |||||||
$ | 9 | $ | 8 | $ | 17 | |||||||||
2016 | ||||||||||||||
October 27 | November 14 | $ | 9 | $ | 8 | $ | 17 | |||||||
July 27 | August 12 | 9 | 7 | 16 | ||||||||||
April 28 | May 13 | 9 | 8 | 17 | ||||||||||
January 28 | February 12 | 9 | 7 | 16 | ||||||||||
$ | 36 | $ | 30 | $ | 66 | |||||||||
2015 | ||||||||||||||
October 29 | November 13 | $ | 9 | $ | 8 | $ | 17 | |||||||
July 29 | August 14 | 9 | 7 | 16 | ||||||||||
April 29 | May 15 | 9 | 7 | 16 | ||||||||||
January 28 | February 13 | 8 | 8 | 16 | ||||||||||
$ | 35 | $ | 30 | $ | 65 | |||||||||
21. COMMITMENTS AND CONTINGENCIES
Future Minimum Commitments
At December 31, 2017, we had our commitments that have remaining non-cancelable terms in excess of one year as detailed below:
Payments due by Period | |||||||||||||||||||||||||||
2018 | 2019 | 2020 | 2021 | 2022 | Thereafter | Total | |||||||||||||||||||||
(in millions) | |||||||||||||||||||||||||||
Annual debt maturities(1) | $ | 500 | $ | 500 | $ | 1,000 | $ | 600 | $ | 1,453 | $ | 2,850 | $ | 6,903 | |||||||||||||
Interest obligations(2) | 324 | 280 | 243 | 208 | 183 | 3,414 | $ | 4,652 | |||||||||||||||||||
Purchase commitments(3) | 255 | — | — | — | — | — | $ | 255 | |||||||||||||||||||
Power commitments(4) | 26 | 25 | 24 | 10 | 10 | 257 | $ | 352 | |||||||||||||||||||
Operating leases | 3 | 3 | 2 | 1 | 1 | — | $ | 10 | |||||||||||||||||||
Right-of-way | 2 | 2 | 2 | 2 | 2 | 36 | $ | 46 | |||||||||||||||||||
Product purchase obligations(5) | 32 | 16 | 15 | 8 | — | — | $ | 71 | |||||||||||||||||||
Other long-term liabilities(6) | — | — | 1 | 1 | 1 | 6 | $ | 9 | |||||||||||||||||||
Total | $ | 1,142 | $ | 826 | $ | 1,287 | $ | 830 | $ | 1,650 | $ | 6,563 | $ | 12,298 | |||||||||||||
(1) | Represents scheduled future maturities of our consolidated third-party debt principal obligations excluding any discounts. We have the ability under certain debt facilities to repay the obligations prior to scheduled maturities. Therefore, the actual timing of future cash repayments could be materially different than presented above. For information regarding our consolidated debt obligations, see Item 8. Financial Statements and Supplementary Data — Note 13 - Debt. |
(2) | Estimated cash payments for third-party interest exclude adjustments for derivative agreements and cash payments for interest on variable-rate debt. We borrow and repay at varying amounts and interest rates. For more information on our debt obligations, see Item 8. Financial Statements and Supplementary Data — Note 13 - Debt. |
(3) | Represents commitments to purchase materials, primarily pipe from third-party suppliers in connection with our growth projects. |
(4) | Represents commitments to purchase power, included certain power commitments with obligations that are dependent on variable components. For these commitments, we only included the determinable portion of our commitment based on the contracted usage requirement and the current applicable contract rate. |
123
ENBRIDGE ENERGY PARTNERS, L.P.
NOTES TO THE CONSOLIDATED FINANCIAL STATEMENTS
21. COMMITMENTS AND CONTINGENCIES – (continued)
(5) | Represents long-term product purchase commitments to purchase drag reducing agents. |
(6) | Includes noncurrent portion of capital leases. We are unable to estimate deferred income taxes (see Note 18 - Income Taxes) since cash payments for income taxes are determined primarily by taxable income for each discrete fiscal year. We are also unable to estimate asset retirement obligations (see Note 14 - Asset Retirement Obligations), environmental liabilities (see Note 21 - Commitments and Contingencies) and hedges payable (see Note 17 - Derivative Financial Instruments and Hedging Activities) due to the uncertainty as to the amount and, or, timing of when cash payments will be required. |
Environmental Liabilities
We are subject to federal and state laws and regulations relating to the protection of the environment. These laws and regulations can change from time to time, imposing new obligations on us. Environmental risk is inherent to liquid hydrocarbon pipeline operations, and we are, at times, subject to environmental remediation at various contaminated sites. We manage this environmental risk through environmental policies and practices to minimize any impact our operations may have on the environment. To the extent that we are unable to recover payment for environmental liabilities from insurance or other potentially responsible parties, we will be responsible for payment of liabilities arising from environmental incidents associated with the operating activities of our liquids businesses. Our General Partner has agreed to indemnify us from and against any costs relating to environmental liabilities associated with the Lakehead System assets prior to the transfer of these assets to us in 1991. This excludes any liabilities resulting from a change in laws after such transfer. We continue to voluntarily investigate past leak sites on our systems for the purpose of assessing whether any remediation is required in light of current regulations.
As of December 31, 2017 and 2016, our consolidated statements of financial position included $23 million and $100 million, respectively, in “Environmental liabilities,” and $51 million for both years in “Other long-term liabilities,” that we have accrued for costs we have recognized primarily to address remediation of contaminated sites, asbestos containing materials, management of hazardous waste material disposal, outstanding air quality measures for certain of our liquids and natural gas assets and penalties we have been or expect to be assessed.
Lakehead Line 6B Crude Oil Releases
Line 6B Crude Oil Release
On July 26, 2010, a release of crude oil on Line 6B of our Lakehead System was reported near Marshall, Michigan. We estimate that approximately 20,000 barrels of crude oil were leaked at the site, a portion of which reached the Kalamazoo River via Talmadge Creek, a waterway that feeds the Kalamazoo River. The released crude oil affected approximately 38 miles of shoreline along the Talmadge Creek and Kalamazoo River waterways, including residential areas, businesses, farmland and marshland between Marshall and downstream of Battle Creek, Michigan.
We continue to evaluate the need for additional remediation activities and are performing the necessary restoration and monitoring of the areas affected by the Line 6B crude oil release. All the initiatives we are undertaking in the monitoring and restoration phase are intended to restore the crude oil release area to the satisfaction of the appropriate regulatory authorities.
On March 14, 2013, we received an order from the EPA (the Order) that required additional containment and active recovery of submerged oil relating to the Line 6B crude oil release. In February 2015, the EPA acknowledged our completion of the Order.
In November 2014, regulatory authority was transferred from the EPA to the Michigan Department of Environmental Quality (MDEQ). The MDEQ has oversight over submerged oil reassessment, sheen management and sediment trap monitoring and maintenance activities, through a Kalamazoo River Residual Oil Monitoring and Maintenance Work Plan.
In May 2015, Enbridge reached a settlement with the MDEQ and the Michigan Attorney General’s offices regarding the Line 6B crude oil release. As stipulated in the settlement, Enbridge agrees to: (i) provide at least 300 acres of wetland through restoration, creation, or banked wetland credits, to remain as wetland in perpetuity, (ii) pay $5.0 million as mitigation for impacts to the banks, bottomlands, and flow of Talmadge Creek and the Kalamazoo River for the purpose of enhancing the Kalamazoo River watershed and restoring stream flows in the River, (iii) continue to reimburse
124
ENBRIDGE ENERGY PARTNERS, L.P.
NOTES TO THE CONSOLIDATED FINANCIAL STATEMENTS
21. COMMITMENTS AND CONTINGENCIES – (continued)
the State of Michigan for costs arising from oversight of Enbridge activities since the release, and (iv) continue monitoring, restoration and invasive species control within state-regulated wetlands affected by the release and associated response activities. The timing of these activities is based upon the work plans approved by the State of Michigan.
As of December 31, 2017, our cumulative cost estimate for the Line 6B crude oil release remains at $1.2 billion. For purposes of estimating our expected losses associated with the Line 6B crude oil release, we have included those costs that we considered probable and that could be reasonably estimated at December 31, 2017. Our estimates exclude: (i) amounts we have capitalized, (ii) any claims associated with the release that may later become evident, (iii) amounts recoverable under insurance, and (iv) fines and penalties from other governmental agencies except as described in the Line 6B Fines and Penalties section below. Our assumptions include, where applicable, estimates of the expected number of days the associated services will be required and rates that we have obtained from contracts negotiated for the respective service and equipment providers. As we receive invoices for the actual personnel, equipment and services, our estimates will continue to be further refined. Our estimates also consider currently available facts, existing technology and presently enacted laws and regulations. These amounts also consider our and other companies’ prior experience remediating contaminated sites and data released by government organizations. Despite the efforts we have made to ensure the reasonableness of our estimates, changes to the recorded amounts associated with this release are possible as more reliable information becomes available. We continue to have the potential of incurring additional costs in connection with this crude oil release due to variations in any or all of the categories described above, including modified or revised requirements from regulatory agencies, in addition to fines and penalties as well as expenditures associated with litigation and settlement of claims.
The components underlying our cumulative estimated loss for the cleanup, remediation and restoration associated with the Line 6B crude oil release, the majority of which have been paid, include the following:
December 31, | |||
2017 | |||
(in millions) | |||
Response personnel and equipment | $ | 547 | |
Environmental consultants | 224 | ||
Professional, regulatory, fines and penalties and other | 444 | ||
Total | $ | 1,215 | |
For the years ended December 31, 2017, 2016 and 2015, we made payments of $76 million, $21 million and $37 million, respectively, for costs associated with the Line 6B crude oil release. For the years ended December 31, 2017 and 2016, we had a remaining estimated liability of $62 million and $139 million, respectively. We did not recognize any insurance recoveries for the years ended December 31, 2017, 2016 and 2015.
Fines and Penalties
At December 31, 2017, our total estimated costs related to the Line 6B crude oil release include $69 million in paid fines and penalties, which includes fines and penalties paid to the United States Department of Justice (DOJ) as discussed below.
Consent Decree
On May 23, 2017, the United States District Court for the Western District of Michigan, Southern Division (the District Court), approved our signed settlement agreement with the EPA and the DOJ regarding a consent decree to resolve liability for the Lines 6B crude oil release reported on July 26, 2010, as well as a release of approximately 6,427 barrels of oil from Line 6A near Romeoville, Illinois, on September 9, 2010 (the Consent Decree). On June 15, 2017, Enbridge made a total payment of $68 million as required by the Consent Decree, which reflects a $61 million civil penalty for the Line 6B release, a $1 million civil penalty for the Line 6A release, and $6 million for past removal costs and interest.
125
ENBRIDGE ENERGY PARTNERS, L.P.
NOTES TO THE CONSOLIDATED FINANCIAL STATEMENTS
21. COMMITMENTS AND CONTINGENCIES – (continued)
In addition to the monetary fines and penalties, the Consent Decree calls for replacement of Line 3, which we initiated in 2014 and is currently under regulatory review in the State of Minnesota. The Consent Decree contains a variety of injunctive measures, including, but not limited to, enhancements to our comprehensive in-line inspection (ILI)-based spill prevention program; enhanced measures to protect the Straits of Mackinac; improved leak detection requirements; installation of new valves to control product loss in the event of an incident; continued enhancement of control room operations; and improved spill response capabilities. Collectively, these measures build on continuous improvements we have implemented since 2010 to our leak detection program, control center operations, and emergency response program. We estimate the total cost of these measures to be approximately $110 million, most of which is already incorporated into existing long-term capital investment and operational expense planning and guidance. Compliance with the terms of the Consent Decree is not expected to materially impact our overall financial performance.
Insurance
We are included in the comprehensive insurance program maintained by Enbridge for its subsidiaries. This program includes insurance coverage in types and amounts and with terms and conditions that are generally consistent with coverage considered customary for our industry.
In the unlikely event multiple insurable incidents occur which exceed coverage limits within the same insurance period, the total insurance coverage will be allocated among the Enbridge entities on an equitable basis based on an insurance allocation agreement we have entered into with Enbridge and other Enbridge subsidiaries.
A majority of the costs incurred for the July 2010 Line 6B crude oil release, other than fines and penalties, are covered by the insurance policies that expired on April 30, 2011, which had an aggregate limit of $650 million for pollution liability for Enbridge and its affiliates. Including our remediation spending through December 31, 2017, costs related to Line 6B exceeded the limits of the coverage available under these insurance policies. Through December 31, 2017, we have recorded total insurance recoveries of $547 million for the Line 6B crude oil release, out of the $650 million aggregate limit.
In March 2013, we and Enbridge filed a lawsuit against the insurers of $145 million of coverage, as one particular insurer disputed our recovery eligibility for costs related to our claim on the Line 6B crude oil release and the other remaining insurers asserted that their payment was predicated on the outcome of our recovery with that insurer. We received a partial recovery payment of $42 million from the other remaining insurers and amended our lawsuit such that it included only one insurer.
Of the remaining $103 million coverage limit, $85 million was the subject matter of a lawsuit Enbridge filed against one particular insurer described above. In March 2015, Enbridge reached agreement with that insurer to submit the $85 million claim to binding arbitration. On May 2, 2017, the arbitration panel issued a decision that was not favorable to Enbridge. As a result, we will not receive any additional insurance recoveries in connection with the Line 6B crude oil release.
Legal and Regulatory Proceedings
We are subject to various legal and regulatory actions and proceedings which arise in the normal course of business, including interventions in regulatory proceedings and challenges to regulatory approvals and permits by special interest groups. Some of these proceedings are covered, in whole or in part, by insurance.
We are in discovery in relation to a unitholder derivative action, with trial scheduled in the fourth quarter of 2018. Accordingly, an estimate of reasonably possible losses, if any, associated with causes of action cannot be made until all of the facts, circumstances and legal theories relating to such claims and the defenses are fully disclosed and analyzed. We have not established any reserves relating to this action. We believe the action is without merit and expect to vigorously defend against it. We believe an unfavorable outcome to be more than remote but less than probable.
126
ENBRIDGE ENERGY PARTNERS, L.P.
NOTES TO THE CONSOLIDATED FINANCIAL STATEMENTS
21. COMMITMENTS AND CONTINGENCIES – (continued)
A number of governmental agencies and regulators initiated investigations into the Line 6B crude oil release. As at December 31, 2017, there are no claims pending against us in United States state courts in connection with the July 2010 Line 6B crude oil release.
We have accrued a provision for future legal costs and probable losses associated with the Line 6B crude oil release as described above in this footnote.
Oil and Gas in Custody
Our Liquids assets transport crude oil owned by our customers for a fee. The volume of liquid hydrocarbons in our pipeline systems at any one time varies from approximately 27 million to 63 million barrels, virtually all of which is owned by our customers. Under the terms of our tariffs, losses of crude oil from identifiable incidents not resulting from our direct negligence may be apportioned among our customers.
Rights-of-Way
As part of our pipeline construction process, we must obtain certain rights-of-way from landowners whose property the pipeline will cross. Rights-of-way that we buy are capitalized as part of “Property, plant and equipment, net” in our consolidated statements of financial position. Rights-of-way that we lease are expensed. We have recorded expenses of $2 million for the leased right-of-way agreements for each of the three years ended December 31, 2017, 2016 and 2015.
Purchase Commitment and Lease expense
The purchases made under purchase commitments, power commitments, product purchase obligations and transportation/service contract obligations for the years ended December 31, 2017, 2016 and 2015 totaled $341 million, $947 million and $260 million, respectively.
Our consolidated operating expenses include lease and rental expense amounts of $7 million, $8 million and $8 million during the years ended December 31, 2017, 2016 and 2015, respectively.
127
22. QUARTERLY FINANCIAL DATA (UNAUDITED)
First | Second | Third | Fourth | Total | |||||||||||||||
(in millions, except per unit amounts) | |||||||||||||||||||
2017 Quarters | |||||||||||||||||||
Operating revenue | $ | 605 | $ | 597 | $ | 616 | $ | 610 | $ | 2,428 | |||||||||
Operating income | 269 | 312 | 266 | 274 | 1,121 | ||||||||||||||
Income from continuing operations | 179 | 232 | 196 | 101 | 708 | ||||||||||||||
Loss from discontinued operations, net of tax | (22 | ) | (35 | ) | — | — | (57 | ) | |||||||||||
Net income | 157 | 197 | 196 | 101 | 651 | ||||||||||||||
Net income (loss) attributable to general and limited partner ownership interests in Enbridge Energy Partners, L.P. - continuing operations | 79 | 117 | 93 | (6 | ) | 283 | |||||||||||||
Net income (loss) attributable to general and limited partner ownership interests in Enbridge Energy Partners, L.P. - discontinued operations | (14 | ) | (24 | ) | — | — | (38 | ) | |||||||||||
Net income (loss) per common unit and i-unit (basic and diluted): | |||||||||||||||||||
Income (loss) from continuing operations | 0.19 | 0.27 | 0.19 | (0.05 | ) | 0.60 | |||||||||||||
Loss from discontinued operations | (0.04 | ) | (0.06 | ) | — | — | (0.10 | ) | |||||||||||
Net income (loss) per common unit and i-unit | $ | 0.15 | $ | 0.21 | $ | 0.19 | $ | (0.05 | ) | $ | 0.50 | ||||||||
2016 Quarters | |||||||||||||||||||
Operating revenue | $ | 630 | $ | 621 | $ | 635 | $ | 630 | $ | 2,516 | |||||||||
Operating income (loss)(1) | 296 | 323 | (449 | ) | 311 | 481 | |||||||||||||
Income from continuing operations | 203 | 241 | (544 | ) | 216 | 116 | |||||||||||||
Loss from discontinued operations, net of tax | (30 | ) | (63 | ) | (31 | ) | (33 | ) | (157 | ) | |||||||||
Net income (loss) | 173 | 178 | (575 | ) | 183 | (41 | ) | ||||||||||||
Net income (loss) attributable to general and limited partner ownership interests in Enbridge Energy Partners, L.P. - continuing operations | 101 | 130 | (385 | ) | 103 | (51 | ) | ||||||||||||
Net income (loss) attributable to general and limited partner ownership interests in Enbridge Energy Partners, L.P. - discontinued operations | (21 | ) | (46 | ) | (22 | ) | (22 | ) | (111 | ) | |||||||||
Net income (loss) per common unit and i-unit (basic and diluted): | |||||||||||||||||||
Income (loss) from continuing operations | 0.13 | 0.21 | (1.25 | ) | 0.14 | (0.77 | ) | ||||||||||||
Loss from discontinued operations | (0.06 | ) | (0.13 | ) | (0.06 | ) | (0.06 | ) | (0.31 | ) | |||||||||
Net income (loss) per common unit and i-unit | $ | 0.07 | $ | 0.08 | $ | (1.31 | ) | $ | 0.08 | $ | (1.08 | ) | |||||||
____________
(1) | Third quarter 2016 operating expenses were impacted by an asset impairment of $757 million. For more information, refer to Note 9 - Property, Plant and Equipment. |
23. SUBSEQUENT EVENTS
Distribution to Partners
On January 31, 2018, the board of directors of Enbridge Management declared a distribution payable to our partners on February 14, 2018. The distribution was paid to unitholders of record as of February 7, 2018 and consisted of our available cash of $162 million at December 31, 2017, or $0.35 per limited partner unit. Of this distribution, $130 million was paid in cash, $31 million was distributed in i-units to our i-unitholder, Enbridge Management, and due to the i-unit
128
ENBRIDGE ENERGY PARTNERS, L.P.
NOTES TO THE CONSOLIDATED FINANCIAL STATEMENTS
23. SUBSEQUENT EVENTS – (continued)
distribution, $1 million was retained from our General Partner from amounts otherwise distributable to it in respect of its general partner interest and limited partner interest to maintain its 2% general partner interest.
Distribution to Series EA Interests
On January 31, 2018, the board of directors of Enbridge Management, acting on behalf of Enbridge Pipelines (Lakehead) L.L.C., the managing general partner of the OLP and a holder of the Series EA interests, declared a distribution payable to the holders of the Series EA general and limited partner interests. The OLP paid $50 million to the noncontrolling interest in the Series EA, while $34 million was paid to us.
Distribution to Series ME Interests
On January 31, 2018, the board of directors of Enbridge Management, acting on behalf of Enbridge Pipelines (Lakehead) L.L.C., the managing general partner of the OLP and a holder of the Series ME interests, declared a distribution payable to the holders of the Series ME general and limited partner interests. The OLP paid $44 million to the noncontrolling interest in the Series ME, while $15 million was paid to us.
129
ITEM 9. CHANGES IN AND DISAGREEMENTS WITH ACCOUNTANTS ON ACCOUNTING AND FINANCIAL DISCLOSURE
None.
ITEM 9A. CONTROLS AND PROCEDURES
DISCLOSURE CONTROLS AND PROCEDURES
We and Enbridge maintain systems of disclosure controls and procedures designed to provide reasonable assurance that we are able to record, process, summarize and report the information required to be disclosed in the reports that we file or submit under the Exchange Act within the time periods specified in the rules and forms of the SEC, and that such information is accumulated and communicated to our management, including our principal executive and principal financial officers, as appropriate, to allow timely decisions regarding required disclosure. Our management, with the participation of our principal executive and principal financial officers, has evaluated the effectiveness of our disclosure controls and procedures as of December 31, 2017. Based upon that evaluation, our principal executive and principal financial officers concluded that our disclosure controls and procedures are effective at the reasonable assurance level. In conducting this assessment, our management relied on similar evaluations conducted by employees of Enbridge affiliates who provide certain treasury, accounting and other services on our behalf.
INTERNAL CONTROL OVER FINANCIAL REPORTING
MANAGEMENT'S ANNUAL REPORT ON INTERNAL CONTROL OVER FINANCIAL REPORTING
Management of the Partnership is responsible for establishing and maintaining adequate internal control over financial reporting as such term is defined in Exchange Act Rule 13a-15(f).
The Partnership’s internal control over financial reporting is a process designed under the supervision and with the participation of our principal executive and principal financial officers, and effected by the board of directors of our General Partner, management and other personnel, to provide reasonable assurance regarding the reliability of financial reporting and the preparation of the Partnership’s financial statements for external purposes in accordance with generally accepted accounting principles.
The Partnership’s internal control over financial reporting includes policies and procedures that:
• | Pertain to the maintenance of records that in reasonable detail accurately and fairly reflect transactions and dispositions of assets of the Partnership; |
• | Provide reasonable assurance that transactions are recorded as necessary to permit preparation of financial statements in accordance with generally accepted accounting principles, and that receipts and expenditures of the Partnership are being made only in accordance with the authorizations of the Partnership’s management and directors; and |
• | Provide reasonable assurance regarding prevention or timely detection of unauthorized acquisition, use or disposition of our assets that could have a material effect on our financial statements. |
Because of its inherent limitations, the Partnership’s internal control over financial reporting may not prevent or detect misstatements. Also, projections of any evaluation of effectiveness to future periods are subject to the risk that controls may become inadequate because of changes in conditions, or that the degree of compliance with our policies or procedures may deteriorate.
Management assessed the effectiveness of the Partnership’s internal control over financial reporting as of December 31, 2017, with the participation of our principal executive and principal financial officers, based on the framework established in Internal Control — Integrated Framework (2013) issued by the Committee of Sponsoring Organizations of the Treadway Commission (COSO). Based on this assessment, management concluded that the Partnership maintained effective internal control over financial reporting as of December 31, 2017.
130
The effectiveness of the Partnership’s internal control over financial reporting as of December 31, 2017 has been audited by PricewaterhouseCoopers LLP, an independent registered public accounting firm, as stated in their report which appears in Item 8. Financial Statements and Supplementary Data.
CHANGES IN INTERNAL CONTROL OVER FINANCIAL REPORTING
There have been no changes in internal control over financial reporting that have materially affected, or are reasonably likely to materially affect, our internal control over financial reporting during the three months ended December 31, 2017.
ITEM 9B. OTHER INFORMATION
None.
131
PART III
ITEM 10. DIRECTORS, EXECUTIVE OFFICERS AND CORPORATE GOVERNANCE
DIRECTORS AND EXECUTIVE OFFICERS OF THE REGISTRANT
We are a limited partnership and have no officers or directors of our own. Set forth below is certain information concerning the directors and executive officers of the General Partner and of Enbridge Management as the delegate of the General Partner under a delegation of control agreement among us, the General Partner and Enbridge Management. All directors of the General Partner are elected annually and may be removed by Enbridge (U.S.) Inc., as the sole shareholder of the General Partner, an indirect and wholly-owned subsidiary of Enbridge. All directors of Enbridge Management were elected and may be removed by the General Partner, as the sole holder of Enbridge Management’s voting shares. All officers of the General Partner and Enbridge Management serve at the discretion of the boards of directors of the General Partner and Enbridge Management, respectively. Unless otherwise noted below, all directors and officers of the General Partner hold identical positions in Enbridge Management.
Name | Age | Position | ||
Jeffrey A. Connelly | 71 | Director and Chairman of the Board | ||
J. Richard Bird | 68 | Director | ||
J. Herbert England | 71 | Director | ||
D. Guy Jarvis | 54 | Director and Executive Vice President — Liquids Pipelines | ||
Mark A. Maki | 53 | Director and President | ||
Stephen J. Neyland | 50 | Director and Vice President | ||
Laura Buss Sayavedra | 50 | Director of the General Partner and Enbridge Management and Vice President, Sponsored Vehicles of the General Partner and Vice President of Enbridge Management | ||
William S. Waldheim | 61 | Director | ||
Dan A. Westbrook | 65 | Director | ||
John K. Whelen | 58 | Director | ||
Mark R. Boyce | 54 | Vice President, Liquids Pipelines Law | ||
David W. Bryson | 51 | Senior Vice President — Liquids Pipelines, Operations | ||
Allen C. Capps | 47 | Controller | ||
Leo J. Golden | 51 | Vice President — Major Projects | ||
Christopher J. Johnston | 48 | Vice President, Finance | ||
Wanda M. Opheim | 55 | Treasurer | ||
Bradley F. Shamla | 49 | Vice President — Liquids Pipelines, Operations | ||
William T. Yardley | 53 | Executive Vice President, Gas Transmission and Midstream of the General Partner | ||
DIRECTORS AND NAMED EXECUTIVE OFFICERS
Jeffrey A. Connelly
Jeffrey A. Connelly was elected as Chairman of the Board of Directors, or the Board, in July 2012 and as a director of the General Partner and Enbridge Management in January 2003. Previously, Mr. Connelly served as Chairman of the Audit, Finance & Risk Committee of the General Partner and Enbridge Management. Mr. Connelly also served as Executive Vice President, Senior Vice President and Vice President of the Coastal Corporation from 1988 to 2001.
Mr. Connelly brings significant financial experience to our Board because of his experience as the former Treasurer and other executive roles with Coastal Corporation, a former Fortune 500 Company whose principal business segments included gathering, processing, transmission, storage and distribution of natural gas; oil refining and marketing; oil
132
exploration and production; electric power production; and coal mining. He also served as the chief executive officer for several wholly-owned Coastal subsidiaries.
J. Richard Bird
J. Richard Bird was elected a director of the General Partner and Enbridge Management in October 2012. He retired from Enbridge in early 2015, having served as Executive Vice President, Chief Financial Officer and Corporate Development, and various other roles, including: Executive Vice President Liquids Pipelines, Senior Vice President Corporate Planning and Development, and Vice President and Treasurer during his tenure with Enbridge which began in 1995. Mr. Bird serves on the Board of Directors or Trustees of Enbridge Pipelines Inc., Enbridge Income Fund Holdings Inc. and Bird Construction Company Inc. He is a member of the Board of Directors of the Alberta Investment Management Company and chairman of its audit committee. Mr. Bird is also a member of the Investment Committee of the University of Calgary Board of Governors. He was named Canada’s CFO of the Year for 2010. He holds a Bachelor of Arts degree from the University of Manitoba, and a Masters of Business Administration and PhD from the University of Toronto and has completed the Advanced Management Program at Harvard Business School.
Through his long career in the energy industry and his financial expertise, Mr. Bird provides significant experience to the Boards of the General Partner and Enbridge Management.
J. Herbert England
J. Herbert England was elected a director of the General Partner and Enbridge Management in July 2010 and was appointed as the Chairman of the Audit, Finance & Risk Committee of the General Partner and Enbridge Management in July 2012. Mr. England also serves on the Enbridge board of directors, for whom he also is Chairman of the Audit, Finance & Risk Committee, and on the board of directors and the audit committee of FuelCell Energy, Inc. He has been Chair & Chief Executive Officer of Stahlman-England Irrigation Inc., a contracting company in southwest Florida, since 2000. From 1993 to 1997, Mr. England was the Chair, President & Chief Executive Officer of Sweet Ripe Drinks Ltd., a fruit beverage manufacturing company. Prior to 1993, Mr. England held various executive positions with John Labatt Limited, a brewing company, and its operating companies, Catelli Inc., a food manufacturing company, and Johanna Dairies Inc., a dairy company.
Mr. England brings to the Board a wide range of financial executive experience because of his previous positions, as well as his service with other public company audit committees.
D. Guy Jarvis
D. Guy Jarvis was appointed Executive Vice President - Liquids Pipelines and a director of the General Partner and Enbridge Management in March 2014. Mr. Jarvis was appointed Executive Vice President and President, Liquids Pipelines of Enbridge on February 2017, he has served as President of the Liquids Pipelines division of Enbridge since March 2014, when he assumed responsibility for all of Enbridge’s crude oil and liquids pipeline businesses across North America. Prior to this, he was Chief Commercial Officer, Liquids Pipelines from October 2013 to March 2014. From September 2011 to October 2013, Mr. Jarvis served as President of Enbridge Gas Distribution, providing overall leadership to Enbridge Gas Distribution, Canada’s largest natural gas utility, as well as Enbridge Gas New Brunswick, Gazifère and St. Lawrence Gas. Previously at Enbridge Pipelines Inc., Mr. Jarvis served as Senior Vice President, Investor Relations & Enterprise Risk; Senior Vice President, Business Development from March 2008 to October 2010; Vice President, Upstream Development for Enbridge Pipelines Inc.; and Vice President, Gas Services.
Mr. Jarvis joined Enbridge in 2000 and brings to the board over a quarter century of experience in the oil and gas business, the bulk of which relates to energy marketing and business development activities.
Mark A. Maki
Mark A. Maki was appointed President of the General Partner and Enbridge Management in January 2014 and has served as a director of both companies since October 2010. Additionally, in October 2016, Mr. Maki was elected to serve Enbridge as Senior Vice President — Finance Business Partners. Previously, Mr. Maki served as President of Enbridge Management and Senior Vice President of the General Partner from October 2010 to January 2014 and he served Enbridge in the functional title of Acting President, Gas Pipelines during 2013. Mr. Maki also previously served as Vice President — Finance of the General Partner and Enbridge Management from July 2002. Prior to that time, Mr. Maki served as Controller of the General Partner and Enbridge Management from June 2001, and prior to that, as Controller of Enbridge Pipelines from September 1999.
Mr. Maki brings over thirty years of oil and gas experience to the board, having joined Enbridge in 1986 and progressing through a series of accounting and financial roles of increasing responsibility during his tenure with Enbridge
133
in the United States and Canada. Through his broad range of domestic and Canadian experience in the pipeline industry, Mr. Maki provides our Board with financial expertise, leadership skills in our industry and knowledge of our local community and business environment.
William S. Waldheim
William S. Waldheim was elected as a director of the General Partner and Enbridge Management in February 2016 and serves on the Audit, Finance & Risk Committee of the General Partner and Enbridge Management, as well as on Special Committees of Enbridge Management. He previously served as President of DCP Midstream Partners LP where he had overall responsibility for DCP partnership affairs including commercial, trading and business development until his retirement in 2015. Prior to this, Mr. Waldheim was President of Midstream Marketing and Logistics for DCP Midstream and managed natural gas, crude oil and natural gas liquids marketing and logistics. From 2005 to 2008 he was Group Vice President of Commercial for DCP Midstream, managing its upstream and downstream commercial business. Mr. Waldheim started his professional career in 1978 with Champlin Petroleum as an auditor and financial analyst and served in roles involving NGL and crude oil distribution and marketing. He served as Vice President of NGL and Crude Oil Marketing for Union Pacific Fuels from 1987 until 1998 at which time they were acquired by DCP.
Mr. Waldheim provides our Board with a broad range of industry experience through his long career in the petroleum industry, ranging from upstream, midstream and downstream and across oil and gas and liquids sectors.
Dan A. Westbrook
Dan A. Westbrook was elected a director of the General Partner and Enbridge Management in October 2007 and serves on the Audit, Finance & Risk Committee of the General Partner and Enbridge Management, as well as on Special Committees of Enbridge Management. Since 2008, he has also served on the board of the Carrie Tingley Hospital Foundation in Albuquerque, New Mexico. From 2013 to 2016, Mr. Westbrook served as a director of SandRidge Energy, Inc. From 2001 to 2005, Mr. Westbrook served as president of BP China Gas, Power & Upstream and as vice-chairman of the board of directors of Dapeng LNG, a Sino joint venture between BP subsidiary CNOOC Gas & Power Ltd. and other Chinese companies. He held executive positions with BP in Argentina, Houston, Russia, Chicago and the Netherlands before retiring from the company in January 2006. He is a former director of Ivanhoe Mines, now known as Turquoise Hill Resources Ltd., an international mining company, Synenco Energy Inc., a Calgary-based oil sands company, and Knowledge Systems Inc., a privately-held United States company that provided software and consultant services to the oil and gas industry.
Through his long career in the petroleum exploration and production industry, including his other public company directorships and previous service as President of BP China, Mr. Westbrook provides our Board with extensive industry experience, leadership skills, international and petroleum development experience, as well as knowledge of our business environment.
John K. Whelen
John K. Whelen was elected a director of the General Partner and Enbridge Management in October 2014. Mr. Whelen also serves Enbridge as Executive Vice President and Chief Financial Officer since October 15, 2014, and as such leads the financial reporting function, and tax and treasury functions for Enbridge. Prior to this, from July 2014, to October 2014, Mr. Whelen was Senior Vice President, Finance for Enbridge and from April 2011 to July 2014 he was Senior Vice President and Controller. From September 2006 to April 2011, Mr. Whelen was Senior Vice President, Corporate Development for Enbridge. Additionally, Mr. Whelen has served as the chief financial officer, and then President of Enbridge Income Fund. Mr. Whelen joined Enbridge in 1992 as Manager of Treasury at what has become Enbridge Gas Distribution and has held a series of executive positions during his tenure with Enbridge.
Mr. Whelen brings to our Board his broad experience in capital markets as well as treasury, risk management, corporate planning and development, and financial reporting.
Stephen J. Neyland
Stephen J. Neyland was elected as a director to the General Partner and Enbridge Management in February of 2017. He was appointed Vice President of the General Partner and Enbridge Management in October of 2017 after having previously served as Vice President - Finance of the General Partner and Enbridge Management from October 2010 to July 2017. He also serves as Vice President - Finance of Spectra Energy Partners GP, LLC since February of 2017. Mr. Neyland was previously Controller of the General Partner and Enbridge Management effective September 2006. Prior to these appointments, he served the General Partner as Controller - Natural Gas from January 2005, Assistant Controller from May 2004 to January 2005 and in other managerial roles in finance and accounting from
134
December 2001 to May 2004. Prior to that time, Mr. Neyland was Controller of Koch Midstream Services from 1999 to 2001.
Mr. Neyland brings to our Board his broad experience in finance and accounting as well as in-depth knowledge of the business of the General Partner and Enbridge Management.
Laura Buss Sayavedra
Laura Buss Sayavedra was elected a director of the General Partner and Enbridge Management in February 2017. Also in February 2017, Ms. Sayavedra was elected as a director and appointed as the Vice President of Sponsored Vehicles of Spectra Energy Partners GP, LLC. In November of 2017, Ms. Sayavedra was appointed Vice President Finance Transformation and ERP Program Lead. From February to November 2017, Ms. Sayavedra served as Vice President, Sponsored Vehicles of the General Partner. Ms. Sayavedra served as Vice President and Treasurer and head of enterprise risk management for Spectra Energy Corp from January 2014 to February 2017. Ms. Sayavedra previously served as Vice President-Strategy for Spectra Energy Corp in 2013, as Vice President and Chief Financial Officer of Spectra Energy Partners, LP from 2008 to 2014, and as Vice President, Strategic Development and Analysis of Spectra Energy Corp from 2007 to 2008. Prior to that, Ms. Sayavedra served as a Vice President of Operations & Analytics of Duke Energy North America, and also served in various finance and business development roles of increasing responsibility.
Ms. Sayavedra brings to our Board her experience in finance and capital markets transactions as well as treasury and risk management.
Bradley F. Shamla
Bradley F. Shamla was appointed Vice President — Liquids Pipelines, Operations of the General Partner and Enbridge Management in April 2013. He previously served Enbridge as Vice President, Market Development since October 2010. Mr. Shamla was previously a senior director in the Business Development Group of Enbridge since 2008 and before that he was general manager in the Liquids Pipelines Operations Group, having joined Enbridge in 1991 and worked in a number of areas, including Operations, Engineering and Administration, both in the United States and Canada.
OTHER EXECUTIVE OFFICERS
Mark R. Boyce was appointed Vice President, Liquids Pipelines Law of the General Partner and Enbridge Management in June 2016. Mr. Boyce also currently serves as Vice President, Liquids Pipelines Law of several Enbridge subsidiaries. Prior to that, from May 2015 to June 2016, he was Vice President, Chief Compliance & Privacy Officer for Enbridge and from April 2012 until May 2015 he was Vice President & Chief Compliance Officer for Enbridge, responsible for the development and performance of compliance, training and ethics programs. Prior to April 2012, Mr. Boyce served Enbridge Gas Distribution (“EGD”) as Vice President, Law & Information Technology, a position he had progressed to after joining Enbridge as a corporate solicitor for the predecessor of EGD in August 1993.
David W. Bryson was appointed Senior Vice President — Liquids Pipelines, Operations of the General Partner and Enbridge Management in October 2016. Since June 2016, Mr. Bryson also serves the Liquids Pipelines Division of Enbridge as Senior Vice President, Operations, Liquids Pipelines, responsible for North American field operations across the Mainline, Gathering and Storage assets of the Liquids Pipelines Division. Prior to that, from April 2014, he was Vice President, Customer Service, Liquids Pipelines, after serving from July 2012 to April 2014 as Vice President, Asset Performance & Development and Vice President, Strategy & Integrated Services. Mr. Bryson joined Enbridge in 1994 via Enbridge Gas Distribution as a manager and progressed into the Major Projects Division in 2008, where he held various roles directing several of the major projects and programs, and progressed to the Liquids Pipelines division in 2012.
Allen Capps was appointed Controller and principal accounting officer of each of General Partner and Enbridge Management in February 2017. Mr. Capps is also Vice President and Chief Accounting Officer of Enbridge Inc. and the Controller of Spectra Energy Partners GP, LLC. He was appointed Vice President and Controller of Spectra Energy Corp in January 2012. He previously served as Vice President, Business Development, Storage and Transmission, for Union Gas from April 2010. Prior to such time, Mr. Capps served as Vice President and Treasurer for Spectra Energy Corp from December 2007 until April 2010. Mr. Capps has a strong knowledge of the energy industry and years of experience in senior finance and treasury roles.
135
Leo J. Golden was appointed Vice President — Major Projects of the General Partner and Enbridge Management on April 30, 2015. Since July 2014 he also serves Enbridge as a Vice President responsible for the execution of Renewables, Power and Gas Processing projects in both Canada and the United States From November 2011 to July 2014, Mr. Golden served Enbridge as Vice President, Major Projects Execution for certain subsidiaries. From April 2008 and November 2011, he was Vice President of Pipeline and Green Energy Projects and Vice President of the Alberta Clipper Project for certain Enbridge subsidiaries. Mr. Golden has served Enbridge in many capacities for over 25 years, having joined Enbridge in September 1990. His roles have included Director and Project Director of several Enbridge projects and areas, including Alberta Clipper, Shipper Services, Oil Sands and Acquisitions, Rates Assistant, Rates Analyst, Planning Analyst, Energy Analyst, and Manager of Business Development. In 1989, prior to joining Enbridge, Mr. Golden was a policy analyst with the Vancouver Stock Exchange.
Christopher J. Johnston was appointed Vice President, Finance and principal financial officer of the General Partner and Enbridge Management in July 2017. Mr. Johnston is also currently the Vice President Finance, Liquids Pipelines of Enbridge Inc. He joined Enbridge Inc. as Vice President and Controller on July 1, 2014. Prior to joining Enbridge Inc., Mr. Johnston worked at Deloitte LLP where he was Partner in their Assurance and Advisory practice for eight years.
Wanda M. Opheim was appointed to the role of Treasurer of the General Partner and Enbridge Management in February of 2017. She was also appointed to the role of Senior Vice President, Treasury of Enbridge in February 2017. Prior to that, she held the role of Senior Vice President, Chief Accounting Officer of Enbridge. Since joining Enbridge 25 years ago, Ms. Opheim has held roles of increasing responsibility within the Enbridge finance group most recently as Senior Vice President, Finance. Prior to that she was the Vice President, Corporate Planning and Development, Vice President, Treasury & Tax, Senior Director, Tax Services and Manager, Cash Management & Banking.
William T. Yardley was appointed Executive Vice President, Gas Transmission and Midstream of the General Partner in July of 2017. He also serves on the Board of Directors of Spectra Energy Partners GP, LLC and is the President of Spectra Energy Company (Spectra Energy). Mr. Yardley joined Spectra Energy in 2000 as General Manager of Marketing for one of Spectra Energy’s predecessor subsidiaries, Duke Energy Gas Transmission. He later served as Vice President of Marketing and Business Development and as Group Vice President of Spectra Energy’s northeastern United States assets and operations. He was named to his current position with Spectra Energy in January 2013.
SECTION 16(a) BENEFICIAL OWNERSHIP REPORTING COMPLIANCE
Section 16(a) of the Exchange Act requires our directors, executive officers and 10% beneficial owners to file with the SEC reports of ownership and changes in ownership of our equity securities and to furnish us with copies of all reports filed. Based on our review of the Section 16(a) filings that have been received by us and inquiries made to our directors and executive officers, we believe that all filings required to be made under Section 16(a) during 2017 were timely made.
GOVERNANCE MATTERS
We are a “controlled company,” as that term is used in NYSE Rule 303A, because all of our voting units are owned by the General Partner. Because we are a controlled company, the NYSE listing standards do not require that we or the General Partner have a majority of independent directors or a nominating or compensation committee of the General Partner’s board of directors.
The NYSE listing standards require our principal executive officer to annually certify that he is not aware of any violation by the Partnership of the NYSE corporate governance listing standards. Accordingly, this certification was provided as required to the NYSE on March 8, 2017.
STATEMENT ON BUSINESS CONDUCT AND CORPORATE GOVERNANCE GUIDELINES
We have adopted a Statement on Business Conduct applicable to all of our employees, officers and directors. We also have a statement of Corporate Governance Guidelines that sets forth the expectation of how our board of directors should function and its position with respect to key corporate governance issues. Copies of the Statement on Business Conduct and the Corporate Governance Guidelines are available on our website at www.enbridgepartners.com. We post on our website any amendments to or waivers of our Statement on Business Conduct or amendments to our Corporate Governance Guidelines, and we intend to satisfy any disclosure requirements that may arise under Form
136
8-K relating to this information through such postings. Additionally, these materials are available in print, free of charge, to any person who requests the information. Persons wishing to obtain this printed material should submit a request to Corporate Secretary, c/o Enbridge Energy Partners, L.P., 5400 Westheimer Court, Houston, Texas 77056
AUDIT, FINANCE & RISK COMMITTEE
Enbridge Management has an Audit, Finance & Risk Committee, referred to as the “Audit Committee,” comprised of four board members who are independent as the term is used in Section 10A of the Exchange Act. None of these members are relying upon any exemptions from the foregoing independence requirements. Mr. England is chairman of the Audit Committee. The members of the Audit Committee are Jeffrey A. Connelly, J. Herbert England, William Waldheim and Dan A. Westbrook. The Audit Committee provides independent oversight with respect to our internal controls, accounting policies, financial reporting, internal audit function and the report of the independent registered public accounting firm. The Audit Committee also reviews the scope and quality, including the independence and objectivity, of the independent and internal auditors and the fees paid for both audit and non-audit work and makes recommendations concerning audit matters, including the engagement of the independent auditors, to the Board of Directors.
The charter of the Audit Committee is available on our website at www.enbridgepartners.com. The charter of the Audit Committee complies with the listing standards of the NYSE currently applicable to us. This material is available in print, free of charge, to any person who requests the information. Persons wishing to obtain this printed material should submit a request to Corporate Secretary, c/o Enbridge Energy Partners, L.P., 5400 Westheimer Court, Houston, Texas 77056.
Enbridge Management’s Board of Directors has determined that Mr. England, Mr. Connelly and Mr. Waldheim each qualify as “audit committee financial experts” as defined in Item 407(d)(5)(ii) of Regulation S-K. Each of the members of the Audit Committee is independent as defined by Section 303A of the listing standards of the NYSE.
Mr. England serves on the Audit Committees of the General Partner and Enbridge Management, FuelCell Energy, Inc., and Enbridge Inc. In compliance with the provisions of the Audit Committee Charter, the boards of directors of the General Partner and of Enbridge Management determined that Mr. England’s simultaneous service on such audit committees does not impair his ability to effectively serve on the Audit Committee.
Enbridge Management’s Audit Committee has established procedures for the receipt, retention and treatment of complaints we receive regarding accounting, internal accounting controls or auditing matters and the confidential, anonymous submission by our employees of concerns regarding questionable accounting or auditing matters. Persons wishing to communicate with our Audit Committee may do so by writing to the Chairman, Audit Committee, c/o Enbridge Energy Partners, L.P., 5400 Westheimer Court, Houston, Texas 77056.
EXECUTIVE SESSIONS OF NON-MANAGEMENT DIRECTORS
The independent directors of Enbridge Management meet at regularly scheduled executive sessions without management. Jeffrey A. Connelly serves as the presiding director at those executive sessions. Persons wishing to communicate with the Company’s independent directors may do so by writing to the Chairman, Board of Directors, Enbridge Energy Partners, L.P., 5400 Westheimer Court, Houston, Texas 77056.
ITEM 11. EXECUTIVE COMPENSATION
COMPENSATION DISCUSSION AND ANALYSIS
General
We are an MLP and do not directly employ any employees, nor do we have executive officers or directors. We are managed by Enbridge Management, the delegate of our General Partner, and the Named Executive Officers, or NEOs, are executive officers of Enbridge Management and our General Partner. Similarly, the directors are members of the boards of directors of Enbridge Management and our General Partner. Our General Partner and Enbridge Management are indirect subsidiaries of Enbridge, and we are a business unit of Enbridge. Our General Partner, Enbridge Management and Enbridge, through its affiliates, provide us with managerial, administrative, operational and affiliated director services pursuant to service agreements among them and us. Pursuant to these service agreements, we reimburse our General Partner, Enbridge Management and affiliates of Enbridge for the costs of these managerial, administrative, operational and director services, which costs include a portion of the compensation of the NEOs.
137
The boards of directors of Enbridge Management and our General Partner do not have compensation committees, nor do they have responsibility for approving the elements of compensation for the NEOs presented in the tables following this discussion. The boards of directors of Enbridge Management and our General Partner, as part of our annual budgeting process, however, do have responsibility for evaluating and determining the reasonableness of our overall budget. The budget includes compensation amounts to be allocated to us for managerial, administrative, operational and director support to be provided by our General Partner, Enbridge Management and Enbridge and its affiliates pursuant to the service agreements mentioned above. The budgeted amount of total compensation includes the portion of the compensation of the NEOs that will be allocated to us and is discussed in more detail below.
Since we do not have direct employees or directors, and our General Partner and Enbridge Management do not have responsibility for approving the elements of compensation for the NEOs, we, our General Partner and Enbridge Management do not have compensation policies. The compensation policies and philosophy of Enbridge govern the types and amounts of compensation of each of the NEOs.
For 2017, our NEOs were:
Name | Position | |
Mark A. Maki | President (Principal Executive Officer) | |
Christopher J. Johnston1 | Vice President, Finance (Principal Financial Officer) | |
Stephen J. Neyland1 | Vice President (Former Principal Financial Officer) | |
D. Guy Jarvis | Executive Vice President - Liquids Pipelines & Major Projects | |
Bradley F. Shamla | Vice President - US Liquids Operations | |
David Bryson | Sr. Vice President, Liquids Operations | |
C. Gregory Harper2 | Former Executive Vice President - Gas Pipelines & Processing | |
1 On July 28, 2017, Mr. Neyland ceased to serve as the principal financial officer, and, on the same date, Mr. Johnston was appointed to serve as the principal financial officer. 2 Mr. Harper ceased to serve as an officer or director of our General partner and Enbridge Management on February 27, 2017. | ||
Mr. Jarvis is also an executive officer of Enbridge, serving as the Executive Vice President, Liquid Pipelines. As such, the Human Resources and Compensation Committee of the board of directors of Enbridge, or the HRC Committee, approves the elements of compensation for Mr. Jarvis based on the recommendation of the President & Chief Executive Officer of Enbridge considering his position within Enbridge on an enterprise-wide basis.
The HRC Committee does not have responsibility for reviewing or approving compensation for employees, on an individual basis, who are not a part of Enbridge’s executive leadership team. Compensation for our NEOs, with the exception of Mr. Jarvis, is determined as part of an Enbridge enterprise-wide review process. Each business unit develops a salary increase budget recommendation, in consultation with the Enbridge corporate compensation department, based on a competitive analysis of the labor market for that business unit. These recommendations are presented, in summary and on a business unit basis, to the HRC Committee for approval. Individual salary increases are implemented after the HRC Committee approves the overall budget. Compensation adjustments for the remaining NEOs are recommended by their supervisors and reviewed by the executive leadership team of Enbridge, including the President & Chief Executive Officer of Enbridge. Enbridge’s President & Chief Executive Officer reviews and approves salary increase recommendations, on an enterprise-wide basis, to ensure that compensation expense is within the budget approved by the HRC Committee. Each of the NEOs provides services to other affiliates of Enbridge and, therefore, compensation is determined on the basis of overall performance with respect to Enbridge and all of its affiliates and not solely based on performance with respect to us.
The HRC Committee has also reviewed the alignment of each compensation component with the interests of shareholders. The overall compensation mix of short-term and long-term compensation opportunities and the components of such incentive opportunities are balanced to mitigate undue risk and promote the financial and operational health of Enbridge. In addition, total incentive opportunities have a greater emphasis on the long term to drive long-term decisions.
We are a partnership and not a corporation for United States federal income tax purposes, and therefore, we are not subject to the limitations on the deductibility of executive compensation in Internal Revenue Code §162(m). In addition, we are not the employer for any of the NEOs.
138
The discussion and analysis of Enbridge's compensation practices for the fiscal year ended December 31, 2017 will be provided in its proxy statement which will be available upon its filing on the SEC's website at www.sec.gov and on Enbridge's website at www.enbridge.com.
Elements of Compensation
The HRC Committee sets the compensation philosophy of Enbridge, which is approved by the Enbridge board of directors. Enbridge has a pay-for-performance philosophy and programs that are designed to be aligned with its interests, on an enterprise-wide basis, as well as the interests of its shareholders. A significant portion of total direct compensation of Enbridge’s senior management is dependent on actual performance measured against short-, medium- and long-term performance goals of Enbridge, on an enterprise-wide basis, which are approved by the HRC Committee. As business units of Enbridge, we contribute to its overall growth, earnings and attainment of performance goals.
The elements of total compensation in 2017 for senior management of Enbridge were:
• | Base Salary - to provide a fixed level of compensation for performing day-to-day responsibilities, while balancing the individual’s role and competency, market conditions and issues of attraction and retention. |
• | Short-term incentive - to provide a competitive, performance cash award based on pre-determined corporate, business unit and individual goals that measure the execution of the business strategy over a one-year period. |
• | Medium-term and long-term incentives - to recognize contributions and provide competitive, equity-based compensation comprised of performance stock units, restricted stock units, and incentive stock options that are tied to the share price of Enbridge common shares, and are considered at-risk to motivate performance over the medium and long term. |
• | Pension plan - to provide a competitive retirement benefit. |
• | Savings plan - to promote ownership of Enbridge common shares and to provide the opportunity to save additional funds for retirement or other financial goals. |
• | Perquisites - to provide a competitive allowance to offset expenses largely related to the executive’s role. |
• | Benefits - to provide a competitive benefits program including health and welfare, life insurance and disability programs. |
With the exception of Mr. Jarvis, no other NEO has an existing executive employment agreement in place. The executive employment agreement for Mr. Jarvis provides specific total compensation terms in situations of involuntary termination or constructive dismissal.
The HRC Committee makes the determination as to whether the enterprise-wide performance goals have been achieved, approves business unit results and retains the discretion to make adjustments as necessary to more accurately reflect whether those goals have been met or exceeded. For example, the HRC Committee may determine to disregard the impacts of certain long-term financing activities on cash flow when determining whether certain goals have been met.
Base Salary
Base salary for the NEOs reflects a balance of market conditions, role, individual competency and attraction and retention considerations and takes into account compensation practices at peer companies of Enbridge. Increases in base pay for all NEOs are based primarily on competitive considerations.
Short-Term Incentive Plan
The Enbridge short-term incentive plan, or STIP, is designed to provide incentive for and to reward the achievement of goals that are aligned with the Enbridge annual business plan. The target short-term incentive reflects the level of responsibility associated with the role and competitive practice and is expressed as a percentage of base salary. Actual incentive awards can range from zero to two times the target. Awards under the plan are based on performance achieved relative to the goals established at the Enbridge corporate level, business unit level and individual level. Performance achieved relative to the corporate and business unit goals in each of these areas is reflected on a scale of zero to two; zero indicates performance was below threshold levels, one indicates that goals were achieved and two indicates that performance was exceptional. At the individual level, performance is assessed on a scale of zero to two and a half times; zero indicates performance was below threshold levels, one indicates that goals were achieved and two and a half indicates that performance was exceptional. Notwithstanding the two and a half times multiplier on individual performance, the overall range for the short-term incentive plan is zero to two times.
139
Each executive’s target award and payout range reflect the level of responsibility associated with their role, as well as competitive practice, and is established as a percentage of base salary.
Short-term incentive targets (as a % of base salary)
Executive | Target Short-Term Incentive | Payout range | Performance measures/weightings (as a % of total) | ||
Corporate | Business unit | Individual | |||
Mark Maki | 40% | 0 - 80% | 60% | 20% | 20% |
Christopher Johnston | 35% | 0 - 70% | 30% | 50% | 20% |
Stephen Neyland | 35% | 0 - 70% | 30% | 50% | 20% |
D. Guy Jarvis | 75% | 0 - 150% | 40% | 40% | 20% |
Bradley Shamla | 35% | 0 - 70% | 30% | 50% | 20% |
David Bryson | 40% | 0 - 80% | 30% | 50% | 20% |
C. Gregory Harper1 | n/a | n/a | n/a | n/a | n/a |
1. | Mr. Harper did not receive a calculated payment under the 2017 short-term incentive plan. A prorated value was included in his severance payment in accordance with his employment agreement. |
The overall performance multiplier and STIP are calculated as follows: | |||||
Performance multiplier | STIP | ||||
Corporate target incentive opportunity x (0-2) | Base Salary $ | ||||
+ | Business unit target incentive opportunity x (0-2) | x | Target STIP % | ||
+ | Individual target incentive opportunity x (0-2.5) | x | Overall performance multiplier (0-2) | ||
= | Overall performance multiplier (0-2) | = | $ Short term incentive award | ||
STIP Performance Metrics
The Enbridge STIP was designed to emphasize integration priorities for Enbridge as well as key financial, safety and operational objectives.
• | Available Cash Flow from Operations (ACFFO) per share was chosen as a measure of Enbridge's corporate performance, as a focus on ACFFO will enhance transparency of Enbridge's cash flow growth, increase comparability of results relative to peers, and will help ensure full value recognition for Enbridge's superior assets, growth and commercial arrangements. ACFFO per share is now referred to as distributable cash flow (DCF) per share; the calculation methodology remains unchanged. Target performance was set at $3.75 per share, at a level that matched corporate forecasts. Maximum payout level was set at $4.15 per share, and minimum performance was set at $3.60 per share, levels deemed by the Committee to be significant challenges or minimally acceptable. |
• | An Integration Scorecard was created, as the integration objectives are paramount to Enbridge's success. These objectives include advancing targeted financial synergies, creating meaningful engagement plans to motivate and energize employees and achieving established integration plans for each line of business. |
• | Business Unit Scorecards were designed to measure the performance and success of each business unit in areas such as financial performance, safety, operations and integrity, project execution and workforce development. Applicable business unit scorecards for 2017 are included below. |
• | Individual objectives were also established for each NEO based on strategic and operational priorities related to their responsibilities and other factors |
2017 Performance Results
At the end of the 2017 cycle, management prepared a report on the achievement of financial, integration, safety and operational goals under the Enbridge STIP. The HRC Committee reviewed and approved results.
For 2017, the following results were achieved (expressed as a percentage of achievement at the on-target level of performance):
140
Measures: | Results |
Enbridge Corporate Performance (Overall Result)1: | 0.95x |
Enbridge DCF/share (50% weighting) | 0.80x |
Enbridge Integration Scorecard (50% weighting) | 1.40x |
Business Unit Scorecards: | |
Gas Transmission and Midstream | 1.43x |
Corporate | 1.16x |
Liquids Pipelines | 1.15x |
Liquids Pipelines & Major Projects (for Mr. Jarvis) | 1.17x |
1. | To better align with the shareholder experience, key performance indicators and cost containment measures undertaken in 2017, Management recommended that the calculated result be reduced for all employees at the vice president level and above, including all of the NEOs. As a result, the final corporate performance multiplier for 2017 applicable to the NEOs is 0.95x. |
The business unit performance measure for each NEO is calculated as follows:
Business Unit Scorecard | Mark A. Maki | Christopher Johnston | Stephen J. Neyland | D. Guy Jarvis | Bradley F. Shamla | David Bryson | C. Gregory Harper |
Gas Transmission and Midstream | - | - | 100% | - | - | - | - |
Corporate | 100% | - | - | - | - | - | - |
Liquids Pipelines | - | 100% | - | 90% | 100% | 100% | - |
Major Projects | - | - | - | 10% | - | - | - |
The Business Unit Scorecards that are used to determine the business unit performance portion of the short-term incentive awards is calculated as shown in the following tables. The Business Unit Scorecards reflect rounding and range from 0 to 2.0, with 1.0 meaning that the target performance measure was met. The business units include us, but also include portions of other Enbridge businesses.
Gas Transmission and Midstream | |||||
Performance Measure | Weight | Sub Measures & Weightings | Multiplier | Weighted Multiplier | |
Safety | 21% | Incident investigations Total recordable injury frequency Training program completion Safety observations and leadership | 4% 8% 5% 4% | 1.81 | 0.38 |
Operations & Integrity | 14% | Risk assessments and inspections Transmission pipeline inspections Number of onshore natural gas transmission pipeline leaks Reliability incident frequency | 4% 4% 4% 2% | 1.67 | 0.23 |
Financial | 40% | Gas Transmission and Midstream DCF | 40% | 1.31 | 0.52 |
Workforce & Other | 25% | Projects on schedule Projects on budget Career development | 10% 10% 5% | 1.16 | 0.29 |
Business Unit Performance Multiplier | 1.43 | ||||
141
Corporate | ||||||
Performance Measure | Weight | Sub Measures & Weightings | Multiplier | Weighted Multiplier | ||
Safety, Operations & Integrity | 15% | Incident investigations Total recordable injury frequency Safety observations and leadership Average safety performance of all business units | 4.5% 4% 1.5% 5% | 1.77 | 0.27 | |
Operational Performance: Other Business Units | 10% | Operational Reliability, Customer Satisfaction & Other Non- Financial Performance of other BUs | 10% | 1.33 | 0.13 | |
Financial | 65% | Corporate Office Cost Containment | 65 | % | 1.17 | 0.76 |
Workforce & Other | 10% | Career development | 10% | — | — | |
Business Unit Performance Multiplier | 1.16 | |||||
Liquids Pipelines | |||||
Performance Measure | Weight | Sub Measures & Weightings | Multiplier | Weighted Multiplier | |
Safety | 24% | Incident investigations Total recordable injury frequency Safety observations and leadership | 6% 8% 10% | 1.67 | 0.40 |
Operations& Integrity | 16% | Significant releases Release volume Pipeline reliability Facility inspection and repairs | 4% 4% 4% 4% | 1.50 | 0.24 |
Financial | 40% | Liquids Pipelines DCF | 40% | 0.75 | 0.30 |
Workforce & Other | 20% | Stakeholder relationships Project integration Career development | 5% 5% 10% | 1.05 | 0.21 |
Business Unit Performance Multiplier | 1.15 | ||||
Major Projects | |||||
Performance Measure | Weight | Sub Measures & Weightings | Multiplier | Weighted Multiplier | |
Safety | 20% | Incident investigations Total recordable injury frequency Safety observations | 9% 3% 8% | 1.00 | 0.20 |
Operations& Integrity | 20% | Environmental incident investigations Environmental incident frequency Quality management throughout project lifecycle | 6% 4% 10% | 1.74 | 0.35 |
Project Execution | 55% | Projects on schedule Projects on budget Seamless project integration | 25% 25% 5% | 1.41 | 0.77 |
Workforce & Other | 5% | Career development | 5% | 1.06 | 0.05 |
Business Unit Performance Multiplier | 1.37 | ||||
The table below details each NEO’s overall performance multiplier for 2017, including individual multiplier results:
142
Short-term incentive performance multipliers
A - Corporate performance | B - Business unit performance | C - Individual performance | A+B+C1 | |||||||||||||||||||||||
Executive | Wt. | x | Mult. | = | Total A | Wt. | x | Mult. | = | Total B | Wt. | x | Mult. | = | Total C | Overall Total | ||||||||||
Mark Maki | 60 | % | 0.95 | 0.6 | 20 | % | 1.16 | 0.2 | 20 | % | 1.50 | 0.3 | 1.10 | |||||||||||||
Christopher Johnston | 30 | % | 0.95 | 0.3 | 50 | % | 1.15 | 0.6 | 20 | % | 1.00 | 0.2 | 1.06 | |||||||||||||
Stephen Neyland | 30 | % | 0.95 | 0.3 | 50 | % | 1.43 | 0.7 | 20 | % | 1.00 | 0.2 | 1.20 | |||||||||||||
D. Guy Jarvis | 40 | % | 0.95 | 0.4 | 40 | % | 1.17 | 0.5 | 20 | % | 1.75 | 0.4 | 1.20 | |||||||||||||
Bradley Shamla | 30 | % | 0.95 | 0.3 | 50 | % | 1.15 | 0.6 | 20 | % | 1.50 | 0.3 | 1.16 | |||||||||||||
David Bryson | 30 | % | 0.95 | 0.3 | 50 | % | 1.15 | 0.6 | 20 | % | 1.50 | 0.3 | 1.16 | |||||||||||||
C. Gregory Harper2 | n/a | n/a | n/a | n/a | n/a | n/a | n/a | n/a | n/a | n/a | ||||||||||||||||
1. | Differences between calculated multipliers and overall multipliers due to rounding. |
2. | Mr. Harper did not receive a calculated payment under the 2017 short-term incentive plan. A prorated value was included in his severance payment in accordance with his executive employment agreement. See "Former Executive Officers" section for details. |
Each NEO’s calculated short-term incentive award, as well as the actual award, is as follows:
Short-term incentive award calculations
Executive | December 31, 2017 salary1 ($) | x | 2017 target award (%) | x | Overall multiplier | = | Calculated award1,2 ($) | Actual award1,2 ($) | |||||
Mark Maki | 294,424 | 40 | % | 1.10 | 129,546 | 129,782 | |||||||
Christopher Johnston | 215,571 | 35 | % | 1.06 | 79,977 | 79,977 | |||||||
Stephen Neyland | 276,357 | 35 | % | 1.20 | 116,070 | 116,070 | |||||||
D. Guy Jarvis | 502,813 | 75 | % | 1.20 | 452,532 | 452,079 | |||||||
Bradley Shamla | 281,899 | 35 | % | 1.16 | 114,451 | 114,451 | |||||||
David Bryson | 275,350 | 40 | % | 1.16 | 127,762 | 127,762 | |||||||
C. Gregory Harper3 | n/a | n/a | n/a | n/a | n/a | ||||||||
1. | Canadian dollars have been converted to US dollars using the published WM/Reuters 4pm London year end exchange rate of C$1 =US$0.7981. |
2. | Differences between calculated awards and actual awards due to proration of short-term incentive targets throughout the year and/or rounding. |
3. | Mr. Harper did not receive a calculated payment under the 2017 short-term incentive plan. A prorated value was included in his severance payment in accordance with his executive employment agreement. See "Former Executive Officers" section for details. |
Medium- and long-term incentives
Enbridge’s medium- and long-term incentives for executives include two primary plans: the performance stock unit plan and incentive stock option plan.
Enbridge views medium- and long-term incentives as forward-looking compensation vehicles, and as such grants are considered as part of the compensation for the year of grant and onwards instead of in recognition of prior performance.
The various plans that apply to executives have different terms, vesting conditions and performance criteria. This mitigates the risk that executives produce only short-term results for individual profit. This approach also benefits shareholders and helps to maximize the ongoing retention value of the medium- and long-term incentives granted to executives.
Medium- and long-term incentive grants are determined as follows:
Base salary ($) | x | Target incentive opportunity (%) | ÷ | Option value or share price | = | Number of options or units granted (#) |
The table below outlines Enbridge’s current medium- and long-term incentive plans.
143
Performance stock units | Incentive stock options | |
Term | Three years | 10 years |
Description | Phantom shares/units with performance conditions that affect payout | Options to acquire Enbridge common shares with an exercise price equal to the fair market value on the grant date |
Frequency | Annual grants | Annual grants |
Performance Conditions | Enbridge 50% - DCF growth relative to a target set at the start of the term 50% - risk-adjusted total shareholder return (TSR) performance relative to peers | n/a |
Vesting | Performance stock units cliff vest after three years | Options vest at 25% per year over four years, starting on the first anniversary of the grant date |
Payout | Paid out in cash at the end of three years based on the market value of an Enbridge common share, subject to adjustment from 0-200% depending on achievement of the performance conditions above. | Participant acquires Enbridge common shares at the exercise price defined at the time of grant |
The table below shows the target medium- and long-term incentive awards for each NEO, as well as the amount each plan contributes to that total, in each case as a percentage of base salary.
Medium- & long-term incentive targets (as a % of base salary)
Annual grant breakdown | |||
Executive | Target Medium & Long-Term Incentives | Performance stock units | Incentive stock options |
Mark Maki | 85% | 25.5% | 59.5% |
Christopher Johnston | 70% | 21% | 49% |
Stephen Neyland | 70% | 21% | 49% |
D. Guy Jarvis | 250% | 87.5% | 162.5% |
Bradley Shamla | 70% | 21% | 49% |
David Bryson | 85% | 25.5% | 59.5% |
C. Gregory Harper | 200% | 70.0% | 130.0% |
Performance stock units
Performance stock units give executives the opportunity to earn up to two times the value of their units when the units mature after three years, by achieving pre-set hurdles on specific performance measures. Performance stock units are granted annually, at the beginning of the year.
For grants starting in 2016, the following two performance measures are used, each weighted at 50%:
i. | DCF growth: this measure represents a commitment to Enbridge shareholders to achieve operating cash flow growth that demonstrates Enbridge’s ability to deliver on its growth plan and continued dividend increases. |
ii. | Relative risk-adjusted total shareholder return (risk-adjusted TSR): defined as TSR divided by volatility over the measurement period, this measure is used to compare Enbridge against its performance peers. Enbridge strongly believes risk-adjusted TSR resonates with the investor value proposition of strong, consistent total returns over the long term. For this measure, Enbridge compares itself against the following group of companies, chosen because they are all capital market competitors with a similar risk profile, operating in a comparable industry sector. |
144
Performance comparator group: relative risk-adjusted TSR1 | ||
Canadian Utilities Limited | NiSource Inc. | |
Dominion Resources | ONEOK, Inc. | |
DTE Energy Company | Pembina Pipeline Corporation | |
Energy Transfer Equity | PG&E Corporation | |
Enterprise Products Partners, L.P. | Plains All American Pipeline, L.P. | |
Fortis Inc. | Sempra Energy | |
Inter Pipeline Ltd. | TransCanada Corporation | |
Kinder Morgan, Inc. | ||
Magellan Midstream Partners, L.P. | ||
1.For the 2017 peer group, Spectra Energy Corp. was removed due to the Merger.
Payout is determined at the end of the three-year term using an actual performance multiplier that ranges anywhere from 0.0x to 2.0x depending on whether the performance conditions were met. The final Enbridge share price at the end of the term is the volume weighted average trading price of an Enbridge common share on the TSX or NYSE for the last 20 days before the end of the term.
2017 performance stock unit grant
The mechanics of the 2017 performance stock unit grant are illustrated below.
Number of performance units granted | + | Performance units (dividend equivalents) | x | Performance multiplier | x | Final share price | = | Payout ($) | |||||||
DCF/share growth (50%)* 0x = below 2% compound annual growth 1x = 8.4% compound annual growth 2x = at or above 10.9% compound annual growth | Relative risk-adjusted TSR (50%) 0x = below 50th percentile 1x = between 50th and 75th percentile 2x = above 75th percentile | ||||||||||||||
*Performance between the above anchors will result in a multiplier determined through linear interpolation. | |||||||||||||||
Performance thresholds for DCF growth and relative risk-adjusted TSR are reviewed annually.
The following performance stock units were granted to the NEOs in 2017:
Executive | Number of performance stock units granted | Expected value (as a % of base salary) | ||
Mark Maki | 3,540 | 53.6 | % | |
Christopher Johnston | 1,310 | 27.5 | % | |
Stephen Neyland | 2,620 | 40.6 | % | |
D. Guy Jarvis | 9,330 | 86.9 | % | |
Bradley Shamla | 2,470 | 37.5 | % | |
David Bryson | 3,350 | 54.3 | % | |
C. Gregory Harper | 7,030 | 69.3 | % | |
2015 performance stock unit payout
The performance stock units granted January 1, 2015 matured on December 31, 2017 . The performance multiplier was 1.38x and was calculated based on the following metrics:
145
Measure | Adjusted EPS growth | Relative P/E ratio | Combined (50/50 weighting) |
Lower threshold | 3% compound growth | Below 50th percentile | |
(0.0x multiplier) | (0.0x multiplier) | ||
Target (midpoint) | 6% compound growth | Between 50th - 75th percentile | |
(1.0x multiplier) | (1.0x multiplier) | ||
Upper threshold | 10% compound growth | Above 75th percentile | |
(2.0x multiplier) | (2.0x multiplier) | ||
Actual | 5.3% compound growth | 95th percentile | 1.38x multiplier |
(0.75x multiplier) | (2.0x multiplier) | ||
The performance peer group for the 2015 performance stock unit payout was as follows:
Performance comparator group: relative P/E ratio1 | |
Ameren Corporation Canadian Utilities Limited CenterPoint Energy, Inc. Emera Incorporated Fortis Inc. National Fuel Gas Company NiSource Inc. | OGE Energy Corp. ONEOK, Inc. PG&E Corporation Sempra Energy TransAlta Corporation TransCanada Corporation |
1. | Spectra Energy Corp. was removed from the peer group due to the Merger. |
This resulted in the following payouts for the NEOs in early 2018:
Executive | Performance stock units granted (#) | + | Notionally reinvested dividends (#) | = | Total performance stock units (#) | x | Performance multiplier | x | Final share price1,2 ($) | = | Payout ($)2 | |
Mark Maki | 3,590 | 475 | 4,065 | 1.38 | 38.59 | 216,463 | ||||||
Christopher Johnston | 2,030 | 268 | 2,298 | 1.38 | 39.23 | 124,725 | ||||||
Stephen Neyland | 1,690 | 223 | 1,913 | 1.38 | 38.59 | 101,900 | ||||||
D. Guy Jarvis | 8,370 | 1,107 | 9,477 | 1.38 | 39.23 | 514,260 | ||||||
Bradley Shamla | 2,550 | 337 | 2,887 | 1.38 | 38.59 | 153,755 | ||||||
David Bryson | 3,560 | 471 | 4,031 | 1.38 | 39.23 | 218,730 | ||||||
C. Gregory Harper3 | 2,490 | 329 | 2,819 | 1.38 | 38.59 | 112,603 | ||||||
1. | The volume weighted average price of an Enbridge share on the TSX or the NYSE for the 20 trading days immediately preceding December 31, 2017. |
2. | Canadian dollars have been converted to US dollars using the published WM/Reuters 4pm London year end exchange rate of C$1 = US$0.7981. Differences between calculated payout and amounts in the column due to rounding. |
3. | Mr. Harper's performance stock unit payout is prorated as a result of his departure from Enbridge. |
2015 Midcoast Energy Partners performance stock unit payout
In 2015, grants of performance stock units were made that were tied to the formerly publicly traded units of Midcoast Energy Partners (“MEP”). Mr. Harper was the only NEO to participate in this plan. The MEP performance stock units that were granted on January 1, 2015 matured on December 31, 2017.
The performance multiplier of 0.25x was calculated based on the following metrics:
Measure | Weighting | Multiplier |
Distributable Cash Flow (DCF) per Unit | 50% | 0.0x |
Distribution yield relative to peers | 50% | 0.5x |
Overall Multiplier | 0.25x | |
The peer group used to determine the relative distribution yield for the 2015 grant was as follows:
146
American Midstream Partners, L.P. Crestwood Midstream Partners, L.P. DCP Midstream Partners, L.P. Enable Midstream Partners, L.P. MarkWest Energy Partners, L.P. | QEP Midstream Partners, L.P. Regency Energy Partners, L.P. Southcross Energy Partners, L.P. Summit Midstream Partners, L.P. Targa Resources Partners, L.P. |
This resulted in the following payout for Mr. Harper in early 2018:
Executive | Performance stock units granted (#) | + | Notionally reinvested dividends (#) | = | Total performance stock units (#) | x | Performance multiplier | x | Final unit price1 ($) | = | Payout ($)2 | ||
C. Gregory Harper | 23,490 | 9,918 | 33,408 | 0.25 | 8.00 | 63,359 | |||||||
1. | The final unit price is based on the consolidation price of $8.00 per unit. |
2. | Values that were crystalized at the transaction date were further subject to total shareholder return on Enbridge common shares for the time period from June 28, 2017 - December 31, 2017. |
In 2017, Enbridge acquired all of the outstanding publicly-held common units, and Midcoast Energy Partners LP was taken private. Accordingly, there will be no further grants under this plan.
Incentive stock options
Incentive stock options provide executives the opportunity to buy Enbridge common shares at some point in the future at the exercise price defined at the time of grant. Members of Enbridge’s senior management leadership team are eligible to receive incentive stock options.
Incentive stock options are typically granted in February or March every year to both Canadian and US members of senior management who are eligible to participate in the incentive stock option plan. Options granted to US employees can either be qualified or non-qualified, as defined by the US Internal Revenue Code. Incentive stock options may be granted to executives when they join Enbridge, and if granted, are typically effective as of the executive’s date of hire. If the hire date falls within a blackout period, the grant is delayed until after the end of the blackout period.
Incentive stock options vest in equal installments over a four-year period. The maximum term of a stock option is 10 years, but the term can be reduced if the executive leaves Enbridge.
The exercise price of an incentive stock option is the weighted average trading price of an Enbridge common share on the listed exchange for the last five trading days before the grant date. If the grant date is during a trading blackout period, the grant date will be adjusted to no earlier than the sixth trading day after the trading blackout period ends. Stock options are never backdated or re-priced.
2017 Incentive Stock Option Grants
The table below shows the incentive stock options granted to each of the NEOs in 2017.
Executive | Stock options granted (#) | Expected value (% of base salary)1 | ||
Mark Maki | 67,800 | 105.9 | % | |
Christopher Johnston | 33,760 | 73.0 | % | |
Stephen Neyland | 38,080 | 85.4 | % | |
D. Guy Jarvis | 155,500 | 149.3 | % | |
Bradley Shamla | 37,510 | 82.5 | % | |
David Bryson | 63,720 | 106.4 | % | |
C. Gregory Harper | 85,120 | 121.6 | % | |
1. | There was a decrease in grant date fair values between the time of HRC Committee approval of option awards and grant execution. This was not a discretionary adjustment to decrease the value delivered below target, but was a result of the change in the inputs into the Black Scholes model between the time of approval and grant date. |
147
2017 Special Awards
Several unique awards were provided to the NEOs during 2017 for specific, one-off circumstances. None of the following programs are considered as part of the standard compensation package for the NEOs, and these awards will not be made on a recurring basis.
Merger & Acquisition Strategic Transformation Award
The Merger was the most extraordinary and complex activity undertaken in company history. In recognition of the transformational nature of the deal, and the leadership that was required to bring the deal to closing, a cash Merger & Acquisition Strategic Transformation Award was provided to Mr. Harper.
The following table outlines the details of the awards:
Executive | Total award value ($) | |
C. Gregory Harper | 150,000 | |
Integration & Synergy Incentive
To ensure that Enbridge delivered on the cost synergy targets which were announced to shareholders at the time of the Merger signing, an Integration & Synergy Incentive was awarded to Messrs. Maki and Bryson for the successful execution of detailed integration efforts.
The award was subject to specific performance criteria related to the pace and quality of integration efforts. Additionally, the award was subject to minimum threshold criteria including achieving specific business continuity objectives that would ensure a smooth transition following the closing of the transaction, including safety and reliability, financial reporting, regulatory compliance and employee engagement actions. Failure to meet the performance criteria would result in an adjustment to the size of the award downwards or eliminate payment entirely. There was no upside opportunity within the program.
Performance against the pre-determined metrics was reviewed and assessed by the President & Chief Executive Officer of Enbridge, and a full payment was approved.
Executive | Total award value ($)1 | ||
Mark Maki | 176,703 | ||
David Bryson | 110,140 | ||
1. | Canadian dollars have been converted to US dollars using the published WM/Reuters 4pm London year end exchange rate of C$1 =$0.7981. |
Pension Plan
Enbridge sponsors a number of non-contributory qualified pension plans, including:
• | the Pension Plan for Employees of Enbridge Gas Distribution Inc. and Affiliates, or EGD RPP; |
• | the Retirement Plan for the Employees of Enbridge and its Canadian affiliates, or EI RPP; and |
• | the Enbridge Employee Services, Inc. Employees’ Pension Plan, or US QPP. |
Enbridge also sponsors a number of non-contributory, supplemental nonqualified retirement plans which provide defined benefits in excess of the tax-qualified plans’ limits, including:
• | the Enbridge Supplemental Pension Plan, or EI SPP; and |
• | the Enbridge Employee Services, Inc. Supplemental Pension Plan for United States Employees, or US SPP. |
We collectively refer to the EGD RPP, the EI RPP, the US QPP, the EI SPP and the US SPP as the Pension Plans.
148
For service prior to becoming a senior management employee, there are different pension benefits depending on an employee’s hire date with Enbridge. For Canadian non-senior management employees, the EI RPP provides employees with a choice to participate in a non-contributory defined contribution component, where the level of contribution varies depending on age and years of service, or a defined benefit component where benefits equal (a) 1.6% of the participant’s Highest Average Earnings multiplied by (b) the number of years of credited years of service and offset for a portion of the government’s Canada Pension Plan benefit. Highest Average Earnings is equal to sum of (i) the average of the participant’s highest annual base salary during three consecutive years out of the last ten years of credited service and (ii) 50% of the average of the participant’s three highest annual performance bonuses paid in the last five years of credited service. EGD RPP benefits for service prior to July 1, 2001 are capped at registered plan limits with no SPP benefits payable. US employees hired before January 1, 2002 have grandfathered benefits equal to: (a) 1.6% of the participant’s Highest Average Earnings multiplied by (b) the number of credited years of service. US employees hired after January 1, 2002 have cash balance benefits with pay credits ranging from 4% to 10% depending on the employees’ pensionable pay, age and years of service. Other provisions are aligned with the senior management provisions described below.
For service while a senior management employee, the Pension Plans provide a yearly pension payable in the normal form (60% joint and survivor) equal to: (a) 2% of the participant’s Highest Average Earnings multiplied by (b) the number of credited years of service. An unreduced pension is payable if retirement is after age 55 with 30 or more years of service or after age 60. Early retirement reductions apply if a participant retires and does not meet these requirements. Retirement benefits paid from the Pension Plans are indexed at 50% of the annual increase in the consumer price index. All NEOs are currently senior management employees.
Mr. Bryson participated in the defined contribution component of the EI RPP for 3.83 years. No further company or employee contributions are permitted to be made to this plan.
Defined Contribution Plans
Enbridge provides an employee savings plan for all employees. For Canadian employees, Enbridge matches 100% of employee contributions up to 2.5% of base salary. For US employees, Enbridge provides a tax-qualified retirement plan which matches 100% of employee contributions up to 5.0% of base salary, subject to limits established by the IRS.
Savings Plans
Enbridge provides an employee savings plan for all employees. For Canadian employees, Enbridge matches 100% of employee contributions up to 2.5% of base salary. For US employees, Enbridge provides a tax-qualified retirement plan which matches 100% of employee contributions up to 5.0% of base salary, subject to limits established by the IRS.
Other benefits
Enbridge’s perquisites and benefits plans are key elements of the total compensation package for the NEOs.
Perquisites
The NEOs receive an annual perquisite allowance to offset expenses related to their positions, such as the cost of owning and operating a vehicle, parking and business clubs. These allowance levels are reviewed regularly for competitiveness. The NEOs are also reimbursed for a portion of costs for personal financial planning.
Life and health benefits
Medical, dental, life insurance and disability insurance benefits are available to meet the specific needs of individuals and their families. The NEOs participate in the same plan as all other employees. The plans are structured to provide minimum basic coverage with the option of enhanced coverage at a level that is competitive and affordable.
The HRC Committee reviews the retirement and other benefits regularly. These benefits are a key element of a total compensation package and are designed to be competitive and reasonably meet the needs of executives in their current roles.
149
Other Compensation Policies
Share ownership
It is important for all Enbridge officers, including the NEOs, to have a meaningful equity stake in Enbridge. Owning Enbridge common shares is a tangible way to align the interests of executives with those of Enbridge shareholders. Each Enbridge officer is given a share ownership target and is required to meet and maintain their target within four years of being appointed to the position, or within four years of the target being re-set. The ownership target in 2017 for Mr. Jarvis was two times base salary; for all other NEO it is one times base salary.
Anti-hedging policy
Our insider trading and reporting guidelines, among other things, prohibit directors, officers, employees and contractors (of us and our subsidiaries) from purchasing financial instruments that are designed to hedge or offset a decrease in market value of equity securities granted as compensation or held by the NEO, as such positions delink the intended alignment of employee and shareholder interests. The following activities are specifically prohibited:
• | any form of hedging activity; |
• | any form of transaction involving stock options (other than exercising options in accordance with the plans); |
• | any other form of derivative trading (including “puts” and “calls”); and |
• | “short selling” (selling securities that the individual does not own). |
Clawback policy
The incentive compensation clawback policy allows Enbridge to recover, from current and former executives, certain incentive compensation amounts awarded or paid to individuals if the individuals engaged in fraud or willful misconduct that led to inaccurate financial results reporting, regardless of whether the misconduct resulted in a restatement of all or a part of Enbridge’s financial statements.
Service Agreements and Allocation of Compensation to the Partnership
As discussed above, our General Partner, Enbridge Management and affiliates of Enbridge provide managerial, administrative, and operational and director services to us pursuant to service agreements and we reimburse them for the costs of such services. Through an operational services agreement among Enbridge, affiliates of Enbridge and us, we are charged for the services of executive management resident in Canada, including the services of Messrs. Jarvis, Maki, Johnston and Bryson. Through a general and administrative services agreement among us, our General Partner, Enbridge Management and Enbridge Employee Services, Inc., a subsidiary of our General Partner, which we refer to as EES, we are charged for the services of executive management resident in the United States, including Messrs. Harper, Neyland and Shamla. See Item 13. Certain Relationships and Related Transactions, and Director Independence — Other Related Party Transactions for a discussion of these two agreements.
In connection with our annual budget process, we determine a budgeted allocation rate, which represents an estimated average percentage of expected time that will be spent by each of the NEOs on our business during the succeeding year. The NEOs provide input as to what those estimated percentages should be. Those estimates are revised each year based on historical experience and business plans for the following year. The NEOs do not keep logs of their time spent on our matters. Since the allocation rate is estimated, the actual time spent by an NEO on our behalf may vary from the budgeted allocation rate, and we may be allocated more or less of that NEO’s compensation than the actual percentage of his time spent on our behalf in a given year.
For services provided under the operational services agreement, as part of the annual budget process, we, Enbridge and affiliates of Enbridge, which we refer to as the Canadian service providers, agree on the amount to be allocated to us, which represents an estimate of a pro-rata reimbursement of each Canadian service provider’s estimated annual departmental costs, net of amounts charged to other affiliates and amounts identifiable as costs of that Canadian service provider. The Canadian service providers charge us a monthly fixed fee based on the budgeted amount.
For services provided under the general and administrative services agreement, base salary costs of EES are allocated to us based on the percentage of time spent by EES employees, including four of the NEOs, on our behalf compared with the total time of all EES employees. We are also allocated a portion of the equity-based compensation
150
expense of EES as determined in accordance with U.S. GAAP. Pension expenses of EES, other than expenses under Enbridge’s nonqualified supplemental pension plan for U.S. domiciled employees, which we refer to as the SPP, are allocated to us based on the proportion that the total headcount of EES employees assigned to us bears to the total headcount of EES. For this purpose, an employee of EES is deemed to be assigned to us if he or she works on assets we own. Pension expenses of EES attributable to the SPP are allocated to us based upon the average budgeted allocation rate. EES allocates to us that portion of its compensation expense for the STIP equal to the total salaries of employees who perform work for us multiplied by the average budgeted allocation rate divided by EES’s total salary expense.
The compensation of our NEOs included in the tables below is established by Enbridge as described above. We selected our three most highly compensated executives (other than our principal executed officer and our principal financial officer) based on current estimates regarding the amount of time such executives devoted to us. We have included in the following tables the full amount of compensation and related benefits provided for each of the NEOs together with an estimate of the approximate time spent by each NEO on our behalf and the estimated amount of compensation cost allocated to us for the years ended December 31, 2017, 2016 and 2015, as applicable. Since the amount of NEO compensation allocated to us is based on estimates of time spent on our behalf by the particular NEO, the compensation amounts allocated to us as presented below may not reflect the actual amount of compensation allocated to us for each particular NEO.
151
Summary Compensation Table
The table below shows the total amounts that Enbridge and its subsidiaries paid and granted to the NEOs for the years ended December 31, 2017, 2016 and 2015. Amounts represented below for Messrs. Maki, Johnston, Jarvis, and Bryson were originally paid in Canadian dollars have been converted to US dollars using the published WM/Reuters 4pm London year end exchange rate of C$1 = US$0.7981, C$1 = US$0.7548, and C$1= US$0.782 for 2017, 2016 and 2015 respectively.
Named Executive Principal Position | Year | Salary | Bonus(1) | Share Awards(2) | Option Awards(3) | Non-Equity Incentive Compen-sation Plan(4) | Change in Pension Value and Nonqualified Deferred Compen-sation Earnings(5) | All Other Compen-sation(6) | Total(7) | Approximate Percentage of Time Devoted to Enbridge Energy Partners, L.P. | Approximate Amount Allocated to Enbridge Energy Partners, L.P. | ||||||||||
($) | ($) | ($) | ($) | ($) | ($) | ($) | ($) | (%) | ($) | ||||||||||||
Mark Maki | 2017 | 294,424 | 176,703 | 157,936 | 311,687 | 129,782 | 718,000 | 176,610 | 1,965,142 | 50 | 982,571 | ||||||||||
President (Principal Executive Officer) | 2016 | 348,534 | — | 209,094 | 584,948 | 179,600 | 377,000 | 291,071 | 1,990,247 | 90 | 1,791,222 | ||||||||||
2015 | 366,649 | — | 166,540 | 394,438 | 197,729 | (247,000 | ) | 40,227 | 918,583 | 90 | 826,724 | ||||||||||
Christopher Johnston7 | 2017 | 214,853 | — | 58,445 | 155,200 | 79,977 | 118,000 | 35,837 | 662,312 | 30 | 198,693 | ||||||||||
Vice President, Finance (Principal Financial Officer) | |||||||||||||||||||||
Stephen Neyland | 2017 | 274,804 | 150,000 | 109,647 | 230,765 | 116,070 | 489,000 | 44,897 | 1,415,183 | 20 | 283,036 | ||||||||||
Vice President (Former Principal Financial Officer) | 2016 | 270,144 | — | 76,291 | 203,102 | 192,937 | 193,000 | 35,001 | 970,475 | 80 | 776,380 | ||||||||||
2015 | 268,497 | — | 78,399 | 159,602 | 127,881 | 11,000 | 38,040 | 683,420 | 90 | 615,078 | |||||||||||
D. Guy Jarvis | 2017 | 496,827 | — | 416,255 | 714,857 | 452,079 | 1,270,000 | 82,495 | 3,432,513 | 30 | 1,029,754 | ||||||||||
Executive Vice President - Liquids Pipelines & Major Projects | 2016 | 443,615 | — | 464,986 | 552,378 | 518,269 | 694,000 | 80,636 | 2,753,883 | 30 | 826,165 | ||||||||||
2015 | 426,718 | — | 367,451 | 322,066 | 405,332 | (266,000 | ) | 88,473 | 1,344,040 | 30 | 403,212 | ||||||||||
Bradley Shamla | 2017 | 280,315 | — | 103,370 | 227,311 | 114,451 | 778,000 | 48,266 | 1,551,713 | 75 | 1,163,783 | ||||||||||
Vice President - US Liquids Operations | 2016 | 275,561 | — | 115,496 | 324,064 | 143,224 | 401,000 | 49,636 | 1,308,981 | 75 | 981,736 | ||||||||||
2015 | 273,881 | — | 118,295 | 280,001 | 135,990 | (380,000 | ) | 61,271 | 489,437 | 75 | 367,078 | ||||||||||
David Bryson | 2017 | 275,350 | 110,140 | 149,459 | 292,930 | 127,762 | 421,000 | 294,143 | 1,670,784 | 25 | 417,696 | ||||||||||
Sr. Vice President, Liquids Operations | |||||||||||||||||||||
C. Gregory Harper | 2017 | 106,075 | 150,000 | 294,206 | 515,827 | — | 188,000 | 2,719,669 | 3,973,777 | 35 | 1,390,822 | ||||||||||
Former Executive Vice President - Gas Pipelines & Processing | 2016 | 424,300 | 63,000 | 224,635 | 268,645 | 440,583 | 204,000 | 55,409 | 1,680,572 | 35 | 588,200 | ||||||||||
______________________________ | |||||||||||||||||||||
1. | The amounts disclosed in this column for 2017 represent the Merger & Acquisition Strategic Transformation Award and the Integration & Synergy Incentive for Messrs. Harper and Maki respectively. See "2017 Special Awards" section for details. Mr. Neyland received a retention award in 2017. |
2. | The amounts disclosed in this column include the aggregate grant date fair value of performance stock units and restricted stock units granted in 2017, 2016 and 2015, as applicable, in each case, computed in accordance with the provisions of FASB ASC Topic 718. For 2017, the NEOs were only granted performance stock units. |
3. | The amounts disclosed in this column represent the grant date fair value of stock option awards granted to each of the NEOs, calculated in accordance with FASB ASC Topic 718. The grant date fair value of stock option awards is measured using the Black-Scholes option-pricing model. |
4. | The amounts disclosed in this column represent amounts paid under the Enbridge STIP with respect to the 2017, 2016 and 2015 performance years. |
5. | Further details on the amounts disclosed in this column can be found in the section entitled "Pension Plan". |
6. | The table below sets forth the elements comprising the amounts presented in this column for 2017. |
152
2017 All Other Compensation
Amounts represented below for Messrs. Maki, Johnston, Jarvis, and Bryson were originally paid in Canadian dollars have been converted to US dollars using the published WM/Reuters 4pm London year end exchange rate of C$1 = US$0.7981.
Perquisite Allowance(a) | Flexible Benefit Credits(b) | 401(k) Matching Contributions(c) | Relocation Expense | Paid Unused Vacation | Other Benefits(d),(e) | ||||
Executive | Year | $ | $ | $ | $ | $ | $ | Total(f) | |
Mark Maki | 2017 | 15,962 | 4,448 | - | 103,892 | 39,866 | 12,441 | 176,610 | |
Christopher Johnston | 2017 | 15,962 | 8,869 | - | - | 6,572 | 4,433 | 35,837 | |
Stephen Neyland | 2017 | 20,000 | - | 13,500 | - | 10,390 | 1,007 | 44,897 | |
D. Guy Jarvis | 2017 | 27,934 | 18,207 | - | 27,892 | - | 8,462 | 82,495 | |
Bradley Shamla | 2017 | 20,000 | - | 13,500 | 14,765 | - | - | 48,266 | |
David Bryson | 2017 | 15,962 | 11,521 | - | 262,362 | - | 4,298 | 294,143 | |
C. Gregory Harper | 2017 | 9,423 | - | 5,483 | - | 11,636 | 2,693,127 | 2,719,669 | |
______________________________ | |||||||||
a. | Perquisite allowance represents an amount that is paid in cash as additional compensation to cover the business use personal vehicle, recreational clubs, financial planning and income tax preparation. |
b. | For the NEOs domiciled in Canada, flexible benefit credits are provided based on their family status and base salary. These credits can be used to purchase benefits or can be paid in cash. Participants may receive up to 2.5% of base salary in matching contributions towards their flexible benefit credits if they make contributions into their Savings Plan to purchase Enbridge common shares. |
c. | For the NEOs domiciled in the United States who participate in the Enbridge Employee Services, Inc. Savings Plan, referred to as the 401(k) Plan, they may contribute up to 50% of their base salary, which is matched up to 5% by Enbridge. Both individual and matching contributions are subject to limits established by IRS. Enbridge contributions are used to purchase Enbridge common shares at market value and employee contributions may be used to purchase Enbridge common shares or 21 designated funds. |
d. | The amounts disclosed in this column include parking, personal use of company aircraft, executive medical health assessments, and gifts and awards. |
e. | For Mr. Harper, the "Other Benefits" amount includes a severance payment of $2,693,127 that was paid upon his departure on April 1, 2017. The amount payable was in accordance with his executive employment agreement. Details of this severance calculation can be found in the "Former Executive Officers" section. |
f. | Differences between the summation of columns and the totals are due to rounding. |
153
2017 GRANTS OF PLAN-BASED AWARDS | |||||||||||||
Grant | |||||||||||||
All Other | Date | ||||||||||||
Option | Exercise | Fair | |||||||||||
Awards: | or | Value | |||||||||||
Number | Base | of | |||||||||||
Estimated Future Payouts | Estimated Future Payouts | of | Price | Stock | |||||||||
Under Non-Equity Incentive | Under Equity Incentive Plan | Securities | of | and | |||||||||
Plan Awards(2) | Awards(3),(4) | Underlying | Option | Option | |||||||||
Plan | Approval | Grant | Threshold | Target | Maximum | Threshold | Target | Maximum | Options | Awards(5) | Awards(6),(7) | ||
Name | Name (1) | Date | Date | ($) | ($) | ($) | (#) | (#) | (#) | (#) | ($/Sh) | ($) | |
(a) | (b) | (b) | (b) | (c) | (d) | (e) | (f) | (g) | (h) | (j) | (k) | (l) | |
Mark Maki | PSUs | 1-Feb-17 | 1-Jan-17 | — | — | — | — | 3,540 | 7,080 | — | — | 157,936 | |
ISOs | 1-Feb-17 | 28-Feb-17 | — | — | — | — | — | — | 67,800 | 55.84 | 311,687 | ||
STIP | 1-Feb-18 | 23-Feb-18 | — | 117,769 | 235,539 | — | — | — | — | — | — | ||
Christopher Johnston | PSUs | 1-Feb-17 | 1-Jan-17 | — | — | — | — | 1,310 | 2,620 | — | — | 58,445 | |
ISOs | 1-Feb-17 | 28-Feb-17 | — | — | — | — | — | — | 33,760 | 55.84 | 155,200 | ||
STIP | 1-Feb-18 | 23-Feb-18 | — | 75,450 | 150,900 | — | — | — | — | — | — | ||
Stephen Neyland | PSUs | 1-Feb-17 | 1-Jan-17 | — | — | — | — | 2,620 | 5,240 | — | — | 109,647 | |
ISOs | 1-Feb-17 | 28-Feb-17 | — | — | — | — | — | — | 38,080 | 41.64 | 230,765 | ||
STIP | 1-Feb-18 | 23-Feb-18 | — | 96,725 | 193,450 | — | — | — | — | — | — | ||
D. Guy Jarvis | PSUs | 1-Feb-17 | 1-Jan-17 | — | — | — | — | 9,330 | 18,660 | — | — | 416,255 | |
ISOs | 1-Feb-17 | 28-Feb-17 | — | — | — | — | — | — | 155,500 | 55.84 | 714,857 | ||
STIP | 1-Feb-18 | 23-Feb-18 | — | 377,110 | 754,220 | — | — | — | — | — | — | ||
Bradley Shamla | PSUs | 1-Feb-17 | 1-Jan-17 | — | — | — | — | 2,470 | 4,940 | — | — | 103,370 | |
ISOs | 1-Feb-17 | 28-Feb-17 | — | — | — | — | — | — | 37,510 | 41.64 | 227,311 | ||
STIP | 1-Feb-18 | 23-Feb-18 | — | 98,665 | 197,329 | — | — | — | — | — | — | ||
David Bryson | PSUs | 1-Feb-17 | 1-Jan-17 | — | — | — | — | 3,350 | 6,700 | — | — | 149,459 | |
ISOs | 1-Feb-17 | 28-Feb-17 | — | — | — | — | — | — | 63,720 | 55.84 | 292,930 | ||
STIP | 1-Feb-18 | 23-Feb-18 | — | 110,140 | 220,280 | — | — | — | — | — | — | ||
C. Gregory Harper | PSUs | 1-Feb-17 | 1-Jan-17 | — | — | — | — | 7,030 | 14,060 | — | — | 294,206 | |
ISOs | 1-Feb-17 | 28-Feb-17 | — | — | — | — | — | — | 85,120 | 41.64 | 515,827 | ||
STIP | n/a | n/a | n/a | n/a | n/a | n/a | n/a | n/a | n/a | n/a | n/a | ||
______________________________ | |||||||||||||
1. | As used in this table, “PSUs” are the performance stock units granted under the Performance Stock Unit Plan, “RSUs” are the restricted stock units granted under the Restricted Stock Unit Plan, “ISOs” are the incentive stock options granted under the Incentive Stock Option Plan, and STIP refers to the cash award payable under the Short-Term Incentive Plan. |
2. | Represents the cash amounts to be paid for performance during 2017 under the Enbridge Short-Term Incentive Plan. There was no threshold payout under this plan for 2017. |
3. | Awards were made in units of Enbridge common stock and were granted under the terms of the Performance Stock Unit Plan, as amended. |
4. | All performance stock units are earned based on how the Company performs relative to our Peer Group over a three year performance period (January 1, 2017 to December 31, 2019). |
5. | The exercise price of the incentive stock options at the time of grant was $55.84 CAD for Canadian-domiciled NEOs and $41.64 USD for NEOs domiciled in the United States. |
6. | All awards reflected in this column were computed in accordance with FASB ASC Topic 718. The per-share full grant date fair value of the performance stock units and incentive stock options granted were $42.24 and $41.64 respectively. |
7. | The grant date fair value for Canadian option grants was converted from Canadian dollars to US dollars using the published WM/Reuters 4pm London year end exchange rate of C$1 = US$0.7981. |
154
2017 OUTSTANDING EQUITY AWARDS AT FISCAL YEAR END | |||||||||||||||||||
Option Awards | Stock Awards | ||||||||||||||||||
Equity Incentive | Equity Incentive | ||||||||||||||||||
Plan Awards: | Plan Awards: | ||||||||||||||||||
Number of | Number of | Number of | Market or | ||||||||||||||||
Securities | Securities | Unearned | Payout Value | ||||||||||||||||
Underlying | Underlying | Shares, Units or | of Unearned | ||||||||||||||||
Unexercised | Unexercised | Option | Other Rights | Shares, Units or | |||||||||||||||
Options | Options | Exercise | Option | That Have | Other Rights That | ||||||||||||||
(#) | (#) | Price 2 | Expiration | Not Vested 3,4 | Have Not Vested5 | ||||||||||||||
Name | Exercisable | Unexercisable 1 | ($) | Date 1 | (#) | ($) | |||||||||||||
Mark Maki | — | 67,800 | 55.84 | 28-Feb-2027 | 3,713 | 291,392 | |||||||||||||
21,133 | 63,397 | 32.56 | 01-Mar-2026 | 6,474 | 506,379 | ||||||||||||||
30,435 | 30,435 | 47.41 | 02-Mar-2025 | ||||||||||||||||
47,288 | 15,762 | 44.09 | 13-Mar-2024 | ||||||||||||||||
63,600 | — | 43.84 | 27-Feb-2023 | ||||||||||||||||
61,650 | — | 38.65 | 02-Mar-2022 | ||||||||||||||||
76,400 | — | 28.99 | 14-Feb-2021 | ||||||||||||||||
Christopher Johnston | — | 33,760 | 55.84 | 28-Feb-2027 | 1,374 | 107,832 | |||||||||||||
8,373 | 25,117 | 44.06 | 01-Mar-2026 | 2,111 | 165,666 | ||||||||||||||
16,495 | 16,495 | 59.08 | 02-Mar-2025 | ||||||||||||||||
Stephen Neyland | — | 38,080 | 41.64 | 28-Feb-2027 | 2,747 | 214,899 | |||||||||||||
7,338 | 22,012 | 32.56 | 01-Mar-2026 | 2,362 | 184,760 | ||||||||||||||
12,315 | 12,315 | 47.41 | 02-Mar-2025 | ||||||||||||||||
27,225 | 9,075 | 44.09 | 13-Mar-2024 | ||||||||||||||||
41,050 | — | 43.84 | 27-Feb-2023 | ||||||||||||||||
39,100 | — | 38.65 | 02-Mar-2022 | ||||||||||||||||
33,450 | — | 28.99 | 14-Feb-2021 | ||||||||||||||||
7,700 | — | 21.97 | 16-Feb-2020 | ||||||||||||||||
D. Guy Jarvis | — | 155,500 | 55.84 | 28-Feb-2027 | 9,787 | 767,991 | |||||||||||||
25,950 | 77,850 | 44.06 | 01-Mar-2026 | 14,100 | 1,106,443 | ||||||||||||||
34,025 | 34,025 | 59.08 | 02-Mar-2025 | ||||||||||||||||
58,763 | 19,587 | 48.81 | 13-Mar-2024 | ||||||||||||||||
15,087 | — | 44.83 | 27-Feb-2023 | ||||||||||||||||
169,400 | — | 39.34 | 15-Aug-2020 | ||||||||||||||||
Bradley Shamla | — | 37,510 | 41.64 | 28-Feb-2027 | 2,590 | 202,596 | |||||||||||||
11,708 | 35,122 | 32.56 | 01-Mar-2026 | 3,576 | 279,706 | ||||||||||||||
21,605 | 21,605 | 47.41 | 02-Mar-2025 | ||||||||||||||||
26,625 | 8,875 | 44.09 | 13-Mar-2024 | ||||||||||||||||
52,000 | — | 44.83 | 27-Feb-2023 | ||||||||||||||||
50,350 | — | 38.34 | 02-Mar-2022 | ||||||||||||||||
65,400 | — | 28.78 | 14-Feb-2021 | ||||||||||||||||
25,400 | — | 23.30 | 16-Feb-2020 | ||||||||||||||||
25,000 | — | 19.81 | 25-Feb-2019 | ||||||||||||||||
David Bryson | — | 63,720 | 55.84 | 28-Feb-2027 | 3,514 | 275,753 | |||||||||||||
14,650 | 43,950 | 44.06 | 01-Mar-2026 | 3,391 | 266,096 | ||||||||||||||
27,575 | 27,575 | 59.08 | 02-Mar-2025 | ||||||||||||||||
43,688 | 14,562 | 48.81 | 13-Mar-2024 | ||||||||||||||||
58,900 | — | 44.83 | 27-Feb-2023 | ||||||||||||||||
50,500 | — | 38.34 | 02-Mar-2022 | ||||||||||||||||
63,400 | — | 28.78 | 14-Feb-2021 | ||||||||||||||||
22,000 | — | 23.30 | 16-Feb-2020 | ||||||||||||||||
30,500 | — | 19.81 | 25-Feb-2019 | ||||||||||||||||
C. Gregory Harper | 9,745 | — | 32.56 | 01-Mar-2026 | 7,372 | 576,620 | |||||||||||||
9,050 | — | 47.41 | 02-Mar-2025 | 6,955 | 544,015 | ||||||||||||||
25,988 | — | 44.09 | 13-Mar-2024 | 70,074 | 6 | 700,740 | |||||||||||||
34,520 | — | 48.81 | 15-Aug-2020 | ||||||||||||||||
______________________________ | |||||||||||||||||||
1. | Each ISO award has a 10-year term and vests pro-rata as to one-fourth of the option award beginning on the first anniversary of the grant date; thus the vesting dates for each of the option awards in this table can be calculated accordingly. |
2. | Strike prices are reflected in the currency granted. |
3. | The market value of performance stock units that have not vested was calculated using the formula set forth in the "Medium and Long Term Incentives" section, and the closing Enbridge common share price on December 29, 2017 (C$49.16 and US$39.11). Canadian dollars have been converted to US dollars using the published WM/Reuters 4pm London year end exchange rate of C$1 =US$0.7981. |
4. | Relates to performance stock units that will vest on December 1, 2018 and December 1, 2019. |
155
5. | A performance multiplier of 1.0x has been used based on achieving the Target Performance Level as defined in the plan. |
6. | Reflects MEP performance stock units. |
2017 OPTION EXERCISES AND STOCK VESTED | |||||||||||||||||
Option Awards | Stock Awards | ||||||||||||||||
Number of Shares Acquired on Exercise | Value Realized on Exercise (1) | Number of Shares Acquired on Vesting | Value Realized on Vesting (1) | ||||||||||||||
Name | (#) | ($) | (#) | ($) | |||||||||||||
(a) | (b) | (c) | (d) | (e) | |||||||||||||
Mark Maki | — | — | 4,065 | 216,463 | |||||||||||||
Christopher Johnston | — | — | 2,298 | 124,725 | |||||||||||||
Stephen Neyland | 2,750 | 64,969 | 1,913 | 101,900 | |||||||||||||
D. Guy Jarvis | — | — | 9,477 | 514,260 | |||||||||||||
Bradley Shamla | 28,000 | 751,652 | 2,887 | 153,755 | |||||||||||||
David Bryson | 27,200 | 515,089 | 4,031 | 218,730 | |||||||||||||
C. Gregory Harper | — | — | 2,819 | 112,603 | (2) | ||||||||||||
33,408 | 63,359 | (3) | |||||||||||||||
______________________________ | |||||||||||||||||
1. | Canadian dollars have been converted to US dollars using the published WM/Reuters 4pm London year end exchange rate of C$1 =US$0.7981. |
2. | Mr. Harper received a prorated payout as a result of his departure from Enbridge. |
3. | Mr. Harper also received a performance stock unit grant from Midcoast Energy Partners on January 1, 2015 which vested on December 31, 2017. The value realized on vesting is 63,359, which is based on the consolidation price of $8.00 USD per unit. A performance multiplier of 0.25x is applied for the period starting January 1, 2015 and ending June 27, 2017, and Enbridge TSR is used for the period starting June 28, 2017 and December 31, 2017. |
156
PENSION BENEFITS
The table below summarizes the NEOs’ number of years of credited service, present value of accumulated benefits and payments received during the last fiscal year (if any) under each pension plan. Assumptions used in calculating the present value of accumulated benefits are based on the assumptions used for the purposes of reporting the company’s financial statements and which are described in the company’s financial statements on Form 10-K. These assumptions include a discount rate 3.59% and a cash balance interest credit rate of 4.5%. We have converted pensions payable in Canadian dollars to US dollars using the published WM/Reuters 4pm London year end exchange rate of C$1 =US$0.7981.
Number of | Present Value | Payments | ||||||||
Years Credited | of Accumulated | During | ||||||||
Service | Benefit | Last Fiscal Year | ||||||||
Name | Plan Name | (#) | ($) | ($) | ||||||
(a) | (b) | (c) | (d) | (e) | ||||||
Mark Maki | EI RPP | 3.15 | 157,000 | |||||||
EI SPP | 3.15 | 420,000 | ||||||||
US QPP | 28.17 | 2,385,000 | ||||||||
US SPP | 15.27 | 2,254,000 | ||||||||
Christopher Johnston | EI RPP | 3.50 | 112,000 | |||||||
EI SPP | 3.50 | 139,000 | ||||||||
Stephen Neyland | US QPP | 16.00 | 334,000 | |||||||
US SPP | 13.00 | 1,407,000 | ||||||||
D. Guy Jarvis | EI RPP | 15.42 | 608,000 | |||||||
EGD RPP | 2.08 | 82,000 | ||||||||
EI SPP | 17.50 | 3,401,000 | ||||||||
Bradley Shamla | EI RPP | 14.44 | 679,000 | |||||||
EI SPP | 14.44 | 1,276,000 | ||||||||
US QPP | 12.44 | 975,000 | ||||||||
US SPP | 4.64 | 299,000 | ||||||||
David Bryson | EI RPP | 9.55 | 375,000 | |||||||
EGD RPP | 3.83 | 158,000 | ||||||||
EI SPP | 9.55 | 738,000 | ||||||||
US QPP | 3.87 | 56,000 | ||||||||
US SPP | 3.70 | 397,000 | ||||||||
C. Gregory Harper | EI RPP | n/a | 78,000 | |||||||
EI SPP | 3.17 | 523,000 | ||||||||
______________________________ | ||||||||||
POTENTIAL PAYMENTS UPON TERMINATION OR CHANGE-IN-CONTROL
Medium and Long-Term Incentive Awards
Pursuant to the terms of each NEO’s performance stock units, upon a voluntary resignation, all performance stock units are forfeited. Upon the NEO’s retirement or an involuntary termination (not for cause), the performance stock units are prorated to date of retirement or termination, as applicable, and will become earned and will settle at the end of the applicable performance period. Further, upon a change of control, the performance stock units will become earned and will settle as of the date of the change of control based on performance achieved as of the date of the change of control.
Pursuant to the terms of the Enbridge Incentive Stock Option Plan, as amended, upon a voluntary resignation, all unvested incentive stock options held by the NEO will be cancelled and all vested incentive stock options will remain exercisable through the earlier of 30 days following the date of such resignation or the end of the original term of the incentive stock options. Upon an NEO’s retirement, all incentive stock options continue to be subject to the same vesting schedule and will remain exercisable through the earlier of three years following the date of such resignation or the end
157
of the original term of the incentive stock options. If the NEO experiences an involuntary termination (not for cause), vested incentive stock options will remain exercisable through the earlier of 30 days following the date of termination or the end of the original term of the incentive stock options and unvested incentive stock options will be cancelled. Further, upon a change of control, all incentive stock options will become fully vested and remain exercisable.
Performance stock options generally have the same termination provisions as incentive stock options except:
• | Upon the NEO’s retirement, Enbridge prorates performance stock options for the period of active employment in the 5 year period starting January 1 of the year of grant. The executive officer can exercise these options until the later of three years after retirement or 30 days after the share price targets must be met (or up to the date the option expires, whichever is earlier), as long as the performance criteria are met; |
• | Upon death, unvested options are pro-rated and the plan assumes performance requirements have been met; |
• | Upon an involuntary termination (not for cause), unvested options are pro-rated; and |
• | Upon a change of control, the plan assumes the performance requirements have been met. |
Employment Agreements
Other than Mr. Jarvis, as described below, none of the NEOs have an employment agreement with us or any other Enbridge affiliate. Since 2007, it has been Enbridge’s policy not to enter into employment agreements granting “single trigger” voluntary termination rights in favor of the executive.
In 2014, Enbridge entered into an executive employment agreement with Mr. Jarvis. The terms of the agreement continue until the earlier of (i) voluntary retirement in accordance with Enbridge’s retirement policies for its senior employees, (ii) voluntary resignation, (iii) death or (iv) termination of employment by Enbridge. The following table provides a summary of the incremental compensation that Enbridge would pay to Mr. Jarvis under the terms of his employment agreement upon the occurrence of one of the foregoing events:
Type of termination | Base salary | Short-term incentive | Pension | Benefits |
Resignation | None | Payable in full if executive has worked the entire calendar year. Otherwise, none. | No longer earns service credits. | None |
Retirement | Current year’s incentive is prorated based on retirement date. | Post-retirement benefits begin | ||
Termination not for cause or constructive dismissal; Termination following change of control | 2x current base salary is paid out in a lump sum | 2x the average short-term incentive award over the past two years is paid out in a lump sum plus the current year’s short-term incentive, prorated based on active service during the year of termination. | Two years of additional years of pension credit are added to the final pension calculation | 2x the value of future benefits paid out in a lump sum |
The treatment of Mr. Jarvis' outstanding vested stock options would be in accordance with the terms of the Incentive Stock Option Plan, as amended, however Mr. Jarvis' unvested stock options at the time of termination would be paid in cash.
The table below shows the additional amounts that would have been paid if Mr. Jarvis had been terminated on December 31, 2017 under different termination scenarios. Canadian dollars have been converted to US dollars using the published WM/Reuters 4pm London year end exchange rate of C$1 =US$0.7981.
158
Executive | Triggering Event | Base salary1 ($) | Short-term incentive2 ($) | Medium-term incentives3 ($) | Long-term incentives4 ($) | Pension5 ($) | Benefits6 ($) | Total payout ($) | |
D. Guy Jarvis | Change in Control | 0 | 0 | 553,221 | 322,352 | 0 | 0 | 875,573 | |
Voluntary termination or termination with cause | 0 | 0 | 0 | 0 | 3,868 | 3,868 | |||
Involuntary termination without cause | 1,005,627 | 961,698 | 937,217 | 322,352 | 943,000 | 112,111 | 4,282,004 | ||
Involuntary or good reason termination after a CIC | 1,005,627 | 961,698 | 937,217 | 322,352 | 943,000 | 112,111 | 4,282,004 | ||
Death | 0 | 0 | 496,813 | 322,352 | 0 | 3,868 | 823,032 | ||
__________
1. | Total for the severance period (two years). Based on base salary as at December 31, 2017. |
2. | Total for the severance period. Based on two times the average short-term incentive paid in the prior two years. |
3. | In-the-money value of unvested incentive stock options and performance stock options as of December 31, 2017. |
4. | The value of outstanding performance stock units as of December 31, 2017 as though the grants had vested and performance at the Target Performance Level (as defined in the plan) as of the date of the termination resulting in a 1.0x performance multiplier. |
5. | Value of the additional years of pension accrual over the severance period. |
6. | Benefits include the annual flexible perquisite, flex credit allowance and savings plan matching contributions over the severance period plus an allowance for financial and career counseling. |
Former Executive Officers
Mr. Harper received certain payments as a result of his separation of service from Enbridge on April 1, 2017 in accordance with the terms and conditions of his executive employment agreement with Enbridge. Such payments are outlined in the following table.
Benefit Type | Amount ($) | |||
Cash Severance 1 | 848,600 | |||
Short Term Incentive 1 | 908,814 | |||
Health and Welfare Benefits Continuation 1 | 465,629 | |||
Outplacement Assistance 1 | 20,000 | |||
Unvested Stock Awards Payout 2 | 450,085 | |||
Total | 2,693,127 | |||
__________
1. | Amounts are also included in the Summary Compensation Table under All Other Compensation. |
2. | Amounts represent unvested, in-the-money stock options paid in cash. |
After his departure, Mr. Harper is subject to certain restrictive covenants, including a prohibition on (1) engaging in any practice or business in competition with Enbridge or its affiliates for one year, (2) disclosing the confidential information of Enbridge or its affiliates indefinitely and (3) recruiting for two years.
Mr. Neyland did not receive any payment in connection with his cessation of service as the principal financial officer on July 28, 2017.
159
DIRECTOR COMPENSATION
As an MLP, we are managed by Enbridge Management, a delegate of our General Partner. The boards of directors of Enbridge Management and our General Partner are comprised of the same persons. We are allocated 100% of the director compensation of these board members. Enbridge employees who are members of the boards of directors of our General Partner or Enbridge Management do not receive any additional compensation for serving in those capacities.
Under the Director Compensation Plan, non-employee directors receive an annual retainer of $165,000, with no additional fees for attending regular meetings. The annual retainer paid to the Chairman of the Board is $20,000 and the annual retainer paid to the Chairman of the Audit Committee is $15,000. The out-of-state travel fee is $1,500 per meeting. In addition, the Director Compensation Plan has set the retainer paid to a Director serving as Chairman of any Special Committee that may be constituted from time to time to $10,000 for each committee. Each member of a Special Committee receives $1,500 per meeting.
The Corporate Governance Guidelines provide an expectation that independent directors will hold a personal investment in us or Enbridge Management or both, of at least two times the annual board retainer, which, based on the current annual retainer would equal $330,000. Directors would be expected to achieve the foregoing level of equity ownership five years from the date he or she became a director. All of our independent directors are in compliance with this requirement.
Name (a) | Fees Earned or Paid in Cash ($) (b) | |
Jeffrey A. Connelly Chairman of the Board | 232,500 | |
J. Herbert England Audit, Finance and Risk Committee Chairman | 184,500 | |
J. Richard Bird | 174,000 | |
William S. Waldheim | 210,000 | |
Dan A. Westbrook | 186,000 | |
C. Gregory Harper, D. Guy Jarvis, Mark A. Maki and John K. Whelen(1) | 0 | |
(1) Messrs. Harper, Jarvis, Maki and Whelen were also employees of Enbridge or its subsidiaries and thus do not receive any compensation as a director in addition to their standard compensation as an employee of Enbridge or its subsidiaries. | ||
Each director is indemnified for actions associated with being a director to the fullest extent permitted under Delaware law, and we maintain errors and omissions insurance.
PAY RATIO DISCLOSURE
As discussed above, as an MLP, we do not employ directly any of the persons responsible for managing our business. All personnel necessary for our business are employed and compensated by our General Partner, Enbridge Management or Enbridge, through its affiliates, subject to the terms of an operational services agreement. Since we do not have direct employees, we do not have compensation policies pursuant to which we approve or establish elements of compensation, nor do we have any authority for compensation-related decisions.
Because we do not have any employees, we are not required by SEC rules to provide disclosure regarding the ratio of the annual total compensation of our Principal Executive Officer to the median annual total compensation of employees of our General Partner, Enbridge Management or Enbridge, through its affiliates, who provide services to us.
COMPENSATION REPORT OF THE BOARD OF DIRECTORS
The Board of Directors of Enbridge Energy Management, L.L.C., as delegate of the General Partner of Enbridge Energy Partners, L.P., has reviewed and discussed the Compensation Discussion and Analysis section of this report
160
with management and, based on that review and discussion, has recommended that the Compensation Discussion and Analysis be included in this report.
J. Richard Bird, Director
Laura Buss Sayavedra, Vice President and Director
Jeffrey A. Connelly, Director
J. Herbert England, Director
D. Guy Jarvis, Executive Vice President - Liquids Pipelines and Director
Mark A. Maki, President and Director
Stephen J. Neyland, Vice President and Director
William S. Waldheim, Director
Dan A. Westbrook, Director
John K. Whelen, Director
ITEM 12. SECURITY OWNERSHIP OF CERTAIN BENEFICIAL OWNERS AND MANAGEMENT AND RELATED STOCKHOLDER MATTERS
SECURITY OWNERSHIP OF CERTAIN BENEFICIAL OWNERS
The following table sets forth information as of February 13, 2018 with respect to persons known to us to be the beneficial owners of more than 5% of any class of the Partnership’s units:
161
Name and Address of Beneficial Owner | Title of Class | Amount and Nature of Beneficial Ownership | Percent of Class | ||||
Enbridge Energy Management, L.L.C. | i-units | 89,798,818 | 100.0 | ||||
5400 Westheimer Court | |||||||
Houston, TX 77056 | |||||||
Enbridge Energy Company, Inc. | Class A common units | 110,827,018 | 24.6 | ||||
5400 Westheimer Court | Class B common units | 7,825,500 | 100.0 | ||||
Houston, TX 77056 | Class E units | 18,114,975 | 100.0 | ||||
Class F units | 1,000 | 100.0 | |||||
ALPS Advisors, Inc.(1) | Class A common units | 14,571,433 | 5.4 | ||||
1290 Broadway, Suite 1100 | |||||||
Denver, CO 80203 | |||||||
Alerian MLP ETF(1) | Class A common units | 14,511,243 | 5.4 | ||||
1290 Broadway, Suite 1100 | |||||||
Denver, CO 80203 | |||||||
____________
(1) | ALPS Advisors, Inc. reported in Amendment 2 to its Schedule 13G, filed February 6, 2018, that it is an investment adviser registered under Section 203 of the Investment Advisors Act of 1940 and, in that role, which furnishes investment advice to investment companies registered under the Investment Company Act of 1940 collectively referred to as the Funds. It also reported that in that role as investment adviser, it has voting or investment power or both over the Class A common units of the Partnership that are owned by the Funds, and may be deemed to be the beneficial owner of the Class A common units of the Partnership held by the Funds; however, all of the Class A common units in that amendment are owned by the Funds. ALPS Advisors, Inc. further disclaims beneficial ownership of such Class A common units. Alerian MLP ETF, which jointly filed that amendment is an investment company registered under the Investment Company Act of 1940 and is one of the Funds to which ALPS Advisors, Inc. provides investment advice. |
We do not have any shares that have been approved for issuance under an equity compensation plan.
SECURITY OWNERSHIP OF MANAGEMENT AND DIRECTORS
The following table sets forth information as of February 13, 2018 with respect to each class of our units and the listed shares of Enbridge Management beneficially owned by the NEOs and directors of the General Partner and Enbridge Management and all executive officers and directors of the General Partner and Enbridge Management as a group:
162
Name | Enbridge Energy Management, L.L.C. | Enbridge Energy Partners, L.P. | ||||||||||||
Title of Class | Number of Shares(1) | Percent of Class | Title of Class | Amount and Nature of Beneficial Ownership(1) | Percent of Class | |||||||||
Jeffrey A. Connelly(2) | Listed Shares | — | * | Class A common units | 20,000 | * | ||||||||
J. Richard Bird(3) | Listed Shares | 123,660 | * | Class A common units | — | * | ||||||||
David Bryson | Listed Shares | — | * | Class A common units | — | * | ||||||||
J. Herbert England | Listed Shares | — | * | Class A common units | 8,626 | * | ||||||||
Christopher J. Johnston | Listed Shares | 1,483 | * | Class A common units | — | * | ||||||||
D. Guy Jarvis | Listed Shares | — | * | Class A common units | — | * | ||||||||
Mark A. Maki | Listed Shares | 7,642 | * | Class A common units | 4,000 | * | ||||||||
Stephen J. Neyland(4)(5) | Listed Shares | 11,278 | * | Class A common units | 1,200 | * | ||||||||
Laura Buss Sayavedra | Listed Shares | — | * | Class A common units | — | * | ||||||||
Bradley F. Shamla | Listed Shares | — | * | Class A common units | — | * | ||||||||
William S. Waldheim(6) | Listed Shares | — | * | Class A common units | 6,000 | * | ||||||||
Dan A. Westbrook(7) | Listed Shares | — | * | Class A common units | 23,000 | * | ||||||||
John K. Whelen | Listed Shares | — | * | Class A common units | — | * | ||||||||
All executive officers, directors and nominees as a group (18 persons) | Listed Shares | 144,063 | * | Class A common units | 62,826 | * | ||||||||
____________
(1) | Unless otherwise indicated, each beneficial owner has sole voting and investment power with respect to all of the Class A common units or Listed Shares attributed to him or her. |
(2) | The 20,000 Class A common units deemed beneficially owned by Mr. Connelly, 20,000 Class A common units are held in the Susan K. Connelly Family Trust, of which Mr. Connelly is the trustee and a beneficiary. |
(3) | The Listed Shares owned by Mr. Bird are held by an investment holding corporation over which he exercises full control and direction. |
(4) | The Listed shares beneficially owned by Mr. Neyland are held in a Family Trust for which Mr. Neyland is a co-trustee as well as a beneficiary. |
(5) | The 1,200 Class A common units beneficially owned by Mr. Neyland are held by a Family Trust for which Mr. Neyland is a co-trustee as well as a beneficiary. |
(6) | The 6,000 Class A common units beneficially held by Mr. Waldheim are held in the Waldheim Family Trust. |
(7) | Of the 23,000 Class A common units deemed beneficially owned by Mr. Westbrook, 16,000 Class A common units are held by The Westbrook Trust, for which Mr. Westbrook is the trustee and beneficiary, and 7,000 Class A common units are held by the Mary Ruth Westbrook Trust, for which Mr. Westbrook is the sole trustee and beneficiary. |
ITEM 13. CERTAIN RELATIONSHIPS AND RELATED TRANSACTIONS, AND DIRECTOR INDEPENDENCE
CERTAIN RELATIONSHIPS AND RELATED TRANSACTIONS
We believe that the terms and provisions of our related party agreements are fair to us; however, such agreements and transactions may not be as favorable to us as we could have obtained from unaffiliated third parties. For further discussion of these and other related party transactions, refer to Part II. Item 8. Financial Statements and Supplementary Data — Note 20 - Related Party Transactions.
INTEREST OF THE GENERAL PARTNER IN THE PARTNERSHIP
163
At December 31, 2017, our General Partner had the following ownership interests, directly or indirectly in us:
Quantity | Effective Ownership % | ||||
Class E units | 18,114,975 | 4.0 | % | ||
Class A common units | 110,827,018 | 24.6 | % | ||
Class B common units | 7,825,500 | 1.7 | % | ||
Class F units | 1,000 | — | % | ||
General Partner interest | — | 2.0 | % | ||
i-units | 10,494,470 | 2.3 | % | ||
Total | 147,262,963 | 34.6 | % | ||
INTEREST OF ENBRIDGE MANAGEMENT IN THE PARTNERSHIP
At December 31, 2017, Enbridge Management owned 89,798,818 i-units, representing a 19.9% limited partner interest in us. The i-units are a special class of our limited partner interests. All of our i-units are owned by Enbridge Management and are not publicly traded. Enbridge Management’s limited liability company agreement provides that the number of all of its outstanding shares, including the voting shares owned by the General Partner, at all times will equal the number of i-units that it owns. Through the combined effect of the provisions in the partnership agreement and the provisions of Enbridge Management’s limited liability company agreement, the number of outstanding Enbridge Management shares and the number of our i-units will at all times be equal.
CASH DISTRIBUTIONS
As discussed in Part II. Item 7. Management’s Discussion and Analysis of Financial Condition and Results of Operations, we make quarterly cash distributions of our available cash to our General Partner and limited partners. The holders of our i-units received in-kind distributions under the partnership agreement. Our General Partner, through its ownership in Class F units receives incremental incentive cash distributions on the portion of cash distributions that exceed certain target thresholds above the minimum quarterly distribution target of $0.295 on a per unit basis as follows:
Unitholders | General Partner and Class F units | ||||
Quarterly Cash Distributions per Unit: | |||||
Up to $0.295 per unit | 98 | % | 2 | % | |
Target great than $0.295 per unit to $0.35 per unit | 85 | % | 15 | % | |
Target greater than $0.35 per unit | 75 | % | 25 | % | |
During 2017, we paid cash and incentive distributions to our General Partner for its general partner ownership interest of approximately $12 million and cash distributions of $39 million, $29 million, $143 million, $13 million, and $11 million in connection with its ownership of the Class D units, Class E units, Class A common units, Class B common units, and Class F units respectively. The cash distributions we make to our General Partner for its general partner ownership interest exclude an amount equal to 2% of the i-unit distributions to maintain its 2% general partner interest.
IN-KIND DISTRIBUTIONS
Enbridge Management, as owner of our i-units, does not receive distributions in cash. Instead, each time that we make a cash distribution to the General Partner and the holders of our Class A and Class B common units, we issue additional i-units to Enbridge Management in an amount determined by dividing the cash amount distributed per limited partner unit by the average price of one of Enbridge Management’s listed shares on the NYSE for the 10-trading day period immediately preceding the ex-dividend date for Enbridge Management’s shares multiplied by the number of shares outstanding on the record date. In 2017, 2016 and 2015, we distributed a total of 7,941,650, 8,571,429 and 4,980,552 i-units to Enbridge Management, on a split-adjusted basis, and retained cash totaling approximately $138 million, $179 million and $161 million in connection with these in-kind distributions.
GENERAL PARTNER CONTRIBUTIONS
164
Pursuant to our partnership agreement, our General Partner is at all times required to maintain its 2% general partner ownership interest in us. In 2017 in connection with our issuance of Class A common units, our General Partner contributed approximately $24 million to us to maintain its 2% general partner ownership interest. In 2016 the General Partner was not required to contribute to maintain its 2% general partner interest. In 2015, in connection with our various issuances and sales of Class A common units, our General Partner contributed approximately $6 million to us to maintain its 2% general partner ownership interest.
OTHER RELATED PARTY TRANSACTIONS
We do not directly employ any of the individuals responsible for managing or operating our business, nor do we have any directors. We obtain managerial, administrative and operational services from our General Partner, Enbridge Management and affiliates of Enbridge pursuant to service agreements among us, Enbridge Management and affiliates of Enbridge. Pursuant to these service agreements, we have agreed to reimburse our General Partner and affiliates of Enbridge for the cost of managerial, administrative, operational and director services they provide to us.
REVIEW, APPROVAL OR RATIFICATION OF TRANSACTIONS WITH RELATED PERSONS
If we contemplate entering into a transaction, other than a routine or in the ordinary course of business transaction, in which a related person will have a direct or indirect material interest, the proposed transaction is submitted for consideration to the board of directors of our General Partner or Enbridge Management, as appropriate. The board of directors then determines whether it is advisable to constitute a special committee of independent directors to evaluate the proposed transaction. If a special committee is appointed, the committee obtains information regarding the proposed transaction from management and determines whether it is advisable to engage independent legal counsel or an independent financial advisor to advise the members of the committee regarding the transaction. If the special committee retains such counsel or financial advisor, the committee considers the advice and, in the case of a financial advisor, such advisor’s opinion as to whether the transaction is fair to us and all of our unitholders.
Potential transactions with related persons that are not financially significant so as to require review by the board of directors are disclosed to the President of Enbridge Management and our General Partner and reviewed for compliance with the Enbridge Statement on Business Conduct. The President may also consult with legal counsel in making such determination. If a related person transaction occurred and was later found not to comply with the Statement on Business Conduct, the transaction would be reported to the board of directors for further review and ratification or remedial action.
The Enbridge Statement of Business Conduct sets forth policies and procedures for the review and approval of certain transactions with persons affiliated with us.
During 2017, we had the following “related person” transactions (as the term is defined in Item 404 of Regulation S-K):
• | An affiliate of Enbridge that provides employee services to the Partnership continued a previously existing employment relationship with Jordan Connelly, the son of Jeffrey A. Connelly, a member of the Board of Directors. Mr. Connelly is employed in our Houston office as a Gas Supply Representative. During 2017, he received total cash compensation of $99,987 and benefits estimated at approximately 34.4% of his base compensation for a total of $134,383. |
DIRECTOR INDEPENDENCE
For a discussion of director independence, see Item 10. Directors, Executive Officers and Corporate Governance — Governance Matters.
ITEM 14. PRINCIPAL ACCOUNTANT FEES AND SERVICES
The following table sets forth the aggregate fees billed for professional services rendered by PricewaterhouseCoopers LLP, our principal independent auditors, for each of our last two fiscal years.
165
For the year ended December 31, | |||||||
2017 | 2016 | ||||||
Audit fees(1) | $ | 1,829,000 | $ | 2,224,000 | |||
Tax fees(2) | 800,000 | 800,000 | |||||
Total | $ | 2,629,000 | $ | 3,024,000 | |||
____________
(1) | Audit fees consist of fees billed for professional services rendered for the audit of our consolidated financial statements, reviews of our interim consolidated financial statements, audits of various subsidiaries for statutory and regulatory filing requirements and our debt and equity offerings. |
(2) | Tax fees consist of fees billed for professional services rendered for federal and state tax compliance for Partnership tax filings and unitholder K-1’s. |
Engagements for services provided by PricewaterhouseCoopers LLP are subject to pre-approval by the Audit Committee of Enbridge Management’s board of directors; however, services up to $50,000 may be approved by the Chairman of the Audit Committee, under the board of directors’ delegated authority. All services in 2017 and 2016 were approved by the Audit Committee.
166
PART IV
ITEM 15. EXHIBITS AND FINANCIAL STATEMENT SCHEDULES
The following documents are filed as a part of this report:
(1) | FINANCIAL STATEMENTS |
The following financial statements and supplementary data are incorporated by reference in Part II, Item 8. Financial Statements and Supplementary Data of this Annual Report on Form 10-K.
a. | Report of PricewaterhouseCoopers LLP, Independent Registered Public Accounting Firm. |
b. |
c. | Consolidated Statements of Income for the years ended December 31, 2017, 2016 and 2015. |
d. | Consolidated Statements of Comprehensive Income for the years ended December 31, 2017, 2016 and 2015. |
e. | Consolidated Statements of Cash Flows for the years ended December 31, 2017, 2016 and 2015. |
f. | Consolidated Statements of Financial Position as of December 31, 2017 and 2016. |
g. | Consolidated Statements of Partners’ Capital for the years ended December 31, 2017, 2016 and 2015. |
h. | Notes to the Consolidated Financial Statements. |
(2) | FINANCIAL STATEMENT SCHEDULES |
All schedules have been omitted because they are not applicable, the required information is shown in the consolidated financial statements or Notes thereto or the required information is immaterial.
(3) | EXHIBITS. |
Reference is made to the “Index of Exhibits” following Item 16 Form 10-K Summary, which is hereby incorporated into this Item.
167
ITEM 16. FORM 10-K SUMMARY
None.
INDEX OF EXHIBITS
Each exhibit identified below is included as a part of this Annual Report. Exhibits included in this filing are designated by an asterisk (“*”); all exhibits not so designated are incorporated by reference to a prior filing as indicated. Exhibits designated with a “+” constitute a management contract or compensatory plan arrangement required to be filed as an exhibit to this report pursuant to Item 15(b) of Form 10-K.
Exhibit Number | Description | |
2.1 | ||
3.1 | ||
3.2 | ||
3.3 | ||
3.4 | ||
3.5 | ||
4.1 | ||
4.2 | ||
4.3 | ||
4.4 | ||
4.5 | ||
4.6 | ||
4.7 | ||
4.8 | ||
4.9 | ||
168
Exhibit Number | Description | |
4.10 | ||
4.11 | ||
4.12 | ||
4.13 | ||
4.14 | ||
4.15 | ||
4.16 | ||
10.1 | ||
10.2 | ||
10.3 | ||
10.4 | ||
10.5 | ||
10.6 | ||
10.7 | ||
10.8 | ||
10.9 | ||
10.1 | ||
10.11 | ||
169
Exhibit Number | Description | |
10.12 | ||
10.13 | ||
10.14 | ||
10.15 | ||
10.16 | ||
10.17 | ||
10.18 | ||
10.19 | ||
10.20 | ||
10.21 | ||
10.22 | ||
10.23 | ||
10.24 | ||
10.25 | ||
10.26 | ||
10.27 | ||
+10.28 | ||
+10.29 | ||
+10.30 | ||
170
Exhibit Number | Description | |
+10.31 | ||
+10.32 | ||
+10.33 | ||
+10.34 | ||
10.35 | ||
10.36 | ||
10.37 | ||
10.38 | ||
10.39 | ||
10.40 | ||
10.41 | ||
10.42 | ||
10.43 | ||
10.44 | ||
10.45 | ||
10.46 | ||
10.47 | ||
171
Exhibit Number | Description | |
10.48 | ||
10.49 | ||
10.50 | ||
10.51 | ||
10.52 | ||
10.53 | ||
10.54 | ||
10.55 | ||
10.56 | ||
10.57 | ||
10.58 | ||
10.59 | ||
10.60 | ||
10.61 | ||
10.62 | ||
*21.1 | ||
*31.1 | ||
*31.2 | ||
*32.1 | ||
*32.2 | ||
*101.INS | XBRL Instance Document. | |
*101.SCH | XBRL Taxonomy Extension Schema Document. | |
*101.CAL | XBRL Taxonomy Extension Calculation Linkbase Document. | |
*101.DEF | XBRL Taxonomy Extension Definition Linkbase Document. | |
*101.LAB | XBRL Taxonomy Extension Label Linkbase Document. | |
*101.PRE | XBRL Taxonomy Extension Presentation Linkbase Document. | |
172
____________
Copies of Exhibits may be obtained upon written request of any Unitholder to Investor Relations, Enbridge Energy Partners, L.P., 5400 Westheimer Court, Houston, Texas 77056.
SIGNATURES
Pursuant to the requirements of Section 13 or 15(d) of the Securities Exchange Act of 1934, the Registrant has duly caused this report to be signed on its behalf by the undersigned, thereunto duly authorized.
Enbridge Energy Partners, L.P. (Registrant) | ||
By: | Enbridge Energy Management, L.L.C., as delegate of the General Partner | |
Date: February 15, 2018 | By: | /s/ Mark A. Maki |
Mark A. Maki President (Principal Executive Officer) | ||
Pursuant to the requirements of the Securities Exchange Act of 1934, this report has been signed below on February 15, 2018 by the following persons on behalf of the Registrant and in the capacities indicated.
/s/ Mark A. Maki | /s/ Christopher J. Johnston | |
Mark A. Maki President and Director (Principal Executive Officer) | Christopher J. Johnston Vice President, Finance (Principal Financial Officer) | |
/s/ Allen C. Capps | /s/ Jeffrey A. Connelly | |
Allen C. Capps Controller (Principal Accounting Officer) | Jeffrey A. Connelly Director | |
/s/ J. Herbert England | /s/ J. Richard Bird | |
J. Herbert England Director | J. Richard Bird Director | |
/s/ Stephen J. Neyland | /s/ Laura Buss Sayavedra | |
Stephen J. Neyland Vice President and Director | Laura Buss Sayavedra Vice President and Director | |
/s/ John K. Whelen | /s/ Dan A. Westbrook | |
John K. Whelen Director | Dan A. Westbrook Director | |
/s/ William S. Waldheim | /s/ D. Guy Jarvis | |
William S. Waldheim Director | D. Guy Jarvis Executive Vice President — Liquids Pipelines and Director | |
173