Attached files
| file | filename |
|---|---|
| EX-99.1 - EX-99.1 - MFA FINANCIAL, INC. | a18-6176_1ex99d1.htm |
| 8-K - 8-K - MFA FINANCIAL, INC. | a18-6176_18k.htm |

Forward Looking Statements When used in this presentation or other written or oral communications, statements which are not historical in nature, including those containing words such as “will,” “believe,” “expect,” “anticipate,” “estimate,” “plan,” “continue,” “intend,” “should,” “could,” “would,” “may” or similar expressions, are intended to identify “forward-looking statements” within the meaning of Section 27A of the Securities Act of 1933, as amended, and Section 21E of the Securities Exchange Act of 1934, as amended, and, as such, may involve known and unknown risks, uncertainties and assumptions. Statements regarding the following subjects, among others, may be forward-looking: changes in interest rates and the market (i.e., fair) value of MFA’s MBS, residential whole loans, CRT securities and other assets; changes in the prepayment rates on the mortgage loans securing MFA’s MBS, an increase of which could result in a reduction of the yield on MBS in our portfolio and could require us to reinvest the proceeds received by us as a result of such prepayments in MBS with lower coupons; credit risks underlying MFA’s assets, including changes in the default rates and management’s assumptions regarding default rates on the mortgage loans securing MFA’s Non-Agency MBS and relating to MFA’s residential whole loan portfolio; MFA’s ability to borrow to finance its assets and the terms, including the cost, maturity and other terms, of any such borrowings; implementation of or changes in government regulations or programs affecting MFA’s business; MFA’s estimates regarding taxable income, the actual amount of which is dependent on a number of factors, including, but not limited to, changes in the amount of interest income and financing costs, the method elected by MFA to accrete the market discount on Non-Agency MBS and residential whole loans and the extent of prepayments, realized losses and changes in the composition of MFA’s Agency MBS, Non-Agency MBS and residential whole loan portfolios that may occur during the applicable tax period, including gain or loss on any MBS disposals and whole loan modification, foreclosure and liquidation; the timing and amount of distributions to stockholders, which are declared and paid at the discretion of MFA’s Board of Directors and will depend on, among other things, MFA’s taxable income, its financial results and overall financial condition and liquidity, maintenance of its REIT qualification and such other factors as MFA’s Board of Directors deems relevant; MFA’s ability to maintain its qualification as a REIT for federal income tax purposes; MFA’s ability to maintain its exemption from registration under the Investment Company Act of 1940, as amended (or the Investment Company Act), including statements regarding the Concept Release issued by the Securities and Exchange Commission (SEC) relating to interpretive issues under the Investment Company Act with respect to the status under the Investment Company Act of certain companies that are engaged in the business of acquiring mortgages and mortgage-related interests; MFA’s ability to successfully implement its strategy to grow its residential whole loan portfolio which is dependent on, among other things, the supply of loans offered for sale in the market; expected returns on our investments in non-performing residential whole loans (NPLs), which are affected by, among other things, the length of time required to foreclose upon, sell, liquidate or otherwise reach a resolution of the property underlying the NPL, home price values, amounts advanced to carry the asset (e.g., taxes, insurance, maintenance expenses, etc. on the underlying property) and the amount ultimately realized upon resolution of the asset; risks associated with our investments in MSR related assets, including servicing, regulatory and economic risks, and risks associated with investing in real estate assets, including changes in business conditions and the general economy. These and other risks, uncertainties and factors, including those described in the annual, quarterly and current reports that MFA files with the SEC, could cause MFA’s actual results to differ materially from those projected in any forward-looking statements it makes. All forward-looking statements speak only as of the date on which they are made and are based on beliefs, assumptions and expectations of MFA’s future performance, taking into account information currently available. New risks and uncertainties arise over time and it is not possible to predict those events or how they may affect MFA. You are cautioned not to place undue reliance on these forward-looking statements, which speak only as of the date on which they are made. Except as required by law, MFA is not obligated to, and does not intend to, update or revise any forward-looking statements, whether as a result of new information, future events or otherwise. 2

Executive summary In the fourth quarter we generated EPS of $0.24, an increase from prior earnings due primarily to: • •Gains on Fair Value whole loans (including approx $15 million of cash received) •Recovery of prices of CRT securities after hurricane-related declines in Q3 • Book value per share was unchanged from the prior quarter-end at $7.70 and is up from $7.62 at December 31, 2016, as our investment strategy continues to produce stable book value. • Undistributed taxable income of $0.15 per common share at December 31, 2017. • We were active in the market in the fourth quarter, investing over $700 million. Portfolio run-off slowed in the fourth quarter to approximately $700 million (down from $1.0 billion in Q3). • Our equity invested increased by over $160 million versus September 30, 2017, as new investments utilize less leverage than the assets that paid off during the fourth quarter. 3

Executive summary Through volatile markets and both interest rate generated strong long term returns to investors and credit cycles, MFA has (1) As of 12/31/17 assuming reinvestment of dividends. 4 Time PeriodAnnualized MFA Shareholder Return (1) Since January 1, 200015.0% 10 Year11.7% 5 Year12.5% 1 Year14.3%
Investment strategy Position for higher levels of market uncertainty • Primary focus on shorter term assets with inherently less interest rate sensitivity. • Produce attractive returns that are comparable to peers, but with less risk due to lower leverage, less interest rate exposure and reduced prepayment sensitivity. • Given the current investment landscape, we will continue to expand our investment opportunity set within the residential mortgage space, utilizing the same disciplined approach to risk/reward as we have done in the past. • Maintain staying power and preserve the ability to invest opportunistically: •Permanent equity capital and available liquidity •Debt to equity ratio is low enough to accommodate potential declines in asset prices 5

Market conditions and investment activity • Despite a challenging investment environment, MFA purchased more than $700 million in assets in the fourth quarter. • Investment activity slightly exceeded portfolio run-off in the fourth quarter. RPL/NPL MBS run-off, which had been elevated in prior quarters, returned to more normal levels. • Higher prices for nearly all asset classes have altered risk/reward levels. We have maintained our pricing discipline despite our desire to replace run-off. • Unlike Agency MBS, our other asset classes are not always available for purchase. • CRT securities spreads tightened as concerns related to hurricanes subsided, with pricing reflecting close to historic tights at year-end. 6

Higher EPS primarily due to MTM gains on fair value loans and CRTs • In Q4 2017, lower sequential net interest income, due primarily to continued run-off in interest earning assets, was more than offset by higher net other income, which was driven by: •Strong performance from fair value loans, which exhibited mark to market gains and increased cash receipts. •Increases in unrealized gains in CRT securities held at fair value, with prices rebounding this quarter as hurricane related concerns subsided. In addition, operating and other expenses returned to more normal levels this quarter. The prior quarter included the impact of non-recurring expenses related to our contractual obligations to the estate of our former CEO. As previously noted, the increased contribution of other income items may lead to fluctuations in net income going forward. 7 $m $m • • Summary Income StatementQ4 2017 Q3 2017 Net Interest Income52.455.9 Other Income (net) MBS sale gains9.014.9 Income from fair value loans41.418.7 CRT securities held at fair value13.5(5.2) Other loan and REO related income1.00.7 Total Other Income (net)65.029.1 Operating and Other Expenses(16.8)(21.2) Preferred Dividends(3.8)(3.8) Net Income Available to Common Shareholders96.860.1 Earnings Per Common Share$0.24$0.15

Fourth quarter investment flows Our assets run-off due to amortization, paydowns or sale, allowing reinvestment opportunities in changing interest rate and credit environments. $ in Millions 2017 Runoff Acquisitions changes December 31, 2017 Change $1,881 $(87) $554 $38 $2,386 $505 REO (1) RPL/NPL are securitized financial instruments that are backed by re-performing and non-performing loans. The majority of these securities are structured such that the coupon increases up to 300 basis points (bps) at 36 months from issuance or sooner. (2) MSR Related Assets include investments in Term Notes and a Corporate Loan whose cash flows are considered to be largely dependent on underlying MSRs that either directly or indirectly act as collateral for the investment. 8 September 30,4th Quarter4th QuarterMTM and other4th Quarter Residential Whole Loans and RPL/NPL MBS (1) $1,195$(282)$12$(2)$923$(272) MSR Related Assets (2) $412$—$80$—$492$80 Credit Risk Transfer Securities$654$(5)$—$15$664$10 Legacy Non-Agency MBS$2,717$(149)$53$(10)$2,611$(106) Agency MBS$3,019$(181)$9$(22)$2,825$(194) Totals$9,878$(704)$708$19$9,901$23

MFA’s yields and spreads remain attractive • Despite five Fed Funds rate increases in two years: • • MFA’s interest rate spread is relatively unchanged and remains attractive. Yields on many of our credit sensitive assets have risen as credit fundamentals have continued to improve. We have successfully identified higher yielding assets in a rising rate environment. Funding costs have risen more slowly than Fed Funds. • • Yield on interest earning assets, net interest rate spread and Fed Funds 5% 4% 3% 2% 1% 0% Q3 '15 Q4 '15 Q1 '16 Q2 '16 Q3 '16 Q4 '16 Q1 '17 Q2 '17 Q3 '17 Q4 '17 9 Yield (%)
Fourth quarter 2017 yields and spreads by asset type (1) Net of 45 bps of servicing costs. (2) These residential whole loans are held at fair value and produce GAAP income/loss based on changes in fair value in the current period, and therefore results will vary on a quarter-to-quarter basis. MFA expects to realize returns over time on these whole loan investments of 5-7%. 10 Yield/Cost ofDebt/Net AssetReturnFundsNet SpreadEquity Ratio Agency MBS2.08%(1.79)%0.29%7.7x Legacy Non-Agency MBS9.12%(3.29)%5.83%2.0x RPL/NPL MBS4.27%(2.72)%1.55%1.6x Credit Risk Transfer Securities5.77%(2.55)%3.22%2.2x MSR Related Assets6.35%(3.11)%3.24%1.8x RPL Whole Loans5.43%(1) (3.31)%2.12%1.2x NPL Whole Loans(2) (3.58)%(2) 2.1x

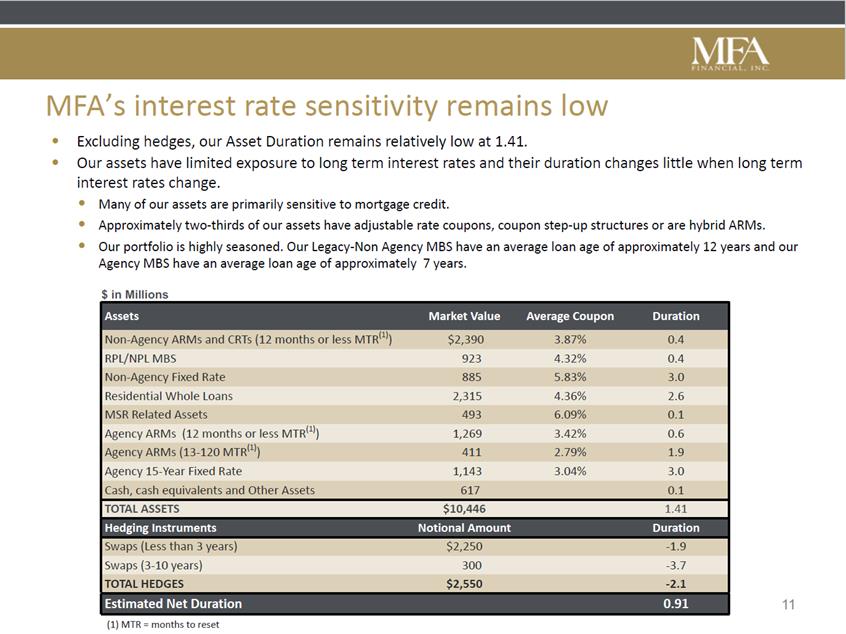
MFA’s interest rate sensitivity remains low • • Excluding hedges, our Asset Duration remains relatively low at 1.41. Our assets have limited exposure to long term interest rates and their duration changes little when long term interest rates change. • • • Many of our assets are primarily sensitive to mortgage credit. Approximately two-thirds of our assets have adjustable rate coupons, coupon step-up structures or are hybrid ARMs. Our portfolio is highly seasoned. Our Legacy-Non Agency MBS have an average loan age of approximately 12 years and our Agency MBS have an average loan age of approximately 7 years. $ in Millions 11 (1) MTR = months to reset AssetsMarket ValueAverage CouponDuration Non-Agency ARMs and CRTs (12 months or less MTR(1)) $2,3903.87%0.4 RPL/NPL MBS9234.32%0.4 Non-Agency Fixed Rate8855.83%3.0 Residential Whole Loans2,3154.36%2.6 MSR Related Assets4936.09%0.1 Agency ARMs (12 months or less MTR(1)) 1,2693.42%0.6 Agency ARMs (13-120 MTR(1)) 4112.79%1.9 Agency 15-Year Fixed Rate1,1433.04%3.0 Cash, cash equivalents and Other Assets6170.1 TOTAL ASSETS$10,4461.41 Hedging InstrumentsNotional AmountDuration Swaps (Less than 3 years)$2,250-1.9 Swaps (3-10 years)300-3.7 TOTAL HEDGES$2,550-2.1 Estimated Net Duration0.91
MFA’s strategy has delivered book value stability and low sensitivity to prepayment rates MFA's Agency MBS Premium Amortization and Legacy Non-Agency MBS Discount Accretion by quarter Quarterly change in MFA's Book Value (left axis) and MFA's Asset Duration by Quarter (right axis) $30 10% 8% 6% 4% 2% 0% -2% -4% -6% -8% -10% 2.5 $25 2.0 $20 1.5 $15 1.0 $10 0.5 $5 $0 0.0 Legacy Non-Agency MBS discount accretion has exceeded Agency MBS premium amortization since 2013. MFA’s investment strategy has minimized book value volatility. In the last few years the average quarterly book value change has been less than 2%. 12 Q1-2014 Q2-2014 Q3-2014 Q4-2014 Q1-2015 Q2-2015 Q3-2015 Q4-2015 Q1-2016 Q2-2016 Q3-2016 Q4-2016 Q1-2017 Q2-2017 Q3-2017 Q4-2017 Millions ($) Q3-2013 Q4-2013 Q1-2014 Q2-2014 Q3-2014 Q4-2014 Q1-2015 Q2-2015 Q3-2015 Q4-2015 Q1-2016 Q2-2016 Q3-2016 Q4-2016 Q1 -2017 Q2-2017 Q3-2017 Q4-2017
Continued positive fundamentals for residential mortgage credit • Fundamental and technical support for residential credit assets and home prices. • Unemployment rate of 4.1% in December 2017, down from 4.7% a year ago. • According to the Urban Institute and CoreLogic, the percentage of homes with negative equity fell to 4.9% in December 2017 from 6.3% in the prior year. • According to the CoreLogic Loan Performance Insights report released in January 2018, nationwide delinquencies continue to decline. 30+ day delinquency rates have dropped to 5.1% versus 5.2% a year ago. 13

Residential whole loan portfolio update • We purchased $554MM of residential whole loans in the fourth quarter. • Purchases were more heavily weighted towards NPLs as we have seen a material spread tightening in the RPL market. • Market trading volumes for the year ended 2017 were approximately $40B of re-performing and non-performing loans. • We executed on an unrated securitization of non-performing loans selling $235MM of senior securities at a 3.375% yield. • Returns to date on non-performing loans continue to be consistent with our expectation of 5-7%. 14

Performance of non-performing loans purchased before 12/31/16 Measured by percentage of total loan count, 31% of loans which were non-performing at purchase are either performing or have paid in full as of December 2017. • 1,415 loans that were non-performing at purchase are either performing today or have paid in full. • 80% of MFA modified loans are either performing today or have paid in full. • (1) Defined as MBA 60-days delinquent or more at the time of purchase (2) Defined as MBA current, 30-days delinquent or made a payment in December 2017 15 Delinquent at purchase(1); held over one year % by loan count Status as of 12/31/17Count% of Total (2) Performing1,17426% Paid in full2415% Non-performing1,36931% REO56213% Liquidated1,10925% Total4,455100%
RPL/NPL MBS portfolio • Current market yields of approximately 3.375% for A1 Classes and 5% for A2 classes. • Well protected portfolio with substantial credit enhancement. • Very short assets with an average of 22 months remaining to step-up. • We have witnessed very low levels of price volatility. Net Coupon Months to step-up Current CEOriginal CE 3 Month Bond CPR (millions) 16 Fair value RPL MBS$78.03.64%2939.1%35.5%22.2% NPL MBS$845.14.39%2147.3%45.1%20.0% Total$923.14.32%2246.6%44.2%20.1%

MFA Non-Agency MBS portfolio: Then and Now 60% 49.1% 50% 40% 30% 20% 10% % % 0.2% 0% <= 60% 61-80% 81-90% 91-100% 101-110% > 125% Loan-to-value • • • Loan-to-value ratios have improved markedly from the first quarter of 2014 to today. The improvement has led to an increased ability to refinance resulting in faster prepayments. We expect to see continued improvement in loan-to-value ratios as 100% of the underlying loans are currently amortizing. Source: CoreLogic Data as of March 31, 2014 and December 31, 2017 17 % of underlying collateral 35.6% 34% 19.5% 15% 8.5 % 14.4%14.2% 4.1 2.9% 2.5

Summary • We remain active in the market and successfully purchased more than $700 million of investments in the fourth quarter. • We continue to expand our investment opportunity set within the residential mortgage space, utilizing the same disciplined approach to risk/reward as we have in the past. • Our Legacy Non-Agency assets continue to perform well and our diligent asset management is producing attractive economic outcomes on our credit sensitive loans. • MFA is well-positioned for changes in prepayment rates, monetary policy and/or interest rates. 18
Additional Information 19

Book value for the quarter was unchanged and up 1% in 2017 20 Qtr ended 12/31/17 Year ended 12/31/17 Book value per common share at the beginning of the period $7.70 $7.62 Net income available to common shareholders 0.24 0.79 Common dividends declared (0.20) (0.80) Net change attributable to Agency MBS (0.04) (0.10) Net change attributable to Non-Agency MBS and CRT securities (0.05) 0.10 Net change in value of swap hedges 0.05 0.09 Book value per common share as of 12/31/17 $7.70 $7.70