Attached files
| file | filename |
|---|---|
| EX-99.2 - EXHIBIT 99.2 - FEDERAL HOME LOAN MORTGAGE CORP | a20174qerexhibit992a01.htm |
| 8-K - 8-K - FEDERAL HOME LOAN MORTGAGE CORP | a20174qer8kfacing.htm |
 |  | |
Exhibit 99.1
Freddie Mac Reports Full-Year 2017 Comprehensive Income of $5.6 Billion and
Fourth Quarter 2017 Comprehensive Loss of $3.3 Billion
Full-Year and Fourth Quarter Comprehensive Income, Excluding Significant Items¹,
Were $8.1 Billion and $2.1 Billion, Respectively
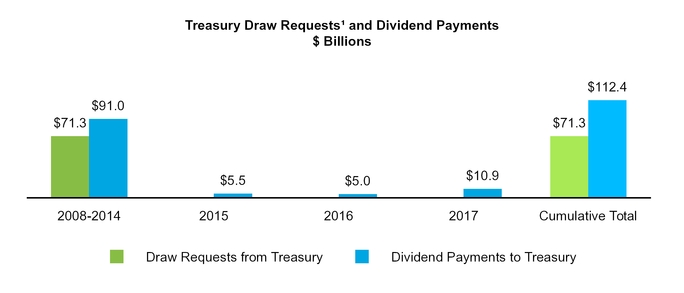
Write-down of Net Deferred Tax Asset Led to Fourth Quarter Net Loss and $0.3 Billion Draw Request to the U.S. Treasury
__
2017 Full-Year Financial Results
• | Comprehensive income of $5.6 billion was affected by two significant items: |
◦ | $4.5 billion, or $2.9 billion after-tax, benefit from a litigation settlement; and |
◦ | $5.4 billion write-down of the net deferred tax asset due to the impact of the recent tax reform legislation. |
• | Comprehensive income, excluding the significant items¹, was $8.1 billion, reflecting strong business fundamentals. |
• | Market-related gains of $1.2 billion after-tax primarily driven by gains from spread tightening and single-family legacy asset dispositions. |
2017 Fourth Quarter Financial Results
• | Comprehensive loss of $3.3 billion, driven primarily by the $5.4 billion write-down of the net deferred tax asset. |
• | Excluding this write-down, comprehensive income¹ was $2.1 billion, reflecting continued strong business fundamentals. |
• | Market-related gains of $0.4 billion after-tax primarily driven by gains from spread tightening and single-family legacy asset dispositions. |
____________________________________________________________________________________________________________________
2017 Business Highlights
Fundamentals Remained Strong; Continued Growth in Guarantee Businesses • Total guarantee portfolio grew 6 percent – highest growth rate in the past ten years; exceeding $2 trillion for the first time. • Total mortgage-related investments portfolio declined 15 percent to $253 billion while the total investments portfolio declined 13 percent to $342 billion. | “2017 was a landmark year in Freddie Mac’s transformation, reaching several very significant milestones. The guarantee book topped $2 trillion for the first time after growing 6 percent last year, the highest rate in a decade. Our work to innovate and reimagine the mortgage experience - and almost all business activities - has helped increase our competitiveness and made home possible for 2.3 million homebuying and renting families in 2017. Notably, the number of first-time homebuyers we funded hit a 10-year high and we were once again the nation’s top multifamily financier. At the same time, we significantly lowered taxpayer exposure to our risks, having reduced impaired assets in the investment portfolio by nearly 30 percent through cost-effective transactions, while integrating credit risk transfer extensively across both guarantee businesses. “We now have a fully competitive company that is executing on its mission, protecting taxpayers and helping to build a better housing finance system for the nation. We are all proud to be part of this better Freddie Mac.” Donald H. Layton Chief Executive Officer |
Delivering on the Company's Mission • Provided approximately $429 billion in liquidity to the mortgage market – funded nearly 1.5 million single-family homes and 820 thousand multifamily rental units; guaranteed nearly 11 million single-family homes and nearly 4 million multifamily rental units at year-end. | |
Returned $10.9 Billion to Taxpayers in 2017 • Returned $112.4 billion to taxpayers to-date while drawing $71.3 billion through year-end. • $0.3 billion will be drawn to cover fourth quarter net worth deficit; remaining amount available under the Senior Preferred Stock Purchase Agreement will decline to $140.2 billion. | |
Single-family: Providing Liquidity to the Market while Transforming Housing Finance • Guarantee portfolio grew 4 percent during the year, reflecting increased competitiveness and efforts to improve the mortgage experience for lenders the company serves. • Serious delinquency rate of 1.08 percent, up 8 basis points from prior year and 22 basis points from prior quarter, due to the impact of recent hurricane activity. • Transferred a majority of credit risk2 on $280 billion in UPB of loans during 2017; have now transferred a portion of credit risk on 35 percent of the total outstanding guarantee portfolio, up from 26 percent a year ago. | |
Multifamily: Leading the Industry • Guarantee portfolio grew 28 percent from prior year to $203 billion. • Record purchase volume of $73 billion increased 29 percent from a year ago due to continued strong market demand, expansion of new product offerings and increased competitiveness. • Delinquency rate continued to be near zero at 0.02 percent at year-end. • Transferred a large majority of the credit risk2 on a record $65 billion in UPB of loans in 2017 and on $249 billion in UPB of loans since 2009. | |
¹ See Non-GAAP Financial Measures Highlights on page 4 and pages 15-16 for additional details and reconciliations to the comparable amounts under GAAP.
2 As measured by modeled capital.
Freddie Mac Fourth Quarter 2017 Financial Results
February 15, 2018
Page 2
McLean, VA — Freddie Mac (OTCQB: FMCC) today reported net income of $5.6 billion for the full-year 2017, compared to net income of $7.8 billion for the full-year 2016. The company also reported comprehensive income of $5.6 billion for the full-year 2017, compared to comprehensive income of $7.1 billion for the full-year 2016.
Summary Consolidated Statements of Comprehensive Income
Three Months Ended | Full-Year | |||||||||||||||||
(Dollars in millions) | 12/31/2017 | 9/30/2017 | Change | 2017 | 2016 | Change | ||||||||||||
Net interest income | $3,501 | $3,489 | $12 | $14,164 | $14,379 | $(215) | ||||||||||||
Benefit (provision) for credit losses | 262 | (716 | ) | 978 | 84 | 803 | (719 | ) | ||||||||||
Derivative gains (losses) | 88 | (678 | ) | 766 | (1,988 | ) | (274 | ) | (1,714 | ) | ||||||||
Other non-interest income (loss)1 | 1,227 | 6,152 | (4,925 | ) | 8,857 | 774 | 8,083 | |||||||||||
Non-interest income (loss) | 1,315 | 5,474 | (4,159 | ) | 6,869 | 500 | 6,369 | |||||||||||
Administrative expense | (558 | ) | (524 | ) | (34 | ) | (2,106 | ) | (2,005 | ) | (101 | ) | ||||||
Other non-interest expense | (698 | ) | (533 | ) | (165 | ) | (2,177 | ) | (2,038 | ) | (139 | ) | ||||||
Non-interest expense | (1,256 | ) | (1,057 | ) | (199 | ) | (4,283 | ) | (4,043 | ) | (240 | ) | ||||||
Income before income tax expense | 3,822 | 7,190 | (3,368 | ) | 16,834 | 11,639 | 5,195 | |||||||||||
Income tax expense | (6,743 | ) | (2,519 | ) | (4,224 | ) | (11,209 | ) | (3,824 | ) | (7,385 | ) | ||||||
Net income (loss) | $(2,921) | $4,671 | $(7,592) | $5,625 | $7,815 | $(2,190) | ||||||||||||
Total other comprehensive income (loss) | (391 | ) | (21 | ) | (370 | ) | (67 | ) | (697 | ) | 630 | |||||||
Comprehensive income (loss) | $(3,312) | $4,650 | $(7,962) | $5,558 | $7,118 | $(1,560) | ||||||||||||
Memo Item | ||||||||||||||||||
Guarantee fee income(1) | $186 | $169 | $17 | $662 | $513 | $149 | ||||||||||||
(1) Guarantee fee income on a GAAP basis is primarily from the company’s multifamily business and is included in Other income (loss) on Freddie Mac’s consolidated statements of comprehensive income.
Financial Results Discussion
Full-Year 2017 Financial Results – Freddie Mac’s full-year 2017 net income of $5.6 billion and comprehensive income of $5.6 billion decreased $2.2 billion and $1.6 billion, respectively, from the full-year 2016. The decrease in the company’s full-year 2017 results was primarily driven by two significant items: a $5.4 billion write-down of the company's net deferred tax asset during the fourth quarter, partially offset by the $4.5 billion, or $2.9 billion after-tax, litigation settlement received in the third quarter.
Freddie Mac's full-year 2017 comprehensive income, excluding significant items¹, was $8.1 billion, an increase of approximately $1.0 billion from the full-year 2016, reflecting strong business fundamentals.
Market-related gains of $1.2 billion were primarily driven by a $0.9 billion gain from credit spread tightening and a $0.6 billion gain from single-family legacy asset dispositions, partially offset by a $0.3 billion loss from interest rate impacts, all after-tax.
Fourth Quarter 2017 Financial Results – The company’s fourth quarter 2017 net loss of $2.9 billion and comprehensive loss of $3.3 billion decreased $7.6 billion and $8.0 billion, respectively, from the third quarter of 2017 primarily driven by the write-down of the company's net deferred tax asset in the fourth quarter and the litigation settlement received in the third quarter.
Freddie Mac's fourth quarter 2017 comprehensive income, excluding the write-down of the net deferred tax asset¹, was $2.1 billion, an increase of approximately $0.3 billion from the $1.8 billion comprehensive income, excluding the litigation settlement1, in the third quarter of 2017, reflecting continued strong business fundamentals.
Market-related gains of $0.4 billion were primarily driven by a $0.3 billion gain from credit spread tightening and a $0.3 billion gain from single-family legacy asset dispositions, partially offset by a $0.1 billion loss from interest rate impacts, all after-tax.
¹ See Non-GAAP Financial Measures Highlights on page 4 and pages 15-16 for additional details and reconciliations to the comparable amounts under GAAP.
Freddie Mac Fourth Quarter 2017 Financial Results
February 15, 2018
Page 3
Selected Financial Measures
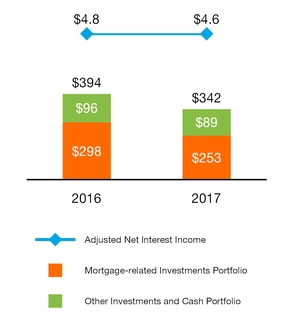
Net Interest Income
$ Billions
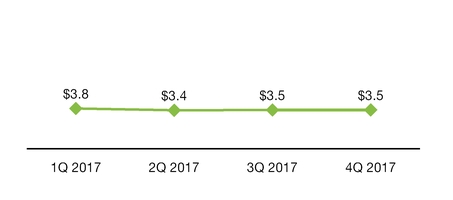
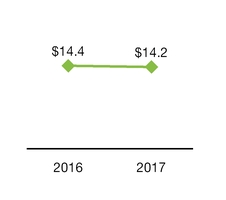
Full-Year and Fourth Quarter 2017
• | Net interest income decreased $0.2 billion from 2016 and was relatively unchanged from the third quarter. |
▪ | The decrease in full-year net interest income primarily reflected a mandated decline in the size of the company’s investments portfolio partially offset by higher net interest yield on both mortgage-related investments and other investments and increased guarantee fees. |
Guarantee Fee Income(1) and Multifamily Guarantee Portfolio
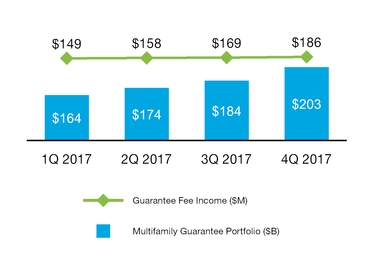
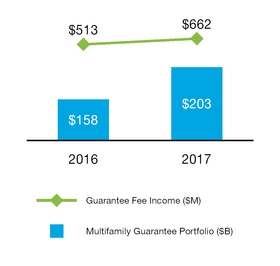
(1) Guarantee fee income on a GAAP basis is primarily from the company’s multifamily business and is included in Other income (loss) on Freddie Mac’s consolidated statements of comprehensive income.
Full-Year and Fourth Quarter 2017
• | Guarantee fee income, primarily from the company’s multifamily business, increased $149 million and $17 million from the full-year 2016 and the third quarter of 2017, respectively, driven by larger average multifamily guarantee portfolio balances due to increased issuances of K Certificates and SB Certificates during 2017. |
Freddie Mac Fourth Quarter 2017 Financial Results
February 15, 2018
Page 4
Benefit (Provision) for Credit Losses
$ Millions
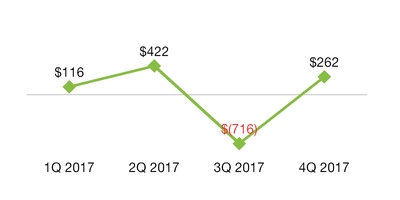
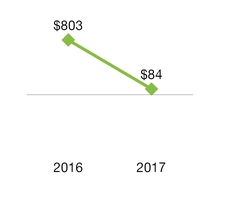
Full-Year 2017
• | Benefit for credit losses decreased $719 million from the full-year 2016 primarily reflecting the company's estimate of losses related to hurricane activity in the third quarter of 2017. |
Fourth Quarter 2017
• | Benefit for credit losses was $262 million, a shift from a provision for credit losses of $716 million in the third quarter of 2017, driven by the company's estimate of losses from hurricane activity in the third quarter that increased the provision for credit losses in that period. |
Non-GAAP Financial Measure Highlights
In addition to analyzing the company’s results on a GAAP basis, management reviews net interest income and guarantee fee income on an “adjusted”, or non-GAAP, basis. These adjusted financial measures are calculated by reclassifying certain credit guarantee-related activities and investment-related activities between various line items on the company’s GAAP consolidated statements of comprehensive income. Management believes these non-GAAP financial measures are useful because they more clearly reflect the company’s sources of revenue.
• | The company’s GAAP net interest income includes the spread earned on its investments activities plus the guarantee fees earned by its single-family business. GAAP guarantee fees are primarily those generated by its multifamily business. |
▪ | Adjusted net interest income is the net spread earned on the company’s investments activities, including the cost of funds associated with using derivatives. |
▪ | Adjusted guarantee fee income consists of the revenues from guarantee fees from both the single-family and multifamily businesses, net of the 10 basis point guarantee fee remitted to Treasury as part of the Temporary Payroll Tax Cut Continuation Act of 2011. |
In 2017, the company added a new non-GAAP financial measure adjusting comprehensive income for certain significant items. This adjusted financial measure is calculated by excluding significant items from the company’s GAAP comprehensive income that are not indicative of its on-going operations. Management believes that this new non-GAAP financial measure is useful because it allows users to better understand the drivers of the company's on-going financial results.
• | The company excluded the write-down of the net deferred tax asset in the fourth quarter of 2017 from GAAP comprehensive income as the impact of the tax reform legislation is considered a one-time event. |
• | The company excluded a litigation settlement in the third quarter of 2017 from GAAP comprehensive income as it related to the recovery of losses on legacy securities in which the company no longer invests. |
The graphs that follow show the non-GAAP financial measures for adjusted net interest income and adjusted guarantee fee income.
Freddie Mac Fourth Quarter 2017 Financial Results
February 15, 2018
Page 5
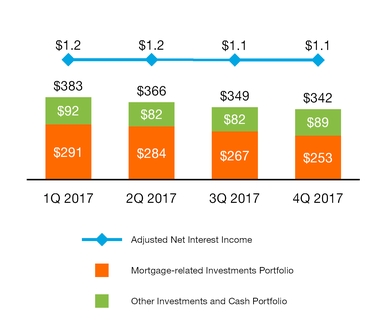
Adjusted Net Interest Income(1)(2) and Investments Portfolio
$ Billions
(1) | Non-GAAP financial measure. For reconciliations to the comparable amounts under GAAP, see page 15 of this press release. |
(2) | During the first quarter of 2017, the company discontinued adjustments which reflected the reclassification of amortization of upfront cash paid and received upon acquisitions and issuances of swaptions and options from GAAP derivative gains (losses) to adjusted net interest income. Prior period results have been revised to conform to the current period presentation. |
Full-Year and Fourth Quarter 2017
• | Adjusted net interest income decreased $0.2 billion from the full-year 2016 and was relatively unchanged from the third quarter of 2017. |
▪ | The decrease in full-year adjusted net interest income primarily reflected a decline in the company’s investments portfolio, partially offset by higher net interest yield on both mortgage-related investments and other investments. |
• | The mortgage-related investments portfolio declined $45 billion, or 15 percent, from the prior year, ending the year at $253 billion – below the 2017 year-end mandated portfolio cap of $288 billion and just slightly over the 2018 year-end mandated portfolio cap of $250 billion. |
▪ | The company remained focused on reducing the balance of less liquid assets in this portfolio. The balance of less liquid assets was $88 billion at year-end 2017, a decline of $36 billion, or 29 percent, from year-end 2016. |
◦ | Less liquid assets include single-family reperforming loans, single-family seriously delinquent loans, multifamily unsecuritized mortgage loans not in the securitization pipeline, and mortgage-related securities not guaranteed by a GSE or the U.S. government. |
– | The balance of non-agency mortgage-related securities was $5 billion at year-end 2017, a decline of $11 billion, or 69 percent, from year-end 2016. |
Freddie Mac Fourth Quarter 2017 Financial Results
February 15, 2018
Page 6
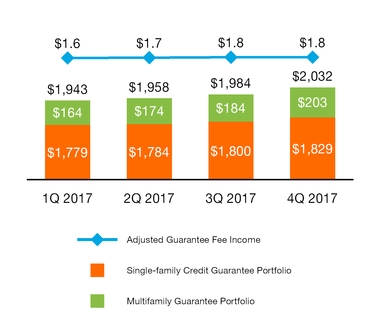
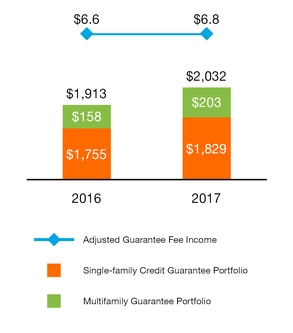
Adjusted Guarantee Fee Income(1) and Total Guarantee Portfolio
$ Billions
(1) | Non-GAAP financial measure. For reconciliations to the comparable amounts under GAAP, see page 15 of this press release. |
Note: Amounts may not add due to rounding.
Full-Year and Fourth Quarter 2017
• | Adjusted guarantee fee income increased $0.2 billion from the full-year 2016 and was relatively unchanged from the third quarter of 2017. |
▪ | The increase in adjusted guarantee fee income primarily reflected higher multifamily income due to larger average multifamily guarantee portfolio balances as a result of increased issuances of K Certificates and SB Certificates during 2017. |
◦ | Adjusted single-family guarantee fee income was relatively unchanged from the prior year as higher average contractual guarantee fees on the growing guarantee portfolio were partially offset by lower amortization of single-family upfront fees driven by a decrease in loan prepayments. |
◦ | Adjusted single-family guarantee fee income from contractual guarantee fees is expected to increase over the long-term as guarantee fees on new single-family business are generally higher than the fees received on older vintages that continue to run off. |
• | The total guarantee portfolio grew $119 billion, or 6 percent, from the prior year. |
Freddie Mac Fourth Quarter 2017 Financial Results
February 15, 2018
Page 7
Segment Financial Results and Business Highlights
Freddie Mac’s operations consist of three reportable segments which are based on the types of business activities they perform – Single-family Guarantee, Multifamily and Capital Markets. The company presents Segment Earnings for each reportable segment by reclassifying certain credit guarantee-related and investment-related activities between various line items on its GAAP condensed consolidated statements of comprehensive income and allocating certain revenue and expenses, including funding costs and administrative expenses, to its three reportable segments. For more information about Segment Earnings, see Note 13 to the financial statements included in the company’s Annual Report on Form 10-K for the year ended December 31, 2017 and page 16 of this Press Release.
Single-family Guarantee Segment
Providing liquidity while transforming U.S. housing finance.
Financial Results(1)
Three Months Ended | Full-Year | |||||||||||||||
(Dollars in millions) | 12/31/2017 | 9/30/2017 | Change | 2017 | 2016 | Change | ||||||||||
Guarantee fee income | $1,589 | $1,581 | $8 | $6,094 | $6,091 | $3 | ||||||||||
Provision for credit losses | (41) | (826 | ) | 785 | (816 | ) | (517 | ) | (299 | ) | ||||||
Other non-interest income | 424 | 403 | 21 | 1,505 | 447 | 1,058 | ||||||||||
Administrative expense | (363) | (353 | ) | (10) | (1,381 | ) | (1,323 | ) | (58 | ) | ||||||
REO operations expense | (65) | (38 | ) | (27) | (203 | ) | (298 | ) | 95 | |||||||
Other non-interest expense | (381) | (348 | ) | (33) | (1,382 | ) | (1,169 | ) | (213 | ) | ||||||
Segment Earnings before income tax expense | 1,163 | 419 | 744 | 3,817 | 3,231 | 586 | ||||||||||
Income tax expense | (405) | (164 | ) | (241) | (1,316 | ) | (1,061 | ) | (255 | ) | ||||||
Segment Earnings, net of taxes | $758 | $255 | $503 | $2,501 | $2,170 | $331 | ||||||||||
Total other comprehensive income (loss), net of tax | 42 | — | 42 | 40 | (9 | ) | 49 | |||||||||
Total comprehensive income | $800 | $255 | $545 | $2,541 | $2,161 | $380 | ||||||||||
(1) The financial performance of the company’s Single-family Guarantee segment is measured based on its contribution to GAAP net income (loss).
• | Single-family Guarantee segment earnings increased $331 million from the full-year 2016. |
▪ | The increase in segment earnings primarily resulted from a higher benefit from single-family legacy asset reclassifications and dispositions, partially offset by an increase in provision for credit losses attributable to estimated losses from recent hurricane activity and higher credit risk transfer expense due to increased volume of outstanding transactions. |
Business Highlights
• | Core loan portfolio (after 2008), which excludes HARP and other relief refinance loans, continued to grow and was 78 percent of the single-family credit guarantee portfolio at December 31, 2017. |
• | Single-family credit guarantee portfolio increased 4 percent from year-end 2016 to $1.8 trillion at year-end 2017 driven in part by an increase in U.S. single-family mortgage debt outstanding as a result of continued home price appreciation, combined with the continuing stability of the company's share of U.S single-family origination volume. |
• | Average guarantee fees charged on new acquisitions were 41 basis points (net of the legislated 10 basis point guarantee fee remitted to Treasury as part of the Temporary Payroll Tax Cut Continuation Act of 2011) for the full-year 2017, down from 45 basis points for the full-year 2016 due in part to competitive pricing pressures. |
▪ | Average guarantee fees on the single-family credit guarantee portfolio were 34 basis points, down from 35 basis points for the full-year 2016, due to lower amortization of upfront fees driven by a decrease in loan prepayments in 2017 partially offset by higher contractual guarantee fees. |
• | Sold $0.5 billion in UPB of seriously delinquent single-family mortgage loans and $8.2 billion of single-family reperforming loans during 2017, and $3.1 billion in UPB of seriously delinquent single-family mortgage loans and $1.1 billion of single-family reperforming loans during 2016. |
Freddie Mac Fourth Quarter 2017 Financial Results
February 15, 2018
Page 8
• | Transferred a portion of credit risk associated with $280 billion in UPB of loans in the single-family credit guarantee loan portfolio during the full-year 2017; the company has now transferred a portion of the credit risk on nearly 35 percent of the total outstanding single-family credit guarantee portfolio. |
• | Provided funding for nearly 1.5 million single-family homes, approximately 663 thousand of which were refinance loans. |
Multifamily Segment
Leading the Multifamily finance industry.
Financial Results(1)
Three Months Ended | Full-Year | |||||||||||||||||
(Dollars in millions) | 12/31/2017 | 9/30/2017 | Change | 2017 | 2016 | Change | ||||||||||||
Net interest income | $301 | $342 | $(41) | $1,206 | $1,022 | $184 | ||||||||||||
Guarantee fee income | 193 | 170 | 23 | 676 | 511 | 165 | ||||||||||||
Benefit (provision) for credit losses | (3 | ) | (22 | ) | 19 | (13 | ) | 22 | (35 | ) | ||||||||
Gains (losses) on loans and other non-interest income | 654 | 183 | 471 | 1,485 | 1,166 | 319 | ||||||||||||
Derivative gains (losses) | 212 | 22 | 190 | 181 | 407 | (226 | ) | |||||||||||
Administrative expense | (107 | ) | (98 | ) | (9 | ) | (395 | ) | (362 | ) | (33 | ) | ||||||
Other non-interest expense | (22 | ) | (11 | ) | (11 | ) | (66 | ) | (58 | ) | (8 | ) | ||||||
Segment Earnings before income tax expense | 1,228 | 586 | 642 | 3,074 | 2,708 | 366 | ||||||||||||
Income tax expense | (426 | ) | (212 | ) | (214 | ) | (1,060 | ) | (890 | ) | (170 | ) | ||||||
Segment Earnings, net of taxes | $802 | $374 | $428 | $2,014 | $1,818 | $196 | ||||||||||||
Total other comprehensive income (loss), net of tax | (142 | ) | (4 | ) | (138 | ) | (77 | ) | (236 | ) | 159 | |||||||
Total comprehensive income | $660 | $370 | $290 | $1,937 | $1,582 | $355 | ||||||||||||
(1) The financial performance of the company’s Multifamily segment is measured based on its contribution to GAAP comprehensive income (loss).
• | Multifamily segment comprehensive income increased $355 million from the full-year 2016. |
▪ | The increase in comprehensive income was primarily due to increased net interest income driven by higher net interest yields and increased guarantee fee income due to continued growth in the multifamily guarantee portfolio. |
▪ | Higher fair value gains were driven by larger average balances due to increased new business volume, partially offset by less tightening of K Certificate benchmark spreads and the effects of strategic pricing. |
▪ | Disposition of certain non-agency CMBS, coupled with spread tightening, resulted in larger gains on non-agency CMBS. |
• | Derivative gains (losses) for the Multifamily segment are largely offset by interest rate-related fair value changes on the loans and investment securities being economically hedged. As a result, there is minimal net impact on total comprehensive income for the Multifamily segment from interest rate-related derivatives. |
Business Highlights
• | Record new purchase volume of $73 billion for 2017, an increase of 29 percent from 2016, while outstanding loan purchase commitments increased 17 percent to $14 billion, reflecting continued strong market demand and strategic pricing efforts. |
• | Multifamily guarantee portfolio increased 28 percent from year-end 2016 to $203 billion at year-end 2017 due to increased share of Multifamily new business volume, expansion of new product offerings and purchase activity related to certain targeted loans in underserved markets. |
▪ | Capped Multifamily new business activity was $34 billion for 2017, while uncapped new business activity was $40 billion. |
Freddie Mac Fourth Quarter 2017 Financial Results
February 15, 2018
Page 9
◦ | The 2017 FHFA Scorecard goal was to maintain the dollar volume of annual capped multifamily new business activity at or below a production cap of $36.5 billion. This production cap will decrease to $35.0 billion in 2018. |
• | Transferred a large majority of the expected and stress credit losses on a record $65 billion in UPB of loans in 2017 and on $249 billion in UPB of loans since 2009. |
▪ | Credit risk transfers primarily consisted of 53 K Certificate and 19 SB Certificate transactions that transferred a large majority of expected and stress credit losses associated with $61 billion in UPB of loans during 2017 and $239 billion in UPB of loans since 2009. |
• | Provided financing for approximately 820 thousand rental units in 2017 compared to 739 thousand in 2016. |
▪ | 83 percent of the eligible units financed were affordable to families earning at or below area median incomes. |
Capital Markets Segment
Enhancing the liquidity of the company’s securities in the secondary mortgage market while reducing less liquid assets using economically sensible transactions and responding to market opportunities in funding the company's business activities.
Financial Results(1)
Three Months Ended | Full-Year | |||||||||||||||||
(Dollars in millions) | 12/31/2017 | 9/30/2017 | Change | 2017 | 2016 | Change | ||||||||||||
Net interest income | $773 | $804 | $(31) | $3,381 | $3,812 | $(431) | ||||||||||||
Net impairment of available-for-sale securities recognized in earnings | 42 | 50 | (8 | ) | 236 | 269 | (33 | ) | ||||||||||
Derivative gains (losses) | 170 | (324 | ) | 494 | (587 | ) | 1,151 | (1,738 | ) | |||||||||
Gains (losses) on trading securities | (363 | ) | (26 | ) | (337 | ) | (570 | ) | (1,077 | ) | 507 | |||||||
Other non-interest income | 897 | 5,754 | (4,857 | ) | 7,813 | 1,865 | 5,948 | |||||||||||
Administrative expense | (88 | ) | (73 | ) | (15 | ) | (330 | ) | (320 | ) | (10 | ) | ||||||
Segment Earnings before income tax expense | 1,431 | 6,185 | (4,754) | 9,943 | 5,700 | 4,243 | ||||||||||||
Income tax expense | (507 | ) | (2,143 | ) | 1,636 | (3,428 | ) | (1,873 | ) | (1,555 | ) | |||||||
Segment Earnings, net of taxes | $924 | $4,042 | $(3,118) | $6,515 | $3,827 | $2,688 | ||||||||||||
Total other comprehensive income (loss), net of tax | (291 | ) | (17 | ) | (274 | ) | (30 | ) | (452 | ) | 422 | |||||||
Total comprehensive income | $633 | $4,025 | $(3,392) | $6,485 | $3,375 | $3,110 | ||||||||||||
(1) The financial performance of the company’s Capital Markets segment is measured based on its contribution to GAAP comprehensive income (loss).
• | Capital Markets segment comprehensive income increased $3.1 billion from the full-year 2016. |
▪ | The increase in comprehensive income was primarily driven by the $4.5 billion (pre-tax) litigation settlement received in the third quarter of 2017, partially offset by decreased net interest income driven by the continued reduction in the balance of the mortgage-related investments portfolio. |
Business Highlights
• | Continued to responsibly reduce the balance of the mortgage investments portfolio with a focus on reducing less liquid assets. The less liquid assets were $56 billion at year-end 2017, down $24 billion, or 30 percent, from year-end 2016, due primarily to securitizations of $8.2 billion of reperforming loans and sales of $9.2 billion of non-agency mortgage-related securities and ongoing portfolio liquidations. |
• | Continued to maintain a presence in the agency mortgage-related securities market to strategically support the guarantee business. |
▪ | Liquid assets held by the Capital Markets segment were 66 percent of the portfolio, or $130 billion, at year-end 2017, an increase from 60 percent of the portfolio, or $138 billion, at year-end 2016. |
Freddie Mac Fourth Quarter 2017 Financial Results
February 15, 2018
Page 10
Housing Market Support
Freddie Mac supports the U.S. housing market by executing its charter mission to ensure credit availability for new and refinanced mortgages as well as rental housing and helping struggling homeowners avoid foreclosure.
Affordable Housing Goals – In December 2017, FHFA determined that Freddie Mac achieved all five single-family and all three multifamily affordable housing goals for 2016. At this time, based on preliminary information, the company believes it met all five single-family goals and all three multifamily goals for 2017. FHFA will not be able to make a final determination on the company's 2017 performance until market data is released in October 2018.
Preventing Foreclosures – Freddie Mac continued to help struggling borrowers retain their homes or otherwise avoid foreclosure, completing approximately 75 thousand single-family loan workouts in 2017.
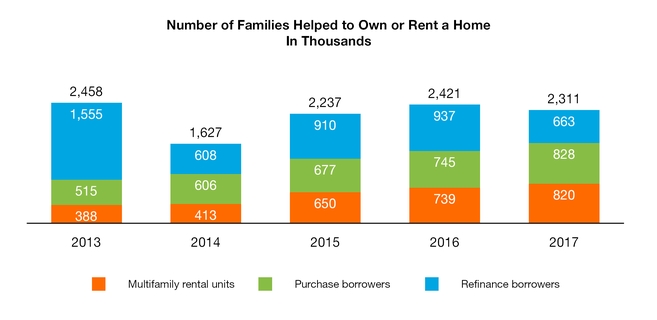
Mortgage Funding – Freddie Mac provided approximately $429 billion in liquidity to the market in 2017, funding:
• | Nearly 1.5 million single-family homes, approximately 663 thousand of which were refinance loans; and |
• | Approximately 820 thousand multifamily rental units. |
Freddie Mac Fourth Quarter 2017 Financial Results
February 15, 2018
Page 11
About Freddie Mac’s Conservatorship
Since September 2008, Freddie Mac has been operating under conservatorship with FHFA as Conservator. The support provided by Treasury pursuant to the Purchase Agreement enables the company to maintain access to the debt markets and have adequate liquidity to conduct its normal business operations.
(1) | Excludes the initial $1 billion liquidation preference of senior preferred stock issued to Treasury in September 2008 as consideration for Treasury’s funding commitment and the $3.0 billion increase in the aggregate liquidation preference of the senior preferred stock pursuant to the December 21, 2017 Letter Agreement. The company received no cash proceeds as a result of issuing the initial $1 billion liquidation preference of senior preferred stock or the $3.0 billion increase on December 31, 2017. |
Note: Amounts may not add due to rounding.
• | Based on Freddie Mac's net worth deficit of $312 million at December 31, 2017, FHFA, as Conservator, will submit a draw request, on the company's behalf, to Treasury under the Purchase Agreement in the amount of $312 million. |
• | The amount of funding available to Freddie Mac under the Purchase Agreement is $140.5 billion as of December 31, 2017, and will be reduced to $140.2 billion upon the funding of the draw request related to the company's negative net worth at December 31, 2017. |
• | The applicable Capital Reserve Amount was $600 million in 2017 and will be $3.0 billion from January 1, 2018 and thereafter, pursuant to the December 21, 2017 Letter Agreement. |
▪ | Under the Letter Agreement, the dividend for the dividend period from October 1, 2017 through and including December 31, 2017 was reduced to $2.25 billion. |
• | Through December 31, 2017, aggregate cash dividends paid to Treasury were $41.1 billion more than cumulative cash draws received from Treasury. |
▪ | The payment of dividends does not reduce the outstanding liquidation preference under the Purchase Agreement. |
• | The aggregate liquidation preference of the senior preferred stock increased by $3.0 billion to $75.3 billion on December 31, 2017 pursuant to the Letter Agreement and will increase to $75.6 billion upon the funding of the draw request. |
Freddie Mac Fourth Quarter 2017 Financial Results
February 15, 2018
Page 12
Additional Information
For more information, including that related to Freddie Mac’s financial results, conservatorship and related matters, see the company’s Annual Report on Form 10-K for the year ended December 31, 2017 and the company’s Financial Results Supplement. These documents are available on the Investor Relations page of the company’s Web site at www.FreddieMac.com/investors.
Additional information about Freddie Mac and its business is also set forth in the company’s filings with the SEC, which are available on the Investor Relations page of the company’s Web site at www.FreddieMac.com/investors and the SEC’s Web site at www.sec.gov. Freddie Mac encourages all investors and interested members of the public to review these materials for a more complete understanding of the company’s financial results and related disclosures.
Webcast Announcement
Management will host a conference call at 9 a.m. Eastern Time on February 15, 2018 to discuss the company’s results with the media. The conference call will be concurrently webcast. To access the live audio webcast, use the following link: https://edge.media-server.com/m6/p/kqr995hm. The replay will be available on the company’s Web site at www.FreddieMac.com/investors for approximately 30 days. All materials related to the call will be available on the Investor Relations page of the company’s Web site at www.FreddieMac.com/investors.
Media Contact: Lisa Gagnon (703) 903-3385 | Investor Contact: Laurie Garthune (571) 382-4732 | |
* * * *
This press release contains forward-looking statements, which may include statements pertaining to the conservatorship, the company’s current expectations and objectives for its Single-Family Guarantee, Multifamily and Capital Markets segments, its efforts to assist the housing market, liquidity and capital management, economic and market conditions and trends, market share, the effect of legislative and regulatory developments and new accounting guidance, credit quality of loans the company owns or guarantees, the costs and benefits of the company’s credit risk transfer transactions, and results of operations and financial condition on a GAAP, Segment Earnings, non-GAAP and fair value basis. Forward-looking statements involve known and unknown risks and uncertainties, some of which are beyond the company’s control. Management’s expectations for the company’s future necessarily involve a number of assumptions, judgments and estimates, and various factors, including changes in market conditions, liquidity, mortgage spreads, credit outlook, actions by the U.S. government (including FHFA, Treasury and Congress), and the impacts of legislation or regulations and new or amended accounting guidance, could cause actual results to differ materially from these expectations. These assumptions, judgments, estimates and factors are discussed in the company’s Annual Report on Form 10-K for the year ended December 31, 2017, which is available on the Investor Relations page of the company’s Web site at www.FreddieMac.com/investors and the SEC’s Web site at www.sec.gov. The company undertakes no obligation to update forward-looking statements it makes to reflect events or circumstances occurring after the date of this press release.
Freddie Mac makes home possible for millions of families and individuals by providing mortgage capital to lenders. Since its creation by Congress in 1970, the company has made housing more accessible and affordable for homebuyers and renters in communities nationwide. The company is building a better housing finance system for homebuyers, renters, lenders and taxpayers. Learn more at FreddieMac.com, Twitter @FreddieMac and Freddie Mac’s blog FreddieMac.com/blog.
Freddie Mac Fourth Quarter 2017 Financial Results
February 15, 2018
Page 13
FREDDIE MAC
CONDENSED CONSOLIDATED STATEMENTS OF COMPREHENSIVE INCOME
Three Months Ended | Twelve Months Ended | |||||||||||
(in millions, except share-related amounts) | December 31, 2017 | September 30, 2017 | December 31, 2017 | December 31, 2016 | ||||||||
Interest income | ||||||||||||
Mortgage loans | $16,055 | $15,867 | $63,735 | $61,040 | ||||||||
Investments in securities | 778 | 821 | 3,415 | 3,855 | ||||||||
Other | 221 | 185 | 657 | 270 | ||||||||
Total interest income | 17,054 | 16,873 | 67,807 | 65,165 | ||||||||
Interest expense | (13,553 | ) | (13,384 | ) | (53,643 | ) | (50,786 | ) | ||||
Net interest income | 3,501 | 3,489 | 14,164 | 14,379 | ||||||||
Benefit (provision) for credit losses | 262 | (716 | ) | 84 | 803 | |||||||
Net interest income after benefit (provision) for credit losses | 3,763 | 2,773 | 14,248 | 15,182 | ||||||||
Non-interest income (loss) | ||||||||||||
Gains (losses) on extinguishment of debt | 46 | 27 | 341 | (211 | ) | |||||||
Derivative gains (losses) | 88 | (678 | ) | (1,988 | ) | (274 | ) | |||||
Net Impairment of available-for-sale securities recognized in earnings | (1 | ) | (1 | ) | (18 | ) | (191 | ) | ||||
Other gains (losses) on investment securities recognized in earnings | 214 | 723 | 1,054 | (78 | ) | |||||||
Other income | 968 | 5,403 | 7,480 | 1,254 | ||||||||
Non-interest income (loss) | 1,315 | 5,474 | 6,869 | 500 | ||||||||
Non-interest expense | ||||||||||||
Salaries and employee benefits | (285 | ) | (272 | ) | (1,098 | ) | (989 | ) | ||||
Professional services | (112 | ) | (110 | ) | (452 | ) | (489 | ) | ||||
Other administrative expense | (161 | ) | (142 | ) | (556 | ) | (527 | ) | ||||
Total administrative expense | (558 | ) | (524 | ) | (2,106 | ) | (2,005 | ) | ||||
Real estate owned operations expense | (61 | ) | (35 | ) | (189 | ) | (287 | ) | ||||
Temporary Payroll Tax Cut Continuation Act of 2011 expense | (350 | ) | (339 | ) | (1,340 | ) | (1,152 | ) | ||||
Other expense | (287 | ) | (159 | ) | (648 | ) | (599 | ) | ||||
Non-interest expense | (1,256 | ) | (1,057 | ) | (4,283 | ) | (4,043 | ) | ||||
Income before income tax expense | 3,822 | 7,190 | 16,834 | 11,639 | ||||||||
Income tax expense | (6,743 | ) | (2,519 | ) | (11,209 | ) | (3,824 | ) | ||||
Net income (loss) | (2,921 | ) | 4,671 | 5,625 | 7,815 | |||||||
Other comprehensive income (loss), net of taxes and reclassification adjustments: | ||||||||||||
Changes in unrealized gains (losses) related to available-for-sale securities | (499 | ) | (47 | ) | (253 | ) | (825 | ) | ||||
Changes in unrealized gains (losses) related to cash flow hedge relationships | 43 | 26 | 124 | 141 | ||||||||
Changes in defined benefit plans | 65 | — | 62 | (13 | ) | |||||||
Total other comprehensive income (loss), net of taxes and reclassification adjustments | (391 | ) | (21 | ) | (67 | ) | (697 | ) | ||||
Comprehensive income (loss) | $(3,312) | $4,650 | $5,558 | $7,118 | ||||||||
Net income (loss) | $(2,921) | $4,671 | $5,625 | $7,815 | ||||||||
Undistributed net worth sweep and senior preferred stock dividends | — | (4,650 | ) | (8,869 | ) | (7,718 | ) | |||||
Net income (loss) attributable to common stockholders | $(2,921) | $21 | $(3,244) | $97 | ||||||||
Net income (loss) per common share — basic and diluted | $(0.90) | $0.01 | $(1.00) | $0.03 | ||||||||
Weighted average common shares outstanding (in millions) — basic and diluted | 3,234 | 3,234 | 3,234 | 3,234 | ||||||||
Freddie Mac Fourth Quarter 2017 Financial Results
February 15, 2018
Page 14
FREDDIE MAC
CONDENSED CONSOLIDATED BALANCE SHEETS
(in millions, except share-related amounts) | December 31, 2017 | December 31, 2016 | ||||
Assets | ||||||
Cash and cash equivalents | $6,848 | $12,369 | ||||
Restricted cash and cash equivalents | 2,963 | 9,851 | ||||
Securities purchased under agreements to resell | 55,903 | 51,548 | ||||
Investments in securities, at fair value | 84,318 | 111,547 | ||||
Mortgage loans held-for-sale (includes $20,054 and $16,255 at fair value) | 34,763 | 18,088 | ||||
Mortgage loans held-for-investment (net of allowance for loan losses of $8,966 and $13,431) | 1,836,454 | 1,784,915 | ||||
Accrued interest receivable | 6,355 | 6,135 | ||||
Derivative assets, net | 375 | 747 | ||||
Deferred tax assets, net | 8,107 | 15,818 | ||||
Other assets (includes $3,353 and $2,408 at fair value) | 13,690 | 12,358 | ||||
Total assets | $2,049,776 | $2,023,376 | ||||
Liabilities and equity | ||||||
Liabilities | ||||||
Accrued interest payable | $6,221 | $6,015 | ||||
Debt, net (includes $5,799 and $6,010 at fair value) | 2,034,630 | 2,002,004 | ||||
Derivative liabilities, net | 269 | 795 | ||||
Other liabilities | 8,968 | 9,487 | ||||
Total liabilities | 2,050,088 | 2,018,301 | ||||
Commitments and contingencies | ||||||
Equity | ||||||
Senior preferred stock (redemption value of $75,336 and $72,336) | 72,336 | 72,336 | ||||
Preferred stock, at redemption value | 14,109 | 14,109 | ||||
Common stock, $0.00 par value, 4,000,000,000 shares authorized, 725,863,886 shares issued and 650,054,731 shares and 650,046,828 shares outstanding | — | — | ||||
Additional paid-in capital | — | — | ||||
Retained earnings (accumulated deficit) | (83,261 | ) | (77,941 | ) | ||
AOCI, net of taxes, related to: | ||||||
Available-for-sale securities (includes $593 and $782, related to net unrealized gains on securities for which other-than-temporary impairment has been recognized in earnings) | 662 | 915 | ||||
Cash flow hedge relationships | (356 | ) | (480 | ) | ||
Defined benefit plans | 83 | 21 | ||||
Total AOCI, net of taxes | 389 | 456 | ||||
Treasury stock, at cost, 75,809,155 shares and 75,817,058 shares | (3,885 | ) | (3,885 | ) | ||
Total equity | (312 | ) | 5,075 | |||
Total liabilities and equity | $2,049,776 | $2,023,376 | ||||
Freddie Mac Fourth Quarter 2017 Financial Results
February 15, 2018
Page 15
FREDDIE MAC
NON-GAAP RECONCILIATIONS
Reconciliation of GAAP Net Interest Income to Adjusted Net Interest Income (pre-tax) | ||||||||||||||||||
(Dollars in millions) | 1Q 2017 | 2Q 2017 | 3Q 2017 | 4Q 2017 | 2016 | 2017 | ||||||||||||
GAAP Net Interest Income | $3,795 | $3,379 | $3,489 | $3,501 | $14,379 | $14,164 | ||||||||||||
Reclassifications: | ||||||||||||||||||
Guarantee fee income reclassified to adjusted guarantee fee income (1) (2) | (1,741 | ) | (1,840 | ) | (1,921 | ) | (1,946 | ) | (7,241 | ) | (7,448 | ) | ||||||
Accrual of periodic cash settlements reclassified from derivative gain (loss) (3) | (467 | ) | (429 | ) | (398 | ) | (296 | ) | (1,760 | ) | (1,590 | ) | ||||||
Other reclassifications (4) | (387 | ) | 57 | (24 | ) | (185 | ) | (544 | ) | (539 | ) | |||||||
Total reclassifications | (2,595 | ) | (2,212 | ) | (2,343 | ) | (2,427 | ) | (9,545 | ) | (9,577 | ) | ||||||
Adjusted Net Interest Income | $1,200 | $1,167 | $1,146 | $1,074 | $4,834 | $4,587 | ||||||||||||
Reconciliation of GAAP Guarantee Fee Income* to Adjusted Guarantee Fee Income (pre-tax) | ||||||||||||||||||
(Dollars in millions) | 1Q 2017 | 2Q 2017 | 3Q 2017 | 4Q 2017 | 2016 | 2017 | ||||||||||||
GAAP Guarantee Fee Income* | $149 | $158 | $169 | $186 | $513 | $662 | ||||||||||||
Reclassifications: | ||||||||||||||||||
Guarantee fee income reclassified from net interest income (1) (2) | 1,741 | 1,840 | 1,921 | 1,946 | 7,241 | 7,448 | ||||||||||||
Temporary Payroll Tax Cut Continuation Act of 2011 expense reclassified from other non-interest expense (5) | (321 | ) | (330 | ) | (339 | ) | (350 | ) | (1,152 | ) | (1,340 | ) | ||||||
Total reclassifications | 1,420 | 1,510 | 1,582 | 1,596 | 6,089 | 6,108 | ||||||||||||
Adjusted Guarantee Fee Income | $1,569 | $1,668 | $1,751 | $1,782 | $6,602 | $6,770 | ||||||||||||
Reconciliation of GAAP Comprehensive Income to Comprehensive Income, excluding Significant Items | ||||||||||||||||||
(Dollars in billions) | 1Q 2017 | 2Q 2017 | 3Q 2017 | 4Q 2017 | 2016 | 2017 | ||||||||||||
GAAP Comprehensive Income | $2.2 | $2.0 | $4.7 | $(3.3) | $7.1 | $5.6 | ||||||||||||
Exclusions: | ||||||||||||||||||
Non-agency mortgage-related securities litigation settlement | — | — | (4.5 | ) | — | — | (4.5 | ) | ||||||||||
Tax effect related to litigation settlement | — | — | 1.6 | — | — | 1.6 | ||||||||||||
Write-down of net deferred tax asset | — | — | — | 5.4 | — | 5.4 | ||||||||||||
Total exclusions | — | — | (2.9 | ) | 5.4 | — | 2.5 | |||||||||||
Comprehensive Income, excluding Significant items (6) | $2.2 | $2.0 | $1.8 | $2.1 | $7.1 | $8.1 | ||||||||||||
* Guarantee fee income on a GAAP basis is included in Other income (loss) on Freddie Mac’s condensed consolidated statements of comprehensive income.
Note: Columns may not add due to rounding.
For notes on reclassifications, see page 16 of this press release.
Freddie Mac Fourth Quarter 2017 Financial Results
February 15, 2018
Page 16
During the first quarter of 2017, the company changed how it calculates certain components of its Segment Earnings for its Capital Markets segment. The purpose of this change was to more closely align Segment Earnings results relative to GAAP results in order to better reflect how management evaluates the Capital Markets segment. Prior period results have been revised to conform to the current period presentation. The change to the calculation of net interest income for the Capital Markets segment is also reflected in the company's calculation of adjusted net interest income.
The change includes:
• | The discontinuation of adjustments which reflected the reclassification of amortization of upfront cash paid and received upon acquisitions and issuances of swaptions and options from derivative gains (losses) to net interest income for the Capital Markets segment. |
▪ | The discontinuation of the adjustments resulted in an increase to adjusted net interest income of $1.3 billion for 2016 to align with the current presentation. The change did not affect the calculation of adjusted guarantee fee income. |
During the fourth quarter of 2017, the company changed its GAAP accounting for qualifying hedges due to the adoption of amended hedge accounting guidance. As a result, the company modified its investment activity-related reclassifications beginning in the fourth quarter of 2017 in order to continue to reflect Segment Earnings for its Capital Markets segment consistently with prior periods. No prior period results required updates.
Notes on Significant Reclassifications
(1) Net guarantee fees are reclassified from GAAP net interest income to adjusted guarantee fee income.
(2) Implied guarantee fee income related to unsecuritized loans held in the mortgage investments portfolio is reclassified from GAAP net interest income to adjusted guarantee fee income.
(3) The accrual of periodic cash settlements of all derivatives is reclassified from GAAP derivative gains (losses) into adjusted net interest income to fully reflect the periodic cost associated with the protection provided by these contracts.
(4) Other reclassifications primarily relate to items reclassified out of GAAP net interest income, including the amortization of premiums and discounts associated with the company’s PCs and the loans underlying those PCs, amortization of non-cash premiums on single-family loans in trusts and on consolidated PCs, amortization of discounts on loans purchased with deteriorated credit quality that are on accrual status, the accretion of other-than-temporary impairments on available-for-sale securities, STACR debt note expense and net float income or expense.
(5) The expense related to the Temporary Payroll Tax Cut Continuation Act of 2011 is reclassified from GAAP other non-interest expense to adjusted guarantee fee income. As a result of the reclassification, the revenue and expense related to the legislated 10 basis point increase are netted within adjusted guarantee fee income.
(6) On December 22, 2017, tax reform legislation was signed into law. The fourth quarter of 2017 and full-year 2017 GAAP results reflect the estimated impact of the enactment of the legislation, which resulted in a $5.4 billion decrease in both net income and comprehensive income. The third quarter of 2017 and full-year 2017 GAAP results also included a benefit of $4.5 billion (pre-tax) from a settlement with the Royal Bank of Scotland plc related to non-agency mortgage-related securities. The tax effect related to this settlement was $(1.6) billion. Comprehensive income excluding the impact of these significant items is a non-GAAP financial measure. Management believes this measure is useful because it allows users to better understand the drivers of the company's on-going financial results.