Attached files
| file | filename |
|---|---|
| 8-K - ARNA-8K-20180214 - ARENA PHARMACEUTICALS INC | arna-8k_20180215.htm |

February 2018 Non-Confidential Corporate Presentation Exhibit 99.1
Forward-Looking Statements This presentation includes forward-looking statements that involve a number of risks and uncertainties, including statements about our investigative stage drug candidates, including with respect to their potential (including to become first or best-in-class), safety, efficacy, indications, significance of data, development plans, differentiation, the market and unmet needs and commercialization, expected data readouts and initiation of new clinical trials; our focus, goals, strategy, plans, timelines and guidance; our partnered programs; financial and other guidance; and other statements that are not historical facts, including statements that may include words such as “may,” “will,” “intend,” “plan,” “expect,” “potential” or other similar words. For such statements, we claim the protection of the Private Securities Litigation Reform Act of 1995. Actual events or results may differ materially from expectations, and you are cautioned not to place undue reliance on these forward-looking statements, which speak only as of the time they were made. Factors that could cause actual results to differ materially from such statements include, without limitation: the timing and outcome of research, development and regulatory review is uncertain; results of clinical trials and other studies are subject to different interpretations and may not be predictive of future results; clinical and nonclinical data is voluminous and detailed, and regulatory agencies may interpret or weigh the importance of data differently and reach different conclusions than Arena or others, request additional information, have additional recommendations or change their guidance or requirements; unexpected or unfavorable new data; our drug candidates may not advance in development or be approved for marketing; clinical trials and other studies may not proceed at the time or in the manner expected or at all; data and information related to our programs may not meet regulatory requirements or otherwise be sufficient for further development, regulatory review, partnering or approval; top-line data may not accurately reflect the complete results of a particular study or trial; other risks related to developing, seeking regulatory approval of and commercializing drugs, including regulatory, manufacturing, supply and marketing issues and drug availability; we expect to need additional funds to advance all of our programs, and you and others may not agree with the manner in which we allocate our resources; Arena's and third parties' intellectual property rights; competition; reimbursement and pricing decisions; risks related to relying on partners and other third parties; and satisfactory resolution of litigation or other disagreements. Additional factors that could cause actual results to differ materially from those stated or implied by our forward-looking statements are disclosed in our SEC filings, including under the heading “Risk Factors” in our Quarterly Report on Form 10-Q for the quarter ended September 30, 2017. We disclaim any intent or obligation to update these forward-looking statements, other than as may be required under applicable law.
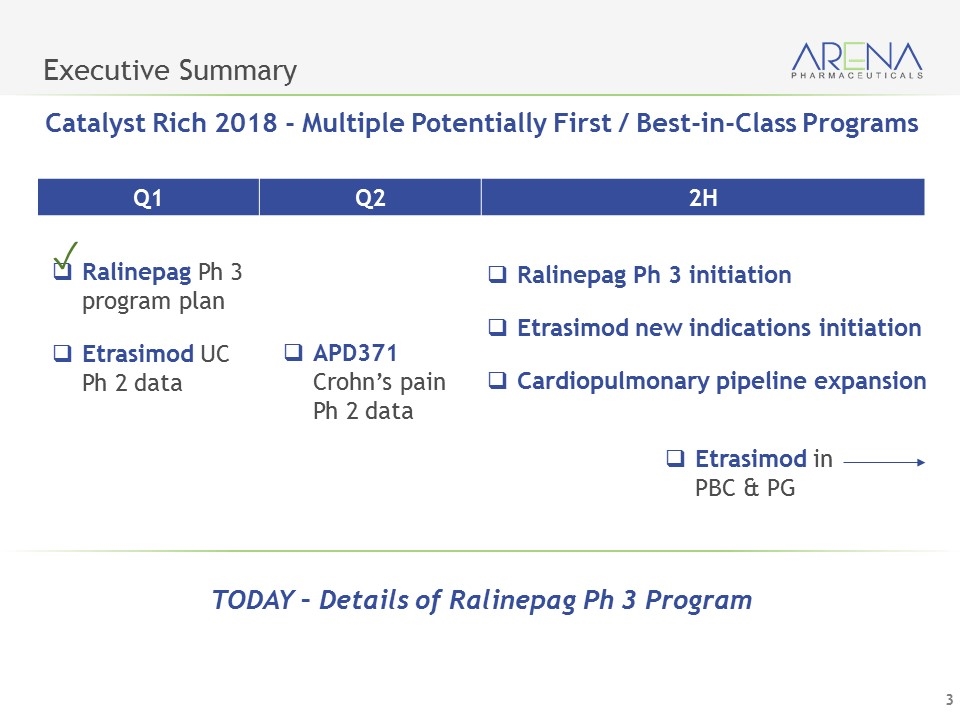
Executive Summary Catalyst Rich 2018 - Multiple Potentially First / Best-in-Class Programs Q1 Q2 2H Ralinepag Ph 3 program plan Etrasimod UC Ph 2 data APD371 Crohn’s pain Ph 2 data Ralinepag Ph 3 initiation Etrasimod new indications initiation Cardiopulmonary pipeline expansion Etrasimod in PBC & PG TODAY – Details of Ralinepag Ph 3 Program ✓
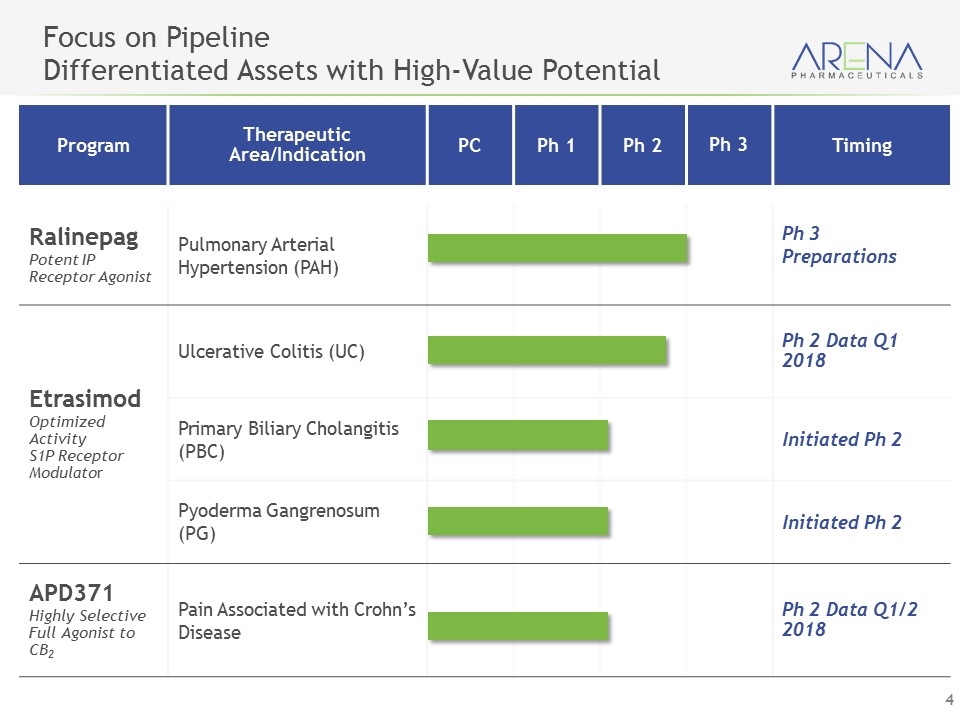
Program Therapeutic Area/Indication PC Ph 1 Ph 2 Ph 3 Timing Ralinepag Potent IP Receptor Agonist Pulmonary Arterial Hypertension (PAH) Ph 3 Preparations Etrasimod Optimized Activity S1P Receptor Modulator Ulcerative Colitis (UC) Ph 2 Data Q1 2018 Primary Biliary Cholangitis (PBC) Initiated Ph 2 Pyoderma Gangrenosum (PG) Initiated Ph 2 APD371 Highly Selective Full Agonist to CB2 Pain Associated with Crohn’s Disease Ph 2 Data Q1/2 2018 Focus on Pipeline Differentiated Assets with High-Value Potential
A Next-Generation, Oral, Selective Prostacyclin Receptor (IP) Agonist for the Treatment of Pulmonary Arterial Hypertension Ralinepag
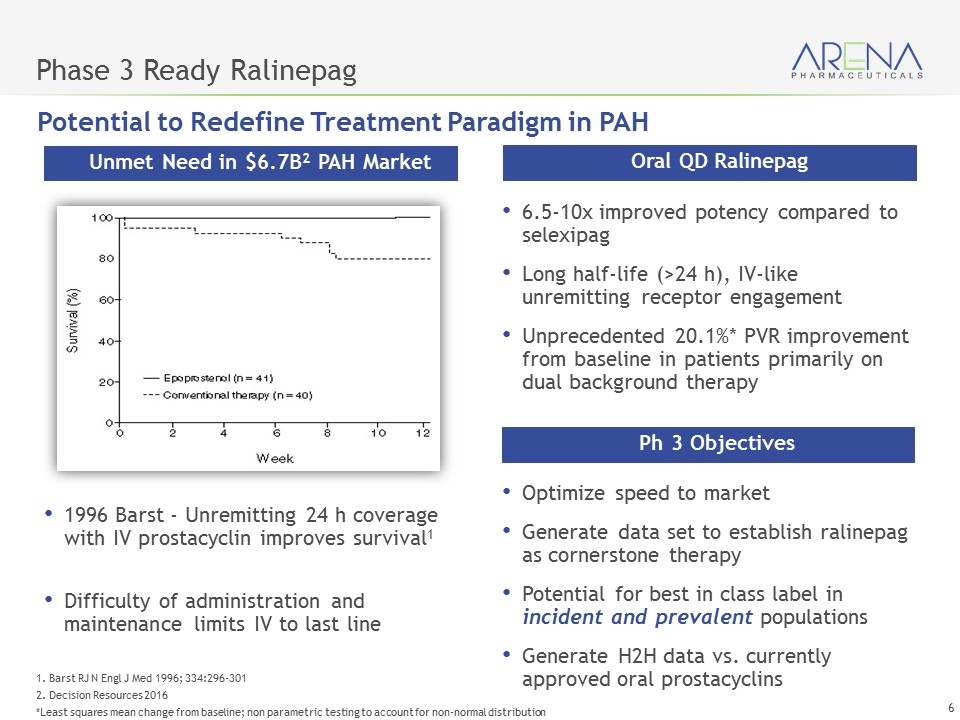
Phase 3 Ready Ralinepag 1996 Barst - Unremitting 24 h coverage with IV prostacyclin improves survival1 Difficulty of administration and maintenance limits IV to last line Unmet Need in $6.7B2 PAH Market 6.5-10x improved potency compared to selexipag Long half-life (>24 h), IV-like unremitting receptor engagement Unprecedented 20.1%* PVR improvement from baseline in patients primarily on dual background therapy Oral QD Ralinepag Optimize speed to market Generate data set to establish ralinepag as cornerstone therapy Potential for best in class label in incident and prevalent populations Generate H2H data vs. currently approved oral prostacyclins Ph 3 Objectives Potential to Redefine Treatment Paradigm in PAH 1. Barst RJ N Engl J Med 1996; 334:296-301 2. Decision Resources 2016 *Least squares mean change from baseline; non parametric testing to account for non-normal distribution
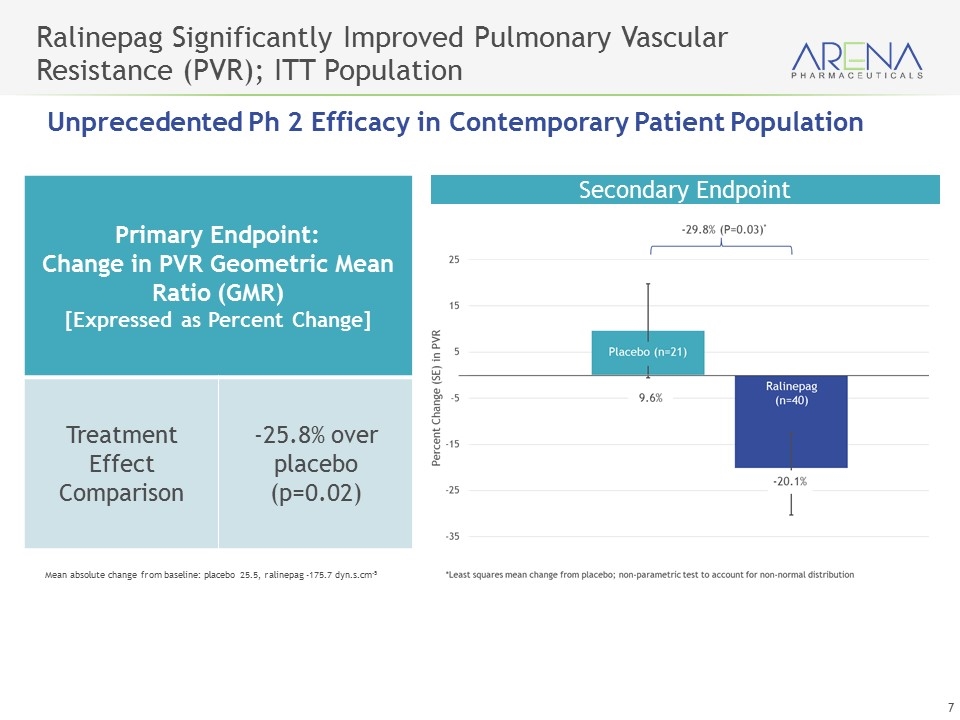
Ralinepag Significantly Improved Pulmonary Vascular Resistance (PVR); ITT Population Primary Endpoint: Change in PVR Geometric Mean Ratio (GMR) [Expressed as Percent Change] Treatment Effect Comparison -25.8% over placebo (p=0.02) Mean absolute change from baseline: placebo 25.5, ralinepag -175.7 dyn.s.cm-5 Secondary Endpoint Unprecedented Ph 2 Efficacy in Contemporary Patient Population
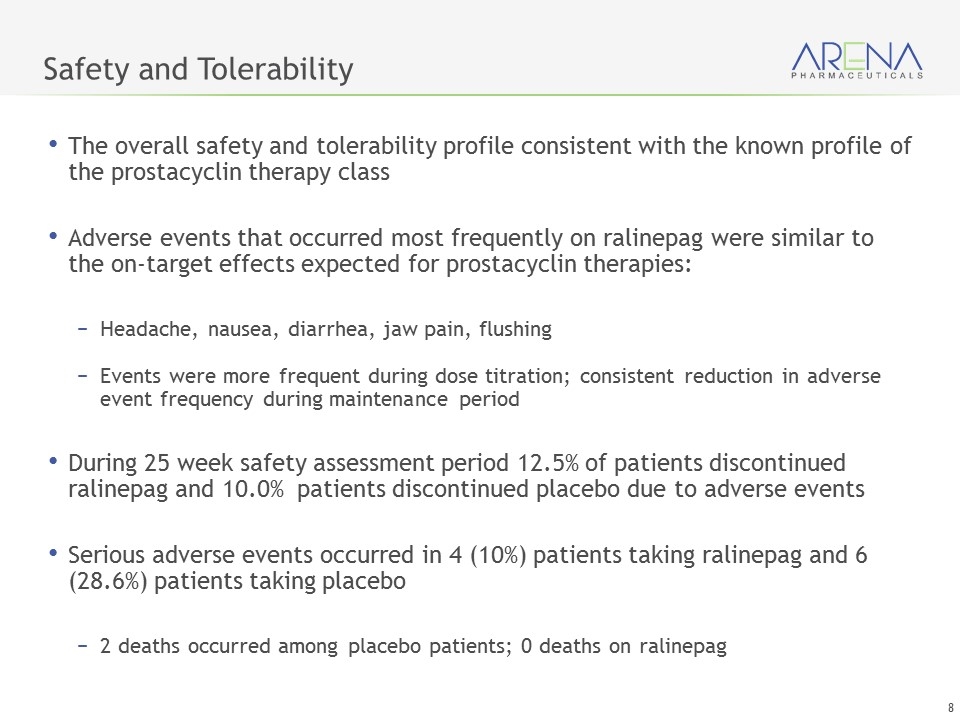
The overall safety and tolerability profile consistent with the known profile of the prostacyclin therapy class Adverse events that occurred most frequently on ralinepag were similar to the on-target effects expected for prostacyclin therapies: Headache, nausea, diarrhea, jaw pain, flushing Events were more frequent during dose titration; consistent reduction in adverse event frequency during maintenance period During 25 week safety assessment period 12.5% of patients discontinued ralinepag and 10.0% patients discontinued placebo due to adverse events Serious adverse events occurred in 4 (10%) patients taking ralinepag and 6 (28.6%) patients taking placebo 2 deaths occurred among placebo patients; 0 deaths on ralinepag Safety and Tolerability
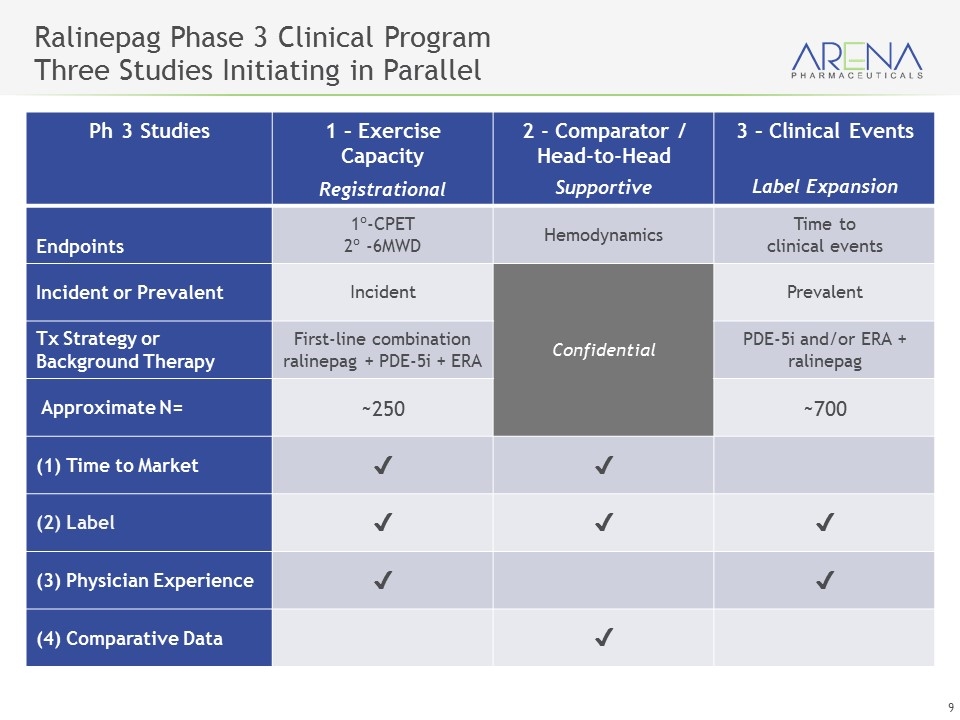
Ralinepag Phase 3 Clinical Program Three Studies Initiating in Parallel Ph 3 Studies 1 – Exercise Capacity Registrational 2 - Comparator / Head-to-Head Supportive 3 – Clinical Events Label Expansion Endpoints 1º-CPET 2º -6MWD Hemodynamics Time to clinical events Incident or Prevalent Incident Confidential Prevalent Tx Strategy or Background Therapy First-line combination ralinepag + PDE-5i + ERA PDE-5i and/or ERA + ralinepag Approximate N= ~250 ~700 (1) Time to Market ✔️ ✔️ (2) Label ✔️ ✔️ ✔️ (3) Physician Experience ✔️ ✔️ (4) Comparative Data ✔️
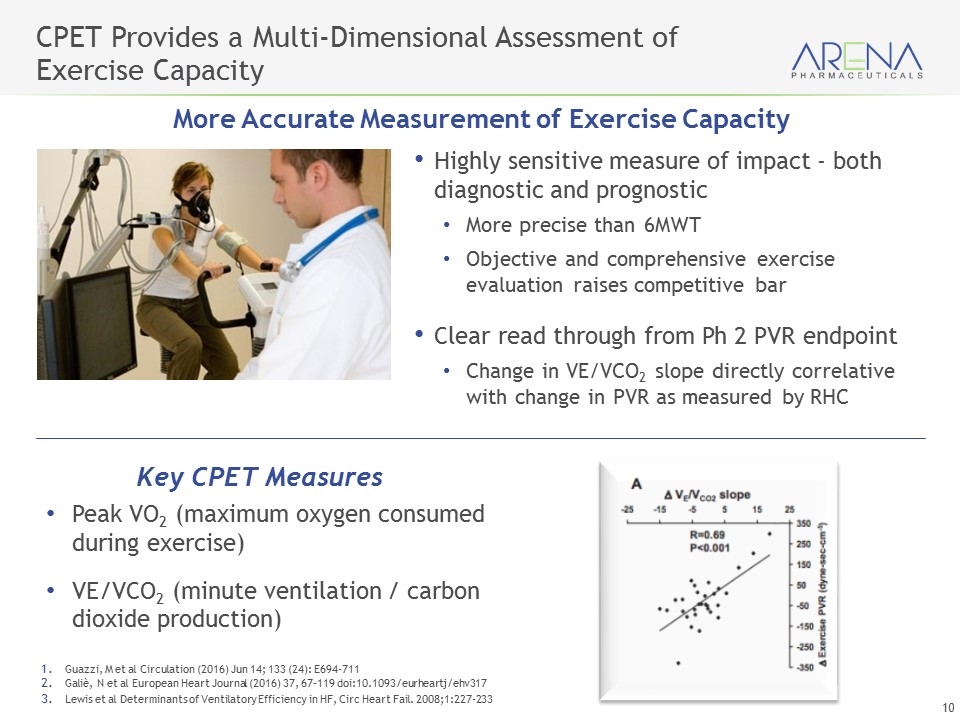
CPET Provides a Multi-Dimensional Assessment of Exercise Capacity More Accurate Measurement of Exercise Capacity Peak VO2 (maximum oxygen consumed during exercise) VE/VCO2 (minute ventilation / carbon dioxide production) Key CPET Measures Highly sensitive measure of impact - both diagnostic and prognostic More precise than 6MWT Objective and comprehensive exercise evaluation raises competitive bar Clear read through from Ph 2 PVR endpoint Change in VE/VCO2 slope directly correlative with change in PVR as measured by RHC Guazzi, M et al Circulation (2016) Jun 14; 133 (24): E694-711 Galiè, N et al European Heart Journal (2016) 37, 67–119 doi:10.1093/eurheartj/ehv317 Lewis et al Determinants of Ventilatory Efficiency in HF, Circ Heart Fail. 2008;1:227-233
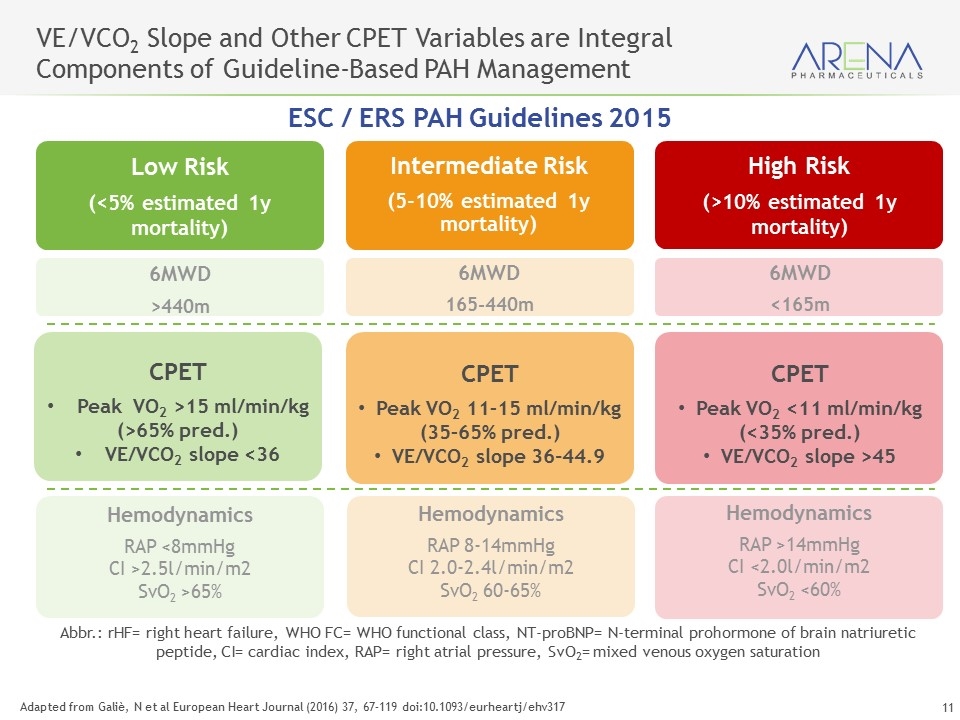
6MWD <165m 6MWD 165-440m Intermediate Risk (5-10% estimated 1y mortality) 6MWD >440m Adapted from Galiè, N et al European Heart Journal (2016) 37, 67–119 doi:10.1093/eurheartj/ehv317 VE/VCO2 Slope and Other CPET Variables are Integral Components of Guideline-Based PAH Management High Risk (>10% estimated 1y mortality) Low Risk (<5% estimated 1y mortality) CPET Peak VO2 <11 ml/min/kg (<35% pred.) VE/VCO2 slope >45 CPET Peak VO2 11–15 ml/min/kg (35–65% pred.) VE/VCO2 slope 36-44.9 Hemodynamics RAP >14mmHg CI <2.0l/min/m2 SvO2 <60% Hemodynamics RAP 8-14mmHg CI 2.0-2.4l/min/m2 SvO2 60-65% Hemodynamics RAP <8mmHg CI >2.5l/min/m2 SvO2 >65% ESC / ERS PAH Guidelines 2015 Abbr.: rHF= right heart failure, WHO FC= WHO functional class, NT-proBNP= N-terminal prohormone of brain natriuretic peptide, CI= cardiac index, RAP= right atrial pressure, SvO2= mixed venous oxygen saturation CPET Peak VO2 >15 ml/min/kg (>65% pred.) VE/VCO2 slope <36
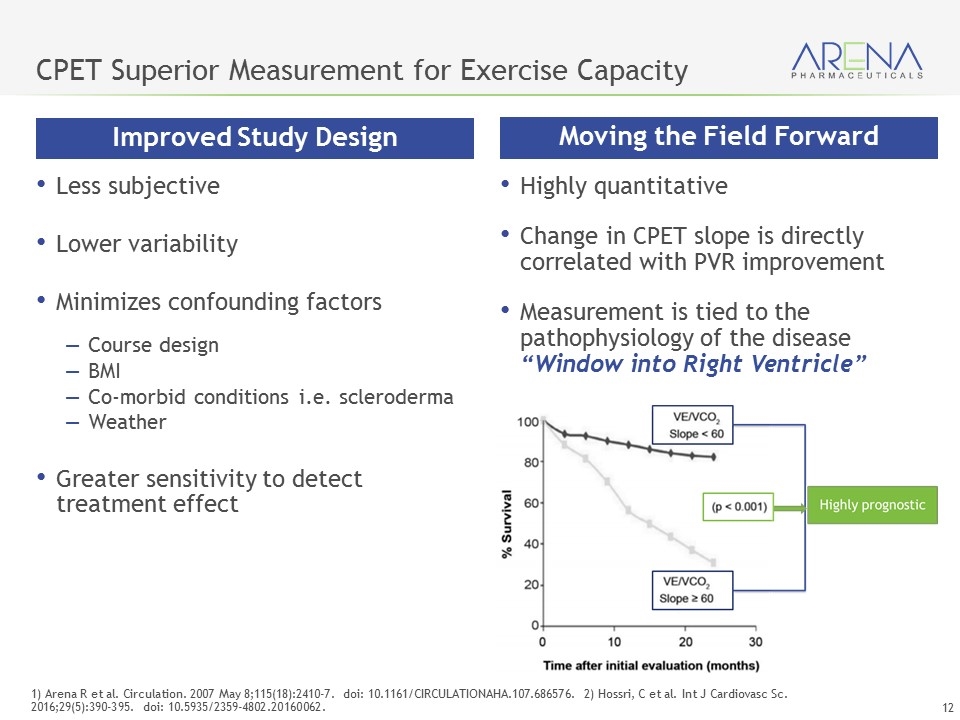
CPET Superior Measurement for Exercise Capacity Less subjective Lower variability Minimizes confounding factors Course design BMI Co-morbid conditions i.e. scleroderma Weather Greater sensitivity to detect treatment effect 1) Arena R et al. Circulation. 2007 May 8;115(18):2410-7. doi: 10.1161/CIRCULATIONAHA.107.686576. 2) Hossri, C et al. Int J Cardiovasc Sc. 2016;29(5):390-395. doi: 10.5935/2359-4802.20160062. Moving the Field Forward Improved Study Design Highly quantitative Change in CPET slope is directly correlated with PVR improvement Measurement is tied to the pathophysiology of the disease “Window into Right Ventricle”
Oral, Next Generation, S1P Receptor Modulator Optimized Activity Being Evaluated for Multiple Immune-Inflammatory Diseases Etrasimod
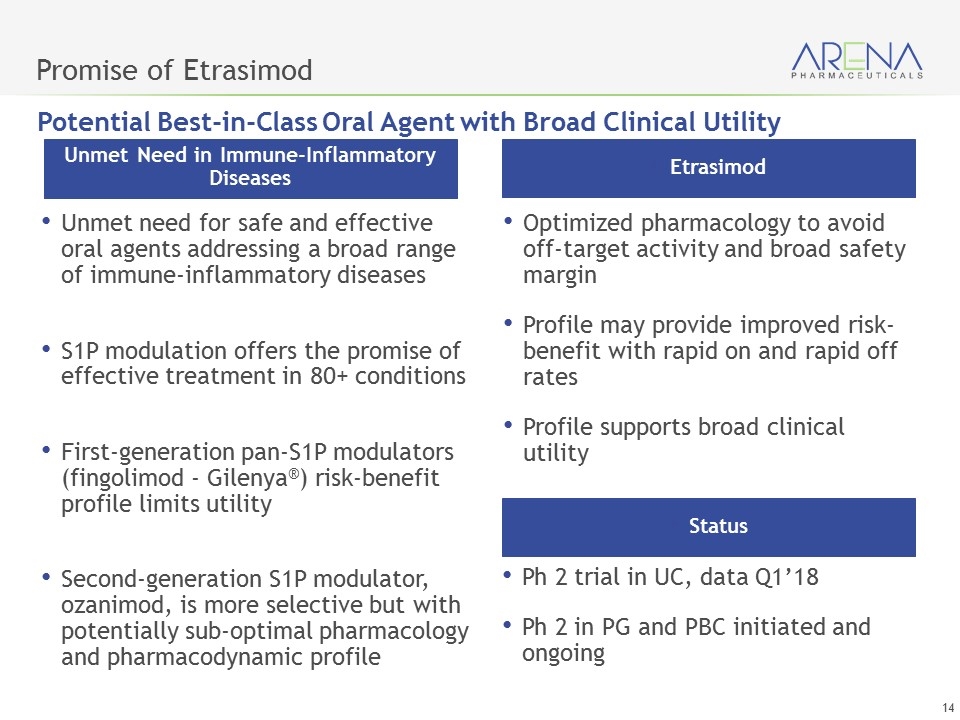
Promise of Etrasimod Unmet need for safe and effective oral agents addressing a broad range of immune-inflammatory diseases S1P modulation offers the promise of effective treatment in 80+ conditions First-generation pan-S1P modulators (fingolimod - Gilenya®) risk-benefit profile limits utility Second-generation S1P modulator, ozanimod, is more selective but with potentially sub-optimal pharmacology and pharmacodynamic profile Unmet Need in Immune-Inflammatory Diseases Optimized pharmacology to avoid off-target activity and broad safety margin Profile may provide improved risk-benefit with rapid on and rapid off rates Profile supports broad clinical utility Etrasimod Ph 2 trial in UC, data Q1’18 Ph 2 in PG and PBC initiated and ongoing Status Potential Best-in-Class Oral Agent with Broad Clinical Utility
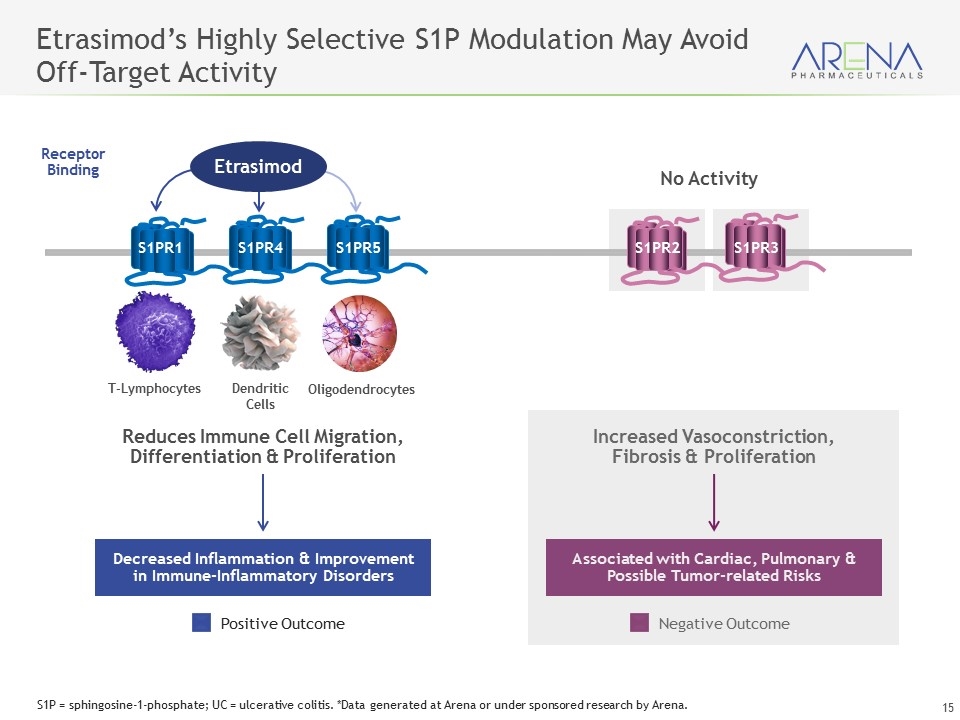
Associated with Cardiac, Pulmonary & Possible Tumor-related Risks Decreased Inflammation & Improvement in Immune-Inflammatory Disorders Positive Outcome Negative Outcome Dendritic Cells Reduces Immune Cell Migration, Differentiation & Proliferation Increased Vasoconstriction, Fibrosis & Proliferation T-Lymphocytes Oligodendrocytes S1PR2 S1PR3 Etrasimod’s Highly Selective S1P Modulation May Avoid Off-Target Activity No Activity Receptor Binding S1PR1 S1PR4 S1PR5 Etrasimod S1P = sphingosine-1-phosphate; UC = ulcerative colitis. *Data generated at Arena or under sponsored research by Arena.
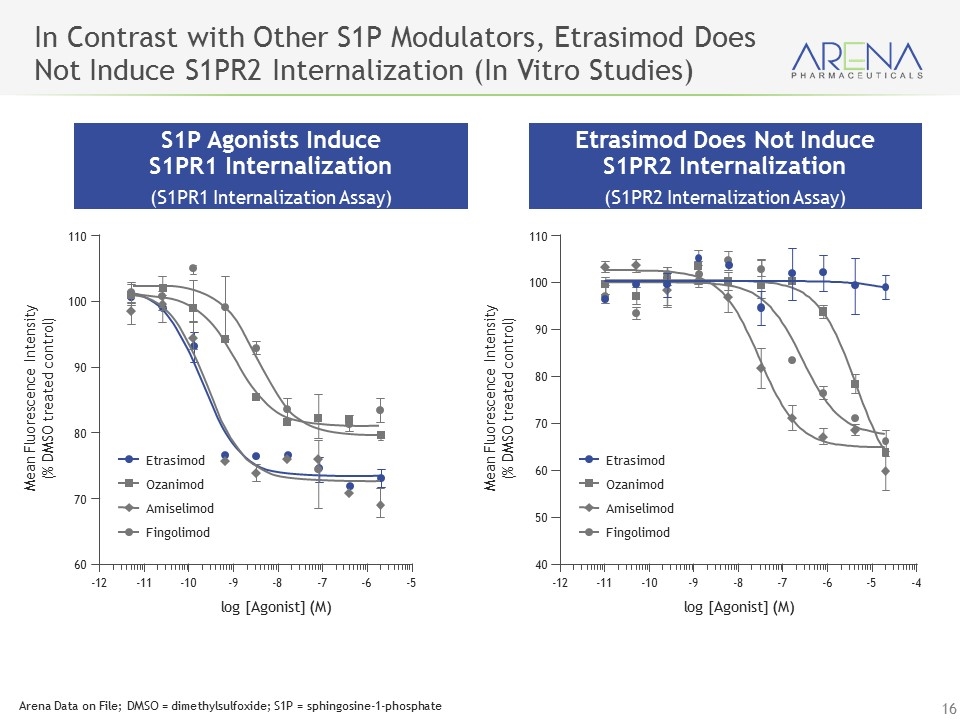
In Contrast with Other S1P Modulators, Etrasimod Does Not Induce S1PR2 Internalization (In Vitro Studies) S1P Agonists Induce S1PR1 Internalization (S1PR1 Internalization Assay) Etrasimod Does Not Induce S1PR2 Internalization (S1PR2 Internalization Assay) -12 -11 -10 -9 -8 -7 -6 -5 log [Agonist] (M) Mean Fluorescence Intensity (% DMSO treated control) 60 80 90 100 110 70 Etrasimod Fingolimod Ozanimod Amiselimod -12 -11 -10 -9 -8 -7 -6 -5 -4 log [Agonist] (M) Mean Fluorescence Intensity (% DMSO treated control) 40 80 90 100 110 50 60 70 Etrasimod Fingolimod Ozanimod Amiselimod Arena Data on File; DMSO = dimethylsulfoxide; S1P = sphingosine-1-phosphate
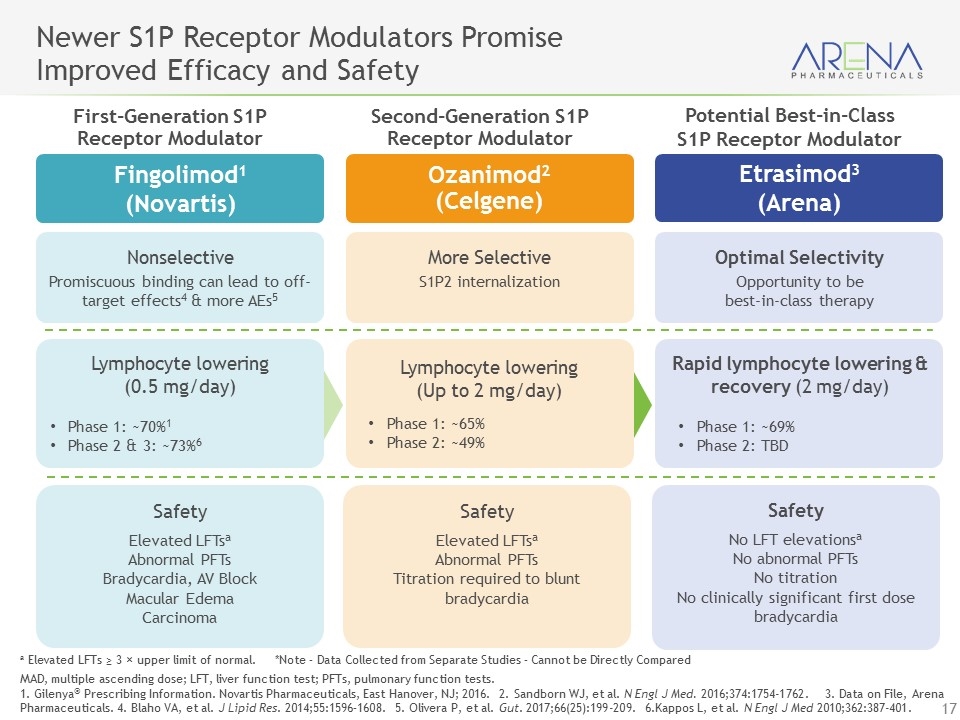
Optimal Selectivity Opportunity to be best-in-class therapy More Selective S1P2 internalization Ozanimod2 (Celgene) Nonselective Promiscuous binding can lead to off-target effects4 & more AEs5 a Elevated LFTs ≥ 3 × upper limit of normal. *Note – Data Collected from Separate Studies – Cannot be Directly Compared MAD, multiple ascending dose; LFT, liver function test; PFTs, pulmonary function tests. 1. Gilenya® Prescribing Information. Novartis Pharmaceuticals, East Hanover, NJ; 2016. 2. Sandborn WJ, et al. N Engl J Med. 2016;374:1754-1762. 3. Data on File, Arena Pharmaceuticals. 4. Blaho VA, et al. J Lipid Res. 2014;55:1596–1608. 5. Olivera P, et al. Gut. 2017;66(25):199-209. 6.Kappos L, et al. N Engl J Med 2010;362:387-401. Newer S1P Receptor Modulators Promise Improved Efficacy and Safety Etrasimod3 (Arena) Fingolimod1 (Novartis) First-Generation S1P Receptor Modulator Second-Generation S1P Receptor Modulator Rapid lymphocyte lowering & recovery (2 mg/day) Phase 1: ~69% Phase 2: TBD Lymphocyte lowering (Up to 2 mg/day) Phase 1: ~65% Phase 2: ~49% Lymphocyte lowering (0.5 mg/day) Phase 1: ~70%1 Phase 2 & 3: ~73%6 Safety No LFT elevationsa No abnormal PFTs No titration No clinically significant first dose bradycardia Safety Elevated LFTsa Abnormal PFTs Titration required to blunt bradycardia Safety Elevated LFTsa Abnormal PFTs Bradycardia, AV Block Macular Edema Carcinoma Potential Best-in-Class S1P Receptor Modulator
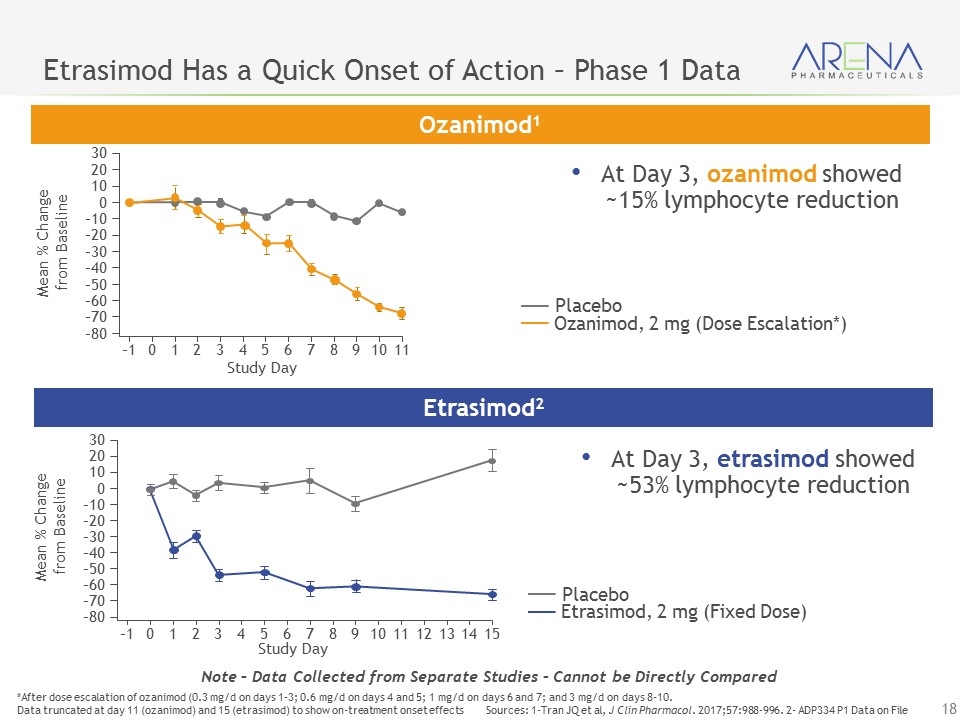
Etrasimod Has a Quick Onset of Action – Phase 1 Data *After dose escalation of ozanimod (0.3 mg/d on days 1–3; 0.6 mg/d on days 4 and 5; 1 mg/d on days 6 and 7; and 3 mg/d on days 8–10. Data truncated at day 11 (ozanimod) and 15 (etrasimod) to show on-treatment onset effects Sources: 1-Tran JQ et al, J Clin Pharmacol. 2017;57:988-996. 2- ADP334 P1 Data on File Note – Data Collected from Separate Studies – Cannot be Directly Compared Ozanimod1 Etrasimod2 Ozanimod, 2 mg (Dose Escalation*) Placebo Mean % Change from Baseline 30 20 10 0 –10 –20 –30 –40 –50 –60 –70 –80 –1 0 1 2 3 4 5 6 7 8 9 10 11 Study Day Study Day 30 20 10 0 –10 –20 –30 –40 –50 –60 –70 –80 –1 0 1 2 3 4 5 6 7 8 9 10 11 12 13 14 15 Mean % Change from Baseline Etrasimod, 2 mg (Fixed Dose) Placebo At Day 3, etrasimod showed ~53% lymphocyte reduction At Day 3, ozanimod showed ~15% lymphocyte reduction
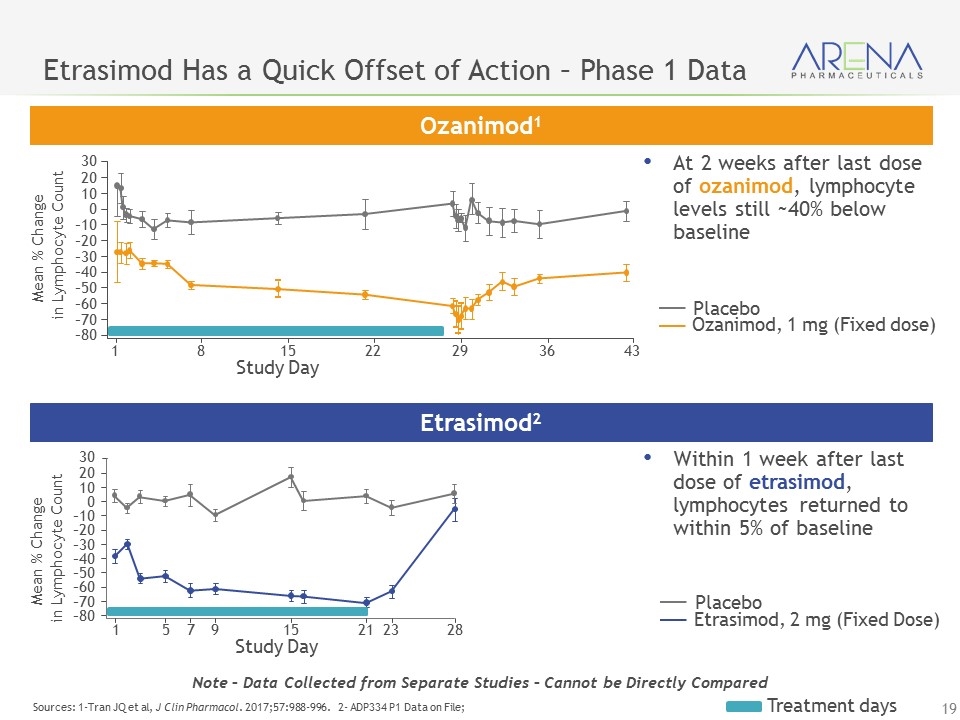
Etrasimod Has a Quick Offset of Action – Phase 1 Data Sources: 1-Tran JQ et al, J Clin Pharmacol. 2017;57:988-996. 2- ADP334 P1 Data on File; Ozanimod1 Etrasimod2 Ozanimod, 1 mg (Fixed dose) Placebo Etrasimod, 2 mg (Fixed Dose) Placebo Treatment days Within 1 week after last dose of etrasimod, lymphocytes returned to within 5% of baseline At 2 weeks after last dose of ozanimod, lymphocyte levels still ~40% below baseline Study Day 30 Mean % Change in Lymphocyte Count 20 10 0 –10 –20 –30 –40 –50 –60 –70 –80 1 8 15 22 29 36 43 Study Day 30 Mean % Change in Lymphocyte Count 20 10 0 –10 –20 –30 –40 –50 –60 –70 –80 1 5 7 9 15 21 23 28 Note – Data Collected from Separate Studies – Cannot be Directly Compared
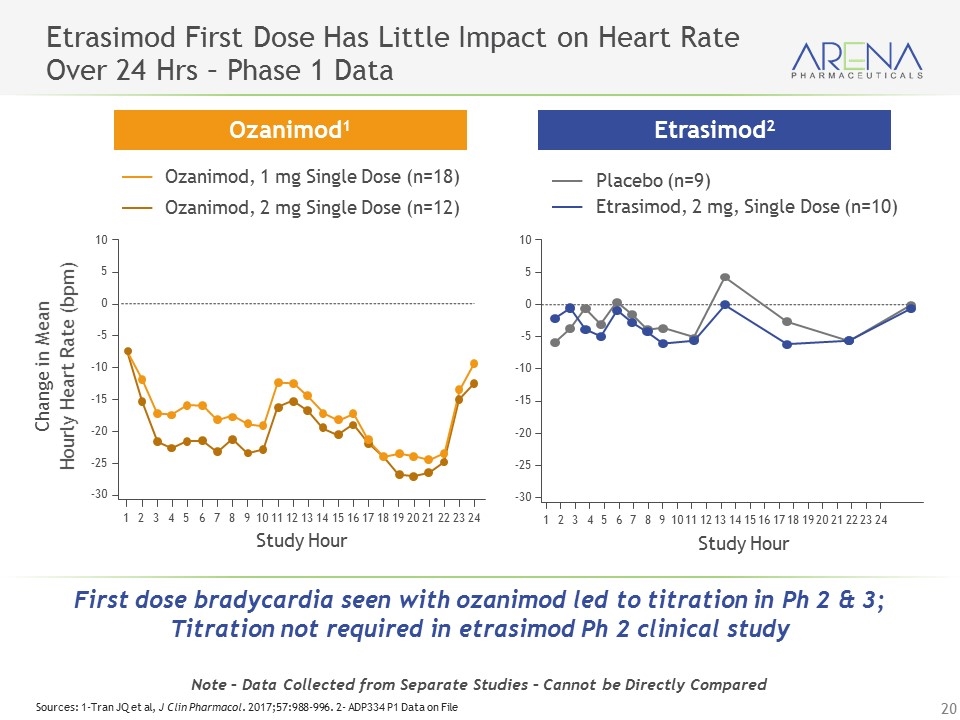
Etrasimod First Dose Has Little Impact on Heart Rate Over 24 Hrs – Phase 1 Data Ozanimod, 1 mg Single Dose (n=18) Ozanimod, 2 mg Single Dose (n=12) Placebo (n=9) Etrasimod, 2 mg, Single Dose (n=10) Ozanimod1 Etrasimod2 Note – Data Collected from Separate Studies – Cannot be Directly Compared Sources: 1-Tran JQ et al, J Clin Pharmacol. 2017;57:988-996. 2- ADP334 P1 Data on File 1 2 3 4 5 6 7 8 9 10 11 12 13 14 15 16 17 18 19 20 21 22 23 24 10 0 –10 –20 –30 5 –5 –15 –25 Study Hour Change in Mean Hourly Heart Rate (bpm) 10 0 –10 –20 –30 5 –5 –15 –25 Study Hour 1 2 3 4 5 6 7 8 9 10 11 12 13 14 15 16 17 18 19 20 21 22 23 24 First dose bradycardia seen with ozanimod led to titration in Ph 2 & 3; Titration not required in etrasimod Ph 2 clinical study
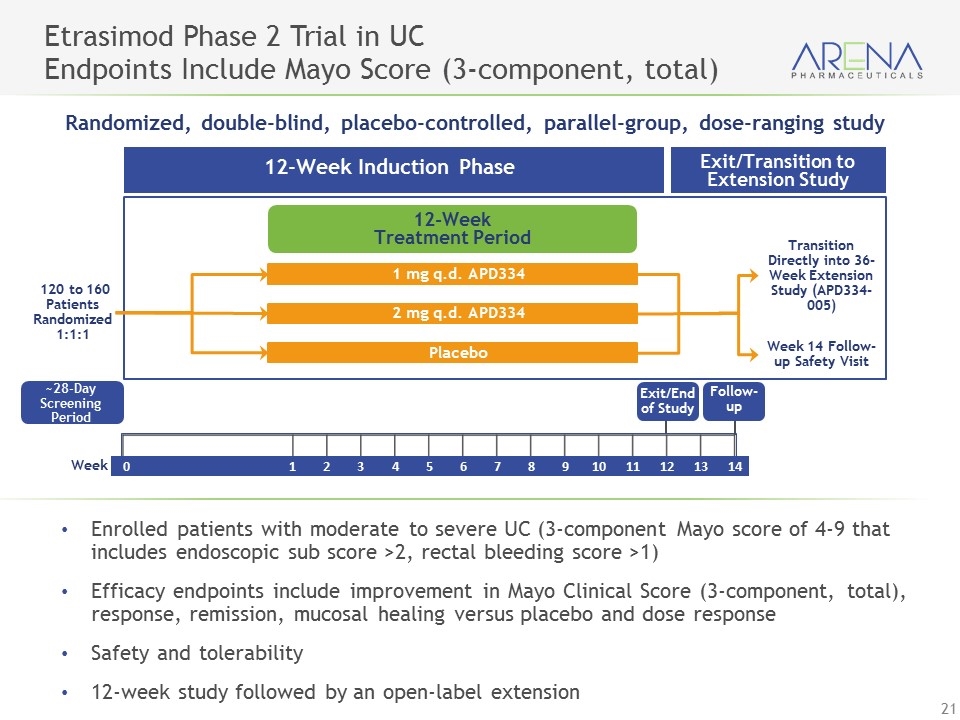
Enrolled patients with moderate to severe UC (3-component Mayo score of 4-9 that includes endoscopic sub score >2, rectal bleeding score >1) Efficacy endpoints include improvement in Mayo Clinical Score (3-component, total), response, remission, mucosal healing versus placebo and dose response Safety and tolerability 12-week study followed by an open-label extension Etrasimod Phase 2 Trial in UC Endpoints Include Mayo Score (3-component, total) Week 0 1 2 3 4 5 6 7 8 9 10 11 12 13 14 Randomized, double-blind, placebo-controlled, parallel-group, dose-ranging study 12-Week Induction Phase Exit/Transition to Extension Study 12-Week Treatment Period 1 mg q.d. APD334 2 mg q.d. APD334 Placebo Transition Directly into 36-Week Extension Study (APD334-005) 120 to 160 Patients Randomized 1:1:1 Week 14 Follow-up Safety Visit Exit/End of Study ~28-Day Screening Period Follow-up
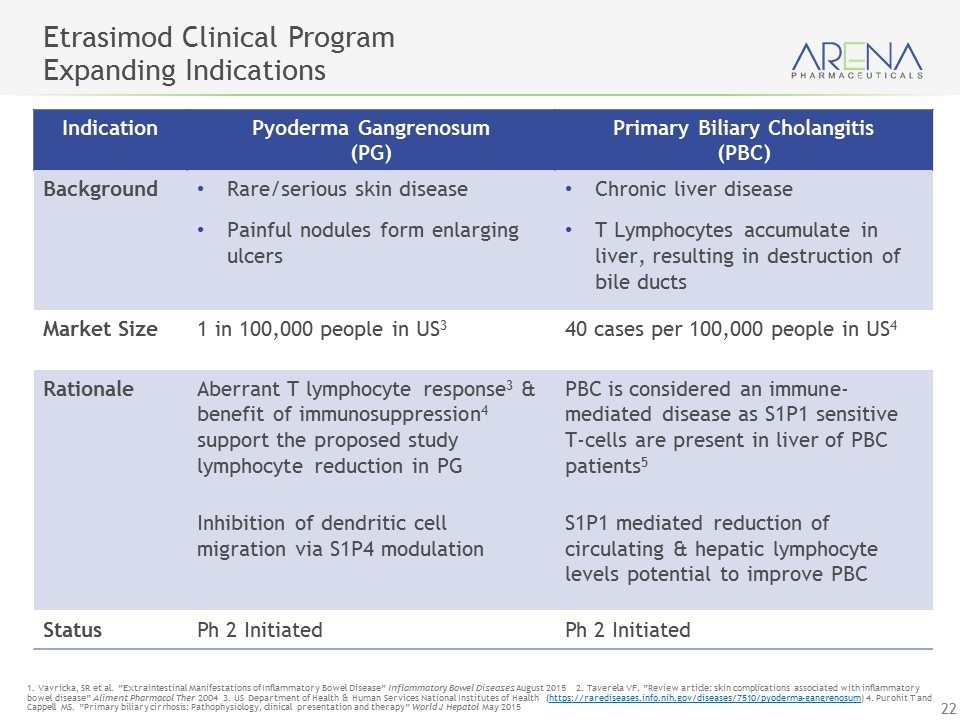
Etrasimod Clinical Program Expanding Indications 1. Vavricka, SR et al. ”Extraintestinal Manifestations of Inflammatory Bowel Disease” Inflammatory Bowel Diseases August 2015 2. Taverela VF. ”Review article: skin complications associated with inflammatory bowel disease” Aliment Pharmacol Ther 2004 3. US Department of Health & Human Services National Institutes of Health (https://rarediseases.info.nih.gov/diseases/7510/pyoderma-gangrenosum) 4. Purohit T and Cappell MS. ”Primary biliary cirrhosis: Pathophysiology, clinical presentation and therapy” World J Hepatol May 2015 Indication Pyoderma Gangrenosum (PG) Primary Biliary Cholangitis (PBC) Background Rare/serious skin disease Painful nodules form enlarging ulcers Chronic liver disease T Lymphocytes accumulate in liver, resulting in destruction of bile ducts Market Size 1 in 100,000 people in US3 40 cases per 100,000 people in US4 Rationale Aberrant T lymphocyte response3 & benefit of immunosuppression4 support the proposed study lymphocyte reduction in PG Inhibition of dendritic cell migration via S1P4 modulation PBC is considered an immune-mediated disease as S1P1 sensitive T-cells are present in liver of PBC patients5 S1P1 mediated reduction of circulating & hepatic lymphocyte levels potential to improve PBC Status Ph 2 Initiated Ph 2 Initiated
APD371 Peripherally Restricted, Highly–Selective, Full Agonist to Cannabinoid 2 Receptor (CB2) Being Evaluated for Treatment of Pain Associated with Crohn’s Disease
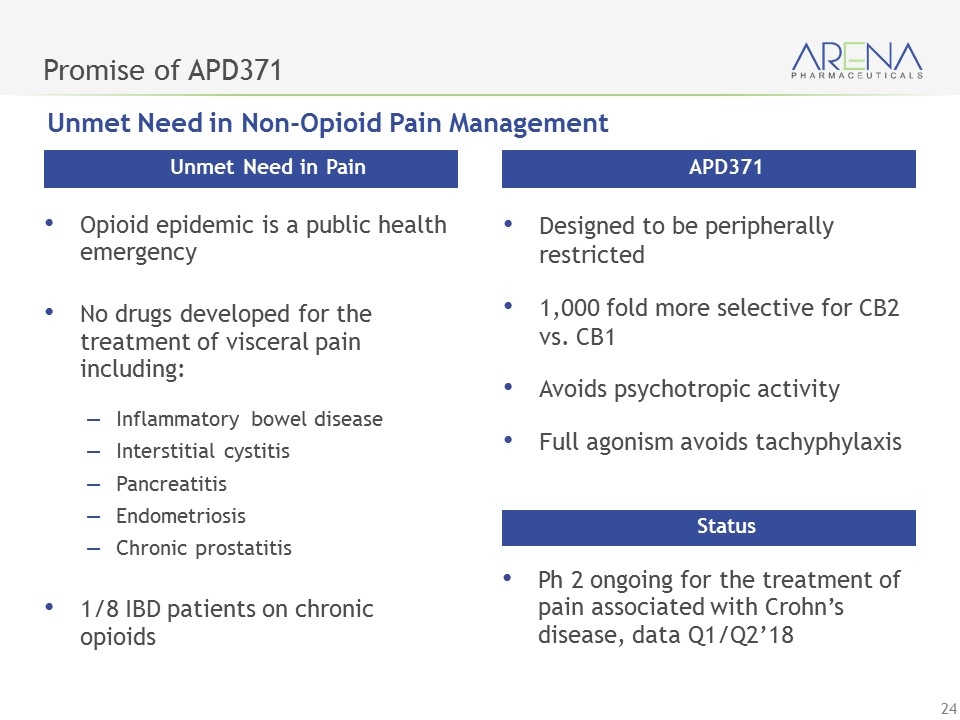
Promise of APD371 Opioid epidemic is a public health emergency No drugs developed for the treatment of visceral pain including: Inflammatory bowel disease Interstitial cystitis Pancreatitis Endometriosis Chronic prostatitis 1/8 IBD patients on chronic opioids Unmet Need in Pain Designed to be peripherally restricted 1,000 fold more selective for CB2 vs. CB1 Avoids psychotropic activity Full agonism avoids tachyphylaxis APD371 Ph 2 ongoing for the treatment of pain associated with Crohn’s disease, data Q1/Q2’18 Status Unmet Need in Non-Opioid Pain Management
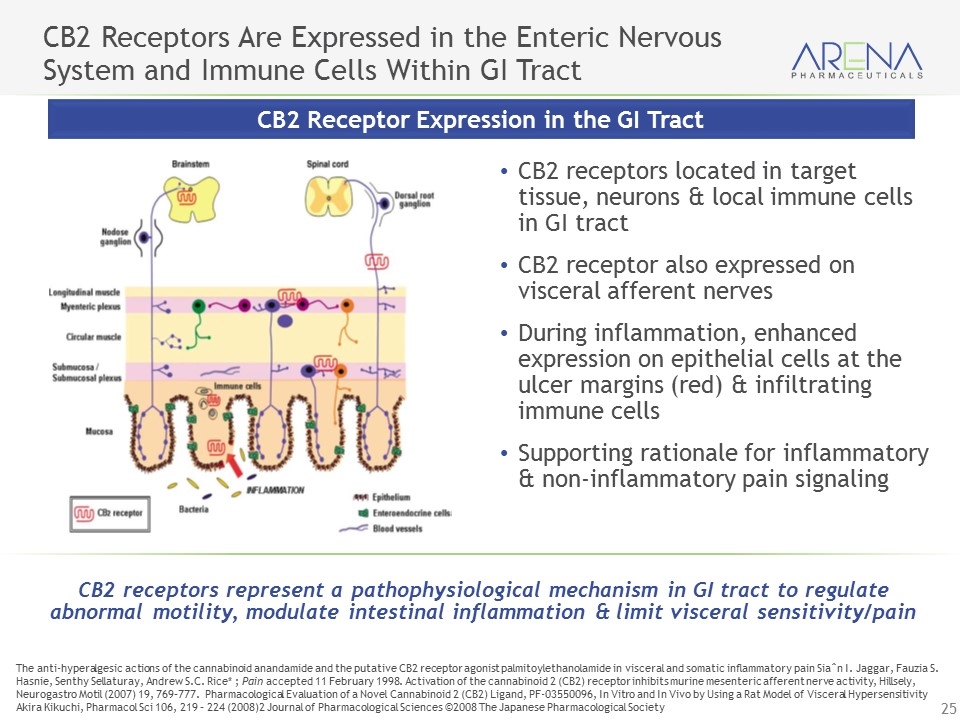
CB2 Receptors Are Expressed in the Enteric Nervous System and Immune Cells Within GI Tract CB2 receptors located in target tissue, neurons & local immune cells in GI tract CB2 receptor also expressed on visceral afferent nerves During inflammation, enhanced expression on epithelial cells at the ulcer margins (red) & infiltrating immune cells Supporting rationale for inflammatory & non-inflammatory pain signaling CB2 Receptor Expression in the GI Tract CB2 receptors represent a pathophysiological mechanism in GI tract to regulate abnormal motility, modulate intestinal inflammation & limit visceral sensitivity/pain The anti-hyperalgesic actions of the cannabinoid anandamide and the putative CB2 receptor agonist palmitoylethanolamide in visceral and somatic inflammatory pain Siaˆn I. Jaggar, Fauzia S. Hasnie, Senthy Sellaturay, Andrew S.C. Rice* ; Pain accepted 11 February 1998. Activation of the cannabinoid 2 (CB2) receptor inhibits murine mesenteric afferent nerve activity, Hillsely, Neurogastro Motil (2007) 19, 769–777. Pharmacological Evaluation of a Novel Cannabinoid 2 (CB2) Ligand, PF-03550096, In Vitro and In Vivo by Using a Rat Model of Visceral Hypersensitivity Akira Kikuchi, Pharmacol Sci 106, 219 – 224 (2008)2 Journal of Pharmacological Sciences ©2008 The Japanese Pharmacological Society
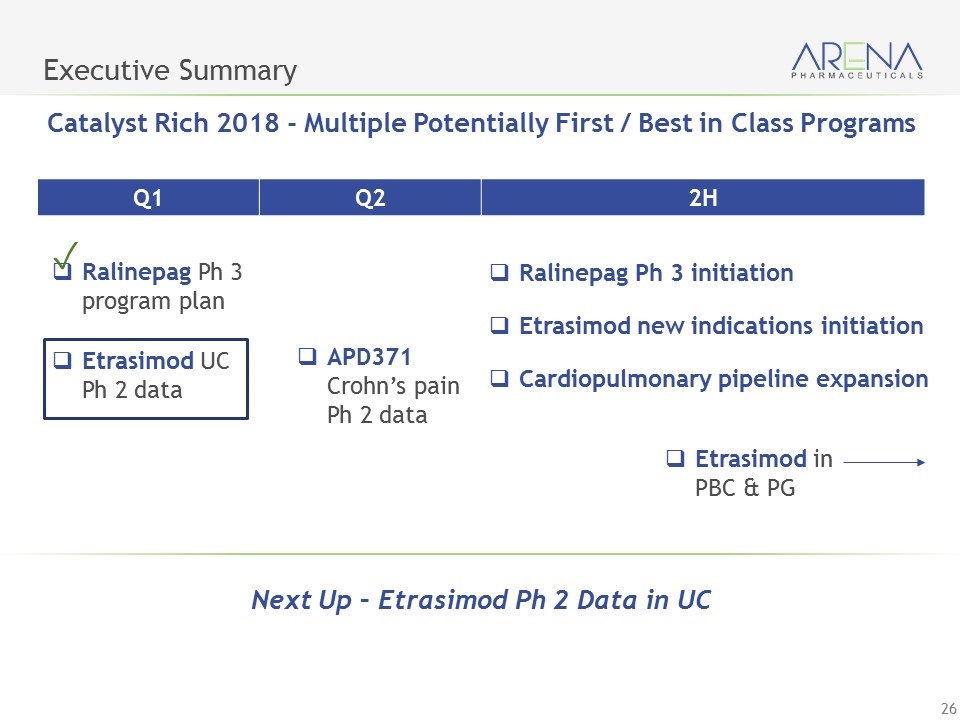
Executive Summary Catalyst Rich 2018 - Multiple Potentially First / Best in Class Programs Q1 Q2 2H Ralinepag Ph 3 program plan APD371 Crohn’s pain Ph 2 data Ralinepag Ph 3 initiation Etrasimod new indications initiation Cardiopulmonary pipeline expansion Etrasimod in PBC & PG Next Up – Etrasimod Ph 2 Data in UC Etrasimod UC Ph 2 data ✓

NASDAQ: ARNA Thank you
