Attached files
| file | filename |
|---|---|
| EX-99.2 - EX-99.2 - Rosehill Resources Inc. | d518143dex992.htm |
| EX-99.1 - EX-99.1 - Rosehill Resources Inc. | d518143dex991.htm |
| EX-23.2 - EX-23.2 - Rosehill Resources Inc. | d518143dex232.htm |
| EX-23.1 - EX-23.1 - Rosehill Resources Inc. | d518143dex231.htm |
| EX-10.28 - EX-10.28 - Rosehill Resources Inc. | d518143dex1028.htm |
| EX-5.1 - EX-5.1 - Rosehill Resources Inc. | d518143dex51.htm |
Table of Contents
Index to Financial Statements
As filed with the Securities and Exchange Commission on February 14, 2018
Registration No. 333-
UNITED STATES
SECURITIES AND EXCHANGE COMMISSION
Washington, D.C. 20549
FORM S-1
REGISTRATION STATEMENT
UNDER
THE SECURITIES ACT OF 1933
ROSEHILL RESOURCES INC.
(Exact Name of Registrant as Specified in its Charter)
| Delaware | 6770 | 47-5500436 | ||
| (State or other jurisdiction of incorporation) |
(Primary Standard Industrial Classification Code Number) |
(I.R.S. Employer Identification No.) |
J. A. (Alan) Townsend
President and Chief Executive Officer
16200 Park Row, Suite 300
Houston, Texas 77084
(281) 675-3400
(Name, Address, Including Zip Code, and Telephone Number, Including Area Code, of Agent for Service)
Copies to:
| Brenda K. Lenahan Vinson & Elkins L.L.P. 666 Fifth Street, 26th Floor New York, New York 10103 (212) 237-0000 |
Sean T. Wheeler Latham & Watkins LLP 811 Main Street, Suite 3700 Houston, Texas 77002 (713) 546-5400 |
Approximate date of commencement of proposed sale to the public:
As soon as practicable after this Registration Statement becomes effective
If any of the securities being registered on this Form are to be offered on a delayed or continuous basis pursuant to Rule 415 under the Securities Act of 1933, check the following box. ☐
If this Form is filed to register additional securities for an offering pursuant to Rule 462(b) under the Securities Act, check the following box and list the Securities Act registration statement number of the earlier effective registration statement for the same offering. ☐
If this Form is a post-effective amendment filed pursuant to Rule 462(c) under the Securities Act, check the following box and list the Securities Act registration statement number of the earlier effective registration statement for the same offering. ☐
If this Form is a post-effective amendment filed pursuant to Rule 462(d) under the Securities Act, check the following box and list the Securities Act registration statement number of the earlier effective registration statement for the same offering. ☐
Indicate by check mark whether the registrant is a large accelerated filer, an accelerated filer, a non-accelerated filer, smaller reporting company or an emerging growth company. See the definitions of “large accelerated filer,” “accelerated filer,” “smaller reporting company” and “emerging growth company” in Rule 12b-2 of the Exchange Act.
| Large accelerated filer | ☐ | Accelerated filer | ☐ | |||
| Non-accelerated filer | ☒ (Do not check if a smaller reporting company) | Smaller reporting company | ☐ | |||
| Emerging growth company | ☒ | |||||
If an emerging growth company, indicate by check mark if the registrant has elected not to use the extended transition period for complying with any new or revised financial accounting standards provided to Section 7(a)(2)(B) of the Securities Act. ☐
CALCULATION OF REGISTRATION FEE
|
| ||||||||
| Title of each class of securities to be registered |
Amount to be registered(1) |
Proposed maximum offering price per share(2) |
Proposed maximum aggregate offering price |
Amount of registration fee(3) | ||||
| Class A Common Stock, par value $0.0001 per share |
11,500,000 | $6.59 | $75,785,000.00 | $9,435.23 | ||||
|
| ||||||||
|
| ||||||||
| (1) | Includes 1,500,000 shares of Class A Common Stock issuable upon exercise of the underwriters’ option to purchase additional shares of Class A Common Stock. |
| (2) | Calculated in accordance with Rule 457(c) of the Securities Act of 1933, as amended, on the basis of the high and low sale price of the Class A Common Stock on February 9, 2018. |
| (3) | The Registrant previously paid a registration fee of $13,264 in connection with the filing of a Registration Statement on Form S-1 (File No. 333-217684) that was withdrawn before any securities were sold thereunder. The Registrant subsequently used $6,805 associated with such unsold securities to offset the registration fee in connection with a Registration Statement on Form S-3 (File No. 333-217683). In accordance with Rule 457(p), part of the registration fee due in connection with this Registration Statement on Form S-1 will be offset against the remaining registration fee of $6,459 associated with the withdrawn Registration Statement on Form S-1. |
The Registrant hereby amends this Registration Statement on such date or dates as may be necessary to delay its effective date until the Registrant shall file a further amendment which specifically states that this Registration Statement shall thereafter become effective in accordance with Section 8(a) of the Securities Act, or until the Registration Statement shall become effective on such date as the Securities and Exchange Commission acting pursuant to said Section 8(a), may determine.
Table of Contents
Index to Financial Statements
The information contained in this preliminary prospectus is not complete and may be changed. These securities may not be sold until the registration statement filed with the Securities and Exchange Commission is effective. This preliminary prospectus is not an offer to sell these securities, and it is not soliciting an offer to buy these securities, in any jurisdiction where the offer or sale is not permitted.
SUBJECT TO COMPLETION, DATED FEBRUARY 14, 2018
PRELIMINARY PROSPECTUS

ROSEHILL RESOURCES INC.
10,000,000 SHARES
CLASS A COMMON STOCK
We are offering 10,000,000 shares of our Class A Common Stock, par value $0.0001 per share (“Class A Common Stock”).
Our Class A Common Stock is listed on The NASDAQ Capital Market (“NASDAQ”) under the symbol “ROSE.” On February 13, 2018, the closing price of our Class A Common Stock was $7.59. As of February 13, 2018, we had 6,116,635 shares of Class A Common Stock issued and outstanding.
We are an “emerging growth company” as defined in Section 2(a) of the Securities Act of 1933, as amended (the “Securities Act”), as modified by the Jumpstart Our Business Startups Act of 2012 (the “JOBS Act”) and are subject to reduced public company reporting requirements. This prospectus complies with the requirements that apply to an issuer that is an emerging growth company.
Investing in our Class A Common Stock involves risks. See “Risk Factors” beginning on page 17 of this prospectus.
| Price to Public |
Underwriting Discounts(1) |
Proceeds to Us |
||||||||||
| Per Share |
$ | $ | $ | |||||||||
| Total |
$ | $ | $ | |||||||||
| (1) | We have also agreed to reimburse the underwriters for certain of their expenses in connection with this offering. See “Underwriting.” |
We have granted the underwriters an option to purchase up to an additional 1,500,000 shares of Class A Common Stock from us at the public offering price, less underwriting discounts, within 30 days of the date of this prospectus.
The shares of Class A Common Stock are expected to be ready for delivery on or about , 2018.
Neither the Securities and Exchange Commission nor any state securities commission has approved or disapproved of these securities or determined if this prospectus is truthful or complete. Any representation to the contrary is a criminal offense.
Citigroup
The date of this prospectus is , 2018
Table of Contents
Index to Financial Statements
| 1 | ||||
| 17 | ||||
| 50 | ||||
| 52 | ||||
| 53 | ||||
| 55 | ||||
| 56 | ||||
| MANAGEMENT’S DISCUSSION AND ANALYSIS OF FINANCIAL CONDITION AND RESULTS OF OPERATIONS |
58 | |||
| 89 | ||||
| 119 | ||||
| 126 | ||||
| 132 | ||||
| SECURITY OWNERSHIP OF CERTAIN BENEFICIAL OWNERS AND MANAGEMENT |
142 | |||
| 145 | ||||
| 150 | ||||
| 160 | ||||
| MATERIAL U.S. FEDERAL INCOME TAX CONSIDERATIONS FOR NON-U.S. HOLDERS |
162 | |||
| 166 | ||||
| 166 | ||||
| 166 | ||||
| F-1 |
You should rely only on the information contained in this prospectus and any free writing prospectus we may authorize to be delivered or made available to you relating to this offering. We have not, and the underwriters have not, authorized anyone to provide you with different or additional information. If anyone provides you with different or inconsistent information, you should not rely on it. We are not, and the underwriters are not, offering to sell, or seeking offers to buy, these securities in jurisdictions where offers and sales are not permitted. You should not assume that the information contained in this prospectus or any free writing prospectus relating to this offering is accurate as of any date other than its respective date. Our business, financial condition, results of operations and prospects may have changed since that date.
i
Table of Contents
Index to Financial Statements
This summary highlights certain information appearing elsewhere in this prospectus. This summary does not contain all of the information that you should consider before investing in our Class A Common Stock. For a more complete understanding of this offering, you should read the entire prospectus carefully, including the information presented under the sections entitled “Risk Factors” and “Cautionary Note Regarding Forward-Looking Statements” and the financial statements and related notes thereto.
Unless the context otherwise requires, references in this prospectus to (i) “Rosehill Resources,” “the Company,” “our company,” “we,” “our” and “us,” or like terms, refer to Rosehill Resources Inc. and its subsidiaries, including Rosehill Operating Company, LLC, and (ii) “Rosehill Operating” refer to Rosehill Operating Company, LLC, an entity of which we act as the sole managing member and of whose common units we currently own approximately 17.0% (or 32.9% assuming the conversion of our Series A preferred units in Rosehill Operating into common units in Rosehill Operating (the “Rosehill Operating Common Units”)). Pro forma for the completion of this offering, we expect to own approximately 35.1% of Rosehill Operating’s Common Units (or 45.2% assuming the conversion of our Series A preferred units in Rosehill Operating into Rosehill Operating Common Units).
Rosehill Operating is considered our accounting predecessor and, as such, the historical financial statements of Rosehill Operating are included elsewhere in this prospectus. The historical financial statements of KLR Energy Acquisition Corp. are not included in this prospectus, but were included in the definitive proxy statement filed with the Securities and Exchange Commission on April 12, 2017, as amended and supplemented. Unless the context otherwise requires, (i) prior to the completion of the Transaction (as defined below), references to “Rosehill Operating” refer to the assets, liabilities and operations of the business that were contributed to Rosehill Operating Company, LLC in connection with the Transaction and (ii) following the completion of the Transaction, references to “Rosehill Operating” refer to Rosehill Operating Company, LLC. Unless stated otherwise or the context otherwise requires, the information in this prospectus (i) assumes that the underwriters will not exercise their option to purchase additional shares of Class A Common Stock, (ii) does not include the future issuance of Class A Common Stock under the Rosehill Resources Inc. 2017 Long-Term Incentive Plan and (iii) does not include any shares of Class A Common Stock issuable upon conversion of our Series A Cumulative Perpetual Convertible Preferred Stock, par value $0.0001 per share (the “Series A Preferred Stock”), redemption of Rosehill Operating Common Units or upon exercise of our outstanding warrants.
Our Company
We are an independent oil and natural gas company focused on the acquisition, exploration, development, and production of unconventional oil and associated liquids-rich natural gas reserves in the Permian Basin. The Permian Basin is located in West Texas and Southeastern New Mexico and is comprised of three primary sub-basins: the Midland Basin, the Central Basin Platform and the Delaware Basin. Since the sale of our Barnett Shale assets during the fourth quarter of 2017, our assets are concentrated within the Delaware Basin, and we divide our operations into two core areas: the Northern Delaware Basin and the Southern Delaware Basin.
We were incorporated in Delaware on September 21, 2015 as a special purpose acquisition company under the name of KLR Energy Acquisition Corporation (“KLRE”) for the purpose of effecting a merger, asset acquisition, capital stock exchange, stock purchase, reorganization or similar business combination involving us and one or more businesses. On April 27, 2017, we acquired a portion of the equity of Rosehill Operating, an entity into which Tema Oil & Gas Company (“Tema”), a wholly owned subsidiary of Rosemore, Inc. (“Rosemore”), contributed certain assets and liabilities (the “Transaction”). At the closing of the Transaction, we became the sole managing member of Rosehill Operating and we changed our name to Rosehill Resources Inc.
1
Table of Contents
Index to Financial Statements
Our sole material asset is our interest in Rosehill Operating. As the sole managing member of Rosehill Operating, we, through our officers and directors, are responsible for all operational, management and administrative decisions relating to Rosehill Operating’s business without the approval of any other member, unless otherwise specified in the Second Amended and Restated Limited Liability Company Agreement of Rosehill Operating (the “Second Amended LLC Agreement”).
Our management team has significant experience identifying, acquiring and developing unconventional oil and natural gas assets with the objective of being a returns-oriented pure-play Delaware Basin company focusing on (i) acreage with reduced development risk as a result of being in proved areas within the vicinity of other successful wells, (ii) stacked pay zones, including Brushy Canyon, Avalon/1st Bone Spring, 2nd Bone Spring, 3rd Bone Spring, Upper Wolfcamp A (X/Y), Lower Wolfcamp A, and Wolfcamp B, and (iii) application of geology, optimizing well process improvements and well returns. We believe these characteristics enhance our horizontal production capabilities, recoveries and economic results.
Since 2012, we have drilled 46 horizontal wells in the Delaware Basin with a continuing drop in drilling times and an increase in operational capabilities and efficiencies. In late December 2017, our production exceeded 10,000 net barrels of oil equivalent per day, an increase of over 89% as compared to the daily average of the third quarter of 2017. We have assembled a multi-year inventory of horizontal development and exploration projects, including projects to further evaluate the regional extent and multi-pay potential of our assets. As of December 31, 2017, our portfolio included 41 gross operated producing horizontal wells and working interests in approximately 11,150 net acres in the Delaware Basin with an inventory of 530 gross operated and non-operated potential horizontal drilling locations.
We have identified 480 gross operated and 50 gross non-operated potential horizontal drilling locations, including 30 locations associated with proved undeveloped reserves as of December 31, 2017, in up to ten formations from Brushy Canyon down through the Wolfcamp B. As of December 31, 2017, 32 of our gross operated potential horizontal drilling locations in the Northern Delaware Basin were uneconomic using Securities and Exchange Commission (“SEC”) pricing assumptions. We believe that development drilling of our identified gross operated potential horizontal drilling locations, together with an increased focus on maximizing the value of existing assets by optimizing completions, reducing horizontal drilling costs, efficiently building out facilities, and reducing operating costs, will allow us to grow our production and reserves. We also intend to grow our production and reserves through acquisitions that meet certain strategic and financial objectives. As of December 31, 2017, our gross operated potential horizontal drilling locations are reflected in the table below:
| Gross Operated Potential Horizontal Drilling Locations (1)(2)(3)(4)(5) |
||||
| Target Formation |
||||
| Brushy Canyon |
33 | |||
| Upper Avalon |
10 | |||
| Lower Avalon / 1st Bone Spring |
45 | |||
| 2nd Bone Spring Shale |
19 | |||
| 2nd Bone Spring Sand |
61 | |||
| 3rd Bone Spring Shale |
19 | |||
| 3rd Bone Spring Sand |
50 | |||
| Upper Wolfcamp A (X/Y) |
70 | |||
| Lower Wolfcamp A |
80 | |||
| Wolfcamp B |
93 | |||
|
|
|
|||
| Total Horizontal Locations |
480 | |||
|
|
|
|||
2
Table of Contents
Index to Financial Statements
| (1) | Our estimated drilling locations are based on well spacing assumptions and the evaluation of our horizontal drilling results as well as results of other operators in the area, combined with our interpretation of available geologic and engineering data. In particular, we have analyzed and interpreted well results and other data acquired through our participation in the drilling of a vertical well that penetrated all of our targeted horizontal formations. In addition, to evaluate the prospects of our horizontal acreage, we have performed open-hole and mud log evaluations, core analysis, and drill cuttings analysis, and acquired and interpreted modern 3-D seismic data. |
| (2) | Our inventory of gross operated potential horizontal drilling locations assumes four to six wells per 640-acre section within each of the ten formations, with the number of prospective formations varying from tract to tract depending on the geology of the specific area. |
| (3) | Our identified gross operated potential horizontal drilling locations are located on operated and non-operated acreage. We operate approximately 91% of our 530 identified gross potential horizontal drilling locations. Of the 31 identified gross operated potential horizontal drilling locations associated with proved undeveloped reserves, 30 are operated and one is non-operated. As of December 31, 2017, we had an approximate 91% average working interest in our operated acreage. |
| (4) | Includes proved undeveloped (“PUD”) locations on our leasehold in the Northern Delaware Basin. |
| (5) | The drilling locations that we actually drill will depend on the availability of capital, regulatory approvals, seasonal restrictions, commodity prices, costs, actual drilling results and other factors. Any drilling activities we are able to conduct on these identified potential horizontal drilling locations may not be successful and may not result in our ability to add additional proved reserves to our existing proved reserves. Drilling for and producing oil and natural gas are high-risk activities with many uncertainties that could adversely affect our business, financial condition and results of operations. The identified gross potential horizontal drilling locations are scheduled out over many years, making them susceptible to uncertainties that could materially alter the occurrence or timing of their drilling. In addition, we may not be able to raise the capital that would be necessary to drill such locations. |
We expect to drill between 50 and 54 wells in 2018, completing between 42 and 46 wells. As of December 31, 2017, we had five drilled uncompleted wells (“DUCs”) and expect to exit 2018 with 12 to 16 DUCs. We expect our 2018 capital budget for drilling, completion and recompletion activities and facilities costs to be in the range of $350 to $375 million, excluding acreage acquisitions. We anticipate that 80-85% of our 2018 capital costs will be incurred in connection with drilling and completion activities.
Recent Events
White Wolf Acquisition
On December 8, 2017 (the “White Wolf Closing Date”), we acquired 4,565 net acres and other associated assets and interests in the Southern Delaware Basin (the “White Wolf Acquisition”) for approximately $77.6 million in cash, subject to customary purchase price adjustments, pursuant to a Purchase and Sale Agreement (the “PSA”) from certain sellers named therein (the “Sellers”). Subject to certain conditions under the PSA, until March 8, 2018, Rosehill Operating is obligated to acquire additional oil and natural gas leases located within a certain designated area in the Delaware Basin (the “Designated Area”) from the Sellers for additional consideration of up to $80 million in cash in the aggregate. Such additional oil and natural gas leases (subject to certain selection criteria set forth in the PSA) include all oil and natural gas leases owned by any Seller (or its affiliates) within the Designated Area as of October 24, 2017 (the “Execution Date”) but were not included in the initial 4,565 net acres acquired on the White Wolf Closing Date and any oil and natural gas lease acquired by any Seller (or its affiliates) during the period starting on the Execution Date and ending on March 8, 2018 (the “Additional Interests”). The conveyance of such Additional Interests will occur no later May 7, 2018.
3
Table of Contents
Index to Financial Statements
On the White Wolf Closing Date, we also secured financing for the transaction from certain private funds and accounts managed by EIG Global Energy Partners, LLC (collectively, “EIG”) through the issuance and sale (i) by us of 150,000 shares of 10.000% Series B Redeemable Preferred Stock, par value $0.0001 per share (the “Series B Preferred Stock”) for an aggregate purchase price of $150.0 million and (ii) by Rosehill Operating of $100.0 million in aggregate principal amount of 10.00% Senior Secured Second Lien Notes due January 31, 2023 (the “Second Lien Notes”). We have the option, subject to certain conditions, to issue and sell from time to time up to an additional 50,000 shares of Series B Preferred Stock for a purchase price of $1,000 per share of Series B Preferred Stock. Such option becomes exercisable by us on March 8, 2018, and terminates on December 8, 2018. For a discussion of our Series B Preferred Stock, please read “Description of Capital Stock.” For a discussion of the Second Lien Notes, please read “Management’s Discussion and Analysis of Financial Condition and Results of Operation—Capital Requirements and Sources of Liquidity—Second Lien Notes.”
The proceeds received from the issuance of the Series B Preferred Stock and the Second Lien Notes were used to fund the White Wolf Acquisition, to fully repay all amounts outstanding under our revolving credit facility, and to pay related financing costs. The remaining proceeds and any proceeds received from any future issuance of the additional 50,000 shares of Series B Preferred Stock, will be used to fund any portion of the Additional Interests and to fund capital development.
On December 21, 2017, we acquired from the Sellers certain mineral and royalty interests, two producing wells, and an additional 1,940 net acres in the Southern Delaware Basin for $39.0 million. These assets reduce the available Additional Interests in the Designated Area.
Barnett Shale Divestiture
As of December 31, 2016, we owned 4,468 net acres in the Barnett Shale in the Fort Worth Basin and operated 18 vertical and 21 horizontal wells on our Barnett Shale acreage. On November 2, 2017, we announced the closing of the sale of Barnett Shale assets for approximately $7.1 million, subject to customary purchase price adjustments, and received payment of $6.2 million from the buyer on October 31, 2017. At the time of sale, production from the Barnett Shale assets was approximately 675 net Boe per day.
Our Business Strategies
Our primary business objective is to increase stockholder value through the execution of the following strategies.
| • | Maximize returns by optimizing drilling and completion techniques and improving operational efficiency. Our experienced management and technical teams have a proven track record of optimizing drilling and completion techniques to drive well and field-level returns. We have experienced a significant decrease in our drilling time and increase in our operational capabilities and efficiencies. These trends have been driven in part by efficiency improvements in the field, including reduced drilling days, the modification of well designs and reduction or elimination of unnecessary costs, such as eliminating the use of snubbing units to install tubing into a live well, reducing the number of trips in and out of the wellbore during drilling by switching to a more engineered drill bit selection, and utilizing a third-party mud consultant to monitor the mud program and properties thereby reducing the chemical usage and improving the rate of penetration. We extensively employ pad drilling and sequential well completion, an approach we believe reduces drilling days and maximizes ultimate recovery of the reservoir by minimizing degradation in offset-well performance due to drops in pressure as resource is extracted subsurface. We have observed and integrated best practices from Delaware Basin operators on our acreage and have benefited from drilling efficiencies and enhanced completion techniques. |
| • | Grow production, cash flow and reserves by developing our extensive Delaware Basin drilling inventory. We intend to selectively develop our acreage base in an effort to maximize its value and |
4
Table of Contents
Index to Financial Statements
| resource potential. We will pursue drilling opportunities that offer competitive returns that we consider to be low risk based on production history and industry activity in the area and repeatable as a result of well-defined geological properties over a large area. Through the conversion of our resource base to developed reserves, we will seek to increase our reserves, production and cash flow while generating favorable returns on invested capital. Our proved reserves increased 135% from year-end 2016 to 31.1 MMBoe at December 31, 2017 and in late December 2017, our production exceeded 10,000 net barrels of oil equivalent per day, an increase of over 89% as compared to the daily average of the third quarter of 2017. We will continue to closely monitor operators throughout the basin, including those with active leases on adjoining properties, or offset operators, as they delineate acreage and zones, providing us further data to optimize our development plan over time. We believe this strategy will allow us to significantly grow our reserves, production and cash flow while efficiently allocating capital to maximize the value of our resource base. |
| • | Pursue additional leasing and strategic acquisitions. We intend to focus primarily on increasing our acreage position through leasing in the immediate vicinity of our existing Delaware Basin acreage, while selectively pursuing other acquisition opportunities that meet our strategic and financial objectives. Our acreage position extends through what we believe are multiple oil and natural gas producing stratigraphic horizons in the Delaware Basin, which we refer to as the stacked pay core, and we believe we can economically and efficiently add and integrate additional acreage into our current operations. Since 2012, we have grown our acreage position in the Delaware Basin from approximately 2,400 net acres to approximately 11,150 net acres. We have a proven history of acquiring leasehold positions in the Delaware Basin that have substantial oil-weighted resource potential, and believe our management team’s extensive experience operating in the Delaware Basin provides us with a competitive advantage in identifying leasing opportunities and acquisition targets and evaluating resource potential. |
| • | Maintain a high degree of operational control. We seek to maintain operational control of our properties in order to better execute on our strategy of enhancing returns through operating improvements and cost efficiencies. As the operator of approximately 95% of our acreage, we are able to effectively manage (i) the timing and level of our capital spending, (ii) our development drilling strategies and (iii) our operating costs. We believe this flexibility to manage our development program allows us to optimize our field-level returns and profitability. |
| • | Maintain a conservative financial position. We seek to maintain a conservative financial position. We expect to fund our growth with cash on hand, including proceeds received from the issuance of the Series B Preferred Stock and the Second Lien Notes, cash flow from operations, borrowings under our revolving credit facility, additional issuances of Series B Preferred Stock to EIG and by opportunistically accessing the capital markets. We intend to continue allocating capital in a disciplined manner and proactively managing our cost structure to achieve our business objectives. Consistent with our disciplined approach to financial management, we expect to maintain an active hedging program that seeks to reduce our exposure to commodity price volatility and to protect our cash flow and capital program. |
Our Competitive Strengths
We believe the following strengths will assist in the successful execution of our business strategies:
| • | Attractively positioned in the oil-rich Delaware Basin. We have accumulated a leasehold position of approximately 11,150 net acres in the Delaware Basin as of December 31, 2017. We believe the Delaware Basin is an attractive operating area due to its immense original oil-in-place, favorable operating environment, multiple proven horizontal reservoirs, high oil and liquids-rich natural gas content, well-developed network of oilfield service providers, long-lived reserves with relatively consistent reservoir quality and historically high drilling success rates. In addition to leveraging our technical expertise in this core area, our geographically concentrated acreage position allows us to capitalize on economies of scale |
5
Table of Contents
Index to Financial Statements
| with respect to drilling and production costs. Based on our drilling and production results to date and well-established offset operator activity in and around our project areas, we believe there are relatively low geologic risks and ample repeatable drilling opportunities across our core Delaware Basin operating area. |
| • | Leverage extensive industry experience and veteran leadership to optimize operations and to evaluate and execute strategic acquisitions. Our management and technical teams have an extensive track record of forming and building businesses in North American resource plays. Our management team has extensive engineering, geological, geophysical, technical and operational expertise in successfully developing and operating properties. As a result of our management’s operational expertise, we experienced an increase in our proved reserves of 135% from year-end 2016 to 31.1 MMBoe at December 31, 2017, and in late December 2017, our production exceeded 10,000 net barrels of oil equivalent per day, an increase of over 89% as compared to the daily average of the third quarter of 2017. Our management also has significant experience in successfully sourcing, evaluating and executing acquisition opportunities, including multiple privately sourced acquisitions that make up the majority of our current acreage position. We regularly initiate and review acquisition opportunities and intend to pursue future acquisitions that meet our strategic and financial objectives. We believe our understanding of the geology and reservoir properties of potential acquisition targets will allow us to identify and acquire highly prospective acreage in order to grow our resource base and maximize stockholder value. |
| • | Operating control over the majority of our asset portfolio and high working interests. Because we operate approximately 95% of our net acreage, the amount and timing of our capital expenditures are largely subject to our discretion. Our operated acreage provides us with flexibility to manage our drilling program and optimize our returns and profitability. As of December 31, 2017, our average working interest in our operated and non-operated wells in the Delaware Basin was approximately 91% and 16%, respectively. High working interests allow us to leverage our operational team more effectively and generate better returns. |
| • | Conservative capital structure. After giving effect to this offering and the application of the net proceeds therefrom (including any proceeds from the exercise of the underwriters’ option to purchase additional shares), we expect to have approximately $ million of available borrowing capacity under our revolving credit facility and $ million of cash on hand and access to up to $50 million through additional issuances of Series B Preferred Stock to EIG. We will continue to seek to maintain financial flexibility to allow us to actively pursue our drilling, development and exploration activities across our portfolio and maximize our ability to complete any incremental acquisition opportunities. |
Organizational Structure
We are a holding company whose sole material asset is our interest in Rosehill Operating. We are the managing member of Rosehill Operating and are responsible for all operational, management and administrative decisions relating to Rosehill Operating’s business. Tema owns 29,807,692 Rosehill Operating Common Units and a like number of shares of our Class B Common Stock. Each share of Class B Common Stock has no economic rights but entitles the holder to one vote on all matters to be voted on by our shareholders generally. Holders of our Class A Common Stock and Class B Common Stock vote together as a single class on all matters presented to our shareholders for their vote or approval, except as required by applicable law or by our certificate of incorporation.
The Second Amended LLC Agreement provides Tema with a redemption right, which entitles Tema to cause Rosehill Operating to redeem, from time to time, all or a portion of its Rosehill Operating Common Units (together with a corresponding number of shares of Class B Common Stock) for, at Rosehill Operating’s option, newly issued shares of Class A Common Stock on a one-for-one basis or an equivalent amount of cash. Alternatively, upon exercise of the redemption right, we (instead of Rosehill Operating) have the right (the “call
6
Table of Contents
Index to Financial Statements
right”) to, for administrative convenience, acquire each tendered Rosehill Operating Common Unit directly from Tema for Class A Common Stock or cash at our election.
In connection with the closing of the Transaction, we entered into a Tax Receivable Agreement with Tema. This agreement generally provides for the payment by us to Tema of 90% of the net cash savings, if any, in U.S. federal, state and local income tax and franchise tax that we actually realize or are deemed to realize in certain circumstances as a result of certain increases in the tax basis in the assets of Rosehill Operating and certain benefits attributable to imputed interest. We will retain the benefit of the remaining 10% of these cash savings.
Payments will generally be made under the Tax Receivable Agreement as we realize actual cash tax savings in periods after the Transaction from the tax benefits covered by the Tax Receivable Agreement. However, if the Tax Receivable Agreement terminates early, either at our election in connection with certain mergers or other changes of control or as a result of our breach of a material obligation thereunder, we could be required to make a substantial, immediate lump sum payment in advance of any actual cash tax savings. We will be dependent on Rosehill Operating to make distributions to us in an amount sufficient to cover our obligations under the Tax Receivable Agreement.
The following diagram illustrates our ownership structure immediately following this offering (assuming that the underwriters’ option to purchase additional shares is not exercised).
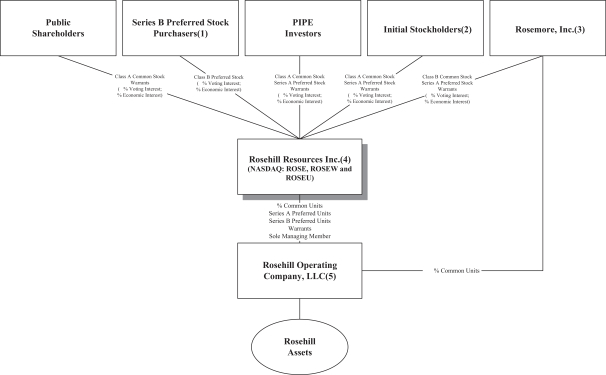
| (1) | “Series B Preferred Stock Purchasers” refers to certain private funds and accounts managed by EIG Global Energy Partners, LLC. |
| (2) | “Initial Stockholders” refers to KLR Energy Sponsor, LLC and certain of our current and former directors and officers. |
| (3) | Includes Class B Common Stock, Series A Preferred Stock and warrants held by Rosemore, and its direct and indirect wholly owned subsidiaries, including Tema. |
7
Table of Contents
Index to Financial Statements
| (4) | The economic and voting interests set forth above do not take into account (i) the exercise of outstanding warrants for shares of Class A Common Stock, (ii) the future issuance of shares of Class A Common Stock under the Rosehill Resources Inc. 2017 Long Term Incentive Plan or (iii) the conversion of Series A Preferred Stock or Class B Common Stock into shares of Class A Common Stock. |
| (5) | In connection with the conversion of our Series A Preferred Stock into Class A Common Stock, the Rosehill Operating Series A preferred units owned by us will convert into Rosehill Operating Common Units and, on an as-converted basis, we will own approximately % of the Rosehill Operating Common Units. |
Implication of Being an Emerging Growth Company
We qualify as an “emerging growth company” as defined in the JOBS Act. As an emerging growth company, we are allowed to take advantage of specified reduced disclosure and other requirements that are otherwise not applicable generally to public companies. These provisions include:
| • | Allowance to provide only two years of audited financial statements in addition to any required unaudited interim financial statements with correspondingly reduced “Management’s Discussion and Analysis of Financial Condition and Results of Operation” disclosure; |
| • | Reduced disclosure about our executive compensation arrangements; |
| • | No requirement for non-binding advisory votes on executive compensation or golden parachute arrangements; and |
| • | Exemption from the auditor attestation requirement in the assessment of our internal control over financial reporting. |
In addition, the JOBS Act also provides that an “emerging growth company” can take advantage of the extended transition period provided in Section 7(a)(2)(B) of the Securities Act of 1933 for complying with new or revised accounting standards. In other words, an “emerging growth company” can delay the adoption of certain accounting standards until those standards would otherwise apply to private companies. We have elected not to opt out of such extended transition period which means that when a standard is issued or revised and it has different application dates for public or private companies, we, as an emerging growth company, can adopt the new or revised standard at the time private companies adopt the new or revised standard.
We may take advantage of these provisions for up to five years or such earlier time that we are no longer an emerging growth company. We would cease to be an emerging growth company on the date that is the earliest of (i) the last day of the fiscal year in which we have total annual gross revenues of $1.07 billion or more (as adjusted for inflation pursuant to SEC rules from time to time); (ii) the last day of our fiscal year following the fifth anniversary of the date of the completion of our initial public offering; (iii) the date on which we have issued more than $1.0 billion in non-convertible debt during the previous three years; or (iv) the date on which we are deemed to be a large accelerated filer under rules of the SEC. We have taken advantage of reduced reporting requirements in this prospectus. Accordingly, the information contained herein may be different than the information you might receive from other public companies in which you have a beneficial ownership.
Principal Executive Offices and Internet Address
Our principal executive offices are located at 16200 Park Row, Suite 300, Houston, Texas 77084, and our telephone number at that address is (281) 675-3400.
Our website address is www.rosehillresources.com. We make our periodic reports and other information filed with or furnished to the SEC, available free of charge through our website as soon as reasonably practicable after those reports and other information are electronically filed with or furnished to the SEC. Information on our website or any other website is not incorporated by reference into, and does not constitute a part of, this prospectus.
8
Table of Contents
Index to Financial Statements
The Offering
| Issuer |
Rosehill Resources Inc. |
| Class A Common Stock offered by us |
10,000,000 shares (or 11,500,000) shares if the underwriters exercise their option to purchase additional shares). |
| Class A Common Stock outstanding after this |
16,116,635 shares (or 17,616,635 shares if the underwriters exercise their option to purchase additional shares). |
| Other equity securities outstanding after this |
29,807,692 shares of Class B Common Stock |
| 97,698 shares of 8.0% Series A Cumulative Perpetual Preferred Stock |
| 150,626 shares of 10.0% Series B Redeemable Preferred Stock |
| 25,594,158 warrants exercisable into shares of Class A Common Stock |
| For a discussion of our Class B Common Stock, Series A Preferred Stock, Series B Preferred Stock and warrants, please read “Description of Capital Stock.” |
| Use of proceeds |
We expect to receive approximately $ million of net proceeds from this offering, after deducting underwriting discounts and estimated offering expenses payable by us. We anticipate that we will contribute all of the net proceeds from this offering to Rosehill Operating in exchange for a number of Rosehill Operating Common Units equal to the number of shares of Class A Common Stock issued by us in this offering. |
| Rosehill Operating intends to use the net proceeds from this offering to finance its development plan and for general corporate purposes, including to fund potential future acquisitions. Please read “Use of Proceeds.” |
| Dividend policy |
We do not anticipate paying any cash dividends on our Class A Common Stock. Please read “Dividend Policy.” |
| Redemption right of Tema |
Under the Second Amended LLC Agreement, Tema has the right to cause Rosehill Operating to redeem, from time to time, all or a portion of its Rosehill Operating Common Units (together with a corresponding number of shares of Class B Common Stock) for, at Rosehill Operating’s option, (i) newly issued shares of Class A Common Stock on a one-for-one basis or (ii) an equivalent amount of cash. Alternatively, upon the exercise of the redemption right, we (instead of Rosehill Operating) have the right (the “call right”) to acquire each tendered Rosehill Operating Common Unit directly from |
9
Table of Contents
Index to Financial Statements
| Tema for Class A Common Stock or cash at our election. In connection with any redemption of Rosehill Operating Common Units pursuant to the redemption right or call right, the corresponding number of shares of Class B Common Stock will be cancelled. See “Certain Relationships and Related Party Transactions—Agreements Relating to the Transaction—Amended and Restated Limited Liability Company Agreement of Rosehill Operating.” |
| Tax Receivable Agreement |
In connection with the closing of the Transaction, we entered into a Tax Receivable Agreement with Tema which generally provides for the payment by us to Tema of 90% of the net cash savings, if any, in U.S. federal, state and local income tax that we actually realize or are deemed to realize in certain circumstances in periods after the closing of the Transaction as a result of certain tax basis increases and certain tax benefits attributable to imputed interest. We will retain the benefit of the remaining 10% of these cash savings. See “Risk Factors—Risks Related to the Class A Common Stock and Our Capital Structure” and “Certain Relationships and Related Party Transactions—Agreements Relating to the Transaction—Tax Receivable Agreement.” |
| Listing and trading symbol |
Our Class A Common Stock is quoted on the NASDAQ Capital Market under the symbol “ROSE.” |
| Risk factors |
You should carefully read and consider the information set forth under the heading “Risk Factors” and all other information set forth in this prospectus before deciding to invest in our Class A Common Stock. |
| (1) | The number of shares of Class A Common Stock does not include (i) the 7,791,602 shares of Class A Common Stock available for future issuance under the Rosehill Resources Inc. 2017 Long Term Incentive Plan or (ii) any shares of Class A Common Stock issuable upon conversion of Series A Preferred Stock, upon a redemption of Rosehill Operating Common Units (together with a corresponding number of shares of Class B Common Stock), or upon exercise of our outstanding warrants. The outstanding number of shares of Class A Common Stock and warrants exercisable into shares of Class A Common Stock include 14,179 outstanding units, each consisting of one share of Class A Common Stock and one warrant. |
10
Table of Contents
Index to Financial Statements
Summary Historical Financial Information
We have no direct operations and no significant assets other than our ownership interest in Rosehill Operating, an entity of which we act as the sole managing member and of whose Rosehill Operating Common Units we currently own approximately 17.0% (or 32.9% assuming the conversion of our Rosehill Operating Series A preferred units into Rosehill Operating Common Units). Pro forma for the completion of this offering, we expect to own approximately 35.1% of Rosehill Operating Common Units (or 45.2% assuming the conversion of our Series A preferred units in Rosehill Operating into Rosehill Operating Common Units). Rosehill Operating is considered our accounting predecessor. Unless the context otherwise requires, (i) prior to the completion of the Transaction, references to “Rosehill Operating” refer to the assets, liabilities and operations of the business that were contributed to Rosehill Operating Company, LLC in connection with the Transaction and (ii) following the completion of the Transaction, references to “Rosehill Operating” refer to Rosehill Operating Company, LLC.
The following table shows our and Rosehill Operating’s summary historical financial information, and certain pro forma financial information, for the periods indicated. The summary historical financial information of Rosehill Operating as of December 31, 2016 and 2015 and for the years ended December 31, 2016, 2015 and 2014 was derived from the audited carve-out historical financial statements of our predecessor included elsewhere in this prospectus. Our summary unaudited interim historical financial information as of and for the nine months ended September 30, 2017 and 2016 was derived from our unaudited interim historical condensed financial statements included elsewhere in this prospectus. The summary unaudited interim historical financial information has been prepared on a consistent basis with the audited financial statements. The results of operations for the interim periods are not necessarily indicative of the results that may be expected for the full year because of the impact of acquisitions, fluctuations in prices received from oil and natural gas, natural production declines, the uncertainty of exploration and development drilling results and other factors. In addition, because the historical information for the years ended December 31, 2016, 2015 and 2014 relates to periods prior to the completion of the Transaction and reflects 100% of Rosehill Operating’s financial results, such historical information may not be indicative of our results following the Transaction due in part to our 17% ownership interest in Rosehill Operating.
11
Table of Contents
Index to Financial Statements
The summary historical financial information should be read in conjunction with “Capitalization,” “Management’s Discussion and Analysis of Financial Condition and Results of Operations,” and the financial statements and accompanying notes included elsewhere in this prospectus.
| Nine Months Ended September 30, |
Year Ended December 31, | |||||||||||||||||||
| 2017 | 2016 | 2016 | 2015 | 2014 | ||||||||||||||||
| (Unaudited) | ||||||||||||||||||||
| Statement of Operations Data (in thousands): |
||||||||||||||||||||
| Revenues: |
||||||||||||||||||||
| Oil sales |
$ | 36,464 | $ | 16,437 | $ | 24,807 | $ | 20,601 | $ | 28,444 | ||||||||||
| Natural gas sales |
5,592 | 3,651 | 5,304 | 4,909 | 7,445 | |||||||||||||||
| Natural gas liquids sales |
5,405 | 3,115 | 4,534 | 3,977 | 7,674 | |||||||||||||||
|
|
|
|
|
|
|
|
|
|
|
|||||||||||
| Total revenues |
47,461 | 23,203 | 34,645 | 29,487 | 43,563 | |||||||||||||||
| Operating expenses: |
||||||||||||||||||||
| Lease operating expenses |
6,479 | 3,621 | 4,800 | 4,582 | 6,103 | |||||||||||||||
| Production taxes |
2,174 | 1,051 | 1,541 | 1,311 | 1,861 | |||||||||||||||
| Gathering and transportation expenses |
2,329 | 1,708 | 2,398 | 2,094 | 2,462 | |||||||||||||||
| Depreciation, depletion and amortization and accretion |
26,150 | 16,525 | 24,965 | 23,364 | 15,967 | |||||||||||||||
| Impairment of oil and natural gas properties |
— | — | — | 8,131 | 27,595 | |||||||||||||||
| Exploration costs |
1,208 | 496 | 794 | 960 | 960 | |||||||||||||||
| General and administrative expenses(1) |
11,356 | 3,480 | 9,000 | 4,234 | 5,151 | |||||||||||||||
| Gain on sale of oil and natural gas properties |
— | — | — | — | (6 | ) | ||||||||||||||
| (Gain) loss on sale of other assets |
(11 | ) | — | (50 | ) | 18 | (26 | ) | ||||||||||||
|
|
|
|
|
|
|
|
|
|
|
|||||||||||
| Total operating expenses |
49,685 | 26,881 | 43,448 | 44,694 | 60,067 | |||||||||||||||
|
|
|
|
|
|
|
|
|
|
|
|||||||||||
| Total operating income (loss) |
(2,224 | ) | (3,678 | ) | (8,803 | ) | (15,207 | ) | (16,504 | ) | ||||||||||
| Other income (expense) |
||||||||||||||||||||
| Interest expense, net |
(1,274 | ) | (2,256 | ) | (1,822 | ) | (3,247 | ) | (5,469 | ) | ||||||||||
| Gain (loss) on commodity derivative instruments(2) |
1,751 | (2,132 | ) | (4,169 | ) | 3,735 | 2,404 | |||||||||||||
| Other income (expense), net |
(105 | ) | 23 | (247 | ) | 7 | 316 | |||||||||||||
|
|
|
|
|
|
|
|
|
|
|
|||||||||||
| Total other expense |
372 | (4,365 | ) | (6,238 | ) | 495 | (2,749 | ) | ||||||||||||
|
|
|
|
|
|
|
|
|
|
|
|||||||||||
| Income (loss) before income taxes(3) |
(1,852 | ) | (8,043 | ) | (15,041 | ) | (14,712 | ) | (19,253 | ) | ||||||||||
| Income tax expense |
(650 | ) | 93 | 148 | 108 | — | ||||||||||||||
|
|
|
|
|
|
|
|
|
|
|
|||||||||||
| Net income (loss) |
(1,202 | ) | (8,136 | ) | (15,189 | ) | (14,820 | ) | (19,253 | ) | ||||||||||
| Net income (loss) attributable to noncontrolling interest |
(8,009 | ) | — | — | — | — | ||||||||||||||
|
|
|
|
|
|
|
|
|
|
|
|||||||||||
| Net income (loss) attributable to Rosehill Resources Inc. before preferred stock dividends |
6,807 | (8,136 | ) | (15,189 | ) | (14,820 | ) | (19,253 | ) | |||||||||||
| Preferred stock dividends |
10,014 | — | — | — | — | |||||||||||||||
|
|
|
|
|
|
|
|
|
|
|
|||||||||||
| Net income (loss) attributable to Rosehill Resources Inc. common stockholders |
$ | (3,207 | ) | $ | (8,136 | ) | $ | (15,189 | ) | $ | (14,820 | ) | $ | (19,253 | ) | |||||
|
|
|
|
|
|
|
|
|
|
|
|||||||||||
| Pro Forma Per Share Data (in thousands, except per share data)(4): |
||||||||||||||||||||
| Pro forma net income (loss) attributable to Rosehill Resources Inc. common stockholders |
$ | (2,778) | $ | (14,630) | ||||||||||||||||
| Pro forma earnings (loss) per share |
||||||||||||||||||||
| Basic |
$ | (0.47) | $ | (2.50) | ||||||||||||||||
| Diluted |
$ | (0.47) | $ | (2.50) | ||||||||||||||||
12
Table of Contents
Index to Financial Statements
| Nine Months Ended September 30, |
Year Ended December 31, | |||||||||||||||||||
| 2017 | 2016 | 2016 | 2015 | 2014 | ||||||||||||||||
| (Unaudited) | ||||||||||||||||||||
| Pro forma weighted average common shares outstanding |
||||||||||||||||||||
| Basic |
5,857 | 5,857 | ||||||||||||||||||
| Diluted |
5,857 | 5,857 | ||||||||||||||||||
| Cash Flow Data (in thousands): |
||||||||||||||||||||
| Net cash provided by operating activities |
$ | 35,527 | $ | 9,328 | $ | 11,461 | $ | 18,244 | $ | 25,525 | ||||||||||
| Net cash used in investing activities |
(100,333 | ) | (11,943 | ) | (22,164 | ) | (16,993 | ) | (53,392 | ) | ||||||||||
| Net cash provided by (used in) financing activities |
61,028 | (20,661 | ) | (8,597 | ) | 17,519 | 23,457 | |||||||||||||
| Other Financial Data (in thousands): |
||||||||||||||||||||
| Adjusted EBITDAX (unaudited)(5) |
$ | 23,972 | $ | 13,353 | $ | 15,041 | $ | 20,783 | $ | 27,388 | ||||||||||
| As of September 30, 2017 |
As of December 31, | |||||||||||||||
| 2016 | 2015 | 2014 | ||||||||||||||
| (Unaudited) | ||||||||||||||||
| Balance Sheet Data (in thousands): |
||||||||||||||||
| Cash and cash equivalents |
$ | 4,656 | $ | 8,434 | $ | 27,734 | $ | 8,964 | ||||||||
| Other current assets |
7,758 | 7,909 | 5,962 | 8,828 | ||||||||||||
|
|
|
|
|
|
|
|
|
|||||||||
| Total current assets |
12,414 | 16,343 | 33,696 | 17,792 | ||||||||||||
| Total property and equipment, net |
214,026 | 123,373 | 122,873 | 137,848 | ||||||||||||
| Other long—term assets, net |
1,365 | 110 | 334 | 251 | ||||||||||||
|
|
|
|
|
|
|
|
|
|||||||||
| Total assets |
$ | 227,805 | $ | 139,826 | $ | 156,903 | $ | 155,891 | ||||||||
|
|
|
|
|
|
|
|
|
|||||||||
| Current liabilities, other |
$ | 41,187 | $ | 14,223 | $ | 9,165 | $ | 11,549 | ||||||||
| Current portion, long term debt |
— | — | 20,000 | — | ||||||||||||
| Long term debt, net of current portion |
50,000 | 55,000 | 45,000 | 75,000 | ||||||||||||
| Note payable, related party |
— | — | — | 10,000 | ||||||||||||
| Other long-term liabilities |
5,727 | 5,383 | 3,761 | 3,164 | ||||||||||||
|
|
|
|
|
|
|
|
|
|||||||||
| Total liabilities |
96,914 | 74,606 | 77,926 | 99,713 | ||||||||||||
|
|
|
|
|
|
|
|
|
|||||||||
| Total stockholders’ equity / parent net investment |
130,891 | 65,220 | 78,977 | 56,178 | ||||||||||||
|
|
|
|
|
|
|
|
|
|||||||||
| Total liabilities and stockholders’ equity / parent net investment |
$ | 227,805 | $ | 139,826 | $ | 156,903 | $ | 155,891 | ||||||||
|
|
|
|
|
|
|
|
|
|||||||||
| (1) | Includes transaction expenses incurred in connection with the Transaction. |
| (2) | Gain (loss) on commodity derivative instruments was previously presented separately within Revenues for the years ended December 31, 2016, 2015 and 2014. |
| (3) | Rosehill Operating is treated as a partnership for U.S. federal income tax purposes and for purposes of certain state and local income taxes. Rosehill Operating is subject to the Texas margins tax at a rate of 0.75%. |
| (4) | We incurred non-recurring transaction costs that were directly attributable to the Transaction of $3.4 million and $2.6 million for the year ended December 31, 2016 and the nine months ended September 30, 2017, respectively. Had those costs been eliminated, pro forma net loss attributable to Rosehill Resources Inc. common stockholders would have been $(14,630) and $(2,778) for the year ended December 31, 2016 and the nine-months ended September 30, 2017, respectively. Pro forma basic and diluted earnings per share would have increased by $0.09 and $0.08 for the year ended December 31, 2016 and for the nine-months ended September 30, 2017, respectively. |
| (5) | Adjusted EBITDAX is a non-GAAP financial measure. For a definition of Adjusted EBITDAX and a reconciliation of net income to Adjusted EBITDAX, see “Non-GAAP Financial Measure” below. |
13
Table of Contents
Index to Financial Statements
Non-GAAP Financial Measure
Adjusted EBITDAX is a supplemental non-GAAP financial measure that is used by management and external users of our financial statements, such as industry analysts, investors, lenders and rating agencies. We define Adjusted EBITDAX as net income (loss) before interest expense, income taxes, DD&A, accretion and impairment of oil and natural gas properties, (gains) losses on commodity derivatives excluding net cash receipts (payments) on settled commodity derivatives, gains and losses from the sale of assets and other non-cash operating items. Adjusted EBITDAX is not a measure of net income as determined by United States generally accepted accounting principles (“U.S. GAAP”).
Management believes Adjusted EBITDAX is useful because it allows them to more effectively evaluate our operating performance and compare our results of operations from period to period and against our peers without regard to financing methods or capital structure. We exclude the items listed above from net income in arriving at Adjusted EBITDAX because these amounts can vary substantially from company to company within our industry depending upon accounting methods and book values of assets, capital structures and the method by which the assets were acquired. Adjusted EBITDAX should not be considered as an alternative to, or more meaningful than, net income as determined in accordance with U.S. GAAP or as an indicator of our operating performance or liquidity. Certain items excluded from Adjusted EBITDAX are significant components in understanding and assessing a company’s financial performance, such as a company’s cost of capital and tax structure, as well as the historic costs of depreciable assets, none of which are components of Adjusted EBITDAX. Our presentation of Adjusted EBITDAX should not be construed as an inference that its results will be unaffected by unusual or non-recurring items. Our computations of Adjusted EBITDAX may not be comparable to other similarly titled measures of other companies.
The following table presents an unaudited reconciliation of net loss, the most directly comparable financial measure calculated and presented in accordance with U.S. GAAP, to Adjusted EBITDAX.
| Nine Months Ended September 30, |
Year Ended December 31, | |||||||||||||||||||
| 2017 | 2016 | 2016 | 2015 | 2014 | ||||||||||||||||
| (unaudited) | ||||||||||||||||||||
| Reconciliation of net loss to Adjusted EBITDAX (in thousands): |
||||||||||||||||||||
| Net loss |
$ | (1,202 | ) | $ | (8,136 | ) | $ | (15,189 | ) | $ | (14,820 | ) | $ | (19,253 | ) | |||||
| Interest expense, net |
1,274 | 2,256 | 1,822 | 3,247 | 5,469 | |||||||||||||||
| Income tax expense (benefit) |
(650 | ) | 93 | 148 | 108 | — | ||||||||||||||
| Depreciation, depletion and amortization and accretion |
26,150 | 16,525 | 24,965 | 23,364 | 15,967 | |||||||||||||||
| Impairment of oil and natural gas properties |
— | — | — | 8,131 | 27,595 | |||||||||||||||
| Loss (gain) on commodity derivatives, net |
(1,751 | ) | 2,132 | 4,169 | (3,735 | ) | (2,404 | ) | ||||||||||||
| Net cash received (paid) in settlement of commodity derivatives |
162 | 483 | (824 | ) | 4,470 | 46 | ||||||||||||||
| Gain on sale of oil and natural gas properties |
— | — | — | — | (6 | ) | ||||||||||||||
| Loss (gain) on sale of other assets |
(11 | ) | — | (50 | ) | 18 | (26 | ) | ||||||||||||
|
|
|
|
|
|
|
|
|
|
|
|||||||||||
| Adjusted EBITDAX |
$ | 23,972 | $ | 13,353 | $ | 15,041 | $ | 20,783 | $ | 27,388 | ||||||||||
|
|
|
|
|
|
|
|
|
|
|
|||||||||||
14
Table of Contents
Index to Financial Statements
Summary Historical Reserve and Operating Data
The following tables present, for the periods and as of the dates indicated, summary data with respect to the estimated net proved oil and natural gas reserves and operating data for Rosehill Operating, an entity of which we act as sole managing member and of whose Rosehill Operating Common Units we currently own approximately 17.0% (or 32.9% assuming the conversion of our Rosehill Operating Series A preferred units into Rosehill Operating Common Units). Pro forma for the completion of this offering, we expect to own approximately 35.1% of Rosehill Operating Common Units (or 45.2% assuming the conversion of our Series A preferred units in Rosehill Operating into Rosehill Operating Common Units).
The reserve estimates attributable to the properties of Rosehill Operating as of December 31, 2017 and 2016 presented in the table are based on reserve reports prepared by Ryder Scott Company, L.P., our independent petroleum engineer. Copies of the reserve reports are attached as exhibits to the registration statement of which this prospectus forms a part. All of these reserve estimates were prepared in accordance with the SEC’s rules regarding oil and natural gas reserve reporting that are currently in effect. The following tables also contain summary unaudited information regarding production and sales of oil, natural gas and natural gas liquids (“NGLs”) with respect to such properties.
See the sections entitled “Management’s Discussion and Analysis of Financial Condition and Results of Operations” and “Description of Business—Oil and Natural Gas Data” in evaluating the material presented below.
| As of December 31, 2017(1) |
As of December 31, 2016(2) |
|||||||
| Proved Reserves: |
||||||||
| Oil (MBbls) |
18,436 | 7,356 | ||||||
| Natural gas (MMcf) |
39,316 | 17,355 | ||||||
| NGL (MBbls) |
6,143 | 2,985 | ||||||
|
|
|
|
|
|||||
| Total proved reserves (MBoe) |
31,132 | 13,234 | ||||||
|
|
|
|
|
|||||
| Proved Developed Reserves: |
||||||||
| Oil (MBbls) |
8,814 | 3,068 | ||||||
| Natural gas (MMcf) |
14,171 | 10,574 | ||||||
| NGL (MBbls) |
2,286 | 1,802 | ||||||
|
|
|
|
|
|||||
| Total proved developed reserves (MBoe) |
13,461 | 6,632 | ||||||
|
|
|
|
|
|||||
| Proved developed reserves as a percentage of total proved reserves |
43 | % | 50 | % | ||||
| Proved Undeveloped Reserves: |
||||||||
| Oil (MBbls) |
9,622 | 4,288 | ||||||
| Natural gas (MMcf) |
25,145 | 6,781 | ||||||
| NGL (MBbls) |
3,857 | 1,183 | ||||||
|
|
|
|
|
|||||
| Total proved undeveloped reserves (MBoe) |
17,670 | 6,601 | ||||||
|
|
|
|
|
|||||
| Oil and Natural Gas Prices: |
||||||||
| Oil—per Bbl |
$ | 51.34 | 42.75 | |||||
| Natural gas—per MMBtu |
$ | 2.98 | 2.49 | |||||
| NGL—per Bbl |
$ | 31.82 | 11.73 | |||||
| (1) | Estimated net proved reserves were determined using average first-day-of-the-month prices for the prior twelve months in accordance with SEC guidance. For oil volumes, the average West Texas Intermediate |
15
Table of Contents
Index to Financial Statements
| posted price of $51.34 per barrel as of December 31, 2017 was adjusted for quality, transportation fees and a regional price differential. For natural gas volumes, the average Henry Hub spot price of $2.98 per MMBtu as of December 31, 2017 was adjusted for energy content, transportation fees and a regional price differential. For December 31, 2017, NGLs were priced off of Mont Belvieu pricing, as adjusted, and not as a percentage of West Texas Intermediate. All prices are held constant throughout the lives of the properties. The average adjusted product prices weighted by production over the remaining lives of the properties were $46.67 per barrel of oil, $2.99 per Mcf of natural gas, and $21.09 per barrel of NGL, in each case as of December 31, 2017. |
| (2) | Estimated net proved reserves were determined using average first-day-of-the-month prices for the prior twelve months in accordance with SEC guidance. For oil volumes, the average West Texas Intermediate posted price of $42.75 per barrel, as of December 31, 2016 was adjusted for quality, transportation fees and a regional price differential. For natural gas volumes, the average Henry Hub spot price of $2.49 per MMBtu as of December 31, 2016 was adjusted for energy content, transportation fees and a regional price differential. For NGL volumes, 27.5% of the average West Texas Intermediate posted price of $42.75 per barrel, or $11.73, as of December 31, 2016 was adjusted for quality, transportation fees and a regional price differential. All prices are held constant throughout the lives of the properties. The average adjusted product prices weighted by production over the remaining lives of the properties were $39.20 per barrel of oil, $9.44 per barrel of NGL, and $2.54 per Mcf of natural gas, in each case as of December 31, 2016. |
| Nine Months Ended September 30, |
Year Ended December 31, |
|||||||||||||||
| 2017 | 2016 | 2016 | 2015 | |||||||||||||
| Production and Operating Data: |
||||||||||||||||
| Net Production Volumes(1): |
||||||||||||||||
| Oil (MBbls) |
794 | 429 | 612 | 472 | ||||||||||||
| Natural gas (MMcf) |
2,089 | 1,796 | 2,381 | 2,074 | ||||||||||||
| NGLs (MBbls) |
312 | 275 | 358 | 312 | ||||||||||||
|
|
|
|
|
|
|
|
|
|||||||||
| Total (MBoe) |
1,454 | 1,003 | 1,367 | 1,130 | ||||||||||||
|
|
|
|
|
|
|
|
|
|||||||||
| Average net daily production (Boe/d) |
5,327 | 3,662 | 3,734 | 3,096 | ||||||||||||
| Average Realized Prices: |
||||||||||||||||
| Oil (per Bbl) (before the effects of cash settled commodity derivatives) |
$ | 45.92 | $ | 38.31 | $ | 40.52 | $ | 43.62 | ||||||||
| Natural gas (per Mcf) (before the effects of cash settled commodity derivatives) |
2.68 | 2.03 | 2.23 | 2.37 | ||||||||||||
| NGLs (per Bbl) (before the effects of cash settled commodity derivatives) |
17.32 | 11.33 | 12.68 | 12.75 | ||||||||||||
|
|
|
|
|
|
|
|
|
|||||||||
| Total (per Boe) (before the effects of cash settled commodity derivatives) |
$ | 32.64 | $ | 23.13 | $ | 25.35 | $ | 26.09 | ||||||||
|
|
|
|
|
|
|
|
|
|||||||||
| Total (per Boe) (after the effects of cash settled commodity derivatives) |
$ | 32.75 | $ | 23.62 | $ | 22.30 | $ | 29.40 | ||||||||
|
|
|
|
|
|
|
|
|
|||||||||
| Average Unit Costs per Boe: |
||||||||||||||||
| Lease operating expense |
$ | 4.46 | $ | 3.61 | $ | 3.51 | $ | 4.06 | ||||||||
| Production taxes |
1.50 | 1.05 | 1.13 | 1.16 | ||||||||||||
| Gathering and transportation expense |
1.60 | 1.70 | 1.75 | 1.85 | ||||||||||||
| Depreciation, depletion and amortization and accretion |
17.98 | 16.48 | 18.14 | 20.57 | ||||||||||||
| Impairment of oil and natural gas properties |
— | — | — | 7.20 | ||||||||||||
| Exploration costs |
0.83 | 0.49 | 0.58 | 0.85 | ||||||||||||
| General and administrative expense |
7.81 | 3.47 | 6.58 | 3.75 | ||||||||||||
| (1) | Totals may not sum due to rounding. |
16
Table of Contents
Index to Financial Statements
An investment in the Class A Common Stock involves a high degree of risk. In addition to the other information included in this prospectus, you should carefully consider each of the risk factors set forth in any applicable prospectus supplement. Any of these risks and uncertainties could have a material adverse effect on our business, financial condition, cash flows and results of operations. If that occurs, the trading price of the Class A Common Stock could decline materially and you could lose all or part of your investment.
The risks included in this prospectus are not the only risks we face. We may experience additional risks and uncertainties not currently known to us, or as a result of developments occurring in the future. Conditions that we currently deem to be immaterial may also materially and adversely affect our business, financial condition, cash flows and results of operations.
Risks Related to the White Wolf Acquisition
We may fail to realize the benefits anticipated from the White Wolf Acquisition.
The acreage and other associated assets and interests recently acquired in the White Wolf Acquisition involve potential risks, including, without limitation, inefficiencies and unexpected costs and liabilities. We may be unable to successfully integrate the acquired properties or to realize anticipated revenues or other benefits of the White Wolf Acquisition. Our ability to achieve the anticipated benefits of the White Wolf Acquisition will depend in part upon whether we can integrate the acquired properties into our existing business in an efficient and effective manner. We may not be able to accomplish this integration process successfully. If these risks or other expected costs and liabilities were to materialize, any desired benefits of the White Wolf Acquisition may not be fully realized, if at all, and our future financial performance and results of operations could be negatively impacted.
If the benefits of the White Wolf Acquisition do not meet the expectations of the marketplace, or financial or industry analysts, the market price of our Class A Common Stock may decline.
The market price of our Class A Common Stock may decline as a result of the White Wolf Acquisition if the acquired assets do not perform as expected, or we do not otherwise achieve the perceived benefits of the White Wolf Acquisition as rapidly as, or to the extent, anticipated by the marketplace, or financial or industry analysts. Our assessment of the White Wolf Acquisition properties to date has been limited and does not reveal all existing or potential problems, nor will it permit us to become familiar enough with the properties to assess fully their capabilities and deficiencies. Although we will inspect the acquired properties, inspections may not reveal all title, structural or environmental problems. We may be required to assume the risk of the physical condition of the properties in addition to the risk that the properties may not perform in accordance with our expectations.
The market price of our Class A Common Stock may decline as a result of the White Wolf Acquisition if, among other things, the integration and development of the acquired properties is unsuccessful or if the expenses, title, environmental and other defects, or transaction costs related to the White Wolf Acquisition are greater than expected or the acquired properties do not yield the anticipated returns. Accordingly, investors may experience a loss from a decreasing stock price and we may not be able to raise future capital, if necessary, in the equity markets.
Risks Related to Our Operations
Oil, natural gas and NGL prices are volatile. A reduction or sustained decline in oil, natural gas and NGL prices could adversely affect our business, financial condition and results of operations and our ability to meet our capital expenditure obligations and financial commitments.
Our revenues, profitability, cash flows and future growth, as well as liquidity and ability to access additional sources of capital, depends substantially on prevailing prices for oil, natural gas, and NGLs. A reduction in or
17
Table of Contents
Index to Financial Statements
sustained lower prices will reduce the amount of oil, natural gas, and NGLs that we can economically produce and may result in impairments of our proved reserves or reduction of our proved undeveloped reserves. Oil, natural gas, and NGL prices also affect the amount of cash flow available for capital expenditures and ability to borrow and raise additional capital.
The markets for oil, natural gas, and NGLs have historically been volatile. For example, since 2014, the WTI spot price for oil declined from a high of $107.95 per barrel in June 2014 to a low of $26.19 per barrel in February 2016, and the NYMEX Henry Hub spot price for natural gas declined from a high of $8.15 per MMBtu in February 2014 to a low of $1.49 per MMBtu in March 2016. Likewise, NGLs, which are made up of ethane, propane, isobutane, normal butane and natural gasoline, each of which have different uses and different pricing characteristics, have suffered significant recent declines in realized prices.
The market prices for oil, natural gas, and NGLs depend on factors beyond our control. Some, but not all, of the factors that can cause fluctuation include:
| • | worldwide and regional economic conditions impacting the global supply and demand for oil, natural gas, and NGLs; |
| • | the price and quantity of foreign imports of oil, natural gas, and NGLs; |
| • | political and economic conditions in, or affecting, other producing regions or countries, including the Middle East, Africa, South America, and Russia; |
| • | actions of the Organization of the Petroleum Exporting Countries (“OPEC”), its members and other state—controlled oil companies, including the ability of members of OPEC to agree to and maintain price and production controls; |
| • | the level of global exploration, development and production; |
| • | the level of global inventories; |
| • | the extent to which U.S. shale producers become “swing producers” adding or subtracting to the world supply; |
| • | prevailing prices on local price indexes in the area in which we operate; |
| • | the proximity, capacity, cost and availability of gathering and transportation facilities; |
| • | localized and global supply and demand fundamentals and transportation availability; |
| • | the cost of exploring for, developing, producing and transporting reserves; |
| • | weather conditions, other natural disasters, and climate change; |
| • | technological advances affecting energy consumption; |
| • | the price and availability of alternative fuels; |
| • | worldwide conservation measures; |
| • | domestic and foreign governmental relations, regulation, and taxes; |
| • | worldwide governmental regulation and taxes; |
| • | U.S. and foreign trade restrictions, regulations, tariffs, agreements, and treaties; |
| • | the level and effect of trading in commodity futures markets, including commodity price speculators and others; and |
| • | political conditions or hostilities and unrest in oil producing regions. |
Lower commodity prices will reduce our cash flows and borrowing ability. We may be unable to obtain needed capital or financing on satisfactory terms, which could lead to a decline in the present value of our
18
Table of Contents
Index to Financial Statements
reserves and our ability to develop future reserves. Lower commodity prices may also reduce the amount of oil, natural gas and NGLs that we can produce economically and may impact our ability to satisfy our obligations under firm-commitment transportation agreements. We have historically been able to hedge our natural gas production at prices that are significantly higher than current strip prices. However, in the current commodity price environment, our ability to enter into comparable derivative arrangements may be limited.
Using lower prices in estimating proved reserves would likely result in a reduction in proved reserve volumes due to economic limits. While it is difficult to project future economic conditions and whether such conditions will result in impairment of proved property costs, we consider several variables including specific market factors and circumstances at the time of prospective impairment reviews, and the continuing evaluation of development plans, production data, economics and other factors. In addition, sustained periods with oil and natural gas prices at levels lower than current strip prices and the resultant effect such prices may have on our drilling economics and our ability to raise capital may require us to re-evaluate and postpone or eliminate our development drilling, which could result in the reduction of some of our proved undeveloped reserves. If we are required to curtail our drilling program, we may be unable to continue to hold leases that are scheduled to expire, which may further reduce our reserves. As a result, a substantial or extended decline in commodity prices may materially and adversely affect our future business, financial condition, results of operations, liquidity or ability to finance planned capital expenditures.
Our development and acquisition projects require substantial capital expenditures. We may be unable to obtain required capital or financing on satisfactory terms, which could lead to a decline in our ability to access or grow production and reserves.
The oil and natural gas industry is capital-intensive. We make substantial capital expenditures related to development and acquisition projects. We expect to fund our capital expenditures with cash generated by operations, borrowings under the credit agreement, dated April 27, 2017 (the “Credit Agreement”), by and among Rosehill Operating and PNC Bank, National Association, as administrative agent and issuing bank, and each of the lenders from time to time party thereto and through additional issuances of Series B Preferred Stock to EIG; however, financing needs may require an alteration or increase in our capitalization substantially through the issuance of debt or equity or the sale of assets. The issuance of additional indebtedness would require that a portion of the cash flow from our operations be used for the payment of interest and principal on our indebtedness, thereby reducing our ability to use cash flow from operations to fund working capital, capital expenditures and acquisitions. The issuance of additional equity securities by us would be dilutive to stockholders. The actual amount and timing of our future capital expenditures may differ materially from our estimates as a result of, among other things: oil, natural gas and NGL prices; actual drilling results; the availability and cost of drilling rigs and other services and equipment; and regulatory, technological and competitive developments. A reduction in commodity prices from current levels may result in a decrease in our actual capital expenditures, which would negatively impact our ability to grow production.
Our cash flow from operations and access to capital are subject to a number of variables, including:
| • | the prices at which our production is sold; |
| • | our proved reserves; |
| • | the volume of hydrocarbons we are able to produce from existing wells; |
| • | our ability to acquire, locate and produce new reserves; |
| • | the levels of our operating expenses; |
| • | our ability to borrow under our Credit Agreement (or any replacement credit facility); and |
| • | our ability to access the capital markets. |
If cash flow from operations or available borrowings under our Credit Agreement decrease as a result of lower oil, natural gas and NGL prices, operational difficulties, declines in reserves or for any other reason, we
19
Table of Contents
Index to Financial Statements
may have limited ability to obtain the capital necessary to sustain operations at current levels. If additional capital is needed, we may not be able to obtain debt or equity financing on acceptable terms, if at all. If cash flow from operations or available under existing or anticipated credit facilities are insufficient to meet our capital requirements, the failure to obtain additional financing could result in a curtailment of the development of our properties, which in turn could lead to a decline in our reserves and production and could materially and adversely affect our business, financial condition and results of operations.
Drilling for oil and gas involves numerous and significant risks and uncertainties.
Risks that we face while drilling wells include:
| • | effects of weather, floods, snowstorms, ice storms, and similar natural conditions, on the drilling location and delivery of materials to the wellsite; |
| • | unforeseen water flows; |
| • | lost circulation of drilling fluids; |
| • | unexpected oil and gas flows into the wellbore; |
| • | drill pipe, casing and equipment failure, or loss of equipment in the well; |
| • | failure or inaccuracies of directional drilling measurement devices; |
| • | excessive hole washouts in the salt/anhydrite zones resulting in poor surface cement jobs; |
| • | inability to reach the desired drilling zone with conventional bits and drilling techniques; |
| • | failure to land a wellbore in the desired drilling zone; |
| • | inability to stay in the desired drilling zone or being able to run tools and other equipment consistently while drilling horizontally through the formation; |
| • | difficulties in running casing the entire length of the wellbore. |
Risks that we face while completing wells include:
| • | the ability to fracture stimulate the planned number of stages; |
| • | the ability to run tools the entire length of the wellbore during completion operations; and |
| • | the ability to successfully clean out the wellbore after completion of the final fracture stimulation stage. |
In addition, certain of the new techniques we are adopting may cause irregularities or interruptions in production due to offset wells being shut in and the time required to drill and complete multiple wells before any such wells begin producing. Furthermore, the results of our drilling in new or emerging formations are more uncertain initially than drilling results in areas that are more developed and have a longer history of established production. Newer or emerging formations and areas have limited or no production history and, consequently, we are more limited in assessing future drilling results in these areas. If our drilling results are less than anticipated, the return on our investment for a particular project may not be as attractive as anticipated, and we could incur material write-downs of unevaluated properties and a decline in the value of our undeveloped acreage.
Drilling for and producing oil and natural gas are high risk activities with many uncertainties that could adversely affect our business, financial condition or results of operations.
Our future financial condition and results of operations will depend on the success of our development, acquisition and production activities, which are subject to numerous risks beyond our control, including the risk that drilling will not result in commercially viable oil and natural gas production.
20
Table of Contents
Index to Financial Statements
Our decisions to develop or purchase prospects or properties will depend in part on the evaluation of data obtained through geophysical and geological analyses, production data and engineering studies, the results of which are often inconclusive or subject to varying interpretations. For a discussion of the uncertainty involved in these processes, see “Reserve estimates depend on many assumptions that may turn out to be inaccurate. Any material inaccuracies in reserve estimates or underlying assumptions will materially affect the quantities and present value of our reserves” below. In addition, our cost of drilling, completing and operating wells is often uncertain.
Many factors may curtail, delay or cancel our scheduled drilling projects, including the following:
| • | delays imposed by or resulting from compliance with regulatory requirements, including limitations resulting from wastewater disposal, emissions of greenhouse gases (“GHGs”) and limitations on hydraulic fracturing; |
| • | pressure or irregularities in geological formations; |
| • | shortages of or delays in obtaining equipment and qualified personnel or in obtaining water for hydraulic fracturing activities; |
| • | equipment failures, accidents or other unexpected operational events; |
| • | lack of available gathering facilities or delays in construction of gathering facilities; |
| • | lack of available capacity on interconnecting transmission pipelines; |
| • | adverse weather conditions, including such conditions which are possibly connected to climate change; |
| • | drought conditions limiting the availability of water for hydraulic fracturing, including such conditions as possibly connected to climate change; |
| • | issues related to compliance with environmental regulations, including protections for threatened or endangered species; |
| • | environmental hazards, such as oil and natural gas leaks, oil spills, pipeline and tank ruptures and unauthorized discharges of brine, well stimulation and completion fluids, toxic gases or other pollutants into the surface and subsurface environment; |
| • | declines in oil and natural gas prices; |
| • | limited availability of financing at acceptable terms; |
| • | title problems; and |
| • | limitations in the market for oil and natural gas. |
Our derivative activities could result in financial losses or could reduce our earnings.
A portion of our oil and natural gas production has historically been hedged in order to protect cash flow from falling prices. The use of these arrangements limits our ability to benefit from increases in the prices of natural gas and oil. As of December 31, 2017, we had entered into commodity derivative contracts for the contract months of January 2018 through December 2022 covering a total of 5,624 MBbls of oil and 9,900 MMcf of natural gas. At the closing of the Transaction, all crude oil options and natural gas options were settled, and all crude oil and natural gas swaps were transferred to us. Accordingly, our earnings may fluctuate significantly as a result of changes in fair value of our commodity derivative.
Commodity derivatives may also expose us to the risk of financial loss in some circumstances, including when:
| • | production and sales are insufficient to offset losses under the commodity derivatives; |
21
Table of Contents
Index to Financial Statements
| • | the counterparty to the commodity derivatives defaults on its contractual obligations; |
| • | there is an increase in the differential between the underlying price in the commodity derivatives and actual prices received; |
| • | issues arise with regard to legal enforceability of such instruments; or |
| • | applicable laws or regulations regarding such instruments are changed. |
The use of commodity derivatives may, in some cases, require the posting of cash collateral with counterparties. If we enter into commodity derivatives that require cash collateral, particularly if commodity prices or interest rates change in a manner averse to us, our cash otherwise available for use in our operations would be reduced, which could limit our ability to make future capital expenditures and make payments on our indebtedness, and which could also limit the size of our borrowing base. Future collateral requirements will depend on arrangements with counterparties, highly volatile oil and natural gas prices and interest rates. In addition, commodity derivatives could limit the benefit we would receive from increases in the prices for oil and natural gas, which could also have a material adverse effect on our financial condition.
Our commodity derivative contracts expose us to risk of financial loss if a counterparty fails to perform under a contract. Disruptions in the financial markets could lead to sudden decreases in a counterparty’s liquidity, which could make the counterparty unable to perform under the terms of the contract, and we may not be able to realize the benefit of the contract. We are unable to predict sudden changes in a counterparty’s creditworthiness or ability to perform. Even if we accurately predict sudden changes, our ability to negate the risk may be limited depending upon market conditions.
During periods of declining commodity prices, our commodity derivative contract receivable positions have generally increased, which has increased our counterparty credit exposure. If the creditworthiness of our counterparties deteriorates and results in their nonperformance, we could incur a significant loss with respect to our commodity derivative contracts.
Reserve estimates depend on many assumptions that may turn out to be inaccurate. Any material inaccuracies in reserve estimates or underlying assumptions will materially affect the quantities and present value of our reserves.
The process of estimating oil and natural gas reserves is complex. It requires interpretations of available technical data and many assumptions, including assumptions relating to current and future economic conditions and commodity prices. Any significant inaccuracies in these interpretations or assumptions could materially affect the estimated quantities and present value of our reserves. In order to prepare reserve estimates, we must project production rates and timing of development expenditures. We must also analyze available geological, geophysical, production and engineering data. The extent, quality and reliability of this data can vary. The process also requires economic assumptions about matters such as oil and natural gas prices, drilling and operating expenses, capital expenditures, taxes and availability of funds.
Actual future production, oil and natural gas prices, revenues, taxes, development expenditures, operating expenses and quantities of recoverable oil and natural gas reserves may vary from our estimates. For instance, initial production rates reported by us or other operators may not be indicative of future or long-term production rates, our recovery efficiencies may be worse than expected, and production declines may be greater than our estimates and may be more rapid and irregular when compared to initial production rates. In addition, we may adjust reserve estimates to reflect additional production history, results of development activities, current commodity prices and other existing factors. Any significant variance could materially affect the estimated quantities and present value of our reserves.
You should not assume that the present value of future net revenues from our estimated reserves is the current market value of such reserves. We generally base the estimated discounted future net cash flows from
22
Table of Contents
Index to Financial Statements
reserves on prices and costs on the date of the estimate. Actual future prices and costs may differ materially from those used in the present value estimate. For example, our estimated proved reserves as of December 31, 2017 were, and related standardized measure will be, calculated under SEC rules using twelve-month trailing average benchmark prices of $51.34 per barrel of oil (WTI), $31.82 per barrel of NGL (Mont Belvieu), and $2.98 per MMBtu of natural gas (Henry Hub) which, for certain periods in 2017, were substantially higher than the available spot prices. If spot prices are below such calculated amounts, using more recent prices in estimating proved reserves may result in a reduction in proved reserve volumes due to economic limits.
Our identified drilling locations are scheduled out over many years, making them susceptible to uncertainties that could materially alter the occurrence or timing of our drilling. In addition, we may not be able to raise the substantial amount of capital that would be necessary to drill such locations.
We have specifically identified and scheduled certain drilling locations as an estimation of our future multi-year drilling activities on our existing acreage. These drilling locations represent a significant part of our growth strategy. Our ability to drill and develop these locations depends on a number of uncertainties, including oil and natural gas prices, the availability and cost of capital, drilling and production costs, availability of drilling services and equipment, drilling results, lease expirations, gathering system and pipeline transportation constraints, access to and availability of water sourcing and distribution systems, regulatory approvals and other factors. Because of these uncertain factors, we do not know if the potential drilling locations our management has identified will ever be drilled or if we will be able to produce oil or natural gas in commercial qualities from these or any other drilling locations. In addition, unless production is established within the spacing units covering the undeveloped acres on which some of the drilling locations are obtained, the leases for such acreage will expire. As such, our actual drilling activities may materially differ from those presently identified.
As of December 31, 2017, 480 gross operated potential horizontal drilling locations, which includes 30 locations associated with proved undeveloped reserves as of December 31, 2017, have been identified on our acreage based on four to six wells per 640-acre section within each of ten formations from the Brushy Canyon through Wolfcamp B formations. As of December 31, 2017, 189 of our Northern Delaware Basin gross operated potential horizontal drilling locations were economic using SEC pricing assumptions. Horizontal lateral effective lengths across our acreage range from 4,000 feet up to 10,000 feet. As a result of the limitations described above, we may be unable to drill many of the identified locations. Further, in connection with the White Wolf Acquisition, we acquired approximately 9,100 net acres in northwestern Pecos County, Texas, which is largely unproven and relatively undrilled compared to other areas in the Delaware Basin. We have no experience drilling in Pecos County. Based on future operations or regulatory changes, we may determine that certain formations cannot be physically or economically exploited or that spacing of wells may have to be changed.
In addition, we will require significant additional capital over a prolonged period in order to pursue the development of these locations, and we may not be able to raise or generate the capital required to do so. See “—Our development and acquisition projects require substantial capital expenditures. We may be unable to obtain required capital or financing on satisfactory terms, which could lead to a decline in our ability to access or grow production and reserves” above. Any drilling activities we are able to conduct on these locations may not be successful or result in our ability to add additional proved reserves to our overall proved reserves or may result in a downward revision of our estimated proved reserves, which could have a material adverse effect on our future business and results of operations. Additionally, if we curtail our drilling program, we may lose a portion of our acreage through lease expirations.
Certain of our undeveloped leasehold acreage is subject to leases that will expire over the next several years unless production is established on units containing the acreage, the primary term is extended through continuous drilling provisions or the leases are renewed.
As of December 31, 2017, approximately 54% of our total net acreage was either held by production or under continuous drilling provisions. The leases for our net acreage not held by production will expire at the end
23
Table of Contents
Index to Financial Statements
of their primary term unless production is established in paying quantities under the units containing these leases, the leases are held beyond their primary terms under continuous drilling provisions or the leases are renewed. If our leases expire and we are unable to renew the leases, we will lose the right to develop the related properties. Our ability to drill and develop these locations depends on a number of uncertainties, including oil and natural gas prices, the availability and cost of capital, drilling and production costs, availability of drilling services and equipment, drilling results, lease expirations, gathering system and pipeline transportation constraints, access to and availability of water sourcing and distribution systems, regulatory approvals and other factors.
Our operations are substantially dependent on the availability of water. Restrictions on our ability to obtain water may have an adverse effect on our financial condition, results of operations and cash flows.
Water is an essential component of deep shale oil and natural gas drilling and hydraulic fracturing processes. Drought conditions have persisted in Texas in past years. These drought conditions have led governmental authorities to restrict the use of water subject to their jurisdiction for hydraulic fracturing to protect local water supplies. If we are unable to obtain water to use in our operations, we may be unable to economically produce oil and natural gas, which could have a material and adverse effect on our financial condition, results of operations and cash flows.
The core of our producing properties are located in the Delaware Basin, a sub-basin of the Permian Basin, in West Texas and New Mexico, making us vulnerable to risks associated with operating in a single geographic area.
The core of our producing properties are geographically concentrated in the Delaware Basin, a sub-basin of the Permian Basin, in West Texas. At December 31, 2017, 100% of our total estimated proved reserves were attributable to properties located in this area. As a result of this concentration, we may be disproportionately exposed to the impact of regional supply and demand factors, delays or interruptions of production from wells in this area caused by governmental regulation, processing or transportation capacity constraints, market limitations, availability of equipment and personnel, water shortages or other drought related conditions or interruption of the processing or transportation of oil, natural gas or NGLs.
In addition to the geographic concentration of our producing properties in the Northern Delaware Basin described above, at December 31, 2017, approximately 71% percent of our proved reserves were attributable to the 3rd Bone Spring, Wolfcamp A (X/Y) and Wolfcamp A Lower formations. This concentration of assets within a small number of producing horizons exposes us to additional risks, such as changes in field-wide rules and regulations that could cause us to permanently or temporarily shut-in all of our wells within a field. There were no proved reserves attributable to the Southern Delaware Basin as of December 31, 2017.
We will not be the operator on all of our acreage or drilling locations, and, therefore, we will not be able to control the timing of exploration or development efforts, associated costs, or the rate of production of any non-operated assets.
We have leased or acquired approximately 11,150 net acres in the Delaware Basin, approximately 95% of which we operate, as of December 31, 2017. As of December 31, 2017, we were the operator on 480 of our 530 identified gross horizontal drilling locations. We expect to operate approximately 100% of, and have an approximate 90% working interest in, the acreage we acquired and expect to operate in the White Wolf Acquisition and believe that the acreage may be prospective for six different shale formations. We will have limited ability to exercise influence over the operations of the drilling locations we do not operate, and the operators of those locations may at any time have economic, business or legal interests or goals that are inconsistent with us. Furthermore, the success and timing of development activities by such operators will depend on a number of factors that will be largely outside of our control, including:
| • | the timing and amount of capital expenditures; |
24
Table of Contents
Index to Financial Statements
| • | the operator’s expertise and financial resources; |
| • | the approval of other participants in drilling wells; |
| • | the selection of technology; and |
| • | the rate of production of reserves, if any. |
This limited ability to exercise control over the operations and associated costs of some of our non-operated drilling locations could prevent the realization of targeted returns on capital in drilling or acquisition activities.
We participate in oil and gas leases with third parties who may not be able to fulfill their commitments to our projects.
We own less than 100% of the working interest on a minority of the oil and gas leases on which we conduct operations, and other unrelated parties own the remaining portion of the working interest. Financial risks are inherent in any operation where the cost of drilling, equipping, completing and operating wells is shared by more than one person. We could potentially be held liable for joint activity obligations of other working interest owners, such as nonpayment of costs and liabilities arising from the actions of other working interest owners. In addition, declines in oil, natural gas and NGL prices may increase the likelihood that some of these working interest owners, particularly those that are smaller and less established, are not able to fulfill their joint activity obligations. Other working interest owners may be unable or unwilling to pay their share of project costs, and, in some cases, may declare bankruptcy. In the event any other working interest owners do not pay their share of such costs, we would likely have to pay those costs, and may be unsuccessful in any efforts to recover these costs from other working interest owners, which could materially adversely affect our financial position.
The marketability of our production will be dependent upon transportation and other facilities, certain of which we will not control. If these facilities are unavailable, our operations could be interrupted and our revenues reduced.
The marketability of our oil and natural gas production depends in part upon the availability, proximity and capacity of transportation facilities owned by third parties. Our oil production is purchased at the wellhead by Gateway Gathering and Marketing (“Gateway”), an affiliate of Tema, and transported through Gateway’s Raven Gathering System (“Raven”) pipeline to the interconnection between Raven pipeline and Plains Marketing, LP pipeline. The oil is then transported on a third party pipeline to Midland, Texas where it is sold. Our natural gas production is transported by Gateway on Gateway’s Loving County Gathering System (“LCGS”) pipeline from the wellhead to the interconnection between LCGS pipeline and ETC Field Services pipeline. The gas is sold by us to the third party (ETC Field Services) at the interconnection between LCGS and ETC Field Services. ETC Field Services transports the gas to our processing facility. In connection with the Transaction, we and Gateway entered into crude oil gathering and natural gas gathering agreements with ten-year terms.
We do not control Gateway’s or the third-party’s transportation facilities and our access to the facilities may be limited or denied. Insufficient production from our wells to support the construction of pipeline facilities by our purchasers or a significant disruption in the availability of third-party transportation facilities or other production facilities could adversely impact our ability to deliver to market or produce our oil and natural gas and thereby cause a significant interruption in our operations. If, in the future, we are unable, for any sustained period, to implement acceptable delivery or transportation arrangements or encounter production related difficulties, we may be required to shut in or curtail production or flare natural gas. Any such shut-in, curtailment, or flaring or an inability to obtain favorable terms for delivery of the oil and natural gas produced from our fields, would materially and adversely affect our financial condition and results of operations.
Multi-well pad drilling may result in volatility in our operating results.
We utilize multi-well pad drilling where practical. Because wells drilled on a pad are not brought into production until all wells on the pad are drilled and completed and the drilling rig is moved from the location,
25
Table of Contents
Index to Financial Statements
multi-well pad drilling delays the commencement of production, which may cause volatility in our quarterly operating results.
We may incur losses as a result of title defects in the properties in which we invest.
The existence of a material title deficiency can render a lease worthless and can adversely affect our results of operations and financial condition. While we have historically obtained title opinions prior to commencing drilling operations on a lease or in a unit, the failure of title may not be discovered until after a well is drilled, in which case we may lose the lease and the right to produce all or a portion of the minerals under the property and may be required to pay damages to the actual owner of the lease.
Concerns over economic, business or industry conditions may have a material adverse effect on our results of operations, liquidity and financial condition.
Concerns over global economic conditions, energy costs, geopolitical issues, inflation, the availability and cost of credit, the European, Asian and the United States financial markets have contributed to increased economic uncertainty and diminished expectations for the global economy. In addition, continued hostilities in the Middle East and the occurrence or threat of terrorist attacks in the United States or other countries could adversely affect the global economy. Concerns about global economic growth have had a significant adverse impact on global financial markets and commodity prices. If the economic climate in the United States or abroad deteriorates, worldwide demand for petroleum products could diminish further, which could impact the price at which we can sell our production, affect the ability of our vendors, suppliers and customers to continue operations and ultimately adversely impact our results of operations, liquidity and financial condition.
The development of our estimated proved undeveloped reserves (“PUDs”) may take longer and may require higher levels of capital expenditures than currently anticipated. Therefore, our estimated PUDs may not be ultimately developed or produced.
As of December 31, 2017, 57% of our total estimated proved reserves were classified as PUDs. Development of these PUDS may take longer and require higher levels of capital expenditures than currently anticipated. For example, primarily as a result of factors outside our control, including a downturn in commodity prices, we adjusted our development plan to temporarily defer the drilling of certain PUD locations. As a result, no PUDs were converted from undeveloped to developed during 2015 and 2016. As a result of our failure to convert any PUDs during 2015 and 2016, we will have a shorter period of time available to convert such PUDs (due to the requirement to convert PUDs from undeveloped to developed within five years of initial booking). Further delays in the development of our PUDs, increases in costs to drill and develop such reserves or decreases in commodity prices will reduce the value of our estimated PUDs and future revenues estimated for such reserves and may result in some projects becoming uneconomic. In addition, delays in the development of reserves could cause us to have to reclassify our PUDs as unproved reserves if we no longer believe with reasonable certainty that we will develop the PUDs within five years after their initial booking. If we do not drill our PUD wells within five years after their respective dates of booking, we may be required to write-down our PUDs.
If commodity prices decrease to a level such that our future undiscounted cash flows from our properties are less than their carrying value, we may be required to take impairments or write-downs of the carrying values of our properties.
Accounting rules require periodic review of the carrying value of our properties for possible impairment. Based on prevailing commodity prices and specific market factors and circumstances at the time of prospective impairment reviews, and the continuing evaluation of development plans, production data, economics and other factors, we may be required to write-down the carrying value of our properties. A write-down constitutes a non-cash charge to earnings. Commodity prices have declined significantly in recent years. For example, the WTI spot price for oil declined from a high of $107.95 per barrel in June 2014 to a low of $26.19 per barrel in
26
Table of Contents
Index to Financial Statements
February 2016, and the NYMEX Henry Hub spot price for natural gas declined from a high of $8.15 per MMBtu in February 2014 to a low of $1.49 per MMBtu in March 2016. Likewise, NGLs have suffered significant recent declines in realized prices. The price of propane (Mont Belvieu) ranged from a high of $1.73 per gallon in February 2014 to a low of $0.30 per gallon in January 2016 and the price of ethane (Mont Belvieu) ranged from a high of $0.45 per gallon in January 2014 to a low of $0.13 per gallon in December 2015. We recognized impairment charges of $8.1 million in the year ended December 31, 2015, while no impairment was recognized for the year ended December 31, 2016. Lower commodity prices in the future could result in impairments of our properties, which could have a material adverse effect on our results of operations for the periods in which such charges are taken.
Unless we replace our reserves with new reserves and develops those reserves, our reserves and production will decline, which would adversely affect our future cash flows and results of operations.
Producing oil and natural gas reservoirs generally are characterized by declining production rates that vary depending upon reservoir characteristics and other factors. Unless we conduct successful ongoing exploration and development activities or continually acquires properties containing proved reserves, our proved reserves will decline as those reserves are produced. Our future reserves and production, and therefore our future cash flow and results of operations, are highly dependent on our success in efficiently developing our current reserves and economically finding or acquiring additional recoverable reserves. We may not be able to develop, find or acquire sufficient additional reserves to replace the current and future production. If we are unable to replace our current and future production, the value of our reserves will decrease, and our business, financial condition and results of operations would be materially and adversely affected.
Conservation measures and technological advances could reduce demand for oil and natural gas.
Fuel conservation measures, alternative fuel requirements, increasing consumer demand for alternatives to oil and natural gas, technological advances in fuel economy and energy generation devices could reduce demand for oil and natural gas. The impact of the changing demand for oil and natural gas may have a material adverse effect on our business, financial condition, results of operations and cash flows.
We depend upon significant purchasers for the sale of most of our oil, natural gas and NGL production.
We have historically sold our production to a relatively small number of customers, as is customary in our business. For the nine months ended September 30, 2017 and the year ended December 31, 2016, two and three customers accounted for approximately 88% and 97%, respectively, of our total revenue. During such periods, no other purchaser accounted for 10% or more of our revenue. The loss of any one or all of our significant customers as a purchaser could materially and adversely affect our revenues in the short-term.
Our operations may be exposed to significant delays, costs and liabilities as a result of environmental and occupational health and safety requirements applicable to our business activities.
Our operations are subject to stringent and complex federal, state and local laws and regulations governing the discharge of materials into the environment, occupational health and safety aspects of our operations, or otherwise relating to the protection of the environment and natural resources. These laws and regulations may impose numerous obligations applicable to our operations, including the acquisition of a permit or other approval before conducting regulated activities; the restriction of the types, quantities and concentration of materials that can be released into the environment; the limitation or prohibition of drilling activities on certain lands lying within wilderness, wetlands and other protected areas; the application of specific health and safety criteria addressing worker protection; or the imposition of substantial liabilities for pollution resulting from our operations. Numerous governmental authorities, such as the U.S. Environmental Protection Agency (“EPA”) and analogous state agencies, have the power to enforce compliance with these laws and regulations and the permits issued under them. Such enforcement actions may require us to perform difficult and costly compliance measures
27
Table of Contents
Index to Financial Statements
or corrective actions. Failure to comply with these laws and regulations may result in the assessment of sanctions, including administrative, civil or criminal penalties, natural resource damages, the imposition of investigatory or remedial obligations, and the issuance of orders limiting or prohibiting some or all of our operations; and plugging and abandonment responsibilities for wells which have ceased producing. In addition, we may experience delays in obtaining, or be unable to obtain, required permits, which may delay or interrupt our operations and limit our growth and revenue.
Certain environmental laws impose strict as well as joint and several liabilities for costs required to remediate and restore sites where hazardous substances, hydrocarbons or solid wastes have been released into the environment. We may be required to remediate contaminated properties currently or formerly operated by us or our predecessors in interest or facilities of third parties that received waste generated by our operations regardless of whether such contamination resulted from the conduct of others or from consequences of our own actions that were in compliance with all applicable laws at the time those actions were taken. In connection with certain acquisitions, we could acquire, or be required to provide indemnification against, environmental liabilities that could expose us to material losses. In addition, claims for damages to persons or property, including natural resources, may result from the environmental, health and safety impacts of our operations. Our insurance may not cover all environmental risks and costs or may not provide sufficient coverage if an environmental claim is made against us. Moreover, public interest in the protection of the environment has increased dramatically in recent years. The trend of more expansive and stringent environmental legislation and regulations applied to the crude oil and natural gas industry could continue, resulting in increased costs of doing business and consequently affecting profitability. For example, in June 2016, the EPA finalized a rule regarding criteria for aggregating multiple small surface sites into a single source for air-quality permitting purposes applicable to the oil and gas industry. This rule could cause small facilities, on an aggregate basis, to be deemed a major source, thereby triggering more stringent air permitting requirements. In addition, in October 2015, the EPA lowered the National Ambient Air Quality Standard (“NAAQS”) for ozone from 75 to 70 parts per billion. In November 2017, the EPA published a list of areas that are in compliance with the new ozone standards and separately in December 2017 issued responses to state recommendations for designating non-attainment areas. States have the opportunity to submit new air quality monitoring to EPA prior to EPA finalizing any non-attainment designations, which EPA is expected to issue during the first half of 2018. State implementation of the revised NAAQS could result in stricter permitting requirements, delay or prohibit our ability to obtain such permits and result in increased expenditures for pollution control equipment, the costs of which could be significant. To the extent laws are enacted or other governmental action is taken that restricts drilling or imposes more stringent and costly operating, waste handling, disposal and cleanup requirements, our business, prospects, financial condition or results of operations could be materially adversely affected.
We may incur substantial losses and be subject to substantial liability claims as a result of our operations. Additionally, we may not be insured for, or the insurance may be inadequate to protect us against, these risks.
We are not insured against all risks. Losses and liabilities arising from uninsured and underinsured events could materially and adversely affect our business, financial condition or results of operations.
Our exploration and development activities are subject to all of the operating risks associated with drilling for and producing oil and natural gas, including the possibility of:
| • | environmental hazards, such as uncontrollable releases of oil, natural gas, brine, well fluids, toxic gas or other pollution into the environment, including groundwater and air contamination; |
| • | abnormally pressured formations; |
| • | mechanical difficulties, such as stuck oilfield drilling and service tools and drill pipe or casing failures or collapse; |
| • | fire, explosions and ruptures of pipelines; |
28
Table of Contents
Index to Financial Statements
| • | personal injuries and death; |
| • | natural disasters, which may include severe weather as possibly connected to climate change and seismic events as possibly connected to injection of produced water and flowback into disposal wells; and |
| • | terrorist attacks targeting oil and natural gas related facilities and infrastructure. |
Any of these risks could adversely affect our ability to conduct operations or result in substantial loss to us as a result of claims for:
| • | injury or loss of life; |
| • | damage to and destruction of property, natural resources and equipment; |
| • | pollution and other environmental damage; |
| • | statutory or regulatory investigations and penalties; and |
| • | repair and remediation costs. |
We may elect not to obtain insurance for any or all of these risks if we believe that the cost of available insurance is excessive relative to the risks presented. In addition, statutory and regulatory penalties, pollution and environmental risks generally are not fully insurable. The occurrence of an event that is not fully covered by insurance could have a material adverse effect on our business, financial condition and results of operations.
Properties that we decide to drill may not yield oil or natural gas in commercially viable quantities.
Properties that we decide to drill that do not yield oil or natural gas in commercially viable quantities will adversely affect our results of operations and financial condition. There is no way to predict in advance of drilling and testing whether any particular prospect will yield oil or natural gas in sufficient quantities to recover drilling or completion costs or to be economically viable. The use of micro-seismic data and other technologies and the study of producing fields and data from other wells in the same area, or more fully explored prospects, will not enable us to know conclusively prior to drilling whether oil or natural gas will be present or, if present, in commercial quantities. Further, drilling operations may be curtailed, delayed or cancelled as a result of numerous factors, including:
| • | unexpected or adverse drilling conditions; |
| • | title problems; |
| • | elevated pressure or lost circulation in formations; |
| • | equipment failures or accidents; |
| • | adverse weather conditions; |
| • | compliance with environmental and other governmental or contractual requirements; and |
| • | increase in the cost of, shortages or delays in the availability of, electricity, supplies, materials, drilling or workover rigs, equipment and services. |
We may be unable to make attractive acquisitions or successfully integrate acquired assets or businesses, and any inability to do so may disrupt our business and hinder our ability to grow.
In the future, we may make acquisitions of assets or businesses that complement or expand our current business. However, there is no guarantee we will be able to identify attractive acquisition opportunities. In the event we are able to identify attractive acquisition opportunities, we may not be able to complete the acquisition or do so on commercially acceptable terms. Competition for acquisitions may also increase the cost of, or cause us to refrain from, completing acquisitions.
29
Table of Contents
Index to Financial Statements
The success of any completed acquisition will depend on our ability to integrate effectively the acquired assets or business. The process of integrating acquired assets or businesses may involve unforeseen difficulties and may require a disproportionate amount of managerial and financial resources. In addition, possible future acquisitions may be larger and for purchase prices significantly higher than those paid for earlier acquisitions. No assurance can be given that we will be able to identify additional suitable acquisition opportunities, negotiate acceptable terms, obtain financing for acquisitions on acceptable terms or successfully acquire identified targets. Our failure to achieve consolidation savings, to integrate the acquired businesses and assets into our existing operations successfully or to minimize any unforeseen operational difficulties could have a material adverse effect on our financial condition and results of operations.
In addition, our Credit Agreement, Certificate of Designations for the Series B Preferred Stock and the Note Purchase Agreement impose, and future debt agreements may impose, among other things, limitations on our ability to enter into mergers or combination transactions. See “—Restrictions in our Credit Agreement, Certificate of Designations for the Series B Preferred Stock and the Note Purchase Agreement limit, and our future debt agreements could limit, our ability to engage in certain activities.” Such limitations may also restrict our ability to incur certain indebtedness, which could indirectly limit our ability to engage in acquisitions of assets or businesses.
We may be subject to risks in connection with acquisitions of properties.
The successful acquisition of properties requires an assessment of several factors, including:
| • | recoverable reserves; |
| • | future oil and natural gas prices and their applicable differentials; |
| • | geological risks; |
| • | access to markets; |
| • | operating costs; and |
| • | potential environmental and other liabilities. |
The accuracy of these assessments is inherently uncertain. In connection with these assessments, we perform a review of the subject properties that we believe to be generally consistent with industry practices. However, these reviews will not reveal all existing or potential problems, nor will it permit us to become sufficiently familiar with the properties to fully assess their deficiencies and capabilities. Inspections may not always be performed on every well, and environmental problems, such as groundwater contamination, are not necessarily observable even when an inspection is undertaken. Even when problems are identified, the seller may be unwilling or unable to provide effective contractual protection against all or part of the problems.
Certain of our properties are subject to land use restrictions, which could limit the manner in which we conduct our business.
In order to bring equipment, supplies, water, personnel and produced products to and from certain of our properties, we and/or our contractors must obtain permissions or rights-of-way from other parties, including private property owners and governmental agencies. There is no guarantee that we or our contractors will be able to obtain or continue to obtain those permissions or rights or to obtain them at a reasonable cost. In addition, certain of our properties are subject to land use restrictions, including ordinances, which could limit the manner in which we conduct our business. Although none of our proposed drilling locations associated with proved undeveloped reserves as of December 31, 2017 are on properties currently subject to such land use restrictions, such restrictions may become effective in the future. All of the permissions, rights-of-way, and restrictions discussed above could affect, among other things, our access to and the permissible uses of our facilities as well as the manner in which we produce oil and natural gas and may restrict or prohibit drilling in general. The costs incurred to comply with such restrictions may be significant in nature, and we may experience delays or curtailment in the pursuit of development activities and may even be precluded from the drilling of wells.
30
Table of Contents
Index to Financial Statements
The unavailability or high cost of additional drilling rigs, equipment, supplies, personnel and oilfield services could adversely affect our ability to execute our development plans within our budget and on a timely basis.
We do not own any drilling rigs, nor do we own other equipment and supplies that are critical to our continuing ability to drill for and produce oil, gas, and NGLs. We are dependent on access to qualified and competent contractors for such equipment and supplies, as well as the personnel to engage in our drilling and production program. The demand for drilling rigs, pipe and other equipment and supplies, as well as for qualified and experienced field personnel to drill wells and conduct field operations, geologists, geophysicists, engineers and other professionals in the oil and natural gas industry, can fluctuate significantly, often in correlation with oil and natural gas prices, causing periodic shortages. Our operations are concentrated in areas in which industry has increased rapidly, and as a result, demand for such drilling rigs, equipment and personnel, as well as access to transportation, processing and refining facilities in these areas, has increased, as have the costs for those items. We may not be able to renew or obtain new drilling contracts for rigs whose contracts are expiring or are terminated or obtain drilling contracts for our uncontracted new builds. Any delay or inability to secure the personnel, including frac crews, equipment, power, services, resources and facilities access necessary for us to increase our development activities could result in production volumes being below our forecasted volumes. In addition, any such negative effect on production volumes, or significant increases in costs, could have a material adverse effect on our cash flow and profitability. Furthermore, if we are unable to secure a sufficient number of drilling rigs at reasonable costs, we may not be able to drill all of our acreage before our leases expire.
We could experience periods of higher costs if commodity prices rise. These increases could reduce our profitability, cash flow and ability to complete development activities as planned.
Historically, our capital and operating costs have risen during periods of increasing oil, natural gas and NGL prices. These cost increases result from a variety of factors beyond our control, such as increases in the cost of electricity, steel and other raw materials that we and our vendors rely upon; increased demand for labor, services and materials as drilling activity increases; and increased taxes. Decreased levels of drilling activity in the oil and gas industry in recent periods have led to declining costs of some drilling equipment, materials and supplies. However, such costs may rise faster than increases in our revenue if commodity prices rise, thereby negatively impacting our profitability, cash flow and ability to complete development activities as scheduled and on budget. This impact may be magnified to the extent that our ability to participate in the commodity price increases is limited by our prior or future commodity derivative activities.
Should we fail to comply with all applicable Federal Energy Regulatory Commission (“FERC”) administered statutes, rules, regulations and orders, we could be subject to substantial penalties and fines.
Under the Domenici-Barton Energy Policy Act of 2005, FERC has civil penalty authority under the Natural Gas Act of 1938 (“NGA”) and the Natural Gas Policy Act of 1978 (“NGPA”) to impose penalties of up to $1,238,271 per day for each violation for current violations and disgorgement of profits associated with any violation. While our operations have not been regulated by FERC as a natural gas company under the NGA, FERC has adopted regulations that may subject certain of our otherwise non-FERC jurisdictional operations to FERC’s annual reporting and posting requirements. We also must comply with the anti-market manipulation rules enforced by FERC. Additional rules and legislation pertaining to those and other matters may be considered or adopted by FERC from time to time. Failure to comply with those regulations in the future could subject us to civil penalty liability.
Climate change laws and regulations restricting emissions of GHGs could result in increased operating costs and reduced demand for the oil and natural gas that we produce, while potential physical effects of climate change could disrupt our production and cause us to incur significant costs in preparing for or responding to those effects.
In response to findings that emissions of carbon dioxide, methane and other GHGs present an endangerment to public health and the environment, the EPA has adopted regulations pursuant to the federal Clean Air Act that,
31
Table of Contents
Index to Financial Statements
among other things, require preconstruction and operating permits for GHG emissions from certain large stationary sources that otherwise require such permits for non-GHG emissions. Facilities required to obtain preconstruction permits for their GHG emissions are also required to meet “best available control technology” standards that are being established by the states or, in some cases, by the EPA on a case-by-case basis. These regulatory requirements could adversely affect our operations and restrict or delay our ability to obtain air permits for new or modified sources. In addition, the EPA has adopted rules requiring the monitoring and reporting of GHG emissions from specified onshore and offshore oil and natural gas production sources in the United States on an annual basis, which include certain of our operations. Furthermore, in June 2016, the EPA finalized rules that establish new controls for emissions of methane from new, modified or reconstructed sources in the oil and natural gas source category, including production, processing, transmission and storage activities. The rules include first-time standards to address emissions of methane from equipment and processes across the source category, including hydraulically fractured oil and natural gas well completions. However, in June 2017, the EPA published a proposed rule to stay certain portions of the June 2016 standards for two years and re-evaluate the entirety of the 2016 standards, but the EPA has not yet published a final rule and, as a result, the June 2016 rule remains in effect but future implementation of the 2016 standards is uncertain at this time. To the extent implemented, compliance with these rules will require enhanced record-keeping practices, the purchase of new equipment, such as optical gas imaging instruments to detect leaks, and increased frequency of maintenance and repair activities to address emissions leakage. The rules will also likely require additional personnel time to support these activities or the engagement of third party contractors to assist with and verify compliance. These new and proposed rules could result in increased compliance costs on our operations.
While Congress has from time to time considered legislation to reduce emissions of GHGs, there have not been significant legislative proposals to reduce GHG emissions at the federal level in recent years. In the absence of such federal climate legislation, a number of state and regional efforts have emerged that are aimed at tracking and/or reducing GHG emissions by means of cap and trade programs. These programs typically require major sources of GHG emissions to acquire and surrender emission allowances in return for emitting those GHGs. In addition, efforts have been made and continue to be made in the international community toward the adoption of international treaties or protocols that would address global climate change issues. At the international level, the United States joined the international community at the 21st Conference of the Parties of the United Nations Framework Convention on Climate Change in Paris, France, which resulted in an agreement (the “Paris Agreement”) that requires member countries to review and “represent a progression” in their intended nationally determined contributions, and set GHG emission reduction goals every five years beginning in 2020. The Paris Agreement entered into force in November 2016. Although this agreement does not create any binding obligations for nations to limit their GHG emissions, it does include pledges from the participating nations to voluntarily limit or reduce future emissions. In June 2017, President Trump stated that the United States would withdraw from the Paris Agreement, but may enter into a future international agreement related to GHGs on different terms. The Paris Agreement provides for a four-year exit process beginning when it took effect in November 2016, which would result in an effective exit date of November 2020. The United States’ adherence to the exit process is uncertain and/or the terms on which the United States may reenter the Paris Agreement or a separately negotiated agreement are unclear at this time.
Although it is not possible at this time to predict how legislation or new regulations that may be adopted to address GHG emissions would impact our business, any such future laws and regulations imposing reporting obligations on, or limiting emissions of GHGs from, our equipment and operations could require us to incur costs to reduce emissions of GHGs associated with our operations. Substantial limitations on GHG emissions could adversely affect demand for the oil and natural gas we produce and lower the value of our reserves. Recently, activists concerned about the potential effects of climate change have directed their attention at sources of funding for fossil-fuel energy companies, which has resulted in certain financial institutions, funds and other sources of capital restricting or eliminating their investment in oil and natural gas activities. Ultimately, this could make it more difficult to secure funding for exploration and production activities. Notwithstanding potential risks related to climate change, the International Energy Agency estimates that global energy demand will continue to rise and will not peak until after 2040 and that oil and gas will continue to represent a substantial
32
Table of Contents
Index to Financial Statements
percentage of global energy use over that time. Finally, it should be noted that some scientists have concluded that increasing concentrations of GHGs in the earth’s atmosphere may produce climate changes that have significant physical effects, such as increased frequency and severity of storms, floods, droughts, and other climatic events. Our operations are onshore and not located in coastal or flood-prone regions of the United States, but if any such effects were to occur, they have the potential to cause physical damage to our assets or affect the availability of water for our operations and thus could have a material adverse effect on our operations.
Federal, state and local legislative and regulatory initiatives relating to hydraulic fracturing as well as governmental reviews of such activities could result in increased costs and additional operating restrictions or delays in the completion of oil and natural gas wells and adversely affect our production.
Hydraulic fracturing is an important and common practice that is used to stimulate production of oil and/or natural gas from dense subsurface rock formations. The hydraulic fracturing process involves the injection of water, proppants and chemicals under pressure into targeted subsurface formations to fracture the surrounding rock and stimulate production. We regularly use hydraulic fracturing as part of our operations and expect to continue that practice. Hydraulic fracturing is typically regulated by state oil and natural gas commissions, but the EPA has asserted federal regulatory authority pursuant to the federal Safe Drinking Water Act (“SDWA”) over certain hydraulic fracturing activities involving the use of diesel fuels and published permitting guidance in February 2014 addressing the performance of such activities using diesel fuels. The EPA has also issued: final regulations under the federal Clean Air Act establishing performance standards, including standards for the capture of air emissions released during hydraulic fracturing; and also finalized rules in June 2016 that prohibit the discharge of wastewater from hydraulic fracturing operations to publicly owned wastewater treatment plants. In addition, Congress has from time to time considered legislation to provide for federal regulation of hydraulic fracturing under the SDWA and to require disclosure of the chemicals used in the hydraulic fracturing process. It is unclear how any additional federal regulation of hydraulic fracturing activities may affect our operations.
In December 2016, the EPA released its final report on the potential impacts of hydraulic fracturing on drinking water resources. The final report concluded that “water cycle” activities associated with hydraulic fracturing may impact drinking water resources “under some circumstances,” noting that the following hydraulic fracturing water cycle activities and local- or regional-scale factors are more likely than others to result in more frequent or more severe impacts: water withdrawals for fracturing in times or areas of low water availability; surface spills during the management of fracturing fluids, chemicals or produced water; injection of fracturing fluids into wells with inadequate mechanical integrity; injection of fracturing fluids directly into groundwater resources; discharge of inadequately treated fracturing wastewater to surface waters; and disposal or storage of fracturing wastewater in unlined pits. As described elsewhere in this prospectus, these risks are regulated under various state, federal, and local laws. The EPA’s study report did not find a direct link between the action of hydraulically fracturing the well itself and contamination of groundwater resources. The study report does not, therefore, appear to provide a reasonable basis to expect Congress to repeal the exemption for hydraulic fracturing under the federal Safe Drinking Water Act at the federal level.
At the state level, several states have adopted or are considering legal requirements that could impose more stringent permitting, disclosure and well construction requirements on hydraulic fracturing activities. For example, in May 2013, the Railroad Commission of Texas issued a “well integrity rule,” which updates the requirements for drilling, putting pipe down and cementing wells. The rule includes testing and reporting requirements, such as (i) the requirement to submit cementing reports after well completion or after cessation of drilling, whichever is later, and (ii) the imposition of additional testing on wells less than 1,000 feet below usable groundwater. The well integrity rule took effect in January 2014. Local governments also may seek to adopt ordinances within their jurisdictions regulating the time, place and manner of drilling activities in general or hydraulic fracturing activities in particular. If new or more stringent federal, state or local legal restrictions relating to the hydraulic fracturing process are adopted in areas where we operate, we could incur potentially significant added costs to comply with such requirements, experience delays or curtailment in the pursuit of development activities, and perhaps even be precluded from drilling wells.
33
Table of Contents
Index to Financial Statements
Legislation or regulatory initiatives intended to address seismic activity could restrict our drilling and production activities, as well as our ability to dispose of produced water, including saltwater, gathered from such activities, which could have a material adverse effect on our business.
State and federal regulatory agencies recently have focused on a possible connection between hydraulic fracturing related activities and the increased occurrence of seismic activity, and regulatory agencies at all levels are continuing to study the possible linkage between oil and gas activity and induced seismicity. In 2015, the United States Geological Survey identified eight states, including Texas, with areas of increased rates of induced seismicity that could be attributed to fluid injection or oil and gas extraction. In addition, a number of lawsuits have been filed in other states, for example recent lawsuits in Oklahoma, alleging that disposal well operations have caused damage to neighboring properties or otherwise violated state and federal rules regulating waste disposal. In response to these concerns, regulators in some states are seeking to impose additional requirements, including requirements on the permitting of produced water disposal wells or otherwise to assess any relationship between seismicity and the use of such wells. For example, in October 2014, the Railroad Commission of Texas published a rule governing permitting or re-permitting of disposal wells that would require, among other things, the submission of information on seismic events occurring within a specified radius of the disposal well location, as well as logs, geologic cross sections and structure maps relating to the disposal area in question. If the permittee or an applicant for a disposal well permit fails to demonstrate that the saltwater or other fluids are confined to the disposal zone or if scientific data indicates that such a disposal well is likely to be or determined to be contributing to seismic activity, then the agency may deny, modify, suspend or terminate the permit application or existing operating permit for that well. The Oklahoma Corporation Commission also released well completion seismicity guidelines in December 2016 for operators in the SCOOP and STACK that call for hydraulic fracturing operations to be suspended following earthquakes of certain magnitudes in the vicinity. In addition, in February 2017, the Oklahoma Corporation Commission’s Oil and Gas Conservation Division issued an order limiting future increases in the volume of oil and natural gas wastewater injected into the ground in an effort to reduce the number of earthquakes in the state.
We dispose of large volumes of produced water, including saltwater, gathered from our drilling and production operations using disposal wells pursuant to permits issued by governmental authorities overseeing such disposal activities and pursuant to permissions granted by the owners of properties where the disposal wells are located. While these permits are issued in accordance with existing laws and regulations, these legal requirements are subject to change, as are the permissions granted by property owners. Any changes could result in the imposition of more stringent operating constraints or new monitoring and reporting requirements, owing to, among other things, concerns of the public or governmental authorities or property owners regarding such gathering or disposal activities. The adoption and implementation of any new laws or regulations or changes that restrict our expected ability to use hydraulic fracturing or dispose of produced water gathered from our drilling and production activities, either by limiting disposal volumes, disposal well locations or otherwise, or requiring us to shut down disposal wells, could have a material adverse effect on our business, financial condition and results of operations.
Competition in the oil and natural gas industry is intense, making it more difficult for us to acquire properties, market oil or natural gas and secure trained personnel.
Our ability to acquire additional prospects and to find and develop reserves in the future will depend on our ability to evaluate and select suitable properties and to consummate transactions in a highly competitive environment for acquiring properties, marketing oil and natural gas and securing trained personnel. Also, there is substantial competition for capital available for investment in the oil and natural gas industry. Many of our competitors possess and employ financial, technical and personnel resources substantially greater than ours. Those companies may be able to pay more for productive properties and exploratory prospects and to evaluate, bid for and purchase a greater number of properties and prospects than our financial or personnel resources permit. In addition, other companies may be able to offer better compensation packages to attract and retain qualified personnel than we are able to offer. The cost to attract and retain qualified personnel may increase
34
Table of Contents
Index to Financial Statements
substantially in the future. We may not be able to compete successfully in the future in acquiring prospective reserves, developing reserves, marketing hydrocarbons, attracting and retaining quality personnel and raising additional capital, which could have a material adverse effect on our business.
The loss of senior management or technical personnel could adversely affect our operations.
We depend on the services of our senior management and technical personnel. We do not maintain, nor do we plan to obtain, any insurance against the loss of any of these individuals. The loss of the services of such senior management or technical personnel could have a material adverse effect on our business, financial condition and results of operations.
Our business is difficult to evaluate because it may be susceptible to the potential difficulties associated with rapid growth and expansion.
Our assets have grown rapidly over the last several years. We believe that our future success depends on our ability to manage the rapid growth that we have experienced and the demands from increased responsibility on management personnel. The following factors could present difficulties:
| • | increased responsibilities for our executive level personnel; |
| • | increased administrative burden; |
| • | increased capital requirements; and |
| • | increased organizational challenges common to large, expansive operations. |
Our operating results could be adversely affected if we do not successfully manage these potential difficulties. The historical financial information contained in this prospectus is not necessarily indicative of the results that may be realized in the future.
Failure to maintain effective internal controls over financial reporting could have a material adverse effect on our business, operating results and stock price.
In connection with the audit of the financial statements attributable to Rosehill Operating, management concluded that the Company had a material weakness as of December 31, 2016 due to significant deficiencies in the following areas:
| • | Asset retirement obligations estimates; |
| • | Information technology general controls; |
| • | Identification and documentation of related party transactions; |
| • | Going concern evaluation; and |
| • | Depreciation, depletion and amortization calculations. |
In connection with the preparation of the financial statements for the quarter ended September 30, 2017, management and the Audit Committee concluded that we had a material weakness as of that date due to significant deficiencies related to (i) technical documentation of complex transactions, (ii) identification and classification of well costs, (iii) depreciation, depletion and amortization calculations, and (iv) timely reconciliation and review of accounts. A material weakness related to the identification and analysis of the appropriate accounting treatment of complex transactions was also identified during the quarter ended September 30, 2017, which failed to detect the error in our financial statements in a timely manner for the quarterly period ended June 30, 2017, filed with the Securities and Exchange Commission on August 15, 2017, and resulted in a restatement filed on November 3, 2017. As a result of the error and the related restatement of the Company’s financial statements, and as a result of the material weaknesses identified, our CEO and CFO have concluded that our internal controls over financial reporting were not effective as of September 30, 2017.
35
Table of Contents
Index to Financial Statements
Our disposition activities may be subject to factors beyond our control, and in certain cases we may retain unforeseen liabilities for certain matters.
We have regularly sold non-core assets in order to increase capital resources available for other core assets and to create organizational and operational efficiencies. We have also occasionally sold interests in core assets for the purpose of accelerating the development and increasing efficiencies in such core assets. Various factors could materially affect our ability to dispose of such assets in the future, including the approvals of governmental agencies or third parties and the availability of purchasers willing to acquire the assets with terms we deem acceptable.
Sellers often retain certain liabilities or agree to indemnify buyers for certain matters related to the sold assets. The magnitude of any such retained liability or of the indemnification obligation is difficult to quantify at the time of the transaction and ultimately could be material. Also, as is typical in divestiture transactions, third parties may be unwilling to release us from guarantees or other credit support provided prior to the sale of the divested assets. As a result, after a divestiture, we may remain secondarily liable for the obligations guaranteed or supported to the extent that the buyer of the assets fails to perform these obligations.
The standardized measure of our estimated proved reserves and our PV-10 are not necessarily the same as the current market value of our estimated proved oil reserves.
The present value of future net cash flow from our proved reserves, or standardized measure, and our related PV-10 calculation, may not represent the current market value of our estimated proved oil reserves. In accordance with SEC requirements, we base the estimated discounted future net cash flow from our estimated proved reserves on the 12-month average oil index prices, calculated as the unweighted arithmetic average for the first-day-of-the-month price for each month and costs in effect as of the date of the estimate, holding the prices and costs constant throughout the life of the properties. Actual future prices and costs may differ materially from those used in the net present value estimate, and future net present value estimates using then current prices and costs may be significantly less than current estimates. In addition, the 10% discount factor we use when calculating discounted future net cash flow for reporting requirements in compliance with the Financial Accounting Standard Board Codification 932, “Extractive Activities-Oil and Gas,” may not be the most appropriate discount factor based on interest rates in effect from time to time and risks associated with us or the oil and natural gas industry in general.
Our ability to use net operating loss carryforwards to offset future taxable income for U.S. federal income tax purposes is subject to limitation.
As of December 31, 2017, we expect we will have approximately $ of U.S. federal operating loss carryforwards (“NOLs”), which began to expire in . Utilization of these NOLs depends on many factors, including our future income, which cannot be assured. In addition, Section 382 of the Internal Revenue Code of 1986, as amended (“Section 382”), generally imposes an annual limitation on the amount of NOLs that may be used to offset taxable income when a corporation that has undergone an “ownership change” (as determined under Section 382) An ownership change generally occurs if one or more shareholders (or group of shareholders) who are each deemed to own at least 5% of our stock change their ownership by more than 50 percentage points over their lowest ownership percentage during a rolling three-year period.
In the event that an ownership change has occurred, or were to occur, utilization of our NOLs would be subject to an annual limitation under Section 382, determined by multiplying the value of our stock at the time of the ownership change by the applicable long-term tax-exempt rate as defined in Section 382, subject to certain adjustments. Any unused annual limitation may be carried over to later years.
We believe we experienced an ownership change as a result of the Transaction on April 27, 2017, and our NOLs at the time of the Transaction are subject to limitation under Section 382, which may cause U.S. federal
36
Table of Contents
Index to Financial Statements
income taxes to be paid earlier than otherwise would be paid if such limitation were not in effect and could cause such NOLs to expire unused, in each case reducing or eliminating the benefit of such NOLs. To the extent we are not able to offset our future income with our NOLs, this would adversely affect our operating results and cash flows if we attain profitability. Similar rules and limitations may apply for state income tax purposes.
We depend on computer and telecommunications systems and failures in our systems or cyber security attacks could significantly disrupt our business operations.
We have entered into agreements with third parties for hardware, software, telecommunications and other information technology services in connection with our business. In addition, we have developed proprietary software systems, management techniques and other information technologies incorporating software licensed from third parties. It is possible we could incur interruptions from cyber security attacks, computer viruses or malware. We believe that we have positive relations with our related vendors and maintain adequate anti-virus and malware software and controls; however, any interruptions to our arrangements with third parties to our computing and communications infrastructure or our information systems could significantly disrupt our business operations.
Our derivative transactions expose us to counterparty credit risk.
Our derivative transactions expose us to risk of financial loss if a counterparty fails to perform under a derivative contract. Disruptions in the financial markets could lead to sudden decreases in a counterparty’s liquidity, which could make them unable to perform under the terms of the derivative contract and we may not be able to realize the benefit of the derivative contract.
Hedging transactions may limit our potential gains and increase our potential losses.
In order to manage our exposure to price risks in the marketing of our oil, natural gas, and natural gas liquids production, we have entered into oil, natural gas, and natural gas liquids price hedging arrangements with respect to a portion of our anticipated production and we may enter into additional hedging transactions in the future. While intended to reduce the effects of volatile commodity prices, such transactions may limit our potential gains and increase our potential losses if commodity prices were to rise substantially over the price established by the hedge. In addition, such transactions may expose us to the risk of loss in certain circumstances, including instances in which:
| • | our production is less than expected; |
| • | there is a widening of price differentials between delivery points for our production; or |
| • | the counterparties to our hedging agreements fail to perform under the contracts. |
The adoption of derivatives legislation by Congress could have an adverse impact on our ability to use derivative instruments to reduce the effects of commodity prices, interest rates and other risks associated with our business.
Historically, we have entered into a number of commodity derivative contracts in order to hedge a portion of our oil and natural gas production. On July 21, 2010, then President Obama signed into law the Dodd-Frank Wall Street Reform and Consumer Protection Act, or the Dodd-Frank Act, which requires the SEC and the Commodity Futures Trading Commission (or CFTC), along with other federal agencies, to promulgate regulations implementing the new legislation.
The CFTC has finalized other regulations implementing the Dodd-Frank Act’s provisions regarding trade reporting, margin, clearing, and trade execution; however, some regulations remain to be finalized and it is not possible at this time to predict when the CFTC will adopt final rules. For example, the CFTC has re-proposed
37
Table of Contents
Index to Financial Statements
regulations setting position limits for certain futures and option contracts in the major energy markets and for swaps that are their economic equivalents. Certain bona fide hedging transactions are expected to be made exempt from these limits. Also, it is possible that under recently adopted margin rules, some registered swap dealers may require us to post initial and variation margins in connection with certain swaps not subject to central clearing.
The Dodd-Frank Act and any additional implementing regulations could significantly increase the cost of some commodity derivative contracts (including through requirements to post collateral, which could adversely affect our available liquidity), materially alter the terms of some commodity derivative contracts, limit our ability to trade some derivatives to hedge risks, reduce the availability of some derivatives to protect against risks we encounter, and reduce our ability to monetize or restructure our existing commodity derivative contracts. If we reduce our use of derivatives as a consequence, our results of operations may become more volatile and our cash flows may be less predictable, which could adversely affect our ability to plan for and fund capital expenditures. Increased volatility may make us less attractive to certain types of investors. Finally, the Dodd-Frank Act was intended, in part, to reduce the volatility of oil and natural gas prices, which some legislators attributed to speculative trading in derivatives and commodity instruments related to oil and natural gas. If the implementing regulations result in lower commodity prices, our revenues could be adversely affected. Any of these consequences could adversely affect our business, financial condition and results of operations.
Risks Related to Our Indebtedness
We may incur substantial additional debt, which could decrease our ability to maintain operations or service existing debt obligations.
Subject to the restrictions in our Credit Agreement, Certificate of Designations for the Series B Preferred Stock and the Note Purchase Agreement (as defined below), we may incur substantial additional debt in the future. We may also consider investments in joint ventures or acquisitions that may increase our indebtedness. Adding new debt to then existing debt levels could intensify the operational risks that we now face.
We may not be able to generate sufficient cash to service all of our indebtedness and may be forced to take other actions to satisfy our obligations under applicable debt instruments, which may not be successful.
Our ability to make scheduled payments on, or to refinance, our indebtedness obligations, including our Credit Agreement and Second Lien Notes or line of credit, depends on our financial condition and operating performance, which are subject to prevailing economic and competitive conditions and certain financial, business and other factors beyond our control. We may not be able to maintain a level of cash flows from operating activities sufficient to permit us to pay the principal, premium, if any, and interest on our current and future indebtedness.
If our cash flows and capital resources are insufficient to fund debt service obligations, we may be forced to reduce or delay investments and capital expenditures, sell assets, seek additional capital or restructure or refinance indebtedness. Our ability to restructure or refinance our indebtedness will depend on the condition of the capital markets and our financial condition at such time. Any refinancing of indebtedness could be at higher interest rates and may require us to comply with more onerous covenants, which could further restrict business operations. The terms of future debt instruments may restrict us from adopting some of these alternatives. In addition, any failure to make payments of interest and principal on outstanding indebtedness on a timely basis would likely result in a reduction of our credit rating, which could harm our ability to incur additional indebtedness. In the absence of sufficient cash flows and capital resources, we could face substantial liquidity problems and might be required to dispose of material assets or operations to meet debt service and other obligations. Our Credit Agreement, Certificate of Designations for the Series B Preferred Stock and the Note Purchase Agreement restrict, among other things, our ability to dispose of assets and our use of the proceeds from such disposition. See “—Restrictions in our Credit Agreement, Certificate of Designations for the Series B
38
Table of Contents
Index to Financial Statements
Preferred Stock and the Note Purchase Agreement limit, and our future debt agreements could limit, our ability to engage in certain activities.” We may not be able to consummate those dispositions, and the proceeds of any such disposition may not be adequate to meet any debt service obligations then due. These alternative measures may not be successful and may not permit us to meet scheduled debt service obligations.
Restrictions in our Credit Agreement, Certificate of Designations for the Series B Preferred Stock and the Note Purchase Agreement limit, and our future debt agreements could limit, our ability to engage in certain activities.
Our Credit Agreement, Certificate of Designations for the Series B Preferred Stock and the Note Purchase Agreement contain, and our future debt agreements may contain, a number of significant covenants, including restrictive covenants that limit our ability to, among other things:
| • | incur additional indebtedness; |
| • | be liable in respect of any third party guaranty; |
| • | incur liens; |
| • | make loans to others; |
| • | make investments; |
| • | pay dividends or make distributions to third parties; |
| • | liquidate, merge or consolidate with another entity; |
| • | enter into commodity hedges exceeding a specified percentage of our expected production; |
| • | enter into interest rate hedges exceeding a specified percentage of our outstanding indebtedness; |
| • | sell properties or assets; |
| • | issue additional shares of capital stock; and |
| • | engage in certain other transactions without the prior consent of the holders of the Second Lien Notes, the Series B Preferred Stock and/or PNC Bank, National Association and the lenders under the Credit Agreement. |
In addition, our Credit Agreement requires us to maintain the following financial ratios: (1) a working capital ratio, which is the ratio of consolidated current assets (including unused commitments under the Credit Agreement, but excluding non-cash assets) to consolidated current liabilities (excluding non-cash obligations, reclamation obligations to the extent classified as current liabilities and current maturities under the Credit Agreement), of not less than 1.0 to 1.0, and (2) a leverage ratio, which is the ratio of the sum of all of our Total Funded Debt to EBITDAX (as such terms are defined in the Credit Agreement) for the four fiscal quarters then ended, of not greater than 4.00 to 1.00. Failure to do so could result in mandatory or full repayment of the indebtedness. The senior secured revolving credit facility also does not permit us to borrow funds if at the time of such borrowing, we are not in pro forma compliance with the financial covenants.
A breach of any covenant in our Credit Agreement likely would result in a default under the Credit Agreement after any applicable grace periods. A default, if not waived, could result in acceleration of the indebtedness outstanding under our Credit Agreement and in a default with respect to, and an acceleration of, the indebtedness outstanding under other debt agreements. The accelerated indebtedness may become immediately due and payable. If that occurs, we may not be able to make all of the required payments or borrow sufficient funds to refinance such indebtedness. Even if new financing were available at that time, it may not be on terms that are acceptable to us. If an event of default occurs under the Credit Agreement, PNC Bank, National Association will have the right to proceed against the pledged capital stock and take control of substantially all of our material operating subsidiaries that are guarantors’ assets.
39
Table of Contents
Index to Financial Statements
If we fail to pay dividends on the Series B Preferred Stock in any fiscal quarter, the dividend rate will increase from 10% to 12% per annum on the $1,000 liquidation preference per share of Series B Preferred Stock until such dividends are paid in full. In addition, if the Company fails to pay dividends for three out of four consecutive fiscal quarters or for six quarters (whether or not consecutive), then a representative appointed by the holders of a majority of the outstanding shares of Series B Preferred Stock shall have the right to appoint one director to our board of directors, and we shall be required to seek the approval of such representative for certain corporate actions, in each case, until three months following the date on which such dividends are paid in full.
The restrictions in our Credit Agreement, Certificate of Designations for the Series B Preferred Stock and the Note Purchase Agreement limit our ability to obtain future financings to withstand a future downturn in our business or the economy in general, or to otherwise conduct necessary corporate activities. We may also be prevented from taking advantage of business opportunities that arise because of the limitations that the restrictive covenants under our Credit Agreement, Certificate of Designations for the Series B Preferred Stock and the Note Purchase Agreement impose on us.
Any significant reduction in the borrowing base under our Credit Agreement as a result of the periodic borrowing base redeterminations or otherwise may negatively impact our ability to fund our operations.
Our Credit Agreement limits the amounts we can borrow up to a borrowing base amount, which the lenders, in their sole discretion, determine at certain periods throughout the year. The borrowing base depends on, among other things, projected revenues from, and asset values of, the oil and natural gas properties securing our loan. If we do not furnish the information required for the redetermination by the specified date, the lender may nonetheless redetermine the borrowing base in their sole discretion until the relevant information is received.
In the future, we may not be able to access adequate funding under our Credit Agreement (or a replacement facility) as a result of a decrease in our borrowing base due to the issuance of new indebtedness, the outcome of a subsequent borrowing base redetermination or an unwillingness or inability on the part of lending counterparties to meet their funding obligations and the inability of other lenders to provide additional funding to cover the defaulting lender’s portion. Declines in commodity prices could result in a determination to lower the borrowing base in the future and, in such a case, we could be required to repay any indebtedness in excess of the redetermined borrowing base. As a result, we may be unable to implement our respective drilling and development plan, make acquisitions or otherwise carry out business plans, which would have a material adverse effect on our financial condition and results of operations and impair our ability to service our indebtedness.
Increases in interest rates could adversely affect our business.
Our business and operating results can be harmed by factors such as the availability, terms of and cost of capital, increases in interest rates or a reduction in credit rating. These changes could cause our cost of doing business to increase, limit our ability to pursue acquisition opportunities, reduce cash flow used for drilling and place us at a competitive disadvantage. For example, as of September 30, 2017, our outstanding borrowings subject to variable interest rates were approximately $50.0 million, and a 1.0% increase in interest rates would result in an increase in annual interest expense of approximately $0.5 million, assuming the $50.0 million of debt was outstanding for the period. Our Credit Agreement is subject to similar or greater interest rate expenses. Recent and continuing disruptions and volatility in the global financial markets may lead to a contraction in credit availability impacting our ability to finance operations. We require continued access to capital. A significant reduction in cash flows from operations or the availability of credit could materially and adversely affect our ability to achieve planned growth and operating results.
40
Table of Contents
Index to Financial Statements
Risks Related to the Class A Common Stock and Our Capital Structure
We are a holding company. Our sole material asset is our equity interest in Rosehill Operating and we are accordingly dependent upon distributions from Rosehill Operating to pay taxes, make payments under the Tax Receivable Agreement and cover our corporate and other overhead expenses.
We are a holding company and have no material assets other than our equity interest in Rosehill Operating. We have no independent means of generating revenue. To the extent Rosehill Operating has available cash, we intend to cause Rosehill Operating to make (i) generally pro rata distributions to its unitholders, including us, in an amount at least sufficient to allow us to pay dividends with respect to the Series A Preferred Stock, our taxes and to make payments under the Tax Receivable Agreement with Tema and (ii) non-pro rata payments to us to reimburse us for our corporate and other overhead expenses. To the extent that we need funds and Rosehill Operating or its subsidiaries are restricted from making such distributions or payments under applicable law or regulation or under the terms of any financing arrangements, or are otherwise unable to provide such funds, our liquidity and financial condition could be materially adversely affected.
The market price of the Class A Common Stock may decline.
Fluctuations in the price of the Class A Common Stock could contribute to the loss of all or part of your investment. Prior to the closing of the Transaction, trading in our Class A Common Stock and Warrants had been limited. The trading price of the Class A Common Stock could be volatile and subject to wide fluctuations in response to various factors, some of which are beyond our control. Any of the factors listed below could have a material adverse effect on your investment and the Class A Common Stock may trade at prices significantly below the price you paid for them. In such circumstances, the trading price of the Class A Common Stock may not recover and may experience a further decline.
Factors affecting the trading price of the Class A Common Stock may include:
| • | actual or anticipated fluctuations in our quarterly financial results or the quarterly financial results of companies perceived to be similar to us; |
| • | changes in the market’s expectations about our operating results; |
| • | success of competitors; |
| • | our operating results failing to meet the expectation of securities analysts or investors in a particular period; |
| • | changes in financial estimates and recommendations by securities analysts concerning us or our markets in general; |
| • | operating and stock price performance of other companies that investors deem comparable to us; |
| • | our ability to market new and enhanced products on a timely basis; |
| • | changes in laws and regulations affecting our business; |
| • | commencement of, or involvement in, litigation involving us; |
| • | changes in our capital structure, such as future issuances of securities or the incurrence of additional debt; |
| • | the volume of securities available for public sale; |
| • | any major change in our board or management; |
| • | sales of substantial amounts of our securities by our directors, executive officers or significant stockholders or the perception that such sales could occur; and |
| • | general economic and political conditions such as recession; interest rate, fuel price, and international currency fluctuations; and acts of war or terrorism. |
41
Table of Contents
Index to Financial Statements
Many of the factors listed above are beyond our control. In addition, broad market and industry factors may materially harm the market price of the Class A Common Stock irrespective of our operating performance. The stock market in general, and NASDAQ have experienced price and volume fluctuations that have often been unrelated or disproportionate to the operating performance of the particular companies affected. The trading prices and valuations of our Class A Common Stock and Warrants, which trade on The NASDAQ Capital Market, may not be predictable. A loss of investor confidence in the market for retail stocks or the stocks of other companies which investors perceive to be similar to us could depress the price of the Class A Common Stock regardless of our business, prospects, financial conditions or results of operations. A decline in the market price of the Class A Common Stock also could adversely affect our ability to issue additional securities and our ability to obtain additional financing in the future.
If securities or industry analysts do not publish or cease publishing research or reports about us, our business, or our market, or if they change their recommendations regarding the Class A Common Stock adversely, the price and trading volume of the Class A Common Stock could decline.
The trading market for the Class A Common Stock relies in part on the research and reports that industry or financial analysts publish about us or our business. We do not control these analysts and there can be no assurance that any will cover us in the future. Furthermore, if one or more analysts do cover us and downgrade or provide negative outlook on our stock or our industry, or the stock of any of our competitors, or publishes inaccurate or unfavorable research about our business, the price of the Class A Common Stock could decline. If one or more of these analysts commence and subsequently cease coverage of our business or fail to publish reports on us regularly, we could lose visibility in the market, which in turn could cause our stock price or trading volume to decline.
Tema and KLR Energy Sponsor, LLC (“KLR Sponsor”) own a significant percentage of our outstanding voting common stock.
Tema and KLR Sponsor currently beneficially own approximately 86.7% of our voting common stock and, upon the conversion of our Series A Preferred Stock, will beneficially own approximately 74.0% of our voting common stock. As long as Tema and KLR Sponsor own or control a significant percentage of outstanding voting power, they will continue to have the ability to strongly influence all corporate actions requiring stockholder approval, including the election and removal of directors and the size of our board of directors, any amendment of our charter or bylaws, or the approval of any merger or other significant corporate transaction, including a sale of substantially all of our assets.
The interests of Tema and KLR Sponsor may not align with the interests of our other stockholders. Tema and KLR Sponsor may acquire and hold interests in businesses that compete directly or indirectly with us. Tema and KLR Sponsor may also pursue acquisition opportunities that may be complementary to our business, and, as a result, those acquisition opportunities may not be available to us. In addition, our second amended and restated certificate of incorporation, amended and restated bylaws and the Shareholders’ and Registration Rights Agreement, dated as of December 20, 2016, by and among the Company, Tema, KLR Sponsor, Anchorage Illiquid Opportunities V, L.P. and AIO V AIV 3 Holdings, L.P. (the “SHRRA”), provide that, subject to certain limitations, we renounce any interest or expectancy in the business opportunities of our officers and directors and their respective affiliates and each such party shall not have any obligation to offer us those opportunities unless presented to one of our directors or officers in his or her capacity as a director or officer.
We are currently a “controlled company” within the meaning of the NASDAQ Listing Rules, but do not expect to retain that status following future equity offerings. However, during the phase-in period we may continue to rely on exemptions from certain corporate governance requirements that provide protection to stockholders of other companies.
Because Tema and KLR Sponsor control a majority of the combined voting power of all classes of our outstanding voting stock, we have been a “controlled company” under NASDAQ corporate governance listing
42
Table of Contents
Index to Financial Statements
standards. Under the NASDAQ rules, a company of which more than 50% of the voting power is held by another person or group of persons acting together is a controlled company and may elect not to comply with certain NASDAQ corporate governance requirements, including the requirements that:
| • | a majority of the board of directors consist of independent directors; |
| • | the nominating and governance committee be composed entirely of independent directors with a written charter addressing the committee’s purpose and responsibilities; and |
| • | the compensation committee be composed entirely of independent directors with a written charter addressing the committee’s purpose and responsibilities. |
Following future equity offerings, we expect that Tema and KLR Sponsor will cease to control a majority of the combined voting power of all classes of our outstanding voting stock. Accordingly, we will no longer be a “controlled company” within the meaning of the rules of NASDAQ. Under NASDAQ rules, a company that ceases to be a controlled company must comply with the independent board committee requirements as they relate to the nominating and corporate governance and compensation committees on the following phase-in schedule: (1) one independent committee member at the time it ceases to be a controlled company, (2) a majority of independent committee members within 90 days of the date it ceases to be a controlled company and (3) all independent committee members within one year of the date it ceases to be a controlled company. Additionally, NASDAQ rules provide a 12-month phase-in period from the date a company ceases to be a controlled company to comply with the majority independent board requirement. During these phase-in periods, our stockholders will not have the same protections afforded to stockholders of companies of which the majority of directors are independent. Additionally, if, within the phase-in periods, we are not able to recruit additional directors who would qualify as independent, or otherwise comply with NASDAQ rules, we may be subject to enforcement actions by NASDAQ. Furthermore, a change in our board of directors and committee membership may result in a change in corporate strategy and operation philosophies, and may result in deviations from our current growth strategy.
The pro forma per share data included in this prospectus gives pro forma effect to the completion of the Transaction and may not be indicative of what our actual financial position or results of operations would have been.
The pro forma per share data included in this prospectus gives pro forma effect to the completion of the Transaction and is presented for illustrative purposes only. The pro forma per share data is not necessarily indicative of what our actual financial position or results of operations would have been had the Transaction been completed on the dates indicated. See “Prospectus Summary—Summary Historical Financial Information.”
Future sales of our common stock could reduce our stock price, and any additional capital raised by us through the sale of equity or convertible securities may dilute your ownership in us.
We may sell additional shares of Class A Common Stock or securities convertible into Class A Common Stock in subsequent public or private offerings. On December 31, 2017, 6,116,635 shares of our Class A Common Stock were outstanding and upon completion of this offering, 16,116,635 shares, or 17,616,635 shares if the underwriters exercise in full their option to purchase additional shares of Class A Common Stock, will be outstanding.
Downward pressure on the market price of our Class A Common Stock that likely will result from sales of our Class A Common Stock issued in connection with the exercise of the Warrants or the conversion of the Class B Common Stock or Series A Preferred Stock could encourage short sales of our Class A Common Stock by market participants. Generally, short selling means selling a security, contract or commodity not owned by the seller. The seller is committed to eventually purchase the financial instrument previously sold. Short sales are used to capitalize on an expected decline in the security’s price. Such sales of our Class A Common Stock could have a tendency to depress the price of the stock, which could increase the potential for short sales.
43
Table of Contents
Index to Financial Statements
We cannot predict the size of future issuances of our Class A Common Stock or securities convertible into Class A Common Stock or the effect, if any, that future issuances and sales of shares of our Class A Common Stock will have on the market price of our Class A Common Stock. Sales of substantial amounts of our Class A Common Stock (including shares issued in connection with an acquisition), or the perception that such sales could occur, may adversely affect prevailing market prices of our common stock.
The Class A Common Stock are equity interests and are therefore subordinated to our indebtedness.
In the event of our liquidation, dissolution or winding up, the Class A Common Stock would rank below our Series A Preferred Stock and Series B Preferred Stock and all secured debt claims against us. As a result, holders of the Class A Common Stock will not be entitled to receive any payment or other distribution of assets upon our liquidation, dissolution or winding up until after all of our obligations to our secured debt holders and to holders of our Series A Preferred Stock and Series B Preferred Stock have been satisfied.
Because we currently have no plans to pay cash dividends on our Class A Common Stock, you may not receive any return on investment unless you sell your Class A Common Stock for a price greater than that which you paid for it.
We currently do not expect to pay any cash dividends on our Class A Common Stock. Any future determination to pay cash dividends or other distributions on our Class A Common Stock will be at the discretion of the board of directors and will be dependent on our earnings, financial condition, operation results, capital requirements, and contractual, regulatory and other restrictions, including restrictions contained in the senior secured credit facility or agreements governing any existing and future outstanding indebtedness we or our subsidiaries may incur, on the payment of dividends by us or by our subsidiaries to us, and other factors that our board of directors deems relevant.
As a result, you may not receive any return on an investment in our Class A Common Stock unless you sell the Class A Common Stock for a price greater than that which you paid for it.
Some of our total outstanding shares are restricted from immediate resale but may be sold into the market in the future. This could cause the market price of our Class A Common Stock to drop significantly, even if our business is doing well.
As of December 31, 2017, KLR Sponsor and Tema hold approximately 86.7% of our issued and outstanding shares of Class A Common Stock, including Class A Common Stock issuable upon exchange of Class B Common Stock. While the SHRRA restricts, except in certain circumstances, KLR Sponsor and Tema from transferring any of their common stock until one year following the date of the consummation of the Transaction, these shares may be sold after the expiration of the lock-up period. As restrictions on resale end, the market price of our Class A Common Stock could decline if the holders of currently restricted shares sell them or are perceived by the market as intending to sell them. Additionally, the Tax Receivable Agreement grants Tema the right to prevent certain dispositions of the assets we acquired in the Transaction for a period of up to three years following the closing of the Transaction.
Additionally, in connection with the Transaction, we issued a total of 95,000 shares of Series A Preferred Stock (convertible into Class A Common Stock) and 9,000,000 warrants (exercisable for Class A Common Stock), and have a total of 25,594,158 warrants outstanding at December 31, 2017. To the extent the Class A Common Stock that is issuable upon conversion or exercise of these securities is sold, the market price of our Class A Common Stock could decline.
44
Table of Contents
Index to Financial Statements
Holders of our Series B Preferred Stock have certain limited consent rights that could prevent us from taking certain corporate actions, and as a result may adversely affect our business, operating results and stock price.
Holders of our Series B Preferred Stock have certain limited consent rights with respect to our ability to take certain corporate actions, including the following:
| • | the issuance, authorization or creation of any class or series of stock senior to or on parity with the Series B Preferred Stock; |
| • | the incurrence of additional indebtedness, provided that such indebtedness may be incurred if, after giving pro forma effect to the incurrence and any application of the proceeds thereof, we maintain a Leverage Ratio (as defined in the Certificate of Designations) of less than 4.00 to 1.00; |
| • | the issuance or incurrence of high-yield debt, unless the debt (A) does not have an all-in interest rate together with any component of yield greater than the Notes (as defined below) and a make-whole provision less favorable than the Second Lien Notes and (B) is used to refinance the Second Lien Notes; |
| • | the entry into any joint venture agreement or issuance of equity securities of our subsidiaries, other than to us or our wholly-owned subsidiaries; |
| • | sales of certain property having a fair market value greater than $15.0 million in any fiscal year and $40.0 million in the aggregate; |
| • | and certain property acquisitions or investments in excess of $15.0 million in any fiscal year and $40.0 million in the aggregate, unless such acquisitions or investments are financed solely using our common equity (or cash proceeds of the issuance of our common equity). |
The consent rights of the holders of our Series B Preferred Stock could prevent us from obtaining future financings to withstand a future downturn in our business or the economy in general, or to otherwise conduct necessary corporate activities, and as a result may adversely affect our business, operating results and stock price.
Anti-takeover provisions contained in our amended and restated charter, as well as provisions of Delaware law, could impair a takeover attempt.
Our amended and restated certificate of incorporation and bylaws contain provisions that may discourage unsolicited takeover proposals that stockholders may consider to be in their best interests. We are also subject to anti-takeover provisions under Delaware law, which could delay or prevent a change of control. Together these provisions may make more difficult the removal of management and may discourage transactions that otherwise could involve payment of a premium over prevailing market prices for our securities. These provisions include:
| • | a staggered board providing for three classes of directors, which limits the ability of a stockholder or group to gain control of our board; |
| • | no cumulative voting in the election of directors, which limits the ability of minority stockholders to elect director candidates; |
| • | the right of our board of directors to elect a director to fill a vacancy created by the expansion of the board of directors or the resignation, death, or removal of a director in certain circumstances, which prevents stockholders from being able to fill vacancies on our board of directors; |
| • | the ability of our board of directors to determine whether to issue shares of our preferred stock and to determine the price and other terms of those shares, including preferences and voting rights, without stockholder approval, which could be used to significantly dilute the ownership of a hostile acquirer; |
| • | the ability of each of Tema or KLR Sponsor to call a special meeting of stockholders, provided that such person owns 15% or more of the outstanding shares of common stock until the Trigger Date, and thereafter prohibit such ability; |
45
Table of Contents
Index to Financial Statements
| • | a prohibition on stockholders calling a special meeting upon and following the Trigger Date, which forces stockholder action to be taken at an annual or special meeting of our stockholders called by the board; |
| • | the requirement that a meeting of stockholders may be called only by the board of directors after the Trigger Date, which may delay the ability of our stockholders to force consideration of a proposal or to take action, including the removal of directors; |
| • | providing that after the Trigger Date directors may be removed prior to the expiration of their terms by stockholders only for cause or upon the affirmative vote of 75% of the voting power of all outstanding shares of the combined company; |
| • | a requirement that changes or amendments to the certificate of incorporation or the bylaws must be approved (i) before the Trigger Date, by a majority of the voting power of outstanding common stock of the combined company, which such majority shall include at least 80% of the shares then held by KLR Sponsor and Tema, and (ii) thereafter, certain changes or amendments must be approved by at least 75% of the voting power of outstanding common stock of the combined company; and |
| • | advance notice procedures that stockholders must comply with in order to nominate candidates to our board of directors or to propose matters to be acted upon at a stockholders’ meeting, which may discourage or deter a potential acquirer from conducting a solicitation of proxies to elect the acquirer’s own slate of directors or otherwise attempting to obtain control of the Company. |
Changes in laws or regulations, or a failure to comply with any laws and regulations, may adversely affect our business, investments and results of operations.
We are subject to laws, regulations and rules enacted by national, regional and local governments and NASDAQ. In particular, we are required to comply with certain SEC, NASDAQ and other legal or regulatory requirements. Compliance with, and monitoring of, applicable laws, regulations and rules may be difficult, time consuming and costly. Those laws, regulations and rules and their interpretation and application may also change from time to time and those changes could have a material adverse effect on our business, investments and results of operations. In addition, a failure to comply with applicable laws, regulations and rules, as interpreted and applied, could have a material adverse effect on our business and results of operations.
We may be required to make payments under the Tax Receivable Agreement for certain tax benefits that we may claim, and the amounts of such payments could be significant.
In connection with the closing of the Transaction, we entered into a Tax Receivable Agreement with Tema. This agreement generally provides for the payment by us to Tema of 90% of the net cash savings, if any, in U.S. federal, state and local income tax and franchise tax that we actually realize or are deemed to realize in certain circumstances as a result of certain increases in the tax basis in the assets of Rosehill Operating and certain benefits attributable to imputed interest. We will retain the benefit of the remaining 10% of these cash savings.
The term of the Tax Receivable Agreement will continue until all tax benefits that are subject to the Tax Receivable Agreement have been utilized or expired, unless we exercise our right to terminate the Tax Receivable Agreement early within thirty (30) days of certain mergers or other changes of control (or the Tax Receivable Agreement is terminated early due to our breach of a material obligation thereunder), and we make the termination payment specified in the Tax Receivable Agreement. In addition, payments we make under the Tax Receivable Agreement will be increased by any interest accrued from the due date (without extensions) of the corresponding tax return.
The payment obligations under the Tax Receivable Agreement are our obligations and not obligations of Rosehill Operating, and we expect that the payments we will be required to make under the Tax Receivable Agreement will be substantial. Estimating the amount and timing of payments that may become due under the Tax Receivable Agreement is by its nature imprecise. For purposes of the Tax Receivable Agreement, cash
46
Table of Contents
Index to Financial Statements
savings in tax generally are calculated by comparing our actual tax liability (determined by using the actual applicable U.S. federal income tax rate and an assumed combined state and local income tax rate) to the amount we would have been required to pay had we not been able to utilize any of the tax benefits subject to the Tax Receivable Agreement. The actual increase in tax basis, as well as the amount and timing of any payments under the Tax Receivable Agreement, are dependent upon significant future events and assumptions, including the timing of the redemptions of Rosehill Operating Common Units, the price of our Class A Common Stock at the time of each redemption, the extent to which such redemptions are taxable transactions, the amount of Tema’s tax basis in its Rosehill Operating Common Units at the time of the relevant redemption, the depreciation and amortization periods that apply to the increase in tax basis, the amount and timing of taxable income we generate in the future, the U.S. federal income tax rates then applicable, and the portion of our payments under the Tax Receivable Agreement that constitute imputed interest or give rise to depreciable or amortizable tax basis. The payments under the Tax Receivable Agreement will not be conditioned upon a holder of rights under the Tax Receivable Agreement having a continued ownership interest in us.
In certain cases, payments under the Tax Receivable Agreement may be accelerated and/or significantly exceed the actual benefits, if any, we realize in respect of the tax attributes subject to the Tax Receivable Agreement.
If we elect to terminate the Tax Receivable Agreement early within thirty (30) days of certain mergers or other changes of control or it is terminated early due to our breach of a material obligation thereunder, our obligations under the Tax Receivable Agreement would accelerate and we would be required to make a substantial immediate lump-sum payment. This payment would equal the present value of the hypothetical future payments that could be required to be paid under the Tax Receivable Agreement (determined by applying a discount rate equal to one-year LIBOR plus 150 basis points). The calculation of hypothetical future payments will be based upon certain assumptions and deemed events set forth in the Tax Receivable Agreement, including (i) the assumption that we have sufficient taxable income to fully utilize the tax benefits covered by the Tax Receivable Agreement and (ii) the assumption that any units (other than those held by us) outstanding on the termination date are deemed to be exchanged on the termination date. Any early termination payment may be made significantly in advance of the actual realization, if any, of the future tax benefits to which the termination payment relates.
Upon an early termination of the Tax Receivable Agreement, we could be required to make payments under the Tax Receivable Agreement that exceed our actual cash tax savings, if any, in respect of the tax attributes subject to the Tax Receivable Agreement. In these situations, our obligations under the Tax Receivable Agreement could have a substantial negative impact on our liquidity and could have the effect of delaying, deferring or preventing certain mergers, asset sales, or other forms of business combinations or changes of control. For example, if the Tax Receivable Agreement had been terminated immediately after the closing of the Transaction, the estimated termination payments would, in the aggregate, have been approximately $ million (calculated using a discount rate equal to one-year LIBOR plus 150 basis points, applied against an undiscounted liability of $ million). The foregoing number is merely an estimate and the actual payments could differ materially. There can be no assurance that we will be able to finance our obligations under the Tax Receivable Agreement.
In the event that we elect to terminate the Tax Receivable Agreement early within thirty (30) days of certain mergers or other changes of control, the consideration payable to holders of our Class A Common Stock could be substantially reduced.
If we elect to terminate the Tax Receivable Agreement early within thirty (30) days of certain mergers or other changes of control, we would be obligated to make a substantial, immediate lump-sum payment, and such payment may be significantly in advance of, and may materially exceed, the actual realization, if any, of the future tax benefits to which the payment relates. As a result of this payment obligation, holders of our Class A Common Stock could receive substantially less consideration in connection with a change of control transaction
47
Table of Contents
Index to Financial Statements
than they would receive in the absence of such obligation. Further, our payment obligations under the Tax Receivable Agreement will not be conditioned upon Tema having a continued interest in us or Rosehill Operating. Accordingly, Tema’s interests may conflict with those of the holders of our Class A Common Stock. Please read “Risk Factors—Risks Related to the Class A Common Stock and Our Capital Structure—In certain cases, payments under the Tax Receivable Agreements may be accelerated and/or significantly exceed the actual benefits we realize, if any, in respect of the tax attributes subject to the Tax Receivable Agreement” and ‘‘Certain Relationships and Related Party Transactions—Tax Receivable Agreement.”
We will not be reimbursed for any payments made under the Tax Receivable Agreement in the event that any tax benefits are subsequently disallowed.
Payments under the Tax Receivable Agreement will be based on the tax reporting positions that we will determine. Tema will not reimburse us for any payments previously made under the Tax Receivable Agreement if any tax benefits that have given rise to payments under the Tax Receivable Agreement are subsequently disallowed, except that excess payments made to Tema will be netted against payments that would otherwise be made to Tema, if any, after our determination of such excess. As a result, in such circumstances, we could make payments that are greater than our actual cash tax savings, if any, and may not be able to recoup those payments, which could adversely affect our liquidity.
In certain circumstances, Rosehill Operating will be required to make tax distributions and tax advances to its unitholders, and the tax distributions and tax advances that Rosehill Operating will be required to make may be substantial.
Pursuant to the Second Amended LLC Agreement, Rosehill Operating will make generally pro rata cash distributions, or tax distributions, to its unitholders, including us, in an amount sufficient to allow us to pay our taxes and to allow us to make payments under the Tax Receivable Agreement with Tema. In addition to these pro rata distributions, certain Rosehill Operating unitholders will be entitled to receive tax advances in an amount sufficient to allow each such unitholder to pay its respective taxes on such holder’s allocable share of Rosehill Operating’s taxable income. Any such tax advance will be calculated after taking into account certain other distributions or payments received by the unitholders from Rosehill Operating. Under the applicable tax rules, Rosehill Operating is required to allocate net taxable income disproportionately to its members in certain circumstances. Tax advances will be determined based on an assumed individual tax rate and will be repaid upon exercise of the redemption right or the call right, as applicable.
Funds used by Rosehill Operating to satisfy its tax distribution and tax advance obligations will not be available for reinvestment in our business. Moreover, the tax distributions and tax advances Rosehill Operating will be required to make may be substantial, and because of the disproportionate allocation of net taxable income, may exceed the actual tax liability for some of the existing owners of Rosehill Operating.
The JOBS Act permits “emerging growth companies” like us to take advantage of certain exemptions from various reporting requirements applicable to other public companies that are not emerging growth companies.
We qualify as an “emerging growth company” as defined in the JOBS Act. As such, we take advantage of certain exemptions from various reporting requirements applicable to other public companies that are not emerging growth companies for as long as we continue to be an emerging growth company, including (i) the exemption from the auditor attestation requirements with respect to internal control over financial reporting under Section 404 of the Sarbanes-Oxley Act, (ii) the exemptions from say-on-pay, say-on-frequency and say-on-golden parachute voting requirements and (iii) reduced disclosure obligations regarding executive compensation in our periodic reports and proxy statements. As a result, our stockholders may not have access to certain information they deem important. We will remain an emerging growth company until the earliest of (i) the last day of the fiscal year following the fifth anniversary of the date of our initial public offering, (ii) the
48
Table of Contents
Index to Financial Statements
last day in the fiscal year in which we have total annual gross revenue of at least $1.07 billion (as adjusted for inflation pursuant to SEC rules from time to time), (iii) the date in which we are deemed to be a large accelerated filer, which means the market value of our Class A Common Stock that is held by non-affiliates exceeds $700 million as of the last business day of our prior second fiscal quarter, or (iv) the date on which we have issued more than $1.0 billion in non-convertible debt during the prior three-year period.
In addition, Section 107 of the JOBS Act provides that an emerging growth company can take advantage of the exemption from complying with new or revised accounting standards provided in Section 7(a)(2)(B) of the Securities Act as long as we are an emerging growth company. An emerging growth company can therefore delay the adoption of certain accounting standards until those standards would otherwise apply to private companies. The JOBS Act provides that a company can elect to opt out of the extended transition period and comply with the requirements that apply to non-emerging growth companies, but any such election to opt out is irrevocable. We have elected not to opt out of such extended transition period, which means that when a standard is issued or revised and it has different application dates for public or private companies, we, as an emerging growth company, can adopt the new or revised standard at the time private companies adopt the new or revised standard. This may make comparison of our financial statements with another public company which is neither an emerging growth company nor an emerging growth company which has opted out of using the extended transition period difficult or impossible because of the potential differences in accountant standards used.
We cannot predict if investors will find our Class A Common Stock less attractive because we will rely on these exemptions. If some investors find our Class A Common Stock less attractive as a result, there may be a less active trading market for our Class A Common Stock and our stock price may be more volatile.
49
Table of Contents
Index to Financial Statements
CAUTIONARY NOTE REGARDING FORWARD-LOOKING STATEMENTS
We make forward-looking statements in this prospectus. These forward-looking statements relate to, among other things, expectations for future financial performance, business strategies and expectations for our business. Specifically, forward-looking statements may include statements relating to:
| • | the benefits of the Transaction and the White Wolf Acquisition; |
| • | the future financial performance of the company; |
| • | changes in our reserves and future operating results; |
| • | expansion plans and opportunities; and |
| • | other statements preceded by, followed by or that include the words “estimate,” “plan,” “project,” “forecast,” “intend,” “expect,” “anticipate,” “believe,” “seek,” “target” or similar expressions. |
These forward-looking statements are based on information available as of the date of this prospectus, and current expectations, forecasts and assumptions, and involve a number of judgments, risks and uncertainties. Accordingly, forward-looking statements should not be relied upon as representing our views as of any subsequent date, and we do not undertake any obligation to update forward-looking statements to reflect events or circumstances after the date they were made, whether as a result of new information, future events or otherwise, except as may be required under applicable securities laws.
You should not place undue reliance on these forward-looking statements in deciding whether to invest in the Class A Common Stock. As a result of a number of known and unknown risks and uncertainties, our actual results or performance may be materially different from those expressed or implied by these forward-looking statements. Some factors that could cause actual results to differ include:
| • | our ability to realize the anticipated benefits from the White Wolf Acquisition; |
| • | declines in oil, natural gas, and NGL prices; |
| • | volatility in the commodity-future markets; |
| • | the occurrence of drilling failures, lower than expected production, and delays; |
| • | the inability to access capital to expand production; |
| • | the outcome of any legal proceedings that may be instituted against us in connection with the Transaction and transactions contemplated thereby; |
| • | legislative or regulatory changes, including retroactive royalty or production tax regimes, hydraulic- fracturing regulation, drilling and permitting regulations, derivatives reform, changes in state and federal corporate taxes, environmental regulation, environmental risks and liability under federal, state and foreign laws and local environmental laws and regulations; |
| • | the possibility that we may be adversely affected by other economic, business, and/or competitive factors; and |
| • | the creditworthiness of our financial counterparties and operation partners; |
| • | other risks and uncertainties indicated in this prospectus, including those set forth under the section entitled “Risk Factors.” |
Should one or more of the risks or uncertainties described in this prospectus occur, or should underlying assumptions prove incorrect, our actual results and plans could differ materially from those expressed in any forward-looking statements.
All forward-looking statements, expressed or implied, included in this prospectus are expressly qualified in their entirety by this cautionary statement. This cautionary statement should also be considered in connection
50
Table of Contents
Index to Financial Statements
with any subsequent written or oral forward-looking statements that we or persons acting on our behalf may issue.
Except as otherwise required by applicable law, we disclaim any duty to update any forward-looking statements, all of which are expressly qualified by the statements in this section, to reflect events or circumstances after the date of this prospectus.
51
Table of Contents
Index to Financial Statements
We expect to receive approximately $ million (or approximately $ million if the underwriters’ option to purchase additional shares is exercised in full) of net proceeds from this offering, after deducting underwriting discounts and estimated offering expenses. We anticipate that we will contribute all of the net proceeds from this offering to Rosehill Operating in exchange for a number of Rosehill Operating Common Units equal to the number of shares of Class A Common Stock issued by us in this offering. Rosehill Operating intends to use the net proceeds from this offering to finance its development plan and for general corporate purposes, including to fund potential future acquisitions.
We anticipate that we will contribute all of the net proceeds from the exercise of the underwriters’ option to purchase additional shares to Rosehill Operating in exchange for additional Rosehill Operating Common Units. Rosehill Operating intends to use the net proceeds from this offering to finance its development plan and for general corporate purposes, including to fund potential future acquisitions.
52
Table of Contents
Index to Financial Statements
PRICE RANGE OF CLASS A COMMON STOCK AND DIVIDEND POLICY
Our Class A Common Stock trades on NASDAQ under the symbol “ROSE.” As of February 13, 2018, there were approximately 10 shareholders of record of our Class A Common Stock. The actual number of holders of our Class A Common Stock is greater than the number of record holders, and includes shareholders who are beneficial owners, but whose shares are held in “street name” by brokers and other nominees. On February 13, 2018, the last reported closing sales price of our common stock was $7.59 per share.
Until the consummation of the Transaction, our Class A Common Stock was listed on NASDAQ under the symbol “KLRE.” Following the Transaction, which was consummated on April 27, 2017, we continued the listing of our Class A Common Stock on NASDAQ under the symbol “ROSE.”
The following table sets forth, for the calendar quarter indicated, the high and low sales prices of our Class A Common Stock as reported on NASDAQ for the periods presented. These comparisons may not provide meaningful information to you in determining whether to purchase shares of our Class A Common Stock. You are urged to obtain current market quotations for our Class A Common Stock and to review carefully the other information contained in this prospectus.
| Class A Common Stock | ||||||||
| High | Low | |||||||
| Fiscal 2016: |
||||||||
| Quarter ended 3/31/2016(1) |
$ | 9.95 | $ | 9.90 | ||||
| Quarter ended 6/30/2016 |
$ | 10.15 | $ | 9.90 | ||||
| Quarter ended 9/30/2016 |
$ | 10.15 | $ | 9.91 | ||||
| Quarter ended 12/31/2016 |
$ | 10.50 | $ | 10.10 | ||||
| Fiscal 2017: |
||||||||
| Quarter ended 3/31/2017 |
$ | 10.65 | $ | 10.20 | ||||
| Quarter ended 6/30/2017 |
$ | 11.69 | $ | 7.80 | ||||
| Quarter ended 9/30/2017 |
$ | 8.98 | $ | 5.52 | ||||
| Quarter ended 12/31/2017 |
$ | 10.84 | $ | 7.62 | ||||
| Fiscal 2018: |
||||||||
| Quarter ended 3/31/2018 (2) |
$ | 8.48 | $ | 6.21 | ||||
| (1) | Beginning on March 29, 2016. |
| (2) | Through February 13, 2018. |
Dividend Policy
We have not paid any cash dividends on the our common stock to date and do not currently contemplate paying dividends in the foreseeable future. The payment of cash dividends in the future will be dependent upon our revenues and earnings, if any, capital requirements and general financial condition. The payment of any future cash dividends will be within the discretion of our board of directors at such time.
Pursuant to that certain Certificate of Designation for the Series A Preferred Stock (the “Certificate of Designation for the Series A Preferred Stock”) filed with the Secretary of State of the State of Delaware on April 27, 2017, holders of Series A Preferred Stock are entitled to receive, when, as and if declared by our board of directors, cumulative dividends, payable in cash, Series A Preferred Stock, or a combination thereof, in each case, at the sole discretion of the Company, at an annual rate of 8% on the $1,000 liquidation preference per share of the Series A Preferred Stock, payable quarterly in arrears on January 15, April 15, July 15 and October 15 of each year, beginning on July 15, 2017.
Pursuant to that certain Certificate of Designation for the Series B Preferred Stock (the “Certificate of Designation for the Series B Preferred Stock”) filed with the Secretary of State of the State of Delaware on
53
Table of Contents
Index to Financial Statements
December 8, 2017, holders of Series B Preferred Stock are entitled to receive, when, as and if declared by our board of directors, cumulative dividends, payable in cash, or with respect to dividends declared for any quarter ending on or prior to January 15, 2019, a combination of cash and Series B Preferred Stock, in each case, at the sole discretion of the Company, at an annual rate of 10% on the $1,000 liquidation preference per share of the Series B Preferred Stock, payable quarterly in arrears on January 15, April 15, July 15 and October 15 of each year, beginning on January 15, 2018.
For a summary of the material terms and provisions of our capital stock, see “Description of Capital Stock.”
54
Table of Contents
Index to Financial Statements
The following table sets forth our cash and cash equivalents and capitalization as of September 30, 2017:
| • | on an actual basis; |
| • | as adjusted to give effect to the White Wolf Acquisition and related financing; and |
| • | as further adjusted to give effect to the increase in our authorized share capital and the sale of Class A Common Stock in this offering (using the public offering price of $ per share and assuming no exercise of the underwriters’ option to purchase additional shares) and the application of the net proceeds from this offering as set forth under “Use of Proceeds.” |
This table should be read in conjunction with, and is qualified in its entirety by reference to, “Management’s Discussion and Analysis of Financial Condition and Results of Operations” and our financial statements and the accompanying notes appearing elsewhere in this prospectus.
| As of September 30, 2017 | ||||||||||||
| Actual | As Adjusted | As Further Adjusted |
||||||||||
| (unaudited) (in thousands, except share counts and par value) |
||||||||||||
| Cash and cash equivalents |
$ | 4,656 | $ | $ | ||||||||
|
|
|
|
|
|
|
|||||||
| Long-term debt, including current maturities: |
||||||||||||
| Credit Facility |
50,000 | |||||||||||
| 10.00% Senior Secured Second Lien Notes due 2023 |
— | |||||||||||
| Notes payable to related party |
375 | |||||||||||
|
|
|
|
|
|
|
|||||||
| Total debt(1) |
$ | 50,375 | $ | $ | ||||||||
|
|
|
|
|
|
|
|||||||
| Series B Preferred stock, $0.0001 par value; 210,000 shares authorized, no shares issued and outstanding (Actual); 210,000 shares authorized, 150,000 shares of Series B Preferred Stock issued and outstanding (As Adjusted); 210,000 shares authorized, 150,000 shares of Series B Preferred Stock issued and outstanding (As Further Adjusted) |
— | |||||||||||
| Stockholders’ equity(2): |
||||||||||||
| Class A Common Stock, $0.0001 par value; 95,000,000 shares authorized, 5,856,581 shares issued and outstanding (Actual); 95,000,000 shares authorized, 5,856,581 shares issued and outstanding (As Adjusted); shares authorized, shares issued and outstanding (As Further Adjusted) |
1 | |||||||||||
| Class B Common Stock, $0.0001 par value; 30,000,000 shares authorized, 29,807,692 shares issued and outstanding (Actual); 35,000,000 shares authorized, 29,807,692 shares issued and outstanding (As Adjusted); 35,000,000 shares authorized, 29,807,692 shares issued and outstanding (As Further Adjusted) |
3 | |||||||||||
| Series A Preferred stock, $0.0001 par value; 150,000 shares authorized, 98,298 shares of Series A Preferred Stock issued and outstanding (Actual); 150,000 shares authorized, 98,298 shares of Series A Preferred Stock issued and outstanding (As Adjusted); 150,000 shares authorized, 98,298 shares of Series A Preferred Stock issued and outstanding (As Further Adjusted) |
80,592 | |||||||||||
| Additional paid-in capital |
20,187 | |||||||||||
| Retained earnings |
— | |||||||||||
|
|
|
|
|
|
|
|||||||
| Non-controlling interest |
30,108 | |||||||||||
|
|
|
|
|
|
|
|||||||
| Total equity |
$ | 130,891 | $ | $ | ||||||||
|
|
|
|
|
|
|
|||||||
| Total capitalization |
$ | 181,266 | $ | $ | ||||||||
|
|
|
|
|
|
|
|||||||
| (1) | As of December 31, 2017, our total debt was $100,000,000. |
| (2) | Assumes shareholders approve the charter amendment to increase authorized share capital. For additional information regarding the proposed charter amendment, see “Description of Capital Stock.” |
55
Table of Contents
Index to Financial Statements
SELECTED HISTORICAL FINANCIAL INFORMATION
We have no direct operations and no significant assets other than our ownership interest in Rosehill Operating, an entity of which we act as the sole managing member and of whose Rosehill Operating Common Units we currently own approximately 17.0% (or 32.9% assuming the conversion of our Rosehill Operating Series A preferred units into Rosehill Operating Common Units). Pro forma for the completion of this offering, we expect to own approximately 35.1% of Rosehill Operating Common Units (or 45.2% assuming the conversion of our Series A preferred units in Rosehill Operating into Rosehill Operating Common Units). Rosehill Operating is considered our accounting predecessor. Unless the context otherwise requires, (i) prior to the completion of the Transaction, references to “Rosehill Operating” refer to the assets, liabilities and operations of the business that were contributed to Rosehill Operating Company, LLC in connection with the Transaction and (ii) following the completion of the Transaction, references to “Rosehill Operating” refer to Rosehill Operating Company, LLC.
The following table shows our and Rosehill Operating’s selected historical financial information for the periods indicated. The selected historical financial information of Rosehill Operating as of December 31, 2016 and 2015 and for the years ended December 31, 2016, 2015 and 2014 was derived from the audited carve-out historical financial statements of our predecessor included elsewhere in this prospectus. Our unaudited interim historical financial information as of and for the nine months ended September 30, 2017 and 2016 was derived from our unaudited interim historical condensed financial statements included elsewhere in this prospectus. The unaudited interim historical financial information has been prepared on a consistent basis with the audited financial statements. The results of operations for the interim periods are not necessarily indicative of the results that may be expected for the full year because of the impact of acquisitions, fluctuations in prices received from oil and natural gas, natural production declines, the uncertainty of exploration and development drilling results and other factors. In addition, because the historical information for the years ended December 31, 2016, 2015 and 2014 relates to periods prior to the completion of the Transaction and reflects 100% of Rosehill Operating’s financial results, such historical information may not be indicative of our results following the Transaction due in part to our 17% ownership interest in Rosehill Operating.
The selected historical financial information should be read in conjunction with “Capitalization,” “Management’s Discussion and Analysis of Financial Condition and Results of Operations,” the financial statements and accompanying notes included elsewhere in this prospectus.
| Nine Months Ended September 30, |
Year Ended December 31, | |||||||||||||||||||
| 2017 | 2016 | 2016 | 2015 | 2014 | ||||||||||||||||
| Statement of Operations Data (in thousands): | (unaudited) | |||||||||||||||||||
| Revenues: |
||||||||||||||||||||
| Oil sales |
$ | 36,464 | $ | 16,437 | $ | 24,807 | $ | 20,601 | $ | 28,444 | ||||||||||
| Natural gas sales |
5,592 | 3,651 | 5,304 | 4,909 | 7,445 | |||||||||||||||
| Natural gas liquids sales |
5,405 | 3,115 | 4,534 | 3,977 | 7,674 | |||||||||||||||
|
|
|
|
|
|
|
|
|
|
|
|||||||||||
| Total revenues |
47,461 | 23,203 | 34,645 | 29,487 | 43,563 | |||||||||||||||
| Operating expenses: |
||||||||||||||||||||
| Lease operating expenses |
6,479 | 3,621 | 4,800 | 4,582 | 6,103 | |||||||||||||||
| Production taxes |
2,174 | 1,051 | 1,541 | 1,311 | 1,861 | |||||||||||||||
| Gathering and transportation expenses |
2,329 | 1,708 | 2,398 | 2,094 | 2,462 | |||||||||||||||
| Depreciation, depletion and amortization and accretion |
26,150 | 16,525 | 24,965 | 23,364 | 15,967 | |||||||||||||||
| Impairment of oil and natural gas properties |
— | — | — | 8,131 | 27,595 | |||||||||||||||
| Exploration costs |
1,208 | 496 | 794 | 960 | 960 | |||||||||||||||
| General and administrative expenses(1) |
11,356 | 3,480 | 9,000 | 4,234 | 5,151 | |||||||||||||||
| Gain on sale of oil and natural gas properties |
— | — | — | — | (6 | ) | ||||||||||||||
| (Gain) loss on sale of other assets |
(11 | ) | — | (50 | ) | 18 | (26 | ) | ||||||||||||
|
|
|
|
|
|
|
|
|
|
|
|||||||||||
| Total operating expenses |
49,685 | 26,881 | 43,448 | 44,694 | 60,067 | |||||||||||||||
|
|
|
|
|
|
|
|
|
|
|
|||||||||||
| Total operating income (loss) |
(2,224 | ) | (3,678 | ) | (8,803 | ) | (15,207 | ) | (16,504 | ) | ||||||||||
56
Table of Contents
Index to Financial Statements
| Nine Months Ended September 30, |
Year Ended December 31, | |||||||||||||||||||
| 2017 | 2016 | 2016 | 2015 | 2014 | ||||||||||||||||
| Statement of Operations Data (in thousands): | (unaudited) | |||||||||||||||||||
| Other income (expense) |
||||||||||||||||||||
| Interest expense, net |
(1,274 | ) | (2,256 | ) | (1,822 | ) | (3,247 | ) | (5,469 | ) | ||||||||||
| Gain (loss) on commodity derivative instruments(2) |
1,751 | (2,132 | ) | (4,169 | ) | 3,735 | 2,404 | |||||||||||||
| Other income (expense), net |
(105 | ) | 23 | (247 | ) | 7 | 316 | |||||||||||||
|
|
|
|
|
|
|
|
|
|
|
|||||||||||
| Total other expense |
372 | (4,365 | ) | (6,238 | ) | 495 | (2,749 | ) | ||||||||||||
|
|
|
|
|
|
|
|
|
|
|
|||||||||||
| Gain (loss) before income taxes(3) |
(1,852 | ) | (8,043 | ) | (15,041 | ) | (14,712 | ) | (19,253 | ) | ||||||||||
| Income tax expense |
(650 | ) | 93 | 148 | 108 | — | ||||||||||||||
|
|
|
|
|
|
|
|
|
|
|
|||||||||||
| Net income (loss) |
$ | (1,202 | ) | $ | (8,136 | ) | $ | (15,198 | ) | $ | (14,820 | ) | $ | (19,253 | ) | |||||
|
|
|
|
|
|
|
|
|
|
|
|||||||||||
| Cash Flow Data (in thousands): |
||||||||||||||||||||
| Net cash provided by operating activities |
$ | 35,527 | $ | 9,328 | $ | 11,461 | $ | 18,244 | $ | 25,525 | ||||||||||
| Net cash used in investing activities |
(100,333 | ) | (11,943 | ) | (22,164 | ) | (16,993 | ) | (53,392 | ) | ||||||||||
| Net cash provided by (used in) financing activities |
61,028 | (20,661 | ) | (8,597 | ) | 17,519 | 23,457 | |||||||||||||
| Other Financial Data (in thousands): |
||||||||||||||||||||
| Adjusted EBITDAX (unaudited)(4) |
$ | 23,972 | $ | 13,353 | $ | 15,041 | $ | 20,783 | $ | 27,388 | ||||||||||
| As of September 30, 2017 |
As of December 31, | |||||||||||||||
| 2016 | 2015 | 2014 | ||||||||||||||
| (unaudited) | ||||||||||||||||
| Balance Sheet Data (in thousands): |
||||||||||||||||
| Cash and cash equivalents |
$ | 4,656 | $ | 8,434 | $ | 27,734 | $ | 8,964 | ||||||||
| Other current assets |
7,758 | 7,909 | 5,962 | 8,828 | ||||||||||||
|
|
|
|
|
|
|
|
|
|||||||||
| Total current assets |
12,414 | 16,343 | 33,696 | 17,792 | ||||||||||||
| Total property and equipment, net |
214,026 | 123,373 | 122,873 | 137,848 | ||||||||||||
| Other long—term assets, net |
1,365 | 110 | 334 | 251 | ||||||||||||
|
|
|
|
|
|
|
|
|
|||||||||
| Total assets |
$ | 227,805 | $ | 139,826 | $ | 156,903 | $ | 155,891 | ||||||||
|
|
|
|
|
|
|
|
|
|||||||||
| Current liabilities, other |
$ | 41,187 | $ | 14,223 | $ | 9,165 | $ | 11,549 | ||||||||
| Current portion, long term debt |
— | — | 20,000 | — | ||||||||||||
| Long term debt, net of current portion |
50,000 | 55,000 | 45,000 | 75,000 | ||||||||||||
| Note payable, related party |
— | — | — | 10,000 | ||||||||||||
| Other long-term liabilities |
5,727 | 5,383 | 3,761 | 3,164 | ||||||||||||
|
|
|
|
|
|
|
|
|
|||||||||
| Total liabilities |
96,914 | 74,606 | 77,926 | 99,713 | ||||||||||||
|
|
|
|
|
|
|
|
|
|||||||||
| Total stockholders’ equity / parent net investment |
130,891 | 65,220 | 78,977 | 56,178 | ||||||||||||
|
|
|
|
|
|
|
|
|
|||||||||
| Total liabilities and stockholders’ equity / parent net investment |
$ | 227,805 | $ | 139,826 | $ | 156,903 | $ | 155,891 | ||||||||
|
|
|
|
|
|
|
|
|
|||||||||
| (1) | Includes transaction expenses incurred in connection with the Transaction. |
| (2) | Gain (loss) on commodity derivative instruments was previously presented separately within Revenues for the years ended December 31, 2016, 2015 and 2014. |
| (3) | Rosehill Operating is treated as a partnership for U.S. federal income tax purposes and for purposes of certain state and local income taxes. Rosehill Operating is subject to the Texas margins tax at a rate of 0.75%. |
| (4) | Adjusted EBITDAX is a non-GAAP financial measure. For a definition of Adjusted EBITDAX and a reconciliation of Adjusted EBITDAX to net income, see “Prospectus Summary—Non-GAAP Financial Measure.” |
57
Table of Contents
Index to Financial Statements
MANAGEMENT’S DISCUSSION AND ANALYSIS OF FINANCIAL CONDITION AND RESULTS OF OPERATIONS
The following discussion and analysis should be read in conjunction with the “Selected Historical Financial Information” and the accompanying carve-out financial statements of the Assets and Liabilities of the Business Contributed to Rosehill Operating Company, LLC and our unaudited interim historical financial information as of and for the nine months ended September 30, 2017 and the related notes included elsewhere in this prospectus. The following discussion contains forward-looking statements that reflect our future plans, estimates, beliefs and expected performance. The forward-looking statements are dependent upon events, risks and uncertainties that may be outside of our control. Our actual results could differ materially from those discussed in these forward-looking statements. Factors that could cause or contribute to such differences include, but are not limited to, market prices for oil, natural gas and NGLs, production volumes, estimates of proved reserves, capital expenditures, economic and competitive conditions, regulatory changes and other uncertainties, as well as those factors discussed below and elsewhere in this prospectus, particularly in “Risk Factors” and “Cautionary Note Regarding Forward-Looking Statements,” all of which are difficult to predict. In light of these risks, uncertainties and assumptions, the forward-looking events discussed may not occur.
Overview
We are an independent oil and natural gas company focused on the acquisition, exploration, development and production of unconventional oil and associated liquids-rich natural gas reserves in the Permian Basin. Our assets are concentrated in the Delaware Basin, a sub-basin of the Permian Basin. We have drilling locations in ten distinct formations in the Delaware Basin in: the Brushy Canyon, Upper Avalon, Lower Avalon, 2nd Bone Spring Shale, 2nd Bone Spring Sand, 3rd Bone Spring Sand, 3rd Bone Spring Shale, Upper Wolfcamp A (X/Y), Lower Wolfcamp A and Wolfcamp B, and our goal is to build a premier development and acquisition company focused on horizontal drilling in the Delaware Basin. We are actively applying new technologies, such as extended length lateral drilling and enhanced completion techniques, throughout our two core operating areas: the Northern Delaware Basin and the Southern Delaware Basin. As of December 31, 2016, we also operated 18 vertical and 21 horizontal wells in the Barnett Shale in the Fort Worth Basin. We sold our assets in the Fort Worth Basin on October 31, 2017.
We were incorporated in Delaware on September 21, 2015 as a special purpose acquisition company under the name of KLR Energy Acquisition Corporation for the purpose of effecting a merger, capital stock exchange, asset acquisition, stock purchase, reorganization or similar business combination involving us and one or more businesses. On April 27, 2017, we consummated the Transaction pursuant to which we acquired a portion of the equity of Rosehill Operating, into which Tema, a wholly-owned subsidiary of Rosemore, contributed certain assets and liabilities. At the closing of the Transaction, we became the sole managing member of Rosehill Operating and our sole material asset is our interest in Rosehill Operating. Following the Transaction, we changed our name to Rosehill Resources Inc.
We have no direct operations and no significant assets other than our ownership interest in Rosehill Operating, an entity of which we act as the sole managing member and of whose common units we currently own approximately 17.0% (or 32.9% assuming the conversion of out Rosehill Operating Series A preferred units into Rosehill Operating Common Units). Pro forma for the completion of this offering, we expect to own approximately 35.1% of Rosehill Operating Common Units (or 45.2% assuming the conversion of our Series A preferred units in Rosehill Operating into Rosehill Operating Common Units).
Market Conditions
The oil and natural gas industry is cyclical and commodity prices are highly volatile. In the second half of 2014, oil prices began a rapid and significant decline as the global oil supply began to outpace demand. During 2015, 2016 and 2017, the global oil supply continued to outpace demand, resulting in a sustained decline in
58
Table of Contents
Index to Financial Statements
realized prices for oil production. In general, this imbalance between supply and demand reflects the significant supply growth achieved in the United States as a result of shale drilling and oil production increases by certain other countries, including the efforts of Russia and Saudi Arabia to retain market share, combined with only modest demand growth in the United States and less-than-expected demand in other parts of the world, particularly in Europe and China. Although there has been a dramatic decrease in drilling activity in the industry since 2014, oil storage levels in the United States remain at historically high levels. Until supply and demand balance and the overhang in storage levels begins to decline, prices are expected to remain under pressure. In addition, the lifting of economic sanctions on Iran has resulted in increasing supplies of oil from Iran, adding further downward pressure to oil prices. NGL prices generally correlate to the price of oil. Also adversely affecting NGL prices is the supply of NGLs in recent years. Prices for domestic natural gas began to decline during the third quarter of 2014 and continued to be weak during 2015 through 2017. This decline is primarily due to an imbalance between supply and demand across North America. The duration and magnitude of commodity price declines cannot be accurately predicted.
Our revenue, profitability and future growth are highly dependent on the prices we receive for our oil and natural gas production, as well as NGLs that are extracted from our natural gas during processing.
For the nine months ended September 30, 2017 and 2016, our average realized oil price per barrel was $45.92 and $38.31, respectively. For the nine months ended September 30, 2017 and 2016, our average realized natural gas price per Mcf was $2.68 and $2.03, respectively, and our average realized price for NGLs per barrel was $17.32 and $11.33, respectively. For the year ended December 31, 2016, 2015 and 2014, our average realized oil price per barrel was $40.52, $43.62 and $77.93, respectively. For the year ended December 31, 2016, 2015 and 2014, our average realized natural gas price per Mcf was $2.23, $2.37 and $4.06, respectively, and our average realized price for NGLs per barrel was $12.68, $12.75 and $26.93 and, respectively. These commodity prices represent our realized prices before the effects of commodity derivative settlements. Lower oil, natural gas and NGL prices may not only decrease our revenues but may also reduce the amount of oil, natural gas and NGLs that we can produce economically, which may consequently reduce our oil, natural gas, and NGL reserves. Lower commodity prices in the future could result in impairments of our properties and may materially and adversely affect our future business, financial condition, results of operations, operating cash flows, liquidity, or ability to finance planned capital expenditures. Lower oil, natural gas, and NGL prices may also reduce the borrowing base under our credit agreement, which may be determined at the discretion of the lenders and is based on the collateral value of our proved reserves that have been mortgaged to the lenders. Alternatively, higher oil and natural gas prices may result in significant non-cash fair value losses being incurred on our commodity derivatives, which could cause us to experience net losses when oil and natural gas prices rise.
How We Evaluate Our Operations
We use a variety of financial and operational metrics to assess the performance of our oil and natural gas operations, including:
| • | realized prices on the sale of oil, natural gas, and NGLs, including the effect of our commodity derivative contracts on our oil and natural gas production; |
| • | production results; |
| • | operating expenses on a per Barrel of oil equivalent (“Boe”); and |
| • | Adjusted EBITDAX. |
See “—Sources of Our Revenues,” “—Realized Prices,” “—Production Results,” “—Operating Costs and Expenses” and “—Adjusted EBITDAX” below for a discussion of these metrics.
Sources of Our Revenues
Our revenues are derived from the sale of our oil and natural gas production, as well as the sale of NGLs that are extracted from our natural gas during processing. Oil sales contributed 77% and 71% of our total
59
Table of Contents
Index to Financial Statements
revenues for the nine months ended September 30, 2017 and 2016, respectively. Natural gas sales contributed 12% and 16% and NGL sales contributed 11% and 13% of our total revenues for the nine months ended September 30, 2017 and 2016, respectively. Our oil, natural gas, and NGL revenues and percentages do not include the effects of commodity derivatives.
Realized Prices
Fluctuations in our revenue, profitability, cash flow and future production growth are highly dependent on the commodity prices we receive. Oil, natural gas, and NGL prices are market driven and have been historically volatile, and we expect that future prices will continue to fluctuate due to, but not limited to, supply and demand factors, seasonality, and geopolitical and economic factors. See “—Market Conditions” for information regarding the current commodity price environment. A 10% change in our realized oil, natural gas and NGL prices would have changed revenue by $3.6 million, $0.6 million and $0.5 million, respectively, for the nine months ended September 30, 2017.
The following table presents our average realized commodity prices for the periods indicated before the effects of cash settled commodity derivatives:
| Nine Months Ended September 30, |
Year Ended December 31, | |||||||||||||||||||
| 2017 | 2016 | 2016 | 2015 | 2014 | ||||||||||||||||
| Crude Oil (per Bbl): |
||||||||||||||||||||
| Average realized price, before the effects of cash settled commodity derivatives |
$ | 45.92 | $ | 38.31 | $ | 40.52 | $ | 43.62 | $ | 77.93 | ||||||||||
| Natural Gas (per Mcf): |
||||||||||||||||||||
| Average realized price, before the effects of cash settled commodity derivatives |
$ | 2.68 | $ | 2.03 | $ | 2.23 | $ | 2.37 | $ | 4.06 | ||||||||||
| NGLs (per Bbl): |
||||||||||||||||||||
| Average realized price, before the effects of cash settled commodity derivatives |
$ | 17.32 | $ | 11.33 | $ | 12.68 | $ | 12.75 | $ | 26.93 | ||||||||||
The prices we receive for our products are based on NYMEX benchmark pricing and adjusted for quality, energy content, transportation fees, and regional price differentials.
See “Results of Operations” below for an analysis of the impact changes in realized prices had on our revenues.
Operational and Financial Highlights for the nine months ended September 30, 2017 and 2016 and the years ended December 31, 2016, 2015, and 2014
Production Results
The following table presents production volumes for our properties for the periods indicated:
| Nine Months Ended September 30, |
Year Ended December 31, | |||||||||||||||||||
| 2017 | 2016 | 2016 | 2015 | 2014 | ||||||||||||||||
| Oil (MBbls) |
794 | 429 | 612 | 472 | 365 | |||||||||||||||
| Natural gas (MMcf) |
2,089 | 1,796 | 2,381 | 2,074 | 1,834 | |||||||||||||||
| NGLs (MBbls) |
312 | 275 | 358 | 312 | 285 | |||||||||||||||
|
|
|
|
|
|
|
|
|
|
|
|||||||||||
| Total (MBoe)(1) |
1,454 | 1,003 | 1,367 | 1,130 | 956 | |||||||||||||||
|
|
|
|
|
|
|
|
|
|
|
|||||||||||
| Average net daily production (Boe/d)(1) |
5,327 | 3,662 | 3,734 | 3,096 | 2,618 | |||||||||||||||
|
|
|
|
|
|
|
|
|
|
|
|||||||||||
| (1) | May not sum due to rounding. |
60
Table of Contents
Index to Financial Statements
As reservoir pressures decline, production from a given well or formation decreases. Growth in our future production and reserves will depend on our ability to continue to add proved reserves in excess of our production. Accordingly, we plan to maintain our focus on adding reserves through drilling as well as acquisitions. Our ability to add reserves through development projects and acquisitions is dependent on many factors, including our ability to borrow or raise capital, obtain regulatory approvals, procure contract drilling rigs and personnel and successfully identify and consummate acquisitions. Please read “Risk Factors—Risks Related to Our Operations” for a discussion of these and other risks affecting our proved reserves and production.
Derivative Activity
To achieve a more predictable cash flow and reduce exposure to adverse fluctuations in commodity prices, we have historically used commodity derivative instruments, such as options and swaps, to hedge price risk associated with a portion of our anticipated oil and natural gas production. By removing a significant portion of the price volatility associated with our oil and natural gas production, we believe we will mitigate, but not eliminate, the potential negative effects of reductions in oil and natural gas prices on our cash flow from operations for those periods. However, in a portion of our current positions, hedging activity may also reduce our ability to benefit from increases in oil and natural gas prices. We will sustain losses to the extent our commodity derivative contract prices are lower than market prices and, conversely, we will sustain gains to the extent our commodity derivative contract prices are higher than market prices. In certain circumstances, where we have unrealized gains in our commodity derivatives portfolio, we may choose to restructure existing commodity derivative contracts or enter into new transactions to modify the terms of current contracts in order to realize the current value of our existing positions. We are under no obligation to hedge a specific portion of our production. See “—Quantitative and Qualitative Disclosure About Market Risk—Commodity Price Risk” for information regarding our exposure to market risk, including the effects of changes in commodity prices, and our commodity derivative contracts.
We have historically relied on commodity derivative contracts to mitigate our exposure to lower commodity prices, and we expect to continue to utilize commodity derivative instruments to hedge price risk in the future. From time to time, we have been able to hedge our oil and natural gas production at prices that are higher than current strip prices. Derivative instruments we enter into in the future will be based on then-current commodity prices, which may be less favorable than current commodity prices. Our hedging strategy and future hedging transactions will generally be determined at our discretion and may be different than what we have done on a historical basis.
We have relied on a variety of hedging strategies and instruments to hedge future price risk. We have utilized swap and options to reduce the effect of price changes on a portion of our oil and natural gas production.
A swap has an established fixed price. When the settlement price is below the fixed price, the counterparty pays us an amount equal to the difference between the settlement price and the fixed price multiplied by the hedged contract volume. When the settlement price is above the fixed price, we pay our counterparty an amount equal to the difference between the settlement price and the fixed price multiplied by the hedged contract value.
A put option has an established floor price. The buyer of the put option pays the seller a premium to enter into the put option. When the settlement price is below the floor price, the seller pays the buyer an amount equal to the difference between the settlement price and the strike price multiplied by the hedged contract volume. When the settlement price is above the floor price, the put option expires worthless.
A call option has an established ceiling price. The buyer of the call option pays the seller a premium to enter into the call option. When the settlement price is above the ceiling price, the seller pays the buyer an amount equal to the difference between the settlement price and the strike price multiplied by the hedged contract volume. When the settlement price is below the ceiling price, the call option expires worthless.
61
Table of Contents
Index to Financial Statements
Below is a summary of our open commodity derivative instrument positions for 2017 and beyond as of September 30, 2017, by product and strategy:
| Three Months Ended | ||||||||||||||||||||||||||||||||||||
| 12/31/2017 | 3/3/2018 | 6/30/2018 | 9/30/2018 | 12/31/2018 | 3/31/2019 | 6/30/2019 | 9/30/2019 | 12/31/2019 | ||||||||||||||||||||||||||||
| NYMEX WTI(1) Crude Swaps: |
||||||||||||||||||||||||||||||||||||
| Notional volume (Bbl) |
144,000 | 129,000 | 105,000 | 108,000 | 108,000 | 27,000 | 27,000 | 27,000 | 27,000 | |||||||||||||||||||||||||||
| Weighted average fixed price ($/Bbl) |
$ | 52.78 | $ | 52.19 | $ | 50.44 | $ | 50.39 | $ | 50.39 | $ | 51.04 | $ | 51.04 | $ | 51.04 | $ | 51.04 | ||||||||||||||||||
| NYMEX HH(2) Natural Gas Swaps: |
||||||||||||||||||||||||||||||||||||
| Notional volume (MMBtu) |
390,000 | 690,000 | 180,000 | 180,000 | 180,000 | 60,000 | — | — | — | |||||||||||||||||||||||||||
| Weighted average fixed price ($/MMBtu) |
$ | 3.13 | $ | 3.43 | $ | 3.03 | $ | 3.03 | $ | 3.03 | $ | 3.03 | $ | — | $ | — | $ | — | ||||||||||||||||||
| NYMEX HH(2) Natural Gas Options: |
||||||||||||||||||||||||||||||||||||
| Purchased Puts: |
||||||||||||||||||||||||||||||||||||
| Notional volume (MMBtu) |
180,000 | — | — | — | — | — | — | — | — | |||||||||||||||||||||||||||
| Weighted average fixed price ($/MMBtu) |
$ | 3.30 | $ | — | $ | — | $ | — | $ | — | $ | — | $ | — | $ | — | $ | — | ||||||||||||||||||
| Sold Puts: |
||||||||||||||||||||||||||||||||||||
| Notional volume (MMBtu) |
180,000 | — | — | — | — | — | — | — | — | |||||||||||||||||||||||||||
| Weighted average fixed price ($/MMBtu) |
2.75 | — | — | — | — | — | — | — | — | |||||||||||||||||||||||||||
| Calls: |
||||||||||||||||||||||||||||||||||||
| Notional volume (MMBtu) |
180,000 | — | — | — | — | — | — | — | — | |||||||||||||||||||||||||||
| Weighted average fixed price ($/MMBtu) |
$ | 3.92 | $ | — | $ | — | $ | — | $ | — | $ | — | $ | — | $ | — | $ | — | ||||||||||||||||||
| (1) | NYMEX WTI refers to West Texas Intermediate crude oil price on the New York Mercantile Exchange. |
| (2) | NYMEX HH refers to Henry Hub natural gas price on the New York Mercantile Exchange. |
As of September 30, 2017, our open commodity derivative positions with respect to future production were as follows::
| 2017 | 2018 | 2019 | ||||||||||
| Commodity derivative swaps |
||||||||||||
| Oil: |
||||||||||||
| Notional volume (Bbl) |
144,000 | 450,000 | 108,000 | |||||||||
| Weighted average price ($/Bbl) |
$ | 52.78 | $ | 50.92 | $ | 51.04 | ||||||
| Natural Gas: |
||||||||||||
| Notional volume (MMBtu) |
390,000 | 1,230,000 | 60,000 | |||||||||
| Weighted average price ($/MMBtu) |
$ | 3.13 | $ | 3.25 | $ | 3.03 | ||||||
| Commodity derivative options |
||||||||||||
| Natural Gas: |
||||||||||||
| Notional volume (MMBtu) |
180,000 | — | — | |||||||||
| Weighted average price ($/MMBtu) |
$ | 3.32 | $ | — | $ | — | ||||||
Commodity derivative instruments are recognized on the balance sheet as either assets or liabilities measured at fair value. We have not elected to apply cash flow hedge accounting, and consequently, recognize gains and losses in earnings rather than deferring such amounts in other comprehensive income as allowed under cash flow hedge accounting. Fair value gains or losses, as well as cash receipts or payments on settled commodity derivative contracts, are recognized in our results of operations. Cash flows from commodity derivatives are reported as cash flows from operating activities. These gains and losses have been allocated to us for the purpose of the our financial statements.
62
Table of Contents
Index to Financial Statements
At the closing of the Transaction, selected crude oil and natural gas options remained with Tema and the remainder were transferred to us. All crude oil and natural gas swaps were transferred to us as part of the Transaction.
Operating Costs and Expenses
Costs associated with producing oil, natural gas, and NGLs are substantial. Some of these costs vary with commodity prices, some trend with the type and volume of production, and others are a function of the number of wells we own. As of December 31, 2017 and 2016, we owned interests in 57 and 69 gross producing wells, respectively.
Lease Operating Expenses. Lease operating expenses (“LOE”) are the costs incurred in the operation of producing properties and workover costs. Expenses for direct labor, water/gas injection, water disposal, compressor rental, and chemicals comprise the most significant portion of our LOE. Certain items, such as direct labor and compressor rental, generally remain relatively fixed across broad production volume ranges, but can fluctuate depending on activities performed during a specific period. For instance, repairs to our pumping equipment or surface facilities result in increased LOE in periods during which they are performed. Certain of our operating cost components are variable and increase or decrease as the level of produced hydrocarbons and water increases or decreases. For example, we incur water disposal costs in connection with various production-related activities, such as trucking water for disposal until connection can be made to a water disposal well.
We monitor our operations to ensure that we are incurring LOE at an acceptable level. For example, we monitor our LOE per Boe to determine if any wells or properties should be shut in, recompleted, or sold. This unit rate also allows us to monitor these costs in certain fields and geographic areas to identify trends and to benchmark against other producers. Although we strive to reduce our LOE, these expenses can increase or decrease on a per unit basis as a result of various factors as we operate our properties or makes acquisitions and dispositions of properties. For example, we may increase field level expenditures to optimize our operations, incurring higher expenses in one quarter relative to another, or we may acquire or dispose of properties that have different LOE per Boe. These initiatives would influence our overall operating cost and could cause fluctuations when comparing LOE on a period to period basis.
We are also subject to ad valorem taxes in the counties where our production is located. Ad valorem taxes are generally based on the valuation of our oil and natural gas properties, which trend with oil and natural gas prices.
Production Taxes. Production taxes are paid on produced oil and natural gas based on a percentage of revenues from production sold at fixed rates established by federal, state, or local taxing authorities. In general, the production taxes we pay correlate to the changes in oil, natural gas, and NGL revenues.
Gathering and Transportation Expense. Gathering and transportation expense principally consists of expenditures to prepare and transport production from the wellhead to a specified sales point and gas processing costs. These costs will fluctuate with increases or decreases in production volumes, contractual fees, and changes in fuel and compression costs.
Depreciation, Depletion, and Amortization. Depreciation, depletion, and amortization (“DD&A”) is the systematic expensing of the capitalized costs incurred to acquire and develop oil and natural gas properties. We use the successful efforts method of accounting for oil and natural gas activities, and, as such, we capitalize all costs associated with our development and acquisition efforts and all successful exploration efforts, which are then allocated to each unit of production using the unit of production method. Please read “—Critical Accounting Policies and Estimates—Successful Efforts Method of Accounting for Oil and Natural Gas Activities” for further discussion.
63
Table of Contents
Index to Financial Statements
Accretion Expense. Accretion expense is the periodic accreting of the present value of the estimated asset retirement liability to reflect the passage of time.
Impairment Expense. We review our proved properties and unproved leasehold costs for impairment whenever events and changes in circumstances indicate that a decline in the recoverability of their carrying value may have occurred. Impairment is reviewed and recorded on a property-by-property basis. Please read “—Critical Accounting Policies and Estimates—Impairment of Oil and Natural Gas Properties” for further discussion.
General and Administrative Expenses. General and administrative (“G&A”) expenses are costs incurred for overhead, including payroll and benefits for our corporate staff, costs of maintaining our headquarters, costs of managing our production and development operations, audit and other fees for professional services, and legal compliance. A portion of these expenses have been allocated to us from Tema (on the basis of direct usage when identifiable with the remainder allocated proportionately on a Boe basis) for the purpose of our carve-out financial statements.
Transaction Expense. Transaction expenses are costs incurred in connection with the Transaction. Under the terms of the Business Combination Agreement dated December 31, 2016 (the “Business Combination Agreement”), Tema and Rosemore were entitled to be reimbursed for transaction expenses incurred through the closing of the transaction.
Interest Expense, Net. Tema historically financed a portion of our working capital requirements and capital expenditures with borrowings under its secured line of credit. As a result, we have incurred interest expense that is affected by both fluctuations in interest rates and Tema’s financing decisions. Interest paid to lenders under the secured line of credit is reflected in interest expense, net. These expenses have been allocated to us for purposes of the our carve-out financial statements.
Adjusted EBITDAX
We define Adjusted EBITDAX as net income (loss) before interest expense, income taxes, DD&A, accretion and impairment of oil and natural gas properties, (gains) losses on commodity derivatives excluding net cash receipts (payments) on settled commodity derivatives, gains and losses from the sale of assets and other non-cash operating items. Adjusted EBITDAX is not a measure of net income as determined by U.S. GAAP.
We believe Adjusted EBITDAX is useful because it allows us to more effectively evaluate our operating performance and compare our results of operations from period to period and against our peers without regard to financing methods or capital structure. We exclude the items listed above from net income in arriving at Adjusted EBITDAX because these amounts can vary substantially from company to company within our industry depending upon accounting methods and book values of assets, capital structures and the method by which the assets were acquired. Adjusted EBITDAX should not be considered as an alternative to, or more meaningful than, net income as determined in accordance with U.S. GAAP or as an indicator of our operating performance or liquidity. Certain items excluded from Adjusted EBITDAX are significant components in understanding and assessing a company’s financial performance, such as a company’s cost of capital and tax structure, as well as the historic costs of depreciable assets, none of which are components of Adjusted EBITDAX. Our presentation of Adjusted EBITDAX should not be construed as an inference that our results will be unaffected by unusual or non-recurring items. Our computations of Adjusted EBITDAX may not be comparable to other similarly titled measures of other companies. For further discussion, please read “Prospectus Summary—Summary Historical Financial Information—Non-GAAP Financial Measure.”
64
Table of Contents
Index to Financial Statements
Factors Affecting the Comparability of Our Future Financial Data Results to the Historical Financial Results of Rosehill Operating
Our future results of our operations may not be comparable to the historical results of operations of Rosehill Operating for the periods presented due to the following reasons:
Income Taxes. Rosehill Operating is a limited liability company electing to be taxed as a partnership and, therefore, it will not incur entity level tax. Any taxable income or loss generated by Rosehill Operating is passed through to and included in the taxable income or loss of its members, including us, on a pro rata basis. We are subject to U.S. federal income taxes, in addition to state and local income taxes with respect to our allocable share of any taxable income or loss of Rosehill Operating, as well as any stand-alone income or loss generated by us. Subject to certain restrictions, we generally will be required to make pro rata distributions to our members in an amount at least sufficient to allow them to pay their taxes. Such distributions will reduce the cash available to be used in Rosehill Operating’s business.
Public Company Expenses. We incur direct G&A expense as a result of being a publicly traded company, including, but not limited to, costs associated with hiring new personnel, implementation of compensation programs that are competitive with our public company peer group, annual and quarterly reports to stockholders, tax return preparation, independent auditor fees, investor relations activities, registrar and transfer agent fees, incremental director and officer liability insurance costs, and independent director compensation. These direct G&A expenses are not included in Rosehill Operating’s historical financial results of operations prior to the Transaction date of April 27, 2017.
65
Table of Contents
Index to Financial Statements
Results of Operations
Nine months ended September 30, 2017 Compared to Nine months ended September 30, 2016
Oil, Natural Gas, and NGL Sales Revenues. The following table provides the components of our revenues for the periods indicated, as well as each period’s respective average realized prices and production volumes:
| Nine Months Ended September 30, | Change | Change% | ||||||||||||||
| (unaudited) | 2017 | 2016 | ||||||||||||||
| Revenues (in thousands): |
||||||||||||||||
| Oil sales |
$ | 36,464 | $ | 16,437 | $ | 20,027 | 122 | % | ||||||||
| Natural gas sales |
5,592 | 3,651 | 1,941 | 53 | % | |||||||||||
| NGLs sales |
5,405 | 3,115 | 2,290 | 74 | % | |||||||||||
|
|
|
|
|
|
|
|
|
|||||||||
| Total revenues |
$ | 47,461 | $ | 23,203 | $ | 24,258 | 105 | % | ||||||||
|
|
|
|
|
|
|
|
|
|||||||||
| Average sales price(1): |
||||||||||||||||
| Oil (per Bbl) |
$ | 45.92 | $ | 38.31 | $ | 7.61 | 20 | % | ||||||||
| Natural gas (per Mcf) |
2.68 | 2.03 | 0.65 | 32 | % | |||||||||||
| NGLs (per Bbl) |
17.32 | 11.33 | 5.99 | 53 | % | |||||||||||
|
|
|
|
|
|
|
|
|
|||||||||
| Total (per Boe) |
$ | 32.64 | $ | 21.63 | $ | 9.51 | 41 | % | ||||||||
|
|
|
|
|
|
|
|
|
|||||||||
| Total, including effects of gain on settled commodity derivatives, net (per Boe) |
$ | 32.75 | $ | 23.62 | $ | 9.13 | 39 | % | ||||||||
| Net Production: |
||||||||||||||||
| Oil (MBbls) |
794 | 429 | 365 | 85 | % | |||||||||||
| Natural gas (MMcf) |
2,089 | 1,796 | 293 | 16 | % | |||||||||||
| NGLs (MBbls) |
312 | 275 | 37 | 13 | % | |||||||||||
|
|
|
|
|
|
|
|
|
|||||||||
| Total (MBoe) |
1,454 | 1,003 | 451 | 45 | % | |||||||||||
|
|
|
|
|
|
|
|
|
|||||||||
| Average daily net production volume: |
||||||||||||||||
| Oil (Bbls/d) |
2,908 | 1,566 | 1,342 | 86 | % | |||||||||||
| Natural gas (Mcf/d) |
7,651 | 6,557 | 1,094 | 17 | % | |||||||||||
| NGLs (Bbls/d) |
1,144 | 1,003 | 141 | 14 | % | |||||||||||
|
|
|
|
|
|
|
|
|
|||||||||
| Total (Boe/d) |
5,327 | 3,662 | 1,665 | 45 | % | |||||||||||
|
|
|
|
|
|
|
|
|
|||||||||
| (1) | Excluding the effects of realized and unrealized commodity derivative transactions unless noted otherwise. |
The increase in total revenues is due to increases in oil sales, natural gas sales, and NGL sales resulting from higher production volumes and higher average sales prices. The increase in average daily net production contributed $18.2 million, and the increase in the average sales price contributed $6.1 million, to the overall revenue increase. The increase in average net daily production is attributable to seven additional operated wells being on production during the nine months ended September 30, 2017 as compared to the prior period.
Oil sales increased primarily due to increased oil production contributing $16.8 million, and average sales prices for oil contributing $3.3 million. Natural gas sales increased primarily due to increased average sales prices for natural gas contributing $1.2 million, and natural gas production contributing $0.8 million. NGL sales increased primarily due to increased average sales prices for NGL contributing $1.6 million and increased NGL production contributing $0.6 million.
66
Table of Contents
Index to Financial Statements
Operating Expenses. The following table summarizes our operating expenses for the periods indicated:
| Nine Months Ended September 30, | Change | Change% | ||||||||||||||
| (unaudited) | 2017 | 2016 | ||||||||||||||
| Operating expenses (in thousands): |
||||||||||||||||
| Lease operating expense |
$ | 6,479 | $ | 3,621 | $ | 2,858 | 79 | % | ||||||||
| Production taxes |
2,174 | 1,051 | 1,123 | 107 | % | |||||||||||
| Gathering and transportation expense |
2,329 | 1,708 | 621 | 36 | % | |||||||||||
| Depreciation, depletion, amortization and accretion expense |
26,150 | 16,525 | 9,625 | 58 | % | |||||||||||
| Exploration costs |
1,208 | 496 | 712 | 144 | % | |||||||||||
| General and administrative expense |
8,738 | 3,480 | 5,258 | 151 | % | |||||||||||
| Transaction expense |
2,618 | — | 2,618 | 100 | % | |||||||||||
| (Gain) Loss on sale of oil and gas properties and other assets |
(11 | ) | — | (11 | ) | (100 | %) | |||||||||
|
|
|
|
|
|
|
|||||||||||
| Total operating expenses |
$ | 49,685 | $ | 26,881 | $ | 22,804 | 85 | % | ||||||||
|
|
|
|
|
|
|
|||||||||||
| Operating expenses per Boe: |
||||||||||||||||
| Lease operating expense |
$ | 4.46 | $ | 3.61 | $ | 0.85 | 24 | % | ||||||||
| Production taxes |
1.50 | 1.05 | 0.45 | 43 | % | |||||||||||
| Gathering and transportation expense |
1.60 | 1.70 | (0.10 | ) | (6 | %) | ||||||||||
| Depreciation, depletion, amortization and accretion expense |
17.98 | 16.48 | 1.50 | 9 | % | |||||||||||
| Exploration costs |
0.83 | 0.49 | 0.34 | 69 | % | |||||||||||
| General and administrative expense |
6.01 | 3.47 | 2.54 | 73 | % | |||||||||||
| Transaction expense |
1.80 | — | 1.80 | 100 | % | |||||||||||
| (Gain) Loss on sale of oil and gas properties and other assets |
(0.01 | ) | — | (0.01 | ) | (100 | %) | |||||||||
|
|
|
|
|
|
|
|||||||||||
| Total operating expenses per Boe |
$ | 34.17 | $ | 26.80 | $ | 4.24 | 28 | % | ||||||||
|
|
|
|
|
|
|
|||||||||||
Lease Operating Expense. The increase in LOE is primarily due to increases in produced water disposal fees of $1.6 million, surface equipment repair and maintenance of $0.4 million, and injection water and gas of $0.4 million. On a Boe basis, LOE increased primarily due to the factors discussed above.
Production Taxes. Production taxes are primarily based on the market value of Rosehill Operating’s production at the wellhead. Production taxes increased due to higher revenues in 2017 versus 2016.
Gathering and Transportation Expense. Gathering and transportation expenses increased due to production growth resulting in higher sales and processing volumes and expenses.
Depreciation, Depletion, Amortization and Accretion. DD&A increased due to higher production volumes and a higher DD&A rate from recent drilling activity. Capitalized costs related to drilled uncompleted wells are excluded from the DD&A and impairment calculations pending commencement of production. Seven wells were added to producing wells during the nine months ended September 30, 2017.
Exploration Costs. Exploration costs increased primarily due to costs related to an unsuccessful acquisition of $0.2 million and to an increase in geological and geophysical (“G&G”) hardware and software maintenance costs of $0.3 million and other G&G related costs of $0.2 million.
General and Administrative Expense. G&A expense increased primarily due to employee compensation and benefit expenses of $2.3 million, consulting fees of $1.0 million, public company expenses of $0.5 million,
67
Table of Contents
Index to Financial Statements
audit fees of $0.5 million, legal expenses of $0.2 million and recruiting expenses of $0.2 million as a result of our going from a private entity to a public entity. These expenses were not incurred at the same levels, or at all, in periods prior to the Transaction. On a Boe basis, G&A increased primarily due to the factors noted above.
Transaction Expense. We incurred expenses of $2.6 million during the nine months ended September 30, 2017, related to the Transaction.
Other Income and Expense. The following table summarizes our other income and expenses for the periods indicated:
| Nine Months Ended September 30, | Change | Change% | ||||||||||||||
| (unaudited) | 2017 | 2016 | ||||||||||||||
| Other (expense) income (in thousands): |
||||||||||||||||
| Interest expense, net |
$ | (1,274 | ) | $ | (2,256 | ) | $ | 982 | (44 | )% | ||||||
| Gain (loss) on commodity derivatives, net |
1,751 | (2,132 | ) | 3,883 | (182 | )% | ||||||||||
| Other income (expense), net |
(105 | ) | 23 | (128 | ) | (557 | )% | |||||||||
|
|
|
|
|
|
|
|
|
|||||||||
| Total other (expense) income |
$ | 372 | $ | (4,365 | ) | $ | 4,737 | (109 | )% | |||||||
|
|
|
|
|
|
|
|
|
|||||||||
| Income tax expense (benefit) |
(650 | ) | 93 | (743 | ) | (799 | )% | |||||||||
Interest Expense, Net. Interest expense decreased due to a decrease in realized and unrealized losses on the interest rate swap of $0.8 million and the elimination of a $0.2 million bank fee paid in 2016. The $0.2 million bank fee was paid in relation to the reduction of the interest rate swap during the nine months ended September 30, 2016.
Gain (loss) on commodity derivatives, net. Net gains and losses on commodity derivatives are a function of fluctuations in the underlying commodity prices versus fixed hedge prices and the monthly settlement of the instruments. The net gain for 2017 above is comprised of net gains of $0.2 million on cash settlements and net gains of $1.6 million on mark-to-market unsettled positions. The net loss for 2016 shown above is comprised of net gains of $0.5 million on cash settlements and net losses of $2.6 million on marked-to-market unsettled positions.
68
Table of Contents
Index to Financial Statements
Year Ended December 31, 2016 Compared to Year Ended December 31, 2015
Oil, Natural Gas, and NGL Sales Revenues. The following table provides the components of our revenues for the periods indicated, as well as average realized prices and production volumes:
| Year Ended December 31, | ||||||||||||||||
| 2016 | 2015 | Change | Change% | |||||||||||||
| Revenues (in thousands): |
||||||||||||||||
| Oil sales |
$ | 24,807 | $ | 20,601 | $ | 4,206 | 20 | % | ||||||||
| Natural gas sales |
5,304 | 4,909 | 395 | 8 | % | |||||||||||
| NGLs sales |
4,534 | 3,977 | 557 | 14 | % | |||||||||||
|
|
|
|
|
|
|
|||||||||||
| Total revenues |
$ | 34,645 | $ | 29,487 | $ | 5,158 | 17 | % | ||||||||
|
|
|
|
|
|
|
|||||||||||
| Average realized price(1): |
||||||||||||||||
| Oil (per Bbl) |
$ | 40.52 | $ | 43.62 | $ | (3.10 | ) | (7 | %) | |||||||
| Natural gas (per Mcf) |
2.23 | 2.37 | (0.14 | ) | (6 | %) | ||||||||||
| NGLs (per Bbl) |
12.68 | 12.75 | (0.07 | ) | (1 | %) | ||||||||||
|
|
|
|
|
|
|
|||||||||||
| Total (per Boe) |
$ | 25.35 | $ | 26.09 | $ | (0.74 | ) | (3 | %) | |||||||
|
|
|
|
|
|
|
|||||||||||
| Total, after effects of gain (loss) from commodity derivatives (per Boe) |
$ | 22.30 | $ | 29.40 | $ | (7.10 | ) | (24 | %) | |||||||
|
|
|
|
|
|
|
|||||||||||
| Production: |
||||||||||||||||
| Oil (MBbls) |
612 | 472 | 140 | 30 | % | |||||||||||
| Natural gas (MMcf) |
2,381 | 2,074 | 307 | 15 | % | |||||||||||
| NGLs (MBbls) |
358 | 312 | 46 | 15 | % | |||||||||||
|
|
|
|
|
|
|
|||||||||||
| Total (MBoe)(2) |
1,367 | 1,130 | 237 | 21 | % | |||||||||||
|
|
|
|
|
|
|
|||||||||||
| Average net daily production volume: |
||||||||||||||||
| Oil (Bbls/d) |
1,673 | 1,294 | 379 | 29 | % | |||||||||||
| Natural gas (Mcf/d) |
6,506 | 5,683 | 823 | 14 | % | |||||||||||
| NGLs (Bbls/d) |
977 | 855 | 122 | 14 | % | |||||||||||
|
|
|
|
|
|
|
|||||||||||
| Total (per Boe/d)(2) |
3,734 | 3,096 | 638 | 21 | % | |||||||||||
|
|
|
|
|
|
|
|||||||||||
| (1) | Excluding the effects of realized and unrealized commodity derivative transactions unless noted otherwise. |
| (2) | Totals may not sum due to rounding. |
As reflected in the table above, our total revenues for 2016 were 17% higher, or $5.2 million, as compared to 2015. Oil sales for 2016 as compared to 2015 increased 20%, or $4.2 million, primarily due to a 30% increase in oil production (140 MBbls), or $5.7 million, offset by a 7% decrease in the average realized price for oil ($3.10 per Bbl), or $1.5 million. Natural gas sales for 2016 as compared to 2015 increased 8%, or $0.4 million, primarily due to a 15% increase in natural gas production (307 MMcf), or $0.7 million, offset by a 6% decrease in the average realized price for natural gas ($0.14 per Mcf), or $0.3 million. NGL sales for 2016 as compared to 2015 increased 14%, or $0.6 million, primarily due to a 15% increase in NGL production (46 MBbls), or $0.6 million.
Operating Expenses. We present per Boe information because we use such information to evaluate our performance relative to our peers and to identify and measure trends we believe may require additional analysis.
69
Table of Contents
Index to Financial Statements
The following table summarizes our expenses for the periods indicated:
| Year Ended December 31, | ||||||||||||||||
| 2016 | 2015 | Change | Change% | |||||||||||||
| Operating expenses (in thousands): |
||||||||||||||||
| Lease operating expense |
$ | 4,800 | $ | 4,582 | $ | 218 | 5 | % | ||||||||
| Production taxes |
1,541 | 1,311 | 230 | 18 | % | |||||||||||
| Gathering and transportation expense |
2,398 | 2,094 | 304 | 15 | % | |||||||||||
| Depreciation, depletion and amortization |
24,789 | 23,244 | 1,545 | 7 | % | |||||||||||
| Accretion expense |
176 | 120 | 56 | 47 | % | |||||||||||
| Impairment of oil and natural gas properties |
— | 8,131 | (8,131 | ) | (100 | %) | ||||||||||
| Exploration costs |
794 | 960 | (166 | ) | (17 | %) | ||||||||||
| General and administrative expense |
6,166 | 4,234 | 1,932 | 46 | % | |||||||||||
| Transaction expense |
2,834 | — | 2,834 | 100 | % | |||||||||||
| (Gain) Loss on sale of other assets |
(50 | ) | 18 | (68 | ) | (378 | %) | |||||||||
|
|
|
|
|
|
|
|||||||||||
| Total operating expenses |
$ | 43,448 | $ | 44,694 | $ | (1,246 | ) | (3 | %) | |||||||
|
|
|
|
|
|
|
|||||||||||
| Operating expenses per Boe: |
||||||||||||||||
| Lease operating expense |
$ | 3.51 | $ | 4.06 | $ | (0.55 | ) | (14 | %) | |||||||
| Production taxes |
1.13 | 1.16 | (0.03 | ) | (3 | %) | ||||||||||
| Gathering and transportation expense |
1.75 | 1.85 | (0.10 | ) | (5 | %) | ||||||||||
| Depreciation, depletion and amortization |
18.14 | 20.57 | (2.43 | ) | (12 | %) | ||||||||||
| Accretion expense |
0.13 | 0.11 | 0.02 | 18 | % | |||||||||||
| Impairment of oil and natural gas properties |
— | 7.20 | (7.20 | ) | (100 | %) | ||||||||||
| Exploration costs |
0.58 | 0.85 | (0.27 | ) | (32 | %) | ||||||||||
| General and administrative expense |
4.51 | 3.75 | 0.76 | 20 | % | |||||||||||
| Transaction expense |
2.07 | — | — | — | ||||||||||||
| (Gain) loss on sale of other assets |
(0.04 | ) | 0.02 | (0.06 | ) | (300 | %) | |||||||||
|
|
|
|
|
|
|
|||||||||||
| Total operating expenses per Boe |
$ | 31.78 | $ | 39.57 | $ | (7.79 | ) | (20 | %) | |||||||
|
|
|
|
|
|
|
|||||||||||
Lease Operating Expense. LOE increased 5%, or $0.2 million, in 2016 as compared to 2015. The increase was due to purchases of injection water and gas of $0.2 million. On a Boe basis, LOE decreased 14%, or $1.0 million, primarily due to a 237 MBoe increase in production during 2016 compared to 2015.
Production Taxes. Production taxes are primarily based on the market value of our production at the wellhead. Production taxes increased 18%, or $0.2 million, in 2016 as compared to 2015 due to an increase of $5.2 million in production revenues in 2016 as compared to 2015. On a Boe basis, production taxes decreased 3%, or $0.03 per Boe, primarily due to higher production volumes (237 MBoe) in 2016 as compared to 2015. Production taxes as a percentage of our revenue was 5% for 2016 compared to 4% for 2015.
Gathering and Transportation Expense. Gathering and transportation expenses increased 15%, or $0.3 million, during 2016 as compared to 2015 due to a 237 MBoe increase in sales and processing volumes. On a Boe basis, gathering and transportation expenses decreased 5%, or $0.10 per Boe, due to higher sales and processing volumes (237 MBoe) during 2016 compared to 2015.
Depreciation, Depletion, and Amortization. Our DD&A rate can fluctuate as a result of impairments, dispositions, exploration and development costs, and proved reserve volumes. DD&A increased 7%, or $1.5 million, during the year ended December 31, 2016 compared to the prior year, due to higher production volumes in 2016 (237 MBoe), or $4.3 million, offset by a lower DD&A rate of $2.8 million. The DD&A rate on a Boe basis decreased 12%, or $1.8 million ($2.43 per Boe), due to the increases in proved developed reserves during 2016 (767 MBoe).
70
Table of Contents
Index to Financial Statements
Accretion Expense. Accretion expense increased 47%, or $0.1 million, during the year ended December 31, 2016 compared to the prior year due to the addition of five new producing wells. On a Boe basis, accretion expense increased 18%, or $0.02 per Boe.
Impairment of Oil and Gas Properties. We did not record any impairment in 2016. In 2015, we recorded an $8.1 million impairment expense, all of which was attributable to an impairment of developed properties.
Exploration Costs. Exploration costs decreased 17%, or $0.2 million, due to a reduction in contract personnel during the year ended December 31, 2016 compared to the prior year. On a Boe basis, exploration costs decreased 32%, or $0.27 per Boe.
General and Administrative Expense. G&A expense increased 46%, or $1.9 million, primarily due to an increase in salaries and benefits ($1.4 million) and legal expense ($0.3 million). On a Boe basis, G&A expense increased 20%, or $0.76 per Boe.
Transaction Expense. Transaction expenses of $2.8 million related to the Transaction were incurred during the year ended December 31, 2016.
Other Income and Expense. The following table summarizes our other income and expenses for the periods indicated:
| Year Ended December 31, | ||||||||||||||||
| 2016 | 2015 | Change | Change% | |||||||||||||
| Other (expense) income (in thousands): |
||||||||||||||||
| Interest expense, net |
$ | (1,822 | ) | $ | (3,247 | ) | $ | 1,425 | (44 | %) | ||||||
| Gain (loss) on commodity derivatives, net |
(4,169 | ) | 3,735 | (7,904 | ) | 212 | % | |||||||||
| Other income (expense), net |
(247 | ) | 7 | (254 | ) | (3629 | %) | |||||||||
|
|
|
|
|
|
|
|
|
|||||||||
| Total other expense |
$ | (6,238 | ) | $ | 495 | $ | (6,733 | ) | (1360 | %) | ||||||
|
|
|
|
|
|
|
|
|
|||||||||
| Income tax expense |
(148 | ) | (108 | ) | (40 | ) | 37 | % | ||||||||
Interest Expense, Net. Interest expense, net decreased 44%, or $1.4 million, due to a decrease in the average borrowings under our secured line of credit during the year ended December 31, 2016 ($55.0 million) compared to the prior year ($65.0 million).
Gain (loss) on commodity derivatives, net. The decrease was primarily due to a 212%, or $7.9 million, decrease in gain (loss) on commodity derivatives, net. The decrease in commodity prices that resulted in a 3% decrease in the average realized price per Boe, or $1.8 million ($0.74 per Boe), was offset by a 21% increase in average net daily production, or $6.9 million (237 MBoe), as compared to the prior year. The increase in average net daily production was attributable to four operated and one non-operated new wells coming on line during the year ended December 31, 2016.
During 2016, we recognized a $4.2 million commodity derivative loss as compared to a $3.7 million commodity derivative gain in 2015. Net gains and losses on our commodity derivatives are a function of fluctuations in the underlying commodity prices and the monthly settlement of the instruments.
71
Table of Contents
Index to Financial Statements
Year Ended December 31, 2015 Compared to the Year Ended December 31, 2014
Oil and Natural Gas Revenues. The following table provides the components of our revenues for the years indicated, as well as average realized prices and production volumes:
| Year Ended December 31, | ||||||||||||||||
| 2015 | 2014 | Change | Change% | |||||||||||||
| Revenues (in thousands): |
||||||||||||||||
| Oil sales |
$ | 20,601 | $ | 28,444 | $ | (7,843 | ) | (28 | %) | |||||||
| Natural gas sales |
4,909 | 7,445 | (2,536 | ) | (34 | %) | ||||||||||
| NGL sales |
3,977 | 7,674 | (3,697 | ) | (48 | %) | ||||||||||
|
|
|
|
|
|
|
|||||||||||
| Total revenues |
$ | 29,487 | $ | 43,563 | $ | (14,076 | ) | (32 | %) | |||||||
|
|
|
|
|
|
|
|||||||||||
| Average realized price(1): |
||||||||||||||||
| Oil (per Bbl) |
$ | 43.62 | $ | 77.93 | $ | (34.31 | ) | (44 | %) | |||||||
| Natural gas (per Mcf) |
2.37 | 4.06 | (1.69 | ) | (42 | %) | ||||||||||
| NGL (per Bbl) |
12.75 | 26.93 | (14.18 | ) | (53 | %) | ||||||||||
|
|
|
|
|
|
|
|||||||||||
| Total (per Boe) |
$ | 26.09 | $ | 45.58 | $ | (19.49 | ) | (43 | %) | |||||||
|
|
|
|
|
|
|
|||||||||||
| Total, after effects of gain (loss) from commodity derivatives (per Boe) |
$ | 29.40 | $ | 48.10 | $ | (18.70 | ) | (39 | %) | |||||||
|
|
|
|
|
|
|
|||||||||||
| Production: |
||||||||||||||||
| Oil (MBbls) |
472 | 365 | 107 | 29 | % | |||||||||||
| Natural gas (MMcf) |
2,074 | 1,834 | 240 | 13 | % | |||||||||||
| NGL (MBbls) |
312 | 285 | 27 | 9 | % | |||||||||||
|
|
|
|
|
|
|
|||||||||||
| Total (MBoe)(2) |
1,130 | 956 | 174 | 18 | % | |||||||||||
|
|
|
|
|
|
|
|||||||||||
| Average net daily production volume: |
||||||||||||||||
| Oil (Bbls/d) |
1,294 | 1,000 | 294 | 29 | % | |||||||||||
| Natural gas (Mcf/d) |
5,683 | 5,025 | 658 | 13 | % | |||||||||||
| NGL (Bbls/d) |
855 | 781 | 74 | 9 | % | |||||||||||
|
|
|
|
|
|
|
|||||||||||
| Total (Boe/d)(2) |
3,096 | 2,618 | 478 | 18 | % | |||||||||||
|
|
|
|
|
|
|
|||||||||||
| (1) | Excluding the effects of realized and unrealized commodity derivative transactions unless noted otherwise. |
| (2) | Totals may not sum due to rounding. |
As reflected in the table above, our total revenues for 2015 were 32%, or $14.1 million, lower than 2014. The decrease was primarily due to a significant decrease in commodity prices resulting in a 43% decrease in the average realized price per Boe, or $19.7 million ($19.49 per Boe), which was partially offset by a 18% increase in average net daily production, or $5.6 million (174 MBoe), as compared to the prior year. The increase in production was attributable to one operated and two non-operated new wells coming on line during the year ended December 31, 2015.
Oil sales for 2015 as compared to 2014 decreased 28%, or $7.8 million, primarily due to a 44% decrease in average realized price for oil ($34.31 per Bbl), or $12.5 million, offset by a 29% increase in oil production (107 MBbls), or $4.7 million. Natural gas sales for 2015 as compared to 2014 decreased 34%, or $2.5 million, primarily due to a 42% decrease in average realized price for natural gas ($1.69 per Mcf), or $3.1 million, offset by a 13% increase in natural gas production (240 MMcf), or $0.6 million. NGL sales for 2015 as compared to 2014 decreased 48%, or $3.7 million, primarily due to a 53% decrease in the average realized price for NGLs ($14.18 per Bbl), or $4.0 million, offset by a 9% increase in NGL production (27 MBbls), or $0.3 million.
72
Table of Contents
Index to Financial Statements
Operating Expenses. The following table summarizes our expenses for the periods indicated:
| Year Ended December 31, | ||||||||||||||||
| 2015 | 2014 | Change | Change% | |||||||||||||
| Operating expenses (in thousands): |
||||||||||||||||
| Lease operating expense |
$ | 4,582 | $ | 6,103 | $ | (1,521 | ) | (25 | %) | |||||||
| Production taxes |
1,311 | 1,861 | (550 | ) | (30 | %) | ||||||||||
| Gathering and transportation expense |
2,094 | 2,462 | (368 | ) | (15 | %) | ||||||||||
| Depreciation, depletion and amortization |
23,244 | 15,842 | 7,402 | 47 | % | |||||||||||
| Accretion expense |
120 | 125 | (5 | ) | (4 | %) | ||||||||||
| Impairment of oil and natural gas properties |
8,131 | 27,595 | (19,464 | ) | (71 | %) | ||||||||||
| Exploration costs |
960 | 960 | — | — | % | |||||||||||
| General and administrative expense |
4,234 | 5,151 | (917 | ) | (18 | %) | ||||||||||
| (Gain) loss on sale of oil and natural gas properties |
— | (6 | ) | 6 | (100 | %) | ||||||||||
| (Gain) loss on sale of other assets |
18 | (26 | ) | 44 | (169 | %) | ||||||||||
|
|
|
|
|
|
|
|||||||||||
| Total operating expenses before other miscellaneous (income) expense |
$ | 44,694 | $ | 60,067 | $ | (15,373 | ) | (26 | %) | |||||||
|
|
|
|
|
|
|
|||||||||||
| Operating expenses per Boe: |
||||||||||||||||
| Lease operating expense |
$ | 4.06 | $ | 6.39 | $ | (2.33 | ) | (36 | %) | |||||||
| Production taxes |
1.16 | 1.95 | (0.79 | ) | (41 | %) | ||||||||||
| Gathering and transportation expense |
1.85 | 2.58 | (0.73 | ) | (28 | %) | ||||||||||
| Depreciation, depletion and amortization |
20.57 | 16.58 | 3.99 | 24 | % | |||||||||||
| Accretion expense |
0.11 | 0.13 | (0.02 | ) | (15 | %) | ||||||||||
| Impairment of oil and natural gas properties |
7.20 | 28.87 | (21.67 | ) | (75 | %) | ||||||||||
| Exploration costs |
0.85 | 1.00 | (0.15 | ) | (15 | %) | ||||||||||
| General and administrative expense |
3.75 | 5.39 | (1.64 | ) | (30 | %) | ||||||||||
| (Gain) loss on sale of oil and natural gas properties |
— | (0.01 | ) | 0.01 | (100 | %) | ||||||||||
| (Gain) loss on sale of other assets |
0.02 | (0.03 | ) | 0.05 | (167 | %) | ||||||||||
|
|
|
|
|
|
|
|||||||||||
| Total operating expenses per Boe |
$ | 39.57 | $ | 62.85 | $ | (23.28 | ) | (37 | %) | |||||||
|
|
|
|
|
|
|
|||||||||||
Lease Operating Expense. LOE decreased 25%, or $1.5 million, in 2015 as compared to 2014, due to reduced cost of water disposal ($1.5 million) as a result of our having drilled a saltwater disposal well in 2015 reducing the cost to haul disposal water. On a Boe basis, LOE decreased 36%, or $2.33 per Boe.
Production Taxes. Production taxes are primarily based on the market value of our production at the wellhead. Production taxes decreased 30%, or $0.6 million, due to lower production revenues ($14.1 million lower in 2015) as a result of lower realized commodity prices ($19.49 per Boe lower in 2015). On a Boe basis, production taxes decreased 41%, or $0.79 per Boe. Production taxes as a percentage of our revenue was 4% for 2015 and 2014, respectively.
Gathering and Transportation Expense. Gathering and transportation expense decreased 15%, or $0.4 million. In 2015, lower prices for natural gas ($1.69 per Mcf lower in 2015) and NGLs ($14.18 per Bbl lower in 2015) resulted in lower costs ($0.7 million) associated with fuel and processing fees, which were partially offset by higher processing volumes (174 MBoe), or $0.3 million. On a Boe basis, gathering and transportation expense decreased 28%, or $0.73 per Boe.
Depreciation, Depletion, and Amortization. Our DD&A rate can fluctuate as a result of impairments, dispositions, finding and development costs, and proved reserve volumes. DD&A expense increased 47%, or $7.4 million, due to an increase in production volumes (174 MBoe), or $3.6 million, and lower reserve volumes (5.2 MBoe), or $3.8 million. DD&A per Boe was $20.57 for 2015, an increase of $3.99 as compared to $16.58 in 2014.
73
Table of Contents
Index to Financial Statements
Accretion Expense. Accretion expense was consistent in 2015 compared to 2014. A $3.1 million decrease in estimated plugging and abandonment costs was offset by $2.7 million associated with the addition of three new producing wells. On a Boe basis, accretion expense decreased 15%, or $0.02 per Boe, due to consistent costs being allocated over a 174 MBoe increase in production in 2015 as compared to 2014.
Impairment of Oil and Gas Properties. In 2015, we recorded an $8.1 million impairment expense, all of which was attributable to an impairment of developed properties. In 2014, we recorded a $27.6 million impairment expense, of which $0.1 million was attributable to an impairment of undeveloped properties.
Exploration Costs. Exploration costs were consistent in 2015 compared to 2014. On a Boe basis, exploration costs decreased 15%, or $0.15 per Boe, due to consistent costs being allocated over a 174 MBoe increase in production in 2015 as compared to 2014.
General and Administrative Expense. G&A expenses decreased 18%, or $0.9 million, due to a reduction in salaries and related benefits ($1.6 million) offset by an increase in legal expense ($0.4 million) as compared to 2014. On a Boe basis, G&A decreased 30%, or $1.64 per Boe.
Other Income and Expense. The following table summarizes our other income and expense for the years indicated:
| Year Ended December 31, | ||||||||||||||||
| 2015 | 2014 | Change | Change% | |||||||||||||
| Other (expense) income (in thousands): |
||||||||||||||||
| Interest expense, net |
$ | (3,247 | ) | $ | (5,469 | ) | $ | 2,222 | (41 | %) | ||||||
| Gain (loss) on commodity derivatives, net |
3,735 | 2,404 | 1,331 | 55 | % | |||||||||||
| Other income, net |
7 | 316 | (309 | ) | (98 | %) | ||||||||||
|
|
|
|
|
|
|
|||||||||||
| Total other expense |
495 | (2,749 | ) | 3,244 | 118 | % | ||||||||||
|
|
|
|
|
|
|
|||||||||||
| Income tax expense |
(108 | ) | — | (108 | ) | 100 | % | |||||||||
Interest Expense, Net. Interest expense, net decreased 41%, or $2.2 million, due to a decrease in the average amounts outstanding under Tema’s secured line of credit in 2015 ($65.0 million) as compared to 2014 ($75.0 million).
Gain (loss) on commodity derivatives, net. In 2015, we recognized a $3.7 million gain on commodity derivative instruments compared to a $2.4 million gain on commodity derivative instruments in 2014. Net gains and losses on our commodity derivatives are a function of fluctuations in the underlying commodity prices and the monthly settlement of the instruments.
Capital Requirements and Sources of Liquidity
Overview
Our development and acquisition activities require us to make significant operating and capital expenditures. Our primary sources of liquidity include cash flows from operations, future borrowings under our Credit Agreement, and our option to sell up to an additional 50,000 shares of Series B Preferred Stock to EIG. We expect to continue funding our growth with cash flow from operations, from availability under our Credit Agreement, the issuance of up to $50 million of additional Series B Preferred Stock and by opportunistically accessing the capital markets. To date, our primary use of capital has been for the acquisition and development of oil and natural gas properties.
The amount and allocation of future capital expenditures will depend upon a number of factors, including the number and size of acquisition opportunities, our cash flows from operations, investing and financing
74
Table of Contents
Index to Financial Statements
activities, and our ability to assimilate acquisitions and execute our drilling program. We have historically reviewed our capital expenditure budget periodically to assess changes in current and projected cash flows, acquisition and divestiture activities, debt requirements, and other factors. If we are unable to obtain funds when needed or on acceptable terms, we may not be able to complete acquisitions that may be favorable to us or finance the capital expenditures necessary to maintain our production or proved reserves.
Because we are the operator of a high percentage of our acreage, the timing and level of our capital spending is largely discretionary and within our control. We could choose to defer a portion of these planned capital expenditures depending on a variety of factors, including, but not limited to, the success of our drilling activities, prevailing and anticipated prices for oil, natural gas and NGLs, the availability of necessary equipment, infrastructure and capital, the receipt and timing of required regulatory permits and approvals, seasonal conditions, drilling and acquisition costs, and the level of participation by other working interest owners. A deferral of planned capital expenditures, particularly with respect to drilling and completing new wells, could result in a reduction in anticipated production and cash flows. Additionally, if we curtail our drilling program, we may lose a portion of our acreage through lease expirations. See “Description of Business—Oil and Natural Gas Production Prices and Costs—Developed and Undeveloped Acreage.” In addition, we may be required to reclassify some portion of our reserves currently booked as proved undeveloped reserves if such a deferral of planned capital expenditures means we will be unable to develop such reserves within five years of their initial booking.
We expect our 2018 capital budget for drilling, completion and recompletion activities and facilities costs to be in the range of $350 to $375 million, excluding any acreage acquisitions. We anticipate that 80-85% of our 2018 capital costs will be incurred in connection with drilling and completion activities.
Our 2017 capital budget for drilling, completion and recompletion activities and facilities costs, excluding leasing and other acquisitions, increased from $145 million to a range of $175 million to $195 million, due to faster drilling and additional completions that occurred in 2017. During the nine months ended September 30, 2017, we incurred capital costs, excluding asset retirement costs and leasing and acquisition costs, of approximately $111 million.
Our 2016 capital budget for drilling, completion and recompletion activities and facilities costs was approximately $25.5 million, excluding leasing and other acquisitions. We allocated approximately $24.8 million to drill and complete operated wells and $0.7 million to participate in the drilling and completion of non-operated wells. For 2016, we budgeted $1.6 million for leasing. In the year ended December 31, 2016, we incurred capital costs of approximately $22.9 million, excluding asset retirement costs and leasing and acquisition costs.
Prior to the Transaction, Tema had $55 million outstanding under its secured line of credit, which was assumed by us upon the closing of the Transaction and immediately paid off using proceeds from the Transaction. On April 27, 2017, we entered into the Credit Agreement with a revolving line of credit and letter of credit facility of up to $250 million with an initial borrowing base of $55 million, that matures on April 27, 2022. The borrowing base under the terms of our Credit Agreement is redetermined semi-annually. In addition, we may request an interim redetermination once a year. Effective October 30, 2017, the borrowing base was increased to $75 million. We had borrowings of approximately $50 million outstanding under our revolving credit facility as of September 30, 2017.
At September 30, 2017, we were in compliance with the total funded debt to EBITDAX covenant in the Credit Facility agreement for the measurement period ended September 30, 2017. In connection with increasing our borrowing base under the Credit Agreement, Rosehill Operating received a limited waiver of compliance with the current ratio covenant until the quarter ending December 31, 2018, subject to an earlier reinstatement of the covenant upon the occurrence of certain conditions.
In late December 2017, our production exceeded 10,000 net barrels of oil equivalent per day, an increase of over 89% as compared to the daily average of the third quarter of 2017, driven by early results from wells that
75
Table of Contents
Index to Financial Statements
recently began flowback. Based on this increased production, our oil and natural gas price forecasts, and our expectations for continued growth of our borrowing base, we believe that our cash flow from operations, future borrowings under our Credit Agreement, and our option to sell up to an additional 50,000 shares of Series B Preferred Stock to EIG will provide us with sufficient capital to fund our operations for the next 12 months. We strive to manage our debt level below the available credit line in order to maintain sufficient borrowing capacity; however, actual growth in the borrowing base may lag liquidity or funding needs and, as such, we may require additional sources of capital to pay down the credit facility balance and/or reduce our planned capital investments. Although we believe we will have adequate access to capital, there is no assurance that this additional capital will be available or available at acceptable terms. Future cash flows are subject to a number of variables, including the level of oil and natural gas production, commodity prices, and our ability to execute on our drilling and development program. We anticipate that significant additional capital expenditures will be required to more fully develop our properties.
At September 30, 2017, we had a working capital deficit of $28.8 million, compared to a surplus of $2.1 million at December 31, 2016. The increase in our working capital deficit as of September 30, 2017 was primarily due to increased accounts payable and accrued expenses related to the significant increase in drilling and completion activities on our core properties.
On December 8, 2017, we completed the initial acquisition of 4,565 net acres and other associated assets and interests in the Southern Delaware Basin in Pecos and Reeves counties, Texas for $77.6 million in cash, increasing our horizontal drilling potential by over 160 gross locations. On December 21, 2017, we announced an additional acquisition of 1,940 net acres, certain mineral and royalty interests, and two producing wells from the same seller, under the same terms, for $39.0 million. Altogether the acreage and other associated assets and interests acquired in the White Wolf Acquisition provide us with an additional 259 gross locations, with opportunities in multiple Bone Spring and Wolfcamp horizons, with additional upside potential from deeper Woodford and shallower Avalon horizons. We believe the White Wolf Acquisition will provide transformative and value adding growth as it more than doubles our previous acreage position, with high working interest, contiguous acreage, and establishes a second core operating area in the Delaware Basin.
On November 2, 2017, we completed the sale of our remaining Barnett Shale assets for approximately $7.1 million, subject to customary purchase price adjustments, and received a payment of $6.2 million from the buyer on October 31, 2017.
In the event we make any acquisitions and the amount of capital required is greater than the amount we have available for acquisitions at that time, we could be required to reduce the expected level of capital expenditures and/or seek additional capital. If we require additional capital for that or other reasons, we may seek such capital through traditional reserve base borrowings, joint venture partnerships, production payment financings, asset sales, offerings of debt or equity securities, or other means.
We plan to continue an active hedging program to reduce the impact of commodity price volatility on our cash flow from operations.
Working Capital Analysis
We define working capital as current assets less current liabilities. At September 30, 2017 and December 31, 2016, we had a working capital deficit of $28.8 million and working capital of $2.1 million, respectively. We may continue to incur working capital deficits in the future due to liabilities incurred in connection with our drilling program until revenue is recognized from the associated production. Collection of our accounts receivable has historically been timely, and losses associated with uncollectible receivables have historically not been significant. Cash and cash equivalents totaled $4.7 million and $8.4 million, at September 30, 2017 and December 31, 2016, respectively. Our borrowing base under our credit facility increased from $55 million to $75 million, effective October 30, 2017, with borrowings of $50 million outstanding at September 30, 2017. We
76
Table of Contents
Index to Financial Statements
expect that the pace of development activities, production volumes, commodity prices, and differentials to NYMEX prices for oil and natural gas production will be the most significant variables affecting our working capital.
Cash Flows from Operating, Investing and Financing Activities
Analysis of Cash Flow Changes for the Nine months ended September 30, 2017 Compared to Nine months ended September 30, 2016
The following table summarizes our cash flows for the periods indicated:
| Nine Months Ended September 30, | ||||||||
| 2017 | 2016 | |||||||
| Net cash provided by operating activities |
$ | 35,527 | $ | 9,328 | ||||
| Net cash used in investing activities |
(100,333 | ) | (11,943 | ) | ||||
| Net cash provided by (used in) financing activities |
61,028 | (20,661 | ) | |||||
|
|
|
|
|
|||||
| Net change in cash and cash equivalents |
$ | (3,778 | ) | $ | (23,276 | ) | ||
|
|
|
|
|
|||||
Operating Activities. Net cash provided by operating activities is primarily driven by the changes in commodity prices, operating expenses, production volumes, and associated changes in working capital. The increase in net cash provided by operating activities of $26.2 million was primarily due to an increase in production and realized prices increasing revenues $24.3 million.
Investing Activities. Net cash used in investing activities is primarily comprised of acquisition and development of oil and natural gas properties. Net cash used in investing activities included $(100.0) million and $(11.6) million attributable to the acquisition and development of oil and natural gas properties and mineral leases for the nine months ended September 30, 2017 and 2016, respectively.
Financing Activities. Net cash provided by financing activities in 2017, included $90.8 million of proceeds from the issuance of preferred stock and warrants, $18.7 million of net proceeds from the Transaction, $50.0 million of proceeds from borrowings under the Credit Agreement, offset by the $(55.0) million repayment on the Prior Tema Credit Agreement and $(40.5) million paid to the noncontrolling interest owners in connection with the Transaction. Net cash used in financing activities in 2016 included a $(20.0) million repayment on the Prior Tema Credit Agreement.
Analysis of Cash Flow Changes for the Year Ended December 31, 2016 Compared to the Year Ended December 31, 2015
Operating Activities. Net cash provided by operating activities is primarily affected by the price of oil, natural gas and NGLs, production volumes, and changes in working capital. The decrease in net cash provided by operating activities of $6.8 million for the year ended December 31, 2016 as compared to the prior year was due to a decrease in revenues, a decrease in accounts receivable ($3.9 million), and a decrease in prepaid and other current assets ($0.8 million), offset by an increase in accounts payable and accrued liabilities and other ($2.8 million), and an increase in net change in derivative instruments ($1.6 million).
Investing Activities. Net cash used in investing activities is primarily comprised of acquisition and development of oil and natural gas properties, net of dispositions. In 2016, net cash used for investing activities included $22.0 million attributable to the acquisition and development of oil and natural gas properties. In 2015, net cash used for investing activities included $17.2 million attributable to the acquisition and development of oil and natural gas properties.
Financing Activities. Net cash provided by financing activities in 2016 included $10.0 million of borrowings on Tema’s secured line of credit, $20.0 million of repayments under Tema’s secured line of credit
77
Table of Contents
Index to Financial Statements
and $1.4 million of parent investment. Net cash provided by financing activities in 2015 included $10.0 million of repayments under Tema’s secured line of credit, $25.9 million of parent investment and $1.8 million of borrowings under a related party unsecured credit agreement.
Analysis of Cash Flow Changes for the Year Ended December 31, 2015 Compared to the Year Ended December 31, 2014
Operating Activities. Net cash provided by operating activities is primarily affected by the price of oil, natural gas and NGLs, production volumes and changes in working capital. The decrease in net cash provided by operating activities for the year ended December 31, 2015 as compared to the prior year is primarily due to a decrease in net loss ($4.4 million) and impairment ($19.5 million) offset by an increase in DD&A ($7.4 million).
Investing Activities. Net cash used in investing activities is primarily comprised of acquisition and development of oil and natural gas properties net of dispositions. In 2015, net cash used for investing activities included $17.2 million attributable to the acquisition and development of oil and natural gas properties. In 2014, net cash used for investing activities included $76.7 million attributable to the acquisition and development of oil and natural gas properties, offset by $24.6 million in proceeds from sales of marketable securities.
Financing Activities. Net cash provided by financing activities in 2015 included $10.0 million of repayments to Tema’s secured line of credit, offset by parent investment of $25.9 million and $1.8 million of borrowings under a related party unsecured credit agreement. Net cash provided by financing activities in 2014 included $15.0 million of borrowing under Tema’s secured line of credit, $10.0 million of borrowings under a related party unsecured credit agreement, offset by $1.5 million parent distribution.
Credit Agreement
On April 27, 2017, Rosehill Operating and PNC Bank, National Association, as lender, Administrative Agent and Issuing Bank, and each of the lenders from time to time party thereto (collectively, the “Lenders”) entered into a credit agreement, which provides Rosehill Operating with a revolving line of credit and a letter of credit facility of up to $250 million (as amended by that certain First Amendment to Credit Agreement, dated December 8, 2017 (the “First Amendment”) the “Credit Agreement”), subject to a borrowing base that is determined semi-annually by the Lenders based upon Rosehill Operating’s financial statements and the estimated value of its oil and gas properties, in accordance with the Lenders’ customary practices for oil and gas loans. Such redetermined borrowing base will become effective and applicable to Rosehill Operating and the Lenders on or about April 1st and October 1st of each year, as applicable, commencing October 1, 2017. Rosehill Operating and the Lenders may each request an additional redetermination of the borrowing base once between two successive scheduled redeterminations. The borrowing base will be automatically reduced upon the issuance or incurrence of debt under senior unsecured notes or upon Rosehill Operating’s or any of its subsidiary’s disposition of properties or liquidation of hedges in excess of certain thresholds. Amounts borrowed under the Credit Agreement may not exceed the borrowing base. The initial borrowing base was $55 million, which may be increased with the consent of all Lenders. The borrowing base increased to $75 million on October 30, 2017. In connection with increasing the borrowing base under the Credit Agreement, Rosehill Operating received a limited waiver of compliance with the working capital covenant until the quarter ending December 31, 2018, subject to an earlier reinstatement of the working capital covenant upon the occurrence of certain conditions. The working capital covenant was reinstated concurrently with the effectiveness of the First Amendment. The Credit Agreement also does not permit Rosehill Operating to borrow funds if at the time of such borrowing Rosehill Operating is not in pro forma compliance with the financial covenants. Additionally, Rosehill Operating’s borrowing base may be reduced in connection with the subsequent redetermination of the borrowing base. The amounts outstanding under the Credit Agreement are secured by first priority liens on substantially all of Rosehill Operating’s oil and natural gas properties and associated assets and all of the stock of Rosehill Operating’s material operating subsidiaries that are guarantors of the Credit Agreement. If an event of default occurs under the Credit Agreement, the Lenders have the right to proceed against the pledged capital stock and take control of
78
Table of Contents
Index to Financial Statements
substantially all of Rosehill Operating and Rosehill Operating’s material operating subsidiaries that are guarantors’ assets.
Borrowings under the Credit Agreement will bear interest at a base rate plus an applicable margin ranging from 1.00% to 2.00% or at London Interbank Offered Rate (“LIBOR”) plus an applicable margin ranging from 2.00% to 3.00%. The Credit Agreement matures on April 27, 2022. The amount outstanding at September 30, 2017 under the Credit Agreement is $50.0 million with a weighted average interest rate of 3.2%.
The Credit Agreement contains various affirmative and negative covenants. These covenants may limit Rosehill Operating’s ability to, among other things: incur additional indebtedness; make loans to others; make investments; enter into mergers; make or declare dividends or distributions; enter into commodity hedges exceeding a specified percentage of Rosehill Operating’s expected production; enter into interest rate hedges exceeding a specified percentage of Rosehill Operating’s outstanding indebtedness; incur liens; sell assets; and engage in certain other transactions without the prior consent of the Lenders.
The Credit Agreement also requires Rosehill Operating to maintain the following financial ratios: (1) a working capital ratio, which is the ratio of consolidated current assets (including unused commitments under the Credit Agreement, but excluding non-cash assets) to consolidated current liabilities (excluding non-cash obligations, reclamation obligations to the extent classified as current liabilities and current maturities under the Credit Agreement), of not less than 1.0 to 1.0, and (2) a leverage ratio, which is the ratio of the sum of all of Rosehill Operating’s Total Funded Debt to EBITDAX (as such terms are defined in the Credit Agreement) for the four fiscal quarters then ended, of not greater than 4.00 to 1.00. We were in compliance with the leverage ratio covenant in the Credit Agreement for the measurement period ended September 30, 2017. In connection with increasing its borrowing base under the Credit Agreement, Rosehill Operating received a limited waiver of compliance with the working capital covenant until the quarter ending December 31, 2018, subject to an earlier reinstatement of the working capital covenant upon the occurrence of certain conditions. The working capital covenant was reinstated concurrently with the effectiveness of the First Amendment.
Second Lien Notes
On December 8, 2017, Rosehill Operating issued and sold $100,000,000 in aggregate principal amount of 10.00% Senior Secured Second Lien Notes due January 31, 2023 (the “Second Lien Notes”) to certain private funds and accounts managed by EIG Global Energy Partners, LLC under and pursuant to the terms of that certain Note Purchase Agreement, dated as of December 8, 2017 (the “Note Purchase Agreement”), among Rosehill Operating, the Company, the holders of Notes party thereto (the “Holders”) and U.S. Bank National Association, as agent and collateral agent on behalf of the Holders (the “Agent”).
Under the Note Purchase Agreement, Rosehill Operating may, at its option, redeem the Second Lien Notes in whole or in part, together with accrued and unpaid interest thereon, (i) at any time after December 8, 2019 but on or prior to December 8, 2020, at a redemption price equal to 103% of the principal amount of the Second Lien Notes being redeemed, (ii) at any time after December 8, 2020 but on or prior to December 8, 2021, at a redemption price equal to 101.5% of the principal amount of the Second Lien Notes being redeemed and (iii) at any time after December 8, 2021, at a redemption price equal to the principal amount of the Second Lien Notes being redeemed. On or prior to December 8, 2019, Rosehill Operating may, at its option, redeem the Second Lien Notes in whole or in part, together with accrued and unpaid interest thereon, at a redemption price equal to 103% of the principal amount of the Second Lien Notes being redeemed plus an additional make-whole premium set forth in the Note Purchase Agreement.
The Second Lien Notes may become subject to redemption under certain other circumstances, including upon the incurrence of non-permitted debt or, subject to various exceptions, reinvestments rights and prepayment or redemption rights with respect to other debt or equity of Rosehill Operating, upon an asset sale, hedge termination or casualty event. Rosehill Operating will be further required to make an offer to redeem the Second
79
Table of Contents
Index to Financial Statements
Lien Notes upon a Change in Control (as defined in the Note Purchase Agreement) at a redemption price equal to 101% of the principal amount being redeemed. Other than in connection with a change in control or casualty event, the redemption prices and make-whole premium described in the foregoing paragraph shall also apply, at such times and to the extent set forth therein, to any mandatory redemption of the Second Lien Notes or any acceleration of the Second Lien Notes prior to the stated maturity thereof upon the occurrence of an event of default.
The Note Purchase Agreement requires Rosehill Operating to maintain a leverage ratio, which is the ratio of the sum of all of Rosehill Operating’s Total Funded Debt to EBITDAX (as such terms are defined in the Note Purchase Agreement) for the four fiscal quarters then ended, of not greater than 4.00 to 1.00.
The Note Purchase Agreement contains various affirmative and negative covenants. The negative covenants may limit Rosehill Operating’s ability to, among other things, incur additional indebtedness (including pursuant to senior unsecured notes), make investments, make or declare dividends or distributions, redeem its preferred equity, acquire or dispose of oil and gas properties and other assets or engage in certain other transactions without the prior consent of the Holders, subject to various exceptions, qualifications and value thresholds. Rosehill Operating is also required to meet minimum commodity hedging levels based on its expected production on an ongoing basis.
We are subject to certain limited restrictions under the Note Purchase Agreement, including (without limitation) a negative pledge with respect to our equity interests in Rosehill Operating and a contingent obligation to guarantee the Second Lien Notes upon request by the Holders in the event that we incur debt obligations.
The obligations of Rosehill Operating under the Note Purchase Agreement are secured on a second-lien basis by the same collateral that secures its first-lien obligations. In connection with the Notes Purchase, Rosehill Operating granted first-lien and second-lien security interests over additional collateral to meet the minimum mortgage requirements under the Note Purchase Agreement.
Contractual Obligations
A summary of our contractual obligations as of December 31, 2016 is provided in the following table:
| Payments Due by Period For the Year Ending December 31, | ||||||||||||||||||||||||||||
| 2017 | 2018 | 2019 | 2020 | 2021 | Thereafter | Total | ||||||||||||||||||||||
| (in thousands) | ||||||||||||||||||||||||||||
| Credit Agreement(1) |
$ | — | $ | 55,000 | $ | — | $ | — | $ | — | $ | — | $ | 55,000 | ||||||||||||||
| Operating leases(2) |
1,062 | 1,104 | 1,090 | 1,076 | 1,087 | 552 | 5,971 | |||||||||||||||||||||
| Capital leases(2) |
34 | 34 | 34 | — | — | — | 102 | |||||||||||||||||||||
| Asset retirement obligations(3) |
251 | — | — | — | — | 5,180 | 5,431 | |||||||||||||||||||||
|
|
|
|
|
|
|
|
|
|
|
|
|
|
|
|||||||||||||||
| Total |
$ | 1,347 | $ | 56,138 | $ | 1,124 | $ | 1,076 | $ | 1,087 | $ | 5,732 | $ | 66,504 | ||||||||||||||
|
|
|
|
|
|
|
|
|
|
|
|
|
|
|
|||||||||||||||
| (1) | This table does not include future commitment fees, amortization of deferred financing costs, interest expense, or other fees on Tema’s secured line of credit because Tema’s secured line of credit was paid off by us in connection with our assumption of Tema’s assets and liabilities in 2017. We entered into a new credit agreement on the closing date of the Transaction. For additional information regarding our Credit Agreement, see “—Credit Agreement.” |
| (2) | In connection with the Transaction, Tema transferred to us certain noncancelable operating and capital leases for office space and equipment. |
| (3) | Amounts represent estimates of our future asset retirement obligations. Because these costs typically extend many years into the future, estimating these future costs requires management to make estimates and judgments that are subject to future revisions based upon numerous factors, including the rate of inflation, changing technology, and the political and regulatory environment. |
80
Table of Contents
Index to Financial Statements
Quantitative and Qualitative Disclosure About Market Risk
We are exposed to market risk, including the effects of adverse changes in commodity prices and interest rates as described below. The primary objective of the following information is to provide quantitative and qualitative information about our potential exposure to market risks. The term “market risk” refers to the risk of loss arising from adverse changes in oil and natural gas prices and interest rates. The disclosures are not meant to be precise indicators of expected future losses, but rather indicators of reasonably possible losses. All of our market risk sensitive instruments were entered into for purposes other than speculative trading.
Commodity Price Risk
Our major market risk exposure is in the pricing that we receive for oil, natural gas, and NGLs production. Pricing for oil, natural gas, and NGLs has been volatile and unpredictable for several years, and we expect this volatility to occur in the future. As an example of recently experienced volatility, since January 1, 2014, the WTI spot price for oil declined from a high of $107.95 per barrel on June 20, 2014 to $26.19 per barrel on February 11, 2016, and the Henry Hub spot price for natural gas declined from a high of $8.15 per MMBtu on February 10, 2014 to a low of $1.49 per MMBtu on March 4, 2016. Likewise, NGLs, which are made up of ethane, propane, isobutane, normal butane and natural gasoline, each of which have different uses and different pricing characteristics, have suffered significant recent declines in realized prices. Subsequent to the latter dates, commodity prices have stabilized.
The prices we receive for oil, natural gas, and NGLs production depend on numerous factors beyond our control, some of which are discussed under “Risk Factors—Risks Related to our Operations—Oil, natural gas and NGL prices are volatile. A sustained decline in oil, natural gas and NGL prices could adversely affect our business, financial condition and results of operations and our ability to meet our capital expenditure obligations and financial commitments.”
Due to this volatility, we use commodity derivative instruments, such as collars, swaps, and basis swaps, to hedge price risk associated with a portion of our anticipated production. Our hedging instruments allow us to reduce, but not eliminate, the potential effects of the variability in cash flow from operations due to fluctuations in oil and natural gas prices and provide increased certainty of cash flows for our drilling program and debt service requirements. These instruments provide only partial price protection against declines in oil and natural gas prices and may partially limit our potential gains from future increases in prices. We are subject to no contractual obligations to hedge any portion of our production.
A 10% per barrel change in realized oil price would have resulted in a $3.6 million change in oil revenues for the nine months ended September 30, 2017. A 10% per Mcf change in realized natural gas price would have resulted in a $0.6 million change in natural gas revenues for the nine months ended September 30, 2017. A 10% per barrel change in NGLs prices would have changed NGLs revenue by $0.5 million for the nine months ended September 30, 2017. During the nine months ended September 30, 2017, oil sales, natural gas sales and NGLs sales contributed 77%, 12% and 11%, respectively, of our total revenues. Our oil, natural gas, and NGLs revenues do not include the effects of commodity derivatives.
For further discussion of our use of derivatives, please see “—Overview—Derivative Activity.”
Counterparty Exposure and Customer Credit Risk
Our commodity derivative contracts expose us to credit risk in the event of nonperformance by counterparties. While we do not require counterparties to our commodity derivative contracts to post collateral, we do evaluate the credit standing of such counterparties as we deem appropriate. The counterparty to our commodity derivative contracts currently in place, all of which will either be transferred to us or settled in connection with the closing of the Transaction, have investment grade ratings.
81
Table of Contents
Index to Financial Statements
Our principal exposures to credit risk are through receivables resulting from joint interest receivables and receivables from the sale of our oil and natural gas production due to the concentration of its oil and natural gas receivables with several significant customers. The inability or failure of our significant customers to meet their obligations to us or their insolvency or liquidation may adversely affect our financial results. However, the credit quality of our customers is believed to be high.
Joint operations receivables arise from billings to entities that own partial interests in the wells we operate. These entities participate in our wells primarily based on their ownership in leases on which we intend to drill. We have little ability to control whether these entities will participate in our wells.
Our hedging policy permits us to enter into derivative contracts with major financial institutions or major energy entities. Our derivative contracts are currently with major financial institutions, including the lender under our Credit Agreement. We have rights of offset against the borrowings under our Credit Agreement. See “Quantitative and Qualitative Disclosures About Market Risk—Counterparty and Customer Credit Risk” for additional information.
Interest Rate Risk
As of December 31, 2017, we had no borrowings outstanding under the Credit Agreement. Interest under the Credit Agreement is tiered based on amount borrowed. The interest rate is LIBOR plus a range of 2% to 3% depending on the outstanding balance. Assuming no change in the amount outstanding, the impact on interest expense of a 1% increase or decrease in the assumed weighted average interest rate would not materially impact our interest cost. We currently have no derivative arrangements to protect against fluctuations in interest rates applicable to our outstanding indebtedness.
Critical Accounting Policies and Estimates
The discussion and analysis of our financial condition and results of operations are based upon financial statements prepared on a carve-out basis and are derived from the financial statement and accounting records of Tema, which have been prepared in accordance with GAAP. The preparation of the financial statements requires it to make estimates and assumptions that affect the reported amounts of assets, liabilities, revenues, and expenses and related disclosure of contingent assets and liabilities. Changes in facts and circumstances or additional information may result in revised estimates, and actual results may differ from these estimates.
Successful Efforts Method of Accounting for Oil and Natural Gas Activities
Our oil and natural gas producing activities are accounted for using the successful efforts method of accounting. Under the successful efforts method, we capitalize lease acquisition costs, all development costs, and successful exploration costs.
Proved Oil and Natural Gas Properties. Costs incurred to obtain access to proved reserves and to provide facilities for extracting, treating, gathering, and storing oil, natural gas, and NGLs are capitalized. All costs incurred to drill and equip successful exploratory wells, development wells, development-type stratigraphic test wells, and service wells, including unsuccessful development wells, are capitalized.
Unproved Properties. Acquisition costs associated with the acquisition of non-producing leaseholds are recorded as unproved leasehold costs and capitalized as incurred. These consist of costs incurred in obtaining a mineral interest or right in a property, such as a lease in addition to options to lease, broker fees, recording fees, and other similar costs related to acquiring properties. Leasehold costs are classified as unproved until proved reserves are discovered, at which time related costs are transferred to proved oil and natural gas properties.
Exploration Costs. Exploration costs, other than exploration drilling costs, are charged to expense as incurred. These costs include exploratory seismic expenditures, other geological and geophysical costs, and lease
82
Table of Contents
Index to Financial Statements
rentals. The costs of drilling exploratory wells and exploratory-type stratigraphic wells are initially capitalized pending determination of whether the well has discovered proved commercial reserves. If the exploratory well is determined to be unsuccessful, the cost of the well is transferred to expense.
Impairment of Oil and Natural Gas Properties
The process of estimating oil and natural gas reserves is complex. It requires interpretations of available technical data and many assumptions relating to current and future economic conditions and commodity prices. Any significant inaccuracies in the interpretations or assumptions could materially affect the estimated quantities and present value of the reserves. Actual future production, commodity prices, revenues, taxes, development expenditures, operating expenses and quantities of recoverable reserves may vary, and has historically varied, from estimates.
Our proved oil and natural gas properties are recorded at cost. Our proved properties are evaluated for impairment on a field-by-field basis whenever events or changes in circumstances indicate that an asset’s carrying value may not be recoverable. We compare expected undiscounted future cash flows to the net book value of the asset. If the future undiscounted expected cash flows, based on its estimate of future oil and natural gas prices, operating costs and anticipated production from proved reserves and risk-adjusted probable and possible reserves, are lower than the net book value of the asset, the capitalized cost is reduced to fair value. Commodity pricing is estimated by using WTI and Henry Hub natural gas NYMEX strip market pricing, adjusted for quality, transportation fees and a regional price differential. Fair value is calculated by discounting the future cash flows at a rate of 10%. Our management considers 10% to be an appropriate discount rate to apply in determining fair value. We believe a 10% discount rate is commonly used by oil and gas industry peers, analysts, and investors in evaluating the monetary significance of oil and gas properties and for comparing the size and value of proved reserves among companies in our industry. Accordingly, we currently believe a 10% discount rate is consistent with a rate a market participant would consider in evaluating onshore domestic proved oil and gas reserves and produces a reasonable estimate of fair value.
While it is difficult to project future impairment write-downs in light of numerous factors involved, fluctuations in prices or costs could result in an impairment of our oil and natural gas properties. Our average realized price per barrel of oil decreased approximately 7%, and our average realized price per Mcf of natural gas decreased approximately 6%, for the year ended December 31, 2016 as compared to the year ended December 31, 2015. Lease operating expenses increased 5% for the year ended December 31, 2016 as compared to the year ended December 31, 2015. If we had used the average realized prices of oil and natural gas utilized in the preparation of our 2016 oil and gas reserve report and reduced it by 10% and held lease operating expenses constant, we would have incurred impairment of approximately $2.8 million in 2016. However, we use NYMEX and Henry Hub strip pricing for our impairment calculations. Assuming a 10% reduction in the NYMEX and Henry Hub pricing, we would not have incurred impairment in 2016. Further, assuming a 10% increase in the lease operating expenses utilized in the preparation of our 2016 oil and gas reserve report, and holding average realized oil and gas prices constant, we would not have incurred additional impairment.
Commodity prices are volatile, and there can be no assurance that we will not experience a more significant decline in average realized prices than discussed above. Depending upon the then-current commodity price environment, we may not be able to economically produce in the assumed quantities, which could have a negative impact on expected cash flows. In addition, during periods of rising commodity prices, lease operating costs have typically risen as well, and there can be no assurance that such costs will not increase more than the amount assumed above.
Unproved oil and natural gas properties are assessed periodically, and no less than annually, for impairment on an aggregate basis based on remaining lease term, drilling results, reservoir performance, seismic interpretation and future plans to develop acreage. As unproved oil and natural gas properties are developed and reserves are proved, the capitalized costs are subject to depreciation and depletion. If the development of these
83
Table of Contents
Index to Financial Statements
properties is deemed unsuccessful, the capitalized costs related to the unsuccessful activity is expensed in the year the determination is made. The rate at which the unproved oil and natural gas properties are written off or reclassified to proved oil and natural gas properties depends on the timing and success of our future exploration and development program.
Oil and Natural Gas Reserve Quantities
Our estimated proved reserve quantities and future net cash flows are critical to the understanding of the value of our business. They are used in comparative financial ratios and are the basis for significant accounting estimates in its financial statements, including the calculations of depletion and impairment of proved oil and natural gas properties. Future cash inflows and future production and development costs are determined by applying prices and costs, including transportation, quality differentials, and basis differentials, applicable to each period to the estimated quantities of proved reserves remaining to be produced as of the end of that period. Expected cash flows are discounted to present value using an appropriate discount rate. For example, the standardized measure calculations require a 10% discount rate to be applied. Although reserve estimates are inherently imprecise, and estimates of new discoveries and undeveloped locations are more imprecise than those of established producing oil and gas properties, we make a considerable effort in estimating our reserves. We expect proved reserve estimates will change as additional information becomes available and as commodity prices and operating and capital costs change. We have and expect to evaluate and estimate our proved reserves each year-end. For purposes of depletion and impairment, reserve quantities are adjusted in accordance with GAAP for the impact of additions and dispositions.
Revenue Recognition
Our revenue recognition policy is significant because revenue is a key component of our results of operations and our forward-looking statements contained in the above analysis of liquidity and capital resources. We derive our revenue primarily from the sale of produced oil, natural gas, and NGLs. Revenue is recognized when our production is delivered to the purchaser, but payment is generally received between 30 and 90 days after the date of production. No revenue is recognized unless it is determined that title to the product has transferred to a purchaser. At the end of each month, we make estimates of the amount of production delivered to the purchaser and the price we will receive. We use our knowledge of our properties, contractual arrangements, NYMEX and local spot market prices, and other factors as the basis for these estimates. Variances between our estimates and the actual amounts received are recorded in the month payment is received.
Commodity Derivative Instruments
We utilize commodity derivative instruments, including swaps, collars, and basis swaps, to manage the price risk associated with the forecasted sale of its oil and natural gas production. These commodity derivative instruments are not designated as hedges for accounting purposes. Accordingly, changes in fair value are recognized in our statements of operations in the period of change. Gains and losses on commodity derivatives and premiums paid for put options are included in cash flows from operating activities.
Asset Retirement Obligations
Our asset retirement obligation represents the estimated present value of the amount we will incur to retire long-lived assets at the end of their productive lives, in accordance with applicable state laws. Our asset retirement obligation is determined by calculating the present value of estimated cash flows related to the liability. The retirement obligation is recorded as a liability at its estimated present value as of inception with an offsetting increase in the carrying amount of the related long-lived asset. Periodic accretion of discount of the estimated liability is recorded as an expense in the income statement. The cost of the tangible asset, including the asset retirement cost, is depreciated over the useful life of the asset.
84
Table of Contents
Index to Financial Statements
Asset retirement liability is determined using significant assumptions, including current estimates of plugging and abandonment costs, annual inflation of these costs, the productive lives of assets, and our risk-adjusted interest rate. Changes in any of these assumptions can result in significant revisions to the estimated asset retirement obligation. Because of the subjectivity of assumptions, the costs to ultimately retire our wells may vary significantly from prior estimates.
Recently Issued Accounting Pronouncements
In April 2015, the FASB issued ASU 2015-03, Interest—Imputation of Interest (Subtopic 835-30): Simplifying the Presentation of Debt Issuance Costs, which requires that debt issuance costs related to a recognized debt liability be presented in the balance sheet as a direct deduction from the carrying amount of that debt liability, consistent with debt discounts. ASU 2015-03 is effective for fiscal years beginning after December 15, 2015, including interim periods therein, and is applied retrospectively. Early adoption is permitted for financial statements that have not been previously issued. In August 2015, ASU 2015-15, Presentation and Subsequent Measurement of Debt Issue Costs Associated with Line of Credit Arrangements, was subsequently issued to address the absence of authoritative guidance for debt issuance costs related to line-of-credit arrangements and states that the SEC staff will not object to an entity deferring and presenting debt issuance costs as an asset and subsequently amortizing the deferred debt issuance costs ratably over the term of the line-of-credit arrangement, regardless of whether there are any outstanding borrowings on the line-of-credit arrangement. The adoption of this ASU will impact the presentation of Deferred Financing Costs on our balance sheet.
In August 2015, the FASB issued ASU 2015-14, Revenue from Contracts with Customers (Topic 606): Deferral of Effective Date, which defers the effective date of ASU 2014-09 by one year to be effective for annual reporting periods beginning after December 15, 2018, and interim reporting periods within annual reporting periods beginning after December 31, 2019. ASU 2014-09, Revenue from Contracts with Customers, supersedes the revenue recognition requirements in Topic 605, Revenue Recognition, and industry-specific guidance in Subtopic 932-605, Extractive Activities—Oil and Gas—Revenue Recognition and requires an entity to recognize revenue when it transfers promised goods or services to customers in an amount that reflects the consideration the entity expects to be entitled to in exchange for those goods or services. Subsequently, in April 2016, the FASB issued ASU 2016-10, Revenue from Contracts with Customers (Topic 606): Identifying Performance Obligations and Licensing as further clarification on identifying performance obligations and the licensing implementation guidance. In May 2016, the FASB issued ASU 2016-12, Revenue from Contracts with Customers (Topic 606): Narrow—Scope Improvements and Practical Expedients, as clarifying guidance to improve the operability and understandability of the implementation guidance on principal versus agent considerations. In December 2016, the FASB further issued ASU 2016-20, Technical Corrections and Improvements to Topic 606, Revenue from Contracts with Customers, to increase stakeholders’ awareness of the proposals and to expedite improvements to ASU 2014-09. While the evaluation of this new accounting standard is still ongoing, no significant changes to our existing policies have been identified.
In November 2015, the FASB issued ASU 2015-17, Income Taxes (Topic 704): Balance Sheet Classification of Deferred Taxes. ASU No. 2015-17 eliminates the current requirement for organizations to present deferred tax liabilities and assets as current and non-current in a classified balance sheet. Instead, companies are required to classify all deferred tax assets and liabilities as non-current. ASU 2015-17 is effective for interim and annual periods beginning after December 15, 2016. The adoption of this ASU did not have a material impact on our financial statements.
In February 2016, the FASB issued ASU 2016-02, Leases (Topic 842), which requires the recognition of lease assets and lease liabilities by lessees for those leases classified as operating leases under previous U.S. GAAP. ASU 2016-02 is effective for fiscal years beginning after December 15, 2018, including interim periods within those fiscal years. Early adoption is permitted. We are currently evaluating the method of adoption and impact this standard will have on our financial statements and related disclosures.
85
Table of Contents
Index to Financial Statements
In June 2016, the FASB issued ASU 2016-13, Financial Instruments—Credit Losses (Topic 326): Measurement of Credit Losses on Financial Instruments requiring the measurement of all expected credit losses for financial assets, which include trade receivables, held at the reporting date based on historical experience, current conditions, and reasonable and supportable forecasts. The guidance in this ASU is effective for fiscal years, and interim periods within those fiscal years, beginning after December 15, 2019, with early adoption permitted for interim and annual periods beginning after December 15, 2018. The evaluation of this standard on our financial statements and related disclosures is currently ongoing.
In August 2016, the FASB issued ASU 2016-15, Statement of Cash Flows (Topic 320): Classification of Cash Receipts and Cash Payments, which addresses eight specific cash flow issues with the objective of reducing the existing diversity of presentation and classification in the statement of cash flows. The new standard applies to cash flows associated with debt payment or debt extinguishment costs, settlement of zero-coupon debt or other debt instruments with coupon rates that are insignificant in relation to effective interest rate of borrowing, contingent consideration payments made after a business combination, proceeds from the settlement of insurance claims, proceeds from the settlement of corporate-owned life insurance policies, distributions received from equity method investees, beneficial interests in securitization transactions and separately identifiable cash flows, and application of the predominance principle. ASU 2016-15 is effective for fiscal years beginning after December 15, 2017, including interim periods within those fiscal periods. Early adoption is permitted, but only if all amendments are adopted in the same period. The evaluation of this standard on our statements of cash Flows is currently ongoing.
In January 2017, the FASB issued ASU 2017-01, Business Combinations (Topic 805): Clarifying the Definition of a Business, which clarifies the definition of a business with the objective of adding guidance to assist entities with evaluating whether transactions should be accounted for as acquisitions (or disposals) of assets or businesses. ASU 2017-01 is effective for fiscal years beginning after December 15, 2018, including interim periods within these fiscal years. The adoption of this ASU, using a prospective approach, could have a material impact on our financial statements and related disclosures as future acquisitions or disposals could be treated as asset purchases (or sales) in lieu of a business.
In February 2017, the FASB issued ASU 2017-05, Other Income—Gains and Losses from the Derecognition of Nonfinancial Assets (Subtopic 610-20): Clarifying the Scope of Asset Derecognition Guidance and Accounting for Partial Sales of Nonfinancial Assets, which clarifies the scope of Subtopic 610-20 and provides further guidance for partial sales of nonfinancial assets. Subtopic 610-20, which was issued in May 2014 as part of ASU 2014-09, provides guidance for recognizing gains and losses from the transfer of nonfinancial assets in contracts with noncustomers. An entity is required to apply the amendments in ASU 2017-05 at the same time it applies the amendments in ASU 2014-09. An entity may elect to apply the amendments in ASU 2017-05 either retrospectively to each period presented in the financial statements in accordance with the guidance on accounting changes in FASB’s Accounting Standards Codification (“ASC”) Topic 250, Accounting Changes and Error Corrections, paragraphs 10-45-5 through 10-45-10 (i.e. the retrospective approach) or retrospectively with a cumulative-effect adjustment to retained earnings as of the beginning of the fiscal year of adoption (i.e. the modified retrospective approach). An entity may elect to apply all of the amendments in ASU 2017-05 and ASU 2014-09 using the same transition method, and alternatively may elect to use different transition methods. The impact ASU 2017-05 will have on the financial statements and related disclosures is currently ongoing.
In May 2017, the FASB issued ASU, 2017-09—Compensation—Stock Compensation (Topic 718); Scope of Modification Accounting. The new guidance clarifies when to account for a change to the terms or conditions of a share-based payment award as a modification. Under the new guidance, modification accounting is required only if the fair value, the vesting conditions, or the classification of the award as equity or liability changes as a result of the change in terms or conditions. This ASU is not expected to have a material impact on the Company’s consolidated financial results.
86
Table of Contents
Index to Financial Statements
In July 2017, the FASB issued ASU. 2017-11—Earnings Per Share (Topic 260); Distinguishing Liabilities from Equity (Topic 480); Derivatives and Hedging (Topic 815): (Part I) Accounting for Certain Financial Instruments with Down Round Features, (Part II) Replacement of the Indefinite Deferral for Mandatorily Redeemable Financial Instruments of Certain Nonpublic Entities and Certain Mandatorily Redeemable Noncontrolling Interests with a Scope Exception. The amendments in Part I of ASU 2017-11 change the classification analysis of certain equity-linked financial instruments (or embedded features) with down round features and also clarify existing disclosure requirements for equity-classified instruments. The amendments in Part II of ASU 2017-11 recharacterize the indefinite deferral of certain provisions of Topic 480, currently presented as pending content in the Codification, to a scope exception. For the Company, the amendments in Part I of this Update are effective for fiscal years beginning after December 15, 2019, and interim periods within fiscal years beginning after December 15, 2020. Early adoption is permitted, including adoption in an interim period. If an entity early adopts the amendments in an interim period, any adjustments should be reflected as of the beginning of the fiscal year that includes that interim period. The amendments in Part II of this Update do not require any transition guidance because those amendments do not have an accounting effect.
In August 2017, the FASB issued ASU 2017-12, Derivatives and Hedging (Topic 815): Targeted Improvements to Accounting for Hedging Activities, which expands and refines hedge accounting for both financial and non-financial risk components, aligns the recognition and presentation of the effects of hedging instruments and hedge items in the financial statements, and includes certain targeted improvements to ease the application of current guidance related to the assessment of hedge effectiveness. ASU 2017-12 is effective for the Company for fiscal years beginning after December 15, 2019. Early adoption is permitted. The Company has not yet evaluated the impact of this standard on its unaudited condensed financial statements and related disclosures.
Internal Controls and Procedures
In connection with the audit of the financial statements attributable to Rosehill Operating, management concluded that the Company had a material weakness as of December 31, 2016 due to significant deficiencies in the following areas:
| • | Asset retirement obligations estimates; |
| • | Information technology general controls; |
| • | Identification and documentation of related party transactions; |
| • | Going concern evaluation; and |
| • | Depreciation, depletion and amortization calculations |
In connection with the preparation of the financial statements for the quarter ended September 30, 2017, management and the Audit Committee concluded that we had a material weakness as of that date due to significant deficiencies related to (i) technical documentation of complex transactions, (ii) identification and classification of well costs, (iii) depreciation, depletion and amortization calculations, and (iv) timely reconciliation and review of accounts. A material weakness related to the identification and analysis of the appropriate accounting treatment of complex transactions was also identified during the quarter ended September 30, 2017, which failed to detect the error in our financial statements in a timely manner for the quarterly period ended June 30, 2017, filed with the Securities and Exchange Commission on August 15, 2017, and resulted in a restatement filed on November 3, 2017. As a result of the error and the related restatement of the Company’s financial statements, and as a result of the material weaknesses identified, our CEO and CFO have concluded that our internal controls over financial reporting were not effective as of September 30, 2017.
87
Table of Contents
Index to Financial Statements
Inflation
Inflation in the United States has been relatively low in recent years and did not have a material impact on our results of operations for the nine months ended September 30, 2017 and 2016 and the years ended December 31, 2016, 2015, or 2014. Although the impact of inflation has been insignificant in recent years, it is still a factor in the United States economy and we tend to experience inflationary pressure on the cost of oilfield services and equipment as increasing oil and natural gas prices increase drilling activity in our areas of operations.
Off-Balance Sheet Arrangements
Currently, we have no off-balance sheet arrangements.
88
Table of Contents
Index to Financial Statements
Our Company
We are an independent oil and natural gas company focused on the acquisition, exploration, development, and production of unconventional oil and associated liquids-rich natural gas reserves in the Permian Basin. The Permian Basin is located in West Texas and Southeastern New Mexico and is comprised of three primary sub-basins: the Midland Basin, the Central Basin Platform and the Delaware Basin. Since the sale of our Barnett Shale assets during the fourth of quarter 2017, our assets are primarily concentrated within the Delaware Basin, and we divide our operations into two core areas: the Northern Delaware Basin and the Southern Delaware Basin.
We were incorporated in Delaware on September 21, 2015 as a special purpose acquisition company under the name of KLR Energy Acquisition Corporation for the purpose of effecting a merger, asset acquisition, capital stock exchange, stock purchase, reorganization or similar business combination involving us and one or more businesses. On April 27, 2017, we consummated the Transaction pursuant to which we acquired a portion of the equity of Rosehill Operating into which Tema, a wholly owned subsidiary of Rosemore, contributed certain assets and liabilities. At the closing of the Transaction, we became the sole managing member of Rosehill Operating. Following the Transaction, we changed our name to Rosehill Resources Inc.
Our sole material asset is our interest in Rosehill Operating. As the sole managing member of Rosehill Operating, we, through our officers and directors, are responsible for all operational, management and administrative decisions relating to Rosehill Operating’s business without the approval of any other member, unless otherwise specified in the Second Amended LLC Agreement.
Our management team has significant experience identifying, acquiring and developing unconventional oil and natural gas assets with the objective of being a returns-oriented pure-play Delaware Basin company focusing on (i) acreage with reduced development risk as a result of being in proved areas within the vicinity of other successful wells, (ii) stacked pay zones, including Brushy Canyon, Avalon/1st Bone Spring, 2nd Bone Spring, 3rd Bone Spring, Upper Wolfcamp A (X/Y), Lower Wolfcamp A, and Wolfcamp B, and (iii) application of geology, optimizing well process improvements and well returns. We believe these characteristics enhance our horizontal production capabilities, recoveries and economic results.
Since 2012, we have drilled 46 horizontal wells in the Delaware Basin with a continuing drop in drilling times and an increase in operational capabilities and efficiencies. In late December 2017, our production exceeded 10,000 net barrels of oil equivalent per day, an increase of over 89% as compared to the daily average of the third quarter of 2017. We have assembled a multi-year inventory of horizontal development and exploration projects, including projects to further evaluate the regional extent and multi-pay potential of our assets. As of December 31, 2017, our portfolio included 41 gross operated producing horizontal wells and working interests in approximately 11,150 net acres in the Delaware Basin with an inventory of 530 gross operated and non-operated potential horizontal drilling locations. The following table presents as of December 31, 2017 certain information for the completed wells by target bench for the horizontal wells that we have drilled since 2014.
| Well Name |
Target Formation |
First Production / Anticipated Completion |
Lateral Length (feet) |
Days to Drill |
Estimated Total D&C ($M) |
|||||||||||||
| Z&T 20 G004 |
3rd Bone Spring Sand | 1/18/18 | 4,305 | 13 | $ | 7,270 | ||||||||||||
| Z&T 20 G003R |
Wolfcamp A (X/Y) | 1/18/18 | 4,273 | 13 | $ | 7,357 | ||||||||||||
| Z&T 42 F001 |
Lower Wolfcamp A | 12/22/17 | 4,269 | 20 | $ | 7,278 | ||||||||||||
| Z&T 20 F001 |
Lower Wolfcamp A | 12/21/17 | 4,905 | 17 | $ | 7,208 | ||||||||||||
| Weber 26 C004 |
3rd Bone Spring Sand | 12/19/17 | 5,043 | 14 | $ | 6,847 | ||||||||||||
| Weber 26 C003 |
Wolfcamp A (X/Y) | 12/19/17 | 4,990 | 13 | $ | 6,650 | ||||||||||||
| Weber 26 C002 |
Lower Wolfcamp A | 12/19/17 | 4,506 | 13 | $ | 6,415 | ||||||||||||
89
Table of Contents
Index to Financial Statements
| Well Name |
Target Formation |
First Production / Anticipated Completion |
Lateral Length (feet) |
Days to Drill |
Estimated Total D&C ($M) |
|||||||||||||
| Z&T 42 F002 |
3rd Bone Spring Sand | 11/23/17 | 4,713 | 14 | $ | 6,742 | ||||||||||||
| Z&T 42 G004 |
Wolfcamp A (X/Y) | 11/23/17 | 4,617 | 18 | $ | 5,688 | ||||||||||||
| Z&T 42 G005 |
3rd Bone Spring Sand | 11/18/17 | 4,707 | 21 | $ | 8,036 | ||||||||||||
| Z&T 42 G003 |
Lower Wolfcamp A | 11/18/17 | 4,545 | 22 | $ | 7,961 | ||||||||||||
| Z&T 20 A002 |
2nd Bone Spring Sand | 10/16/17 | 4,835 | 15 | $ | 7,272 | ||||||||||||
| Kyle 24 E003 |
3rd Bone Spring Sand | 10/13/17 | 4,870 | 16 | $ | 7,453 | ||||||||||||
| Kyle 24 E002 |
Wolfcamp A (X/Y) | 10/13/17 | 4,652 | 27 | $ | 7,950 | ||||||||||||
| Kyle 24 E001 |
Lower Wolfcamp A | 10/12/17 | 5,272 | 22 | $ | 9,651 | ||||||||||||
| Weber 26 G002 |
Wolfcamp B | 10/3/17 | 4,665 | 31 | $ | 9,764 | ||||||||||||
| Kyle 24 G002 |
3rd Bone Spring Sand | 9/25/17 | 4,915 | 13 | $ | 6,514 | ||||||||||||
| Kyle 24 F001 |
Lower Wolfcamp A | 9/23/17 | 4,971 | 21 | $ | 7,904 | ||||||||||||
| Z&T 20 G002 |
Wolfcamp B | 8/9/17 | 3,267 | 26 | $ | 9,395 | ||||||||||||
| Weber 26 C001 |
Wolfcamp B | 4/29/17 | 5,200 | 26 | $ | 10,015 | ||||||||||||
| Weber 26 G001 |
Lower Wolfcamp A | 12/31/16 | 4,612 | 34 | $ | 8,471 | ||||||||||||
| Z&T 20 A001 |
Lower Wolfcamp A | 11/10/16 | 4,526 | 36 | $ | 6,679 | ||||||||||||
| Kyle 24 G001 |
Lower Wolfcamp A | 5/16/16 | 4,324 | 31 | $ | 7,314 | ||||||||||||
| Z&T 20 G001 |
Lower Wolfcamp A | 2/23/16 | 4,171 | 40 | $ | 6,247 | ||||||||||||
| Z&T 42 F003BH |
Wolfcamp A (X/Y) | 12/4/14 | 4,020 | 48 | $ | 11,095 | ||||||||||||
| Kyle 26 E004WH |
Wolfcamp A (X/Y) | 6/27/14 | 4,250 | 60 | $ | 10,740 | ||||||||||||
We have identified 480 gross operated and 50 gross non-operated potential horizontal drilling locations, including 30 locations associated with proved undeveloped reserves as of December 31, 2017, in up to ten formations from Brushy Canyon down through the Wolfcamp B, which is reflected in the table below. As of December 31, 2017, 32 of our gross operated potential horizontal drilling locations in the Northern Delaware Basin were uneconomic using SEC pricing assumptions. We believe that development drilling of our identified gross operated potential horizontal drilling locations, together with an increased focus on maximizing the value of existing assets by optimizing completions, reducing horizontal drilling costs, efficiently building out facilities, and reducing operating costs, will allow us to grow our production and reserves. We also intend to grow our production and reserves through acquisitions that meet certain strategic and financial objectives. As of December 31, 2017, our gross operated potential horizontal drilling locations are reflected in the table below:
| Target Formation |
Gross Operated Potential Horizontal Drilling Locations (1)(2)(3)(4)(5) |
|||
| Brushy Canyon |
33 | |||
| Upper Avalon |
10 | |||
| Lower Avalon / 1st Bone Spring |
45 | |||
| 2nd Bone Spring Shale |
19 | |||
| 2nd Bone Spring Sand |
61 | |||
| 3rd Bone Spring Shale |
19 | |||
| 3rd Bone Spring Sand |
50 | |||
| Upper Wolfcamp A (X/Y) |
70 | |||
| Lower Wolfcamp A |
80 | |||
| Wolfcamp B |
93 | |||
|
|
|
|||
| Total Horizontal Locations |
480 | |||
|
|
|
|||
| (1) | Our estimated drilling locations are based on well spacing assumptions and the evaluation of our horizontal drilling results as well as results of other operators in the area, combined with our interpretation of available |
90
Table of Contents
Index to Financial Statements
| geologic and engineering data. In particular, we have analyzed and interpreted well results and other data acquired through our participation in the drilling of a vertical well that penetrated all of our targeted horizontal formations. In addition, to evaluate the prospects of our horizontal acreage, we have performed open-hole and mud log evaluations, core analysis, and drill cuttings analysis, and acquired and interpreted modern 3-D seismic data. |
| (2) | Our inventory of gross operated potential horizontal drilling locations assumes four to six wells per 640-acre section within each of the ten formations, with the number of prospective formations varying from tract to tract depending on the geology of the specific area. |
| (3) | Our identified gross operated potential horizontal drilling locations are located on operated and non-operated acreage. We operate approximately 91% of our 530 identified gross potential horizontal drilling locations. Of the 31 identified gross operated potential horizontal drilling locations associated with proved undeveloped reserves, 30 are operated and one is non-operated. As of December 31, 2017, we had an approximate 91% average working interest in our operated acreage. |
| (4) | Includes proved undeveloped (“PUD”) locations on our leasehold in the Northern Delaware Basin. |
| (5) | The drilling locations that we actually drill will depend on the availability of capital, regulatory approvals, seasonal restrictions, commodity prices, costs, actual drilling results and other factors. Any drilling activities we are able to conduct on these identified potential horizontal drilling locations may not be successful and may not result in our ability to add additional proved reserves to our existing proved reserves. Drilling for and producing oil and natural gas are high-risk activities with many uncertainties that could adversely affect our business, financial condition and results of operations. The identified gross potential horizontal drilling locations are scheduled out over many years, making them susceptible to uncertainties that could materially alter the occurrence or timing of their drilling. In addition, we may not be able to raise the capital that would be necessary to drill such locations. |
We expect to drill between 50 and 54 wells in 2018, completing between 42 and 46 wells. As of December 31, 2017, we had five drilled uncompleted wells (“DUCs”) and expect to exit 2018 with 12 to 16 DUCs. We expect our 2018 capital budget for drilling, completion and recompletion activities and facilities costs to be in the range of $350 to $375 million, excluding acreage acquisitions. We anticipate that 80-85% of our 2018 capital costs will be incurred in connection with drilling and completion activities.
Our Business Strategies
Our primary business objective is to increase stockholder value through the execution of the following strategies.
| • | Maximize returns by optimizing drilling and completion techniques and improving operational efficiency. Our experienced management and technical teams have a proven track record of optimizing drilling and completion techniques to drive well and field-level returns. We have experienced a significant decrease in our drilling time and increase in our operational capabilities and efficiencies. These have been driven in part by efficiency improvements in the field, including reduced drilling days, the modification of well designs and reduction or elimination of unnecessary costs, such as eliminating the use of snubbing units to install tubing into a live well, reducing the number of trips in and out of the wellbore during drilling by switching to a more engineered drill bit selection, and utilizing a third-party mud consultant to monitor the mud program and properties thereby reducing the chemical usage and improving the rate of penetration. We extensively employ pad drilling and sequential well completion, an approach we believe reduces drilling days and maximizes ultimate recovery of the reservoir by minimizing degradation in offset-well performance due to drops in pressure as resource is extracted subsurface. We have observed and integrated best practices from Delaware Basin operators on our acreage and have benefited from drilling efficiencies and enhanced completion techniques. |
| • | Grow production, cash flow and reserves by developing our extensive Delaware Basin drilling inventory. We intend to selectively develop our acreage base in an effort to maximize its value and resource potential. We will pursue drilling opportunities that offer competitive returns that we consider to |
91
Table of Contents
Index to Financial Statements
| be low risk based on production history and industry activity in the area and repeatable as a result of well-defined geological properties over a large area. Through the conversion of our resource base to developed reserves, we will seek to increase our reserves, production and cash flow while generating favorable returns on invested capital. Our proved reserves increased 135% from year-end 2016 to 31.1 MMBoe at December 31, 2017 and in late December 2017, our production exceeded 10,000 net barrels of oil equivalent per day, an increase of over 89% as compared to the daily average of the third quarter of 2017. We will continue to closely monitor operators throughout the basin, including those with active leases on adjoining properties, or offset operators, as they delineate acreage and zones, providing us further data to optimize our development plan over time. We believe this strategy will allow us to significantly grow our reserves, production and cash flow while efficiently allocating capital to maximize the value of our resource base. |
| • | Pursue additional leasing and strategic acquisitions. We intend to focus primarily on increasing our acreage position through leasing in the immediate vicinity of our existing Delaware Basin acreage, while selectively pursuing other acquisition opportunities that meet our strategic and financial objectives. Our acreage position extends through what we believe are multiple oil and natural gas producing stratigraphic horizons in the Delaware Basin, which we refer to as the stacked pay core, and we believe we can economically and efficiently add and integrate additional acreage into our current operations. Since 2012, we have grown our acreage position in the Delaware Basin from approximately 2,400 net acres to approximately 11,150 net acres. We have a proven history of acquiring leasehold positions in the Delaware Basin that have substantial oil-weighted resource potential, and believe our management team’s extensive experience operating in the Delaware Basin provides us with a competitive advantage in identifying leasing opportunities and acquisition targets and evaluating resource potential. |
| • | Maintain a high degree of operational control. We seek to maintain operational control of our properties in order to better execute on our strategy of enhancing returns through operating improvements and cost efficiencies. As the operator of approximately 95% of our acreage, we are able to effectively manage (i) the timing and level of our capital spending, (ii) our development drilling strategies and (iii) our operating costs. We believe this flexibility to manage our development program allows us to optimize our field-level returns and profitability. |
| • | Maintain a conservative financial position. We seek to maintain a conservative financial position. We expect to fund our growth with cash on hand, including proceeds received from the issuance of the Series B Preferred Stock and the Second Lien Notes, cash flow from operations, borrowings under our revolving credit facility, additional issuances of Series B Preferred Stock to EIG and by opportunistically accessing the capital markets. We intend to continue allocating capital in a disciplined manner and proactively managing our cost structure to achieve our business objectives. Consistent with our disciplined approach to financial management, we expect to maintain an active hedging program that seeks to reduce our exposure to commodity price volatility and to protect our cash flow and capital program. |
Our Competitive Strengths
We believe the following strengths will assist in the successful execution of our business strategies:
| • | Attractively positioned in the oil-rich Delaware Basin. We have accumulated a leasehold position of approximately 11,150 net acres in the Delaware Basin as of December 31, 2017. We believe the Delaware Basin is an attractive operating area due to its immense original oil-in-place, favorable operating environment, multiple proven horizontal reservoirs, high oil and liquids-rich natural gas content, well-developed network of oilfield service providers, long-lived reserves with relatively consistent reservoir quality and historically high drilling success rates. In addition to leveraging our technical expertise in this core area, our geographically concentrated acreage position allows us to capitalize on economies of scale with respect to drilling and production costs. Based on our drilling and production results to date and well-established offset operator activity in and around our project areas, we believe there are relatively low geologic risks and ample repeatable drilling opportunities across our core Delaware Basin operating area. |
92
Table of Contents
Index to Financial Statements
| • | Leverage extensive industry experience and veteran leadership to optimize operations and to evaluate and execute strategic acquisitions. Our management and technical teams have an extensive track record of forming and building businesses in North American resource plays. Our management team has extensive engineering, geological, geophysical, technical and operational expertise in successfully developing and operating properties. As a result of our management’s operational expertise, we experienced an increase in our proved reserves of 135% from year-end 2016 to 31.1 MMBoe at December 31, 2017, and in late December 2017, our production exceeded 10,000 net barrels of oil equivalent per day, an increase of over 89% as compared to the daily average of the third quarter of 2017. Our management also has significant experience in successfully sourcing, evaluating and executing acquisition opportunities, including multiple privately sourced acquisitions that make up the majority of our current acreage position. We regularly initiate and review acquisition opportunities and intend to pursue future acquisitions that meet our strategic and financial objectives. We believe our understanding of the geology and reservoir properties of potential acquisition targets will allow us to identify and acquire highly prospective acreage in order to grow our resource base and maximize stockholder value. |
| • | Operating control over the majority of our asset portfolio and high working interests. Because we operate approximately 95% of our net acreage, the amount and timing of our capital expenditures are largely subject to our discretion. Our operated acreage provides us with flexibility to manage our drilling program and optimize our returns and profitability. As of December 31, 2017, our average working interest in our operated and non-operated wells in the Delaware Basin was approximately 91% and 16%, respectively. High working interests allow us to leverage our operational team more effectively and generate better returns. |
| • | Conservative capital structure. After giving effect to this offering and the application of the net proceeds therefrom (including any proceeds from the exercise of the underwriters’ option to purchase additional shares), we expect to have approximately $ million of available borrowing capacity under our revolving credit facility and $ million of cash on hand and access to up to $50 million through additional issuances of Series B Preferred Stock to EIG. We will continue to seek to maintain financial flexibility to allow us to actively pursue our drilling, development and exploration activities across our portfolio and maximize our ability to complete any incremental acquisition opportunities. |
Our Operations
Our future development will be focused predominately on horizontal development drilling in both our core acreage areas in the Northern Delaware Basin and the Southern Delaware Basin. We are currently operating two horizontal rigs and have one frac crew under contract.
The amount and timing of our capital expenditures is largely discretionary and within our control. We could choose to defer a portion of our planned capital expenditures depending on a variety of factors, including but not limited to the success of our drilling activities, prevailing and anticipated prices for oil and natural gas, the availability of necessary equipment, infrastructure and capital, the receipt and timing of required regulatory permits and approvals, seasonal conditions, drilling and acquisition costs and the level of participation by other interest owners.
Because we operate approximately 95% of our net acreage, the amount and timing of these capital expenditures are largely subject to our discretion. Our operated acreage provides us with flexibility to manage our drilling program and optimize our returns and profitability. Our decision to defer a portion of our planned capital expenditures would depend on a variety of factors, including the success of our drilling activities; prevailing and anticipated prices for oil, natural gas, and NGLs; the availability of necessary equipment, infrastructure, and capital; the receipt and timing of required regulatory permits and approvals; drilling, completion and acquisition costs; and the level of participation by other working interest owners.
93
Table of Contents
Index to Financial Statements
We operate in one industry segment, which is the exploration, development and production of oil and natural gas, and all operations are conducted in the United States. Consequently, we currently report a single reportable segment. See the notes to our consolidated financial statements for financial information about this reportable segment.
Our 2017 capital budget for drilling, completion and recompletion activities and facilities costs, excluding leasing and other acquisitions, increased from $145 million to a range of $175 million to $195 million, due to faster drilling and additional completions that occurred in 2017. For the year ended December 31, 2017, we expect to drill 26 gross (26 net) and complete 21 gross (21 net) horizontal wells.
Our 2016 capital budget for drilling, completion and recompletion activities and facilities costs was approximately $25.5 million, excluding leasing and other acquisitions. We allocated approximately $24.8 million to drill and complete operated wells and $0.7 million to participate in the drilling and completion of non-operated wells. For 2016, we budgeted $1.6 million for leasing. In the year ended December 31, 2016, we incurred capital costs of approximately $22.9 million, excluding asset retirement costs and leasing and acquisition costs.
Our Properties
Our properties are located in two core areas within the Delaware Basin, a sub-basin of the Permian Basin. The Permian Basin consists of mature, legacy onshore oil and liquids-rich natural gas reservoirs that span approximately 86,000 square miles in West Texas and New Mexico. The Permian Basin is composed of five sub regions: the Delaware Basin, the Central Basin Platform, the Midland Basin, the Northwest Shelf and the Eastern Shelf. The Permian Basin is an attractive operating area due to its multiple horizontal and vertical target formations, favorable operating environment, high oil and liquids-rich natural gas content, mature infrastructure, well-developed network of oilfield service providers, long-lived reserves with consistent reservoir quality and historically high drilling success rates. According to the U.S. Energy Information Administration, the Permian Basin is the most prolific unconventional oil producing area in the U.S. and accounts for nearly half of the active drilling rigs in the United States as of December 31, 2016.
Our Land
The present structural form of the Delaware Basin began to take shape in the early Pennsylvanian period at which time the area slowly downwarped relative to the adjacent Central Basin Platform and Northwest Shelf. This period was characterized by relatively stable marine shale and limestone deposition with periodic influxes of siliciclastics during sea-level lowstands. Stratigraphic records indicate a rapid deepening of the Delaware Basin during early Permian time. Organic rich marine shales, carbonate debris flows, and turbidite sandstones were the predominant deposits in the Delaware Basin during this period. Subsequent burial and thermal maturation of this thick Permian succession of highly organic source and reservoir rock resulted in what Rosehill Operating believes is evolving into a prolific oil field.
The Delaware Basin encompasses an estimated 15,000 square miles and contained 42,000 producing wells as of September 2017, with production from certain wells dating back to 1924. Over the past decade, horizontal drilling activity has been more prevalent within the Delaware Basin relative to other areas of the Permian Basin. As of December 31, 2017, three of the top four Permian Basin counties by horizontal rig count are located in the Delaware Basin.
Oil and natural gas production was first established in the 1940s and 1950s from vertical wells in the Delaware Basin in the area of Rosehill Operating’s leasehold. Unconventional, horizontal production was first established in 2010 in the Avalon Shale member of the Bone Spring formation. Horizontal Wolfcamp production was established in 2014. The Wolfcamp has become the most common horizontal drilling target in Rosehill Operating’s core, with new wells targeting both the XY Sand interval near the top of the Wolfcamp A, and the Lower Wolfcamp A.
94
Table of Contents
Index to Financial Statements
Summary of Core Operating Areas and Other Plays
The following is a summary of information regarding our core operating areas and other plays:
| Total Gross Acreage |
Total Net Acreage |
|||||||
| Northern Delaware Basin |
6,664 | 4,009 | ||||||
| Southern Delaware Basin |
8,098 | 7,132 | ||||||
| Other |
— | — | ||||||
|
|
|
|
|
|||||
| Total Delaware Basin |
14,762 | 11,141 | ||||||
|
|
|
|
|
|||||
Northern Delaware Basin. At December 31, 2017, we had estimated proved reserves in this area of 31,132 MBoe, representing 100% of our total proved reserves. The Northern Delaware Basin is characterized by a thick, resource-rich hydrocarbon column that lends itself to multi-zone development. We leverage leading-edge horizontal drilling and completion technologies to target the Brushy Canyon, Avalon Shale, Bone Spring and Wolfcamp producing formations. These formations produce from 6,500 to 13,500 feet for our currently targeted activity. 2018, we intend to spend approximately 58 percent of our 2018 drilling and completions capital plan on our Northern Delaware Basin assets.
Southern Delaware Basin. At December 31, 2017, we had no estimated proved reserves in this area. Across our Southern Delaware Basin acreage position we primarily target the Bone Spring and Wolfcamp formations, which generally range from 7,000 feet to 10,500 feet in depth. In 2018, we intend to spend approximately 42 percent of our 2018 drilling and completions capital plan on our Southern Delaware Basin assets and to use drilling and completion techniques used in the Northern Delaware Basin, where applicable.
Our Acreage
The following table summarizes our Delaware Basin acreage by county as of December 31, 2017:
| County |
Gross | Net | ||||||
| Loving (Delaware) |
4,307 | 3,009 | ||||||
| Lea (Delaware) |
1,240 | 868 | ||||||
| Eddy (Delaware) |
1,117 | 132 | ||||||
| Reeves (Delaware) |
627 | 627 | ||||||
| Pecos (Delaware) |
7,471 | 6,505 | ||||||
|
|
|
|
|
|||||
| Total |
14,762 | 11,141 | ||||||
|
|
|
|
|
|||||
The following table presents our total gross and net developed and undeveloped acreage by area at December 31, 2017. Developed acreage consists of acres spaced or assigned to productive wells and does not include undrilled acreage held by production under the terms of the lease. Undeveloped acreage is defined as acres on which wells have not been drilled or completed to a point that would permit the production of commercial quantities of oil or natural gas, regardless of whether such acreage contains proved reserves.
| Developed Acres | Undeveloped Acres | Total Acres | ||||||||||||||||||||||
| Gross | Net | Gross | Net | Gross | Net | |||||||||||||||||||
| Northern Delaware Basin |
4,624 | 3,041 | 2,040 | 968 | 6,664 | 4,009 | ||||||||||||||||||
| Southern Delaware Basin |
2,990 | 2,380 | 5,108 | 4,752 | 8,098 | 7,132 | ||||||||||||||||||
| Other |
— | — | — | — | — | — | ||||||||||||||||||
|
|
|
|
|
|
|
|
|
|
|
|
|
|||||||||||||
| Total |
7,614 | 5,421 | 7,148 | 5,720 | 14,762 | 11,141 | ||||||||||||||||||
|
|
|
|
|
|
|
|
|
|
|
|
|
|||||||||||||
| (1) | Developed acreage is acreage spaced or assigned to productive wells and does not include undrilled acreage held by production under the terms of the lease. |
95
Table of Contents
Index to Financial Statements
| (2) | Undeveloped acreage is acreage on which wells have not been drilled or completed to a point that would permit the production of commercial quantities of oil or natural gas, regardless of whether such acreage contains proved reserves. |
| (3) | A gross acre is an acre in which a working interest is owned. |
| (4) | A net acre is deemed to exist when the sum of the fractional ownership working interests in gross acres equals one. |
We are the operator of approximately 95% of this acreage. In addition, we own mineral interests underlying approximately 14,760 gross (11,150 net) of these acres, with an average royalty interest of 78%. Through December 31, 2017, we have drilled 26 gross (26 net) wells in our Northern Delaware Basin leasehold acreage, primarily targeting the Bone Spring and Wolfcamp formations.
Undeveloped Acreage Expirations
Many of the leases comprising the undeveloped acreage set forth in the table above will expire at the end of their respective primary terms unless production from the leasehold acreage has been established prior to such date, in which event the lease will remain in effect until the cessation of production. The following table sets forth the gross and net undeveloped acreage by area, as of December 31, 2017, that will expire over the next five years unless production is established within the spacing units covering the acreage or the lease is renewed or extended under continuous drilling provisions prior to the primary term expiration dates.
| EXPIRATIONS | 2018 | 2019 | 2020 | 2021 | 2022 | |||||||||||||||||||||||||||||||||||
| Gross | Net | Gross | Net | Gross | Net | Gross | Net | Gross | Net | |||||||||||||||||||||||||||||||
| Northern Delaware Basin |
— | — | — | — | — | — | — | — | — | — | ||||||||||||||||||||||||||||||
| Southern Delaware Basin |
— | — | 640 | 640 | 3,922 | 3,891 | — | — | — | — | ||||||||||||||||||||||||||||||
|
|
|
|
|
|
|
|
|
|
|
|
|
|
|
|
|
|
|
|
|
|||||||||||||||||||||
| Total |
— | — | 640 | 640 | 3,922 | 3,891 | — | — | — | — | ||||||||||||||||||||||||||||||
|
|
|
|
|
|
|
|
|
|
|
|
|
|
|
|
|
|
|
|
|
|||||||||||||||||||||
Our Locations
As of December 31, 2017, we have identified 480 gross operated potential horizontal drilling locations within our core acreage, in up to ten formations from Brushy Canyon down through the Wolfcamp B. Advanced petrophysical logs from the vertical portions of our wells, sidewall cores, and seismic data are being utilized to guide our horizontal development of the area. The use of seismic data has resulted in a better understanding of our leasehold’s geology relative to other parts of the basin. The depth to the top of the Wolfcamp from a representative well central to our leasehold is approximately 11,500 feet true vertical depth. The gross thickness of the potential pay section from the top of the Brushy Canyon formation through the base of the Wolfcamp B is approximately 4,500 feet, an attractive thickness for development with multiple horizontal landing formations. We believe that the combination of these conditions will allow us to achieve superior results during the development of its leasehold.
Historically, our horizontal drilling has been widespread across the majority of our lease acreage. We have established commercial production in seven distinct formations in the Delaware Basin in: the Upper Avalon, Lower Avalon, 2nd Bone Spring Sand, 3rd Bone Spring Sand, Upper Wolfcamp A (X/Y), Lower Wolfcamp A and Wolfcamp B. In addition, offset operators have drilled and are producing in all ten formations-from Brushy Canyon down through the Wolfcamp B, enabling us to evaluate our acreage across various geographic areas and stratigraphic formations. As of December 31, 2017, approximately 51% of our total net operated acreage was either held by production or under continuous drilling provisions. Offset operator activity within the 3rd Bone Spring Sand and the Wolfcamp formations as well as our recent successful Wolfcamp drilling program has been a catalyst for Rosehill Operating to generate a development program focused on the 3rd Bone Spring Sand, Upper Wolfcamp A (X/Y), Lower Wolfcamp A and Wolfcamp B formations. We will closely monitor this offset activity and adjust our future development plans with information and best practices learned from other operators.
96
Table of Contents
Index to Financial Statements
Completion design and our effective execution are the predominant factors that dictate relative well performance in an area or zone. We have an evolving completion strategy that includes methodical adjustments of parameters, testing of different well designs on adjacent locations with similar rock characteristics, constant monitoring and re-evaluation of results and ultimately tailoring completions to the conditions specific to an area or formation. Our current base completion design is a hybrid fracture stimulation-a combination of slickwater and cross-linked gel. The field-level rate of return is most influenced by incremental improvements in well performance and cost savings; our philosophy is to focus on both parameters, with an emphasis on performance enhancement.
We believe all ten formations represent opportunities across our core acreage and we plan to target those formations in our future drilling program. In this prospectus, identified gross potential drilling locations are defined as locations on operated and non-operated leaseholds specifically identified by geologic, engineering and economic assessment. We have estimated our drilling locations based on well spacing assumptions and the evaluation of our operated horizontal drilling results as well as results of other operators in our area. Well performances are combined with interpretation of available geologic and engineering data to generate a development model for the assets. In addition, to evaluate the prospects of our horizontal acreage, we have performed open-hole and mud log evaluations, core analysis, and drill cuttings analysis. We have also acquired 48 square miles of 3-D seismic data that has been used to aid in the interpretation of the prospective formations. The availability of local infrastructure, well performance results, subsurface data and other factors that management may deem relevant, such as easement restrictions and state and local regulations, are considered in determining such locations. The locations that we will actually drill will ultimately depend upon the availability of capital, regulatory approvals, seasonal restrictions, oil and natural gas prices, costs and actual drilling results, among other factors.
Based on our evaluation of applicable geologic and engineering data, we currently have approximately 480 gross (438 net) identified potential operated horizontal drilling locations in multiple horizons on our acreage. We intend to continue to develop our reserves and increase production through development drilling and exploitation and exploration activities on this multi-year project inventory of identified potential drilling locations and through additional acquisitions that meet our strategic and financial objectives, targeting oil-weighted reserves.
The following table summarizes our technically identified gross operated horizontal drilling locations in the Delaware Basin as of December 31, 2017:
| Net Acreage | ||||
| Northern Delaware Basin |
4,009 | |||
| Southern Delaware Basin |
7,132 | |||
|
|
|
|||
| Total Delaware Basin |
11,141 | |||
|
|
|
|||
| (1) | We have estimated our drilling locations based on well spacing assumptions for the areas in which we operate, and other criteria. The drilling locations on which we drill will depend on the availability of capital, regulatory approvals, commodity prices, costs, actual drilling results and other factors. Any drilling activities we conduct on these identified locations may not be successful and may not result in our adding additional proved reserves to our existing proved reserves. See also “Risk Factors. |
| (2) | Our inventory of gross operated potential horizontal drilling locations assumes four to six wells per 640-acre section within each of the ten formations, with the number of prospective formations varying from tract to tract depending on the geology of the specific area. |
97
Table of Contents
Index to Financial Statements
The table below sets forth our identified operated horizontal drilling locations for both of our core areas in the Delaware Basin by formation as of December 31, 2017:
| Operated Horizontal Drilling Locations(1) | ||||||||
| Target Formation: |
Gross | Net | ||||||
| Brushy Canyon |
33 | 30 | ||||||
| Upper Avalon |
10 | 10 | ||||||
| Lower Avalon / 1st Bone Spring |
45 | 41 | ||||||
| 2nd Bone Spring Shale |
19 | 19 | ||||||
| 2nd Bone Spring Sand |
61 | 56 | ||||||
| 3rd Bone Spring Shale |
19 | 19 | ||||||
| 3rd Bone Spring Sand |
50 | 44 | ||||||
| Wolfcamp AX, Y |
70 | 63 | ||||||
| Lower Wolfcamp A |
80 | 71 | ||||||
| Wolfcamp B |
93 | 85 | ||||||
|
|
|
|
|
|||||
| Total Horizontal Locations(2) |
480 | 438 | ||||||
|
|
|
|
|
|||||
| (1) | Our inventory of gross operated potential horizontal drilling locations assumes four to six wells per 640-acre section within each of the ten formations, with the number of prospective formations varying from tract to tract depending on the geology of the specific area. |
| (2) | Includes proved undeveloped (“PUD”) locations for our leasehold in the Northern Delaware Basin. |
Drilling Activity and Results
The following table summarizes our drilling activity for the last three years.
| For the Year Ended December 31, | ||||||||||||||||
| 2017 | 2016 | 2015 | 2014 | |||||||||||||
| (unaudited) | ||||||||||||||||
| Exploratory Wells: |
||||||||||||||||
| Productive(1) |
15 | 3 | 2 | 5 | ||||||||||||
| Dry |
— | — | — | — | ||||||||||||
| Total Exploratory |
15 | 3 | 2 | 5 | ||||||||||||
|
|
|
|
|
|
|
|
|
|||||||||
| Development Wells: |
||||||||||||||||
| Productive(1) |
4 | 2 | 1 | 4 | ||||||||||||
| Dry |
— | — | — | — | ||||||||||||
| Total Exploratory |
4 | 2 | 1 | 4 | ||||||||||||
|
|
|
|
|
|
|
|
|
|||||||||
| Total Wells |
||||||||||||||||
| Productive(1) |
19 | 5 | 3 | 9 | ||||||||||||
| Dry |
— | — | — | — | ||||||||||||
| (1) | Although a well may be classified as productive upon completion, future changes in oil and natural gas prices, operating costs and production may result in the well becoming uneconomical, particularly exploratory wells for which there is no production history. |
Production Status
During the nine months ended September 30, 2017, our net production from our Delaware Basin acreage was 1,454,387 BOE, or an average of 5,327 BOE/d, of which 55% was oil, 24% was natural gas liquids and 21% was natural gas.
98
Table of Contents
Index to Financial Statements
Operational Facilities
Our development plan includes the development of necessary infrastructure to lower our costs and support our drilling schedule and production growth. We expect to accomplish this goal primarily through contractual arrangements with third-party service providers. Our facilities are generally in close proximity to our well locations and include storage tank batteries, oil/natural gas/water separation equipment, and artificial lift equipment. A crude oil gathering system and a natural gas gathering system are already in place and functioning. We have sufficient gathering systems and pipeline takeaway capacity to continue ongoing and planned operations into 2018. As we continue to drill and develop our Delaware Basin assets, we expect that additional tank battery, water disposal and intra-field gathering lines will be required. We have agreements in place with third-party natural gas and crude oil purchasers and processors to benefit from existing downstream infrastructure. We expect to continue to evaluate the marketplace to obtain additional transportation and gathering options and capacity in the form of new pipeline tie-ins. We and Gateway, an affiliate of Tema, entered into crude oil gathering and natural gas gathering agreements for a ten-year term. Please read the section entitled “Management’s Discussion and Analysis of Financial Condition and Results of Operations-Related Party Transactions” for further detail.
Oil and Natural Gas Data
Estimation and Review of Proved Reserves
Proved reserve estimates as of December 31, 2017 and 2016 were prepared by Ryder Scott, L.P. (“Ryder Scott”), our independent petroleum engineer. Proved reserve estimates as of December 31, 2015 were prepared internally by management. The technical persons responsible for preparing our proved reserve estimates meet the requirements with regard to qualifications, independence, objectivity and confidentiality set forth in the Standards Pertaining to the Estimating and Auditing of Oil and Gas Reserves Information promulgated by the Society of Petroleum Engineers. Ryder Scott does not own an interest in any of our properties, nor is it employed by us on a contingent basis. Copies of our independent petroleum engineer’s proved reserve reports as of December 31, 2017 and 2016 are attached as exhibits to this prospectus.
We maintain an internal staff of petroleum engineers and geoscience professionals to work closely with our independent petroleum engineers to ensure the integrity, accuracy and timeliness of the data used to calculate the proved reserves relating to our assets. Our internal technical team members meet with our independent petroleum engineer periodically during the period covered by the proved reserve report to discuss the assumptions and methods used in the proved reserve estimation process. We provide historical information to Ryder Scott for our properties, such as ownership interest, oil and natural gas production, well test data, commodity prices, subsurface geologic data and operating and development costs. Our Vice President of Engineering, is primarily responsible for overseeing the preparations of all of our reserve estimates and is a petroleum engineer with 28 years of petroleum engineering experience, including experience with both offshore conventional and onshore unconventional field developments. The preparation of our proved reserve estimates was completed in accordance with our internal control procedures. These procedures, which are intended to ensure reliability of reserve estimations, include the following:
| • | review and verification of producing formations, well targets and the development plan by our Vice President of Geology and Vice President of Engineering; |
| • | review and verification of historical production data, which data is based on actual production as reported by us; |
| • | review of well by well reserve estimates by independent reserve engineers; |
| • | review by our Vice President of Engineering of all of our reported proved reserves, including the review of all significant reserve changes and all new PUD additions; |
| • | direct reporting responsibilities by our Vice President of Engineering to our Chief Executive Officer; and |
| • | verification of property ownership interests by our land department. |
99
Table of Contents
Index to Financial Statements
Under the rules promulgated by the SEC, proved reserves are those quantities of oil and natural gas which, by analysis of geoscience and engineering data, can be estimated with reasonable certainty to be economically producible from a given date forward from known reservoirs and under existing economic conditions, operating methods and government regulations, prior to the time at which contracts providing the right to operate expire (unless evidence indicates that renewal is reasonably certain, regardless of whether deterministic or probabilistic methods are used for the estimation). If deterministic methods are used, the SEC has defined reasonable certainty for proved reserves as a “high degree of confidence that the quantities will be recovered.” All of our proved reserves as of December 31, 2017, 2016 and 2015 were estimated using a deterministic method. The estimation of reserves involves two distinct determinations. The first determination results in the estimation of the quantities of recoverable oil and natural gas and the second determination results in the estimation of the uncertainty associated with those estimated quantities in accordance with the definitions established under SEC rules. The process of estimating the quantities of recoverable oil and natural gas reserves relies on the use of certain generally accepted analytical procedures. These analytical procedures fall into four broad categories or methods: (i) production performance-based methods; (ii) material balance-based methods; (iii) volumetric-based methods; and (iv) analogy. These methods may be used singularly or in combination by the reserve evaluator in the process of estimating the quantities of reserves. Reserves for PDP wells were estimated using production performance methods for the vast majority of properties. Certain new producing properties with very little production history were forecast using a combination of production performance and analogy to similar production, both of which are considered to provide a reasonably high degree of accuracy. Non-producing reserve estimates for developed and undeveloped properties were forecasted using analogy methods. This method provides a reasonably high degree of accuracy for predicting proved developed non-producing and PUD locations for our properties, due to the abundance of analog data.
To estimate economically recoverable proved reserves and related future net cash flows, Ryder Scott and management considered with respect to the carve-out figures many factors and assumptions, including the use of reservoir parameters derived from geological and engineering data, which cannot be measured directly, economic criteria based on current costs, SEC pricing requirements, and forecasts of future production rates. Under SEC rules, reasonable certainty can be established using techniques that have been proven effective by actual production from projects in the same reservoir or an analogous reservoir or by other evidence using reliable technology that establishes reasonable certainty. Reliable technology is a grouping of one or more technologies (including computational methods) that have been field tested and have been demonstrated to provide reasonably certain results with consistency and repeatability in the formation being evaluated or in an analogous formation. To establish reasonable certainty with respect to our estimated proved reserves, the technologies and economic data used in the estimation of our proved reserves have been demonstrated to yield results with consistency and repeatability and include production and well test data, downhole completion information, geologic data, electrical logs, radioactivity logs, core analyses, available seismic data, historical well costs and operating expense data.
Summary of Oil, Natural Gas and NGL Reserves
At December 31, 2017, our estimated proved oil and natural gas reserves were 31,132 MBoe based on an internal reserve report audited by Ryder Scott Company, L.P. (“Ryder Scott”), our independent reserve engineers, in accordance with the rules and regulations of the SEC. Based on this report, at December 31, 2017, our proved reserves were approximately 59% oil, 21% natural gas, 20% NGLs and 43% proved developed. The calculated percentages include proved developed non-producing reserves.
100
Table of Contents
Index to Financial Statements
The following table presents our estimated net proved oil, natural gas and natural gas liquids reserves as of the fiscal years indicated:
| As of December 31, | ||||||||||||
| 2017(1) | 2016(2) | 2015(3) | ||||||||||
| Proved developed reserves: |
||||||||||||
| Oil (MBbls) |
8,814 | 3,068 | 2,698 | |||||||||
| Natural gas (MMcf) |
14,171 | 10,574 | 10,116 | |||||||||
| NGL (MBbls) |
2,286 | 1,802 | 1,481 | |||||||||
|
|
|
|
|
|
|
|||||||
| Total (MBoe) |
13,462 | 6,632 | 5,865 | |||||||||
| Proved undeveloped reserves: |
||||||||||||
| Oil (MBbls) |
9,622 | 4,288 | 2,954 | |||||||||
| Natural gas (MMcf) |
25,145 | 6,781 | 3,783 | |||||||||
| NGL (MBbls) |
3,857 | 1,183 | 513 | |||||||||
|
|
|
|
|
|
|
|||||||
| Total (MBoe) |
17,670 | 6,601 | 4,098 | |||||||||
| Total proved reserves: |
||||||||||||
| Oil (MBbls) |
18,436 | 7,356 | 5,652 | |||||||||
| Natural gas (MMcf) |
39,316 | 17,355 | 13,899 | |||||||||
| NGL (MBbls) |
6,143 | 2,985 | 1,994 | |||||||||
|
|
|
|
|
|
|
|||||||
| Total (MBoe) |
31,132 | 13,234 | 9,963 | |||||||||
| Oil and Natural Gas Prices: |
||||||||||||
| Oil (per Bbl) |
$ | 51.34 | 42.75 | 50.28 | ||||||||
| Natural gas (per Bbl) |
$ | 2.98 | 2.49 | 2.58 | ||||||||
| NGL (per MMBtu) |
$ | 31.82 | 11.73 | 13.83 | ||||||||
| (1) | Our estimated net proved reserves were determined using average first-day-of-the-month prices for the prior twelve months in accordance with SEC guidance. For oil, the average West Texas Intermediate posted price of $51.34 per barrel as of December 31, 2017 was adjusted for quality, transportation fees, and a regional price differential. For natural gas volumes, the average Henry Hub spot price of $2.98 per MMBtu as of December 31, 2017 was adjusted for energy content and a regional price differential. For December 31, 2017, NGLs were priced off of Mont Belvieu pricing, as adjusted, and not as a percentage of West Texas Intermediate. All prices are held constant throughout the producing life of the properties. |
| (2) | Our estimated net proved reserves were determined using average first-day-of-the-month prices for the prior twelve months in accordance with SEC guidance. For oil, the average West Texas Intermediate posted price of $42.75 per barrel as of December 31, 2016 was adjusted for quality, transportation fees, and a regional price differential. For natural gas volumes, the average Henry Hub spot price of $2.49 per MMBtu as of December 31, 2016 was adjusted for energy content and a regional price differential. For NGL volumes, 27.5% of the average West Texas Intermediate posted price of $42.75 per barrel, or $11.73, as of December 31, 2016 was adjusted for quality, transportation fees and a regional price differential. All prices are held constant throughout the producing life of the properties. |
| (3) | Our estimated net proved reserves were determined using average first-day-of-the-month prices for the prior twelve months in accordance with SEC guidance. For oil, the average West Texas Intermediate posted price of $50.28 per barrel as of December 31, 2015 was adjusted for quality, transportation fees and a regional price differential. For natural gas volumes, the average Henry Hub spot price of $2.58 per MMBtu as of December 31, 2015 was adjusted for energy content and a regional price differential. For NGL volumes, 27.5% of the average West Texas Intermediate posted price of $50.28 per barrel, or $13.83, as of December 31, 2015 was adjusted for quality, transportation fees and a regional price differential. All prices are held constant throughout the producing life of the properties. |
101
Table of Contents
Index to Financial Statements
The following table sets forth our estimated proved oil, natural gas and natural gas liquids proved reserves by area at December 31, 2017.
| Oil (MBbls) |
Natural Gas (MMcf) |
NGL (MBbls) |
Total (Mboe) |
|||||||||||||
| Core Operating Areas: |
||||||||||||||||
| Northern Delaware Basin |
18,436 | 39,316 | 6,143 | 31,132 | ||||||||||||
| Southern Delaware Basin |
— | — | — | — | ||||||||||||
| Other |
— | — | — | — | ||||||||||||
|
|
|
|
|
|
|
|
|
|||||||||
| Total |
18,436 | 39,316 | 6,143 | 31,132 | ||||||||||||
|
|
|
|
|
|
|
|
|
|||||||||
The following table sets forth the changes in our proved reserve volumes by area during the year ended December 31, 2017 (in MBoe).
| Production | Extensions and Discoveries(1) |
Purchases of Minerals-in- Place(2) |
Sales of Minerals-in- Place(3) |
Revisions of Previous Estimates (4) |
||||||||||||||||
| Core Operating Areas: |
||||||||||||||||||||
| Northern Delaware Basin |
||||||||||||||||||||
| Southern Delaware Basin |
||||||||||||||||||||
| Other |
||||||||||||||||||||
|
|
|
|
|
|
|
|
|
|
|
|||||||||||
| Total |
||||||||||||||||||||
|
|
|
|
|
|
|
|
|
|
|
|||||||||||
| (1) | Extensions and discoveries of approximately MBoe are primarily the result of our continued success from our extension and infill horizontal drilling programs in our core operating areas. Proved developed reserves increased approximately MBoe due to our exploratory drilling activity in 2017. Based upon this activity, approximately MMBoe of new proved undeveloped locations were added, of which the majority are one offset location from an existing producing well. |
| (2) | Our purchases of minerals-in-place are composed of approximately MBoe from mineral interest acquisitions in Z&T 20 wells around May 2017. |
| (3) | Our sales of minerals-in-place are composed of approximately MBoe from the Barnett divestiture in the Newark Field in WISE County, Texas. |
| (4) | Revisions of previous estimates are composed of (i) MMBoe of positive revisions due to adjustments made to type curves based on more current information of the wells and (ii) MBoe of positive price revisions. Our proved reserves at December 31, 2017 were determined using the SEC prices of $51.34 per Bbl of oil for WTI and $2.98 per MMBtu of natural gas for Henry Hub spot, compared to corresponding prices of $42.75 per Bbl of oil and $2.49 per MMBtu of natural gas at December 31, 2016. |
The changes from December 31, 2016 estimated proved reserves to December 31, 2017 estimated proved reserves reflect the addition of MBoe of proved reserves through discoveries and extensions, as well as net positive revisions of MBoe primarily due to the increase in commodity prices, offset by production of MBoe throughout the year.
The changes from December 31, 2015 estimated proved reserves to December 31, 2016 estimated proved reserves reflect the addition of 5,479 MBoe of proved reserves through discoveries and extensions, offset by net negative revisions of 841 MBoe primarily due to the decline in commodity prices and production of 1,367 MBoe throughout the year.
Reserve engineering is and must be recognized as a subjective process of estimating volumes of economically recoverable oil and natural gas that cannot be measured in an exact manner. The accuracy of any
102
Table of Contents
Index to Financial Statements
reserve estimate is a function of the quality of available data and of engineering and geological interpretation. As a result, the estimates of different engineers often vary. In addition, the results of drilling, testing and production may justify revisions of such estimates. Accordingly, reserve estimates often differ from the quantities of oil and natural gas that are ultimately recovered. Estimates of economically recoverable oil and natural gas and of future net revenues are based on a number of variables and assumptions, all of which may vary from actual results, including geologic interpretation, prices and future production rates and costs. Please read “Risk Factors.”
Additional information regarding our proved reserves can be found in the notes to our consolidated financial statements included elsewhere in this prospectus and the proved reserve report as of December 31, 2017, which is included as an exhibit to this prospectus.
Proved Undeveloped Reserves
As of December 31, 2017, our proved undeveloped reserves totaled 9,622 MBbls of oil, 25,145 MMcf of natural gas and 3,857 MBbls of natural gas liquids, for a total of 17,760 MBoe. PUDs will be converted from undeveloped to developed as the applicable wells begin production.
The following table summarizes the changes in PUD reserves for the year ended December 31, 2017 in MBoe:
| December 31, 2014 |
6,068 | |||
| Extensions, discoveries and other additions |
3,456 | |||
| Performance and price revisions |
(5,426 | ) | ||
| Acquisition of reserves |
— | |||
| Disposition of reserves |
— | |||
| Transfers to proved developed |
— | |||
|
|
|
|||
| December 31, 2015(1) |
4,098 | |||
| Extensions, discoveries and other additions |
4,283 | |||
| Performance and price revisions |
(1,780 | ) | ||
| Acquisition of reserves |
— | |||
| Disposition of reserves |
— | |||
| Transfers to proved developed |
— | |||
|
|
|
|||
| December 31, 2016(2) |
6,601 | |||
| Extensions, discoveries and other additions |
||||
| Performance and price revisions |
||||
| Acquisition of reserves |
||||
| Disposition of reserves |
||||
| Transfers to proved developed |
||||
|
|
|
|||
| December 31, 2017(3) |
| (1) | As of December 31, 2015, our PUDs totaled 2,954 MBbls of oil, 3,783 MMcf of natural gas and 513 MNbls of NGLs for a total of 4,098 MBoe. |
| (2) | As of December 31, 2016, our PUDs totaled 4,288 MBbls of oil, 6,781 MMcf of natural gas and 1,183 MBbls of NGLs for a total of 6,601 MBoe. |
| (3) | As of December 31, 2017, our PUDs totaled MBbls of oil, MMcf of natural gas and MBbls of NGLs for a total of MBoe. |
At the time of initial booking, our PUDs were a part of an approved plan to develop those reserves. However, after a development plan has been adopted, we periodically make adjustments to the approved development plan due to events or circumstances that have occurred subsequent to the time the plan was approved. Primarily as a result of factors outside our control, including a downturn in commodity prices, we
103
Table of Contents
Index to Financial Statements
adjusted our development plan to temporarily defer the drilling of certain PUD locations. As a result, no PUDs were converted from undeveloped to developed during 2015 and 2016. However, we continue to believe with reasonable certainty that these PUDs will be developed within five years of their initial booking.
As of December 31, 2017, we had 31 PUD locations booked. Of these 31 PUD locations, two locations were originally booked at December 31, 2014, seven locations were originally booked at December 31, 2015 and three locations were originally booked at December 31, 2016. Our development plan resulted in four PUDs drilled in 2017. Plans for 2018 include drilling 11 PUD targets. We believe that our progress to date in 2017 demonstrates our ability to execute on our development plan. Our development plan sets forth the remaining PUD locations to be brought to proved producing status within five years of initial booking.
As of December 31, 2017, we estimated that the cost to bring these wells to a status of economic productivity would be approximately $7.1 million per location to execute our development program. Based on costs incurred in connection with the drilling of two wells associated with PUD locations in 2017, we believe these cost estimates remain accurate. Our ability to fund our development plan is supported by the cash flow generated by its producing properties. In addition, as we convert reserves from undeveloped status to producing status, the borrowing base under our reserve-based revolving credit facility will increase, providing additional liquidity with which to finance further development. We expect to be able to fund our development going forward through cash flows from operations, borrowings under our revolving credit facility, and our ability to access the capital markets.
104
Table of Contents
Index to Financial Statements
Oil and Natural Gas Production Prices and Production Costs
Production and Price History
The following table sets forth information regarding our net production of oil, natural gas and NGLs, all of which is from the Delaware Basin, and certain price and cost information for each of the periods indicated:
| Nine Months Ended September 30, |
Year Ended December 31, | |||||||||||||||||||
| 2017 | 2016 | 2016 | 2015 | 2014 | ||||||||||||||||
| (unaudited) | ||||||||||||||||||||
| Production data: |
||||||||||||||||||||
| Oil (MBbls) |
794 | 429 | 612 | 472 | 365 | |||||||||||||||
| Natural gas (MMcf) |
2,089 | 1,796 | 2,381 | 2,074 | 1,834 | |||||||||||||||
| NGLs (MBbls) |
312 | 275 | 358 | 312 | 285 | |||||||||||||||
|
|
|
|
|
|
|
|
|
|
|
|||||||||||
| Total (MBoe)(1) |
1,454 | 1,003 | 1,367 | 1,130 | 956 | |||||||||||||||
| Average realized prices before effects of derivative settlements: |
||||||||||||||||||||
| Oil (per Bbl) |
$ | 45.92 | $ | 38.31 | $ | 40.52 | $ | 43.62 | $ | 77.93 | ||||||||||
| Natural gas (per Mcf) |
2.68 | 2.03 | 2.23 | 2.37 | 4.06 | |||||||||||||||
| NGLs (per Bbl) |
17.32 | 11.33 | 12.68 | 12.75 | 26.93 | |||||||||||||||
|
|
|
|
|
|
|
|
|
|
|
|||||||||||
| Total (per Boe) |
$ | 32.64 | $ | 23.13 | $ | 25.35 | $ | 26.09 | $ | 45.58 | ||||||||||
| Total, including effects of derivative settlements (per Boe) |
$ | 32.75 | $ | 23.62 | $ | 22.30 | $ | 29.40 | $ | 48.10 | ||||||||||
| Average costs (per Boe): |
||||||||||||||||||||
| Lease operating expense |
$ | 4.46 | $ | 3.61 | $ | 3.51 | $ | 4.06 | $ | 6.39 | ||||||||||
| Production taxes |
1.50 | 1.05 | 1.13 | 1.16 | 1.95 | |||||||||||||||
| Gathering and transportation |
1.60 | 1.70 | 1.75 | 1.85 | 2.58 | |||||||||||||||
| Depreciation, depletion and amortization and accretion |
17.98 | 16.48 | 18.27 | 20.68 | 16.71 | |||||||||||||||
| Impairment of oil and natural gas properties |
— | — | — | 7.20 | 28.87 | |||||||||||||||
| Exploration costs |
0.83 | 0.49 | 0.58 | 0.85 | 1.00 | |||||||||||||||
| General and administrative expense |
6.01 | 3.47 | 4.51 | 3.75 | 5.39 | |||||||||||||||
| Transaction expense |
1.80 | — | 2.07 | — | — | |||||||||||||||
| Gain on sale of oil and natural gas properties |
— | — | — | — | (0.01 | ) | ||||||||||||||
| (Gain) loss on sale of other assets |
(0.01 | ) | — | (0.04 | ) | 0.02 | (0.03 | ) | ||||||||||||
|
|
|
|
|
|
|
|
|
|
|
|||||||||||
| Total(1) |
$ | 34.17 | $ | 26.80 | $ | 31.78 | $ | 39.57 | $ | 62.85 | ||||||||||
|
|
|
|
|
|
|
|
|
|
|
|||||||||||
| (1) | May not sum due to rounding. |
Productive Wells
The following table sets forth the number of productive oil and natural gas wells on our properties at December 31, 2017. This table does not include wells in which we own a royalty interest only.
| Gross Productive Wells | Net Productive Wells | |||||||||||||||||||||||
| Oil | Gas | Total | Oil | Natural Gas |
Total | |||||||||||||||||||
| December 31, 2017 |
||||||||||||||||||||||||
| Core Operating Areas: |
||||||||||||||||||||||||
| Northern Delaware Basin |
32 | 13 | 45 | 28 | 13 | 41 | ||||||||||||||||||
| Southern Delaware Basin |
9 | 3 | 12 | 6 | 3 | 9 | ||||||||||||||||||
| Other |
— | — | — | — | — | — | ||||||||||||||||||
| Total |
41 | 16 | 57 | 34 | 16 | 50 | ||||||||||||||||||
105
Table of Contents
Index to Financial Statements
As of December 31, 2017, we had an average working interest of 88% in 57 gross (50 net) productive horizontal wells, of which 45 gross (41 net) are in the Northern Delaware Basin acreage area and of which 12 gross (9 net) are in the Southern Delaware Basin acreage area. Productive wells consist of producing wells and wells capable of production, including oil wells awaiting connection to production facilities. Gross wells are the total number of producing wells in which we have an interest and net wells are the sum of our fractional working interests owned in gross wells.
General
We design and manage the development of a well and supervise operation and maintenance activities on a day-to-day basis. Independent contractors engaged by us provide all the equipment and personnel associated with these activities. We employ petroleum engineers, geologists and land professionals who work to improve production rates, increase reserves and lower the cost of operating our oil and natural gas properties.
Marketing and Customers
With respect to core properties we operate in Loving County, Texas, we maintain contracts with Gateway to gather the majority of our production. We deliver crude oil, natural gas, and NGL production to Gateway and Gateway transports and redelivers the oil, natural gas, and NGLs to certain delivery points. We sell all of our natural gas and NGLs under contracts with terms generally greater than twelve months and all of our oil under contracts with terms generally less than twelve months.
On the Weber 26 Lease in Loving County, Texas, we sell our crude oil to Rio Energy International with an initial three-month contract, month-to-month thereafter, and our natural gas to Outrigger Delaware Operating LLC, a midstream gas gathering and transportation company, with a five-year gas purchase contract. Gateway does not provide gathering services on the Weber 26 Lease.
With respect to the properties we operate in Wise County, Texas, we sell our crude oil production to Targa Midstream Services and sells our natural gas to Enlink Midstream Services. Gateway does not provide gathering services with respect to the Barnett Shale properties.
We sell our production to a relatively small number of customers, as is customary in the industry. For the year ended December 31, 2016, Gateway, ETC Field Services, LLC and Enlink Midstream Services, LLC accounted for 70%, 17% and 10%, respectively, of total revenues related to us. For the year ended December 31, 2015, Gateway, Sunoco Inc., Enlink Midstream Services, LLC and Regency Energy Partners LP accounted for 54%, 13%, 11% and 11%, respectively, of total revenues related to us. For the year ended December 31, 2014, Enterprise Crude Pipeline, LLC, Sunoco Inc., Devon Gas Services, LP, and Regency Energy Partners LP accounted for 33%, 32%, 18% and 11%, respectively, of total revenues related to us. The loss of any one or all of our significant customers as a purchaser could materially and adversely affect our revenues in the short-term. However, based on the current demand for oil and natural gas and the availability of other purchasers, we believe that the loss of any of our significant customers as a purchaser would not have a material adverse effect on our financial condition and results of operations because crude oil and natural gas are fungible products with well-established markets and numerous purchasers.
Transportation
Production from our core properties in Loving County, Texas is delivered to our production facilities and then transported through Gateway’s Raven Pipeline to the interconnection between Raven Pipeline and Plains Pipeline. In connection with the Transaction, we and Gateway entered into a Crude Oil Gathering Agreement for a period of ten years.
Our natural gas production is delivered to our production facilities and then transported through Gateway’s LCGS to the interconnection between LCGS Pipeline and ETC Field Services Pipeline. The gas is sold by us to
106
Table of Contents
Index to Financial Statements
ETC Field Services at the interconnection between LCGS pipeline and ETC Field Services. Gateway provides transportation on the LCGS pipeline. ETC Field services transports the gas to their processing facility. We do not control Gateway’s or any other third party’s transportation facilities. In connection with the Transaction, we and Gateway have entered into a Gas Gathering Agreement for a period of ten years.
During the further development of our properties, we expect to consider all gathering and delivery infrastructure options in the areas of our production. However, Gateway will have a right of first refusal to build gathering and delivery infrastructure for our properties in Loving County, Texas.
For descriptions of the Crude Oil Gathering Agreement and Gas Gathering Agreement, please read the section entitled “Management’s Discussion and Analysis of Financial Condition and Results of Operations-Related Party Transactions”.
Further, oil and natural gas compete with other forms of energy available to customers, primarily based on price.
Competition
The oil and natural gas industry is intensely competitive and we compete with other companies that have greater resources. Many of these companies not only explore for and produce oil and natural gas, but also carry on midstream and refining operations and market petroleum and other products on a regional, national or worldwide basis. These companies may be able to pay more for productive oil and natural gas properties and exploratory prospects or to define, evaluate, bid for and purchase a greater number of properties and prospects than our financial or human resources permit. In addition, these companies may have a greater ability to continue exploration activities during periods of low oil and natural gas market prices. Our larger or more integrated competitors may be able to absorb the burden of existing, and any changes to, federal, state and local laws and regulations more easily than we can, which would adversely affect our competitive position. Our ability to acquire additional properties and to discover reserves in the future will be dependent upon our ability to evaluate and select suitable properties and to consummate transactions in a highly competitive environment. In addition, because we have fewer financial and human resources than many companies in our industry, we may be at a disadvantage in bidding for exploratory prospects and producing oil and natural gas properties.
There is also competition between oil and natural gas producers and other industries producing energy and fuel, primarily based on price. Changes in the availability or price of oil and natural gas or other forms of energy, as well as business conditions, conservation, and the ability to convert to alternate fuels and other forms of energy may affect the demand for oil and natural gas. Furthermore, competitive conditions may be substantially affected by various forms of energy legislation and/or regulation considered from time to time by the governments of the United States and the jurisdictions in which we operate. It is not possible to predict the nature of any such legislation or regulation, which may ultimately be adopted or its effects upon our future operations. Such laws and regulations may substantially increase the costs of developing oil and natural gas and may prevent or delay the commencement or continuation of a given operation. Our larger competitors may be able to absorb the burden of existing and future federal, state, and local laws and regulations more easily than we can, which would adversely affect our competitive position.
Title to Properties
We believe that we have satisfactory title to our producing properties in accordance with generally accepted industry standards. As is customary in the oil and natural gas industry, we initially conduct only a cursory review of the title to our properties for an acquisition of leasehold acreage. We perform a thorough title examination and curative work with respect to significant defects prior to either an acquisition of producing properties or prior to commencement of drilling operations on those properties. To the extent title opinions or other investigations reflect title defects on those properties, we are typically responsible for curing any title defects at our expense.
107
Table of Contents
Index to Financial Statements
We generally will not commence drilling operations on a property until we have cured any material title defects on such property. We have obtained title opinions on substantially all of our producing properties and believe that we have satisfactory title to our producing properties in accordance with standards generally accepted in the oil and natural gas industry.
Prior to completing an acquisition of producing oil and natural gas leases, we perform title reviews on the most significant leases and, depending on the materiality of properties, we may obtain a title opinion, obtain an updated title review or opinion or review previously obtained title opinions. Our oil and natural gas properties are subject to customary royalty and other interests, liens for current taxes and other burdens, which we believe do not materially interfere with the use of or affect our carrying value of the properties.
We believe that we have satisfactory title to all our material assets. Although title to these properties is in some cases subject to encumbrances, such as customary interests generally retained in connection with the acquisition of real property, customary royalty interests and contract terms and restrictions, liens under operating agreements, liens related to environmental liabilities associated with historical operations, liens for current taxes and other burdens, easements, restrictions and minor encumbrances customary in the oil and natural gas industry, we believe that none of these liens, restrictions, easements, burdens and encumbrances will materially detract from the value of these properties or from our interest in these properties or materially interfere with our use of these properties in the operation of our business. In addition, we believe that we have obtained sufficient rights-of-way grants and permits from public authorities and private parties for us to operate our business in all material respects.
Oil and Natural Gas Leases
The typical oil and natural gas lease agreement covering our properties provides for the payment of royalties to the mineral owner for all oil, NGL and natural gas produced from any wells drilled on the leased premises. The lessor royalties and other leasehold burdens on our properties generally range from 12.5% to 25%, resulting in a net revenue interest to us generally ranging from 75% to 87.5%. As of December 31, 2017, 54% of our net leasehold acreage was held by production.
Seasonality of Business
Demand for oil and natural gas generally decreases during the spring and fall months and increases during the summer and winter months. However, seasonal anomalies such as mild winters or mild summers sometimes lessen this fluctuation. Weather conditions affect the demand for and prices of, oil and natural gas. Due to these seasonal fluctuations, results of operations for individual quarterly periods may not be indicative of the results that may be realized on an annual basis.
Operational Hazards and Insurance
The oil and natural gas industry involves a variety of operating risks, including the risk of fire, explosions, blow outs, pipe failures and, in some cases, abnormally high-pressure formations which could lead to environmental hazards such as oil spills, natural gas leaks and the discharge of toxic gases. If any of these should occur, we could incur legal defense costs and could be required to pay amounts due to injury, loss of life, damage or destruction to property, natural resources and equipment, pollution or environmental damage, regulatory investigation and penalties and suspension of operations.
In accordance with what we believe to be industry practice, we maintain insurance against some, but not all, of the operating risks to which our business is exposed. We currently have insurance policies for onshore property (oil lease property/production equipment) for selected locations, rig physical damage protection, control of well protection for selected wells, comprehensive general liability, commercial automobile, workers compensation, pollution liability (claims made coverage with a policy retroactive date), excess umbrella liability and other coverage.
108
Table of Contents
Index to Financial Statements
Our insurance is subject to exclusion and limitations, and there is no assurance that such coverage will fully or adequately protect us against liability from all potential consequences, damages and losses. Any of these operational hazards could cause a significant disruption to our business. A loss not fully covered by insurance could have a material adverse effect on our financial position, results of operations and cash flows. See “Risk Factors-Risks Related to the Oil and Natural Gas Industry and Our Business-Operating hazards and uninsured risks may result in substantial losses and could prevent us from realizing profits.”
We reevaluate the purchase of insurance, policy terms and limits annually. Future insurance coverage for our industry could increase in cost and may include higher deductibles or retentions. In addition, some forms of insurance may become unavailable in the future or unavailable on terms that we believe are economically acceptable. No assurance can be given that we will be able to maintain insurance in the future at rates that we consider reasonable and we may elect to maintain minimal or no insurance coverage. We may not be able to secure additional insurance or bonding that might be required by new governmental regulations. This may cause us to restrict our operations, which might severely impact our financial position. The occurrence of a significant event, not fully insured against, could have a material adverse effect on our financial condition and results of operations.
Generally, we also require our third-party vendors to sign master service agreements in which they agree to indemnify us for injuries and deaths of the service provider’s employees as well as contractors and subcontractors hired by the service provider.
Regulation of the Oil and Natural Gas Industry
Our operations are substantially affected by federal, state and local laws and regulations. Failure to comply with these laws and regulations can result in substantial penalties. The regulatory burden on the industry increases the cost of doing business and affects profitability. We do not believe that compliance with existing requirements will have a material adverse effect on our financial position, cash flows or results of operations, such laws and regulations are frequently amended or reinterpreted. Therefore, we are unable to predict the future costs or impact of compliance. Additional proposals and proceedings that affect the oil and natural gas industry are regularly considered by the United States Congress (“Congress”), the states, the Federal Energy Regulatory Commission (the “FERC”) and the courts. We cannot predict when or whether any such proposals may become effective. We do not believe that we would be affected by any such action materially differently than similarly situated competitors.
Regulation of Oil and Natural Gas Production
The production of oil and natural gas is subject to regulation under a wide range of local, state and federal statutes, rules, orders and regulations. Federal, state and local statutes and regulations require permits for drilling operations, drilling bonds and reports concerning operations. We own property interests in jurisdictions that regulate drilling and operating activities by requiring, among other things, permits for the drilling of wells, maintaining bonding requirements to drill or operate wells, and regulating the location of wells, the method of drilling and casing wells, the source and disposal of water used in the drilling and completion process, the surface use and restoration of properties upon which wells are drilled and the plugging and abandonment of wells. Our operations are also subject to various conservation laws and regulations, including the size of drilling and spacing units or proration units, the number of wells which may be drilled in an area and the unitization or pooling of crude oil or natural gas wells, as well as regulations that limit or prohibit the venting or flaring of natural gas and impose certain requirements regarding the ratability or fair apportionment of production from fields and individual wells. These laws also govern various conservation matters, including provisions for the unitization or pooling of oil and natural gas properties, the establishment of maximum allowable rates of production from oil and natural gas wells, the regulation of well spacing or density, and plugging and abandonment of wells. The effect of these regulations may limit the amount of oil and natural gas that we can produce from our wells and limit the number of wells or the locations at which we can drill, although we can apply for exceptions to such
109
Table of Contents
Index to Financial Statements
regulations or to have reductions in well spacing or density. Moreover, these jurisdictions impose a production or severance tax with respect to the production and sale of oil, NGLs and natural gas within its jurisdiction. The failure to comply with these rules and regulations can result in substantial penalties. Our competitors in the oil and natural gas industry are subject to the same regulatory requirements and restrictions that affect our operations.
Regulation of Oil Sales and Transportation
Sales of oil, condensate and NGLs are not currently regulated and are made at negotiated prices. Nevertheless, Congress could reenact price controls in the future. Our sales of oil are affected by the availability, terms and cost of transportation. The transportation of oil in common carrier pipelines is also subject to rate and access regulation. FERC regulates interstate oil pipeline transportation rates under the Interstate Commerce Act. In general, interstate oil pipeline rates must be cost-based, although settlement rates agreed to by all shippers are permitted and market based rates may be permitted in certain circumstances. Intrastate oil pipeline transportation rates are subject to regulation by state regulatory commissions. The basis for intrastate oil pipeline regulation, and the degree of regulatory oversight and scrutiny given to intrastate oil pipeline rates, varies from state to state. Insofar as effective interstate and intrastate rates and regulations regarding access are equally applicable to all comparable shippers, we believe that the regulation of oil transportation will not affect our operations in any way that is of material difference from those of our competitors who are similarly situated. In December 2015, H.R. 2029 was signed into law which lifted a ban on the export of crude oil from the United States. This will enable U.S. oil producers the flexibility to seek new markets and export oil into the global marketplace.
Regulation of Natural Gas Sales and Transportation
Historically, the transportation and sale for resale of natural gas in interstate commerce have been regulated by agencies of the U.S. federal government, primarily FERC. In the past, the federal government has regulated the prices at which natural gas could be sold. While sales by producers of natural gas can currently be made at uncontrolled market prices, Congress could reenact price controls in the future.
The transportation and sale for resale of natural gas in interstate commerce is regulated primarily under the NGA and by regulations and orders promulgated under the NGA by FERC. In certain limited circumstances, intrastate transportation and wholesale sales of natural gas may also be affected directly or indirectly by laws enacted by Congress and by FERC regulations.
The EP Act of 2005 amended the NGA to add an anti-market manipulation provision that makes it unlawful for any entity to engage: (i) in connection with the purchase or sale of natural gas subject to the jurisdiction of FERC, or the purchase or sale of transportation services subject to the jurisdiction of FERC, directly or indirectly, use, or employ any device, scheme, or artifice to defraud; (ii) make any untrue statement of material fact or omit to make any such statement necessary to make the statements made not misleading; or (iii) engage in any act or practice that operates as a fraud or deceit upon any person. The anti-market manipulation rule does not apply to activities that relate only to intrastate or other non-jurisdictional sales or gathering, but does apply to activities of gas pipelines and storage companies that provide interstate services, as well as otherwise non-jurisdictional entities to the extent the activities are conducted “in connection with” gas sales, purchases or transportation subject to FERC jurisdiction, which now includes the annual reporting requirements described below.
The EP Act of 2005 also provides FERC with the power to assess civil penalties of up to $1,238,271per day per violation of the NGA and the NGPA. The civil penalty provisions are applicable to entities that engage in the sale of natural gas for resale in interstate commerce. Under FERC’s regulations, wholesale buyers and sellers of more than 2.2 million MMBtus of physical natural gas in the previous calendar year, including natural gas producers, gatherers and marketers, are now required to report, on May 1 of each year, aggregate volumes of natural gas purchased or sold at wholesale in the prior calendar year to the extent such transactions utilize,
110
Table of Contents
Index to Financial Statements
contribute to or may contribute to the formation of price indices, and whether they report prices to any index publishers, and if so, whether their reporting complies with FERC’s policy statement on price reporting.
Gathering service, which occurs upstream of jurisdictional transmission services, is regulated by the states onshore and in state waters. Section 1(b) of the NGA exempts companies providing natural gas gathering servoces from regulation by FERC as a natural gas company under the NGA. Although FERC has set forth a general test for determining whether facilities perform a non-jurisdictional gathering function or a jurisdictional transmission function, FERC’s determinations is made on a case-by-case basis. We believe that the third-party natural gas pipelines on which our gas is gathered meet the traditional tests FERC has used to establish a pipeline’s status as a gatherer not subject to regulation as a natural gas company. However, the distinction between FERC-regulated transmission services and federally unregulated gathering services is the subject of ongoing litigation, so the classification and regulation of those gathering facilities are subject to change based on future determinations by FERC, the courts or Congress. State regulation of natural gas gathering facilities generally includes various occupational safety, environmental and, in some circumstances, nondiscriminatory-take requirements. Although such regulation has not generally been affirmatively applied by state agencies, natural gas gathering may receive greater regulatory scrutiny in the future.
For physical sales of these energy commodities, we are required to observe anti-market manipulation laws and related regulations enforced by FERC under the EP Act of 2005 and under the Commodity Exchange Act (“CEA”) and regulations promulgated thereunder by the U.S. Commodity Futures Trading Commission. The CEA prohibits any person from manipulating or attempting to manipulate the price of any commodity in interstate commerce or futures or derivative contracts on such commodity. The CEA also prohibits knowingly delivering or causing to be delivered false or misleading or knowingly inaccurate reports concerning market information or conditions that affect or tend to affect the price of a commodity, as well as any manipulative or deceptive device or contrivance in connection with any contract of sale of any commodity in interstate commerce or futures or derivative contract on such commodity. Should we violate the anti-market manipulation laws and regulations, they could also be subject to related third-party damage claims by, among others, sellers, royalty owners and taxing authorities.
Intrastate natural gas transportation is also subject to regulation by state regulatory agencies. The basis for intrastate regulation of natural gas transportation and the degree of regulatory oversight and scrutiny given to intrastate natural gas pipeline rates and services varies from state to state. Insofar as such regulation within a particular state will generally affect all intrastate natural gas shippers within the state on a comparable basis, we believe that the regulation of similarly situated intrastate natural gas transportation in any states in which we operate and ships our natural gas on an intrastate basis will not affect our operations in any way that is of material difference from those of our competitors. Like the regulation of interstate transportation rates, the regulation of intrastate transportation rates affects the marketing of natural gas that we produce, as well as the revenue we receive for sales of its our natural gas.
Changes in law and to FERC or state policies and regulations may adversely affect the availability and reliability of firm and/or interruptible transportation service on interstate and intrastate pipelines, and we cannot predict what future action FERC or state regulatory bodies will take. We do not believe, however, that any regulatory changes will affect it in a way that materially differs from the way they will affect other natural gas producers and marketers with which we compete.
Regulation of Environmental and Occupational Safety and Health Matters
Our oil and natural gas exploration, development and production operations are subject to stringent federal, regional, state and local laws and regulations governing the discharge of materials into the environment or otherwise relating to environmental protection. Numerous federal, state and local governmental agencies, such as the EPA, issue regulations that often require difficult and costly compliance measures that carry substantial administrative, civil and criminal penalties and may result in injunctive obligations for non-compliance. These
111
Table of Contents
Index to Financial Statements
laws and regulations may require the acquisition of a permit before drilling commences, restrict the types, quantities and concentrations of various substances that can be released into the environment in connection with drilling and production activities, limit or prohibit construction or drilling activities on certain lands lying within wilderness, wetlands, ecologically or seismically sensitive areas, and other protected areas, require action to prevent or remediate pollution from current or former operations, such as plugging abandoned wells or closing pits, result in the suspension or revocation of necessary permits, licenses and authorizations, require that additional pollution controls be installed and impose substantial liabilities for pollution resulting from our operations or related to our owned or operated facilities. Liability under such laws and regulations is often strict (i.e., no showing of “fault” is required) and can be joint and several. Moreover, it is not uncommon for neighboring landowners and other third parties to file claims for personal injury and property damage allegedly caused by the release of hazardous substances, hydrocarbons or other waste products into the environment. Changes in environmental laws and regulations occur frequently, and any changes that result in more stringent and costly pollution control or waste handling, storage, transport, disposal or cleanup requirements could materially adversely affect our operations and financial position, as well as the oil and natural gas industry in general. We have not experienced any material adverse effect from compliance with these environmental requirements. This trend, however, may not continue in the future.
Regulation of Hazardous Substances and Waste Handling
The Comprehensive Environmental Response, Compensation, and Liability Act (“CERCLA”), also known as the “Superfund” law, and comparable state laws impose liability, without regard to fault or the legality of the original conduct, on certain classes of persons that are considered to have contributed to the release of a “hazardous substance” into the environment. These persons include the current and past owner or operator of the disposal site or the site where the release occurred and companies that disposed or arranged for the disposal of the hazardous substances at the site where the release occurred. Under CERCLA, such persons may be subject to joint and several strict liability for the costs of cleaning up the hazardous substances that have been released into the environment and for damages to natural resources. Although petroleum substances such as crude oil and natural gas are excluded from the definition of hazardous substances under CERCLA, various substances used in drilling and production operations are not covered by this exclusion and releases of these non-excluded substances or petroleum substances could give rise to liability under CERCLA. In addition, it is not uncommon for neighboring landowners and other third parties to file claims for personal injury and property damage allegedly caused by the hazardous substances or petroleum released into the environment. We are only able to directly control the operation of those wells for which we act as operator. Notwithstanding our lack of direct control over wells operated by others, the liability of an operator other than us for releases may, in certain circumstances, be attributed to us. We generate materials in the course of our operations that may be regulated as hazardous substances, but we are unaware of any liabilities for which we may be held responsible that would materially and adversely affect us.
The Resource Conservation and Recovery Act (“RCRA”) and analogous state laws impose detailed requirements for the generation, handling, storage, treatment and disposal of nonhazardous and hazardous solid wastes. RCRA specifically excludes drilling fluids, produced waters and other wastes associated with the development or production of crude oil, natural gas or geothermal energy from regulation as hazardous wastes. However, in the course of our operations, we may generate some amounts of ordinary industrial wastes, such as paint wastes, waste solvents, laboratory wastes and waste compressor oils that may be regulated as hazardous wastes if such wastes have hazardous characteristics or are listed hazardous wastes. In addition, even wastes excluded from the definition of hazardous waste may be regulated by the EPA or state agencies under, state laws or other federal laws. Moreover, it is possible that those particular oil and natural gas development and production wastes now excluded from the definition of hazardous wastes could be classified as hazardous wastes in the future. For example, from time to time various environmental groups have challenged the EPA’s exclusion of certain oil and gas wastes from regulation under RCRA. In one such challenge, the U.S. District Court for the District of Columbia entered a consent decree requiring EPA to evaluate the exclusion and, by March 2019, to either sign a notice of proposed rulemaking revising the regulations excluding oil and gas wastes or sign a
112
Table of Contents
Index to Financial Statements
determination that revision of the exclusion is not necessary. A loss of the RCRA exclusion for drilling fluids, produced waters and related wastes, if EPA were to eliminate the exclusion, could result in an increase in our costs to manage and dispose of generated wastes, which could have a material adverse effect on our results of operations and financial position. Although the costs of managing hazardous waste may be significant, we do not believe that our costs in this regard are materially more burdensome than those for similarly situated companies.
We currently own, lease, or operate numerous properties that have been used for oil and natural gas development and production activities for many years. Although we believe that we have utilized operating and waste disposal practices that were standard in the industry at the time, hazardous substances, wastes or petroleum hydrocarbons may have been released on, under or from the properties owned or leased by us, or on, under or from other locations, including off-site locations, where such substances have been taken for recycling or disposal. In addition, some of our properties have been operated by third parties or by previous owners or operators whose treatment and disposal of hazardous substances, wastes or petroleum hydrocarbons was not under our control. These properties and the substances disposed or released on, under or from them may be subject to CERCLA, RCRA, and analogous state laws. Under such laws, we could be required to undertake response or corrective measures, which could include removal of previously disposed substances and wastes, cleanup of contaminated property, or performance of remedial plugging or pit closure operations to prevent future contamination.
Regulation of Water Discharges
The Clean Water Act and comparable state laws impose restrictions and strict controls regarding the discharge of pollutants, including produced waters and other oil and natural gas wastes, into or near navigable waters. The discharge of pollutants into regulated waters is prohibited, except in accordance with the terms of a permit issued by the EPA or the state. The discharge of dredge and fill material in regulated waters, including wetlands, is also prohibited, unless authorized by a permit issued by the U.S. Army Corps of Engineers (the “Corps”). In September 2015, the EPA and the Corps issued new rules defining the scope of the EPA’s and the Corps’ jurisdiction under the Clean Water Act with respect to certain types of waterbodies and classifying these waterbodies as regulated wetlands. The 2015 rule was stayed nationwide to determine whether federal district or appellate courts had jurisdiction to hear cases in the matter and, in January 2017, the U.S. Supreme Court agreed to hear the case. The EPA and the Corps issued a proposed rulemaking in June 2017 to repeal the June 2015 rule, and announced their intent to issue a new rule defining the Clean Water Act’s jurisdiction. Recently, in January 2018, the U.S. Supreme Court issued a decision finding that jurisdiction resides with the federal district courts; consequently, while implementation of the 2015 rule currently remains stayed, the previously-filed district court cases will be allowed to proceed. Following the Supreme Court’s decision, the EPA and the Corps issued a final rule in January 2018 staying implementation of the 2015 rule for two years. As a result of these recent developments, future implementation of the June 2015 rule is uncertain. To the extent any revised rule expands the scope of the Clean Water Act’s jurisdiction, we could face increased costs and delays with respect to obtaining permits for dredge and fill activities in wetland areas. Obtaining permits has the potential to delay the development of oil and natural gas projects. These laws and any implementing regulations provide for administrative, civil and criminal penalties for any unauthorized discharges of pollutants in reportable quantities and may impose substantial potential liability for the costs of removal, remediation and damages.
In addition, pursuant to these laws and regulations, we may be required to obtain and maintain approvals or permits for the discharge of wastewater or storm water and are required to develop and implement spill prevention, control and countermeasure plans, also referred to as “SPCC plans,” for on-site storage of significant quantities of oil.
The primary federal law related specifically to oil spill liability is the Oil Pollution Act of 1990 (“OPA”), which amends and augments the oil spill provisions of the Clean Water Act and imposes certain duties and liabilities on certain “responsible parties” related to the prevention of oil spills and damages resulting from such spills in or threatening waters of the United States or adjoining shorelines. For example, operators of certain oil
113
Table of Contents
Index to Financial Statements
and natural gas facilities must develop, implement and maintain facility response plans, conduct annual spill training for certain employees and provide varying degrees of financial assurance. Owners or operators of a facility, vessel or pipeline that is a source of an oil discharge or that poses the substantial threat of discharge is one type of “responsible party” who is liable. The OPA applies joint and several liability, without regard to fault, to each liable party for oil removal costs and a variety of public and private damages. Although defenses exist, they are limited. As such, a violation of the OPA has the potential to adversely affect our operations.
Regulation of Air Emissions
The federal Clean Air Act and comparable state laws restrict the emission of air pollutants from many sources, such as, for example, compressor stations, through air emissions standards, construction and operating permitting programs and the imposition of other compliance requirements. These laws and regulations may require us to obtain pre-approval for the construction or modification of certain projects or facilities expected to produce or significantly increase air emissions, obtain and strictly comply with stringent air permit requirements or utilize specific equipment or technologies to control emissions of certain pollutants. Over the next several years, we may be required to incur certain capital expenditures for air pollution control equipment or other air emissions related issues. For example, in October 2015, the EPA lowered the NAAQS for ozone from 75 to 70 parts per billion. In November 2017, the EPA published a list of areas that are in compliance with the new ozone standards and, separately in December 2017, issued responses to state recommendations for designating non-attainment areas. States have the opportunity to submit new air quality monitoring to EPA prior to EPA finalizing any non-attainment designations. In addition, EPA intends to establish an Ozone Cooperative Compliance Task Force to develop additional flexibility for states to ease compliance with the ozone standards.
In addition, the EPA has adopted new rules under the Clean Air Act that require the reduction of volatile organic compound emissions from certain fractured and refractured natural gas wells for which well completion operations are conducted and further require that most wells use reduced emission completions, also known as “green completions.” These regulations also establish specific new requirements regarding emissions from production-related wet seal and reciprocating compressors, and from pneumatic controllers and storage vessels. More recently, in June 2016, the EPA finalized rules regarding criteria for aggregating multiple small surface sites into a single source for air-quality permitting purposes applicable to the oil and gas industry. This rule could cause small facilities, on an aggregate basis, to be deemed a major source, thereby triggering more stringent air permitting processes and requirements. Compliance with these and other air pollution control and permitting requirements has the potential to delay the development of oil and natural gas projects and increase our costs of development, which costs could be significant. However, we do not believe that compliance with such requirements will have a material adverse effect on our operations.
Regulation of Greenhouse Gas (“GHG”) Emissions
In response to findings that emissions of carbon dioxide, methane, and other GHG present an endangerment to public health and the environment, the EPA has adopted regulations pursuant to the federal Clean Air Act that, among other things, require preconstruction and operating permits for GHG emissions from certain large stationary sources that otherwise require such permits for non-GHG emissions. Facilities required to obtain preconstruction permits for their GHG emissions are also required to meet “best available control technology” standards that are being established by the states or, in some cases, by the EPA on a case-by-case basis. These regulatory requirements could adversely affect our operations and restrict or delay our ability to obtain air permits for new or modified sources. In addition, the EPA has adopted rules requiring the monitoring and reporting of GHG emissions from specified onshore and offshore oil and natural gas production sources in the United States on an annual basis, which include certain of our operations. Furthermore, in June 2016, the EPA finalized rules that establish new controls for emissions of methane from new, modified or reconstructed sources in the oil and natural gas source category, including production, processing, transmission and storage activities. The rules include first-time standards to address emissions of methane from equipment and processes across the source category, including hydraulically fractured oil and natural gas well completions. However, in June 2017,
114
Table of Contents
Index to Financial Statements
the EPA published a proposed rule to stay certain portions of the June 2016 standards for two years and re-evaluate the entirety of the 2016 standards, but the EPA has not yet published a final rule and, as a result, the June 2016 rule remains in effect but future implementation of the 2016 standards is uncertain at this time. To the extent implemented, compliance with these rules will require enhanced record-keeping practices, the purchase of new equipment such as optical gas imaging instruments to detect leaks and increased frequency of maintenance and repair activities to address emissions leakage. The rules will also likely require hiring additional personnel to support these activities or the engagement of third-party contractors to assist with and verify compliance. These new and proposed rules could result in increased compliance costs on our operations.
While Congress has from time to time considered legislation to reduce emissions of GHGs, there have not been significant legislative proposals to reduce GHG emissions at the federal level in recent years. In the absence of such federal climate legislation, a number of state and regional efforts have emerged that are aimed at tracking and/or reducing GHG emissions by means of cap and trade programs. These programs typically require major sources of GHG emissions to acquire and surrender emission allowances in return for emitting those GHGs. At the international level, the United States joined the international community at the 21st Conference of the Parties of the United Nations Framework Convention on Climate Change in Paris, France that requires member countries to review and ‘‘represent a progression’’ in their intended nationally determined contributions, which set GHG emission reduction goals every five years beginning in 2020. The Paris Agreement entered into force in November 2016. Although this agreement does not create any binding obligations for nations to limit their GHG emissions, it does include pledges from participating nations to voluntarily limit or reduce future emissions. In June 2017, President Trump stated that the United States would withdraw from the Paris Agreement, but may enter into a future international agreement related to GHGs. The Paris Agreement provides for a four-year exit process beginning when it took effect in November 2016, which would resulting in an effective exit date of November 2020. The United States’ adherence to the exit process is uncertain and/or the terms on which the United States may reenter the Paris Agreement or a separately negotiated agreement are unclear at this time.
Although it is not possible at this time to predict how legislation or new regulations that may be adopted to address GHG emissions would impact our business, any such future laws and regulations imposing reporting obligations on, or limiting emissions of GHGs from, our equipment and operations could require us to incur costs to reduce emissions of GHGs associated with our operations. Substantial limitations on GHG emissions could adversely affect demand for the oil and natural gas we produce. Recently, activists concerned about the potential effects of climate change have directed their attention at sources of funding for fossil-fuel energy companies, which has resulted in certain financial institutions, funds and other sources of capital restricting or eliminating their investment in oil and natural gas activities. Ultimately, this could make it more difficult to secure funding for exploration and production activities. Notwithstanding potential risks related to climate change, the International Energy Agency estimates that global energy demand will continue to rise and will not peak until after 2040 and that oil and gas will continue to represent a substantial percentage of global energy use over that time. Finally, it should be noted that some scientists have concluded that increasing concentrations of GHGs in the Earth’s atmosphere may produce climate changes that have significant physical effects, such as increased frequency and severity of storms, floods, droughts, and other climatic events. Our operations are onshore and not located in coastal or flood-prone regions of the United States, but if any such effects were to occur at our locations, these effects have the potential to cause physical damage to our assets or affect the availability of water for our operations and thus could have a material adverse effect on our operations.
Regulation of Hydraulic Fracturing
Hydraulic fracturing is an important common practice that is used to stimulate production of hydrocarbons, particularly natural gas, from tight formations, including shales. The process, which involves the injection of water, sand and chemicals under pressure into formations to fracture the surrounding rock and stimulate production, is typically regulated by state oil and natural gas commissions. However, legislation has been proposed in recent sessions of Congress to amend the Safe Drinking Water Act (“SDWA”) to repeal the exemption for hydraulic fracturing from the definition of “underground injection,” to require federal permitting
115
Table of Contents
Index to Financial Statements
and regulatory control of hydraulic fracturing, and to require disclosure of the chemical constituents of the fluids used in the fracturing process. Furthermore, several federal agencies have asserted regulatory authority over certain aspects of the process. For example, the EPA has recently taken the position that hydraulic fracturing with fluids containing diesel fuel is subject to regulation under the Underground Injection Control program, specifically as “Class II” Underground Injection Control wells under the Safe Drinking Water Act. Also, on June 28, 2016, the EPA published a final rule prohibiting the discharge of wastewater from onshore unconventional oil and gas extraction facilities to publicly owned wastewater treatment plants. The EPA is also conducting a study of private wastewater treatment facilities, also known as centralized waste treatment (“CWT”) facilities accepting oil and gas extraction wastewater. The EPA is collecting data and information related to the extent to which CWT facilities accept such wastewater, available treatment technologies (and their associated costs), discharge characteristics, financial characteristics of CWT facilities, and the environmental impacts of discharges from CWT facilities.
On August 16, 2012, the EPA published final regulations under the federal Clean Air Act that establish new air emission controls for oil and natural gas production and natural gas processing operations. Specifically, the EPA’s rule package includes New Source Performance standards to address emissions of sulfur dioxide and volatile organic compounds and a separate set of emission standards to address hazardous air pollutants frequently associated with oil and natural gas production and processing activities. The final rule seeks to achieve a 95% reduction in volatile organic compounds emitted by requiring the use of reduced emission completions or “green completions” on all hydraulically-fractured wells constructed or refractured after January 1, 2015. The rules also establish specific new requirements regarding emissions from compressors, controllers, dehydrators, storage tanks and other production equipment. The EPA received numerous requests for reconsideration of these rules from both industry and the environmental community, and court challenges to the rules were also filed. In response, the EPA has issued, and will likely continue to issue, revised rules responsive to some of the requests for reconsideration.
On May 12, 2016, the EPA amended its regulations to impose new standards for methane and volatile organic compounds emissions for certain new, modified, and reconstructed equipment, processes, and activities across the oil and natural gas sector. On the same day, the EPA finalized a plan to implement its minor new source review program in Indian country for oil and natural gas production, and it issued for public comment an information request that will require companies to provide extensive information instrumental for the development of regulations to reduce methane emissions from existing oil and gas sources. These standards, as well as any future laws and their implementing regulations, may require us to obtain pre-approval for the expansion or modification of existing facilities or the construction of new facilities expected to produce air emissions, impose stringent air permit requirements, or mandate the use of specific equipment or technologies to control emissions. In addition, on December 13, 2016, the EPA released a study examining the potential for hydraulic fracturing activities to impact drinking water resources, finding that, under some circumstances, the use of water in hydraulic fracturing activities can impact drinking water resources. Also, on February 6, 2015, the EPA released a report with findings and recommendations related to public concern about induced seismic activity from disposal wells. The report recommends strategies for managing and minimizing the potential for significant injection-induced seismic events.
Other governmental agencies, including the U.S. Department of Energy, the U.S. Geological Survey, and the U.S. Government Accountability Office, have evaluated or are evaluating various other aspects of hydraulic fracturing. These ongoing or proposed studies could spur initiatives to further regulate hydraulic fracturing, and could ultimately make it more difficult or costly for us to perform fracturing and increase our costs of compliance and doing business. Several states, including Texas, and local jurisdictions, have adopted, or are considering adopting, regulations that could restrict or prohibit hydraulic fracturing in certain circumstances, impose more stringent operating standards and/or require the disclosure of the composition of hydraulic fracturing fluids. The Texas Legislature adopted legislation, effective September 1, 2011, requiring oil and gas operators to publicly disclose the chemicals used in the hydraulic fracturing process. The Texas Railroad Commission adopted rules and regulations implementing this legislation that apply to all wells for which the Texas Railroad Commission
116
Table of Contents
Index to Financial Statements
issues an initial drilling permit after February 1, 2012. The law requires that the well operator disclose the list of chemical ingredients subject to the requirements of OSHA for disclosure on an internet website and file the list of chemicals with the Texas Railroad Commission with the well completion report. The total volume of water used to hydraulically fracture a well must also be disclosed to the public and filed with the Texas Railroad Commission. Also, in May 2013, the Texas Railroad Commission adopted rules governing well casing, cementing and other standards for ensuring that hydraulic fracturing operations do not contaminate nearby water resources. The rules took effect in January 2014. Additionally, on October 28, 2014, the Texas Railroad Commission adopted disposal well rule amendments designed, among other things, to require applicants for new disposal wells that will receive non-hazardous produced water and hydraulic fracturing flowback fluid to conduct seismic activity searches utilizing the U.S. Geological Survey. The searches are intended to determine the potential for earthquakes within a circular area of 100 square miles around a proposed new disposal well. The disposal well rule amendments, which became effective on November 17, 2014, also clarify the Texas Railroad Commission’s authority to modify, suspend or terminate a disposal well permit if scientific data indicates a disposal well is likely to contribute to seismic activity. The Texas Railroad Commission has used this authority to deny permits for waste disposal wells.
There has been increasing public controversy regarding hydraulic fracturing with regard to the use of fracturing fluids, induced seismic activity, impacts on drinking water supplies, use of water and the potential for impacts to surface water, groundwater and the environment generally. A number of lawsuits and enforcement actions have been initiated across the country implicating hydraulic fracturing practices. If new laws or regulations that significantly restrict hydraulic fracturing are adopted, such laws could make it more difficult or costly for us to perform fracturing to stimulate production from tight formations as well as make it easier for third parties opposing the hydraulic fracturing process to initiate legal proceedings based on allegations that specific chemicals used in the fracturing process could adversely affect groundwater. In addition, if hydraulic fracturing is further regulated at the federal, state or local level, our fracturing activities could become subject to additional permitting and financial assurance requirements, more stringent construction specifications, increased monitoring, reporting and recordkeeping obligations, plugging and abandonment requirements and also to attendant permitting delays and potential increases in costs. Such legislative changes could cause us to incur substantial compliance costs, and compliance or the consequences of any failure to comply by us could have a material adverse effect on our financial condition and results of operations. At this time, it is not possible to estimate the impact on our business of newly enacted or potential federal, state or local laws governing hydraulic fracturing.
ESA and Migratory Birds
The Endangered Species Act (“ESA”) and (in some cases) comparable state laws were established to protect endangered and threatened species. Pursuant to the ESA, if a species is listed as threatened or endangered, restrictions may be imposed on activities adversely affecting that species’ habitat. Similar protections are offered to migratory birds under the Migratory Bird Treaty Act. We may conduct operations on oil and natural gas leases in areas where certain species that are listed as threatened or endangered or proposed for listing are known to exist. The U.S. Fish and Wildlife Service may designate critical habitat and suitable habitat areas that it believes are necessary for survival of a threatened or endangered species. A critical habitat or suitable habitat designation could result in further material restrictions to federal land use and may materially delay or prohibit land access for oil and natural gas development. Moreover, as a result of a settlement approved by the U.S. District Court for the District of Columbia in September 2011, the U.S. Fish and Wildlife Service was required to make a determination on listing of more than 250 species as endangered or threatened under the ESA by no later than completion of the Agency’s 2017 fiscal year, however, the agency did not meet the deadline. Similar protections are offered to migratory birds under the Migratory Bird Treaty Act. The federal government issued indictments under the Migratory Bird Treaty Act to several oil and natural gas companies after dead migratory birds were found near reserve pits associated with drilling activities. However, in December 2017, the Department of Interior issued a new opinion revoking prior policy and concluded that an incidental take is not a violation of the Migratory Bird Treaty Act. The identification or designation of previously unprotected species as threatened or
117
Table of Contents
Index to Financial Statements
endangered in areas where underlying property operations are conducted could cause us to incur increased costs arising from species protection measures or could result in limitations on our development activities that could have an adverse impact on our ability to develop and produce reserves. If we were to have a portion of our leases designated as a critical or suitable habitat, it could adversely impact the value of our leases.
OSHA
We are subject to the requirements of the Occupational Safety and Health Act (“OSHA”) and comparable state statutes whose purpose is to protect the health and safety of workers. In addition, the OSHA hazard communication standard, the Emergency Planning and Community Right-to-Know Act and comparable state statutes and any implementing regulations require that we organize and/or disclose information about hazardous materials used or produced in our operations and that this information be provided to employees, state, and local governmental authorities and citizens.
Related Permits and Authorizations
Many environmental laws require us to obtain permits or other authorizations from state and/or federal agencies before initiating certain drilling, construction, production, operation, or other oil and natural gas activities and to maintain these permits and compliance with their requirements for ongoing operations. These permits are generally subject to protest, appeal, or litigation, which, in certain cases, can delay or halt projects and cease production or operation of wells, pipelines and other operations.
Employees
As of December 31, 2017, we had 48 full-time employees. We also hire independent contractors and consultants on an as needed basis in land, technical, regulatory and other disciplines who assist with specific tasks and perform various field and other services. None of our employees are represented by labor unions or covered by collective bargaining agreements, and we have not experienced any strikes or work stoppages. Our future success will depend partially on our ability to identify, attract, retain and motivate qualified personnel. We consider our relations with our employees to be satisfactory.
Legal Proceedings
There is no material litigation, arbitration or governmental proceeding currently pending against us or any members of our management team in their capacity as such.
Our Offices
Our corporate offices are located at 16200 Park Row, Suite 300, Houston, Texas 77084, and the phone number at that address is (281) 675-3400. We also lease office space in Midland, Texas. We believe that our offices are adequate for our current operations.
118
Table of Contents
Index to Financial Statements
Management and Board of Directors
Set forth below are the names, ages and positions of each of each of our directors and executive officers:
| Name |
Age | Position | ||||
| J.A. (Alan) Townsend |
67 | President, Chief Executive Officer and Director | ||||
| Craig Owen |
48 | Chief Financial Officer | ||||
| Brian K. Ayers |
61 | Vice President of Geology | ||||
| R. Colby Williford |
53 | Vice President of Land | ||||
| Gary C. Hanna |
60 | Chairman | ||||
| Edward Kovalik |
43 | Director | ||||
| Frank Rosenberg |
59 | Director | ||||
| William E. Mayer |
77 | Director | ||||
| Harry Quarls |
65 | Director | ||||
| Francis Contino |
72 | Director | ||||
J.A. (Alan) Townsend has served as our President and Chief Executive Officer since the closing of the Transaction. Mr. Townsend has been the President and a Director of Tema since April 2008. He also currently serves and has served as President and Director of several of Rosemore’s subsidiaries, including Gateway since April 2008, President of Crown Central New Holdings, LLC since 2010, President and Director of Tema of PA, LLC since 2012, and President and Director of Raven Gathering System, LLC since 2015. He has been employed by Tema since November 2001. Mr. Townsend has 45 years of engineering, operations, and management experience in the oil and gas industry. He has held several executive positions in public companies, including serving as President of Equitable Resources Energy Co., an exploration and production subsidiary of Equitable Resources, Vice President of KRM Petroleum Inc., an independent exploration and production company, and Chief Executive Officer of Camelot Oil and Gas Company, a privately owned exploration and production company. He earned a Bachelor of Science in Petroleum Engineering in 1972 and a Masters of Engineering in Petroleum Engineering from the Colorado School of Mines in 1977. Mr. Townsend brings significant industry experience leading oil and gas companies to the Company’s management team and the Board of Directors.
Craig Owen has served as our Chief Financial Officer since June 26, 2017. Mr. Owen has over 25 years of experience, serving in key executive financial and accounting leadership roles within the energy sector. Mr. Owen most recently served as Senior Vice President and Chief Financial Officer of Southwestern Energy Company from October 2012 to June 2017. Previously, from 2008 to 2012, he was the Controller and Chief Accounting Officer of Southwestern Energy Company. Prior to joining Southwestern Energy Company, Mr. Owen was the Controller, Operations Accounting at Anadarko Petroleum Corporation and held various managerial and financial positions at PricewaterhouseCoopers LLP, ARCO Pipe Line Company and Hilcorp Energy Company. Mr. Owen holds a bachelor’s degree in accounting from Texas A&M University and is a Certified Public Accountant.
Brian K. Ayers has served as our Vice President of Geology since April 2017. Mr. Ayers has over 38 years of geology, operations, and management experience in the oil and gas industry. Prior to Rosehill, Mr. Ayers served as Vice President of Geology for Tema from June 2012 to April 2017, and as Vice President of Land from June 2012 to May 2014. Mr. Ayers served Marshfield Oil and Gas as Consultant, Business Development and Geology from January 2012 to May 2012. Mr. Ayers has also held numerous executive positions for public and private companies, including President and Chief Executive Officer of Centurion Exploration Company, Senior Vice President of Geology for America Capital Energy Corporation, Vice President, Division Manager for Samson Lone Star and Vice President, Domestic Exploration for Coastal Oil & Gas Corporation. He began his career in 1980 as an Exploration Geophysicist at Texaco in New Orleans. Mr. Ayers served as an independent director on the Board of Directors of Tamaska Oil and Gas, Ltd. from 2007 to 2014. Mr. Ayers holds a Bachelors
119
Table of Contents
Index to Financial Statements
of Arts in Geophysical Science from The University of Chicago and a Masters of Business Administration from the Else School of Management, Millsaps College.
R. Colby Williford has served as our Vice President of Land since April 2017. Mr. Williford has over 29 years of petroleum land management experience, including field and in-house positions in Texas, Louisiana, Oklahoma, New Mexico, Colorado, and Wyoming. From May 2014 to April 2017, Mr. Williford served as Vice President to Land for Tema. He held the same position with Momentum Oil & Gas, LLC, from April 2011 to May 2014. Additionally, Mr. Williford has served as Vice President of Land for Centurion Exploration Company and America Capital Energy Corporation, the U.S. oil & gas subsidiary of the ZhongRong Group, Shanghai, China. He began his career in 1985 as a field landman working for small to medium sized companies and transitioned to in-house work providing acquisition & divestiture due diligence, land management and contract negotiation. Mr. Williford holds a Bachelors of Business Administration in International Business from The University of Houston.
Gary C. Hanna, has served as our Chairman since September 2015. Mr. Hanna has over 30 years of executive experience in the energy exploration and production and service sectors, with a primary focus in the mid-continent U.S. and Gulf of Mexico regions. Between September 2015 and April 2017, Mr. Hanna also served as our Chief Executive Officer. Between June 2015 and September 2015, Mr. Hanna evaluated various investment and employment opportunities. Mr. Hanna was a consultant for Energy XXI Gulf Coast, Inc. from June 2014 to June 2015. From 2009 until June 2014, Mr. Hanna served as the Chief Executive Officer of EPL Oil & Gas, Inc., or EPL, a publicly-traded company that was acquired by Energy XXI in June 2014 for $2.3 billion, and was elected as a director of EPL in June 2010 and Chairman in 2013. From 2008 to 2009, Mr. Hanna served as President and Chief Executive Officer of Admiral Energy Services, a start-up company focused on the development of offshore energy services. From 1999 to 2007, Mr. Hanna served in various capacities at Tetra Technologies, Inc., an international oil and gas services production company, including serving as Senior Vice President from 2002 to 2007. Mr. Hanna also served as President and Chief Executive Officer of Tetra’s affiliate, Maritech Resources, Inc., and as President of Tetra Applied Technologies, Inc., another Tetra affiliate. From 1996 to 1998, Mr. Hanna served as the President and Chief Executive Officer of Gulfport Energy Corporation, a public oil and gas exploration company. From 1995 to 1998, he also served as the Chief Operations Officer for DLB Oil& Gas, Inc., a mid-continent exploration public company. From 1982 to 1995, Mr. Hanna served as President and Chief Executive Officer of Hanna Oil Properties, Inc., a company engaged in oil services and the development of mid-continent oil and gas prospects. Since November 2015, Mr. Hanna has served as a member of the boards of directors of Hercules Offshore, Inc. and Aspire Holdings Corp. Mr. Hanna holds a B.B.A. in Economics from the University of Oklahoma. Mr. Hanna is well-qualified to serve as director due to his extensive operational, financial and management background.
Edward Kovalik has served as a director since September 2015. Between September 2015 and April 2017, Mr. Kovalik also served as President of the Company. Mr. Kovalik has also been the Chief Executive Officer and Managing Partner of KLR Holdings and KLR Group Holdings, LLC (“KLR Group”), an investment bank specializing in the energy sector which he co-founded in the spring of 2012. Mr. Kovalik manages the firm and focuses on structuring bespoke financing solutions for the firm’s clients. Mr. Kovalik has over 17 years of experience as an investment banker. Prior to founding KLR Holdings, from 2002 until April 2012, Mr. Kovalik served in various capacities of Rodman & Renshaw, most recently as Head of Capital Markets and the head of Rodman’s Energy Investment Banking team. From 1999 to 2002, Mr. Kovalik was a Vice President at Ladenburg Thalmann & Co., where he focused on private placement transactions for public companies. Mr. Kovalik has served as a member of the boards of directors of River Bend Oil and Gas, LLC since June 2013 and Marathon Patent Group, Inc. a public company, since April 2014. Mr. Kovalik is well-qualified to serve as director due to his extensive financial and management background.
Frank Rosenberg has served as a director since the closing of the Transaction. Since 2006, Mr. Rosenberg has been a Director of Tema Oil & Gas, Gateway Gathering and Marketing and Rosemore. Mr. Rosenberg is also the Co-Chairman of the Board of Directors (since 2013) and Chief Investment Officer of Rosemore, Chairman of
120
Table of Contents
Index to Financial Statements
the Board of Attransco, which historically operated U.S.-flagged mixed-use oil tankers, and a Director of Glen Eagle Resources (since 2013), a junior miner based in Montreal, Canada. Prior to joining Rosemore, Mr. Rosenberg had a breadth of assignments with Crown Central Petroleum Corporation at the refinery, in the trading operation, the wholesale and retail marketing departments, with the last job being as President & CEO. Mr. Rosenberg began his career with General Electric Credit Corporation (currently, GE Capital) in the marketing and then credit departments. He received an MBA from Emory University and a B.S. in Chemical Engineering from Bucknell University. Mr. Rosenberg was selected to serve on the board of directors due to his extensive experience in the oil and gas industry and significant financial experience.
William E. Mayer has served as a director since the closing of the Transaction. He currently serves and has served as a Director of Rosemore since 2005. Mr. Mayer is the founder of Park Avenue Equity Partners. He was a Professor and Dean at the College of Business, University of Maryland, and at the Simon College of Business, University of Rochester. Mr. Mayer worked for The First Boston Corporation (Credit Suisse), where he was President and CEO. He is on the board of BlackRock Capital Investment Corporation, Premier, Inc. and Lee Enterprises. He was Chairman of the Aspen Institute, and Chairman of the Board of the University of Maryland. He is on the board of The Rubin Museum, Atlantic Council, Pardee RAND Graduate School, Global Health Corps, and Miller Buckfire, and is a member of the Council on Foreign Relations, and Vice Chairman of the Middle East Investment Initiative. Mr. Mayer was a First Lieutenant in the U.S. Air Force. He holds a BS and an MBA from the University of Maryland. Mr. Mayer brings significant experience as a board member to the Company’s board of directors.
Harry Quarls has served as a director since the closing of the Transaction. He has been Managing Director at Global Infrastructure Partners since January 2009. He serves as Chairman of the Board of Penn Virginia Corporation (from which position he has announced his retirement effective February 28, 2018) and Woodbine Holdings LLC and as a Director of US Oil Sands Corporation and Opal Resources LLC. Mr. Quarls previously served as Chairman of the Board of Directors of Trident Resources Corp. and as a Director for Fairway Resources LLC. He also served as a Managing Director and Practice Leader for Global Energy at Booz & Co., a leading international management consulting firm, and as a member of Booz’s Board of Directors. Mr. Quarls earned an M.B.A. degree from Stanford University and also holds ScM. and B.S. degrees, both in chemical engineering, from M.I.T. and Tulane University, respectively. Mr. Quarls will bring considerable financial and energy investing experience, as well as experience on the boards of numerous public and private energy companies, to the Board of Directors.
Francis Contino has served as a director since the closing of the Transaction. He currently serves as Managing Director of FAC&B LLC, a consulting firm he founded in 2008. Additionally, since 2004 he has served as member of the board and Chairman of the Audit Committee of Mettler Toledo International, Inc., a leading global supplier of precision instruments and services. Mr. Contino previously served as Chief Financial Officer, Executive Vice President, and Director of McCormick & Company from 1998 to 2008. Prior to joining McCormick, Mr. Contino served as the Managing Partner of the Baltimore office of Ernst & Young, where he began his career. Mr. Contino completed the Executive Leadership Education Program at The Kellogg School of Business at Northwestern University. He graduated from the University of Maryland in 1968. Mr. Contino was selected to join the Company’s board of directors due to his considerable board experience and financial background.
Board of Directors and Terms of Office of Directors
The Company’s amended and restated certificate of incorporation provides for the classification of our board of directors into three separate classes, with each class serving a three-year term. At the Special Meeting, the stockholders elected seven directors to our board of directors, with each Class I director having a term that expires at the Company’s annual meeting of stockholders in 2018, each Class II director having a term that expires at the Company’s annual meeting of stockholders in 2019 and each Class III director having a term that expires at the Company’s annual meeting of stockholders in 2020, or in each case until their respective successors are duly elected and qualified, or until their earlier resignation, removal or death.
121
Table of Contents
Index to Financial Statements
Our board of directors consists of two individuals serving as Class I directors, two individuals serving as Class II directors and three individuals serving as Class III directors.
Independence of Directors
Because Tema and KLR Sponsor control a majority of the combined voting power of all classes of our outstanding voting stock, we have been a “controlled company” under NASDAQ corporate governance listing standards. Under the NASDAQ rules, a company of which more than 50% of the voting power is held by another person or group of persons acting together is a controlled company and may elect not to comply with certain NASDAQ corporate governance requirements, including the requirements that:
| • | a majority of the board of directors consist of independent directors; |
| • | the nominating and governance committee be composed entirely of independent directors with a written charter addressing the committee’s purpose and responsibilities; and |
| • | the compensation committee be composed entirely of independent directors with a written charter addressing the committee’s purpose and responsibilities. |
If in the future Tema and KLR Sponsor cease to control a majority of the combined voting power of all classes of our outstanding voting stock, we will no longer be a “controlled company” within the meaning of the rules of NASDAQ. Under NASDAQ rules, a company that ceases to be a controlled company must comply with the independent board committee requirements as they relate to the nominating and corporate governance and compensation committees on the following phase-in schedule: (1) one independent committee member at the time it ceases to be a controlled company, (2) a majority of independent committee members within 90 days of the date it ceases to be a controlled company and (3) all independent committee members within one year of the date it ceases to be a controlled company. Additionally, NASDAQ rules provide a 12-month phase-in period from the date a company ceases to be a controlled company to comply with the majority independent board requirement. During these phase-in periods, our stockholders will not have the same protections afforded to stockholders of companies of which the majority of directors are independent. Additionally, if, within the phase-in periods, we are not able to recruit additional directors who would qualify as independent, or otherwise comply with NASDAQ rules, we may be subject to enforcement actions by NASDAQ. Furthermore, a change in our board of directors and committee membership may result in a change in corporate strategy and operation philosophies, and may result in deviations from our current growth strategy.
The Company’s board of directors has determined that Messrs. Contino, Mayer, Quarls and Rosenberg are independent within the meaning of NASDAQ Rule 5605(a)(2).
Committees of the Board of Directors
The standing committees of the Company’s board of directors consist of an audit committee (the “Audit Committee”), a compensation committee (the “Compensation Committee”) and a corporate governance and nominating committee (the “Corporate Governance and Nominating Committee”). Each of the committees reports to the board of directors.
The composition, duties and responsibilities of these committees are set forth below.
Audit Committee
The principal functions of the Company’s Audit Committee are detailed in the Company’s Audit Committee charter, which is available on the Company’s website, and include:
| • | the appointment, compensation, retention, replacement, and oversight of the work of the independent auditors and any other independent registered public accounting firm engaged by us; |
122
Table of Contents
Index to Financial Statements
| • | pre-approving all audit and non-audit services to be provided by the independent auditors or any other registered public accounting firm engaged by us, and establishing pre-approval policies and procedures; |
| • | reviewing and discussing with the independent auditors all relationships the auditors have with the Company in order to evaluate their continued independence; |
| • | setting clear hiring policies for employees or former employees of the independent auditors; |
| • | setting clear policies for audit partner rotation in compliance with applicable laws and regulations; |
| • | obtaining and reviewing a report, at least annually, from the independent auditors describing (i) the independent auditor’s internal quality-control procedures and (ii) any material issues raised by the most recent internal quality-control review, or peer review, of the audit firm, or by any inquiry or investigation by governmental or professional authorities, within, the preceding five years respecting one or more independent audits carried out by the firm and any steps taken to deal with such issues; |
| • | reviewing and approving any related party transaction required to be disclosed pursuant to Item 404 of Regulation S-K promulgated by the SEC prior to us entering into such transaction; and |
| • | reviewing with management, the independent auditors, and our legal advisors, as appropriate, any legal, regulatory or compliance matters, including any correspondence with regulators or government agencies and any employee complaints or published reports that raise material issues regarding our financial statements or accounting policies and any significant changes in accounting standards or rules promulgated by the Financial Accounting Standards Board, the SEC or other regulatory authorities. |
Under the NASDAQ listing standards and applicable SEC rules, the Company is required to have at least three members of the Audit Committee, all of whom must be independent. Following the closing of the Transaction, our Audit Committee consists of Messrs. Contino, Mayer and Quarls, with Mr. Contino serving as the Chair. We believe that Messrs. Contino, Mayer and Quarls qualify as independent directors according to the rules and regulations of the SEC with respect to audit committee membership. We also believe that Mr. Contino qualifies as our “audit committee financial expert,” as such term is defined in Item 401(h) of Regulation S-K.
Compensation Committee
The principal functions of the Company’s Compensation Committee are detailed in the Company’s Compensation Committee charter, which is available on the Company’s website, and include:
| • | reviewing and approving on an annual basis the corporate goals and objectives relevant to the Company’s Chief Executive Officer’s compensation, evaluating its Chief Executive Officer’s performance in light of such goals and objectives and determining and approving the remuneration (if any) of its Chief Executive Officer based on such evaluation; |
| • | reviewing and approving on an annual basis the compensation of all of the Company’s other officers; |
| • | reviewing on an annual basis the Company’s executive compensation policies and plans; |
| • | implementing and administering the Company’s incentive compensation equity-based remuneration plans; |
| • | assisting management in complying with the Company’s proxy statement and annual report disclosure requirements; |
| • | approving all special perquisites, special cash payments and other special compensation and benefit arrangements for the Company’s officers and employees; |
| • | if required, producing a report on executive compensation to be included in the Company’s annual proxy statement; and |
| • | reviewing, evaluating and recommending changes, if appropriate, to the remuneration for directors. |
123
Table of Contents
Index to Financial Statements
Our Compensation Committee consists of Messrs. Mayer, Quarls, Rosenberg and Kovalik, with Mr. Mayer serving as the Chair.
Nominating and Governance Committee
The principal functions of the Company’s Nominating and Governance Committee are detailed in the Company’s Corporate Governance and Nominating Committee charter, which is available on the Company’s website, and include:
| • | identifying individuals qualified to become members of our board of directors, consistent with criteria approved by our board of directors; |
| • | overseeing the organization of our board of directors to discharge the board’s duties and responsibilities properly and efficiently; |
| • | identifying best practices and recommending corporate governance principles; and |
| • | developing and recommending to our board of directors a set of corporate governance guidelines and principles applicable to us. |
The Nominating and Governance Committee also develops and recommends to the board of directors corporate governance principles and practices and assists in implementing them, including conducting a regular review of our corporate governance principles and practices. The Nominating and Governance Committee oversees the annual performance evaluation of the board of directors and the committees of the board of directors and makes a report to the board of directors on succession planning.
Our Nominating and Governance Committee consists of Messrs. Rosenberg, Contino and Kovalik, with Mr. Rosenberg serving as the Chair.
Indemnification of Directors and Executive Officers
Our amended and restated charter provides that our executive officers and directors are indemnified by us to the fullest extent authorized by Delaware law, as it now exists or may in the future be amended. In addition, our amended and restated certificate of incorporation provides that our directors will not be personally liable for monetary damages to us for breaches of their fiduciary duty as directors, except to the extent such exemption from liability or limitation thereof is not permitted by the DGCL.
We have entered into agreements with our executive officers and directors to provide contractual indemnification in addition to the indemnification provided for in our amended and restated certificate of incorporation. Our bylaws also permit us to maintain insurance on behalf of any executive officer, director or employee for any liability arising out of his or her actions, regardless of whether Delaware law would permit such indemnification. We have purchased a policy of directors’ and officers’ liability insurance that insures our executive officers, directors and director nominees against the cost of defense, settlement or payment of a judgment in some circumstances and insures us against our obligations to indemnify our executive officers and directors.
These provisions may discourage stockholders from bringing a lawsuit against our directors for breach of their fiduciary duty. These provisions also may have the effect of reducing the likelihood of derivative litigation against executive officers and directors, even though such an action, if successful, might otherwise benefit us and our stockholders. Furthermore, a stockholder’s investment may be adversely affected to the extent we pay the costs of settlement and damage awards against executive officers and directors pursuant to these indemnification provisions.
We believe that these provisions and the insurance and the indemnity agreements are necessary to attract and retain talented and experienced officers and directors.
124
Table of Contents
Index to Financial Statements
Financial Code of Ethics
We have adopted a Financial Code of Ethics applicable to our directors, executive officers and employees. We have filed copies of our Financial Code of Ethics as an exhibit to our Current Report on Form 8-K filed on May 3, 2017. You will be able to review these documents by accessing our public filings at the SEC’s web site at www.sec.gov. In addition, a copy of the Financial Code of Ethics will be provided without charge upon request from us. We intend to disclose any amendments to or waivers of certain provisions of our Financial Code of Ethics Code of Ethics in a Current Report on Form 8-K. See “Where You Can Find More Information.”
125
Table of Contents
Index to Financial Statements
EXECUTIVE AND DIRECTOR COMPENSATION
The tables and narrative disclosure below provide compensation disclosure that satisfies the requirements applicable to emerging growth companies, as defined in the JOBS Act.
In this section, we provide disclosure relating to the compensation of our named executive officers paid by the Company following the business combination on April 27, 2017 and Rosemore, Inc., during the rest of 2017. We are also presenting information on historic executive compensation paid by Rosemore, Inc. in 2016 to the individuals who constitute our named executive officers for 2017. The tables and narrative disclosure below provide compensation information for the following individuals:
| • | J.A. (Alan) Townsend, our President and Chief Executive Officer; |
| • | Craig Owen, our Chief Financial Officer; |
| • | Brian K. Ayers, our Vice President of Geology; |
| • | R. Colby Williford, Vice President of Land; and |
| • | Gary C. Hanna, the Chairman of our board of directors and former Chief Executive Officer. |
We refer to Messrs. Townsend, Owen, Ayers, Williford and Hanna herein collectively as our “Named Executive Officers.”
2017 Summary Compensation Table
The following table summarizes the compensation paid to our Named Executive Officers for the fiscal years ended December 31, 2017 and 2016.
| Name and Principal Position |
Year | Salary ($) | Bonus ($)(1) |
Non-Equity Incentive Plan Compensation ($)(2) |
Stock Awards ($)(3) |
All Other Compensation ($)(4) |
Total ($) |
|||||||||||||||||||||
| J.A. (Alan) Townsend |
2017 | $ | 436,567 | $ | — | $ | — | $ | 1,864,158 | $ | 57,266 | $ | 2,357,991 | |||||||||||||||
| (President and Chief |
2016 | $ | 307,000 | $ | 107,420 | $ | 132,928 | $ | — | $ | 55,256 | $ | 602,604 | |||||||||||||||
| Executive Officer) |
||||||||||||||||||||||||||||
| Gary C. Hanna(5) |
2017 | $ | — | $ | — | $ | — | $ | — | $ | 224,828 | (5) | $ | 224,828 | ||||||||||||||
| (Chairman of the Board |
2016 | $ | — | $ | — | $ | — | $ | — | $ | — | $ | — | |||||||||||||||
| of Directors) |
||||||||||||||||||||||||||||
| Craig Owen(6) |
2017 | $ | 249,230 | $ | — | $ | — | $ | 1,789,594 | $ | 8,000 | $ | 2,046,824 | |||||||||||||||
| (Chief Financial Officer) |
||||||||||||||||||||||||||||
| Brian K. Ayers |
2017 | $ | 305,917 | $ | — | $ | — | $ | 706,825 | $ | 12,938 | $ | 1,025,680 | |||||||||||||||
| (Vice President, Geology) |
2016 | $ | 267,750 | $ | 53,550 | $ | 92,800 | $ | — | $ | 14.826 | $ | 428,826 | |||||||||||||||
| R. Colby Williford |
2017 | $ | 263,333 | $ | — | $ | — | $ | 512,644 | $ | 10,133 | $ | 786,110 | |||||||||||||||
| (Vice President, Land) |
2016 | $ | 240,000 | $ | 48,000 | $ | 59,788 | $ | — | $ | 9,315 | $ | 357,103 | |||||||||||||||
| (1) | Bonus amounts for 2017 are not calculable as of the date of this prospectus. It is anticipated that 2017 bonus amounts will be determined by March 2018, at which time the Company will disclose the amounts of such bonuses. Amounts in this column reflect the discretionary bonus paid by Rosehill Operating to its Named Executive Officers for services provided in 2016. |
| (2) | Amounts in this column for 2016 reflect awards earned by our Named Executive Officers under Rosemore, Inc.’s long-term incentive compensation program, referred to as the Value Added Rights (“VAR”) program. Following the Transaction, our Named Executive Officers no longer participate in the VAR program. The numbers represented in this column reflect an estimate of amounts earned at the December 31, 2016 |
126
Table of Contents
Index to Financial Statements
| evaluation date under the VAR program. This estimate is based on the price per VAR used for VAR awards evaluated in 2015. |
| (3) | The amounts reflected in the “Stock Awards” column represent the grant date fair value of restricted stock unit awards granted to our Named Executive Officers in November 2017 pursuant to the LTIP (as defined below), as computed in accordance with Financial Accounting Standards Board (“FASB”) Accounting Standard Codification (“ASC”) Topic 718. |
| (4) | The amounts in this column for 2017 (other than the amount reported for Mr. Hanna) represent the amount of matching contributions made by the Company to the Rosehill Employee Savings Plan & Trust for each participating Named Executive Officer. For 2016, amounts in this column reflect, for all Named Executive Officers other than Mr. Hanna, matching contributions to Rosemore, Inc.’s Employee Savings Plan and Trust made on behalf of our Named Executive Officers and employer contributions made on behalf of the Named Executive Officers under the Rosemore Employee Retirement Account Plan, Supplemental Savings Plan and Supplemental Executive Retirement Plan. Following the Transaction, our Named Executive Officers no longer participate in any plans sponsored or maintained by Rosemore, Inc. The amounts in this column for 2017 do not include amounts related to vacation payments, if any, payable at the time of the Transaction. |
| (5) | Mr. Hanna served as our Chief Executive Officer prior to the closing of the Transaction on April 27, 2017. Mr. Hanna did not receive any compensation for his service as our Chief Executive Officer in 2016 or 2017. Accordingly, the amount included for Mr. Hanna in the “All Other Compensation” column for 2017 reflects the aggregate compensation Mr. Hanna received for his service as the Chairman of our board of directors in 2017, as more fully discussed in “Director Compensation” below, which amount includes $84,821 in cash retainer fees and $140,007 reflecting the aggregate grant date fair value of the restricted stock award granted to Mr. Hanna under the LTIP in fiscal year 2017, computed in accordance with FASB ASC Topic 718. |
| (6) | Mr. Owen’s employment with the Company began on June 26, 2017. |
Narrative Disclosure to Summary Compensation Table
Base Salaries and Annual Bonus Awards
Other than Mr. Hanna, each of our Named Executive Officers has entered into an employment agreement with Rosehill Operating. The employment agreements provide for annualized base salaries, which provide a minimum, fixed level of cash compensation for services rendered during the year. The Named Executive Officers’ respective employment agreements provide for annualized base salaries of $500,000 for Mr. Townsend, $480,000 for Mr. Owen, $325,000 for Mr. Ayers and $275,000 for Mr. Williford. In addition, for the 2017 fiscal year, our Named Executive Officers (other than Mr. Hanna) were eligible to earn annual cash incentive bonuses of up to 100% for Messrs. Townsend and Owen, 70% for Mr. Ayers and 60% for Mr. Williford, in each case, of the applicable Named Executive Officer’s base salary in effect on December 31, 2017. As discussed above, as of the date of filing of this prospectus, annual bonus amounts for 2017 have not yet been determined.
Employment Agreements
In connection with the closing of the Transaction, Rosehill Operating entered into employment agreements with each of Messrs. Townsend, Ayers, and Williford setting forth the terms and conditions of their employment. Rosehill Operating also entered into an employment agreement, effective June 26, 2017, with Mr. Owen in connection with his appointment as the Company’s Chief Financial Officer. The employment agreements provide for a two-year initial term beginning on the applicable effective date of each employment agreement, which initial term is automatically extended for successive, additional one-year periods, unless either the applicable executive or we provide 30 days’ prior written notice that no such automatic extension will occur. The employment agreements provide for an annualized base salary and a discretionary annual bonus based on performance targets determined annually by the Compensation Committee. The employment agreements also provide that the applicable executives will be eligible to receive annual awards under the LTIP on the terms and conditions determined by the Compensation Committee from time to time. While employed under the employment agreements, the executives are eligible for certain additional benefits, including reimbursement of reasonable business expenses, paid vacation, and participation in our benefit plans, programs or arrangements.
127
Table of Contents
Index to Financial Statements
The employment agreements also contain certain restrictive covenants, including provisions that create restrictions, with certain limitations, on the applicable executive competing with the Company and its affiliates, soliciting any customers, or soliciting or hiring Company employees or inducing them to terminate their employment. These restrictions are generally intended to apply during the term of the executives’ employment with the Company and for the one-year period following termination of employment. In addition, the employment agreements provide for potential severance benefits in connection with certain terminations of employment, as described in “Potential Payments upon Termination or Change in Control” below.
Rosehill Resources Inc. Long-Term Incentive Plan
On April 27, 2017, the stockholders of the Company approved the Rosehill Resources Inc. Long-Term Incentive Plan (the “LTIP”), which permits the grant of a number of different types of equity, equity-based, and cash awards to employees directors and consultants. The purpose of the LTIP is to provide a means to attract and retain qualified service providers by affording such individuals a means to acquire and maintain stock ownership or awards, the value of which is tied to the performance of the Company. The LTIP also provides additional incentives and reward opportunities designed to strengthen such individuals’ concern for the welfare of the Company and their desire to remain in its employ.
On November 9, 2017, the Company granted restricted stock units under the LTIP to each of the Named Executive Officers other than Mr. Hanna. Except as otherwise provided in the applicable award agreement, the restricted stock units vest in three equal installments on the first three anniversaries of the date of the closing of the Transaction, subject to each Named Executive Officer’s continued employment through each such vesting date. The unvested restricted stock units held by our Named Executive Officers accrue dividend equivalent right credits (“DERs”) equal to the dividends, if any, paid in respect of shares of our common stock. The DERs will be paid in cash within 60 days following the vesting of the associated restricted stock units, or, if applicable, will be forfeited at the same time the associated restricted stock units are forfeited. In addition, the award agreements provide for accelerated vesting of unvested restricted stock units upon certain terminations of employment following a change in control of the Company, as described in “Potential Payments upon Termination or Change in Control” below.
Retirement Benefits
We have not maintained, and do not currently maintain, a defined benefit pension plan or nonqualified deferred compensation plan. We currently maintain a retirement plan pursuant to which employees, including our Named Executive Officers other than Mr. Hanna, are permitted to contribute portions of their base compensation to a tax-qualified retirement account. The Company provides matching contributions equal to 100% of elective deferrals up to 3% of eligible compensation and 50% of elective deferrals from 3% to a maximum of 5% of eligible compensation, subject to the applicable contributions limits. Matching contributions are immediately fully vested.
128
Table of Contents
Index to Financial Statements
Outstanding Equity Awards at 2017 Fiscal Year-End
The following table provides information concerning equity awards that have not vested for our Named Executive Officers as of December 31, 2017.
| Stock Awards | ||||||||||||
| Name |
Grant Date | Number of Shares or Units That Have Not Vested (#)(1) |
Market Value of Shares or Units That Have Not Vested ($)(2) |
|||||||||
| J. Alan Townsend Restricted Stock Units |
11/4/17 | 188,680 | $ | 1,483,025 | ||||||||
| Gary C. Hanna(3) Restricted Stock Award |
7/19/17 | 17,611 | (3) | $ | 138,422 | |||||||
| Craig Owen Restricted Stock Units |
11/4/17 | 181,133 | $ | 1,423,705 | ||||||||
| Brian K. Ayers Restricted Stock Units |
11/4/17 | 71,541 | $ | 562,312 | ||||||||
| R. Colby Williford Restricted Stock Units |
11/4/17 | 51,887 | $ | 407,832 | ||||||||
| (1) | Other than with respect to Mr. Hanna, the equity-based awards included in this column consist of restricted stock units subject to time-based vesting conditions. The restricted stock units granted to our Named Executive Officers on November 9, 2017, will vest in three equal increments on April 27 of each of 2018, 2019 and 2020, subject to the applicable executive’s continued employment through each such vesting date. |
| (2) | The amounts reflected in this column represent the market value of the restricted stock award held by Mr. Hanna and the common stock underlying the restricted stock unit awards held by our Named Executive Officers other than Mr. Hanna, computed based on the closing price of our common stock on December 31, 2017, which was $7.86 per share. |
| (3) | As discussed above, Mr. Hanna served as our Chief Executive Officer prior to the closing of the Transaction on April 27, 2017. The award included in this table for Mr. Hanna reflects the restricted stock award Mr. Hanna received for his service as the Chairman of our board of directors in 2017, as discussed in “Director Compensation” below. The forfeiture restrictions applicable to the restricted stock award granted to Mr. Hanna on July 19, 2017, will lapse on the first anniversary of the grant date, subject to Mr. Hanna’s continuous service on our board of directors through such date. |
Potential Payments upon Termination or Change in Control
Employment Agreements
As discussed above, other than Mr. Hanna, each of our Named Executive Officers has entered into an employment agreement with Rosehill Operating. The employment agreements provide for potential severance benefits in connection with certain terminations of employment. Generally, the employment agreements provide that, upon a resignation by the applicable executive for “good reason” or upon a termination by us without “cause” (including upon the expiration of the then-existing initial term or renewal term, as applicable, due to non-renewal by us), then, subject to the applicable executive’s execution and non-revocation of a release within the time provided to do so, the applicable executive will be eligible to receive a severance payment in an amount equal to 12 months’ worth of the applicable executive’s base salary for the year in which such termination occurs, payable in a lump sum following such termination.
129
Table of Contents
Index to Financial Statements
Restricted Stock Units
Subject to the applicable executive’s execution and non-revocation of a release, the restricted stock units held by our Named Executive Officers (other than Mr. Hanna) will become immediately fully vested in the event the applicable executive is terminated by the Company without “cause” or for “good reason” (as such terms are defined in the applicable award agreements) within the 18-month period following a “change in control” (as such term is defined in the LTIP).
Applicable Definitions
For purposes of the employment agreements and the restricted stock unit award agreements, “cause” generally means the applicable executive’s: (i) material breach of the employment agreement or award agreement, as applicable, any other written agreement between the applicable executive and the Company, or any policy or code of conduct established by the Company; (ii) commission of an act of gross negligence, willful misconduct, breach of fiduciary duty, fraud, theft or embezzlement; (iii) commission of, conviction or indictment for, or plea of nolo contendere to, any felony or crime involving moral turpitude; or (iv) willful failure or refusal (other than due to disability) to perform his obligations pursuant to the employment agreement or award agreement, as applicable, or to follow any lawful directive from the Company, provided, however, that the applicable executive will have 30 days to cure such willful failure or refusal following written notice from the Company.
For purposes of the employment agreements and the restricted stock unit award agreements, “good reason” generally means: (i) a material diminution in the applicable executive’s base salary (other than across-the-board reduction affecting similarly situated employees in substantially the same proportion as the applicable executive) or authority, duties and responsibilities with the Company, provided, however, that the removal of the applicable executive as an officer or board member of Company or any of its affiliates will not constitute Good Reason; (ii) a material breach by the Company of any of its covenants or obligations under the employment agreement or award agreement, as applicable; or (iii) the relocation of the applicable executive’s principal place of employment by more than 75 miles from the location of the his principal place of employment as of the effective date of the employment agreement or award agreement, as applicable. In order for an assertion of a termination for good reason to be effective, the applicable executive must provide written notice to the board of directors of the existence of one of the foregoing conditions within 30 days of the initial existence of such condition, and such condition must remain uncorrected for 30 days following the board of directors’ receipt of such written notice.
For purposes of the restricted stock unit award agreements, “change in control” (as defined in the LTIP) generally means: (i) a change in the ownership of the Company whereby any person or group acquires ownership of more than 50% of the total fair market value or total voting power of the stock of the Company; (ii) a change in the effective control of the Company whereby either (A) any person or group acquires ownership of stock of the Company possessing 30% or more of the total voting power of the stock of the Company; or (B) a majority of the members of the board of directors are replaced during any 12-month period by directors whose appointment or election is not endorsed by at least a majority of the members of the board of directors; (iii) a change in the ownership of a substantial portion of the Company’s assets whereby any person or group acquires assets of the Company that have a total gross fair market value equal to 40% of the total gross fair market value of all the assets of the Company.
Director Compensation
Our non-employee directors are entitled to receive compensation for services they provide to us consisting of retainers, fees and equity-based compensation as described below. Directors that also provide services to the Company or its affiliates as employees, including Mr. Townsend, do not receive compensation for their service on our board of directors.
130
Table of Contents
Index to Financial Statements
Each non-employee director is generally eligible to receive the following for each complete calendar year:
| • | an annual base retainer fee of $50,000; |
| • | an additional $50,000 retainer fee for the Chairman of the board of directors; |
| • | an additional $20,000 retainer fee for the Chair of the Audit Committee; |
| • | an additional $15,000 retainer fee for the Chair of the Compensation Committee; and |
| • | an additional $10,000 retainer for the Chair of the Corporate Governance and Nominating Committee. |
All retainers are paid in cash on a quarterly basis in arrears. In addition, each director is reimbursed for: (1) travel and miscellaneous expenses to attend meetings and activities of the board of directors or its committees and (2) travel and miscellaneous expenses related to his or her participation in general education and orientation programs for directors.
In addition to cash compensation, the Company’s non-employee directors are eligible to receive annual equity-based compensation under the LTIP. In 2017, each non-employee director received a restricted stock award with an aggregate grant date value equal to approximately $140,000. Generally, the forfeiture restrictions applicable to the restricted stock awards granted in 2017 will lapse on the one-year anniversary of the date of grant of such awards, subject to the applicable non-employee director’s continuous service on our board of directors through such vesting date. Restricted stock awards granted to the Company’s non-employee directors are subject to the terms and conditions of the LTIP and the award agreements pursuant to which such awards are granted.
2017 Non-Employee Director Compensation
The following table provides information concerning the compensation of our non-employee directors for the fiscal year ended December 31, 2017.
| Name |
Fees Earned or Paid in Cash ($)(1) |
Stock Awards ($)(2) |
Total ($) |
|||||||||
| Gary C. Hanna(3) |
$ | 84,821 | $ | 140,007 | $ | 224,828 | ||||||
| Edward Kovalik |
$ | 50,893 | $ | 140,007 | $ | 190,900 | ||||||
| Frank Rosenberg |
$ | 57,679 | $ | 140,007 | $ | 197,686 | ||||||
| William E. Mayer |
$ | 61,071 | $ | 140,007 | $ | 201,078 | ||||||
| Harry Quarls |
$ | 50,893 | $ | 140,007 | $ | 190,900 | ||||||
| Francis Contino |
$ | 64,464 | $ | 140,007 | $ | 204,471 | ||||||
| (1) | Includes annual cash retainer and supplemental retainers for each non-employee director during fiscal 2017, as described above. |
| (2) | Amounts in this column reflect the aggregate grant date fair value of restricted stock awards granted under the LTIP in fiscal year 2017, computed in accordance with FASB ASC Topic 718. The forfeiture restrictions applicable to the restricted stock awards granted in 2017 will lapse on July 19, 2018, subject to each non-employee director’s continuous service on our board of directors through such date. |
| (3) | As discussed above, Mr. Hanna served as our Chief Executive Officer prior to the closing of the Transaction on April 27, 2017. Mr. Hanna did not receive any compensation for his service as our Chief Executive Officer in 2016 or 2017. Inaccordance with SEC rules, the amounts reported in this table for Mr. Hanna are also included in the “All Other Compensation” column of the 2017 Summary Compensation Table above. |
131
Table of Contents
Index to Financial Statements
CERTAIN RELATIONSHIPS AND RELATED PARTY TRANSACTIONS
Founder Shares
In November 2015, pursuant to that certain Securities Subscription Agreement, dated as of November 20, 2015, KLR Sponsor purchased 4,312,500 shares of common stock (such stock, the “Founder Shares”), for $25,000, or approximately $0.006 per share. The Founder Shares are identical to the common stock included in the units sold in the IPO except that the Founder Shares are subject to certain transfer restrictions, as described in more detail below. In December 2015 and February and March 2016, KLR Sponsor returned to us, at no cost, an aggregate of 1,972,500 Founder Shares, which we cancelled. In January 2016, KLR Sponsor transferred 150,000 shares to Ms. Thom, 50,000 shares to Mr. Dow, and 10,000 shares to Messrs. Abbas, Buckner and York. In March 2016, Mr. Dow and Ms. Thom returned to us, at no cost, 10,000 and 30,000 Founder Shares, respectively, which we cancelled. Also in March 2016, KLR Sponsor forfeited an aggregate of 253,670 Founder Shares at no cost upon receiving the underwriters’ notice of only a partial exercise of their over-allotment option in connection with the IPO. All of the Founder Shares forfeited were cancelled by the Company. The 2,046,330 remaining Founder Shares represented 20.0% of the outstanding shares upon the completion of the IPO.
On April 28, 2017, all of the outstanding Founder Shares were automatically converted into 3,475,663 shares of Class A Common Stock in connection with the closing of the Transaction. As used herein, unless the context otherwise requires, “Founder Shares” are deemed to include the shares of Class A Common Stock issued upon conversion thereof.
Subject to certain limited exceptions, 50% of the Founder Shares will not be transferred, assigned or sold until the earlier of (i) one year after the date of the consummation of Transaction or (ii) the date on which the closing price of our Class A Common Stock equals or exceeds $12.00 per share (as adjusted for stock splits, stock dividends, reorganizations and recapitalizations) for any 20 trading days within any 30-trading day period commencing 150 days after the Transaction and pursuant to the transfer restrictions agreed upon by KLR Sponsor at the time of our IPO, the remaining 50% of the Founder Shares will not be transferred, assigned or sold until six months after the date of the consummation of the Transaction, or earlier, in either case, if, subsequent to the Transaction, we consummate a subsequent liquidation, merger, stock exchange or other similar transaction which results in all of our shareholders having the right to exchange their common stock for cash, securities or other property, which we refer to as the “Lock-Up Period.”
Private Placement Warrants
Simultaneously with the closing of the IPO, the Company consummated the private placement of 8,310,000 warrants at a price of $0.75 per warrant, of which 7,776,667 private placement warrants were sold to KLR Sponsor, and 533,333 private placement warrants were sold to EarlyBirdCapital, Inc. (“EBC”), the representative of the underwriters in the IPO, and its designees, generating gross proceeds of approximately $6.2 million.
On March 21, 2016, simultaneously with the exercise of the over-allotment, the Company consummated the private placement of an additional 98,838 private placement warrants to KLR Sponsor and EBC and its designees, among which 86,483 private placement warrants were purchased by KLR Sponsor and 12,355 private placement warrants were purchased by EBC and its designees, generating gross proceeds of approximately $74,000. The purchase price of the private placement warrants was added to the proceeds from the IPO to be held in the Trust Account pending completion of the Transaction. Each private placement warrant entitles the holder to purchase one share of our Class A Common Stock at $11.50 per share.
The private placement warrants (including the Class A Common Stock issuable upon exercise of the private placement warrants) are non-redeemable so long as they are held by KLR Sponsor or its permitted transferees. KLR Sponsor agreed to additional transfer restrictions relating to its common stock in connection with its entry into the SHRRA. If the private placement warrants are held by someone other than KLR Sponsor or its permitted
132
Table of Contents
Index to Financial Statements
transferees, the private placement warrants will be redeemable by the Company and exercisable by such holders on the same basis as the public warrants included in the units being sold in the IPO. Otherwise, the private placement warrants have terms and provisions that are identical to those of the public warrants sold as part of the units issued in the IPO.
Related Party Transactions
KLR Sponsor and its affiliates loaned the Company $275,000 in the aggregate by the issuance of unsecured promissory notes, which we refer to as the “Notes”, to cover expenses related to the IPO. These Notes were non-interest bearing and were paid in full on the completion of the IPO. In October 2016, KLR Sponsor provided a commitment to loan to KLRE up to an additional $100,000 for working capital purposes. On March 1, 2017, KLRE borrowed the full amount under this commitment, which was repaid at the closing of the Transaction.
Prior to the completion of the Transaction, KLR Group, an affiliate of KLR Sponsor, provided, at no cost to KLRE, office space and general administrative services.
Pursuant to an employment agreement entered into between us and Ms. Thom, we paid Ms. Thom an annualized salary of $200,000 from the consummation of the IPO through December 31, 2016. In lieu of any salary in 2017, Ms. Thom was eligible to receive a bonus equal to the amount of salary she would have received from January 1, 2017 through the date of our initial business combination, or approximately $65,000. We have historically reimbursed an affiliate of KLR Sponsor for certain expenses incurred in connection with the employment of Mr. Hanna and Ms. Thom, including employment related taxes (to be paid in connection with Ms. Thom’s annual salary and bonus) and health benefits.
KLR Sponsor, its executive officers and directors, or any of their respective affiliates have historically been reimbursed for any out-of-pocket expenses incurred in connection with activities on our behalf such as identifying potential target businesses and performing due diligence on suitable business combinations. Our audit committee reviews on a quarterly basis all payments that are made to KLR Sponsor, its executive officers and directors or our or their affiliates and determines which expenses and the amount of expenses that will be reimbursed. There is no cap or ceiling on the reimbursement of out-of-pocket expenses incurred by such persons in connection with activities on our behalf.
From time to time we may retain KLR Group to provide certain financial advisory, underwriting, capital raising, and other services for which KLR Group may receive fees in connection with such services. The amount of fees we pay to KLR Group will be based upon the prevailing market for similar services rendered by comparable investment banks for such transactions at such time, and will be subject to the review of our audit committee pursuant to the audit committee’s policies and procedures relating to transactions that may present conflicts of interest.
In October 2016, we entered into an agreement with a placement agent and KLR Group in connection with the PIPE Investment. As compensation for the services, we paid the placement agent and KLR Group a cash fee equal to 5.5% of the aggregate gross proceeds of the PIPE Investment (or $4.125 million). Such fee was split evenly between the placement agent and KLR Group.
In December 2017, KLR Group acted as placement agent in connection with the financing of the White Wolf Acquisition. As compensation for the services, we paid KLR Group a cash fee equal to $7.5 million.
At the time of our IPO, we engaged EBC as an advisor in connection with our Transaction. We agreed to pay EBC a cash fee for such services upon the consummation of our initial Transaction in an amount equal to $2.8 million (exclusive of any applicable finders’ fees which might become payable). Of such amount, we were allowed to allocate 1% of the gross proceeds of our IPO to other firms that assisted us with our Transaction, and in connection with the closing of the Transaction, we allocated $0.8 million to KLR Group in consideration of its role in assisting us with our Transaction.
133
Table of Contents
Index to Financial Statements
Agreements Relating to the Transaction
Shareholders’ and Registration Rights Agreement
Concurrently with the execution of the Business Combination Agreement, KLRE entered into the SHRRA with KLR Sponsor and Tema (each an “SHRRA Sponsor” and together, the “SHRRA Sponsors”) and Anchorage Illiquid Opportunities V, L.P. and AIO AIV 3 Holdings, L.P. (collectively, “Anchorage”), the primary investor in the private placement, which governs the rights and obligations of the SHRRA Sponsors and Anchorage with respect to KLRE following the closing of the Transaction. Pursuant to the terms of the SHRRA, and subject to certain exceptions, the SHRRA Sponsors are bound by restrictions on the transfer of (i) 33% of their Common Stock (as defined in the SHRRA) through the first anniversary of the closing of the Transaction and (ii) 67% of their Common Stock through the second anniversary of the closing of the Transaction, provided that sales of Common Stock above certain specified prices are permitted between the first and second anniversaries of the closing of the Transaction.
Pursuant to the SHRRA, the SHRRA Sponsors and Anchorage are entitled to certain registration rights, including the right to initiate two underwritten offerings in any twelve-month period and unlimited piggyback registration rights, subject to customary black-out periods, cutback provisions and other limitations as set forth in the SHRRA. Pursuant to the SHRRA, KLRE filed with the SEC a shelf registration statement relating to the offer and sale of the Registrable Securities (as defined in the SHRRA) owned by the SHRRA Sponsors and Anchorage (and any permitted transferees) and has agreed to keep such shelf registration statement effective on a continuous basis until the date as of which all such Registrable Securities have been sold or another registration statement is filed under the Securities Act. In addition, Anchorage has preemptive rights under the SHRRA to participate in future equity issuances by KLRE, subject to certain exceptions, so as to maintain its then-current percentage ownership of our capital stock.
Subject to specified ownership thresholds, KLR Sponsor is entitled to designate two directors for appointment to the Board, Tema is entitled to designate four directors and Anchorage is entitled to designate one director. Each SHRRA Sponsor and Anchorage is entitled to appoint a representative or observer on each committee of the Board. KLR Sponsor initially designated Gary C. Hanna (who serves as the Chairman of the Board) and Edward Kovalik, Tema initially designated J.A. (Alan) Townsend, Frank Rosenberg, William Mayer and Francis Contino and Anchorage designated Harry Quarls. Pursuant to the terms of the SHRRA, each SHRRA Sponsor must vote for the designees of the other SHRRA Sponsor and is entitled to replace any of its designees that are removed from the Board.
Also pursuant to the SHRRA, ending on the two year anniversary of closing of the Transaction, the Board may not approve, or cause Rosehill Operating to approve, certain Major Transactions (as such defined in the SHRRA) without the affirmative vote of at least 70% of the directors then serving on the Board. In addition, Anchorage has preemptive rights under the SHRRA to participate in future equity issuances by KLRE, subject to certain exceptions, so as to maintain its then-current percentage ownership of our capital stock.
Certain rights and obligations of the SHRRA Sponsors and Anchorage under the SHRRA will automatically cease if the SHRRA Sponsors and Anchorage (i) no longer hold any of our equity securities or (ii) no longer have the right to designate an individual for nomination to the Board.
Subscription Agreements
In connection with its entry into the Business Combination Agreement, KLRE entered into Subscription Agreements, each dated as of December 20, 2016, with KLR Sponsor and each of The K2 Principal Fund, L.P., Anchorage Illiquid Opportunities V, L.P., AIO V AIV 3 Holdings, L.P. and Geode Diversified Fund, a segregated account of Geode Capital Master Fund Ltd., pursuant to which, among other things, KLRE issued and sold in a private placement an aggregate of 75,000 shares of Series A Preferred Stock, which are convertible into shares of Class A Common Stock at a conversion price of $11.50 per share (subject to certain adjustments) and
134
Table of Contents
Index to Financial Statements
5,000,000 warrants for aggregate gross proceeds of $75 million. Additionally, KLR Sponsor contributed 476,540 shares of Class A Common Stock to the purchasers in the private placement. The proceeds from the private placement were used to fund the cash portion of the consideration required to effect the Transaction and any remaining proceeds were used for general corporate purposes, including to finance development and acquisition activities.
Pursuant to the Subscription Agreements, purchasers of Series A Preferred Stock and warrants in the private placement are entitled to certain registration rights, subject to customary black-out periods, cutback provisions and other limitations as set forth therein.
Side Letter
On December 20, 2016, KLR Sponsor and Rosemore entered into a Side Letter, pursuant to which the parties agreed to backstop redemptions by the Company’s public stockholders in excess of 30% of the outstanding shares of Class A Common Stock by purchasing shares of Class A Common Stock or Series A Preferred Stock in an amount up to $20 million. Pursuant to the Side Letter, KLR Sponsor agreed to transfer to Rosemore 750,000 warrants. In addition, under the terms of the Side Letter, certain shares of Class A Common Stock held by KLR Sponsor may be reallocated to Rosemore on the second anniversary of the closing date of the Transaction as a result of (i) certain acquisition activities undertaken by the Company as of certain times of determination and (ii) the volume weighted average trading price of the Company’s Class A Common Stock as of certain times of determination.
Amended and Restated Limited Liability Company Agreement of Rosehill Operating
At the closing of the Transaction, KLRE and Tema entered into that certain First Amended and Restated Limited Liability Company Agreement of Rosehill Operating (the “Second Amended LLC Agreement”). Following the closing of the Transaction, we operate our business through Rosehill Operating and its subsidiaries. The operations of Rosehill Operating, and the rights and obligations of the holders of the Rosehill Operating Common Units, are set forth in the Second Amended LLC Agreement.
Appointment as Managing Member. Under the Second Amended LLC Agreement, we are a member and the sole managing member of Rosehill Operating. As the sole managing member, we control all of the day-to-day business affairs and decision-making of Rosehill Operating without the approval of any other member, unless otherwise stated in the Second Amended LLC Agreement. As such, we, through our officers and directors, are responsible for all operational and administrative decisions of Rosehill Operating and the day-to-day management of Rosehill Operating’s business.
Compensation. We are not entitled to compensation for our services as managing member. We are entitled to reimbursement by Rosehill Operating for any costs, fees or expenses incurred on behalf of Rosehill Operating (including costs of securities offerings not borne directly by members, board of directors compensation and meeting costs, cost of periodic reports to its stockholders, litigation costs and damages arising from litigation, accounting and legal costs); provided that we will not be reimbursed for any of our income tax obligations.
Allocations and Distributions. Rosehill Operating will allocate its net income or net loss for each year to the members of Rosehill Operating pursuant to the terms of the Second Amended LLC Agreement, and the members of Rosehill Operating, including us, will generally incur U.S. federal, state and local income taxes on their share of any taxable income of members of Rosehill Operating. Net income and losses of members of Rosehill Operating generally will be allocated first to us with respect to our Series A and Series B preferred units in Rosehill Operating and then to the holders of Rosehill Operating Common Units on a pro rata basis in accordance with their respective percentage ownership of Rosehill Operating Common Units, subject to requirements under U.S. federal income tax law that certain items of income, gain, loss or deduction be allocated disproportionately in certain circumstances. The Second Amended LLC Agreement requires Rosehill Operating
135
Table of Contents
Index to Financial Statements
to make a corresponding cash distribution to us at any time a dividend is to be paid by us to the holders of our Series A Preferred Stock and Series B Preferred Stock. The Second Amended LLC Agreement allows for distributions to be made by Rosehill Operating to its members on a pro rata basis in accordance with the number of Rosehill Operating Common Units owned by each member out of funds legally available therefor. We expect Rosehill Operating may make distributions out of distributable cash periodically to the extent permitted by the debt agreements of Rosehill Operating and necessary to enable us to cover our operating expenses and other obligations, as well as to make dividend payments, if any, to the holders of our Class A Common Stock. In addition, the Second Amended LLC Agreement generally requires Rosehill Operating to make (i) pro rata distributions (in accordance with the number of Rosehill Operating Common Units owned by each member) to its members, including us, in an amount at least sufficient to allow us to pay our taxes and satisfy our obligations under the Tax Receivable Agreement and (ii) tax advances, which will be repaid upon a redemption, in an amount sufficient to allow each of the members of Rosehill Operating to pay its respective taxes on such holder’s allocable share of Rosehill Operating’s taxable income after taking into account certain other distributions or payments received by the unitholder from Rosehill Operating or us.
Rosehill Operating Common Unit Redemption Right. The Second Amended LLC Agreement provides Tema with a redemption right, which entitles Tema to cause Rosehill Operating to redeem, from time to time, all or a portion of its Rosehill Operating Common Units (and a corresponding number of shares of Class B Common Stock) for, at Rosehill Operating’s option, newly-issued shares of our Class A Common Stock on a one-for-one basis or a cash payment equal to the average of the volume-weighted closing price of one share of Class A Common Stock for the twenty trading days prior to the date Tema delivers a notice of redemption for each Rosehill Operating Common Unit redeemed (subject to customary adjustments, including for stock splits, stock dividends and reclassifications). In the event of a “Reclassification Event” (as defined in the Second Amended LLC Agreement), the managing member is to ensure that each Rosehill Operating Common Unit (and a corresponding share of Class B Common Stock) is redeemable for the same amount and type of property, securities or cash that a share of Class A Common Stock becomes exchangeable for or converted into as a result of such “Reclassification Event.” Upon the exercise of the redemption right, Tema will surrender its Rosehill Operating Common Units (and a corresponding number of shares of Class B Common Stock) to Rosehill Operating and (i) Rosehill Operating shall cancel such Rosehill Operating Common Units and issue to the Company a number of Rosehill Operating Common Units equal to the number of surrendered Rosehill Operating Common Units and (ii) the Company shall cancel the surrendered shares of Class B Common Stock. The Second Amended LLC Agreement requires that we contribute cash or shares of our Class A Common Stock to Rosehill Operating in exchange for the issuance to the Company described in clause (i). Rosehill Operating will then distribute such cash or shares of our Class A Common Stock to Tema to complete the redemption. Upon the exercise of the redemption right, we may, at our option, effect a direct exchange of cash or our Class A Common Stock for such Rosehill Operating Common Units in lieu of such a redemption.
Maintenance of One-to-One Ratios. The Second Amended LLC Agreement includes provisions intended to ensure that we at all times maintain a one-to-one ratio between (a) (i) the number of outstanding shares of Class A Common Stock and (ii) the number of Rosehill Operating Common Units owned by the Company (subject to certain exceptions for certain rights to purchase equity securities of the Company under a “poison pill” or similar shareholder rights plan, if any, certain convertible or exchangeable securities issued under the Company’s equity compensation plans and certain equity securities issued pursuant to the Company’s equity compensation plans (other than a stock option plan) that are restricted or have not vested thereunder) and (b) (i) the number of other outstanding equity securities of the Company (including the Series A Preferred Stock and the warrants) and (ii) the number of corresponding outstanding equity securities of Rosehill Operating. These provisions are intended to result in Tema having a voting interest in the Company that is identical to Tema’s economic interest in Rosehill Operating.
Transfer Restrictions. The Second Amended LLC Agreement generally does not permit transfers of Rosehill Operating Common Units by members, subject to limited exceptions. Any transferee of Rosehill
136
Table of Contents
Index to Financial Statements
Operating Common Units must, among other things, assume by written agreement all of the obligations of a transferring member with respect to the transferred units.
Dissolution. The Second Amended LLC Agreement provides that Rosehill Operating shall dissolve upon the earlier of the sale of all or substantially all of the assets of Rosehill Operating or upon the determination of the managing member. Upon a dissolution event, the proceeds of a liquidation will be distributed in the following order: (i) first, to pay the expenses of winding up Rosehill Operating; (ii) second, to pay debts and liabilities owed to creditors of Rosehill Operating; (iii) third, to set up cash reserves which the managing member reasonably deems necessary for contingent or unforeseen liabilities or certain future payments and (iv) fourth, (A) to the holders of Series A preferred units pursuant to the terms of such securities and (B) then to the members pro-rata in accordance with their respective relative ownership of Rosehill Operating Common Units.
Indemnification and Fiduciary Duties. The Second Amended LLC Agreement provides for indemnification of the managing member, members and officers of Rosehill Operating and their respective subsidiaries or affiliates and provides that, except as otherwise provided therein, we, as the managing member of Rosehill Operating, have the same fiduciary duties to Rosehill Operating and its members as are owed to a corporation organized under Delaware law and its stockholders by its directors.
Tax Receivable Agreement
Certain transactions with Tema in connection with the Transaction resulted in adjustments to the tax basis of the tangible and intangible assets of Rosehill Operating, which would result in increased deductions allocated to us. In addition, Tema may redeem its Rosehill Operating Common Units for shares of Class A Common Stock or cash, as applicable, pursuant to the redemption right described above. Rosehill Operating intends to make for itself (and for each of its material direct or indirect subsidiaries that is treated as a partnership for U.S. federal income tax purposes and that it controls) an election under Section 754 of the Code that will be effective for the taxable year of the Transaction and each taxable year in which a redemption of Rosehill Operating Common Units occurs. Pursuant to the Section 754 election, our acquisitions (or deemed acquisition for U.S. federal income tax purposes) of Rosehill Operating Common Units as a result of redemptions of Rosehill Operating Common Units are expected to result in adjustments to the tax basis of the tangible and intangible assets of Rosehill Operating. These adjustments will be allocated to us. Such adjustments to the tax basis of the tangible and intangible assets of Rosehill Operating would not have been available to us absent its acquisition or deemed acquisition of Rosehill Operating Common Units as a result of redemptions of Rosehill Operating Common Units. The tax basis adjustments described above are expected to increase (for tax purposes) our depreciation and amortization deductions and may also decrease our gains (or increase our losses) on future dispositions of certain assets to the extent tax basis is allocated to those assets. Such increased deductions and losses and reduced gains may reduce the amount of tax that we would otherwise be required to pay in the future.
On April 27, 2017, in connection with the closing of the Transaction, we entered into a Tax Receivable Agreement (the “Tax Receivable Agreement”) with Tema. The Tax Receivable Agreement generally provides for the payment by us to Tema of 90% of the net cash savings, if any, in U.S. federal, state and local income tax and franchise tax that we actually realize (or are deemed to realize in certain circumstances) in periods after the closing of the Transaction as a result of: (i) any tax basis increases in the assets of Rosehill Operating resulting from the distribution to Tema of the cash consideration in connection with the Transaction, the shares of Class B common stock and the warrants and the assumption by Rosehill Operating of $55 million in Tema indebtedness (the “Tema Liabilities”) in connection with the Transaction, (ii) any tax basis increases in the assets of Rosehill Operating resulting from a redemption of Rosehill Operating Common Units, and (iii) imputed interest deemed to be paid by us as a result of, and additional tax basis arising from, payments it makes under the Tax Receivable Agreement. Under the Tax Receivable Agreement, we retain the benefit of the remaining 10% of these cash savings. Certain of Tema’s rights under the Tax Receivable Agreement are transferable in connection with a permitted transfer of Rosehill Operating Common Units or following a redemption of Tema’s Rosehill Operating Common Units.
137
Table of Contents
Index to Financial Statements
The payment obligations under the Tax Receivable Agreement are our obligations and not obligations of Rosehill Operating, and we expect that the payments we are required to make under the Tax Receivable Agreement will be substantial. Estimating the amount and timing of payments that may become due under the Tax Receivable Agreement is by its nature imprecise. For purposes of the Tax Receivable Agreement, cash savings in tax generally will be calculated by comparing our actual tax liability (determined by using the actual applicable U.S. federal income tax rate and an assumed combined state and local income tax rate) to the amount we would have been required to pay had we not been able to utilize any of the tax benefits subject to the Tax Receivable Agreement. The amounts payable, as well as the timing of any payments, under the Tax Receivable Agreement are dependent upon significant future events and assumptions, including the timing of the redemptions of Rosehill Operating Common Units, the price of our Class A Common Stock at the time of each redemption, the extent to which such redemptions are taxable transactions, the amount of Tema’s tax basis in its Rosehill Operating Common Units at the time of the relevant redemption, the depreciation and amortization periods that apply to the increase in tax basis, the amount, character and timing of taxable income we generate in the future, the U.S. federal income tax rates then applicable, and the portion of our payments under the Tax Receivable Agreement that constitute imputed interest or give rise to depreciable or amortizable tax basis.
We expect that if the Tax Receivable Agreement were terminated immediately after this offering, the estimated termination payments would be approximately $ million (calculated using a discount rate equal to one-year LIBOR plus 150 basis points, applied against an undiscounted liability of $ million).
The foregoing amounts are merely estimates and the actual payments could differ materially. It is possible that future transactions or events could increase or decrease the actual tax benefits realized and the Tax Receivable Agreement payments as compared to the foregoing estimates. Moreover, there may be a negative impact on our liquidity if, as a result of timing discrepancies or otherwise, (i) the payments under the Tax Receivable Agreement exceed the actual tax benefits we realize in respect of the tax attributes subject to the Tax Receivable Agreement and/or (ii) distributions to us by Rosehill Operating are not sufficient to permit us to make payments under the Tax Receivable Agreement after is has paid its taxes and other obligations. The payments under the Tax Receivable Agreement are not conditioned upon Tema having a continued ownership interest in either Rosehill Operating or us.
In addition, although we are not aware of any issue that would cause the Internal Revenue Service or other relevant tax authorities to challenge potential tax basis increases or other tax benefits covered under the Tax Receivable Agreement, Tema will not reimburse us for any payments previously made under the Tax Receivable Agreement if any tax benefits that have given rise to payments under the Tax receivable Agreement are subsequently disallowed, except that excess payments made to Tema will be netted against payments that would otherwise to be made to Tema, if any, after our determination of such excess. As a result, in such circumstances, we could make payments that are greater than our actual cash tax savings, if any, and may not be able to recoup those payments, which could adversely affect our liquidity.
The term of the Tax Receivable Agreement commenced upon the completion of the Transaction and will continue until all tax benefits that are subject to such Tax Receivable Agreement have been utilized or expired, unless we exercise our right to terminate the Tax Receivable Agreement within thirty (30) days of certain mergers or other changes of control or it is terminated early due to our breach of a material obligation thereunder. Payments will generally be made under the Tax Receivable Agreement as we realize actual cash tax savings in periods after the Transaction from the tax benefits covered by the Tax Receivable Agreement. However, if we elect to terminate the Tax Receivable Agreement early within thirty (30) days of certain mergers or other changes of control or it is terminated early due to our breach of a material obligation thereunder, our obligations under the Tax Receivable Agreement would accelerate and we would be required to make a substantial, immediate lump-sum payment in advance of any actual cash tax savings. This payment would equal the present value of hypothetical future payments that could be required to be paid under the Tax Receivable Agreement (determined by applying a discount rate of one-year LIBOR plus 150 basis points). The calculation of hypothetical future payments will be based upon certain assumptions and deemed events set forth in the Tax Receivable Agreement,
138
Table of Contents
Index to Financial Statements
including (i) the assumption that we have sufficient taxable income to fully utilize the tax benefits covered by the Tax Receivable Agreement and (ii) the assumption that any units (other than those held by us) outstanding on the termination date are deemed to be exchanged on the termination date. Any early termination payment may be made significantly in advance of the actual realization, if any, of the future tax benefits to which the termination payment relates.
The Tax Receivable Agreement provides that in the event that we breach any of our material obligations under it, whether as a result of (i) our failure to make any payment when due (including in cases where we elect to terminate the Tax Receivable Agreement early, the Tax Receivable Agreement is terminated early or we have available cash but fail to make payments when due under circumstances where we do not have the right to elect to defer the payment, as described below), (ii) our failure to honor any other material obligation under it, or (iii) by operation of law as a result of the rejection of the Tax Receivable Agreement in a case commenced under the U.S. Bankruptcy Code or otherwise, then Tema may elect to treat such breach as an early termination, which would cause all our payment and other obligations under the Tax Receivable Agreement to be accelerated and become due and payable applying the same assumptions described above.
Upon an early termination of the Tax Receivable Agreement, we could be required to make payments under the Tax Receivable Agreement that exceed our actual cash tax savings, if any, in respect of the tax attributes subject to the Tax Receivable Agreement. In these situations, our obligations under the Tax Receivable Agreement could have a substantial negative impact on our liquidity and could have the effect of delaying, deferring or preventing certain mergers, asset sales, or other forms of business combinations or changes of control. For example, if the Tax Receivable Agreement were terminated immediately after this offering, the estimated termination payments would, in the aggregate, be approximately $ million (calculated using a discount rate equal to one-year LIBOR plus 150 basis points, applied against an undiscounted liability of $ million). There can be no assurance that we will be able to finance our obligations under the Tax Receivable Agreement.
Decisions we make in the course of running our business, such as with respect to mergers, asset sales, other forms of business combinations or other changes in control, may influence the timing and amount of payments that are received by Tema under the Tax Receivable Agreement. For example, the earlier disposition of assets following a redemption of Rosehill Operating Common Units may accelerate payments under the Tax Receivable Agreement and increase the present value of such payments, and the disposition of assets before a redemption of Rosehill Operating Common Units may increase Tema’s tax liability without giving rise to any rights of Tema to receive payments under the Tax Receivable Agreement. Such effects may result in differences or conflicts of interest between Tema and our shareholders. The Tax Receivable Agreement provides that, until 36 months from the closing date of the Transaction (the “Protection Period”), for so long as Tema beneficially holds at least 20% of the total issued and outstanding equity of Rosehill Operating (excluding Tema’s beneficial ownership of Rosehill Operating through Tema’s ownership of Class A Common Stock), we shall not cause Rosehill Operating to sell, exchange or dispose of Contributed Assets (as defined in the Business Combination Agreement) in any 12-month period during the Protection Period if, following such disposition, the cumulative aggregate amount realized (as that term is defined in Section 1001 of the Internal Revenue Code of 1986, as amended) from all dispositions of Contributed Assets during such 12-month period would be in excess of $40 million, without the consent of Tema, which consent may be granted or withheld in Tema’s sole discretion. We shall provide notice to Tema of any proposed disposition of Contributed Assets which would have an amount realized in excess of $20 million and the material terms of such disposition no later than 15 business days prior to the proposed disposition.
Payments generally are due under the Tax Receivable Agreement within five days following the finalization of the schedule with respect to which the payment obligation is calculated. However, interest on such payments
will begin to accrue from the due date (without extensions) of our U.S. federal income tax return for the period to which such payments relate until such payment due date at a rate equal to one-year LIBOR plus 300 basis points. Except in cases where we elect to terminate the Tax Receivable Agreement early or it is otherwise terminated as
139
Table of Contents
Index to Financial Statements
described above, generally we may defer payments due under the Tax Receivable Agreement if we do not have available cash to satisfy our payment obligations under the Tax Receivable Agreement or if our contractual obligations limit our ability to make these payments. Any such deferred payments under the Tax Receivable Agreement generally will accrue interest from the due date for such payment until the payment date at a rate of one year LIBOR plus 550 basis points. However, interest will accrue from the due date for such payment until the payment date at a rate of one year LIBOR plus 300 basis points if we are unable to make such payment as a result of limitations imposed by existing credit agreements. We have no present intention to defer payments under the Tax Receivable Agreement.
Because we are a holding company with no operations of our own, our ability to make payments under the Tax Receivable Agreement is dependent on the ability of Rosehill Operating to make distributions to us in an amount sufficient to cover our obligations under the Tax Receivable Agreement. This ability, in turn, may depend on the ability of Rosehill Operating’s subsidiaries to make distributions to it. The ability of Rosehill Operating, its subsidiaries and other entities in which it directly or indirectly holds an equity interest to make such distributions will be subject to, among other things, the applicable provisions of Delaware law (or other applicable jurisdiction) that may limit the amount of funds available for distribution and restrictions in relevant debt instruments issued by Rosehill Operating, or its subsidiaries and/other entities in which it directly or indirectly holds an equity interest. To the extent that we are unable to make payments under the Tax Receivable Agreement due to an unavailability of sufficient cash, such payments will be deferred and will accrue interest until paid.
Gathering Agreements
At the closing of the Transaction, Rosehill Operating entered into certain crude oil gathering and gas gathering agreements with Gateway, a wholly owned subsidiary of Rosemore, pursuant to which Gateway will receive, gather, store, treat, and redeliver crude oil and gas production from receipt points within certain production areas located in Loving County, Texas that are exclusively dedicated by Rosehill Operating to Gateway, at certain delivery points for downstream transportation. Each gathering agreement has a term of 10 years that automatically renews on a year-to-year basis until terminated by either party pursuant to the agreements. Rosehill Operating will pay Gateway a fee for such services set forth in the gathering agreements. Gateway provided the same services to Tema in the same dedicated area before the Transaction.
Indemnification Agreements
Effective as of the closing date of the Transaction, we entered into indemnification agreements with certain of our directors and executive officers. Each indemnification agreement provides that, subject to limited exceptions, and among other things, we will indemnify the director or executive officer to the fullest extent permitted by law for claims arising in his or her capacity as our director or officer.
Related Party Policy
Prior to the closing of our IPO, we did not have a formal policy for the review, approval or ratification of related party transactions. Accordingly, certain of the transactions discussed above were not reviewed, approved or ratified in accordance with any such policy.
We have adopted a Financial Code of Ethics requiring us to avoid, wherever possible, all conflicts of interests, except under guidelines or resolutions approved by our board of directors (or the appropriate committee of our board) or as disclosed in our public filings with the SEC. Under our Financial Code of Ethics, conflict of interest situations include any financial transaction, arrangement or relationship (including any indebtedness or guarantee of indebtedness) involving the company. A copy of our code of ethics is available on our website.
In addition, our Audit Committee, pursuant to its charter, is responsible for reviewing and approving related party transactions to the extent that we enter into such transactions. An affirmative vote of a majority of the
140
Table of Contents
Index to Financial Statements
members of the Audit Committee present at a meeting at which a quorum is present is required in order to approve a related party transaction. A majority of the members of the entire Audit Committee will constitute a quorum. Without a meeting, the unanimous written consent of all of the members of the Audit Committee will be required to approve a related party transaction. A copy of the Audit Committee charter is available on our website. We also require each of our directors and executive officers to complete a directors’ and officers’ questionnaire that elicits information about related party transactions.
These procedures are intended to determine whether any such related party transaction impairs the independence of a director or presents a conflict of interest on the part of a director, employee or officer.
141
Table of Contents
Index to Financial Statements
SECURITY OWNERSHIP OF CERTAIN BENEFICIAL OWNERS AND MANAGEMENT
The following table sets forth information known to us regarding ownership of shares of our common stock as of February 13, 2018:
| • | each person who is the beneficial owner of more than 5% of the outstanding shares of our common stock; |
| • | each of the Company’s named executive officers and directors; and |
| • | all executive officers and directors of the Company, as a group. |
Beneficial ownership is determined according to the rules of the SEC, which generally provide that a person has beneficial ownership of a security if he, she or it possesses sole or shared voting or investment power over that security, including options and warrants that are currently exercisable or exercisable within 60 days.
The percentages in the table below are based on 6,116,635 shares Class A Common Stock and 29,807,692 shares of Class B Common Stock issued and outstanding as of February 13, 2018. In calculating the percentages for a particular holder, we treated as outstanding the number of shares of Class A Common Stock issuable upon exercise of that particular holder’s warrants or conversion of that particular holder’s Series A Preferred Stock and did not assume exercise of any other holder’s warrants or conversion of any other holder’s Series A Preferred Stock.
Unless otherwise indicated, we believe that all persons named in the table below have sole voting and investment power with respect to all shares of voting common stock beneficially owned by them.
| Class A Common Stock | Class B Common Stock | |||||||||||||||
| Name and Address of Beneficial Owners(1) |
Number of Shares |
% | Number of Shares |
% | ||||||||||||
| More than 5% Stockholders |
||||||||||||||||
| KLR Entities(2) |
3,544,733 | 44.0 | % | — | — | |||||||||||
| Rosemore, Inc.(3) |
36,159,518 | 86.1 | % | 29,807,692 | 100 | % | ||||||||||
| K2 Principal Fund, L.P.(4) |
1,621,663 | 23.1 | % | — | — | |||||||||||
| Anchorage(5) |
8,441,287 | 60.8 | % | — | — | |||||||||||
| Geode Diversified Fund(6) |
715,020 | 11.0 | % | — | — | |||||||||||
| Buerger Entities(7) |
5,164,801 | 51.5 | % | — | — | |||||||||||
| Directors and Named Executive Officers |
||||||||||||||||
| Gary C. Hanna(8) |
1,391,138 | 19.7 | % | — | — | |||||||||||
| Edward Kovalik(9) |
3,562,344 | 44.4 | % | — | — | |||||||||||
| J.A. (Alan) Townsend(10) |
206,180 | 3.5 | % | — | — | |||||||||||
| Craig Owen(11) |
190,433 | 3.2 | % | — | — | |||||||||||
| T.J. Thom(12) |
140,000 | 2.4 | % | — | — | |||||||||||
| Harry Quarls |
28,429 | * | — | — | ||||||||||||
| Francis Contino |
27,611 | * | — | — | ||||||||||||
| Frank Rosenberg |
17,611 | * | — | — | ||||||||||||
| William E. Mayer |
17,611 | * | — | — | ||||||||||||
| All directors and executive officers as a group (9 individuals) |
5,581,352 | 74.8 | % | — | — | |||||||||||
| * | Less than one percent. |
| (1) | Unless otherwise noted, the business address of each of the entities or individuals set forth in the table is c/o Rosehill Resources Inc., 16200 Park Row, Suite 300, Houston, Texas 77084. |
| (2) | KLR Group Investments, LLC (“KLR Investments”) is the managing member of KLR Sponsor. Mr. Kovalik is the managing member of KLR Group, which owns 100% of KLR Group Investments, LLC, which is the managing member of KLR Sponsor. Includes: (i) 414,601 shares of Class A common stock |
142
Table of Contents
Index to Financial Statements
| held by KLR Investments, (ii) 2,118,547 warrants to purchase Class A common stock held by KLR Investments, (iii) 85,565 shares of Class A common stock issuable upon conversion of Series A Preferred Stock held by KLR Investments and (iv) 926,020 shares of Class A common stock held by KLR Sponsor. KLR Sponsor has entered into the SHRRA with Tema and other holders. Pursuant to the SHRRA, KLR Sponsor and Tema have agreed to, among other things, vote their shares of common stock to elect members of the Board of Directors of the Company as set forth therein. Because of the relationship between KLR Sponsor and Tema as a result of the SHRRA, KLR Sponsor may be deemed, pursuant to Rule 13d-3 under the Act, to beneficially own the shares of common stock held by Tema. KLR Sponsor disclaims beneficial ownership of the shares of common stock held by Tema. |
| (3) | Rosemore’s address is 1 North Charles Street, 22nd Floor, Baltimore, MD 21201. Includes: (i) 29,807,692 shares of Class B common stock exchangeable (together with a corresponding number of Rosehill Operating Common Units) for Class A Common Stock on a one-to-one basis held by Tema, (ii) 4,000,000 warrants to purchase Class A Common Stock held by Tema, (iii) 750,000 warrants to purchase Class A Common Stock held by Rosemore, and (iv) 18,421 shares of Series A Preferred Stock held by Rosemore Holdings, Inc., a wholly owned subsidiary of Rosemore that are convertible into 1,601,826 shares of Class A Common Stock. Shares held by Tema and Rosemore Holdings, Inc. may be deemed beneficially owned by Rosemore, their sole parent. Tema’s address is 1 North Charles Street, 22nd Floor, Baltimore, MD 21201, and Rosemore Holdings, Inc.’s address is 7 St. Paul Street, Suite 820, Baltimore, MD 21202. Tema has entered into the SHRRA with KLR Sponsor and other holders. Pursuant to the SHRRA, KLR Sponsor and Tema have agreed to, among other things, vote their shares of common stock to elect members of the Board of Directors of the Company as set forth therein. Because of the relationship between KLR Sponsor and Tema as a result of the SHRRA, Tema may be deemed, pursuant to Rule 13d 3 under the Act, to beneficially own the shares of common stock held by KLR Sponsor. Tema disclaims beneficial ownership of the shares of common stock held by KLR Sponsor. |
| (4) | Includes 1,165,848 shares of Class A Common Stock issuable upon the exercise of outstanding warrants and 869,565 shares of Class A Common Stock issuable upon conversion of shares of Series A Preferred Stock. K2 Principal Fund, L.P.’s address is 2 Bloor St West, Suite 801, Toronto, Ontario, M4W 3E2. The reported securities are owned directly by the K2 Principal Fund, L.P. (the “Fund”), and indirectly by: K2 GenPar L.P., the general partner of the Fund (the “GP”), K2 GenPar 2009 Inc., the general partner of the GP (“GenPar 2009”), Shawn Kimel Investments Inc., which owns 100% of the equity interests in GenPar 2009 (“SKI”), and Shawn Kimel, the sole owner of SKI. SKI owns 66.5% of the equity interests of K2 & Associates Investment Management Inc. (“K2 & Associates”). K2 & Associates is the investment manager of the Fund. Shawn Kimel, through his ownership of SKI and his being president of each of SKI, the GP, GenPar2009 and K2 & Associates, controls the voting and dispositive power for all of its shares of our common stock. |
| (5) | Includes a total of 3,245,678 shares of Class A Common Stock issuable upon exercise of outstanding warrants, including 1,570,759 shares issuable to Anchorage Illiquid Opportunities V, L.P. and 1,674,919 shares issuable to AIO V AIV 3 Holdings, L.P., and a total of 4,782,607 shares of Class A Common Stock issuable upon conversion of shares of Series A Preferred Stock, including 2,314,521 shares issuable to Anchorage Illiquid Opportunities V, L.P. and 2,468,086 shares issuable to AIO V AIV 3 Holdings, L.P. Anchorage Capital Group, L.L.C. (“ACG”), an SEC-registered investment advisor, is the investment manager of each of Anchorage Illiquid Opportunities V, L.P. and AIO V AIV 3 Holdings, L.P. ACG’s address is 610 Broadway, 6th Floor, New York, NY 10112. Anchorage Advisors Management, L.L.C. (“AAM”) is the sole managing member of ACG. Mr. Kevin Ulrich is the Chief Executive Officer of ACG and the senior managing member of AAM. ACG, AAM and Mr. Ulrich have indirect voting or investment power with respect to each of Anchorage Illiquid Opportunities V, L.P. and AIO V AIV 3 Holdings, L.P., but each of those entities or natural persons disclaims beneficial ownership in the registrable securities owned by each of Anchorage Illiquid Opportunities V, L.P. and AIO V AIV 3 Holdings, L.P. |
| (6) | Includes 668,174 shares issuable upon conversion of shares of Series A Preferred Stock and 46,846 shares of Common Stock. Geode is a segregated account of Geode Capital Master Fund Ltd and is in the care of |
143
Table of Contents
Index to Financial Statements
| Geode Capital Management LP (“GCM LP”). GCM LP’s address is One Post Office Square, 20th Floor, Boston, MA 02109. GCM LP has the sole voting or investment power with respect to Geode. |
| (7) | Includes: (i) 418,393 shares of Class A common stock, 1,281,208 warrants to purchase Class A common stock and 22,000 shares of Class A common stock issuable upon conversion of Series A Preferred Stock held by Reid S. Buerger, (ii) 418,393 shares of Class A common stock, 1,281,208 warrants to purchase Class A common stock and 22,000 shares of Class A common stock issuable upon conversion of Series A Preferred Stock held by Alan H. Buerger 2003 Trust for Reid S. Buerger (the “Trust”) and (iii) 418,392 shares of Class A common stock, 1,281,208 warrants to purchase Class A common stock and 22,000 shares of Class A common stock issuable upon conversion of Series A Preferred Stock held by 2012 Buerger Family SD LLC (the “LLC”). The address for Mr. Buerger, the Trust and the LLC is 7111 Valley Green Road, Fort Washington, Pennsylvania 19034. |
| (8) | Includes 1,150,979 shares of Class A Common Stock issuable upon exercise of warrants owned by the Reporting Person and 46,435 shares of Class A Common Stock issuable upon conversion of shares of Series A Preferred Stock owned by Mr. Hanna. |
| (9) | Mr. Kovalik is the managing member of KLR Group, which owns 100% of KLR Group Investments, LLC, which is the managing member of KLR Sponsor. KLR Group Investments, LLC is the managing member of KLR Sponsor. Mr. Kovalik may therefore be deemed to be a beneficial owner of the securities owned by KLR Group and KLR Sponsor. |
| (10) | Includes 10,000 shares of Class A Common Stock issuable upon exercise of warrants owned by the Reporting Person. |
| (11) | Includes 9,300 shares of Class A Common Stock issuable upon exercise of warrants owned by the Reporting Person. |
| (12) | Tiffany J. Thom resigned from her position as Chief Financial Officer on June 26, 2017. |
144
Table of Contents
Index to Financial Statements
Citigroup Global Markets Inc. is acting as book-running manager of the offering and as representative of the underwriters named below. Subject to the terms and conditions stated in the underwriting agreement dated the date of this prospectus, each underwriter named below has severally agreed to purchase, and we have agreed to sell to that underwriter, the number of shares set forth opposite the underwriter’s name.
| Underwriter |
Number of Shares |
|||
| Citigroup Global Markets Inc. |
||||
|
|
|
|||
| Total |
||||
|
|
|
|||
The underwriting agreement provides that the obligations of the underwriters to purchase the shares included in this offering are subject to approval of legal matters by counsel and to other conditions. The underwriters are obligated to purchase all the shares (other than those covered by the underwriters’ option to purchase additional shares described below) if they purchase any of the shares.
Shares sold by the underwriters to the public will initially be offered at the public offering price set forth on the cover of this prospectus. Any shares sold by the underwriters to securities dealers may be sold at a discount from the public offering price not to exceed $ per share. If all the shares are not sold at the initial offering price, the underwriters may change the offering price and the other selling terms.
If the underwriters sell more shares than the total number set forth in the table above, we have granted to the underwriters an option, exercisable for 30 days from the date of this prospectus, to purchase up to additional shares at the public offering price less the underwriting discount. To the extent the option is exercised, each underwriter must purchase a number of additional shares approximately proportionate to that underwriter’s initial purchase commitment. Any shares issued or sold under the option will be issued and sold on the same terms and conditions as the other shares that are the subject of this offering.
We, our officers and directors, and certain of our stockholders have agreed that, for a period of days from the date of this prospectus, we and they will not, without the prior written consent of Citigroup Global Markets Inc., dispose of or hedge any shares or any securities convertible into or exchangeable for our Class A Common Stock. Citigroup Global Markets Inc. in its sole discretion may release any of the securities subject to these lock-up agreements at any time without notice.
The shares of Class A Common Stock are listed on the Nasdaq Capital Market under the symbol “ROSE.”
The following table shows the underwriting discounts and commissions that we are to pay to the underwriters in connection with this offering. These amounts are shown assuming both no exercise and full exercise of the underwriters’ over-allotment option.
| Paid by Rosehill | ||||||||
| No Exercise | Full Exercise | |||||||
| Per share |
$ | $ | ||||||
| Total |
$ | $ | ||||||
We estimate that our portion of the total expenses of this offering will be $ .
In connection with the offering, the underwriters may purchase and sell shares in the open market. Purchases and sales in the open market may include short sales, purchases to cover short positions, which may include purchases pursuant to the underwriters’ option to purchase additional shares, and stabilizing purchases.
| • | Short sales involve secondary market sales by the underwriters of a greater number of shares than they are required to purchase in the offering. |
145
Table of Contents
Index to Financial Statements
| • | “Covered” short sales are sales of shares in an amount up to the number of shares represented by the underwriters’ option to purchase additional shares. |
| • | “Naked” short sales are sales of shares in an amount in excess of the number of shares represented by the underwriters’ option to purchase additional shares. |
| • | Covering transactions involve purchases of shares either pursuant to the underwriters’ option to purchase additional shares or in the open market in order to cover short positions. |
| • | To close a naked short position, the underwriters must purchase shares in the open market. A naked short position is more likely to be created if the underwriters are concerned that there may be downward pressure on the price of the shares in the open market after pricing that could adversely affect investors who purchase in the offering. |
| • | To close a covered short position, the underwriters must purchase shares in the open market or must exercise the option to purchase additional shares. In determining the source of shares to close the covered short position, the underwriters will consider, among other things, the price of shares available for purchase in the open market as compared to the price at which they may purchase shares through the underwriters’ option to purchase additional shares. |
| • | Stabilizing transactions involve bids to purchase shares so long as the stabilizing bids do not exceed a specified maximum. |
Purchases to cover short positions and stabilizing purchases, as well as other purchases by the underwriters for their own accounts, may have the effect of preventing or retarding a decline in the market price of the shares. They may also cause the price of the shares to be higher than the price that would otherwise exist in the open market in the absence of these transactions. The underwriters may conduct these transactions on the Nasdaq Capital Market, in the over-the-counter market or otherwise. If the underwriters commence any of these transactions, they may discontinue them at any time.
In addition, in connection with this offering, some of the underwriters (and selling group members) may engage in passive market making transactions in the shares on the Nasdaq Capital Market, prior to the pricing and completion of the offering. Passive market making consists of displaying bids on the Nasdaq Capital Market no higher than the bid prices of independent market makers and making purchases at prices no higher than those independent bids and effected in response to order flow. Net purchases by a passive market maker on each day are limited to a specified percentage of the passive market maker’s average daily trading volume in the shares during a specified period and must be discontinued when that limit is reached. Passive market making may cause the price of the shares to be higher than the price that otherwise would exist in the open market in the absence of those transactions. If the underwriters commence passive market making transactions, they may discontinue them at any time.
Conflicts of Interest
The underwriters are full-service financial institutions engaged in various activities, which may include securities trading, commercial and investment banking, financial advisory, investment management, principal investment, hedging, financing and brokerage activities. The underwriters and their respective affiliates have in the past performed commercial banking, investment banking and advisory services for us from time to time for which they have received customary fees and reimbursement of expenses and may, from time to time, engage in transactions with and perform services for us in the ordinary course of their business for which they may receive customary fees and reimbursement of expenses. In the ordinary course of their various business activities, the underwriters and their respective affiliates may make or hold a broad array of investments and actively trade debt and equity securities (or related derivative securities) and financial instruments (which may include bank loans and/or credit default swaps) for their own account and for the accounts of their customers and may at any time hold long and short positions in such securities and instruments. Such investments and securities activities may
146
Table of Contents
Index to Financial Statements
involve securities and/or instruments of ours or our affiliates. The underwriters and their affiliates may also make investment recommendations and/or publish or express independent research views in respect of such securities or financial instruments and may hold, or recommend to clients that they acquire, long and/or short positions in such securities and instruments.
We have agreed to indemnify the underwriters against certain liabilities, including liabilities under the Securities Act, or to contribute to payments the underwriters may be required to make because of any of those liabilities.
Notice to Prospective Investors in the European Economic Area
In relation to each member state of the European Economic Area that has implemented the Prospectus Directive (each, a relevant member state), with effect from and including the date on which the Prospectus Directive is implemented in that relevant member state (the relevant implementation date), an offer of shares described in this prospectus may not be made to the public in that relevant member state other than:
| • | to any legal entity which is a qualified investor as defined in the Prospectus Directive; |
| • | to fewer than 100 or, if the relevant member state has implemented the relevant provision of the 2010 PD Amending Directive, 150 natural or legal persons (other than qualified investors as defined in the Prospectus Directive), as permitted under the Prospectus Directive, subject to obtaining the prior consent of the relevant Dealer or Dealers nominated by us for any such offer; or |
| • | in any other circumstances falling within Article 3(2) of the Prospectus Directive, |
provided that no such offer of shares shall require us or any underwriter to publish a prospectus pursuant to Article 3 of the Prospectus Directive.
For purposes of this provision, the expression an “offer of securities to the public” in any relevant member state means the communication in any form and by any means of sufficient information on the terms of the offer and the shares to be offered so as to enable an investor to decide to purchase or subscribe for the shares, as the expression may be varied in that member state by any measure implementing the Prospectus Directive in that member state, and the expression “Prospectus Directive” means Directive 2003/71/EC (and amendments thereto, including the 2010 PD Amending Directive, to the extent implemented in the relevant member state) and includes any relevant implementing measure in the relevant member state. The expression 2010 PD Amending Directive means Directive 2010/73/EU.
The sellers of the shares have not authorized and do not authorize the making of any offer of shares through any financial intermediary on their behalf, other than offers made by the underwriters with a view to the final placement of the shares as contemplated in this prospectus. Accordingly, no purchaser of the shares, other than the underwriters, is authorized to make any further offer of the shares on behalf of the sellers or the underwriters.
Notice to Prospective Investors in the United Kingdom
This prospectus is only being distributed to, and is only directed at, persons in the United Kingdom that are qualified investors within the meaning of Article 2(1)(e) of the Prospectus Directive that are also (i) investment professionals falling within Article 19(5) of the Financial Services and Markets Act 2000 (Financial Promotion) Order 2005 (the “Order”) or (ii) high net worth entities, and other persons to whom it may lawfully be communicated, falling within Article 49(2)(a) to (d) of the Order (each such person being referred to as a “relevant person”). This prospectus and its contents are confidential and should not be distributed, published or reproduced (in whole or in part) or disclosed by recipients to any other persons in the United Kingdom. Any person in the United Kingdom that is not a relevant person should not act or rely on this document or any of its contents.
147
Table of Contents
Index to Financial Statements
Notice to Prospective Investors in France
Neither this prospectus nor any other offering material relating to the shares described in this prospectus has been submitted to the clearance procedures of the Autorité des Marchés Financiers or of the competent authority of another member state of the European Economic Area and notified to the Autorité des Marchés Financiers. The shares have not been offered or sold and will not be offered or sold, directly or indirectly, to the public in France. Neither this prospectus nor any other offering material relating to the shares has been or will be:
| • | released, issued, distributed or caused to be released, issued or distributed to the public in France; or |
| • | used in connection with any offer for subscription or sale of the shares to the public in France. |
Such offers, sales and distributions will be made in France only:
| • | to qualified investors (investisseurs qualifiés) and/or to a restricted circle of investors (cercle restreint d’investisseurs), in each case investing for their own account, all as defined in, and in accordance with articles L.411-2, D.411-1, D.411-2, D.734-1, D.744-1, D.754-1 and D.764-1 of the French Code monétaire et financier; |
| • | to investment services providers authorized to engage in portfolio management on behalf of third parties; or |
| • | in a transaction that, in accordance with article L.411-2-II-1° -or-2° -or 3° of the French Code monétaire et financier and article 211-2 of the General Regulations (Règlement Général) of the Autorité des Marchés Financiers, does not constitute a public offer (appel public à l’épargne). |
The shares may be resold directly or indirectly, only in compliance with articles L.411-1, L.411-2, L.412-1 and L.621-8 through L.621-8-3 of the French Code monétaire et financier.
Notice to Prospective Investors in Hong Kong
The shares may not be offered or sold in Hong Kong by means of any document other than (i) in circumstances which do not constitute an offer to the public within the meaning of the Companies Ordinance (Cap. 32, Laws of Hong Kong), or (ii) to “professional investors” within the meaning of the Securities and Futures Ordinance (Cap. 571, Laws of Hong Kong) and any rules made thereunder, or (iii) in other circumstances which do not result in the document being a “prospectus” within the meaning of the Companies Ordinance (Cap. 32, Laws of Hong Kong) and no advertisement, invitation or document relating to the shares may be issued or may be in the possession of any person for the purpose of issue (in each case whether in Hong Kong or elsewhere), which is directed at, or the contents of which are likely to be accessed or read by, the public in Hong Kong (except if permitted to do so under the laws of Hong Kong) other than with respect to shares which are or are intended to be disposed of only to persons outside Hong Kong or only to “professional investors” within the meaning of the Securities and Futures Ordinance (Cap. 571, Laws of Hong Kong) and any rules made thereunder.
Notice to Prospective Investors in Japan
The shares offered in this prospectus have not been and will not be registered under the Financial Instruments and Exchange Law of Japan. The shares have not been offered or sold and will not be offered or sold, directly or indirectly, in Japan or to or for the account of any resident of Japan (including any corporation or other entity organized under the laws of Japan), except (i) pursuant to an exemption from the registration requirements of the Financial Instruments and Exchange Law and (ii) in compliance with any other applicable requirements of Japanese law.
Notice to Prospective Investors in Singapore
This prospectus has not been registered as a prospectus with the Monetary Authority of Singapore. Accordingly, this prospectus and any other document or material in connection with the offer or sale, or
148
Table of Contents
Index to Financial Statements
invitation for subscription or purchase, of the shares may not be circulated or distributed, nor may the shares be offered or sold, or be made the subject of an invitation for subscription or purchase, whether directly or indirectly, to persons in Singapore other than (i) to an institutional investor under Section 274 of the Securities and Futures Act, Chapter 289 of Singapore (the “SFA”), (ii) to a relevant person pursuant to Section 275(1), or any person pursuant to Section 275(1A), and in accordance with the conditions specified in Section 275 of the SFA or (iii) otherwise pursuant to, and in accordance with the conditions of, any other applicable provision of the SFA, in each case subject to compliance with conditions set forth in the SFA.
Where the shares are subscribed or purchased under Section 275 of the SFA by a relevant person which is:
| • | a corporation (which is not an accredited investor (as defined in Section 4A of the SFA)) the sole business of which is to hold investments and the entire share capital of which is owned by one or more individuals, each of whom is an accredited investor; or |
| • | a trust (where the trustee is not an accredited investor) whose sole purpose is to hold investments and each beneficiary of the trust is an individual who is an accredited investor, |
shares, debentures and units of shares and debentures of that corporation or the beneficiaries’ rights and interest (howsoever described) in that trust shall not be transferred within six months after that corporation or that trust has acquired the shares pursuant to an offer made under Section 275 of the SFA except:
| • | to an institutional investor (for corporations, under Section 274 of the SFA) or to a relevant person defined in Section 275(2) of the SFA, or to any person pursuant to an offer that is made on terms that such shares, debentures and units of shares and debentures of that corporation or such rights and interest in that trust are acquired at a consideration of not less than S$200,000 (or its equivalent in a foreign currency) for each transaction, whether such amount is to be paid for in cash or by exchange of securities or other assets, and further for corporations, in accordance with the conditions specified in Section 275 of the SFA; |
| • | where no consideration is or will be given for the transfer; or |
| • | where the transfer is by operation of law. |
149
Table of Contents
Index to Financial Statements
The following description of our capital stock summarizes the material terms and provisions of our capital stock. It may not contain all the information that is important to you. For the complete terms of our capital stock, please refer to our amended and restated certificate of incorporation, amendment to certificate of incorporation, and our bylaws, which are attached as exhibits to the registration statement of which this prospectus forms a part. The Delaware General Corporation Law may also affect the terms of our capital stock.
We have authorized 95,000,000 shares of Class A Common Stock, $0.0001 par value per share, 30,000,000 shares of Class B Common Stock, $0.0001 par value per share and 1,000,000 shares of preferred stock, par value $0.0001 per share, 150,000 shares of which are designated as Series A Preferred Stock and 210,000 shares are designated as Series B Preferred Stock. There are (a) 10 holders of record of Class A Common Stock and 6,116,635 shares of Class A Common Stock outstanding; (b) 1 holder of record of Class B Common Stock and 29,807,692 shares of Class B Common Stock outstanding; (c) 6 holders of record of Series A Preferred Stock and 98,298 shares of Series A Preferred Stock outstanding; (d) 3 holders of record of Series B Preferred Stock and 150,626 shares of Series B Preferred Stock outstanding and (e) 9 holders of the our warrants and 25,594,158 warrants outstanding. The number of shares of Class A Common Stock and Warrants outstanding include 14,179 outstanding units, each consisting of one share of Class A Common Stock and one warrant.
Prior to the consummation of this offering, we plan to convene a special meeting of holders of our Class A Common Stock and Class B Common Stock for the purpose of seeking stockholder approval to increase the number of our authorized shares of Class A Common Stock from 95,000,000 shares to 250,000,000 shares. Under applicable Delaware law and the provisions of our amended and restated certificate of incorporation, such an increase will require the approval of the holders of a majority of our issued and outstanding shares of common stock. It is necessary for us to increase the number of authorized shares of Class A Common Stock under our amended and restated certificate of incorporation in order to ensure that there is a sufficient number of authorized shares of Class A Common Stock to undertake this offering.
Common Stock
Holders of our Class A Common Stock are entitled to one vote for each share held on all matters to be voted on by our stockholders. Holders of the Class A Common Stock and holders of the Class B Common voting together as a single class, have the exclusive right to vote for the election of directors and on all other matters properly submitted to a vote of the stockholders. There is no cumulative voting with respect to the election of directors, with the result that the holders of more than 50% of the shares voted for the election of directors can elect all of the directors.
Subject to the rights, if any, of the holders of any outstanding series of the preferred stock, the holders of shares of our common stock (other than holders of shares of Class B Common Stock) are entitled to receive such dividends and other distributions (payable in cash, property or capital stock of the Company) when, as and if declared thereon by the board of directors from time to time out of any assets or funds of the Company and will share equally on a per share basis in such dividends and distributions.
Subject to the rights, if any, of the holders of any outstanding series of the preferred stock, in the event of any voluntary or involuntary liquidation, dissolution or winding up of the Company, after payment or provision for payment of the debts and other liabilities of the Company, the holders of shares of common stock (other than holders of shares of Class B Common Stock) shall be entitled to receive all the remaining assets of the Company available for distribution to its stockholders, ratably in proportion to the number of shares of common stock (other than shares of Class B Common Stock) held by them. The holders of our common stock have no preemptive or other subscription rights and there are no sinking fund or redemption provisions applicable to our common stock.
150
Table of Contents
Index to Financial Statements
Class B Common Stock
In connection with the Transaction, the Company issued 29,807,692 shares of Class B Common Stock with a par value of $0.0001 per share. Shares of Class B Common Stock may be issued only to Tema, their respective successors and assigns, as well as any permitted transferees of Tema. A holder of Class B Common Stock may transfer shares of Class B Common Stock to any transferee (other than the Company) only if, and only to the extent permitted by the Second Amended LLC Agreement, such holder also simultaneously transfers an equal number of such holder’s Rosehill Operating Common Units to such transferee in compliance with the Second Amended LLC Agreement. Holders of our Class B Common Stock will vote together as a single class with holders of our Class A Common Stock on all matters properly submitted to a vote of the stockholders. In addition, the holders of Class B Common Stock, voting as a separate class, will be entitled to approve any amendment, alteration or repeal of any provision of our certificate of incorporation that would alter or change the powers, preferences or relative, participating, optional or other or special rights of the Class B Common Stock. Holders of Class B Common Stock will not be entitled to any dividends from the Company and will not be entitled to receive any of our assets in the event of any voluntary or involuntary liquidation, dissolution or winding up of our affairs.
Tema generally has the right to cause Rosehill Operating to redeem all or a portion of its Rosehill Operating Common Units in exchange for shares of our Class A Common Stock or, at Rosehill Operating’s option, an equivalent amount of cash; provided that we may, at our option, effect a direct exchange of cash or Class A Common Stock for such Rosehill Operating Common Units in lieu of such a redemption. Upon the future redemption or exchange of Rosehill Operating Common Units held by Tema, a corresponding number of shares of Class B Common Stock will be cancelled. Our certificate of incorporation requires us to maintain a one-to-one ratio between the number of outstanding shares of our Class B Common Stock and the number of Rosehill Operating Common Units owned by Tema. This construct is intended to result in Tema having a voting interest in the Company that is identical to Tema’s percentage economic interest in Rosehill Operating.
Preferred Stock
Our amended and restated certificate of incorporation provides that shares of preferred stock may be issued from time to time in one or more series. Our board of directors is authorized to fix the voting rights, if any, designations, powers, preferences, the relative, participating, optional or other special rights and any qualifications, limitations and restrictions thereof, applicable to the shares of each series. Our board of directors is able to, without stockholder approval, issue preferred stock with voting and other rights that could adversely affect the voting power and other rights of the holders of the common stock and could have anti-takeover effects. The ability of our board of directors to issue preferred stock without stockholder approval could have the effect of delaying, deferring or preventing a change of control of us or the removal of existing management.
8.000% Series A Cumulative Perpetual Preferred Stock
At the closing of the Transaction, we issued 75,000 shares of Series A Preferred Stock pursuant to the PIPE Investment and 20,000 shares of Series A Preferred Stock pursuant to the Side Letter. Pursuant to the Certificate of Designation for the Series A Preferred Stock filed with the Secretary of State of the State of Delaware on April 27, 2017, holders of Series A Preferred Stock are entitled to receive, when, as and if declared by our board of directors, cumulative dividends, payable in cash, Series A Preferred Stock, or a combination thereof, in each case, at the sole discretion of the Company, at an annual rate of 8% on the $1,000 liquidation preference per share of the Series A Preferred Stock, payable quarterly in arrears on January 15, April 15, July 15 and October 15 of each year.
The Series A Preferred Stock ranks senior to our common stock and on parity with our Series B Preferred Stock with respect to the payment of dividends and distribution of assets upon liquidation, dissolution or winding up. Each share of Series A Preferred Stock is convertible, at the holder’s option at any time, initially into 86.9565
151
Table of Contents
Index to Financial Statements
shares of our Class A Common Stock (which is equivalent to an initial conversion price of approximately $11.50 per share of Class A Common Stock), subject to specified adjustments and limitations as set forth in the Certificate of Designation for the Series A Preferred Stock. Under certain circumstances, we will increase the conversion rate upon a “fundamental change” as described in the Certificate of Designation for the Series A Preferred Stock. Based on the initial conversion rate, 8,260,868 shares of our Class A Common Stock would be issuable upon conversion of all of the Series A Preferred Stock.
At any time on or after the second anniversary of the closing date of the Transaction, we may, at our option, give notice of our election to cause all outstanding shares of Series A Preferred Stock to be automatically converted into shares of our Class A Common Stock at the conversion rate, if the closing sale price of our Class A Common Stock equals or exceeds 120% of the conversion price for at least 20 trading days in a period of 30 consecutive trading days, as described in the Certificate of Designation for the Series A Preferred Stock. However, in any 30-day period, we may not convert a number of shares of Series A Preferred Stock in excess of the number of shares of Series A Preferred Stock which would convert into 15% of the number of shares of Class A Common Stock traded on NASDAQ in the preceding calendar month.
Except as required by law or our amended and restated certificate of incorporation, which includes the Certificate of Designation for the Series A Preferred Stock, the holders of Series A Preferred Stock have no voting rights (other than with respect to certain matters regarding the Series A Preferred Stock or when dividends payable on the Series A Preferred Stock have not been paid for an aggregate of six or more quarterly dividend periods, whether or not consecutive, as provided in the Certificate of Designation for the Series A Preferred Stock).
Upon our voluntary or involuntary liquidation, winding-up or dissolution, each holder of Series A Preferred Stock will be entitled to receive a liquidation preference in the amount of $1,000 per share of Series A Preferred Stock, plus an amount equal to accrued and unpaid dividends on the shares to but excluding the date fixed for liquidation, winding-up or dissolution, to be paid out of our assets legally available for distribution to our stockholders, after satisfaction of liabilities to our creditors and distributions to holders of shares of senior stock and before any payment or distribution is made to holders of junior stock (including our Class A Common Stock).
10.000% Series B Redeemable Preferred Stock
In connection with the White Wolf Acquisition, we issued 150,000 shares of Series B Preferred Stock pursuant that certain Series B Redeemable Preferred Stock Purchase Agreement (the “Series B Preferred Stock Purchase Agreement”) among the Company and certain private funds and accounts managed by EIG Global Energy Partners, LLC (collectively, the “Series B Preferred Stock Purchasers”). Pursuant to that certain Certificate of Designation for the Series B Preferred Stock (the “Certificate of Designation for the Series B Preferred Stock”) filed with the Secretary of State of the State of Delaware on December 8, 2017, holders of Series B Preferred Stock are entitled to receive, when, as and if declared by our board of directors, cumulative dividends, payable in cash at an annual rate of 10% on the $1,000 liquidation preference per share of the Series B Preferred Stock, payable quarterly in arrears on January 15, April 15, July 15 and October 15 of each year. With respect to dividends declared for any quarter ending on or prior to January 15, 2019, our board of directors may elect to pay as dividends additional shares of Series B Preferred Stock in kind (the “Series B PIK Shares”) in an amount up to 40% of that which would have been payable had the dividends been fully paid in cash.
The Series B Preferred Stock ranks senior to our common stock and on parity with our Series A Preferred Stock with respect to the payment of dividends and distribution of assets upon liquidation, dissolution or winding up. The shares of Series B Preferred Stock are redeemable by us: (a) in full, upon a Change of Control (as defined in the Certificate of Designations for the Series B Preferred Stock), (b) in whole or in part, at the election of the holders on or after December 8, 2023, or at any time if we are not current on the dividends payable to the
152
Table of Contents
Index to Financial Statements
holders of Series B Preferred Stock for a period of nine consecutive months or (c) in whole or in part, at any time at our option, in each case, for a base return amount (the “Base Return Amount”), which is an amount of cash:
| • | with respect to the Series B PIK Shares, in aggregate equal to (i) $1,000 for each Series B PIK Share plus (ii) the value of all accrued and unpaid dividends in respect of such Series B PIK Shares; |
| • | with respect to the Series B Preferred Stock (excluding the Series B PIK Shares), in aggregate equal to (i) the product of (A) the number of outstanding shares of Series B Preferred Stock (excluding any Series B PIK Shares) multiplied by (B) for each such share of Series B Preferred Stock, (1) prior to the first anniversary of the date of issuance of such share of Series B Preferred Stock, $1,250, (2) on or after the first anniversary and prior to the second anniversary of the date of issuance of such share of Series B Preferred Stock, $1,350 and (3) on or after the second anniversary of the date of issuance of such share of Series B Preferred Stock, the greater of (x) $1,500 and (y) an amount necessary to achieve a 16.0% IRR (as defined in the Certificate of Designations for the Series B Preferred Stock) with respect to such share of Series B Preferred Stock, plus (ii) the amount of all accrued but unpaid dividends in respect of such shares of Series B Preferred Stock, minus (iii) all dividends paid at the normal dividend rate on shares of Series B Preferred Stock (including Series B PIK Shares) minus (iv) $4.0 million; and |
| • | with respect to the Series B Preferred Stock (excluding the Series B PIK Shares) on a per share basis, equal to the quotient of (i) the aggregate amount calculated with respect to the Series B Preferred Stock (excluding the Series B PIK Shares) above divided by (ii) the number of outstanding shares of Series B Preferred Stock (excluding any Series B PIK Shares). |
If we fail to pay dividends in any quarter, the dividend rate will increase to 12% per annum on the $1,000 liquidation preference per share of Series B Preferred Stock until such dividends are paid in full. In addition, if we fail to pay dividends for three out of four consecutive quarters or for six quarters (whether or not consecutive), then a representative appointed by the holders of a majority of the outstanding shares of Series B Preferred Stock shall have the right to appoint one director to the board of directors, and we will be required to seek the approval of such representative for certain corporate actions, in each case, until three months following the date on which such dividends are paid in full.
If we fail to timely and fully redeem the shares of Series B Preferred Stock required to be redeemed upon a Change of Control or upon the request of the holders as provided above, then (A) the dividend rate will increase to 14% per annum on the $1,000 liquidation preference per share of Series B Preferred Stock, (B) a representative of the holders of Series B Preferred Stock will have the right to appoint one director to the board of directors, and (C) we will be required to seek the approval of such representative for certain corporate actions, in each case, until the shares of Series B Preferred Stock required to be redeemed are redeemed.
Except as required by law or our amended and restated certificate of incorporation, which includes the Certificate of Designation for the Series B Preferred Stock, the holders of Series B Preferred Stock have no voting rights and have limited consent rights with respect to our ability to take certain corporate actions, including:
| • | the issuance, authorization or creation of any class or series of stock senior to or on parity with the Series B Preferred Stock; |
| • | the incurrence of additional indebtedness, provided that such indebtedness may be incurred if, after giving pro forma effect to the incurrence and any application of the proceeds thereof, we maintain a Leverage Ratio (as defined in the Certificate of Designations for the Series B Preferred Stock) of less than 4.00 to 1.00; |
| • | the issuance or incurrence of high-yield debt, unless the debt (A) does not have an all-in interest rate together with any component of yield greater than the Second Lien Notes and a make-whole provision less favorable than the Second Lien Notes and (B) is used to refinance the Second Lien Notes; |
153
Table of Contents
Index to Financial Statements
| • | the entry into any joint venture agreement or issuance of equity securities of our subsidiaries, other than to us or our wholly-owned subsidiaries; |
| • | sales of certain property having a fair market value greater than $15.0 million in any fiscal year and $40.0 million in the aggregate; and |
| • | certain property acquisitions or investments in excess of $15.0 million in any fiscal year and $40.0 million in the aggregate, unless such acquisitions or investments are financed solely using our common equity (or cash proceeds of the issuance of our common equity). |
For as long as the Series B Preferred Stock Purchasers and their affiliates collectively beneficially own more than 25% of the outstanding shares of Series B Preferred Stock, such Series B Preferred Stock Purchasers and their affiliates will be entitled to designate one person to attend all meetings of the board of directors or committees thereof (the “Board Observer”). The Board Observer will not be a member of the board of directors, and will not have voting rights with respect to any action brought before the board of directors or any committees thereof.
Upon our voluntary or involuntary liquidation, winding-up or dissolution, each holder of Series B Preferred Stock will be entitled to receive the Base Return Amount plus accrued and unpaid dividends.
Warrants
Each of our warrants entitles the registered holder to purchase one share of our Class A Common Stock at a price of $11.50 per share, subject to adjustment as discussed below, at any time commencing 30 days after the completion of the Transaction. The warrants will expire five years after the completion of the business combination, at 5:00 p.m., New York City time, or earlier upon redemption or liquidation.
No warrant will be exercisable for cash or on a cashless basis, and we will not be obligated to issue any shares to holders seeking to exercise their warrants, unless the issuance of the shares upon such exercise is registered or qualified under the securities laws of the state of the exercising holder, unless an exemption is available. In the event that the conditions in the immediately preceding sentence are not satisfied with respect to a warrant, the holder of such warrant will not be entitled to exercise such warrant and such warrant may have no value and expire worthless, in which case, the purchaser of a unit containing such warrant will have paid the full purchase price for the unit solely for the share of Class A Common Stock underlying such unit.
On May 5, 2017, we filed a registration statement for the registration of the shares of Class A Common Stock issuable upon exercise of the warrants. The registration statement became effective on June 19, 2017. We will use our best efforts to maintain the effectiveness of such registration statement, and a current prospectus relating thereto, until the expiration of the warrants in accordance with the provisions of the warrant agreement. Notwithstanding the foregoing, public warrant holders may, during any period when we shall have failed to maintain an effective registration statement, exercise warrants on a cashless basis pursuant to an available exemption from registration under the Securities Act. In such event, each holder would pay the exercise price by surrendering the warrants for that number of shares of Class A Common Stock equal to the quotient obtained by dividing (x) the product of the number of shares of Class A Common Stock underlying the warrants, multiplied by the difference between the exercise price of the warrants and the “fair market value” (defined below) by (y) the fair market value. The “fair market value” shall mean the average reported last sale price of the shares of Class A Common Stock for the 10 trading days ending on the day prior to the date of exercise. If an exemption from registration is not available, holders will not be able to exercise their warrants on a cashless basis.
Once the warrants become exercisable, the Company may call the warrants for redemption:
| • | in whole and not in part; |
| • | at a price of $0.01 per warrant; |
154
Table of Contents
Index to Financial Statements
| • | not less than 30 days’ prior written notice of redemption (the “30-day redemption period”) to each warrant holder; and |
| • | if, and only if, the reported last sale price of the Class A Common Stock equals or exceeds $21.00 per share for any 20 trading days within a 30-trading day period ending on the third trading day prior to the date we send the notice of redemption to the warrant holders; provided there is an effective registration statement with respect to the shares of Class A Common Stock underlying such warrants and a current prospectus relating to those shares of Class A Common Stock is available throughout the 30-day redemption period. |
We have established the last of the redemption criterion discussed above to prevent a redemption call unless there is at the time of the call a significant premium to the warrant exercise price. If the foregoing conditions are satisfied and we issue a notice of redemption of the warrants, each warrant holder will be entitled to exercise his, her or its warrant prior to the scheduled redemption date. However, the price of the Class A Common Stock may fall below the $21.00 redemption trigger price as well as the $11.50 warrant exercise price after the redemption notice is issued.
If we call the warrants for redemption as described above, our management will have the option to require any holder that wishes to exercise his, her or its warrants to do so on a “cashless basis.” In determining whether to require all holders to exercise their warrants on a “cashless basis,” our management will consider, among other factors, our cash position, the number of warrants that are outstanding and the dilutive effect on our stockholders of issuing the maximum number of shares of Class A Common Stock issuable upon the exercise of our warrants. If our management takes advantage of this option, all holders of warrants would pay the exercise price by surrendering their warrants for that number of shares of Class A Common Stock equal to the quotient obtained by dividing (x) the product of the number of shares of Class A Common Stock underlying the warrants, multiplied by the difference between the exercise price of the warrants and the “fair market value” (defined below) by (y) the fair market value. The “fair market value” shall mean the average reported last sale price of the Class A Common Stock for the 10 trading days ending on the third trading day prior to the date on which the notice of redemption is sent to the holders of warrants. If our management takes advantage of this option, the notice of redemption will contain the information necessary to calculate the number of shares of Class A Common Stock to be received upon exercise of the warrants, including the “fair market value” in such case. Requiring a cashless exercise in this manner will reduce the number of shares to be issued and thereby lessen the dilutive effect of a warrant redemption. If we call our warrants for redemption and our management does not take advantage of this option, KLR Sponsor and its permitted transferees would still be entitled to exercise their private placement warrants for cash or on a cashless basis using the same formula described above that other warrant holders would have been required to use had all warrant holders been required to exercise their warrants on a cashless basis, as described in more detail below.
A holder of a warrant may notify us in writing in the event it elects to be subject to a requirement that such holder will not have the right to exercise such warrant, to the extent that after giving effect to such exercise, such person (together with such person’s affiliates), to the warrant agent’s actual knowledge, would beneficially own in excess of 9.8% (or such other amount as a holder may specify) of the shares of Class A Common Stock outstanding immediately after giving effect to such exercise.
If the number of outstanding shares of Class A Common Stock is increased by a stock dividend payable in shares of Class A Common Stock, or by a split-up of shares of Class A Common Stock or other similar event, then, on the effective date of such stock dividend, split-up or similar event, the number of shares of Class A Common Stock issuable on exercise of each warrant will be increased in proportion to such increase in the outstanding shares of Class A Common Stock. A rights offering to holders of Class A Common Stock entitling holders to purchase shares of Class A Common Stock at a price less than the fair market value will be deemed a stock dividend of a number of shares of Class A Common Stock equal to the product of (i) the number of shares of Class A Common Stock actually sold in such rights offering (or issuable under any other equity securities sold
155
Table of Contents
Index to Financial Statements
in such rights offering that are convertible into or exercisable for Class A Common Stock) multiplied by (ii) one (1) minus the quotient of (x) the price per share of Class A Common Stock paid in such rights offering divided by (y) the fair market value. For these purposes (i) if the rights offering is for securities convertible into or exercisable for Class A Common Stock, in determining the price payable for Class A Common Stock, there will be taken into account any consideration received for such rights, as well as any additional amount payable upon exercise or conversion and (ii) fair market value means the volume weighted average price of Class A Common Stock as reported during the ten (10) trading day period ending on the trading day prior to the first date on which the shares of Class A Common Stock trade on the applicable exchange or in the applicable market, regular way, without the right to receive such rights.
In addition, if we, at any time while the warrants are outstanding and unexpired, pay a dividend or make a distribution in cash, securities or other assets to the holders of Class A Common Stock on account of such shares of Class A Common Stock (or other shares of our capital stock into which the warrants are convertible), other than (a) as described above, or (b) certain ordinary cash dividends, or (c) then the warrant exercise price will be decreased, effective immediately after the effective date of such event, by the amount of cash and/or the fair market value of any securities or other assets paid on each share of Class A Common Stock in respect of such event.
If the number of outstanding shares of our Class A Common Stock is decreased by a consolidation, combination, reverse stock split or reclassification of shares of Class A Common Stock or other similar event, then, on the effective date of such consolidation, combination, reverse stock split, reclassification or similar event, the number of shares of Class A Common Stock issuable on exercise of each warrant will be decreased in proportion to such decrease in outstanding shares of Class A Common Stock.
Whenever the number of shares of Class A Common Stock purchasable upon the exercise of the warrants is adjusted, as described above, the warrant exercise price will be adjusted by multiplying the warrant exercise price immediately prior to such adjustment by a fraction (x) the numerator of which will be the number of shares of Class A Common Stock purchasable upon the exercise of the warrants immediately prior to such adjustment, and (y) the denominator of which will be the number of shares of Class A Common Stock so purchasable immediately thereafter.
In case of any reclassification or reorganization of the outstanding shares of Class A Common Stock (other than those described above or that solely affects the par value of such shares of Class A Common Stock), or in the case of any merger or consolidation of us with or into another corporation (other than a consolidation or merger in which we are the continuing corporation and that does not result in any reclassification or reorganization of our outstanding shares of Class A Common Stock), or in the case of any sale or conveyance to another corporation or entity of our assets or other property as an entirety or substantially as an entirety in connection with which we are dissolved, the holders of the warrants will thereafter have the right to purchase and receive, upon the basis and upon the terms and conditions specified in the warrants and in lieu of the shares of our Class A Common Stock immediately theretofore purchasable and receivable upon the exercise of the rights represented thereby, the kind and amount of shares of stock or other securities or property (including cash) receivable upon such reclassification, reorganization, merger or consolidation, or upon a dissolution following any such sale or transfer, that the holder of the warrants would have received if such holder had exercised their warrants immediately prior to such event. However, if such holders were entitled to exercise a right of election as to the kind or amount of securities, cash or other assets receivable upon such consolidation or merger, then the kind and amount of securities, cash or other assets for which each warrant will become exercisable will be deemed to be the weighted average of the kind and amount received per share by such holders in such consolidation or merger that affirmatively make such election, and if a tender, exchange or redemption offer has been made to and accepted by such holders under circumstances in which, upon completion of such tender or exchange offer, the maker thereof, together with members of any group (within the meaning of Rule 13d-5(b)(1) under the Exchange Act) of which such maker is a part, and together with any affiliate or associate of such maker (within the meaning of Rule 12b-2 under the Exchange Act) and any members of any such group of which any
156
Table of Contents
Index to Financial Statements
such affiliate or associate is a part, own beneficially (within the meaning of Rule 13d-3 under the Exchange Act) more than 50% of the outstanding shares of Class A Common Stock, the holder of a warrant will be entitled to receive the highest amount of cash, securities or other property to which such holder would actually have been entitled as a stockholder if such warrant holder had exercised the warrant prior to the expiration of such tender or exchange offer, accepted such offer and all of the Class A Common Stock held by such holder had been purchased pursuant to such tender or exchange offer, subject to adjustments (from and after the consummation of such tender or exchange offer) as nearly equivalent as possible to the adjustments provided for in the warrant agreement. Additionally, if less than 70% of the consideration receivable by the holders of Class A Common Stock in such a transaction is payable in the form of Class A Common Stock in the successor entity that is listed for trading on a national securities exchange or is quoted in an established over-the-counter market, or is to be so listed for trading or quoted immediately following such event, and if the registered holder of the warrant properly exercises the warrant within thirty days following public disclosure of such transaction, the warrant exercise price will be reduced as specified in the warrant agreement based on the per share consideration minus Black-Scholes Warrant Value (as defined in the warrant agreement) of the warrant.
The warrants may be exercised upon surrender of the warrant certificate on or prior to the expiration date at the offices of the warrant agent, with the exercise form on the reverse side of the warrant certificate completed and executed as indicated, accompanied by full payment of the exercise price (or on a cashless basis, if applicable), by certified or official bank check payable to us, for the number of warrants being exercised. The warrant holders do not have the rights or privileges of holders of Class A Common Stock and any voting rights until they exercise their warrants and receive shares of Class A Common Stock. After the issuance of shares of Class A Common Stock upon exercise of the warrants, each holder will be entitled to one vote for each share held of record on all matters to be voted on by stockholders.
Warrants may be exercised only for a whole number of shares of Class A Common Stock. No fractional shares will be issued upon exercise of the warrants. If, upon exercise of the warrants, a holder would be entitled to receive a fractional interest in a share, we will, upon exercise, round down to the nearest whole number the number of shares of Class A Common Stock to be issued to the warrant holder.
The public warrants were issued in registered form under a warrant agreement between Continental Stock Transfer & Trust Company, as warrant agent, and us. The warrant agreement provides that the terms of the warrants may be amended without the consent of any holder to cure any ambiguity or correct any defective provision, but requires the approval by the holders of at least 65% of the then outstanding public warrants to make any change that adversely affects the interests of the registered holders of public warrants.
Private Placement Warrants
The private placement warrants (including the Class A Common Stock issuable upon exercise of the private placement warrants) are non-redeemable so long as they are held by KLR Sponsor or its permitted transferees. KLR Sponsor agreed to additional transfer restrictions relating to its common stock in connection with its entry into the SHRRA. If the private placement warrants are held by someone other than KLR Sponsor or its permitted transferees, the private placement warrants will be redeemable by the Company and exercisable by such holders on the same basis as the public warrants included in the units being sold in the IPO. Otherwise, the private placement warrants have terms and provisions that are identical to those of the public warrants sold as part of the units issued in the IPO.
If holders of the private placement warrants elect to exercise them on a cashless basis, they will pay the exercise price by surrendering his, her or its warrants for that number of shares of Class A Common Stock equal to the quotient obtained by dividing (x) the product of the number of shares of Class A Common Stock underlying the warrants, multiplied by the difference between the exercise price of the warrants and the “fair market value” (defined below) by (y) the fair market value. The “fair market value” shall mean the average reported last sale price of the Class A Common Stock for the 10 trading days ending on the third trading day
157
Table of Contents
Index to Financial Statements
prior to the date on which the notice of warrant exercise is sent to the warrant agent. The reason that we agreed that these warrants will be exercisable on a cashless basis so long as they are held by KLR Sponsor and permitted transferees is because it was not known at the time whether they will be affiliated with us following a business combination. If they remain affiliated with us, their ability to sell our securities in the open market will be significantly limited. We have policies in place that prohibit insiders from selling our securities except during specific periods of time. Even during such periods of time when insiders will be permitted to sell our securities, an insider cannot trade in our securities if he or she is in possession of material non-public information. Accordingly, unlike public stockholders who could exercise their warrants and sell the shares of Class A Common Stock received upon such exercise freely in the open market in order to recoup the cost of such exercise, the insiders could be significantly restricted from selling such securities.
Warrants Issued in Connection with Transaction
In connection with the closing of the Transaction, we issued 5,000,000 warrants to PIPE Investors and 4,000,000 warrants to Tema. These warrants were issued on the same terms, and are subject to the same rights and obligations, as the public warrants.
Our Transfer Agent and Warrant Agent
The transfer agent for our common stock and warrant agent for our warrants is Continental Stock Transfer & Trust Company. We have agreed to indemnify Continental Stock Transfer & Trust Company in its roles as transfer agent and warrant agent, its agents and each of its stockholders, directors, officers and employees against all liabilities, including judgments, costs and reasonable counsel fees that may arise out of acts performed or omitted for its activities in that capacity, except for any liability due to any gross negligence, willful misconduct or bad faith of the indemnified person or entity.
Certain Anti-Takeover Provisions of Delaware Law, our Amended and Restated Certificate of Incorporation, and our Bylaws
We are currently subject to the provisions of Section 203 of the DGCL, which we refer to as “Section 203”, regulating corporate takeovers.
Section 203 prevents certain Delaware corporations, under certain circumstances, from engaging in a “business combination” with:
| • | a stockholder who owns 15% or more of our outstanding voting stock (otherwise known as an “interested stockholder”); |
| • | an affiliate of an interested stockholder; or |
| • | an associate of an interested stockholder, for three years following the date that the stockholder became an interested stockholder. |
| • | A “business combination” includes a merger or sale of more than 10% of our assets. However, the above provisions of Section 203 do not apply if: |
| • | our board of directors approves the transaction that made the stockholder an “interested stockholder”, prior to the date of the transaction; |
| • | after the completion of the transaction that resulted in the stockholder becoming an interested stockholder, that stockholder owned at least 85% of our voting stock outstanding at the time the transaction commenced, other than statutorily excluded shares of common stock; or |
| • | on or subsequent to the date of the transaction, the business combination is approved by our board of directors and authorized at a meeting of our stockholders, and not by written consent, by an affirmative vote of at least two-thirds of the outstanding voting stock not owned by the interested stockholder. |
158
Table of Contents
Index to Financial Statements
Our amended and restated certificate of incorporation provides that our board of directors is classified into three classes of directors. As a result, in most circumstances, a person can gain control of our board only by successfully engaging in a proxy contest at three or more annual meetings.
Further, our amended and restated certificate of incorporation only allows stockholders to call a special meeting until the first date on which Tema and KLR Sponsor and their successors and affiliates cease collectively to beneficially own (directly or indirectly) more than 30% of the outstanding shares of our common stock (the “Trigger Date”).
The amended and restated certificate of incorporation provides that after the Trigger Date directors may be removed prior to the expiration of their terms by stockholders only for cause or upon the affirmative vote of 75% of the voting power of all outstanding shares of the combined company.
The amended and restated certificate of incorporation requires that changes or amendments to the certificate of incorporation or the bylaws must be approved (i) before the Trigger Date, by a majority of the voting power of our outstanding common stock, which such majority includes at least 80% of the shares held by KLR Sponsor, and (ii) thereafter, certain changes or amendments must be approved by at least 75% of the voting power of our outstanding common stock.
In addition, our amended and restated certificate of incorporation does not provide for cumulative voting in the election of directors; our board of directors is empowered to elect a director to fill a vacancy created by the expansion of the board of directors or the resignation, death, or removal of a director in certain circumstances; and our advance notice procedures require that stockholders must comply with in order to nominate candidates to our board of directors or to propose matters to be acted upon at a stockholders’ meeting.
Our authorized but unissued common stock and preferred stock are available for future issuances without stockholder approval and could be utilized for a variety of corporate purposes, including future offerings to raise additional capital, acquisitions and employee benefit plans. The existence of authorized but unissued and unreserved common stock and preferred stock could render more difficult or discourage an attempt to obtain control of us by means of a proxy contest, tender offer, merger or otherwise.
Listing of Class A Common Stock
Our Class A Common Stock trades on The NASDAQ Capital Market under the symbol “ROSE.” Through April 27, 2017, our Class A Common Stock was listed on The NASDAQ Capital Market under the symbol “KLRE.”
159
Table of Contents
Index to Financial Statements
The following is a summary of certain considerations associated with the acquisition and holding of the Class A Common Stock by employee benefit plans that are subject to Title I of the Employee Retirement Income Security Act of 1974, as amended (“ERISA”), plans, individual retirement accounts and other arrangements that are subject to Section 4975 of the Internal Revenue Code of 1986, as amended (the “Code”) or employee benefit plans that are governmental plans (as defined in Section 3(32) of ERISA), certain church plans (as defined in Section 3(33) of ERISA), non-U.S. plans (as described in Section 4(b)(4) of ERISA) or other plans that are not subject to the foregoing but may be subject to provisions under any other federal, state, local, non-U.S. or other laws or regulations that are similar to such provisions of ERISA or the Internal Revenue Code of 1986, as amended (the “Code”) (collectively, “Similar Laws”), and entities whose underlying assets are considered to include “plan assets” of any such plan, account or arrangement (each, a “Plan”).
This summary is based on the provisions of ERISA and the Code (and related regulations and administrative and judicial interpretations) as of the date of this prospectus. This summary does not purport to be complete, and no assurance can be given that future legislation, court decisions, regulations, rulings or pronouncements will not significantly modify the requirements summarized below. Any of these changes may be retroactive and may thereby apply to transactions entered into prior to the date of their enactment or release. This discussion is general in nature and is not intended to be all inclusive, nor should it be construed as investment or legal advice.
General Fiduciary Matters
ERISA and the Code impose certain duties on persons who are fiduciaries of a Plan subject to Title I of ERISA or Section 4975 of the Code (an “ERISA Plan”) and prohibit certain transactions involving the assets of an ERISA Plan and its fiduciaries or other interested parties. Under ERISA and the Code, any person who exercises any discretionary authority or control over the administration of an ERISA Plan or the management or disposition of the assets of an ERISA Plan, or who renders investment advice for a fee or other compensation to an ERISA Plan, is generally considered to be a fiduciary of the ERISA Plan.
In considering an investment in the Class A Common Stock with a portion of the assets of any Plan, a fiduciary should consider the Plan’s particular circumstances and all of the facts and circumstances of the investment and determine whether the acquisition and holding of the Class A Common Stock is in accordance with the documents and instruments governing the Plan and the applicable provisions of ERISA, the Code, or any Similar Law relating to the fiduciary’s duties to the Plan, including, without limitation:
| • | whether the investment is prudent under Section 404(a)(1)(B) of ERISA and any other applicable Similar Laws; |
| • | whether, in making the investment, the ERISA Plan will satisfy the diversification requirements of Section 404(a)(1)(C) of ERISA and any other applicable Similar Laws; |
| • | whether the investment is permitted under the terms of the applicable documents governing the Plan; |
| • | whether the acquisition or holding of the Class A Common Stock will constitute a “prohibited transaction” under Section 406 of ERISA or Section 4975 of the Code (please see discussion under “—Prohibited Transaction Issues” below); and |
| • | whether the Plan will be considered to hold, as plan assets, (i) only the Class A Common Stock or (ii) an undivided interest in our underlying assets (please see the discussion under “—Plan Asset Issues” below). |
Prohibited Transaction Issues
Section 406 of ERISA and Section 4975 of the Code prohibit ERISA Plans from engaging in specified transactions involving plan assets with persons or entities who are “parties in interest,” within the meaning of
160
Table of Contents
Index to Financial Statements
ERISA, or “disqualified persons,” within the meaning of Section 4975 of the Code, unless an exemption is available. A party in interest or disqualified person who engages in a non-exempt prohibited transaction may be subject to excise taxes and other penalties and liabilities under ERISA and the Code. In addition, the fiduciary of the ERISA Plan that engages in such a non-exempt prohibited transaction may be subject to excise taxes, penalties and liabilities under ERISA and the Code. The acquisition and/or holding of the Class A Common Stock by an ERISA Plan with respect to which the issuer, the initial purchaser, or a guarantor is considered a party in interest or a disqualified person may constitute or result in a direct or indirect prohibited transaction under Section 406 of ERISA and/or Section 4975 of the Code, unless the investment is acquired and is held in accordance with an applicable statutory, class or individual prohibited transaction exemption.
Because of the foregoing, the Class A Common Stock should not be acquired or held by any person investing “plan assets” of any Plan, unless such acquisition and holding will not constitute a non-exempt prohibited transaction under ERISA and the Code or a similar violation of any applicable Similar Laws.
Plan Asset Issues
Additionally, a fiduciary of a Plan should consider whether the Plan will, by investing in us, be deemed to own an undivided interest in our assets, with the result that we would become a fiduciary of the Plan and our operations would be subject to the regulatory restrictions of ERISA, including its prohibited transaction rules, as well as the prohibited transaction rules of the Code and any other applicable Similar Laws.
The Department of Labor (the “DOL”) regulations provide guidance with respect to whether the assets of an entity in which ERISA Plans acquire equity interests would be deemed “plan assets” under some circumstances. Under these regulations, an entity’s assets generally would not be considered to be “plan assets” if, among other things:
(a) the equity interests acquired by ERISA Plans are publicly offered securities i.e., the equity interests are part of a class of securities that is widely held by 100 or more investors independent of the issuer and each other, are “freely transferable” (as defined in the DOL regulations), and are either registered under certain provisions of the federal securities laws or sold to the ERISA Plan as part of a public offering under certain conditions;
(b) the entity is an “operating company” i.e., it is primarily engaged in the production or sale of a product or service, other than the investment of capital, either directly or through a majority-owned subsidiary or subsidiaries; or
(c) there is no significant investment by benefit plan investors, which is defined to mean that immediately after the most recent acquisition by an ERISA Plan of any equity interest in the entity, less than 25% of the total value of each class of equity interest (disregarding certain interests held by persons (other than benefit plan investors) with discretionary authority or control over the assets of the entity or who provide investment advice for a fee (direct or indirect) with respect to such assets, and any affiliates thereof) is held by ERISA Plans, IRAs and certain other Plans (but not including governmental plans, foreign plans and certain church plans), and entities whose underlying assets are deemed to include plan assets by reason of a Plan’s investment in the entity.
Due to the complexity of these rules and the excise taxes, penalties and liabilities that may be imposed upon persons involved in non-exempt prohibited transactions, it is particularly important that fiduciaries, or other persons considering acquiring and/or holding the Class A Common Stock on behalf of, or with the assets of, any Plan, consult with their counsel regarding the potential applicability of ERISA, Section 4975 of the Code and any Similar Laws to such investment and whether an exemption would be applicable to the acquisition and holding of the Class A Common Stock. Purchasers of the Class A Common Stock have the exclusive responsibility for ensuring that their acquisition and holding of the Class A Common Stock complies with the fiduciary responsibility rules of ERISA and does not violate the prohibited transaction rules of ERISA, the Code or applicable Similar Laws. The sale of the Class A Common Stock to a Plan is in no respect a representation by us or any of our affiliates or representatives that such an investment meets all relevant legal requirements with respect to investments by any such Plan or that such investment is appropriate for any such Plan.
161
Table of Contents
Index to Financial Statements
MATERIAL U.S. FEDERAL INCOME TAX CONSIDERATIONS FOR NON-U.S. HOLDERS
The following is a summary of the material U.S. federal income tax considerations related to the purchase, ownership and disposition of our Class A Common Stock by a non-U.S. holder (as defined below), that holds our Class A Common Stock as a “capital asset” (generally property held for investment). This summary is based on the provisions of the Code, U.S. Treasury regulations promulgated thereunder (“Treasury Regulations”), administrative rulings and judicial decisions, all as in effect on the date hereof, and all of which are subject to change, possibly with retroactive effect. We have not sought any ruling from the Internal Revenue Service (“IRS”) with respect to the statements made and the conclusions reached in the following summary, and there can be no assurance that the IRS or a court will agree with such statements and conclusions.
This summary does not address all aspects of U.S. federal income taxation that may be relevant to non-U.S. holders in light of their personal circumstances. In addition, this summary does not address the Medicare tax on certain investment income, U.S. federal estate or gift tax laws, any state, local or non-U.S. tax laws or any tax treaties. This summary also does not address tax considerations applicable to investors that may be subject to special treatment under the U.S. federal income tax laws, such as:
| • | banks, insurance companies or other financial institutions; |
| • | tax-exempt or governmental organizations; |
| • | qualified foreign pension funds (or any entities all of the interests of which are held by a qualified foreign pension fund); |
| • | dealers in securities or foreign currencies; |
| • | persons whose functional currency is not the U.S. dollar; |
| • | “controlled foreign corporations,” “passive foreign investment companies,” and corporations that accumulate earnings to avoid U.S. federal income tax; |
| • | traders in securities that use the mark-to-market method of accounting for U.S. federal income tax purposes; |
| • | persons subject to the alternative minimum tax; |
| • | partnerships or other pass-through entities for U.S. federal income tax purposes or holders of interests therein; |
| • | persons deemed to sell our Class A Common Stock under the constructive sale provisions of the Code; |
| • | persons that acquired our Class A Common Stock through the exercise of employee stock options or otherwise as compensation or through a tax-qualified retirement plan; |
| • | certain former citizens or long-term residents of the United States; and |
| • | persons that hold our Class A Common Stock as part of a straddle, appreciated financial position, synthetic security, hedge, conversion transaction or other integrated investment or risk reduction transaction. |
PROSPECTIVE INVESTORS ARE ENCOURAGED TO CONSULT THEIR TAX ADVISORS WITH RESPECT TO THE APPLICATION OF THE U.S. FEDERAL INCOME TAX LAWS TO THEIR PARTICULAR SITUATION, AS WELL AS ANY TAX CONSEQUENCES OF THE PURCHASE, OWNERSHIP AND DISPOSITION OF OUR CLASS A COMMON STOCK ARISING UNDER THE U.S. FEDERAL ESTATE OR GIFT TAX LAWS OR UNDER THE LAWS OF ANY STATE, LOCAL, NON-U.S. OR OTHER TAXING JURISDICTION OR UNDER ANY APPLICABLE INCOME TAX TREATY.
162
Table of Contents
Index to Financial Statements
Non-U.S. Holder Defined
For purposes of this discussion, a “non-U.S. holder” is a beneficial owner of our Class A Common Stock that is not for U.S. federal income tax purposes a partnership or any of the following:
| • | an individual who is a citizen or resident of the United States; |
| • | a corporation (or other entity taxable as a corporation for U.S. federal income tax purposes) created or organized in or under the laws of the United States, any state thereof or the District of Columbia; |
| • | an estate the income of which is subject to U.S. federal income tax regardless of its source; or |
| • | a trust (i) the administration of which is subject to the primary supervision of a U.S. court and which has one or more United States persons who have the authority to control all substantial decisions of the trust or (ii) which has made a valid election under applicable Treasury Regulations to be treated as a United States person. |
If a partnership (including an entity or arrangement treated as a partnership for U.S. federal income tax purposes) holds our Class A Common Stock, the tax treatment of a partner in the partnership generally will depend upon the status of the partner, upon the activities of the partnership and upon certain determinations made at the partner level. Accordingly, we urge partners in partnerships (including entities or arrangements treated as partnerships for U.S. federal income tax purposes) considering the purchase of our Class A Common Stock to consult their tax advisors regarding the U.S. federal income tax considerations of the purchase, ownership and disposition of our Class A Common Stock by such partnership.
Distributions
Distributions of cash or property on our Class A Common Stock, if any, will constitute dividends for U.S. federal income tax purposes to the extent paid from our current or accumulated earnings and profits, as determined under U.S. federal income tax principles. To the extent those distributions exceed our current and accumulated earnings and profits, the distributions will be treated as a non-taxable return of capital to the extent of the non-U.S. holder’s tax basis in our Class A Common Stock and thereafter as capital gain from the sale or exchange of such Class A Common Stock. See “—Gain on Disposition of Class A Common Stock.” Subject to the withholding requirements under FATCA (as defined below) and with respect to effectively connected dividends, each of which is discussed below, any distribution made to a non-U.S. holder on our Class A Common Stock generally will be subject to U.S. withholding tax at a rate of 30% of the gross amount of the distribution unless an applicable income tax treaty provides for a lower rate. To receive the benefit of a reduced treaty rate, a non-U.S. holder must provide the applicable withholding agent with an IRS Form W-8BEN or IRS Form W-8BEN-E (or other applicable or successor form) certifying qualification for the reduced rate.
Dividends paid to a non-U.S. holder that are effectively connected with a trade or business conducted by the non-U.S. holder in the United States (and, if required by an applicable income tax treaty, are treated as attributable to a permanent establishment maintained by the non-U.S. holder in the United States) generally will be taxed on a net income basis at the rates and in the manner generally applicable to United States persons (as defined under the Code). Such effectively connected dividends will not be subject to U.S. withholding tax if the non-U.S. holder satisfies certain certification requirements by providing the applicable withholding agent with a properly executed IRS Form W-8ECI certifying eligibility for exemption. If the non-U.S. holder is a corporation for U.S. federal income tax purposes, it may also be subject to a branch profits tax (at a 30% rate or such lower rate as specified by an applicable income tax treaty) on its effectively connected earnings and profits (as adjusted for certain items), which will include effectively connected dividends.
Gain on Disposition of Class A Common Stock
Subject to the discussions below under “—Information Reporting and Backup Withholding” and “—Additional Withholding Requirements under FATCA,” a non-U.S. holder generally will not be subject to
163
Table of Contents
Index to Financial Statements
U.S. federal income or withholding tax on any gain realized upon the sale or other disposition of our Class A Common Stock unless:
| • | the non-U.S. holder is an individual who is present in the United States for a period or periods aggregating 183 days or more during the calendar year in which the sale or disposition occurs and certain other conditions are met; |
| • | the gain is effectively connected with a trade or business conducted by the non-U.S. holder in the United States (and, if required by an applicable income tax treaty, is attributable to a permanent establishment maintained by the non-U.S. holder in the United States); or |
| • | our Class A Common Stock constitutes a United States real property interest by reason of our status as a United States real property holding corporation (“USRPHC”) for U.S. federal income tax purposes and as a result such gain is treated as effectively connected with a trade or business conducted by the non-U.S. holder in the United States. |
A non-U.S. holder described in the first bullet point above will be subject to U.S. federal income tax at a rate of 30% (or such lower rate as specified by an applicable income tax treaty) on the amount of such gain, which generally may be offset by U.S. source capital losses.
A non-U.S. holder whose gain is described in the second bullet point above or, subject to the exceptions described in the next paragraph, the third bullet point above, generally will be taxed on a net income basis at the rates and in the manner generally applicable to United States persons (as defined under the Code) unless an applicable income tax treaty provides otherwise. If the non-U.S. holder is a corporation for U.S. federal income tax purposes whose gain is described in the second bullet point above, then such gain would also be included in its effectively connected earnings and profits (as adjusted for certain items), which may be subject to a branch profits tax (at a 30% rate or such lower rate as specified by an applicable income tax treaty).
Generally, a corporation is a USRPHC if the fair market value of its United States real property interests equals or exceeds 50% of the sum of the fair market value of its worldwide real property interests and its other assets used or held for use in a trade or business. We believe that we currently are, and expect to remain for the foreseeable future, a USRPHC for U.S. federal income tax purposes. However, as long as our Class A Common Stock continues to be “regularly traded on an established securities market” (within the meaning of the Treasury Regulations), only a non-U.S. holder that actually or constructively owns, or owned at any time during the shorter of the five-year period ending on the date of the disposition or the non-U.S. holder’s holding period for the Class A Common Stock, more than 5% of our Class A Common Stock will be treated as disposing of a U.S. real property interest and will be taxable on gain realized on the disposition of our Class A Common Stock as a result of our status as a USRPHC. If our Class A Common Stock were not considered to be regularly traded on an established securities market, such holder (regardless of the percentage of stock owned) would be treated as disposing of a U.S. real property interest and would be subject to U.S. federal income tax on a taxable disposition of our Class A Common Stock (as described in the preceding paragraph), and a 15% withholding tax would apply to the gross proceeds from such disposition.
Non-U.S. holders should consult their tax advisors with respect to the application of the foregoing rules to their ownership and disposition of our Class A Common Stock.
Information Reporting and Backup Withholding
Any dividends paid to a non-U.S. holder must be reported annually to the IRS and to the non-U.S. holder. Copies of these information returns may be made available to the tax authorities in the country in which the non-U.S. holder resides or is established. Payments of dividends to a non-U.S. holder generally will not be subject to backup withholding if the non-U.S. holder establishes an exemption by properly certifying its non-U.S. status on an IRS Form W-8BEN or IRS Form W-8BEN-E (or other applicable or successor form).
164
Table of Contents
Index to Financial Statements
Payments of the proceeds from a sale or other disposition by a non-U.S. holder of our Class A Common Stock effected by or through a U.S. office of a broker generally will be subject to information reporting and backup withholding (at the applicable rate) unless the non-U.S. holder establishes an exemption by properly certifying its non-U.S. status on an IRS Form W-8BEN or IRS Form W-8BEN-E (or other applicable or successor form) and certain other conditions are met. Information reporting and backup withholding generally will not apply to any payment of the proceeds from a sale or other disposition of our Class A Common Stock effected outside the United States by a non-U.S. office of a broker. However, unless such broker has documentary evidence in its records that the non-U.S. holder is not a United States person and certain other conditions are met, or the non-U.S. holder otherwise establishes an exemption, information reporting will apply to a payment of the proceeds of the disposition of our Class A Common Stock effected outside the United States by such a broker if it has certain relationships within the United States.
Backup withholding is not an additional tax. Rather, the U.S. federal income tax liability (if any) of persons subject to backup withholding will be reduced by the amount of tax withheld. If backup withholding results in an overpayment of taxes, a refund may be obtained, provided that the required information is timely furnished to the IRS.
Additional Withholding Requirements under FATCA
Sections 1471 through 1474 of the Code, and the Treasury Regulations and administrative guidance issued thereunder (“FATCA”), impose a 30% withholding tax on any dividends paid on our Class A Common Stock and on the gross proceeds from a disposition of our Class A Common Stock (if such disposition occurs after December 31, 2018), in each case if paid to a “foreign financial institution” or a “non-financial foreign entity” (each as defined in the Code) (including, in some cases, when such foreign financial institution or non-financial foreign entity is acting as an intermediary), unless (i) in the case of a foreign financial institution, such institution enters into an agreement with the U.S. government to withhold on certain payments, and to collect and provide to the U.S. tax authorities substantial information regarding U.S. account holders of such institution (which includes certain equity and debt holders of such institution, as well as certain account holders that are non-U.S. entities with U.S. owners), (ii) in the case of a non-financial foreign entity, such entity certifies that it does not have any “substantial United States owners” (as defined in the Code) or provides the applicable withholding agent with a certification identifying the direct and indirect substantial United States owners of the entity (in either case, generally on an IRS Form W-8BEN-E), or (iii) the foreign financial institution or non-financial foreign entity otherwise qualifies for an exemption from these rules and provides appropriate documentation (such as an IRS Form W-8BEN-E). Foreign financial institutions located in jurisdictions that have an intergovernmental agreement with the United States governing these rules may be subject to different rules. Under certain circumstances, a holder might be eligible for refunds or credits of such taxes. Non-U.S. holders are encouraged to consult their own tax advisors regarding the effects of FATCA on an investment in our Class A Common Stock.
INVESTORS CONSIDERING THE PURCHASE OF OUR CLASS A COMMON STOCK ARE URGED TO CONSULT THEIR OWN TAX ADVISORS REGARDING THE APPLICATION OF THE U.S. FEDERAL INCOME TAX LAWS TO THEIR PARTICULAR SITUATIONS AND THE APPLICABILITY AND EFFECT OF U.S. FEDERAL ESTATE AND GIFT TAX LAWS AND ANY STATE, LOCAL OR NON-U.S. TAX LAWS AND TAX TREATIES.
165
Table of Contents
Index to Financial Statements
The validity of the securities offered hereby will be passed upon for us by Vinson & Elkins LLP of Houston, Texas. Certain legal matters related to the offering will be passed upon for the underwriters by Latham & Watkins LLP, of Houston, Texas.
The carve-out financial statements of the assets and liabilities of the business to be contributed to Rosehill Operating Company, LLC (Predecessor) as of December 31, 2016 and 2015 and for the three years in the period ended December 31, 2016, included in this Prospectus have been so included in reliance on the report of BDO USA, LLP, an independent registered public accounting firm, appearing elsewhere herein, given on the authority of said firm as experts in auditing and accounting.
Estimates of our oil and natural gas reserves and related future net cash flows related to our properties as of December 31, 2017 included herein and elsewhere in this prospectus were based upon a reserve report prepared by our independent petroleum engineer, Ryder Scott Company, L.P. We have included these estimates in reliance on the authority of such firm as an expert in such matters.
WHERE YOU CAN FIND MORE INFORMATION
We have filed with the SEC a registration statement on Form S-1 under the Securities Act with respect to the Class A Common Stock offered by this prospectus. This prospectus does not contain all of the information included in the registration statement. For further information pertaining to us and the Class A Common Stock you should refer to the registration statement and its exhibits. Statements contained in this prospectus concerning any of our contracts, agreements or other documents are not necessarily complete. If a contract or document has been filed as an exhibit to the registration statement, we refer you to the copy of the contract or document that has been filed. Each statement in this prospectus relating to a contract or document filed as an exhibit is qualified in all respects by the filed exhibit.
We are subject to the informational requirements of the Securities Exchange Act of 1934, as amended, and file annual, quarterly and current reports and other information with the SEC. Our filings with the SEC are available to the public on the SEC’s website at http://www.sec.gov. Those filings are also available to the public on, or accessible through, our website under the heading “Investors” at www.rosehillresources.com. The information we file with the SEC or contained on or accessible through our corporate website or any other website that we may maintain is not part of this prospectus or the registration statement of which this prospectus is a part. You may also read and copy, at SEC prescribed rates, any document we file with the SEC, including the registration statement (and its exhibits) of which this prospectus is a part, at the SEC’s Public Reference Room located at 100 F Street, N.E., Washington D.C. 20549. You can call the SEC at 1-800-SEC-0330 to obtain information on the operation of the Public Reference Room.
166
Table of Contents
Index to Financial Statements
| ROSEHILL OPERATING COMPANY, LLC (Predecessor) |
||||
| Audited Financial Statements |
||||
| F-2 | ||||
| F-3 | ||||
| Statements of Operations for the Years Ended December 31, 2016, 2015 and 2014 |
F-4 | |||
| F-5 | ||||
| Statements of Cash Flows for the Years Ended December 31, 2016, 2015 and 2014 |
F-6 | |||
| F-7 | ||||
| ROSEHILL RESOURCES INC. |
||||
| Unaudited Financial Statements |
||||
| Condensed Balance Sheets as of September 30, 2017 and December 31, 2016 |
F-28 | |||
| Condensed Statements of Operations for the Nine months ended September 30, 2017 and 2016 |
F-29 | |||
| Condensed Statements of Stockholders’ Equity / Parent Net Investment |
F-30 | |||
| Condensed Statements of Cash Flows for the Nine months ended September 30, 2017 and 2016 |
F-31 | |||
| F-32 | ||||
F-1
Table of Contents
Index to Financial Statements
REPORT OF INDEPENDENT REGISTERED PUBLIC ACCOUNTING FIRM
Board of Directors
Tema Oil and Gas Company
Houston, Texas
We have audited the accompanying carve-out balance sheets of the assets and liabilities of the business to be contributed by Tema Oil and Gas Company (“Tema”) to Rosehill Operating Company, LLC (the “Contributed Assets”) as of December 31, 2016 and 2015 and the related carve-out statements of operations, changes in parent net investment and cash flows for each of the three years in the period ended December 31, 2016. These carve-out financial statements are the responsibility of management of the Contributed Assets. Our responsibility is to express an opinion on these carve-out financial statements based on our audits.
We conducted our audits in accordance with the standards of the Public Company Accounting Oversight Board (United States) and in accordance with auditing standards generally accepted in the United States of America. Those standards require that we plan and perform the audit to obtain reasonable assurance about whether the carve-out financial statements are free of material misstatement. The Contributed Assets are not required to have, nor were we engaged to perform, an audit of its internal control over financial reporting. Our audits included consideration of internal control over financial reporting as a basis for designing audit procedures that are appropriate in the circumstances, but not for the purpose of expressing an opinion on the effectiveness of the internal control over financial reporting of the Contributed Assets. Accordingly, we express no such opinion. An audit also includes examining, on a test basis, evidence supporting the amounts and disclosures in the carve-out financial statements, assessing the accounting principles used and significant estimates made by management, as well as evaluating the overall financial statement presentation. We believe that our audits provide a reasonable basis for our opinion.
In our opinion, the carve-out financial statements referred to above present fairly, in all material respects, the financial position of the Contributed Assets at December 31, 2016 and 2015, and the results of their operations and their cash flows for each of the three years in the period ended December 31, 2016, in conformity with accounting principles generally accepted in the United States of America.
As discussed in Note 1, the Contributed Assets are a group of related assets and liabilities owned by Tema, including oil and natural gas properties in the Delaware Basin and Barnett Shale and certain related assets and liabilities. The carve-out financial statements reflect the assets, liabilities, revenues and expenses directly attributable to the Contributed Assets, as well as allocations deemed reasonable by management, to present the financial position, results of operations, changes in parent net investment, and cash flows of the Contributed Assets on a stand-alone basis and do not necessarily reflect the financial position, results of operations, changes in parent net investment, and cash flows of the Contributed Assets in the future or what they would have been had the Contributed Assets been a separate, standalone entity during the periods presented.
/s/ BDO USA, LLP
Houston, TX
March 6, 2017
F-2
Table of Contents
Index to Financial Statements
ASSETS AND LIABILITIES OF THE BUSINESS TO BE CONTRIBUTED TO
ROSEHILL OPERATING COMPANY, LLC
| As of December 31, | ||||||||
| 2016 | 2015 | |||||||
| (in thousands) | ||||||||
| ASSETS |
||||||||
| Current Assets |
||||||||
| Cash and cash equivalents |
$ | 8,434 | $ | 27,734 | ||||
| Accounts receivable |
1,928 | 2,102 | ||||||
| Accounts receivable, related party |
4,837 | 1,274 | ||||||
| Inventory |
280 | 494 | ||||||
| Derivative assets |
247 | 1,533 | ||||||
| Prepaid and other current assets |
617 | 559 | ||||||
|
|
|
|
|
|||||
| Total current assets |
16,343 | 33,696 | ||||||
| Property and Equipment |
||||||||
| Oil and natural gas properties (successful efforts method of accounting), net |
122,267 | 121,621 | ||||||
| Other property and equipment, net |
1,106 | 1,252 | ||||||
|
|
|
|
|
|||||
| Total property and equipment, net |
123,373 | 122,873 | ||||||
| Other assets, net |
110 | 334 | ||||||
|
|
|
|
|
|||||
| Total Assets |
$ | 139,826 | $ | 156,903 | ||||
|
|
|
|
|
|||||
| LIABILITIES AND PARENT NET INVESTMENT |
||||||||
| Current Liabilities |
||||||||
| Accounts payable |
$ | 4,658 | $ | 5,084 | ||||
| Accounts payable, related parties |
612 | 528 | ||||||
| Accrued liabilities and other |
7,205 | 3,403 | ||||||
| Derivative liabilities |
1,856 | 120 | ||||||
| Current portion, capital lease obligation |
30 | 30 | ||||||
| Current portion, long term debt |
— | 20,000 | ||||||
|
|
|
|
|
|||||
| Total current liabilities |
14,361 | 29,165 | ||||||
| Noncurrent Liabilities |
||||||||
| Long term debt, net of current portion |
55,000 | 45,000 | ||||||
| Capital lease obligation, net of current portion |
65 | 94 | ||||||
| Asset retirement obligations |
5,180 | 3,667 | ||||||
|
|
|
|
|
|||||
| Total liabilities |
74,606 | 77,926 | ||||||
| Commitments and contingencies (Note 13) |
||||||||
| Parent Net Investment |
65,220 | 78,977 | ||||||
|
|
|
|
|
|||||
| Total Liabilities and Parent Net Investment |
$ | 139,826 | $ | 156,903 | ||||
|
|
|
|
|
|||||
The accompanying notes are an integral part of these financial statements.
F-3
Table of Contents
Index to Financial Statements
ASSETS AND LIABILITIES OF THE BUSINESS TO BE CONTRIBUTED TO
ROSEHILL OPERATING COMPANY, LLC
| For the Years Ended December 31, | ||||||||||||
| 2016 | 2015 | 2014 | ||||||||||
| (in thousands) | ||||||||||||
| Revenues |
||||||||||||
| Oil sales |
$ | 24,807 | $ | 20,601 | $ | 28,444 | ||||||
| Natural gas sales |
5,304 | 4,909 | 7,445 | |||||||||
| Natural gas liquids sales |
4,534 | 3,977 | 7,674 | |||||||||
| Gain (loss) on commodity derivatives, net |
(4,169 | ) | 3,735 | 2,404 | ||||||||
|
|
|
|
|
|
|
|||||||
| Total revenues |
30,476 | 33,222 | 45,967 | |||||||||
| Operating expenses |
||||||||||||
| Lease operating expenses |
4,800 | 4,582 | 6,103 | |||||||||
| Production taxes |
1,541 | 1,311 | 1,861 | |||||||||
| Gathering and transportation |
2,398 | 2,094 | 2,462 | |||||||||
| Depreciation, depletion and amortization |
24,789 | 23,244 | 15,842 | |||||||||
| Accretion expense |
176 | 120 | 125 | |||||||||
| Impairment of oil and natural gas properties |
— | 8,131 | 27,595 | |||||||||
| Exploration costs |
794 | 960 | 960 | |||||||||
| General and administrative expenses |
9,000 | 4,234 | 5,151 | |||||||||
| Gain on sale of oil and natural gas properties |
— | — | (6 | ) | ||||||||
| (Gain) loss on sale of other assets |
(50 | ) | 18 | (26 | ) | |||||||
|
|
|
|
|
|
|
|||||||
| Total operating expenses |
43,448 | 44,694 | 60,067 | |||||||||
|
|
|
|
|
|
|
|||||||
| Operating loss |
(12,972 | ) | (11,472 | ) | (14,100 | ) | ||||||
| Other income (expense) |
||||||||||||
| Interest expense, net |
(1,822 | ) | (3,247 | ) | (5,469 | ) | ||||||
| Other income (expense), net |
(247 | ) | 7 | 316 | ||||||||
|
|
|
|
|
|
|
|||||||
| Total other expense |
(2,069 | ) | (3,240 | ) | (5,153 | ) | ||||||
|
|
|
|
|
|
|
|||||||
| Loss before income taxes |
(15,041 | ) | (14,712 | ) | (19,253 | ) | ||||||
| Income tax expense |
148 | 108 | — | |||||||||
|
|
|
|
|
|
|
|||||||
| Net loss |
$ | (15,189 | ) | $ | (14,820 | ) | $ | (19,253 | ) | |||
|
|
|
|
|
|
|
|||||||
The accompanying notes are an integral part of these financial statements.
F-4
Table of Contents
Index to Financial Statements
ASSETS AND LIABILITIES OF THE BUSINESS TO BE CONTRIBUTED TO
ROSEHILL OPERATING COMPANY, LLC
STATEMENTS OF CHANGES IN PARENT NET INVESTMENT
| Parent Net Investment |
||||
| (in thousands) | ||||
| Balances at December 31, 2013 |
76,905 | |||
| Net loss |
(19,253 | ) | ||
| Net distribution to Parent |
(1,474 | ) | ||
|
|
|
|||
| Balances at December 31, 2014 |
56,178 | |||
| Net loss |
(14,820 | ) | ||
| Contribution from Parent in exchange for note payable |
11,750 | |||
| Net investment from Parent |
25,869 | |||
|
|
|
|||
| Balances at December 31, 2015 |
78,977 | |||
| Net loss |
(15,189 | ) | ||
| Net investment from Parent |
1,432 | |||
|
|
|
|||
| Balances at December 31, 2016 |
$ | 65,220 | ||
|
|
|
|||
The accompanying notes are an integral part of these financial statements.
F-5
Table of Contents
Index to Financial Statements
ASSETS AND LIABILITIES OF THE BUSINESS TO BE CONTRIBUTED TO
ROSEHILL OPERATING COMPANY, LLC
| For the Years Ended December 31, | ||||||||||||
| 2016 | 2015 | 2014 | ||||||||||
| (in thousands) | ||||||||||||
| Cash flows from operating activities |
||||||||||||
| Net loss |
$ | (15,189 | ) | $ | (14,820 | ) | $ | (19,253 | ) | |||
| Adjustments to reconcile net loss to net cash provided by operating activities: |
||||||||||||
| Accretion expense |
176 | 120 | 125 | |||||||||
| Depreciation, depletion, and amortization |
24,789 | 23,244 | 15,842 | |||||||||
| Impairment of oil and natural gas properties |
— | 8,131 | 27,595 | |||||||||
| Gain on sale of oil and natural gas properties |
— | — | (6 | ) | ||||||||
| (Gain) loss on sale of other assets |
(50 | ) | 18 | (26 | ) | |||||||
| (Gain) loss on derivative instruments |
4,630 | (1,893 | ) | 2,074 | ||||||||
| Gain on investments |
— | — | (128 | ) | ||||||||
| Net cash received (paid) in settlement of derivative instruments |
(1,608 | ) | 3,305 | (1,140 | ) | |||||||
| Amortization of debt issuance costs |
113 | 98 | 66 | |||||||||
| Settlement of asset retirement obligations |
(53 | ) | (10 | ) | (190 | ) | ||||||
| Changes in operating assets and liabilities: |
||||||||||||
| (Increase) decrease in accounts receivable and net accounts receivable, related party |
(3,305 | ) | 597 | (182 | ) | |||||||
| (Increase) decrease in inventory |
214 | (47 | ) | (275 | ) | |||||||
| (Increase) decrease in prepaid and other current assets |
(58 | ) | 743 | (1,019 | ) | |||||||
| (Increase) decrease in other assets |
111 | (109 | ) | (84 | ) | |||||||
| Increase (decrease) in accounts payable and accrued liabilities and other |
1,691 | (1,133 | ) | 2,126 | ||||||||
|
|
|
|
|
|
|
|||||||
| Net cash provided by operating activities |
11,461 | 18,244 | 25,525 | |||||||||
|
|
|
|
|
|
|
|||||||
| Cash flows from investing activities |
||||||||||||
| Additions to oil and natural gas properties |
(22,004 | ) | (17,176 | ) | (76,726 | ) | ||||||
| Purchases of investments |
— | — | (239 | ) | ||||||||
| Proceeds from sale of investments |
— | — | 24,586 | |||||||||
| Purchases of other property and equipment |
(263 | ) | (167 | ) | (1,057 | ) | ||||||
| Proceeds from sales of oil and natural gas properties and other property and equipment |
103 | 350 | 44 | |||||||||
|
|
|
|
|
|
|
|||||||
| Net cash used in investing activities |
(22,164 | ) | (16,993 | ) | (53,392 | ) | ||||||
|
|
|
|
|
|
|
|||||||
| Cash flows from financing activities |
||||||||||||
| Proceeds from long term debt |
10,000 | — | 15,000 | |||||||||
| Payments on long term debt |
(20,000 | ) | (10,000 | ) | — | |||||||
| Net investment from (distribution to) Parent |
1,432 | 25,869 | (1,474 | ) | ||||||||
| Proceeds from note payable, related party |
— | 1,750 | 10,000 | |||||||||
| Payments on capital lease obligation |
(29 | ) | (28 | ) | (2 | ) | ||||||
| Debt issuance costs |
— | (72 | ) | (67 | ) | |||||||
|
|
|
|
|
|
|
|||||||
| Net cash provided by (used in) financing activities |
(8,597 | ) | 17,519 | 23,457 | ||||||||
|
|
|
|
|
|
|
|||||||
| Net increase (decrease) in cash and cash equivalents |
(19,300 | ) | 18,770 | (4,410 | ) | |||||||
| Cash and cash equivalents, beginning of year |
27,734 | 8,964 | 13,374 | |||||||||
|
|
|
|
|
|
|
|||||||
| Cash and cash equivalents, end of year |
$ | 8,434 | $ | 27,734 | $ | 8,964 | ||||||
|
|
|
|
|
|
|
|||||||
| Supplemental disclosures of non cash activity: |
||||||||||||
| Non-cash investing activities: |
||||||||||||
| Asset retirement obligations incurred and revisions in estimated costs, net |
$ | 1,641 | $ | 515 | $ | 226 | ||||||
| Changes in accrued capital expenditures |
$ | (1,434 | ) | $ | 1,090 | $ | 974 | |||||
| Non-cash financing activities: |
||||||||||||
| Contribution from Parent in exchange for note payable |
$ | — | $ | 11,750 | $ | — | ||||||
| Capital lease obligations |
$ | — | $ | — | $ | 94 | ||||||
| Supplemental disclosures of cash flow information: |
||||||||||||
| Cash paid for interest |
$ | 1,794 | $ | 2,371 | $ | 2,039 | ||||||
The accompanying notes are an integral part of these financial statements.
F-6
Table of Contents
Index to Financial Statements
ASSETS AND LIABILITIES OF THE BUSINESS TO BE CONTRIBUTED TO
ROSEHILL OPERATING COMPANY, LLC
NOTES TO THE FINANCIAL STATEMENTS
Note 1—Nature of Operations
Tema Oil and Gas Company (“Tema” or “Parent”) has identified certain oil and natural gas assets and related liabilities that will be contributed to Rosehill Operating Company, LLC (“Rosehill Operating”). Rosehill Operating is expected to incorporate as a Delaware limited liability company immediately prior to the completion of a Transaction (as defined in Note 4—“Transaction” below) with KLR Energy Acquisition Corp. (“KLRE”), a publicly traded special purpose acquisition company (“SPAC”). Tema is a wholly-owned subsidiary of Rosemore, Inc. (“Rosemore”).
The accompanying financial statements reflect the assets and liabilities of the business to be contributed to Rosehill Operating by the Parent (“Contributed Assets”). The Contributed Assets include all of the Parent’s oil and natural gas properties located in the Delaware and Barnett Basins and certain other assets, including equipment, contracts, rights-of-way, and related liabilities.
All drilling completed on the Contributed Assets during the periods presented in the accompanying financial statements occurred in the Delaware Basin, a sub-basin of the Permian Basin, in West Texas and New Mexico.
Note 2—Basis of Presentation
The accompanying financial statements have been prepared on a “carve-out” basis and are derived from the financial statements and accounting records of the Parent. The financial statements have been prepared in accordance with generally accepted accounting principles in the United States (“U.S. GAAP”). These financial statements may not be indicative of the future performance of the Contributed Assets and do not necessarily reflect what the results of operations, financial position and cash flows would have been had the Contributed Assets been operated as an independent company during the periods presented.
The accompanying financial statements include direct expenses related to the Contributed Assets and expense allocations for certain functions of the Parent including, but not limited to, general corporate expenses related to finance, legal, information technology, human resources, communications, insurance, utilities, and compensation. These expenses have been allocated on the basis of direct usage when identifiable, actual volumes and revenues, with the remainder allocated proportionately on a barrel of oil equivalent (“BOE”) basis. Management considers the basis on which the expenses have been allocated to reasonably reflect the utilization of services provided to or the benefit received by the Contributed Assets during the periods presented. The allocations may not, however, reflect the expenses that would have been incurred as an independent company for the periods presented. Actual costs that may have been incurred if the Contributed Assets had been a stand-alone entity would depend on a number of factors, including the organizational structure, whether functions were outsourced or performed by employees and strategic decisions made in areas such as information technology and infrastructure. The allocations and related estimates and assumptions are described more fully in Note 12—“Transactions with Related Parties.”
Subsequent events have been evaluated through the issuance date of these financial statements. Any material subsequent events that occurred prior to such date have been properly recognized or disclosed in the accompanying financial statements.
Note 3—Summary of Significant Accounting Policies
Risks and Uncertainties
Revenue, profitability and future rate of growth related to the Contributed Assets are substantially dependent on prevailing prices for oil, natural gas, and natural gas liquids (“NGLs”). Historically, the energy
F-7
Table of Contents
Index to Financial Statements
markets have been very volatile, and there can be no assurance that commodity prices will not be subject to wide fluctuations in the future. A substantial or extended decline in commodity prices could have a material effect on the financial position, results of operations, cash flows, access to capital and on the quantities of oil, natural gas, and NGL reserves that can be economically produced from the Contributed Assets. It is possible for any of these effects to occur in the near term, given the recent volatility in commodity pricing.
Use of Estimates
The preparation of financial statements in accordance with U.S. GAAP requires management to make estimates and assumptions that affect the reported amounts of assets and liabilities; disclosure of contingent assets and liabilities at the date of the financial statements; the reported amounts of revenues and expenses during the reporting periods; and the quantities and values of proved oil, natural gas and NGL reserves used in calculating depletion and assessing impairment of oil and natural gas properties. Actual results could differ significantly from these estimates. Significant estimates made by management include the quantities of proved oil, natural gas, and NGL reserves and the fair value of its commodity derivative positions.
While management believes these estimates are reasonable, changes in facts and assumptions of the discovery of new information may result in revised estimates. Actual results could differ from these estimates and it is at lease reasonably possible these estimates could be revised in the near term, and these revisions could be material.
Revenue Recognition
Substantially all of the oil, natural gas and NGLs are sold at market-based prices to a variety of purchasers. For operated properties, revenue from the production of oil, natural gas, and NGLs is recognized when the product is delivered to the customer and collectability is reasonable assured. For non-operated properties, revenue from the production of oil, natural gas, and NGLs is recognized under the sales method. Under the sales method, should excess sales exceed the share of estimated remaining recoverable reserves related to the Contributed Assets, a liability would be recorded. Differences between sales and entitled share of production are not material.
Cash and Cash Equivalents
Cash and cash equivalents consist of cash and short-term, highly liquid investments with maturities of three months or less when acquired and are stated at cost, which approximates fair value.
Concentration of Credit Risk
Financial instruments with potential credit risk consist principally of cash and cash equivalents, accounts receivable, commodity derivative financial instruments and debt. Cash and cash equivalent balances with major financial institutions, at times, may exceed federally insured limits; however, management believes there is no significant credit risk related to cash and cash equivalents.
As the operator of a property, full payment for costs associated with the property is made and reimbursement is sought from the other working interest partners in the property for their share of those costs. The joint interest partners consist primarily of independent oil and natural gas producers. If the oil and natural gas exploration and production industry in general was adversely affected, the ability to collect reimbursements from the joint interest partners could also be adversely affected.
The purchasers of oil, natural gas and NGL production consist primarily of marketers, major oil and gas companies, and oil and gas pipeline companies. Credit evaluations on the purchasers of the production are performed and their financial condition is monitored on an ongoing basis.
F-8
Table of Contents
Index to Financial Statements
The commodity derivative transactions related to the Contributed Assets are carried out in the over-the-counter market and some are subject to margin-deposit requirements. The use of commodity derivative transactions involves the risk that the counterparties will be unable to meet the financial terms of such transactions. The counterparties for all of the commodity derivative transactions have an “investment grade” credit rating. Credit ratings of hedging counterparties are monitored on an ongoing basis. Although the commodity derivative contracts were entered into with three counterparties to mitigate the exposure to any individual counterparty, if any of the counterparties were to default on its obligations under the commodity derivative contracts or seek bankruptcy protection, it could have a material adverse effect on the ability to fund planned activities related to the Contributed Assets and could result in a larger percentage of future production being subject to commodity price volatility. In addition, in poor economic environments and tight financial markets, the risk of a counterparty default is heightened and fewer counterparties may participate in commodity derivative transactions, which could result in greater concentration of the exposure to any one counterparty or a larger percentage of the future production being subject to commodity price changes.
Major Customers
Gateway Gathering and Marketing Company (“Gateway”, a wholly-owned subsidiary of Rosemore), ETC Field Services, LLC (“ETC”) and Enlink Midstream Services, LLC (“Enlink”) accounted for 70%, 17% and 10%, respectively, of total revenues related to the Contributed Assets for the year ended December 31, 2016. For the year ended December 31, 2015, Gateway, Sunoco Inc. (“Sunoco”), Enlink and Regency Energy Partners LP (“Regency”) accounted for 54%, 13%, 11% and 11%, respectively, of total revenues related to the Contributed Assets. For the year ended December 31, 2014, Enterprise Crude Pipeline, LLC, Sunoco, Devon Gas Services, LP and Regency accounted for 33%, 32%, 18% and 11%, respectively, of total revenues related to the Contributed Assets. If any significant customers are lost, such loss could adversely affect revenue derived from the oil and natural gas properties related to the Contributed Assets.
At December 31, 2016, Gateway and ETC accounted for 78% and 14% of accounts receivable, including related party amounts, respectively. At December 31, 2015, Gateway and Enlink accounted for 69% and 21% of accounts receivable, including related party amounts, respectively.
Any concentration of customers may impact overall credit risk, either positively or negatively, in that these entities may be similarly affected by changes in economic or other conditions impacting the oil and natural gas industry.
Accounts Receivable
Accounts receivable are accounted for at the contractual amounts less allowance for doubtful accounts. Provisions for losses on accounts receivable are established if it is determined that collection of all or a part of an outstanding balance is not probable. Collectability is reviewed regularly and an allowance is established or adjusted, as necessary, using the specific identification method. There was no allowance for doubtful accounts as of December 31, 2016 and 2015.
Inventory
Inventories related to the Contributed Assets primarily consist of tubular goods and well equipment held for use in oil and natural gas operations. Inventories are carried at the lower of cost or market.
Derivative Financial Instruments
Commodity derivative instruments are recorded on the balance sheet at fair value as either an asset or a liability with changes in fair value recognized currently in earnings. While commodity derivative instruments are utilized to manage the price risk attributable to expected oil and natural gas production, commodity derivative
F-9
Table of Contents
Index to Financial Statements
instruments are not designated as accounting hedges under the accounting guidance. The related cash flow impact of the commodity derivative activities is reflected as cash flows from operating activities unless they are determined to have a significant financing element at inception, in which case they are classified within financing activities.
In order to manage the interest rate risk associated with long term debt, an interest rate swap agreement was entered into in 2012. Hedge accounting was not applied to the interest rate derivative contract; therefore, changes in fair value are recorded in earnings through interest expense. Cash settlements related to current interest rate swap contracts are reflected as cash flows from operating activities unless they are determined to have a significant financing element at inception, in which case they are classified within financing activities.
Oil and Natural Gas Properties
Oil and natural gas properties are accounted for under the successful efforts method of accounting. Under the successful efforts method, costs to acquire interests in oil and natural gas properties, property acquisitions, successful exploratory costs, development costs, and support equipment and facilities are capitalized when incurred. Exploration costs, including personnel and other internal costs, geological and geophysical expenses, delay rentals for natural gas and oil leases, costs associated with unsuccessful lease acquisitions and carrying and retaining unproved properties, and exploratory dry hole drilling costs are charged to expense as incurred. Costs of drilling exploratory wells are initially capitalized, but are charged to expense if the well is determined to be unsuccessful. In order for exploratory well costs to be capitalized, a sufficient quantity of reserves must be discovered to justify its completion as a producing well and that sufficient progress must be made in assessing the well’s economic and operating feasibility. If both of these requirements are not met, the costs are expensed. There were no exploratory well costs pending determination of proved reserves at December 31, 2016 or 2015, nor any unsuccessful exploratory dry hole costs during the years ended December 31, 2016, 2015 or 2014.
The costs of unproved leaseholds and mineral interests are capitalized as unproved properties pending the results of exploration and leasing efforts, at which time the costs are transferred to proved oil and natural gas properties if those efforts are deemed successful.
The cost of normal maintenance and repairs is charged to expense as incurred. Material expenditures that increase the life of an asset are capitalized and depreciated over the shorter of the estimated remaining useful life of the asset or the term of the lease, if applicable.
Acquisition costs and development costs of proved oil and natural gas properties, including estimated dismantlement, restoration and abandonment costs, are depreciated and depleted on a field-by-field basis by the units-of-production method using proved reserves and proved developed reserves, respectively. Depreciation, depletion and amortization (“DD&A”) expense related to oil and natural gas properties was $24.4 million, $22.8 million and $15.4 million for the years ended December 31, 2016, 2015 and 2014, respectively.
Net carrying values of retired, sold or abandoned properties that constitute less than a complete unit of depreciable property are charged or credited, net of proceeds, to accumulated DD&A, unless doing so significantly affects the units-of-production amortization rate, in which case a gain or loss is recognized in income. As such, gain or loss, if any, is recognized only when a group of proved properties (entire field) that constitute an amortization base has been retired, sold or abandoned.
Other Property and Equipment
Other property and equipment, including office furniture, computer hardware and software, equipment and buildings, is recorded at cost. Depreciation is calculated using the straight-line method over the estimated useful lives of the assets. Buildings are depreciated on a straight-line basis over five years. Compression equipment is depreciated on a straight-line basis over 15 years. Certain other property and equipment are depreciated on a straight-line basis over three to seven years. Depreciation and amortization expense was $0.4 million for each of the years ended December 31, 2016, 2015 and 2014.
F-10
Table of Contents
Index to Financial Statements
Impairment of Long-Lived Assets
Long-lived assets are reviewed each reporting period for possible impairment, or whenever changes in circumstances indicate that the carrying amount of assets may not be fully recoverable. Possible indicators of impairment include lower expected future oil and natural gas prices, actual or expected future development or operating costs significantly higher than previously anticipated, significant downward oil and natural gas reserve revisions, or when changes in other circumstances indicate the carrying amount of an asset may not be recoverable. An impairment loss is recognized for proved properties when the estimated undiscounted future cash flows expected to result from the long-lived asset are less than its carrying amount. The undiscounted future cash flows of the long-lived assets are estimated to assess the recoverability of carrying amounts, and such cash flows are determined on the basis of reasonable and documented assumptions that represent the best estimate of the future economic conditions during the remaining useful life of the asset. If the carrying amount exceeds the estimated undiscounted future cash flows, the carrying amount of the long-lived asset will be written down to its fair value.
Unproved leasehold costs are assessed for impairment at the end of each reporting period and transferred to proved oil and natural gas properties to the extent they are associated with successful exploration activities. Significant unevaluated leasehold costs are individually assessed for impairment based on current exploration plans, and any impairment is charged to expense.
Asset Retirement Obligations
If a reasonable estimate of the fair value of an obligation to perform site reclamation, dismantle facilities or plug and abandon wells can be made, a liability (asset retirement obligation or “ARO”) is recorded on the balance sheet and the present value of the asset retirement cost (“ARC”) is capitalized in oil and natural gas properties in the period in which the ARO is incurred. Settlements include payments made to satisfy the AROs. Transfers of AROs to purchasers of divested properties are recorded as part of the gain or loss on sale.
In general, the amount of the initial ARO and ARC will equal the estimated future costs to satisfy the abandonment obligation assuming normal operation of the assets, using current prices that are escalated by an estimated inflation factor up to the estimated settlement date, which is then discounted back to the date that the abandonment obligation was incurred using the appropriate credit adjusted risk-free rate. After recording these amounts, ARO is accreted to its future estimated value and the original ARC is depreciated on a units-of-production basis with the related asset.
Capitalized Interest
Significant oil and natural gas investments in unproved properties and significant exploration and development projects that have not commenced production that are undergoing the construction of assets which have not commenced principle operations qualify for interest capitalization. For such significant projects, interest is capitalized as part of the historical cost of developing and constructing assets until the asset is ready for service. Capitalized interest is determined by multiplying the weighted-average borrowing cost on debt by the average amount of qualifying costs incurred. Once the qualifying asset is completed and placed in service, the associated capitalized interest is expensed through depreciation or impairment. No capitalized interest was recorded during the years ended December 31, 2016, 2015 or 2014, respectively, because the drilling of exploration and development wells generally lasts less than three months and the capitalized interest on these wells would be inconsequential.
Income Taxes
The Contributed Assets are owned by Tema which is treated as a partnership for U.S. federal income tax purposes and for purposes of certain state and local income taxes. For such purposes, Tema’s net taxable income
F-11
Table of Contents
Index to Financial Statements
and any related tax credits are passed through to the members of Tema and are included in the member’s tax returns, even though such net taxable income or tax credits may not have actually been distributed. Accordingly, no provision has been made in the financial statements for such income taxes paid at the shareholder level.
Income tax expense on the Statements of Operations relate to the Texas franchise tax, at a statutory rate of 0.75% of taxable margin. Deferred tax assets and liabilities are recognized for future Texas franchise tax consequences attributable to differences between the financial statement carrying amount of existing assets and liabilities and their respective Texas franchise tax bases. For each of the years ended December 31, 2016 and 2015, the Texas franchise tax expenses incurred was $0.1 million. For the year ended December 31, 2014, no Texas franchise tax expense was incurred.
The effects of uncertain tax positions are recognized in the financial statements if these positions meet a “more-likely-than-not” threshold. For those uncertain tax positions that are recognized in the financial statements, liabilities are established to reflect the portion of those positions it cannot conclude “more-likely-than-not” to be realized upon ultimate settlement. As of December 31, 2016 and 2015, no uncertain tax positions were recognized as liabilities in the financial statements.
Investments
The accompanying financial statements of the Contributed Assets includes short term investments consisting of mutual funds which were accounted for as marketable securities and recorded at fair value based on quoted market prices. Dividends received from these short term investments were $0.3 million during the year ended December 31, 2014, and were recorded in “Other income (expense), net” in the accompanying Statements of Operations. During the year ended December 31, 2014, proceeds of $24.6 million were received from the sale of the short term investments and a gain of $0.1 million was recorded in “Other income (expense), net” in the accompanying Statements of Operations.
Fair Value of Financial Instruments
The carrying values of the current financial instruments, which include cash and cash equivalents, accounts receivable, other assets, accounts payable, and accrued and other liabilities approximate their fair value as of December 31, 2016 and 2015 due to the short-term nature of those instruments. Refer to Note 7—“Fair Value Measurements” for a discussion on the fair values of the commodity derivatives and the Credit Agreement.
Recently Issued Accounting Standards
In April 2015, the FASB issued ASU 2015-03, Interest—Imputation of Interest (Subtopic 835-30): Simplifying the Presentation of Debt Issuance Costs, which requires that debt issuance costs related to a recognized debt liability be presented in the balance sheet as a direct deduction from the carrying amount of that debt liability, consistent with debt discounts. ASU 2015-03 is effective for fiscal years beginning after December 15, 2015, including interim periods therein, and is applied retrospectively. Early adoption is permitted for financial statements that have not been previously issued. In August 2015, ASU 2015-15, Presentation and Subsequent Measurement of Debt Issue Costs Associated with Line of Credit Arrangements, was subsequently issued to address the absence of authoritative guidance for debt issuance costs related to line-of-credit arrangements and states that an entity may continue to present debt issuance costs as an asset and subsequently amortizing the deferred debt issuance costs ratably over the term of the line-of-credit arrangement, regardless of whether there are any outstanding borrowings on the line-of-credit arrangement. Given the debt issuance costs relate to the Credit Agreement, the current accounting and disclosure for such costs was not impacted.
In July 2015, the FASB issued ASU 2015-11, Inventory (Topic 330): Simplifying the Measurement of Inventory, which requires that inventory is measured at the lower of cost or net realizable value (“NRV”), with the latter defined as the estimated selling prices in the ordinary course of business, less reasonably predictable
F-12
Table of Contents
Index to Financial Statements
costs of completion, disposal, and transportation. This ASU eliminates the need to determine market or replacement cost and evaluate whether it is above the ceiling at NRV or below the floor (NRV less a normal profit margin). The guidance in this ASU is effective prospectively for interim and annual periods beginning after December 15, 2016, with early adoption permitted. The adoption of this ASU is not expected to have a material impact on the financial statements.
In August 2015, the FASB issued ASU 2015-14, Revenue from Contracts with Customers (Topic 606): Deferral of Effective Date, which defers the effective date of ASU 2014-09 by one year to be effective for annual reporting periods beginning after December 15, 2018 and the interim periods therein. ASU 2014-09, Revenue from Contracts with Customers, supersedes the revenue recognition requirements in Topic 605, Revenue Recognition, and industry-specific guidance in Subtopic 932-605, Extractive Activities—Oil and Gas—Revenue Recognition and requires an entity to recognize revenue when it transfers promised goods or services to customers in an amount that reflects the consideration the entity expects to be entitled to in exchange for those goods or services. Subsequently, in April 2016, the FASB issued ASU 2016-10, Revenue from Contracts with Customers (Topic 606): Identifying Performance Obligations and Licensing as further clarification on identifying performance obligations and the licensing implementation guidance. In May 2016, the FASB issued ASU 2016-12, Revenue from Contracts with Customers (Topic 606): Narrow—Scope Improvements and Practical Expedients, as clarifying guidance to improve the operability and understandability of the implementation guidance on principal versus agent considerations. In December 2016, the FASB further issued ASU 2016-20, Technical Corrections and Improvements to Topic 606, Revenue from Contracts with Customers, to increase stakeholders’ awareness of the proposals and to expedite improvements to ASU 2014-09. The method of adoption and impact these standards will have on the financial statements and related disclosures is currently being evaluated.
In November 2015, the FASB issued ASU 2015-17, Income Taxes (Topic 704): Balance Sheet Classification of Deferred Taxes, which eliminates the current requirement for organizations to present deferred tax liabilities and assets as current and non-current in a classified balance sheet. Instead, companies are required to classify all deferred tax assets and liabilities as non-current. ASU 2015-17 is effective for interim and annual periods beginning after December 15, 2016. The adoption of this ASU is not expected to have a material impact on the financial statements given the pass-through nature of the Parent for tax purposes.
In February 2016, the FASB issued ASU 2016-02, Leases (Topic 842), which requires the recognition of lease assets and lease liabilities by lessees for those leases classified as operating leases under previous U.S. GAAP. ASU 2016-02 is effective for fiscal years beginning after December 15, 2018, including interim periods within those fiscal years. Early adoption is permitted. The method of adoption and impact this standard will have on the financial statements and related disclosures is currently being evaluated.
In June 2016, the FASB issued ASU 2016-13, Financial Instruments—Credit Losses (Topic 326): Measurement of Credit Losses on Financial Instruments requiring the measurement of all expected credit losses for financial assets, which include trade receivables, held at the reporting date based on historical experience, current conditions, and reasonable and supportable forecasts. The guidance in this ASU is effective for fiscal years, and interim periods within those fiscal years, beginning after December 15, 2019, with early adoption permitted for interim and annual periods beginning after December 15, 2018. The method of adoption and impact this standard will have on the financial statements and related disclosures is currently being evaluated.
In August 2016, the FASB issued ASU 2016-15, Statement of Cash Flows (Topic 320): Classification of Cash Receipts and Cash Payments, which addresses eight specific cash flow issues with the objective of reducing the existing diversity of presentation and classification in the statement of cash flows. The new standard applies to cash flows associated with debt payment or debt extinguishment costs, settlement of zero-coupon debt or other debt instruments with coupon rates that are insignificant in relation to effective interest rate of borrowing, contingent consideration payments made after a business combination, proceeds from the settlement of insurance claims, proceeds from the settlement of corporate-owned life insurance policies, distributions received from
F-13
Table of Contents
Index to Financial Statements
equity method investees, beneficial interests in securitization transactions and separately identifiable cash flows and application of the predominance principle. ASU 2016-15 is effective for fiscal years beginning after December 15, 2017, including interim periods within those fiscal periods. Early adoption is permitted, but only if all amendments are adopted in the same period. The impact this standard will have on the financial statements and related disclosures is currently being evaluated.
In January 2017, the FASB issued ASU 2017-01, Business Combinations (Topic 805): Clarifying the Definition of a Business, which clarifies the definition of a business with the objective of adding guidance to assist entities with evaluating whether transactions should be accounted for as acquisitions (or disposals) of assets or businesses. ASU 2017-01 is effective for fiscal years beginning after December 15, 2017, including interim periods within these fiscal years. The impact this standard will have on the financial statements and related disclosures is currently being evaluated.
In February 2017, the FASB issued ASU 2017-05, Other Income—Gains and Losses from the Derecognition of Nonfinancial Assets (Subtopic 610-20): Clarifying the Scope of Asset Derecognition Guidance and Accounting for Partial Sales of Nonfinancial Assets, which clarifies the scope of Subtopic 610-20 and provides further guidance for partial sales of nonfinancial assets. Subtopic 610-20, which was issued in May 2014 as part of ASU 2014-09, provides guidance for recognizing gains and losses from the transfer of nonfinancial assets in contracts with noncustomers. An entity is required to apply the amendments in ASU 2017-05 at the same time it applies the amendments in ASU 2014-09. An entity may elect to apply the amendments in ASU 2017-05 either retrospectively to each period presented in the financial statements in accordance with the guidance on accounting changes in FASB’s Accounting Standards Codification (“ASC”) Topic 250, Accounting Changes and Error Corrections, paragraphs 10-45-5 through 10-45-10 (i.e. the retrospective approach) or retrospectively with a cumulative-effect adjustment to retained earnings as of the beginning of the fiscal year of adoption (i.e. the modified retrospective approach). An entity may elect to apply all of the amendments in ASU 2017-05 and ASU 2014-09 using the same transition method, and alternatively may elect to use different transition methods. The impact ASU 2017-05 will have on the financial statements and related disclosures is currently being evaluated.
Note 4—Transaction
On December 20, 2016, Tema entered into a Business Combination Agreement with KLRE, pursuant to which, and subject to the terms and adjustments set forth therein, KLRE will acquire a portion of the equity of Rosehill Operating, to which Tema will contribute and transfer certain assets and liabilities, for (i) the contribution to Rosehill Operating by KLRE of a certain cash consideration and for the issuance to Rosehill Operating by KLRE of 29,807,692 shares of its Class B common stock (which cash and shares of Class B common stock will immediately be distributed by Rosehill Operating to Tema), (ii) the assumption by Rosehill Operating of $55.0 million in Tema indebtedness and (iii) the contribution to Rosehill Operating by KLRE of the remaining cash proceeds of its initial public offering (the “Transaction”).
In connection with the closing of the Transaction, (i) KLRE will issue to Rosehill Operating 4.0 million warrants exercisable for shares of Class A Common Stock (the “Tema warrants”) in exchange for 4.0 million warrants exercisable for Rosehill Operating common units (the “Rosehill warrants”) deemed equal to the Tema warrants and (ii) the Tema warrants and $35.0 million will immediately be distributed to Tema. In addition, KLRE will contribute the proceeds of a certain PIPE Investment to Rosehill Operating in exchange for Rosehill Operating Series A preferred units and additional 5.0 million Rosehill warrants. The Transaction is expected to close in the second quarter of 2017, subject to certain closing conditions, including receipt of KLRE shareholder approval.
F-14
Table of Contents
Index to Financial Statements
Note 5—Accounts Receivable
Accounts receivable is comprised of the following as of December 31, 2016 and 2015:
| 2016 | 2015 | |||||||
| (in thousands) | ||||||||
| Revenue receivable |
$ | 1,291 | $ | 337 | ||||
| Joint interest billings |
557 | 1,765 | ||||||
| Other |
80 | — | ||||||
|
|
|
|
|
|||||
| Accounts receivable |
$ | 1,928 | $ | 2,102 | ||||
|
|
|
|
|
|||||
Note 6—Derivative Instruments
Various commodity derivative instruments have been entered into to mitigate a portion of the exposure to potentially adverse market changes in commodity prices, market interest rates and associated impact on cash flows. All contracts are entered into for other-than-trading purposes. The derivative contracts include commodity options and swaps, and an interest rate swap.
The fair value of the derivative assets and liabilities as of December 31, 2016 and 2015, respectively, is as follows:
| 2016 | 2015 | |||||||
| (in thousands) | ||||||||
| Derivative assets |
||||||||
| Commodity derivative options |
$ | 21 | $ | 1,533 | ||||
| Interest rate swap |
226 | — | ||||||
|
|
|
|
|
|||||
| Total |
$ | 247 | $ | 1,533 | ||||
|
|
|
|
|
|||||
| 2016 | 2015 | |||||||
| (in thousands) | ||||||||
| Derivative liabilities |
||||||||
| Commodity derivative options |
$ | — | $ | 4 | ||||
| Commodity derivative swaps |
1,856 | 18 | ||||||
| Interest rate swap |
— | 98 | ||||||
|
|
|
|
|
|||||
| Total |
$ | 1,856 | $ | 120 | ||||
|
|
|
|
|
|||||
F-15
Table of Contents
Index to Financial Statements
As of December 31, 2016, the open commodity derivative positions with respect to future production were as follows:
| 2017 | ||||
| (in unit of measure specified) | ||||
| Commodity derivative swaps |
||||
| Oil: |
||||
| Notional volume (Barrels) |
273,000 | |||
| Weighted average price ($/Barrel) |
$ | 51.56 | ||
| Natural Gas: |
||||
| Notional volume (MMBtu) |
1,480,000 | |||
| Weighted average price ($/MBtu) |
$ | 3.15 | ||
| Commodity derivative options |
||||
| Oil: |
||||
| Notional volume (Barrels) |
406,000 | |||
| Weighted average price ($/Barrel) |
$ | 46.89 | ||
| Natural Gas: |
||||
| Notional volume (MMBtu) |
2,550,000 | |||
| Weighted average price ($/MBtu) |
$ | 3.15 | ||
For the years ended December 31, 2016, 2015 and 2014, the effect of the derivative activity on the Statements of Operations is as follows:
| 2016 | 2015 | 2014 | ||||||||||
| (in thousands) | ||||||||||||
| Realized gain (loss) on derivatives |
||||||||||||
| Commodity derivative options |
$ | 511 | $ | 4,340 | $ | 20 | ||||||
| Commodity derivative swaps |
(1,334 | ) | 130 | 26 | ||||||||
|
|
|
|
|
|
|
|||||||
| Total |
(823 | ) | 4,470 | 46 | ||||||||
| Interest rate swap |
(785 | ) | (1,165 | ) | (1,186 | ) | ||||||
|
|
|
|
|
|
|
|||||||
| Total realized gain (loss) on derivatives |
(1,608 | ) | 3,305 | (1,140 | ) | |||||||
|
|
|
|
|
|
|
|||||||
| Unrealized gain (loss) on derivatives |
||||||||||||
| Commodity derivative options |
$ | (1,508 | ) | $ | (735 | ) | $ | 2,358 | ||||
| Commodity derivative swaps |
(1,838 | ) | — | — | ||||||||
|
|
|
|
|
|
|
|||||||
| Total |
(3,346 | ) | (735 | ) | 2,358 | |||||||
| Interest rate swap |
324 | (677 | ) | (3,292 | ) | |||||||
|
|
|
|
|
|
|
|||||||
| Total unrealized loss on derivatives |
$ | (3,022 | ) | $ | (1,412 | ) | $ | (934 | ) | |||
|
|
|
|
|
|
|
|||||||
The gains and losses resulting from the cash settlement and mark-to-market of the commodity derivatives are included within “Revenues” in the Statements of Operations. The gains and losses resulting from the cash settlement and mark-to-market of the interest rate swap are included in “Interest expense” in the Statements of Operations.
Note 7—Fair Value Measurements
Fair value is the price that would be received to sell an asset or paid to transfer a liability in an orderly transaction between market participants at the measurement date (exit price). The authoritative guidance requires disclosure of the framework for measuring fair value and requires that fair value measurements be classified and disclosed in one of the following categories:
Level 1—Unadjusted quoted prices in active markets that are accessible at the measurement date for identical, unrestricted assets or liabilities. Active markets are those in which transactions for the assets or
F-16
Table of Contents
Index to Financial Statements
liabilities occur with sufficient frequency and volume to provide pricing information on an ongoing basis, such as commodity options.
Level 2—Quoted prices in markets that are not active, or inputs that are observable, either directly or indirectly, for substantially the full term of the asset of liability. This category includes those derivative instruments that are valued using observable market data, such as derivatives related to interest rate swaps.
Level 3—Measured based on prices or valuation models that require inputs that are both significant to the fair value measurement and less observable from objective sources. Pricing inputs are unobservable for the investment and includes situations where there is little, if any, market activity for the investment, such as commodity swaps.
Observable data is considered to be market data if it is readily available, regularly distributed or updated, reliable and verifiable, not proprietary, provided by multiple, independent sources that are actively involved in the relevant market. In certain cases, the inputs used to measure fair value may fall into different levels of the fair value hierarchy. In such cases, an investment’s level with the fair value hierarchy is based on lowest level of input that is significant to the fair value measurement. The assessment of the significance of a particular input to the fair value measurement in its entirety requires judgment and considers factors specific to the investment. However, the determination of what constitutes “observable” requires significant judgment. The categorization of an investment within the hierarchy is based upon the pricing transparency of the investment and does not necessarily correspond to the perceived risk of that investment.
Fair Value of Financial Instruments
The financial instruments measured at fair value on a recurring basis consist of the following as of December 31, 2016 and 2015:
| 2016 | 2015 | |||||||
| (in thousands) | ||||||||
| Derivative instruments: |
||||||||
| Derivative assets |
247 | 1,533 | ||||||
| Derivative liabilities |
(1,856 | ) | (120 | ) | ||||
|
|
|
|
|
|||||
| Total recurring fair value measurement |
$ | (1,609 | ) | $ | 1,413 | |||
|
|
|
|
|
|||||
Derivative instruments represent unrealized amounts related to the derivative positions, including swaps and options, within current assets and current liabilities on the Balance Sheets.
The tables below set forth by level within the fair value hierarchy the gross components of the assets and liabilities that were measured at fair value on a recurring basis as of December 31, 2016 and 2015. These gross balances are intended solely to provide information on sources of inputs to fair value and proportions of fair value involving objective versus subjective valuations and do not represent either the actual credit exposure or net economic exposure.
| 2016 | ||||||||||||||||
| Level 1 | Level 2 | Level 3 | Total | |||||||||||||
| (in thousands) | ||||||||||||||||
| Derivative assets |
21 | 226 | — | 247 | ||||||||||||
| Commodity derivative liabilities |
(1,856 | ) | — | — | (1,856 | ) | ||||||||||
|
|
|
|
|
|
|
|
|
|||||||||
| Total derivative assets (liabilities) |
$ | (1,835 | ) | $ | 226 | $ | — | $ | (1,609 | ) | ||||||
|
|
|
|
|
|
|
|
|
|||||||||
F-17
Table of Contents
Index to Financial Statements
| 2015 | ||||||||||||||||
| Level 1 | Level 2 | Level 3 | Total | |||||||||||||
| (in thousands) | ||||||||||||||||
| Commodity derivative assets |
1,533 | — | — | 1,533 | ||||||||||||
| Derivative liabilities |
(4 | ) | (98 | ) | (18 | ) | (120 | ) | ||||||||
|
|
|
|
|
|
|
|
|
|||||||||
| Total derivative assets (liabilities) |
$ | 1,529 | $ | (98 | ) | $ | (18 | ) | $ | 1,413 | ||||||
|
|
|
|
|
|
|
|
|
|||||||||
The following table summarizes the changes in the fair value of the Level 3 assets (liabilities) measured on a recurring basis for the years ended December 31, 2016 and 2015:
| 2016 | 2015 | |||||||
| (in thousands) | ||||||||
| Balances at beginning of year |
$ | (18 | ) | $ | 40 | |||
| Sales |
— | (18 | ) | |||||
| Settlements |
18 | (40 | ) | |||||
|
|
|
|
|
|||||
| Net purchases, sales and settlements |
18 | (58 | ) | |||||
| Transfers into and out of Level 3 |
— | — | ||||||
|
|
|
|
|
|||||
| Balances at end of year |
$ | — | $ | (18 | ) | |||
|
|
|
|
|
|||||
Financing Arrangements
The fair value measurements for the Credit Agreement represent Level 2 inputs. Based on the average of certain imputed interest rates, the fair value of the Credit Agreement is estimated to be $51.6 million and $59.3 million as of December 31, 2016 and 2015, respectively.
Non-Financial Assets and Liabilities
Non-financial assets and liabilities that are initially measured at fair value on a recurring basis are comprised primarily of ARO and ARC, which are recorded at fair value when acquired or incurred and not re-measured at fair value in subsequent periods. Such initial measurements are classified as Level 3 since certain significant unobservable inputs are utilized in their determination. The fair value of additions to ARO liability and certain changes in the estimated fair value of the liability are measured using valuation techniques consistent with the income approach, converting future cash flows to a single discounted amount. Significant inputs to the valuation include (i) estimated plug and abandonment cost per well based on historical experience and information from third-party vendors; (ii) estimated remaining life per well; (iii) future inflation factors; and (iv) average credit-adjusted risk-free rate. These inputs require significant judgments and estimates by management at the time of the valuation and are the most sensitive and subject to change.
If the carrying amount of oil and natural gas properties exceeds the estimated undiscounted future cash flows, the carrying amount of the oil and natural gas properties will be adjusted to the fair value. The fair value of oil and natural gas properties is determined using valuation techniques consistent with the income and market approach. The factors used to determine fair value are subject to management’s judgment and expertise and include, but are not limited to, (i) recent sales prices of comparable properties; (ii) the present value of future cash flows, net of estimated operating and development costs using estimates of proved oil and natural gas reserves; (iii) future commodity prices; (iv) future production estimates; (v) anticipated capital expenditures; and (vi) various discount rates commensurate with the risk and current market conditions associated with the projected cash flows. These assumptions represent “Level 3” inputs.
F-18
Table of Contents
Index to Financial Statements
Note 8—Property and equipment
Property and equipment is comprised of the following as of December 31, 2016 and 2015:
| 2016 | 2015 | |||||||
| (in thousands) | ||||||||
| Proved oil and natural gas properties |
$ | 258,530 | $ | 235,541 | ||||
| Unproved oil and natural gas properties |
1,942 | 1,376 | ||||||
| Land |
1,561 | — | ||||||
| Other property and equipment |
3,808 | 3,818 | ||||||
|
|
|
|
|
|||||
| Total property and equipment |
265,841 | 240,735 | ||||||
| Less: accumulated DD&A(1) |
(142,468 | ) | (117,862 | ) | ||||
|
|
|
|
|
|||||
| Property and equipment, net |
$ | 123,373 | $ | 122,873 | ||||
|
|
|
|
|
|||||
| (1) | Accumulated DD&A of oil and natural gas properties, including impairment, is $139.8 million and $115.3 million as of December 31, 2016 and 2015, respectively. |
There were no impairment charges attributable to proved oil and natural gas properties recorded during the year ended December 31, 2016. During 2015 and 2014, significant declines in oil and natural gas market prices indicated that the carrying values of certain oil and natural gas properties were impaired. At December 31, 2015 and 2014, the estimated undiscounted future cash flows of various oil and natural gas properties were less than their respective carrying values, and as a result, impairment charges were recorded attributable to proved oil and natural gas properties of $8.1 million and $27.6 million, respectively, for the years ended December 31, 2015 and 2014. Further declines in commodity prices could potentially result in future impairments of oil and natural gas properties.
Note 9—Asset Retirement Obligations
The change in ARO related to the Contributed Assets for the years ended December 31, 2016 and 2015 is set forth below:
| 2016 | 2015 | |||||||
| (in thousands) | ||||||||
| Carrying amount of ARO at January 1 |
$ | 3,667 | $ | 3,042 | ||||
| Liabilities incurred |
164 | 56 | ||||||
| Liabilities settled |
(53 | ) | (10 | ) | ||||
| Accretion expense |
176 | 120 | ||||||
| Revisions of estimated liabilities |
1,477 | 459 | ||||||
|
|
|
|
|
|||||
| Carrying amount of ARO at December 31 |
5,431 | 3,667 | ||||||
| Less: current portion of ARO |
(251 | ) | — | |||||
|
|
|
|
|
|||||
| Long term ARO |
$ | 5,180 | $ | 3,667 | ||||
|
|
|
|
|
|||||
F-19
Table of Contents
Index to Financial Statements
Note 10—Accrued Liabilities and Other
Accrued liabilities and other is comprised of the following as of December 31, 2016 and 2015:
| 2016 | 2015 | |||||||
| (in thousands) | ||||||||
| Accrued payroll |
$ | 948 | $ | 532 | ||||
| Accrued professional fees |
223 | — | ||||||
| Production taxes |
120 | 134 | ||||||
| Royalties payable |
2,494 | 1,005 | ||||||
| Advances from joint owners |
219 | 395 | ||||||
| Deferred rent |
138 | 132 | ||||||
| Current portion of ARO |
251 | — | ||||||
| Accrued capital expenditures |
2,443 | 1,009 | ||||||
| Other |
369 | 196 | ||||||
|
|
|
|
|
|||||
| Total |
$ | 7,205 | $ | 3,403 | ||||
|
|
|
|
|
|||||
Note 11—Debt and Note Payable to Related Party
A summary of changes in amounts due under the Credit Agreement is as follows for the years ended December 31, 2016 and 2015:
| 2016 | 2015 | |||||||
| (in thousands) | ||||||||
| Beginning balance at January 1 |
$ | 65,000 | $ | 75,000 | ||||
| Borrowings |
10,000 | — | ||||||
| Repayments |
(20,000 | ) | (10,000 | ) | ||||
|
|
|
|
|
|||||
| Ending balance at December 31 |
55,000 | 65,000 | ||||||
| Less: current portion of long-term debt |
— | (20,000 | ) | |||||
|
|
|
|
|
|||||
| Long term debt |
$ | 55,000 | $ | 45,000 | ||||
|
|
|
|
|
|||||
Credit Agreement
In December 2012, a secured line of credit was entered into with a bank for $60.0 million (the “Credit Agreement”), with an optional expansion to $75.0 million, subject to satisfactory credit underwriting. Borrowings under the Credit Agreement bear interest at floating London Interbank Offered Rate (“LIBOR”) plus 1.00% (the Applicable Margin), and are collateralized by the existing producing oil and natural gas properties. There is no principal amortization required until the expiration of the Credit Agreement, when all outstanding amounts become due. The Credit Agreement expires December 28, 2017, unless otherwise amended. The Credit Agreement is subject to periodic, but no less than semi-annual, redeterminations of the borrowing base. Redeterminations are based on the mid-year and year-end oil and gas reserve reports.
In 2013, the option to expand the Credit Agreement to $75.0 million was exercised and as of January 1, 2015, the Credit Agreement was fully drawn. In September 2015, the borrowing base was reduced to $68.0 million as a result of the regular semi-annual redetermination process. The decrease in borrowing base was primarily due to the impact of declining oil and natural gas commodity prices. The debt was paid down as required, and as of December 31, 2015, the outstanding balance on the Credit Agreement was $65.0 million.
In March 2016, the borrowing base was reduced to $45.0 million as a result of the semi-annual redetermination process. The second reduction was again primarily due to the impact of declining oil and natural gas commodity prices. The debt was paid down as required. In September 2016, the borrowing base was
F-20
Table of Contents
Index to Financial Statements
increased to $55.0 million as a result of the regular semi-annual redetermination process. The increase in borrowing base was due in part to an increase in reserves and an increase in oil and natural gas commodity prices. The additional borrowing base was drawn on November 18, 2016. As of December 31, 2016, the outstanding balance on the Credit Agreement was $55.0 million.
In December 2014, the Credit Agreement was amended for a modification to the indebtedness covenant to permit certain subordinated debt (the “First Amendment to the Credit Agreement”). Please refer to “Note Payable to Related Party” below.
In September 2016, the Credit Agreement was amended to modify certain definitions, certain covenants, increasing the Applicable Commitment Fee Rate and Applicable Margin, and Applicable Letter of Credit fee, and waiving certain defaults (the “Second Amendment to the Credit Agreement”). The Applicable Commitment Fee Rate under the Credit Agreement was increased from 0.15% to 0.50% to be calculated on the borrowing base limit rather than the undrawn Credit Agreement and paid quarterly. The Applicable Margin was increased from 1.00% to 2.00%. The Applicable Letter of Credit Fee was increased from 1.00% to 2.00%. As of December 31, 2016, Tema was in compliance with all covenants in relation to the Credit Agreement.
On March 6, 2017, the Credit Agreement was amended to extend the original expiration date to June 30, 2018 (the “Third Amendment to the Credit Agreement”).
The aggregate interest expense under the Credit Agreement was $1.4 million, $1.2 million and $1.0 million during the years ended December 31, 2016, 2015 and 2014, respectively.
The Credit Agreement will not be transferred to Rosehill Operating at the closing of the Transaction as discussed in Note 4—“Transaction.” The financial covenants contained in the Credit Agreement are determined based on the net worth and operating results of Tema, which include the Contributed Assets. In connection with the Transaction, the Credit Agreement is expected to be refinanced and will include covenants specific to Rosehill Operating and the Contributed Assets.
Interest Rate Swap
Concurrent with the initial $60.0 million drawdown of the Credit Agreement, an interest rate swap was entered into with a bank to fix the interest rate of the Credit Agreement. The interest rate swap expires in 2022 and includes an option that expires on December 28, 2017, which allows the swap to unwind at par. The cost of the option was financed into the swap, resulting in a slightly higher interest rate for the 10-year period. The notional amount of the interest rate swap is $60.0 million with a fixed rate of 2.11%. The fair value of the interest rate swap as of December 31, 2016 and 2015 was an asset of $0.2 million and a liability of $0.1 million, respectively. The additional $15.0 million expansion of the Credit Agreement in 2013 was not swapped. Consequently, the outstanding portion of the note payable over $60.0 million bore interest at floating LIBOR based rates. In conjunction with the March 2016 Credit Agreement redetermination to the new borrowing base of $45.0 million, the notional amount of the interest rate swap was reduced from $60.0 million to $45.0 million and an expense of $0.2 million was recognized for the fee paid to the bank related to the reduction of the interest rate swap.
Interest expense related to realized losses on the interest rate swap was $0.8 million for the year ended December 31, 2016, and $1.2 million for each of the years ended December 31, 2015 and 2014. Interest expense related to unrealized gain on the interest rate swap was $0.3 million for the year ended December 31, 2016. Interest expense related to unrealized losses on the interest rate swap was $0.7 million and $3.3 million for the years ended December 31, 2015 and 2014, respectively.
Debt Issuance Costs
Debt issuance costs consist of certain costs paid in the process of securing the Credit Agreement and are capitalized and subsequently charged to interest expense over the term of the related debt, using the effective
F-21
Table of Contents
Index to Financial Statements
interest rate method. As of December 31, 2016 and 2015, unamortized debt issuance costs were $0.1 million and $0.2 million, respectively, and are included in “Prepaid and other current assets” and “Other assets, net” for the respective periods on the accompanying Balance Sheets.
Note Payable to Related Party
In December 2014, a $30.0 million unsecured credit agreement bearing an interest rate of 2.0% was entered into with Rosemore (the “Unsecured Credit Agreement”). The agreement required interest only payments until the maturity date, March 29, 2018, at which time the entire principal and unpaid interest will become due. As of December 31, 2014, $10.0 million was outstanding under the Unsecured Credit Agreement and during 2015, an additional $1.8 million was borrowed under the Unsecured Credit Agreement. In December 2015, Rosemore elected to convert the aggregate outstanding principal amount of $11.8 million to contributed capital. No amounts were outstanding under the Unsecured Credit Agreement as of December 31, 2016 and 2015. During the year ended December 31, 2015, $0.2 million of interest related to the Unsecured Credit Agreement was incurred. No related interest was incurred during the year ended December 31, 2016.
Note 12—Transactions with Related Parties
The Unsecured Credit Agreement with Rosemore is discussed in Note 11—“Debt and Note Payable to Related Party—Note Payable to Related Party.”
Rosemore provides employee benefits and other administrative services to Tema. During the years ended December 31, 2016, 2015 and 2014, Rosemore incurred and billed to Tema approximately $6.0 million, $5.7 million and $7.9 million, respectively, related to these services. A portion of these amounts have been allocated on the Statements of Operations related to the Contributed Assets—please refer to “Cost Allocations” below. As of December 31, 2016 and 2015, the payable due to Rosemore related to these expenses was approximately $0.3 million as of each year end.
A portion of oil, natural gas and NGLs related to the Contributed Assets is sold to Gateway. During the years ended December 31, 2016, 2015 and 2014, revenues from production sold to Gateway were approximately $24.3 million, $16.8 million and less than $0.1 million, respectively. As of December 31, 2016 and 2015, the related receivable due from Gateway was approximately $4.5 million and $1.1 million, respectively.
During the years ended December 31, 2016, 2015 and 2014, approximately $1.4 million, $0.8 million and $0.6 million, respectively, were incurred related to a marketing and gathering agreement with Gateway. As of December 31, 2016 and 2015, the payable due to Gateway related to this agreement was approximately $0.3 million and $0.2 million, respectively.
Certain consulting services are provided to Gateway, and for each of the years ended December 31, 2016, 2015 and 2014, Gateway was invoiced approximately $0.1 million annually related to these services. Certain general and administrative services are also provided to Gateway, for which Gateway was invoiced approximately $0.3 million, $0.3 million and $0.4 million, respectively, during the years ended December 31, 2016, 2015 and 2014. As of December 31, 2016 and 2015, the receivable due from Gateway related to these services was approximately $0.3 million and $0.2 million, respectively.
Transaction expenses of $3.0 million have been incurred through December 31, 2016 in connection with the Transaction and have been included as general and administrative expenses. Under the terms of the Business Combination Agreement, the Parent will be reimbursed for transaction expenses incurred through the closing of the transaction.
Cost Allocations
Tema allocated certain overhead costs associated with general and administrative services, including insurance, professional fees, facilities, information services, human resources and other support departments
F-22
Table of Contents
Index to Financial Statements
related to the Contributed Assets. Also included in the cost allocations are costs associated with employees covered under Rosemore’s defined benefit plan and long-term incentive compensation plan. In connection with the proposed reverse merger, employees who transfer to Rosehill Operating will no longer participate in either employee benefit plan.
Where costs incurred related to the Contributed Assets could not be determined by specific identification, the costs are primarily allocated proportionately on a BOE basis. Management believes these allocations are a reasonable reflection of the utilization of services provided. However, the allocations may not fully reflect the expense that would have been incurred had the Contributed Assets been a stand-alone company during the periods presented.
The total amount related to the Contributed Assets for overhead cost allocations for the years ended December 31, 2016, 2015 and 2014, which is recorded in general and administrative costs, was $6.0 million, $4.2 million and $5.2 million, respectively.
Note 13—Commitments and Contingencies
Leases
Noncancelable operating and capital lease commitments for office space and equipment related to the Contributed Assets expire in years 2019 through 2022. The effective interest rate for capital leases is 3.6%. Certain leases have renewal options.
The following is a noncancelable schedule of future minimum lease payments as of December 31, 2016:
| (in thousands) Years Ending December 31, |
Operating Leases |
Capital Leases |
||||||
| 2017 |
1,062 | 34 | ||||||
| 2018 |
1,104 | 34 | ||||||
| 2019 |
1,090 | 34 | ||||||
| 2020 |
1,076 | — | ||||||
| 2021 |
1,087 | — | ||||||
| Thereafter |
552 | — | ||||||
|
|
|
|
|
|||||
| Total noncancelable future lease commitments |
$ | 5,971 | $ | 102 | ||||
|
|
|
|||||||
| Less: imputed interest |
(7 | ) | ||||||
|
|
|
|||||||
| Present value of obligations under capital leases |
$ | 95 | ||||||
|
|
|
|||||||
Rent expense for operating leases is recognized on a straight-line basis over the lease term. Rent expense for the years ended December 31, 2016, 2015 and 2014 was $0.7 million, $0.6 million and $0.4 million, respectively. Amortization of assets acquired under capital leases for each of the years ended December 31, 2016, 2015 and 2014 was less than $0.1 million and is included within “Depreciation, depletion and amortization expense” in the Statements of Operations.
Legal
During 2013, operational difficulties related to the Contributed Assets were experienced, including directional drilling errors on one well and defective casing on two other wells. Lawsuits were filed against the directional drilling company and casing supply vendor to recover damages. The case against the directional drilling company and one case against a casing supply vendor were resolved in 2015 with approximately $2.2 million being recovered from the settlements during the year ended December 31, 2015. The recovered amounts in 2015 were applied against the cost of the related wells. No additional amounts were recovered during the year ended December 31, 2016. Currently, one case against a casing supply vendor is still pending for which mediation has been set for March 23, 2017.
F-23
Table of Contents
Index to Financial Statements
The Parent has been named as a defendant in a personal injury claim related to the Contributed Assets. The Parent is indemnified on this claim through the drilling contractor. Although the outcome of this lawsuit cannot be predicted with certainty, a loss resulting from this claim is not expected.
In the opinion of management, there is no incidental litigation that will have a material adverse effect on the financial condition, results of operations and cash flows.
Environmental Matters
Environmental assessments and remediation efforts are conducted at multiple locations, primarily previously owned or operated facilities. Environmental and clean-up costs are accrued when it is both probable that a liability has been incurred and the amount can be reasonably estimated. Accruals for losses from environmental remediation obligations generally are recorded no later than completion of the remediation feasibility study. Estimated costs, which are based upon experience and assessments, are recorded at undiscounted amounts without considering the impact of inflation and are adjusted periodically as additional or new information is available. Environmental assessments and remediation costs for the years ended December 31, 2016, 2015 and 2014 did not have a material adverse effect on the financial condition, results of operations and cash flows.
Note 14—Supplementary Disclosures of Oil and Natural Gas Activities (Unaudited)
The unaudited supplemental information on oil and natural gas exploration and production activities for 2016, 2015, and 2014 has been presented in accordance with FASB’s ASC Topic 932, Extractive Activities—Oil and Gas and the SEC’s final rule, Modernization of Oil and Gas Reporting.
Capitalized Costs
Capitalized costs include the cost of properties, equipment, and facilities for oil and natural gas producing activities. Capitalized costs for proved properties include costs for oil and natural gas leaseholds where proved reserves have been identified, development wells, and related equipment and facilities, including development wells in progress. Capitalized costs for unproved properties include costs for acquiring oil and natural gas leaseholds where no proved reserves have been identified, including costs of exploratory wells that are in the process of drilling or in active completion, and costs of exploratory wells suspended or waiting on completion. For a summary of these costs, please refer to Note 8—“Property and Equipment.”
Costs Incurred for Property Acquisition, Exploration, and Development
Amounts reported as costs incurred include both capitalized costs and costs charged to expense when incurred for oil and natural gas property acquisition, exploration, and development activities. Costs incurred also include new AROs established in the current year as well as increases or decreases to ARO resulting from changes to cost estimates during the year. Exploration costs presented below include the costs of drilling and equipping successful and unsuccessful exploration wells during the year, geological and geophysical expenses, and the costs of retaining undeveloped leaseholds. Development costs include the costs of drilling and equipping development wells, and construction of related production facilities.
The following table summarizes the costs incurred for oil and natural gas property acquisition, exploration, and development activities for the years ended December 31, 2016, 2015 and 2014:
| 2016 | 2015 | 2014 | ||||||||||
| (in thousands) | ||||||||||||
| Property acquisition costs |
$ | 572 | $ | 1,382 | $ | 3,595 | ||||||
| Exploration costs |
12,517 | 4,851 | 39,821 | |||||||||
| Development costs |
11,143 | 9,347 | 33,352 | |||||||||
|
|
|
|
|
|
|
|||||||
| Total costs incurred |
$ | 24,232 | $ | 15,580 | $ | 76,768 | ||||||
|
|
|
|
|
|
|
|||||||
F-24
Table of Contents
Index to Financial Statements
Estimated Oil and Natural Gas Reserves
Proved oil and natural gas reserve estimates as of December 31, 2016 were prepared by Ryder Scott, Rosehill Operating’s independent petroleum engineer. Proved oil and natural gas reserve estimates as of December 31, 2015 and 2014 were prepared internally by management. The proved oil and natural gas reserve estimates were prepared in accordance with definitions and guidelines established by the SEC. Accordingly, the reserve estimates are based upon existing economic and operating conditions.
There are numerous uncertainties inherent in establishing quantities of proved reserves. The following reserve data represents estimates only, and should not be deemed exact. In addition, the standardized measure of discounted future net cash flows (“Standardized Measure”) should not be construed as the current market value of the oil and natural gas properties or the cost that would be incurred to obtain equivalent reserves.
The following tables disclose changes in the estimated net quantities of oil, NGL, and natural gas reserves, all of which are located onshore within the continental United States, for the years ended December 31, 2016, 2015 and 2014:
| 2016 | 2015 | 2014 | ||||||||||
| Proved developed and undeveloped reserves: |
||||||||||||
| Oil (MBbls) |
||||||||||||
| Beginning of period |
5,652 | 6,289 | 3,242 | |||||||||
| Revisions to previous estimates(1) |
(1,221 | ) | (3,542 | ) | (282 | ) | ||||||
| Extensions and discoveries(2) |
3,537 | 3,377 | 3,694 | |||||||||
| Production |
(612 | ) | (472 | ) | (365 | ) | ||||||
|
|
|
|
|
|
|
|||||||
| End of period |
7,356 | 5,652 | 6,289 | |||||||||
|
|
|
|
|
|
|
|||||||
| Natural Gas (MMcf) |
||||||||||||
| Beginning of period |
13,899 | 27,622 | 26,213 | |||||||||
| Revisions to previous estimates(1) |
143 | (15,983 | ) | (5,519 | ) | |||||||
| Extensions and discoveries(2) |
5,694 | 4,334 | 8,762 | |||||||||
| Production |
(2,381 | ) | (2,074 | ) | (1,834 | ) | ||||||
|
|
|
|
|
|
|
|||||||
| End of period |
17,355 | 13,899 | 27,622 | |||||||||
|
|
|
|
|
|
|
|||||||
| NGL (MBbls) |
||||||||||||
| Beginning of period |
1,994 | 4,299 | 4,423 | |||||||||
| Revisions to previous estimates(1) |
360 | (2,581 | ) | (1,411 | ) | |||||||
| Extensions and discoveries(2) |
993 | 588 | 1,572 | |||||||||
| Production |
(358 | ) | (312 | ) | (285 | ) | ||||||
|
|
|
|
|
|
|
|||||||
| End of period |
2,985 | 1,994 | 4,299 | |||||||||
|
|
|
|
|
|
|
|||||||
| Total proved reserves (MBoe) |
13,234 | 9,963 | 15,192 | |||||||||
|
|
|
|
|
|
|
|||||||
| Proved developed reserves |
||||||||||||
| Oil (MBbls): |
||||||||||||
| Beginning of period |
2,698 | 3,200 | 1,570 | |||||||||
| End of period |
3,068 | 2,698 | 3,200 | |||||||||
| Natural gas (MMcf): |
||||||||||||
| Beginning of period |
10,116 | 18,753 | 20,156 | |||||||||
| End of period |
10,574 | 10,116 | 18,753 | |||||||||
| NGL (MBbls): |
||||||||||||
| Beginning of period |
1,481 | 2,798 | 3,101 | |||||||||
| End of period |
1,802 | 1,481 | 2,798 | |||||||||
F-25
Table of Contents
Index to Financial Statements
| 2016 | 2015 | 2014 | ||||||||||
| Proved undeveloped reserves(3) |
||||||||||||
| Oil (MBbls): |
||||||||||||
| Beginning of period |
2,954 | 3,089 | 1,672 | |||||||||
| End of period |
4,288 | 2,954 | 3,089 | |||||||||
| Natural gas (MMcf): |
||||||||||||
| Beginning of period |
3,783 | 8,869 | 6,057 | |||||||||
| End of period |
6,781 | 3,783 | 8,869 | |||||||||
| NGL (MBbls): |
||||||||||||
| Beginning of period |
513 | 1,501 | 1,322 | |||||||||
| End of period |
1,183 | 513 | 1,501 | |||||||||
| (1) | For the years ended December 31, 2016, 2015 and 2014, revisions to previous estimates include technical revisions due to changes in commodity prices, historical and projected well performances, changes to lease operating expenses, differentials, transportation, shrink, BTU, NGL and condensate yields, and future development costs. |
| (2) | For the years ended December 31, 2016, 2015 and 2014, extensions and discoveries include discoveries and additions primarily related to active drilling in the Wolfcamp and Avalon benches in Loving County within the Delaware Basin. |
| (3) | The proved undeveloped reserves (“PUDs”) are reviewed annually to ensure an appropriate plan for development exists. Generally, reserves for the properties are not booked as PUDs unless there is a plan to convert the PUDs into proved developed reserves within five years of the date they are first booked as PUDs. The current drilling schedule has all PUDs planned for development within five years from the date of the original booking of the PUD. |
Standardized Measure
The following tables present the standardized measure of future net cash flows related to estimated proved oil and natural gas reserves and changes therein, including a reduction for estimated plugging and abandonment costs that are also reflected as an ARO liability on the balance sheet at December 31, 2016 and 2015. Future production and development costs are based on current costs with no escalations. Estimated future cash flows net of future income taxes have been discounted to their present values based on a 10% annual discount rate.
It should not be assumed that the future net cash flows or the discounted future net cash flows, referred to in the tables below, represent the fair value of the estimated oil and natural gas reserves.
The standardized measure of future net cash flows related to estimated proved oil and natural gas reserves as of December 31, 2016, 2015 and 2014 is as follows:
| 2016 | 2015 | 2014 | ||||||||||
| (in thousands) | ||||||||||||
| Future cash inflows |
$ | 360,651 | $ | 306,242 | $ | 793,160 | ||||||
| Future costs: |
||||||||||||
| Production |
(128,689 | ) | (108,968 | ) | (222,337 | ) | ||||||
| Development and net abandonment |
(80,522 | ) | (48,647 | ) | (98,267 | ) | ||||||
|
|
|
|
|
|
|
|||||||
| Future net inflows before income taxes |
151,440 | 148,627 | 472,556 | |||||||||
| Future income taxes(1) |
(1,885 | ) | (1,598 | ) | (4,129 | ) | ||||||
|
|
|
|
|
|
|
|||||||
| Future net cash flows |
149,555 | 147,029 | 468,427 | |||||||||
| 10% discount factor |
(69,492 | ) | (60,760 | ) | (262,952 | ) | ||||||
|
|
|
|
|
|
|
|||||||
| Standardized measure of discounted future net cash flows |
$ | 80,063 | $ | 86,269 | $ | 205,475 | ||||||
|
|
|
|
|
|
|
|||||||
| (1) | Attributable to Texas margin tax. |
F-26
Table of Contents
Index to Financial Statements
Prices for oil and natural gas reserves are based on the preceding 12-months’ average price in regards to closing prices on the first day of each month (the “average price”). As of December 31, 2016 and 2015, the price for NGLs is based on 27.5% of the average price for oil. As of December 31, 2014, the price for NGLs is based on the twelve month average of actual NGL prices received in 2014.
The following table summarizes the average prices used in the calculation of the Standardized Measure as of December 31 of each year.
| 2016 | 2015 | 2014 | ||||||||||
| Natural gas (per MMBtu) |
$ | 2.49 | $ | 2.58 | $ | 4.43 | ||||||
| Oil (per barrel) |
$ | 42.75 | $ | 50.28 | $ | 91.61 | ||||||
| NGL (per barrel) |
$ | 11.73 | $ | 13.83 | $ | 30.67 | ||||||
Changes in Standardized Measure
The changes in standardized measure of future net cash flows related to estimated proved oil and natural gas reserves for the years ended December 31, 2016, 2015 and 2014 is as follows:
| 2016 | 2015 | 2014 | ||||||||||
| (in thousands) | ||||||||||||
| Standardized measure at the beginning of the period |
$ | 86,269 | $ | 205,475 | $ | 124,703 | ||||||
| Sales and transfers of oil and natural gas produced |
(25,210 | ) | (21,731 | ) | (33,785 | ) | ||||||
| Net change in prices and production costs |
(21,705 | ) | (77,685 | ) | 18,152 | |||||||
| Extensions and discoveries |
33,586 | 42,791 | 95,506 | |||||||||
| Changes in estimated future development cost |
16 | 420 | 78 | |||||||||
| Revisions of previous quantity estimates |
(7,857 | ) | (78,219 | ) | (20,224 | ) | ||||||
| Previously estimated development costs incurred |
3,953 | 2,907 | 8,031 | |||||||||
| Accretion of discount |
8,720 | 20,729 | 12,586 | |||||||||
| Net change in income taxes |
(225 | ) | 876 | (657 | ) | |||||||
| Changes in production rates, timing and other |
2,516 | (9,294 | ) | 1,085 | ||||||||
|
|
|
|
|
|
|
|||||||
| Aggregate change |
(6,206 | ) | (119,206 | ) | 80,772 | |||||||
|
|
|
|
|
|
|
|||||||
| Standardized measure at the end of period |
$ | 80,063 | $ | 86,269 | $ | 205,475 | ||||||
|
|
|
|
|
|
|
|||||||
F-27
Table of Contents
Index to Financial Statements
ROSEHILL RESOURCES INC.
CONDENSED CONSOLIDATED BALANCE SHEETS
(in thousands)
| September 30, 2017 |
December 31, 2016 |
|||||||
| (unaudited) | ||||||||
| ASSETS |
||||||||
| Cash and cash equivalents |
$ | 4,656 | $ | 8,434 | ||||
| Accounts receivable |
1,943 | 1,928 | ||||||
| Accounts receivable, related parties |
4,466 | 4,837 | ||||||
| Inventory |
310 | 280 | ||||||
| Derivative assets |
102 | 247 | ||||||
| Prepaid and other current assets |
937 | 617 | ||||||
|
|
|
|
|
|||||
| Total current assets |
12,414 | 16,343 | ||||||
| Property and equipment: |
||||||||
| Oil and natural gas properties (successful efforts) |
378,456 | 262,033 | ||||||
| Other property and equipment |
3,695 | 3,807 | ||||||
| Accumulated depletion, depreciation and amortization |
(168,125 | ) | (142,467 | ) | ||||
|
|
|
|
|
|||||
| Total property and equipment, net |
214,026 | 123,373 | ||||||
| Deferred tax assets |
650 | — | ||||||
| Other assets, net |
715 | 110 | ||||||
|
|
|
|
|
|||||
| Total assets |
$ | 227,805 | $ | 139,826 | ||||
|
|
|
|
|
|||||
| LIABILITIES AND STOCKHOLDERS’ EQUITY / PARENT NET INVESTMENT |
||||||||
| Current liabilities: |
||||||||
| Accounts payable |
$ | 16,414 | $ | 4,658 | ||||
| Accounts payable, related parties |
406 | 612 | ||||||
| Dividends payable |
16 | — | ||||||
| Accrued liabilities and other |
24,351 | 7,097 | ||||||
| Derivative liabilities |
— | 1,856 | ||||||
|
|
|
|
|
|||||
| Total current liabilities |
41,187 | 14,223 | ||||||
| Long-term liabilities: |
||||||||
| Revolving credit facility |
50,000 | 55,000 | ||||||
| Asset retirement obligations |
5,435 | 5,180 | ||||||
| Deferred rent |
137 | 138 | ||||||
| Derivative liabilities |
115 | — | ||||||
| Other |
40 | 65 | ||||||
|
|
|
|
|
|||||
| Total long-term liabilities |
55,727 | 60,383 | ||||||
|
|
|
|
|
|||||
| Total liabilities |
96,914 | 74,606 | ||||||
| Commitments and contingencies (Note 15) |
||||||||
| Stockholders’ equity / parent net investment |
||||||||
| Preferred Stock, $0.0001 par value, 1,000,000 shares authorized, 8.0% Series A Cumulative Perpetual Convertible, $1,000 per share liquidation preference, 98,298 shares issued and outstanding as of September 30, 2017 |
80,592 | — | ||||||
| Class A common stock; $0.0001 par value, 95,000,000 shares authorized, 5,962,247 issued and 5,856,581 outstanding as of September 30, 2017 |
1 | — | ||||||
| Class B common stock; $0.0001 par value, 30,000,000 shares authorized, 29,807,692 issued and outstanding as of September 30, 2017 |
3 | — | ||||||
| Additional paid-in capital |
20,187 | — | ||||||
| Retained earnings |
— | — | ||||||
|
|
|
|
|
|||||
| Total common stockholders’ equity |
20,191 | — | ||||||
| Noncontrolling interest |
30,108 | — | ||||||
| Parent net investment |
— | 65,220 | ||||||
|
|
|
|
|
|||||
| Total stockholders’ equity / parent net investment |
130,891 | 65,220 | ||||||
|
|
|
|
|
|||||
| Total liabilities and stockholders’ equity / parent net investment |
$ | 227,805 | $ | 139,826 | ||||
|
|
|
|
|
|||||
The accompanying notes are an integral part of these unaudited condensed financial statements.
F-28
Table of Contents
Index to Financial Statements
ROSEHILL RESOURCES INC.
CONDENSED CONSOLIDATED STATEMENTS OF OPERATIONS
(Unaudited)
(In thousands, except share and per share amounts)
| Three Months Ended September 30, |
Nine Months Ended September 30, |
|||||||||||||||
| 2017 | 2016 | 2017 | 2016 | |||||||||||||
| Revenues: |
||||||||||||||||
| Oil sales |
$ | 11,435 | $ | 6,909 | $ | 36,464 | $ | 16,437 | ||||||||
| Natural gas sales |
1,881 | 1,587 | 5,592 | 3,651 | ||||||||||||
| Natural gas liquids sales |
1,979 | 1,186 | 5,405 | 3,115 | ||||||||||||
|
|
|
|
|
|
|
|
|
|||||||||
| Total revenues |
15,295 | 9,682 | 47,461 | 23,203 | ||||||||||||
| Operating expenses: |
||||||||||||||||
| Lease operating expenses |
2,944 | 1,314 | 6,479 | 3,621 | ||||||||||||
| Production taxes |
707 | 445 | 2,174 | 1,051 | ||||||||||||
| Gathering and transportation |
835 | 640 | 2,329 | 1,708 | ||||||||||||
| Depreciation, depletion, amortization and accretion |
8,383 | 5,887 | 26,150 | 16,525 | ||||||||||||
| Exploration costs |
434 | 178 | 1,208 | 496 | ||||||||||||
| General and administrative |
5,069 | 931 | 8,738 | 3,480 | ||||||||||||
| Transaction costs |
149 | — | 2,618 | — | ||||||||||||
| Gain on sale of other assets |
— | — | (11 | ) | — | |||||||||||
|
|
|
|
|
|
|
|
|
|||||||||
| Total operating expenses |
18,521 | 9,395 | 49,685 | 26,881 | ||||||||||||
|
|
|
|
|
|
|
|
|
|||||||||
| Operating income (loss) |
(3,226 | ) | 287 | (2,224 | ) | (3,678 | ) | |||||||||
|
|
|
|
|
|
|
|
|
|||||||||
| Other income (expense): |
||||||||||||||||
| Interest expense |
(300 | ) | (210 | ) | (1,274 | ) | (2,256 | ) | ||||||||
| Gain (loss) on commodity derivative instruments |
(1,451 | ) | (231 | ) | 1,751 | (2,132 | ) | |||||||||
| Other income (expense), net |
(148 | ) | 1 | (105 | ) | 23 | ||||||||||
|
|
|
|
|
|
|
|
|
|||||||||
| Total other income (expense) |
(1,899 | ) | (440 | ) | 372 | (4,365 | ) | |||||||||
| Loss before income taxes |
(5,125 | ) | (153 | ) | (1,852 | ) | (8,043 | ) | ||||||||
| Income tax expense (benefit) |
(923 | ) | 29 | (650 | ) | 93 | ||||||||||
|
|
|
|
|
|
|
|
|
|||||||||
| Net income (loss) |
(4,202 | ) | (182 | ) | (1,202 | ) | (8,136 | ) | ||||||||
| Net income (loss) attributable to noncontrolling interest |
(5,680 | ) | — | (8,009 | ) | — | ||||||||||
|
|
|
|
|
|
|
|
|
|||||||||
| Net income (loss) attributable to Rosehill Resources Inc. before preferred stock dividends |
1,478 | (182 | ) | 6,807 | (8,136 | ) | ||||||||||
| Preferred stock dividends |
1,942 | — | 10,014 | — | ||||||||||||
|
|
|
|
|
|
|
|
|
|||||||||
| Net income (loss) attributable to Rosehill Resources Inc. common stockholders |
$ | (464 | ) | $ | (182 | ) | $ | (3,207 | ) | $ | (8,136 | ) | ||||
|
|
|
|
|
|
|
|
|
|||||||||
| Earnings (loss) per common share: |
||||||||||||||||
| Basic |
$ | (0.08 | ) | $ | (0.03 | ) | $ | (0.55 | ) | $ | (1.39 | ) | ||||
| Diluted |
$ | (0.08 | ) | $ | (0.03 | ) | $ | (0.55 | ) | $ | (1.39 | ) | ||||
| Weighted average common shares outstanding: |
||||||||||||||||
| Basic |
5,857 | 5,857 | 5,857 | 5,857 | ||||||||||||
| Diluted |
5,857 | 5,857 | 5,857 | 5,857 | ||||||||||||
The accompanying notes are an integral part of these unaudited condensed financial statements.
F-29
Table of Contents
Index to Financial Statements
ROSEHILL RESOURCES INC.
CONDENSED CONSOLIDATED STATEMENTS OF STOCKHOLDERS’ EQUITY / PARENT NET INVESTMENT
(Unaudited)
(In thousands, except share amounts)
| Preferred Stock | Common Stock | Additional Paid-in Capital |
Retained Earnings |
Total Common Stockholders’ Equity |
Noncontrolling Interest |
Parent Net Investment |
Total Equity |
|||||||||||||||||||||||||||||||||||||||||
| Class A | Class B | |||||||||||||||||||||||||||||||||||||||||||||||
| Shares | Value | Shares | Value | Shares | Value | |||||||||||||||||||||||||||||||||||||||||||
| Balance at December 31, 2016 |
$ | — | $ | — | $ | — | $ | — | $ | — | $ | — | $ | — | $ | — | $ | — | $ | — | $ | 65,220 | $ | 65,220 | ||||||||||||||||||||||||
|
|
|
|
|
|
|
|
|
|
|
|
|
|
|
|
|
|
|
|
|
|
|
|
|
|||||||||||||||||||||||||
| Distribution to parent |
— | — | — | — | — | — | — | — | — | — | (2,267 | ) | (2,267 | ) | ||||||||||||||||||||||||||||||||||
| Net income (loss) |
— | — | — | — | — | — | — | 2,393 | 2,393 | (8,009 | ) | 4,414 | (1,202 | ) | ||||||||||||||||||||||||||||||||||
| Effect of the Transaction: |
||||||||||||||||||||||||||||||||||||||||||||||||
| Issuance of preferred stock and warrants |
95,000 | 70,594 | — | — | — | — | 20,186 | — | 20,186 | — | — | 90,780 | ||||||||||||||||||||||||||||||||||||
| Restricted shares granted to directors |
105,666 | — | 175 | 175 | 175 | |||||||||||||||||||||||||||||||||||||||||||
| Proceeds and shares obtained in the Transaction |
— | — | 5,856,581 | 1 | 29,807,692 | 3 | 7,447 | — | 7,451 | 78,604 | (67,367 | ) | 18,688 | |||||||||||||||||||||||||||||||||||
| Distribution to noncontrolling interest |
— | — | — | — | — | — | — | — | — | (40,487 | ) | — | (40,487 | ) | ||||||||||||||||||||||||||||||||||
| Preferred stock dividends |
3,298 | 9,998 | — | — | — | — | (7,621 | ) | (2,393 | ) | (10,014 | ) | — | — | (16 | ) | ||||||||||||||||||||||||||||||||
|
|
|
|
|
|
|
|
|
|
|
|
|
|
|
|
|
|
|
|
|
|
|
|
|
|||||||||||||||||||||||||
| Balance at September 30, 2017 |
98,298 | $ | 80,592 | 5,962,247 | $ | 1 | 29,807,692 | $ | 3 | $ | 20,187 | $ | — | $ | 20,191 | $ | 30,108 | $ | — | $ | 130,891 | |||||||||||||||||||||||||||
|
|
|
|
|
|
|
|
|
|
|
|
|
|
|
|
|
|
|
|
|
|
|
|
|
|||||||||||||||||||||||||
F-30
Table of Contents
Index to Financial Statements
ROSEHILL RESOURCES INC.
CONDENSED CONSOLIDATED STATEMENTS OF CASH FLOWS
(Unaudited)
(In thousands)
| Nine Months Ended September 30, |
||||||||
| 2017 | 2016 | |||||||
| Cash flows from operating activities: |
||||||||
| Net loss |
$ | (1,202 | ) | $ | (8,136 | ) | ||
| Adjustments to reconcile net loss to net cash provided by operating activities: |
||||||||
| Depreciation, depletion, amortization and accretion |
26,150 | 16,525 | ||||||
| Deferred income taxes |
(650 | ) | — | |||||
| Stock-based compensation |
175 | — | ||||||
| Gain on sale of fixed assets |
(11 | ) | — | |||||
| (Gain) loss on commodity derivative instruments |
(1,751 | ) | 2,132 | |||||
| Loss on interest rate swaps |
369 | 1,155 | ||||||
| Net cash received in settlement of commodity derivative instruments |
162 | 483 | ||||||
| Net cash paid in settlement of interest rate swaps |
(143 | ) | (606 | ) | ||||
| Amortization of debt issuance costs |
168 | 84 | ||||||
| Settlement of asset retirement obligations |
(725 | ) | (52 | ) | ||||
| Changes in operating assets and liabilities: |
||||||||
| (Increase) decrease in accounts receivable and accounts receivable, related parties |
122 | (998 | ) | |||||
| (Increase) decrease in inventory |
(30 | ) | — | |||||
| (Increase) decrease in prepaid and other assets |
(432 | ) | 412 | |||||
| Increase (decrease) in accounts payable and accrued liabilities and other |
13,531 | (1,623 | ) | |||||
| Increase (decrease) in accounts payable, related parties |
(206 | ) | (48 | ) | ||||
|
|
|
|
|
|||||
| Net cash provided by operating activities |
35,527 | 9,328 | ||||||
|
|
|
|
|
|||||
| Cash flows from investing activities: |
||||||||
| Additions to oil and natural gas properties |
(93,536 | ) | (11,592 | ) | ||||
| Acquisition of leasehold interests |
(6,500 | ) | — | |||||
| Additions to other property and equipment |
(343 | ) | (395 | ) | ||||
| Proceeds from sale of other property and equipment |
46 | 44 | ||||||
|
|
|
|
|
|||||
| Net cash used in investing activities |
(100,333 | ) | (11,943 | ) | ||||
|
|
|
|
|
|||||
| Cash flows from financing activities: |
||||||||
| Proceeds from revolving credit facility |
50,000 | — | ||||||
| Repayment on revolving credit facility |
(55,000 | ) | — | |||||
| Repayment of long-term debt |
— | (20,000 | ) | |||||
| Proceeds from issuance of preferred stock and warrants, net |
90,780 | — | ||||||
| Net proceeds from the Transaction |
18,688 | — | ||||||
| Distribution to noncontrolling interest |
(40,487 | ) | — | |||||
| Distribution to parent |
(2,267 | ) | (641 | ) | ||||
| Debt issuance costs |
(661 | ) | — | |||||
| Payment on capital lease obligation |
(25 | ) | (20 | ) | ||||
|
|
|
|
|
|||||
| Net cash provided by (used in) financing activities |
61,028 | (20,661 | ) | |||||
|
|
|
|
|
|||||
| Net decrease in cash and cash equivalents |
(3,778 | ) | (23,276 | ) | ||||
| Cash and cash equivalents, beginning of period |
8,434 | 27,734 | ||||||
|
|
|
|
|
|||||
| Cash and cash equivalents, end of period |
$ | 4,656 | $ | 4,458 | ||||
|
|
|
|
|
|||||
| Supplemental disclosures: |
||||||||
| Cash paid for interest |
$ | 246 | $ | 36 | ||||
| Asset retirement obligations incurred |
$ | 783 | $ | 101 | ||||
| Net settlement of related party receivable and payable |
$ | 199 | $ | — | ||||
| Changes in accrued capital expenditures |
$ | 15,603 | $ | (280 | ) | |||
| Series A preferred stock dividends |
$ | 10,014 | $ | — | ||||
The accompanying notes are an integral part of these condensed consolidated financial statements.
F-31
Table of Contents
Index to Financial Statements
ROSEHILL RESOURCES INC.
NOTES TO CONDENSED CONSOLIDATED FINANCIAL STATEMENTS
(Unaudited)
Note 1—Nature of Operations
Rosehill Resources Inc. (the “Company” or “Rosehill”) is an independent oil and natural gas company focused on the acquisition, exploration, development and production of unconventional oil and associated liquids-rich natural gas reserves in the Permian Basin. The Company’s assets are concentrated in the Delaware Basin, a sub-basin of the Permian Basin as well as, through July 2017, the Fort Worth Basin.
The Company was incorporated in Delaware on September 21, 2015 as a special purpose acquisition company under the name of KLR Energy Acquisition Corp. (“KLRE”) for the purpose of effecting a merger, capital stock exchange, asset acquisition, stock purchase, reorganization or similar business combination involving the Company and one or more businesses. On April 27, 2017, the Company acquired a portion of the equity of Rosehill Operating Company, LLC (“Rosehill Operating”) via a reverse recapitalization (the “Transaction”), into which Tema Oil & Gas Company (“Tema”), a wholly owned subsidiary of Rosemore, Inc. (“Rosemore”), contributed certain assets and liabilities. At the closing of the Transaction, the Company became the sole managing member of Rosehill Operating. Following the Transaction, the Company changed its name to Rosehill Resources Inc.
As the sole managing member of Rosehill Operating, the Company, through its officers and directors, is responsible for all operational and administrative decision-making and control of all of the day-to-day business affairs of Rosehill Operating without the approval of any other member, unless specified in the Amended and Restated Limited Liability Company Agreement of Rosehill Operating (the “LLC Agreement”).
Basis of Presentation
The consolidated financial results of the Company consist of the financial results of Rosehill Resources Inc. and Rosehill Operating, its consolidated subsidiary. Pursuant to the Transaction described in Note 2—Transaction, the Company acquired approximately 16% of the common units of Rosehill Operating, while Tema retained approximately 84% of the common units in Rosehill Operating.
Because Tema has effective control of the combined company before and after the Transaction through its majority voting interest in Rosehill Operating and the Company, respectively, the Transaction was accounted for in a manner similar to a reverse recapitalization. As a result, the reports filed by the Company subsequent to the Transaction are prepared “as if” Rosehill Operating is the predecessor and legal successor to the Company. The historical operations of Rosehill Operating are deemed to be those of the Company. Thus, the financial statements included in this report reflect (i) the historical operating results of Rosehill Operating prior to the Transaction; (ii) the combined results of the Company and Rosehill Operating following the Transaction; (iii) the assets and liabilities of Rosehill Operating at their historical cost; and (iv) the Company’s equity and earnings per share for all periods presented.
All periods prior to the date of the Transaction shown in the accompanying unaudited condensed consolidated financial statements have been prepared on a “carve-out” basis and are derived from the accounting records of Tema. The accompanying unaudited condensed consolidated financial statements prior to the Transaction include direct expenses related to Rosehill Operating and expense allocations for certain functions of Tema including, but not limited to, general corporate expenses related to finance, legal, information technology, human resources, communications, insurance, utilities, and compensation. These expenses have been allocated on the basis of direct usage when identifiable, actual volumes and revenues, with the remainder allocated proportionately on a barrel of oil equivalent (“Boe”) basis. Management considers the basis on which the
F-32
Table of Contents
Index to Financial Statements
expenses have been allocated to reasonably reflect the utilization of services provided to or the benefit received by Rosehill Operating during the periods presented. The allocations may not, however, reflect the expenses that would have been incurred as an independent company for the periods presented. Actual costs that may have been incurred prior to the Transaction would depend on a number of factors, including the organizational structure, whether functions were outsourced or performed by employees and strategic decisions made in areas such as information technology and infrastructure. The allocations and related estimates and assumptions are described more fully in Note 14—Transactions with Related Parties.
The following unaudited condensed financial statements have been prepared pursuant to the rules and regulations of the Securities and Exchange Commission (“SEC”). Certain information and note disclosures normally included in annual financial statements prepared in accordance with generally accepted accounting principles in the United States (“U.S. GAAP”) have been condensed or omitted pursuant to those rules and regulations, although the company believes that the disclosures made are adequate to make the information not misleading. The unaudited condensed consolidated financial statements reflect all normal and recurring adjustments that are, in the opinion of management, necessary for the fair presentation of the results of operations for the interim periods. These interim financial statements should be read in conjunction with Rosehill Operating’s audited financial statements for the year ended December 31, 2016 included in the Proxy Statement of the Company filed with the SEC on April 12, 2017, as amended and supplemented (the “Audited Financial Statements”).
Reclassifications
Certain reclassifications have been made to prior year financial statements to conform to classifications made in the current year. These reclassifications have no impact on net income (loss), stockholder’s equity or statement of cash flows as previously presented.
Variable Interest Entities
Rosehill Operating is a variable interest entity (“VIE”). The Company determined that it is the primary beneficiary of Rosehill Operating as the Company is the sole managing member and has the power to direct the activities most significant to Rosehill Operating’s economic performance as well as the obligation to absorb losses and receive benefits that are potentially significant. At September 30, 2017, the Company had an economic interest of approximately 16% in Rosehill Operating and consolidated 100% of Rosehill Operating’s assets and liabilities and results of operations in the Company’s unaudited condensed consolidated financial statements contained herein. At September 30, 2017, Tema had an economic interest of approximately 84% in Rosehill Operating; however, because it has disproportionately fewer voting rights, Tema is shown as a noncontrolling interest holder of Rosehill Operating. For further discussion see Noncontrolling Interest in Note 13—Stockholder’s Equity.
Use of Estimates
The preparation of unaudited condensed consolidated financial statements in accordance with U.S. GAAP requires management to make estimates and assumptions that affect the reported amounts of assets and liabilities; disclosure of contingent assets and liabilities at the date of the financial statements; the reported amounts of revenues and expenses during the reporting periods; and the quantities and values of proved oil, natural gas and natural gas liquids (“NGLs”) reserves used in calculating depletion and assessing impairment of oil and natural gas properties. Actual results could differ significantly from these estimates. Significant estimates made by management include the quantities of proved oil, natural gas and NGL reserves, related present value estimates of future net cash flows therefrom, the carrying value of oil and natural gas properties, asset retirement obligations, the fair value of its commodity derivative positions, contingencies, fair value of the Company’s warrants and estimates of current and deferred income taxes, deferred income tax valuation allowances and amounts associated with the Company’s Tax Receivable Agreement with Tema (the “Tax Receivable
F-33
Table of Contents
Index to Financial Statements
Agreement”) (see Note 12—Income Taxes). While management believes these estimates are reasonable, changes in facts and assumptions of the discovery of new information may result in revised estimates. Actual results could differ from these estimates and it is reasonably possible these estimates could be revised in the near term, and these revisions could be material.
Note 2—Transaction
On April 27, 2017, upon closing the Transaction, the Company acquired a portion of the common units of Rosehill Operating for (i) the contribution to Rosehill Operating by the Company of $35 million in cash (the “Cash Consideration”), excluding the working capital adjustment, and for the issuance to Rosehill Operating by the Company of 29,807,692 shares of its Class B Common Stock, (ii) the assumption by Rosehill Operating of $55 million in Tema indebtedness and (iii) the contribution to Rosehill Operating by the Company of the remaining cash proceeds of the Company’s initial public offering net of redemptions of approximately $60.6 million. In connection with the closing of the Transaction, the Company issued to Rosehill Operating 4,000,000 warrants exercisable for shares of the Company’s Class A Common Stock (the “Tema warrants”) in exchange for 4,000,000 warrants exercisable for Rosehill Operating common units (the “Rosehill warrants”). The Cash Consideration, estimated working capital adjustment, Tema warrants and shares of Class B Common Stock were immediately distributed to Tema. The estimated working capital adjustment remains subject to final settlement between the Company and Tema, the result of which could require the Company to make additional cash payments of purchase consideration to Tema, or require Tema to remit cash payments to the Company as a reduction of the preliminary purchase price.
In connection with the Transaction, the Company issued and sold 75,000 shares of its 8% Series A Cumulative Perpetual Convertible Preferred Stock (the “Series A Preferred Stock”) and 5,000,000 warrants in a private placement to certain qualified institutional buyers and accredited investors (the “PIPE Investors”) for net proceeds of $70.8 million (the “PIPE Investment”). The Company issued an additional 20,000 shares of Series A Preferred Stock to Rosemore Holdings, Inc. (wholly owned subsidiary of Rosemore) and KLR Energy Sponsor, LLC (the “Sponsor”) in connection with the closing of the Transaction for net proceeds of $20 million. The Company contributed the net proceeds from the PIPE Investment and from the issuance of 20,000 shares of Series A preferred stock to Rosemore Holdings, Inc. and the Sponsor to Rosehill Operating in exchange for Rosehill Operating Series A preferred units and additional Rosehill warrants. Of these proceeds, $55 million was used to retire the indebtedness assumed by Rosehill Operating.
Net cash provided by the Company upon the closing of the Transaction was $109.5 million, which consisted of $90.8 million of net proceeds from the sale of Series A Preferred Stock and $18.7 million from the sale of common shares prior to the Transaction, net of redemptions and offering and transaction costs.
Note 3—Summary of Significant Accounting Policies and Recently Issued Accounting Standards
The significant accounting policies followed by the Company are set forth in Note 3—Summary of Significant Accounting Policies included in the Audited Financial Statements.
Recently Issued Accounting Standards
The Company is an “emerging growth company,” as defined in Section 2(a) of the Securities Act of 1933, as amended, (the “Securities Act”), as modified by the Jumpstart our Business Startups Act of 2012, (the “JOBS Act”), and it may take advantage of certain exemptions from various reporting requirements that are applicable to other public companies that are not emerging growth companies including, but not limited to, not being required to comply with the auditor attestation requirements of Section 404 of the Sarbanes-Oxley Act, reduced disclosure obligations regarding executive compensation in its periodic reports and proxy statements, and exemptions from the requirements of holding a nonbinding advisory vote on executive compensation and shareholder approval of any golden parachute payments not previously approved.
F-34
Table of Contents
Index to Financial Statements
Further, Section 102(b)(1) of the JOBS Act exempts emerging growth companies from being required to comply with new or revised financial accounting standards until private companies (that is, those that have not had a Securities Act registration statement declared effective or do not have a class of securities registered under the Exchange Act) are required to comply with the new or revised financial accounting standards. The JOBS Act provides that a company can elect to opt out of the extended transition period and comply with the requirements that apply to non-emerging growth companies but any such election to opt out is irrevocable. The Company has elected not to opt out of such extended transition period, which means that when a standard is issued or revised and it has different application dates for public or private companies, the Company, as an emerging growth company, can adopt the new or revised standard at the time private companies adopt the new or revised standard. This may make comparison of the Company’s financial statements with another public company which is neither an emerging growth company nor an emerging growth company which has opted out of using the extended transition period difficult or impossible because of the potential differences in accounting standards used.
In August 2015, the FASB issued ASU 2015-14, Revenue from Contracts with Customers (Topic 606): Deferral of Effective Date, which defers the effective date of ASU 2014-09 by one year to be effective for the Company for annual reporting periods beginning after December 15, 2018, and interim reporting periods within annual reporting periods beginning after December 15, 2019. ASU 2014-09, Revenue from Contracts with Customers, supersedes the revenue recognition requirements in Topic 605, Revenue Recognition, and industry-specific guidance in Subtopic 932-605, Extractive Activities—Oil and Gas—Revenue Recognition and requires an entity to recognize revenue when it transfers promised goods or services to customers in an amount that reflects the consideration the entity expects to be entitled to in exchange for those goods or services. Subsequently, in April 2016, the FASB issued ASU 2016-10, Revenue from Contracts with Customers (Topic 606): Identifying Performance Obligations and Licensing as further clarification on identifying performance obligations and the licensing implementation guidance. In May 2016, the FASB issued ASU 2016-12, Revenue from Contracts with Customers (Topic 606): Narrow—Scope Improvements and Practical Expedients, as clarifying guidance to improve the operability and understandability of the implementation guidance on principal versus agent considerations. In December 2016, the FASB further issued ASU 2016-20, Technical Corrections and Improvements to Topic 606, Revenue from Contracts with Customers, to increase stakeholders’ awareness of the proposals and to expedite improvements to ASU 2014-09. In September 2017, the FASB issued ASU 2017-13, Revenue Recognition (Topic 605), Revenue from Contracts with Customers (Topic 606), Leases (Topic 840), and Leases (Topic 842) which amends SEC paragraphs pursuant to the Staff Announcement at the July 20, 2017 EITF Meeting and Rescission of Prior SEC Staff Announcements and Observer Comments. While we are in the preliminary stages of the evaluation of this new accounting standard, no significant changes to the Company’s existing policies have been identified.
In February 2016, the FASB issued ASU 2016-02, Leases (Topic 842), which requires the recognition of lease assets and lease liabilities by lessees for those leases classified as operating leases under previous U.S. GAAP. ASU 2016-02 is effective for the Company for fiscal years beginning after December 15, 2019, and interim periods within fiscal years beginning after December 15, 2020. Early adoption is permitted. The method of adoption and impact this standard will have on the unaudited condensed financial statements and related disclosures is currently being evaluated.
In June 2016, the FASB issued ASU 2016-13, Financial Instruments—Credit Losses (Topic 326): Measurement of Credit Losses on Financial Instruments requiring the measurement of all expected credit losses for financial assets, which include trade receivables, held at the reporting date based on historical experience, current conditions, and reasonable and supportable forecasts. The guidance in this ASU is effective for the Company for fiscal years beginning after December 15, 2020, and interim periods within fiscal years beginning after December 15, 2021 with early adoption permitted for interim and annual periods beginning after December 15, 2018. The evaluation of this standard on the unaudited condensed financial statements and related disclosures is currently ongoing.
In August 2016, the FASB issued ASU 2016-15, Statement of Cash Flows (Topic 320): Classification of Cash Receipts and Cash Payments, which addresses eight specific cash flow issues with the objective of reducing
F-35
Table of Contents
Index to Financial Statements
the existing diversity of presentation and classification in the statement of cash flows. The new standard applies to cash flows associated with debt payment or debt extinguishment costs, settlement of zero-coupon debt or other debt instruments with coupon rates that are insignificant in relation to effective interest rate of borrowing, contingent consideration payments made after a business combination, proceeds from the settlement of insurance claims, proceeds from the settlement of corporate-owned life insurance policies, distributions received from equity method investees, beneficial interests in securitization transactions and separately identifiable cash flows and application of the predominance principle. ASU 2016-15 is effective for the Company for fiscal years beginning after December 15, 2018, and interim periods within fiscal years beginning after December 15, 2019. Early adoption is permitted, but only if all amendments are adopted in the same period. The evaluation of this standard on the unaudited condensed Statements of Cash Flows is currently ongoing.
In January 2017, the FASB issued ASU 2017-01, Business Combinations (Topic 805): Clarifying the Definition of a Business, which clarifies the definition of a business with the objective of adding guidance to assist entities with evaluating whether transactions should be accounted for as acquisitions (or disposals) of assets or businesses. ASU 2017-01 is effective for the Company for fiscal years beginning after December 15, 2018, and interim periods within fiscal years beginning after December 15, 2019. The adoption of this ASU, using a prospective approach, could have a material impact on the unaudited condensed financial statements and related disclosures if future acquisitions or disposals are treated as asset purchases (or sales) rather than acquisition or disposal of a business.
In February 2017, the FASB issued ASU 2017-05, Other Income—Gains and Losses from the Derecognition of Nonfinancial Assets (Subtopic 610-20): Clarifying the Scope of Asset Derecognition Guidance and Accounting for Partial Sales of Nonfinancial Assets, which clarifies the scope of Subtopic 610-20 and provides further guidance for partial sales of nonfinancial assets. Subtopic 610-20, which was issued in May 2014 as part of ASU 2014-09, provides guidance for recognizing gains and losses from the transfer of nonfinancial assets in contracts with noncustomers. An entity is required to apply the amendments in ASU 2017-05 at the same time it applies the amendments in ASU 2014-09. Therefore, ASU 2017-05 is effective for the Company for fiscal years beginning after December 15, 2018, and interim periods within fiscal years beginning after December 15, 2019. An entity may elect to apply the amendments in ASU 2017-05 either retrospectively to each period presented in the financial statements in accordance with the guidance on accounting changes in FASB’s Accounting Standards Codification (“ASC”) Topic 250, Accounting Changes and Error Corrections, paragraphs 10-45-5 through 10-45-10 (i.e. the retrospective approach) or retrospectively with a cumulative-effect adjustment to retained earnings as of the beginning of the fiscal year of adoption (i.e. the modified retrospective approach). An entity may elect to apply all of the amendments in ASU 2017-05 and ASU 2014-09 using the same transition method, and alternatively may elect to use different transition methods. Entities may apply the guidance earlier as of annual reporting periods beginning after December 15, 2016, including interim reporting periods within that reporting period. The impact ASU 2017-05 will have on the unaudited condensed financial statements and related disclosures is currently ongoing.
In May 2017, the FASB issued ASU, 2017-09—Compensation—Stock Compensation (Topic 718); Scope of Modification Accounting. The new guidance clarifies when to account for a change to the terms or conditions of a share-based payment award as a modification. Under the new guidance, modification accounting is required only if the fair value, the vesting conditions, or the classification of the award as equity or liability changes as a result of the change in terms or conditions. This ASU is not expected to have a material impact on the Company’s consolidated financial results.
In July 2017, the FASB issued ASU. 2017-11—Earnings Per Share (Topic 260); Distinguishing Liabilities from Equity (Topic 480); Derivatives and Hedging (Topic 815): (Part I) Accounting for Certain Financial Instruments with Down Round Features, (Part II) Replacement of the Indefinite Deferral for Mandatorily Redeemable Financial Instruments of Certain Nonpublic Entities and Certain Mandatorily Redeemable Noncontrolling Interests with a Scope Exception. The amendments in Part I of ASU 2017-11 change the classification analysis of certain equity-linked financial instruments (or embedded features) with down round
F-36
Table of Contents
Index to Financial Statements
features and also clarify existing disclosure requirements for equity-classified instruments. The amendments in Part II of ASU 2017-11 recharacterize the indefinite deferral of certain provisions of Topic 480, currently presented as pending content in the Codification, to a scope exception. For the Company, the amendments in Part I of this Update are effective for fiscal years beginning after December 15, 2019, and interim periods within fiscal years beginning after December 15, 2020. Early adoption is permitted, including adoption in an interim period. If an entity early adopts the amendments in an interim period, any adjustments should be reflected as of the beginning of the fiscal year that includes that interim period. The amendments in Part II of this Update do not require any transition guidance because those amendments do not have an accounting effect.
In August 2017, the FASB issued ASU 2017-12, Derivatives and Hedging (Topic 815): Targeted Improvements to Accounting for Hedging Activities, which expands and refines hedge accounting for both financial and non-financial risk components, aligns the recognition and presentation of the effects of hedging instruments and hedge items in the financial statements, and includes certain targeted improvements to ease the application of current guidance related to the assessment of hedge effectiveness. ASU 2017-12 is effective for the Company for fiscal years beginning after December 15, 2019. Early adoption is permitted. The Company has not yet evaluated the impact of this standard on its unaudited condensed financial statements and related disclosures.
Note 4—Earnings Per Share
The Transaction was structured as a reverse recapitalization by which the Company issued stock for the net assets of Rosehill Operating accompanied by a recapitalization. Earnings per share has been recast for all historical periods to reflect the Company’s capital structure for all comparative periods.
The following table sets forth the calculation of basic and diluted weighted average shares outstanding and earnings per share for the indicated periods:
| Three Months Ended September 30, |
Nine Months Ended September 30, |
|||||||||||||||
| 2017 | 2016 | 2017 | 2016 | |||||||||||||
| (in thousands except per share data) | (unaudited) | |||||||||||||||
| Net Income (Loss) (numerator): |
||||||||||||||||
| Basic: |
||||||||||||||||
| Net income (loss) attributable to common stockholders of Rosehill Resources Inc. |
$ | (464 | ) | $ | (182 | ) | $ | (3,207 | ) | $ | (8,136 | ) | ||||
| Diluted: |
||||||||||||||||
| Net income (loss) attributable to common stockholders of Rosehill Resources Inc. |
$ | (464 | ) | $ | (182 | ) | $ | (3,207 | ) | $ | (8,136 | ) | ||||
| Add: Dividends on convertible preferred stock |
||||||||||||||||
| Net income (loss) attributable to common stockholders of Rosehill Resources Inc.—diluted |
$ | (464 | ) | $ | (182 | ) | $ | (3,207 | ) | $ | (8,136 | ) | ||||
| Weighted average shares (denominator): |
||||||||||||||||
| Weighted average shares—basic |
5,857 | 5,857 | 5,857 | 5,857 | ||||||||||||
| Dilutive effect of convertible preferred stock |
||||||||||||||||
| Weighted average shares—diluted |
5,857 | 5,857 | 5,857 | 5,857 | ||||||||||||
| Basic earnings per share |
$ | (0.08 | ) | $ | (0.03 | ) | $ | (0.55 | ) | $ | (1.39 | ) | ||||
| Diluted earnings per share |
$ | (0.08 | ) | $ | (0.03 | ) | $ | (0.55 | ) | $ | (1.39 | ) | ||||
For the three and nine months ended September 30, 2017 the Company excluded the following common stock equivalents from the computation of diluted earnings per share because the effect of conversion was antidilutive as a result of the net loss for the periods:
| • | 8.5 million shares of Class A common stock issuable upon conversion of the Company’s Series A Preferred Stock, |
F-37
Table of Contents
Index to Financial Statements
| • | 25.6 million warrants convertible into shares of Class A common stock, and |
| • | 0.1 million shares of unvested restricted Class A common stock issued to directors. |
Note 5—Accounts Receivable
Accounts receivable is comprised of the following:
| September 30, 2017 | December 31, 2016 | |||||||
| (in thousands) | (unaudited) | |||||||
| Revenue receivable |
$ | 1,417 | $ | 1,291 | ||||
| Joint interest billings |
526 | 557 | ||||||
| Other |
— | 80 | ||||||
|
|
|
|
|
|||||
| Accounts receivable |
$ | 1,943 | $ | 1,928 | ||||
|
|
|
|
|
|||||
Note 6—Derivative Instruments
The Company enters into various derivative instruments to mitigate a portion of the exposure to potentially adverse market changes in commodity prices, market interest rates and associated impact on cash flows. All contracts are entered into for other-than-trading purposes.
Tema’s interest rate swap was terminated by Tema on April 20, 2017. At the closing of the Transaction, selected crude oil options and natural gas options were designated to remain with Tema. In connection with the Transaction, certain crude oil swaps and natural gas swaps were transferred to the Company. Contracts with one counterparty were finally novated to the Company in July 2017.
The fair value of the derivative assets and liabilities is as follows as of the respective dates:
| September 30, 2017 |
December 31, 2016 |
|||||||
| (unaudited) | ||||||||
| Derivative assets—Current |
||||||||
| Commodity derivative options |
$ | 48 | $ | 21 | ||||
| Commodity derivative swaps |
54 | — | ||||||
| Interest rate swap |
— | 226 | ||||||
|
|
|
|
|
|||||
| Total Derivative assets—Current |
$ | 102 | $ | 247 | ||||
|
|
|
|
|
|||||
| Derivative liabilities—Current |
||||||||
| Commodity derivative swaps |
$ | — | $ | 1,856 | ||||
|
|
|
|
|
|||||
| Total Derivative liabilities—Current |
$ | — | $ | 1,856 | ||||
|
|
|
|
|
|||||
| Derivative liabilities—Non current |
||||||||
| Commodity derivative swaps |
$ | 115 | $ | — | ||||
|
|
|
|
|
|||||
| Total Derivative liabilities—Non current |
$ | 115 | $ | — | ||||
|
|
|
|
|
|||||
F-38
Table of Contents
Index to Financial Statements
As of September 30, 2017, the open commodity derivative positions with respect to future production were as follows:
| 2017 | 2018 | 2019 | ||||||||||
| Commodity derivative swaps |
||||||||||||
| Oil: |
||||||||||||
| Notional volume (Barrels) |
144,000 | 450,000 | 108,000 | |||||||||
| Weighted average price ($/Barrel) |
$ | 52.78 | $ | 50.92 | $ | 51.04 | ||||||
| Natural Gas: |
||||||||||||
| Notional volume (MMBtu) |
390,000 | 1,230,000 | 60,000 | |||||||||
| Weighted average price ($/MMBtu) |
$ | 3.13 | $ | 3.25 | $ | 3.03 | ||||||
| Commodity derivative options |
||||||||||||
| Natural Gas: |
||||||||||||
| Notional volume (MMBtu) |
180,000 | — | — | |||||||||
| Weighted average price ($/MMBtu) |
$ | 3.32 | $ | — | $ | — | ||||||
For the three and nine months ended September 30, 2017 and 2016, the effect of the derivative activity on the Company’s Condensed Consolidated Statements of Operations was as follows:
| Three Months Ended September 30, |
Nine Months Ended September 30, |
|||||||||||||||
| (in thousands) | 2017 | 2016 | 2017 | 2016 | ||||||||||||
| Realized gain (loss) on derivatives |
||||||||||||||||
| Commodity derivative options |
$ | 18 | $ | (10 | ) | $ | 172 | $ | (24 | ) | ||||||
| Commodity derivative swaps |
454 | (315 | ) | (10 | ) | 507 | ||||||||||
|
|
|
|
|
|
|
|
|
|||||||||
| Total |
472 | (325 | ) | 162 | 483 | |||||||||||
| Interest rate swap |
6 | (185 | ) | (143 | ) | (606 | ) | |||||||||
|
|
|
|
|
|
|
|
|
|||||||||
| Total realized gain (loss) on derivatives |
$ | 478 | $ | (510 | ) | $ | 19 | $ | (123 | ) | ||||||
|
|
|
|
|
|
|
|
|
|||||||||
| Unrealized gain (loss) on derivatives |
||||||||||||||||
| Commodity derivative options |
$ | 55 | $ | 94 | $ | 361 | $ | (1,395 | ) | |||||||
| Commodity derivative swaps |
(1,978 | ) | — | 1,228 | (1,220 | ) | ||||||||||
|
|
|
|
|
|
|
|
|
|||||||||
| Total |
(1,923 | ) | 94 | 1,589 | (2,615 | ) | ||||||||||
| Interest rate swap |
— | 232 | (226 | ) | (549 | ) | ||||||||||
|
|
|
|
|
|
|
|
|
|||||||||
| Total unrealized gain (loss) on derivatives |
$ | (1,923 | ) | $ | 326 | $ | 1,363 | $ | (3,164 | ) | ||||||
|
|
|
|
|
|
|
|
|
|||||||||
The gains and losses resulting from the cash settlement and mark-to-market of the commodity derivatives are included within “Other income (expense)” in the Condensed Consolidated Statements of Operations. The gains and losses resulting from the cash settlement and mark-to-market of the interest rate swap are included in “Interest expense” in the Condensed Consolidated Statements of Operations.
Note 7—Fair Value Measurements
Fair value is the price that would be received to sell an asset or paid to transfer a liability in an orderly transaction between market participants at the measurement date (exit price). Fair value measurements are classified and disclosed within the following fair value hierarchy:
Level 1—Unadjusted quoted prices in active markets that are accessible at the measurement date for identical, unrestricted assets or liabilities. Active markets are those in which transactions for the assets or liabilities occur with sufficient frequency and volume to provide pricing information on an ongoing basis.
F-39
Table of Contents
Index to Financial Statements
Level 2—Quoted prices in markets that are not active, or inputs that are observable, either directly or indirectly, for substantially the full term of the asset or liability. This category includes those derivative instruments that are valued using observable market data.
Level 3—Measured based on prices or valuation models that require inputs that are both significant to the fair value measurement and less observable from objective sources. Pricing inputs are unobservable for the investment and includes situations where there is little, if any, market activity for the investment.
Observable data is considered to be market data if it is readily available, regularly distributed or updated, reliable and verifiable, not proprietary, provided by multiple, independent sources that are actively involved in the relevant market. In certain cases, the inputs used to measure fair value may fall into different levels of the fair value hierarchy. In such cases, an investment’s level with the fair value hierarchy is based on lowest level of input that is significant to the fair value measurement. The assessment of the significance of a particular input to the fair value measurement in its entirety requires judgment and considers factors specific to the investment. However, the determination of what constitutes “observable” requires significant judgment. The categorization of an investment within the hierarchy is based upon the pricing transparency of the investment and does not necessarily correspond to the perceived risk of that investment.
Fair Value of Financial Instruments
The financial instruments measured at fair value on a recurring basis consist of the following:
| September 30, 2017 |
December 31, 2016 |
|||||||
| (in thousands) | (unaudited) | |||||||
| Derivative assets (liabilities) |
||||||||
| Derivative assets—current |
$ | 102 | $ | 247 | ||||
| Derivative liabilities—current |
— | (1,856 | ) | |||||
| Derivative liabilities—non current |
(115 | ) | — | |||||
|
|
|
|
|
|||||
| Total derivative assets (liabilities) |
$ | (13 | ) | $ | (1,609 | ) | ||
|
|
|
|
|
|||||
Derivative assets and liabilities represent unrealized amounts related to the derivative positions on the Condensed Consolidated Balance Sheets.
The tables below set forth by level within the fair value hierarchy represent the gross components of the assets and liabilities that were measured at fair value on a recurring basis as of September 30, 2017 and December 31, 2016. These gross balances are intended solely to provide information on sources of inputs to fair value and proportions of fair value involving objective versus subjective valuations and do not represent either the actual credit exposure or net economic exposure.
| September 30, 2017 | ||||||||||||||||
| (in thousands) | Level 1 | Level 2 | Level 3 | Total | ||||||||||||
| Derivative assets (liabilities) |
||||||||||||||||
| Derivative assets—current |
$ | — | $ | 102 | $ | — | $ | 102 | ||||||||
| Derivative liabilities—non current |
— | (115 | ) | — | (115 | ) | ||||||||||
|
|
|
|
|
|
|
|
|
|||||||||
| Total derivative assets (liabilities) |
$ | — | $ | (13 | ) | $ | — | $ | (13 | ) | ||||||
|
|
|
|
|
|
|
|
|
|||||||||
F-40
Table of Contents
Index to Financial Statements
| December 31, 2016 | ||||||||||||||||
| (in thousands) | Level 1 | Level 2 | Level 3 | Total | ||||||||||||
| Derivative assets (liabilities) |
||||||||||||||||
| Derivative assets—current |
$ | 21 | $ | 226 | $ | — | $ | 247 | ||||||||
| Derivative liabilities—non current |
(1,856 | ) | — | — | (1,856 | ) | ||||||||||
|
|
|
|
|
|
|
|
|
|||||||||
| Total derivative assets (liabilities) |
$ | (1,835 | ) | $ | 226 | $ | — | $ | (1,609 | ) | ||||||
|
|
|
|
|
|
|
|
|
|||||||||
Financing Arrangements
The fair value measurements for amounts outstanding under the Credit Agreement (see Note 11—Revolving Credit Facility) represent Level 2 inputs. Based on the average of certain imputed interest rates, the book value of the amount outstanding under the Tema Credit Agreement (see Note 11—Revolving Credit Facility) approximates the fair value at December 31, 2016. The book value of the amount outstanding under the Credit Agreement approximated the fair value at September 30, 2017.
Non-Financial Assets and Liabilities
Non-financial assets and liabilities that are initially measured at fair value are comprised of asset retirement obligations and the corresponding increase to the related long-lived asset and are not remeasured at fair value in subsequent periods. Such initial measurements are classified as Level 3 since certain significant unobservable inputs are utilized in their determination. The fair value of additions to asset retirement obligation liability and certain changes in the estimated fair value of the liability are measured using valuation techniques consistent with the income approach, converting future cash flows to a single discounted amount. Significant inputs to the valuation include (i) estimated plug and abandonment cost per well based on historical experience and information from third-party vendors; (ii) estimated remaining life per well; (iii) future inflation factors; and (iv) average credit-adjusted risk-free rate. These inputs require significant judgments and estimates by management at the time of the valuation and are the most sensitive and subject to change.
If the carrying amount of oil and natural gas properties exceeds the estimated undiscounted future cash flows, the carrying amount of the oil and natural gas properties will be adjusted to the fair value. The fair value of oil and natural gas properties is determined using valuation techniques consistent with the income and market approach. The factors used to determine fair value are subject to management’s judgment and expertise and include, but are not limited to, (i) recent sales prices of comparable properties; (ii) the present value of future cash flows, net of estimated operating and development costs using estimates of proved oil and natural gas reserves; (iii) future commodity prices; (iv) future production estimates; (v) anticipated capital expenditures; and (vi) various discount rates commensurate with the risk and current market conditions associated with the projected cash flows. These assumptions represent “Level 3” inputs.
Note 8—Property and equipment
Property and equipment is comprised of the following:
| September 30, 2017 |
December 31, 2016 |
|||||||
| (in thousands) | (unaudited) | |||||||
| Proved oil and natural gas properties |
$ | 377,517 | $ | 258,530 | ||||
| Unproved oil and natural gas properties |
533 | 1,942 | ||||||
| Land |
406 | 1,561 | ||||||
| Other property and equipment |
3,695 | 3,807 | ||||||
|
|
|
|
|
|||||
| Total property and equipment |
382,151 | 265,840 | ||||||
| Less: accumulated DD&A(1) |
(168,125 | ) | (142,467 | ) | ||||
|
|
|
|
|
|||||
| Total Property and equipment, net |
$ | 214,026 | $ | 123,373 | ||||
|
|
|
|
|
|||||
F-41
Table of Contents
Index to Financial Statements
| (1) | Accumulated Depreciation, Depletion and Amortization (“DD&A”) of oil and natural gas properties including impairment, is $165.5 million and $139.8 million as of September 30, 2017 and December 31, 2016, respectively. |
DD&A expense related to oil and natural gas properties was $8.2 million and $5.7 million for the three months ended September 30, 2017 and 2016, respectively, and $25.7 million and $16.1 million for the nine months ended September 30, 2017 and 2016, respectively. Depreciation and amortization expense related to other property and equipment was $0.1 million for the three months ended September 30, 2017 and 2016, respectively; and $0.3 million for the nine months ended September 30, 2017 and 2016, respectively. No impairment charges related to proved and unproved oil and natural gas properties were recorded for the three or nine months ended September 30, 2017 and 2016. There were no exploratory well costs pending determination of proved reserves as of September 30, 2017 or December 31, 2016 nor any unsuccessful exploratory dry hole costs during the nine months ended September 30, 2017 or September 30, 2016.
In the second quarter of 2017, Rosehill Operating completed the purchase of additional working interests in various operated wells and leasehold interests in Loving County, Texas, from unaffiliated individuals and entities for total consideration of $6.5 million, which approximates fair value. The effective date of the purchase of the working interests was May 1, 2017. The acquisition was accounted for using the acquisition method under ASC 805, Business Combinations, which requires acquired assets and liabilities to be recorded at fair value as of the acquisition date. The difference between the historical results of operations and the unaudited pro forma results of operations for the three and nine months ended September 30, 2017 and 2016 was determined to be de minimus and therefore not provided.
In October 2017, the Company sold all of its properties in the Fort Worth Basin including the Company’s future abandonment and reclamation liabilities associated with these properties for cash proceeds of $6.2 million, subject to normal and customary post-closing adjustments to reflect an effective date of August 1, 2017. The Company estimates that it will realize a gain on the sale of these properties of approximately $4.0 million in the fourth quarter of 2017.
Note 9—Asset Retirement Obligations
The change in asset retirement obligations or the nine month period ended September 30, 2017 is set forth below:
| (in thousands) |
||||
| Balance at January 1, 2017 |
$ | 5,431 | ||
| Liabilities incurred |
783 | |||
| Liabilities settled |
(725 | ) | ||
| Accretion expense |
198 | |||
|
|
|
|||
| Balance at September 30, 2017 |
5,687 | |||
| Less: current portion |
(252 | ) | ||
|
|
|
|||
| Long-term portion at September 30, 2017 |
$ | 5,435 | ||
|
|
|
F-42
Table of Contents
Index to Financial Statements
Note 10—Accrued Liabilities and Other
Accrued liabilities and other is comprised of the following as of the respective dates:
| September 30, 2017 |
December 31, 2016 |
|||||||
| (in thousands) | (unaudited) | |||||||
| Accrued payroll |
$ | 1,819 | $ | 948 | ||||
| Accrued legal and professional fees |
750 | 223 | ||||||
| Production taxes |
138 | 120 | ||||||
| Property taxes |
342 | — | ||||||
| Royalties payable |
1,833 | 2,494 | ||||||
| Advances from joint owners |
113 | 219 | ||||||
| Asset retirement obligations, current |
252 | 251 | ||||||
| Accrued lease operating expense |
694 | — | ||||||
| Accrued capital expenditures |
18,046 | 2,443 | ||||||
| Other |
364 | 399 | ||||||
|
|
|
|
|
|||||
| Total accrued liabilities and other |
$ | 24,351 | $ | 7,097 | ||||
|
|
|
|
|
|||||
Note 11—Revolving Credit Facility
Credit Agreement
On April 27, 2017, Rosehill Operating and PNC Bank, National Association, as lender, Administrative Agent and Issuing Bank, and each of the lenders from time to time party thereto (collectively, the “Lenders”) entered into a credit agreement, which provides Rosehill Operating with a revolving line of credit and a letter of credit facility of up to $250 million (the “Credit Agreement”), subject to a borrowing base that is determined semi-annually by the Lenders based upon Rosehill Operating’s financial statements and the estimated value of its oil and gas properties, in accordance with the Lenders’ customary practices for oil and gas loans. Such redetermined borrowing base will become effective and applicable to Rosehill Operating and the Lenders on or about April 1st and October 1st of each year, as applicable, commencing October 1, 2017. Rosehill Operating and the Lenders may each request an additional redetermination of the borrowing base once between two successive scheduled redeterminations. The borrowing base will be automatically reduced upon the issuance or incurrence of debt under senior unsecured notes or upon Rosehill Operating’s or any of its subsidiary’s disposition of properties or liquidation of hedges in excess of certain thresholds. Amounts borrowed under the Credit Agreement may not exceed the borrowing base. Rosehill Operating’s initial borrowing base was $55 million, which may be increased with the consent of all Lenders. On October 30, 2017, the Company’s borrowing base capacity was increased to $75 million. The Credit Agreement also does not permit Rosehill Operating to borrow funds if at the time of such borrowing Rosehill Operating is not in pro forma compliance with the financial covenants. Additionally, Rosehill Operating’s borrowing base may be reduced in connection with the subsequent redetermination of the borrowing base. The amounts outstanding under the Credit Agreement are secured by first priority liens on substantially all of Rosehill Operating’s oil and natural gas properties and associated assets and all of the stock of Rosehill Operating’s material operating subsidiaries that are guarantors of the Credit Agreement. If an event of default occurs under the Credit Agreement, the Lenders have the right to proceed against the pledged capital stock and take control of substantially all of Rosehill Operating and Rosehill Operating’s material operating subsidiaries that are guarantors’ assets.
Borrowings under the Credit Agreement will bear interest at a base rate plus an applicable margin ranging from 1.00% to 2.00% or at London Interbank Offered Rate (“LIBOR”) plus an applicable margin ranging from 2.00% to 3.00%. The Credit Agreement matures on April 27, 2022. The amount outstanding as of September 30, 2017 under the Credit Agreement was $50.0 million with a weighted average interest rate of 3.2%.
F-43
Table of Contents
Index to Financial Statements
The Credit Agreement contains various affirmative and negative covenants. These covenants may limit Rosehill Operating’s ability to, among other things: incur additional indebtedness; make loans to others; make investments; enter into mergers; make or declare dividends or distributions; enter into commodity hedges exceeding a specified percentage of Rosehill Operating’s expected production; enter into interest rate hedges exceeding a specified percentage of Rosehill Operating’s outstanding indebtedness; incur liens; sell assets; and engage in certain other transactions without the prior consent of the Lenders.
The Credit Agreement also requires Rosehill Operating to maintain the following financial ratios: (1) a working capital ratio, which is the ratio of consolidated current assets (including unused commitments under the Credit Agreement, but excluding non-cash assets) to consolidated current liabilities (excluding non-cash obligations, reclamation obligations to the extent classified as current liabilities and current maturities under the Credit Agreement), of not less than 1.0 to 1.0, and (2) a leverage ratio, which is the ratio of the sum of all of Rosehill Operating’s Total Funded Debt to EBITDAX (as such terms are defined in the Credit Agreement) for the four fiscal quarters then ended, of not greater than 4.00 to 1.00. We were in compliance with the leverage ratio covenant in the Credit Agreement for the measurement period ended September 30, 2017. In connection with increasing its borrowing base under the Credit Agreement, Rosehill Operating received a limited waiver of compliance with the working capital covenant until the quarter ending December 31, 2018, subject to an earlier reinstatement of the working capital covenant upon the occurrence of certain conditions.
Tema Credit Agreement
In December 2012, Tema entered into a secured line of credit with a bank for $60 million (the “Tema Credit Agreement”), with an optional expansion to $75 million, subject to satisfactory credit underwriting. Borrowings under the Tema Credit Agreement bore interest at floating LIBOR plus 1.00% (the Applicable Margin), and was collateralized by the existing producing oil and natural gas properties. There was no principal amortization required until the expiration of the Tema Credit Agreement, when all outstanding amounts became due.
Upon the closing of the Transaction on April 27, 2017, the $55 million outstanding balance under the Tema Credit Agreement was assumed by Rosehill Operating and immediately paid off using proceeds from the issuance of preferred stock in the Transaction. Concurrent with the initial drawdown of the Tema Credit Agreement, an interest rate swap was entered into with a bank to fix the interest rate of the Tema Credit Agreement. In anticipation of the closing of the Transaction on April 20, 2017, the interest rate swap was terminated by Tema.
Deferred Financing Costs
Deferred financing costs incurred in connection with securing the Credit Agreement were $0.6 million and as of September 30, 2017, the net balance of $0.6 million was included in other long-term assets in the condensed consolidated balance sheet.
Note 12—Income Taxes
The Company’s sole material asset is its interest in Rosehill Operating, which is treated as a partnership for U.S. federal income tax purposes and for purposes of certain state and local income taxes. Rosehill Operating’s net taxable income and any related tax credits are passed through to its members and are included in the members’ tax returns, even though such net taxable income or tax credits may not have actually been distributed. While the Company consolidates Rosehill Operating for financial reporting purposes, the Company will be taxed on its share of future earnings not attributed to the noncontrolling interest holder, Tema, which will continue to bear its own share of income tax on future earnings. The income tax burden on the earnings taxed to the noncontrolling interest is not reported by the Company in its condensed consolidated financial statements under GAAP. As a result, the Company’s effective tax rate could materially differ from the statutory rate. The Company currently estimates its annual effective income tax rate to be approximately 35% as a result of the
F-44
Table of Contents
Index to Financial Statements
Company’s estimate of the mix of taxable income attributable directly to the Company and the net taxable income (and any related tax credits) passed through from its ownership in Rosehill Operating. Changes in this mix may result in the Company’s effective tax rate varying significantly in future periods.
The Company is presently forecasting pre-tax income for 2017. However, the Company has recognized a pre-tax loss for the nine-months ended September 30, 2017, and is required to record a deferred tax benefit related to this loss before income taxes. This benefit is expected to reverse in the fourth quarter of 2017 when forecasted pre-tax income is realized. Total income tax expense will be adjusted for the variance between forecasted and actual results. The Company is not expecting to pay any federal income taxes for 2017 at this time.
The Company expects that its excess tax basis in its investment in Rosehill Operating over its book carrying value in this investment resulting from the Transaction will reduce certain income tax payments in the future. A valuation allowance was recorded at the effective time of the Transaction because Management does not believe it is more likely-than-not that this difference will reverse in the foreseeable future. The realization of future tax benefits from the Transaction will not cause a reduction in the effective tax rate of the Company, as it will be credited to additional paid in capital when recognized.
Additionally, the Company is treated as having acquired a net operating loss carryover of approximately $0.4 million in the Transaction. Because utilization of the carryover may be subject to a Section 382 limitation, the Company does not presently believe that these deferred tax assets are more likely than not realizable, these assets are fully offset by a valuation allowance. As a result, no net deferred tax assets are presently recorded on the financial statements. Any future tax benefit resulting from the realization of a deferred tax asset related to these operating loss carryovers will not cause a reduction in the effective tax rate of the Company, as it will be credited to additional paid in capital when recognized.
In connection with the Transaction, the Company entered into a Tax Receivable Agreement (“TRA“) with the noncontrolling interest holder, Tema. The TRA provides that the Company will pay to Tema of 90% of the net cash savings, if any, in U.S. federal, state and local income tax that the Company realizes (or is deemed to realize in certain circumstances) in periods beginning with and after the closing of the Transaction as a result of the following: (i) any tax basis increases in the assets of Rosehill Operating resulting from the distribution to Tema of the cash consideration, the shares of Class B common stock and warrants and the assumption of Tema liabilities in connection with the Transaction, (ii) the tax basis increases in the assets of Rosehill Operating resulting from the redemption by Rosehill Operating or the exchange by the Company, as applicable, of Rosehill Operating common units for Class A common stock or cash, as applicable, and (iii) imputed interest deemed to be paid by the Company as a result of, and additional tax basis arising from, payments it makes under the TRA.
No liability under the TRA has been recognized in the accompanying condensed consolidated balance sheet. If and when Tema exercises its right to cause the Company to redeem all or a portion of its Rosehill Operating common units, a liability under the TRA will be recorded. The amount of liability will be based on 90% of the estimated future cash tax savings that the Company will realize as a result of increases in the basis of Rosehill Operating’s assets attributed to the Company resulting from such redemption. The amount of the increase in asset basis, the related estimated cash tax savings and the attendant TRA liability will depend on the price of the Company’s Class A common stock at the time of the relevant redemption. Due to the uncertainty surrounding the amount and timing of future redemptions of Rosehill Operating common units by Tema, the Company does not believe it is appropriate to record a TRA liability until such time that Rosehill Operating common units are redeemed or converted into the Company’s Class A common shares or cash.
The effects of uncertain tax positions are recognized in the condensed consolidated financial statements if these positions meet a “more-likely-than-not” threshold. For those uncertain tax positions that are recognized, liabilities are established to reflect the portion of those positions that the Company cannot conclude are “more-likely-than-not” to be realized upon ultimate settlement. The Company’s policy is to recognize interest and
F-45
Table of Contents
Index to Financial Statements
penalties related to uncertain tax positions in income tax expense. As of September 30, 2017, no uncertain tax positions were recognized as liabilities in the condensed consolidated financial statements.
Note 13—Stockholders’ Equity
The following description summarizes the material terms and provisions of the securities that the Company has authorized. For the complete terms of these securities, refer to the Company’s amended and restated certificate of incorporation, and bylaws, which are incorporated by reference into this Registration Statement on Form S-1.
Prior to the Transaction, KLRE was a shell company with no operations, formed as a vehicle to effect a business combination with one or more operating businesses. After the closing of the Transaction, the Company became a holding company whose sole material asset is its interest in Rosehill Operating. The following table summarizes the changes in the outstanding preferred stock, common stock and Class A common stock warrants through the date of the Transaction.
| Series A Preferred Stock |
Class A Common Stock |
Class B Common Stock |
Class F Common Stock |
Total Shares of Common Stock |
Class A Common Stock Warrants |
|||||||||||||||||||
| Issued at formation |
— | 588,276 | — | 4,312,500 | 4,900,776 | 588,276 | ||||||||||||||||||
| Issued at IPO |
— | 7,597,044 | — | — | 7,597,044 | 7,597,044 | ||||||||||||||||||
| Issued in connection with private placement |
— | — | — | — | — | 8,408,838 | ||||||||||||||||||
| Forfeitures/Cancellation of founder shares |
— | — | — | (2,266,170 | ) | (2,266,170 | ) | — | ||||||||||||||||
| Conversion of founder shares |
— | 3,475,665 | — | (2,046,330 | ) | 1,429,335 | — | |||||||||||||||||
| Redemption of Class A shares |
— | (5,804,404 | ) | — | — | (5,804,404 | ) | — | ||||||||||||||||
| Issued to Tema in connection with the Transaction |
— | — | 29,807,692 | — | 29,807,692 | 4,000,000 | ||||||||||||||||||
| Preferred stock and warrants issued to PIPE Investors |
75,000 | — | — | — | — | 5,000,000 | ||||||||||||||||||
| Preferred stock issued to Sponsor and Rosemore Holdings, Inc. |
20,000 | — | — | — | — | — | ||||||||||||||||||
|
|
|
|
|
|
|
|
|
|
|
|
|
|||||||||||||
| Outstanding at the Transaction date |
75,000 | 5,856,581 | 29,807,692 | — | 35,664,273 | 25,594,158 | ||||||||||||||||||
Class A Common Stock. Holders of the Company’s Class A Common Stock are entitled to one vote for each share held on all matters to be voted on by the stockholders. Holders of the Class A Common Stock and holders of the Class B Common Stock voting together as a single class, have the exclusive right to vote for the election of directors and on all other matters properly submitted to a vote of the stockholders. Additionally, the Sponsor and Tema agreed to restrictions on certain transfers of the Company’s securities, which include, subject to certain exceptions, restrictions on the transfer of (i) 33% of their common stock through the first anniversary of the closing date of the Transaction and (ii) 67% of their common stock through the second anniversary of the closing date, provided that sales of common stock above $18.00 per share will be permitted between the first and second anniversaries of the closing date of the Transaction. Further, in connection with underwritten offerings by the Sponsor and Tema, and subject to certain conditions, sales of common stock at a price reasonably expected to equal or exceed $18.00 per share and in any case equal to or in excess of $16.00 per share will be permitted.
In connection with the Transaction, the Company distributed approximately $60.6 million of the cash proceeds from the Company’s initial public offering to redeem $5.8 million shares of Class A common stock, which shares were then cancelled by the Company. Cash transferred to Rosehill Operating, net of transaction expenses incurred in connection with the Transaction, was $18.7 million.
F-46
Table of Contents
Index to Financial Statements
Class B Common Stock. Shares of Class B common stock may be issued only to Tema, their respective successors and assignees, as well as any permitted transferees of Tema. A holder of Class B common stock may transfer shares of Class B common stock to any transferee (other than the Company) only if such holder also simultaneously transfers an equal number of such holder’s Rosehill Operating common units to such transferee in compliance with the LLC Agreement. Holders of the Company’s Class B common stock will vote together as a single class with holders of the Company’s Class A common stock on all matters properly submitted to a vote of the stockholders.
Holders of Class B common stock, generally have the right to cause the Company to redeem all or a portion of their stock in exchange for shares of the Company’s class A common stock on a one-to-one basis or, at the Company’s option, an equivalent amount of cash. The Company may, however, at its option, affect a direct exchange of cash or Class A common stock for such Rosehill Operating common units in lieu of such a redemption. Upon the future redemption or exchange of Rosehill Operating common units, a corresponding number of shares of Class B common stock will be canceled.
In the Transaction, the Company issued to Rosehill Operating 29,807,692 shares of its Class B common stock and 4,000,000 warrants exercisable for shares of its Class A common stock in exchange for 4,000,000 warrants exercisable for Rosehill Operating common units. Rosehill Operating immediately distributed the warrants and shares of Class B common stock to Tema.
Class F Common Stock. In November 2015, pursuant to the Securities Subscription Agreement, dated as of November 20, 2015, the Sponsor purchased 4,312,500 shares of Class F common stock (the “Founder Shares”) for $25,000. The Founder Shares were identical to the Class A common stock included in the units sold in its initial public offering (“IPO”) except that the Founder Shares were subject to certain transfer restrictions. In December 2015, February 2016 and March 2016, the Sponsor and the Company’s officers returned an aggregate of 575,000; 862,500; and 828,670 Founder Shares, respectively, at no cost. All of the Founder Shares returned were canceled by the Company.
The 2,046,330 remaining Founder Shares represented 20.0% of the outstanding shares upon the completion of the IPO. On April 28, 2017, all of the outstanding Founder Shares were automatically converted into 3,475,665 shares of Class A common stock in connection with the Transaction. As used herein, unless the context otherwise requires, the “Founder Shares” are deemed to include the shares of Class A common stock issued upon conversion of the Founder Shares and such converted shares continue to be subject to certain transfer restrictions.
8% Series A Cumulative Perpetual Convertible Preferred Stock. Each share of Series A Preferred Stock has a liquidation preference of $1,000 per share and is convertible, at the holder’s option at any time, initially into 86.9565 shares of the Company’s Class A common stock (which is equivalent to an initial conversion price of approximately $11.50 per share of Class A common stock), subject to specified adjustments and limitations as set forth in the Certificate of Designations of Series A Preferred Stock (the “Certificate of Designations”). Under certain circumstances, the Company will increase the conversion rate upon a “fundamental change” as described in the Certificate of Designations. Based on the initial conversion rate, 8,547,650 shares of the Company’s Class A common stock would be issuable upon conversion of all of the Series A Preferred Stock outstanding at September 30, 2017.
The Company contributed the net proceeds of $70.8 million ($75 million gross proceeds, net of $4.2 million in issuance costs) from its issuance of 75,000shares of Series A Preferred Stock and 5,000,000 warrants (the “PIPE Warrants”), exercisable for shares of Class A common stock, to Rosehill Operating. In connection with the issuance of the Series A Preferred Stock, the Sponsor transferred 476,540 of its Class A common shares to the PIPE Investors to consummate the transaction. The net proceeds from the issuance of these preferred shares and warrants was attributed to the preferred stock, warrants and Class A shares contributed by the Sponsor issued to the PIPE Investors based on the relative fair value of those securities using, among other factors, the closing price of the Class A common stock and the closing price of the warrants on April 27, 2017.
F-47
Table of Contents
Index to Financial Statements
The nondetachable conversion option embedded in the Series A Preferred Stock was evaluated pursuant to ASC 470-20 to determine whether a beneficial conversion feature existed as of the closing date of the Transaction which would be recognized separately from the Series A Preferred Stock in the Company’s consolidated financial statements. The conversion option is considered beneficial if, at the commitment closing date, the effective conversion price (represented by the proceeds received less the allocated value of the Class A warrants and Class A common stock) for the Series A Preferred Stock is less than the fair value of the Class A common stock into which it is convertible at the commitment closing date. As a result of this evaluation, the Company separately recognized in equity, with an offsetting reduction in the carrying amount of the Series A Preferred Stock, the value of the beneficial conversion feature at the commitment date of $6.7 million. Since the Company’s Series A Preferred Stock is perpetual and has no stated maturity date and no restrictions on conversion, the value attributable to the nondetachable conversion option was recognized immediately as a non-cash deemed dividend on the date that the Series A Preferred Stock was issued. As a result, Preferred stock dividends for the nine months ended September 30, 2017, of $10.0 million includes the non-cash deemed dividend of $6.7 million related to the value of the nondetachable beneficial conversion option. The Company will ratably recognize additional non-cash deemed dividends attributable to the Series A Preferred Stock discount which was created by the issuance of the Class A warrants and the contribution of the Class A common stock, as the Series A Preferred Stock which was sold to the PIPE investors is converted. These additional non-cash deemed dividends will, upon Series A Preferred Stock conversions, reduce net income attributable to Rosehill Resources Inc, common stockholders. Additionally, future issuances of Series A Preferred Stock resulting from dividends paid-in-kind may, depending on the trading price per share of the Company’s Class A common stock on the dividend date, contain a beneficial conversion option determined on the same basis as described above and, thus, result in additional non-cash deemed dividends which will reduce net income attributable to Rosehill Resources Inc. common stockholders when such paid-in-kind preferred shares are granted.
The table below summarizes the preferred stock dividends reflected in the Company’s condensed consolidated statements of operations for the periods shown:
| (in thousands) | Three Months Ended September 30, 2017 |
Nine Months Ended September 30, 2017 |
||||||
| Dividends paid-in-kind |
$ | 1,926 | $ | 3,298 | ||||
| Dividends declared and payable in cash |
16 | 16 | ||||||
| Non-cash deemed dividends |
— | 6,700 | ||||||
|
|
|
|
|
|||||
| $ | 1,942 | $ | 10,014 | |||||
|
|
|
|
|
|||||
Rosemore and the Sponsor backstopped redemptions by the public stockholders of the Company once 30% of the outstanding shares of Class A common stock were redeemed by purchasing 20,000 shares of Series A Preferred Stock for net proceeds of $20 million pursuant to a side letter entered into between Rosemore, the Sponsor and the Company.
The Company contributed to Rosehill Operating the net proceeds from the issuance of 20,000 shares of Series A Preferred Stock to Rosemore Holdings, Inc. and the Sponsor.
The Company’s Board of Directors declared dividends on the Series A Preferred Stock on June 29, 2017 and September 29, 2017, which dividends were paid in-kind through the issuance of 1,372 and 1,926 shares of Series A Preferred Stock on July 15, 2017 and October 16, 2017, respectively.
Warrants. Each of the Company’s warrants entitles the registered holder to purchase one share of the Company’s Class A common stock at a price of $11.50 per share, subject to adjustment pursuant the terms of the warrant agreement. The warrants have a five-year term which commenced on April 27, 2017, upon the completion of the Transaction and will expire on April 27, 2022. The Company may call the warrants for redemption if the reported last sale price of the Class A common stock equals or exceeds $21.00 per share for
F-48
Table of Contents
Index to Financial Statements
any 20 trading days within a 30-trading day period ending on the third trading day prior to the date the Company sends the notice of redemption to the warrant holders.
There were 588,276 warrants issued in connection with the formation of the Company and 7,597,044 public warrants issued in connection with KLRE’s IPO. Additionally, there were 8,408,838 warrants issued to the Sponsor and EarlyBirdCapital Inc. pursuant to a private placement (the “Private Placement Warrants”) in connection with the Company’s initial public offering (including the Class A common stock issuable upon exercise of the Private Placement Warrants). The Private Placement Warrants will not be redeemable by the Company and will be exercisable on a cashless basis so long as they are held by the initial holders or their permitted transferees. Otherwise, the Private Placement Warrants have terms and provisions that are identical to those of the warrants described above. If the Private Placement Warrants are held by holders other than the initial holders or their permitted transferees, the Private Placement Warrants will be redeemable by the Company and exercisable by the holders on the same basis as the warrants described above.
In connection with the closing of the Transaction, the Company issued 5,000,000 warrants to the PIPE Investors and 4,000,000 warrants to Tema. These warrants were issued on the same terms, and are subject to the same rights and obligations, as described above.
As of September 30, 2017, there were 25,594,158 warrants outstanding.
Noncontrolling Interest. Noncontrolling interest represents the membership interest held by holders other than the Company. On April 27, 2017, upon the closing of the Transaction, the Company’s noncontrolling interest percentage in Rosehill Operating, held by Tema, was approximately 84%, The Company has consolidated the financial position and results of operations of Rosehill Operating and reflected the proportionate interest held by Tema as a noncontrolling interest. Of the proceeds received in connection with the Transaction, $40.5 million was distributed to the noncontrolling interest.
Long-Term Incentive Plan. As of September 30, 2017, there were 7,394,334 shares of Class A common stock available for issuance under the Rosehill Resources Inc. Long-Term Incentive Plan dated as of April 27, 2017 (the “LTIP”), subject to adjustment pursuant to the plan. On July 19, 2017, a grant of 105,666 shares of restricted stock was awarded to the Company’s non-employee directors pursuant to the LTIP. These shares will fully vest on July 18, 2018. Stock-based compensation cost associated with this award totaling $840,000 will be recognized over the one-year vesting period.
Note 14—Transactions with Related Parties
The Company is not entitled to compensation for its services as managing member of Rosehill Operating. The Company is entitled to reimbursement by Rosehill Operating for any costs, fees or expenses incurred on behalf of Rosehill Operating (including costs of securities offerings not borne directly by members, board of directors’ compensation and meeting costs, cost of periodic reports to its stockholders, litigation costs and damages arising from litigation, accounting and legal costs); provided that the Company will not be reimbursed for any of its income tax obligations.
Rosemore. Rosemore provides employee benefits and other administrative services to Rosehill Operating via the Transition Services Agreement (discussed under Transaction Service Agreement below) between Rosehill Operating and Tema. During the three months ended September 30, 2017 and the three months ended September 30, 2016, Rosemore incurred and Tema billed to Rosehill Operating approximately $3.1 million and $1.3 million, respectively, related to these services. Rosemore incurred and Tema billed to Rosehill Operating approximately $5.9 million and $3.8 million for the nine month period ended September 30, 2017 and September 30, 2016, respectively. Amounts incurred prior to the Transaction have been allocated to Rosehill Operating on the Condensed Consolidated Statements of Operations—see “Cost Allocations” below. As of September 30, 2017 and December 31, 2016 the payable due to Tema related to these expenses was $0.6 million,
F-49
Table of Contents
Index to Financial Statements
and $0.3 million, respectively. The amount due to Tema as of September 30, 2017 is netted against the $0.6 million amount due from Tema under the TSA discussed below.
Gateway Gathering and Marketing (“Gateway”). A portion of Rosehill Operating’s oil, natural gas and NGLs is sold to Gateway, a subsidiary of Rosemore. During the three and nine months ended September 30, 2017, revenues from production sold to Gateway were approximately $11.4 million and $36.2 million, respectively. During the three and nine months ended September 30, 2016, revenues from production sold to Gateway were approximately $6.8 million and $16.1 million, respectively. As of September 30, 2017 and December 31, 2016, the related receivable due from Gateway was approximately $4.3 million and $4.5 million, respectively.
During the three and nine months ended September 30, 2017, approximately $0.3 million and $0.8 million, respectively, was incurred related to a marketing and gathering agreement with Gateway compared to approximately $0.3 million and $0.7 million, during the three and nine months ended September 30, 2016, respectively. As of September 30, 2017 and December 31, 2016, the payable due to Gateway related to this agreement was $0.4 million and approximately $0.3 million, respectively. Certain consulting services are provided to Gateway, and for each of the three and nine months ended September 30, 2017 and three and nine months ended September 30, 2016, Gateway was invoiced amounts less than $0.1 million related to these services, which were recorded in general and administrative expenses in the accompanying Condensed Consolidated Statements of Operations. Certain other general and administrative services are also provided to Gateway, for which Gateway was invoiced approximately $0.1 million in the three months ended September 30, 2016 and was invoiced approximately $0.1 million and $0.2 million in the nine months ended September 30, 2017, and September 30, 2016, respectively. As of December 31, 2016, the receivable due from Gateway related to these services was approximately $0.3 million. As of September 30, 2017, there was noreceivable from Gateway related to these services.
Transaction expense. Under the terms of the Transaction, the Company reimbursed Tema and Rosemore $1.6 million and $2.4 million, respectively, on April 27, 2017, for costs incurred in connection with the Transaction.
Distributions. The LLC Agreement requires Rosehill Operating to make a corresponding cash distribution to the Company at any time a dividend is to be paid by the Company to the holders of its Series A Preferred Stock. The LLC Agreement allows for distributions to be made by Rosehill Operating to its members on a pro rata basis in accordance with the number of Rosehill Operating Common Units owned by each member out of funds legally available therefor. The Company expects Rosehill Operating may make distributions out of Distributable Cash periodically to the extent permitted by the revolving credit facility agreements of Rosehill Operating and necessary to enable the Company to cover its operating expenses and other obligations, as well as to make dividend payments, if any, to the holders of its Class A common stock. In addition, the LLC Agreement generally requires Rosehill Operating to make pro rata distributions to its members, including the Company, in an amount at least sufficient to allow the Company to (i) pay its taxes and (ii) satisfy its obligations under the Tax Receivable Agreement.
Cost Allocations. For periods prior to the Transaction, Tema allocated certain overhead costs associated with general and administrative services, including insurance, professional fees, facilities, information services, human resources and other support departments related to Rosehill Operating. Also included in the cost allocations are costs associated with employees covered under Rosemore’s defined benefit plan and long term incentive compensation plan. Employees of Rosehill Operating no longer participate in either employee benefit plan. Overhead costs allocated were $1.1 million for the three months ended September 30, 2016, and were $1.5 million and $4.0 million for the nine months ended September 30, 2017 and 2016, respectively. There were no overhead costs allocated for the three months ended September 30, 2017. Where costs incurred related to Rosehill Operating’s assets in the periods prior to the Transaction could not be determined by specific identification, the costs were primarily allocated proportionately on a Boe basis. Management believes the
F-50
Table of Contents
Index to Financial Statements
allocations are a reasonable reflection of the utilization of services provided. However, the allocations may not fully reflect the expense that would have been incurred had Rosehill Operating’s assets been a stand-alone company during the 2016 periods presented.
Transition Service Agreement. On April 27, 2017 in connection with the closing of the Transaction, the Company entered into a Transition Service Agreement (“TSA”) with Tema to provide certain services to each other following the closing of the Transaction. Pursuant to the terms, the Company agreed to provide to Tema (i) operation services for the assets excluded from the Transaction, (ii) divestment assistance, and (iii) office space to Gateway. Tema agreed to provide to the Company (i) human resources and benefits administration, (ii) information technology and telecommunications, (iii) general business insurance, and (iv) legal services. The TSA terminates on October 27, 2018, unless terminated or discontinued earlier in accordance with the terms and condition of the TSA. During the nine months ended September 30, 2017, the Company incurred and billed costs of $0.6 million related to services provided by Tema under the TSA. Amounts due from Tema as of September 30, 2017, related to the TSA are $0.6 million, which are netted against the amount due to Tema under the TSA of $0.6 million discussed above. Additionally, the estimated amounts due to the Company from Tema related to the estimated working capital adjustment as of September 30, 2017 of $0.2 million, remains subject to final settlement between the Company and Tema.
Note 15—Commitments and Contingencies
Transaction. See Note 2—Transaction for a description of the estimated working capital adjustment related to the Transaction which remains subject to final settlement between the Company and Tema.
Legal. In the ordinary course of business, the Company is party to various legal actions, which arise primarily from its activities as operator of oil and natural gas wells. In management’s opinion, the outcome of any such currently pending legal actions will not have a material adverse effect on the Company’s financial position or results of operation.
Environmental Matters. Environmental assessments and remediation efforts are conducted at multiple locations, primarily previously owned or operated facilities. Environmental and clean-up costs are accrued when it is both probable that a liability has been incurred and the amount can be reasonably estimated. Accruals for losses from environmental remediation obligations generally are recorded no later than completion of the remediation feasibility study. Estimated costs, which are based upon experience and assessments, are recorded at undiscounted amounts without considering the impact of inflation and are adjusted periodically as additional or new information is available. Environmental assessments and remediation costs for neither the three or nine months ended September 30, 2017 and 2016 had a material adverse effect on the financial condition, results of operations and cash flows.
Rights of Securities Holders. The holders of the Founder Shares, the Series A Preferred Stock, the Private Placement Warrants and unregistered Class A common stock were entitled to registration rights pursuant to certain agreements of the Company. In May 2017, the Company filed a registration statementregistering the Founder Shares, the Series A Preferred Stock (and any shares of common stock issuable upon conversion of the Series A Preferred Stock), the Private Placement Warrants (and any shares of Class A common stock issuable upon the exercise of the Private Placement Warrants), the unregistered Class A common stock and the shares of common stock issuable upon exercise of the outstanding Warrants. The registration statement was declared effective on June 19, 2017.
Rosehill Operating Common Unit Redemption Right. The LLC Agreement provides Tema with a redemption right, which entitles Tema to cause Rosehill Operating to redeem, from time to time, all or a portion of its Rosehill Operating common units (and a corresponding number of shares of Class B common stock) for, at Rosehill Operating’s option, newly issued shares of the Company’s Class A common stock on a one-for-one basis or a cash payment equal to the average of the volume-weighted closing price of one share of Class A
F-51
Table of Contents
Index to Financial Statements
common stock for the twenty trading days prior to the date Tema delivers a notice of redemption for each Rosehill Operating common unit redeemed (subject to customary adjustments, including for stock splits, stock dividends and reclassifications). In the event of a reclassification event (as defined in the LLC Agreement), the Company as managing member is required to ensure that each Rosehill Operating common unit (and a corresponding share of Class B common stock) is redeemable for the same amount and type of property, securities or cash that a share of Class A common stock becomes exchangeable for or converted into as a result of such reclassification event. Upon the exercise of the redemption right, Tema will surrender its Rosehill Operating common units (and a corresponding number of shares of Class B common stock) to Rosehill Operating and (i) Rosehill Operating shall cancel such Rosehill Operating common units and issue to the Company a number of Rosehill Operating common units equal to the number of surrendered Rosehill Operating common units and (ii) the Company shall cancel the surrendered shares of Class B common stock. The LLC Agreement requires that the Company contribute cash or shares of Class A common stock to Rosehill Operating in exchange for the issuance to the Company described in clause (i). Rosehill Operating will then distribute such cash or shares of the Company’s Class A common stock to Tema to complete the redemption. Upon the exercise of the redemption right, the Company may, at its option, affect a direct exchange of cash or its Class A common stock for such Rosehill Operating common units in lieu of such a redemption.
Maintenance of One-to-One Ratios. The LLC Agreement includes provisions intended to ensure that the Company at all times maintains a one-to-one ratio between (a) (i) the number of outstanding shares of Class A common stock and (ii) the number of Rosehill Operating common units owned by the Company (subject to certain exceptions for certain rights to purchase equity securities of the Company under a “poison pill” or similar shareholder rights plan, if any, certain convertible or exchangeable securities issued under the Company’s equity compensation plans and certain equity securities issued pursuant to the Company’s equity compensation plans (other than a stock option plan) that are restricted or have not vested thereunder) and (b) (i) the number of other outstanding equity securities of the Company (including the Series A Preferred Stock and the warrants) and (ii) the number of corresponding outstanding equity securities of Rosehill Operating. These provisions are intended to result in Tema having a voting interest in the Company that is identical to Tema’s economic interest in Rosehill Operating.
Note 16—Subsequent Event
October 24, 2017, the Company and Rosehill Operating entered into a Purchase and Sale Agreement (the “PSA”) to acquire specified oil and gas wells, leases covering approximately 4,565 net acres and other associated assets and interests in the southern Delaware Basin (the “Southern Delaware Acquisition”) for approximately $77.6 million in cash (the “Purchase Price”), subject to customary purchase price adjustments. Subject to certain conditions under the PSA, the Company and Rosehill Operating are obligated to acquire from the sellers additional oil and gas leases located within a certain designated area in the Delaware Basin (the “Designated Area”) from the sellers for additional consideration calculated on the same basis as the Purchase Price, up to an additional $80 million in cash in the aggregate.
The PSA may be terminated under certain conditions including if the closing of the Southern Delaware Acquisition has not occurred on or before December 31, 2017, and by the Company if it has not been able to obtain financing by the applicable target date. The Company is evaluating several potential sources of financing for the Southern Delaware Acquisition, including preferred equity, debt or a combination thereof. The Company has no firm commitment for such financing and may not be able to obtain financing on desirable terms, if at all.
On October 24, 2017, the Company paid the Sellers a deposit of $6 million (the “Deposit”) pursuant to the PSA. If the PSA is terminated under certain circumstances resulting from a breach of the PSA by the Company or if the Company terminates the PSA due to its inability to obtain financing on satisfactory terms by the applicable target date, the sellers will be entitled to retain the Deposit. Alternatively, if the PSA is terminated under certain circumstances resulting from a breach of the PSA by any seller, the Company will be entitled, in addition to legal and equitable remedies (including seeking damages from the sellers or seeking specific performance of the PSA), to receive a return of the Deposit.
F-52
Table of Contents
Index to Financial Statements
ROSEHILL RESOURCES INC.
10,000,000 SHARES
CLASS A COMMON STOCK
PROSPECTUS
, 2018
Citigroup
Until , all dealers that effect transactions in these securities, whether or not participating in this offering, may be required to deliver a prospectus. This is in addition to the dealers’ obligation to deliver a prospectus when acting as underwriters and with respect to their unsold allotments or subscriptions.
Table of Contents
Index to Financial Statements
PART II—INFORMATION NOT REQUIRED IN PROSPECTUS
Item 13. Other Expenses of Issuance and Distribution
The following table sets forth the costs and expenses payable by the registrant in connection with this offering, other than underwriting discounts and commissions. All of the amounts shown are estimates except the SEC registration fee.
| SEC Registration Fee |
$ | 9,435.23 | ||
| FINRA Filing Fee |
11,867.75 | |||
| Printing and Engraving Expenses |
* | |||
| NASDAQ Listing Fee |
* | |||
| Legal Fees and Expenses |
* | |||
| Accounting Fees and Expenses |
* | |||
| Transfer Agent and Registrar Fee |
* | |||
| Other |
* | |||
|
|
|
|||
| Total |
$ | * | ||
|
|
|
| * | The estimated expenses are presently undeterminable and will be set forth in an amendment to this Registration Statement. |
Item 14. Indemnification of Directors and Officers
Section 145 of the DGCL provides that a corporation may indemnify any person who was or is a party, or is threatened to be made a party, to any threatened, pending or completed action, suit or proceeding, whether civil, criminal, administrative or investigative (other than an action by or in the right of the corporation by reason of the fact that the person is or was a director, officer, employee or agent of the corporation, or is or was serving at the request of the corporation as a director, officer, employee or agent of another corporation, partnership, joint venture, trust or other enterprise), against expenses (including attorneys’ fees), judgments, fines and amounts paid in settlement actually and reasonably incurred by the person in connection with such action, suit or proceeding if the person acted in good faith and in a manner the person reasonably believed to be in or not opposed to the best interests of the corporation and, with respect to any criminal action or proceeding, had no reasonable cause to believe his or her conduct was unlawful. A similar standard is applicable in the case of derivative actions (i.e., actions by or in the right of the corporation), except that indemnification extends only to expenses, including attorneys’ fees, incurred in connection with the defense or settlement of such action and the statute requires court approval before there can be any indemnification where the person seeking indemnification has been found liable to the corporation.
Our amended and restated certificate of incorporation provides that we will, to the fullest extent authorized or permitted by applicable law, indemnify our current and former officers and directors, as well as those persons who, while directors or officers of our corporation, are or were serving as directors, officers, employees or agents of another entity, trust or other enterprise, including service with respect to an employee benefit plan, in connection with any threatened, pending or completed proceeding, whether civil, criminal, administrative or investigative, against all expense, liability and loss (including, without limitation, attorneys’ fees, judgments, fines, ERISA excise taxes and penalties and amounts paid in settlement) reasonably incurred or suffered by any such person in connection with any such proceeding. Notwithstanding the foregoing, a person eligible for indemnification pursuant to our amended and restated certificate of incorporation will be indemnified by us in connection with a proceeding initiated by such person only if such proceeding was authorized by our board of directors, except for proceedings to enforce rights to indemnification.
In accordance with Section 102(b)(7) of the DGCL, our amended and restated certificate of incorporation provides that no director shall be personally liable to us or any of our stockholders for monetary damages resulting from breaches of their fiduciary duty as directors, except to the extent such limitation on or exemption
II-1
Table of Contents
Index to Financial Statements
from liability is not permitted under the DGCL. However, this provision does not limit or eliminate our rights or the rights of any stockholder to seek non-monetary relief, such as an injunction or rescission, in the event of a breach of a director’s duty of care.
Our bylaws also include provisions relating to advancement of expenses and indemnification rights consistent with those set forth in our amended and restated certificate of incorporation. In addition, our bylaws provide for a right of indemnity to bring a suit in the event a claim for indemnification or advancement of expenses is not paid in full by us within a specified period of time. Our bylaws also permit us to purchase and maintain insurance, at our expense, to protect us and/or any director, officer, employee or agent of our corporation or another entity, trust or other enterprise against any expense, liability or loss, whether or not we would have the power to indemnify such person against such expense, liability or loss under the DGCL.
Any repeal or amendment of provisions of our amended and restated certificate of incorporation or our bylaws affecting indemnification rights, whether by our stockholders or by changes in law, or the adoption of any other provisions inconsistent therewith, will (unless otherwise required by law) be prospective only, except to the extent such amendment or change in law permits us to provide broader indemnification rights on a retroactive basis, and will not in any way diminish or adversely affect any right or protection existing at the time of such repeal or amendment or adoption of such inconsistent provision with respect to any act or omission occurring prior to such repeal or amendment or adoption of such inconsistent provision. Our amended and restated certificate of incorporation will also permit us, to the extent and in the manner authorized or permitted by law, to indemnify and to advance expenses to persons other that those specifically covered by our amended and restated certificate of incorporation.
We have entered into indemnification agreements with each of our officers and directors, a form of which is attached as Exhibit 10.7 to the registration statement of which this prospectus forms a part. These agreements will require us to indemnify these individuals to the fullest extent permitted under Delaware law against liabilities that may arise by reason of their service to us, and to advance expenses incurred as a result of any proceeding against them as to which they could be indemnified.
Pursuant to the Underwriting Agreement attached as Exhibit 1.1 to the registration statement of which this prospectus forms a part, we have agreed to indemnify the underwriters and the underwriters have agreed to indemnify us against certain civil liabilities that may be incurred in connection with this offering, including certain liabilities under the Securities Act.
Insofar as indemnification for liabilities arising under the Securities Act may be permitted to directors, officers or persons controlling us pursuant to the foregoing provisions, we have been informed that in the opinion of the SEC, such indemnification is against public policy as expressed in the Securities Act and is therefore unenforceable.
Item 15. Recent Sales of Unregistered Securities
Since our formation, we have sold the following securities without registration under the Securities Act:
Founder Shares
In November 2015, KLR Sponsor purchased an aggregate of 4,312,500 founder shares, for an aggregate offering price of $25,000 at an average purchase price of approximately $0.006 per share. In December 2015, KLR Sponsor returned to us, at no cost, an aggregate of 575,000 founder shares, which we cancelled. The number of founder shares issued was determined based on the expectation that such founder shares would represent 20.0% of the outstanding shares upon completion of this offering. Such securities were issued in connection with our organization pursuant to the exemption from registration contained in Section 4(a)(2) of the Securities Act. KLR Sponsor is an accredited investor for purposes of Rule 501 of Regulation D. KLR Sponsor is an accredited investor for purposes of Rule 501 of Regulation D.
II-2
Table of Contents
Index to Financial Statements
Private Placement Warrants
Simultaneously with the consummation of our initial public offering, we consummated the private placement of 8,310,000 Warrants at a price of $0.75 per Warrant, generating total proceeds of $6,232,500. In connection with the partial exercise of the underwriters’ overallotment option, we sold an additional 98,838 Warrants in a private placement to KLR Sponsor and EarlyBirdCapital, Inc. at a price of $0.75 per Warrant, generating proceeds of $74,000. The Warrants, which were purchased by KLR Sponsor and EarlyBirdCapital, Inc. (and its designees), are substantially similar to the Public Warrants, except that if held by the original holders or their permitted assigns, they (i) may be exercised for cash or on a cashless basis and (ii) are not subject to being called for redemption. EarlyBirdCapital, Inc. agreed that it will not be permitted to exercise any Warrants after the five year anniversary of the effective date of the initial public offering registration statement. If the Warrants are held by holders other than its initial holders, the Warrants will be redeemable by us and exercisable by holders on the same basis as the Public Warrants. This issuance was made pursuant to the exemption from registration contained in Section 4(a)(2) of the Securities Act.
Series A Preferred Stock and Warrant Issuance in Connection with Transaction
In connection with the Transaction, we issued in a private placement an aggregate 75,000 shares of Series A Preferred Stock and 5,000,000 warrants to Anchorage, Geode Diversified Fund and The K2 Principal Fund, L.P., and received gross proceeds of $75.0 million, which proceeds were contributed to Rosehill Operating in exchange for Rosehill Operating Series A preferred units and additional Rosehill warrants. The Series A Preferred Stock and the Warrants sold in connection with the Transaction were issued pursuant to the exemption from registration contained in Section 4(a)(2) of the Securities Act.
Class B Common Stock Issuance in Connection with Transaction
On the closing date of the Transaction, we issued 29,807,692 shares of Class B Common Stock to Rosehill Operating, which shares of Class B Common Stock were immediately distributed by Rosehill Operating to Tema. The issuance of Class B Common Stock was made pursuant to the exemption from registration contained in Section 4(a)(2) of the Securities Act.
Side Letter
On the closing date of the Transaction, the Company sold 2,200 shares of Series A Preferred Stock to KLR Sponsor and 17,800 shares of Series A Preferred Stock to Rosemore Holdings, Inc., an affiliate of Rosemore, Inc., pursuant to a side letter entered into among Rosemore, Inc., KLR Sponsor and the Company. These issuances were made pursuant to the exemption from registration contained in Section 4(a)(2) of the Securities Act.
Rosehill Operating Common Unit Exchange
On the closing date of the Transaction, we issued to Rosehill Operating 4,000,000 Warrants exercisable for shares of Class A Common Stock in exchange for 4,000,000 Warrants exercisable for Rosehill Operating Common Units. The issuance of the Warrants was made pursuant to the exemption from registration contained in Section 4(a)(2) of the Securities Act.
Series B Preferred Stock Issuance in Connection with the White Wolf Acquisition
In connection with the White Wolf Acquisition, we issued in a private placement an aggregate 150,000 shares of Series B Preferred Stock to certain private funds and accounts managed by EIG Global Energy Partners, LLC, and received gross proceeds of $150.0 million. The shares of Series B Preferred Stock sold in connection with the White Wolf Acquisition were issued pursuant to the exemption from registration contained in Section 4(a)(2) of the Securities Act.
II-3
Table of Contents
Index to Financial Statements
Item 16. Exhibits
(a) See the Exhibit Index immediately preceding the signature page of this registration statement and which is incorporated by reference herein.
Item 17. Undertakings
The registrant hereby undertakes that:
(1) For purposes of determining any liability under the Securities Act of 1933, the information omitted from the form of prospectus filed as part of this Registration Statement in reliance upon Rule 430A and contained in a form of prospectus filed by the Registrant pursuant to Rule 424(b)(1) or (4) or 497 (h) under the Securities Act shall be deemed to be part of this Registration Statement as of the time it was declared effective; and
(2) For purposes of determining any liability under the Securities Act of 1933, each post-effective amendment that contains a form of prospectus shall be deemed to be a new registration statement relating to the securities offered therein, and the offering of such securities at that time shall be deemed to be the initial bona fide offering thereof.
Insofar as indemnification for liabilities arising under the Securities Act of 1933 may be permitted to directors, officers and controlling persons of the registrant pursuant to the foregoing provisions, or otherwise, the registrant has been advised that, in the opinion of the Securities and Exchange Commission, such indemnification is against public policy as expressed in the Securities Act and is, therefore, unenforceable. In the event that a claim for indemnification against such liabilities (other than the payment by the registrant of expenses incurred or paid by a director, officer or controlling person of the registrant in the successful defense of any action, suit or proceeding) is asserted by such director, officer or controlling person in connection with the securities being registered, the registrant will, unless in the opinion of its counsel the matter has been settled by controlling precedent, submit to a court of appropriate jurisdiction the question whether such indemnification by it is against public policy as expressed in the Securities Act and will be governed by the final adjudication of such issue.
II-4
Table of Contents
Index to Financial Statements
EXHIBIT INDEX
II-5
Table of Contents
Index to Financial Statements
II-6
Table of Contents
Index to Financial Statements
| * | Filed herewith |
| ** | To be filed by amendment. |
| *** | Certain schedules referenced in the agreement have been omitted in accordance with item 601(b)(2) of Regulation S-K. A copy of any omitted schedule will be furnished supplementally to the U.S. Securities and Exchange Commission upon request. |
| (1) | Incorporated by reference to the Company’s Form 8-K, filed with the Commission on March 16, 2016. |
| (2) | Incorporated by reference to the Company’s Form 8-K, filed with the Commission on December 20, 2016. |
| (3) | Incorporated by reference to the Company’s Amendment No. 1 to the Registration Statement (File no. 333-209041) on Form S-1/A, filed with the Commission on February 5, 2016. |
| (4) | Incorporated by reference to the Company’s Registration Statement (File no. 333-209041) on Form S-1, filed with the Commission on January 19, 2016. |
| (5) | Incorporated by reference to the Company’s Form 8-K, filed with the Commission on May 3, 2017. |
| (6) | Incorporated by reference to the Company’s Form 8-K, filed with the Commission on April 28, 2017. |
| (7) | Incorporated by reference to the Company’s Quarterly Report on Form 10-Q for the quarterly period ended June 30, 2017, filed with the Commission on August 15, 2017. |
| (8) | Incorporated by reference to the Company’s Form 8-K, filed with the Commission on December 14, 2017. |
| (9) | Incorporated by reference to the Company’s Form 8-K, filed with the Commission on December 22, 2017. |
II-7
Table of Contents
Index to Financial Statements
Pursuant to the requirements of the Securities Act of 1933, as amended, the registrant certifies that it has reasonable grounds to believe that it meets all of the requirements for filing on Form S-1 and has duly caused this Registration Statement on Form S-1 to be signed on its behalf by the undersigned, thereunto duly authorized, in the City of Houston, State of Texas on February 14, 2018.
| ROSEHILL RESOURCES INC.
| ||
| By: | /s/ J.A. (Alan) Townsend | |
| Name: | J.A. (Alan) Townsend | |
| Title: | President and Chief Executive Officer | |
| (Principal Executive Officer) | ||
KNOW ALL MEN BY THESE PRESENTS, that each person whose signature appears below constitutes and appoints J.A. (Alan) Townsend and Craig Owen and each of them acting alone, his true and lawful attorneys-in-fact, with full power of substitution and resubstitution for him and in his name, place and stead, in any and all capacities to sign any and all amendments including post-effective amendments to this registration statement, and to file the same, with all exhibits thereto, and other documents in connection therewith, with the SEC, hereby ratifying and confirming all that said attorneys-in-fact or their substitutes, each acting alone, may lawfully do or cause to be done by virtue thereof.
Pursuant to the requirements of the Securities Act of 1933, this registration statement has been signed by the following persons in the capacities and on the dates indicated.
| Name |
Position |
Date | ||
| /s/ J.A. (Alan) Townsend J.A. (Alan) Townsend |
President, Chief Executive Officer and Director (Principal Executive Officer) |
February 14, 2018 | ||
| /s/ Craig Owen Craig Owen |
Chief Financial Officer (Principal Financial and Accounting Officer) |
February 14, 2018 | ||
| /s/ Gary C. Hanna Gary C. Hanna |
Chairman | February 14, 2018 | ||
| /s/ Edward Kovalik Edward Kovalik |
Director | February 14, 2018 | ||
| /s/ Frank Rosenberg Frank Rosenberg |
Director | February 14, 2018 | ||
| /s/ William E. Mayer William E. Mayer |
Director | February 14, 2018 | ||
| /s/ Harry Quarls Harry Quarls |
Director | February 14, 2018 | ||
| /s/ Francis Contino Francis Contino |
Director | February 14, 2018 | ||
II-8