Attached files
| file | filename |
|---|---|
| EX-99.1 - EXHIBIT 99.1 - CHIMERA INVESTMENT CORP | pressrelease-q42017.htm |
| 8-K - 8-K - CHIMERA INVESTMENT CORP | chimera8-kq4x17pressrelease.htm |

FINANCIAL
SUPPLEMENT
NYSE: CIM
4th Quarter 2017

Information is unaudited, estimated and subject to change.
DISCLAIMER This presentation includes “forward-looking statements” within the meaning of the safe harbor provisions of the UnitedStates Private Securities Litigation Reform Act of 1995. Actual results may differ from expectations, estimates andprojections and, consequently, readers should not rely on these forward-looking statements as predictions of future
events. Words such as “goal” “expect,” “target,” “assume,” “estimate,” “project,” “budget,” “forecast,” “anticipate,” “intend,” “plan,”
“may,” “will,” “could,” “should,” “believe,” “predicts,” “potential,” “continue,” and similar expressions are intended to identify
such forward-looking statements. These forward-looking statements involve significant risks and uncertainties that
could cause actual results to differ materially from expected results, including, among other things, those described in
our most recent Annual Report on Form 10-K, and any subsequent Quarterly Reports on Form 10-Q, under the caption
“Risk Factors.” Factors that could cause actual results to differ include, but are not limited to: the state of credit markets
and general economic conditions; changes in interest rates and the market value of our assets; the rates of default or
decreased recovery on the mortgages underlying our target assets; the occurrence, extent and timing of credit losses
within our portfolio; the credit risk in our underlying assets; declines in home prices; our ability to establish, adjust and
maintain appropriate hedges for the risks in our portfolio; the availability and cost of our target assets; our ability to
borrow to finance our assets and the associated costs; changes in the competitive landscape within our industry; our
ability to manage various operational risks and costs associated with our business; interruptions in or impairments to our
communications and information technology systems; our ability to acquire residential mortgage loans and successfully
securitize the residential mortgage loans we acquire; our ability to oversee our third party sub-servicers; the impact of
any deficiencies in the servicing or foreclosure practices of third parties and related delays in the foreclosure process; our
exposure to legal and regulatory claims; legislative and regulatory actions affecting our business; the impact of new or
modified government mortgage refinance or principal reduction programs; our ability to maintain our REIT qualification;
and limitations imposed on our business due to our REIT status and our exempt status under the Investment Company
Act of 1940.
Readers are cautioned not to place undue reliance upon any forward-looking statements, which speak only as of the
date made. Chimera does not undertake or accept any obligation to release publicly any updates or revisions to any
forward-looking statement to reflect any change in its expectations or any change in events, conditions or
circumstances on which any such statement is based. Additional information concerning these and other risk factors is
contained in Chimera’s most recent filings with the Securities and Exchange Commission (SEC). All subsequent written
and oral forward-looking statements concerning Chimera or matters attributable to Chimera or any person acting on its
behalf are expressly qualified in their entirety by the cautionary statements above.
This presentation may include industry and market data obtained through research, surveys, and studies conducted by
third parties and industry publications. We have not independently verified any such market and industry data from
third-party sources. This presentation is provided for discussion purposes only and may not be relied upon as legal or
investment advice, nor is it intended to be inclusive of all the risks and uncertainties that should be considered. This
presentation does not constitute an offer to purchase or sell any securities, nor shall it be construed to be indicative of
the terms of an offer that the parties or their respective affiliates would accept.
Readers are advised that the financial information in this presentation is based on company data available at the time of
this presentation and, in certain circumstances, may not have been audited by the company’s independent auditors.

Information is unaudited, estimated and subject to change. 2
PORTFOLIO COMPOSITION
Residential
Mortgage Credit
Portfolio
Agency
Portfolio Total Portfolio
Gross Asset Yield: 7.2% 3.0% 6.3%
Financing Cost(3): 3.9% 2.0% 3.6%
Net Interest
Spread: 3.3% 1.0% 2.7%
Net Interest
Margin: 3.7% 1.4% 3.2%
All data as of December 31, 2017
(1) Financing excludes unsettled trades.
(2) Reflects fourth quarter 2017 average assets, yields, and spreads.
(3) Includes the interest incurred on interest rate swaps.
Net Investment Analysis(2)
17
16
15
14
13
12
11
10
9
8
7
6
5
4
3
2
1
0
B
ill
io
ns
$3.0
$0.7
$4.0
$3.2
$9.6
Non-Recourse
(Securitization)
Recourse (Repo)
Recourse (Repo)
Equity
Equity
Agency Portfolio
Total Assets: 4.4 billion(1)
Residential Mortgage
Credit Portfolio
Total Assets: 16.5 billion(1)
82% of Chimera's equity capital is allocated to mortgage credit

Information is unaudited, estimated and subject to change. 3
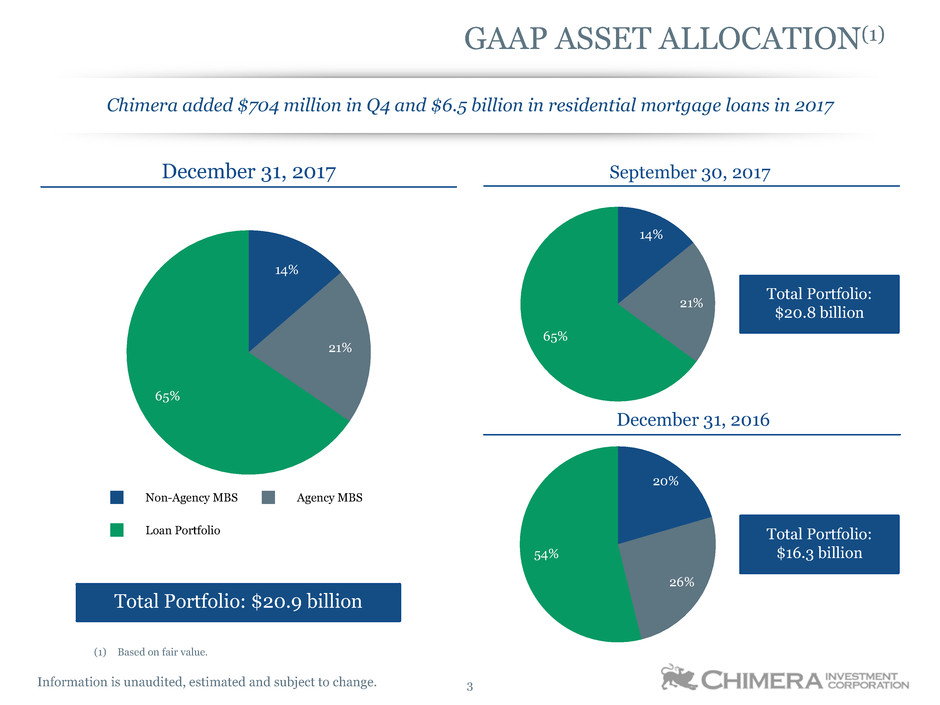
December 31, 2017 September 30, 2017
Total Portfolio: $20.9 billion
Non-Agency MBS Agency MBS
Loan Portfolio
14%
21%
65%
14%
21%
65%
GAAP ASSET ALLOCATION(1)
(1) Based on fair value.
Chimera added $704 million in Q4 and $6.5 billion in residential mortgage loans in 2017
20%
26%
54%
December 31, 2016
Total Portfolio:
$20.8 billion
Total Portfolio:
$16.3 billion

Information is unaudited, estimated and subject to change. 4
December 31, 2017 September 30, 2017
Total Financing: $16.8 Billion
Agency Repurchase Agreements, RMBS
Non-Agency Repurchase Agreements, RMBS
Non-Recourse Debt, Securitized RMBS and Loans (2)
19%
24%
57%
19%
22%60%
GAAP FINANCING SOURCES
(1) Based on fair value.
Total Leverage(1): 4.6:1
Recourse Leverage(1): 2.0:1
24%
20%
57%
December 31, 2016
Total Financing:
$16.6 billion
Total Financing:
$12.9 billion

Information is unaudited, estimated and subject to change. 5
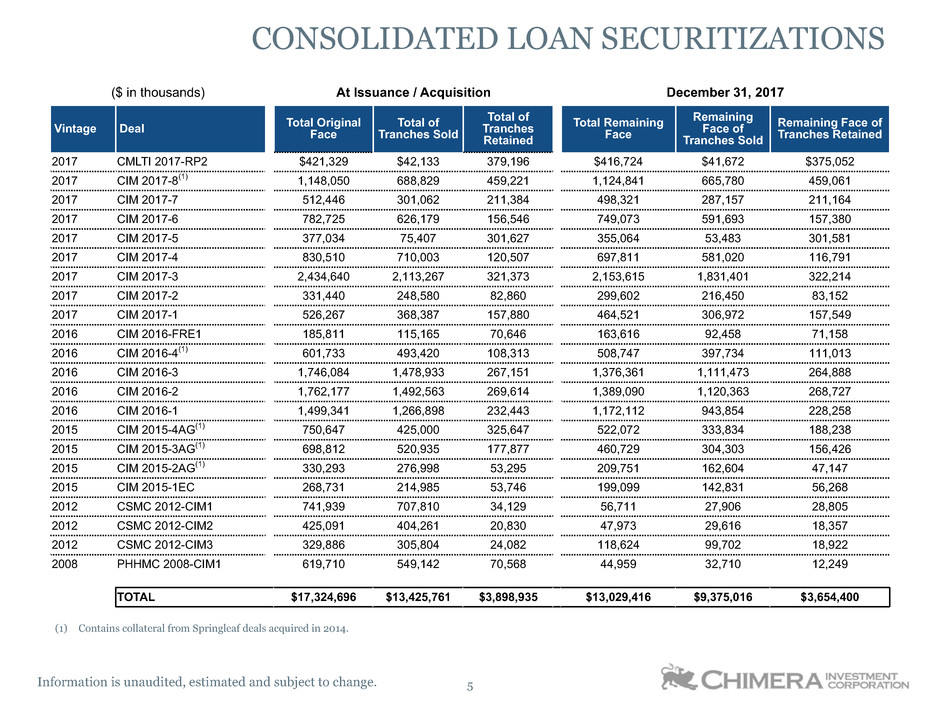
($ in thousands) At Issuance / Acquisition December 31, 2017
Vintage Deal Total OriginalFace
Total of
Tranches Sold
Total of
Tranches
Retained
Total Remaining
Face
Remaining
Face of
Tranches Sold
Remaining Face of
Tranches Retained
2017 CMLTI 2017-RP2 $421,329 $42,133 379,196 $416,724 $41,672 $375,052
2017 CIM 2017-8(1) 1,148,050 688,829 459,221 1,124,841 665,780 459,061
2017 CIM 2017-7 512,446 301,062 211,384 498,321 287,157 211,164
2017 CIM 2017-6 782,725 626,179 156,546 749,073 591,693 157,380
2017 CIM 2017-5 377,034 75,407 301,627 355,064 53,483 301,581
2017 CIM 2017-4 830,510 710,003 120,507 697,811 581,020 116,791
2017 CIM 2017-3 2,434,640 2,113,267 321,373 2,153,615 1,831,401 322,214
2017 CIM 2017-2 331,440 248,580 82,860 299,602 216,450 83,152
2017 CIM 2017-1 526,267 368,387 157,880 464,521 306,972 157,549
2016 CIM 2016-FRE1 185,811 115,165 70,646 163,616 92,458 71,158
2016 CIM 2016-4(1) 601,733 493,420 108,313 508,747 397,734 111,013
2016 CIM 2016-3 1,746,084 1,478,933 267,151 1,376,361 1,111,473 264,888
2016 CIM 2016-2 1,762,177 1,492,563 269,614 1,389,090 1,120,363 268,727
2016 CIM 2016-1 1,499,341 1,266,898 232,443 1,172,112 943,854 228,258
2015 CIM 2015-4AG(1) 750,647 425,000 325,647 522,072 333,834 188,238
2015 CIM 2015-3AG(1) 698,812 520,935 177,877 460,729 304,303 156,426
2015 CIM 2015-2AG(1) 330,293 276,998 53,295 209,751 162,604 47,147
2015 CIM 2015-1EC 268,731 214,985 53,746 199,099 142,831 56,268
2012 CSMC 2012-CIM1 741,939 707,810 34,129 56,711 27,906 28,805
2012 CSMC 2012-CIM2 425,091 404,261 20,830 47,973 29,616 18,357
2012 CSMC 2012-CIM3 329,886 305,804 24,082 118,624 99,702 18,922
2008 PHHMC 2008-CIM1 619,710 549,142 70,568 44,959 32,710 12,249
TOTAL $17,324,696 $13,425,761 $3,898,935 $13,029,416 $9,375,016 $3,654,400
(1) Contains collateral from Springleaf deals acquired in 2014.
CONSOLIDATED LOAN SECURITIZATIONS

Information is unaudited, estimated and subject to change. 6
($ in thousands) At Issuance / Acquisition December 31, 2017
Vintage Deal Total OriginalFace
Total of
Tranches
Sold
Total of
Tranches
Retained
Total Remaining
Face
Remaining
Face of
Tranches
Sold
Remaining Face
of Tranches
Retained
2014 CSMC 2014-4R(1) 367,271 — 367,271 210,789 — 210,789
2010 CSMC 2010-1R 1,730,581 691,630 1,038,951 504,330 3,669 500,661
2010 CSMC 2010-11R 566,571 338,809 227,762 207,428 — 207,428
2009 CSMC 2009-12R 1,730,698 915,566 815,132 476,131 87,478 388,653
2009 JPMRR 2009-7 1,522,474 856,935 665,539 435,208 108,077 327,131
2009 JMAC 2009-R2 281,863 192,500 89,363 75,301 19,949 55,352
TOTAL 6,199,458 2,995,440 3,204,018 1,909,187 219,173 1,690,014
% of origination remaining 31% 7% 53%
CONSOLIDATED RMBS SECURITIZATIONS
▪ Re-Remic subordinate bonds have had slow prepayments considering the low interest rate environment
▪ Chimera expects the subordinate bond portfolio to have meaningful impact on earnings for the foreseeable future
(1) Contains collateral from CSMC 2010-12R Trust.

Information is unaudited, estimated and subject to change. 7
Agency Securities – As of December 31, 2017
Repo Days to Maturity – As of December 31, 2017
Agency Securities – As of September 30, 2017
Repo Days to Maturity – As of September 30, 2017
Maturity PrincipalBalance
Weighted
Average Rate
Weighted
Average Days
Within 30 days $2,433,157 1.40%
30 to 59 days 473,727 1.38%
60 to 89 days 189,350 1.37%
Total $3,096,234 1.39% 21 Days
(1) Coupon is a weighted average for Commercial and Agency IO
(2) Notional Agency IO was $3.0 billion and $3.2 billion as of December 31, 2017 and September 30, 2017 respectively.
Security
Type Coupon
(1) Current
Face
Weighted
Average
Market Price
Weighted
Average CPR
Agency
Pass-
through
3.50% $850,775 102.9 9.9
4.00% 1,207,687 104.9 13.4
4.50% 168,666 106.8 14.0
Commercial 3.6% 1,894,594 102.3 —
Agency IO 0.7% N/M(2) 3.5 3.1
Total $4,121,722
Maturity PrincipalBalance
Weighted
Average Rate
Weighted
Average Days
Within 30 days $2,124,925 1.44%
30 to 59 days 647,889.511 1.48%
60 to 89 days 429,241 1.63%
Total $3,202,056 1.47% 28 Days
Security
Type Coupon
(1) Current
Face
Weighted
Average
Market Price
Weighted
Average CPR
Agency
Pass-
through
3.50% $878,766 103.3 10.3
4.00% 1,261,567 105.5 10.8
4.50% 176,505 107.7 15.7
Commercial 3.6% 1,774,802 102.1 —
Agency IO 0.7% N/M(2) 3.6 9.8
Total $4,091,640
AGENCY & REPO SUMMARY

Information is unaudited, estimated and subject to change. 8
Description
($ in thousands)
- 100 Basis
Points
- 50 Basis
Points Unchanged
+50 Basis
Points
+100 Basis
Points
Agency
Securities
Market Value $ 4,610,532 $ 4,491,913 $ 4,364,828 $ 4,229,318 $ 4,089,486
Percentage Change 5.6 % 2.9 % - (3.1)% (6.3)%
Swap
Market Value (160,638) (77,945) - 75,607 150,428
Percentage Change (3.7)% (1.8)% - 1.7 % 3.4 %
Futures
Market Value (34,928) (17,228) - 16,767 33,098
Percentage Change (0.8)% (0.4)% - 0.4 % 0.8 %
Net Gain/(Loss) $ 50,138 $ 31,912 - $ (43,136) $ (91,816)
Percentage Change
in Portfolio Value(1) 1.1 % 0.7 % - (1.0)% (2.1)% Near Term 0-3
Short Term 3-5
Medium Term 5-10
Long Term 10-30
Hedge Book Maturities
37%
31%
32%
1%
INTEREST RATE SENSITIVITY
Chimera added to its Agency Commercial and hedge portfolios during the quarter
Total Notional Balance - Derivative Instruments
December 31, 2017 September 30, 2017
Interest Rate Swaps 3,816,400 3,373,400
Swaptions 391,000 482,000
Futures 619,700 619,700
(1) Based on instantaneous moves in interest rates.

chimerareit.com
