Attached files
| file | filename |
|---|---|
| EX-32.1 - CERTIFICATION - Sino-Global Shipping America, Ltd. | f10q1217ex32-1_sinoglobal.htm |
| EX-31.2 - CERTIFICATION - Sino-Global Shipping America, Ltd. | f10q1217ex31-2_sinoglobal.htm |
| EX-31.1 - CERTIFICATION - Sino-Global Shipping America, Ltd. | f10q1217ex31-1_sinoglobal.htm |
U.S. SECURITIES AND EXCHANGE COMMISSION
WASHINGTON, DC 20549
FORM 10-Q
☒ Quarterly report pursuant to Section 13 or 15(d) of the Securities Exchange Act of 1934
For the period ended December 31, 2017
☐ Transition report pursuant to Section 13 or 15(d) of the Securities Exchange Act of 1934
For the transition period from ___________ to ___________.
Commission File Number 001-34024
Sino-Global Shipping America, Ltd.
(Exact name of registrant as specified in its charter)
| Virginia | 11-3588546 | |
| (State or other jurisdiction of | (I.R.S. employer | |
| Incorporation or organization) | identification number) |
1044 Northern Boulevard, Suite 305
Roslyn, New York 11576-1514
(Address of principal executive offices and zip code)
(718) 888-1814
(Registrant’s telephone number, including area code)
Indicate by check mark whether the registrant (1) has filed all reports required to be filed by Section 13 or 15(d) of the Securities Exchange Act of 1934 during the preceding 12 months (or for such shorter period that the registrant was required to file such reports) and (2) has been subject to such filing requirements for the past 90 days. Yes ☒ No ☐
Indicate by check mark whether the registrant has submitted electronically and posted on its corporate Web site, if any, every Interactive Data File required to be submitted and posted pursuant to Rule 405 of Regulation S-T (§232.405 of this chapter) during the preceding 12 months (or for such shorter period that the registrant was required to submit and post such files). Yes ☒ No ☐
Indicate by check mark whether the registrant is a large accelerated filer, an accelerated filer, a non-accelerated filer, smaller reporting company, or an emerging growth company. See the definitions of “large accelerated filer,” “accelerated filer,” “smaller reporting company,” and “emerging growth company” in Rule 12b-2 of the Exchange Act.
| Large accelerated filer ☐ | Accelerated filer ☐ |
| Non-accelerated filer ☐ (Do not check if a smaller reporting company) | Smaller reporting company ☒ |
| Emerging Growth Company ☐ |
If an emerging growth company, indicate by check mark if the registrant has elected not to use the extended transition period for complying with any new or revised financial accounting standards provided pursuant to Section 13(a) of the Exchange Act. ☐
Indicate by check mark whether the registrant is a shell company (as defined in Rule 12b-2 of the Exchange Act). Yes ☐ No ☒
Indicate the number of shares outstanding of each of the issuer’s classes of common stock, as of the latest practicable date. As of February 12, 2018, the Company has 10,435,535 issued and outstanding shares of common stock.
SINO-GLOBAL SHIPPING AMERICA, LTD.
FORM 10-Q
INDEX
| PART I. FINANCIAL INFORMATION | 1 |
| Item 1. Financial Statements | 1 |
| Item 2. Management’s Discussion and Analysis of Financial Condition and Results of Operations | 24 |
| Item 3. Quantitative and Qualitative Disclosures about Market Risk | 41 |
| Item 4. Controls and Procedures | 41 |
| PART II. OTHER INFORMATION | 42 |
| Item 6. Exhibits | 42 |
i
SPECIAL NOTE REGARDING FORWARD-LOOKING STATEMENTS
This document contains certain statements of a forward-looking nature. Such forward-looking statements, including but not limited to projected growth, trends and strategies, future operating and financial results, financial expectations and current business indicators are based upon current information and expectations and are subject to change based on factors beyond the control of the Company. Forward-looking statements typically are identified by the use of terms such as “look,” “may,” “will,” “should,” “might,” “believe,” “plan,” “expect,” “anticipate,” “estimate” and similar words, although some forward-looking statements are expressed differently. The accuracy of such statements may be impacted by a number of business risks and uncertainties that could cause actual results to differ materially from those projected or anticipated, including but not limited to the following:
| ● | Our ability to timely and properly deliver our services; |
| ● | Our dependence on a limited number of major customers and related parties; |
| ● | Political and economic factors in the Peoples’ Republic of China (“PRC”); |
| ● | Our ability to expand and grow our lines of business; |
| ● | Unanticipated changes in general market conditions or other factors, which may result in cancellations or reductions in the need for our services; |
| ● | Economic conditions which would reduce demand for services provided by the Company and could adversely affect profitability; |
| ● | The effect of terrorist acts, or the threat thereof, on the demand for the shipping and logistic industry which could, adversely affect the Company’s operations and financial performance; |
| ● | The acceptance in the marketplace of our new lines of business; |
| ● | Foreign currency exchange rate fluctuations; |
| ● | Hurricanes or other natural disasters; and |
| ● | Our ability to attract, retain and motivate skilled personnel. |
Readers are cautioned not to place undue reliance on these forward-looking statements, which speak only as of the date hereof. The Company undertakes no obligation to update this forward-looking information unless required by applicable law or regulations.
ii
PART I. FINANCIAL INFORMATION
| Item 1. | Financial Statements |
SINO-GLOBAL SHIPPING AMERICA, LTD. AND AFFILIATES
INDEX TO FINANCIAL STATEMENTS
| PAGE | |
| UNAUDITED CONDENSED CONSOLIDATED FINANCIAL STATEMENTS: | |
| Unaudited Condensed Consolidated Balance Sheets as of December 31, 2017 and June 30, 2017 | 2 |
| Unaudited Condensed Consolidated Statements of Operations and Comprehensive Income for the Three and Six Months Ended December 31, 2017 and 2016 | 3 |
| Unaudited Condensed Consolidated Statements of Cash Flows for the Six Months Ended December 31, 2017 and 2016 | 4 |
| Notes to the Unaudited Condensed Consolidated Financial Statements | 5 |
| 1 |
SINO-GLOBAL SHIPPING AMERICA, LTD. AND AFFILIATES
CONDENSED CONSOLIDATED BALANCE SHEETS
(UNAUDITED)
| December 31, | June 30, | |||||||
| 2017 | 2017 | |||||||
| Assets | ||||||||
| Current assets | ||||||||
| Cash and cash equivalents | $ | 7,219,848 | $ | 8,733,742 | ||||
| Accounts receivable, less allowance for doubtful accounts of $763,984 and $185,821 as of December 31, 2017 and June 30, 2017, respectively | 4,248,363 | 2,569,141 | ||||||
| Other receivables, less allowance for doubtful accounts of $145,279 and $145,244 as of December 31, 2017 and June 30, 2017, respectively | 318,827 | 37,811 | ||||||
| Advances to suppliers-third parties | 14,611 | 54,890 | ||||||
| Advances to suppliers-related party | 3,473,717 | 3,333,038 | ||||||
| Prepaid expenses and other current assets | 230,721 | 311,136 | ||||||
| Due from related parties, net | 2,372,996 | 1,715,130 | ||||||
| Total Current Assets | 17,879,083 | 16,754,888 | ||||||
| Property and equipment, net | 217,335 | 187,373 | ||||||
| Intangible assets, net | 184,722 | - | ||||||
| Prepaid expenses | - | 6,882 | ||||||
| Other long-term assets | 119,059 | 117,478 | ||||||
| Deferred tax assets | 1,823,100 | 749,400 | ||||||
| Total Assets | $ | 20,223,299 | $ | 17,816,021 | ||||
| Liabilities and Equity | ||||||||
| Current Liabilities | ||||||||
| Advances from customers | $ | 360,744 | $ | 369,717 | ||||
| Accounts payable | 506,989 | 206,211 | ||||||
| Taxes payable | 2,258,737 | 1,886,216 | ||||||
| Due to related parties | - | 206,323 | ||||||
| Accrued expenses and other current liabilities | 359,748 | 418,029 | ||||||
| Total Current Liabilities | 3,486,218 | 3,086,496 | ||||||
| Income tax payable - noncurrent portion | 440,219 | - | ||||||
| Total Liabilities | 3,926,437 | 3,086,496 | ||||||
| Commitments and Contingencies | ||||||||
| Equity | ||||||||
| Preferred stock, 2,000,000 shares authorized, no par value, none issued. | - | - | ||||||
| Common stock, 50,000,000 shares authorized, no par value; 10,611,032 and 10,281,032 shares issued as of December 31, 2017 and June 30, 2017, respectively; 10,435,535 and 10,105,535 outstanding as of December 31, 2017 and June 30, 2017, respectively | 20,535,379 | 20,535,379 | ||||||
| Additional paid-in capital | 1,032,016 | 688,934 | ||||||
| Treasury stock, at cost, 175,497 shares as of December 31, 2017 and June 30, 2017 | (417,538 | ) | (417,538 | ) | ||||
| Retained earnings (accumulated deficit) | 20,985 | (893,907 | ) | |||||
| Accumulated other comprehensive loss | (134,637 | ) | (414,564 | ) | ||||
| Total Sino-Global Shipping America Ltd. Stockholders' Equity | 21,036,205 | 19,498,304 | ||||||
| Non-controlling Interest | (4,739,343 | ) | (4,768,779 | ) | ||||
| Total Equity | 16,296,862 | 14,729,525 | ||||||
| Total Liabilities and Equity | $ | 20,223,299 | $ | 17,816,021 | ||||
The accompanying notes are an integral part of these unaudited condensed consolidated financial statements
| 2 |
SINO-GLOBAL SHIPPING AMERICA, LTD. AND AFFILIATES
CONDENSED CONSOLIDATED STATEMENTS OF OPERATIONS AND COMPREHENSIVE INCOME
(UNAUDITED)
| For the Three Months Ended December 31, | For the Six Months Ended December 31, | |||||||||||||||
| 2017 | 2016 | 2017 | 2016 | |||||||||||||
| Net revenues - third parties | $ | 4,665,235 | $ | 1,511,624 | $ | 9,480,086 | $ | 2,606,547 | ||||||||
| Net revenues - related party | 555,246 | 616,924 | 1,120,406 | 1,466,403 | ||||||||||||
| Total revenues | 5,220,481 | 2,128,548 | 10,600,492 | 4,072,950 | ||||||||||||
| Cost of revenues | (3,375,878 | ) | (350,796 | ) | (7,041,796 | ) | (657,135 | ) | ||||||||
| Gross profit | 1,844,603 | 1,777,752 | 3,558,696 | 3,415,815 | ||||||||||||
| General and administrative expenses | (1,827,014 | ) | (776,284 | ) | (2,590,371 | ) | (1,636,198 | ) | ||||||||
| Selling expenses | (335,261 | ) | (46,875 | ) | (357,727 | ) | (112,184 | ) | ||||||||
| Total operating expenses | (2,162,275 | ) | (823,159 | ) | (2,948,098 | ) | (1,748,382 | ) | ||||||||
| Operating income (loss) | (317,672 | ) | 954,593 | 610,598 | 1,667,433 | |||||||||||
| Other income (expense) | ||||||||||||||||
| Financial income (expense), net | 137,799 | (88,470 | ) | 222,595 | (91,904 | ) | ||||||||||
| Total other income (expense) | 137,799 | (88,470 | ) | 222,595 | (91,904 | ) | ||||||||||
| Net income (loss) before provision for income taxes | (179,873 | ) | 866,123 | 833,193 | 1,575,529 | |||||||||||
| Income tax benefit (expense) | 571,121 | (73,391 | ) | 274,692 | (145,012 | ) | ||||||||||
| Net income | 391,248 | 792,732 | 1,107,885 | 1,430,517 | ||||||||||||
| Net income (loss) attributable to non-controlling interest | 93,545 | (100,169 | ) | 192,993 | (108,104 | ) | ||||||||||
| Net income attributable to Sino-Global Shipping America, Ltd. | $ | 297,703 | $ | 892,901 | $ | 914,892 | $ | 1,538,621 | ||||||||
| Comprehensive income | ||||||||||||||||
| Net income | $ | 391,248 | $ | 792,732 | $ | 1,107,885 | $ | 1,430,517 | ||||||||
| Foreign currency translation income (loss) | 97,600 | (104,312 | ) | 145,317 | (118,882 | ) | ||||||||||
| Comprehensive income | 488,848 | 688,420 | 1,253,202 | 1,311,635 | ||||||||||||
| Less: Comprehensive income attributable to non-controlling interest | 20,618 | 21,512 | 61,365 | 24,121 | ||||||||||||
| Comprehensive income attributable to Sino-Global Shipping America Ltd. | $ | 468,230 | $ | 666,908 | $ | 1,191,837 | $ | 1,287,514 | ||||||||
| Earnings per share | ||||||||||||||||
| -Basic | $ | 0.03 | $ | 0.11 | $ | 0.09 | $ | 0.19 | ||||||||
| -Diluted | $ | 0.03 | $ | 0.11 | $ | 0.09 | $ | 0.18 | ||||||||
| Weighted average number of common shares used in computation | ||||||||||||||||
| -Basic | 10,367,492 | 8,280,535 | 10,236,513 | 8,280,535 | ||||||||||||
| -Diluted | 10,415,503 | 8,342,870 | 10,286,683 | 8,318,541 | ||||||||||||
The accompanying notes are an integral part of these unaudited condensed consolidated financial statements
| 3 |
SINO-GLOBAL SHIPPING AMERICA LTD. AND AFFILIATE
CONDENSED CONSOLIDATED STATEMENTS OF CASH FLOWS
(UNAUDITED)
| For the six months ended December 31, | ||||||||
| 2017 | 2016 | |||||||
| US$ | US$ | |||||||
| Cash flows from operating Activities | ||||||||
| Net income | $ | 1,107,885 | $ | 1,430,517 | ||||
| Adjustment to reconcile net income to net cash provided by (used in) operating activities: | ||||||||
| Stock - based compensation expense | 9,665 | 92,472 | ||||||
| Amortization of stock - based compensation to consultants | 333,417 | 529,569 | ||||||
| Depreciation and amortization | 31,742 | 25,407 | ||||||
| Provision for (recovery of) doubtful accounts | 837,431 | (108,344 | ) | |||||
| Deferred tax benefit | (1,073,700 | ) | - | |||||
| Changes in assets and liabilities | ||||||||
| Accounts receivable | (2,210,485 | ) | 615,324 | |||||
| Other receivables | (234,751 | ) | 219,860 | |||||
| Advances to suppliers - third parties | 50,465 | (1,417,731 | ) | |||||
| Prepaid expense and other current assets | 80,952 | 42,906 | ||||||
| Other long-term assets | - | 5,693 | ||||||
| Due from related parties | (921,532 | ) | (133,713 | ) | ||||
| Advances from customers | (23,001 | ) | 369,626 | |||||
| Accounts payable | 288,283 | (309,941 | ) | |||||
| Taxes payable | 731,456 | 174,432 | ||||||
| Due to related parties | (206,323 | ) | - | |||||
| Accrued expenses and other current liabilities | (61,218 | ) | 386,381 | |||||
| Net cash provided by (used in) operating activities | (1,259,714 | ) | 1,922,458 | |||||
| Cash flows from investing Activities | ||||||||
| Acquisition of property and equipment | (50,278 | ) | - | |||||
| Acquisition of intangible assets | (190,000 | ) | - | |||||
| Prepayment for acquisition of intangible assets | (10,000 | ) | - | |||||
| Net cash used in investing activities | (250,278 | ) | - | |||||
| Effect of exchange rate fluctuations on cash and cash equivalents | (3,902 | ) | (14,999 | ) | ||||
| Net (decrease) increase in cash and cash equivalents | (1,513,894 | ) | 1,907,459 | |||||
| Cash and cash equivalents at beginning of period | 8,733,742 | 1,385,994 | ||||||
| Cash and cash equivalents at end of period | $ | 7,219,848 | $ | 3,293,453 | ||||
| Supplemental information | ||||||||
| Income taxes paid | $ | 60,162 | $ | 6,446 | ||||
The accompanying notes are an integral part of these unaudited condensed consolidated financial statements
| 4 |
SINO-GLOBAL SHIPPING AMERICA, LTD. AND AFFILIATES
NOTES TO THE CONDENSED CONSOLIDATED FINANCIAL STATEMENTS
(UNAUDITED)
Note 1. ORGANIZATION AND NATURE OF BUSINESS
Founded in the United States (the “U.S.”) in 2001, Sino-Global Shipping America, Ltd., a Virginia corporation (“Sino-Global” or the “Company”), is a non-asset based global shipping and freight logistics integrated solutions provider. The Company provides tailored solutions and value-added services for its customers to drive effectiveness and control in related links throughout the entire shipping and freight logistics chain. The Company conducts its business primarily through its wholly-owned subsidiaries in the U.S., the People’s Republic of China, including Hong Kong (the “PRC”), Australia and Canada. Currently, a significant portion of the Company’s business is generated from clients located in the PRC.
The Company’s Chinese subsidiary, Trans Pacific Shipping Limited, a wholly-owned foreign enterprise (“Trans Pacific Beijing”), is the 90% owner of Trans Pacific Logistics Shanghai Limited (“Trans Pacific Shanghai”). Trans Pacific Beijing and Trans Pacific Shanghai are referred to collectively as “Trans Pacific”.
Prior to fiscal year 2016, the Company’s shipping agency business was operated by its subsidiaries in the PRC. The Company’s shipping management services were operated by its subsidiary in Hong Kong. The Company’s shipping and chartering services were operated by its subsidiaries in the U.S. and subsidiary in Hong Kong. Currently, the Company’s inland transportation management services are operated by its subsidiaries in the PRC, Hong Kong and the U.S. The Company’s freight logistics services are operated by its subsidiaries in the PRC and the U.S. The Company’s container trucking services are currently operated by its subsidiaries in the PRC and through a joint venture in the U.S. The Company’s newly added bulk cargo container trucking services are currently operated by its subsidiary in the U.S. The Company has increased its business in the U.S. since the launch of the short haul container truck services web-based platform in December 2016.
In January 2016, the Company formed a subsidiary, Sino-Global Shipping LA Inc., a California corporation (“Sino LA”), for the purpose of expanding its business to provide freight logistics services to importers who ship goods into the U.S. The Company expects to generate a majority of its revenues from providing inland transportation services and bulk cargo container services in the coming fiscal year.
In fiscal year 2016, affected by worsening market conditions in the shipping industry, the Company’s shipping agency business sector suffered a significant decrease in revenue due to a reduced number of ships served. As a result, the Company has suspended its shipping agency services business. Also as a result of these market condition changes, the Company has suspended its shipping management services business. In addition, in December 2015, the Company suspended its shipping and chartering services business, primarily as a result of the termination of a previously-contemplated vessel acquisition. As of December 31, 2017, the Company’s business segments consist of inland transportation management services, freight logistics services, container trucking services and bulk cargo container services.
In August 2016, the Company’s Board of Directors (the “Board”) authorized management to move forward with the development of a mobile application that will provide a full-service logistics platform between the U.S. and the PRC for short-haul trucking in the U.S.
Sino-Global completed development of a full-service logistics platform as of December 2016. Upon the completion of the platform, the Company signed two significant agreements with COSCO Beijing International Freight Co., Ltd. (“COSFRE Beijing”) and Sino-Trans Guangxi in December 2016. Pursuant to the agreement with COSFRE Beijing, the Company will receive a percentage of the total amount of each transportation fee for the arrangement of inland transportation services for COSFRE Beijing’s container shipments into U.S. ports. For the strategic cooperation framework agreement with Sino-Trans Guangxi, which is a subsidiary of Sino-Trans Limited, the Company expects to utilize both parties’ existing resources and establish an integrated logistics plan to provide an end-to-end supply chain solution for customers shipping soybeans and sulfur products from the U.S. to southern PRC via container.
On January 5, 2017, the Company entered into a joint venture agreement and formed a new joint venture company named ACH Trucking Center Corp. (“ACH Center”) with Jetta Global Logistics Inc. (“Jetta Global”). Along with the establishment of ACH Center, the Company began providing short haul trucking transportation and logistics services to customers located in the New York and New Jersey areas. The Company holds a 51% ownership stake in ACH Center. Although the establishment of ACH Center brought benefit for the Company and Jetta Global, it could not satisfy long term development for both the Company and Jetta Global. The Company signed a termination agreement with Jetta Global to terminate the joint venture agreement on December 4, 2017. As ACH center’s operating revenue was less than 1% of the Company’s consolidated revenue and the termination did not constitute a strategic shift that will have a major effect on the Company’s operations and financial results, the results of operations for ACH Center was not reported as discontinued operations under the guidance of Accounting Standards Codification 205.
| 5 |
On January 9, 2017, the Company entered into a strategic cooperation agreement with China Ocean Shipping Agency Qingdao Co. Ltd. (“COSCO Qingdao”). COSCO Qingdao will utilize the Company’s full-service logistics platform to arrange the transportation of its container shipments into U.S. ports. Sino-Global will receive a percentage of the total amount of each transportation fee in exchange for the arrangement of inland transportation services for COSCO Qingdao’s container shipments into U.S. ports.
On February 18, 2017, the Company entered into a cooperative transportation agreement with a related party, Zhiyuan International Investment & Holding Group (Hong Kong) Co., Ltd. (the “Buyer” or “Zhiyuan Hong Kong”). Zhiyuan Hong Kong, jointly with China Minmetals Corporation and China Metallurgical Group Corporation, acts as the general designer, general equipment provider and general service contractor in the upgrade and renovation project of Perwaja Steel, located in Malaysia (the “Project”). The Company agreed to provide high-quality services, including the design of a detailed transportation plan as well as execution and necessary supervision of the plan at Zhiyuan Hong Kong’s demand, in consideration for which the Company will receive a 1% to 1.25% transportation fee incurred in the Project as a commission for its services rendered (see Note 3 and Note 15). On July 7, 2017, the Company signed a supplemental agreement with the Buyer, pursuant to which the Company will cooperate with Zhiyuan Hong Kong exclusively on the entire Project’s transportation needs. Pursuant to the supplemental agreement, the Company agrees to make prepayments to Zhiyuan Hong Kong for its share of packaging and transporting costs related to the Project; in return, the Company will receive 15% of the cost incurred in the Project from Zhiyuan Hong Kong as a service fee. The Project is expected to be completed in one to two years and the Company will collect its service fee in accordance with Project completion.
On September 11, 2017, the Company set up a new wholly-owned subsidiary, Ningbo Saimeinuo Supply Chain Management Ltd. (“Sino Ningbo”), via the wholly-owned entity, Sino-Global Shipping New York Inc. This subsidiary primarily engages in supply chain management and freight logistics services.
Note 2. SUMMARY OF SIGNIFICANT ACCOUNTING POLICIES
(a) Basis of Presentation
The accompanying unaudited condensed consolidated financial statements have been prepared in accordance with accounting principles generally accepted in the United States of America (“US GAAP”) for information pursuant to the rules and regulations of the Securities Exchange Commission (“SEC”).
In the opinion of management, all adjustments, consisting only of normal recurring adjustments, considered necessary to give a fair presentation have been included. Interim results are not necessarily indicative of results of a full year. The information in this Form 10-Q should be read in conjunction with information included in the annual report for the fiscal year ended June 30, 2017 on Form 10-K filed with the SEC on September 27, 2017.
(b) Basis of Consolidation
The unaudited condensed consolidated financial statements include the accounts of the Company, its subsidiaries, and its affiliates. All significant intercompany transactions and balances are eliminated in consolidation. A subsidiary is an entity in which the Company, directly or indirectly, controls more than one half of the voting power or has the power to: govern the financial and operating policies; appoint or remove the majority of the members of the board of directors; cast a majority of votes at the meeting of the board of directors.
U.S. GAAP provides guidance on the identification of variable interest entity (“VIE”) and financial reporting for entities over which control is achieved through means other than voting interests. The Company evaluates each of its interests in an entity to determine whether or not the investee is a VIE and, if so, whether the Company is the primary beneficiary of such VIE. In determining whether the Company is the primary beneficiary, the Company considers if the Company (1) has power to direct the activities that most significantly affects the economic performance of the VIE, and (2) receives the economic benefits of the VIE that could be significant to the VIE. If deemed the primary beneficiary, the Company consolidates the VIE. Sino-Global Shipping Agency Ltd., a PRC corporation (“Sino-China”), is considered a VIE, with the Company as the primary beneficiary. The Company, through Trans Pacific Beijing, entered into certain agreements with Sino-China, pursuant to which the Company receives 90% of Sino-China’s net income. The Company does not receive any payments from Sino-China unless Sino-China recognizes net income during its fiscal year.
As a VIE, Sino-China’s revenues are included in the Company’s total revenues, and any loss from operations is consolidated with that of the Company. Because of contractual arrangements between the Company and Sino-China, the Company has a pecuniary interest in Sino-China that requires consolidation of the financial statements of the Company and Sino-China.
| 6 |
The Company has consolidated Sino-China’s operating results because the entities are under common control in accordance with ASC 805-10, “Business Combinations”. The agency relationship between the Company and Sino-China and its branches is governed by a series of contractual arrangements pursuant to which the Company has substantial control over Sino-China. Management makes ongoing reassessments of whether the Company remains the primary beneficiary of Sino-China. As mentioned elsewhere in this report, due to the worsening market conditions in the shipping industry, Sino-China’s shipping agency business suffered a significant decrease in revenue due to a reduced number of ships served. As a result, the Company has temporarily suspended this business. Sino-China is also providing services in other related business segments of the Company.
The carrying amount and classification of Sino-China’s assets and liabilities included in the Company’s unaudited condensed consolidated balance sheets were as follows:
| December 31, | June 30, | |||||||
| 2017 | 2017 | |||||||
| Total current assets | $ | 9,736,634 | $ | 9,327,990 | ||||
| Total assets | 9,877,880 | 9,472,651 | ||||||
| Total current liabilities | 6,279 | 4,517 | ||||||
| Total liabilities | 6,279 | 4,517 | ||||||
(c) Fair Value of Financial Instruments
We follow the provisions of ASC 820, Fair Value Measurements and Disclosures, which clarifies the definition of fair value, prescribes methods for measuring fair value, and establishes a fair value hierarchy to classify the inputs used in measuring fair value as follows:
Level 1 — Observable inputs such as unadjusted quoted prices in active markets for identical assets or liabilities available at the measurement date.
Level 2 — Inputs other than quoted prices that are observable for the asset or liability in active markets, quoted prices for identical or similar assets and liabilities in markets that are not active, inputs other than quoted prices that are observable, and inputs derived from or corroborated by observable market data.
Level 3 — Unobservable inputs that reflect management’s assumptions based on the best available information.
The carrying value of accounts receivable, other receivables, other current assets and current liabilities approximate their fair values because of the short-term nature of these instruments.
(d) Use of Estimates and Assumptions
The preparation of the Company’s unaudited condensed consolidated financial statements in conformity with U.S. GAAP requires management to make estimates and assumptions that affect the reported amounts of assets and liabilities and disclosure of contingent assets and liabilities at the dates of the financial statements and the reported amounts of revenues and expenses during the reporting periods. Estimates are adjusted to reflect actual experience when necessary. Significant accounting estimates reflected in the Company’s unaudited condensed consolidated financial statements include revenue recognition, fair value of stock based compensation, cost of revenues, allowance for doubtful accounts, deferred income taxes, and the useful lives of property and equipment. Since the use of estimates is an integral component of the financial reporting process, actual results could differ from those estimates.
| 7 |
(e) Translation of Foreign Currency
The accounts of the Company and its subsidiaries, including Sino-China and each of its branches are measured using the currency of the primary economic environment in which the entity operates (the “functional currency”). The Company’s functional currency is the U.S. dollar (“USD”) while its subsidiaries in the PRC, including Sino-China, report their financial positions and results of operations in Renminbi (“RMB”). The accompanying unaudited condensed consolidated financial statements are presented in USD. Foreign currency transactions are translated into USD using the fixed exchange rates in effect at the time of the transaction. Generally, foreign exchange gains and losses resulting from the settlement of such transactions are recognized in the unaudited condensed consolidated statements of operations. The Company translates the foreign currency financial statements of Sino-China, Sino-Global Shipping Australia, Sino-Global Shipping Hong Kong, Sino-Global Shipping Canada, Trans Pacific Beijing, Trans Pacific Shanghai and Sino Ningbo in accordance with ASC 830-10, “Foreign Currency Matters”. Assets and liabilities are translated at current exchange rates quoted by the People’s Bank of China at the balance sheet dates and revenues and expenses are translated at average exchange rates in effect during the year. The resulting translation adjustments are recorded as other comprehensive income (loss) and accumulated other comprehensive loss as a separate component of equity of the Company, and also included in non-controlling interests.
The exchange rates as of December 31, 2017 and June 30, 2017 and for the three and six months ended December 31, 2017 and 2016 are as follows:
| December 31, | June 30, | Three months ended December 31, | Six months ended December 31, | |||||||||||||||||||||
| 2017 | 2017 | 2017 | 2016 | 2017 | 2016 | |||||||||||||||||||
| Foreign currency | Balance Sheet | Balance Sheet | Profits/Loss | Profits/Loss | Profits/Loss | Profits/Loss | ||||||||||||||||||
| RMB:1USD | 6.5060 | 6.7806 | 6.6153 | 6.8328 | 6.6428 | 6.7498 | ||||||||||||||||||
| AUD:1USD | 1.2797 | 1.3028 | 1.3007 | 1.3357 | 1.2838 | 1.3275 | ||||||||||||||||||
| HKD:1USD | 7.8118 | 7.8059 | 7.8076 | 7.7576 | 7.8112 | 7.7571 | ||||||||||||||||||
| CAD:1USD | 1.2573 | 1.2982 | 1.2702 | 1.3351 | 1.2620 | 1.3198 | ||||||||||||||||||
(f) Cash and Cash Equivalents
Cash and cash equivalents consist of cash on hand and other highly liquid investments which are unrestricted as to withdrawal or use, and which have an original maturity of three months or less when purchased. The Company maintains cash and cash equivalents with various financial institutions mainly in the PRC, Australia, Hong Kong, Canada and the U.S. As of December 31, 2017 and June 30, 2017, cash balances of $6,812,501 and $6,246,337, respectively, were maintained at financial institutions in the PRC, which were not insured by any of the Chinese authorities. As of December 31, 2017 and June 30, 2017, cash balance of $364,722 and $2,462,792, respectively, were maintained at U.S. financial institutions, and were insured by the Federal Deposit Insurance Corporation or other programs subject to certain limitations.
(g) Accounts Receivable and Allowance for Doubtful Accounts
Accounts receivable are presented at net realizable value. The Company maintains allowances for doubtful accounts and for estimated losses. The Company reviews the accounts receivable on a periodic basis and makes general and specific allowances when there is doubt as to the collectability of individual receivable balances. In evaluating the collectability of individual receivable balances, the Company considers many factors, including the age of the balances, customers’ historical payment history, their current credit-worthiness and current economic trends. Receivables are considered past due after 180 days. Accounts Receivable are written off against the allowances only after exhaustive collection efforts.
| 8 |
(h) Property and Equipment, net
Net property and equipment are stated at historical cost less accumulated depreciation. Historical cost comprises the asset’s purchase price and any directly attributable costs of bringing the asset to its working condition and location for its intended use. Depreciation is calculated on a straight-line basis over the following estimated useful lives:
| Buildings | 20 years | |
| Motor vehicles | 5-10 years | |
| Furniture and office equipment | 3-5 years | |
| Leasehold improvements | Shorter of lease term or useful life |
The carrying value of a long-lived asset is considered impaired by the Company when the anticipated undiscounted cash flows from such asset are less than the asset’s carrying value. If impairment is identified, a loss is recognized based on the amount by which the carrying value exceeds the fair value of the long-lived asset. Fair value is determined primarily using the anticipated cash flows discounted at a rate commensurate with the risk involved or based on independent appraisals. Management has determined that there were no impairments as of the balance sheet dates.
(i) Intangible Assets, net
Intangible assets are recorded at cost less accumulated amortization. Amortization is calculated on a straight-line basis over the following estimated useful lives:
| Software | 3-5 years |
The Company evaluates intangible assets for impairment whenever events or changes in circumstances indicate that the assets might be impaired. There was no such impairment as of December 31, 2017.
(j) Revenue Recognition
Revenue is recognized when all of the following have occurred: (i) persuasive evidence of an arrangement exists, (ii) delivery has occurred or services have been rendered, (iii) the price is fixed or determinable, and (iv) the ability to collect is reasonably assured
| ● | Revenues from inland transportation management services are recognized when commodities are being released from the customers’ warehouse. | |
| ● | Revenues from freight logistics services are recognized when the related contractual services are rendered. | |
| ● | Revenues from container trucking services are recognized when the related contractual services are rendered. | |
| ● | Revenues from bulk cargo container services are recognized when the related contractual services are rendered. |
| 9 |
Bulk cargo container services included shipping of products, arranging cargo container shipping from U.S. to China port, then from China port to end user. Revenue is recognized upon completion of shipping arrangements agreed with customers, either at customer’s designated port or final destination.
(k) Taxation
Because the Company and its subsidiaries and Sino-China are incorporated in different jurisdictions, they file separate income tax returns. The Company uses the asset and liability method of accounting for income taxes in accordance with U.S. GAAP. Deferred taxes, if any, are recognized for the future tax consequences of temporary differences between the tax basis of assets and liabilities and their reported amounts in the unaudited condensed consolidated financial statements. A valuation allowance is provided against deferred tax assets if it is more likely than not that the asset will not be utilized in the future.
The Company recognizes the tax benefit from an uncertain tax position only if it is more likely than not that the tax position will be sustained on examination by the taxing authorities, based on the technical merits of the position. The Company recognizes interest and penalties, if any, related to unrecognized tax benefits as income tax expense.
Income tax returns for the years prior to 2014 are no longer subject to examination by U.S. tax authorities.
On December 22, 2017, the “Tax Cuts and Jobs Act” (“The Act”) was enacted. Under the provisions of The Act, the U.S. corporate tax rate decreased from 35% to 21%. Since the Company has a June 30 fiscal year-end, the U.S. statutory federal blended rate will be approximately 28% for our fiscal year ending June 30, 2018, and 21% for subsequent fiscal years. Additionally, the Tax Act imposes a one-time transition tax on deemed repatriation of historical earnings of foreign subsidiaries, and future foreign earnings are subject to U.S. taxation. The change in rate has caused the Company to re-measure all U.S. deferred income tax assets and liabilities for temporary differences using the blended rate. Net operating loss (“NOL”) carryforwards are limited to 80% of taxable income and can be carried forward indefinitely.
PRC Enterprise Income Tax
PRC enterprise income tax is calculated based on taxable income determined under the PRC Generally Accepted Accounting Principles (“PRC GAAP”) at 25%. Sino-China and Trans Pacific are registered in PRC and governed by the Enterprise Income Tax Laws of the PRC.
PRC Business Tax and Surcharges
Revenues from services provided by the Company’s PRC subsidiaries and affiliates, including Sino-China and Trans Pacific are subject to the PRC business tax of 5%. Business tax and surcharges are paid on gross revenues generated minus the costs of services which are paid on behalf of the customers.
Enterprises or individuals who sell commodities, engage in services or selling of goods in the PRC are subject to a value added tax (“VAT”) in accordance with PRC laws. All of the Company’s revenue generated in the PRC are subject to a VAT on the gross sales price. The VAT rates are 6% and 11%, depending on the type of services provided. The Company is entitled to a deduction or offset for VAT paid on the services rendered by the vendors against the VAT when the Company engage in services.
In addition, under PRC regulations, the Company’s PRC subsidiaries and affiliates are required to pay city construction taxes (7%) and education surcharges (3%) based on calculated business tax payments.
The Company’s PRC subsidiaries and affiliates report revenues net of PRC’s VAT, business tax and surcharges for all the periods presented in the consolidated statements of operations.
| 10 |
(l) Earnings per Share
Basic earnings per share is computed by dividing net income attributable to holders of common shares of the Company by the weighted average number of common shares of the Company outstanding during the applicable period. Diluted earnings per share reflect the potential dilution that could occur if securities or other contracts to issue common shares of the Company were exercised or converted into common shares of the Company. Common share equivalents are excluded from the computation of diluted earnings per share if their effects would be anti-dilutive.
For the three and six months ended December 31, 2017, the basic average shares outstanding and diluted average shares of the Company outstanding were not the same because the effect of potential shares of common stock of the Company was dilutive since the exercise prices for options were lower than the average market price for the related periods. For the three and six months ended December 31, 2017, a total of 48,011 and 50,170 unexercised options were dilutive, respectively, and were included in the computation of diluted earnings per share. For the three and six months ended December 31, 2016, a total of 62,335 and 38,006 unexercised options were dilutive, respectively, and were included in the computation of diluted EPS.
(m) Comprehensive Income (loss)
The Company reports comprehensive income (loss) in accordance with the Financial Accounting Standards Board (“FASB”) issued authoritative guidance which establishes standards for reporting comprehensive income (loss) and its component in financial statements. Comprehensive income (loss), as defined, includes all changes in equity during a period from non-owner sources.
(n) Stock-based Compensation
Stock-based payment transactions with employees are measured on the grant-date fair value of the equity instrument issued and recognized as compensation expense over the requisite service period. Valuations are based upon highly subjective assumptions about the future, including stock price volatility and exercise patterns. The fair value of share-based payment awards was estimated using the Black-Scholes option pricing model. Expected volatilities are based on the historical volatility of the Company’s stock. The Company uses historical data to estimate option exercise and employee terminations. The expected term of options granted represents the period of time that options granted are expected to be outstanding. The risk-free rate for periods within the expected life of the option is based on the U.S. Treasury yield curve in effect at the time of the grant.
(o) Risks and Uncertainties
The Company’s business, financial position and results of operations may be influenced by the political, economic, and legal environments in the PRC, as well as by the general state of the PRC economy. The Company’s operations in the PRC are subject to special considerations and significant risks not typically associated with companies in North America and Western Europe. These include risks associated with, among others, the political, economic and legal environment and foreign currency exchange. The Company’s results may be adversely affected by changes in the political, regulatory and social conditions in the PRC, and by changes in governmental policies or interpretations with respect to laws and regulations, anti-inflationary measures, currency conversion, remittances abroad, and rates and methods of taxation, among other things. Moreover, the Company’s ability to grow its business and maintain its profitability could be negatively affected by the nature and extent of services provided to its major customers, Tianjin Zhiyuan Investment Group Co., Ltd. (the “Zhiyuan Investment Group”) and Tengda Northwest Ferroalloy Co., Ltd. (“Tengda Northwest”).
(p) Reclassification
Certain prior period amounts have been reclassified to conform to the current period presentation, including reclassification of $125,755 amortization of stock-based compensation to consultants as prepaid expense and other current assets, and reclassification of $504,815 revenue and $390,719 cost of revenue from freight logistics service segment to bulk cargo container service segment. These reclassifications have no effect on the results of operations and cash flows.
| 11 |
(q) Recent Accounting Pronouncements
Revenue Recognition: In May 2014, the FASB issued Accounting Standards Update No. 2014-09, Revenue from Contracts with Customers: Topic 606 (ASU 2014-09), to supersede nearly all existing revenue recognition guidance under U.S. GAAP. The core principle of ASU 2014-09 is to recognize revenues when promised goods or services are transferred to customers in an amount that reflects the consideration that is expected to be received for those goods or services. ASU 2014-09 defines a five step process to achieve this core principle and, in doing so, it is possible more judgment and estimates may be required within the revenue recognition process than are required under existing U.S. GAAP, including identifying performance obligations in the contract, estimating the amount of variable consideration to include in the transaction price and allocating the transaction price to each separate performance obligation. ASU 2014-09 is effective for the Company in the first quarter of fiscal year 2018 using either of two methods: (i) retrospective to each prior reporting period presented with the option to elect certain practical expedients as defined within ASU 2014-09 (full retrospective method); or (ii) retrospective with the cumulative effect of initially applying ASU 2014-09 recognized at the date of initial application and providing certain additional unaudited condensed as defined per ASU 2014-09 (modified retrospective method). The Company is currently assessing the impact to its unaudited condensed financial statements, and has not yet selected a transition approach.
Leases: In February 2016, the FASB issued ASU No. 2016-02, Leases (Topic 842) (“ASU 2016-2”), which provides guidance on lease amendments to the FASB Accounting Standard Codification. This ASU will be effective for us beginning in December 15, 2018. The Company is currently in the process of evaluating the impact of the adoption of ASU 2016-2 on unaudited condensed financial statements.
Statement of Cash Flows: In August 2016, the FASB issued ASU 2016-15, Statement of Cash Flows (Topic 230): The amendments in this Update apply to all entities, including both business entities and not-for-profit entities that are required to present a statement of cash flows under Topic 230. The amendments in this Update provide guidance on the following eight specific cash flow issues. The amendments are an improvement to GAAP because they provide guidance for each of the eight issues, thereby reducing the current and potential future diversity in practice described above. ASU 2016-15 is effective for the Company for fiscal years beginning after December 15, 2017, including interim periods within those fiscal years. Early adoption is permitted, including adoption in an interim period. The Company is still evaluating the effect that this guidance will have on the Company’s unaudited condensed financial statements and related disclosures.
Business Combination: In January 2017, the FASB issued Accounting Standards Update No. 2017-01, Business Combinations (Topic 805): Clarifying the Definition of a Business (ASU 2017-01), which revises the definition of a business and provides new guidance in evaluating when a set of transferred assets and activities is a business. This guidance will be effective in the fiscal year beginning after December 15, 2017 and interim periods within those periods on a prospective basis, and early adoption is permitted. The Company does not expect the standard to have a material impact on its consolidated financial statements.
Stock-based Compensation: In May 2017, the FASB issued ASU No. 2017-09, “Compensation—Stock compensation (Topic 718): Scope of modification accounting” (“ASU 2017-09”). The purpose of the amendment is to clarify which changes to the terms or conditions of a share-based payment award require an entity to apply modification accounting. For all entities that offer share based payment awards, ASU 2017-09 is effective for interim and annual reporting periods beginning after December 15, 2017. The Company is currently assessing the impact of ASU 2017-09 on its unaudited condensed financial statements.
Stock-based Compensation: In July 2017, the FASB issued ASU 2017-11, “Earnings Per Share (Topic 260)”, Distinguishing Liabilities from Equity (Topic 480), Derivatives and Hedging (Topic 815). The amendments in Part I of this Update change the classification analysis of certain equity-linked financial instruments (or embedded features) with down round features. When determining whether certain financial instruments should be classified as liabilities or equity instruments, a down round feature no longer precludes equity classification when assessing whether the instrument is indexed to an entity’s own stock. The amendments also clarify existing disclosure requirements for equity-classified instruments. The amendments in Part II of this Update recharacterize the indefinite deferral of certain provisions of Topic 480 that now are presented as pending content in the Codification, to a scope exception. Those amendments do not have an accounting effect. For public business entities, the amendments in Part I of this Update are effective for fiscal year and interim periods within those fiscal years, beginning after December 15, 2018. Early adoption is permitted for all entities, including adoption in an interim period. If an entity early adopts the amendments in an interim period, any adjustments should be reflected as of the beginning of the fiscal year that includes that interim period. The Company does not expect that the adoption of this guidance will have a material impact on its unaudited condensed financial statements.
Revenue Recognition and Leases: In September 2017, the FASB issued ASU 2017-13, Revenue from Contracts with Customers (Topic 606) and Leases (Topic 842). The main objective of this pronouncement is to clarify the effective date of the adoption of ASC Topic 606 and ASC Topic 842 and the definition of public business entity as stipulated in ASU 2014-09 and ASU 2016-02. ASU 2014-09 provides that a public business entity and certain other specified entities adopt ASC Topic 606 for annual reporting periods beginning after December 15, 2017, including interim reporting periods within that reporting period. All other entities are required to adopt ASC Topic 606 for annual reporting periods beginning after December 15, 2018, and interim reporting periods within annual reporting periods beginning after December 15, 2019. ASU 2016-12 requires that “a public business entity and certain other specified entities adopt ASC Topic 842 for fiscal years beginning after December 15, 2018, and interim periods within those fiscal years. All other entities are required to adopt ASC Topic 842 for fiscal years beginning after December 15, 2019, and interim periods within fiscal years beginning after December 15, 2020”. ASU 2017-13 clarifies that the SEC would not object to certain public business entities electing to use the non-public business entities effective dates for applying ASC 606 and ASC 842. ASU 2017-13, however, limits such election to certain public business entities that “otherwise would not meet the definition of a public business entity except for a requirement to include or inclusion of its financial statements or financial information in another entity’s filings with the SEC”. Management does not expect the adoption of ASU 2017-13 to have any material impact on its financial positions and results of operations or cash flows.
Except for the ASU’s described above, no ASU’s are expected to have a material impact on the unaudited condensed consolidated financial statements upon adoption.
| 12 |
Note 3. ADVANCES TO SUPPLIERS
The Company’s advances to third - party suppliers are as follows:
| December 31, | June 30, | |||||||
| 2017 | 2017 | |||||||
| Intelligent logistics system deposit | $ | 10,000 | $ | - | ||||
| Freight fees | - | 29,960 | ||||||
| Other | 4,611 | 24,930 | ||||||
| Total advances to suppliers - third parties | $ | 14,611 | $ | 54,890 | ||||
On December 27, 2017, with the approval of the Board of Directors, the Company signed a contract with Tianjin Anboweiye Technology Ltd Co. (“Tianjin Anboweiye”), to develop a more complete and intelligent logistics system based on the Company’s current container trucking platform. The purpose is to help the Company make better connections with the system used by state-owned companies in China, and to satisfy such state-owned companies’ demand for container trucks in the United States.
As of December 31, 2017, advances to third-party suppliers were primarily related to freight logistics services.
The Company’s advances to related-party suppliers are as follows:
| December 31, | June 30, | |||||||
| 2017 | 2017 | |||||||
| Freight fees | $ | 3,473,717 | $ | 3,333,038 | ||||
| Total advances to suppliers - related party | $ | 3,473,717 | $ | 3,333,038 | ||||
As discussed in Note 1, on February 18, 2017, the Company entered into a cooperative transportation agreement with Zhiyuan Hong Kong. Zhiyuan Hong Kong is owned by the Company’s largest shareholder. On July 7, 2017, the Company signed a supplemental agreement, pursuant to which the Company will cooperate with Zhiyuan Hong Kong exclusively on the entire Project’s transportation needs. Pursuant to the supplemental agreement, the Company agrees to make prepayments to Zhiyuan Hong Kong for its share of packaging and transporting costs related to the Project; in return the Company will receive 15% of the cost incurred in the Project from Zhiyuan Hong Kong as a service fee. The Project is expected to be completed in one to two years, and the Company will collect its service fee in accordance with Project completion. As of December 31, 2017, no cost was recognized under this Project. No additional freight fees were advanced during the three and six months ended December 31, 2017.
Note 4. ACCOUNTS RECEIVABLE, NET
The Company’s net accounts receivable is as follows:
| December 31, | June 30, | |||||||
| 2017 | 2017 | |||||||
| Trade accounts receivable | $ | 5,012,347 | $ | 2,754,962 | ||||
| Less: allowances for doubtful accounts | (763,984 | ) | (185,821 | ) | ||||
| Accounts receivables, net | $ | 4,248,363 | $ | 2,569,141 | ||||
| 13 |
Movement of allowance for doubtful accounts is as follows:
Six months ended December 31, 2017 | Year ended June 30, | |||||||
| Beginning balance | $ | 185,821 | $ | 207,028 | ||||
| Provision for doubtful accounts | 598,403 | - | ||||||
| Less: write-off/recovery | (24,638 | ) | (18,912 | ) | ||||
| Exchange rate effect | 4,398 | (2,295 | ) | |||||
| Ending balance | $ | 763,984 | $ | 185,821 | ||||
Note 5. PREPAID EXPENSES AND OTHER ASSETS
The Company’s prepaid expenses and other current assets are as follows:
| December 31, | June 30, | |||||||
| 2017 | 2017 | |||||||
| Consultant fees (1) | $ | 79,075 | $ | 158,150 | ||||
| Advance to employees | 57,859 | 64,160 | ||||||
| Other | 93,787 | 95,708 | ||||||
| Total | 230,721 | 318,018 | ||||||
| Less: current portion | 230,721 | 311,136 | ||||||
| Total noncurrent portion | $ | - | $ | 6,882 | ||||
(1) The Company entered into a management consulting services agreement with a consulting company on November 12, 2015, pursuant to which the consulting company shall assist the Company with its regulatory filings during the period from July 1, 2016 to June 30, 2018. In return for its services, as approved by the Board, a total of RMB 2,100,000 ($316,298) was paid to the consulting company. The above-mentioned consulting fees have been and will be ratably charged to expense over the terms of the above-mentioned agreement.
| 14 |
Note 6. PROPERTY AND EQUIPMENT, NET
The Company’s net property and equipment as follows:
| December 31, | June 30, | |||||||
| 2017 | 2017 | |||||||
| Buildings | $ | 206,891 | $ | 198,512 | ||||
| Motor vehicles | 608,862 | 542,471 | ||||||
| Computer equipment | 156,826 | 155,141 | ||||||
| Office equipment | 78,273 | 66,097 | ||||||
| Furniture and fixtures | 166,372 | 163,219 | ||||||
| System software | 122,479 | 117,733 | ||||||
| Leasehold improvements | 65,511 | 62,857 | ||||||
| Total | 1,405,214 | 1,306,030 | ||||||
| Less: Accumulated depreciation | 1,187,879 | 1,118,657 | ||||||
| Property and equipment, net | $ | 217,335 | $ | 187,373 | ||||
Depreciation expense for the three months ended December 31, 2017 and 2016 were $13,261 and $12,065, respectively.
Depreciation expense for the six months ended December 31, 2017 and 2016 were $26,464 and $25,407, respectively.
Note 7. INTANGIBLE ASSETS, NET
Intangible assets consisted of the following:
| December 31, | June 30, | |||||||
| 2017 | 2017 | |||||||
| Full service logistics platforms | $ | 190,000 | $ | - | ||||
| Less: Accumulated amortization | 5,278 | - | ||||||
| Intangible asset, net | $ | 184,722 | $ | - | ||||
As a part of the above-mentioned intelligent logistics system (see Note 3), four information platforms were completed by the Tianjin Anboweiye research team in November 2017 and placed into service. The platforms are being amortized over five years.
Amortization expense of intangible assets amounted to $5,278 and $nil for the three and six months ended December 31, 2017 and 2016, respectively.
| 15 |
Note 8. STOCK-BASED COMPENSATION
The issuance of the Company’s options is exempted from registration under of the Securities Act of 1933, as amended (the “Act”). The Common Stock underlying the Company’s options granted may be sold in compliance with Rule 144 under the Act. Each option may be exercised to purchase one share of the common stock of the Company, no par value per share (the “Common Stock”). Payment for the options may be made in cash or by exchanging shares of Common Stock at their fair market value. The fair market value will be equal to the average of the highest and lowest registered sales prices of Company Stock on the date of exercise.
The term of the options granted in 2009 is for 10 years and the exercise price of the 56,000 options is $7.75 which vested over 5 years and were fully vested as of December 31, 2017. The fair value of the stock options was estimated using the Black-Scholes option-pricing model.
The term of the 10,000 options granted in 2013 is 10 years and the exercise is $2.01. The fair value of the 10,000 stock options was calculated at the grant date using the Black-Scholes option-pricing model with the following assumptions: volatility of 452.04%, risk free interest rate of 0.88% and expected life of 10 years. The total fair value of the options was $19,400. In accordance with the vesting periods, the Company recorded no stock-based compensation expense for the three and six months ended December 31, 2017 and 2016. As of December 31, 2017, 8,000 options were vested.
Pursuant to the Company’s 2014 Stock Incentive Plan, effective on July 26, 2016, the Company granted options to purchase a total of 150,000 shares of the Company’s Common Stock to two employees with a one-year vesting period, one half of which vested on October 26, 2016, and the other half vested on July 26, 2017. The exercise price of the options is $1.10, which was equal to the share price of the Company’s Common Stock on July 26, 2016. The grant date fair value of such options was $0.77 per share. The fair value of the options was calculated using the Black-Scholes options pricing model with the following assumptions: volatility of 99.68%, risk free interest rate of 1.15%, and expected life of 5 years. The total fair value of the options was $115,979. In accordance with the vesting periods, $nil and $28,995 were expensed related to these options for the three months ended December 31, 2017 and 2016, respectively. $9,665 and $48,325 were expensed related to these options for the six months ended December 31, 2017 and 2016, respectively. In February 2017, 75,000 of these options were exercised by the two employees of the Company.
A summary of the options is presented in the table below:
| Shares | Weighted Average Exercise Price | |||||||
| Options outstanding, as of June 30, 2017 | 141,000 | $ | 3.81 | |||||
| Granted | - | - | ||||||
| Exercised | - | - | ||||||
| Cancelled | - | - | ||||||
| Options outstanding, as of December 31, 2017 | 141,000 | $ | 3.81 | |||||
| Options exercisable, as of December 31, 2017 | 139,000 | $ | 3.83 | |||||
| 16 |
Following is a summary of the status of options outstanding and exercisable as of December 31, 2017
| Outstanding Options | Exercisable Options | |||||||||||||||||
| Exercise Price | Number | Average Remaining Contractual Life | Average Exercise Price | Number | Average Remaining Contractual Life | |||||||||||||
| $ | 7.75 | 56,000 | 0.38 years | $ | 7.75 | 56,000 | 0.38 years | |||||||||||
| $ | 2.01 | 10,000 | 5.08 years | $ | 2.01 | 8,000 | 5.08 years | |||||||||||
| $ | 1.10 | 75,000 | 3.57 years | $ | 1.10 | 75,000 | 3.57 years | |||||||||||
| 141,000 | 139,000 | |||||||||||||||||
Following is a summary of the status of warrants outstanding and exercisable as of December 31, 2017:
| Warrants Outstanding | Warrants Exercisable | Weighted Average Exercise Price | Average Remaining Contractual Life | |||||||||
| 139,032 | 139,032 | $ | 9.30 | 0.38 years | ||||||||
Total expenses for options and warrants amounted to $Nil and $9,665 for three and six months ended December 31, 2017, respectively. Total expenses for options and warrants amounted to $28,995 and $92,472 for three and six months ended December 31, 2016, respectively.
Note 9. EQUITY TRANSACTIONS
On June 6, 2014, the Company entered into management consulting and advisory services agreements with two consultants, pursuant to which the consultants assisted the Company in, among other things, financial and tax due diligence, business evaluation and integration, and development of pro forma financial statements. In return for their services, as approved by the Company’s Board of Directors, a total of 600,000 shares of the Company’s common stock were to be issued to these two consultants. In June 2014, 200,000 shares of the Company’s common stock were issued to the consultants as a prepayment for their services. The value of their consulting services was determined using the fair value of the Company’s common stock of $2.34 per share when the shares were issued to the consultants. Their service agreements were for the period July 1, 2014 to December 31, 2016. The remaining 400,000 shares of the Company’s common stock were then issued to the consultants on September 30, 2014 at $1.68 per share, and the service terms are from September 2014 to November 2016. These shares were valued at $1,140,000 and the related consulting fees have been ratably charged to expense over the term of the agreements. Consulting expenses for the above services were $nil and $96,578 for the three months ended December 31, 2017 and 2016, respectively. Consulting expenses for the above services were $nil and $218,045 for the six months ended December 31, 2017 and 2016, respectively.
On May 5, 2015, the Company entered into management consulting and advisory services agreements with three consultants, pursuant to which the consultants assisted the Company in, among other things, review of time charter agreements; crew management advisory; development of permanent and preventive maintenance standards related to dry dockings and ship repairs; development of regular technical and marine vessel inspections and quality control procedures; and development and implementation of alternative remedial actions to address technical problems that may arise. In return for their services, as approved by the Company’s Board of Directors, a total of 500,000 shares of the Company’s common stock were to be issued to these three consultants at $1.50 per share. Their service agreements are for a period of 18 months, effective May 2015. These shares were valued at $750,000 and the related consulting fees have been ratably charged to expense over the term of the agreements. Consulting expenses for the above services were $nil and $48,478 for the three months ended December 31, 2017 and 2016, respectively. Consulting expenses for the above services were $nil and $173,137 for the six months ended December 31, 2017 and 2016, respectively
On December 9, 2015, the Company entered into a consulting and advisory services agreement with a consultant, pursuant to which the consultant will assist the Company with corporate restructuring, business evaluation and capitalization during the period from November 20, 2015 to November 19, 2016. In return for such services, the Company issued 250,000 shares of the Company’s common stock to this consultant for services to be rendered during the first half of the service period. Such shares were issued as restricted shares at $1.02 per share on December 9, 2015. On May 23, 2016, the Company issued an additional 250,000 shares of common stock to this consultant at $0.72 per share to cover the services from the seventh month to November 19, 2016. These shares were valued at $435,000. Consulting expenses were $nil and $48,387 for the three months ended December 31, 2017 and 2016, respectively. Consulting expenses were $nil and $138,387 for the six months ended December 31, 2017 and 2016, respectively.
| 17 |
In March 2017, the Company entered into a consulting and advisory services agreement with Jianwei Li, who will provide management consulting services that include marketing program designing and implementation and cooperative partner selection and management. The service period is from March 2017 to February 2020. The Company issued 250,000 shares of common stock as the remuneration for the services, which were issued as restricted shares at $2.53 per share on March 22, 2017 to the consultant. These shares were valued at $632,500. Consulting expenses were $52,709 and $nil for the three months ended December 31, 2017 and 2016, respectively. Consulting expenses were $105,417 and $nil for the six months ended December 31, 2017 and 2016, respectively.
On October 23, 2017, the Company issued 130,000 shares to its employees of its restricted common stock valued at $2.80 per share. One fourth of the total number of common shares issued shall become vested on each of November 16, 2017, February 16, 2018, May 16, 2018 and August 16, 2018. These shares were valued at $364,000. $91,000 and $nil are recorded in the Company’s G&A expenses for the three and six months ended December 31, 2017 and 2016, respectively.
On October 27, 2017, the Company issued 200,000 shares of restricted common stock with a fair value of $548,000 to a company pursuant to a consulting agreement. The scope of services primarily covers advising on business development, strategic planning and compliance during the one-year service period from October 17, 2017 to October 16, 2018. Consulting expenses were $137,000 and $nil for the three and six months ended December 31, 2017 and 2016, respectively.
Total consulting expenses were $280,709 and $193,443 for the three months ended December 31, 2017 and 2016, and $333,417 and $529,569 for the six months ended December 31, 2017 and 2016, respectively.
Note 10. NON-CONTROLLING INTEREST
The Company’s non-controlling interest consists of the following:
| December 31, | June 30, | |||||||
| 2017 | 2017 | |||||||
| Sino-China: | ||||||||
| Original paid-in capital | $ | 356,400 | $ | 356,400 | ||||
| Additional paid-in capital | 1,044 | 1,044 | ||||||
| Accumulated other comprehensive income | 82,769 | 217,379 | ||||||
| Accumulated deficit | (5,277,982 | ) | (5,421,578 | ) | ||||
| (4,837,769 | ) | (4,846,755 | ) | |||||
| Trans Pacific Logistics Shanghai Ltd. | 98,426 | 46,047 | ||||||
| ACH Trucking Center Corp. (A) | - | 31,929 | ||||||
| Total | $ | (4,739,343 | ) | $ | (4,768,779 | ) | ||
(A) The Company has terminated the joint venture agreement with Jetta Global on ACH Trucking Center Corp. on December 4, 2017
| 18 |
Note 11. COMMITMENTS AND CONTINGENCY
Lease Obligations
The Company leases certain office premises and apartments for employees under operating lease agreements with various terms through April 16, 2020. Future minimum lease payments under the operating lease agreements are as follows:
| Amount | ||||
| Twelve months ending December 31, | ||||
| 2018 | $ | 175,651 | ||
| 2019 | 104,222 | |||
| 2020 | 15,053 | |||
| $ | 294,926 | |||
Rental expense for the three months ended December 31, 2017 and 2016 were $54,445 and $65,555, respectively. Rental expense for the six months ended December 31, 2017 and 2016 were $119,307 and $127,890, respectively.
Contingencies
The Labor Contract Law of the PRC requires employers to insure the liability of the severance payments for terminated employees that have worked for the employers for at least two years prior to January 1, 2008. Employers are liable for one month of severance pay per year of service provided by employees. As of December 31, 2017 and June 30, 2017, the Company has estimated its severance payments to be approximately $54,313 and $48,713, respectively. Such payments have not been reflected in its unaudited condensed consolidated financial statements because management cannot predict what the actual payment, if any, will be in the future.
Note 12. INCOME TAXES
On December 22, 2017, the “Tax Cuts and Jobs Act” (“The Act”) was enacted. Under the provisions of the Act, the U.S. corporate tax rate decreased from 35% to 21%. Since the Company has a June 30 fiscal year-end, a blended U.S. statutory federal rate of approximately 28% for the fiscal year ending June 30, 2018 is applied to the provision for income tax, and a 21% for subsequent fiscal years.
The Company re-measured certain deferred tax assets based on blended rate of 28% at which these deferred tax amounts are expected to reverse in the future and the re-measurement resulted in a tax expense of $120,400 being recognized during the three and six months ended December 31, 2017.
In addition, the Company recorded a provisional amount for its one-time transition tax for all of its foreign subsidiaries, resulting in an increase in income tax expense of $478,499 for the three and six months ended December 31, 2017. The one-time transition tax was calculated using the Company’s total post-1986 overseas net earnings and profits which amounted to approximately $5.7 million. The one-time transition tax is taxed at the rate of 15.5% for the Company’s cash and cash equivalents and 8% for the other assets to be paid over 8 years.
The Company’s income tax benefit (expense) for the three and six months ended December 31, 2017 and 2016 is as follows:
For the three months ended December 31, | For the six months ended December 31, | |||||||||||||||
| 2017 | 2016 | 2017 | 2016 | |||||||||||||
| Current | ||||||||||||||||
| USA | $ | - | $ | - | $ | (60,162 | ) | $ | - | |||||||
| Hong Kong | (5,113 | ) | (27,576 | ) | (9,422 | ) | (34,101 | ) | ||||||||
| China | (118,867 | ) | (45,815 | ) | (250,925 | ) | (110,911 | ) | ||||||||
| One-time transition tax on accumulated foreign earnings | (478,499 | ) | - | (478,499 | ) | - | ||||||||||
| (602,479 | ) | (73,391 | ) | (799,008 | ) | (145,012 | ) | |||||||||
| Deferred | ||||||||||||||||
| USA | 1,173,600 | - | 1,073,700 | - | ||||||||||||
| Total income tax benefit (expense) | $ | 571,121 | $ | (73,391 | ) | $ | 274,692 | $ | (145,012 | ) | ||||||
| 19 |
The Company recorded income tax benefit of $571,121 in the three months ended December 31, 2017, compared to income tax expense of $73,391 in the three months ended December 31, 2016. The Company recorded income tax benefit of $274,692 in the six months ended December 31, 2017, compared to income tax expense of $145,012 in the six months ended December 31, 2016.
The Company’s deferred tax assets are comprised of the following:
| December 31, | June 30, | |||||||
| 2017 | 2017 | |||||||
| Allowance for doubtful accounts | $ | 333,000 | $ | 106,000 | ||||
| Stock-based compensation | 687,000 | 790,000 | ||||||
| Net operating loss | 1,316,000 | 1,464,000 | ||||||
| Total deferred tax assets | 2,336,000 | 2,360,000 | ||||||
| Valuation allowance | (512,900 | ) | (1,610,600 | ) | ||||
| Deferred tax assets, net - long-term | $ | 1,823,100 | $ | 749,400 | ||||
The Company’s operations in the U.S. for federal tax purposes have incurred a cumulative net operating loss (“NOL”) of approximately $5,567,000 as of December 31, 2017, which may reduce federal future taxable income. For the three and six months ended December 31, 2017, approximately $241,000 and 637,000 of NOL was utilized, respectively.
The Company periodically evaluates the likelihood of the realization of deferred tax assets, and reduces the carrying amount of the deferred tax assets by a valuation allowance to the extent it believes a portion will not be realized. The Company considers many factors when assessing the likelihood of future realization of the deferred tax assets, including its recent cumulative earnings experience, expectation of future income, the carry forward periods available for tax reporting purposes, and other relevant factors. Management has provided an allowance against the deferred tax assets balance as of December 31, 2017. The net decrease in the valuation allowance for the three and six months ended December 31, 2017 amounted to $1,038,600 and $1,097,700, respectively on the basis of management’s reassessment of the amount of its deferred tax assets that are more likely than not to be realized. Management considers new evidence, both positive and negative, that could affect its future realization of deferred tax assets. Due to enactment of the Act, NOL could be carried forward indefinitely and the Company has pretax income resulting in utilization of the NOL in the current period, management determined that there is sufficient positive evidence to conclude that it is more likely than not that all of its NOL are realizable.
The Company’s taxes payable consists of the following:
| December 31, | June 30, | |||||||
| 2017 | 2017 | |||||||
| VAT tax payable | $ | 552,144 | $ | 520,436 | ||||
| Corporate income tax payable | 2,079,776 | 1,290,832 | ||||||
| Others | 67,036 | 74,948 | ||||||
| Total | 2,698,956 | 1,886,216 | ||||||
| Less: current portion | 2,258,737 | 1,886,216 | ||||||
| Income tax payable - noncurrent portion | $ | 440,219 | $ | - | ||||
| 20 |
Note 13. CONCENTRATIONS
Major Customers
For the three months ended December 31, 2017, three customers accounted for 60%, 16% and 11% of the Company’s revenues, respectively. As of December 31, 2017, one of these three customers accounted for 100% of the Company’s accounts due from related parties and the remaining two customers accounted for approximately 74% of the Company’s accounts receivable.
For the three months ended December 31, 2016, four customers accounted for 39%, 29%, 11% and 10% of the Company’s revenues, respectively. At December 31, 2016, one of these four customers accounted for 100% of the Company’s accounts due from related parties and the remaining three customers accounted for approximately 86% of the Company’s accounts receivable.
For the six months ended December 31, 2017, three customers accounted for 54%, 16% and 11% of the Company’s revenues, respectively. As of December 31, 2017, one of these three customers accounted for 100% of the Company’s accounts due from related parties and the remaining two customers accounted for approximately 74% of the Company’s accounts receivable.
For the six months ended December 31, 2016, three customers accounted for 36%, 36% and 12% of the Company’s revenues, respectively. At December 31, 2016, one of these three customers accounted for 100% of the Company’s accounts due from related parties and the remaining two customers accounted for approximately 79% of the Company’s accounts receivable.
Major Suppliers
For the three months ended December 31, 2017, two suppliers accounted for 82% and 15% of the total costs of revenue, respectively. For the three months ended December 31, 2016, one supplier accounted for 47% of the total costs of revenue.
For the six months ended December 31, 2017, one supplier accounted for 71% of the total costs of revenue. For the six months ended December 31, 2016, two suppliers accounted for 28% and 10% of the total costs of revenue, respectively.
Note 14. SEGMENT REPORTING
ASC 280, “Segment Reporting”, establishes standards for reporting information about operating segments on a basis consistent with the Company’s internal organizational structure as well as information about geographical areas, business segments and major customers in financial statements for detailing the Company’s business segments.
The Company’s chief operating decision maker is the Chief Executive Officer, who reviews the financial information of the separate operating segments when making decisions about allocating resources and assessing the performance of the group. The Company has determined that it has six operating segments: (1) shipping agency and shipping management services; (2) shipping and chartering services; (3) inland transportation management services; (4) freight logistics services; (5) container trucking services; (6) bulk cargo container services. However, due to the downturn in the shipping industry, the Company has decided to suspend to its shipping agency and shipping management services and shipping and chartering services.
As stated in Note 1, ACH Center’s operating revenue was less than 1% of the Company’s consolidated revenue and the results of operations for ACH Center was not reported as discontinued operations and was included in the container trucking services segment and freight logistics services segment below. For the three and six months ended December 31, 2017, revenue from ACH Center for container trucking services amounted to $nil and $42,968 respectively, representing 0% and 8% of the segment’s revenue. For the three and six months ended December 31, 2017, gross profit from ACH Center for container trucking services amounted to $nil and $4,297 respectively, representing 0% and 2% of the segment’ gross profit. For the three and six months ended December 31, 2017, revenue from ACH Center for freight logistics services amounted to $nil and $46,937 respectively, representing 0% and 1% of the segment’s revenue. For the three and six months ended December 31, 2017, gross profit from ACH Center for freight logistics services amounted to $nil and $13,989 respectively, representing 0% and 2% of the segment’ gross profit.
| 21 |
Prior to second quarter of fiscal 2018, bulk cargo container services were included in our freight logistics services segment and were operated by our New York subsidiary. Due to the growth of this business line and to enable our CODM to better assess the financial performance of the Company, we separated bulk cargo container services as a separate segment starting from this quarter. We have reclassified $504,815 of revenue from freight logistics services to bulk cargo container services for the six months ended December 31, 2017 for better comparison.
The following tables present summary information by segment for the three and six months ended December 31, 2017 and 2016, respectively:
| For the three months ended December 31, 2017 | ||||||||||||||||||||
| Inland
Transportation Management Services | Freight Logistics Services | Container Trucking Services | Bulk
Cargo Container Services | Total | ||||||||||||||||
| Revenues | ||||||||||||||||||||
| - Related party | $ | 555,246 | $ | - | $ | - | $ | - | $ | 555,246 | ||||||||||
| - Third parties | $ | 838,595 | $ | 3,596,323 | $ | 126,865 | $ | 103,452 | $ | 4,665,235 | ||||||||||
| Total revenues | $ | 1,393,841 | $ | 3,596,323 | $ | 126,865 | $ | 103,452 | $ | 5,220,481 | ||||||||||
| Cost of revenues | $ | 174,025 | $ | 3,108,195 | $ | 49,848 | $ | 43,810 | $ | 3,375,878 | ||||||||||
| Gross profit | $ | 1,219,816 | $ | 488,128 | $ | 77,017 | $ | 59,642 | $ | 1,844,603 | ||||||||||
| Depreciation and amortization | $ | 12,736 | $ | 476 | $ | 5,327 | $ | - | $ | 18,539 | ||||||||||
| Total capital expenditures | $ | - | $ | 2,721 | $ | 42,480 | $ | - | $ | 45,201 | ||||||||||
| For the three months ended December 31, 2016 | ||||||||||||||||||||
| Inland Transportation Management Services | Freight Logistic Services | Container Trucking Services | Bulk Cargo Container Services | Total | ||||||||||||||||
| Revenues | ||||||||||||||||||||
| -Related party | $ | 616,924 | $ | - | $ | - | $ | - | $ | 616,924 | ||||||||||
| -Third parties | $ | 834,679 | $ | 517,066 | $ | 159,879 | $ | - | $ | 1,511,624 | ||||||||||
| Total revenues | $ | 1,451,603 | $ | 517,066 | $ | 159,879 | $ | - | $ | 2,128,548 | ||||||||||
| Cost of revenues | $ | 87,800 | $ | 167,035 | $ | 95,961 | $ | - | $ | 350,796 | ||||||||||
| Gross profit | $ | 1,363,803 | $ | 350,031 | $ | 63,918 | $ | - | $ | 1,777,752 | ||||||||||
| Depreciation and amortization | $ | 6,695 | $ | 5,370 | $ | - | $ | - | $ | 12,065 | ||||||||||
| Total capital expenditures | $ | 45,466 | $ | - | $ | - | $ | - | $ | 45,466 | ||||||||||
| For the six months ended December 31, 2017 | ||||||||||||||||||||
| Inland
Transportation Management Services | Freight Logistics Services | Container Trucking Services | Bulk
Cargo Container Services | Total | ||||||||||||||||
| Revenues | ||||||||||||||||||||
| - Related party | $ | 1,120,406 | $ | - | $ | - | $ | - | $ | 1,120,406 | ||||||||||
| - Third parties | $ | 1,691,901 | $ | 6,600,212 | $ | 579,706 | $ | 608,267 | $ | 9,480,086 | ||||||||||
| Total revenues | $ | 2,812,307 | $ | 6,600,212 | $ | 579,706 | $ | 608,267 | $ | 10,600,492 | ||||||||||
| Cost of revenues | $ | 356,175 | $ | 5,828,108 | $ | 393,024 | $ | 464,489 | $ | 7,041,796 | ||||||||||
| Gross profit | $ | 2,456,132 | $ | 772,104 | $ | 186,682 | $ | 143,778 | $ | 3,558,696 | ||||||||||
| Depreciation and amortization | $ | 20,397 | $ | 951 | $ | 10,394 | $ | - | $ | 31,742 | ||||||||||
| Total capital expenditures | $ | - | $ | 7,798 | $ | 42,480 | $ | - | $ | 50,278 | ||||||||||
| For the six months ended December 31, 2016 | ||||||||||||||||||||
| Inland Transportation Management Services | Freight Logistic Services | Container Trucking Services | Bulk Cargo Container Services | Total | ||||||||||||||||
| Revenues | ||||||||||||||||||||
| - Related party | $ | 1,466,403 | $ | - | $ | - | $ | - | $ | 1,466,403 | ||||||||||
| - Third parties | $ | 1,470,935 | $ | 975,733 | $ | 159,879 | $ | - | $ | 2,606,547 | ||||||||||
| Total revenues | $ | 2,937,338 | $ | 975,733 | $ | 159,879 | $ | - | $ | 4,072,950 | ||||||||||
| Cost of revenues | $ | 191,801 | $ | 369,373 | $ | 95,961 | $ | - | $ | 657,135 | ||||||||||
| Gross profit | $ | 2,745,537 | $ | 606,360 | $ | 63,918 | $ | - | $ | 3,415,815 | ||||||||||
| Depreciation and amortization | $ | 14,667 | $ | 10,740 | $ | - | $ | - | $ | 25,407 | ||||||||||
| Total capital expenditures | $ | 45,466 | $ | - | $ | - | $ | - | $ | 45,466 | ||||||||||
| 22 |
| Total assets: | December 31, | June 30, | ||||||
| 2017 | 2017 | |||||||
| Inland Transportation Management Services | $ | 18,219,884 | $ | 15,552,593 | ||||
| Freight Logistic Services | 206,190 | 1,704,946 | ||||||
| Container Trucking Services | 1,100,081 | 558,482 | ||||||
| Bulk Cargo Container Services | 697,144 | - | ||||||
| Total Assets | $ | 20,223,299 | $ | 17,816,021 | ||||
Note 15. OTHER RELATED PARTY TRANSACTIONS
As of December 31, 2017 and June 30, 2017, the outstanding amounts due from related party consist of the following:
| December 31, | June 30, | |||||||
| 2017 | 2017 | |||||||
| Tianjin Zhiyuan Investment Group Co., Ltd. | $ | 2,636,662 | $ | 1,715,130 | ||||
| Less: allowance for doubtful accounts | (263,666 | ) | - | |||||
| Total | $ | 2,372,996 | $ | 1,715,130 | ||||
In June 2013, the Company signed a five-year global logistics service agreement with Tianjin Zhiyuan Investment Group Co., Ltd. (the “Zhiyuan Investment Group”) and TEWOO Chemical & Light Industry Zhiyuan Trade Co., Ltd. (together with Zhiyuan Investment Group, “Zhiyuan”). Zhiyuan Investment Group is owned by Mr. Zhang, the largest shareholder of the Company. In September 2013, the Company executed an inland transportation management service contract with the Zhiyuan Investment Group, whereby it would provide certain advisory services and help control potential commodities loss during the transportation process. As a result of the inland transportation management services provided to Zhiyuan, the Company generated revenue of $555,246 (11% of the Company’s total revenue) and $616,924 (29% of the Company’s total revenue) for the three months ended December 31, 2017 and 2016, respectively. The Company generated revenue of $1,120,406 (11% of the Company’s total revenue) and $1,466,403 (36% of the Company’s total revenue) for the six months ended December 31, 2017 and 2016, respectively. The amount due from Zhiyuan Investment Group at June 30, 2017 was $1,715,130. During the six months ended December 31, 2017, the Company continued to provide inland transportation management services to Zhiyuan and collected nil from Zhiyuan to increase outstanding accounts receivable. As of December 31, 2017, the Company provided a 10% allowance for doubtful accounts of the amount due from Zhiyuan.
As of December 31, 2017 and June 30, 2017, the outstanding amounts of advance to suppliers-related party consist of the following:
| December 31, | June 30, | |||||||
| 2017 | 2017 | |||||||
| Zhiyuan International Investment & Holding Group (Hong Kong) Co., Ltd. | $ | 3,473,717 | $ | 3,333,038 | ||||
| Total | $ | 3,473,717 | $ | 3,333,038 | ||||
On February 18, 2017, Trans Pacific Beijing (subsidiary) and Sino China (VIE) (collectively, the “Seller”), a subsidiary and VIE of the Company, entered into a Cooperative Transportation Agreement (the “Agreement”) with Zhiyuan International Investment & Holding Group (Hong Kong) Co., Ltd. (the “Buyer” or “Zhiyuan Hong Kong”). Mr. Zhang has also invested in the Buyer and is the largest shareholder of the Company. Pursuant to the Agreement, the Buyer, jointly with China Minmetals Corporation and China Metallurgical Group Corporation, acts as the general designer, general equipment provider and general service contractor in the upgrade and renovation project of Perwaja Steel Indonesia, which is located in Malaysia (the “Project”). The Seller shall be appointed as general agent to handle all related logistics and transportation occurring in the Project, ranging from equipment manufacturing, assembling, processing to instalment as referenced in the Agreement. The Seller agrees to make certain advance transportation payments during the Project on the basis of current practice in China’s transportation agency industry. The Buyer agrees to repay the advances to the Seller at any time as requested and, as instructed by the Seller, to satisfy the security repayment test in light of the Seller’s listed company profile. The Seller is contracted to provide high-quality services including the design of a detailed transportation plan as well as execution and necessary supervision of the transportation plan at the Buyer’s demand, and shall receive from the Buyer 1% - 1.25% of the total transportation expense incurred in the Project as commission for its professional design and execution of transportation plan as the general agent. No additional freight fees were advanced during the three and six months ended December 31, 2017.
| 23 |
| Item 2. | Management’s Discussion and Analysis of Financial Condition and Results of Operations |
The following discussion and analysis of our company’s financial condition and results of operations should be read in conjunction with our unaudited condensed consolidated financial statements and the related notes included elsewhere in this report. This discussion contains forward-looking statements that involve risks and uncertainties. Actual results and the timing of selected events could differ materially from those anticipated in these forward-looking statements as a result of various factors.
Overview
Second Quarter 2018 Highlights
Revenue in the three months ended December 31, 2017 increased by $3,091,933, or 145.3%, over the comparable period in 2016. The increase was primarily due to:
| ● | We have expanded the freight logistics segment through cooperating with our major customers. In particular, our subsidiary, Trans Pacific Shanghai, has increased sales to BAO-NYK Shipping PTE. Ltd. (“BAO-NYK”). For the three months ended December 31, 2017, our total sales to BAO-NYK totaled approximately $3.1 million, as compared to $nil for the corresponding period in 2016. |
| ● | Prior to second quarter of fiscal 2018, bulk cargo container services were included in our freight logistics services segment and were operated by our New York subsidiary. Due to the growth of this business line, and to enable our chief operating decision maker to better assess the financial performance of the Company, we separated our bulk cargo container services as a unique segment starting this quarter. We have reclassified $474,855 of revenue from freight logistics services to bulk cargo container services for the six months ended December 31, 2017 for comparison purpose.
Historically, containers shipping from the U.S. to China have low utilization rates. As a result, large shipping lines in China, including COSCO Shipping Lines Co., Ltd (“COSCO Shipping Lines”), have to bear the shipping costs of empty containers and are seeking solutions to work strategically with local logistics companies in the US. With the Chinese government banning the import of environmental wastes by the end of 2017, the empty container rate of COSCO Group's container shipping from the United States to China will be further reduced. Therefore COSCO Beijing signed a strategic cooperation agreement with us to jointly promote bulk cargo container transportation. Bulk freight rate is usually lower than that of container freight rate, however the transit time is much longer and customers have low flexibility in arrangement with freight carriers. COSCO Group headquarters will give us the same container freight rate as bulk freight, even lower than bulk shipping fee, to support our expansion from bulk to container shipping, so as to transport more cargoes from the United States to China. In the first quarter, we cooperated with Guangxi Sinotrans Group for the first trial operation of bulk cargo container. During the quarter, we cooperated with another customer, Sichuan Minmetals Import and Export Company, for trial operation. Based on the two trial runs with positive response, we signed a service agreement with Chengdu Dingxu International Trade Co., Ltd. ("Chengdu Dingxu") to coordinate sulfur suppliers in the United States to supply 100,000 tons of sulfur to Chengdu Dingxu on annual basis. Pursuant to the agreement, we will organize the shipping carriers, help customer to complete the duty and custom declaration and arrange transportation to the destination designated by Chengdu Dingxu. We will not take any title of any of their purchases and we will not take any inventory risks. We will be reimbursed by Chengdu Dingxu once our performance obligations are completed for the money we advanced on these purchases. |
| 24 |
The fiscal Year 2018 Trends
In fiscal year 2018, we will continue to focus on developing business to increase revenue and cash flow in the United States and continue to use bulk cargos containerized business between container shipping lines of the U.S. to China as the major part of our growth.
We will continue our cooperation with Cosco to promote bulk cargo container shipping. Our goal is to promote shipping of not only sulfur products but also others that are in high demand in China, such as petroleum coke, alfalfa and DDGS. We expect to ship these bulk container products to reach 400-500 containers per month. Through the implementation of bulk cargo container transport business, more smaller truck companies can be attracted to join our short-haul container truck online service platform, so that the online service platform can be improved and further upgraded and eventually become a peer-to peer online platform that connects truckers and customers.
Due to our new business in bulk cargo containers and the integrated freight business segment, our overall gross margin rate was affected. We expect as we gradually grow our business in these segments, our overall gross margin will improve.
Company Structure
The following diagram represents the corporate structure of the Company as of the date of this report:
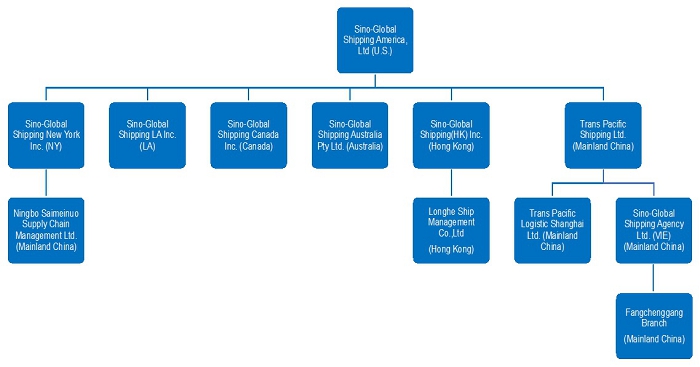
| 25 |
Results of Operations
The Three Months Ended December 31, 2017 Compared to the Three Months Ended December 31, 2016
Revenues
Revenues increased by $3,091,933, or 145.3%, from $2,128,548 for the three months ended December 31, 2016 to $5,220,481 for the comparable period in 2017. This increase was primarily due to the Company’s efforts to diversify its business in freight logistics services. The revenues generated from freight logistics services increased by $3,079,257, or 595.5%, from $517,066 for the three months ended December 31, 2016 to $3,596,323 for the comparable period in 2017.
This quarter we ended our joint venture with Jetta Global on ACH Trucking Center and created a new segment for bulk cargo container services; see more discussion in the related segments below.
The following tables present summary information by segment for the three months ended December 31, 2017 and 2016:
| For the three months ended December 31, 2017 | ||||||||||||||||||||
| Inland
Transportation Management Services | Freight Logistics Services | Container Trucking Services | Bulk Cargo Container Services | Total | ||||||||||||||||
| Revenues | ||||||||||||||||||||
| - Related party | $ | 555,246 | $ | - | $ | - | $ | - | $ | 555,246 | ||||||||||
| - Third parties | $ | 838,595 | $ | 3,596,323 | $ | 126,865 | $ | 103,452 | $ | 4,665,235 | ||||||||||
| Total revenues | $ | 1,393,841 | $ | 3,596,323 | $ | 126,865 | $ | 103,452 | $ | 5,220,481 | ||||||||||
| Cost of revenues | $ | 174,025 | $ | 3,108,195 | $ | 49,848 | $ | 43,810 | $ | 3,375,878 | ||||||||||
| Gross profit | $ | 1,219,816 | $ | 488,128 | $ | 77,017 | $ | 59,642 | $ | 1,844,603 | ||||||||||
| GM% | 87.5 | % | 13.6 | % | 60.7 | % | 57.7 | % | 35.3 | % | ||||||||||
| For the three months ended December 31, 2016 | ||||||||||||||||||||
| Inland Transportation Management Services | Freight Logistic Services | Container Trucking Services | Bulk Cargo Container Services | Total | ||||||||||||||||
| Revenues | ||||||||||||||||||||
| - Related party | $ | 616,924 | $ | - | $ | - | $ | - | $ | 616,924 | ||||||||||
| - Third parties | $ | 834,679 | $ | 517,066 | $ | 159,879 | $ | - | $ | 1,511,624 | ||||||||||
| Total revenues | $ | 1,451,603 | $ | 517,066 | $ | 159,879 | $ | - | $ | 2,128,548 | ||||||||||
| Cost of revenues | $ | 87,800 | $ | 167,035 | $ | 95,961 | $ | - | $ | 350,796 | ||||||||||
| Gross profit | $ | 1,363,803 | $ | 350,031 | $ | 63,918 | $ | - | $ | 1,777,752 | ||||||||||
| GM% | 94.0 | % | 67.7 | % | 40.0 | % | - | 83.5 | % | |||||||||||
(1) Revenues from Inland Transportation Management Services
In September 2013, the Company executed an inland transportation management service contract with Zhiyuan Investment Group, a related party, whereby the Company agreed to provide certain solutions to help control the potential loss of commodities during the transportation process. The Company also began providing inland transportation management services to a third-party customer, Tengda Northwest, following the quarter ended September 2014. The fluctuation in revenue from this segment is due to the change in the quantities of commodities transported by both Zhiyuan Investment Group and Tengda Northwest.
For Tengda Northwest, the service fee charge was RMB 32 per ton. For Zhiyuan Investment Group, the service fee charge was RMB 38 per ton.
| 26 |
Revenue from the inland transportation management services segment decreased $57,762 from $1,451,603 for the three months ended December 31, 2016 to $1,393,841 for the three months ended December 31, 2017. Revenue from related party customers decreased $61,678 from $616,924 for the three months ended December 31, 2016 to $555,246 for the three months ended December 31, 2017 since the transported quantities decreased from 112,000 tons to 97,489 tons. Revenue from third party customers increased $3,916 from $834,679 for the three months ended December 31, 2016 to $838,595 for the three months ended December 31, 2017. The increase was primarily due to the depreciation of USD against RMB from 6.8328 for the three months ended December 31, 2016 to 6.6153 for the corresponding period in 2017.
For the three months ended December 31, 2017 and 2016, gross profit from inland transportation management services amounted to $1,219,816 and $1,363,803, respectively.
Overall gross margins for this segment decreased to 87.5% for the three months ended December 31, 2017 from 94.0% for the three months ended December 31, 2016. The decrease of gross margins in the current quarter was due to the change of product mix with different service fees per ton.
(2) Revenues from Freight Logistics Services
Since we formed our new subsidiary, Sino-Global Shipping LA, Inc., in January 2016, we began to provide freight logistics services, including cargo forwarding and truck transportation services. Since the revenue increased significantly for providing such services from period to period, the Company has presented the related revenue as a separated business segment since the first quarter of 2017 fiscal year.
During the three months ended December 31, 2017, the portion of revenues generated from freight logistics services has increased significantly. The increase was primarily due to increased orders from one of our clients, BAO-NYK Shipping PTE. Ltd. (“BAO-NYK”), during the current period, as compared to $nil in the corresponding period in 2016. The gross margin decreased to 13.6% from 67.7%, primarily due to the changing variety of services provided between the current period and the corresponding period in 2016. Every single business of freight logistics services has a unique gross margin according to a different service scope. Usually, a business in full-scale scope has a higher gross margin, and business with fragmented scope has a lower gross margin. Our fragmented scope business increased significantly, such as revenue from BAO-NYK, and contributed a much higher portion of revenue in this sector than full-scale businesses, as compared to the prior period.
The revenue generated from freight logistics services was $3,596,323, and the related gross profit was $488,128 for the three months ended December 31, 2017. For the three months ended December 31, 2016, the revenue generated from freight logistics services was $517,066, and the related gross profit was $350,031.
(3) Revenues from Container Trucking Services
Since we completed our web-based short-haul container truck service platform in December 2016, we began generating revenue from short-haul trucking and containers services through the service platform and introduced this Container Trucking Services as a new segment in the second quarter of 2017. Since the second quarter of the fiscal year 2017, the Company has provided container trucking services in the PRC regions and, as of the third quarter of the fiscal year 2017, has begun to provide related services in certain U.S. regions. This new business segment is based on a modified and improved version of our freight logistics services business segment.
On January 5, 2017, we entered into a joint venture agreement and formed a new joint venture company named ACH Trucking Center Corp. (“ACH Center”) with Jetta Global Logistics Inc. (“Jetta Global”). Along with the establishment of ACH Center, we began providing short haul trucking transportation and logistics services to customers located in the New York and New Jersey areas. We hold a 51% ownership stake in ACH Center. Although the establishment of ACH Center brought benefits for us and Jetta Global, it could not satisfy long term development for both us and Jetta Global. We signed a termination agreement with Jetta Global to terminate the joint venture agreement on December 4, 2017. As ACH center’s operating revenue was less than 1% of our consolidated revenue and the termination did not constitute a strategic shift that will have a major effect on our operations and financial results, the results of operations for ACH Center were not reported as discontinued operations. For the three months ended December 31, 2017, revenue from container trucking services decreased by $33,014 from $159,879 for the three months ended December 31, 2016, to $126,865. The decrease was primarily due to the termination of our joint venture agreement with Jetta Global.
| 27 |
(4) Revenues from Bulk Cargo Container Services
For the three months ended December 31, 2017, we shipped 120 containers with 18 tons per container of sulfur from Long Beach, CA in the U.S. to our customers in China. The arrangement included coordinating the customer to sign the purchase contract with sulfur suppliers in the United States, organizing the container shipping, custom clearance; all have been fulfilled when we shipped the product to our customer’s designated port, Qingdao PRC. For the three months ended December 31, 2017, gross revenue generated from bulk cargo container services was $103,452 and the related cost was $43,810 with gross profit of $59,642 or 57.7%. We were the agent in this transaction as we did not take any inventory risk; we reported revenue on a net basis less the cost of sulfur. Due to the integrated and value added services we provide to our customers, the average gross profit was higher than freight logistics.
Operating Costs and Expenses
Operating costs and expenses increased by $4,364,198 or 371.8%, from $1,173,955 for the three months ended December 31, 2016 to $5,538,153 for the three months ended December 31, 2017. This increase was primarily due to the increase in the cost of revenue, general and administrative expense and selling expenses, as discussed below.
The following table sets forth the components of the Company’s costs and expenses for the periods indicated:
| For the three months ended December 31, | ||||||||||||||||||||||||
| 2017 | 2016 | Change | ||||||||||||||||||||||
| US$ | % | US$ | % | US$ | % | |||||||||||||||||||
| Revenues | 5,220,481 | 100.0 | % | 2,128,548 | 100.0 | % | 3,091,933 | 145.3 | % | |||||||||||||||
| Cost of revenues | 3,375,878 | 64.7 | % | 350,796 | 16.5 | % | 3,025,082 | 862.3 | % | |||||||||||||||
| Gross margin | 35.3 | % | 83.5 | % | (48.2 | )% | ||||||||||||||||||
| General and administrative expenses | 1,827,014 | 35.0 | % | 776,284 | 36.5 | % | 1,050,730 | 135.4 | % | |||||||||||||||
| Selling expenses | 335,261 | 6.4 | % | 46,875 | 2.2 | % | 288,386 | 615.2 | % | |||||||||||||||
| Total Costs and Expenses | 5,538,153 | 106.1 | % | 1,173,955 | 55.2 | % | 4,364,198 | 371.8 | % | |||||||||||||||
Costs of Revenues
Cost of revenues was $3,375,878 for the three months ended December 31, 2017, an increase of $3,025,082, or 862.3%, as compared to $350,796 for the three months ended December 31, 2016. The overall cost of revenues as a percentage of our revenues increased from 16.5% for the three months ended December 31, 2016, to 64.7% for the three months ended December 31, 2017. The increase stemmed from the majority of the revenues during the three months ended December 31, 2017, which comes from the less profitable freight logistic services segment discussed above.
During the three months ended December 31, 2017, 69% of total revenue was from the freight logistics services segment with a gross profit margin of 14% and 27% of total revenue was from the inland transportation management services segment with a gross profit margin of 88%. During the three months ended December 31, 2016, 24% of total revenue was from the freight logistics services segment with a gross profit margin of 68%, and 68% of total revenue was from the inland transportation management service segment with a gross profit margin of 94%. The significant decrease of gross profit margin of the freight logistics services segment is due to a change in our variety of services that caused revenue from the fragmented scope to contribute a much larger portion of total revenue under the freight logistics services segment in the current period in comparison with the prior period.
| 28 |
General and Administrative Expenses
General and administrative expenses consist primarily of salaries and benefits, office rent, office expenses, regulatory filing and listing fees, amortization of stock-based compensation, legal, accounting and other professional service fees. For the three months ended December 31, 2017, we had $1,827,014 of general and administrative expenses, as compared to $776,284 for the three months ended December 31, 2016, an increase of $1,050,730, or 135.4%. The increase was primarily due to increases in labor expense of $277,981, provision for doubtful accounts of $598,403, consulting fees of $37,500, and legal fees of $27,258, partially offset by the complaint settlement payments made to a former vice president of the Company. As a result of the increase in general and administrative expenses of 135.4% and the increase in revenues of 145.3%, our general and administrative expenses, as a percentage of revenue, decreased from 36.5% for the three months ended December 31, 2016 to 35.0% for the corresponding period in 2017.
Selling Expenses
Selling expenses consist primarily of business development costs, such as traveling expenses for sales purposes, and salaries and benefits for our sales staff. For the three months ended December 31, 2017, we had $335,261 of selling expenses as compared to $46,875 for the three months ended December 31, 2016, an increase of $288,386, or 615.2%. During the three months ended December 31, 2017, we increased our business development efforts to explore new business opportunities while maintaining our current customer relationships. Rising labor costs also increased our overall selling expenses as compared to the same period of 2016. As a percentage of revenue, our selling expenses increased from 2.2% for the three months ended December 31, 2016, to 6.4% for the corresponding period in 2017.
Operating Income (loss)
The Company had an operating loss of $317,672 for the three months ended December 31, 2017, compared to an operating income of $954,593 for the comparable period ended December 31, 2016. The decrease was primarily due to the significant increase in the cost of revenues and general and administrative expenses, partially offset by increased revenue generated from freight logistics services as discussed above.
Financial Income (Expense), Net
The Company’s net financial income was $137,799 for the three months ended December 31, 2017, compared to the net financial expense of $88,470 for the same period of 2016. We have operations in the U.S., Canada, Australia, Hong Kong and the PRC, and our financial income (expenses) for the three months ended December 31, 2017 and 2016 primarily reflects the foreign currency transaction income or loss expressed in U.S. Dollars.
| 29 |
Taxation
The Company’s income tax benefit was $571,121 for the three months ended December 31, 2017, compared to an income tax expense of $73,391 for the three months ended December 31, 2016. The increase in income tax benefit was due to the increased allowance for doubtful accounts of approximately $598,403 and partly offset by an increased current income tax expense.
During the three months ended December 31, 2017, the Company recognized a total deferred income tax benefit of $1,173,600, which derived from the utilization of net operating loss (“NOL”) and the decrease in the valuation allowance against the deferred tax assets, based on the Company’s latest projected taxable income.
On December 22, 2017, the “Tax Cuts and Jobs Act” (“The Act”) was enacted. Under the provisions of the Act, the U.S. corporate tax rate decreased from 35% to 21%. As the Company has a June 30 fiscal year-end, the lower corporate income tax rate will be phased in, resulting in a U.S. statutory federal rate of approximately 28% for our fiscal year ending June 30, 2018, and 21% for subsequent fiscal years. Additionally, the Tax Act imposes a one-time transition tax on deemed repatriation of historical earnings of foreign subsidiaries, and future foreign earnings are subject to U.S. taxation. The change in rate has caused us to re-measure all U.S. deferred income tax assets and liabilities for temporary differences and NOL carryforwards, and record a deferred income tax expense of $120,400.
Meanwhile, we accrued a one-time transition tax on accumulated foreign earnings in the amount of $478,499, which will be paid over 8 years. The increase in current income tax expenses was also attributable to the increase in the taxable income of Trans Pacific during the three and six months ended December 31, 2017 in comparison to the same period in 2016.
We periodically evaluate the likelihood of the realization of deferred tax assets, and reduce the carrying amount of the deferred tax assets by a valuation allowance to the extent it believes a portion will not be realized. We consider many factors when assessing the likelihood of future realization of the deferred tax assets, including our recent cumulative earnings, expectation of future income, the carry forward periods available for tax reporting purposes, and other relevant factors. We have provided an allowance against the deferred tax assets balance as of December 31, 2017. The net decrease in the valuation allowance for the three months ended December 31, 2017 amounted to $1,038,600 on the basis of our reassessment of the amount of our deferred tax assets that are more likely than not to be realized. We considered new evidence, both positive and negative, that could affect the future realization of deferred tax assets. Due to enactment of the Act, NOL could be carried forward indefinitely and we had pretax income resulting in utilization of NOL in the current period, we believe that there is sufficient positive evidence to conclude that it is more likely than not that all of our NOL are realizable.
Net Income
As a result of the foregoing, the Company had a net income of $391,248 for the three months ended December 31, 2017, compared to a net income of $792,732 for the three months ended December 31, 2016. After the deduction of non-controlling interest, net income attributable to Sino-Global was $297,703 for the three months ended December 31, 2017; for the three months ended December 31, 2016, the Company had a net income of $892,901. Comprehensive income attributable to the Company was $468,230 for the three months ended December 31, 2017, compared to a comprehensive income of $666,908 for the three months ended December 31, 2016.
| 30 |
Six Months Ended December 31, 2017 Compared to Six Months Ended December 31, 2016
Revenues
Revenues increased by $6,527,542, or 160.3%, from $4,072,950 for the six months ended December 31, 2016 to $10,600,492 for the comparable period in 2017. This increase was primarily due to the Company’s efforts to diversify its business in the freight logistics services and bulk cargo container services. The Company separately presents bulk cargo container services as a new segment during the three months ended December 31, 2017, total $608,267 bulk cargo container service revenue, of which $474,855 was reclassified from freight logistics services for the six months ended December 31, 2017. The revenues generated from freight logistics services increased by $5,624,479, or 576.4%, from $975,733 for the six months ended December 31, 2016 to $6,600,212 for the comparable period in 2017. The revenues generated from bulk cargo services for the six months ended December 31, 2017 were $608,267, as compared to $nil for the comparable period in 2016.
The following tables present summary information by segment for the six months ended December 31, 2017 and 2016:
| For the six months ended December 31, 2017 | ||||||||||||||||||||
| Inland
Transportation Management Services | Freight Logistics Services | Container Trucking Services | Bulk Cargo Container Services | Total | ||||||||||||||||
| Revenues | ||||||||||||||||||||
| - Related party | $ | 1,120,406 | $ | - | $ | - | $ | - | $ | 1,120,406 | ||||||||||
| - Third parties | $ | 1,691,901 | $ | 6,600,212 | $ | 579,706 | $ | 608,267 | $ | 9,480,086 | ||||||||||
| Total revenues | $ | 2,812,307 | $ | 6,600,212 | $ | 579,706 | $ | 608,267 | $ | 10,600,492 | ||||||||||
| Cost of revenues | $ | 356,175 | $ | 5,828,108 | $ | 393,024 | $ | 464,489 | $ | 7,041,796 | ||||||||||
| Gross profit | $ | 2,456,132 | $ | 772,104 | $ | 186,682 | $ | 143,778 | $ | 3,558,696 | ||||||||||
| GM% | 87.3 | % | 11.7 | % | 32.2 | % | 23.6 | % | 33.6 | % | ||||||||||
| For the six months ended December 31, 2016 | ||||||||||||||||||||
| Inland Transportation Management Services | Freight Logistic Services | Container Trucking Services | Bulk Cargo Container Services | Total | ||||||||||||||||
| Revenues | ||||||||||||||||||||
| - Related party | $ | 1,466,403 | $ | - | $ | - | $ | - | $ | 1,466,403 | ||||||||||
| - Third parties | $ | 1,470,935 | $ | 975,733 | $ | 159,879 | $ | - | $ | 2,606,547 | ||||||||||
| Total revenues | $ | 2,937,338 | $ | 975,733 | $ | 159,879 | $ | - | $ | 4,072,950 | ||||||||||
| Cost of revenues | $ | 191,801 | $ | 369,373 | $ | 95,961 | $ | - | $ | 657,135 | ||||||||||
| Gross profit | $ | 2,745,537 | $ | 606,360 | $ | 63,918 | $ | - | $ | 3,415,815 | ||||||||||
| Depreciation and amortization | $ | 14,667 | $ | 10,740 | $ | - | $ | - | $ | 25,407 | ||||||||||
| Total capital expenditures | $ | 45,466 | $ | - | $ | - | $ | - | $ | 45,466 | ||||||||||
| GM% | 93.5 | % | 62.1 | % | 40.0 | % | - | 83.9 | % | |||||||||||
(1) Revenues from Inland Transportation Management Services
In September 2013, the Company executed an inland transportation management service contract with Zhiyuan Investment Group, a related party, whereby the Company agreed to provide certain solutions to help control the potential loss of commodities during the transportation process. The Company also began providing inland transportation management services to a third-party customer, Tengda Northwest, following the quarter ended September 2014. The fluctuation in revenue from this segment is due to the change in the quantities of commodities transported by both Zhiyuan Investment Group and Tengda Northwest.
For Tengda Northwest, the service fee charge was RMB 32 per ton. For Zhiyuan Investment Group, the service fee charge was RMB 38 per ton.
| 31 |
Revenue from the inland transportation management services segment decreased $125,031 from $2,937,338 for the six months ended December 31, 2016 to $2,812,307 for the six months ended December 31, 2017. Revenue from related-party customers decreased $345,997 from $1,466,403 for the six months ended December 31, 2016 to $1,120,406 for the six months ended December 31, 2017 since the transported quantities decreased from 262,465 tons to 197,545 tons. Revenue from third-party customers increased $220,966 from $1,470,935 for the six months ended December 31, 2016 to $1,691,901 for the six months ended December 31, 2017 since the transported quantities increased from 313,773 tons to 350,834 tons for the period indicated.
For the six months ended December 31, 2017 and 2016, gross profit from inland transportation management services amounted to $2,456,132 and $2,745,537, respectively.
Overall gross margins for this segment decreased to 87.3% for the six months ended December 31, 2017 from 93.5% for the six months ended December 31, 2016. The decrease of gross margins in the current is due to the change of product mix with different service fee per ton.
(2) Revenues from Freight Logistics Services
Since we formed our new subsidiary, Sino-Global Shipping LA, Inc., in January 2016, we began to provide freight logistics services, including cargo forwarding and truck transportation services. Since the revenue increased significantly for providing such services from period to period, the Company has presented the related revenue as a separated business segment since the first quarter of 2017 fiscal year.
During the six months ended December 31, 2017, the portion of revenues generated from freight logistics services has increased significantly. The increase was primarily due to orders from one of our clients: approximately $5.7 million of revenue was generated from BAO-NYK Shipping PTE. Ltd. (“BAO-NYK”) during the current period, as compared to less than $2,000 in the corresponding period in 2016. The gross margin decreased to 11.7% from 62.1% primarily due to the change in the variety of services currently provided in comparison with those services provided in the corresponding period of 2016. Every single business of freight logistics services has a unique gross margin according to different service scope. Usually, a business in full-scale scope has a higher gross margin, and the business with fragmented scope has a lower gross margin. Our fragmented scope business increased significantly, such as revenue from BAO-NYK, and contributed a much higher portion of revenue in this sector than full-scale business compared to prior period.
The revenue generated from freight logistics services was $6,600,212 and the related gross profit was $772,104 for the six months ended December 31, 2017. For the six months ended December 31, 2016, the revenue generated from freight logistics services was $975,733, and the related gross profit was $606,360.
Revenue from ACH Center amounted to $46,937 or 0.7% of the segment’s revenue for the six months ended December 31, 2017 and gross profit from ACH Center amounted to $13,989 representing 1.8% of the segment’ gross profit.
(3) Revenues from Container Trucking Services
Since we completed our web-based short-haul container truck service platform in December 2016, we began generating revenue from short-haul trucking and containers services through the service platform and presented this as a new segment, "Container Trucking Services," from in the second quarter of 2017. Since the second quarter of the fiscal year 2017, the Company has provided container trucking services in PRC regions and, as of the third quarter of the fiscal year 2017, has begun to provide related services in certain U.S. regions. This new business segment is based on a modified and improved version of our freight logistics services business segment.
On January 5, 2017, we entered into a joint venture agreement and formed a new joint venture company named ACH Trucking Center Corp. (“ACH Center”) with Jetta Global Logistics Inc. (“Jetta Global”). Along with the establishment of ACH Center, we began providing short haul trucking transportation and logistics services to customers located in the New York and New Jersey areas. We hold a 51% ownership stake in ACH Center. Although the establishment of ACH Center brought benefit for us and Jetta Global, it could not satisfy long term development for both us and Jetta Global. We signed a termination agreement with Jetta Global to terminate the joint venture agreement on December 4, 2017. As ACH center’s operating revenue was less than 1% of our consolidated revenue and the termination did not constitute a strategic shift that will have a major effect on our operations and financial results, the results of operations for ACH Center were not reported as discontinued operation.
For the six months ended December 31, 2017, revenue generated from container trucking services was $579,706 and the related gross profit was $186,682. Revenue from ACH Center amounted to $42,968 or 7.8% of the segment’s revenue for the six months ended December 31, 2017 and gross profit from ACH Center amounted to $4,297 representing 2.3% of the segment’s gross profit.
| 32 |
(4) Revenues from Bulk Cargo Container Services
For the six months ended December 31, 2017, we shipped 140 containers with 18 tons per container of sulfur from Long Beach, CA in the U.S. to our customers in China. The arrangement included coordinating the customer to sign the purchase contract with sulfur suppliers in the United States, organizing the container shipping, custom clearance; all have been fulfilled when we shipped the product to our customer’s designated port, Qingdao PRC. For the six months ended December 31, 2017, gross revenue generated from bulk cargo container services was $608,267 and the related cost was $464,489 with gross profit of $143,778 or 23.6%. We were the agent in this transaction as we did not take any inventory risk; we reported revenue on a net basis less the cost of sulfur. Due to the integrated and value added services we provide to our customers, the average gross profit was higher than freight logistics.
Operating Costs and Expenses
Operating costs and expenses increased by $7,584,377 or 315.3%, from $2,405,517 for the six months ended December 31, 2016 to $9,989,894 for the six months ended December 31, 2017. This increase was primarily due to the increase in the cost of revenues and general and administrative expenses as discussed below.
The following table sets forth the components of the Company’s costs and expenses for the periods indicated:.
| For the six months ended December 31, | ||||||||||||||||||||||||
| 2017 | 2016 | Change | ||||||||||||||||||||||
| US$ | % | US$ | % | US$ | % | |||||||||||||||||||
| Revenues | 10,600,492 | 100.0 | % | 4,072,950 | 100.0 | % | 6,527,542 | 160.3 | % | |||||||||||||||
| Cost of revenues | 7,041,796 | 66.4 | % | 657,135 | 16.1 | % | 6,384,661 | 971.6 | % | |||||||||||||||
| Gross margin | 33.6 | % | 83.9 | % | (50.3 | )% | ||||||||||||||||||
| General and administrative expenses | 2,590,371 | 24.4 | % | 1,636,198 | 40.2 | % | 954,173 | 58.3 | % | |||||||||||||||
| Selling expenses | 357,727 | 3.4 | % | 112,184 | 2.8 | % | 245,543 | 218.9 | % | |||||||||||||||
| Total Costs and Expenses | 9,989,894 | 94.2 | % | 2,405,517 | 59.1 | % | 7,584,377 | 315.3 | % | |||||||||||||||
| 33 |
Costs of Revenues
Cost of revenues was $7,041,796 for the six months ended December 31, 2017, an increase of $6,384,661, or 971.6%, as compared to $657,135 for the six months ended December 31, 2016. The overall cost of revenues as a percentage of our revenues increased from 16.1% for the six months ended December 31, 2016, to 66.4% for the six months ended December 31, 2017. The increase in the overall costs of revenues in percentage terms for the six months ended December 31, 2017 stemmed from the majority of the revenues during the six months ended December 31, 2017 coming from the less profitable freight logistics services segment, rather than the more profitable inland transportation management services segment.
During the six months ended December 31, 2017, 63% of total revenue was from the freight logistics services segment, with a gross profit margin of 12%, and 27% of total revenue was from the inland transportation management services segment with a gross profit margin of 87%. During the six months ended December 31, 2016, 24% of total revenue was from the freight logistics services segment with a gross profit margin of 62% and 72% of total revenue was from the inland transportation management service segment with a gross profit margin of 94%. The significant decrease of gross profit margin of the freight logistics services segment is due to a change in the variety of services provided, which caused revenue from the fragmented scope to contribute a much larger portion of total revenue under the freight logistics services segment in the current period as compared to the prior period.
General and Administrative Expenses
General and administrative expenses consist primarily of salaries and benefits, office rent, office expenses, regulatory filing and listing fees, amortization of stock-based compensation, legal, accounting and other professional service fees. For the six months ended December 31, 2017, we had $2,590,371 of expenses, as compared to $1,636,198 for the six months ended December 31, 2016, an increase of $954,173, or 58.3%. The increase was primarily due to increases in labor expense of $232,367, provision for doubtful accounts of $598,403, consulting fees of $79,074, and legal fees of $54,952. As a percentage of revenue, our general and administrative expenses decreased from 40.2% for the six months ended December 31, 2016 to 24.4% for the corresponding period in 2017.
Selling Expenses
Selling expenses consist primarily of business development costs, such as traveling expenses for sales purposes, and salaries and benefits for our sales staff. For the six months ended December 31, 2017, we had $357,727 of sales expenses as compared to $112,184 for the six months ended December 31, 2016, an increase of $245,543, or 218.9%. During the six months ended December 31, 2017, we increased our business development efforts to explore new business opportunities while maintaining our current customer relationships. Rising labor costs also increased our overall selling expenses as compared to the same period of 2016. As a percentage of revenue, our selling expenses increased from 2.8% for the six months ended December 31, 2016, to 3.4% for the corresponding period in 2017.
Operating Income
The Company had an operating income of $610,598 for the six months ended December 31, 2017, compared to an operating income of $1,667,433 for the comparable period ended December 31, 2016. The decrease was primarily due to the increase in general and administrative expenses, partially offset by the increased gross profit generated from freight logistics services and bulk cargo container services as discussed above.
| 34 |
Financial Income (Expense), Net
The Company’s net financial income was $222,595 for the six months ended December 31, 2017, compared to the net financial expense of $91,904 for the same period of 2016. We have operations in the U.S., Canada, Australia, Hong Kong and the PRC, and our financial income (expenses) for the six months ended December 31, 2017 and 2016 primarily reflects the foreign currency transaction income or loss expressed in U.S. Dollars.
Taxation
The Company’s income tax benefit was $274,692 for the six months ended December 31, 2017, compared to an income tax expense of $145,012 for the six months ended December 31, 2016. The increase in income tax benefit was due to the change in valuation allowance and partly offset by an increased current income tax expense.
During the six months ended December 31, 2017, the Company recognized a total deferred income tax benefit of $1,073,700, which derived from the utilization of NOL and the decrease in the valuation allowance against the deferred tax assets, based on the Company’s latest projected taxable income.
On December 22, 2017, the “Tax Cuts and Jobs Act” (“The Act”) was enacted. Under the provisions of the Act, the U.S. corporate tax rate decreased from 35% to 21%. As the Company has a June 30 fiscal year-end, the lower corporate income tax rate will be phased in, resulting in a U.S. statutory federal rate of approximately 28% for our fiscal year ending June 30, 2018, and 21% for subsequent fiscal years. Additionally, the Tax Act imposes a one-time transition tax on deemed repatriation of historical earnings of foreign subsidiaries, and future foreign earnings are subject to U.S. taxation. The change in rate has caused us to remeasure all U.S. deferred income tax assets and liabilities for temporary differences and NOL carryforwards and record a deferred income tax expense of $120,400.
Meanwhile, we accrued a one-time transition tax on accumulated foreign earnings in the amount of $478,499 which will be paid over eight years. The increase in current income tax expense was also attributable to the increase in the taxable income of Trans Pacific during the six months ended December 31, 2017 in comparison to the same period in 2016.
We periodically evaluate the likelihood of the realization of deferred tax assets and reduce the carrying amount of the deferred tax assets by a valuation allowance to the extent it believes a portion will not be realized. We consider many factors when assessing the likelihood of future realization of the deferred tax assets, including our recent cumulative earnings, expectation of future income, the carry forward periods available for tax reporting purposes, and other relevant factors. We have provided an allowance against the deferred tax assets balance as of December 31, 2017. The net decrease in the valuation allowance for the six months ended December 31, 2017 amounted to $1,097,700 on the basis of our reassessment of the amount of our deferred tax assets that are more likely than not to be realized. We considered new evidence, both positive and negative, that could affect the future realization of deferred tax assets. Due to enactment of the Act, NOL could be carried forward indefinitely and we had pretax income resulting in utilization of NOL in the current period, we believe that there is sufficient positive evidence to conclude that it is more likely than not that all of our NOL are realizable.
Net Income
As a result of the foregoing, the Company had a net income of $1,107,885 for the six months ended December 31, 2017, compared to a net income of $1,430,517 for the six months ended December 31, 2016. After the deduction of non-controlling interest, net income attributable to Sino-Global was $914,892 for the six months ended December 31, 2017; for the six months ended December 31, 2016, the Company had a net income of $1,538,621. Comprehensive income attributable to the Company was $1,191,837 for the six months ended December 31, 2017, compared to a comprehensive income of $1,287,514 for the six months ended December 31, 2016.
| 35 |
Liquidity and Capital Resources
Cash Flows and Working Capital
As of December 31, 2017, the Company had $7,219,848 in cash and cash equivalents. We held approximately 5.1% of our cash in banks located in New York, Los Angeles, Canada, Australia and Hong Kong and held approximately 94.9% of our cash in banks located in the PRC.
The following table sets forth a summary of our cash flows for the periods indicated:
| For the six months ended December 31, | ||||||||
| 2017 | 2016 | |||||||
| Net cash provided by (used in) operating activities | $ | (1,259,714 | ) | $ | 1,922,458 | |||
| Net cash used in investing activities | $ | (250,278 | ) | $ | - | |||
| Net (decrease) increase in cash and cash equivalents | $ | (1,513,894 | ) | $ | 1,907,459 | |||
| Cash and cash equivalents at the beginning of period | $ | 8,733,742 | $ | 1,385,994 | ||||
| Cash and cash equivalents at the end of period | $ | 7,219,848 | $ | 3,293,453 | ||||
The following table sets forth a summary of our working capital:
| December 31, 2017 | June
30, 2017 | Variation | % | |||||||||||||
| Total Current Assets | $ | 17,879,083 | $ | 16,754,888 | $ | 1,124,195 | 6.7 | % | ||||||||
| Total Current Liabilities | $ | 3,486,218 | $ | 3,086,496 | $ | 399,722 | 13.0 | % | ||||||||
| Working Capital | $ | 14,392,865 | $ | 13,668,392 | $ | 724,473 | 5.3 | % | ||||||||
| Current Ratio | 5.13 | 5.43 | (0.30 | ) | (5.5 | )% | ||||||||||
We finance our ongoing operating activities primarily by using funds from our operations. We routinely monitor current and expected operational requirements to evaluate the use of available funding sources. In assessing liquidity, management monitors and analyzes the Company’s cash on-hand, its ability to generate sufficient revenue sources in the future and the Company’s operating and capital expenditure commitments. The Company plans to fund continuing operations through identifying new prospective joint ventures and strategic alliance opportunities for new revenue sources, and by reducing costs to improve profitability and replenish working capital. Considering our existing working capital position and our ability to access other funding sources, management believes that the foregoing measures will provide sufficient liquidity for the Company to meet its future liquidity and capital obligations.
Operating Activities
Net cash used in operating activities was $1,259,714 for the six months ended December 31, 2017, including net income of $1.11 million from increased revenue generated from freight logistics services, deferred tax benefit of $1.07 million, provision for doubtful accounts of $0.84 million and amortization of stock-based compensation to consultants of $0.33 million as reconciled. In the current period, accounts receivable increased by $2.21 million and the amount due from related parties increased $0.92 million because of increased revenue for the period. On the other hand, taxes payable increased by $0.73 million primarily due to the one-time transition tax on accumulated foreign earnings. Cash outflows from operating activities for the six months ended December 31, 2017 reflect the above mentioned major factors.
| 36 |
Net cash derived from operating activities was $1,922,458 for the six months ended December 31, 2016, including net income of $1.43 million from increased revenue generated from inland transportation management services and freight logistics services with strong margin contributions and decreased general and administrative expenses. In addition, a significant decrease in provisions for doubtful accounts during the current period and accounts receivable decreased by $0.62 million, as a result of our strengthened cash collection efforts and payments received from Tengda Northwest, our major third-party customer for inland transportation management services, as well as other customers. However, advances to suppliers increased by $1.42 million because we prepaid certain freight fees pursuant to our Memorandum of Understanding with Singapore Metals & Minerals Pte Ltd. and Galasi Jernsih Sdn BHD. Cash inflows from operating activities for the six months ended December 31, 2016 reflect the above mentioned factors.
Investing Activities
The Company’s net cash used in investing activities was $250,278 for the six months ended December 31, 2017 compared to net cash provided by investing activities of $nil for the same period of 2016. For the six months ended December 31, 2017, we developed four information platforms, purchased a motor vehicle and office equipment.
Critical Accounting Policies
We prepare our unaudited condensed consolidated financial statements in accordance with U.S. GAAP. These accounting principles require us to make judgments, estimates and assumptions on the reported amounts of assets and liabilities at the end of each fiscal period, and the reported amounts of revenues and expenses during each fiscal period. We continually evaluate these judgments and estimates based on our own historical experience, knowledge and assessment of current business and other conditions, our expectations regarding the future based on available information and assumptions that we believe to be reasonable.
There have been no material changes during the six months ended December 31, 2017 in our accounting policies from those previously disclosed in the Company’s annual report for the fiscal year ended June 30, 2017.
The selection of critical accounting policies, the judgments and other uncertainties affecting the application of those policies and the sensitivity of reported results to changes in conditions and assumptions are factors that should be considered when reviewing our financial statements. We believe the following accounting policies involve the most significant judgments and estimates used in the preparation of our unaudited condensed consolidated financial statements.
| 37 |
Revenue Recognition
Revenue is recognized when all of the following have occurred: (i) persuasive evidence of an arrangement exists, (ii) delivery has occurred or services have been rendered, (iii) the price is fixed or determinable, and (iv) the ability to collect is reasonably assured.
| ● | Revenues from inland transportation management services are recognized when commodities are being released from the customer’s warehouse. | |
| ● | Revenues from freight logistics services are recognized when the related contractual services are rendered. | |
| ● | Revenues from container trucking services are recognized when the related contractual services are rendered. | |
| ● | Revenues from bulk cargo container services are recognized when the related contractual services are rendered. Bulk cargo container services included shipping of products, arranging cargo container shipping from US to China port, then from China port to end user. Revenue is recognized upon completion of shipping arrangements agreed with customers, either at customer’s designated port or final destination. |
Basis of Consolidation
The Company’s unaudited condensed consolidated financial statements include the accounts of the parent, its subsidiaries and its affiliates. All inter-company transactions and balances are eliminated in consolidation. Sino-Global Shipping Agency Ltd. (“Sino-China”) is considered to be a Variable Interest Entity (VIE), and the Company is the primary beneficiary. Because of the contractual arrangements, the Company had a pecuniary interest in Sino-China that requires consolidation of our and Sino-China's financial statements. The accounts of Sino-China are consolidated in the accompanying unaudited condensed consolidated financial statements pursuant to Accounting Standard Codification (“ASC”) 810-10, “Consolidation”. As a VIE, Sino-China’s revenues are included in our total revenues, its net loss from operations is consolidated with our net income before non-controlling interest. Our non-controlling interest in its net loss is then subtracted to calculate the net income attributable to the Company. The Company temporarily suspended its business with Sino-China in June 2014. Therefore, there is no net income generated by Sino-China in the present.
Use of Estimates and Assumptions
The preparation of the Company’s unaudited condensed consolidated financial statements in conformity with U.S. GAAP requires management to make estimates and assumptions that affect the reported amounts of assets and liabilities and disclosure of contingent assets and liabilities at the dates of the financial statements and the reported amounts of revenues and expenses during the reporting periods. Estimates are adjusted to reflect actual experience when necessary. Significant accounting estimates reflected in the Company’s unaudited condensed consolidated financial statements include revenue recognition, fair value of stock based compensation, cost of revenues, allowance for doubtful accounts, deferred income taxes, and the useful lives of property and equipment. Since the use of estimates is an integral component of the financial reporting process, actual results could differ from those estimates.
| 38 |
Accounts Receivable and Allowance for Doubtful Accounts
Accounts receivable are presented at net realizable value. The Company maintains allowances for doubtful accounts and for estimated losses. The Company reviews the accounts receivable on a periodic basis and makes general and specific allowances when there is doubt as to the collectability of individual receivable balances. In evaluating the collectability of individual receivable balances, the Company considers many factors, including the age of the balances, customers’ historical payment history, their current credit-worthiness and current economic trends. Receivables are considered past due after 180 days. Accounts Receivable are written off against the allowances only after exhaustive collection efforts.
Stock-based Compensation
Stock-based payment transactions with employees are measured on the grant-date fair value of the equity instrument issued and recognized as compensation expense over the requisite service period. Valuations are based upon highly subjective assumptions about the future, including stock price volatility and exercise patterns. The fair value of share-based payment awards was estimated using the Black-Scholes option pricing model. Expected volatilities are based on the historical volatility of the Company’s stock. The Company uses historical data to estimate option exercise and employee terminations. The expected term of options granted represents the period of time that options granted are expected to be outstanding. The risk-free rate for periods within the expected life of the option is based on the U.S. Treasury yield curve in effect at the time of the grant.
Taxation
Because the Company and its subsidiaries and Sino-China are incorporated in different jurisdictions, they file separate income tax returns. The Company uses the asset and liability method of accounting for income taxes in accordance with U.S. GAAP. Deferred taxes, if any, are recognized for the future tax consequences of temporary differences between the tax basis of assets and liabilities and their reported amounts in the unaudited condensed consolidated financial statements. A valuation allowance is provided against deferred tax assets if it is more likely than not that the asset will not be utilized in the future.
The Company recognizes the tax benefit from an uncertain tax position only if it is more likely than not that the tax position will be sustained on examination by the taxing authorities, based on the technical merits of the position. The Company recognizes interest and penalties, if any, related to unrecognized tax benefits as income tax expense.
Income tax returns for the years prior to 2014 are no longer subject to examination by U.S. tax authorities.
On December 22, 2017, the “Tax Cuts and Jobs Act” (“The Act”) was enacted. Under the provisions of the Act, the U.S. corporate tax rate decreased from 35% to 21%. As the Company has a June 30 fiscal year-end, the lower corporate income tax rate will be phased in, resulting in a U.S. statutory federal rate of approximately 28% for our fiscal year ending June 30, 2018, and 21% for subsequent fiscal years. Additionally, the Tax Act imposes a one-time transition tax on deemed repatriation of historical earnings of foreign subsidiaries, and future foreign earnings are subject to U.S. taxation. The change in rate has caused us to re-measure all U.S. deferred income tax assets and liabilities for temporary differences and NOL carryforwards and recorded one time income tax payable relating to “deemed repatriated tax” to be paid over 8 years.
PRC Enterprise Income Tax
PRC enterprise income tax is calculated based on taxable income determined under the PRC Generally Accepted Accounting Principles (“PRC GAAP”) at 25%. Sino-China and Trans Pacific are registered in PRC and governed by the Enterprise Income Tax Laws of the PRC.
| 39 |
PRC Business Tax and Surcharges
Revenues from services provided by the Company’s PRC subsidiaries and affiliates, including Sino-China and Trans Pacific are subject to the PRC business tax of 5%. Business tax and surcharges are paid on gross revenues generated minus the costs of services which are paid on behalf of the customers.
Enterprises or individuals who sell commodities engage in services or selling of goods in the PRC are subject to a value-added tax (“VAT”) in accordance with PRC laws. All of the Company’s revenue generated in the PRC are subject to a VAT on the gross sales price. The VAT rates are 6% and 11%, depending on the type of services provided. The Company is entitled to a deduction or offset for VAT paid on the services rendered by the vendors against the VAT when the Company engages in services.
In addition, under PRC regulations, the Company’s PRC subsidiaries and affiliates are required to pay city construction taxes (7%) and education surcharges (3%) based on calculated business tax payments.
The Company’s PRC subsidiaries and affiliates report revenues net of PRC’s VAT, business tax and surcharges for all the periods presented in the consolidated statements of operations.
Off-Balance Sheet Commitments and Arrangements
We have not entered into any financial guarantees or other commitments to guarantee the payment obligations of any third parties. We have not entered into any derivative contracts that are indexed to our shares and classified as shareholders’ equity or that are not reflected in our unaudited condensed consolidated financial statements. Furthermore, we do not have any retained or contingent interest in assets transferred to an unconsolidated entity that serve as credit, liquidity or market risk support to such entity. We do not have any variable interest in any unconsolidated entity that provides financing, liquidity, market risk or credit support to us or engages in leasing, hedging or research and development services with us.
| 40 |
| Item 3. | Quantitative and Qualitative Disclosures about Market Risk |
This Item is not applicable because we are a smaller reporting company.
| Item 4. | Controls and Procedures |
Evaluation of Disclosure Controls and Procedures
The Company maintains controls and procedures designed to ensure that information required to be disclosed by the issuer in the reports that it files or submits under the Act (15 U.S.C. 78a et seq.) is recorded, processed, summarized and reported, within the time periods specified in the Securities and Exchange Commission’s rules and forms. Disclosure controls and procedures include, without limitation, controls and procedures designed to ensure that information required to be disclosed by an issuer in the reports that it files or submits under the Act is accumulated and communicated to the issuer’s management, including its principal executive and principal financial officers, or persons performing similar functions, as appropriate to allow timely decisions regarding required disclosure.
As of December 31, 2017, the Company carried out an evaluation, under the supervision of and with the participation of its management, including the Company’s Chief Executive Officer and Acting Chief Financial Officer, of the effectiveness of the design and operation of the Company’s disclosure controls and procedures. Based on the foregoing evaluation, Chief Executive Officer and Acting Chief Financial Officer concluded that the Company’s disclosure controls and procedures (as defined in Rules 13a-15(e) and 15d-15(e) under the Securities Exchange Act of 1934, as amended (the “Exchange Act”)) were not effective and adequately designed to ensure that the information required to be disclosed by the Company in the reports it files or submits under the Exchange Act is recorded, processed, summarized and reported within the time periods specified in the applicable rules and forms, and that such information was accumulated and communicated to the management, including Chief Executive Officer and Acting Chief Financial Officer, in a manner that allowed for timely decisions regarding required disclosure. The assessment stemmed from the following material weaknesses –
| ● | Lack of segregation of duties for accounting personnel who prepared and reviewed the journal entries; | |
| ● | Lack of resources with technical competency to review and record non-routine or complex transactions; and | |
| ● | Lack of a full time U.S. GAAP personnel in the accounting department to monitor the recording of the transactions. |
Changes in Internal Control over Financial Reporting.
There were no changes in the Company’s internal control over financial reporting (as defined in Rule 13a-15(f) of the Exchange Act) during the three months ended December 31, 2017 that have materially affected, or are reasonably likely to materially affect, the Company’s internal control over financial reporting.
| 41 |
PART II. OTHER INFORMATION
| Item 6. | Exhibits |
The following exhibits are filed herewith:
| Number | Exhibit | |
| 31.1 | Certifications pursuant to Rule 13a-14(a) or 15d-14(a) under the Securities Exchange Act of 1934, as amended, as adopted pursuant to Section 302 of the Sarbanes-Oxley Act of 2002. | |
| 31.2 | Certifications pursuant to Rule 13a-14(a) or 15d-14(a) under the Securities Exchange Act of 1934, as amended, as adopted pursuant to Section 302 of the Sarbanes-Oxley Act of 2002. | |
| 32.1 | Certifications pursuant to 18 U.S.C. Section 1350, as adopted pursuant to Section 906 of the Sarbanes-Oxley Act of 2002. | |
| EX-101.INS | XBRL Instance Document. | |
| EX-101.SCH | XBRL Taxonomy Extension Schema Document. | |
| EX-101.CAL | XBRL Taxonomy Extension Calculation Linkbase Document. | |
| EX-101.DEF | XBRL Taxonomy Extension Definition Linkbase Document. | |
| EX-101.LAB | XBRL Taxonomy Extension Label Linkbase Document. | |
| EX-101.PRE | XBRL Taxonomy Extension Presentation Linkbase Document. |
| 42 |
SIGNATURES
In accordance with the requirements of the Exchange Act, the registrant caused this report to be signed on its behalf by the undersigned, thereunto duly authorized.
| SINO-GLOBAL SHIPPING AMERICA, LTD. | ||
| February 13, 2018 | By: | /s/ Lei Cao |
| Lei Cao | ||
| Chief Executive Officer | ||
| (Principal Executive Officer) | ||
| February 13, 2018 | By: | /s/ Tuo Pan |
| Tuo Pan | ||
| Acting Chief Financial Officer | ||
| (Principal
Financial Officer and Principal Accounting Officer) | ||
43