Attached files
| file | filename |
|---|---|
| 8-K - FORM 8-K - PEABODY ENERGY CORP | d459246d8k.htm |
Exhibit 99.1

|
Credit Suisse Energy Summit Amy Schwetz Executive Vice President and Chief Financial Officer February 13, 2018
|
Statement on Forward-Looking Information This presentation contains forward-looking statements within the meaning of the securities laws. Forward-looking statements can be identified by the fact that they do not relate strictly to historical or current facts. They often include words or variation of words such as “expects,” “anticipates,” “intends,” “plans,” “believes,” “seeks,” “estimates,” “projects,” “forecasts,” “targets,” “would,” “will,” “should,” “goal,” “could” or “may” or other similar expressions. Forward-looking statements provide management’s current expectations or predictions of future conditions, events or results. All statements that address operating performance, events or developments that we expect or anticipate will occur in the future are forward-looking statements. They may include estimates of revenues, income, earnings per share, cost savings, capital expenditures, dividends, share repurchases, liquidity, capital structure, market share, industry volume, or other financial items, descriptions of management’s plans or objectives for future operations, or descriptions of assumptions underlying any of the above. All forward-looking statements speak only as of the date they are made and reflect the company’s good faith beliefs, assumptions and expectations, but they are not guarantees of future performance or events. Furthermore, the company disclaims any obligation to publicly update or revise any forward-looking statement, except as required by law. By their nature, forward-looking statements are subject to risks and uncertainties that could cause actual results to differ materially from those suggested by the forward-looking statements. Factors that might cause such differences include, but are not limited to, a variety of economic, competitive and regulatory factors, many of which are beyond the company’s control, that are described in our Annual Report on Form 10-K for the fiscal year ended Dec. 31, 2016, as amended on July 10, 2017 and Aug. 14, 2017, and in Exhibit 99.2 to the Company’s Current Report on Form 8-K filed with the SEC on April 11, 2017, as well as additional factors we may describe from time to time in other filings with the SEC. You may get such filings for free at our website at www.peabodyenergy.com. You should understand that it is not possible to predict or identify all such factors and, consequently, you should not consider any such list to be a complete set of all potential risks or uncertainties. Adjusted EBITDA is a non-GAAP measure defined as income (loss) from continuing operations before deducting net interest expense, income taxes, asset retirement obligation expenses, depreciation, depletion and amortization and reorganization items, net. Adjusted EBITDA is also adjusted for the discrete items that management excluded in analyzing the segments’ operating performance as displayed in the reconciliation. A reconciliation of income (loss) from continuing operations, net of income taxes to Adjusted EBITDA is included at the end of this document. Adjusted EBITDA is used by management as one of the primary metrics to measure our operating performance. Management also believes non-GAAP performance measures are used by investors to measure our operating performance and lenders to measure our ability to incur and service debt. Adjusted EBITDA is not intended to serve as an alternative to U.S. GAAP measures of performance and may not be comparable to similarly-titled measures presented by other companies. 2
|
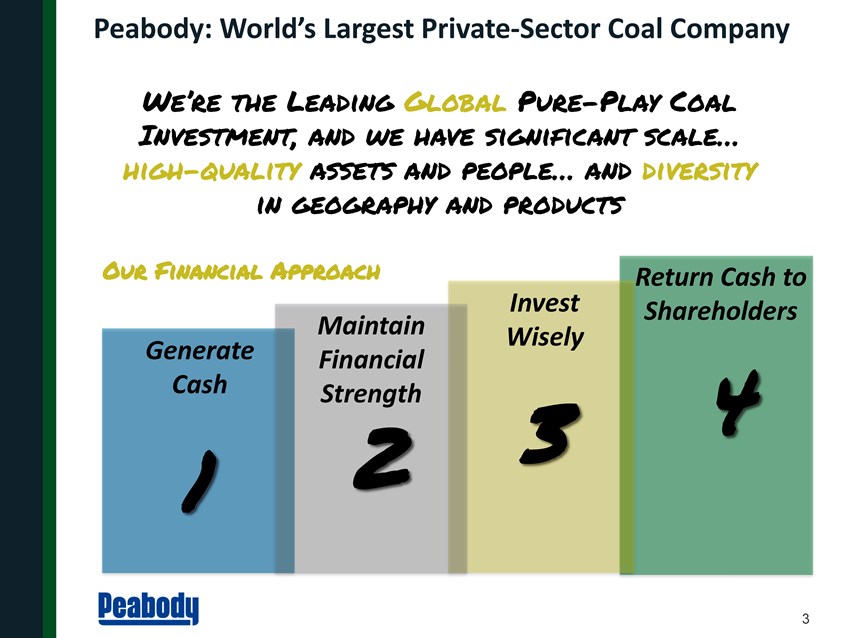
Peabody: World’s Largest Private-Sector Coal Company We’re the Leading Global Pure-Play Coal Investment, and we have significant scale… high-quality assets and people… and diversity in geography and products Our Financial Approach Return Cash to Invest Shareholders Maintain Wisely Generate Financial Cash 3 4 1 2 3
|
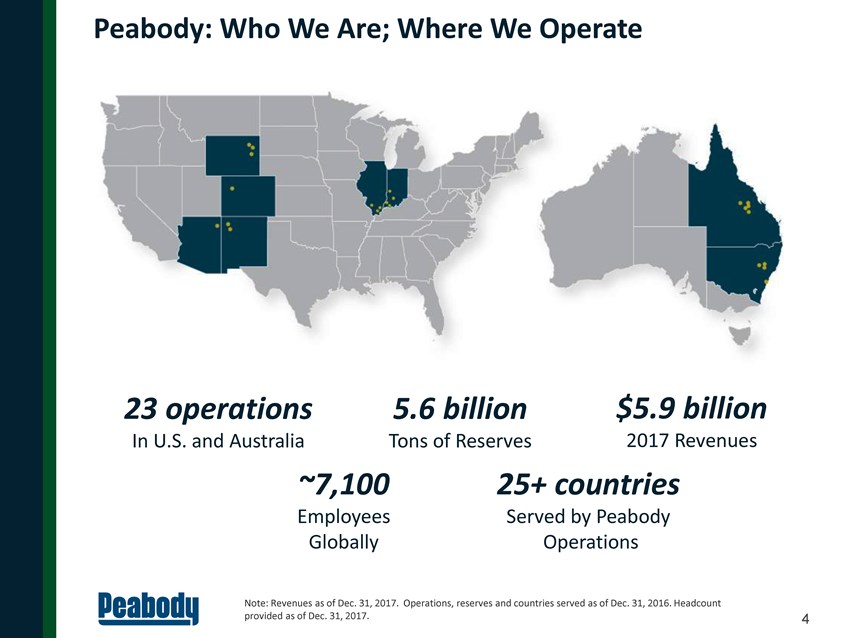
Peabody: Who We Are; Where We Operate 23 operations 5.6 billion $5.9 billion In U.S. and Australia Tons of Reserves 2017 Revenues ~7,100 25+ countries Employees Served by Peabody Globally Operations Note: Revenues as of Dec. 31, 2017. Operations, reserves and countries served as of Dec. 31, 2016. Headcount provided as of Dec. 31, 2017. 4
|
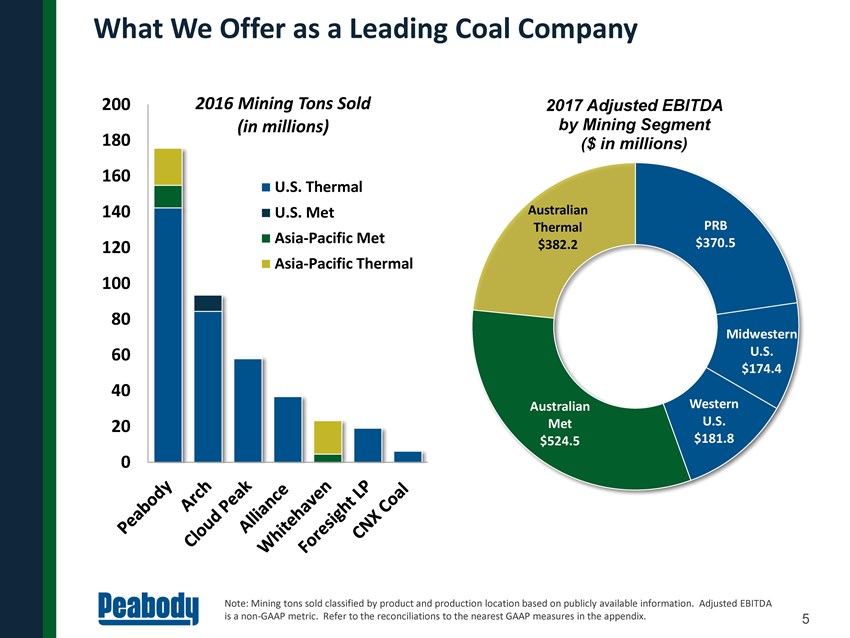
What We Offer as a Leading Coal Company 200 2016 Mining Tons Sold 2017 Adjusted EBITDA (in millions) by Mining Segment 180 ($ in millions) 160 U.S. Thermal 140 U.S. Met Australian Thermal PRB Asia-Pacific Met $370.5 120 $382.2 Asia-Pacific Thermal 100 80 Midwestern 60 U.S. $174.4 40 Australian Western 20 Met U.S. $524.5 $181.8 0 Note: Mining tons sold classified by product and production location based on publicly available information. Adjusted EBITDA is a non-GAAP metric. Refer to the reconciliations to the nearest GAAP measures in the appendix. 5
|
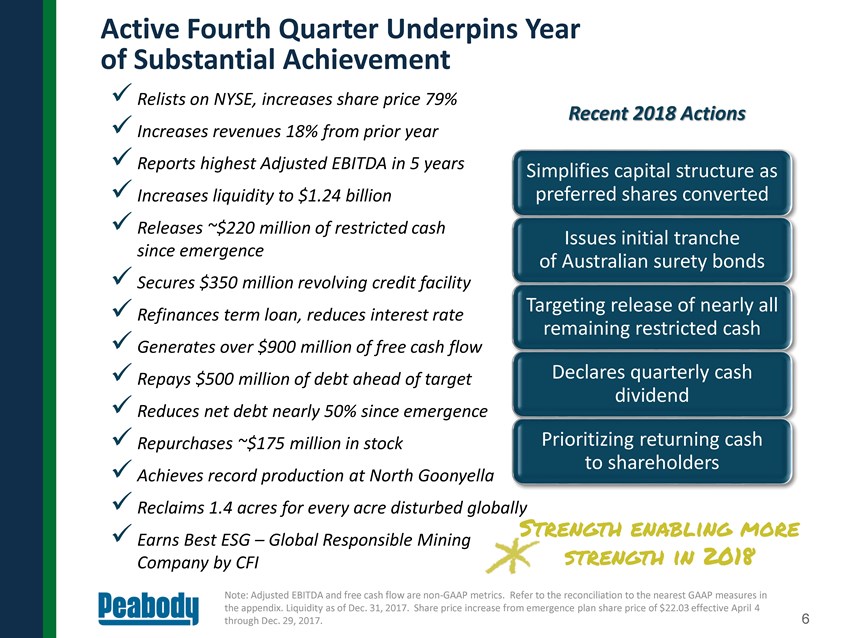
Active Fourth Quarter Underpins Year of Substantial Achievement Relists on NYSE, increases share price 79% Recent 2018 Actions Increases revenues 18% from prior year Reports highest Adjusted EBITDA in 5 years Simplifies capital structure as Increases liquidity to $1.24 billion preferred shares converted Releases ~$220 million of restricted cash Issues initial tranche since emergence of Australian surety bonds Secures $350 million revolving credit facility Targeting release of nearly all Refinances term loan, reduces interest rate remaining restricted cash Generates over $900 million of free cash flow Repays $500 million of debt ahead of target Declares quarterly cash dividend Reduces net debt nearly 50% since emergence Repurchases ~$175 million in stock Prioritizing returning cash to shareholders Achieves record production at North Goonyella Reclaims 1.4 acres for every acre disturbed globally Strength enabling more Earns Best ESG – Global Responsible Mining Company by CFI strength in 2018 Note: Adjusted EBITDA and free cash flow are non-GAAP metrics. Refer to the reconciliation to the nearest GAAP measures in the appendix. Liquidity as of Dec. 31, 2017. Share price increase from emergence plan share price of $22.03 effective April 4 6 through Dec. 29, 2017.
|
Mining Operations Operations at Peabody’s North Antelope Rochelle Mine in Wyoming 7
|
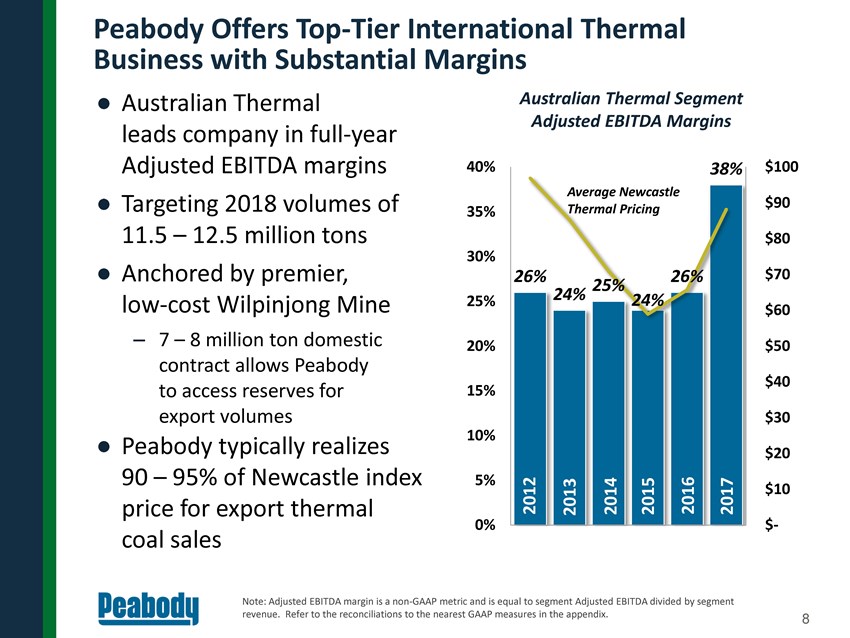
Peabody Offers Top-Tier International Thermal Business with Substantial Margins • Australian Thermal Australian Thermal Segment Adjusted EBITDA Margins leads company in full-year Adjusted EBITDA margins 40% 38% $100 Average Newcastle • Targeting 2018 volumes of $90 35% Thermal Pricing 11.5 – 12.5 million tons $80 30% • Anchored by premier, 26% 26% $70 25% 25% 24% 24% low-cost Wilpinjong Mine $60 – 7 – 8 million ton domestic 20% $50 contract allows Peabody $40 to access reserves for 15% export volumes $30 10% • Peabody typically realizes $20 90 – 95% of Newcastle index 5% 2012 2013 2014 2015 2016 2017 $10 price for export thermal 0% $- coal sales Note: Adjusted EBITDA margin is a non-GAAP metric and is equal to segment Adjusted EBITDA divided by segment revenue. Refer to the reconciliations to the nearest GAAP measures in the appendix. 8
|
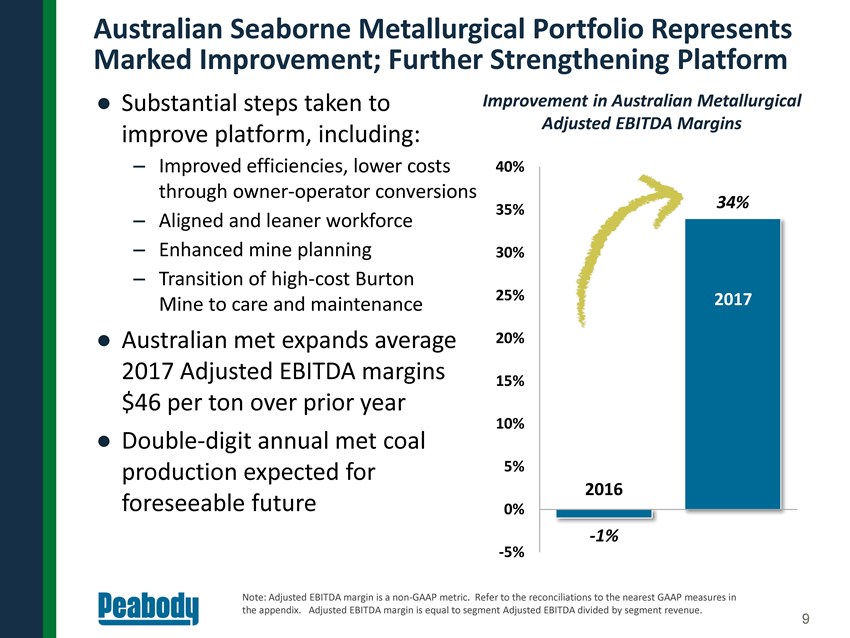
Australian Seaborne Metallurgical Portfolio Represents Marked Improvement; Further Strengthening Platform • Substantial steps taken to Improvement in Australian Metallurgical Adjusted EBITDA Margins improve platform, including: – Improved efficiencies, lower costs 40% through owner-operator conversions 34% 35% – Aligned and leaner workforce – Enhanced mine planning 30% – Transition of high-cost Burton 25% 2017 Mine to care and maintenance • Australian met expands average 20% 2017 Adjusted EBITDA margins 15% $46 per ton over prior year 10% • Double-digit annual met coal 2016 production expected for 5% 2016 foreseeable future 0% -1% -5% Note: Adjusted EBITDA margin is a non-GAAP metric. Refer to the reconciliations to the nearest GAAP measures in the appendix. Adjusted EBITDA margin is equal to segment Adjusted EBITDA divided by segment revenue. 9
|
|
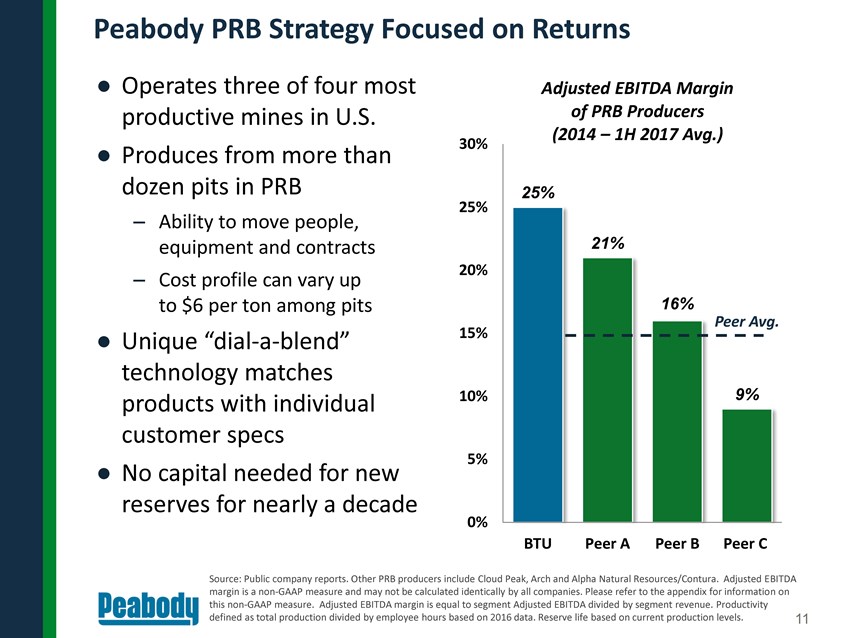
Peabody PRB Strategy Focused on Returns Operates three of four most Adjusted EBITDA Margin productive mines in U.S. of PRB Producers (2014 – 1H 2017 Avg.) 30% Produces from more than dozen pits in PRB 25% Ability 25% – to move people, equipment and contracts 21% – 20% Cost profile can vary up to $6 per ton among pits 16% Peer Avg. Unique “dial-a-blend” 15% technology matches products with individual 10% 9% customer specs 5% No capital needed for new reserves for nearly a decade 0% BTU Peer A Peer B Peer C Source: Public company reports. Other PRB producers include Cloud Peak, Arch and Alpha Natural Resources/Contura. Adjusted EBITDA margin is a non-GAAP measure and may not be calculated identically by all companies. Please refer to the appendix for information on this non-GAAP measure. Adjusted EBITDA margin is equal to segment Adjusted EBITDA divided by segment revenue. Productivity defined as total production divided by employee hours based on 2016 data. Reserve life based on current production levels. 11
|
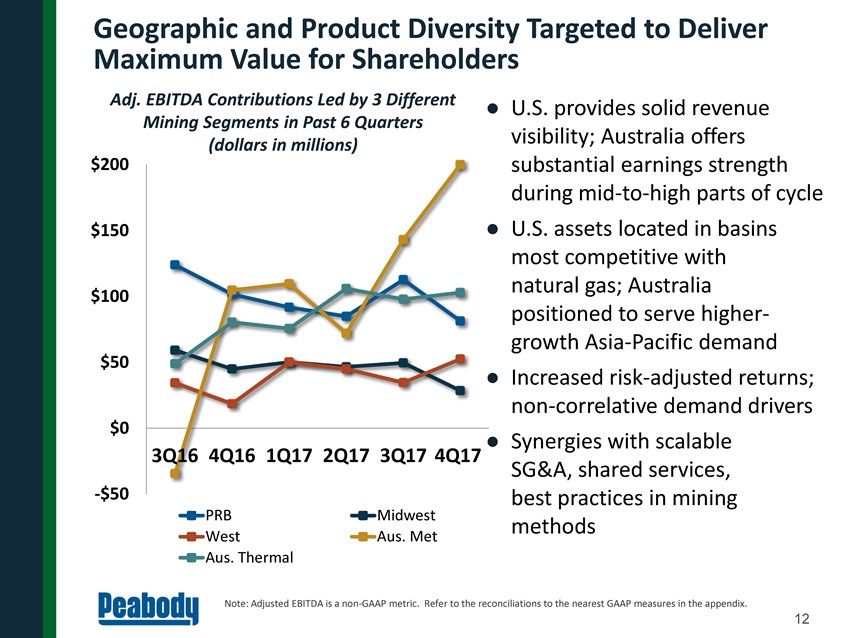
Geographic and Product Diversity Targeted to Deliver Maximum Value for Shareholders Adj. EBITDA Contributions Led by 3 Different U.S. provides solid revenue Mining Segments in Past 6 Quarters visibility; Australia offers (dollars in millions) $200 substantial earnings strength during mid-to-high parts of cycle $150 U.S. assets located in basins most competitive with natural gas; Australia $100 positioned to serve higher- growth Asia-Pacific demand $50 Increased risk-adjusted returns; non-correlative demand drivers $0 Synergies with scalable 3Q16 4Q16 1Q17 2Q17 3Q17 4Q17 SG&A, shared services, -$50 best practices in mining PRB Midwest methods West Aus. Met Aus. Thermal Note: Adjusted EBITDA is a non-GAAP metric. Refer to the reconciliations to the nearest GAAP measures in the appendix. 12
|
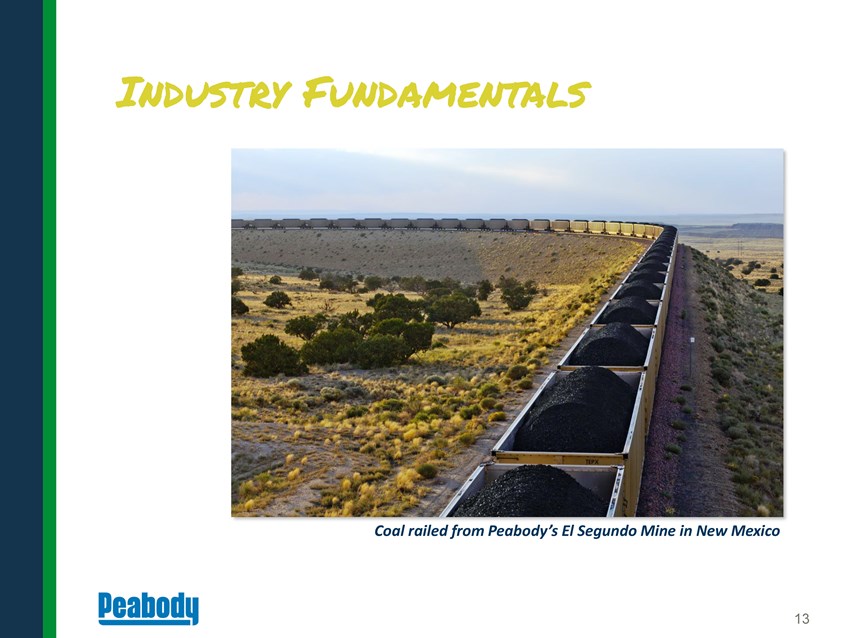
Industry Fundamentals Coal railed from Peabody’s El Segundo Mine in New Mexico 13
|
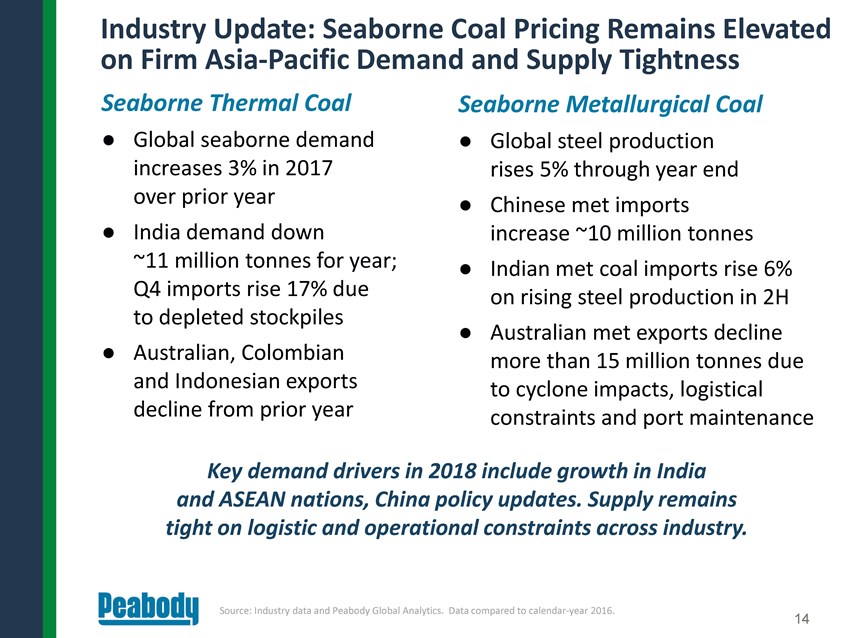
Industry Update: Seaborne Coal Pricing Remains Elevated on Firm Asia-Pacific Demand and Supply Tightness Seaborne Thermal Coal Seaborne Metallurgical Coal Global seaborne demand Global steel production increases 3% in 2017 rises 5% through year end over prior year Chinese met imports India demand down increase ~10 million tonnes ~11 million tonnes for year; Indian met coal imports rise 6% Q4 imports rise 17% due on rising steel production in 2H to depleted stockpiles Australian met exports decline Australian, Colombian more than 15 million tonnes due and Indonesian exports to cyclone impacts, logistical decline from prior year constraints and port maintenance Key demand drivers in 2018 include growth in India and ASEAN nations, China policy updates. Supply remains tight on logistic and operational constraints across industry. Source: Industry data and Peabody Global Analytics. Data compared to calendar-year 2016. 14
|
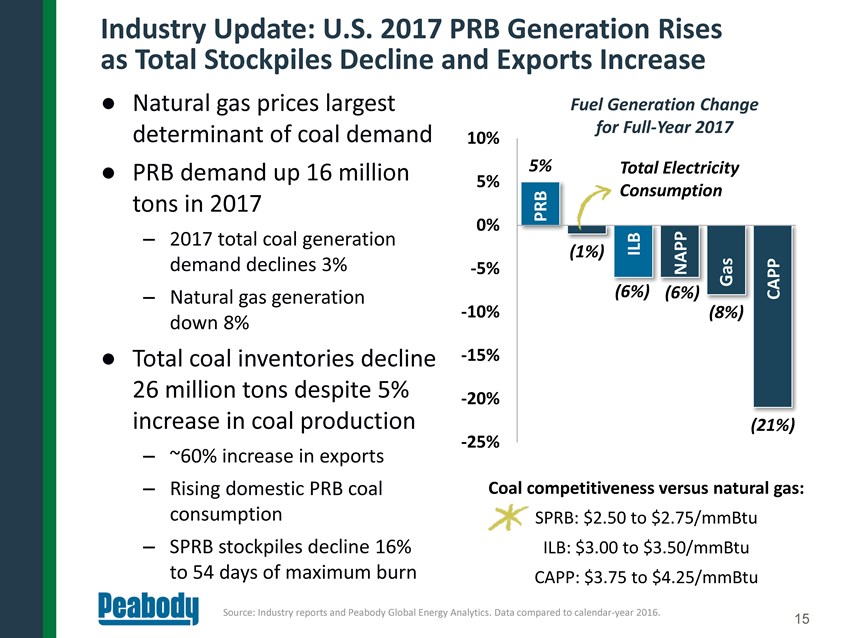
Industry Update: U.S. 2017 PRB Generation Rises as Total Stockpiles Decline and Exports Increase Natural gas prices largest Fuel Generation Change determinant of coal demand for Full-Year 2017 10% PRB demand up 16 million 5% Total Electricity 5% Consumption tons in 2017 PRB 0% – 2017 total coal generation ILB (1%) demand declines 3% -5% NAPP Gas – Natural gas generation (6%) (6%) CAPP -10% (8%) down 8% Total coal inventories decline -15% 26 million tons despite 5% -20% increase in coal production (21%) -25% – ~60% increase in exports – Rising domestic PRB coal Coal competitiveness versus natural gas: consumption SPRB: $2.50 to $2.75/mmBtu – SPRB stockpiles decline 16% ILB: $3.00 to $3.50/mmBtu to 54 days of maximum burn CAPP: $3.75 to $4.25/mmBtu Source: Industry reports and Peabody Global Energy Analytics. Data compared to calendar-year 2016. 15
|
U.S., Australia Advance Pro-Energy Economy; Recognize Importance of Coal in Energy Mix U.S. EPA proposes repeal Previous U.S. Announcements of Clean Power Plan Perry study and proposed FERC Repeal of “Stream Protection Rule” grid resiliency pricing rule Office of Natural Resources represent first step in Revenue proposes to rescind examining grid complexity Coal Valuation Rule Australia scraps renewable EPA files notice of intent subsidies; requires electricity to review and rescind retailers to guarantee reliability “Waters of the U.S.” act Peabody continues to support Review of Clean Power Plan high-efficiency, low-emissions and favorable D.C. circuit ruling technology and advancement Issuance of Energy of carbon capture, use and Independence executive order storage technologies DOI issues secretarial order ending coal leasing moratorium Source: Industry reports. 16

|
Financial Approach 17
|
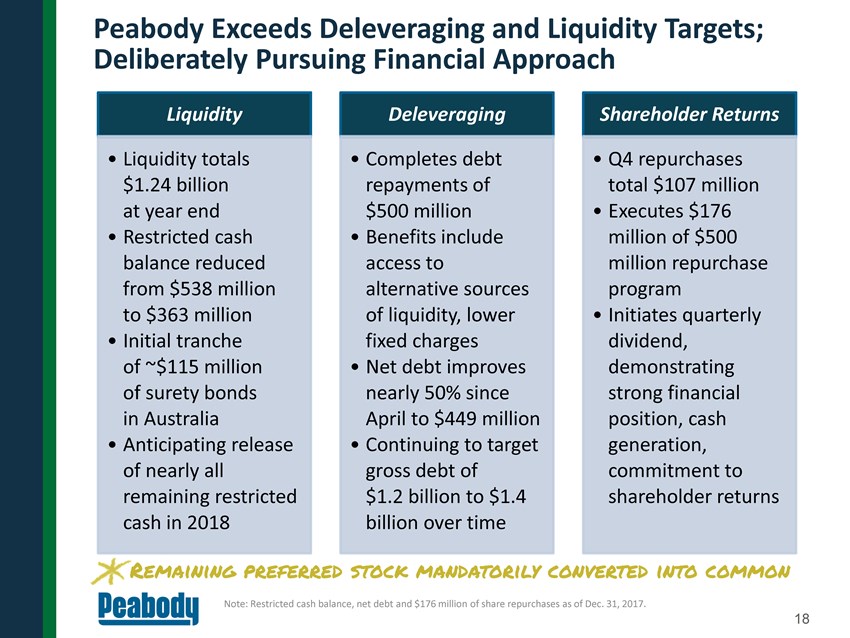
Peabody Exceeds Deleveraging and Liquidity Targets; Deliberately Pursuing Financial Approach Liquidity Deleveraging Shareholder Returns Liquidity totals Completes debt Q4 repurchases $1.24 billion repayments of total $107 million at year end $500 million Executes $176 Restricted cash Benefits include million of $500 balance reduced access to million repurchase from $538 million alternative sources program to $363 million of liquidity, lower Initiates quarterly Initial tranche fixed charges dividend, of ~$115 million Net debt improves demonstrating of surety bonds epay nearly 50% since strong financial in Australia April to $449 million position, cash Anticipating release Continuing to target generation, of nearly all gross debt of commitment to remaining restricted $1.2 billion to $1.4 shareholder returns cash in 2018 billion over time Millio Remaining preferred stock mandatorily converted into common Note: Restricted cash balance, net debt and $176 million of share repurchases as of Dec. 31, 2017. 18
|
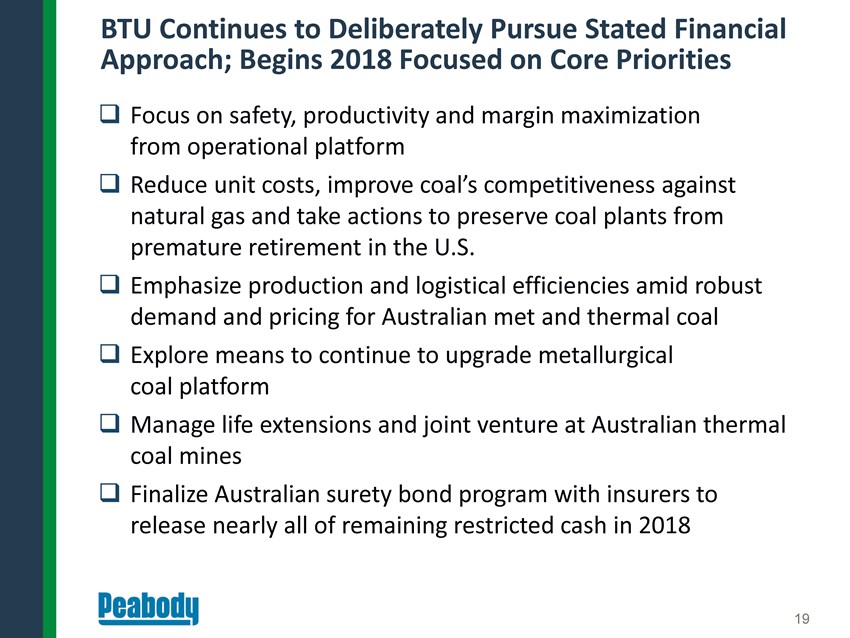
BTU Continues to Deliberately Pursue Stated Financial Approach; Begins 2018 Focused on Core Priorities Focus on safety, productivity and margin maximization from operational platform Reduce unit costs, improve coal’s competitiveness against natural gas and take actions to preserve coal plants from premature retirement in the U.S. Emphasize production and logistical efficiencies amid robust demand and pricing for Australian met and thermal coal Explore means to continue to upgrade metallurgical coal platform Manage life extensions and joint venture at Australian thermal coal mines Finalize Australian surety bond program with insurers to release nearly all of remaining restricted cash in 2018 19
|
APPENDIX North Antelope Rochelle Mine Loadout Facility 20
|
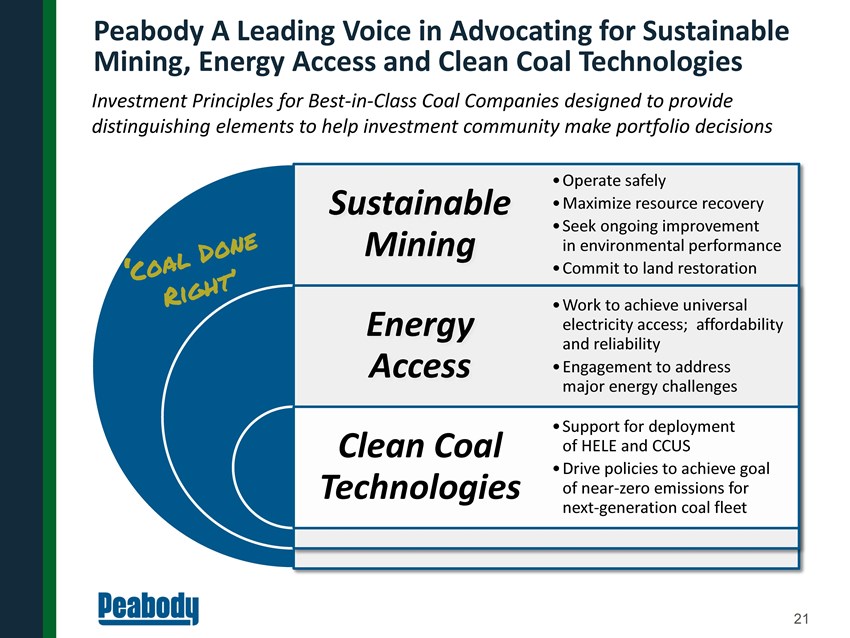
Peabody A Leading Voice in Advocating for Sustainable Mining, Energy Access and Clean Coal Technologies Investment Principles for Best-in-Class Coal Companies designed to provide distinguishing elements to help investment community make portfolio decisions Operate safely Sustainable Maximize resource recovery Seek ongoing improvement Mining in environmental performance Commit to land restoration Work to achieve universal Energy electricity access; affordability and reliability Access Engagement to address major energy challenges Support for deployment Clean Coal of HELE and CCUS Drive policies to achieve goal Technologies of near-zero emissions for next-generation coal fleet 21
|
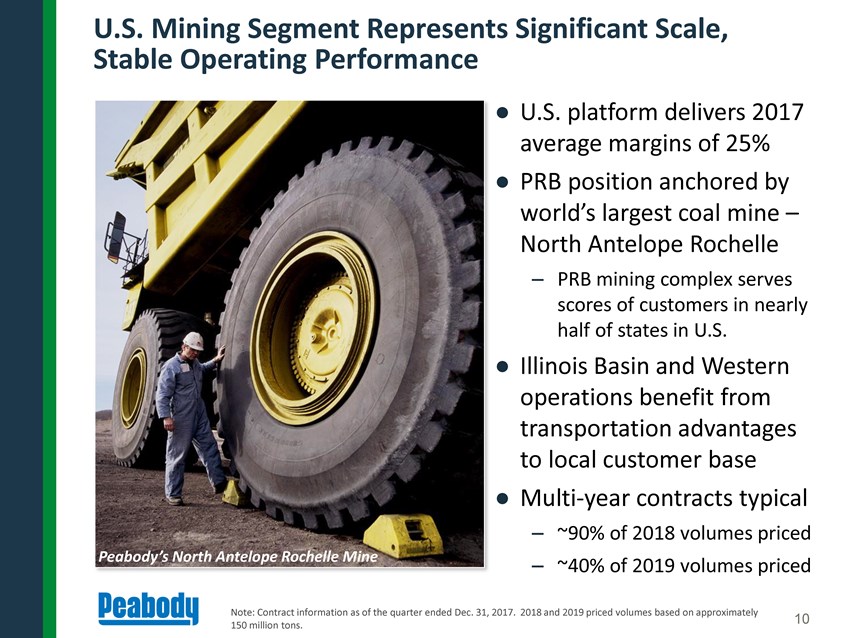
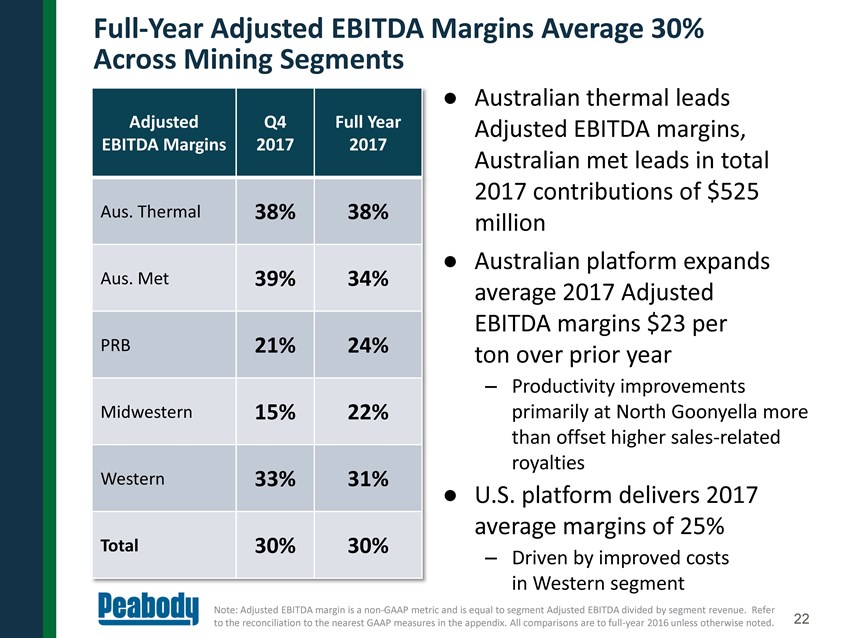
Full-Year Adjusted EBITDA Margins Average 30% Across Mining Segments Australian thermal leads Adjusted Q4 Full Year Adjusted EBITDA margins, EBITDA Margins 2017 2017 Australian met leads in total 2017 contributions of $525 Aus. Thermal 38% 38% million Australian platform expands Aus. Met 39% 34% average 2017 Adjusted EBITDA margins $23 per PRB 21% 24% ton over prior year – Productivity improvements Midwestern 15% 22% primarily at North Goonyella more than offset higher sales-related royalties Western 33% 31% U.S. platform delivers 2017 average margins of 25% Total 30% 30% – Driven by improved costs in Western segment Note: Adjusted EBITDA margin is a non-GAAP metric and is equal to segment Adjusted EBITDA divided by segment revenue. Refer to the reconciliation to the nearest GAAP measures in the appendix. All comparisons are to full-year 2016 unless otherwise noted. 22
|
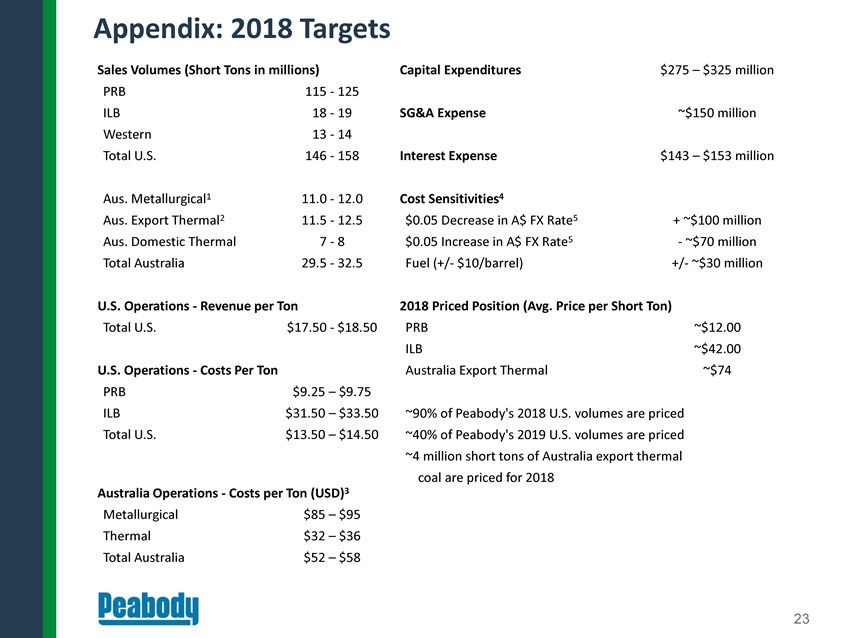
Appendix: 2018 Targets Sales Volumes (Short Tons in millions) Capital Expenditures $275 – $325 million PRB 115 - 125 ILB 18 - 19 SG&A Expense ~$150 million Western 13 - 14 Total U.S. 146 - 158 Interest Expense $143 – $153 million Aus. Metallurgical1 11.0 - 12.0 Cost Sensitivities4 Aus. Export Thermal2 11.5 - 12.5 $0.05 Decrease in A$ FX Rate5 + ~$100 million Aus. Domestic Thermal 7 - 8 $0.05 Increase in A$ FX Rate5 - ~$70 million Total Australia 29.5 - 32.5 Fuel (+/- $10/barrel) +/- ~$30 million U.S. Operations - Revenue per Ton 2018 Priced Position (Avg. Price per Short Ton) Total U.S. $17.50 - $18.50 PRB ~$12.00 ILB ~$42.00 U.S. Operations - Costs Per Ton Australia Export Thermal ~$74 PRB $9.25 – $9.75 ILB $31.50 – $33.50 ~90% of Peabody’s 2018 U.S. volumes are priced Total U.S. $13.50 – $14.50 ~40% of Peabody’s 2019 U.S. volumes are priced ~4 million short tons of Australia export thermal coal are priced for 2018 Australia Operations - Costs per Ton (USD)3 Metallurgical $85 – $95 Thermal $32 – $36 Total Australia $52 – $58 23
|
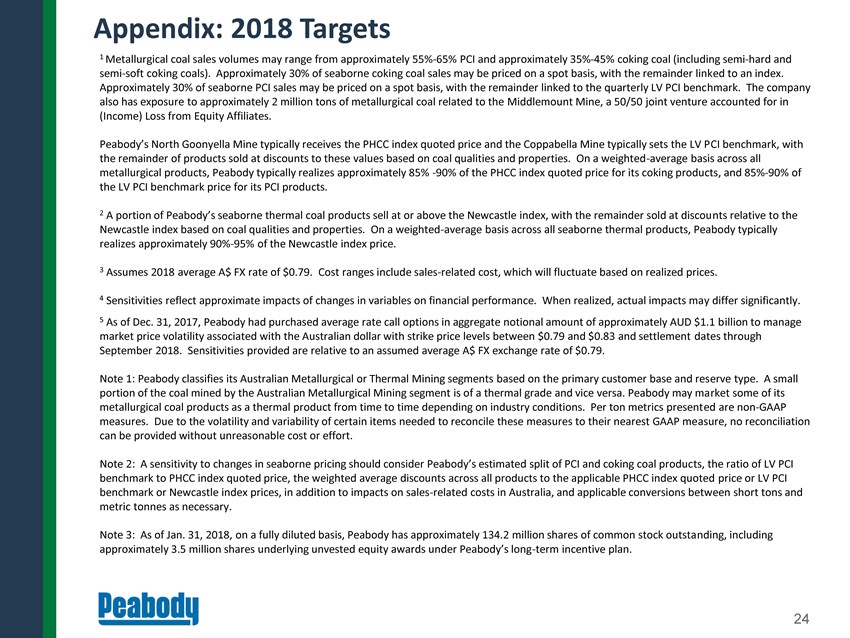
Appendix: 2018 Targets 1 Metallurgical coal sales volumes may range from approximately 55%-65% PCI and approximately 35%-45% coking coal (including semi-hard and semi-soft coking coals). Approximately 30% of seaborne coking coal sales may be priced on a spot basis, with the remainder linked to an index. Approximately 30% of seaborne PCI sales may be priced on a spot basis, with the remainder linked to the quarterly LV PCI benchmark. The company also has exposure to approximately 2 million tons of metallurgical coal related to the Middlemount Mine, a 50/50 joint venture accounted for in (Income) Loss from Equity Affiliates. Peabody’s North Goonyella Mine typically receives the PHCC index quoted price and the Coppabella Mine typically sets the LV PCI benchmark, with the remainder of products sold at discounts to these values based on coal qualities and properties. On a weighted-average basis across all metallurgical products, Peabody typically realizes approximately 85% -90% of the PHCC index quoted price for its coking products, and 85%-90% of the LV PCI benchmark price for its PCI products. 2 A portion of Peabody’s seaborne thermal coal products sell at or above the Newcastle index, with the remainder sold at discounts relative to the Newcastle index based on coal qualities and properties. On a weighted-average basis across all seaborne thermal products, Peabody typically realizes approximately 90%-95% of the Newcastle index price. 3 Assumes 2018 average A$ FX rate of $0.79. Cost ranges include sales-related cost, which will fluctuate based on realized prices. 4 Sensitivities reflect approximate impacts of changes in variables on financial performance. When realized, actual impacts may differ significantly. 5 As of Dec. 31, 2017, Peabody had purchased average rate call options in aggregate notional amount of approximately AUD $1.1 billion to manage market price volatility associated with the Australian dollar with strike price levels between $0.79 and $0.83 and settlement dates through September 2018. Sensitivities provided are relative to an assumed average A$ FX exchange rate of $0.79. Note 1: Peabody classifies its Australian Metallurgical or Thermal Mining segments based on the primary customer base and reserve type. A small portion of the coal mined by the Australian Metallurgical Mining segment is of a thermal grade and vice versa. Peabody may market some of its metallurgical coal products as a thermal product from time to time depending on industry conditions. Per ton metrics presented are non-GAAP measures. Due to the volatility and variability of certain items needed to reconcile these measures to their nearest GAAP measure, no reconciliation can be provided without unreasonable cost or effort. Note 2: A sensitivity to changes in seaborne pricing should consider Peabody’s estimated split of PCI and coking coal products, the ratio of LV PCI benchmark to PHCC index quoted price, the weighted average discounts across all products to the applicable PHCC index quoted price or LV PCI benchmark or Newcastle index prices, in addition to impacts on sales-related costs in Australia, and applicable conversions between short tons and metric tonnes as necessary. Note 3: As of Jan. 31, 2018, on a fully diluted basis, Peabody has approximately 134.2 million shares of common stock outstanding, including approximately 3.5 million shares underlying unvested equity awards under Peabody’s long-term incentive plan. 24
|
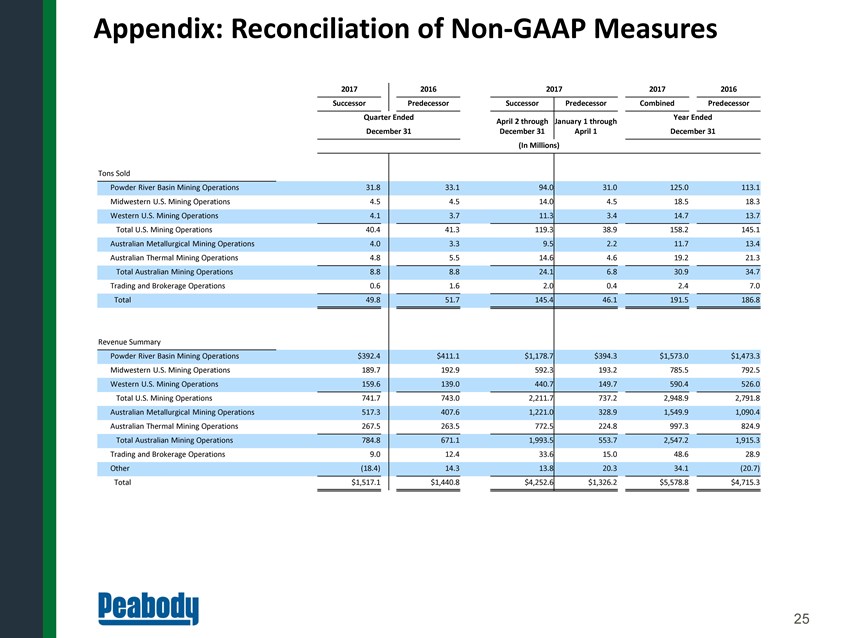
Appendix: Reconciliation of Non-GAAP Measures 2017 2016 2017 2017 2016 Successor Predecessor Successor Predecessor Combined Predecessor Quarter Ended Year Ended April 2 through January 1 through December 31 December 31 April 1 December 31 (In Millions) Tons Sold Powder River Basin Mining Operations 31.8 33.1 94.0 31.0 125.0 113.1 Midwestern U.S. Mining Operations 4.5 4.5 14.0 4.5 18.5 18.3 Western U.S. Mining Operations 4.1 3.7 11.3 3.4 14.7 13.7 Total U.S. Mining Operations 40.4 41.3 119.3 38.9 158.2 145.1 Australian Metallurgical Mining Operations 4.0 3.3 9.5 2.2 11.7 13.4 Australian Thermal Mining Operations 4.8 5.5 14.6 4.6 19.2 21.3 Total Australian Mining Operations 8.8 8.8 24.1 6.8 30.9 34.7 Trading and Brokerage Operations 0.6 1.6 2.0 0.4 2.4 7.0 Total 49.8 51.7 145.4 46.1 191.5 186.8 Revenue Summary Powder River Basin Mining Operations $392.4 $411.1 $1,178.7 $394.3 $1,573.0 $1,473.3 Midwestern U.S. Mining Operations 189.7 192.9 592.3 193.2 785.5 792.5 Western U.S. Mining Operations 159.6 139.0 440.7 149.7 590.4 526.0 Total U.S. Mining Operations 741.7 743.0 2,211.7 737.2 2,948.9 2,791.8 Australian Metallurgical Mining Operations 517.3 407.6 1,221.0 328.9 1,549.9 1,090.4 Australian Thermal Mining Operations 267.5 263.5 772.5 224.8 997.3 824.9 Total Australian Mining Operations 784.8 671.1 1,993.5 553.7 2,547.2 1,915.3 Trading and Brokerage Operations 9.0 12.4 33.6 15.0 48.6 28.9 Other (18.4) 14.3 13.8 20.3 34.1 (20.7) Total $1,517.1 $1,440.8 $4,252.6 $1,326.2 $5,578.8 $4,715.3 25
|
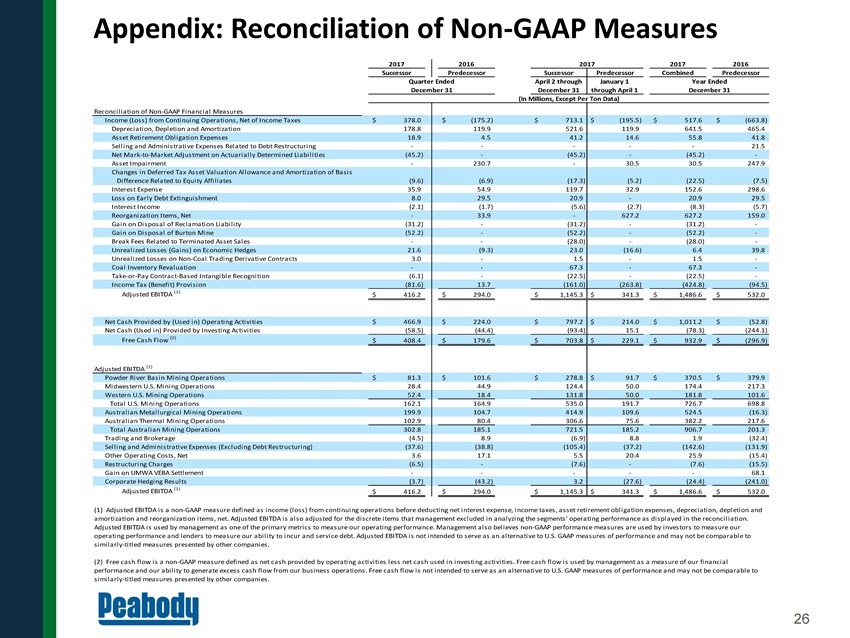
Appendix: Reconciliation of Non-GAAP Measures 2017 2016 2017 2017 2016 Successor Predecessor Successor Predecessor Combined Predecessor Quarter Ended April 2 through January 1 Year Ended December 31 December 31 through April 1 December 31 (In Millions, Except Per Ton Data) Reconciliation of Non-GAAP Financial Measures Income (Loss) from Continuing Operations, Net of Income Taxes $ 378.0 $ (175.2) $ 713.1 $ (195.5) $ 517.6 $ (663.8) Depreciation, Depletion and Amortization 178.8 119.9 521.6 119.9 641.5 465.4 Asset Retirement Obligation Expenses 18.9 4.5 41.2 14.6 55.8 41.8 Selling and Administrative Expenses Related to Debt Restructuring — — — — — 21.5 Net Mark-to-Market Adjustment on Actuarially Determined Liabilities (45.2) — (45.2) — (45.2) -Asset Impairment — 230.7 — 30.5 30.5 247.9 Changes in Deferred Tax Asset Valuation Allowance and Amortization of Basis Difference Related to Equity Affiliates (9.6) (6.9) (17.3) (5.2) (22.5) (7.5) Interest Expense 35.9 54.9 119.7 32.9 152.6 298.6 Loss on Early Debt Extinguishment 8.0 29.5 20.9 — 20.9 29.5 Interest Income (2.1) (1.7) (5.6) (2.7) (8.3) (5.7) Reorganization Items, Net — 33.9 — 627.2 627.2 159.0 Gain on Disposal of Reclamation Liability (31.2) — (31.2) — (31.2) -Gain on Disposal of Burton Mine (52.2) — (52.2) — (52.2) -Break Fees Related to Terminated Asset Sales — — (28.0) — (28.0) -Unrealized Losses (Gains) on Economic Hedges 21.6 (9.3) 23.0 (16.6) 6.4 39.8 Unrealized Losses on Non-Coal Trading Derivative Contracts 3.0 — 1.5 — 1.5 -Coal Inventory Revaluation — — 67.3 — 67.3 -Take-or-Pay Contract-Based Intangible Recognition (6.1) — (22.5) — (22.5) -Income Tax (Benefit) Provision (81.6) 13.7 (161.0) (263.8) (424.8) (94.5) Adjusted EBITDA (1) $ 416.2 $ 294.0 $ 1,145.3 $ 341.3 $ 1,486.6 $ 532.0 Net Cash Provided by (Used in) Operating Activities $ 466.9 $ 224.0 $ 797.2 $ 214.0 $ 1,011.2 $ (52.8) Net Cash (Used in) Provided by Investing Activities (58.5) (44.4) (93.4) 15.1 (78.3) (244.1) Free Cash Flow (2) $ 408.4 $ 179.6 $ 703.8 $ 229.1 $ 932.9 $ (296.9) Adjusted EBITDA (1) Powder River Basin Mining Operations $ 81.3 $ 101.6 $ 278.8 $ 91.7 $ 370.5 $ 379.9 Midwestern U.S. Mining Operations 28.4 44.9 124.4 50.0 174.4 217.3 Western U.S. Mining Operations 52.4 18.4 131.8 50.0 181.8 101.6 Total U.S. Mining Operations 162.1 164.9 535.0 191.7 726.7 698.8 Australian Metallurgical Mining Operations 199.9 104.7 414.9 109.6 524.5 (16.3) Australian Thermal Mining Operations 102.9 80.4 306.6 75.6 382.2 217.6 Total Australian Mining Operations 302.8 185.1 721.5 185.2 906.7 201.3 Trading and Brokerage (4.5) 8.9 (6.9) 8.8 1.9 (32.4) Selling and Administrative Expenses (Excluding Debt Restructuring) (37.6) (38.8) (105.4) (37.2) (142.6) (131.9) Other Operating Costs, Net 3.6 17.1 5.5 20.4 25.9 (15.4) Restructuring Charges (6.5) — (7.6) — (7.6) (15.5) Gain on UMWA VEBA Settlement — — — — — 68.1 Corporate Hedging Results (3.7) (43.2) 3.2 (27.6) (24.4) (241.0) Adjusted EBITDA (1) $ 416.2 $ 294.0 $ 1,145.3 $ 341.3 $ 1,486.6 $ 532.0 (1) Adjusted EBITDA is a non-GAAP measure defined as income (loss) from continuing operations before deducting net interest expense, income taxes, asset retirement obligation expenses, depreciation, depletion and amortization and reorganization items, net. Adjusted EBITDA is also adjusted for the discrete items that management excluded in analyzing the segments’ operating performance as displayed in the reconciliation. Adjusted EBITDA is used by management as one of the primary metrics to measure our operating performance. Management also believes non-GAAP performance measures are used by investors to measure our operating performance and lenders to measure our ability to incur and service debt. Adjusted EBITDA is not intended to serve as an alternative to U.S. GAAP measures of performance and may not be comparable to similarly-titled measures presented by other companies. (2) Free cash flow is a non-GAAP measure defined as net cash provided by operating activities less net cash used in investing activities. Free cash flow is used by management as a measure of our financial performance and our ability to generate excess cash flow from our business operations. Free cash flow is not intended to serve as an alternative to U.S. GAAP measures of performance and may not be comparable to similarly-titled measures presented by other companies. 26
|
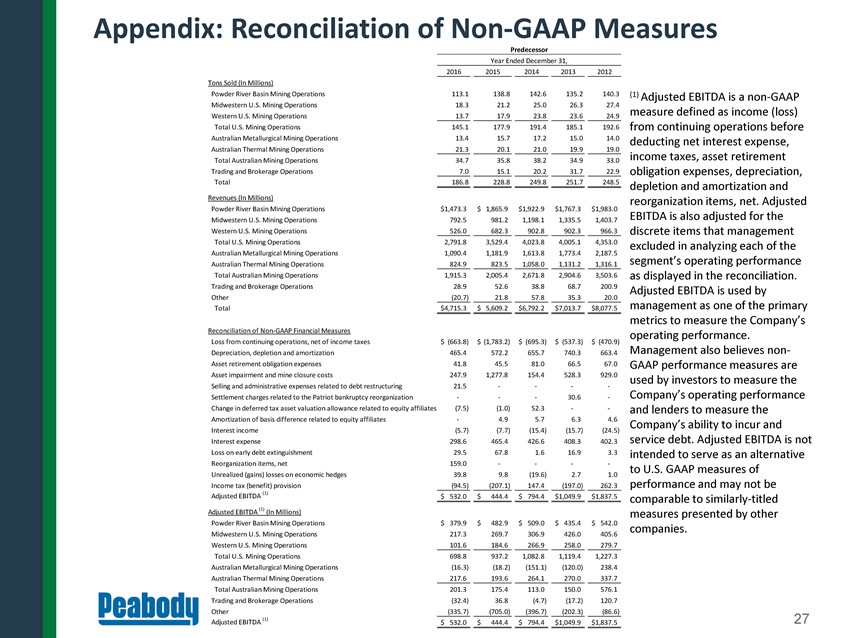
Appendix: Reconciliation of Non-GAAP Measures Predecessor Year Ended December 31, 2016 2015 2014 2013 2012 Tons Sold (In Millions) Powder River Basin Mining Operations 113.1 138.8 142.6 135.2 140.3 (1) Adjusted EBITDA is a non-GAAP Midwestern U.S. Mining Operations 18.3 21.2 25.0 26.3 27.4 measure defined as income (loss) Western U.S. Mining Operations 13.7 17.9 23.8 23.6 24.9 Total U.S. Mining Operations 145.1 177.9 191.4 185.1 192.6 from continuing operations before Australian Metallurgical Mining Operations 13.4 15.7 17.2 15.0 14.0 deducting net interest expense, Australian Thermal Mining Operations 21.3 20.1 21.0 19.9 19.0 Total Australian Mining Operations 34.7 35.8 38.2 34.9 33.0 income taxes, asset retirement Trading and Brokerage Operations 7.0 15.1 20.2 31.7 22.9 obligation expenses, depreciation, Total 186.8 228.8 249.8 251.7 248.5 depletion and amortization and Revenues (In Millions) reorganization items, net. Adjusted Powder River Basin Mining Operations $ 1,473.3 $ 1,865.9 $ 1,922.9 $ 1,767.3 $ 1,983.0 Midwestern U.S. Mining Operations 792.5 981.2 1,198.1 1,335.5 1,403.7 EBITDA is also adjusted for the Western U.S. Mining Operations 526.0 682.3 902.8 902.3 966.3 discrete items that management Total U.S. Mining Operations 2,791.8 3,529.4 4,023.8 4,005.1 4,353.0 excluded in analyzing each of the Australian Metallurgical Mining Operations 1,090.4 1,181.9 1,613.8 1,773.4 2,187.5 segment’s operating performance Australian Thermal Mining Operations 824.9 823.5 1,058.0 1,131.2 1,316.1 Total Australian Mining Operations 1,915.3 2,005.4 2,671.8 2,904.6 3,503.6 as displayed in the reconciliation. Trading and Brokerage Operations 28.9 52.6 38.8 68.7 200.9 Adjusted EBITDA is used by Other (20.7) 21.8 57.8 35.3 20.0 management as one of the primary Total $ 4,715.3 $ 5,609.2 $6,792.2 $ 7,013.7 $8,077.5 metrics to measure the Company’s Reconciliation of Non-GAAP Financial Measures operating performance. Loss from continuing operations, net of income taxes $ (663.8) $ (1,783.2) $ (695.3) $ (537.3) $ (470.9) Management also believes non-Depreciation, depletion and amortization 465.4 572.2 655.7 740.3 663.4 Asset retirement obligation expenses 41.8 45.5 81.0 66.5 67.0 GAAP performance measures are Asset impairment and mine closure costs 247.9 1,277.8 154.4 528.3 929.0 used by investors to measure the Selling and administrative expenses related to debt restructuring 21.5 — — — -Settlement charges related to the Patriot bankruptcy reorganization — — — 30.6 —Company’s operating performance Change in deferred tax asset valuation allowance related to equity affiliates (7.5) (1.0) 52.3 — —and lenders to measure the Amortization of basis difference related to equity affiliates — 4.9 5.7 6.3 4.6 Company’s ability to incur and Interest income (5.7) (7.7) (15.4) (15.7) (24.5) Interest expense 298.6 465.4 426.6 408.3 402.3 service debt. Adjusted EBITDA is not Loss on early debt extinguishment 29.5 67.8 1.6 16.9 3.3 intended to serve as an alternative Reorganization items, net 159.0 — — — —to U.S. GAAP measures of Unrealized (gains) losses on economic hedges 39.8 9.8 (19.6) 2.7 1.0 Income tax (benefit) provision (94.5) (207.1) 147.4 (197.0) 262.3 performance and may not be Adjusted EBITDA (1) $ 532.0 $ 444.4 $ 794.4 $ 1,049.9 $ 1,837.5 comparable to similarly-titled (1) Adjusted EBITDA (In Millions) measures presented by other Powder River Basin Mining Operations $ 379.9 $ 482.9 $ 509.0 $ 435.4 $ 542.0 companies. Midwestern U.S. Mining Operations 217.3 269.7 306.9 426.0 405.6 Western U.S. Mining Operations 101.6 184.6 266.9 258.0 279.7 Total U.S. Mining Operations 698.8 937.2 1,082.8 1,119.4 1,227.3 Australian Metallurgical Mining Operations (16.3) (18.2) (151.1) (120.0) 238.4 Australian Thermal Mining Operations 217.6 193.6 264.1 270.0 337.7 Total Australian Mining Operations 201.3 175.4 113.0 150.0 576.1 Trading and Brokerage Operations (32.4) 36.8 (4.7) (17.2) 120.7 Other (335.7) (705.0) (396.7) (202.3) (86.6) Adjusted EBITDA (1) 27 $ 532.0 $ 444.4 $ 794.4 $ 1,049.9 $1,837.5