Attached files
| file | filename |
|---|---|
| EX-10.40 - EX-10.40 - JAMBA, INC. | jmba-ex1040_698.htm |
| EX-32.2 - EX-32.2 - JAMBA, INC. | jmba-ex322_8.htm |
| EX-32.1 - EX-32.1 - JAMBA, INC. | jmba-ex321_6.htm |
| EX-31.2 - EX-31.2 - JAMBA, INC. | jmba-ex312_7.htm |
| EX-31.1 - EX-31.1 - JAMBA, INC. | jmba-ex311_9.htm |
| EX-23.1 - EX-23.1 - JAMBA, INC. | jmba-ex231_10.htm |
| EX-21.1 - EX-21.1 - JAMBA, INC. | jmba-ex211_11.htm |
| EX-10.41 - EX-10.41 - JAMBA, INC. | jmba-ex1041_699.htm |
UNITED STATES
SECURITIES AND EXCHANGE COMMISSION
Washington, D.C. 20549
FORM 10-K
|
☒ |
ANNUAL REPORT PURSUANT TO SECTION 13 OR 15(d) OF THE SECURITIES EXCHANGE ACT OF 1934 |
For the fiscal year ended January 3, 2017
OR
|
☐ |
TRANSITION REPORT PURSUANT TO SECTION 13 OR 15(d) OF THE SECURITIES EXCHANGE ACT OF 1934 |
Jamba, Inc.
(Exact name of registrant as specified in its charter)
|
Delaware |
001-32552 |
20-2122262 |
|
(State or other jurisdiction of |
(Commission |
(I.R.S. Employer |
|
incorporation) |
File No.) |
Identification No.) |
3001 Dallas Parkway, Suite 140,
Frisco, Texas 75034,
(Address of principal executive offices)
Registrant’s telephone number, including area code: (469) 294-9600
Securities registered pursuant to Section 12(b) of the Act:
|
Common Stock, par value $.001 per share |
The NASDAQ Stock Market LLC |
Securities registered pursuant to Section 12(g) of the Act:
NONE
Indicate by check mark if the registrant is a well-known seasoned issuer, as defined in Rule 405 of the Securities Act. Yes ☐ No ☒
Indicate by check mark if the registrant is not required to file reports pursuant to Section 13 or Section 15(d) of the Act. Yes ☐ No ☒
Indicate by check mark whether the registrant (1) has filed all reports required to be filed by Section 13 or 15(d) of the Securities Exchange Act of 1934 during the preceding 12 months (or for such shorter period that the registrant was required to file such reports), and (2) has been subject to the filing requirements for the past 90 days. Yes ☐ No ☒
Indicate by check mark whether the registrant has submitted electronically and posted on its corporate Web site, if any, every Interactive Data File required to be submitted and posted pursuant to Rule 405 of Regulation S-T (§232.405 of this chapter) during the preceding 12 months (or for such shorter period that the registrant was required to submit and post such files). Yes ☐ No ☒
Indicate by check mark if disclosure of delinquent filers pursuant to Item 405 of Regulation S-K is not contained herein, and will not be contained, to the best of registrant’s knowledge, in definitive proxy or information statements incorporated by reference in Part III of this Form 10-K or any amendment to this Form 10-K. ☐
Indicate by check mark whether the registrant is a large accelerated filer, an accelerated filer, a non-accelerated filer or a smaller reporting company. See the definitions of “large accelerated filer,” “accelerated filer” and “smaller reporting company” in Rule 12b-2 of the Exchange Act (check one):
|
Large accelerated filer |
☐ |
|
Accelerated filer |
☒ |
|
Non-accelerated filer |
☐ |
(Do not check if a smaller reporting company) |
Smaller reporting company |
☐ |
Emerging growth company ☐
If an emerging growth company, indicate by check mark if the registrant has elected not to use the extended transition period for complying with any new or revised financial accounting standards provided pursuant to Section 13(a) of the Exchange Act. ☐
Indicate by check mark whether the registrant is a shell company (as defined in Rule 12b-2 of the Act). Yes ☐ No ☒
The aggregate market value of the registrant’s common stock, $0.001 par value per share, held by non-affiliates as of the last day of the registrant’s second fiscal quarter ended June 28, 2016 was $76,692,507 based upon the closing sales price of registrant’s common stock on such date). For purposes of this disclosure, shares of common stock held by persons who held more than 5% of the outstanding shares of common stock and shares held by officers and directors of the registrant have been excluded in that such persons may be deemed to be affiliates. This determination of affiliate status is not necessarily a conclusive determination for other purposes.
The number of shares of common stock of Jamba, Inc. issued and outstanding as of February 2, 2018 was 18,447,023 and 15,588,206, respectively.
DOCUMENTS INCORPORATED BY REFERENCE
None
ANNUAL REPORT ON FORM 10-K
FISCAL YEAR ENDED JANUARY 3, 2017
|
Form 10-K Item No. |
|
Name of Item |
|
Page |
|
Item 1. |
|
|
4 |
|
|
Item 1A. |
|
|
15 |
|
|
Item 1B. |
|
|
26 |
|
|
Item 2. |
|
|
26 |
|
|
Item 3. |
|
|
28 |
|
|
Item 4. |
|
|
28 |
|
|
Item 5. |
|
|
29 |
|
|
Item 6. |
|
|
31 |
|
|
Item 7. |
|
MANAGEMENT’S DISCUSSION AND ANALYSIS OF FINANCIAL CONDITION AND RESULTS OF OPERATIONS |
|
33 |
|
Item 7A. |
|
|
51 |
|
|
Item 8. |
|
|
52 |
|
|
Item 9. |
|
CHANGES IN AND DISAGREEMENTS WITH ACCOUNTANTS ON ACCOUNTING AND FINANCIAL DISCLOSURE |
|
53 |
|
Item 9A. |
|
|
53 |
|
|
Item 9B. |
|
|
55 |
|
|
Item 10. |
|
|
56 |
|
|
Item 11. |
|
|
64 |
|
|
Item 12. |
|
SECURITY OWNERSHIP OF CERTAIN BENEFICIAL OWNERS AND MANAGEMENT AND RELATED SHAREHOLDER MATTERS |
|
87 |
|
Item 13. |
|
CERTAIN RELATIONSHIPS AND RELATED TRANSACTIONS, AND DIRECTOR INDEPENDENCE |
|
90 |
|
Item 14. |
|
|
91 |
|
|
Item 15. |
|
|
92 |
|
|
|
|
|
98 |
|
2
Special Note Regarding Forward-Looking Statements
This Annual Report on Form 10-K contains forward-looking statements within the meaning of Section 27A of the Securities Act of 1933, as amended, and Section 21E of the Securities Exchange Act of 1934, as amended. You can identify these statements by forward-looking words such as “may,” “will,” “would,” “could,” “should,” “might,” “project,” “potential,” “forecast,” “designed,” “goal,” “approximately,” “expect,” “anticipate,” “contemplate,” “believe,” “estimate,” “intend,” “plan,” and “continue” or the negative of those words or words of similar meaning. Any statement that is not a historical fact, including any other estimates, projections, future trends and the outcome of events that have not yet occurred, is a forward-looking statement. Examples of such statements include references to accelerated growth, new store openings, Company Store comparable sales, expense management and the like. You should read statements that contain these words carefully because they:
|
|
• |
discuss future expectations; |
|
|
• |
contain projections of future results of operations or financial condition; or |
|
|
• |
state other “forward-looking” information. |
We believe it is important to communicate our expectations to our shareholders. However, there may be events and circumstances in the future that we are not able to accurately predict or over which we have no control. The risk factors and cautionary language discussed in this document outline examples of risks, uncertainties and events that may cause actual results to differ materially and adversely from the expectations described in the forward-looking statements, including among other things:
|
|
• |
our business strategy and financial performance, including our transition to an asset-light business model and relocation of our corporate headquarters and data center; |
|
|
• |
our revenue and customer volatility based upon weather and general economic conditions; |
|
|
• |
the operating results of our franchisees; |
|
|
• |
fluctuations in various food and supply costs; |
|
|
• |
competition and other risks related to the food services business; |
|
|
• |
our ability to retain our executive management team and key employees; and |
|
|
• |
other factors discussed in the “Risk Factors” and “Management Discussion and Analysis of Financial Condition and Results of Operations” portion of this annual report. |
You are cautioned not to place undue reliance on these forward-looking statements, which speak only as of the date of this document.
All forward-looking statements included herein are expressly qualified in their entirety by the cautionary statements contained or referred to in this section. Except to the extent required by applicable laws and regulations, we undertake no obligation to update these forward-looking statements to reflect events or circumstances after the date of this document or to reflect the occurrence of unanticipated events.
You should be aware that the occurrence of the events described in the “Risk Factors” portion of this annual report, the documents incorporated herein and our other SEC filings could have a material adverse effect on our business, prospects, financial condition or operating results.
3
Background of Jamba, Inc.
Jamba, Inc. through its wholly-owned subsidiary, Jamba Juice Company, is a healthful, active lifestyle brand with a robust global business driven by a portfolio of franchised and company-owned Jamba Juice ® stores and Jamba Juice ExpressTM formats. The Jamba ® brand was created by founder Kirk Perron to inspire and simplify healthy living. This mission is alive today in the more than 900 retail locations globally and in Jamba branded products. We are a leading restaurant retailer of “better-for-you” specialty beverage blends and food offerings which include flavorful, whole fruit and vegetable smoothies, fresh squeezed juices and juice blends, Energy (smoothie) Bowls, signature “boosts”, shots and a variety of food items including; hot oatmeal, breakfast wraps, sandwiches, Artisan Flatbreads, baked goods and snacks.
Jamba, Inc. was incorporated in Delaware on January 6, 2005 as a blank check company formed to serve as a vehicle for the acquisition of a then unidentified operating business. On July 6, 2005, Jamba, Inc. consummated its initial public offering. On March 10, 2006, Jamba, Inc. entered into an Agreement and Plan of Merger with Jamba Juice Company, which first began operations in 1990. The merger between Jamba, Inc. and Jamba Juice Company was completed on November 29, 2006. The Company’s headquarters were located in Emeryville, California and were relocated to Frisco, Texas in the fourth quarter of fiscal year 2016.
Unless the context otherwise requires, Jamba, Inc., the registrant, together with Jamba Juice Company, are referred to in this Form 10-K annual report (“Form 10-K”) as the “Company”, “Jamba Juice”, “Jamba”, “we”, “us” and “our.” Information regarding the Company’s fiscal periods is included in Item 7, “Management’s Discussion and Analysis of Financial Condition and Results of Operations.”
Fiscal Year
Our fiscal year ends each year on the Tuesday closest to December 31st and therefore we have a 52 or 53 week fiscal year. Fiscal Year 2016 was a 53 week fiscal year, ended on January 3, 2017, with the fourth quarter comprised of 14 weeks. Fiscal Years 2015 and 2014, were 52 week fiscal years, ended on December 29, 2015 and December 30, 2014, respectively.
Narrative Description of Business
As of January 3, 2017, there were 909 Jamba Juice stores globally, consisting of 66 Company-owned and operated stores, all located in the United States (“Company Stores”), 773 franchisee-owned and operated stores (“Franchise Stores”) in the United States and 70 Franchise Stores in international locations (“International Stores”), collectively the (“Jamba System”). During 2015, we substantially completed the move from a primarily company-store to a franchise-business model by refranchising 179 locations. Currently, approximately 93% of our stores are owned and operated by franchisees.
Our Strategic Priorities
Fiscal year 2016 was a year of transition for the Jamba, Inc. business and brand. Dave Pace, Chief Executive Officer (“CEO”) joined the company in March 2016 and outlined a plan for transformation of the business. The plan focuses on five core strategies, amplifying the position Jamba holds as an iconic lifestyle brand and a best-in-class franchisor, which highlights the brand’s commitment to increase shareholder value. With the transition to an asset-light business model now complete, the organization focused on hiring a new leadership team with deep food service experience. While the majority of fiscal year 2016 we executed against the existing business plan, the newly established leadership team made large strides in building the foundation needed to drive the five core strategies into the future, beginning in fiscal 2017.
4
The transition initiatives in fiscal 2016 included the move into our new offices in Frisco, Texas, reenergizing our franchise system and rebuilding the leadership and support teams that were affected by the move from Emeryville, California. As part of the transition, approximately 10% of our support center team members relocated to Frisco. The remaining 90% of our support center team are new to the organization, including many of the individuals on the senior leadership team. More specifically, Marie Perry, previously the interim CFO for Brinker International, joined Jamba in the second quarter as Chief Financial Officer (“CFO”). In March 2017, Joe Thornton joined Jamba as our Chief Operating Officer, and in November 2017, Claudia Schaefer joined Jamba as our Chief Marketing Officer. With the hire of Mr. Thornton and Ms. Schaefer, our Executive Team is fully in place.
The Company’s move to Frisco, Texas, a Dallas suburb, is designed to position the Company for sustainable, long-term growth and thus better serve Jamba’s franchise system and unlock emerging market growth potential. The relocation also served as a catalyst for cultural transformation. The team re-grounded their strategy in the roots of the brand and hired a support center team aligned with both the mission and core values of Jamba and with deep industry knowledge and experience. The new “Jamba Whirl’d Support Center” includes 25,000 square feet of office and collaboration space as well as a world-class test kitchen for product innovation and optimization.
With the transition complete in late 2016, the organization is focused on generating results and creating shareholder value through the transformation of Jamba. The five key strategies include:
|
|
• |
Build an Iconic Global Brand; |
|
|
• |
Establish a Customer and Store-Centric Operating Environment; |
|
|
• |
Drive Sales and Transactions through Innovation; |
|
|
• |
Improve Store Profitability through Simplification; and |
|
|
• |
Expand Our Global Footprint. |
Build an Iconic Global Brand
During fiscal 2016, brand activities were predominately guided by the existing brand strategy. That strategy included ongoing efforts to build total brand value as we continue to position Jamba as a leading global health and wellness, lifestyle brand. With 93% of our stores now franchisee-owned, we have increased our focus on building the brand on a local level, leveraging multi-channel brand marketing tactics, including the expansion of consumer loyalty programs, the development of engaging local marketing promotions and high-performing social media communications. Local brand activation plays a critical role and we believe it will be a significant revenue and consumer traffic driver for our franchisees. By providing our franchisees with tools and technologies that target their guests through email, social media, radio and out-of-home advertising, we are helping them reach new and lapsed consumers in their immediate trade areas. In late 2016, the field marketing team was re-structured to provide additional support to franchise partners.
In late fiscal 2016, the brand strategy began a pivot in an effort to differentiate Jamba from the competitive set and engage guests through a health benefit driven message. We focused on sharing the benefits of blending with our existing, lapsed and potential guests. This shift demonstrated our intent to return to a brand strategy guided by our mission of inspiring and simplifying healthy living. Ongoing, innovative product development, will allow us to meet the needs of today’s increasingly health-conscious and time-starved consumer. The innovation team hired an on-staff nutritionist that works to establish a nutritional point of view for product offerings. We will continue to focus on product innovation offerings that expand our “healthy on the go” offerings across all parts of the day.
By leveraging technology and digital services such as text messaging, email and local social media tools, we enhance and simplify the Jamba experience for today’s socially connected, time-constrained consumers. We continue to upgrade the features of our Jamba Juice mobile application (“app”), helping customers locate stores, order ahead, speed up transactions and improve the online and in-store experience. With more than 2 million members, our Jamba Insider Rewards (“JIR”) program provides incentives for our most loyal customers to make increased visits to Jamba stores. Through JIR, we distribute timely emails to our members informing them of new products and promotions. Increased segmentation efforts in late fiscal 2016 yielded stronger engagement with existing guests and the new digital marketing team outlined plans to elevate the consumer journey in the digital space.
5
We are actively engaged in the most popular social media platforms, delivering engaging content and leveraging the power of influencers to actively promote Jamba to their own followers in Facebook®, YouTube®, Pinterest® and other social media platforms. These influencers post about Jamba’s nutritional benefits in an authentic voice, exponentially amplifying our own marketing communications and reaching more consumers most interested in health and wellness. We also continue to build a strong following on Facebook®, Twitter® and Instagram® with postings that receive increasing favor with Jamba fans. Our YouTube channel attracts fans and increases awareness with fun and informative videos of our high-profile influencers and celebrity athletes. Late in the year, we developed a revised social media engagement strategy focused on developing authentic and sincere relationships within our social communities.
Giving back to the community is a hallmark of the brand and service to our communities has been a consistent focus of Jamba from the Company’s beginning. We continued that work in 2016. Our work in the community ladders up to our mission. We drive awareness of the need to encourage strong dietary and fitness habits in kids through our Team Up For a Healthy America program and through partnerships with the American Heart Association®, National Gardening Association and the GENYOUth Foundation. Our Jamba fundraising card helps support schools in Jamba markets across the country. Additionally, our franchise partners are actively involved in their local communities, raising awareness and providing much needed funding for organizations including Meals on Wheels, Juvenile Diabetes Research Foundation, St. Jude's, National Breast Cancer Foundation and other national and local organizations focused on making our communities healthier.
Jamba launched several marketing campaigns during the year, which are designed to drive significant traffic into our Franchise and Company Stores. We worked closely with local franchisees on numerous local promotions designed to increase trial and awareness.
Establish a Customer and Store-Centric Operating Environment
In 2016, we began to reengage and reenergize our franchise system, field and store teams. Establishing a leadership team with deep food service experience was central to this initiative and the team quickly worked to reprioritize initiatives through the lens of the franchise partners and guests.
As the newly formed leadership team outlined key priorities in each discipline, franchise operators were asked to participate in problem solving, prioritization of initiatives and sharing of best practices. By leveraging franchise operator knowledge and spending time in stores with operating partners and guests, the team has worked to quickly reduce friction in the guest experience and build trust within the franchise system. The Franchise Advisory Council (“FAC”) is also leveraged to ensure the needs of the franchise system were prioritized effectively.
In 2016, Learning and Development systems were evaluated and investments have been made to improve field training by providing in-market support for large brand initiatives. Additionally, the field marketing team was restructured and goals were aligned with FAC approved success metrics. These changes will strengthen the franchisor/franchisee relationship and ensure support center team members are aligned with franchise partner needs.
Finally, after a thorough evaluation of each brand extension within the Jamba system, decisions were made to eliminate any under-performing, non-retail programs. This included an exit from Ready to Drink and Energy products in early fiscal 2016 and JambaGO® in the fourth quarter of 2016. These decisions allow the support center team to focus on the success of company and franchise retail operations.
Drive Sales and Transactions through Innovation
Our long-term growth prospects have been largely driven by our product innovation around our core offerings of smoothies, juices and bowls. In fiscal 2016, product innovation remained a high priority, but our strategy shifted to ensure future innovation efforts extend beyond product innovation and include innovation in technology, including digital marketing and refreshed operational systems.
6
Our product innovation team transitioned fully late in the year and is working to establish a revised innovation pipeline focused on leveraging the core equity of the blender to unlock revenue through expansion of categories and parts of the day. The team, composed of food scientists, quality assurance specialists, nutritionists and food industry experts, is continually developing and testing new and improved menu items that support not only the integrity of the Jamba Juice brand, but our mission of inspiring and simplifying healthy living.
Beyond product innovation, a new IT and digital roadmap was outlined in late 2016. The roadmap outlines nine key projects that will serve to strengthen store operations, improve profitability and enhance the consumer journey in both the in-store and online environments. Digital transformation will begin in fiscal 2017 and will ensure Jamba remains a leader in category and will unlock revenue opportunities across multiple platforms. Improvements to our app, website, customer relationship management and digital marketing channels are central to this strategy.
Improve store profitability through simplification
With the shift to an asset-light business model, we are highly focused on improving franchisee profitability and 4-wall margins. Benefits captured in fiscal 2016 primarily resulted from supply chain efficiencies and simplification of in store product execution.
In fiscal 2016, we created a task force to identify, test and implement opportunities across all expense categories. The task force includes cross functional experts, best in system franchise operators, and operations leadership. We initially identified a focused set of near term opportunities to benefit Jamba in fiscal 2017, and are building a robust pipeline of initiatives for 2017 and beyond. Implementation of the successful opportunities identified will be phased in to the system to ensure savings from each initiative are captured.
The renewed focus on a store centric operating model has created a strong franchisee/franchisor relationship that will prove beneficial to capturing the opportunities in front of us.
Expand our global footprint
As we continue on our path as an asset-light business, our focus will be on expanding our retail footprint globally through franchising. As described below, our focus is on domestic growth and on both traditional and non-traditional store formats. In addition, in fiscal 2016, we refocused our international expansion to our Asia and Middle East markets and exited our previous presence in Canada. Jamba Juice store locations at the end of fiscal 2016 were comprised of approximately 7% Company Store locations and 93% Franchise locations, globally.
Jamba Juice - Domestic
We have a portfolio of flexible store formats that can be utilized in a number of different venues. We generally categorize our stores as either traditional or non-traditional locations. A traditional location is characterized as a business premise that exists primarily as a Jamba Juice store. Traditional stores average approximately 1,000 - 1,200 square feet in size. These stores are located either in major urban centers or in suburban strip mall centers. As of January 3, 2017, there were 599 traditional Jamba Juice store locations. A non-traditional location is characterized as a Jamba Juice store located within another primary business, in conjunction with another business or at institutional settings, such as colleges and universities, entertainment venues, shopping malls, transportation centers, supermarkets and airports. A “captive” audience is a common characteristic of non-traditional locations. We believe one benefit of the development of non-traditional stores is to increase awareness of the Jamba Juice brand to complement the traditional stores in the area. As of January 3, 2017, there were 240 non-traditional Jamba Juice store locations.
We announced a franchise incentive program designed to accelerate new store openings in 2017, including our new Drive-Thru format which is intended to expand our available trade-areas by increasing accessibility to the market. We believe this program will spur additional growth of the incentivized store formats.
7
We continue to innovate in the design of traditional and non-traditional stores. Our goal is to vary the size and format of our stores to allow us to locate them in or near a variety of settings. Our flexibility in store construction enables us to develop stores in a wide range of venues, broadening the visibility of the Jamba brand and giving more customers easier, more convenient access. We believe format flexibility will help us to attract qualified franchisees and offer them the potential to earn a higher return on their investment in capital expenditures. In 2016, we continued the expansion of the refresh and remodel program for our Company Stores in order to provide a contemporary and fresh experience for our customers. We continue to refresh stores, which includes upgrading the stores’ facilities to effectively and efficiently serve our blended, whole food and premium juice platforms.
The Jamba Juice Express concept was launched in 2012. The concept is designed to target venues with a smaller footprint than our historical, non-traditional store. Jamba Juice Express units offer a limited menu of the brand’s top selling smoothies and juices as compared to our other store formats. Our Jamba Juice Express platform is an in-fill strategy for venues such as colleges and universities, grocery stores, hospitals and business cafeterias where the Jamba brand is already a known presence in the market. As of January 3, 2017, there were 47 Jamba Juice Express locations open in 21 states. Due to the nature of the business format and smaller footprint, an Express unit generates a smaller financial store contribution than other formats. To better reflect the key contributors of new store development, Express units will be excluded from store counts, beginning in the first quarter of 2017.
As of January 3, 2017, we had 839 Jamba Juice store locations in the United States, operating in 35 states and Washington, D.C., consisting of 66 Company Stores and 773 Franchise Stores. We lease the real estate for all of our Company Stores. Our market planning has shown that there is potential for a total of at least 2,700 Jamba Juice stores in the United States which would meet our current store opening criteria. During fiscal 2016, 54 new Franchise Stores opened, 30 Franchise Stores closed and we completed the refranchise of one Company Store.
Domestic Franchise Opportunity
Through our franchising program, we offer franchisees choices in store location, format and number of stores they wish to operate including traditional “stand alone” stores and non-traditional store venues such as mall, university, supermarket or transportation center locations. Furthermore, we offer franchisees the opportunity to reserve larger territories by entering into multi-unit development agreements which grant the franchisee exclusive rights to develop and operate a specified number of stores within a specified period of time and geographic area.
As of January 3, 2017, we had 27 development agreements that contain rights to develop additional Franchise Stores. The exclusive territories covered by these agreements include selected markets in the states of Arizona, California, Delaware, Florida, Georgia, Michigan, Minnesota, Missouri, Nevada, New York, North Carolina, Oregon, Pennsylvania, Tennessee, Texas, Utah, Washington and Wisconsin. In 2016, as part of our ongoing east coast expansion, we entered into development agreements which will yield 24 new locations in the greater Detroit, Michigan, Philadelphia, Pennsylvania and Midland, Texas markets.
To help maximize the growth of our non-traditional franchise development, we continue to strengthen our relationships with beverage and food concessionaires operating at venues such as colleges, universities, airports and other transportation centers, as well as other retail and entertainment venues. In addition to our own efforts, we are regularly approached by concessionaires and contract feeders whose independent research has identified us as desired for non-traditional venues where they have secured exclusive development rights from venue owners. When it fits our expansion strategies, these opportunities are incorporated into our development plans.
Our comprehensive market planning and site selection process helps guide the successful execution of our growth strategy. We have processes for identifying, analyzing and assigning undeveloped markets for Franchise Store development. Once a market is selected, we carefully screen trade areas for demand based on demographic, psychographic and Jamba Juice specific variables to assess the risk of developing a store or permitting a franchisee to do so. We review trade areas to ensure that they meet our guidelines for new store development and begin the site selection or approval process. Once a trade area is approved, we carefully screen prospective locations for visibility, traffic patterns, ease-of-use, occupancy costs and co-tenancy for potential Franchise Store locations. Our expansion strategy involves using this market planning and site selection process to leverage areas of demand within each market. We use this approach as a means to create critical mass within specific geographic areas of demand, in order to increase brand awareness and improve operating and marketing efficiencies for Franchise Stores while leveraging the costs associated with regional supervision. Distribution efficiencies can also be realized through this strategy.
8
International Franchising Opportunity
Our international partners work closely with us to build the Jamba Juice brand and implement the Jamba Juice system in their local geographic markets, as well as to maximize revenue and margin growth opportunities, recognizing commercial, cultural and dietary diversity in each market. There were 70 International Stores as of January 3, 2017, with stores located in Indonesia, South Korea, the Philippines, Mexico, Taiwan and the Middle East. As of January 3, 2017, we had six master developers with commitments to open 307 stores internationally.
We anticipate that global new unit development will continue to be a contributor to achieving our stated long term objectives. At the end of fiscal 2016, we had international master development agreements with partners in Indonesia, Thailand, South Korea, the Philippines, Mexico, Taiwan, and the countries of the Gulf Cooperation Council (Bahrain, Kuwait, Oman, Qatar, Saudi Arabia and the United Arab Emirates).
We believe our brand and products have international appeal and we continue to engage in discussions with additional interested partners regarding the expansion of Jamba Juice stores into new international markets. The success of further international expansion will depend on, among other things, local acceptance of the Jamba Juice concept and menu offerings, regional supply chain infrastructure to drive profitable growth for our partners and our ability to attract qualified franchise partners. Our international developer agreements take the form of development and franchise agreements under which we typically receive an initial territory fee, store opening fees and ongoing royalty revenues based on a percentage of sales.
Early progress on our five core strategies has reenergized our company and franchise system and have provided focus for our leadership team. In fiscal 2017, we anticipate that the business will more fully realize the benefits from the work accomplished against each strategy. Work will continue against these core strategies and we expect that further benefits to the business will be realized.
Domestic Store Operations
Franchise Store Management
We continuously partner with franchisees to ensure excellence in Franchise Store operations, principally through our Franchise Business Consultants ("FBCs"). FBCs are Company team members that work closely with franchise owners to review the financial health, strength of the team, best practices and procedures of our franchisees. We engage with our system through a Franchise Advisory Council (“FAC”), which formalizes a channel of communication through a representative group of franchisees to provide advice, counsel and input to us on all aspects impacting our business. Our franchise agreement calls for franchise partners to meet certain operational and maintenance requirements intended to align the operating processes system-wide around a common set of standards. Performance is monitored regularly by the FBCs, who in addition to ensuring operational standards, provide feedback, coaching and support, as needed.
Company Store Management
We believe operational excellence throughout the Jamba system is vital to our success. Our field and store operations teams are responsible for maximizing the performance of our Company Stores across the system. We recruit and retain leaders with broad experience in management within our industry. Our field leadership consists of two Operational Directors and District Managers to support our Company Store operations. Our strong core values have contributed to a highly tenured field team that is deeply experienced and invested in the health of the business and the brand.
Our Store Excellence Program is designed to improve operational execution and performance by establishing comprehensive standards, which we expect all of our stores to achieve and maintain. In addition, we implemented a bonus program that offers Company Store managers rewards on achievement of sales and profit goals. These factors continue to positively impact customer satisfaction and help ensure that all stores in the Jamba System are delivering against the key drivers of customer satisfaction on a consistent basis. We believe team members are the key to our success and support the development of a culture that fosters personal interaction, mutual respect, trust, empowerment, enthusiasm and commitment.
9
Maintaining a culture and a management style that embodies healthy, active lifestyles in an authentic, fun, friendly and efficient manner in Company Stores, as well as Franchise Stores, is essential as we continue to expand, and we believe that it is critical to developing our brand and ensuring our continued success.
Training
Our training programs ensure all team members in the system have the knowledge needed to deliver excellence in guest experience and connect team members to our mission. We conduct training through a variety of programs for franchise partners, team members, support center staff and our leadership team on a regular basis. We are dedicated to providing a meaningful experience for all employees, with ample opportunity to develop leadership skills as they build a career at Jamba. All of our training programs reinforce the importance of prioritizing the guest experience and building sales through menu knowledge. Training materials and best practices are available to our franchisees to help create, preserve and support a singular culture of excellence within all of the stores that comprise our system. Additionally, in 2016 we continued to build our online training resources through Launchpad, an online training eco-system designed to elevate engagement and deliver timely and cost effective training resources to our team and franchise partners.
Recruiting and Retention
We carefully screen potential team members to ensure that they embody our core values and fit into our culture. By maintaining this emphasis and encouraging responsibility and accountability at every level, we believe that we have created a sense of team member loyalty and an open and interactive work environment, resulting in a highly passionate workforce. Our team members are paid competitive wages and are offered opportunities for advancement. In addition to competitive wages, store managers are eligible for performance-based bonuses. In order to preserve a singular culture within the stores that comprise the Jamba System, we share best practice information, qualifications and other relevant information to assist franchisees with hiring and retention.
Advertising and Marketing
In 2016, much of our advertising and marketing efforts focused on product innovation and transformation of our systems and digital eco-system. We reaffirmed our commitment to providing healthier food and beverage options to consumers, specifically by leveraging our historic core equity of blending. In Q4 2016, we initiated a campaign designed to start consumer conversations about the benefits of blending.
Through a variety of product centric innovations, we focused consumers’ attention on the fresh fruits and vegetables that are used to make Jamba juices, smoothies and bowls, underscoring our commitment to providing healthier food and beverage options and fulfilling our mission of inspiring and simplifying healthy living. We continued our partnership with the technology company Spendgo® to provide consumers with an easy-to-use loyalty solution.
Jamba marketing, promotional and public relations activities are designed to promote the Jamba brand image and differentiate it from competitors. Marketing and promotional efforts focus on providing consumers with simple, easy-to-adopt solutions for pursuing a healthy active lifestyle and we continuously endeavor to improve our social responsibility and environmental practices to achieve long-term sustainability. We believe our marketing efforts in 2016 extended our reach and relevance to consumers. By improving our use of technology, expanding our reach into various lifestyle activities, helping communities and guiding our nation’s youth to improve health and wellness, we have continued to inspire and simplify healthy living and have made progress toward our goal of being a leading health and wellness brand.
Product Supply
We are committed to providing only the finest smoothies, juices, bowls and other food products. Smoothie, juice and bowl products depend heavily upon supplies of fresh and individually quick-frozen (“IQF”) fruit and vegetables. We have an established nationwide fresh produce supply chain in order to facilitate our made-to-order freshly squeezed juice platform. The quality of each beverage depends to a large degree on the quality of the basic
10
fruit and vegetable ingredients from which it is made. It is essential that the supply of fruit and vegetables is of the highest quality and is consistent throughout the year. To achieve these goals, we purchase our projected requirements for the coming year from suppliers at the height of the season. The supply and price of fresh and IQF fruit and vegetables are dependent upon the supply and demand at the time of purchase and are subject to volatility. Supply and price can be affected by multiple factors in the producing regions, including weather, natural disasters and national/regional political and economic conditions.
We buy certain produce and dairy using fixed priced or to-be-fixed priced purchase commitments to secure adequate supply of quality ingredients for our products. As a result, we have purchase obligations with certain suppliers for certain produce and dairy for various terms typically ranging from one year to three years. We depend on our relationships with our suppliers for our supply of produce, dairy and other products. While two distributors accounted for approximately 92% of the supplies delivered to our Company Stores, and also service our Franchise Stores, we believe, based on our established relationships with our suppliers, the risk of non-delivery on our purchase commitments is remote.
Our supply chain, purchasing and product organization are funded by all stores across the Jamba System. This funding contributes to the cost of system-wide procurement and management of our supplies and supports our suppliers. The program allows for cost recovery of certain products purchased by Company Stores and Franchise Stores.
Competition
The retail beverage and food industry remains highly competitive and fragmented. Stores compete based on a number of factors, including quality, price-value relationships, customer service, name recognition, employee hiring and retention and location. We compete with international, national, regional and local retailers of beverage and food products, including quick service restaurants/fast food establishments, coffee shops, juice bars, donut shops, frozen yogurt shops and grocery stores. Competition in the beverage and food market is fragmented, and increasingly so, and a major competitor with substantially greater resources than us could enter the market at any time and compete directly against Jamba Juice stores.
We compete most directly with regional smoothie stores, most of which are franchises of other smoothie brands. The rising popularity of convenient and healthy food items resulted in increased competition from non-smoothie retailers as they increased their offerings of smoothies and other juice-related products, and as we increase our food offerings, we have placed ourselves into direct competition with other quick serve food concepts with well established businesses.
Additionally, we face increasing competition from specialty juice bars and stores, which focus on made-to-order juices, juice blends, cold-press juices and fasting/cleansing packages. Many of these brands have cold-press direct-to-consumer capabilities that multiply the geographic reaches of their stores.
We also face intense competition from both restaurants and other specialty retailers for suitable sites for new stores and qualified personnel to operate both new and existing stores. There can be no assurance that we or our franchisees will be able to continue to secure adequate sites at acceptable rent levels or that we or franchisees will be able to attract a sufficient number of qualified personnel to operate our stores.
Government Regulation and Environmental Matters
Government Regulation. We and our franchisees are subject to extensive and varied federal, state and local government regulation, including regulations relating to public health and safety and zoning codes. We operate each of our stores in accordance with standards and procedures designed to comply with applicable codes and regulations. However, if we or our franchisees could not obtain or retain food or other licenses, it would adversely affect our operations. Although we have not experienced, and do not anticipate, any significant difficulties, delays or failures in obtaining required licenses, permits or approvals, any such problem could delay or prevent the opening of, or adversely impact the viability of, a particular store or group of stores.
11
California and other states and local jurisdictions have enacted laws, rules, regulations and ordinances which may apply to the operation of a Company Store or a Franchise Store, including those which (a) establish general standards, specifications and requirements for the construction, design and maintenance of the store premises; (b) regulate matters affecting the health, safety and welfare of our customers, such as general health and sanitation requirements for restaurants; employee practices concerning the storage, handling, cooking and preparation of food; special health, food service and licensing requirements; restrictions on smoking; exposure to tobacco smoke or other carcinogens or reproductive toxicants and saccharin; availability of and requirements for public accommodations, including restrooms; (c) set standards pertaining to employee health and safety and mandatory health insurance; (d) set standards and requirements for fire safety and general emergency preparedness; (e) regulate the proper use, storage and disposal of waste, insecticides and other hazardous materials; (f) establish general requirements or restrictions on advertising containing false or misleading claims, or health and nutrient claims on menus or otherwise, such as “low calorie”, “healthy” or “organic”; (g) establish requirements concerning withholdings and employee reporting of taxes on tips; (h) regulate the amount or type of ingredients in food and beverages; and (i) regulate or ban the use of particular packaging materials.
In order to develop and construct more stores, we, or our franchisees, need to comply with applicable zoning, land use and environmental regulations. Federal and state environmental regulations have not had a material effect on our operations to date, but expansion of our menu offerings or more stringent and varied requirements of local governmental bodies with respect to zoning, land use and environmental factors could delay or even prevent construction and increase development costs for new stores. We, and our franchisees, are also required to comply with the accessibility standards mandated by the U.S. Americans with Disabilities Act, which generally prohibits discrimination in accommodation or employment based on disability. We may, in the future, have to modify stores, for example, by adding access ramps or redesigning certain architectural fixtures, to provide service to or make reasonable accommodations for disabled persons. While these expenses could be material, our current expectation is that any such action will not require us to expend substantial funds.
We are subject to the U.S. Fair Labor Standards Act, the U.S. Immigration Reform and Control Act of 1986 and various federal and state laws governing various matters including minimum wages, overtime meal and rest periods, accommodations to certain employees and other working conditions. Complying with these rules subjects us to substantial expense and can also expose us to liabilities from claims for non-compliance. In addition, we and our franchisees pay a significant number of our hourly staff at rates consistent with, but higher than, the applicable federal, state or local minimum wage. Accordingly, increases in the minimum wage would increase our labor cost. We are also subject to various laws and regulations relating to our current and any future franchise operations. See “Risk Factors - Governmental regulation may adversely affect our ability to open new stores or otherwise adversely affect our existing and future operations and results.”
We are also subject to various federal and state laws that regulate the offer and sale of franchises and aspects of the licensor-licensee relationships. Many state franchise laws impose restrictions on the franchise agreement, including the duration and scope of non-competition provisions, the ability of a franchisor to terminate or refuse to renew and the ability of a franchisor to designate sources of supply. The Federal Trade Commission, or the FTC, and some state laws also require that the franchisor furnish to prospective franchisees a franchise disclosure document that contains prescribed information and, in some instances, require the franchisor to register the franchise offering.
Environmental Matters
We and our franchisees are subject to federal, state and local environmental laws and regulations concerning the use of, among others, polystyrene products, and several counties in which our stores are located have already banned the use of our polystyrene cups. We continued to make progress on certain eco-sustainability initiatives first launched in 2009, including phasing out the use of polystyrene cups, as well as increasing the use of recyclable products and reducing waste. At the beginning of 2016 we launched plastic cups, which are more easily recycled than the double-walled coated paper cups we introduced in 2013. Our other green initiatives include the use of more environmentally friendly packaging for our cup carriers, oatmeal cups and lids, breakfast clear cups and lids, spoons and napkins, all of which are made from recycled material. We have also reduced the amount of corrugated cardboard used for bulk shipping, reduced labeling requirements, and reduced freight, resulting in lower fuel emissions. We have established several optimization programs to reduce waste, such as participation in recycling and composting programs for our food waste, where it is feasible for us to do so.
12
We own and/or have applied to register numerous trademarks and service marks in the United States and in other jurisdictions throughout the world. Some of our trademarks, including Jamba Juice ® and the Jamba logo are of material importance to the Company. The duration of trademark registrations varies from country to country. However, trademarks are generally valid and may be renewed indefinitely as long as they are in use and/or their registrations are properly maintained. In addition, the Company has registered and maintains numerous Internet domain names, including “jamba.com” and “jambajuice.com”.
Management Information Systems
Each Company Store has computerized point-of-sale registers, which collect transaction data used to generate pertinent information, including sales transactions and product mix. Additionally, the point-of-sale system is used to authorize, batch and settle credit card data. All product prices are programmed into the point-of-sale register from the Company’s corporate office. Franchise Stores generally use the same point-of-sale registers as Company Stores, but may elect to use alternative systems provided Company approval and certain information is shared with the Company. Franchisees set their own menu prices.
Company Stores use the Company’s licensed labor management software to record employee time clock information, schedule labor and provide management reports. Company Stores and many Franchise Stores use the Company’s licensed food cost management software to improve inventory management and provide management reports.
Our continued focus on technological and procedural enhancements, in areas such as labor and inventory management, has relieved our store managers from manual administrative tasks and enables them to better focus on delivering exceptional customer service.
Seasonality
Our business is subject to day-to-day volatility based on weather and varies by season. A significant portion of the Company’s revenue is realized during the second and third quarters of the fiscal year, which include the summer months. The fourth quarter of the fiscal year, which encompasses the winter months and the holiday season, has traditionally been our lowest revenue volume quarter. Our business will likely continue to be subject to seasonal patterns for the foreseeable future, given that the largest portion of our sales continues to be from the sale of smoothies during the warmer parts of the year. Because of the seasonality of the business, results for an individual quarter are not necessarily indicative of the results, which may be achieved for the full fiscal year.
Executive Officers
Our executive officers, their respective ages and positions and descriptions of their business experience are set forth below. There are no family relationships among any of the executive officers named below.
David A. Pace, Chief Executive Officer, age 58
Mr. Pace is one of our directors as well as our Chief Executive Officer, and, as such, his biographical information is included below under Item 10 “Directors, Executive Officers and Corporate Governance”.
Marie L. Perry, Executive Vice President, Chief Financial Officer and Chief Administrative Officer, age 52
Ms. Perry has served as the Company’s Chief Financial Officer, Executive Vice President and Chief Administrative Officer since August 2016 and served as the Company’s Executive Vice President, Finance, from May 2016 to August 2016. From 2003 to 2016, Ms. Perry held roles leading all aspects of the Brinker International finance team including having served as interim CFO during a 12-month period, and most recently, serving as Senior Vice President, Controller and Treasurer. Ms. Perry also held senior finance and accounting roles at American Airlines and KPMG.
13
Claudia Schaefer, Senior Vice President and Chief Marketing Officer, age 49
Ms. Schaefer has served as the Company’s Chief Marketing Officer and Senior Vice President since November 2017. Previously, Ms. Schaefer served as Chief Marketing Officer for Cheddar’s Casual Café from January 2015 to November 2017. From 2008 to 2015, Ms. Schaefer served as Vice President of Marketing at Brinker International. From 2004 to 2008, Ms. Schaefer served as Vice President of International Restaurants for T.G.I. Friday’s.
Joe Thornton, Senior Vice President, Chief Operations Officer, age 50
Mr. Thornton has served as the Company’s Senior Vice President, Chief Operations Officer, since March 2017. Previously, Mr. Thornton served as Vice President, U.S. License Stores, for Starbucks Coffee Company from February 2016 to March 2017. From 2006 to 2016, Mr. Thornton held a variety of other leadership positions at Starbucks Coffee Company. From 1992 to 2006, Mr. Thornton held operational leadership roles at Blockbuster Video.
Employees
As of January 3, 2017, we employed approximately 1,177 persons, approximately 109 of whom were at our corporate offices or part of our field, licensing, direct selling and franchise support and operations. The remainder of our team members was comprised of Company Store management and hourly store personnel. The Company also hires a significant number of seasonal team members during its peak selling seasons of the spring and summer. Our team members are not covered by a collective bargaining agreement. We consider our employee relations to be good. We place a priority on staffing our stores and support center positions with highly skilled team members who embrace our culture and we invest in training programs to ensure the quality of our store operations.
Available Information
Our Annual Reports on Form 10-K, Quarterly Reports on Form 10-Q, Current Reports on Form 8-K and amendments to reports filed or furnished pursuant to Sections 13(a) and 15(d) of the Securities Exchange Act of 1934, as amended, are available on our website at http://ir.jambajuice.com, free of charge as soon as reasonably practicable after we electronically file such reports with, or furnish those reports to, the Securities and Exchange Commission (the “SEC”). The SEC also maintains an Internet site that contains reports, proxy and information statements and other information that we file electronically with the SEC at https://www.sec.gov/edgar. The public may also read and copy any materials that we file with the SEC at the SEC’s Public Reference Room at U.S. Securities and Exchange Commission Office of FOIA/ PA Operations, 100 F Street, NE, Washington, DC 20549-2736. Investors may obtain information on the operation of the SEC Public Reference Room by calling the SEC at 1-800-SEC-0330. Our Corporate Governance Principles and Practices, Board of Directors committee charters (including the charters of the Audit Committee, Compensation and Executive Development Committee and Nominating and Governance Committee) and our code of ethics entitled “Code of Business Conduct and Ethics” also are available at that same location on our website. Information on our website is not incorporated into this annual report. Further, our references to the URLs for these websites are intended to be inactive textual references only. Shareholders may request free copies of these documents from:
Jamba, Inc.
c/o ICR, Inc.
685 Third Avenue, 2nd Floor
New York, NY 10017
(646) 277-1212
investors@jambajuice.com
We included the certifications of the Chief Executive Officer and the Chief Financial Officer of Jamba, Inc. relating to the quality of our public disclosure, as required by Section 302 of the Sarbanes-Oxley Act of 2002 and related rules, in this Annual Report on Form 10-K as Exhibits 31.1 and 31.2 hereto.
14
You should carefully consider the risks described below. If any of the risks and uncertainties described below actually occurs, our business, financial condition and results of operations could be materially and adversely affected. The risk factors listed below have been identified as material, however, are not exhaustive. Other sections of this Annual Report on Form 10-K include additional factors that could adversely impact our business, financial condition and results of operations. Moreover, we operate in a very competitive and rapidly changing environment. New factors emerge from time to time and it is not possible to predict the impact of all of these factors on our business, financial condition or results of operation.
RISKS RELATED TO OUR BUSINESS
The loss of our Chief Executive Officer, or one or more of our executive management team could adversely affect our business.
On January 22, 2016, David A. Pace who has been on our Board of Directors since 2012 was appointed Chief Executive Officer of the Company. Our success depends substantially on the contributions and abilities of our executive management team as well as other key employees. We believe that these individuals understand our operational strategies and priorities and the steps necessary to drive our long-term growth and shareholder value. Competition for personnel in our industry is strong and the ability to retain key employees can be difficult. While we have entered into employment agreements with each of our executive officers, we cannot make any assurances that we can retain these individuals for the period necessary for us to achieve and sustain profitability. Our failure to retain and motivate executive management, key employees and Chief Executive Officer sufficient to maintain a competitive position within our industry, and to implement our strategic priorities, would adversely affect our results of operations.
The relocation of our corporate headquarters and data center could adversely affect our operations, operating results and financial condition, as we have experienced and may continue to experience disruptions to our business.
During 2016, we relocated our corporate headquarters from Emeryville, California to Frisco, Texas, a suburb of Dallas. In addition, we relocated our data center from Emeryville, California to Richardson, Texas, also a suburb of Dallas. We incurred expenses of approximately $7.4 million as a result of the move, associated with personnel relocation, employee attrition, retention, severance and replacement, office relocation and other costs. The relocation is intended to, among other things, reduce costs, attract and retain talent and provide a more central location for our market expansion plans.
The relocation included our corporate operations including human resources, finance and accounting, information technology and legal teams, our data center and associated employees. The relocation resulted in significant employee turnover and the planned and unplanned loss of personnel led to business disruptions stemming from delays in filling vacant positions and a lack of personnel with institutional or procedural knowledge and experience. The relocation has also required significant management time and effort, greater than had been anticipated, which was not otherwise devoted to focusing on ongoing business operations and other initiatives and opportunities.
As previously disclosed in the our Form 12b-25 filings with respect to our Form 10-K for our fiscal year ended January 3, 2017 and Form 10-Q for our quarters ended April 4, 2017, July 4, 2017 and October 3, 2017, our financial statements have been delayed as a result of significant changes occurring in 2016, including the relocation of our corporate office in 2016. While we had implemented a transition plan to mitigate the risk relating to the relocation, the replacement and training of new personnel Company wide and transition of operating knowledge created unanticipated difficulties and delays in completing our year-end financials.
The expected benefits of the move may not be fully realized due to associated disruption to our operations and personnel. Any continued difficulties or disruptions could have an adverse effect on our business, results of operations or financial condition.
15
Our revenue is subject to volatility based on weather and varies by season and our operational results may be subject to unusual weather conditions.
Seasonal factors cause our revenue to fluctuate from quarter to quarter. Because the majority of our revenue results from the sale of smoothies, our revenue is typically lower during the winter months and the holiday season, and during periods of inclement weather (because fewer people choose cold beverages) and higher during the spring, summer and fall months (for the opposite reason). Unusual weather conditions, which may or may not result from climate change or other changes in global meteorological conditions, may add to this volatility. Unusual weather conditions may also have an adverse impact on agriculture, result in increased ingredients and raw materials costs, and adversely affect our results of operations.
We are subject to risks associated with climate change and climate change regulation.
Laws and regulations regarding climate change, energy usage and emissions controls may impact the Company directly through higher costs of goods. The potential impacts of climate change and climate change regulations are highly uncertain at this time, and the Company cannot anticipate or predict the material adverse effect on our financial condition, results of operations or cash flows as a result of climate change and climate change regulations. For instance, changes in the prevailing climate may result in a reduction in, or increased prices of available produce and packaging, which may adversely affect our revenue and operating margins.
Our financial results depend upon the operating results of our franchisees.
Following the implementation of our significant refranchising initiative, we receive a substantial portion of our revenues in the form of royalties and other franchise revenues, which are generally based on development fees, initial franchise fees and a percentage of sales at franchise-operated stores and Jamba Juice Expresses. Accordingly, our financial results to a large extent are dependent upon the operational and financial success of our franchisees. If sales trends or economic conditions worsen for our franchisees, their financial results may deteriorate and our royalty and other revenues may decline and our accounts receivable from franchisees and related allowance for doubtful accounts for our franchisees may increase.
We may not be successful in implementing our strategic priorities, which may have a material adverse impact on our business and financial results.
Our business depends upon our ability to implement our strategic priorities, which we believe necessary to support the Company’s continued growth and long-term shareholder value. There can be no assurance that we will be able to continue to successfully implement our strategic priorities or whether these strategic priorities will be successful, and a failure of either could impede our growth and negatively affect our operating results.
We have a history of net losses and may incur losses in the future.
We have incurred net losses in six of the last eight fiscal years. We may continue to incur net losses in the future, and we cannot assure you that we will ever sustain profitability. Continued losses could adversely affect our liquidity and cash reserves and could negatively affect our operating results.
Failure to establish and maintain our internal control over financial reporting may result in us not being able to accurately report our financial results which could result in the loss of investor confidence and adversely affect the market price of our common stock.
Management is responsible for establishing and maintaining adequate internal control over our financial reporting. For fiscal 2016, we disclosed a material weakness in our internal control over financial reporting related to ineffective risk assessment of the risks of material misstatement in financial reporting. This material weakness was related to significant changes in our business model, leadership, key personnel, and relocation of our corporate office. These changes resulted in a significant increase in non-routine transactions and impacted certain routine processes needed to effectively accumulate and present consolidated financial results. This material weakness affected the design, implementation and operation of controls over the preparation, analysis and review of significant balances and disclosures and impacted its ability to close the books in a timely manner. This material weakness also contributed to misstatements related to a number of significant accounts and disclosures.
16
As a result of this material weakness, our management has developed a comprehensive remediation plan designed to address the factors contributing to the material weakness noted above and improve our overall system of internal controls. Our remediation plan provides that we will improve our system of internal controls by enhancing our risk assessment process, including ongoing evaluation of all of components established in Internal Control - Integrated Framework (2013) issued by the Committee of Sponsoring Organizations of the Treadway Commission (“COSO”).
We cannot, however, be certain that other material weaknesses and control deficiencies will not be discovered in the future. If additional material weaknesses or significant deficiencies in our internal controls are discovered or occur in the future, we may be unable to report our financial results accurately or on a timely basis, which could result in the loss of investor confidence and adversely affect the market price of our common stock.
A worsening of economic conditions or a decrease in consumer spending may substantially decrease our revenues and may adversely impact our ability to implement our business strategy.
To a significant extent, our success depends on discretionary consumer spending, which is influenced by general economic conditions and the availability of discretionary income. While economic conditions have been improving, there is no certainty that this trend will continue or that credit and financial markets and confidence in economic conditions will not deteriorate again. Accordingly, we may experience declines in revenue during economic turmoil or during periods of uncertainty. Any material decline in the amount of discretionary spending, leading cost-conscious consumers to be more selective in restaurants visited, could have a material adverse effect on our revenue, results of operations, business and financial condition.
The challenges of competing with the many food services businesses may result in reductions in our revenue and operating margins.
We compete with many well-established companies, food service and otherwise, on the basis of taste, quality and price of product offered, customer service, atmosphere, location and overall consumer experience. Our success depends, in part, upon the popularity of our products and our ability to develop new menu items that appeal to consumers across all four day-parts. Shifts in consumer preferences away from our products, our inability to develop new menu items that appeal to consumers across all day-parts, or changes in our menu that eliminate items popular with some consumers could harm our business. We compete with other smoothie and juice bar retailers, specialty coffee retailers, yogurt and ice cream shops, bagel shops, fast-food restaurants, delicatessens, cafés, take-out food service companies, supermarkets and convenience stores. Our competitors change with each of the four day-parts, ranging from coffee bars and bakery cafés to casual dining chains. Many of our competitors, or potential competitors, have substantially greater financial and other resources than we do, which may allow them to react to changes in the market quicker than we can. In addition, aggressive pricing by our competitors or the entrance of new competitors into our markets, could reduce our revenue and operating margins.
Fluctuations in various food and supply costs, particularly produce and dairy, could adversely affect our operating results.
Supplies and prices of the various products that we use to prepare our offerings can be affected by a variety of factors, such as weather, seasonal fluctuations, demand, politics and economics in the producing countries. These factors subject us to shortages or interruptions in product supplies, which could adversely affect our revenue and profits. In addition, the prices of fruit and dairy, which are the main products in our offerings, can be highly volatile. The quality of produce we seek tends to trade on a negotiated basis, depending on supply and demand at the time of the purchase. An increase in pricing of any produce that we use in our products could have a significant adverse effect on our profitability. In addition, higher diesel and gasoline prices may affect our supply or transportation costs and may affect our profitability. Although we attempt to mitigate the risks of volatile commodity prices and allow greater predictability in pricing by entering into fixed price, or to-be-fixed price, purchase commitments for a portion of our produce and dairy requirements, we cannot assure you that these activities will be successful or that they will not result in our paying substantially more for our produce supply than would have been required absent such activities. Declines in sales may also adversely affect our business to the extent we have long-term purchase commitments in excess of our needs.
17
We are dependent upon a limited number of distributors for a significant amount of our food distribution for our Stores.
For Company Stores, we maintain food distribution contracts primarily with two regional distributors, Systems Services of America (“SSA”) and Gordon Food Services (“GFS”), which also service a majority of our Franchise Stores. SSA distributes to the Western United States, and GFS primarily distributes to the Eastern United States. Although we believe our relationship with these distributors will result in operational efficiencies and cost savings, we cannot assure you that we will be successful or that we will not have to pay substantially more for distributor services in the event GFS or SSA has operational problems. Should GFS or SSA have operational problems, our operations and our operating margins could be adversely affected.
We may face difficulties entering into new or modified arrangements with existing or new suppliers or new service providers.
If we expand our operations into new geographic areas through new Company Stores, Franchise Stores, Jamba Juice Express, or introduce new products with special manufacturing, storage or distribution requirements, we may have to seek new suppliers and service providers, or enter into new arrangements with existing ones. We may also encounter difficulties or be unable to negotiate pricing or other terms as favorable as those we currently enjoy, which could harm our business and operating results. For example, the potential growth in smaller format stores may cause the frequency of shipments to increase and the average number of cases per shipment to decrease, thereby increasing the Company’s per case shipment costs.
The Company’s success depends on the value of the Jamba Juice® brands.
The Jamba Juice® brand promise is to inspire and simplify healthy living. We believe we must preserve and grow the value of the Jamba Juice brands in order to be successful in building our business, and particularly in building a consumer products growth platform under the Jamba brands. Brand value is based in part on consumer perceptions, and the Jamba Juice brand has been highly rated in several recent brand studies. We intend to reinforce and extend these perceptions for the Jamba brands to help support our licensing efforts. Our brand building initiatives involve increasing our product offerings, opening new Franchise Stores and Jamba Juice Express platforms, and entering into licensing arrangements to increase awareness of our brands and create and maintain brand loyalty. Our franchisees and licensees are often authorized to use our logos and provide branded beverages, food and other products directly to customers. We provide training and support to, and monitor the operations of, these business partners, but the product quality and service they deliver may be diminished by any number of factors beyond our control, including financial pressures. We believe customers expect the same quality of products and service from our franchisees and licensees as they do from us. Any shortcoming of one of our business partners, particularly an issue affecting the quality of the service experience or the safety of beverages or food, may be attributed by customers to us, thus damaging our reputation and brand value and potentially affecting our results of operations. If our brand building initiatives are unsuccessful, or if business incidents occur that erode consumer perceptions of our brand, then the value of our products may diminish and we may not be able to implement our business strategy.
We may experience higher than anticipated costs in connection with the refresh and remodel of existing Company Stores.
Updating the format and design of our Company Stores is important to maintaining a positive consumer association with the Jamba Juice brand. While we intend for such remodeling efforts to inure to the benefit of the Company, the associated costs may be higher than expected, and our revenues and expenses could be negatively impacted.
We may not be able to adequately protect our intellectual property, which could harm the value of our brand and adversely affect our business.
Our intellectual property is material to the conduct of our business. Our ability to implement our business plan successfully depends in part on our ability to build further brand recognition using our trademarks, service marks, trade dress and other proprietary intellectual property, including our name and logos and the unique ambiance of our
18
stores, both domestically and overseas. We have secured the ownership and rights to our marks in the United States and have filed or obtained registrations in select classes including restaurant services in most other significant foreign jurisdictions. We undertake similar efforts to protect our brands in other relevant consumer product categories in relevant jurisdictions. If our efforts to protect our intellectual property are inadequate, or if any third party misappropriates or infringes on our intellectual property, the value of our store brand and our consumer products brands may be harmed, which could have a material adverse effect on our business. While we have not encountered material claims from prior users of intellectual property relating to restaurant services in areas where we operate or intend to conduct material operations in the near future, there can be no assurances that we will not encounter any material claims in the future. If so, this could harm our image, brands or competitive position and cause us to incur significant penalties and costs.
Our business could be adversely affected by increased labor or healthcare costs. Self-insurance plan claims could materially impact our results.
Labor is a primary component in the cost of operating our business. We compete with other employers in our markets for hourly workers and may become subject to higher labor costs as a result of such competition. We devote significant resources to recruiting and training our team members. A considerable number of the team members employed by us are paid at rates related to the federal minimum wage. In 2009, the federal minimum wage increased to $7.25 per hour. Additionally, many of our Company Store team members work in stores located in states where the minimum wage is greater than the federal minimum wage and receive compensation equal to the state’s minimum wage. The current minimum wage in California for businesses with 26 or more employees increased to $10.50 per hour effective January 1, 2017, and increases each year until reaching $15.00 per hour in 2022.
Moreover, municipalities may set minimum wages above the applicable state standards, such as in San Francisco, which raised the minimum wage to $13.00 as of July 1, 2016, and will reach $15.00 on July 1, 2018. Any further increases in the federal minimum wage or the enactment of additional state or local minimum wage increases where our employees may be located will increase our labor costs. Competition for employees in various markets could also result in higher required wage rates. Furthermore, the Company is self-insured for employee healthcare and dental benefits. The Company pays a substantial part of the healthcare benefits for team members at the general manager level and above and for those working at the Company’s corporate office. The Company has a guaranteed cost Worker’s Compensation policy effective October 1, 2016. Liabilities associated with our self-insured plans the Company retains are estimated in part, by considering historical claims experience, reserves and other actuarial assumptions. The estimated accruals for these liabilities are based on statistical analyses of historical industry data as well as the Company’s actual historical trends. If actual claims experience differs from the Company’s assumptions, historical trends, and estimates, changes in the Company’s insurance reserves could materially impact our results of operations.
The Patient Protection and Affordable Care Act enacted in 2010, as well as other healthcare reform legislation being considered by Congress and state legislatures may have a material adverse impact on our business. We continue to monitor and evaluate any impact the Patient Protection and Affordable Care Act or alternative regulations may have on our business.
We are reliant on our outsourcing partner to provide effective administrative functions.
During the latter part of 2014, we engaged a third party service provider to provide outsourced accounting, IT, human resources and contract management services. This may allow us to achieve efficiencies and cost savings, in part, through a reduction in our workforce. If our outsourcing partner fails to perform at a sufficient level to ensure our efficient operation, we may not have the resources to timely and efficiently take over those functions, and our financial performance might be adversely impacted as a result.
We are subject to all of the risks associated with leasing space subject to long-term non-cancelable leases.
We, and our franchisees, compete in the market for real estate and our, or their, inability to secure appropriate real estate or lease terms could impact our respective abilities to grow. Our leases generally have initial terms of between five and 15 years, and generally can be extended only in five-year increments if at all. We generally cannot cancel these leases. If an existing or new store is not profitable, and we decide to close it, as we have done in the
19
past and may do in the future, we may nonetheless be committed to perform our obligations under the applicable lease including, among other things, paying the base rent for the balance of the lease term. Additionally, because we sublease the premises of Company Stores sold to franchisees in our refranchising program, we are still legally liable to the landlords under the prime leases, and we will need to assume obligations under the prime lease should a franchisee default on its sublease obligations. Current locations of our stores and franchised locations may become unattractive as demographic patterns change. In addition, as each of our leases expire, we may fail to negotiate renewals, either on commercially acceptable terms or at all, which could require us to close stores in desirable locations.
Our business and results may be subject to disruption from work stoppages, terrorism or natural disasters.
Our operations may be subject to disruption for a variety of reasons, including work stoppages, acts of war, terrorism, pandemics, fire, earthquake, flooding or other natural disasters. These disruptions can result in, among other things, lost sales when consumers stay home or are physically prevented from reaching our stores, property damage, lost sales when our stores are forced to close for extended periods of time and interruptions in supply when vendors suffer damages or transportation is affected. If a natural disaster were to occur near our headquarters and data center in Frisco, Texas, our corporate offices and data center may be damaged or destroyed. Such a disruption could result in the temporary or permanent loss of critical data, suspension of operations, delays in shipments of product, and disruption of business in both the affected region and nationwide, which would adversely affect our revenue and results of operations.
We are highly dependent on the financial performance of stores concentrated in certain geographic areas.
Our financial performance is highly dependent on stores located in California. Stores located in California comprise over 74% of Company Stores and generate a significant portion of our Company Store revenue. These stores also comprise approximately 46% of our total global system stores. If geographic regions in which we have a high concentration of stores experience significant economic pressures, our sales and operating results could be negatively impacted. In addition, state and local laws, government regulations, weather conditions and natural disasters affecting California and other regions where we have a high concentration of stores may have a material impact upon our operating results.
We may not realize the anticipated benefits of any acquisitions, joint ventures or strategic investments.
We expect to continue to evaluate and consider a wide array of potential strategic transactions, including acquisitions, joint ventures and strategic investments. At any given time, we may be engaged in discussions or negotiations with respect to one or more of these types of transactions. Any of these transactions could be material to our financial condition and results of operations. We may not realize the anticipated benefits of any or all of our acquisitions, joint ventures or strategic investments, or we may not realize them in the time frame expected. Future acquisitions, joint ventures or strategic investments may require us to issue additional equity securities, spend a substantial portion of our available cash, or incur debt or liabilities, amortize expenses related to intangible assets or incur write-offs of goodwill, which could adversely affect our results of operations and dilute the economic and voting rights of our shareholders.
Governmental regulation may adversely affect our ability to open new stores or otherwise adversely affect our existing and future operations and results.
We, and our franchisees, are subject to various federal, state and local regulations. Each of our stores is subject to state and local licensing and regulation by health, sanitation, food and workplace safety and other agencies. We, and our franchisees, may experience material difficulties or failures in obtaining the necessary licenses or approvals for new stores, which could delay planned store openings. In addition, stringent and varied requirements of local regulators with respect to zoning, land use and environmental factors could delay or prevent development of new stores in particular locations.
20
Our operations are also subject to the U.S. Fair Labor Standards Act and National Labor Relations Act, which governs such matters as minimum wages, overtime and other working conditions, along with the U.S. Americans with Disabilities Act, family leave mandates and a variety of similar laws enacted by the states that govern these and other employment law matters. In recent years, there has been an increased legislative, regulatory, and consumer focus on nutrition and advertising practices in the food industry. Establishments operating in the quick-service and fast-casual segments have been a particular focus, and compliance with additional regulations can become costly and affect our operating results.
Our federal, state and local tax returns may, from time to time, be selected for audit by the taxing authorities, which may result in tax assessments, interest or penalties that could have a material adverse impact on our results of operations and financial position.
We are subject to federal, state and local taxes in the U.S. In making tax estimates and paying taxes, significant judgment is often required. Although we believe our tax positions and estimates are reasonable, if a taxing authority disagrees with the positions taken by the Company, we could have an additional tax liability, including interest and penalties. If material, payment of such additional amounts could have a material impact on our results of operations and financial position.
We rely heavily on information technology and a material failure of that technology could impair our ability to efficiently operate our business.
Our business operations rely heavily on information systems, including point-of-sale processing in our stores, management of our supply chain and distribution system, vendor and franchisee invoicing, and various other processes and procedures. The efficient management of our business depends significantly on the reliability and capacity of these systems, and any related failure and/or breach of security could cause delays in customer service and reduce efficiency in our operations. Significant capital investments might be required to remediate any problems.
Failure to protect the integrity and security of individually identifiable data of customers, vendors or employees could expose us to data loss, litigation and liability, and our reputation could be significantly harmed.
Our business operations require us to process and/or maintain certain personal, business and financial information about customers, vendors and employees. The use of such information by us is regulated by federal, state and foreign laws, as well as certain third party agreements. If our security and information systems are compromised or if our employees or franchisees fail to comply with the applicable laws and regulations, and this information is obtained by unauthorized persons or used inappropriately, it could adversely affect our reputation and result in litigation and settlement costs, damage awards, or penalties and fines. As privacy and information security law and regulations change, we may incur additional costs to ensure that we remain in compliance.
A failure or breach of our security systems or infrastructure as a result of cyber-attacks could disrupt our business, result in the disclosure or misuse of confidential or proprietary information, damage our reputation, increase our costs and cause losses.
Information security risks have significantly increased in recent years in part because of the proliferation of new technologies, the use of the Internet and telecommunications technologies to conduct financial transactions, and the increased sophistication and activities of organized crime, hackers, terrorists and other external parties. These threats may derive from fraud or malice on the part of our employees or third parties, or may result from human error or accidental technological failure. These threats include cyber-attacks such as computer viruses, malicious code, phishing attacks or information security breaches.
To date, we have not experienced any material impact relating to cyber-attacks or other information security breaches. Any actual attacks could lead to damage to our reputation, additional costs (such as repairing systems and investigation or compliance costs), penalties, financial losses to both us and our customers and partners and the loss of customers and business opportunities. If such attacks are not detected immediately, their effect could be compounded. As cyber-threats continue to evolve, we may be required to expend significant additional resources to
21
continue to modify or enhance our protective measures or to investigate and remediate any information security vulnerabilities. Any of the risks described above could materially adversely affect our overall business and results of operations.
The new presidential administration may make substantial changes to regulatory policies that may adversely affect our business.
The new presidential administration has called for substantial change to various policies and regulations, including labor, healthcare, trade, tax and fiscal policy. We cannot predict the impact, if any, of these changes to our business. However, it is possible that these changes could adversely affect our business. It is likely that some policies adopted by the new administration will benefit us and others will negatively affect us. Until we know what changes are enacted, we will not know whether in total we benefit from, or are negatively affected by, the changes.
In December of 2017, the U.S. government enacted comprehensive tax legislation that includes significant changes to the taxation of business entities, including, among other provisions, a permanent reduction to the corporate income tax rate. Notwithstanding the reduction in the corporate income tax rate, the overall impact of this tax reform is uncertain, and our business and financial condition could be adversely affected.
RISKS RELATED TO OUR FRANCHISE BUSINESS
Termination of an arrangement with a master developer could adversely impact our revenues.
We enter into relationships with “master developers” to develop and operate restaurants in defined domestic and international geographic areas. Master developers are granted exclusive rights with respect to larger territories than our typical franchisees. The termination of an arrangement with a master developer or a lack of expansion by certain master developers could result in the delay of the development and expansion of our business in our targeted markets. Any such delay or interruption could result in lower revenues for us, particularly if we were to choose to close stores following the termination of an arrangement with a master developer.
Our growth strategy depends on increasing franchise ownership.
Our current growth strategy is to continue to pursue an asset-light business model, including selling Company Stores, and increasing the number of franchise locations as a percentage of all stores in the Jamba System. By emphasizing Franchise Store development, we receive an increasingly significant amount of our revenues in the form of royalties from our franchisees. Accordingly, the success of our business is increasingly dependent upon the operational and financial success of our franchisees. This strategy is subject to risks and uncertainties, which may be concentrated where any particular franchisee owns a significant number of franchise locations. While our franchise agreements set forth certain operational standards and guidelines, we have limited control over how our franchisees’ businesses are run, and any significant inability of our franchisees to operate successfully could adversely affect our operating results through decreased royalty payments. We may not be able to identify franchisee candidates with appropriate experience and financial resources or to negotiate mutually acceptable agreements with those that do. Our franchisee candidates may not have access to the financial or management resources that they need to open or continue operating the stores contemplated by their franchise agreements with us. In addition, franchisees may not be able to find suitable sites on which to develop new stores or negotiate acceptable lease terms for the sites, obtain the necessary permits and government approvals or meet construction schedules. If our franchisees incur too much debt or if economic or sales trends deteriorate such that they are unable to repay existing debt, it could result in financial distress or even possible insolvency or bankruptcy. Some of our franchisees experienced financial pressures during fiscal 2016, 2015 and 2014. If a significant number of our franchisees become financially distressed, this could harm our operating results through reduced or delayed royalty payments or increased rent obligations for leased properties on which we are contingently liable.
22
Expansion into new geographic markets may present increased risks.
Franchise growth is planned in new geographic areas in the United States and select international markets. Our future results, and the results of new Franchise Stores, depend on various factors, including successful selection and expansion into these new geographic markets and market acceptance of the Jamba Juice experience. Those markets may have different competitive conditions, consumer tastes and discretionary spending patterns as compared to existing markets. As a result, those new stores may be less successful than stores in our existing markets. Consumers in a new market may not be familiar with the Jamba Juice brand, and we may need to build brand awareness in that market through greater investments in advertising and promotional activity than we originally planned. Franchisees may find it more difficult in new markets to hire, motivate and keep qualified employees who can project our vision, passion and culture. Stores opened in new markets may also have lower average store revenue than stores opened in existing markets, and may have higher construction, occupancy or operating costs than stores in existing markets. Furthermore, we may have difficulty in finding reliable suppliers or distributors or ones that can provide us, either initially or over time, with adequate supplies of ingredients meeting our quality standards. Revenue at stores opened in new markets may take longer to increase and reach expected revenue levels, and may never do so, thereby affecting our overall royalty income. As with the experience of other retail food concepts that have tried to expand nationally and internationally, we may find that the Jamba Juice concept has limited appeal to customers in new markets or we may experience a decline in the popularity of the Jamba Juice experience. Newly opened stores may not succeed, future markets and stores may not be successful and, even if we are successful, our average store revenue, and the royalty income generated therefrom, may not increase and may even decline.
Our efforts to expand internationally may not be successful and could impair the value of our brand.
Our current strategy includes international expansion in a number of countries around the world. Expanding into international markets will expose us to new risks and uncertainties, including product supply, import/export limitations and regulations to which we are not currently bound and may not be currently set up to handle, consumer preferences, occupancy costs, operating expenses and labor and infrastructure challenges. If stores open in international markets and such stores are unable to source inventory locally, franchisees may be required to import inventory from our U.S. distributors and any resulting import duties, tariffs, transportation or other charges may disproportionately impact such stores’ cost of goods which could harm the viability of such stores. Finally, international operations have inherent risks such as foreign currency exchange rate fluctuations, the application and effect of local laws and regulations and enforceability of intellectual property and contract rights. Additionally, effectively managing growth can be challenging, particularly as we continue to expand into new international markets where we must balance the need for flexibility and a degree of autonomy for local management against the need for consistency with our goals, philosophy and standards. Failure of our international expansion strategy could have a material adverse impact on our results of operations.
Termination or non-renewal of franchise agreements may disrupt store performance.
Each franchise agreement is subject to termination by us in the event of default by the franchisee after the applicable cure period. Upon the expiration of the initial term of a franchise agreement, the franchisee generally has an option to renew for an additional term. There is no assurance that franchisees will meet the criteria for renewal or will desire or be able to renew their franchise agreements. If not renewed, a franchise agreement and payments required thereunder will terminate. We may be unable to find a new franchisee to replace such lost revenue. Furthermore, while we will be entitled to terminate franchise agreements following a default that is not cured within the applicable cure period, if any, the disruption to the performance of the stores could materially and adversely affect our business.
Our franchisees could take actions that harm our reputation and reduce our royalty revenue.
While we have franchise agreements in place with our franchisees that provide certain operational requirements, we do not exercise control over the day-to-day operations of our Franchise Stores. Any operational or developmental shortcomings of our Franchise Stores, including their failure to comply with applicable laws, are likely to be attributed to our system-wide operations in the eyes of consumers and could adversely affect our reputation and have a direct negative impact on the royalty revenue we receive from those and other stores.
23
We could face liability from our franchisees and from government agencies.
A franchisee or government agency may bring legal action against us based on the franchisor/franchisee relationship. Various state and federal laws govern our relationship with our franchisees and our potential sale of a franchise. If we fail to comply with these laws, we could be liable for damages to franchisees, fines or other penalties. Expensive litigation with our franchisees or government agencies may adversely affect both our profits and our important relations with our franchisees.
RISKS RELATED TO THE FOOD SERVICE BUSINESS
Litigation and publicity concerning food quality, health claims, and other issues can result in liabilities, increased expenses, distraction of management, and can also cause customers to avoid our products, which could adversely affect our results of operations, business and financial condition.
Food service businesses can be adversely affected by litigation and complaints from customers or government authorities resulting from food quality, health claims, allergens, illness, injury or other health concerns or operating issues stemming from one retail location or a number of retail locations. Adverse publicity about these allegations may negatively affect us, regardless of whether the allegations are true, by discouraging customers from buying our products.
Our customers occasionally file complaints or lawsuits against us alleging that we are responsible for some illness or injury they suffered at or after a visit to our stores, or that we have problems with food quality or operations. We are also subject to a variety of other claims arising in the ordinary course of our business, including false advertising claims, personal injury claims, contract claims and claims alleging violations of federal and state law regarding workplace and employment matters, discrimination and similar matters, and we could become subject to class action or other lawsuits related to these or different matters in the future. Regardless of whether any claims against us are valid, or whether we are ultimately held liable, claims may be expensive to defend and may divert time and money away from our operations and hurt our performance. A judgment significantly in excess of our insurance coverage, or for which we are not covered by insurance, could materially and adversely affect our financial condition or results of operations. Any adverse publicity resulting from these allegations may also materially and adversely affect our reputation or prospects, which in turn, could adversely affect our results.
In addition, the food services industry has been subject to a growing number of claims based on the nutritional content of food products they sell, and disclosure and advertising practices. We may also be subject to this type of proceeding in the future and, even if not, publicity about these matters (particularly directed at the quick-service and fast-casual segments of the industry) may harm our reputation or prospects and adversely affect our results.
We are also impacted by trends in litigation, including class-action allegations brought under various consumer protection laws, securities and derivative lawsuits claiming violations of state and federal securities law, and employee lawsuits, including wage and hour claims. We may also be impacted by litigation involving our relationship with franchisees and the legal distinction between our franchisees and us for employee claims based on, among other things, wage and hour violations, discrimination, harassment, or wrongful termination, as these types of claims are increasingly asserted against franchisors on a co-employer theory by employees of franchisees.
Due to the inherent uncertainties of litigation and regulatory proceedings, we cannot accurately predict the ultimate outcome of any such proceedings. An unfavorable outcome could have a material adverse impact on our business, financial condition and results of operations. In addition, regardless of the outcome of any litigation or regulatory proceedings, these proceedings could result in substantial costs and may require that we devote substantial resources to defend our Company and could affect the future premiums we would be required to pay on our insurance policies. Further, changes in governmental regulations could have adverse effects on our business and subject us to additional regulatory actions.
24
Food safety concerns and instances of food-borne illnesses could harm our customers, result in negative publicity and cause the temporary closure of some stores and, in some cases, could adversely affect the price and availability of fruits and vegetables, any of which could harm our brand reputation, result in a decline in revenue or an increase in costs.
We consider food safety a top priority and dedicate substantial resources toward ensuring that our customers enjoy high-quality, safe and wholesome products. However, we cannot guarantee that our internal controls and training will be fully effective in preventing all food-borne illnesses. Furthermore, our reliance on third-party food suppliers and distributors increases the risk that food-borne illness incidents (such as e. coli, hepatitis A, salmonella or listeria) could occur outside of our control and at multiple locations. Instances of food-borne illnesses, whether real or perceived, and whether at our stores or those of our competitors, could harm customers and otherwise result in negative publicity about us or the products we serve, which could adversely affect revenue. If there is an incident involving our stores serving contaminated products, our customers may be harmed, our revenue may decrease and our brand name and reputation may be impaired. If our customers become ill from food-borne illnesses, we could be forced to temporarily close some stores. In addition, we may have different or additional competitors for our intended customers as a result of making any such changes and may not be able to compete successfully against those competitors. Food safety concerns and instances of food-borne illnesses and injuries caused by food contamination have in the past, and could in the future, adversely affect the price and availability of affected ingredients and cause customers to shift their preferences, particularly if we choose to pass any higher ingredient costs along to consumers. As a result, our costs may increase and our revenue may decline. A decrease in customer traffic as a result of these health concerns or negative publicity, or as a result of a change in our menu or dining experience or a temporary closure of any of our stores, could materially and adversely impact our business, financial condition and results of operations.
RISKS RELATED TO OWNERSHIP OF COMMON STOCK
Failure of the Company’s internal control over financial reporting could harm its business and financial results.
Our management is responsible for establishing and maintaining effective internal control over financial reporting. Internal control over financial reporting is a process to provide reasonable assurance regarding the reliability of financial reporting for external purposes in accordance with accounting principles generally accepted in the United States. Internal control over financial reporting includes: (i) maintaining reasonably detailed records that accurately and fairly reflect our transactions; and (ii) providing reasonable assurance that we (a) record transactions as necessary to prepare the financial statements, (b) make receipts and expenditures in accordance with management authorizations; and (c) would timely prevent or detect any unauthorized acquisition, use or disposition of our assets that could have a material effect on the financial statements. Because of its inherent limitations, internal control over financial reporting is not intended to provide absolute assurance that we would prevent or detect a misstatement of our financial statements or fraud. Any failure to maintain an effective system of internal control over financial reporting could limit our ability to report our financial results accurately and timely or to detect and prevent fraud. In addition, we are required to comply with a variety of reporting, accounting and other rules and regulations. Compliance with existing requirements is expensive. Our accounting systems are older and require manual processing. We may need to implement additional finance and accounting systems and procedures and controls to comply with our reporting requirements. A significant financial reporting failure could cause an immediate loss of investor confidence in us and a sharp decline in the market price of our common stock.
In 2016, the Company underwent significant changes in its business model, leadership, key personnel, and relocation of its corporate office. These changes resulted in a significant increase in non-routine transactions and impacted certain routine processes needed to effectively accumulate and present consolidated financial results. The Company identified that its risk assessment process, which was intended to identify new transactions and changes to existing processes and design appropriate control activities over financial reporting, was not sufficient to prevent or detect material misstatement in a timely basis. Consequently, a material weakness in internal control over financial reporting resulted from ineffective risk assessment of material misstatement in financial reporting.
25
Our anti-takeover provisions may delay or prevent a change of control of us, which may adversely affect the price of our common stock.
Certain provisions in our corporate documents and Delaware law may delay or prevent a change of control of us, which could adversely affect the price of our common stock. For example, the Company’s amended and restated certificate of incorporation and bylaws include anti-takeover provisions such as:
|
|
• |
limitations on the ability of shareholders to amend our charter documents, including shareholder supermajority voting requirements; |
|
|
• |
the inability of shareholders to act by written consent or to call a special meeting absent the request of the holders of a majority of the outstanding common stock; and |
|
|
• |
advance notice requirements for nomination for election to the board of directors and for shareholder proposals. |
The Company is also afforded the protections of Section 203 of the Delaware General Corporation Law which prevents it from engaging in a business combination with a person who acquires at least 15% of its common stock for a period of three years from the date such person acquired such common stock, unless board of directors or shareholder approval is obtained.
Our stock price may fluctuate significantly.
The trading price of our common stock has been volatile and is likely to continue to be volatile. Our stock price could be subject to wide fluctuations in response to a variety of factors. The stock market has experienced significant price and volume fluctuations that have often been unrelated or disproportionate to the operating performance of particular companies. Broad market factors, including the effect of international political instability, armed conflict, natural disasters, financial markets, and general economic conditions, may have a material adverse effect on our stock price, regardless of our actual performance.
None.
The Company’s headquarters were located in Emeryville, California and were relocated to Frisco, Texas in the fourth quarter of fiscal year 2016. The Emeryville facility was occupied under a lease for approximately 37,000 square feet, at a cost of approximately $1.2 million per year and has a lease term that expired on January 31, 2017. The Frisco facility is occupied under a lease for approximately 25,000 square feet, at a cost of approximately $0.8 million per year and has a lease term that expires on March 31, 2027.
The Company, including our franchisees, currently operates all of its stores under leases and typically signs five to 15 year leases. The Company does not intend to purchase real estate for any of its sites in the future. The Company believes that the size and flexibility of its format provide it with a competitive advantage in securing sites. At January 3, 2017, the Company served its customers primarily through a combination of Company Stores, Franchise Stores and International Stores in 35 different States, the District of Columbia, Indonesia, Taiwan, South Korea, the Philippines, Mexico and the Middle East.
26
|
|
|
Store Count as of January 3, 2017 |
||||||
|
|
|
Company Stores |
|
|
Franchise & International Stores |
|
Total |
|
|
United States |
|
|
|
|
|
|
|
|
|
Arizona |
|
|
— |
|
|
40 |
|
40 |
|
California |
|
49 |
|
|
367 |
|
416 |
|
|
Colorado |
|
|
— |
|
|
25 |
|
25 |
|
Connecticut |
|
|
— |
|
|
2 |
|
2 |
|
Delaware |
|
|
— |
|
|
1 |
|
1 |
|
District of Columbia |
|
|
— |
|
|
3 |
|
3 |
|
Florida |
|
|
— |
|
|
30 |
|
30 |
|
Georgia |
|
|
— |
|
|
7 |
|
7 |
|
Hawaii |
|
|
— |
|
|
37 |
|
37 |
|
Idaho |
|
|
— |
|
|
11 |
|
11 |
|
Illinois |
|
13 |
|
|
6 |
|
19 |
|
|
Indiana |
|
|
— |
|
|
1 |
|
1 |
|
Iowa |
|
|
— |
|
|
1 |
|
1 |
|
Kentucky |
|
|
— |
|
|
1 |
|
1 |
|
Louisiana |
|
|
— |
|
|
3 |
|
3 |
|
Maryland |
|
|
— |
|
|
5 |
|
5 |
|
Massachusetts |
|
|
— |
|
|
3 |
|
3 |
|
Michigan |
|
|
— |
|
|
7 |
|
7 |
|
Minnesota |
|
|
— |
|
|
10 |
|
10 |
|
Missouri |
|
|
— |
|
|
6 |
|
6 |
|
Montana |
|
|
— |
|
|
1 |
|
1 |
|
Nevada |
|
|
— |
|
|
17 |
|
17 |
|
New Jersey |
|
1 |
|
|
7 |
|
8 |
|
|
New York |
|
2 |
|
|
22 |
|
24 |
|
|
North Carolina |
|
|
— |
|
|
7 |
|
7 |
|
Ohio |
|
|
— |
|
|
4 |
|
4 |
|
Oklahoma |
|
|
— |
|
|
7 |
|
7 |
|
Oregon |
|
|
— |
|
|
25 |
|
25 |
|
Pennsylvania |
|
|
— |
|
|
9 |
|
9 |
|
Tennessee |
|
|
— |
|
|
4 |
|
4 |
|
Texas |
|
1 |
|
|
37 |
|
38 |
|
|
Utah |
|
|
— |
|
|
23 |
|
23 |
|
Virginia |
|
|
— |
|
|
6 |
|
6 |
|
Washington |
|
|
— |
|
|
32 |
|
32 |
|
Wisconsin |
|
|
— |
|
|
5 |
|
5 |
|
Wyoming |
|
|
— |
|
|
1 |
|
1 |
|
Total in United States |
|
66 |
|
|
773 |
|
839 |
|
|
International |
|
|
|
|
|
|
|
|
|
Indonesia |
|
|
— |
|
|
4 |
|
4 |
|
Mexico |
|
|
— |
|
|
2 |
|
2 |
|
Middle East |
|
|
— |
|
|
9 |
|
9 |
|
Philippines |
|
|
— |
|
|
26 |
|
26 |
|
South Korea |
|
|
— |
|
|
25 |
|
25 |
|
Taiwan |
|
|
— |
|
|
4 |
|
4 |
|
Total International |
|
|
— |
|
|
70 |
|
70 |
|
Grand Total |
|
|
66 |
|
|
843 |
|
909 |
27
The Company is party to various legal proceedings arising in the ordinary course of its business, but it is not currently a party to any legal proceeding that management believes would have a material adverse effect on the consolidated financial position or results of operations of the Company.
Not applicable.
28
|
ITEM 5. |
MARKET FOR JAMBA, INC.’S COMMON EQUITY, RELATED SHAREHOLDER MATTERS AND ISSUER PURCHASES OF EQUITY SECURITIES |
Market Information
The shares of Jamba, Inc. common stock are currently quoted on the NASDAQ Global Market under the symbol JMBA. The closing price per share of Jamba, Inc. common stock as reported on the NASDAQ Global Market on February 2, 2018, was $7.55.
The following table sets forth, for the fiscal quarter indicated, the quarterly high and low closing sales prices of our shares of common stock as reported on the NASDAQ Global Market, as applicable, for each quarter during the last two fiscal years.
|
|
|
Common Stock |
||||
|
|
|
High |
|
|
Low |
|
|
2015 First Quarter |
|
|
16.80 |
|
|
13.71 |
|
2015 Second Quarter |
|
|
16.77 |
|
|
14.98 |
|
2015 Third Quarter |
|
16.33 |
|
|
12.92 |
|
|
2015 Fourth Quarter |
|
14.75 |
|
|
12.75 |
|
|
2016 First Quarter |
|
|
13.64 |
|
|
11.76 |
|
2016 Second Quarter |
|
13.52 |
|
|
10.08 |
|
|
2016 Third Quarter |
|
11.51 |
|
|
10.02 |
|
|
2016 Fourth Quarter |
|
10.94 |
|
|
9.75 |
|
We have not historically paid any cash dividends on our common stock and do not currently have plans to pay any cash dividends. As of February 2, 2018, there were 91 holders of record of our common stock.
Securities Authorized for Issuance under Equity Compensation Plans
Our equity compensation plan information required by this item is incorporated by reference to the information in Part III, Item 12 of this Annual Report on Form 10-K.
29
The following graph compares our cumulative total shareholder return since December 31, 2011 with the cumulative total return of (i) the NASDAQ Composite Index; (ii) the Russell 2000 Index; and (iii) Russell MicroCap Index. The graph assumes that the value of the investment in our common stock and each index (including reinvestment of dividends) was $100 on January 3, 2012. The comparisons in the graph below are based on historical data and are not intended to forecast the possible future performance of our common stock. This performance graph shall not be deemed “soliciting material” or to be “filed” with the SEC for purposes of Section 18 of the Exchange Act, or otherwise subject to the liabilities under that Section, and shall not be deemed to be incorporated by reference into any of our filings under the Securities Act or the Exchange Act.
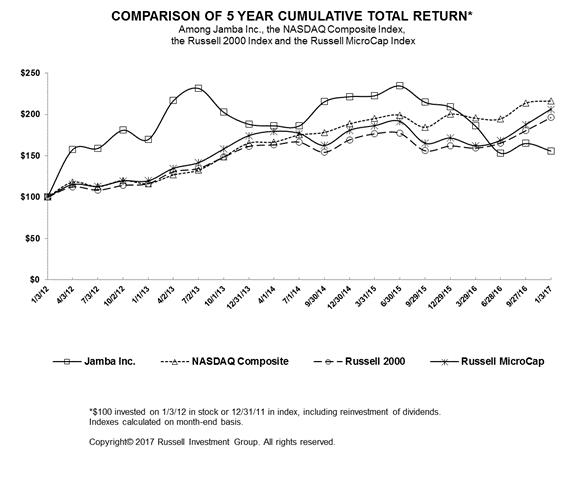
30
The table below summarizes the Company’s recent financial information. The historical information was derived from the consolidated financial statements of Jamba, Inc. and subsidiary for the fiscal years ended January 3, 2017, December 29, 2015, December 30, 2014, December 31, 2013 and January 1, 2013. The data set forth below should be read in conjunction with the consolidated financial statements and notes thereto in Item 8 and with Management’s Discussion and Analysis of Financial Condition and Results of Operations in Item 7.
Statements of Operations Data
(In thousands, except share data and per share amounts)
|
|
|
Fiscal Year Ended January 3, 2017 (1) (2) |
|
|
Fiscal Year Ended December 29, 2015 (2) |
|
|
Fiscal Year Ended December 30, 2014 (2) |
|
|
Fiscal Year Ended December 31, 2013 (2) |
|
|
Fiscal Year Ended January 1, 2013 (2) |
|
|||||
|
Revenue: |
|
|
|
|
|
|
|
|
|
|
|
|
|
|
|
|
|
|
|
|
|
Company stores |
|
$ |
51,282 |
|
|
$ |
137,025 |
|
|
$ |
198,737 |
|
|
$ |
212,887 |
|
|
$ |
215,125 |
|
|
Franchise and other revenue |
|
|
28,341 |
|
|
|
24,651 |
|
|
|
19,311 |
|
|
|
16,362 |
|
|
|
13,664 |
|
|
Total revenue |
|
|
79,623 |
|
|
|
161,676 |
|
|
|
218,048 |
|
|
|
229,249 |
|
|
|
228,789 |
|
|
Costs and operating expenses (income): |
|
|
|
|
|
|
|
|
|
|
|
|
|
|
|
|
|
|
|
|
|
Cost of sales |
|
|
12,601 |
|
|
|
33,737 |
|
|
|
52,236 |
|
|
|
52,211 |
|
|
|
50,215 |
|
|
Labor |
|
|
17,872 |
|
|
|
44,732 |
|
|
|
61,749 |
|
|
|
62,015 |
|
|
|
63,086 |
|
|
Occupancy |
|
|
7,659 |
|
|
|
18,951 |
|
|
|
27,630 |
|
|
|
29,350 |
|
|
|
29,473 |
|
|
Store operating |
|
|
9,285 |
|
|
|
25,152 |
|
|
|
33,089 |
|
|
|
34,802 |
|
|
|
33,524 |
|
|
Depreciation and amortization |
|
|
5,749 |
|
|
|
6,569 |
|
|
|
10,084 |
|
|
|
10,974 |
|
|
|
11,062 |
|
|
General and administrative |
|
|
37,958 |
|
|
|
36,872 |
|
|
|
37,278 |
|
|
|
37,771 |
|
|
|
40,771 |
|
|
Loss (gain) on disposal of assets |
|
|
790 |
|
|
|
(21,609 |
) |
|
|
(2,957 |
) |
|
|
(3,153 |
) |
|
|
648 |
|
|
Store pre-opening |
|
|
1,224 |
|
|
|
1,031 |
|
|
|
763 |
|
|
|
880 |
|
|
|
604 |
|
|
Impairment of long-lived assets |
|
|
3,410 |
|
|
|
2,523 |
|
|
|
175 |
|
|
|
728 |
|
|
|
711 |
|
|
Store lease termination and closure |
|
|
4,160 |
|
|
|
1,669 |
|
|
|
575 |
|
|
|
148 |
|
|
|
421 |
|
|
Other operating, net |
|
|
1,083 |
|
|
|
1,795 |
|
|
|
726 |
|
|
|
1,155 |
|
|
|
(2,339 |
) |
|
Total costs and operating expenses (income): |
|
|
101,791 |
|
|
|
151,422 |
|
|
|
221,348 |
|
|
|
226,881 |
|
|
|
228,176 |
|
|
(Loss) income from operations |
|
|
(22,168 |
) |
|
|
10,254 |
|
|
|
(3,300 |
) |
|
|
2,368 |
|
|
|
613 |
|
|
Other income (expense): |
|
|
|
|
|
|
|
|
|
|
|
|
|
|
|
|
|
|
|
|
|
Interest income |
|
|
250 |
|
|
137 |
|
|
74 |
|
|
9 |
|
|
61 |
|
||||
|
Interest expense |
|
|
(439 |
) |
|
|
(220 |
) |
|
|
(195 |
) |
|
|
(242 |
) |
|
|
(217 |
) |
|
Total other income (expense), net |
|
|
(189 |
) |
|
|
(83 |
) |
|
|
(121 |
) |
|
|
(233 |
) |
|
|
(156 |
) |
|
(Loss) income before income taxes |
|
|
(22,357 |
) |
|
|
10,171 |
|
|
|
(3,421 |
) |
|
|
2,135 |
|
|
|
457 |
|
|
Income tax expense |
|
|
(79 |
) |
|
|
(701 |
) |
|
|
(168 |
) |
|
|
(55 |
) |
|
|
(155 |
) |
|
Net (loss) income |
|
|
(22,436 |
) |
|
|
9,470 |
|
|
|
(3,589 |
) |
|
|
2,080 |
|
|
|
302 |
|
|
Preferred stock dividends and deemed dividends |
|
|
— |
|
|
|
— |
|
|
|
— |
|
|
|
(588 |
) |
|
|
(2,181 |
) |
|
Less: Net income attributable to noncontrolling interest |
|
|
— |
|
|
52 |
|
|
|
43 |
|
|
|
— |
|
|
|
— |
|
|
|
Net (loss) income attributable to Jamba, Inc. |
|
$ |
(22,436 |
) |
|
$ |
9,418 |
|
|
$ |
(3,632 |
) |
|
$ |
1,492 |
|
|
$ |
(1,879 |
) |
|
Weighted-average shares used in the computation of (loss) earnings per share attributable to Jamba, Inc.: |
|
|
|
|
|
|
|
|
|
|
|
|
|
|
|
|
|
|
|
|
|
Basic |
|
|
15,229,102 |
|
|
|
15,787,806 |
|
|
|
17,197,904 |
|
|
|
16,793,235 |
|
|
|
14,139,888 |
|
|
Diluted |
|
|
15,229,102 |
|
|
|
16,228,033 |
|
|
|
17,197,904 |
|
|
|
17,222,030 |
|
|
|
14,139,888 |
|
|
(Loss) earnings per share attributable to Jamba, Inc. common shareholders: |
|
|
|
|
|
|
|
|
|
|
|
|
|
|
|
|
|
|
|
|
|
Basic |
|
$ |
(1.47 |
) |
|
$ |
0.60 |
|
|
$ |
(0.21 |
) |
|
$ |
0.09 |
|
|
$ |
(0.13 |
) |
|
Diluted |
|
$ |
(1.47 |
) |
|
$ |
0.58 |
|
|
$ |
(0.21 |
) |
|
$ |
0.09 |
|
|
$ |
(0.13 |
) |
|
(1) |
Fiscal year ended January 3, 2017 contains the results of operations for 53 weeks. |
|
(2) |
Share and per share data have been adjusted for all periods presented to reflect a five-for-one reverse stock split effective May 31, 2013. |
31
Selected Balance Sheet and Operating Data
(in thousands, fiscal years ended):
|
|
|
January 3, 2017 |
|
|
December 29, 2015 |
|
|
December 30, 2014 |
|
|
December 31, 2013 |
|
|
January 1, 2013 |
|
|||||
|
Cash and cash equivalents |
|
$ |
7,133 |
|
|
$ |
19,730 |
|
|
$ |
17,750 |
|
|
$ |
32,386 |
|
|
$ |
31,486 |
|
|
Total assets |
|
|
41,620 |
|
|
|
69,616 |
|
|
|
92,489 |
|
|
|
97,916 |
|
|
|
93,613 |
|
|
Total liabilities |
|
|
55,397 |
|
|
|
64,625 |
|
|
|
75,744 |
|
|
|
71,074 |
|
|
|
72,101 |
|
|
Series B redeemable preferred stock |
|
|
— |
|
|
|
— |
|
|
|
— |
|
|
|
— |
|
|
|
7,916 |
|
|
Total shareholders’ (deficit) equity |
|
|
(13,777 |
) |
|
|
4,991 |
|
|
|
16,745 |
|
|
|
26,842 |
|
|
|
13,596 |
|
|
Total liabilities and shareholders’ (deficit) equity |
|
|
41,620 |
|
|
|
69,616 |
|
|
|
92,489 |
|
|
|
97,916 |
|
|
|
93,613 |
|
|
Selected Operating Data |
|
|
|
|
|
|
|
|
|
|
|
|
|
|
|
|
|
|
|
|
|
Percentage change in Company Store comparable sales(1) |
|
|
0.8 |
% |
|
|
1.5 |
% |
|
|
2.8 |
% |
|
|
0.5 |
% |
|
|
5.1 |
% |
|
Total Company Stores |
|
|
66 |
|
|
|
70 |
|
|
|
263 |
|
|
|
268 |
|
|
|
301 |
|
|
Total Franchise Stores - Domestic |
|
|
773 |
|
|
|
748 |
|
|
|
543 |
|
|
|
535 |
|
|
|
473 |
|
|
Total International Stores |
|
|
70 |
|
|
|
75 |
|
|
|
62 |
|
|
|
48 |
|
|
|
35 |
|
|
Total Stores |
|
|
909 |
|
|
|
893 |
|
|
|
868 |
|
|
|
851 |
|
|
|
809 |
|
|
(1) |
Percentage change in Company Store comparable sales compares the sales of Company Stores during the current fiscal year to the sales from the same Company Stores for the prior fiscal year. A Company Store is included in this calculation after its first full fiscal year of operations. Sales from Franchise and International Stores are not included in the Company Store comparable sales. |
32
You should read the following discussion and analysis in conjunction with Part II, Item 6 “Selected Financial Data” and our audited consolidated financial statements and the related notes thereto included in Item 8 “Financial Statements and Supplementary Data.” In addition to historical consolidated financial information, this discussion contains forward-looking statements that reflect our plans, estimates and beliefs. Actual results could differ from these expectations as a result of factors including those described under Item 1A, “Risk Factors,” “Special Note Regarding Forward-Looking Statements” and elsewhere in this Form 10-K.
JAMBA, INC. OVERVIEW
Jamba, Inc. through its wholly-owned subsidiary, Jamba Juice Company, is a healthful, active lifestyle brand with a robust global business driven by a portfolio of franchised and company-owned Jamba Juice ® stores and Jamba Juice ExpressTM formats. We are a leading restaurant retailer of “better-for-you” specialty beverage and food offerings which include flavorful, whole fruit and vegetable smoothies, fresh squeezed juices and juice blends, Energy Bowls™, signature “boosts”, shots and a variety of food items including: hot oatmeal, breakfast wraps, sandwiches, Artisan Flatbreads™, baked goods and snacks.
We operate on a 52 or 53 week fiscal year ending on the Tuesday closest to December 31st. Our fiscal quarters are comprised of 13 weeks, with the exception of the fourth quarter of a 53 week year, which contains 14 weeks. Fiscal year 2016 contained 53 weeks and fiscal years 2015 and 2014 each contained 52 weeks.
Fiscal 2016 Financial and Business Highlights
|
|
• |
Franchisees opened 73 new Jamba Juice stores globally; which included 27 traditional stores, 17 non-traditional stores, 10 Jamba Juice Express in the United States and 19 new International Stores. |
|
|
• |
At January 3, 2017, there were 909 stores globally, including 47 express format stores: 66 Company Stores, 773 Domestic Franchise Stores and 70 International Stores. |
|
|
• |
Company Store comparable sales increased 0.8%. This is the sixth consecutive fiscal year of comparable store sales growth for Company Stores. |
|
|
• |
Total revenue for the year decreased $82.1 million to $79.6 million from $161.7 million for the prior year. We substantially completed our move to an asset-light model during our 2015 fiscal year and we now have 93% of our locations owned by experienced franchisees. As a result, Company Store revenue (and related expense) comparisons to the prior year reflected significant decreases on a quarterly and annual basis for fiscal 2015 and fiscal 2016. |
|
|
• |
System-wide comparable sales (includes both Company and Franchise stores) declined 0.2% for the year compared to the prior year. The decline results from a reduction in transaction count, partially offset by an increase in the average check amount. Franchise Store comparable sales declined 0.3%. System-wide and Franchise Store comparable store sales are non-GAAP financial measures and represent the change in year-over-year sales, for stores opened for at least one full fiscal year. |
|
|
• |
Loss from operations was $(22.2) million and operating margin was (27.8%) for the year. General and administrative expenses (“G&A”) for the year increased $ 1.1 million, or 2.9%, to $38.0 million or 47.7% as a percentage of total revenue, for the fiscal year 2016, compared to $36.9 million, or 22.8% as a percentage of total revenue, in the prior year. Included in the 2016 results were $7.4 million of expenses related to the relocation of our corporate headquarters, impairment charges of $3.4 million and $2.0 million due to legal proceedings. |
33
|
|
• |
During the fourth quarter, after a detailed analysis of the performance and potential of JambaGO®, we managed a controlled exit that was substantially completed at the end of Q1 2017. As of January 3, 2017, we accrued $0.9 million primarily related to contract termination costs. We also recognized a non-cash charge, relating to impairment of property, plant and equipment, of approximately $2.3 million related to this exit. As of January 3, 2017, assets of $0.2 million related to JambaGO® were reclassified to assets held for sale in the consolidated balance sheets. |
|
|
• |
In the fourth quarter we completed the refranchising of a Company Store in Emeryville, California. We also announced that we are exploring the refranchising 13 company-owned operations in the Chicago area which was subsequently completed in the second quarter of 2017. The Chicago transaction would include a development agreement to grow the market over the next several years. We recognized a non-cash charge, relating to impairment of property, plant and equipment for these Chicago stores, of approximately $0.7 million. |
34
The discussion that follows should be read in conjunction with the consolidated financial statements and notes thereto. The following table sets forth selected operating data as a percentage of total revenue (unless otherwise noted), of certain items included in our consolidated statements of operations, for the periods indicated.
|
|
|
Fiscal Year Ended (1) |
|
|||||||||
|
|
|
January 3, 2017 |
|
|
December 29, 2015 |
|
|
December 30, 2014 |
|
|||
|
Revenue: |
|
|
|
|
|
|
|
|
|
|
|
|
|
Company Stores |
|
|
64.4 |
% |
|
|
84.8 |
% |
|
|
91.1 |
% |
|
Franchise and other revenue |
|
|
35.6 |
% |
|
|
15.2 |
% |
|
|
8.9 |
% |
|
Total revenue |
|
|
100.0 |
% |
|
|
100.0 |
% |
|
|
100.0 |
% |
|
Costs and operating expenses (income): |
|
|
|
|
|
|
|
|
|
|
|
|
|
Cost of sales |
|
|
24.6 |
% |
|
|
24.6 |
% |
|
|
26.3 |
% |
|
Labor |
|
|
34.9 |
% |
|
|
32.6 |
% |
|
|
31.1 |
% |
|
Occupancy |
|
|
14.9 |
% |
|
|
13.8 |
% |
|
|
13.9 |
% |
|
Store operating |
|
|
18.1 |
% |
|
|
18.4 |
% |
|
|
16.6 |
% |
|
Depreciation and amortization |
|
|
7.2 |
% |
|
|
4.1 |
% |
|
|
4.6 |
% |
|
General and administrative |
|
|
47.7 |
% |
|
|
22.8 |
% |
|
|
17.1 |
% |
|
Loss (gain) on disposal of assets |
|
|
1.0 |
% |
|
|
(13.4 |
)% |
|
|
(1.4 |
)% |
|
Store pre-opening |
|
|
1.5 |
% |
|
|
0.6 |
% |
|
|
0.3 |
% |
|
Impairment of long-lived assets |
|
|
4.3 |
% |
|
|
1.6 |
% |
|
|
0.1 |
% |
|
Store lease termination and closure |
|
|
5.2 |
% |
|
|
1.0 |
% |
|
|
0.3 |
% |
|
Other operating, net |
|
|
1.4 |
% |
|
|
1.1 |
% |
|
|
0.3 |
% |
|
Total costs and operating expenses (income): |
|
|
127.8 |
% |
|
|
93.7 |
% |
|
|
101.5 |
% |
|
(Loss) income from operations |
|
|
(27.8 |
)% |
|
|
6.3 |
% |
|
|
(1.5 |
)% |
|
Other income (expense): |
|
|
|
|
|
|
|
|
|
|
|
|
|
Interest income |
|
|
0.3 |
% |
|
|
0.1 |
% |
|
|
0.1 |
% |
|
Interest expense |
|
|
(0.6 |
)% |
|
|
(0.1 |
)% |
|
|
(0.1 |
)% |
|
Total other expense, net |
|
|
(0.2 |
)% |
|
|
(0.1 |
)% |
|
|
0.0 |
% |
|
(Loss) income before income taxes |
|
|
(28.1 |
)% |
|
|
6.3 |
% |
|
|
(1.5 |
)% |
|
Income tax expense |
|
|
(0.1 |
)% |
|
|
(0.4 |
)% |
|
|
(0.1 |
)% |
|
Net (loss) income |
|
|
(28.2 |
)% |
|
|
5.9 |
% |
|
|
(1.6 |
)% |
|
Less: Net income attributable to noncontrolling interest |
|
|
0.0 |
% |
|
|
(0.1 |
)% |
|
|
0.0 |
% |
|
Net (loss) income attributable to Jamba, Inc. |
|
|
(28.2 |
)% |
|
|
5.8 |
% |
|
|
(1.6 |
)% |
|
(1) |
Cost of sales, labor, occupancy and store operating expense percentages are calculated using Company Stores revenue. All other line items are calculated using total revenue. Certain percentage amounts do not sum to total due to rounding. |
Known Events, Trends or Uncertainties Impacting or Expected to Impact Comparisons of Reported or Future Results
Management reviews and discusses its operations based on both financial and non-financial metrics. Among the key financial metrics upon which management focuses is performance based on the Company’s consolidated GAAP results, including Company Store comparable sales, franchise and other revenue, and income from operations. Management also uses certain supplemental, non-GAAP financial metrics in evaluating financial results, including Franchise Store comparable sales and system-wide comparable sales.
Company Store comparable sales represents the change in year-over-year sales for all Company Stores opened for at least one full year. Franchise Store comparable sales, a non-GAAP financial measure, represents the change in year-over-year sales for all Franchise Stores opened for at least one full year, as reported by franchisees excluding International Stores. System-wide comparable store sales, a non-GAAP financial measure, represents the change in year over-year sales for all Company and Franchise Stores opened for at least one full year and is based on sales by both company-owned and domestic franchise operated stores, as reported by franchisees, which are in the store base. System-wide comparable store sales excludes International Stores, JambaGO® units and Jamba Juice Express™.
35
Company-owned stores that were sold in refranchising transactions are included in the store base for each accounting period of the fiscal quarter in which the store was sold to the extent the sale is consummated at least three days prior to the end of such accounting period, but only for the days such stores have been company-owned. Thereafter, such stores are excluded from the store base until such stores have been franchise-operated for at least one full fiscal period at which point such stores are included in the store base and compared to sales in the comparable period of the prior year. Comparable store sales exclude closed locations.
We review the increase or decrease in Company Store comparable sales, Franchise Store comparable sales and system-wide comparable sales compared with the same period in the prior year to assess business trends and make certain business decisions. We believe that Franchise Store comparable sales and system-wide comparable sales data, both non-GAAP financial measures, are useful in assessing the overall performance of the Jamba brand and, ultimately, the performance of the Company.
We underwent significant changes in our business model, leadership, key personnel, and relocation of our corporate office. These changes resulted in a significant increase in non-routine transactions and impacted certain routine processes needed to effectively accumulate and present consolidated financial results. We identified that our risk assessment process, which was intended to identify new transactions and changes to existing processes and design appropriate control activities over financial reporting, was not sufficient to prevent or detect material misstatement on a timely basis. Consequently, a material weakness in internal control over financial reporting resulted and is described in “ITEM 9A. Controls and Procedures.” Management has begun implementing a plan to assess risks of material misstatement over financial reporting, including the enhancement of internal control activities, and training of key process owners. Management, with the oversight of the Audit Committee has dedicated significant incremental resources to successfully implement and test effectiveness of the enhanced controls throughout fiscal 2017. G&A expenses are expected to be negatively impacted by costs in connection with the remediation plan in fiscal 2017.
On December 22, 2017 the U.S. government passed sweeping tax legislation with the “Tax Cuts and Jobs Act” which includes significant changes to the taxation of business entities. These legislative changes begin to take effect after December 31, 2017. These changes include, among others, (i) a permanent reduction of the corporate income tax rate to a flat 21%, (ii) a repeal of the corporate alternative minimum tax (AMT), (iii) changes to tax depreciation for first-year property, luxury automobiles and qualified leasehold improvements, (iv) a partial limitation on the deductibility of business interest expense, (v) for losses incurred after December 21, 2017 the NOL deduction is limited to 80% of taxable income with an indefinite carry forward and (vi) a disallowance of entertainment expenses but an expansion of the types of expenses allowable as a 50% business meal expenditure. Notwithstanding the reduction in the corporate income tax rate, the overall impact of this tax reform is uncertain, we continue to assess the impact of the recently enacted federal tax reform legislation on our business and our consolidated financial statements.
Key Financial Metrics
The following table sets forth operating data that do not otherwise appear in our consolidated financial statements for the periods indicated:
|
|
|
Fiscal Year Ended |
|
|||||||||||||||||||||
|
|
|
January 3, 2017 (3) |
|
|
December 29, 2015 |
|
||||||||||||||||||
|
|
|
Company Stores(1) |
|
|
Franchise Stores(1) |
|
|
System-wide Stores(2) |
|
|
Company Stores(1) |
|
|
Franchise Stores(1) |
|
|
System-wide Stores(2) |
|
||||||
|
Traffic |
|
|
(2.4 |
)% |
|
|
(4.8 |
)% |
|
|
(4.5 |
)% |
|
|
(3.5 |
)% |
|
|
(3.9 |
)% |
|
|
(3.9 |
)% |
|
Average check |
|
|
3.2 |
% |
|
|
4.5 |
% |
|
|
4.3 |
% |
|
|
5.0 |
% |
|
|
6.6 |
% |
|
|
6.2 |
% |
|
Total comparable store sales |
|
|
0.8 |
% |
|
|
(0.3 |
)% |
|
|
(0.2 |
)% |
|
|
1.5 |
% |
|
|
2.7 |
% |
|
|
2.3 |
% |
|
(1) |
Percentage change in comparable sales compares sales during the current fiscal year to sales from the same stores for the prior fiscal year. A store is included in this calculation after its first full fiscal year of operations. Company Store comparable sales excludes sales from Franchise and International Stores. Franchise Store comparable sales excludes sales from Company, International Stores and closed locations. |
36
|
(3) |
Year ended January 3, 2017 amounts are calculated based on 52 weeks. |
The following table sets forth certain data relating to Company Stores, Franchise Stores and International Stores for the periods indicated:
|
|
|
Fiscal Year Ended |
|
|||||||||
|
|
|
January 3, 2017 |
|
|
December 29, 2015 |
|
|
December 30, 2014 |
|
|||
|
Company Stores: |
|
|
|
|
|
|
|
|
|
|
|
|
|
Beginning of year |
|
|
70 |
|
|
|
263 |
|
|
|
268 |
|
|
Company Stores opened |
|
|
2 |
|
|
|
— |
|
|
|
0 |
|
|
Company Stores acquired from franchisees |
|
|
— |
|
|
|
2 |
|
|
|
26 |
|
|
Company Stores closed |
|
|
(5 |
) |
|
|
(16 |
) |
|
|
(13 |
) |
|
Company Stores sold to franchisees |
|
|
(1 |
) |
|
|
(179 |
) |
|
|
(18 |
) |
|
Total Company Stores |
|
|
66 |
|
|
|
70 |
|
|
|
263 |
|
|
|
|
Fiscal Year Ended |
|
|||||||||
|
|
|
January 3, 2017 |
|
|
December 29, 2015 |
|
|
December 30, 2014 |
|
|||
|
Franchise Stores - Domestic: |
|
|
|
|
|
|
|
|
|
|
|
|
|
Beginning of year |
|
|
748 |
|
|
|
543 |
|
|
|
535 |
|
|
Franchise Stores opened |
|
|
54 |
|
|
|
51 |
|
|
|
43 |
|
|
Franchise Stores purchased by Company |
|
|
— |
|
|
|
(2 |
) |
|
|
(26 |
) |
|
Franchise Stores closed |
|
|
(30 |
) |
|
|
(23 |
) |
|
|
(27 |
) |
|
Franchise Stores purchased from Company |
|
|
1 |
|
|
|
179 |
|
|
|
18 |
|
|
Total Franchise Stores - Domestic |
|
|
773 |
|
|
|
748 |
|
|
|
543 |
|
|
|
|
Fiscal Year Ended |
|
|||||||||
|
|
|
January 3, 2017 |
|
|
December 29, 2015 |
|
|
December 30, 2014 |
|
|||
|
International Stores: |
|
|
|
|
|
|
|
|
|
|
|
|
|
Beginning of year |
|
|
75 |
|
|
|
62 |
|
|
|
48 |
|
|
International Stores opened |
|
|
19 |
|
|
|
22 |
|
|
|
24 |
|
|
International Stores closed |
|
|
(24 |
) |
|
|
(9 |
) |
|
|
(10 |
) |
|
Total International Stores |
|
|
70 |
|
|
|
75 |
|
|
|
62 |
|
|
Grand Total |
|
|
909 |
|
|
|
893 |
|
|
|
868 |
|
Transition to an asset-light model
Under our accelerated refranchising initiative, announced in November 2014, we completed the sale of 179 Company Stores during the year ended December 29, 2015 as part of our transition to an asset-light business model. Additionally, in the fourth quarter of 2016, we completed the refranchising of a Company Store in Emeryville, California related to our move to Frisco, Texas. Over the long term, we believe our accelerated asset-light model initiative is a key driver to accelerate unit growth, reduce general and administrative costs and to achieve certain operational efficiencies. The transition to an asset-light model was substantially completed in fiscal 2015, however, the Company will continually assess refranchising stores to drive continued growth.
37
As part of the refranchising transactions, where feasible, we entered into development agreements which will commit the buyers to build additional Franchise Stores in territories occupied by the purchased stores. In addition, the buyers of mature Company Stores are generally obligated to refresh and refurbish these stores within certain timeframes.
Due to the refranchise activity that occurred throughout fiscal 2015, Company Store revenue (and related expense) comparisons to the prior year reflect significant decreases on a quarterly and annual basis for fiscal 2016.
Revenue
Fiscal Year 2016 to Fiscal Year 2015
Total revenue is comprised of revenue from Company Stores, royalties and fees from Franchise Stores in the U.S. and from International Stores, income from JambaGO® locations and license income from sales of Jamba-branded CPG products. Total revenue in fiscal 2016 decreased by $82.1 million, or 50.8%, compared to fiscal 2015. The following table summarizes revenue for the periods indicated (dollars in thousands):
|
|
|
Fiscal Year Ended January 3, 2017 |
|
|
% of Total Revenue |
|
|
Fiscal Year Ended December 29, 2015 |
|
|
% of Total Revenue |
|
|
Fiscal Year Ended December 30, 2014 |
|
|
% of Total Revenue |
|
||||||
|
Revenue: |
|
|
|
|
|
|
|
|
|
|
|
|
|
|
|
|
|
|
|
|
|
|
|
|
|
Company Stores |
|
$ |
51,282 |
|
|
|
64.4 |
% |
|
$ |
137,025 |
|
|
|
84.8 |
% |
|
$ |
198,737 |
|
|
|
91.1 |
% |
|
Franchise and other revenue |
|
|
28,341 |
|
|
|
35.6 |
% |
|
|
24,651 |
|
|
|
15.2 |
% |
|
|
19,311 |
|
|
|
8.9 |
% |
|
Total revenue |
|
$ |
79,623 |
|
|
|
100.0 |
% |
|
$ |
161,676 |
|
|
|
100.0 |
% |
|
$ |
218,048 |
|
|
|
100.0 |
% |
Company Store revenue
Company Store revenue in fiscal 2016 decreased $85.7 million or 62.6% compared to fiscal 2015. The decrease in Company Store revenue is primarily due to the reduction of 179 Company Stores due to our refranchising strategy, partially offset by the increase in comparable store sales and the 53rd fiscal week, as illustrated by the following table (dollars in thousands):
|
|
|
Company Store Decrease in Revenue 2016 vs. 2015 |
|
|
|
Company Store comparable sales increase |
|
$ |
388 |
|
|
Impact of 53rd operating week |
|
|
735 |
|
|
Reduction in Company Store revenue due to decrease in the number of Company Stores, net |
|
|
(86,866 |
) |
|
Total change in Company Store revenue |
|
$ |
(85,743 |
) |
Company Store comparable sales increased $0.4 million in fiscal 2016, or 0.8%, attributable to a 3.2% increase in average check, offset by a 2.4% decrease in transaction count. The increase in average check was driven by product mix as we continue to increase the sales in bowl and higher ticket items.
Franchise and other revenue
Franchise and other revenue in fiscal 2016 increased by $3.7 million, or 15.0%, compared to fiscal 2015. The increase was primarily due to royalties received on a larger base of Franchise and International Stores, fees recognized and the 53rd fiscal week and partially offset by Franchise Store comparable store sales decrease of 0.3%. Other revenue, which primarily includes revenue from CPG and JambaGO®, decreased by $1.5 million or 25.6% to $4.3 million, compared to $5.8 million in fiscal 2015.
38
The number of Franchise Stores and International Stores grew to 843 as of January 3, 2017 compared to 823 as of December 29, 2015.
Fiscal Year 2015 to Fiscal Year 2014
Total revenue in fiscal 2015 decreased $56.4 million, or 25.9%, compared to fiscal 2014. Total revenue is comprised of revenue from Company Stores, royalties and fees from Franchise Stores in the U.S. and from International Stores, income from JambaGO® locations, license income from sales of Jamba-branded CPG products and direct sales of CPG products.
Company Store revenue
Company Store revenue in fiscal 2015 was $137.0 million, a decrease of $61.7 million, or 31.1%, compared to $198.7 million in fiscal 2014. The decrease in Company Store revenue is primarily due to the reduction of 179 Company Stores due to our refranchising strategy and partially offset by the increase in comparable store sales as illustrated by the following table (dollars in thousands):
|
|
|
Company Store Decrease in Revenue 2015 vs. 2014 |
|
|
|
Company Store comparable sales increase |
|
$ |
2,050 |
|
|
Reduction in Company Store revenue due to decrease in the number of Company Stores, net |
|
|
(63,762 |
) |
|
Total change in Company Store revenue |
|
$ |
(61,712 |
) |
Company Store comparable sales increased $2.1 million in fiscal 2015, or 1.5%, primarily attributable to a 5.0% increase in average check offset by a 3.5% decrease in transaction count related to the significantly reduced number of promotions run in fiscal 2015 compared to fiscal 2014.
Franchise and other revenue
Franchise and other revenue in fiscal 2015 increased $5.3 million, or 27.7%, compared to fiscal 2014 primarily due to an increase in the number of Franchise and International Stores. Other revenue, which primarily includes revenue from JambaGO® and CPG, increased by $0.3 million, or 6.9%, to $5.8 million, compared to $5.5 million in fiscal 2014.
The number of Franchise Stores and International Stores grew to 823 as of December 29, 2015 compared to 605 as of December 30, 2014.
Cost of sales
Cost of sales is comprised of produce, dairy, and other products used to make smoothies and juices and paper products. The following table summarizes cost of sales for the periods indicated (dollars in thousands):
|
|
|
Fiscal Year Ended |
|
|
|
|
|
|
|
|
|
|||||||||
|
|
|
January 3, 2017 |
|
|
December 29, 2015 |
|
|
December 30, 2014 |
|
|
% Change in 2016 |
|
|
% Change in 2015 |
|
|||||
|
Cost of sales |
|
$ |
12,601 |
|
|
$ |
33,737 |
|
|
$ |
52,236 |
|
|
|
(62.6 |
)% |
|
|
(35.4 |
)% |
|
Percentage of company stores revenue |
|
|
24.6 |
% |
|
|
24.6 |
% |
|
|
26.3 |
% |
|
|
|
|
|
|
|
|
39
Cost of sales in fiscal 2016 as a percentage of Company Store revenue, was unchanged compared to fiscal 2015 primarily due to favorable commodity pricing driven by strawberries and mangos (approximately 1.0%) and menu price increases (approximately 0.4%) and partially offset by product mix shift (approximately 0.7%), increased discounts (approximately 0.4%) and change in store base (approximately 0.2%). Cost of sales for fiscal 2016 decreased $21.1 million compared to fiscal 2015, primarily due to the decrease in number of Company Stores as a result of our transition to an asset-light model.
The decrease in cost of sales in fiscal 2015 as a percentage of Company Store revenue was primarily due to the benefit from lower sales discounts (approximately 1.4%), commodities pricing and product mix shift between smoothies and juices (approximately 0.5%) and partially offset by an increase in waste (approximately 0.2%). Cost of sales for fiscal 2015 decreased compared to fiscal 2014 primarily due to the decrease in number of Company Stores as a result of our transition to an asset-light model.
Labor
Labor costs are comprised of store management salaries and bonuses, hourly team member payroll, training costs and other associated fringe benefits. The following table summarizes labor costs for the periods indicated (dollars in thousands):
|
|
|
Fiscal Year Ended |
|
|
|
|
|
|
|
|
|
|||||||||
|
|
|
January 3, 2017 |
|
|
December 29, 2015 |
|
|
December 30, 2014 |
|
|
% Change in 2016 |
|
|
% Change in 2015 |
|
|||||
|
Labor |
|
$ |
17,872 |
|
|
$ |
44,732 |
|
|
$ |
61,749 |
|
|
|
(60.0 |
)% |
|
|
(27.6 |
)% |
|
Percentage of company stores revenue |
|
|
34.9 |
% |
|
|
32.6 |
% |
|
|
31.1 |
% |
|
|
|
|
|
|
|
|
The increase in labor in fiscal 2016, as a percentage of Company Store revenue, was primarily attributable to the change in store base (approximately 1.7%), increased wage rates (approximately 0.7%), reduced labor efficiency (approximately 0.6%) due to outages in the Company’s labor scheduling system in the second and third quarters of 2016. These charges are partially offset by lower fringe benefits (approximately 0.8%) driven by worker’s comp. Labor costs for fiscal 2016 decreased $26.9 million compared to fiscal 2015 primarily due to the decrease in number of Company Stores as a result of our transition to an asset-light model.
The increase in labor in fiscal 2015 as a percentage of Company Store revenue was primarily attributable to the California minimum wage rate increase that was effective July 1, 2014 (approximately 1.2%), an increase in Health Insurance costs due to the Affordable Care Act (approximately 0.5%) and higher wages from the reacquired Chicago store portfolio which occurred in the third quarter of fiscal 2014 (approximately 1.0%) offset favorably by higher Sales leverage and increased staffing efficiencies and operational optimization (approximately 0.9%). Labor costs for fiscal 2015 decreased $17.0 million compared to fiscal 2014, primarily resulting from our transition to an asset-light model.
Occupancy
Occupancy costs include both fixed and variable portions of rent, common area maintenance charges, property taxes, licenses and property insurance for all Company Store locations. The following table summarizes occupancy costs for the periods indicated (dollars in thousands):
|
|
|
Fiscal Year Ended |
|
|
|
|
|
|
|
|
|
|||||||||
|
|
|
January 3, 2017 |
|
|
December 29, 2015 |
|
|
December 30, 2014 |
|
|
% Change in 2016 |
|
|
% Change in 2015 |
|
|||||
|
Occupancy |
|
$ |
7,659 |
|
|
$ |
18,951 |
|
|
$ |
27,630 |
|
|
|
(59.6 |
)% |
|
|
(31.4 |
)% |
|
Percentage of company stores revenue |
|
|
14.9 |
% |
|
|
13.8 |
% |
|
|
13.9 |
% |
|
|
|
|
|
|
|
|
40
The increase in occupancy costs in fiscal 2016, as a percentage of Company Store revenue, was primarily due to common area maintenance (approximately 0.8%), property taxes (approximately 0.4%), rent (approximately 0.2%) and insurance (approximately 0.2%) and partially offset by sales leverage (approximately 0.4%). Occupancy costs for fiscal 2016 decreased $11.3 million, or 59.6%, compared to fiscal 2015 primarily due to the decrease in number of Company Stores as a result of our transition to an asset-light model.
In fiscal 2015 as a percentage of Company Store revenue, occupancy costs were relatively flat, 13.8% in fiscal 2015, compared to 13.9% in fiscal 2014. Occupancy costs for fiscal 2015 decreased by $8.7 million, or 31.4%, compared to fiscal 2014. The decrease in occupancy costs was primarily due to the decrease in the number of Company Stores as a result of our transition to an asset-light model.
Store operating expenses
Store operating expenses consist of various store-level costs such as utilities, marketing, repairs and maintenance, credit card fees and other store operating expenses. The following table summarizes store operating expenses for the periods indicated (dollars in thousands):
|
|
|
Fiscal Year Ended |
|
|
|
|
|
|
|
|
|
|||||||||
|
|
|
January 3, 2017 |
|
|
December 29, 2015 |
|
|
December 30, 2014 |
|
|
% Change in 2016 |
|
|
% Change in 2015 |
|
|||||
|
Store operating |
|
$ |
9,285 |
|
|
$ |
25,152 |
|
|
$ |
33,089 |
|
|
|
(63.1 |
)% |
|
|
(24.0 |
)% |
|
Percentage of company stores revenue |
|
|
18.1 |
% |
|
|
18.4 |
% |
|
|
16.6 |
% |
|
|
|
|
|
|
|
|
The decrease in store operating expense in fiscal 2016, as a percentage of Company Store revenue, is primarily due to lower store-level advertising costs (approximately 0.9%), sales leverage (0.6%), and partially offset by an increase in hardware/software expenses (approximately 0.5%) and credit card fees (approximately 0.5%). Total store operating expenses for fiscal 2016 decreased by $15.9 million, or 63.1%, compared to fiscal 2015 primarily due to the decrease in the number of Company Stores as a result of our transition to an asset-light model.
The increase in total store operating expenses in fiscal 2015 as a percentage of Company Store revenue was primarily due to an increase to advertising costs (approximately 1.1%), uniform costs related to the new-look roll-out (approximately 0.2%), repairs and maintenance costs to prepare stores for refranchising (approximately 0.1%) and utilities (approximately 0.1%). Total store operating expenses for fiscal 2015 decreased by $7.9 million, or 24.0%, compared to fiscal 2014, primarily resulting from our transition to an asset-light model, which was primarily due to the decrease in the number of Company Stores as a result of our transition to an asset-light model.
Depreciation and amortization
Depreciation and amortization expenses include the depreciation of fixed assets and the amortization of intangible assets. The following table summarizes depreciation and amortization for the periods indicated (dollars in thousands):
|
|
|
Fiscal Year Ended |
|
|
|
|
|
|
|
|
|
|||||||||
|
|
|
January 3, 2017 |
|
|
December 29, 2015 |
|
|
December 30, 2014 |
|
|
% Change in 2016 |
|
|
% Change in 2015 |
|
|||||
|
Depreciation and amortization |
|
$ |
5,749 |
|
|
$ |
6,569 |
|
|
$ |
10,084 |
|
|
|
(12.5 |
)% |
|
|
(34.9 |
)% |
|
Percentage of total revenue |
|
|
7.2 |
% |
|
|
4.1 |
% |
|
|
4.6 |
% |
|
|
|
|
|
|
|
|
The decrease in depreciation and amortization in fiscal 2016 was primarily due to the discontinuation of depreciation relating to stores refranchised in the prior year which were partially offset by an increase in depreciation relating to capitalized information technology corporate programs and a correction in the current year of an immaterial prior period adjustment which overstated depreciation expense by approximately $0.2 million for fiscal year 2016.
41
The decrease in depreciation and amortization in fiscal 2015 was primarily due to reclassification from property, fixtures and equipment to assets held for sale for stores prior to their refranchising and the resulting discontinuation of depreciation on those assets. Depreciation and amortization for fiscal 2015 decreased $3.5 million, or 34.9%, compared to fiscal 2014.
General and administrative
G&A expenses include costs associated with our corporate headquarters (in Emeryville, California and Frisco, Texas), field supervision, performance related incentives, outside and contract services, accounting and legal fees, travel and travel-related expenses, share-based compensation and other G&A expenses. Also included in G&A are costs related to the move of the support center to Frisco, Texas, settlement and other legal costs. The following table summarizes G&A expenses for the periods indicated (dollars in thousands):
|
|
|
Fiscal Year Ended |
|
|
|
|
|
|
|
|
|
|||||||||
|
|
|
January 3, 2017 |
|
|
December 29, 2015 |
|
|
December 30, 2014 |
|
|
% Change in 2016 |
|
|
% Change in 2015 |
|
|||||
|
General and administrative |
|
$ |
37,958 |
|
|
$ |
36,872 |
|
|
$ |
37,278 |
|
|
|
2.9 |
% |
|
|
(1.1 |
)% |
|
Percentage of total revenue |
|
|
47.7 |
% |
|
|
22.8 |
% |
|
|
17.1 |
% |
|
|
|
|
|
|
|
|
Total G&A expenses for fiscal 2016 increased by $1.1 million, or 2.9%, compared to fiscal 2015. The increase in total G&A expenses was primarily due to costs related to our relocation to Frisco, Texas (approximately $7.4 million) and legal settlement and liability for ongoing legal action (approximately $2.0 million) and a correction for an immaterial understatement of prior period expenses (approximately $0.5 million) which were partially offset by a decline in share-based compensation expenses (approximately $2.6 million) and lower expenses related to our organizational changes resulting from our shift to an asset-light model. The increase in G&A expenses in fiscal 2016 as a percentage of total revenue is primarily due to a fewer number of Company Stores contributing revenue as a result of our transition to an asset-light model.
Total G&A expenses for fiscal 2015 decreased $0.4 million, or 1.1%, compared to fiscal 2014. The decrease of total G&A expenses was primarily due to decrease in payroll related costs as a result of reduced general and administrative headcount (approximately $4.8 million) and travel costs (approximately $0.6 million) offset by an increase in professional fees (approximately $2.8 million), former Chief Executive Officer’s severance and bonus (approximately $0.8 million), other senior executives’ severance and bonus (approximately $0.6 million) and increased stock compensation expenses related to stock modifications (approximately $0.8 million). During fiscal year 2015 we incurred costs due to the transition and termination agreements related to our former CEO and other senior executives. We also continue to incur costs related to our full transition from a company business model to a franchise model.
Loss (gain) on disposal of assets
Loss (gain) on disposal of assets includes losses or gains from the sales of related furniture, fixtures and equipment and refranchising of Company Stores.
For the fiscal year 2016, the Company recognized a loss on disposal of assets of $0.8 million compared to a gain of $21.6 million in fiscal year 2015. In fiscal 2016, the decrease in the disposal of assets gain relates to the gain on refranchising 179 Company Stores in fiscal 2015 relating to our transition to an asset-light model as well as a correction of an understated prior period loss (approximately $0.2 million).
For the fiscal year 2015, the Company recognized gain on disposal of assets of $21.6 million compared to $3.0 million in fiscal year 2014. The increase was primarily due to the gain on refranchising 179 Company Stores relating to our transition to an asset-light model that was begun in fiscal 2014 to transition the company to an asset-light business model.
42
Store pre-opening consists of costs incurred in connection with start-up and promotion of new store openings as well as rent from possession date to store opening date are expensed as incurred.
The following table summarizes store pre-opening for the periods indicated (dollars in thousands):
|
|
|
Fiscal Year Ended |
|
|
|
|
|
|
|
|
|
|||||||||
|
|
|
January 3, 2017 |
|
|
December 29, 2015 |
|
|
December 30, 2014 |
|
|
% Change in 2016 |
|
|
% Change in 2015 |
|
|||||
|
Store pre-opening |
|
$ |
1,224 |
|
|
$ |
1,031 |
|
|
$ |
763 |
|
|
|
18.7 |
% |
|
|
35.1 |
% |
|
Percentage of total revenue |
|
|
1.5 |
% |
|
|
0.6 |
% |
|
|
0.3 |
% |
|
|
|
|
|
|
|
|
For the fiscal year 2016, store pre-opening increased to $1.2 million compared to $1.0 million for the fiscal year 2015, an increase of $0.2 million primarily related to the opening of two Company Stores in 2016, juice bar remodels and opening 3 additional franchise stores in 2016 compared to 2015.
For the fiscal year 2015, store pre-opening increased to $1.0 million compared to $0.8 million for the fiscal year 2014. The increase in expense of $0.2 million was primarily due to more new store openings over the prior year.
Impairment of long-lived assets
We evaluate long-lived assets for impairment when facts and circumstances indicate that the carrying values of long-lived assets may not be recoverable.
For the fiscal year 2016, impairment of long-lived assets was $3.4 million compared to $2.5 million for the fiscal year 2015. The increase in expense of $0.9 million was primarily related to the loss recorded to reflect assets associated with JambaGO® exit ($2.3 million) and other long-lived assets.
For the fiscal year 2015, impairment of long-lived assets was $2.5 million compared to $0.2 million for the fiscal year 2014. The increase in expense of $2.3 million was primarily due to the non-cash impairment loss relating to stores classified as assets held for sale in the third quarter of fiscal 2015, assets associated with Talbott Teas and other long-lived assets.
Store lease termination and closure
Store lease termination and closure costs consists of expenses incurred when closing a store. At the date the Company ceases use of a store under an operating lease, a liability is recorded for the net present value of any remaining lease obligations, net of estimated sublease income, if any. For the fiscal year 2016, store lease termination and closure was $4.2 million compared to $1.7 million for the fiscal year 2015. The increase in expense of $2.5 million was related to closing a newer Company Store and related fixed assets before lease expiration.
For the fiscal year 2015, store lease termination and closure was an expense of $1.7 million compared to an expense of $0.6 million for the fiscal year 2014. The increase in expense of $1.1 million was primarily due to the eight stores closed at the end of fiscal 2015 before lease expiration.
43
Other operating, net consists of income from breakage from our gift cards (known as jambacard®), jambacard-related fees, expenses related to our franchisees, sublease income, international expenses, gain/loss on investments, bad debt expense and CPG and JambaGO® activities. The following table summarizes other operating, net for the periods indicated (dollars in thousands):
|
|
|
Fiscal Year Ended |
|
|
|
|
|
|
|
|
|
|||||||||
|
|
|
January 3, 2017 |
|
|
December 29, 2015 |
|
|
December 30, 2014 |
|
|
% Change in 2016 |
|
|
% Change in 2015 |
|
|||||
|
Other operating, net |
|
$ |
1,083 |
|
|
$ |
1,795 |
|
|
$ |
726 |
|
|
|
(39.7 |
)% |
|
|
147.2 |
% |
|
Percentage of total revenue |
|
|
1.4 |
% |
|
|
1.1 |
% |
|
|
0.3 |
% |
|
|
|
|
|
|
|
|
Changes in the components of other operating, net include an increase in sublease income from a higher number of subleased refranchise stores (approximately $0.5 million), a decrease in CPG and JambaGO® direct expense (approximately $1.3 million), and a correction for an immaterial understatement of prior period expenses (approximately $0.3 million) and a decrease in franchise expenses (approximately $0.2 million). These changes were partially offset by a decrease in jambacard breakage income (approximately $1.3 million).
For the fiscal year 2015, other operating, net was an expense of $1.8 million compared to an expense of $0.7 million for the fiscal year 2014. The increase of $1.1 million was primarily due to an increase in bad debt related to the write off of barter credits for marketing services due to vendor insolvency and bad debt (approximately $1.4 million), an increase in CPG and JambaGO® direct expense (approximately $0.4 million), and an increase in International expense (approximately $0.4 million) partially offset by a decrease in franchise expense (approximately $0.4 million) and an increase in jambacard breakage income (approximately $0.7 million).
Income tax expense/benefit
Income tax expense in fiscal 2016 was $0.1 million compared to an income tax expense of $0.7 million for fiscal 2015. The decrease in income tax expense was primarily due to the fact that the Company had a large pre-tax net loss in fiscal 2016.
Income tax expense in fiscal 2015 was $0.7 million compared to an income tax expense of $0.2 million for fiscal 2014. The increase in income tax expense was primarily due to the fact that the Company generated taxable income in fiscal 2015.
CRITICAL ACCOUNTING POLICIES AND ESTIMATES
The preparation of consolidated financial statements in conformity with GAAP requires the appropriate application of certain accounting policies, many of which require us to make estimates and assumptions about future events and their impact on amounts reported in our consolidated financial statements and related notes. Since future events and their impact cannot be determined with certainty, actual results may differ from our estimates. Such differences may be material to the consolidated financial statements.
We believe our application of accounting policies, and the estimates inherently required therein, are reasonable. These accounting policies and estimates are periodically reevaluated, and adjustments are made when facts and circumstances dictate a change.
Our accounting policies are more fully described in Note 1 “Business and Summary of Significant Accounting Policies” in the “Notes to Consolidated Financial Statements,” included elsewhere in this Form 10-K. We consider the following policies to be the most critical in understanding the judgments that are involved in preparing the consolidated financial statements.
44
Impairment of Long-Lived Assets
We evaluate long-lived assets for impairment when facts and circumstances indicate that the carrying values of long-lived assets may not be recoverable. The impairment evaluation is generally performed at the individual store asset group level. We first compare the carrying value of the asset to the asset’s estimated future undiscounted cash flows. If the estimated future cash flows are less than the carrying value of the asset, we measure an impairment loss based on the asset’s estimated fair value. The fair value of a store’s assets is estimated using a discounted cash flow model based on internal projections and taking into consideration the view of a market participant. The estimate of cash flows is based on, among other things, certain assumptions about expected future operating performance. Factors considered during the impairment evaluation include factors related to actual operating cash flows, the period of time since a store has been opened or remodeled, refranchising expectations and the maturity of the relevant market.
Our estimates of cash flows used to assess impairment are subject to a high degree of judgment. If our estimates of future cash flows differ from actual cash flows due to, among other things, changes in economic conditions, changes to our business model or changes in operating performance, it would result in an adjustment to results of operations.
Intangible Asset Impairment
Goodwill
We evaluate goodwill for impairment on an annual basis during our fourth fiscal quarter, or more frequently if circumstances, such as material deterioration in performance, indicate carrying values may exceed their fair values. In September 2011, the FASB issued new guidance allowing an entity the option to make a qualitative evaluation about the likelihood of goodwill impairment to determine whether it should calculate the fair value of a reporting unit. If impairment is deemed more likely than not, management would perform the currently prescribed two-step goodwill impairment test. Otherwise, the two-step goodwill impairment test is not required. First, the reporting unit’s estimated fair value is compared to its carrying value, including goodwill. If we determine that the estimated fair value of the reporting unit is less than its carrying value, we move to the second step to determine the implied fair value of the reporting unit’s goodwill. If the carrying amount of the reporting unit’s goodwill exceeds its fair value, an impairment loss is recognized. When reviewing goodwill for impairment, we assess whether goodwill should be allocated to operating levels lower than our single operating segment for which discrete financial information is available and reviewed for decision-making purposes. These lower levels are referred to as reporting units. Currently, our one operating segment was determined to be one reporting unit. Considerable judgment is applied in determining the assumptions used in the qualitative evaluation and in computing fair value. Changes in the assumptions could result in an adjustment to our results of operations.
Other Intangible Assets with Indefinite Lives
We evaluate intangible assets not subject to amortization (primarily trademarks) for impairment on an annual basis during the fourth fiscal quarter, or more frequently if events or changes in circumstances indicate that the asset might be impaired. We qualitatively assess the impairment for other intangible assets not subject to amortization to determine whether it is more likely than not that the fair value of intangible assets are less than their carrying amount. For other intangible assets not subject to amortization not assessed qualitatively, a quantitative approach is utilized. We compare the carrying value of the applicable asset to its fair value, which we estimate using a discounted cash flow analysis or by comparison with the market values of similar assets. If the carrying amount of the asset exceeds its estimated fair value, we determine the impairment loss, if any, as the excess of the carrying value of the intangible asset over its fair value. Changes in the assumptions for the discounted cash flow analysis could result in an adjustment to our results of operations.
Other Intangible Assets with Finite Lives
Intangible assets subject to amortization (primarily franchise agreements, reacquired franchise rights, favorable lease intangible assets and acquired customer relationships) are tested for recoverability whenever events or changes in circumstances indicate that their carrying amounts may not be recoverable. Actual results may differ from our estimates and could cause an adjustment to results of operations.
45
jambacard ® Revenue Recognition
We sell our jambacards to our customers in our retail stores, through our website at www.jambajuice.com and through our resellers. We have sold jambacards since November of 2002. The jambacard works as a reloadable gift card. At the time of the initial load, in an amount between $5 and $500, we record an obligation that is reflected as jambacard liability on the consolidated balance sheets. We relieve the liability and record the related revenue at the time a customer redeems any part of the amount on the card. The card does not have any expiration provisions and is not refundable, except as otherwise required by law.
We recognize income from jambacards when (i) the jambacard is redeemed by the customer or (ii) the likelihood of the jambacard being redeemed by the customer is remote (also referred to as “breakage”), and we determine that we do not have a legal obligation to remit the value of unredeemed jambacards to the relevant jurisdictions. We determine the jambacard breakage amount based upon historical redemption patterns. We review the activity and then conclude that after a certain amount of inactivity the likelihood of redemption becomes remote, and we recognize breakage at that time. Jambacard breakage income is included in other operating, net in the consolidated statements of operations. If the historical redemption pattern changes, our financial statements could be materially affected.
Income Taxes
Deferred tax assets and liabilities are recognized for the future tax consequences attributable to differences between the financial statement carrying amounts of existing assets and liabilities and their respective tax basis. Deferred tax assets and liabilities are measured using enacted income tax rates expected to apply to taxable income in the years in which those temporary differences are expected to be recovered or settled. Any effect on deferred tax assets and liabilities due to a change in tax rates is recognized in income in the period that includes the enactment date. In establishing deferred income tax assets and liabilities, judgments and interpretations are made based on enacted tax laws and published tax guidance applicable to our operations.
Uncertain tax positions are recognized as the greatest amount more than 50% likely of being sustained upon audit based on the technical merits of the position. On a quarterly basis, the Company reviews and updates its inventory of tax positions as necessary to add any new uncertain tax positions taken, or to remove previously identified uncertain positions that have been effectively settled. Additionally, uncertain positions may be re-measured as warranted by changes in facts or law. Accounting for uncertain tax positions requires significant judgments, including estimating the amount, timing and likelihood of ultimate settlement. Although the Company believes that these estimates are reasonable, actual results could differ from these estimates. The Company classifies interest and penalties related to income taxes as a component of income taxes in the consolidated statements of operations.
A liability related to an unrecognized tax benefit is offset against a deferred tax asset for a net operating loss carryforward, a similar tax loss or a tax credit carryforward if such settlement is required or expected in the event the uncertain tax position is disallowed. In situations in which a net operating loss carryforward, a similar tax loss or a tax credit carryforward is not available at the reporting date under the tax law of a jurisdiction or the tax law of a jurisdiction does not require it, and the Company does not intend to use the deferred tax asset for such purpose, the unrecognized tax benefit is presented in the financial statement as a liability and is not combined with deferred tax assets.
Share-based compensation
The Company’s share-based compensation relates to stock options and restricted stock units. We account for share-based compensation at fair value. Compensation expense is recognized for any unvested stock option awards and time-based restricted stock awards on a straight-line basis or ratably over the requisite service period, generally three or four years. The fair value of stock options granted is estimated at the date of grant using a Black-Scholes option-pricing model. Option valuation models, including Black-Scholes, require the input of subjective assumptions, including expected volatility, risk-free rate, expected term, and estimated dividend yield, and changes in the assumptions used can materially affect the grant date fair value of an award. Judgment is applied in determining the assumptions for computing the fair value of share-based compensation. For all award types, the
46
Company makes assumptions for the number of awards that will ultimately not vest (“forfeitures”) in determining the share-based compensation expense for these awards. The Company uses historical data to estimate expected employee behaviors related to option exercises and forfeitures. Compensation expense is trued up for actual forfeitures if different than the estimate.
The fair value of time-based restricted stock units is determined based on our closing stock price on the date of the grant. The restricted stock units granted to employees typically vest and become unrestricted generally over a three or four year period following the date of grant. The restricted stock units granted to non-employee directors typically vest and become unrestricted one year after the date of grant. Performance-based restricted stock units (“PSUs”) typically vest upon the Company satisfying certain performance targets and are granted to employees and non-employees. The Company records compensation expense for PSUs when it is probable that the performance condition(s) included in the grant will be achieved. The compensation expense ultimately recognized, if any, related to these awards will equal the grant date fair value for the number of shares for which the performance condition has been satisfied.
In addition, we grant market-based restricted stock units to certain employees. The fair value was determined using a Monte Carlo simulation that incorporated option-pricing inputs covering the period from the grant date through the end of the performance period as of the date of grant. These restricted stock units typically vest and become unrestricted upon achievement of compound annual stock price growth rate targets of 15%, 22.5% and 30% over a three-year period. Share-based compensation expense is recognized ratably over the vesting periods for market-based restricted stock units.
Self-Insurance Reserves
We are self-insured for healthcare benefits. The estimated accruals for these liabilities are based on statistical analyses of historical industry data as well as actual historical trends. For our workers’ compensation benefits, the Company has a guaranteed cost policy. Before October 1, 2015, we were self-insured and currently have prior years with exposures from September 30, 2012 through September 30, 2015. For these prior policies, liabilities associated with the risks that we retain for workers’ compensation benefits are estimated in part, by considering historical claims experience, demographic factors, severity factors, and other actuarial assumptions. Our estimates use this actuarial data in conjunction with known industry trends and Company experience. If actual claims experience differs from our assumptions, historical trends, and estimates, changes in our insurance reserves would impact the expense recorded in our consolidated statements of operations.
LIQUIDITY AND CAPITAL RESOURCES
Cash Flows Summary
The following table summarizes our cash flows for each of the past three fiscal years ended (in thousands):
|
|
|
January 3, 2017 |
|
|
December 29, 2015 |
|
|
December 30, 2014 |
|
|||
|
Net cash (used in) provided by operating activities |
|
$ |
(7,044 |
) |
|
$ |
(14,610 |
) |
|
$ |
3,543 |
|
|
Net cash (used in) provided by investing activities |
|
|
(6,637 |
) |
|
|
42,344 |
|
|
|
(9,417 |
) |
|
Net cash provided by (used in) financing activities |
|
|
1,084 |
|
|
|
(25,754 |
) |
|
|
(8,762 |
) |
|
Net (decrease) increase in cash and cash equivalents |
|
$ |
(12,597 |
) |
|
$ |
1,980 |
|
|
$ |
(14,636 |
) |
Liquidity
As of January 3, 2017, we had cash and cash equivalents of $7.1 million compared to $19.7 million in cash and cash equivalents as of December 29, 2015. As of January 3, 2017 and December 29, 2015, we had no short term
47
or long term debt. For fiscal year 2016, the Company used $7.0 million in cash for operating activities. The negative cash flow from operating activities resulted primarily from the costs incurred as a result of the relocation of the corporate headquarters.
In fiscal 2016, we incurred approximately $7.4 million in expense and $2.1 million of capital expenditures related to the relocation of our corporate headquarters. Costs incurred in fiscal year 2016 include personnel relocation, employee attrition, retention, severance and replacement, office relocation and other costs related to our relocation of our corporate headquarters.
In fiscal year 2015, the $2.0 million increase in cash and cash equivalents compared to fiscal 2014 was primarily attributable to cash proceeds from the sale of 179 store locations related to our transition to an asset-light model offset by the repurchase of 1,948,004 shares of common stock, changes in the working capital components of the balance sheet due to the sale of 179 stores, and a greater amount of redemptions of jambacards during the year.
We expect that our cash on hand and future cash flows provided by operating activities will be sufficient to fund our working capital and general corporate needs and any non-discretionary capital expenditures for at least the next twelve months and the foreseeable future. The use of cash to fund discretionary capital expenditures will be based on the need to conserve our capital.
On February 14, 2012, the Company entered into a Credit Agreement with Wells Fargo Bank, National Association (the “Lender”), and as amended on November 1, 2012, July 22, 2013, November 4, 2013 and December 29, 2015 (as amended, the “Credit Agreement”), made available to the Company a revolving line of credit in the amount of $10.0 million. On July 22, 2016, the Credit Agreement with Wells Fargo expired.
On November 3, 2016, we entered into a credit agreement with Cadence Bank, NA (“New Credit Agreement”). The New Credit Agreement provides an aggregate principal amount of up to $10.0 million. The credit facility also allows us to request an additional $5.0 million for an aggregate principal amount of up to $15.0 million.
The New Credit Agreement makes available to the Company a revolving line of credit in the amount of up to $15.0 million which accrues interest at a per annum rate equal to the LIBOR rate plus 2.50%. Under the terms of the New Credit Agreement, we are required to maintain certain leverage and coverage ratios and are subject to limits on annual capital expenditures. The New Credit Agreement terminates November 3, 2021. The credit facility is subject to customary affirmative and negative covenants for credit facilities of this type, including limitations on the Company with respect to liens, indebtedness, investments, fundamental changes (merge, dissolve, liquidate, etc.), dispositions, restricted payments and guarantees. The credit facility is evidenced by a revolving loan, is guaranteed by the Company and is secured by substantially all of our assets including the asset of our subsidiary.
During fiscal 2016, there were no borrowings under the Credit Agreement. To acquire the credit facility, the Company incurred upfront fees, which are being amortized over the term of the Credit Agreement. As of January 3, 2017, the unamortized commitment fee for the New Credit Agreement was not material and is recorded in prepaid expenses and other current assets on the consolidated balance sheets. As of January 3, 2017, the Company was in compliance with the financial covenants to the Credit Agreement. However, the Company was, as of May 3, 2017, and currently is, in violation of certain financial reporting covenants. On December 1, 2017, the Company received a covenant waiver and consent that extends the delivery requirements to February 15, 2018, for the fiscal year January 3, 2017, first quarter ended April 4, 2017, second quarter ended July 4, 2017 and third quarter ended October 3, 2017 financial statements.
Since the inception of the Wells Fargo line of credit and the New Credit Agreement, we did not borrow on the facilities and utilized them primarily for collateral against letters of credit, which reduce the amount available to draw. In the future, we may enter equipment leasing arrangements and incur additional indebtedness as necessary and as permitted under our credit agreement. We cannot assure, however, that such financing will be available on favorable terms or at all. The adequacy of our available funds will depend on many factors, including the macroeconomic environment, the operating performance of our Company Stores, the successful expansion of our franchise and licensing programs and the successful rollout and consumer acceptance of our new beverage and food initiatives. Given these factors, our foremost priorities for the near term continue to be preserving and generating cash sufficient to fund our liquidity needs.
48
Net cash used in operating activities was $7.0 million in fiscal 2016, compared to $14.6 million in fiscal 2015, reflecting a decrease in cash flows used in operating activities of $7.6 million. The change in cash used in operating activities was primarily due to the net loss of $22.4 million in fiscal 2016, versus net income of $9.5 million in fiscal 2015, adjusted for a decrease in non-cash items (approximately $33.1 million) and an increase of cash used in operating assets and liabilities (approximately $6.4 million). Cash flows relating to operating assets and liabilities increased compared to prior year primarily due to our asset-light model initiative. The Company expects that operating cash flow will be generated through a combination of Company Store profitability and franchise royalty fees and a reduced cost structure.
Net cash used in operating activities was $14.6 million in fiscal 2015, compared to net cash provided by $3.5 million in fiscal 2014, reflecting a net increase in cash flows used in operating activities of $18.2 million. The increase in cash used in operating activities was primarily due to the increase in net income (loss) ($13.1 million) adjusted for a net decrease in non-cash items (approximately $26.5 million) and a net increase of cash used in operating assets and liabilities (approximately $4.7 million). Net income (loss) after adjustments for noncash items decreased primarily due to a decrease in cash flows driven by a decline in Company Store revenue, pursuant to our transition to an asset-light model. Cash flows relating to operating assets and liabilities declined compared to prior year primarily due to our transition to an asset-light model and an increase in redemption of jambacards.
The amount of cash provided by our operating activities during any particular fiscal year is highly subject to variations in the seasons. The first and fourth quarters of the fiscal year encompasses the winter and holiday season when we traditionally generate our lowest revenue, and our second and third quarters of the fiscal year encompasses the warmer seasons where a significant portion of our revenue and cash flows are realized. For more information on seasonality, refer to the section below entitled “Seasonality and Quarterly Results.” We also expect to have increased expenditures during the first part of the fiscal year as we invest in product development and domestic expansion with the goal to have new products released and new stores open by mid-year to take advantage of the busier summer months.
Investing Activities
Net cash used in investing activities was $6.6 million in fiscal 2016, compared to net cash provided by investing activities of $42.3 million in fiscal 2015. The $48.9 million change in net cash used in investing activities during fiscal 2016 was due to a decrease in proceeds from disposal of fixed assets (approximately $49.9 million) due to our transition to an asset-light model that occurred in fiscal year 2015.
Net cash provided by investing activities was $42.3 million in fiscal 2015, compared to net cash used in investing activities of $9.4 million in fiscal 2014. The $51.8 million increase in net cash provided by investing activities during fiscal 2015 was primarily due to increase in proceeds from disposal of assets (approximately $44.6 million) resulting from our transition to an asset-light model and a decrease in capital expenditure payments (approximately $7.2 million).
Financing Activities
Net cash provided by financing activities was $1.1 million in fiscal 2016, compared to net cash used in financing activities of $25.8 million in fiscal year 2015. The $26.9 million change in net cash provided by financing activities was primarily due to the repurchase of the shares of our common stock (approximately $28.0 million) under the stock repurchase plan approved by our Board of Directors in 2014 that occurred during fiscal 2015, partially offset by a decrease in receipts from our stock issuance plans, including from the exercise of stock options (approximately $0.7 million).
Net cash used in financing activities was $25.8 million in fiscal 2015, compared to $8.8 million in fiscal 2014. The $17.1 million increase in net cash used in financing activities was primarily due to increase in the repurchase of the shares of the Company's common stock (approximately $16.9 million) under the stock repurchase plan approved by our Board of Directors in 2014 while the proceeds from our stock issuance plans remained relatively flat.
49
The following table summarizes contractual obligations and borrowings as of January 3, 2017, and the timing and effect that such commitments are expected to have on our liquidity and capital requirements in future periods. We expect to fund these commitments primarily with operating cash flows generated in the normal course of business (in thousands):
|
|
|
Payments Due by Period |
|
|||||||||||||||||
|
|
|
Total |
|
|
Less Than 1 Year |
|
|
1 - 2 Years |
|
|
3 - 4 Years |
|
|
5 or More Years |
|
|||||
|
Operating lease obligations(1) |
|
$ |
115,316 |
|
|
$ |
26,354 |
|
|
$ |
22,539 |
|
|
$ |
33,154 |
|
|
$ |
33,269 |
|
|
Purchase obligations(2) |
|
|
30,727 |
|
|
|
20,234 |
|
|
|
2,145 |
|
|
|
2,783 |
|
|
|
5,565 |
|
|
Total |
|
$ |
146,043 |
|
|
$ |
46,588 |
|
|
$ |
24,684 |
|
|
$ |
35,937 |
|
|
$ |
38,834 |
|
|
(1) |
Our wholly owned subsidiary, Jamba Juice Company, is a party to each Company Store and certain refranchised stores’ lease obligation. The operating lease obligations represent future minimum lease payments under non-cancelable operating leases and lease termination fees as of January 3, 2017. The minimum lease payments do not include common area maintenance (“CAM”) charges, insurance, contingent rent obligations or real estate taxes, which are also required contractual obligations under our operating leases. In the majority of our operating leases, CAM charges are not fixed and can fluctuate from year to year. Total CAM charges, insurance, contingent rent obligations, license, permits and real estate taxes related to Company Stores and the corporate support center for our fiscal year ended January 3, 2017 were $2.5 million. |
|
(2) |
We negotiate pricing and quality specifications for many of the products used in Company Stores and Franchise Stores. This allows for volume pricing and consistent quality of products that meet our standards. Although we negotiate and contract directly with manufacturers, co-packers or growers for our products, we purchase these products from third-party centralized distributors. These distributors source, warehouse and deliver specified products to both Company Stores and Franchise Stores. The Company has purchase obligations with certain suppliers for certain fruits and dairy for various terms typically ranging from less than one year to five years. The Company has one contract with a supplier for a 15 year term that ends in 2024. |
Off-Balance Sheet Arrangements
We have no off-balance sheet arrangements.
New Accounting Standards
See the Recent Accounting Pronouncements section in Note 1 of our Notes to Consolidated Financial Statements for a summary of new accounting standards.
SEASONALITY AND QUARTERLY RESULTS
Our business is subject to day-to-day volatility based on weather and varies by season. A significant portion of our revenue is realized during the second and third quarters of the fiscal year, which include the summer months. The fourth quarter of the fiscal year, which encompasses the winter months and the holiday season, has traditionally been our lowest revenue volume quarter. Although we have expanded the number of stores offering our bowls, hot oatmeal, hot beverages, sandwiches and Artisan Flatbread selections, our business will likely continue to be subject to seasonal patterns for the foreseeable future, given that the largest portion of our sales continues to be from the sale of smoothies during the warmer parts of the year. Because of the seasonality of the business, results for an individual quarter are not necessarily indicative of the results, which may be achieved for the full fiscal year.
INFLATION
We do not believe that inflation has had a material impact on our results of operations in recent years. However, we cannot predict what effect inflation may have on our operations in the future.
50
Interest Rates
We do not enter into market risk sensitive instruments for trading purposes. We are exposed to financial market risks due primarily to changes in interest rates in our interest bearing accounts. We do not believe a change in interest rate will materially affect our financial position or results of operations. A one percent change of the interest rate would result in an annual change in the results of operations of approximately $0.1 million.
Commodities Prices
We are exposed to the impact of commodity and utility price fluctuations related to unpredictable factors such as weather and various market conditions over which we do not have control. We purchase significant amounts of produce and dairy products to support the needs of our Company Stores. The price and availability of these commodities directly impacts the results of operations and can be expected to impact the future results of operations.
We purchase fruit based on short-term seasonal pricing agreements. These short-term agreements generally set the price of procured frozen fruit and 100% pure fruit concentrates for less than one year based on estimated annual requirements. We purchase fresh produce based on annual pricing agreements. In order to mitigate the effects of price changes in any one commodity on our cost structure, we contract with multiple suppliers both domestically and internationally. These agreements typically set the price for some or all of our estimated annual fruit and fresh produce requirements, protecting us from short-term volatility. Nevertheless, these agreements typically contain a force majeure clause, which, if utilized (such as hurricanes in 2004 that destroyed the Florida orange crop and more recently with the 2007 freeze that affected California citrus), may subject us to significant price increases.
Our pricing philosophy is not to attempt to change consumer prices with every move up or down of the commodity market, but to take a longer term view of managing margins and the value perception of our products in the eyes of our customers. Our objective is to maximize our revenue through increased customer traffic.
51
INDEX TO CONSOLIDATED FINANCIAL STATEMENTS
|
|
|
Page No. |
|
|
F-1 |
|
|
Consolidated Balance Sheets at January 3, 2017 and December 29, 2015 |
|
F-2 |
|
|
F-3 |
|
|
|
F-4 |
|
|
|
F-5 |
|
|
|
F-6 |
52
Report of Independent Registered Public Accounting Firm
The Board of Directors and Shareholders
Jamba, Inc.:
We have audited the accompanying consolidated balance sheets of Jamba, Inc. and subsidiary (the Company) as of January 3, 2017 and December 29, 2015, and the related consolidated statements of operations, shareholders’ equity, and cash flows for the fiscal years ended January 3, 2017, December 29, 2015 and December 30, 2014. In connection with our audits of the consolidated financial statements, we also have audited the related financial statement schedule. These consolidated financial statements and financial statement schedule are the responsibility of the Company’s management. Our responsibility is to express an opinion on these consolidated financial statements and financial statement schedule based on our audits.
We conducted our audits in accordance with the standards of the Public Company Accounting Oversight Board (United States). Those standards require that we plan and perform the audit to obtain reasonable assurance about whether the financial statements are free of material misstatement. An audit includes examining, on a test basis, evidence supporting the amounts and disclosures in the financial statements. An audit also includes assessing the accounting principles used and significant estimates made by management, as well as evaluating the overall financial statement presentation. We believe that our audits provide a reasonable basis for our opinion.
In our opinion, the consolidated financial statements referred to above present fairly, in all material respects, the financial position of Jamba, Inc. and subsidiary as of January 3, 2017 and December 29, 2015, and the results of their operations and their cash flows for the fiscal years ended January 3, 2017, December 29, 2015 and December 30, 2014 in conformity with U.S. generally accepted accounting principles. Also in our opinion, the related financial statement schedule, when considered in relation to the basic consolidated financial statements taken as a whole, presents fairly, in all material respects, the information set forth therein.
We also have audited, in accordance with the standards of the Public Company Accounting Oversight Board (United States), Jamba, Inc.’s internal control over financial reporting as of January 3, 2017, based on criteria established in Internal Control - Integrated Framework (2013) issued by the Committee of Sponsoring Organizations of the Treadway Commission (COSO), and our report dated February 9, 2018 expressed an adverse opinion on the effectiveness of the Company’s internal control over financial reporting.
/s/ KPMG LLP
San Francisco, Ca
February 9, 2018
F-1
(In thousands, except per share data)
|
|
|
January 3,2017 |
|
|
|
December 29, 2015 |
|
||
|
ASSETS |
|
|
|
|
|
|
|
|
|
|
Current assets: |
|
|
|
|
|
|
|
|
|
|
Cash and cash equivalents |
|
$ |
7,133 |
|
|
|
$ |
19,730 |
|
|
Receivables, net of allowances of $1,808 and $618 |
|
|
11,778 |
|
|
|
|
16,932 |
|
|
Inventories |
|
|
534 |
|
|
|
|
818 |
|
|
Prepaid and refundable taxes |
|
|
243 |
|
|
|
|
356 |
|
|
Prepaid rent |
|
|
1,053 |
|
|
|
|
1,682 |
|
|
Assets held for sale |
|
|
206 |
|
|
|
|
3,144 |
|
|
Prepaid expenses and other current assets |
|
|
2,757 |
|
|
|
|
4,495 |
|
|
Total current assets |
|
|
23,704 |
|
|
|
|
47,157 |
|
|
Property, fixtures and equipment, net |
|
|
12,512 |
|
|
|
|
15,600 |
|
|
Goodwill |
|
|
1,183 |
|
|
|
|
1,184 |
|
|
Trademarks and other intangible assets, net |
|
|
1,327 |
|
|
|
|
1,464 |
|
|
Notes receivable and other long-term assets |
|
|
2,894 |
|
|
|
|
4,211 |
|
|
Total assets |
|
$ |
41,620 |
|
|
|
$ |
69,616 |
|
|
LIABILITIES AND SHAREHOLDERS’ EQUITY |
|
|
|
|
|
|
|
|
|
|
Current liabilities: |
|
|
|
|
|
|
|
|
|
|
Accounts payable |
|
$ |
2,749 |
|
|
|
$ |
3,815 |
|
|
Accrued compensation and benefits |
|
|
3,580 |
|
|
|
|
3,788 |
|
|
Workers’ compensation and health insurance reserves |
|
|
675 |
|
|
|
|
633 |
|
|
Accrued jambacard liability |
|
|
24,131 |
|
|
|
|
29,306 |
|
|
Accrued expenses |
|
|
7,658 |
|
|
|
|
9,977 |
|
|
Other current liabilities |
|
|
7,664 |
|
|
|
|
8,116 |
|
|
Total current liabilities |
|
|
46,457 |
|
|
|
|
55,635 |
|
|
Deferred rent and other long-term liabilities |
|
|
8,940 |
|
|
|
|
8,990 |
|
|
Total liabilities |
|
|
55,397 |
|
|
|
|
64,625 |
|
|
Commitments and contingencies (Notes 19) |
|
|
|
|
|
|
|
|
|
|
Shareholders’ (deficit) equity: |
|
|
|
|
|
|
|
|
|
|
Common stock, $.001 par value, 30,000,000 shares authorized; 18,268,885 and 15,410,068 shares issued and outstanding, respectively, at January 3, 2017, and 17,938,820 and 15,080,003 shares issued and outstanding, respectively, at December 29, 2015 |
|
|
18 |
|
|
|
|
18 |
|
|
Additional paid-in capital |
|
|
407,273 |
|
|
|
|
403,605 |
|
|
Treasury shares, at cost, 2,858,817 |
|
|
(40,009 |
) |
|
|
|
(40,009 |
) |
|
Accumulated deficit |
|
|
(381,059 |
) |
|
|
|
(358,623 |
) |
|
Shareholders' (deficit) equity |
|
|
(13,777 |
) |
|
|
|
4,991 |
|
|
Total liabilities and shareholders’ (deficit) equity |
|
$ |
41,620 |
|
|
|
$ |
69,616 |
|
See Notes to Consolidated Financial Statements.
F-2
CONSOLIDATED STATEMENTS OF OPERATIONS
(In thousands, except par value data)
|
|
|
Fiscal Year Ended |
|
|||||||||
|
|
|
January 3, |
|
|
December 29, |
|
|
December 30, |
|
|||
|
|
|
2017 |
|
|
2015 |
|
|
2014 |
|
|||
|
Revenue: |
|
|
|
|
|
|
|
|
|
|
|
|
|
Company stores |
|
$ |
51,282 |
|
|
$ |
137,025 |
|
|
$ |
198,737 |
|
|
Franchise and other revenue |
|
|
28,341 |
|
|
|
24,651 |
|
|
|
19,311 |
|
|
Total revenue |
|
|
79,623 |
|
|
|
161,676 |
|
|
|
218,048 |
|
|
Costs and operating expenses (income): |
|
|
|
|
|
|
|
|
|
|
|
|
|
Cost of sales |
|
|
12,601 |
|
|
|
33,737 |
|
|
|
52,236 |
|
|
Labor |
|
|
17,872 |
|
|
|
44,732 |
|
|
|
61,749 |
|
|
Occupancy |
|
|
7,659 |
|
|
|
18,951 |
|
|
|
27,630 |
|
|
Store operating |
|
|
9,285 |
|
|
|
25,152 |
|
|
|
33,089 |
|
|
Depreciation and amortization |
|
|
5,749 |
|
|
|
6,569 |
|
|
|
10,084 |
|
|
General and administrative |
|
|
37,958 |
|
|
|
36,872 |
|
|
|
37,278 |
|
|
Loss (gain) on disposal of assets |
|
|
790 |
|
|
|
(21,609 |
) |
|
|
(2,957 |
) |
|
Store pre-opening |
|
|
1,224 |
|
|
|
1,031 |
|
|
|
763 |
|
|
Impairment of long-lived assets |
|
|
3,410 |
|
|
|
2,523 |
|
|
|
175 |
|
|
Store lease termination and closure |
|
|
4,160 |
|
|
|
1,669 |
|
|
|
575 |
|
|
Other operating, net |
|
|
1,083 |
|
|
|
1,795 |
|
|
|
726 |
|
|
Total costs and operating expenses (income): |
|
|
101,791 |
|
|
|
151,422 |
|
|
|
221,348 |
|
|
(Loss) income from operations |
|
|
(22,168 |
) |
|
|
10,254 |
|
|
|
(3,300 |
) |
|
Other income (expense): |
|
|
|
|
|
|
|
|
|
|
|
|
|
Interest income |
|
|
250 |
|
|
|
137 |
|
|
|
74 |
|
|
Interest expense |
|
|
(439 |
) |
|
|
(220 |
) |
|
|
(195 |
) |
|
Total other income (expense), net |
|
|
(189 |
) |
|
|
(83 |
) |
|
|
(121 |
) |
|
(Loss) income before income taxes |
|
|
(22,357 |
) |
|
|
10,171 |
|
|
|
(3,421 |
) |
|
Income tax expense |
|
|
(79 |
) |
|
|
(701 |
) |
|
|
(168 |
) |
|
Net (loss) income |
|
|
(22,436 |
) |
|
|
9,470 |
|
|
|
(3,589 |
) |
|
Less: Net income attributable to noncontrolling interest |
|
|
— |
|
|
|
52 |
|
|
|
43 |
|
|
Net (loss) income attributable to Jamba, Inc. |
|
$ |
(22,436 |
) |
|
$ |
9,418 |
|
|
$ |
(3,632 |
) |
|
Weighted-average shares used in the computation of earnings (loss) per share attributable to Jamba, Inc.: |
|
|
|
|
|
|
|
|
|
|
|
|
|
Basic |
|
|
15,229,102 |
|
|
|
15,787,806 |
|
|
|
17,197,904 |
|
|
Diluted |
|
|
15,229,102 |
|
|
|
16,228,033 |
|
|
|
17,197,904 |
|
|
Earnings (loss) per share attributable to Jamba, Inc. common shareholders: |
|
|
|
|
|
|
|
|
|
|
|
|
|
Basic |
|
$ |
(1.47 |
) |
|
$ |
0.60 |
|
|
$ |
(0.21 |
) |
|
Diluted |
|
$ |
(1.47 |
) |
|
$ |
0.58 |
|
|
$ |
(0.21 |
) |
See Notes to Consolidated Financial Statements.
F-3
CONSOLIDATED STATEMENTS OF SHAREHOLDERS’ EQUITY
|
|
|
Common Stock |
|
|
Additional Paid in |
|
|
|
|
|
|
Accumulated |
|
|
Equity Attributable to |
|
|
Noncontrolling |
|
|
Total Shareholders’ |
|
||||||||||
|
(In thousands, except share amounts) |
|
Shares |
|
|
Amount |
|
|
Capital |
|
|
Treasury Stock |
|
|
Deficit |
|
|
Jamba, Inc. |
|
|
Interest |
|
|
Equity |
|
||||||||
|
Balance as of December 31, 2013 |
|
|
17,154,655 |
|
|
$ |
17 |
|
|
$ |
391,234 |
|
|
$ |
— |
|
|
$ |
(364,409 |
) |
|
$ |
26,842 |
|
|
$ |
— |
|
|
$ |
26,842 |
|
|
Share-based compensation expense |
|
|
— |
|
|
|
— |
|
|
|
3,069 |
|
|
|
— |
|
|
|
— |
|
|
|
3,069 |
|
|
|
— |
|
|
|
3,069 |
|
|
Issuance of common stock pursuant to stock plans |
|
|
323,961 |
|
|
|
— |
|
|
|
1,707 |
|
|
|
— |
|
|
|
— |
|
|
|
1,707 |
|
|
|
— |
|
|
|
1,707 |
|
|
Gain on sale of noncontrolling interest |
|
|
— |
|
|
|
— |
|
|
|
662 |
|
|
|
— |
|
|
|
— |
|
|
|
662 |
|
|
|
88 |
|
|
|
750 |
|
|
Paid to noncontrolling interest |
|
|
— |
|
|
|
— |
|
|
|
(42 |
) |
|
|
— |
|
|
|
— |
|
|
|
(42 |
) |
|
|
— |
|
|
|
(42 |
) |
|
Due to noncontrolling interest |
|
|
— |
|
|
|
— |
|
|
|
(1 |
) |
|
|
— |
|
|
|
— |
|
|
|
(1 |
) |
|
|
— |
|
|
|
(1 |
) |
|
Treasury shares purchased, not retired |
|
|
— |
|
|
|
— |
|
|
|
— |
|
|
|
(11,991 |
) |
|
|
— |
|
|
|
(11,991 |
) |
|
|
— |
|
|
|
(11,991 |
) |
|
Net loss |
|
|
— |
|
|
|
— |
|
|
|
— |
|
|
|
— |
|
|
|
(3,632 |
) |
|
|
(3,632 |
) |
|
|
43 |
|
|
|
(3,589 |
) |
|
Balance as of December 30, 2014 |
|
|
17,478,616 |
|
|
$ |
17 |
|
|
$ |
396,629 |
|
|
|
(11,991 |
) |
|
|
(368,041 |
) |
|
|
16,614 |
|
|
|
131 |
|
|
|
16,745 |
|
|
Share-based compensation expense |
|
|
— |
|
|
|
— |
|
|
|
5,162 |
|
|
|
— |
|
|
|
— |
|
|
|
5,162 |
|
|
|
— |
|
|
|
5,162 |
|
|
Issuance of common stock pursuant to stock plans |
|
|
460,204 |
|
|
|
1 |
|
|
|
1,792 |
|
|
|
— |
|
|
|
— |
|
|
|
1,793 |
|
|
|
— |
|
|
|
1,793 |
|
|
Excess tax benefit from exercise of stock options |
|
|
— |
|
|
|
— |
|
|
|
553 |
|
|
|
— |
|
|
|
— |
|
|
|
553 |
|
|
|
— |
|
|
|
553 |
|
|
Realized gain on sale of noncontrolling interest |
|
|
— |
|
|
|
— |
|
|
|
(662 |
) |
|
|
— |
|
|
|
— |
|
|
|
(662 |
) |
|
|
(183 |
) |
|
|
(845 |
) |
|
Noncontrolling interest |
|
|
— |
|
|
|
— |
|
|
|
131 |
|
|
|
— |
|
|
|
— |
|
|
|
131 |
|
|
|
— |
|
|
|
131 |
|
|
Treasury shares purchased, not retired |
|
|
|
|
|
|
— |
|
|
|
— |
|
|
|
(28,018 |
) |
|
|
— |
|
|
|
(28,018 |
) |
|
|
— |
|
|
|
(28,018 |
) |
|
Net income |
|
|
— |
|
|
|
— |
|
|
|
— |
|
|
|
— |
|
|
|
9,418 |
|
|
|
9,418 |
|
|
|
52 |
|
|
|
9,470 |
|
|
Balance as of December 29, 2015 |
|
|
17,938,820 |
|
|
$ |
18 |
|
|
$ |
403,605 |
|
|
|
(40,009 |
) |
|
|
(358,623 |
) |
|
|
4,991 |
|
|
|
— |
|
|
|
4,991 |
|
|
Share-based compensation expense |
|
|
— |
|
|
|
— |
|
|
|
2,579 |
|
|
|
— |
|
|
|
— |
|
|
|
2,579 |
|
|
|
— |
|
|
|
2,579 |
|
|
Issuance of common stock pursuant to stock plans |
|
|
330,065 |
|
|
|
— |
|
|
|
1,089 |
|
|
|
— |
|
|
|
— |
|
|
|
1,089 |
|
|
|
— |
|
|
|
1,089 |
|
|
Net income |
|
|
— |
|
|
|
— |
|
|
|
— |
|
|
|
— |
|
|
|
(22,436 |
) |
|
|
(22,436 |
) |
|
|
— |
|
|
|
(22,436 |
) |
|
Balance as of January 3, 2017 |
|
|
18,268,885 |
|
|
$ |
18 |
|
|
$ |
407,273 |
|
|
$ |
(40,009 |
) |
|
$ |
(381,059 |
) |
|
$ |
(13,777 |
) |
|
$ |
— |
|
|
$ |
(13,777 |
) |
See Notes to Consolidated Financial Statements.
F-4
CONSOLIDATED STATEMENTS OF CASH FLOWS
(Dollars in thousands)
|
|
|
Fiscal Year Ended |
|
|||||||||
|
|
|
January 3, |
|
|
December 29, |
|
|
December 30, |
|
|||
|
|
|
2017 |
|
|
2015 |
|
|
2014 |
|
|||
|
Cash (used in) provided by operating activities: |
|
|
|
|
|
|
|
|
|
|
|
|
|
Net income (loss) attributable to common shareholders |
|
$ |
(22,436 |
) |
|
$ |
9,470 |
|
|
$ |
(3,589 |
) |
|
Adjustments to reconcile net income (loss) to net cash (used in) provided by operating activities: |
|
|
|
|
|
|
|
|
|
|
|
|
|
Depreciation and amortization |
|
|
5,749 |
|
|
|
6,569 |
|
|
|
10,084 |
|
|
Lease termination, store closure costs, impairment and gain on disposals |
|
|
8,359 |
|
|
|
(26,555 |
) |
|
|
(2,420 |
) |
|
Gain from sale of investment in joint venture |
|
|
— |
|
|
|
(662 |
) |
|
|
— |
|
|
Contingent consideration fair value measurement |
|
|
(295 |
) |
|
|
(156 |
) |
|
|
(397 |
) |
|
Jambacard breakage income |
|
|
(4,096 |
) |
|
|
(5,440 |
) |
|
|
(4,744 |
) |
|
Share-based compensation |
|
|
2,579 |
|
|
|
5,162 |
|
|
|
3,069 |
|
|
Bad debt and trade credits |
|
|
1,645 |
|
|
|
1,896 |
|
|
|
358 |
|
|
Deferred rent |
|
|
(1,970 |
) |
|
|
(2,035 |
) |
|
|
(397 |
) |
|
Equity loss from joint ventures |
|
|
98 |
|
|
|
229 |
|
|
|
— |
|
|
Changes in operating assets and liabilities: |
|
|
|
|
|
|
|
|
|
|
|
|
|
Receivables |
|
|
3,493 |
|
|
|
1,222 |
|
|
|
(2,853 |
) |
|
Inventories |
|
|
249 |
|
|
|
1,129 |
|
|
|
387 |
|
|
Prepaid and refundable taxes |
|
|
113 |
|
|
|
118 |
|
|
|
9 |
|
|
Prepaid rent |
|
|
628 |
|
|
|
(1,178 |
) |
|
|
(197 |
) |
|
Prepaid expenses and other current assets |
|
|
581 |
|
|
|
1,456 |
|
|
|
(2,406 |
) |
|
Other long-term assets |
|
|
1,447 |
|
|
|
(1,201 |
) |
|
|
(1,617 |
) |
|
Accounts payable |
|
|
(330 |
) |
|
|
(1,274 |
) |
|
|
(2,145 |
) |
|
Accrued compensation and benefits |
|
|
(208 |
) |
|
|
(2,537 |
) |
|
|
(58 |
) |
|
Workers’ compensation and health insurance reserves |
|
|
43 |
|
|
|
(678 |
) |
|
|
265 |
|
|
Accrued jambacard liability |
|
|
(170 |
) |
|
|
(3,438 |
) |
|
|
5,807 |
|
|
Other current liabilities |
|
|
(2,951 |
) |
|
|
1,669 |
|
|
|
3,319 |
|
|
Other long-term liabilities |
|
|
428 |
|
|
|
1,624 |
|
|
|
1,068 |
|
|
Cash (used in) provided by operating activities |
|
$ |
(7,044 |
) |
|
$ |
(14,610 |
) |
|
$ |
3,543 |
|
|
Cash provided by (used in) investing activities: |
|
|
|
|
|
|
|
|
|
|
|
|
|
Capital expenditures |
|
|
(6,807 |
) |
|
|
(7,052 |
) |
|
|
(14,280 |
) |
|
Acquisitions, net of cash acquired |
|
|
— |
|
|
|
(735 |
) |
|
|
(694 |
) |
|
Proceeds from the sale of assets |
|
|
170 |
|
|
|
50,131 |
|
|
|
5,557 |
|
|
Cash provided by (used in) investing activities |
|
$ |
(6,637 |
) |
|
$ |
42,344 |
|
|
$ |
(9,417 |
) |
|
Cash (used in) provided by financing activities: |
|
|
|
|
|
|
|
|
|
|
|
|
|
Proceeds pursuant to stock plans |
|
|
1,089 |
|
|
|
1,793 |
|
|
|
1,707 |
|
|
Excess tax benefit from exercise of stock options |
|
|
— |
|
|
|
553 |
|
|
|
— |
|
|
Proceeds from sale of noncontrolling interest |
|
|
— |
|
|
|
— |
|
|
|
750 |
|
|
Payments to noncontrolling interest |
|
|
— |
|
|
|
(52 |
) |
|
|
(42 |
) |
|
Payments for treasury shares |
|
|
— |
|
|
|
(28,018 |
) |
|
|
(11,146 |
) |
|
Payments on capital lease obligations |
|
|
(5 |
) |
|
|
(30 |
) |
|
|
(31 |
) |
|
Cash (used in) provided by financing activities |
|
$ |
1,084 |
|
|
$ |
(25,754 |
) |
|
$ |
(8,762 |
) |
|
Net increase (decrease) in cash and cash equivalents |
|
$ |
(12,597 |
) |
|
$ |
1,980 |
|
|
$ |
(14,636 |
) |
|
Cash and cash equivalents at beginning of period |
|
|
19,730 |
|
|
|
17,750 |
|
|
|
32,386 |
|
|
Cash and cash equivalents at end of period |
|
$ |
7,133 |
|
|
$ |
19,730 |
|
|
$ |
17,750 |
|
|
Supplemental cash flow information: |
|
|
|
|
|
|
|
|
|
|
|
|
|
Cash paid for interest |
|
$ |
12 |
|
|
$ |
31 |
|
|
$ |
30 |
|
|
Income taxes paid |
|
|
19 |
|
|
|
65 |
|
|
|
178 |
|
|
Noncash investing and financing activities: |
|
|
|
|
|
|
|
|
|
|
|
|
|
Property, fixtures and equipment in accounts payable |
|
|
312 |
|
|
|
1,171 |
|
|
|
1,192 |
|
|
Property, fixtures and equipment funded by a tenant allowance |
|
|
1,142 |
|
|
|
— |
|
|
|
— |
|
|
Note taken for store disposal |
|
|
100 |
|
|
|
2,000 |
|
|
|
— |
|
|
Noncash purchase of shares of Jamba, Inc. |
|
|
— |
|
|
|
— |
|
|
|
845 |
|
See Notes to Consolidated Financial Statements.
F-5
NOTES TO CONSOLIDATED FINANCIAL STATEMENTS
FOR THE FISCAL YEARS ENDED JANUARY 3, 2017, DECEMBER 29, 2015 AND
DECEMBER 30, 2014
1. BUSINESS AND SUMMARY OF SIGNIFICANT ACCOUNTING POLICIES
Business - Jamba, Inc. consummated its initial public offering in July 2005. On November 29, 2006, Jamba, Inc. consummated the merger with Jamba Juice Company whereby Jamba Juice Company, which first began operations in 1990, became its wholly owned subsidiary.
Jamba, Inc. together with its wholly-owned subsidiary, Jamba Juice Company (“the Company”), is a healthful, active lifestyle brand with a robust global business driven by a portfolio of franchised and company-owned Jamba Juice ® stores and Jamba Juice ExpressTM formats. The Jamba ® brand was created by founder Kirk Perron to inspire and simplify healthy living. This mission is alive today in the more than 900 retail locations globally and in Jamba branded products. The Company is a leading restaurant retailer of “better-for-you” specialty beverage blends and food offerings which include flavorful, whole fruit and vegetable smoothies, fresh squeezed juices and juice blends, Energy (smoothie) Bowls, signature “boosts”, shots and a variety of food items including; hot oatmeal, breakfast wraps, sandwiches, Artisan Flatbreads, baked goods and snacks. The Company’s headquarters were located in Emeryville, California and were relocated to Frisco, Texas in the fourth quarter of fiscal year 2016.
As of January 3, 2017, there were 909 Jamba Juice stores globally, consisting of 66 Company-owned and operated stores (“Company Stores”), 773 franchisee-owned and operated stores (“Franchise Stores”) in the United States, and 70 Franchise Stores in international locations (“International Stores”).
Basis of Presentation - The consolidated financial statements include the accounts of the Company and its wholly-owned subsidiary, Jamba Juice Company. The accounts of Jamba Juice Southern California, LLC (“JJSC”), a former indirect subsidiary, are included through April 28, 2015, when the Company sold its 88% interest in JJSC to the holder of JJSC’s non-controlling interest. All significant intercompany balances and transactions have been eliminated in consolidation. The equity method of accounting is used to account for Jamba Juice Company’s investments in its joint ventures because the Company exercises significant influence over the operations and financial policies of the joint ventures. Accordingly, the carrying value of the investment is reported in other long-term assets, and the Company’s equity in the net income and losses of its joint ventures is reported in other operating, net.
Fiscal Year End - The Company’s fiscal year ends on the Tuesday closest to December 31. The Company’s most recently completed fiscal year, referred to as fiscal 2016 which started on December 30, 2015 and ended on January 3, 2017, had 53 weeks. The Company’s fiscal 2015 which started on December 31, 2014, and ended on December 29, 2015, had 52 weeks, and fiscal 2014 which started on January 1, 2014 and ended on December 30, 2014 had 52 weeks.
Effect of Correction of Prior Period Misstatements – During fiscal year 2016, the Company corrected certain errors which resulted in additional expense in fiscal 2016 of approximately $0.8 million related to prior period financial statements. These errors related to FY 2015 ($0.6 million) and FY 2014 ($0.6 million), with the remaining offsetting amounts relating to the financial statements from years prior to 2014. These adjustments primarily related to the prior fiscal year 2015 results. The Company determined that the corrections were neither quantitatively nor qualitatively material to fiscal year 2016 or to prior periods either individually or in the aggregate or to the trends of the reported results of operations.
F-6
The following table details the specific amounts of out-of-period (overstatements)/understatements for the fiscal years 2016, 2015, 2014 and fiscal years prior to 2014.
|
(In thousands, except share and per share amounts) |
|
Fiscal Year Ended January 3, 2017 |
|
|
Fiscal Year Ended December 29, 2015 |
|
|
Fiscal Year Ended December 30, 2014 |
|
|
Prior to Fiscal Year 2014 |
|
||||
|
Total revenue |
|
$ |
(65 |
) |
|
$ |
(3 |
) |
|
$ |
33 |
|
|
$ |
35 |
|
|
Total costs, operating expenses and gain |
|
|
(893 |
) |
|
|
624 |
|
|
|
622 |
|
|
|
(353 |
) |
|
Income before income taxes |
|
|
828 |
|
|
|
(627 |
) |
|
|
(589 |
) |
|
|
388 |
|
|
Total other expense, net |
|
|
— |
|
|
|
— |
|
|
|
— |
|
|
|
— |
|
|
Income before income taxes |
|
|
828 |
|
|
|
(627 |
) |
|
|
(589 |
) |
|
|
388 |
|
|
Income tax benefit (expense) |
|
|
(30 |
) |
|
|
44 |
|
|
|
29 |
|
|
|
(10 |
) |
|
Net income |
|
|
798 |
|
|
|
(583 |
) |
|
|
(560 |
) |
|
|
378 |
|
|
(Loss) earnings per share attributable to Jamba, Inc. common shareholders: |
|
|
|
|
|
|
|
|
|
|
|
|
|
|
|
|
|
Basic |
|
$ |
0.05 |
|
|
$ |
(0.04 |
) |
|
$ |
(0.03 |
) |
|
|
|
|
|
Diluted |
|
$ |
0.05 |
|
|
$ |
(0.04 |
) |
|
$ |
(0.03 |
) |
|
|
|
|
Significant Estimates - The preparation of the consolidated financial statements and accompanying notes are in conformity with accounting principles generally accepted in the United States of America (“U.S. GAAP”). Preparing consolidated financial statements requires management to make estimates and assumptions that affect the reported amounts of assets, liabilities, revenue and expenses and disclosure of contingent assets and liabilities at the date of the financial statements and the reported amounts of revenue and expenses during the reported periods. Actual results could differ from those estimates.
Reclassifications - Certain prior year amounts have been reclassified to conform to current year presentation in the consolidated financial statements.
Concentrations of Risk - From fiscal 2012 through October 2014, the Company maintained food distribution contracts primarily with one distributor. In October 2014, the Company began working with both Gordon Food Services (“GFS”) in the Eastern United States and Systems Services of America (“SSA”) in the Western United States to distribute food sold in the majority of Company and Franchise Stores. In fiscal 2016 and fiscal 2015, two distributors accounted for approximately 92% and 98%, respectively, of the supplies delivered to Company and Franchise Stores. The Company's limited distributor relationships could have an adverse effect on the Company’s operations.
Financial instruments that potentially subject the Company to concentrations of credit risk consist primarily of cash and cash equivalents. The Company places its cash and cash equivalents with high-quality financial institutions. Balances in the Company’s cash accounts frequently exceed the Federal Deposit Insurance Corporation insurance limit. The Company has not experienced any losses related to these balances and believes the credit risk to be minimal.
Cash and Cash Equivalents - The Company considers all highly liquid instruments with maturities of three months or less when purchased to be cash equivalents. The existing letters of credit balance of $0.4 million is collateralized by restricted cash.
Receivables - Receivables primarily represent amounts due from royalty fees, advertising fees, construction allowances, amounts receivable from suppliers, distributors and CPG customers, sale of jambacards by other issuers and franchisees and rent receivable from franchisees. The allowance for doubtful accounts is the Company’s estimate of the amount of probable credit losses in the Company’s existing accounts receivable.
F-7
Inventories - Inventories are stated at the lower of cost or market. Cost is determined using the first-in, first-out method (“FIFO”). Inventories consist of food, beverages and available-for-sale promotional products. The Company reduces inventory for obsolete and slow-moving inventory and for estimated shrinkage between physical inventory counts.
Property, Fixtures and Equipment - Property, fixtures and equipment are stated at cost less accumulated depreciation. Depreciation is computed using the straight-line method over the estimated useful life. Expenditures for major additions and improvements are capitalized and minor replacements, maintenance and repairs are charged to expense as incurred. The estimated useful life for leasehold improvements is the lesser of 10 years or the term of the underlying lease. The estimated useful life for furniture, fixtures and equipment is three to 10 years. Capitalized software is recorded at cost and includes purchased, internally-developed and externally-developed software used in the Company’s operations. Amortization expense is provided using the straight-line method over the estimated useful lives of the software, which range from one to three years. In fiscal year 2016, the Company received approximately $1.1 million in tenant allowances, primarily related to the headquarters relocation to Frisco, TX.
Upon sale, the cost of assets disposed and their related accumulation depreciation are removed from the consolidated balance sheets. The Company calculates the gain or loss by comparing the carrying value of the assets to the selling price.
Intangible Assets Subject to Amortization – Intangible assets subject to amortization (primarily franchise and reacquired franchise rights, favorable lease intangible assets and acquired customer relationships) are amortized over their estimated useful lives using a method of amortization that reflects the pattern in which the economic benefits of the intangible assets are consumed or otherwise realized. The useful life for the franchise agreements is approximately 13.4 years. The useful life of reacquired franchise rights represents the remaining term of the franchise agreement. The useful life of the favorable lease portfolio intangible is based on the related lease term.
Business Combinations - The Company accounts for business combinations using the acquisition method. Under the acquisition method, the purchase price of the acquisition is allocated to the underlying tangible and intangible assets acquired based on their respective fair values. Fair values are derived from various observable and unobservable inputs and assumptions. The Company utilizes third-party valuation specialists to assist in the allocation. Initial purchase price allocations are preliminary and are subject to revision within the measurement period, not to exceed one year from the date of acquisition. The costs of the business acquisitions are expensed as incurred. These costs may include fees for accounting, legal, professional consulting and valuation specialists.
Assets Held for Sale - The Company classifies assets as held for sale and suspends depreciation and amortization when approval at the appropriate level has been provided, the assets can be immediately removed from operations, an active program has begun to locate a buyer, the assets are being actively marketed for sale at or near their current fair value, significant changes to the plan of sale are not likely and the sale is probable within one year. Upon classification as held for sale, long-lived assets are no longer depreciated, and an assessment of impairment is performed to identify and expense any excess of carrying value over fair value less costs to sell. Subsequent changes to the estimated fair value less costs to sell will impact the measurement of assets held for sale. To the extent fair value increases, any impairment previously recorded is reversed. If the carrying value of the assets held for sale exceeds the fair value less costs to sell, the Company will record a loss for the amount of the excess. The Company also reclassifies the associated prior year balances for assets reclassified to assets held for sale.
If the Company decides not to sell previously classified assets held for sale, the asset is reclassified back to their original asset group. The assets are recorded at the lower of the carrying value before being classified as held for sale adjusted for depreciation that would have been recognized during the time they were classified as held for sale or fair value at the date the Company decided not to sell. Assets held for sale as of January 3, 2017 was $0.2 million and related to JambaGO® assets, which is recorded in assets held for sale in the consolidated balance sheets.
Impairment of Long-lived assets - Long-lived assets, such as property and equipment and intangible assets subject to amortization, are tested for impairment at least annually or when facts and circumstances indicate that the carrying values of long-lived assets may not be recoverable. Long-lived assets are grouped for recognition and measurement of impairment at the lowest level for which identifiable cash flows are largely independent of the cash flows of other assets, generally the store asset group level. The Company first compares the carrying value of the
F-8
asset to the asset’s estimated future undiscounted cash flows. If the estimated future cash flows are less than the carrying value of the asset, the Company measures an impairment loss based on the asset’s estimated fair value. The fair value of a store’s assets is estimated using a discounted cash flow model based on internal projections and taking into consideration the view of a market participant. The estimate of cash flows is based on, among other things, certain assumptions about expected future operating performance. Factors considered during the impairment evaluation include factors related to actual operating cash flows, the period of time since a store has been opened or remodeled, refranchising expectations and the maturity of the relevant market. The Company recorded impairment charges of $3.4 million, $2.5 million, and $0.2 million for fiscal years 2016, 2015 and 2014, respectively.
Impairment of Goodwill, Trademarks and Other Intangible Asset Not Subject to Amortization - Goodwill is evaluated for impairment on an annual basis during the Company’s fourth fiscal quarter, or more frequently if circumstances, such as material deterioration in performance, indicate carrying values may exceed their fair values. When reviewing goodwill for impairment, the Company assesses whether goodwill should be allocated to operating levels lower than its single operating segment for which discrete financial information is available and reviewed for decision-making purposes. These lower levels are referred to as reporting units. Currently, the Company’s one operating segment was determined to be one reporting unit.
Our annual impairment test of goodwill may be completed through a qualitative assessment. We may elect to bypass the qualitative assessment and proceed directly to a two-step quantitative impairment test, in any period. We can resume the qualitative assessment for any subsequent period. If we elect to bypass the qualitative assessment for any reporting unit, or if a qualitative assessment indicates it is more-likely-than-not that the estimated carrying value of a reporting unit exceeds its fair value, we perform a two-step quantitative goodwill impairment test. First, the reporting unit’s estimated fair value is compared to its carrying value, including goodwill. If the Company determines that the estimated fair value of the reporting unit is less than its carrying value, it moves to the second step to determine the implied fair value of the reporting unit’s goodwill. If the carrying amount of the reporting unit’s goodwill exceeds its implied fair value, an impairment loss is recognized. No goodwill impairment was recorded for fiscal years 2016, 2015 and 2014.
Intangible assets not subject to amortization (primarily trademarks) are evaluated for impairment on an annual basis during the fourth fiscal quarter, or more frequently if events or changes in circumstances indicate that the asset might be impaired. The Company qualitatively assesses the impairment for other intangible assets not subject to amortization to determine whether it is more likely than not that the fair value of intangible assets are less than their carrying amount.
For other intangible assets not subject to amortization not assessed qualitatively, a quantitative approach is utilized. The Company compares the carrying value of the applicable asset to its fair value, which the Company estimates using a discounted cash flow analysis or by comparing with the market values of similar assets. If the carrying amount of the asset exceeds its estimated fair value, the Company determines the impairment loss, if any, as the excess of the carrying value of the intangible asset over its fair value. An impairment loss is generally recognized when the carrying amount of the trademarks exceeds the fair value. For fiscal 2016, 2015 and 2014, the company had no impairments related to other intangible assets not subject to amortization.
jambacards® - The Company, through its subsidiary, Jamba Juice Company, sells gift cards called jambacards to its customers in its retail stores, through its website and through resellers. The Company’s jambacards do not have an expiration date. An obligation is recorded at the time of either an initial load or a subsequent reload in accrued jambacard liability on the Company’s consolidated balance sheets. The Company recognizes income from jambacards when (i) the jambacard is redeemed by the customer or (ii) the likelihood of the jambacard being redeemed by the customer is remote (also referred to as “breakage”) and the Company determines that it does not have a legal obligation to remit the unredeemed jambacards to the relevant jurisdictions. The Company determines the jambacard breakage amount based upon its historical redemption patterns. Jambacard breakage income is included in other operating, net in the Consolidated Statements of Operations.
Self-Insurance Reserves -The Company is self-insured for healthcare benefits. The estimated accruals for these liabilities are based on statistical analyses of historical industry data as well as actual historical trends. For its workers’ compensation benefits, the Company has a guaranteed cost policy which renewed on October 1, 2016. Prior to September 30, 2015, the Company had a retrospective policy and was self-insured for existing and prior
F-9
years exposures through September 30, 2012. For these two policies, liabilities associated with the risks that the Company retains for workers’ compensation benefits are estimated in part, by considering historical claims experience, demographic factors, severity factors and other actuarial assumptions. The Company’s estimates use this actuarial data in conjunction with known industry trends and Company experience.
Rent Expense - Under the provisions of certain of the Company’s leases, there are rent holidays and/or escalations in payments over the base lease term, as well as renewal periods. The effects of rent holidays and escalations are reflected in rent costs on a straight-line basis over the expected lease term, which includes cancelable option periods when it is deemed to be reasonably assured that the Company will exercise such option periods due to the fact that the Company would incur an economic penalty for not doing so. The lease term commences on the date when the Company becomes legally obligated for the rent payments which generally coincides with the time when the landlord delivers the property for the Company to develop. All rent costs recognized during construction periods are classified as pre-opening expenses.
The Company has assigned certain of its store leases to franchisees as part of refranchising transactions, and in some cases for amounts less than the Company’s rent obligation. Liabilities for those rent concessions are recorded and relieved against rent expense over the remaining term of the related lease.
Construction Allowances - The Company receives construction allowances from certain landlords, which are deferred and amortized on a straight-line basis over the lease term as a reduction of rent expense. In fiscal year 2016, the Company received approximately $1.1 million in allowances, primarily related to the headquarters relocation to Frisco, TX. Construction allowances are recorded in deferred rent and other long-term liabilities.
Revenue Recognition - Revenue from Company Stores is recognized when product is sold. Revenue is presented net of any taxes collected from customers and remitted to government entities. In fiscal 2014, the Company initiated a loyalty program for its customers, which allows them to earn points based on the volume of their purchases. Under the loyalty program, a customer receives a discount on future purchases when a defined number of points have been earned. The estimated amount of points redeemable in exchange for discounts is recorded in deferred revenue and recognized when the customers redeem the points they earned. The deferred revenue for unredeemed points under the loyalty program was $0.2 million at January 3, 2017 and December 29, 2015.
Revenue from jambacards is recognized upon redemption in exchange for product. Until redemption, outstanding customer balances are recorded as a liability. See “jambacards” section above for discussion on recognition of jambacard breakage.
The Company generally executes franchise agreements for each store that establishes the terms of its arrangement with the franchisee. The franchise agreements typically require the franchisee to pay an initial, non-refundable fee and continuing fees based upon a percentage of sales. Subject to the Company’s approval and the franchisee’s payment of a renewal fee, a franchisee may generally renew the franchise agreement upon its expiration.
Franchise revenue is generated from royalties, development fees, initial franchise fees and revenue from sales at franchise-operated Jamba Juice Express and JambaGO® units. Royalties from Franchise Stores are determined as a percentage of Franchise Store revenue and are recognized in the same period as the related Franchise Store sales occur. If collection of the franchise royalty fee is doubtful, revenue is recognized at the time of collection.
Development fees are paid to the Company as part of an agreement to open and operate a specific number of stores in a specified territory. The amount of the fee is based on the number of stores to be opened pursuant to the development agreement. The nonrefundable fees collected for these services are recognized as the franchise stores under these agreements open. The Company’s multi-unit development agreements specify the number of stores to be opened.
F-10
The Company charges an initial franchise fee for providing operational materials, new store opening, planning and functional training courses. Initial franchise fees, if any, are due for payment at the time the franchise agreement for a particular store is executed. Franchise fees are recognized as revenue when all material services or conditions have been substantially performed or satisfied and no other material conditions or obligations related to the determination of substantial performance exist. Duties and services that are completed prior to approval include training, facilities inspection, receipt of operating license(s) and clearance from appropriate agencies. These duties and services are substantially complete prior to the approval of the opening of a store. Revenue is recognized when the store opens.
Revenue from sales at the Company’s flexible format franchise locations are recognized when the products are delivered to the operators of the Jamba Juice Express.
Other revenue primarily consists of revenue from sales of CPG products sold to retail outlets and online and royalties from licensed CPG products. Revenue from sale of CPG products is recognized when the products are delivered to the customer. License revenue from CPG products is based on a percentage of product sales and is recognized as revenue upon the sale of the product to retail outlets.
Cost of Sales - The Company includes in cost of sales, costs incurred to acquire fruit, dairy and other products used to make smoothies and juices, other food offerings and paper products sold by the Company Stores.
Store Lease Termination and Closure Costs - Costs incurred when closing a store are generally expensed as incurred. At the date the Company ceases use of a store under an operating lease, a liability is recorded for the net present value of any remaining lease obligations, net of estimated sublease income, if any. In instances where a buyout is reasonably expected within six months of store closure, liabilities are recorded by estimating the expected buyout fee and the rent expected to be incurred until a buyout agreement is reached. Any costs recorded upon store closure, as well as any subsequent adjustments to liabilities for remaining lease obligations, as a result of lease termination or changes in estimates of sublease income are recorded in other operating, net in the Consolidated Statements of Operations. Considerable management judgment is necessary to estimate future cash flows, including cash flows from continuing use, terminal value and sublease income. Accordingly, actual results could vary from the Company’s estimates.
Advertising Fund - The Company participates with its franchisees in an advertising fund to collect and administer funds contributed for use in advertising and promotional programs, which are designed to increase sales and enhance the reputation of the Company and its franchise owners. Contributions to the advertising fund are required for Company Stores and traditional Franchise Stores and are generally based on a percent of store sales. The Company has control of the advertising fund. The fund is consolidated and all assets and liabilities of the fund are reported.
The advertising fund assets, consisting primarily of cash received from the Company and franchisees and accounts receivable from franchisees, can only be used for selected purposes and are considered restricted. The cash contributed by franchisees is recorded as a liability against which specified advertising costs are charged. The Company does not reflect franchisee contributions to the fund as revenue in its consolidated statements of operations or consolidated statements of cash flows.
Advertising fund assets as of January 3, 2017 and December 29, 2015 include $1.5 million and $2.4 million of receivables from franchisees, net of allowances, respectively, which is recorded in receivables in the consolidated balance sheets. Advertising fund liabilities as of January 3, 2017 and December 29, 2015, of $1.4 million and $1.2 million, respectively, are reported in other current liabilities and accounts payable in the Company’s consolidated balance sheets.
Advertising Costs - Advertising costs are expensed as incurred and were $2.3 million, $8.5 million and $10.0 million in fiscal years 2016, 2015 and 2014, respectively, and are included in store operating expenses. Advertising contributions received from franchisees, totaled $10.6 million, $7.5 million and $5.8 million for fiscal years 2016, 2015 and 2014, respectively, and were recorded as an offset to advertising expense.
F-11
Store Pre-Opening Costs - Costs incurred in connection with start-up and promotion of new store openings as well as rent from possession date to store opening date are expensed as incurred.
Comprehensive Income - Comprehensive income is defined as the change in equity during a period from transactions and other events, excluding changes resulting from investments from owners and distributions to owners. The Company currently has no components of comprehensive income other than net income, therefore no separate statement of comprehensive income is presented.
Income Taxes - Deferred tax assets and liabilities are recognized for the future tax consequences attributable to differences between the financial statement carrying amounts of existing assets and liabilities and their respective tax basis. Deferred tax assets and liabilities are measured using enacted income tax rates expected to apply to taxable income in the years in which those temporary differences are expected to be recovered or settled. Any effect on deferred tax assets and liabilities due to a change in tax rates is recognized in income in the period that includes the enactment date. In establishing deferred income tax assets and liabilities, judgments and interpretations are made based on enacted tax laws and published tax guidance applicable to the Company’s operations. The Company records deferred tax assets and liabilities and evaluates the need for valuation allowances to reduce deferred tax assets to amounts more likely than not of being realized. Changes in the valuation of the deferred tax assets or changes in the income tax provision may affect the Company’s annual effective income tax rate.
Uncertain tax positions are recognized as the greatest amount more than 50% likely of being sustained upon audit based on the technical merits of the position. On a quarterly basis, the Company reviews and updates its inventory of tax positions as necessary to add any new uncertain tax positions taken, or to remove previously identified uncertain positions that have been effectively settled. Additionally, uncertain positions may be re-measured as warranted by changes in facts or law. Accounting for uncertain tax positions requires significant judgments, including estimating the amount, timing and likelihood of ultimate settlement. Although the Company believes that these estimates are reasonable, actual results could differ from these estimates. The Company classifies interest and penalties related to income taxes as a component of income taxes in the consolidated statements of operations.
A liability related to an unrecognized tax benefit is offset against a deferred tax asset for a net operating loss carryforward, a similar tax loss or a tax credit carryforward if such settlement is required or expected in the event the uncertain tax position is disallowed. In situations in which a net operating loss carryforward, a similar tax loss or a tax credit carryforward is not available at the reporting date under the tax law of a jurisdiction or the tax law of a jurisdiction does not require it, and the Company does not intend to use the deferred tax asset for such purpose, the unrecognized tax benefit is presented in the financial statement as a liability and is not combined with deferred tax assets.
Earnings (Loss) Per Share - Basic earnings (loss) per share is computed based on the weighted-average number of common shares outstanding during the period. Diluted earnings (loss) per share is computed based on the weighted-average number of common shares and potentially dilutive securities, which includes outstanding options and restricted stock awards granted under the Company’s stock option plans. For fiscal years 2016 and 2014, the Company’s basic weighted average shares outstanding were equal to its diluted weighted average shares outstanding, since the Company experienced net losses.
During fiscal years 2015 and 2014, the Company repurchased 1,948,004 and 910,813 shares of common stock, respectively, which reduced the basic weighted average shares outstanding. The Company did not repurchase shares of common stock in fiscal year 2016.
Anti-dilutive common stock equivalents of 1.9 million, 1.9 million and 1.5 million have been excluded from diluted weighted-average shares outstanding in fiscal years 2016, 2015 and 2014, respectively.
Share-based compensation - The Company’s share-based compensation relates to stock options and restricted stock units and is accounted for at fair value. Stock options for a fixed number of shares are granted to certain employees and directors with an exercise price based on the grant date fair value of the Company’s common stock. Compensation expense is recognized for any unvested stock option awards and time-based restricted stock awards on a straight-line basis or ratably over the requisite service period, generally three or four years. For all award types,
F-12
the Company makes assumptions for the number of awards that will ultimately not vest (“forfeitures”) in determining the share-based compensation expense for these awards. The Company uses historical data to estimate expected employee behaviors related to option exercises and forfeitures. Compensation expense is trued up for actual forfeitures if different than the estimate.
The fair value of options granted was estimated at the date of grant using a Black-Scholes option-pricing model. Option valuation models, including Black-Scholes, require the input of subjective assumptions, which can materially affect the grant date fair value of a stock option award. The assumptions used include the risk-free interest rate, the expected term of the award, expected volatility and expected dividend yield. The risk-free interest rate is based on the zero coupon U.S. Treasury rates appropriate for the expected term of the award. For the expected term of the award, the Company utilized the median of the Company’s peer group’s expected term, after adjusting for vesting and term differences. Expected volatility is based on an average of the Company’s recent historic daily stock price observations of the Company’s common stock during the period immediately preceding the share-based award grant that is equal in length to the award’s expected term and the Company’s implied volatility based on the mean of 180-day call and put options as per the open market. Expected dividends are zero based on the history of not paying cash dividends on the Company’s common stock and its intention not to make dividend payments in the future.
The Company grants time-based restricted stock units with a fair value determined based on the closing price of the Company’s common stock on the date of grant. For employees, these restricted stock units typically vest and become unrestricted over the three-year period following the date of grant. For non-employee directors, these restricted stock units typically vest and become unrestricted one year after the date of grant. The Company grants performance-based restricted stock units (“PSUs”), which typically vest upon the Company satisfying certain performance targets and are granted to employees and non-employees. The Company records compensation expense for PSUs when it is probable that the performance condition(s) included in the grant will be achieved. The compensation expense ultimately recognized, if any, related to these awards will equal the grant date fair value for the number of shares for which the performance condition has been satisfied. The fair value of the PSUs is determined based on fair value at the date of grant.
In addition, the Company grants market-based restricted stock units to certain employees. The fair value was determined using a Monte Carlo simulation that incorporated option-pricing inputs covering the period from the grant date through the end of the performance period as of the date of grant. Market-based restricted stock units typically vest and become unrestricted upon achievement of compound annual stock price growth rate targets of 15%, 22.5% and 30% over a three-year period. Share-based compensation expense is recognized ratably over the vesting periods for all market-based and time-based restricted stock units.
Fair Value of Financial Instruments - The following instruments are not measured at fair value on the Company’s consolidated balance sheets but require disclosure of their fair values: cash and cash equivalents, accounts receivables, notes receivable and accounts payable. The estimated fair value of such instruments, excluding notes receivable, approximates their carrying value as reported in the Company’s consolidated balance sheets due to their short-term nature. The estimated fair value of notes receivable approximates its carrying value due to the interest rates aligning with market rates. The fair value of such financial instruments is determined using the income approach based on the present value of estimated future cash flows. The fair value of these instruments would be categorized as Level 2 in the fair value hierarchy, with the exception of cash and cash equivalents, which would be categorized as Level 1.
Segment Reporting - The Company has one reportable retail segment.
Recent Accounting Pronouncements
In August 2014, the Financial Accounting Standards Board (“FASB”) issued Accounting Standard Update (“ASU”) 2014-15, Presentation of Financial Statements – Going Concern (Subtopic 205-40): Disclosure of Uncertainties about an Entity’s Ability to Continue as a Going Concern. ASU 2014-15 requires management to evaluate, at each interim and annual reporting period, whether there are conditions or events that raise substantial doubt about the entity’s ability to continue as a going concern within one year after the date the financial statements are issued, and provide related disclosures. ASU 2014-15 is effective for the annual period ending after December 15, 2016, and for annual periods and interim periods thereafter. The adoption of this guidance did not have any impact on the Company's consolidated financial statements and related disclosures.
F-13
The Company has not yet adopted and is currently assessing the potential impact of the following pronouncements on its Consolidated Financial Statements and related disclosure:
In May 2014, the FASB issued amended guidance on revenue from contracts with customers which amended the existing accounting standards for revenue recognition. ASU 2014-09, Revenue from Contracts with Customers, establishes principles for recognizing revenue upon the transfer of promised goods or services to customers, in an amount that reflects the expected consideration received in exchange for those goods or services. In August 2015, the FASB issued ASU 2015-14 deferring the effective date to fiscal years beginning after December 15, 2017 (including interim reporting periods within those periods). Early adoption is permitted to the original effective date of the fiscal year beginning after December 15, 2016 (including interim reporting periods within those periods). The amendment guidance may be applied retrospectively to each prior period presented with the option to apply practical expedients or retrospectively with the cumulative effect recognized as of the date of initial application. Management believes adoption of the new revenue recognition standard will impact the Company’s accounting for other fees charged to franchisees and transactions involving its advertising fund and gift card fund. Currently, the Company anticipates to adopt the new revenue standard using the modified retrospective transition approach. Management is in the process of determining the financial statement impact and currently unable to estimate the impact on the Company’s consolidated financial statements or related disclosures.
In February 2016, the FASB issued ASU 2016-02, Leases (“ASU 2016-02”), which will require lessees to recognize a lease liability and a right-of-use asset for all leases (with the exception of leases with terms less than 12 months) at the commencement date. The guidance will be effective for the Company beginning fiscal year 2019, with early adoption permitted. The new standard is required to be applied with a modified retrospective approach to each prior reporting period presented with various optional practical expedients. Management believes the adoption of ASU 2016-02 will materially impact the Company’s consolidated financial statements by significantly increasing non-current assets and non-current liabilities on the consolidated balance sheets in order to record the right of use assets and related lease liabilities for existing operating leases. Management is currently unable to estimate the impact on the consolidated financial statements.
In March 2016, the FASB issued ASU 2016-04, Recognition of Breakage for Certain Prepaid Stored-Value Products. The new guidance creates an exception under ASC 405-20, Liabilities-Extinguishments of Liabilities, to derecognize financial liabilities related to certain prepaid stored-value products using a revenue-like breakage model. The guidance will be effective for the Company beginning fiscal year 2018, with early adoption permitted. This guidance can be applied either retrospectively to each period presented or as a cumulative-effect adjustment as of the date of adoption.
In March 2016, the FASB issued ASU 2016-09, Compensation-Stock Compensation: Improvements to Employee Share-Based Payment Accounting. The updated guidance changes how companies account for certain aspects of share-based payment awards to employees, including the accounting for income taxes, forfeitures and statutory tax withholding requirements, as well as classification in the statement of cash flows. The standard also allows us to repurchase more of an employee’s vesting shares for tax withholding purposes without triggering liability accounting, clarifies that all cash payments made to tax authorities on an employee’s behalf for withheld shares should be presented as a financing activity on the cash flows statement, and provides an accounting policy election to account for forfeitures as they occur. The net result of the adoption of ASC 2016-09 on deferred taxes will be zero. The cumulative gross excess tax benefit, or APIC windfall amount is approximately $2.0 million as of January 3, 2017, or approximately $0.8 million on a tax effected basis. When ASU 2016-09 is adopted, the gross excess tax benefit will be recognized as additional deferred tax asset and will increase the net operating loss carryforward. Given the Company has a full valuation allowance against its deferred tax assets, there is no impact on deferred taxes. The guidance will be effective for the Company beginning fiscal year 2017.
The Company has not yet adopted and does not expect the adoption of the following pronouncements to have a significant impact on its Consolidated Financial Statements and related disclosure:
In August 2016, the FASB issued ASU 2016-15, Statement of Cash Flows—Classification of Certain Cash Receipts and Cash Payments, which provides specific guidance for certain cash flow classification issues, previously not specifically addressed, including classification for debt prepayment, contingent consideration made after a business combination, insurance claim proceeds and corporate-owned life insurance policies, distributions
F-14
received from equity method investees and certain other items. The guidance will be effective for the Company beginning fiscal year 2018, with early application permitted.
In July 2015, the FASB issued ASU 2015-11, Simplifying the Measurement of Inventory. This update applies to inventory that is measured using FIFO or average cost method and requires measurement of that inventory at the lower of cost or net realizable value. Net realizable value is defined as the estimated selling price in the ordinary course of business, less reasonably predictable costs of completion, disposal and transportation. This guidance will be effective for the Company beginning fiscal year 2017.
In January 2016, the FASB issued ASU 2016-01, Financial Instruments - Overall (Subtopic 825-10): Recognition and Measurement of Financial Assets and Financial Liabilities (“ASU 2016-01”). ASU 2016-01 addresses certain aspects of recognition, measurement, presentation, and disclosure of financial instruments. ASU 2016-01 will be effective for the Company beginning fiscal year 2018.
In January 2017, the FASB issued ASU 2017-04, Intangibles - Goodwill and Other (Topic 350): Simplifying the Test for Goodwill Impairment, which eliminates Step 2 from the goodwill impairment test. The impairment amount will be calculated at Step 1. The amendments also eliminate the requirements for any reporting unit with a zero or negative carrying amount to perform a qualitative assessment and, if it fails that qualitative test, to perform Step 2 of the goodwill impairment test. An entity still has the option to perform the qualitative assessment for a reporting unit to determine if the quantitative impairment test is necessary. This guidance will be effective for the Company’s fourth quarter annual impairment test in fiscal year 2019, with early adoption permitted.
In January 2017, the FASB issued ASU 2017-09, Compensation-Stock Compensation (Topic 718): Improvements to Employee Share-Based Payment Accounting. The amendments provide guidance on determining which changes to the terms and conditions of share-based payment awards require an entity to apply modification accounting under Topic 718. This guidance will be effective for the Company’s fiscal year 2018, with early adoption permitted.
2. REFRANCHISING
In November 2014, the Company announced an accelerated transition to an asset-light model that included the sale of up to 114 Company Stores in the California market. During fiscal 2015, the Company refranchised 179 opened stores and one unopened store (of which 176 were previously classified as assets held for sale) for total proceeds of $53.1 million which included cash of $51.1 million and notes receivable of $2.0 million. As a result of these transactions, the Company recorded a total gain of $21.6 million on the disposal of assets during fiscal year 2015. At January 3, 2017 and December 29, 2015, notes receivable related to the refranchising was $2.0 million and are included in other long-term assets in the consolidated balance sheets.
In connection with the headquarters relocation from Emeryville, California to Frisco, Texas the Company refranchised the Emeryville store in December 2016 for total proceeds of $0.1 million, which resulted in an immaterial gain. In November 2016, the Company announced plans to refranchise of 13 Company-owned stores in the Chicago area which was subsequently completed in the second quarter of 2017.
F-15
3. PROPERTY, FIXTURES AND EQUIPMENT
Property, fixtures and equipment consisted of the following as of (in thousands):
|
|
|
January 3, 2017 |
|
|
December 29, 2015 |
|
||
|
Leasehold improvements |
|
$ |
20,734 |
|
|
$ |
19,586 |
|
|
Furniture, fixtures and equipment |
|
|
30,349 |
|
|
|
28,470 |
|
|
Construction in progress (primarily stores under construction) |
|
|
74 |
|
|
|
3,773 |
|
|
Total |
|
|
51,157 |
|
|
|
51,829 |
|
|
Less accumulated depreciation and amortization |
|
|
(38,645 |
) |
|
|
(36,229 |
) |
|
Total |
|
$ |
12,512 |
|
|
$ |
15,600 |
|
Depreciation expense related to property, fixtures and equipment for fiscal years 2016, 2015 and 2014 was $5.7 million, $6.5 million and $10.0 million, respectively. Assets related to JambaGo were reclassified on the consolidated balance sheets from property, fixtures and equipment to assets held for sale of $0.2 million and $3.1 million for fiscal years 2016 and 2015.
In fiscal 2016, the Company corrected certain errors including an overstatement of expenses included within depreciation expense of approximately $0.2 million related to prior period financial statements. The Company determined that the corrections were neither quantitatively or qualitatively material to those periods individually and in the aggregate or to the trend of the reported operating results.
4. GOODWILL, TRADEMARKS AND OTHER INTANGIBLE ASSETS
A summary of the changes in goodwill for fiscal 2016 and 2015 follows (in thousands):
|
|
|
Amount |
|
|
|
Balance as of December 30, 2014 |
|
$ |
945 |
|
|
Additions |
|
|
232 |
|
|
Reclassification out of assets held for sale |
|
|
7 |
|
|
Balance as of December 29, 2015 |
|
|
1,184 |
|
|
Refranchise |
|
|
(1 |
) |
|
Balance as of January 3, 2017 |
|
$ |
1,183 |
|
The carrying amount and accumulated amortization of trademarks and other intangible assets as of January 3, 2017 and December 29, 2015 were as follows (in thousands):
|
|
|
Gross Amount |
|
|
Accumulated Amortization |
|
|
Net Amount |
|
|||
|
Intangible Assets |
|
|
|
|
|
|
|
|
|
|
|
|
|
As of January 3, 2017 |
|
|
|
|
|
|
|
|
|
|
|
|
|
Favorable leases |
|
|
1,850 |
|
|
|
(1,850 |
) |
|
|
— |
|
|
Trademarks |
|
|
807 |
|
|
|
— |
|
|
|
807 |
|
|
Franchise agreements and customer lists |
|
|
677 |
|
|
|
(511 |
) |
|
|
166 |
|
|
Reacquired franchise rights |
|
|
599 |
|
|
|
(245 |
) |
|
|
354 |
|
|
Total |
|
$ |
3,933 |
|
|
$ |
(2,606 |
) |
|
$ |
1,327 |
|
F-16
|
|
Gross Amount |
|
|
Accumulated Amortization |
|
|
Net Amount |
|
||||
|
As of December 29, 2015 |
|
|
|
|
|
|
|
|
|
|
|
|
|
Favorable leases |
|
|
1,850 |
|
|
|
(1,850 |
) |
|
|
— |
|
|
Trademarks |
|
|
807 |
|
|
|
— |
|
|
|
807 |
|
|
Franchise agreements and customer lists |
|
|
735 |
|
|
|
(496 |
) |
|
|
239 |
|
|
Reacquired franchise rights |
|
|
599 |
|
|
|
(181 |
) |
|
|
418 |
|
|
Total |
|
$ |
3,991 |
|
|
$ |
(2,527 |
) |
|
$ |
1,464 |
|
Intangible assets, other than trademarks, are amortized over their expected useful lives, ranging from two to seven years. Amortization expense for intangible assets was $0.1 million for fiscal years 2016, 2015 and 2014. The remaining intangible assets, subject to amortization of $0.5 million will continue to be amortized over their estimated useful lives. Expected annual amortization expense for the remaining intangible assets recorded as of January 3, 2017 is as follows (in thousands):
|
Fiscal Year |
|
Amortization Expense |
|
|
|
2017 |
|
$ |
114 |
|
|
2018 |
|
|
112 |
|
|
2019 |
|
|
97 |
|
|
2020 |
|
|
62 |
|
|
2021 |
|
|
47 |
|
|
Thereafter |
|
|
88 |
|
Trademarks are not subject to amortization and the Company evaluates for impairment on an annual basis during the fourth quarter or more frequently if events or changes in circumstances indicate that the asset might be impaired. There was no impairment charge for trademarks in fiscal 2016 and fiscal 2015.
5. ACQUISITIONS
2015 Acquisition
In December 2015, the Company acquired two domestic stores in California from a former franchisee. The purchase was accounted for using the acquisition method of accounting. Under the acquisition method, the purchase price is allocated to the underlying tangible and intangible assets acquired based on their respective fair values. A summary of the purchase price, the fair value of the net assets acquired and the goodwill on the purchase follows (in thousands):
|
Cash paid to acquire stores |
|
$ |
737 |
|
|
Additional consideration resulting from termination of pre-existing relationships |
|
|
85 |
|
|
Total purchase consideration |
|
$ |
822 |
|
|
|
|
|
|
|
|
Net assets acquired: |
|
|
|
|
|
Current assets |
|
$ |
12 |
|
|
Fixed assets |
|
|
259 |
|
|
Re-acquired franchise rights |
|
|
424 |
|
|
Unfavorable Lease |
|
|
(105 |
) |
|
Net assets acquired |
|
$ |
590 |
|
|
|
|
|
|
|
|
Goodwill |
|
$ |
232 |
|
There was a gain on termination of pre-existing relationships that was recorded in gain on disposal of assets on the Consolidated Statement of Operations, and resulted in an increase in the purchase price consideration and an increase in goodwill. The pro-forma effect of the acquisition on the Company’s results of operations was not significant.
F-17
The fair value of the fixed assets acquired is classified as level 2 and is based on inputs other than quoted prices in active markets included in level 1, which are either directly or indirectly observable, to estimate replacement value. The fair value of re-acquired franchise rights is classified as level 3, and is based on significant unobservable inputs and assumptions such as management’s estimate of operating profit and assumed discount rates. Significant changes in the inputs or assumptions would increase or decrease the fair value measurements that would impact the depreciation or amortization of fixed assets and reacquired franchise rights and future impairment, if any.
The fixed assets acquired include leasehold improvements which have an estimated useful life of the lesser of 10 years or the remaining term of the underlying lease. The estimated useful life for furniture, fixtures, and equipment acquired is three to 10 years.
2014 Acquisition
In September 2014, the Company acquired 26 domestic stores, of which three were immediately closed, in the Midwest from a former franchise partner pursuant to a Settlement and General Release Agreement. The purchase was accounted for using the acquisition method of accounting. Under the acquisition method, the purchase price is allocated to the underlying tangible and intangible assets acquired based on their respective fair values. A summary of the purchase price, the fair value of the net assets acquired and the gain on the purchase follows (in thousands):
|
Cash paid to acquire stores |
|
$ |
725 |
|
|
Additional consideration resulting from termination of pre-existing relationships |
|
|
369 |
|
|
Total purchase consideration |
|
$ |
1,094 |
|
|
|
|
|
|
|
|
Net assets acquired: |
|
|
|
|
|
Current assets |
|
$ |
145 |
|
|
Fixed assets |
|
|
365 |
|
|
Re-acquired franchise rights |
|
|
476 |
|
|
Other assets and liabilities |
|
|
343 |
|
|
Net assets acquired |
|
$ |
1,329 |
|
|
|
|
|
|
|
|
Bargain purchase gain |
|
$ |
235 |
|
The bargain purchase price and resulting gain was the result of a reacquisition of stores from a franchisor due to their failure to comply with the franchise agreement. The gain is recorded in the Consolidated Statement of Operations. In addition, there was a gain on termination of pre-existing relationships that was recorded in the Consolidated Statement of Operations, and resulted in an increase in the purchase price consideration and a decrease in the bargain purchase gain. The pro-forma effect of the acquisition on the Company’s results of operations was not significant.
The fair value of the fixed assets acquired is classified as level 3 and is based on unobservable inputs including projected future operating results at the store level and assumed discount rates are applied to calculate the present value of the assets. The fair value of re-acquired franchise rights is classified as level 3, and it is based on significant unobservable inputs and assumptions such as management’s estimate of operating profit and assumed discount rates. Significant changes in the inputs or assumptions would increase or decrease the fair value measurements for future impairment of the fixed assets and reacquired franchise rights.
The fixed assets acquired include leasehold improvements which have an estimated useful life of the lesser of 10 years or the remaining term of the underlying lease. The estimated useful life for furniture, fixtures, and equipment acquired is three to 10 years.
The Company began actively marketing 26 acquired stores in February 2015, which resulted in the determination that the criteria for classification of assets held for sale were met. As a result, 22 store locations were reclassified to assets held for sale during the first quarter of 2015. As of December 29, 2015, these stores were reclassified out of assets held for sale resulting from management’s decision to retain or close certain of the stores.
F-18
Financial Assets and Liabilities
Fair value is an exit price, representing the amount that would be received to sell an asset or paid to transfer a liability in an orderly transaction between market participants. As such, fair value is a market-based measurement that should be determined based on assumptions that market participants would use in pricing an asset or a liability. A three-tier fair value hierarchy is established as a basis for considering such assumptions and for inputs used in the valuation methodologies in measuring fair value:
Level 1: Quoted prices are available in active markets for identical assets or liabilities.
Level 2: Inputs are other than quoted prices in active markets included in Level 1, which are either directly or indirectly observable.
Level 3: Unobservable inputs that are supported by little or no market activity, therefore requiring an entity to develop its own assumptions that market participants would use in pricing.
In the fiscal years 2016 and 2015, the Company recorded gains of $0.3 million and $0.2 million included in gain on contingent consideration within other operating, net, due to a change in circumstances under which remaining contingent consideration was no longer deemed probable of payment.
Non-financial Assets and Liabilities
There are no long-lived assets being carried at fair value as of January 3, 2017 and December 29, 2015. As a result of its quarterly impairment reviews, the Company recognized impairment of $0.4 million, $0.6 million and $0.2 million included in impairment of long-lived assets in the Consolidated Statements of Operations for fiscal years 2016, 2015 and 2014, respectively. The losses for fiscal years 2016 and 2014 are all due to impairment of fixed assets. The losses for fiscal 2015 are due to $0.3 million of impairment of trademarks and $0.3 million impairment of fixed assets.
7. NOTES RECEIVABLE AND OTHER LONG-TERM ASSETS
As of January 3, 2017 and December 29, 2015, other long-term assets consisted of the following (in thousands):
|
|
|
January 3, 2017 |
|
|
December 29, 2015 |
|
||
|
Notes receivable |
|
$ |
1,879 |
|
|
$ |
3,107 |
|
|
Deposits and other |
|
|
889 |
|
|
|
582 |
|
|
Investment in unconsolidated subsidiaries |
|
|
126 |
|
|
|
522 |
|
|
Total |
|
$ |
2,894 |
|
|
$ |
4,211 |
|
As of January 3, 2017 and December 29, 2015, notes receivable includes notes from franchisees totaling $1.9 million and $3.1 million, respectively. The note entered into during fiscal 2015 of $2.0 million has a maturity date of February 1, 2021 and the annual interest rate is 3% per annum.
8. DEVELOPMENT AGREEMENTS
The Company has entered into multi-unit license agreements with area developers to build stores in certain geographic regions. Under typical multi-unit license agreements, the area developer generally pays one-half of the initial nonrefundable fee multiplied by each store to be built as a nonrefundable development fee upon execution of the multi-unit development agreement. This deposit is included in deferred revenue in the accompanying Consolidated Financial Statements. The agreements are generally for a term of five years. Each time a store is opened under the multi-unit license agreement, the Company credits the franchisee one-half of the initial fee as part of the development fee and the franchisee is required to pay the remaining one-half of the initial fee.
F-19
The following table summarizes data about the development agreements for Franchise and International Stores as of:
|
|
|
January 3, 2017 |
|
|
December 29, 2015 |
|
Number of developers with Franchise Store contractual commitments |
|
27 |
|
|
32 |
|
Number of Franchise Stores for which commitments exist |
|
122 |
|
|
163 |
|
Number of developers with International Stores contractual commitments |
|
6 |
|
|
7 |
|
Number of International Stores for which commitments exist |
|
307 |
|
|
485 |
Deferred franchise revenue is included in other current liabilities and other long-term liabilities in the Company’s consolidated balance sheets. As of January 3, 2017 and December 29, 2015, deferred franchise revenue included $1.3 million and $1.1 million, respectively, relating to non-refundable development fees and initial fees paid by domestic franchisees whose stores have not yet opened. In addition, deferred franchise revenue as of January 3, 2017 and December 29, 2015 included $1.5 million and $1.5 million, respectively, relating to non-refundable international development fees.
9. DEFERRED RENT AND OTHER LONG-TERM LIABILITIES
Other long-term liabilities consisted of the following (in thousands):
|
|
|
January 3, 2017 |
|
|
December 29, 2015 |
|
||
|
Deferred rent |
|
$ |
2,260 |
|
|
$ |
2,961 |
|
|
Deferred revenue |
|
|
2,950 |
|
|
|
3,720 |
|
|
Construction allowance |
|
|
1,423 |
|
|
|
735 |
|
|
Other liabilities |
|
|
2,307 |
|
|
|
1,574 |
|
|
Total deferred rent and other long-term liabilities |
|
$ |
8,940 |
|
|
$ |
8,990 |
|
10. LEASE COMMITMENTS
The Company leases its office, retail stores, and some equipment under operating leases, with terms expiring through 2027. Most store leases have an initial term of 10 years, with renewal options of up to 10 years and provide for payment of common area operating expenses and real estate taxes. When the Company refranchises Company Stores, usually the franchisees become sublessees and the Company continues to be obligated under the existing lease agreements for the remainder of the lease terms.
Rental expense, net of sublease income was $7.1 million, $15.6 million and $22.3 million in fiscal years 2016, 2015 and 2014, respectively, and was recorded in occupancy and general and administrative expenses in the accompanying Statements of Operations. The Company recognized sublease income of $20.5 million, $13.8 million and $9.2 million in fiscal years 2016, 2015 and 2014, respectively.
Contingent rent included in occupancy costs in the Statements of Operations was $0.4 million, $0.5 million and $0.5 million in fiscal years 2016, 2015 and 2014, respectively.
F-20
The aggregate future minimum noncancelable lease payments and minimum rentals to be received from sublessees as of January 3, 2017, were as follows (in thousands):
|
Fiscal Year Ending: |
|
Minimum lease payments |
|
|
Minimum rentals to be received |
|
||
|
2017 |
|
$ |
26,354 |
|
|
$ |
20,117 |
|
|
2018 |
|
|
22,539 |
|
|
|
16,734 |
|
|
2019 |
|
|
18,569 |
|
|
|
13,505 |
|
|
2020 |
|
|
14,585 |
|
|
|
10,236 |
|
|
2021 |
|
|
10,769 |
|
|
|
7,446 |
|
|
Thereafter |
|
|
22,500 |
|
|
|
12,583 |
|
|
Total |
|
$ |
115,316 |
|
|
$ |
80,621 |
|
11. CREDIT AGREEMENT
On November 3, 2016, the Company entered into a credit agreement with Cadence Bank, NA (“New Credit Agreement”). The New Credit Agreement provides an aggregate principal amount of up to $10.0 million. The credit facility also allows the Company to request an additional $5.0 million for an aggregate principal amount of up to $15.0 million. The New Credit Agreement accrues interest at a per annum rate equal to the LIBOR rate plus 2.50%. The New Credit Agreement contains customary affirmative and negative covenants and has a five-year term. Under the terms of the New Credit Agreement, the Company is required to either maintain minimum cash or consolidated EBITDA levels and minimum levels of tangible net worth and a minimum fixed charge coverage ratio. The New Credit Agreement terminates November 3, 2021. This credit facility is subject to customary affirmative and negative covenants for credit facilities of this type, including limitations on the Company with respect to liens, indebtedness, guaranties, investments, distributions, mergers and acquisitions and dispositions of assets. The credit facility is evidenced by a revolving note made by the Company in favor of the Lender, is guaranteed by the Company and is secured by substantially all of its assets including the assets of its subsidiary and a pledge of stock of its subsidiary.
To acquire the credit facility, the Company incurred upfront fees, which are being amortized over the term of the Credit Agreement. As of January 3, 2017, the unamortized commitment fee amount was not material and is recorded in prepaid expenses in the consolidated balance sheets. As of January 3, 2017, the Company had no borrowings against the credit facility and was in compliance with the financial covenants to the Credit Agreement.
On February 14, 2012, the Company entered into a Credit Agreement with Wells Fargo Bank, National Association (the “Lender”), which, as amended on November 1, 2012, July 22, 2013, November 4, 2013 and December 29, 2015 (as amended, the “Credit Agreement”), made available to the Company a revolving line of credit in the amount of $10.0 million. The outstanding balance under the amended credit facility accrued interest at a LIBOR Market Index Rate based upon the rate for one month U.S. dollar deposits, plus 2.50% per annum. On July 22, 2016, the Credit Agreement expired with no amounts drawn on the credit facility since its inception. The existing letters of credit balance of $0.4 million is collateralized by restricted cash at January 3, 2017. During the term of the Credit Agreement, the unamortized commitment fee amount was not material. This credit facility was subject to customary affirmative and negative covenants for credit facilities of this type, including limitations on the Company with respect to liens, indebtedness, guaranties, investments, distributions, mergers and acquisitions and dispositions of assets.
12. SHARE-BASED COMPENSATION
Jamba, Inc. 2013 Equity Incentive Plan (“the Plan”) authorizes the Company to provide incentive compensation in the form of stock options, restricted stock and stock units (“RSUs”), performance shares and units (“PSUs”), other stock-based and restricted stock-based awards (“RSAs”), cash-based awards and deferred compensation awards. In addition, the Company periodically authorizes grants of stock-based compensation as inducement awards to new employees. This type of award does not require shareholder approval in accordance with Rule 5635(c)(4) of the Nasdaq listing rules.
F-21
On May 17, 2016, at its 2016 Annual Meeting of Shareholders, the Company’s shareholders, upon the recommendation of the Board of Directors, approved an additional 900,000 shares of common stock to be offered or issued under the 2013 Plan. The 2013 Plan authorizes up to 3,028,847 shares.
As of January 3, 2017, under the Company’s 2013 Plan, there remained 842,120 shares available for grant. All plan equity grants were issued from the 2013 Plan and it is currently the only equity plan from which future equity awards may be granted. Options granted under the 2013 Plan and inducement awards have an exercise price equal to the closing price of the Company’s common stock on the grant date, are generally exercisable for up to 10 years, and vest annually over a four-year period. Unvested shares are forfeited upon termination of employment, unless the award agreement provides otherwise.
Share-based compensation expense was $2.6 million, $5.2 million and $3.1 million for fiscal years 2016, 2015 and 2014, respectively, and is included in general and administrative expenses in the Consolidated Statements of Operations. For fiscal years 2016, 2015 and 2014, the total income tax benefit recognized in our Consolidated Statements of Operations in connection with all share-based compensation awards was $0, $0.6 million and $0, respectively.
Stock Options
The fair value of stock options was estimated at the date of grant using a Black-Scholes option pricing model with the following weighted-average assumptions.
|
|
|
Fiscal Year Ended January 3, 2017 |
|
|
Fiscal Year Ended December 29, 2015 |
|
|
Fiscal Year Ended December 30, 2014 |
|
|||
|
Weighted-average risk-free interest rate |
|
|
1.36 |
% |
|
|
1.75 |
% |
|
|
0.12 |
% |
|
Expected life of options (years) |
|
|
5.22 |
|
|
|
5.85 |
|
|
|
0.80 |
|
|
Expected stock volatility |
|
|
40.5 |
% |
|
|
43.7 |
% |
|
|
60.8 |
% |
|
Expected dividend yield |
|
|
0 |
% |
|
|
0 |
% |
|
|
0 |
% |
For fiscal 2014, the table above reflects 5,000 options that had an accelerated vesting stock modification related to terminated executives. No other options were issued in fiscal 2014.
A summary of the stock option activities for fiscal year 2016 is presented below (shares and dollars in thousands):
|
|
|
Number of Options |
|
|
Weighted- Average Exercise Price |
|
|
Weighted- Average Contractual Term Remaining |
|
|
Aggregate Intrinsic Value |
|
||||
|
Outstanding at December 29, 2015 |
|
|
1,530 |
|
|
$ |
12.42 |
|
|
5.76 |
|
|
$ |
3,960 |
|
|
|
Granted |
|
|
315 |
|
|
|
13.11 |
|
|
|
|
|
|
|
|
|
|
Exercised |
|
|
(197 |
) |
|
|
5.50 |
|
|
|
|
|
|
|
|
|
|
Canceled |
|
|
(448 |
) |
|
|
16.00 |
|
|
|
|
|
|
|
|
|
|
Outstanding at January 3, 2017 |
|
|
1,200 |
|
|
$ |
12.40 |
|
|
|
5.05 |
|
|
$ |
1,213 |
|
|
Options vested or expected to vest at January 3, 2017 |
|
|
1,112 |
|
|
$ |
12.32 |
|
|
|
4.86 |
|
|
$ |
1,213 |
|
|
Options exercisable at January 3, 2017 |
|
|
485 |
|
|
$ |
10.74 |
|
|
|
1.65 |
|
|
$ |
1,211 |
|
F-22
The intrinsic value of stock options is defined as the difference between the current market value and the exercise price, which is equal to the market value at the time of the grant. Information regarding options outstanding and exercisable at January 3, 2017 is as follows (shares in thousands):
|
Range of Exercise Prices |
|
Number Outstanding |
|
|
Weighted- Average Remaining Contractual Life (Years) |
|
Weighted- Average Exercise Price |
|
|
Number Exercisable |
|
|
Weighted- Average Exercise Price |
|
||||
|
$3.00 - $3.00 |
|
|
141 |
|
|
1.05 |
|
$ |
3.00 |
|
|
|
141 |
|
|
$ |
3.00 |
|
|
$5.40 - $10.87 |
|
|
130 |
|
|
4.14 |
|
|
9.02 |
|
|
|
89 |
|
|
|
8.33 |
|
|
$10.93 - $11.65 |
|
|
139 |
|
|
6.43 |
|
|
11.41 |
|
|
|
58 |
|
|
|
11.13 |
|
|
$11.98 - $11.98 |
|
|
10 |
|
|
4.37 |
|
|
11.98 |
|
|
|
10 |
|
|
|
11.98 |
|
|
$12.35 - $12.35 |
|
|
153 |
|
|
9.05 |
|
|
12.35 |
|
|
|
3 |
|
|
|
12.35 |
|
|
$13.30 - $13.71 |
|
|
44 |
|
|
7.69 |
|
|
13.49 |
|
|
|
15 |
|
|
|
13.44 |
|
|
$13.94 - $13.94 |
|
|
503 |
|
|
4.46 |
|
|
13.94 |
|
|
|
139 |
|
|
|
13.94 |
|
|
$19.50 - $45.55 |
|
|
68 |
|
|
6.87 |
|
|
21.89 |
|
|
|
18 |
|
|
|
28.38 |
|
|
$47.55 - $47.55 |
|
|
6 |
|
|
0.44 |
|
|
47.55 |
|
|
|
6 |
|
|
|
47.55 |
|
|
$50.25 - $50.25 |
|
|
6 |
|
|
0.42 |
|
|
50.25 |
|
|
|
6 |
|
|
|
50.25 |
|
|
|
|
|
1,200 |
|
|
5.05 |
|
$ |
12.40 |
|
|
|
485 |
|
|
|
10.74 |
|
The weighted-average grant date fair value of options granted was $4.30 in fiscal 2016, $13.92 in fiscal 2015 and $5.64 in fiscal 2014. At January 3, 2017, stock options vested or expected to vest over the next four years totaled 1.1 million. The remaining expense to amortize is approximately $1.7 million at January 3, 2017. The weighted-average remaining recognition period is approximately two years.
Restricted Stock Awards
Restricted stock awards are granted to members of our Board of Directors as part of their compensation. Awards are fully vested and expensed when granted. The fair value of restricted stock awards is the market close price of our common stock on the date of the grant. In fiscal years 2016 and 2015, 3,514 and 1,094 restricted stock awards were issued with a weighted average grant date fair value per share of $12.80 and $13.71, respectively. There were no RSAs granted in fiscal 2014.
Time-Based Restricted Stock Units
Information regarding activities during fiscal 2016 for outstanding time-based RSUs is as follows (shares in thousands):
|
|
|
Number of shares of RSUs |
|
|
Weighted- Average Grant Date Fair Value (per share) |
|
||
|
Outstanding as of December 29, 2015 |
|
|
190 |
|
|
|
14.09 |
|
|
Granted |
|
|
44 |
|
|
|
11.31 |
|
|
Forfeited |
|
|
(39 |
) |
|
|
13.95 |
|
|
Vested |
|
|
(127 |
) |
|
|
13.70 |
|
|
Outstanding as of January 3, 2017 |
|
|
68 |
|
|
$ |
13.11 |
|
During fiscal years 2016, 2015 and 2014, the Company granted 44,000, 52,000 and 270,000 time-based RSUs at a weighted average grant date fair value of $11.31, $15.10 and $13.21, respectively, with a vesting period of three years. Compensation expense for time-based RSUs is recognized over the vesting period on a straight-line basis. The aggregate grant date fair value of the time-based RSUs granted during fiscal years 2016, 2015 and 2014 was $0.5 million, $0.8 million, and $3.3 million, respectively. The aggregate intrinsic value of time-based RSUs outstanding as of January 3, 2017, December 29, 2015 and December 30, 2014 was $0.7 million, $2.6 million and $4.0 million, respectively.
F-23
At January 3, 2017, unvested share-based compensation for time-based RSUs, net of forfeitures, totaled $0.5 million. This expense will be recognized over the remaining weighted-average vesting period of approximately one year.
Performance-Based Restricted Stock Units
Information regarding activities during fiscal 2016 for outstanding PSUs is as follows (shares in thousands):
|
|
|
Number of shares of PSUs |
|
|
Weighted- Average Grant Date Fair Value (per share) |
|
||
|
Outstanding as of December 29, 2015 |
|
|
57 |
|
|
|
13.89 |
|
|
Granted |
|
|
8 |
|
|
|
10.11 |
|
|
Forfeited |
|
|
(46 |
) |
|
|
13.85 |
|
|
Vested |
|
|
(2 |
) |
|
|
14.04 |
|
|
Outstanding as of January 3, 2017 |
|
|
17 |
|
|
$ |
12.27 |
|
During fiscal years 2016 and 2014, the Company granted 8,000 and 95,000 PSUs at a weighted average grant date fair value of $10.11 and $14.37, respectively. There were no PSUs granted during fiscal 2015. The aggregate grant date fair value of the PSUs during fiscal 2014 was $1.2 million. The aggregate intrinsic value of the PSUs outstanding as of January 3, 2017 and December 29, 2015 was expense of $0.2 million and $0.8 million, respectively. At January 3, 2017, unvested share-based compensation for PSUs, net of forfeitures, was less than $0.1 million, which will be recognized over the remaining weighted-average vesting period of approximately seven months.
Market-Based Restricted Stock Units
Information regarding activities during fiscal 2016 for outstanding market-based RSUs is as follows (shares in thousands):
|
|
|
Number of market-based RSUs |
|
|
Weighted- Average Grant Date Fair Value (per share) |
|
||
|
Outstanding as of December 29, 2015 |
|
|
— |
|
|
|
— |
|
|
Granted |
|
|
505 |
|
|
|
3.04 |
|
|
Forfeited |
|
|
— |
|
|
|
— |
|
|
Vested |
|
|
— |
|
|
|
— |
|
|
Outstanding as of January 3, 2017 |
|
|
505 |
|
|
$ |
3.04 |
|
In January 2016, in connection with the hiring of the Company’s new Chief Executive Officer, the Company granted equity awards which included an award of 350,000 market-based RSUs vesting upon achievement of compound annual stock price growth rate targets of 15%, 22.5% and 30% over a three-year period, which were granted in May 2016.
During fiscal 2016, the Company also granted inducement awards in connection with executive hiring which included 155,000 market-based RSUs vesting upon achievement of compound annual stock price growth rate targets of 15%, 22.5% and 30%. Compensation expense related to market-based RSUs is recognized over the requisite service period on a straight-line basis. The requisite service period is a measure of the expected time to reach the respective vesting threshold. We estimated this period by utilizing a Monte Carlo simulation, considering only those stock price-paths in which the threshold was exceeded. The estimated requisite service period for the market-based RSUs issued in fiscal 2016 ranges between approximately eighteen and twenty-four months.
F-24
The aggregate grant date fair value of the market-based RSUs granted during fiscal 2016 was $1.5 million. There were no market-based RSUs granted during fiscal 2015 or 2014. The aggregate intrinsic value of the market-based RSUs outstanding as of January 3, 2017 was $5.2 million. At January 3, 2017, unvested share-based compensation for market-based RSUs, net of forfeitures, was $0.9 million, which will be recognized over the remaining weighted-average recognition period of approximately fourteen months.
13. STOCK REPURCHASES
On August 4, 2016, the Company announced that its Board of Directors approved the terms of a share repurchase plan (the "2016 Stock Repurchase Program"). Pursuant to the 2016 Stock Repurchase Program, the Company is authorized to repurchase up to $20.0 million of its common stock subject to available cash resources over the next two-year period. The Company may repurchase shares on the open market, through privately negotiated transactions or otherwise, at times, in amounts and at prices considered appropriate by the Company. The number of shares to be purchased and the timing of any purchases are subject to various factors, including the price of the Company’s common stock, the Company’s capital position, the amount of retained earnings of the Company, general market conditions and other economic factors and corporate and regulatory requirements, and may be modified, suspended or terminated at any time.
On October 29, 2014, the Company’s Board of Directors authorized the repurchase of up to $25.0 million of shares of common stock over an 18-month period (the "2014 Stock Repurchase Program"). The Company’s Board of Directors authorized an increase to the Stock Repurchase Program of $15.0 million to a total of $40.0 million in May 2015 and an additional $5.0 million to a total of $45.0 million in September 2015, which expired on May 4, 2016. Shares repurchased under the Stock Repurchase Program are considered treasury stock until retired. During fiscal 2015 and fiscal 2014, the Company repurchased approximately 2.0 million and 0.9 million shares, respectively, under the Stock Repurchase Program. The average price per share during fiscal 2015 and fiscal 2014 was $14.38 and $13.17, respectively, with an aggregate cost of $28.0 million and $12.0 million for fiscal 2015 and fiscal 2014, respectively, leaving $5.0 million available for share repurchases. Shares repurchased under the stock repurchase programs are considered treasury stock until retired.
During fiscal year 2016, the Company did not repurchase shares under the 2016 Stock Repurchase Program or the 2014 Stock Repurchase Program.
14. INCOME TAXES
The components of the income tax (expense) benefit are as follows (in thousands):
|
|
|
January 3, 2017 |
|
|
December 29, 2015 |
|
|
December 30, 2014 |
|
|||
|
Current: |
|
|
|
|
|
|
|
|
|
|
|
|
|
Federal |
|
$ |
— |
|
|
$ |
(438 |
) |
|
$ |
— |
|
|
State |
|
|
(14 |
) |
|
|
(149 |
) |
|
|
(37 |
) |
|
Foreign |
|
|
(65 |
) |
|
|
(114 |
) |
|
|
(131 |
) |
|
|
|
$ |
(79 |
) |
|
$ |
(701 |
) |
|
$ |
(168 |
) |
|
Deferred: |
|
|
|
|
|
|
|
|
|
|
|
|
|
Federal |
|
$ |
— |
|
|
$ |
— |
|
|
$ |
— |
|
|
State |
|
|
— |
|
|
|
— |
|
|
|
— |
|
|
Foreign |
|
|
— |
|
|
|
— |
|
|
|
— |
|
|
|
|
$ |
— |
|
|
$ |
— |
|
|
$ |
— |
|
|
Income tax benefit (expense) |
|
$ |
(79 |
) |
|
$ |
(701 |
) |
|
$ |
(168 |
) |
F-25
The difference between the effective income tax rate and the United States federal income tax rate is summarized as follows:
|
|
|
January 3, 2017 |
|
|
December 29, 2015 |
|
|
December 30, 2014 |
|
|||
|
Statutory federal rate |
|
|
34.0 |
% |
|
|
34.0 |
% |
|
|
34.0 |
% |
|
State income taxes less federal benefit |
|
|
(1.4 |
) |
|
|
(9.2 |
) |
|
|
5.9 |
|
|
Foreign income taxes |
|
|
(0.3 |
) |
|
|
1.1 |
|
|
|
(2.5 |
) |
|
Change in valuation allowance |
|
|
(24.6 |
) |
|
|
(38.1 |
) |
|
|
(31.5 |
) |
|
Meals |
|
|
(0.1 |
) |
|
|
0.3 |
|
|
|
(1.2 |
) |
|
Business Gain on Acquisition |
|
|
— |
|
|
|
— |
|
|
|
8.5 |
|
|
Alternative minimum taxes |
|
|
— |
|
|
|
0.1 |
|
|
|
(1.0 |
) |
|
Expired tax attribute carryforwards |
|
|
(6.4 |
) |
|
|
11.1 |
|
|
|
(17.0 |
) |
|
Tax credits generated |
|
|
— |
|
|
|
(0.1 |
) |
|
|
0.3 |
|
|
Other |
|
|
(1.6 |
) |
|
|
7.7 |
|
|
|
(0.3 |
) |
|
|
|
|
(0.4 |
)% |
|
|
6.9 |
% |
|
|
(4.8 |
)% |
Deferred income taxes are provided for the temporary differences between the carrying values of the Company’s assets and liabilities for financial reporting purposes and their corresponding income tax bases. The temporary differences give rise to either a deferred tax asset or liability in the financial statements that is computed by applying current statutory tax rates to taxable and deductible temporary differences. The deferred tax assets (liabilities) consisted of the following temporary differences as of January 3, 2017 and December 29, 2015 (in thousands):
|
|
|
January 3, 2017 |
|
|
December 29, 2015 |
|
||
|
Net operating losses |
|
$ |
62,875 |
|
|
$ |
50,837 |
|
|
Reserves and accruals |
|
|
5,073 |
|
|
|
10,754 |
|
|
Deferred rent |
|
|
967 |
|
|
|
1,518 |
|
|
Tax credit attributes |
|
|
1,957 |
|
|
|
1,999 |
|
|
Basis difference in intangibles |
|
|
1,152 |
|
|
|
1,510 |
|
|
Share-based compensation |
|
|
1,915 |
|
|
|
2,979 |
|
|
Basis difference in fixed assets |
|
|
5,670 |
|
|
|
3,245 |
|
|
Basis difference in intangibles |
|
|
(95 |
) |
|
|
(289 |
) |
|
Basis difference in investments |
|
|
144 |
|
|
|
4 |
|
|
Reserves and accruals |
|
|
(29 |
) |
|
|
(64 |
) |
|
Total gross deferred tax asset |
|
|
79,629 |
|
|
|
72,493 |
|
|
Valuation allowance |
|
|
(79,629 |
) |
|
|
(72,493 |
) |
|
Total net deferred tax asset |
|
$ |
— |
|
|
$ |
— |
|
Realization of the future tax benefits is dependent on the Company’s ability to generate sufficient taxable income within the carryforward period. A valuation allowance is provided for deferred tax assets when it is “more likely than not” that some portion of the deferred tax asset will not be realized. Because of the Company’s recent history of operating losses, management believes the recognition of the deferred tax assets arising from the above-mentioned future tax benefits is currently not likely to be realized and, accordingly, has provided a valuation allowance. A valuation allowance has been recorded for the net deferred tax assets at January 3, 2017, which increases the valuation allowance by $7.1 million for the fiscal year ended January 3, 2017.
At January 3, 2017, the Company has federal and state net operating loss carryovers (“NOL”) of $148.4 million and $144.5 million, respectively, which, if not used earlier, will expire between 2017 and 2036. In addition, the Company also has tax credit carryforwards for federal and state purposes of $1.1 million and $0.9 million, respectively. Approximately $0.3 million of the federal tax credit carryforwards will start to expire in 2031 if unused before that year. Of the state tax credit carryforwards, approximately $0.7 million will start to expire in 2023 if unused before that year. The remaining federal tax credits and the state tax credits do not expire.
F-26
The Company underwent an “ownership change” as defined in section 382 of the Internal Revenue Code during the second quarter of the Company’s 2009 fiscal year, as a result of the Company’s issuance of Series B-1 Convertible Preferred Stock and Series B-2 Convertible Preferred Stock and other prior trading in the Company’s stock. The amount of NOL and tax credits from pre-change years that may be used to offset the Company’s taxable income for tax years ending after the ownership change is subject to an annual limitation, known as a section 382 limitation. The section 382 limitation may cause NOL’s to expire unutilized. The Company reduced its NOL carryovers stated above for the anticipated expirations caused by the Company’s 2009 change. Since the section 382 ownership change in 2009, the Company has performed quarterly analyses to monitor its ownership for 382 purposes. The Company has not had any other ownership changes for section 382 purposes since 2009.
Changes in the Company’s unrecognized tax benefits are as follows (in thousands):
|
|
|
Fiscal Year Ended January 3, 2017 |
|
|
Fiscal Year Ended December 29, 2015 |
|
||
|
Beginning balance |
|
$ |
185 |
|
|
$ |
185 |
|
|
Increases attributable to tax positions taken during prior periods |
|
|
— |
|
|
|
— |
|
|
Decreases resulting from lapse of applicable statutes of limitations |
|
|
— |
|
|
|
— |
|
|
Ending balance |
|
$ |
185 |
|
|
$ |
185 |
|
As of January 3, 2017, the entire unrecognized tax benefits reduce the deferred tax asset for the net operating loss carryforwards. If recognized, none of the unrecognized tax benefits would impact the Company’s effective tax rate. As of January 3, 2017, it is reasonably possible that the unrecognized tax benefits will not significantly increase or decrease in the next twelve months.
The Company is subject to taxation in the United States and various state and local jurisdictions. As of January 3, 2017, the Company is not subject to any income tax examinations. Due to tax attribute carryforwards, as of January 3, 2017, the Company remains effectively subject to U.S. federal, state and local income tax examinations by tax authorities for the tax years since 2006.
15. EMPLOYEE BENEFIT PLAN
The Company maintains a voluntary defined contribution plan covering all eligible employees. Eligible employees may elect to defer and contribute a percentage of their compensation to the plan, not to exceed the dollar amount set by law. The Company matched employees’ contributions on a discretionary basis, resulting in a contribution of less than $0.1 million each for fiscal years 2016, 2015 and 2014.
16. SEVERANCE AND OTHER COMPENSATION
In connection with the relocation of the Company’s headquarters from Emeryville, California to Frisco, Texas, the Company incurred severance and bonus obligations. At January 3, 2017, $1.6 million of severance and $0.8 million of retention expenses are classified in accrued compensation and benefits and accounts payable, respectively, in the consolidated balance sheets. Additionally, the Company expects to pay bonuses of $0.9 million at the beginning of second quarter in fiscal 2017. The remaining payments will be completed by the end of the second quarter 2018.
On October 1, 2015, the Company announced the retirement of James D. White, the former Chief Executive Officer. In accordance with his employment agreement, severance and bonus of $0.8 million have been accrued for in fiscal 2015 and paid in full in fiscal 2016. Also during fiscal 2015, severance of $0.6 million was recorded for certain departures of two senior executives. Expenses relating to acceleration of options and awards from stock modifications related to the departure of the three executives of $0.8 million were also accounted for in fiscal 2015 and are included as part of stock compensation. These payments were completed during fiscal year 2016.
F-27
17. STORE LEASE TERMINATION AND CLOSURE COSTS
On January 3, 2017, the Company closed one underperforming Company Store in the California market, which was prior to expiration of the contractual lease term. The Company recorded exit costs of $3.6 million, including accrued exit costs of $1.3 million related to the estimated fair value of the lease termination obligation and $2.3 million of asset write-off.
During the fourth quarter of 2015, in conjunction with its transition to an asset-light model, the Company performed a review of its portfolio of Company Stores, and as a result, closed eight underperforming Company Stores in the Chicago and New York City markets on December 29, 2015, which was prior to expiration of their contractual lease terms. The Company accrued exit costs of $1.6 million, including $1.3 million related to the estimated fair value of the lease termination obligation, $0.2 million of asset write-off, and $0.1 million related to severance. At January 3, 2017, the remaining lease termination obligation was approximately $0.5 million related to one of the stores closed in 2015.
The Company estimates the fair value of the remaining lease termination obligation as of the cease-use date, using a weighted average of multiple outcomes approach which considered for each lease: future contractual lease obligations, net of projected sub-lease income (limited to amount of the rental obligation) after a period for remarketing, outcomes including buyout fees for early termination and actual terminations. Future cash flows are discounted using the Company’s credit adjusted risk free rate, which were estimated at 4.95% and 6.5% in fiscal years 2016 and 2015, respectively. Sublease rental income and absorption period assumptions were based on data available from rental activity in the local markets. Assumptions about potential buyout payments were also based on data available from rental activity in the local markets, allowed for a period for negotiation and then a final settlement at a multiple of monthly rental and common area payments.
As of January 3, 2017, the Company’s future lease obligations totaled approximately $3.5 million, which was reduced for estimates for sublease rental income of $1.6 million. The net obligation after discounting was increased for estimated transaction fees to advisors of approximately $0.1 million. The resulting obligation at estimated fair value totaled approximately $1.8 million.
Considerable management judgment is necessary to estimate net future cash flows including cash flows from continuing use, terminal value and sublease income. Accordingly, actual results could vary from the estimates. If these assumptions or their related estimates change in the future, the Company will be required to record additional exit costs or reduce exit costs previously recorded. Exit costs recorded for each of the periods presented include the effect of such changes in estimates; there were no subsequent changes during 2016 to the amount of the obligation.
18. OTHER OPERATING, NET
The components of other operating, net are as follows (in thousands):
|
|
|
Fiscal Year Ended January 3, 2017 |
|
|
Fiscal Year Ended December 29, 2015 |
|
|
Fiscal Year Ended December 30, 2014 |
|
||||||
|
Jambacard breakage income |
|
$ |
|
(4,096 |
) |
|
$ |
|
(5,440 |
) |
|
$ |
|
(4,744 |
) |
|
Jambacard expense |
|
|
|
902 |
|
|
|
|
1,155 |
|
|
|
|
1,299 |
|
|
CPG and JambaGO® direct expense |
|
|
|
1,700 |
|
|
|
|
3,035 |
|
|
|
|
2,637 |
|
|
Franchise discount expense |
|
|
|
461 |
|
|
|
|
706 |
|
|
|
|
847 |
|
|
Franchise other expense |
|
|
|
676 |
|
|
|
|
834 |
|
|
|
|
1,025 |
|
|
Sublease income |
|
|
|
(670 |
) |
|
|
|
(192 |
) |
|
|
|
(121 |
) |
|
Bad debt |
|
|
|
1,560 |
|
|
|
|
1,474 |
|
|
|
|
61 |
|
|
International expense |
|
|
|
613 |
|
|
|
|
708 |
|
|
|
|
316 |
|
|
Gain on contingent consideration |
|
|
|
- |
|
|
|
|
(156 |
) |
|
|
|
(397 |
) |
|
Other (income) expense |
|
|
|
(63 |
) |
|
|
|
(329 |
) |
|
|
|
(197 |
) |
|
Total other operating, net |
|
$ |
|
1,083 |
|
|
$ |
|
1,795 |
|
|
$ |
|
726 |
|
F-28
19. OTHER COMMITMENTS AND CONTINGENCIES
Litigation Related - The Company records a liability for litigation claims and contingencies when payment is probable and the amount of loss can be reasonably estimated.
In fiscal year 2016, the Company recognized $2.0 million in charges associated with ongoing and settled litigation matters based on the available information at the time. The amounts recognized related to aggregate amounts for resolution of the Company’s ordinary course litigation cases estimated at $1.0 million and a commercial vendor dispute settled for $1.0 million. The losses were included in general and administrative expenses in the accompanying Statements of Operations. The Company did not include any reserve for losses relating to ongoing and settled litigation matters in 2015 or 2014.
The Company is a defendant in litigation arising in the normal course of business. Although there can be no assurance as to the ultimate disposition of these matters, it is the opinion of the Company’s management, based upon the information available at this time, that the expected outcome of these matters, individually or in the aggregate, will not have a material adverse effect on the results of operations, liquidity or financial condition of the Company, except as noted above.
Other - The Company has purchase obligations with certain suppliers for certain fruits and dairy for various terms typically ranging from one year to five years. The Company has one contract with a supplier for a 15 year term that ends in 2024. These contracts are commitments to purchase a minimum level of fruit and other items used in the production of the Company’s products totaling $30.7 million, inclusive of purchase commitments of $1.0 million related to a dispute with a commercial vendor.
20. RELATED-PARTY TRANSACTIONS
In fiscal 2016 and fiscal 2015, the Company received $0.2 million from Country Pure Foods related to vendor supply chain management fees and approximately $0.3 million from Sodexo related to licensing fees for Jamba units operated by Sodexo. One Jamba Juice Director is on the Board of Directors of Country Pure Foods and another Jamba Juice Director is an executive with Sodexo.
F-29
21. UNAUDITED QUARTERLY INFORMATION
The tables below provide the Company’s unaudited consolidated results of operations for each quarter in 2016 and 2015:
|
(In thousands, except share and per share amounts) |
|
Thirteen Weeks Ended March 29, 2016 |
|
|
Thirteen Weeks Ended June 28, 2016 |
|
|
Thirteen Weeks Ended September 27, 2016 |
|
|
Fourteen Weeks Ended January 3, 2017 |
|
||||
|
Revenue: |
|
|
|
|
|
|
|
|
|
|
|
|
|
|
|
|
|
Company stores |
|
$ |
11,953 |
|
|
$ |
13,874 |
|
|
$ |
14,350 |
|
|
$ |
11,105 |
|
|
Franchise and other revenue |
|
|
6,801 |
|
|
|
7,666 |
|
|
|
7,711 |
|
|
|
6,163 |
|
|
Total revenue |
|
|
18,754 |
|
|
|
21,540 |
|
|
|
22,061 |
|
|
|
17,268 |
|
|
Costs and operating expenses (income): |
|
|
|
|
|
|
|
|
|
|
|
|
|
|
|
|
|
Cost of sales |
|
|
2,962 |
|
|
|
3,321 |
|
|
|
3,437 |
|
|
|
2,881 |
|
|
Labor |
|
|
4,158 |
|
|
|
4,668 |
|
|
|
4,644 |
|
|
|
4,402 |
|
|
Occupancy |
|
|
2,036 |
|
|
|
1,900 |
|
|
|
1,879 |
|
|
|
1,844 |
|
|
Store operating |
|
|
2,362 |
|
|
|
2,272 |
|
|
|
2,381 |
|
|
|
2,270 |
|
|
Depreciation and amortization |
|
|
1,502 |
|
|
|
1,674 |
|
|
|
1,068 |
|
|
|
1,505 |
|
|
General and administrative |
|
|
7,610 |
|
|
|
9,423 |
|
|
|
9,699 |
|
|
|
11,226 |
|
|
Gain on disposal of assets |
|
|
109 |
|
|
|
188 |
|
|
|
204 |
|
|
|
289 |
|
|
Store pre-opening |
|
|
324 |
|
|
|
326 |
|
|
|
210 |
|
|
|
364 |
|
|
Impairment of long-lived assets |
|
|
— |
|
|
|
127 |
|
|
|
229 |
|
|
|
3,054 |
|
|
Store lease termination and closure |
|
|
120 |
|
|
|
(56 |
) |
|
|
178 |
|
|
|
3,918 |
|
|
Other operating, net |
|
|
271 |
|
|
|
245 |
|
|
|
104 |
|
|
|
463 |
|
|
Total costs, operating expenses, and gain |
|
|
21,454 |
|
|
|
24,088 |
|
|
|
24,033 |
|
|
|
32,216 |
|
|
Loss from operations |
|
|
(2,700 |
) |
|
|
(2,548 |
) |
|
|
(1,972 |
) |
|
|
(14,948 |
) |
|
Other income (expense): |
|
|
|
|
|
|
|
|
|
|
|
|
|
|
|
|
|
Interest income |
|
|
71 |
|
|
|
74 |
|
|
|
50 |
|
|
|
55 |
|
|
Interest expense |
|
|
(59 |
) |
|
|
(59 |
) |
|
|
(51 |
) |
|
|
(270 |
) |
|
Total other income (expense), net |
|
|
12 |
|
|
|
15 |
|
|
|
(1 |
) |
|
|
(215 |
) |
|
Loss before income taxes |
|
|
(2,688 |
) |
|
|
(2,533 |
) |
|
|
(1,973 |
) |
|
|
(15,163 |
) |
|
Income tax (expense) benefit |
|
|
(132 |
) |
|
|
54 |
|
|
|
9 |
|
|
|
(10 |
) |
|
Net loss |
|
|
(2,820 |
) |
|
|
(2,479 |
) |
|
|
(1,964 |
) |
|
|
(15,173 |
) |
|
Less: Net income attributable to noncontrolling interest |
|
|
— |
|
|
|
— |
|
|
|
— |
|
|
|
— |
|
|
Net loss attributable to Jamba, Inc. |
|
$ |
(2,820 |
) |
|
$ |
(2,479 |
) |
|
$ |
(1,964 |
) |
|
$ |
(15,173 |
) |
|
Loss per share attributable to Jamba, Inc. common shareholders: |
|
|
|
|
|
|
|
|
|
|
|
|
|
|
|
|
|
Basic |
|
$ |
(0.19 |
) |
|
$ |
(0.16 |
) |
|
$ |
(0.13 |
) |
|
$ |
(0.99 |
) |
|
Diluted |
|
$ |
(0.19 |
) |
|
$ |
(0.16 |
) |
|
$ |
(0.13 |
) |
|
$ |
(0.99 |
) |
F-30
|
|
Thirteen Weeks Ended March 31, 2015 |
|
|
Thirteen Weeks Ended June 30, 2015 |
|
|
Thirteen Weeks Ended September 29, 2015 |
|
|
Thirteen Weeks Ended December 29, 2015 |
|
|||||
|
Revenue: |
|
|
|
|
|
|
|
|
|
|
|
|
|
|
|
|
|
Company stores |
|
$ |
47,728 |
|
|
$ |
48,360 |
|
|
$ |
28,213 |
|
|
$ |
12,724 |
|
|
Franchise and other revenue |
|
|
4,776 |
|
|
|
5,766 |
|
|
|
7,284 |
|
|
|
6,825 |
|
|
Total revenue |
|
|
52,504 |
|
|
|
54,126 |
|
|
|
35,497 |
|
|
|
19,549 |
|
|
Costs and operating expenses (income): |
|
|
|
|
|
|
|
|
|
|
|
|
|
|
|
|
|
Cost of sales |
|
|
12,407 |
|
|
|
11,474 |
|
|
|
6,626 |
|
|
|
3,230 |
|
|
Labor |
|
|
16,088 |
|
|
|
14,876 |
|
|
|
8,843 |
|
|
|
4,925 |
|
|
Occupancy |
|
|
6,835 |
|
|
|
6,131 |
|
|
|
3,980 |
|
|
|
2,005 |
|
|
Store operating |
|
|
8,034 |
|
|
|
8,059 |
|
|
|
5,901 |
|
|
|
3,158 |
|
|
Depreciation and amortization |
|
|
1,873 |
|
|
|
1,344 |
|
|
|
1,143 |
|
|
|
2,209 |
|
|
General and administrative |
|
|
8,963 |
|
|
|
8,427 |
|
|
|
9,003 |
|
|
|
10,479 |
|
|
Gain on disposal of assets |
|
|
(778 |
) |
|
|
(4,480 |
) |
|
|
(16,076 |
) |
|
|
(275 |
) |
|
Store pre-opening |
|
|
22 |
|
|
|
166 |
|
|
|
287 |
|
|
|
556 |
|
|
Impairment of long-lived assets |
|
|
0 |
|
|
|
295 |
|
|
|
1,907 |
|
|
|
321 |
|
|
Store lease termination and closure |
|
|
22 |
|
|
|
40 |
|
|
|
207 |
|
|
|
1,400 |
|
|
Other operating, net |
|
|
706 |
|
|
|
1,333 |
|
|
|
375 |
|
|
|
(619 |
) |
|
Total costs, operating expenses, and gain |
|
|
54,172 |
|
|
|
47,665 |
|
|
|
22,196 |
|
|
|
27,389 |
|
|
(Loss) income from operations |
|
|
(1,668 |
) |
|
|
6,461 |
|
|
|
13,301 |
|
|
|
(7,840 |
) |
|
Other income (expense): |
|
|
|
|
|
|
|
|
|
|
|
|
|
|
|
|
|
Interest income |
|
|
15 |
|
|
|
14 |
|
|
|
49 |
|
|
|
59 |
|
|
Interest expense |
|
|
(41 |
) |
|
|
(68 |
) |
|
|
(53 |
) |
|
|
(58 |
) |
|
Total other expense, net |
|
|
(26 |
) |
|
|
(54 |
) |
|
|
(4 |
) |
|
|
1 |
|
|
(Loss) income before income taxes |
|
|
(1,694 |
) |
|
|
6,407 |
|
|
|
13,297 |
|
|
|
(7,839 |
) |
|
Income tax benefit (expense) |
|
|
(26 |
) |
|
|
(57 |
) |
|
|
(194 |
) |
|
|
(424 |
) |
|
Net (loss) income |
|
|
(1,720 |
) |
|
|
6,350 |
|
|
|
13,103 |
|
|
|
(8,263 |
) |
|
Less: Net income attributable to noncontrolling interest |
|
|
31 |
|
|
|
21 |
|
|
|
— |
|
|
|
— |
|
|
Net (loss) income attributable to Jamba, Inc. |
|
$ |
(1,751 |
) |
|
$ |
6,329 |
|
|
$ |
13,103 |
|
|
$ |
(8,263 |
) |
|
(Loss) earnings per share attributable to Jamba, Inc. common shareholders: |
|
|
|
|
|
|
|
|
|
|
|
|
|
|
|
|
|
Basic |
|
$ |
(0.11 |
) |
|
$ |
0.39 |
|
|
$ |
0.83 |
|
|
$ |
(0.55 |
) |
|
Diluted |
|
$ |
(0.11 |
) |
|
$ |
0.38 |
|
|
$ |
0.81 |
|
|
$ |
(0.55 |
) |
The sum of (loss) earnings per share for all four quarters may not equal the loss per share of the fiscal year due to rounding.
In connection with the store closure in late fiscal 2016 and the exit of Jamba GO®, the Company recognized a store lease termination and closure expense and an impairment loss of $2.3 million and $3.4 million, respectively, in the fourth quarter. In fiscal 2016, Company Store revenue decreased primarily due to the net reduction in Company Stores resulting from the Company’s transition to an asset-light model. During fiscal 2015, the Company sold four stores in the first quarter, 49 stores in the second quarter, 110 stores in the third quarter and 14 (net of 2 acquired stores) in the fourth quarter. At the end of fiscal 2016, the number of Company Stores was 66 compared to 70 at the end of fiscal 2015. The number of Franchise Stores and International Stores grew to 843 as of January 3, 2017 compared to 823 as of December 29, 2015. During fiscal 2016, the Company sold one store during the fourth quarter.
In the second quarter of 2015, the Company sold its 88% interest in JJSC to the holder of JJSC’s noncontrolling interest, in connection with our transition to an asset-light model.
F-31
Gain on disposal of assets increased primarily due to the transition to an asset-light model during fiscal 2015. As a result, the Company recorded net income in the second and third quarter and for the full fiscal year of 2015 compared to a net loss in fiscal 2016.
In the Statements of Operations for the third quarter ended September 27, 2016 and fourth quarter ended January 3, 2017, the Company corrected certain out-of-period errors related to prior period financial statements. The out-of-period errors related to both the first and second quarters of 2016 as well as 2015, 2014 and earlier results. The adjustments arose from various errors in depreciation expense, share-based compensation, impairments and balance sheet accruals affecting revenues and general and administrative expenses. The Company evaluated and concluded that the corrections made for the out-of-period errors in the third and fourth quarter, and the unadjusted impact on the prior periods, were neither quantitatively or qualitatively material to those periods individually or in the aggregate. The following table details the specific amounts of out-of-period (overstatements)/understatements for the fiscal 2016 quarters.
|
(In thousands, except share and per share amounts) |
|
Thirteen Weeks Ended March 29, 2016 |
|
|
Thirteen Weeks Ended June 28, 2016 |
|
|
Thirteen Weeks Ended September 27, 2016 |
|
|
Fourteen Weeks Ended January 3, 2017 |
|
||||
|
Total revenue |
|
$ |
4 |
|
|
$ |
(202 |
) |
|
$ |
(18 |
) |
|
$ |
151 |
|
|
Total costs, operating expenses and gain |
|
|
(892 |
) |
|
|
490 |
|
|
|
105 |
|
|
|
(596 |
) |
|
Income before income taxes |
|
|
896 |
|
|
|
(692 |
) |
|
|
(124 |
) |
|
|
747 |
|
|
Total other expense, net |
|
|
— |
|
|
|
— |
|
|
|
— |
|
|
|
— |
|
|
Income before income taxes |
|
|
896 |
|
|
|
(692 |
) |
|
|
(124 |
) |
|
|
747 |
|
|
Income tax benefit (expense) |
|
|
(45 |
) |
|
|
14 |
|
|
|
2 |
|
|
|
(1 |
) |
|
Net income |
|
|
851 |
|
|
|
(678 |
) |
|
|
(122 |
) |
|
|
746 |
|
|
(Loss) earnings per share attributable to Jamba, Inc. common shareholders: |
|
|
|
|
|
|
|
|
|
|
|
|
|
|
|
|
|
Basic |
|
$ |
0.06 |
|
|
$ |
(0.04 |
) |
|
$ |
(0.01 |
) |
|
$ |
0.05 |
|
|
Diluted |
|
$ |
0.06 |
|
|
$ |
(0.04 |
) |
|
$ |
(0.01 |
) |
|
$ |
0.05 |
|
22. SUBSEQUENT EVENTS
In the first quarter of fiscal 2017, we recorded severance of $0.6 million for the departures of two senior executives. Additionally in the fourth quarter of fiscal 2017, we recorded severance of $0.3 million for the departure of one senior executive.
Refranchising Activities
In the second quarter of fiscal 2017, the Company refranchised 13 Company-owned stores and signed a 10-unit development agreement in the Chicago area for approximately $0.2 million.
F-32
None.
|
(a) |
Disclosure Controls and Procedures |
An evaluation was conducted under the supervision and with the participation of our management, including our Chief Executive Officer and Chief Financial Officer, on the effectiveness of our disclosure controls and procedures (as defined in Rules 13a-15(e) and 15d-15(e) under the Securities Exchange Act of 1934, as amended) as of the end of the period covered by this Annual Report on Form 10-K. Based on this evaluation, the Chief Executive Officer and the Chief Financial Officer concluded that our disclosure controls and procedures were not effective as of January 3, 2017, solely because of the material weakness in our internal control over financial reporting described below.
To address the material weakness described below, management performed additional analysis and other procedures to ensure that our consolidated financial statements were prepared in accordance with U.S. GAAP. Accordingly, management believes that the consolidated financial statements and disclosures included in this Annual Report on Form 10-K fairly present, in all material respects, in accordance with U.S. GAAP, our financial position, results of operations and cash flows for the periods presented.
|
(b) |
Management’s Annual Report On Internal Control Over Financial Reporting |
We, as management of the Company, are responsible for establishing and maintaining adequate internal control over financial reporting as such term is defined in rules 13a-15(f) and 15d-15(f) of the Securities Exchange Act of 1934, as amended. Pursuant to the rules and regulations of the SEC, internal control over financial reporting is a process designed by, or under the supervision of, our principal executive and principal financial officers, or persons performing similar functions, and affected by our Board of Directors, management and other personnel, to provide reasonable assurance regarding the reliability of financial reporting and the preparation of financial statements for external purposes in accordance with generally accepted accounting principles.
Because of its inherent limitations, internal control over financial reporting may not prevent or detect all misstatements. Also, projections of any evaluation of the effectiveness of future periods are subject to the risk that controls may become inadequate because of changes in conditions, or that the degree of compliance with policies or procedures may deteriorate.
We used the criteria set forth in Internal Control—Integrated Framework (2013), issued by the Committee of Sponsoring Organizations of the Treadway Commission (COSO) to assess the effectiveness of internal control over financial reporting and concluded that our internal control over financial reporting was not effective as of January 3, 2107 due to a material weakness in internal control over financial reporting as described below. A material weakness is a deficiency or a combination of deficiencies, in internal control over financial reporting, such that there is a reasonable possibility that a material misstatement of a company’s annual or interim financial statements will not be prevented or detected on a timely basis.
The effectiveness of the Company’s internal control over financial reporting as of January 3, 2017 has been audited by KPMG LLP, an independent registered public accounting firm, as stated in its report that appears in this Annual Report on Form 10-K.
Material Weakness
We underwent significant changes in our business model, leadership, key personnel, and relocation of our corporate office. These changes resulted in a significant increase in non-routine transactions and impacted certain routine processes needed to effectively accumulate and present consolidated financial results. We identified that our risk assessment process, which was intended to identify new transactions and changes to existing processes and design appropriate control activities over financial reporting, was not sufficient to prevent or detect material misstatement on a timely basis. Consequently, a material weakness in internal control over financial reporting resulted as described below.
53
Ineffective risk assessment of the risks of material misstatement in financial reporting
We did not effectively identify and evaluate how the changes in our business, leadership, key personnel and location could impact our system of internal controls as it relates to assessment of risks related to financial reporting, as well as determine a basis for how those risks should be managed. As a result of ineffective risk assessment, we did not develop policies and procedures as well as design and operate relevant control activities that would mitigate risks of material misstatement over financial reporting.
The material weakness affected the design, implementation and operation of controls over the preparation, analysis and review of significant balances and disclosures and impacted our ability to close our books in a timely manner. This material weakness contributed to misstatements related to a number of significant accounts and disclosures.
|
(c) |
Changes in Internal Control Over Financial Reporting |
There were no changes in our internal control over financial reporting that occurred during the year ended January 3, 2017 that have materially affected, or are reasonably likely to materially affect, our internal control over financial reporting.
|
(d) |
Remediation Actions |
Our comprehensive remediation plan is to address the factors contributing to the material weakness noted above and improve our overall system of internal controls. This will be addressed by enhancing our risk assessment process, including ongoing evaluation of all of the COSO components. Specifically, the activities outlined below will be implemented.
Risk Assessment
Management has begun implementing the plan to assess risks of material misstatement over financial reporting, including the enhancement of internal control activities, and training of key process owners. The plan will be accomplished by the execution of the following:
|
|
• |
Enhancing of company-wide Sarbanes-Oxley internal control over financial reporting including performing a comprehensive evaluation of the risk assessment, scoping and testing process. |
|
|
• |
Redesigning existing controls as necessary, as well as developing and deploying new controls to improve the adequacy and timeliness of preventing or detecting material misstatement over financial reporting. |
|
|
• |
Developing relevant oversight controls that will operate at a level of precision sufficient to detect errors resulting from a control failure, and strengthening our existing oversight controls, including accounting policy oversight, to ensure compliance with policies and procedures. |
|
|
• |
Training key process owners and other relevant personnel to ensure controls are performed timely, appropriately, and supported with adequate evidence of control completion. |
|
|
• |
Augmenting the finance and accounting function with qualified personnel commensurate with the complexity of our processes and financial reporting requirements. |
We believe these activities will remediate the control deficiencies identified above and strengthen our internal controls over financial reporting. Management, with the oversight of the Audit Committee has dedicated significant incremental resources to successfully implement and test effectiveness of the enhanced controls throughout fiscal 2017.
54
Report of Independent Registered Public Accounting Firm
The Board of Directors and Shareholders
Jamba, Inc.:
We have audited Jamba, Inc.’s (“the Company”) internal control over financial reporting as of January 3, 2017, based on criteria established in Internal Control - Integrated Framework (2013) issued by the Committee of Sponsoring Organizations of the Treadway Commission (“COSO”). Jamba, Inc.’s management is responsible for maintaining effective internal control over financial reporting and for its assessment of the effectiveness of internal control over financial reporting, included in the accompanying Management’s Report on Internal Control over Financial Reporting, appearing under Item 9A (b). Our responsibility is to express an opinion on the Company’s internal control over financial reporting based on our audit.
We conducted our audit in accordance with the standards of the Public Company Accounting Oversight Board (United States). Those standards require that we plan and perform the audit to obtain reasonable assurance about whether effective internal control over financial reporting was maintained in all material respects. Our audit included obtaining an understanding of internal control over financial reporting, assessing the risk that a material weakness exists, and testing and evaluating the design and operating effectiveness of internal control based on the assessed risk. Our audit also included performing such other procedures as we considered necessary in the circumstances. We believe that our audit provides a reasonable basis for our opinion.
A company’s internal control over financial reporting is a process designed to provide reasonable assurance regarding the reliability of financial reporting and the preparation of financial statements for external purposes in accordance with generally accepted accounting principles. A company’s internal control over financial reporting includes those policies and procedures that (1) pertain to the maintenance of records that, in reasonable detail, accurately and fairly reflect the transactions and dispositions of the assets of the company; (2) provide reasonable assurance that transactions are recorded as necessary to permit preparation of financial statements in accordance with generally accepted accounting principles, and that receipts and expenditures of the company are being made only in accordance with authorizations of management and directors of the company; and (3) provide reasonable assurance regarding prevention or timely detection of unauthorized acquisition, use, or disposition of the company’s assets that could have a material effect on the financial statements.
Because of its inherent limitations, internal control over financial reporting may not prevent or detect misstatements. Also, projections of any evaluation of effectiveness to future periods are subject to the risk that controls may become inadequate because of changes in conditions, or that the degree of compliance with the policies or procedures may deteriorate. A material weakness is a deficiency, or a combination of deficiencies, in internal control over financial reporting, such that there is a reasonable possibility that a material misstatement of the company’s annual or interim financial statements will not be prevented or detected on a timely basis. A material weakness related to an ineffective risk assessment of the risks of material misstatement in financial reporting, has been identified and included in management’s assessment. We also have audited, in accordance with the standards of the Public Company Accounting Oversight Board (United States), the consolidated balance sheets of Jamba, Inc. as of January 3, 2017 and December 29, 2015, and the related consolidated statements of operations, shareholders’ equity, and cash flows for the fiscal years ended January 3, 2017, December 29, 2015, and December 30, 2014. This material weakness was considered in determining the nature, timing, and extent of audit tests applied in our audit of the 2016 consolidated financial statements, and this report does not affect our report dated February 9, 2018, which expressed an unqualified opinion on those consolidated financial statements.
In our opinion, because of the effect of the aforementioned material weakness on the achievement of the objectives of the control criteria, Jamba, Inc. has not maintained effective internal control over financial reporting as of January 3, 2017, based on criteria established in Internal Control—Integrated Framework (2013) issued by the Committee of Sponsoring Organizations of the Treadway Commission (COSO)").
/s/ KPMG LLP
San Francisco, Ca
February 9, 2018
55
The following table sets forth the name and age of each of our directors.
|
Name |
|
Age |
|
Director Since |
|
David A. Pace |
|
58 |
|
2012 |
|
Richard L. Federico |
|
63 |
|
2006 |
|
Andrew R. Heyer |
|
60 |
|
2009 |
|
Michael A. Depatie |
|
60 |
|
2010 |
|
Lorna C. Donatone |
|
60 |
|
2013 |
|
James C. Pappas |
|
36 |
|
2015 |
|
Glenn W. Welling |
|
47 |
|
2015 |
There are no family relationships among any of our directors or executive officers.
DAVID A. PACE has been a member of our Board since August 2012 and our Chief Executive Officer since January 2016. From 2014 to 2016, Mr. Pace served as President of Carrabba’s Italian Grill, and from 2010 to 2014, Mr. Pace was the Executive Vice President and Chief Resource Officer of Bloomin’ Brands where he was responsible for both the human resources and real estate and development functions of Bloomin’ Brands along with the Fleming’s and Roy’s business units. Before joining Bloomin’ Brands in 2010, Mr. Pace was a management consultant, entrepreneur and not-for-profit leader. He has extensive domestic and international experience overseeing human resources for Starbucks Coffee Company, HomeGrocer.com and PepsiCo/YUM Brands along with additional experiences in technology and sports management. Mr. Pace served as an adjunct faculty member in Southern Methodist University’s Cox Graduate School of Business and is currently Chairman of the Board of Up2US, a rapidly expanding national non-profit focused on improving the health and development of America’s young people through sports-based youth development. Mr. Pace has a Bachelor of Science in Industrial and Labor Relations from Cornell University. Mr. Pace’s position as our Chief Executive Officer and his extensive knowledge of the restaurant and food and beverage industries, including his senior leadership experience in human resources, make him particularly qualified for service on our Board.
RICHARD L. FEDERICO has been a member of our Board of Directors since November 2006 and has served as the Chairman of our Board since January 2016. Mr. Federico had previously served as a director of Jamba Juice Company from October 2004 to November 2006. Mr. Federico is currently Executive Chairman of Wok Holdco, an operator of domestic Asian-inspired restaurant brands, a position he has held since 2012. From 1996 until 2012, Mr. Federico served as a director and from 1997 to 2015, as Chief Executive Officer of P.F. Chang’s China Bistro Inc. In 2000, Mr. Federico was named Chairman of the Board of P.F. Chang’s China Bistro Inc. From 1989 to 1996, Mr. Federico served as President of the Italian Concepts division of Brinker International, Inc., where he was responsible for concept development and operations. Since 2011, Mr. Federico has served on the Board of Directors of Domino’s Pizza. Since August 2016, Mr. Federico has served on the Board of Directors and Compensation Committee of GolfTEC. Mr. Federico’s business acumen and experience in leading a successful publicly-held restaurant concept make him particularly qualified for service as Chairman of our Board, and for service on our Nominating and Corporate Governance Committee and on our Compensation and Executive Development Committee.
ANDREW R. HEYER has been a member of our Board of Directors since June 2009. Mr. Heyer has served as the Chief Executive Officer and Founder of Mistral Equity Partners, a private equity fund, since its founding in 2007. Prior to founding Mistral, Mr. Heyer served as a Founding Managing Partner of Trimaran Capital Partners, LLC, a private equity firm. Mr. Heyer was formerly a Vice Chairman of CIBC World Markets Corp., and a co-head of the CIBC Argosy Merchant Banking Funds. Prior to joining CIBC World Market Corp. in 1995, Mr. Heyer was a Managing Director at Drexel Burnham Lambert Incorporated and, previous to that, he worked at Shearson/American Express. Mr. Heyer also serves on the Board of Directors of Hain Celestial Group. Mr. Heyer also currently serves as a Member of the Executive Committee and Board of Trustees of the University of Pennsylvania and the University of Pennsylvania Health System. Mr. Heyer was appointed as our Lead Director in March 2015, a position he held until January 2016. Mr. Heyer’s business, financial and investment experience in consumer focused product and services industries makes him particularly qualified for service on our Board and our Compensation and Executive Development Committee.
56
MICHAEL A. DEPATIE has been a member of our Board of Directors since November 2010. Mr. Depatie has served as the Managing Partner of KHP Capital Partners, a hotel real estate investment fund, since January 2015. Mr. Depatie served as Chief Executive Officer of Kimpton Hotels and Restaurants, LLC from 2006 to January 2015, and was also a member of Kimpton’s Board of Directors. Prior to being elected as Kimpton’s Chief Executive Officer, Mr. Depatie served as their President from 2005 having joined the Kimpton family of companies as Chief Executive Officer for real estate for Kimpton Group Holding, LLC in 2003. Prior to Kimpton, Mr. Depatie held senior finance and development roles in a number of rapidly growing lodging companies including Residence Inn and Summerfield Suites. Previously, Mr. Depatie was the Chief Financial Officer of Sunterra, an NYSE listed resort hotel vacation ownership company and NYSE listed La Quinta, a national chain of limited service hotels. Mr. Depatie’s extensive senior management experience and his financial expertise make him particularly qualified for service on our Board and as Chairman of our Audit Committee.
LORNA C. DONATONE has been a member of our Board of Directors since December 2013. Since September 2015, Ms. Donatone has served as Region Chair for North America and Chief Executive Officer of Geographic Regions Worldwide for Sodexo. Ms. Donatone had previously served as Chief Executive Officer Schools Worldwide and Chief Operating Officer and Education Market President at Sodexo Education since February 2010, where she oversaw operations and strategic growth for Sodexo at college and university campuses, public school districts and private schools in the U.S. Prior to that, Ms. Donatone served in various other leadership roles at Sodexo including President of School Services from September 2007 to February 2010. Ms. Donatone joined Spirit Cruises, LLC, a subsidiary of Sodexo in 1999 and served as its President from 2002 to 2006. Ms. Donatone is a member of the Sodexo Group Executive Committee and Chair of the Sodexo North America Regional Leadership Committee. She has been a board member of the National Restaurant Association since 2005 and a trustee of the National Restaurant Association Educational Foundation since 2011, where she is Past Chair of the Board. Ms. Donatone is the Past Chair of the Board of Directors of the Women’s Foodservice Forum and was elected as a member of the Board of Trustees for the Culinary Institute of America in 2008. Ms. Donatone’s extensive knowledge of the restaurant and food service industry, senior management experience and financial expertise makes her particularly qualified for service on our Board, our Audit Committee and as Chair of our Nominating and Corporate Governance Committee.
JAMES C. PAPPAS has been a member of our Board of Directors since January 2015. He serves as the Managing Member of JCP Investment Management, LLC, a position he has held since June 2009. Mr. Pappas is the sole member of JCP Investment Holdings, LLC, and was a private investor between 2007 and 2009. Previously, from June 2005 to July 2007, Mr. Pappas was with the Investment Banking/Leveraged Finance Division of Goldman Sachs Group, Inc. where he advised private equity groups and corporations on appropriate leveraged buyout, recapitalization and refinancing alternatives. Prior to that, from June 2004 to June 2005, Mr. Pappas worked with Banc of America Securities, where he focused on consumer and retail investment banking, providing advice on a wide range of transactions including mergers and acquisitions, financings, restructurings and buy-side engagements. From January 2013 to May 2014, Mr. Pappas served as the Chairman of Morgan's Foods Inc., and served as its Director from February 2012 to May 2014. He served as an Independent Director of The Pantry, Inc. from March 2014 to March 2015. He also served as a Director at Samex Mining Corp. from January 2013 to August 2013. Since June 2016, Mr. Pappas has served as a Director of Tandy Leather Factory, Inc., and since October 2016 he has served as Director of US Geothermal, Inc. Mr. Pappas’s financial and food service industry expertise, along with his senior management experience make him particularly qualified to serve on our Board, our Audit Committee and our Nominating and Corporate Governance Committee.
GLENN W. WELLING has been a member of our Board of Directors since January 2015. He served as the Chief Investment Officer and Principal of Engaged Capital, LLC since its founding in 2012. Prior to the founding of Engaged Capital, Mr. Welling was a Principal and Managing Director of Research at Relational Investors LLC, which he joined in July 2008 and was responsible for research in the consumer, healthcare, and utilities sectors. Mr. Welling served from February 2002 to May 2008 as a Managing Director of Credit Suisse Group AG, where he also served as the Head of the Investment Banking Department’s Advisory Business. Mr. Welling served as Partner and Managing Director of HOLT Value Associates L.P. from October 1999 to January 2002. Mr. Welling serves as Chairman of the Board of Directors for the University of Pennsylvania’s tennis program and as a Member of the Wharton Executive Education Board. He also serves as a member of the Board of Directors of ROVI Corporation, and Medifast, Inc. He teaches executive education courses at the Wharton School of Business at the University of Pennsylvania. Mr. Welling’s financial, industry, and senior management experience make him particularly qualified to serve on our Board and as Chairman of our Compensation and Executive Development Committee.
57
Information regarding the Executive Officers of the Company is contained in Part I of this Annual Report on Form 10-K.
CORPORATE GOVERNANCE
Director Independence
The Board of Directors has determined that, except for David Pace, each of the Company director nominees standing for election has no relationship which, in the opinion of the Board of Directors, would interfere with the exercise of independent judgment in carrying out the responsibilities of a director and is an “independent director” as defined by the applicable NASDAQ rules and the rules and regulations of the Securities and Exchange Commission (the “SEC”). In determining the independence of our directors, the Board of Directors has adopted the independence standards that mirror the criteria specified by applicable law and regulations of the SEC and the NASDAQ.
Board Leadership Structure
Our Board leadership structure currently consists of an independent Chairman and a Chief Executive Officer. In January 2016, David A. Pace was appointed our Chief Executive Officer and Richard L. Federico was appointed Chairman of our Board. Prior to the appointment of Richard L. Federico as independent Chairman of the Board, we appointed an independent Lead Director and will do so in the future at any time the roles of Chief Executive Officer and Chairman are combined.
The Board believes that Mr. Federico is best situated to serve as Chairman because he is the director most familiar with the Company’s business and industry, possesses detailed and in-depth knowledge of the issues, opportunities and challenges facing the Company and is thus best positioned to develop agendas that ensure that the Board’s time and attention are focused on the most critical matters. The Company’s independent directors bring experience, oversight and expertise from outside the Company, while the Chief Executive Officer brings Company-specific experience and expertise. The Board has determined that separating the roles of Chairman and Chief Executive Officer is most appropriate based on the current business environment of the Company, among other relevant factors.
Additionally, one of the responsibilities of the Board is to work with management to develop strategic direction and hold management accountable for the execution of strategy once it is developed. The Board believes that the Chairman can provide guidance to the Chief Executive Officer, who can then make the operating decisions necessary to manage the business.
Our Board elects our President, Chief Financial Officer, Secretary and all executive officers. All executive officers serve at the discretion of our Board. Each of our officers devotes his or her full time to our affairs.
Our directors devote time to our affairs as is necessary to discharge their duties. In addition, our Board has the authority to retain its own advisers to assist it in the discharge of its duties. There are no family relationships among any of our directors, officers or key employees.
Board’s Role in Risk Oversight
Our Board has an active role, as a whole and also at the committee level, in overseeing management of the risks we face. This role is one of informed oversight rather than direct management of risk. Our Board regularly reviews and consults with management on strategic direction, challenges and risks we face. Our Board also reviews and discusses with management quarterly financial results and forecasts. The Audit Committee of our Board oversees management of financial risks, and its charter tasks the committee to provide oversight and review of, at least annually, our risk management policies. The Compensation and Executive Development Committee of our Board is responsible for overseeing the management of risks relating to and arising from our executive compensation plans and arrangements. These committees provide regular reports to the full Board.
Management is tasked with the direct management and oversight of legal, financial, and commercial compliance matters, which includes identification and mitigation of associated areas of risk. The Chief Financial Officer and her staff provide regular reports of legal risks to our Board and committees. The Chief Financial Officer and the Controller provide regular reports to the Audit Committee concerning financial, tax and audit related risks. In addition, the Audit Committee receives periodic reports from management on our compliance programs and efforts, investment policy and practices and the results of various internal audit projects. Management and the Compensation and Executive Development Committee’s compensation consultant provide analysis of risks related to our compensation programs and practices to the Compensation and Executive Development Committee.
58
Certain Relationships and Related Party Transactions
The Company has entered into indemnity agreements with certain officers and directors which provide, among other things, that Jamba will indemnify such officer or director, under the circumstances and to the extent provided for therein, for expenses, damages, judgments, fines and settlements he or she may be required to pay in actions or proceedings which he or she is or may be made a party by reason of his or her position as a director, officer or other agent of Jamba, and otherwise to the fullest extent permitted under Delaware law and our Bylaws.
Other than the foregoing, there were no relationships or related party transactions in the fiscal year ended January 3, 2017 requiring disclosure.
Procedures for Approval of Related Person Transactions
Any request for us to enter into a transaction with an executive officer, director or employee, or any of such persons’ immediate family members or affiliates, must first be presented to our Audit Committee for review, consideration and approval. In approving or rejecting the proposed agreement, our Audit Committee will review each such transaction for potential conflicts of interest or improprieties in a manner consistent with our internal Policy Statement on Related Party Transactions.
Executive Sessions
Non-management directors regularly meet in executive session without management present each time our Board of Directors holds its regularly scheduled meetings.
Committees and Board Meeting Attendance
The Board of Directors has a standing Audit Committee, a Compensation and Executive Development Committee and a Nominating and Corporate Governance Committee. Each of these committees operates under a written charter adopted by the Board of Directors. Copies of these charters can be obtained on our website by going to http://ir.jambajuice.com and following the “Corporate Governance” link. The Board of Directors holds at least four regular meetings each year, with additional meetings as required. The Board of Directors held ten meetings during Fiscal 2016, either in person or by teleconference. Each of the standing committees of the Board of Directors held the number of meetings indicated in the table below. During Fiscal 2016, each of our incumbent directors attended at least 75% of the total number of meetings of the Board of Directors and all of the committees of the Board of Directors held during the period in which such director served. Our Corporate Governance Principles and Practices provide that our directors are expected to attend the Annual Meeting of Shareholders. Except for Mr. Howe, all of the directors then serving attended the Company’s last Annual Meeting of Shareholders held on May 17, 2016.
The following table sets forth the three standing committees of the Board of Directors and the members of each committee who served during Fiscal 2016:
|
Name of Director |
|
Audit |
|
Compensation and Executive Development |
|
Nominating and Corporate Governance |
|
Michael A. Depatie |
|
Chair |
|
|
|
|
|
Richard L. Federico |
|
|
|
Member |
|
Member |
|
Lesley H. Howe(1) |
|
Former Chair |
|
|
|
|
|
Andrew R. Heyer |
|
|
|
Member |
|
|
|
David A. Pace(2) |
|
|
|
Former Member |
|
Former Member |
|
Lorna C. Donatone |
|
Member |
|
|
|
Chair |
|
James C. Pappas |
|
Member |
|
|
|
Member |
|
Glenn W. Welling |
|
|
|
Chair |
|
|
|
Number of Meetings: |
|
7 |
|
5 |
|
4 |
|
(1) |
Mr. Howe served on our Board of Directors and as Chairman of the Audit Committee through the date of our 2016 Annual Meeting, after which he completed his term and no longer served as a director of the Company. |
|
(2) |
Mr. Pace served on our Nominating and Corporate Governance Committee and our Compensation and Executive Development Committee until January 22, 2016 when he was appointed Chief Executive Officer. |
59
The current members of the Audit Committee are Michael A. Depatie (Chair), Lorna Donatone, and James C. Pappas. Each of the members of the Audit Committee is independent for purposes of the applicable NASDAQ rules and the rules and regulations of the SEC as they apply to Audit Committee members.
With the assistance of the Company’s legal counsel, the Nominating and Corporate Governance Committee reviewed the applicable legal standards and criteria to determine “audit committee financial expert” status, as well as the answers to annual questionnaires completed by the Board members. On the basis of this review, the Nominating and Corporate Governance Committee delivered a report to the full Board. The Board made a determination that all current members of the Audit Committee are “audit committee financial experts” based upon the Nominating and Corporate Governance Committee’s report and each Board member’s review of the information made available to the committee.
The Audit Committee operates under a written charter approved by the Board of Directors, a copy of which can be obtained on our website by going to http://ir.jambajuice.com and following the “Corporate Governance” link. As more fully defined in the committee’s charter, the functions of the Audit Committee include retaining our independent registered public accounting firm, reviewing their independence, reviewing and approving the planned scope of our annual audit, reviewing and approving any fee arrangements with our independent registered public accounting firm, overseeing their audit work, reviewing and pre-approving any non-audit services that may be performed by them, reviewing the adequacy of accounting and financial controls, reviewing our critical accounting policies and reviewing and approving any related party transactions.
Additional information regarding the Audit Committee is set forth in the Report of the Audit Committee.
Compensation and Executive Development Committee
The current members of the Compensation and Executive Development Committee are Glenn W. Welling (Chair), Richard L. Federico, and Andrew R. Heyer. Each of the members of the Compensation and Executive Development Committee is independent for purposes of the applicable NASDAQ rules. The Compensation and Executive Development Committee operates under a written charter approved by the Board of Directors, a copy of which can be obtained on our website by going to http://ir.jambajuice.com and following the “Corporate Governance” link.
As more fully described in the committee’s charter, the primary function of the Compensation and Executive Development Committee is to assist the Board of Directors in managing compensation and development for directors and executives. The Compensation and Executive Development Committee’s primary duties and responsibilities are to (i) set compensation philosophy and determine executive compensation; (ii) ensure that all components of executive compensation are consistent with the Company’s compensation philosophy as in effect from time to time; (iii) evaluate and make recommendations to the Board of Directors on an annual basis concerning compensation of the members of the Board of Directors; (iv) oversee risks related to our executive compensation plans and arrangements; and (v) work with management to devise and execute on an executive development plan and succession planning and practices for the Company. The Compensation and Executive Development Committee’s charter does not provide for any delegation of these duties. In addition, the Compensation and Executive Development Committee has the authority under its charter to hire outside consultants and conduct such compensation reviews, investigations and/or surveys as the Compensation and Executive Development Committee may reasonably deem will provide such information as could reasonably and properly be required by the Compensation and Executive Development Committee in the exercise of its duties and responsibilities.
In setting compensation for our members of the Board of Directors, our executive officers provide suggestions on the administration of compensation for our directors to the Compensation and Executive Development Committee. For a description of the role our executive officers play in determining or recommending the amount or form of executive compensation, please see the section below entitled “EXECUTIVE COMPENSATION — Compensation Discussion and Analysis.”
Executive Compensation Processes
The Compensation and Executive Development Committee has implemented an annual performance review program for our executives under which annual performance goals are determined early in each calendar year for each of our executive officers. These goals may include both corporate goals and individual department specific goals that facilitate the achievement of corporate performance. Bonuses are tied to the achievement of these performance goals. For all executives, annual base salary increases and bonuses, to the extent awarded, are generally implemented during the first calendar quarter of the year.
60
Risk Considerations in Executive Compensation
Our Compensation and Executive Development Committee has discussed the concept of risk as it relates to our compensation programs, including our executive compensation program, and our Compensation and Executive Development Committee does not believe that our compensation programs encourage excessive or inappropriate risk taking. As described more fully in the section below entitled “EXECUTIVE COMPENSATION — Compensation Discussion and Analysis,” we structure our pay to consist of both fixed and variable compensation. The fixed (or salary) portion of compensation is designed to provide a steady income regardless of our stock price performance so that executives do not feel pressured to focus exclusively on stock price performance to the detriment of other important business metrics. The variable (cash bonus and equity) portions of compensation are designed to reward both intermediate and long-term corporate performance and generally are tied to the achievement of company-wide and individual department-specific goals. Goals are both financial and non-financial, and while largely formula-based, there is also an appropriate level of discretion in determining incentive payouts. We believe that applying company-wide metrics encourages decision-making by our executives that is in the best long-term interest of our Company and shareholders. Further, we believe that these variable elements of compensation constitute a sufficient percentage of overall compensation to motivate our executives to produce superior short, intermediate and long-term corporate results, while the fixed element is also substantial enough that our executives are not encouraged to take unnecessary or excessive risks in doing so. Finally, there are additional risk mitigating policies in place such as insider trading prohibitions and independent Compensation and Executive Development Committee oversight.
Nominating and Corporate Governance Committee
The current members of the Nominating and Corporate Governance Committee are Lorna Donatone (Chair), Richard L. Federico and James C. Pappas. Each of the members of the Nominating and Corporate Governance Committee is independent for purposes of the applicable NASDAQ rules. The Nominating and Corporate Governance Committee operates under a written charter approved by the Board of Directors, a copy of which can be obtained on our website by going to http://ir.jambajuice.com and following the “Corporate Governance” link.
As more fully defined in the committee’s charter, the Nominating and Corporate Governance Committee considers qualified candidates for appointment and nomination for election to the Board of Directors and makes recommendations concerning such candidates, develops corporate governance principles for recommendation to the Board of Directors and oversees the regular evaluation of our directors and management.
Director Nominations — Criteria and Diversity
The Board of Directors has adopted a Director Qualifications and Nominations Policy, the purpose of which is to describe the process by which candidates for possible inclusion in the Company’s slate of director nominees are selected. The Director Qualifications and Nominations Policy is administered by the Nominating and Corporate Governance Committee.
The Nominating and Corporate Governance Committee annually evaluates the current members of the Board of Directors whose terms are expiring and who are willing to continue in service against the criteria set forth below in determining whether to recommend these directors for election. The Nominating and Corporate Governance Committee regularly assesses the optimum size of the Board of Directors and its committees and the needs of the Board of Directors for various skills, background and business experience in determining if the Board of Directors requires additional candidates for nomination.
In fulfilling its responsibilities, the Nominating and Corporate Governance Committee considers, among other things, the following factors in reviewing possible candidates for nomination as director:
|
|
• |
the appropriate size of the Company’s Board of Directors and its Committees; |
|
|
• |
the perceived needs of the Board of Directors for particular skills, background and business experience; |
|
|
• |
the skills, background, reputation, and business experience of nominees compared to the skills, background, reputation, and business experience already possessed by other members of the Board of Directors; |
|
|
• |
nominees’ independence from management; |
61
|
|
• |
applicable regulatory and listing requirements, including independence requirements and legal considerations, such as antitrust compliance; |
|
|
• |
the benefits of a constructive working relationship among directors; and |
|
|
• |
the desire to balance the considerable benefit of continuity with the periodic injection of the fresh perspective provided by new members. |
The Nominating and Corporate Governance Committee does not assign specific weights to particular criteria and no particular criterion is a prerequisite for any prospective nominee.
While the Nominating and Corporate Governance Committee does not have a formal policy on diversity with regard to consideration of director nominees, the Nominating and Corporate Governance Committee considers diversity in its selection of nominees and seeks to have a Board of Directors that brings to the Company a variety of perspectives and skills derived from high quality business and professional experience. Our Board of Directors recognizes its responsibility to ensure that nominees for our Board of Directors possess appropriate qualifications and reflect a reasonable diversity of personal and professional experience, skills, backgrounds and perspectives, including those backgrounds and perspectives with respect to age, gender, culture, race and national origin. We believe that the backgrounds and qualifications of our directors, considered as a group, should provide a composite mix of experience, knowledge and abilities that will allow the Board of Directors to promote our strategic objectives and to fulfill its responsibilities to our shareholders.
Candidates for nomination as director come to the attention of the Nominating and Corporate Governance Committee from time to time through incumbent directors, management, shareholders or third parties. These candidates may be considered at meetings of the Nominating and Corporate Governance Committee at any point during the year. Such candidates are evaluated against the criteria set forth above. If the Nominating and Corporate Governance Committee believes at any time that it is desirable that the Board of Directors consider additional candidates for nomination, the Nominating and Corporate Governance Committee may poll directors and management for suggestions or conduct research to identify possible candidates and may engage, if the Nominating and Corporate Governance Committee believes it is appropriate, a third party search firm to assist in identifying qualified candidates.
The Nominating and Corporate Governance Committee will evaluate any recommendation for director nominee proposed by a shareholder. In order to be so evaluated, any recommendation for director nominee submitted by a shareholder must be sent in writing to the Corporate Secretary, Jamba, Inc., 3001 Dallas Parkway, Suite 140, Frisco, TX 75034, 120 days prior to the anniversary of the date the proxy statement was released to shareholders in connection with the prior year’s annual meeting of shareholders, except that if no annual meeting was held in the previous year or the date of the annual meeting has been advanced by more than thirty (30) calendar days from the date contemplated at the time of the previous year’s proxy statement, notice by the shareholders to be timely must be received not later than the close of business on the tenth (10th) calendar day following the day on which public announcement of the date of such meeting is first made, and must contain, among other requirements set forth in our Bylaws, the following information with respect to the candidate:
|
|
• |
the candidate’s name, age, business address and residence address; |
|
|
• |
the candidate’s principal occupation or employment; |
|
|
• |
the class and number of shares of capital stock of the Corporation which are beneficially owned by the candidate; and |
|
|
• |
any other information relating to the candidate that is required to be disclosed in solicitations for proxies for election of directors pursuant to the Rules and Regulations of the Securities and Exchange Commission under Section 14 of the Securities Exchange Act of 1934, as amended. |
All directors and director nominees must submit a completed form of directors’ and officers’ questionnaire as part of the nominating process. The evaluation process may also include interviews and additional background and reference checks for non-incumbent nominees, at the discretion of the Nominating and Corporate Governance Committee.
62
The Nominating and Corporate Governance Committee will evaluate incumbent directors, as well as candidates for director nominee submitted by directors, management and shareholders consistently using the criteria stated in its policy and will select the nominees that in the Nominating and Corporate Governance Committee’s judgment best suit the needs of the Board of Directors at that time.
Our Bylaws permit shareholders to nominate directors for consideration at annual meetings, provided the advance notice requirements set forth in our Bylaws have been properly met.
Communications with Directors
Shareholders may communicate with any and all members of our Board of Directors by transmitting correspondence by mail or facsimile addressed to one or more directors by name (or to the Chairman, for a communication addressed to the entire Board of Directors) at the following address and fax number:
Name of the Director(s)
c/o Corporate Secretary
Jamba, Inc.
3001 Dallas Parkway, Suite 140
Frisco, TX 75034
Fax: (469) 294-9601
Communications from our shareholders to one or more directors will be collected and organized by our Corporate Secretary under procedures approved by our independent directors. The Corporate Secretary will forward all communications to the Chairman of the Board of Directors, or to the identified director(s) as soon as practicable, although communications that are abusive, in bad taste or that present safety or security concerns may be handled differently. If multiple communications are received on a similar topic, the Corporate Secretary may, in his or her discretion, forward only representative correspondence.
The Chairman of the Board of Directors will determine whether any communication addressed to the entire Board of Directors should be properly addressed by the entire Board of Directors or a committee thereof. If a communication is sent to the Board of Directors or a committee, the Chairman of the Board, or the Chairman of that committee, as the case may be, will determine whether a response to the communication is warranted. If a response to the communication is warranted, the content and method of the response will be coordinated with our Vice President of Legal Affairs.
Code of Business Conduct and Ethics
The Company has adopted a Code of Business Conduct and Ethics that applies to all of its employees, including the Chief Executive Officer, Chief Financial Officer and Controller. The Code of Business Conduct and Ethics can be obtained on the Company’s website by going to http://ir.jambajuice.com and following the “Corporate Governance” link. The Company intends to post on its website any amendments to or waivers of the Company’s Code of Business Conduct and Ethics. The information contained on the Company’s website is not part of this document.
Corporate Governance Guidelines
Our Board has adopted Corporate Governance Principles and Practices to assist it in the exercise of its duties and responsibilities and to serve the best interests of our company and our shareholders. These principles which provide a framework for the conduct of our Board’s business provide, among other things, that:
|
|
• |
The principal responsibility of the directors is to oversee the exercise of corporate powers and to ensure that the Company’s business and affairs are managed to meet its stated goals and objectives; |
|
|
• |
Certain criteria and qualifications be used for consideration of selection of Board nominees; |
|
|
• |
New directors participate in an orientation program; and |
|
|
• |
All Board members have access to senior management. No member of the Board shall stand for re-election after his/her 75th birthday without a waiver from a majority of the members of the Board. At least annually, our Board and its committees will conduct a self-evaluation to determine whether they are functioning effectively. Board members shall not serve on more than four other Boards of Directors of other publicly-traded companies; provided, however that if the Board member also serves as chairman of the board of a publicly-traded company, then he or she shall not serve on more than three other Boards of Directors, or if the Board member also serves as an executive officer of a company, then he or she shall not serve on more than two other Boards of Directors. |
63
These principles can be obtained on our website by going to http://ir.jambajuice.com and following the “Corporate Governance” link. A printed copy of the guidelines may also be obtained by any shareholder upon request in writing to Jamba, Inc., c/o ICR, Inc., 685 Third Avenue, 2nd Floor, New York, NY, 10017, by emailing investors@jambajuice.com, or by telephoning (646) 277-1212.
Stock Ownership Guidelines
Each member of our Board of Directors is required to acquire and maintain, individually or through their affiliates, a minimum of $180,000 of shares of the Company’s common stock during the term of his or her service on the Board, with the value measured by the greater of the aggregate purchase price paid for such shares or the current market price. New members of the Board shall have five years from the date on which their service begins in which to attain the required ownership level. Any director who falls short of the guideline will be deemed in compliance as long as such director retains all stock compensation until the required level of ownership is met. We have also adopted stock ownership guidelines for our management to further align the interests of members of senior management with the interests of our shareholders and to encourage management ownership of our common stock. Further information on these guidelines is set forth in the section below entitled “EXECUTIVE COMPENSATION — Compensation Discussion and Analysis.”
Section 16(a) Beneficial Ownership Reporting Compliance
Section 16(a) of the Securities Exchange Act of 1934, as amended, requires our executive officers and directors and persons who beneficially own more than 10% of our Common Stock to file initial reports of beneficial ownership and reports of changes in beneficial ownership with the SEC. Such persons are required by SEC regulations to furnish us with copies of all Section 16(a) forms filed by such person.
Based solely on our review of such forms furnished to us and written representations from certain reporting persons, we believe that all filing requirements applicable to our executive officers, directors and greater-than-10% shareholders were complied with for Fiscal 2016, other than Mr. Pace who had one late filing in Fiscal 2016.
Summary Compensation Table
The following table sets forth information concerning the compensation earned during fiscal years 2016, 2015 and 2014 by our current Chief Executive Officer, our current Chief Financial Officer, our former President and Chief Executive Officer and our former Chief Financial Officer, each of whom served during part of fiscal 2016, and our three other most highly-compensated persons serving as executive officers at January 3, 2017 (our “Named Executive Officers”):
64
2016 SUMMARY COMPENSATION TABLE
|
Name and Principal Position |
|
Year |
|
Salary ($)(1) |
|
Bonus for Fiscal Year ($)(2) |
|
Stock Awards (time based) ($)(3) |
|
Stock Awards (performance based) ($)(4) |
|
Stock Awards (market based) ($)(5) |
|
Option Awards ($)(3) |
|
Non-Equity Incentive Plan Compensation ($)(6) |
|
All Other Compensation ($)(7) |
|
Total ($) |
|
|||||||||
|
David A. Pace(8) |
|
2016 |
|
|
454,615 |
|
|
200,000 |
|
|
- |
|
|
- |
|
|
1,052,000 |
|
|
870,495 |
|
|
477,736 |
|
691 |
|
|
3,055,537 |
|
|
|
Chief Executive Officer |
|
|
|
|
|
|
|
|
|
|
|
|
|
|
|
|
|
|
|
|
|
|
|
|
|
|
|
|
|
|
|
|
|
|
|
|
|
|
|
|
|
|
|
|
|
|
|
|
|
|
|
|
|
|
|
|
|
|
|
|
|
|
|
James D. White(9) |
|
2016 |
|
|
115,203 |
|
|
- |
|
|
- |
|
|
- |
|
|
- |
|
|
- |
|
|
- |
|
|
637,229 |
|
|
752,432 |
|
|
Former Chief Executive Officer |
|
2015 |
|
|
600,000 |
|
|
- |
|
|
- |
|
|
- |
|
|
- |
|
|
1,257,751 |
|
|
- |
|
|
1,684 |
|
|
1,859,435 |
|
|
and President |
|
2014 |
|
|
600,000 |
|
|
- |
|
|
315,900 |
|
|
395,365 |
|
|
- |
|
|
- |
|
|
208,275 |
|
|
909 |
|
|
1,520,449 |
|
|
|
|
|
|
|
|
|
|
|
|
|
|
|
|
|
|
|
|
|
|
|
|
|
|
|
|
|
|
|
|
|
|
Marie Perry(10) |
|
2016 |
|
|
198,769 |
|
|
50,000 |
|
|
68,160 |
|
|
- |
|
|
289,000 |
|
|
319,500 |
|
|
204,000 |
|
|
383 |
|
|
1,129,812 |
|
|
Executive Vice President, |
|
|
|
|
|
|
|
|
|
|
|
|
|
|
|
|
|
|
|
|
|
|
|
|
|
|
|
|
|
|
|
Chief Financial & |
|
|
|
|
|
|
|
|
|
|
|
|
|
|
|
|
|
|
|
|
|
|
|
|
|
|
|
|
|
|
|
Administrative Officer |
|
|
|
|
|
|
|
|
|
|
|
|
|
|
|
|
|
|
|
|
|
|
|
|
|
|
|
|
|
|
|
|
|
|
|
|
|
|
|
|
|
|
|
|
|
|
|
|
|
|
|
|
|
|
|
|
|
|
|
|
|
|
|
Karen L. Luey(11) |
|
2016 |
|
|
352,000 |
|
|
75,000 |
|
|
- |
|
|
- |
|
|
- |
|
|
- |
|
|
- |
|
|
150,672 |
|
|
577,672 |
|
|
Former Executive Vice President, |
|
2015 |
|
|
352,000 |
|
|
- |
|
|
- |
|
|
- |
|
|
- |
|
|
702,969 |
|
|
- |
|
|
657 |
|
|
1,055,626 |
|
|
Chief Financial & Administrative Officer |
|
2014 |
|
|
352,000 |
|
|
- |
|
|
140,400 |
|
|
175,718 |
|
|
- |
|
|
- |
|
|
77,940 |
|
|
657 |
|
|
746,715 |
|
|
|
|
|
|
|
|
|
|
|
|
|
|
|
|
|
|
|
|
|
|
|
|
|
|
|
|
|
|
|
|
|
|
Rachel Phillips-Luther(12) |
|
2016 |
|
|
99,750 |
|
|
50,000 |
|
|
54,350 |
|
|
- |
|
|
195,000 |
|
|
- |
|
|
100,000 |
|
|
196 |
|
|
499,296 |
|
|
Sr. Vice President, |
|
|
|
|
|
|
|
|
|
|
|
|
|
|
|
|
|
|
|
|
|
|
|
|
|
|
|
|
|
|
|
Chief Marketing Officer |
|
|
|
|
|
|
|
|
|
|
|
|
|
|
|
|
|
|
|
|
|
|
|
|
|
|
|
|
|
|
|
|
|
|
|
|
|
|
|
|
|
|
|
|
|
|
|
|
|
|
|
|
|
|
|
|
|
|
|
|
|
|
|
Steve Adkins |
|
2016 |
|
|
305,192 |
|
|
75,000 |
|
|
- |
|
|
- |
|
|
- |
|
|
- |
|
|
- |
|
|
62,548 |
|
|
442,740 |
|
|
Sr. Vice President, |
|
2015 |
|
|
285,000 |
|
|
- |
|
|
- |
|
|
- |
|
|
- |
|
|
236,822 |
|
|
- |
|
|
575 |
|
|
522,397 |
|
|
Chief Operations Officer |
|
2014 |
|
|
285,000 |
|
|
- |
|
|
77,220 |
|
|
96,644 |
|
|
- |
|
|
- |
|
|
46,697 |
|
|
575 |
|
|
506,136 |
|
|
|
|
|
|
|
|
|
|
|
|
|
|
|
|
|
|
|
|
|
|
|
|
|
|
|
|
|
|
|
|
|
|
Arnaud Joliff(13) |
|
2016 |
|
|
296,729 |
|
|
75,000 |
|
|
- |
|
|
- |
|
|
- |
|
|
- |
|
|
- |
|
|
602 |
|
|
372,331 |
|
|
Sr. Vice President, |
|
2015 |
|
|
253,115 |
|
|
- |
|
|
135,000 |
|
|
- |
|
|
- |
|
|
294,322 |
|
|
- |
|
|
531 |
|
|
682,968 |
|
|
Chief Systems Officer |
|
|
|
|
|
|
|
|
|
|
|
|
|
|
|
|
|
|
|
|
|
|
|
|
|
|
|
|
|
|
|
(1) |
Reflects salaries paid for the respective fiscal year. |
|
(2) |
Reflects cash sign-on bonuses granted as part of new hire arrangements, intended to cover transition-related costs such as relocation and other expenses, cash retention bonuses accrued per the plan adopted by the Board effective November 9, 2015, to be paid upon the confirmed eligibility of each named executive officer after June 30, 2016. |
|
(3) |
Represents the aggregate fair market value of stock options and restricted stock units calculated in accordance with the fair value method. The grant date fair value of options granted was estimated at the date of grant using a Black-Scholes option-pricing model. Option valuation models, including Black-Scholes, require the input of highly subjective assumptions, and changes in the assumptions used can materially affect the grant date fair value of an award. These assumptions include the risk-free rate of interest, expected dividend yield, expected volatility, and the expected term of the award. The risk-free rate of interest is based on the zero coupon U.S. Treasury rates appropriate for the expected term of the award. We apply the guidance provided by the SEC Staff Accounting Bulletin No. 110 to determine expected term. Expected dividends are zero based on our history of not paying cash dividends on the Company’s common stock. For Fiscal Years 2016, 2015, and 2014, expected volatility is based on historic daily stock price observations of the Company's common stock since its inception. There is currently no market-based mechanism or other practical application to verify the reliability and accuracy of the estimates stemming from these valuation models or assumptions. The fair value of restricted stock units is based on the Company’s closing stock price on the date of grant. See the grant date fair value table below for the assumptions used to calculate the grant date fair value of option grants reported for fiscal years 2016, 2015, and 2014 on a grant by grant basis. |
|
(4) |
The fair value of the performance-based restricted stock units is based upon a Monte Carlo calculation. The value of the awards at the grant date assumes that the target level of performance conditions will be achieved in 2016 and 2017. |
65
|
(6) |
Reflects annual incentive bonus awards earned for the respective fiscal year, including guarantees. |
|
(7) |
Represents vacation and personal hours paid out at separation as well as premium payments for life insurance and long term disability. |
|
(8) |
Mr. Pace’s salary is prorated for service between January 22, 2016 and January 3, 2017. Mr. Pace began his employment in 2016, and accordingly he was not a Named Executive Officer in previous years. |
|
(9) |
Mr. White’s salary is prorated for service between December 30, 2015 and January 22, 2016, when he separated from the Company. |
|
(10) |
Ms. Perry’s salary is prorated for service between May 16, 2016 and January 3, 2017. Ms. Perry began her employment in 2016, and was appointed Executive Vice President, Chief Financial & Administrative Officer of the Company on August 9, 2016, and accordingly she was not a Named Executive Officer in previous years. |
|
(11) |
Ms. Luey transitioned out of her role as Executive Vice President, Chief Financial & Administrative Officer of the Company on August 9, 2016, and accordingly she was not a Named Executive Officer after that date. |
|
(12) |
Ms. Phillips-Luther’s salary is prorated for service between August 9, 2016 and January 3, 2017. Ms. Phillips-Luther began her employment in 2016, and accordingly she was not a Named Executive Officer in previous years. |
|
(13) |
Mr. Joliff became a Named Executive Officer in 2015 but was not a Named Executive Officer in previous years. |
66
The following table describes the assumptions used to calculate the grant date fair value of equity grants reported for fiscal years 2016, 2015, and 2014 on a grant-by-grant basis.
|
Name |
|
Grant Date |
|
Options Granted |
|
|
RSUs Granted |
|
|
Exercise Price ($) |
|
Closing Price on Grant Date ($) |
|
|
Volatility (%) |
|
|
Expected Life (Years) |
|
|
Risk Free Interest Rate (%) |
|
|
Dividend Yield (%) |
|
Grant Date Fair Value per Share ($) |
|
|||||||
|
David A. Pace |
|
3/17/2016 |
|
|
150,000 |
|
|
|
|
|
|
|
|
$ |
12.35 |
|
|
41.2 |
|
|
5.18 |
|
|
1.42 |
|
|
- |
|
$ |
4.75 |
|
|||
|
|
|
4/12/2016 |
|
|
50,000 |
|
|
|
|
|
|
|
|
$ 19.50 (1) |
|
|
41.2 |
|
|
5.18 |
|
|
1.25 |
|
|
- |
|
$ |
3.17 |
|
||||
|
|
|
5/17/2016 |
|
|
|
|
|
|
150,000 |
|
|
|
|
$ |
11.33 |
|
|
|
|
|
|
|
|
|
|
|
|
|
|
|
|
$ |
4.02 |
|
|
|
|
(tranche 1) |
|
|
|
|
|
|
|
|
|
|
|
|
|
|
|
|
|
|
|
|
|
|
|
|
|
|
|
|
|
|
|
|
|
|
|
5/17/2016 |
|
|
|
|
|
|
100,000 |
|
|
|
|
$ |
11.33 |
|
|
|
|
|
|
|
|
|
|
|
|
|
|
|
|
$ |
2.78 |
|
|
|
|
(tranche 2) |
|
|
|
|
|
|
|
|
|
|
|
|
|
|
|
|
|
|
|
|
|
|
|
|
|
|
|
|
|
|
|
|
|
|
|
5/17/2016 |
|
|
|
|
|
|
100,000 |
|
|
|
|
$ |
11.33 |
|
|
|
|
|
|
|
|
|
|
|
|
|
|
|
|
$ |
1.71 |
|
|
|
|
(tranche 3) |
|
|
|
|
|
|
|
|
|
|
|
|
|
|
|
|
|
|
|
|
|
|
|
|
|
|
|
|
|
|
|
|
|
|
|
|
|
|
|
|
|
|
|
|
|
|
|
|
|
|
|
|
|
|
|
|
|
|
|
|
|
|
|
|
|
|
|
|
|
James D. White |
|
3/17/2015 |
|
|
208,237 |
|
|
- |
|
|
- |
|
$ |
13.94 |
|
|
|
43.7 |
|
|
|
5.85 |
|
|
|
1.74 |
|
|
- |
|
$ |
6.04 |
|
|
|
|
|
8/7/2014 |
|
- |
|
|
|
22,500 |
|
|
- |
|
$ |
14.04 |
|
|
- |
|
|
- |
|
|
- |
|
|
- |
|
$ |
14.04 |
|
||||
|
|
|
8/7/2014 |
|
- |
|
|
|
7,500 |
|
|
- |
|
$ |
14.04 |
|
|
- |
|
|
- |
|
|
- |
|
|
- |
|
$ |
17.27 |
|
||||
|
|
|
(year 1) |
|
|
|
|
|
|
|
|
|
|
|
|
|
|
|
|
|
|
|
|
|
|
|
|
|
|
|
|
|
|
|
|
|
|
|
8/7/2014 |
|
- |
|
|
|
7,500 |
|
|
- |
|
$ |
14.04 |
|
|
- |
|
|
- |
|
|
- |
|
|
- |
|
$ |
17.32 |
|
||||
|
|
|
(year 2) |
|
|
|
|
|
|
|
|
|
|
|
|
|
|
|
|
|
|
|
|
|
|
|
|
|
|
|
|
|
|
|
|
|
|
|
8/7/2014 |
|
- |
|
|
|
7,500 |
|
|
- |
|
$ |
14.04 |
|
|
- |
|
|
- |
|
|
- |
|
|
- |
|
$ |
18.13 |
|
||||
|
|
|
(year 3) |
|
|
|
|
|
|
|
|
|
|
|
|
|
|
|
|
|
|
|
|
|
|
|
|
|
|
|
|
|
|
|
|
|
|
|
|
|
|
|
|
|
|
|
|
|
|
|
|
|
|
|
|
|
|
|
|
|
|
|
|
|
|
|
|
|
|
|
|
|
Marie Perry |
|
5/16/2016 |
|
|
75,000 |
|
|
|
|
|
|
|
|
$ |
11.65 |
|
|
39.1 |
|
|
5.18 |
|
|
1.29 |
|
|
- |
|
$ |
4.26 |
|
|||
|
|
|
5/18/2016 |
|
|
|
|
|
|
6,000 |
|
|
|
|
$ |
11.36 |
|
|
|
|
|
|
|
|
|
|
|
|
|
|
|
|
$ |
11.36 |
|
|
|
|
5/18/2016 |
|
|
|
|
|
|
40,000 |
|
|
|
|
$ |
11.36 |
|
|
|
|
|
|
|
|
|
|
|
|
|
|
|
|
$ |
4.33 |
|
|
|
|
(tranche 1) |
|
|
|
|
|
|
|
|
|
|
|
|
|
|
|
|
|
|
|
|
|
|
|
|
|
|
|
|
|
|
|
|
|
|
|
5/18/2016 |
|
|
|
|
|
|
25,000 |
|
|
|
|
$ |
11.36 |
|
|
|
|
|
|
|
|
|
|
|
|
|
|
|
|
$ |
3.08 |
|
|
|
|
(tranche 2) |
|
|
|
|
|
|
|
|
|
|
|
|
|
|
|
|
|
|
|
|
|
|
|
|
|
|
|
|
|
|
|
|
|
|
|
5/18/2016 |
|
|
|
|
|
|
20,000 |
|
|
|
|
$ |
11.36 |
|
|
|
|
|
|
|
|
|
|
|
|
|
|
|
|
$ |
1.95 |
|
|
|
|
(tranche 3) |
|
|
|
|
|
|
|
|
|
|
|
|
|
|
|
|
|
|
|
|
|
|
|
|
|
|
|
|
|
|
|
|
|
|
|
|
|
|
|
|
|
|
|
|
|
|
|
|
|
|
|
|
|
|
|
|
|
|
|
|
|
|
|
|
|
|
|
|
|
Karen L. Luey |
|
11/12/2015 |
|
|
25,000 |
|
|
- |
|
|
- |
|
$ |
13.50 |
|
|
|
42.5 |
|
|
|
5.85 |
|
|
|
1.88 |
|
|
- |
|
$ |
5.75 |
|
|
|
|
|
3/17/2015 |
|
|
92,586 |
|
|
- |
|
|
- |
|
$ |
13.94 |
|
|
|
43.7 |
|
|
|
5.85 |
|
|
|
1.74 |
|
|
- |
|
$ |
6.04 |
|
|
|
|
|
8/7/2014 |
|
- |
|
|
|
10,000 |
|
|
- |
|
$ |
14.04 |
|
|
- |
|
|
- |
|
|
- |
|
|
- |
|
$ |
14.04 |
|
||||
|
|
|
8/7/2014 |
|
- |
|
|
|
3,333 |
|
|
- |
|
$ |
14.04 |
|
|
- |
|
|
- |
|
|
- |
|
|
- |
|
$ |
17.27 |
|
||||
|
|
|
(year 1) |
|
|
|
|
|
|
|
|
|
|
|
|
|
|
|
|
|
|
|
|
|
|
|
|
|
|
|
|
|
|
|
|
|
|
|
8/7/2014 |
|
- |
|
|
|
3,333 |
|
|
- |
|
$ |
14.04 |
|
|
- |
|
|
- |
|
|
- |
|
|
- |
|
$ |
17.32 |
|
||||
|
|
|
(year 2) |
|
|
|
|
|
|
|
|
|
|
|
|
|
|
|
|
|
|
|
|
|
|
|
|
|
|
|
|
|
|
|
|
|
|
|
8/7/2014 |
|
- |
|
|
|
3,334 |
|
|
- |
|
$ |
14.04 |
|
|
- |
|
|
- |
|
|
- |
|
|
- |
|
$ |
18.13 |
|
||||
|
|
|
(year 3) |
|
|
|
|
|
|
|
|
|
|
|
|
|
|
|
|
|
|
|
|
|
|
|
|
|
|
|
|
|
|
|
|
|
|
|
|
|
|
|
|
|
|
|
|
|
|
|
|
|
|
|
|
|
|
|
|
|
|
|
|
|
|
|
|
|
|
|
|
|
Rachel Phillips-Luther |
|
8/9/2016 |
|
|
|
|
|
|
5,000 |
|
|
|
|
$ |
10.87 |
|
|
|
|
|
|
|
|
|
|
|
|
|
|
|
|
$ |
10.87 |
|
|
|
|
8/9/2016 |
|
|
|
|
|
|
35,000 |
|
|
|
|
$ |
10.87 |
|
|
|
|
|
|
|
|
|
|
|
|
|
|
|
|
$ |
3.69 |
|
|
|
|
(tranche 1) |
|
|
|
|
|
|
|
|
|
|
|
|
|
|
|
|
|
|
|
|
|
|
|
|
|
|
|
|
|
|
|
|
|
|
|
8/9/2016 |
|
|
|
|
|
|
20,000 |
|
|
|
|
$ |
10.87 |
|
|
|
|
|
|
|
|
|
|
|
|
|
|
|
|
$ |
2.25 |
|
|
|
|
(tranche 2) |
|
|
|
|
|
|
|
|
|
|
|
|
|
|
|
|
|
|
|
|
|
|
|
|
|
|
|
|
|
|
|
|
|
|
|
8/9/2016 |
|
|
|
|
|
|
15,000 |
|
|
|
|
$ |
10.87 |
|
|
|
|
|
|
|
|
|
|
|
|
|
|
|
|
$ |
1.40 |
|
|
|
|
(tranche 3) |
|
|
|
|
|
|
|
|
|
|
|
|
|
|
|
|
|
|
|
|
|
|
|
|
|
|
|
|
|
|
|
|
|
|
|
|
|
|
|
|
|
|
|
|
|
|
|
|
|
|
|
|
|
|
|
|
|
|
|
|
|
|
|
|
|
|
|
|
|
Steve Adkins |
|
3/17/2015 |
|
|
39,209 |
|
|
- |
|
|
- |
|
$ |
13.94 |
|
|
|
43.7 |
|
|
|
5.85 |
|
|
|
1.74 |
|
|
- |
|
$ |
6.04 |
|
|
|
|
|
8/7/2014 |
|
- |
|
|
|
5,500 |
|
|
- |
|
$ |
14.04 |
|
|
- |
|
|
- |
|
|
- |
|
|
- |
|
$ |
14.04 |
|
||||
|
|
|
8/7/2014 |
|
- |
|
|
|
1,833 |
|
|
- |
|
$ |
14.04 |
|
|
- |
|
|
- |
|
|
- |
|
|
- |
|
$ |
17.27 |
|
||||
|
|
|
(year 1) |
|
|
|
|
|
|
|
|
|
|
|
|
|
|
|
|
|
|
|
|
|
|
|
|
|
|
|
|
|
|
|
|
|
|
|
8/7/2014 |
|
- |
|
|
|
1,833 |
|
|
- |
|
$ |
14.04 |
|
|
- |
|
|
- |
|
|
- |
|
|
- |
|
$ |
17.32 |
|
||||
|
|
|
(year 2) |
|
|
|
|
|
|
|
|
|
|
|
|
|
|
|
|
|
|
|
|
|
|
|
|
|
|
|
|
|
|
|
|
|
|
|
8/7/2014 |
|
- |
|
|
|
1,834 |
|
|
- |
|
$ |
14.04 |
|
|
- |
|
|
- |
|
|
- |
|
|
- |
|
$ |
18.13 |
|
||||
|
|
|
(year 3) |
|
|
|
|
|
|
|
|
|
|
|
|
|
|
|
|
|
|
|
|
|
|
|
|
|
|
|
|
|
|
|
|
|
|
|
|
|
|
|
|
|
|
|
|
|
|
|
|
|
|
|
|
|
|
|
|
|
|
|
|
|
|
|
|
|
|
|
|
|
Arnaud Joliff |
|
11/12/2015 |
|
|
10,000 |
|
|
- |
|
|
- |
|
$ |
13.50 |
|
|
|
42.5 |
|
|
|
5.85 |
|
|
|
1.88 |
|
|
- |
|
$ |
5.75 |
|
|
|
|
|
11/12/2015 |
|
- |
|
|
|
10,000 |
|
|
- |
|
$ |
13.50 |
|
|
- |
|
|
- |
|
|
- |
|
|
- |
|
$ |
13.50 |
|
||||
|
|
|
3/17/2015 |
|
|
39,209 |
|
|
- |
|
|
- |
|
$ |
13.94 |
|
|
|
43.7 |
|
|
|
5.85 |
|
|
|
1.74 |
|
|
- |
|
$ |
6.04 |
|
|
67
Grants of Plan-Based Awards at 2016 Fiscal Year End
The following table sets forth certain information with respect to stock and option awards and other plan-based awards granted during the fiscal year ended January 3, 2017 to our Named Executive Officers:
GRANTS OF PLAN-BASED AWARDS IN FISCAL 2016
|
|
|
|
|
|
|
|
|
|
|
|
|
|
|
|
|
|
|
|
|
|
|
|
|
All other |
|
|
All other option |
|
|
|
|
|
|
Grant |
|
|||
|
|
|
|
|
|
|
|
|
|
stock |
|
|
awards: |
|
|
Exercise |
|
|
date fair |
|
|||||||||||||||||||
|
|
|
|
|
Estimated Future Payouts |
|
|
Estimated Future Payouts |
|
awards: |
|
|
# of |
|
|
or base |
|
|
value of |
|
|||||||||||||||||||
|
|
|
|
|
Under Non-Equity Incentive Plan Awards (1) |
|
|
Under Equity Incentive Plan Awards |
|
# of share |
|
|
securities |
|
|
price of |
|
|
stock and |
|
|||||||||||||||||||
|
|
|
|
|
|
|
|
|
|
|
|
|
|
|
|
|
|
|
|
|
|
|
|
|
of stock |
|
|
underlying |
|
|
options |
|
|
option |
|
||||
|
|
|
Grant |
|
Threshold |
|
|
Target |
|
|
Maximum |
|
|
Threshold |
|
Target |
|
|
Maximum |
|
or units |
|
|
options(2) |
|
|
awards |
|
|
awards(3) |
|
||||||||
|
Name |
|
Date |
|
$ |
|
|
$ |
|
|
$ |
|
|
$ |
|
$ |
|
|
$ |
|
# |
|
|
# |
|
|
$ |
|
|
$ |
|
||||||||
|
David A. Pace |
|
3/17/2016 |
|
|
|
|
|
|
|
|
|
|
|
|
|
|
|
|
|
|
|
|
|
|
|
|
|
|
150,000 |
|
|
$ |
12.35 |
|
|
|
712,500 |
|
|
|
|
4/12/2016 |
|
|
|
|
|
|
|
|
|
|
|
|
|
|
|
|
|
|
|
|
|
|
|
|
|
|
50,000 |
|
|
$ |
19.50 |
|
|
|
272,000 |
|
|
|
|
5/3/2016 |
|
|
300,000 |
|
|
|
600,000 |
|
|
|
900,000 |
|
|
|
|
|
|
|
|
|
|
|
|
|
|
|
|
|
|
|
|
|
|
|
|
|
|
|
|
5/17/2016 |
|
|
|
|
|
|
|
|
|
|
|
|
|
|
|
|
2,925,000 |
|
(5) |
|
|
|
|
|
|
|
|
|
|
|
|
|
|
|
|
|
|
|
|
5/17/2016 |
|
|
|
|
|
|
|
|
|
|
|
|
|
|
|
|
2,400,000 |
|
(5) |
|
|
|
|
|
|
|
|
|
|
|
|
|
|
|
|
|
|
|
|
5/17/2016 |
|
|
|
|
|
|
|
|
|
|
|
|
|
|
|
|
2,850,000 |
|
(5) |
|
|
|
|
|
|
|
|
|
|
|
|
|
|
|
|
|
|
|
|
|
|
|
|
|
|
|
|
|
|
|
|
|
|
|
|
|
|
|
|
|
|
|
|
|
|
|
|
|
|
|
|
|
|
|
|
|
|
James D. White(4) |
|
|
|
|
|
|
|
|
|
|
|
|
|
|
|
|
|
|
|
|
|
|
|
|
|
|
|
|
|
|
||||||||
|
|
|
|
|
|
|
|
|
|
|
|
|
|
|
|
|
|
|
|
|
|
|
|
|
|
|
|
|
|
|
|
|
|
|
|
|
|
|
|
|
Marie Perry |
|
5/16/2016 |
|
|
|
|
|
|
|
|
|
|
|
|
|
|
|
|
|
|
|
|
|
|
|
|
|
|
75,000 |
|
|
$ |
11.65 |
|
|
|
319,500 |
|
|
|
|
5/18/2016 |
|
|
|
|
|
|
|
|
|
|
|
|
|
|
|
|
|
|
|
|
|
|
6,000 |
|
(6) |
|
|
|
|
|
|
|
|
|
|
|
|
|
|
5/18/2016 |
|
|
|
|
|
|
|
|
|
|
|
|
|
|
|
|
780,000 |
|
(7) |
|
|
|
|
|
|
|
|
|
|
|
|
|
|
|
|
|
|
|
|
5/18/2016 |
|
|
|
|
|
|
|
|
|
|
|
|
|
|
|
|
600,000 |
|
(7) |
|
|
|
|
|
|
|
|
|
|
|
|
|
|
|
|
|
|
|
|
5/18/2016 |
|
|
|
|
|
|
|
|
|
|
|
|
|
|
|
|
570,000 |
|
(7) |
|
|
|
|
|
|
|
|
|
|
|
|
|
|
|
|
|
|
|
|
5/3/2016 |
|
|
102,000 |
|
|
|
204,000 |
|
|
|
306,000 |
|
|
|
|
|
|
|
|
|
|
|
|
|
|
|
|
|
|
|
|
|
|
|
|
|
|
|
|
|
|
|
|
|
|
|
|
|
|
|
|
|
|
|
|
|
|
|
|
|
|
|
|
|
|
|
|
|
|
|
|
|
|
|
|
|
|
Karen L. Luey |
|
5/3/2016 |
|
|
114,400 |
|
|
|
228,800 |
|
|
|
343,200 |
|
|
|
|
|
|
|
|
|
|
|
|
|
|
|
|
|
|
|
|
|
|
|
|
|
|
|
|
|
|
|
|
|
|
|
|
|
|
|
|
|
|
|
|
|
|
|
|
|
|
|
|
|
|
|
|
|
|
|
|
|
|
|
|
|
|
Rachel Phillips-Luther |
|
8/9/2016 |
|
|
|
|
|
|
|
|
|
|
|
|
|
|
|
|
|
|
|
|
|
|
5,000 |
|
(6) |
|
|
|
|
|
|
|
|
|
|
|
|
|
|
8/9/2016 |
|
|
|
|
|
|
|
|
|
|
|
|
|
|
|
|
682,500 |
|
(7) |
|
|
|
|
|
|
|
|
|
|
|
|
|
|
|
|
|
|
|
|
8/9/2016 |
|
|
|
|
|
|
|
|
|
|
|
|
|
|
|
|
480,000 |
|
(7) |
|
|
|
|
|
|
|
|
|
|
|
|
|
|
|
|
|
|
|
|
8/9/2016 |
|
|
|
|
|
|
|
|
|
|
|
|
|
|
|
|
427,500 |
|
(7) |
|
|
|
|
|
|
|
|
|
|
|
|
|
|
|
|
|
|
|
|
5/3/2016 |
|
|
71,250 |
|
|
|
142,500 |
|
|
|
213,750 |
|
|
|
|
|
|
|
|
|
|
|
|
|
|
|
|
|
|
|
|
|
|
|
|
|
|
|
|
|
|
|
|
|
|
|
|
|
|
|
|
|
|
|
|
|
|
|
|
|
|
|
|
|
|
|
|
|
|
|
|
|
|
|
|
|
|
Steve Adkins |
|
5/3/2016 |
|
|
80,000 |
|
|
|
160,000 |
|
|
|
240,000 |
|
|
|
|
|
|
|
|
|
|
|
|
|
|
|
|
|
|
|
|
|
|
|
|
|
|
|
|
|
|
|
|
|
|
|
|
|
|
|
|
|
|
|
|
|
|
|
|
|
|
|
|
|
|
|
|
|
|
|
|
|
|
|
|
|
|
Arnaud Joliff |
|
5/3/2016 |
|
|
80,000 |
|
|
|
160,000 |
|
|
|
240,000 |
|
|
|
|
|
|
|
|
|
|
|
|
|
|
|
|
|
|
|
|
|
|
|
|
|
|
|
|
|
|
|
|
|
|
|
|
|
|
|
|
|
|
|
|
|
|
|
|
|
|
|
|
|
|
|
|
|
|
|
|
|
|
|
|
|
|
(1) |
These columns show the threshold, target and maximum potential payout under the Management Incentive Plan for each of the Named Executive Officers. The target payouts and maximum payouts listed represent the target and maximum amounts payable based on the Fiscal 2016 target metrics described above in the Section entitled “Compensation Discussion and Analysis,” taking into account the base salaries paid to each of the Named Executive Officers as of January 3, 2017, the last day of Fiscal 2016. No payouts were made under the Management Incentive Plan for Fiscal 2016. The targets for each of our Named Executive Officers are determined by the Compensation and Executive Development Committee. |
|
(2) |
Represents grants of option shares made to participants in the Company’s 2013 Equity Incentive Plan, except for 75,000 option shares granted to Ms. Perry, which were inducement grants outside the plan. The grants are time-based and will vest in equal annual installments over three years. |
68
|
(4) |
Although Mr. White was a Named Executive Officer, he did not receive stock or option or other plan-based awards during Fiscal 2016. |
|
(5) |
The grants are market-based grants and will vest upon the 30th consecutive trading day the closing price of JMBA common stock equals or exceeds $19.50, $24.00 and $28.50, respectively, or upon a change of control whereby JMBA's shareholders receive a per share consideration equaling or exceeding such target price, so long as the target price is achieved during the three year period beginning on the vesting commencement date, and in each case so long as the executive remains an employee of JMBA and/or its affiliates. |
|
(6) |
Represents grants of restricted stock unit inducement grants made outside of the Company’s 2013 Equity Plan. The grants are time-based awards and will vest in equal annual installments over three years. |
|
(7) |
Represents grants of restricted stock unit inducement grants made outside of the Company’s 2013 Equity Plan. The grants are market-based grants and will vest upon the 30th consecutive trading day the closing price of JMBA common stock equals or exceeds $19.50, $24.00 and $28.50, respectively, or upon a change of control whereby JMBA's shareholders receive a per share consideration equaling or exceeding such target price, so long as the target price is achieved during the three year period beginning on the vesting commencement date, and in each case so long as the executive remains an employee of JMBA and/or its affiliates. |
69
Outstanding Equity Awards at 2016 Fiscal Year End
The following table sets forth certain information with respect to the number and value of all unexercised options or unvested portions of restricted stock units previously awarded to our Named Executive Officers as of January 3, 2017:
OUTSTANDING EQUITY AWARDS AT JANUARY 3, 2017
|
|
|
Option Awards(1) |
|
Stock Awards(1) |
|
|||||||||||||||||||||
|
Name |
|
Number of Securities Underlying Unexercised Options (#) Exercisable |
|
|
Number of Securities Underlying Unexercised Options (#) Unexercisable |
|
|
Option Exercise Price ($) |
|
|
Option Expiration Date |
|
Number of Shares or Units of Stock That Have Not Vested (#) |
|
Market Value of Shares or Units of Stock That Have Not Yet Vested(2) ($) |
|
|
Equity Incentive Plan Awards of Unearned Shares, Units or Other Rights That Have Not Vested (#) |
|
Equity Incentive Plan Awards; Market or Payout Value of Unearned Shares, Units or Other Rights That Have Not Vested(2) ($) |
|
|||||
|
David A. Pace |
|
- |
|
|
|
150,000 |
|
|
|
12.35 |
|
|
3/14/2026 |
|
- |
|
- |
|
|
- |
|
- |
|
|||
|
|
|
- |
|
|
|
50,000 |
|
|
|
19.50 |
|
|
3/14/2026 |
|
- |
|
- |
|
|
- |
|
- |
|
|||
|
|
|
- |
|
|
- |
|
|
- |
|
|
- |
|
150,000 (6) |
|
|
1,543,500 |
|
|
- |
|
- |
|
||||
|
|
|
- |
|
|
- |
|
|
- |
|
|
- |
|
100,000 (6) |
|
|
1,029,000 |
|
|
- |
|
- |
|
||||
|
|
|
- |
|
|
- |
|
|
- |
|
|
- |
|
100,000 (6) |
|
|
1,029,000 |
|
|
- |
|
- |
|
||||
|
|
|
|
|
|
|
|
|
|
|
|
|
|
|
|
|
|
|
|
|
|
|
|
|
|
|
|
|
James D. White |
|
|
140,848 |
|
|
- |
|
|
|
3.00 |
|
|
12/1/2018 |
|
- |
|
- |
|
|
- |
|
- |
|
|||
|
|
|
|
15,000 |
|
|
- |
|
|
|
11.10 |
|
|
11/12/2020 |
|
- |
|
- |
|
|
- |
|
- |
|
|||
|
|
|
|
20,000 |
|
|
- |
|
|
|
8.05 |
|
|
11/14/2021 |
|
- |
|
- |
|
|
- |
|
- |
|
|||
|
|
|
|
138,824 |
|
|
- |
|
|
|
13.94 |
|
|
3/17/2025 |
|
- |
|
- |
|
|
- |
|
- |
|
|||
|
|
|
|
|
|
|
|
|
|
|
|
|
|
|
|
|
|
|
|
|
|
|
|
|
|
|
|
|
|
|
|
|
|
|
|
|
|
|
|
|
|
|
|
|
|
|
|
|
|
|
|
|
|
|
|
|
Marie Perry |
|
- |
|
|
|
75,000 |
|
|
11.65 |
|
|
5/16/2026 |
|
- |
|
- |
|
|
- |
|
- |
|
||||
|
|
|
- |
|
|
- |
|
|
- |
|
|
- |
|
6,000 (7) |
|
|
61,740 |
|
|
- |
|
- |
|
||||
|
|
|
- |
|
|
- |
|
|
- |
|
|
- |
|
40,000 (8) |
|
|
411,600 |
|
|
- |
|
- |
|
||||
|
|
|
- |
|
|
- |
|
|
- |
|
|
- |
|
25,000 (8) |
|
|
257,250 |
|
|
- |
|
- |
|
||||
|
|
|
- |
|
|
- |
|
|
- |
|
|
- |
|
20,000 (8) |
|
|
205,800 |
|
|
- |
|
- |
|
||||
|
|
|
|
|
|
|
|
|
|
|
|
|
|
|
|
|
|
|
|
|
|
|
|
|
|
|
|
|
|
|
|
|
|
|
|
|
|
|
|
|
|
|
|
|
|
|
|
|
|
|
|
|
|
|
|
|
Karen L. Luey(3) |
|
|
6,000 |
|
|
- |
|
|
|
47.55 |
|
|
6/14/2017 |
|
- |
|
- |
|
|
- |
|
- |
|
|||
|
|
|
|
2,400 |
|
|
- |
|
|
|
22.40 |
|
|
12/7/2017 |
|
- |
|
- |
|
|
- |
|
- |
|
|||
|
|
|
|
8,000 |
|
|
- |
|
|
|
11.35 |
|
|
6/1/2020 |
|
- |
|
- |
|
|
- |
|
- |
|
|||
|
|
|
|
8,000 |
|
|
- |
|
|
|
11.10 |
|
|
11/12/2020 |
|
- |
|
- |
|
|
- |
|
- |
|
|||
|
|
|
|
4,000 |
|
|
- |
|
|
|
11.05 |
|
|
8/26/2021 |
|
- |
|
- |
|
|
- |
|
- |
|
|||
|
|
|
|
8,600 |
|
|
- |
|
|
|
8.05 |
|
|
11/14/2021 |
|
- |
|
- |
|
|
- |
|
- |
|
|||
|
|
|
- |
|
|
|
92,586 |
|
|
|
13.94 |
|
|
3/17/2025 |
|
- |
|
- |
|
|
- |
|
- |
|
|||
|
|
|
|
6,250 |
|
|
|
18,750 |
|
|
|
13.50 |
|
|
11/12/2025 |
|
- |
|
- |
|
|
- |
|
- |
|
||
|
|
|
- |
|
|
- |
|
|
- |
|
|
- |
|
3,334 (9) |
|
|
34,307 |
|
|
- |
|
- |
|
||||
|
|
|
- |
|
|
- |
|
|
- |
|
|
- |
|
- |
|
- |
|
|
3,334 (10) |
|
|
34,307 |
|
||||
|
|
|
|
|
|
|
|
|
|
|
|
|
|
|
|
|
|
|
|
|
|
|
|
|
|
|
|
|
Rachel Phillips-Luther |
|
- |
|
|
- |
|
|
- |
|
|
- |
|
5,000 (7) |
|
|
51,450 |
|
|
- |
|
- |
|
||||
|
|
|
- |
|
|
- |
|
|
- |
|
|
- |
|
35,000 (8) |
|
|
360,150 |
|
|
- |
|
- |
|
||||
|
|
|
- |
|
|
- |
|
|
- |
|
|
- |
|
20,000 (8) |
|
|
205,800 |
|
|
- |
|
- |
|
||||
|
|
|
- |
|
|
- |
|
|
- |
|
|
- |
|
15,000 (8) |
|
|
154,350 |
|
|
- |
|
- |
|
||||
|
|
|
|
|
|
|
|
|
|
|
|
|
|
|
|
|
|
|
|
|
|
|
|
|
|
|
|
|
Steve Adkins(4) |
|
|
2,600 |
|
|
- |
|
|
|
22.40 |
|
|
12/7/2017 |
|
- |
|
- |
|
|
- |
|
- |
|
|||
|
|
|
|
1,000 |
|
|
|
|
|
|
|
9.70 |
|
|
11/6/2022 |
|
- |
|
- |
|
|
- |
|
- |
|
||
|
|
|
- |
|
|
|
39,209 |
|
|
|
13.94 |
|
|
3/17/2025 |
|
- |
|
- |
|
|
- |
|
- |
|
|||
|
|
|
- |
|
|
- |
|
|
- |
|
|
- |
|
1,834 (9) |
|
|
18,872 |
|
|
- |
|
- |
|
||||
|
|
|
- |
|
|
- |
|
|
- |
|
|
- |
|
- |
|
- |
|
|
1,834 (10) |
|
|
18,872 |
|
||||
|
|
|
|
|
|
|
|
|
|
|
|
|
|
|
|
|
|
|
|
|
|
|
|
|
|
|
|
|
Arnaud Joliff(5) |
|
|
15,000 |
|
|
|
7,500 |
|
|
|
10.79 |
|
|
11/7/2023 |
|
- |
|
- |
|
|
- |
|
- |
|
||
|
|
|
- |
|
|
|
39,209 |
|
|
|
13.94 |
|
|
3/17/2025 |
|
- |
|
- |
|
|
- |
|
- |
|
|||
|
|
|
|
2,500 |
|
|
|
7,500 |
|
|
|
13.50 |
|
|
11/12/2025 |
|
- |
|
- |
|
|
- |
|
- |
|
||
|
|
|
- |
|
|
- |
|
|
- |
|
|
- |
|
6,667 (11) |
|
|
68,603 |
|
|
- |
|
- |
|
||||
|
|
|
- |
|
|
- |
|
|
- |
|
|
- |
|
834 (9) |
|
|
8,582 |
|
|
- |
|
- |
|
||||
|
|
|
- |
|
|
- |
|
|
- |
|
|
- |
|
- |
|
- |
|
|
834 (10) |
|
|
8,582 |
|
||||
70
|
(1) |
Reflects restricted stock units, options, or stock awards granted under the 2013 Equity Plan as well as inducement grants. |
|
(2) |
Market values have been estimated using a price per share of $10.29, which was the closing price of our common stock on the last trading day of fiscal 2016. |
|
(3) |
Upon Ms. Luey’s separation from the Company on March 20, 2017, she received one additional year of accelerated vesting of outstanding stock options, restricted stock and restricted stock units in accordance with the Severance Plan and a Transition Services Agreement dated August 3, 2016. |
|
(4) |
Upon Mr. Adkin’s separation from the Company on January 31, 2017, he received accelerated vesting of outstanding stock options, restricted stock and restricted stock units in accordance with the Severance Plan. |
|
(5) |
Mr. Joliff was granted market-based RSUs in 2017 for parity with other executives. |
|
(6) |
The grants are market-based grants and will vest upon the 30th consecutive trading day the closing price of JMBA common stock equals or exceeds $19.50, $24.00 and $28.50, respectively, or upon a change of control whereby JMBA's shareholders receive a per share consideration equaling or exceeding such target price, so long as the target price is achieved during the three year period beginning on the vesting commencement date, and in each case so long as the executive remains an employee of JMBA and/or its affiliates. |
|
(7) |
Represents grants of restricted stock unit inducement grants made outside of the Company’s 2013 Equity Plan. The grants are time-based grants and will vest in equal annual installments over three years. |
|
(8) |
Represents grants of restricted stock unit inducement grants made outside of the Company’s 2013 Equity Plan. The grants are market-based grants and will vest upon the 30th consecutive trading day the closing price of JMBA common stock equals or exceeds $19.50, $24.00 and $28.50, respectively, or upon a change of control whereby JMBA's shareholders receive a per share consideration equaling or exceeding such target price, so long as the target price is achieved during the three year period beginning on the vesting commencement date, and in each case so long as the executive remains an employee of JMBA and/or its affiliates. |
|
(9) |
Vesting on these restricted stock unit awards commenced on August 7, 2014 and, assuming each individual continues providing services to the Company, will vest and become exercisable in equal installments on August 7, 2015, August 7, 2016, and August 7, 2017. |
|
(10) |
Vesting on these performance-based restricted stock unit awards commenced on August 7, 2014 and, assuming that the Company achieves TSR measurement against a select restaurant peer group for each year, will vest and become exercisable in equal installments on August 7, 2015, August 7, 2016, and August 7, 2017. |
|
(11) |
Vesting on these restricted stock unit awards commenced on November 12, 2015 and, assuming each individual continues providing services to the Company, will vest and become exercisable in equal installments on November 12, 2016, November 12, 2017, and November 12, 2018. |
71
Option Exercises and Stock Vested During Last Fiscal Year
OPTION EXERCISES AND STOCK VESTED DURING
THE FISCAL YEAR ENDED JANUARY 3, 2017
|
|
|
Option Awards |
|
|
Stock Awards |
|
||||||||||
|
Name |
|
Number of Shares Acquired on Exercise (#) |
|
|
Value Realized on Exercise(1) ($) |
|
|
Number of Shares Acquired on Vesting (#) |
|
|
Value Realized on Vesting(2) ($) |
|
||||
|
David A. Pace |
|
- |
|
|
- |
|
|
- |
|
|
- |
|
||||
|
James D. White |
|
|
97,176 |
|
|
|
896,765 |
|
|
|
14,500 |
|
|
|
185,600 |
|
|
Marie Perry |
|
- |
|
|
- |
|
|
- |
|
|
- |
|
||||
|
Karen L. Luey |
|
|
35,888 |
|
|
|
107,836 |
|
|
|
6,667 |
|
|
|
72,470 |
|
|
Rachel Phillips-Luther |
|
- |
|
|
- |
|
|
- |
|
|
- |
|
||||
|
Steve Adkins |
|
- |
|
|
- |
|
|
|
2,917 |
|
|
|
31,708 |
|
||
|
Arnaud Joliff |
|
- |
|
|
- |
|
|
|
9,166 |
|
|
|
93,118 |
|
||
|
(1) |
Based on the difference between the market price of our common stock on the date of exercise and the exercise price of the relevant option multiplied by the number of shares for which the option was exercised. |
|
(2) |
Based on the market value of the underlying shares on vesting date multiplied by the number of shares vested. |
The Company does not provide any deferred compensation arrangements or pension plans. As such, the Pension Benefits Table and Nonqualified Deferred Compensation Table have been eliminated from this Annual Report on Form 10-K.
Potential Payments upon Termination or Change in Control
In 2013 we adopted the Severance Plan for the benefit of employees of the Company holding the title of Executive Vice President or Senior Vice President and for certain other key employees of the Company who may be designated by the Compensation and Executive Development Committee from time to time as eligible to participate in the Severance Plan (each a “Participant,” and collectively, the “Participants”). The Compensation and Executive Development Committee decided to adopt the Severance Plan to provide Participants with specified compensation and benefits in a uniform and consistent manner as between Executive Vice Presidents and as between Senior Vice Presidents and other Participants in the event of a termination of employment under circumstances specified therein. Each of the current Executive Vice Presidents and Senior Vice Presidents has entered into a Severance Plan participation agreement which supersedes all prior arrangements and understandings regarding the subject matter of the Severance Plan (including, but not limited to any severance provisions under any employment agreement entered into prior to the effective date of the Severance Plan and/or the date of the participation agreement), and shall be the exclusive agreement for the determination of any payments and benefits due to such employee.
Pursuant to the Severance Plan, in the event that a Participant is terminated without cause or resigns for good reason in the absence of a change of control, such participant will be entitled to receive certain compensation and benefits from the Company, including the following:
|
|
• |
a severance payment equal to 125% (Executive Vice Presidents) or 100% (in the case of Senior Vice Presidents and other Participants) of such Participant’s annual base salary rate in effect as of the date of termination; |
|
|
• |
all incentive bonuses earned by participant during the period immediately preceding the performance period in which the Participant’s employment terminates; |
|
|
• |
the Participant’s pro rata bonus amount as of the date of termination for incentive bonuses earned during the current performance period; and |
|
|
• |
continuation of health coverage for twelve (12) months. |
72
Pursuant to the Severance Plan, in the event that the Participant is terminated without cause or resigns for good reason within eighteen (18) months following a change in control (as such term is defined in the Severance Plan), such Participant will be entitled to receive certain compensation and benefits from the Company, including the following:
|
|
• |
a severance payment equal to 125% (Executive Vice Presidents) or 100% (in the case of Senior Vice Presidents and other Participants) of such Participant’s annual base salary rate in effect as of the date of termination; |
|
|
• |
all incentive bonuses earned by Participant during the period immediately preceding the performance period in which the Participant’s employment terminates; |
|
|
• |
a bonus payment equal to 100% of the Participant’s target bonus for the performance period; |
|
|
• |
continuation of health coverage for twelve (12) months; and |
|
|
• |
100% accelerated vesting of all unvested equity awards granted on or after the effective date of the Severance Plan. |
Other than as set forth in the Severance Plan, all payments under the Severance Plan are designed to be paid in accordance with the Company’s standard procedures, including applicable tax withholding, and are subject to compliance with Section 409A of the Code. Among other conditions, the Participant must sign and not revoke a general release of all claims against the Company as a condition to receiving any of the benefits prescribed by the Severance Plan.
On October 1, 2015, the Company announced the departure of James D. White from his position as President, Chief Executive Officer and as Chairman of the Board of Directors of the Company. Under the terms negotiated relating to the termination and transition of his employment, Mr. White agreed to remain in his current position to help oversee our operations until a successor was identified.
The terms of the compensation payable to Mr. White in connection with the termination of his employment are governed by the Executive Employment Agreement and the Transition Services Agreement. Under the terms of the agreements, Mr. White was entitled to the following in connection with the termination of his employment:
|
|
• |
one year of his base salary then in effect on the date of termination; |
|
|
• |
the average annual cash bonus paid to him for the most recent three years of employment; |
|
|
• |
continuation of health coverage for twelve months; |
|
|
• |
two years of accelerated vesting of any other unvested stock options; |
|
|
• |
two-thirds of the vesting under the March 17, 2015 stock option grant; |
|
|
• |
one year of accelerated vesting of any time-based unvested restricted stock units; |
|
|
• |
continuation of vesting of any unvested performance-based restricted stock units based on performance through the end of 2016; |
On May 2, 2016, the Company announced that Ms. Karen Luey, former Executive Vice President, Chief Financial Officer and Secretary would not be relocating to Frisco, Texas, and that Marie Perry would succeed Ms. Luey as described below. In connection with the transition, Ms. Luey agreed to continue to provide certain services to the Company after her resignation as Chief Financial and Administrative Officer. The terms of the compensation payable to Ms. Luey in connection with her transition and release of claims are governed by the Severance Plan and a Transition Services Agreement dated August 3, 2016, entered into between Ms. Luey and Jamba Juice Company. The Transition Services Agreement provides that $150,000 of the amount payable under the Plan would be payable to her on an accelerated basis on December 15, 2016 for remaining with the Company on a full-time basis through December 15, 2016. Ms. Luey received additional consideration for remaining with the Company on a full-time basis through March 20, 2017 or such earlier date as determined by the Company, including payment of salary through March 20, 2017, one additional year of accelerated vesting of outstanding stock options, restricted stock and restricted stock units and the extension of health care benefits for one year, subject to certain limitations.
73
On January 9, 2017, the Company and Steve Adkins, former Senior Vice President, U.S. Operations, of Jamba Juice Company, the Company’s wholly-owned subsidiary, mutually agreed that Mr. Adkins would cease to be an officer and employee of Jamba Juice, effective on January 31, 2017. Mr. Adkins and Jamba Juice entered into a Release Agreement, dated January 11, 2017, whereby in addition to the severance benefits under the Severance Plan, Mr. Adkins would be entitled to reimbursement for reasonable out-of-pocket costs incurred in connection with his relocation to California, including for any out-of-pocket costs incurred due to early termination of the lease agreement for his residence in Texas.
The following table presents our estimate of the dollar value of the payments and benefits payable to our Named Executive Officers upon the occurrence of a termination without cause or resignation for good reason under the circumstances noted above, assuming that such event occurred on January 3, 2017, the last day of Fiscal 2016. The actual amounts that would be paid to any Named Executive Officer can only be determined at the time of an actual termination of employment and would vary from those listed below.
|
|
|
Cash Severance |
|
Equity Acceleration |
|
COBRA Premium |
|
|
|
Current Officers: |
|
($) |
|
($) |
|
($)(1) |
|
|
|
David A. Pace |
|
1,077,736(2) |
|
- |
|
|
14,402 |
|
|
Marie Perry |
|
629,000(3) |
|
- |
|
|
15,676 |
|
|
Rachel Phillips-Luther |
|
385,000(4) |
|
- |
|
|
20,042 |
|
|
Steve Adkins |
|
320,000 (4) |
|
- |
|
|
14,402 |
|
|
Arnaud Joliff |
|
320,000 (4) |
|
- |
|
|
20,042 |
|
|
(1) |
Assumes maximum payment of COBRA premiums for the entire severance period covered by the applicable agreement. |
|
(2) |
Includes one year’s base salary and 100% of incentive bonus for Fiscal 2016. |
|
(3) |
Reflects 125% of annual base salary for Executive Vice President and pro rata bonus through date of termination. |
|
(4) |
Reflects 100% of annual base salary for Senior Vice President and pro rata bonus through date of termination. |
The following table presents our estimate of the dollar value of the payments and benefits payable to our Named Executive Officers upon the occurrence of a termination without cause or resignation for good reason in connection with a change of control under the circumstances noted above, assuming that such event occurred on January 3, 2017, the last day of Fiscal 2016. The actual amounts that would be paid to any Named Executive Officer can only be determined at the time of an actual termination of employment and would vary from those listed below.
|
|
|
Cash Severance |
|
Equity Acceleration |
|
|
COBRA Premium |
|
||
|
Current Officers: |
|
($) |
|
($)(1) |
|
|
($)(2) |
|
||
|
David A. Pace |
|
1,377,736(3) |
|
- |
|
|
|
14,402 |
|
|
|
Marie Perry |
|
629,000(4) |
|
|
61,740 |
|
|
|
15,676 |
|
|
Rachel Phillips-Luther |
|
385,000(5) |
|
|
51,450 |
|
|
|
20,042 |
|
|
Steve Adkins |
|
480,000 (5) |
|
|
38,334 |
|
|
|
14,402 |
|
|
Arnaud Joliff |
|
480,000 (5) |
|
|
85,767 |
|
|
|
20,042 |
|
|
(1) |
Calculated based on the assumption that triggering event takes place on January 3, 2017, the last trading day of Fiscal 2016. Reflects the value of accelerated vesting of outstanding equity awards based on the fair market value of $10.29 per share as of the last trading day of Fiscal 2016. Acceleration of outstanding equity awards with an exercise price above $10.29 per share is not reflected. |
|
(2) |
Assumes maximum payment of COBRA premiums for the entire severance period covered by the applicable agreement. |
|
(3) |
Includes eighteen (18) months of base salary and 100% of incentive bonuses for Fiscal 2016. |
|
(4) |
Includes 125% of annual base salary for Executive Vice President and 100% of incentive bonuses for Fiscal 2016. |
|
(5) |
Includes 100% of annual base salary for Senior Vice President and 100% of incentive bonuses for Fiscal 2016. |
74
Change in Control Arrangements in our Equity Compensation Plans
The Compensation and Executive Development Committee may, in its discretion, provide in the grant of any award under the 2013 Equity Plan for the acceleration of exercisability, vesting and/or settlement in connection with a change in control (as defined in the 2013 Equity Plan).
Pursuant to the terms of the 2013 Equity Plan, if a change in control occurs, the surviving, continuing, successor or purchasing entity or its parent may, without the consent of any participant in the 2013 Equity Plan, either assume or continue the Company’s rights and obligations under outstanding awards or substitute substantially equivalent awards for its stock. If so determined by the Compensation and Executive Development Committee, stock-based awards will be deemed assumed if, for each share subject to the award prior to the change in control, its holder is given the right to receive the same consideration that a shareholder would receive as a result of the change in control. In general, any awards which are not assumed, substituted for or otherwise continued in connection with a change in control or exercised or settled prior to the Change in Control will terminate effective as of the time of the change in control. Subject to the restrictions of Section 409A of the Code, the Compensation and Executive Development Committee may provide for the acceleration of vesting or settlement of any or all outstanding awards upon such terms and to such extent as it determines. The 2013 Equity Plan also authorizes the Compensation and Executive Development Committee, in its discretion and without the consent of any participant, to cancel each or any award denominated in shares of stock upon a change in control in exchange for a payment to the participant with respect each vested share (and each unvested share if so determined by the Compensation and Executive Development Committee) subject to the cancelled award of an amount equal to the excess of the consideration to be paid per share of common stock in the change in control transaction over the exercise price per share, if any, under the award. In addition, for awards granted after the 2013 Equity Plan’s amendment and restatement, in the event awards are assumed, continued, or substituted for, as provided above, then “double trigger” treatment (where awards accelerate upon a qualifying termination of employment that follows such change in control) will apply, provided that performance-based awards will be based on actual performance results and will only vest to the extent of such results.
Pursuant to the 2006 Stock Plan, holders of stock rights granted thereunder may be entitled to accelerated vesting upon the occurrence of a corporate transaction (as defined therein). Should a corporate transaction occur, the Board of Directors, or the board of directors of any entity assuming the obligations of the Company thereunder, may generally:
|
|
• |
make appropriate provision for the continuation of such stock rights by substituting, on an equitable basis, either the consideration payable with respect to the number of outstanding shares of Common Stock in connection with the Corporate Transaction or securities of any successor or acquiring entity; |
|
|
• |
upon written notice to the holders, provide that all stock rights must be exercised (either (a) to the extent then exercisable or (b) at the discretion of the Board of Directors, all options or stock rights being made fully exercisable for purposes of the 2006 Stock Plan), within a specified number of days of the date of such notice, at the end of which period the options or stock rights shall be terminated; or |
|
|
• |
terminate all options or stock rights in exchange for a cash payment equal to the excess of the fair market value, less the relevant exercise price, if any, of the shares subject to such stock rights (either (a) to the extent then exercisable or (b) at the discretion of the Board of Directors, all options or stock rights being made fully exercisable for purposes of the 2006 Stock Plan). |
Pursuant to the 2001 Plan, the Board of Directors, in the event of a “Change in Control,” shall have the right, but not the obligation, to accelerate the vesting or termination of restriction, limitation or repurchase rights applicable to such stock awards. As defined in the 2001 Plan, “Change in Control” means:
|
|
• |
a sale of substantially all of the assets of the Company; |
|
|
• |
a merger or consolidation in which the Company is not the surviving corporation; |
|
|
• |
a reverse merger in which the Company is the surviving corporation but the shares of Common Stock outstanding immediately preceding the merger are converted by virtue of the merger into other property; or |
|
|
• |
the acquisition by any person, entity or group of securities of the Company representing at least 50% of the combined voting power entitled to vote in the election of Directors. |
75
COMPENSATION OF MEMBERS OF OUR BOARD OF DIRECTORS
The following table sets forth information concerning the compensation earned or paid during Fiscal 2016 under our Non-Employee Director Compensation Policy by each individual who served as a non-employee director at any time during Fiscal 2016.
2016 DIRECTOR COMPENSATION
|
Name |
|
Board Fees Earned or Paid in Cash(1) ($) |
|
|
Stock Awards(2) ($) |
|
|
Total |
|
|||
|
Lorna C. Donatone |
|
|
69,375 |
|
|
|
53,178 |
|
|
|
122,553 |
|
|
Michael A. Depatie |
|
|
72,363 |
|
|
|
53,178 |
|
|
|
125,541 |
|
|
Richard L. Federico |
|
|
98,125 |
|
|
|
53,178 |
|
|
|
151,303 |
|
|
Andrew R. Heyer |
|
|
62,375 |
|
|
|
53,178 |
|
|
|
115,553 |
|
|
Lesley H. Howe(3) |
|
|
30,769 |
|
|
|
90,640 |
|
|
|
121,409 |
|
|
David A. Pace(4) |
|
|
12,925 |
|
|
|
16,793 |
|
|
|
29,718 |
|
|
James C. Pappas |
|
|
52,500 |
|
|
|
75,668 |
|
|
|
128,168 |
|
|
Glenn W. Welling |
|
|
61,875 |
|
|
|
75,668 |
|
|
|
137,543 |
|
|
(1) |
Fees earned are based on membership on the Board and participation in Board or committee chairmanship positions. |
|
(2) |
Represents the aggregate fair market value of stock grants and restricted stock units calculated in accordance with the fair value method. For more information on this calculation see Footnote 3 to the 2016 Summary Compensation Table above. |
|
(3) |
Mr. Howe served as a member of the Board of Directors through the date of the 2016 Annual Meeting. |
|
(4) |
Mr. Pace became an employee director as of March 14, 2016 and did not receive Director Compensation after that date. |
76
It is the general policy of the Board of Directors that compensation for non-employee directors should be a mix of cash and equity-based compensation. Director compensation is generally reviewed annually by the Compensation and Executive Development Committee, with any changes made by the committee generally becoming effective commencing after the Annual Meeting of Shareholders. All Board members are entitled to reimbursement by the Company for reasonable travel to and from meetings of the Board, and reasonable food and lodging expenses incurred in connection therewith. The 2016 compensation for non-employee directors under our Non-Employee Director Compensation Policy consisted of the following:
|
|
|
Cash Compensation(1) $ |
|
|
Equity Compensation $ |
|
|
Annual Retainer: |
|
|
|
|
|
|
|
Board Member |
|
|
60,000 |
|
|
60,000(2) |
|
Chairman of the Board (additional) |
|
|
40,000 |
|
|
40,000(3) |
|
Audit Committee Chair (additional) |
|
|
20,000 |
|
|
— |
|
Compensation and Executive Development Committee Chair (additional) |
|
|
10,000 |
|
|
— |
|
Nominating and Corporate Governance Committee Chair (additional) |
|
|
10,000 |
|
|
— |
|
(1) |
Assumes service for a full year; directors who serve for less than the full year are entitled to receive a pro-rated portion of the applicable payment. Each “year”, for purposes of the Director Compensation Policy, begins on the date of our annual meeting of shareholders. Each director can elect, in lieu of one-half of their Board Member cash compensation, to take an equally valued stock grant. |
|
(2) |
Each non-employee director elected at an annual meeting is entitled to receive an annual grant of equity-based compensation consisting of a number of restricted stock units under the 2013 Plan with a grant date value equal to $60,000. |
|
(3) |
The Chairman of the Board is entitled to receive an annual grant of equity-based compensation consisting of a number of restricted stock units under the 2013 Plan with a grant date value equal to $40,000. |
Other than as provided above, there were no other arrangements pursuant to which any director was compensated during the fiscal year ended January 3, 2017 for service as a director.
Effective as of the date of the 2017 Annual Meeting, in line with the Company’s cost-reduction efforts, the Board of Directors approved a modification of director compensation such that each of the cash and equity components of annual director compensation will be reduced by $5,000.
Compensation Committee Interlocks and Insider Participation
David Pace served on our Compensation and Executive Development Committee until January 22, 2016 when he was appointed Chief Executive Officer, at which time he ceased to be a member of the Compensation and Executive Development Committee. During Fiscal 2016, no member of the Compensation and Executive Development Committee had any relationship with the Company requiring disclosure under Item 404 of Regulation S-K. During Fiscal 2016, none of the Company’s executive officers served on the Compensation and Executive Development Committee or Board of Directors of another entity any of whose executive officers served on the Company’s Compensation and Executive Development Committee or Board of Directors.
77
Compensation Discussion and Analysis
This Compensation Discussion and Analysis includes a description of the compensation provided in 2016 to our executive officers who are named in the Summary Compensation Table below.
Our named executive officers (“NEOs” or “Named Executive Officers”) for 2016 were:
|
Current Officers |
|
|
|
|
David A. Pace |
|
Chief Executive Officer |
|
|
Marie Perry |
|
Executive Vice President, Chief Financial Officer, Chief Administrative Officer and Secretary |
|
|
|
|
|
|
|
Former Officers |
|
|
|
|
James D. White |
|
Former Chief Executive Officer and President |
|
|
Karen L. Luey |
|
Former Executive Vice President, Chief Financial Officer, Chief Administrative Officer and Secretary |
|
|
Steve A. Adkins |
|
Former Senior Vice President, Chief Operations Officer |
|
|
Rachel Phillips-Luther |
|
Former Senior Vice President, Chief Marketing Officer |
|
|
Arnaud Joliff |
|
Senior Vice President, Chief Systems Officer, General Manager, International |
|
As discussed further in the Executive Summary below, Mr. White departed as Chief Executive Officer and President in January 2016, Ms. Luey transitioned to no longer serve as Executive Vice President, Chief Financial Officer, Chief Administrative Officer and Secretary in July 2016, Mr. Adkins departed as Senior Vice President, Chief Operations Officer, in January 2017, Ms. Phillips-Luther departed as Senior Vice President, Chief Marketing Officer in November 2017 and Mr. Arnaud Joliff departed as Senior Vice President, Chief Systems Officer, General Manager, International in January 2018.
Executive Summary
Our 2016 fiscal year was a considerable year of transformation for the Company. In January, the Company hired Mr. Pace, who had served on the Company’s Board of Directors since 2012, as Chief Executive Officer. The Board and new executive leadership team significantly completed the transition of the Company to an asset light franchise-based business model, which resulted in a shift from a balanced Company store and franchise store approach to a greater than 90% franchise system by the end of the fiscal year. The Company began focusing on cost reduction efforts and implementing an infrastructure more closely aligned with a franchise-based business model, and also restructured the executive leadership team.
A summary of significant business highlights is provided below:
Business Highlights
|
|
• |
Appointed a new independent non-executive Chairman of the Board |
|
|
• |
Significantly completed a transformation of the business from a balanced Company store and franchise store model to an asset light franchise-based business model |
|
|
• |
Hired new leadership to support the change in business strategy, including a new Chief Executive Officer, Chief Financial Officer, and Chief Marketing Officer |
|
|
• |
Exited the JambaGO platform |
|
|
• |
Relocated the business from Emeryville, California to Frisco, Texas |
78
The following compensation program actions were taken in 2016, which were primarily related to recruiting a new executive leadership team, as well as implementing a highly performance-based compensation program that is closely tied to the realization of the Company’s new business strategy.
Compensation Highlights
|
Base Salaries |
• |
Most executives were new, and therefore, no salary adjustments were provided. |
|
|
• |
One continuing executive received a salary increase of 20.75%. |
|
Annual Incentives |
• |
No bonus payouts were earned under the performance-based annual incentive plan implemented for 2016 performance, since performance targets were not achieved. |
|
|
• |
Cash bonuses were granted to certain new executives for 2016 in connection with their new hire arrangements. |
|
Long-Term Incentives |
• |
Initiated a new highly performance-based equity program that consists of market-based RSUs earned upon the achievement of TSR stock price targets that represent 15%, 22.5% and 30% annualized appreciation over a three-year period. |
|
|
• |
Additional long-term incentives were granted in connection with new hire arrangements in the form of “regular” and premium priced options, as well as time-vested RSUs to induce executives to join the Company and make them whole for benefits forfeited at their prior employer. |
|
|
• |
Shareholders approved the adoption of the amended and restated 2013 Equity Plan, which increased the number of shares available for future grants to employees. |
This Compensation Discussion and Analysis details the objectives and design of our executive compensation program and should be read in light of the business transition discussed above, as a number of our programs were implemented to specifically address our new strategy and leadership changes. Still, consistent with prior years, the Company’s objectives for its executive compensation programs are to align pay with performance and shareholder interests, and to attract, motivate and retain a talented, entrepreneurial and creative team of executives who will provide leadership for the Company’s success.
Overview of Major Governance Provisions
Our executive compensation program is supported by a set of strong governance provisions and pay practices, as follows:
|
|
• |
Independent Committee, which is advised by an independent compensation consultant |
|
|
• |
Stock ownership guidelines |
|
|
• |
No hedging or pledging permitted |
|
|
• |
Incentive compensation recoupment (or “clawback”) policy |
|
|
• |
Annual compensation risk assessment |
|
|
• |
Double-trigger accelerated vesting in the event of a covered termination following a change of control |
|
|
• |
No tax reimbursements or gross-ups |
|
|
• |
No special executive-level perquisites or benefits (including no supplemental retirement plans) |
Say-on-Pay
In May 2016, we provided shareholders a “say-on-pay” advisory vote to approve our executive compensation programs. At our 2016 Annual Meeting of Shareholders, shareholders approved the compensation of our NEOs, where approximately 90% of the votes cast were in favor of our practices. The Compensation and Executive Development Committee of the Board (as used herein in this Compensation Discussion and Analysis, the “Committee”) evaluates the results of the advisory vote when determining executive compensation. The Committee
79
also considers many other factors in evaluating our program, including our corporate business objectives and recommendations by our compensation consultant. Taking all of this information into account, the Committee did not make any changes to our executive compensation program and policies specifically as a result of the 2016 say-on-pay advisory vote.
While the Company has historically held an advisory say-on-pay vote every three years, the Committee determined to adopt an annual say-on-pay advisory vote, which was the frequency with which shareholders expressed the most support at the 2016 Annual Meeting.
Objectives and Components of Our Executive Compensation Program
The primary objectives of our executive compensation program are as follows:
|
|
• |
Deliver pay for performance; |
|
|
• |
Drive strong business results; |
|
|
• |
Support teamwork; and |
|
|
• |
Attract and retain strong talent. |
We believe that pursuing these objectives will help us attract and retain qualified executives who are results oriented, engaged and passionate about our brand and are able to help us execute our strategic priorities. The ability to embrace our mission and culture are also important components in driving these objectives.
Our compensation programs provide a mix of fixed compensation and short-term and long-term incentive awards tied to the achievement of specific business objectives, corporate financial goals, and individual performance. We strive to be competitive in a challenging economic environment, with the ultimate objective of improving shareholder value. In addition, we work to ensure that our compensation program is perceived as fundamentally fair to all shareholders.
2016 Compensation Program
We structured our 2016 compensation program as a combination of short and long-term incentives designed to incentivize performance and retain our key executives, including our NEOs. We utilized a combination of annual cash incentive compensation with long-term equity awards that are tied to the achievement of our new business strategy.
Program Elements
The compensation program for our executive officers consists of the following elements:
|
|
• |
Base Salary; |
|
|
• |
Annual Cash Incentive Compensation; |
|
|
• |
Long-term Equity-Based Incentive Compensation; and |
|
|
• |
General Team Member Benefits. |
Base Salary
Base salary is the fixed portion of executive pay and is set to reward an individual’s current contributions to the Company and to compensate them for their day-to-day responsibilities. The Committee determines base salary levels for executives on an annual basis. Increases in salaries are generally based on both individual performance and our merit increase budget for the year. Other factors that may influence setting of or changes in base salary levels include total Company performance, the executive’s experience, responsibilities, management abilities, job performance, current market conditions, and analysis of competitive salaries payable for similar positions at other comparable companies. Salary increases may also be awarded in connection with an individual’s promotion to a new role. Peer group compensation data is reviewed annually for the industry and the relative responsibilities and contributions of the executive officers.
80
In fiscal 2016, the base salary for our current CEO, CFO and CMO were established when they were hired, and no further adjustments were made in fiscal 2016. Base salaries for these executives increased or decreased as follows:
|
Title |
|
2015 Salary |
|
2016 Salary |
|
% Increase / Decrease |
|
Chief Executive Officer |
|
$600,000 |
|
$600,000 |
|
0% |
|
Chief Financial Officer, Chief Administrative Officer & Secretary |
|
$352,000 |
|
$340,000 |
|
(3%) |
|
Chief Marketing Officer |
|
$300,000 |
|
$285,000 |
|
(5%) |
Annual Cash Incentive Compensation
For 2016, NEOs were eligible to receive performance-based annual cash bonuses pursuant to our Management Incentive Plan, based upon achievement of financial and strategic objectives. We believe that our annual cash incentive bonus is an important factor in motivating our management team as a whole, and individual executives in particular, to perform at their highest level toward achievement of our business objectives.
Each participant was eligible for a target award based on the participant’s base salary and position, as shown in the chart below. Actual payouts can range from 0% to 150% of target depending on actual performance relative to the goals. At Threshold performance, 50% of target is paid. At Target performance, 100% of target is paid. At Maximum performance, 150% of target is paid. Linear interpolation is used to determine payouts for performance between Threshold and Maximum, and no bonus is paid for performance below Threshold level.
|
Title |
|
Target Award as a % of Base Salary During Performance Periods |
|
|
Chief Executive Officer |
|
100% |
|
|
Chief Financial Officer, Chief Administrative Officer & Secretary |
|
60% |
|
|
Senior Vice President |
|
50% |
|
Note that in connection with the hire arrangements for the CEO, CFO and CMO, the annual bonus for 2016 was paid at 80%, 100% and 70% of target respectively. These bonuses were provided as an inducement to join the Company, and to acknowledge that these executives were not able to contribute to the goal setting process under the annual incentive plan given the timing of their hire. This arrangement is only applicable to the initial year of hire.
2016 Annual Performance
For fiscal 2016, no amounts were payable to the NEOs under the bonus plan as the targets relating to Adjusted EBITDA, store-level margin, and gross store openings were not achieved.
|
Financial Performance Goals
|
|
Actual Performance |
|
|
Adjusted EBITDA (60% weighted) o Threshold $11.7 million o Target $13.0 million o Maximum $14.7 million |
|
Threshold not achieved |
|
|
4-wall margin (California) (20% weighted) o Threshold 14.5% o Target 15.5% o Maximum 18% |
|
Threshold not achieved |
|
|
Gross Store Openings (20% weighted) o Threshold 80 o Target 100 o Maximum 125 |
|
Threshold not achieved |
|
|
Total Earnout as % of Target |
|
No Bonus Earned |
|
81
Long-Term Equity-Based Incentive Compensation
The Committee generally considers a range of factors in setting the size of equity grants to the NEOs, including assessments of individual performance, the potential contribution that each executive could be expected to make in the future, the NEO’s targeted total direct compensation, previous grants, and the size of awards and total compensation provided to others holding similar positions at companies included in our executive compensation peer group.
The Committee approves all equity awards to our officers at or above the vice president level.
Fiscal 2016 Equity Grants
Market-Based RSUs
Our 2016 equity compensation program consisted predominantly of market-based RSUs that are earned based upon TSR stock price targets that represent 15%, 22.5% and 30% annual appreciation over a three-year period. Therefore, vesting will only occur upon achievement of stock price targets of $19.50, $24.00, and $28.50 per share, and earned shares are subject to a minimum one year holding period once a stock price hurdle is achieved.
Note these grants are intended to cover long-term incentives until fiscal 2019, and therefore, it is anticipated, that additional long-term incentives will not be granted until then. Therefore, the shares and values for each executive should be divided by three to determine the Committee’s intended “annualized” value.
In addition to the awards above, certain officers were granted stock options and time-vested RSUs in connection with their new hire arrangements. These options and time-vested RSU awards were granted as a further inducement to join the Company, as well as to make the executive whole for certain benefits that were forfeited upon leaving their prior employer.
Two types of stock options were granted in 2016. The first type has an exercise price set at 100% of the fair market value on the grant date. The second has an exercise price set at a premium of $19.50 (i.e., the premium is set based on roughly 15% annual price appreciation over a three-year period). The CEO is the only executive with the premium options. All of these options vest in three equal annual installments over three years.
Time-vested RSUs were also granted in certain instances and vest in three equal annual installments over three years.
The table below shows the number of shares granted to each executive in fiscal 2016:
|
|
|
|
|
Market-Based RSUs(1) |
|
Time- Based RSUs |
|
|
|
Stock Options |
||
|
|
|
$19.50 |
|
$24.00 |
|
$28.50 |
|
|
|
FMV |
|
Premium |
|
CEO |
|
150,000 |
|
100,000 |
|
100,000 |
|
— |
|
150,000 |
|
50,000 |
|
CFO |
|
40,000 |
|
25,000 |
|
20,000 |
|
6,000 |
|
75,000 |
|
— |
|
CMO |
|
35,000 |
|
20,000 |
|
15,000 |
|
5,000 |
|
— |
|
— |
|
(1) |
The Company’s Chief Systems Officer was granted Market-Based RSUs in 2017 for parity with other executives. |
Fiscal 2015 Equity Grants
In 2015, we made two-year front-loaded option grants to executives at the time. This program was only applicable to the former executives, and the current Chief Systems Officer. It did not include the current Chief Executive Officer, Chief Financial Officer, or Chief Marketing Officer. Because it was a two-year front-load, there was no long-term incentive grant in 2016 for these executives. The two-year front load was intended to emphasize long-term incentive compensation and to offset a reduction in annual bonus opportunity by 50% in 2015.
82
Pursuant to our equity grant policy, all grants are generally made effective three trading days after each of our quarterly public earnings releases. This applies to all of our employees, including our executive officers. Except with respect to the premium priced options granted to our CEO as described above, the exercise price of stock options is the closing or last quoted price on the date of actual stock option grant, which we believe reflects fair market value after all public disclosures.
All grants issued after June 2013 were made under the 2013 Equity Incentive Plan or pursuant to inducement grants under Nasdaq rules, and all grants prior to June 2013 were made under our 2006 Employee, Director and Consultant Stock Plan, each of which authorize grants to employees, consultants and non-employee directors.
Interim or “off cycle” equity awards are made to newly hired team members as “initial grants”, promotional grants for those taking on significant additional responsibilities or other team members when circumstances warrant it, and are made effective on a fixed quarterly schedule.
Other General Team Member Benefits
Our executive officers are eligible to participate in all of our employee benefit plans, such as our medical, dental, vision, group life, disability, accidental death and dismemberment insurance and our 401(k) plan, in each case on the same terms as other employees, except that the executive officers did not participate in the employer match under our 401(k) plan in fiscal 2016. We do not provide tax gross-ups of any perquisites.
In addition, the CEO, CFO and CMO also received additional transition-related bonuses of $200,000, $50,000 and $50,000, respectively, which were intended to cover relocation and other expenses related to the transition of employment from their prior employer to the Company. The transition bonuses granted to the CFO and CMO are subject to the Company’s repayment policy which requires that the employee reimburse the Company for all or part of the sign-on bonus based on the number of months worked if employment terminates within 18 months for any reason other than position elimination.
Compensation Process and Oversight
Compensation and Executive Development Committee
The Committee has responsibility for establishing, implementing and monitoring our executive compensation philosophy and programs. The Committee determines compensation for our executives, including annual base salary, non-equity incentive plan payments, equity awards and all other compensation. The Committee is composed of members who are not, and never have been, employees of the Company.
Role of Senior Management and Consultant in Compensation Decisions
While the Committee does not delegate any of its authority in setting compensation, members of senior management participate in the Committee’s executive compensation process. For example, the Committee takes into consideration recommendations of our CEO on compensation decisions for executive officers other than himself, based on performance reviews he conducts with each of the executive officers, including the NEOs. Our CEO does not participate in discussions regarding his own compensation.
In addition, the Committee retains independent compensation consultants to assist it in its review of NEO compensation. The Committee reviews the findings and recommendations of its compensation consultant to help ensure that compensation decisions are in line with the Company’s priorities, properly incentivize actions that improve Company performance, and are reasonable when compared to the market for executive talent. As will be discussed below, in fiscal 2016, the Committee engaged Frederic W. Cook & Co., Inc. (“FW Cook”) as its independent compensation consultant. As part of its services, FW Cook:
|
|
• |
Participates in the design of executive compensation programs to help the Committee evaluate the linkage between pay and performance; |
|
|
• |
Reviews market data and advises the Committee on recommending the CEO’s compensation levels to the Board; |
83
|
|
• |
Reviews and advises the Committee regarding the compensation of the other executive officers and non-employee directors; and |
|
|
• |
Assists with an annual risk assessment of our compensation programs. |
FW Cook does not perform any other work on behalf of management or the Company. The Committee has assessed the independence of FW Cook and concluded that no conflict of interest exists that would prevent FW Cook from independently representing the Committee. The Committee intends to continue retaining the services of third party executive compensation specialists from time to time, as the Committee deems necessary or helpful, in connection with the establishment and development of our compensation philosophy and programs.
Competitive Compensation Data
To assist with the compensation determinations regarding our executive officers for fiscal 2016, the Committee reviewed competitive pay and other market data provided by FW Cook, which compared the various elements of executive compensation provided to our executive team, relative to compensation paid to individuals holding similar positions at companies in our executive compensation peer group (described below). FW Cook worked with our human resources department and management to access the data and review our compensation practices and philosophy.
To support our objective of maintaining an executive compensation program that is sufficiently competitive to attract and retain key executives, the Committee evaluates executive compensation information from a specific group of comparable companies, which we call our peer group. This process allows the Committee to set total compensation at levels that it believes are appropriate to retain and motivate our NEOs, and to develop a compensation program that supports our financial and strategic revitalization.
The Committee, with the assistance of FW Cook, identified our executive compensation peer group for fiscal 2016, selecting companies that are similar to us in industry, revenue, net income, number of employees and market capitalization. In determining our fiscal 2016 peer group, the Committee selected companies in the quick service restaurant and fast casual dining spaces with revenues ranging from $96 million to $865 million and market capitalization ranging from $92 million to $1.567 billion (size data were as of the time of the analysis in late-2015). The Company was positioned between the 25th percentile and the median in both size categories.
The companies that comprised the fiscal 2016 executive compensation peer group were:
|
Ark Restaurants |
Diversified Restaurant |
Luby’s |
|
Biglari |
Famous Dave’s |
Nathan Famous |
|
BJ’s |
Fiesta Restaurant Group |
Noodles |
|
Bravo Brio |
Frisch’s Restaurant |
Popeyes |
|
Carrols Restaurant |
Ignite Restaurant |
Ruth’s Hospitality |
|
Chuy Holdings |
Kona Grill |
Sonic |
|
Denny’s |
Krispy Kreme |
|
In making its executive compensation decisions, the Committee considered the competitive data provided by FW Cook. The Committee does not target a specific percentile for pay, but uses the median percentile range as a guide for making its pay decisions with respect to all pay elements. While the Committee considers relevant market pay practices when setting executive compensation, it does not believe that it is appropriate to establish compensation levels based only on market practices. The factors that influence the amount of compensation awarded include market competition for a particular position, an individual’s experience and past performance inside or outside the Company, compensation history, role and responsibilities within the Company, past and future performance objectives, value of the position within the Company, and the Company’s financial performance.
84
Other Executive-Level Programs
Severance and Change in Control Arrangements
In 2013 we adopted an Executive Retention and Severance Plan (the “Severance Plan”) for persons holding the title of Executive Vice President or Senior Vice President and for certain other key employees of the Company who may be designated by the Committee from time to time as eligible to participate in the Severance Plan (each a “Participant”). The Severance Plan superseded all prior arrangements with such Participants relating to severance. The Severance Plan and, with respect to our CEO, his employment agreement, provide for severance payments upon a termination of employment without cause or resignation for good reason, as well as upon a qualifying termination following a change in control of the Company, each as more fully described below in the section entitled “Potential Payments upon Termination or Change in Control.” The Committee believes that providing our executives with specified benefits in the event of a termination of employment by the Company without “cause” or in the event of a “constructive termination” is consistent with competitive practices, helps us retain executives and maintain leadership stability. In addition, the Committee believes that adopting uniform terms for our key employees other than our CEO, as reflected in the Severance Plan, helps to ensure that these executives are treated fairly and consistently.
The Committee believes that the occurrence, or potential occurrence, of a change in control may create uncertainty for our executives and other key employees. The “double trigger” provisions in the Severance Plan are designed to help retain our employees and maintain a stable work environment leading up to and during changes in control by providing certain economic benefits in the event their employment is actually or constructively terminated in connection with such a change.
The Severance Plan does not provide for any “single trigger” payments or benefits upon the occurrence of a change in control. Furthermore, the Severance Plan does not provide tax gross-ups for potential excise or other taxes on any benefits that are paid.
Management Stock Ownership Guidelines
We maintain Management Stock Ownership Guidelines to further align the interests of members of management with the interests of our shareholders and to encourage ownership of our common stock. These guidelines require our senior executives to acquire and maintain a minimum number of shares of our common stock, with such minimum number based upon a multiple of such executive’s annual base salary (with share value based upon the greater of the current stock price or the price at which the shares were acquired). Stock options are not counted for purposes of calculating the number of shares held.
The minimum number of shares is based upon the executive’s position as follows:
|
|
• |
3x salary for our Chief Executive Officer; |
|
|
• |
2x salary for our Chief Financial Officer/Chief Administrative Officer and other Executive Vice Presidents; and |
|
|
• |
1x salary for Senior Vice Presidents. |
There is no time limitation towards achieving the minimum number of shares required. However, until such minimum number of shares is held, 50% of all equity grants (calculated on the basis of net after tax shares) are to be retained.
Recoupment Policy
In March 2016, the Company’s Board of Directors adopted an Incentive Compensation Recoupment Policy setting forth the conditions under which the Company will seek reimbursement with respect to excess incentive compensation paid or awarded to, and to recover net profits realized from the sale, vesting or exercise of shares of the Company’s common stock by, executive officers of the Company.
Restrictions on Hedging and Other Transactions in our Securities
Under our Insider Trading Policy, our officers, directors and employees are not permitted to purchase or sell our securities short or buy or sell puts, calls or other derivative instruments relating to our Common Stock. Our officers, directors and employees are also strongly discouraged from engaging in hedging or monetization transactions involving the Company’s securities or holding Company securities in a margin account or pledging Company securities as collateral for a loan, with any such arrangement requiring pre-approval from the Company’s compliance officer.
85
Analysis of Risk Relating to Our Compensation Programs
Appropriately incentivizing behaviors which support the best interests of the Company and our shareholders is an essential part of the compensation-setting process. We believe that risk-taking is necessary for continued innovation and growth, but that risks should be encouraged within parameters that are appropriate for the long-term health and sustainability of the business. At the direction of the Committee, our benefits committee (comprised of members of management), evaluates the merits of its compensation programs through a comprehensive review of its compensation policies and programs to determine whether they encourage unnecessary or inappropriate risk-taking by the Company’s executives and employees below the executive level, including the following:
|
|
• |
Annual cash incentive awards and long-term incentive awards granted to executives that are tied primarily to corporate performance goals and strategic performance objectives. These metrics provide a balanced approach to rewarding performance of the business as a whole over various and overlapping time periods. |
|
|
• |
The executive annual cash incentive awards include a maximum payout opportunity. |
|
|
• |
Our executives are expected to meet stock ownership guidelines in order to align the executives’ interests with those of our shareholders. |
|
|
• |
In 2016, our annual equity awards to executives are comprised of performance-based RSUs and stock options, to further align pay with Company performance. |
|
|
• |
The Company’s pay philosophy provides an effective balance in the mix of cash and equity and allows for the committee’s discretion. |
|
|
• |
There is appropriate balance in fixed versus variable pay; cash and equity; corporate, business unit, and individual goals; financial and non-financial goals; formulas and discretion, etc. Policies are in place to mitigate compensation risk, such as insider trading prohibitions and independent Committee oversight. The Committee’s oversight extends to incentive and commission plans below the executive level. |
The benefits committee discussed its risk review with FW Cook and reported its findings to the Committee. Based on this review, both for our executive officers and all other employees, we concluded that the risks arising from the Company’s compensation policies and practices are not reasonably likely to have a material adverse effect on the Company.
Tax Considerations
The Committee considers the impact of Section 162(m) of the Internal Revenue Code of 1986, as amended (“Section 162(m)”), in determining the mix of elements of executive compensation. Under Section 162(m), named executive officer (other than the Chief Financial Officer) compensation over $1 million for any year is generally not deductible for United States income tax purposes. Performance-based compensation is exempt from the deduction limit, however, if certain requirements are met. We believe that the gains realized at the time of exercise of nonqualified stock options granted under the terms of our shareholder-approved stock plan are fully deductible in accordance with Section 162(m). In addition, the Committee generally structures performance-based equity grants and annual bonuses payable under our non-equity incentive plan with the intent that they qualify for deductibility in accordance with Section 162(m). Salaries and time-based vesting RSUs do not qualify as performance-based compensation for purposes of Section 162(m). The Committee intends to consider the impact of Section 162(m) on the deductibility of future executive compensation but reserves the right to provide for compensation to executive officers that may not be fully deductible when it believes that other considerations outweigh the tax deductibility of the compensation.
86
COMPENSATION AND EXECUTIVE DEVELOPMENT COMMITTEE REPORT
We, the Compensation and Executive Development Committee of the Board of Directors of the Company, have reviewed and discussed the Compensation Discussion and Analysis contained in this proxy statement with management. Based on such review and discussion, we have recommended to the Board of Directors that the Compensation Discussion and Analysis be included in this Company’s Annual Report on Form 10-K for the fiscal year ended January 3, 2017 and the Company's Proxy Statement for the fiscal year ended January 3, 2017.
|
SUBMITTED BY THE COMPENSATION AND |
|
EXECUTIVE DEVELOPMENT COMMITTEE |
|
OF THE BOARD OF DIRECTORS |
|
|
|
Glenn W. Welling, Chairman |
|
Richard L. Federico |
|
Andrew R. Heyer |
|
ITEM 12. |
SECURITY OWNERSHIP OF CERTAIN BENEFICIAL OWNERS AND MANAGEMENT AND RELATED SHAREHOLDER MATTERS |
Security Ownership of Certain Beneficial Owners and Management
The following table sets forth, as of February 1, 2018, certain information with respect to the beneficial ownership of the Company’s Common Stock by (i) each person who is known by the Company to be the beneficial owner of more than 5% of the Company’s Common Stock, (ii) each director and director-nominee of the Company, (iii) each executive officer named in the Summary Compensation Table and (iv) all directors and executive officers of the Company as a group.
|
|
|
Shares of Common Stock Beneficially Held |
|
||||
|
Name and Address of Beneficial Owner(1) |
|
Amount(2) |
|
|
Percent(3) |
|
|
|
Engaged Capital, LLC(4) |
|
2,834,002 |
|
|
18.2% |
|
|
|
610 Newport Center Drive, Suite 250 |
|
|
|
|
|
|
|
|
Newport Beach, California 92660 |
|
|
|
|
|
|
|
|
Wellington Management Group LLP(5) |
|
2,129,476 |
|
|
13.7% |
|
|
|
280 Congress Street |
|
|
|
|
|
|
|
|
Boston, MA 02210 |
|
|
|
|
|
|
|
|
Indus Capital Partners, LLC(6) |
|
1,430,860 |
|
|
9.2% |
|
|
|
888 Seventh Avenue, 26th Floor |
|
|
|
|
|
|
|
|
New York, NY 10019 |
|
|
|
|
|
|
|
|
Thompson Siegel & Walmsley LLC(7) |
|
790,851 |
|
|
5.1% |
|
|
|
6806 Paragon Place, Suite 300 |
|
|
|
|
|
|
|
|
Richmond, VA 23230 |
|
|
|
|
|
|
|
|
David A. Pace(8) |
|
|
105,677 |
|
|
* |
|
|
James D. White(9) |
|
|
80,666 |
|
|
* |
|
|
Marie Perry(10) |
|
|
27,000 |
|
|
* |
|
|
Karen L. Luey(11) |
|
|
49,797 |
|
|
* |
|
|
Rachel Phillips-Luther |
|
|
4,636 |
|
|
* |
|
|
Steve A. Adkins(12) |
|
|
12,516 |
|
|
* |
|
|
Arnaud Joliff(13) |
|
|
69,543 |
|
|
* |
|
|
Richard L. Federico(14) |
|
|
51,832 |
|
|
* |
|
|
Lesley H. Howe(15) |
|
|
20,000 |
|
|
* |
|
|
Michael A. Depatie(16) |
|
|
36,355 |
|
|
* |
|
|
Lorna C. Donatone |
|
|
19,710 |
|
|
* |
|
|
Andrew R. Heyer |
|
|
33,697 |
|
|
* |
|
|
James C. Pappas(17) |
|
|
420,036 |
|
|
2.7% |
|
|
Glenn W. Welling(4) |
|
|
2,846,905 |
|
|
18.3% |
|
|
All current directors and executive officers as a group(18) |
|
|
3,541,212 |
|
|
22.7% |
|
87
|
* |
Less than 1% |
|
(1) |
Except as otherwise indicated, the persons named in this table have sole voting and investment power with respect to all shares of Common Stock shown as beneficially owned by them, subject to community property laws, where applicable, and to the information contained in the footnotes to this table. This table is based upon the most current information supplied to us by current and former officers and directors of the Company and upon information gathered by us about principal shareholders known to us based on a Schedule 13G or 13D filed with the Securities and Exchange Commission. |
|
(2) |
Under the rules of the Securities and Exchange Commission, a person is deemed to be the beneficial owner of shares that can be acquired by such person within 60 days upon exercise of options or warrants or vesting of restricted stock units. |
|
(3) |
Calculated on the basis of 15,588,206 shares of Common Stock outstanding as of February 1, 2018, provided that any additional shares of Common Stock that a shareholder has the right to acquire within 60 days after February 1, 2018 are deemed to be held and outstanding for the purpose of calculating that shareholder’s percentage of beneficial ownership but not the percentages of beneficial ownership of other shareholders. |
|
(4) |
Based on a Form 4 filed on May 8, 2017 by Engaged Capital, LLC (“Engaged Capital”) and certain of its affiliates. Represents shares directly owned by Engaged Capital Master Feeder I, LP (“Engaged Capital Master I”) and Engaged Capital Master Feeder II, LP (“Engaged Capital Master II”) and held in an account separately managed by Engaged Capital (the “Engaged Capital Account”). Engaged Capital serves as the general partner and investment adviser of each of Engaged Capital Master I and Engaged Capital Master II and the investment adviser of the Engaged Capital Account. Engaged Capital Holdings, LLC (“Engaged Holdings”) serves as the managing member of Engaged Capital. Mr. Welling, as the Founder and Chief Investment Officer of Engaged Capital and the sole member of Engaged Holdings, may be deemed to beneficially own the shares owned directly by Engaged Capital Master I and Engaged Capital Master II and held in the Engaged Capital Account. Mr. Welling expressly disclaims beneficial ownership of such shares except to the extent of his pecuniary interest therein. |
|
(5) |
Based on a Schedule 13G/A filed on February 9, 2017 by Wellington Management Group LLP. Represents (i) 1,482,713 shares over which Wellington Management Group LLP has shared voting power, and (ii) 2,129,476 over which Wellington Management Group LLP has shared dispositive power. |
|
(6) |
Based on a Schedule 13D filed on August 17, 2017 by Indus Capital Partners, LLC. Represents (i) 1,430,860 shares over which Indus Capital Partners, LLC has shared voting power, (ii) 1,430,860 shares over which Indus Capital Partners, LLC has shared dispositive power. |
|
(7) |
Based on a Schedule 13G/A filed on February 6, 2017 by Thompson Siegel & Walmsley, LLC. Represents (i) 707,497 shares over which Thompson Siegel & Walmsley, LLC has sole voting power, (ii) 83,354 shares over which Thompson Siegel & Walmsley, LLC has shared voting power, and (iii) 790,851 shares over which Thompson Siegel & Walmsley, LLC has sole dispositive power. |
|
(8) |
Represents 39,011 shares of Common Stock held by Mr. Pace and 66,666 shares of Common Stock issuable upon the exercise of vested options held by Mr. Pace. |
|
(9) |
Based on a Form 4 filed on December 8, 2015 by Mr. White. |
|
(10) |
Represents 2,000 shares of Common Stock held by Ms. Perry and 25,000 shares of Common Stock issuable upon exercise of vested options held by Ms. Perry. |
|
(11) |
Based on a Form 4 filed on November 18, 2015 by Ms. Luey. |
|
(12) |
Represents 4,186 shares of Common Stock held by Mr. Adkins and 8,330 shares of Common Stock issuable upon exercise of vested options held by Mr. Adkins. |
|
(13) |
Represents 15,904 shares of Common Stock held by Mr. Joliff and 53,639 shares of Common Stock issuable upon exercise of vested options held by Mr. Joliff. |
|
(14) |
Represents 22,795 shares of Common Stock held by Mr. Federico and 29,037 shares of Common Stock issuable upon exercise of vested options held by Mr. Federico. |
88
|
(16) |
Represents 28,855 shares of Common Stock held by Mr. Depatie and 7,500 shares of Common Stock issuable upon exercise of vested options held by Mr. Depatie. |
|
(17) |
Represents 407,133 shares owned directly owned by JCP Investment Partnership, LP (“JCP Partnership”) and 12,903 shares held by Mr. Pappas directly. Mr. Pappas, solely by virtue of his position as the managing member of JCP Investment Management, LLC, the investment manager of JCP Partnership, and as the sole member of JCP Investment Holdings, LLC, the general partner of JCP Investment Partners, LP, which serves as the general partner of JCP Partnership, may be deemed to beneficially own the shares owned directly by JCP Partnership. Mr. Pappas expressly disclaims beneficial ownership of such shares except to the extent of his pecuniary interest therein. |
|
(18) |
Represents 3,586,441 shares of Common Stock and 322,597 shares of Common Stock issuable upon the exercise of vested options. See Notes 4, and 8 through 17, above. |
89
Equity Compensation Plan Information
The Company maintains one stock-based compensation plan. On May 17, 2016, at its 2016 Annual Meeting of Shareholders, the Company’s shareholders, upon the recommendation of the Board of Directors, approved the amendment and restatement of the Jamba, Inc. 2013 Equity Incentive Plan (the “2013 Equity Plan”). The 2013 Equity Plan amended and restated the existing 2013 Equity Plan adopted in May 2013. The 2013 Equity Plan authorizes the Company to provide incentive compensation in the form of stock options, stock appreciation rights, restricted stock and stock units, performance shares and units, other stock-based awards, cash-based awards and deferred compensation awards. The 2013 Equity Plan authorizes the issuance of up to 3,028,847 shares. The following table sets forth information regarding outstanding options and shares reserved for future issuance under the foregoing plans as of January 3, 2017.
|
Plan Category |
|
Number of shares to be issued upon exercise of outstanding options (a) |
|
|
Weighted- average exercise price of outstanding options ($) (b) |
|
|
Number of shares remaining available for future issuance under equity compensation plans (excluding shares reflected in column)(2) (c) |
|
|||
|
Equity compensation plans approved by shareholders |
|
|
953,774 |
|
|
|
13.91 |
|
|
|
1,416,801 |
|
|
Equity compensation plans not approved by shareholders(1) |
|
|
245,848 |
|
|
|
6.55 |
|
|
— |
|
|
|
Total |
|
|
1,199,622 |
|
|
|
|
|
|
|
1,416,801 |
|
|
(1) |
Represents shares outstanding under an option to purchase 300,000 shares of our Common Stock granted to Mr. White, as well as 105,000 shares of our Common Stock granted to executives outside of our equity incentive plans. The grants of these options did not require approval by our shareholders due to their qualification under the “inducement grant exception” provided by Nasdaq Listing Rule 5635(c)(4). |
|
(2) |
Includes 842,120 available for future issuance under the 2013 Equity Plan. |
Certain Relationships and Related Party Transactions
The Company has entered into indemnity agreements with certain officers and directors which provide, among other things, that Jamba will indemnify such officer or director, under the circumstances and to the extent provided for therein, for expenses, damages, judgments, fines and settlements he or she may be required to pay in actions or proceedings which he or she is or may be made a party by reason of his or her position as a director, officer or other agent of Jamba, and otherwise to the fullest extent permitted under Delaware law and our Bylaws.
Other than the foregoing, there were no relationships or related party transactions in the fiscal year ended January 3, 2017 requiring disclosure.
Director Independence
The Board of Directors has determined that, except for David Pace, each of the Company director nominees standing for election has no relationship which, in the opinion of the Board of Directors, would interfere with the exercise of independent judgment in carrying out the responsibilities of a director and is an “independent director” as defined by the applicable NASDAQ rules and the rules and regulations of the Securities and Exchange Commission (the “SEC”). In determining the independence of our directors, the Board of Directors has adopted the independence standards that mirror the criteria specified by applicable law and regulations of the SEC and the NASDAQ.
90
The following table sets forth the aggregate fees billed to the Company for the fiscal year ended January 3, 2017 and fiscal year ended December 29, 2015 by its independent registered public accounting firm, KPMG LLP:
|
|
|
Fiscal 2016 (53 weeks) |
|
|
Fiscal 2015 (52 weeks) |
|
||
|
Audit Fees(1) |
|
$ |
5,465,829 |
|
|
$ |
1,349,755 |
|
|
Audit-Related Fees(2) |
|
|
— |
|
|
|
25,000 |
|
|
Tax Fees |
|
|
— |
|
|
|
— |
|
|
All Other Fees |
|
|
— |
|
|
|
— |
|
|
Total Fees |
|
$ |
5,465,829 |
|
|
$ |
1,374,755 |
|
|
(1) |
Audit fees consist of fees billed for professional services rendered for the audit of the Company’s consolidated annual financial statements and review of the interim consolidated financial statements included in quarterly reports and services that are normally provided by our independent registered public accountants in connection with statutory and regulatory filings or engagements. |
|
(2) |
Audit-related fees consist of fees billed for assurance and related services that are reasonably related to the performance of the audit or review of the Company’s consolidated financial statements and are not reported under “Audit Fees.” |
The Audit Committee has considered whether the provisions of services described in the table above are compatible with maintaining auditor independence. Unless a type of service has received general pre-approval, it will require separate pre-approval by the Audit Committee. The Audit Committee has delegated its pre-approval authority to its Chairman, provided the Chairman reports any pre-approval decisions to the full Audit Committee at its next regularly scheduled meeting. The independent registered public accounting firm and management are required to periodically report to the Audit Committee regarding the extent of services provided by the independent registered public accounting firm in accordance with this pre-approval process. During Fiscal 2016 and Fiscal 2015, all fees paid to our independent auditors were pre-approved in accordance with this policy without exception.
91
Documents filed as part of this Annual Report:
(a) List of Financial Statements
The following consolidated financial statements are included herein in Part II, Item 8 of this Annual Report on Form 10-K:
|
|
F-1 |
|
|
Consolidated Balance Sheets at January 3, 2017 and December 29, 2015; |
|
F-2 |
|
|
F-3 |
|
|
|
F-4 |
|
|
|
F-5 |
|
|
|
F-6 |
(2) Exhibits
The following exhibits are filed as part of this Annual Report or are incorporated herein by reference:
92
|
Exhibit Number |
|
Description |
|
|
|
Form |
|
File No. |
|
Exhibit |
|
Filing Date |
|
Filed Herewith |
|
|
|
|
|
|
|
|
|
|
|
|
|
|
|
|
|
3.1 |
|
Amended and Restated Certificate of Incorporation of the Company |
|
|
|
8-K |
|
001-32552 |
|
3.1 |
|
December 5, 2006 |
|
|
|
|
|
|
|
|
|
|
|
|
|
|
|
|
|
|
|
3.2 |
|
Certificate of Amendment to Amended and Restated Certificate of Incorporation of the Company |
|
|
|
8-K |
|
001-32552 |
|
3.2 |
|
December 5, 2006 |
|
|
|
|
|
|
|
|
|
|
|
|
|
|
|
|
|
|
|
3.3 |
|
Certificate of Amendment to Amended and Restated Certificate of Incorporation of the Company |
|
|
|
8-K |
|
001-32552 |
|
3.1 |
|
May 31, 2013 |
|
|
|
|
|
|
|
|
|
|
|
|
|
|
|
|
|
|
|
3.4 |
|
|
|
|
8-K |
|
001-32552 |
|
3.1 |
|
April 3, 2015 |
|
|
|
|
|
|
|
|
|
|
|
|
|
|
|
|
|
|
|
|
3.5 |
|
|
|
|
8-K |
|
001-32552 |
|
3.1 |
|
August 17, 2010 |
|
|
|
|
|
|
|
|
|
|
|
|
|
|
|
|
|
|
|
|
4.1 |
|
|
|
|
S-1 |
|
333-122812 |
|
4.2 |
|
February 14, 2005 |
|
|
|
|
|
|
|
|
|
|
|
|
|
|
|
|
|
|
|
|
4.2 |
|
Registration Rights Agreement dated June 16, 2009 between Jamba, Inc., the Investors and North Point |
|
|
|
8-K |
|
001-32552 |
|
4.1 |
|
June 17, 2009 |
|
|
|
|
|
|
|
|
|
|
|
|
|
|
|
|
|
|
|
10.1 |
|
|
|
|
8-K |
|
001-32552 |
|
10.1 |
|
December 5, 2006 |
|
|
|
|
|
|
|
|
|
|
|
|
|
|
|
|
|
|
|
|
10.2 |
|
Form of Distribution Agreement by and between Jamba Juice Company and various suppliers |
|
|
|
8-K |
|
001-32552 |
|
10.4 |
|
December 5, 2006 |
|
|
|
|
|
|
|
|
|
|
|
|
|
|
|
|
|
|
|
10.3 |
|
|
|
|
8-K |
|
001-32552 |
|
10.16 |
|
December 5, 2006 |
|
|
|
|
|
|
|
|
|
|
|
|
|
|
|
|
|
|
|
|
10.4 |
|
|
|
|
8-K |
|
001-32552 |
|
10.17 |
|
December 5, 2006 |
|
|
|
|
|
|
|
|
|
|
|
|
|
|
|
|
|
|
|
|
10.5 |
|
Jamba, Inc. Amended and Restated 2006 Employee, Director and Consultant Stock Plan** |
|
|
|
DEF14A |
|
001-32552 |
|
Annex A |
|
April 1, 2010 |
|
|
|
|
|
|
|
|
|
|
|
|
|
|
|
|
|
|
|
10.6 |
|
|
|
|
10-Q |
|
001-32552 |
|
10.2 |
|
August 17, 2011 |
|
|
|
|
|
|
|
|
|
|
|
|
|
|
|
|
|
|
|
|
10.7 |
|
Form of Non-Qualified Stock Option Agreement under the 2006 Plan** |
|
|
|
10-Q |
|
001-32552 |
|
10.3 |
|
August 17, 2011 |
|
|
|
|
|
|
|
|
|
|
|
|
|
|
|
|
|
|
|
10.8 |
|
Form of Restricted Stock Units Agreement under the 2006 Plan** |
|
|
|
10-Q |
|
001-32552 |
|
10.4 |
|
August 17, 2011 |
|
|
|
|
|
|
|
|
|
|
|
|
|
|
|
|
|
|
|
10.9 |
|
|
|
|
DEF14A |
|
001-32552 |
|
Annex B |
|
April 1, 2010 |
|
|
|
|
|
|
|
|
|
|
|
|
|
|
|
|
|
|
|
|
10.10 |
|
|
|
|
10-K |
|
001-32552 |
|
10.11 |
|
March 7, 2013 |
|
|
|
|
|
|
|
|
|
|
|
|
|
|
|
|
|
|
|
|
10.11 |
|
|
|
|
10-K |
|
001-32552 |
|
10.12 |
|
March 7, 2013 |
|
|
93
|
Exhibit Number |
|
Description |
|
|
|
Form |
|
File No. |
|
Exhibit |
|
Filing Date |
|
Filed Herewith |
|
|
|
|
|
|
|
|
|
|
|
|
|
|
|
|
|
10.12 |
|
|
|
|
8-K |
|
001-32552 |
|
10.1 |
|
October 14, 2008 |
|
|
|
|
|
|
|
|
|
|
|
|
|
|
|
|
|
|
|
|
10.13 |
|
|
|
|
8-K |
|
001-32552 |
|
10.1 |
|
December 21, 2010 |
|
|
|
|
|
|
|
|
|
|
|
|
|
|
|
|
|
|
|
|
10.14 |
|
|
|
|
8-K |
|
001-32552 |
|
10.1 |
|
May 16, 2013 |
|
|
|
|
|
|
|
|
|
|
|
|
|
|
|
|
|
|
|
|
10.15 |
|
Form of Notice of Grant of Stock Option under 2013 Equity Incentive Plan** |
|
|
|
8-K |
|
001-32552 |
|
10.2 |
|
May 16, 2013 |
|
|
|
|
|
|
|
|
|
|
|
|
|
|
|
|
|
|
|
10.16 |
|
Form of Stock Option Agreement under 2013 Equity Incentive Plan** |
|
|
|
8-K |
|
001-32552 |
|
10.3 |
|
May 16, 2013 |
|
|
|
|
|
|
|
|
|
|
|
|
|
|
|
|
|
|
|
10.17 |
|
Form of Notice of Grant of Restricted Stock under 2013 Equity Incentive Plan** |
|
|
|
8-K |
|
001-32552 |
|
10.4 |
|
May 16, 2013 |
|
|
|
|
|
|
|
|
|
|
|
|
|
|
|
|
|
|
|
10.18 |
|
Form of Restricted Stock Agreement under 2013 Equity Incentive Plan** |
|
|
|
8-K |
|
001-32552 |
|
10.5 |
|
May 16, 2013 |
|
|
|
|
|
|
|
|
|
|
|
|
|
|
|
|
|
|
|
10.19 |
|
Form of Notice of Grant of Restricted Stock Unit under 2013 Equity Incentive Plan** |
|
|
|
8-K |
|
001-32552 |
|
10.6 |
|
May 16, 2013 |
|
|
|
|
|
|
|
|
|
|
|
|
|
|
|
|
|
|
|
10.20 |
|
Form of Restricted Stock Unit Agreement under 2013 Equity Incentive Plan** |
|
|
|
8-K |
|
001-32552 |
|
10.7 |
|
May 16, 2013 |
|
|
|
|
|
|
|
|
|
|
|
|
|
|
|
|
|
|
|
10.21 |
|
|
|
|
10-Q |
|
001-32552 |
|
10.9 |
|
August 6, 2013 |
|
|
|
|
|
|
|
|
|
|
|
|
|
|
|
|
|
|
|
|
10.22 |
|
Nonemployee Director Restricted Stock Unit Deferral Program and Election Notice |
|
|
|
10-Q |
|
001-32552 |
|
10.1 |
|
August 11, 2014 |
|
|
|
|
|
|
|
|
|
|
|
|
|
|
|
|
|
|
|
10.23 |
|
|
|
|
10-Q |
|
001-32552 |
|
10.1 |
|
August 10, 2015 |
|
|
|
|
|
|
|
|
|
|
|
|
|
|
|
|
|
|
|
|
10.24 |
|
|
|
|
8-K |
|
001-32552 |
|
10.1 |
|
October 2, 2015 |
|
|
|
|
|
|
|
|
|
|
|
|
|
|
|
|
|
|
|
|
10.25 |
|
|
|
|
10-Q |
|
001-32552 |
|
10.1 |
|
November 9, 2015 |
|
|
|
|
|
|
|
|
|
|
|
|
|
|
|
|
|
|
|
|
10.26 |
|
|
|
|
10-Q |
|
001-32552 |
|
10.1 |
|
May 6, 2016 |
|
|
94
|
Exhibit Number |
|
Description |
|
|
|
Form |
|
File No. |
|
Exhibit |
|
Filing Date |
|
Filed Herewith |
|
|
|
|
|
|
|
|
|
|
|
|
|
|
|
|
|
10.26 |
|
Jamba, Inc. 2013 Equity Incentive Plan (As Amended and Restated May 17, 2016)** |
|
|
|
8-K |
|
001-32552 |
|
10.1 |
|
May 20, 2016 |
|
|
|
|
|
|
|
|
|
|
|
|
|
|
|
|
|
|
|
10.27 |
|
|
|
|
10-Q |
|
001-32552 |
|
10.1 |
|
August 5, 2016 |
|
|
|
|
|
|
|
|
|
|
|
|
|
|
|
|
|
|
|
|
10.29 |
|
Employment Agreement dated May 2, 2016, by and between Jamba Juice Company and Marie Perry** |
|
|
|
10-Q |
|
001-32552 |
|
10.2 |
|
August 5, 2016 |
|
|
|
|
|
|
|
|
|
|
|
|
|
|
|
|
|
|
|
10.30 |
|
|
|
|
10-Q |
|
001-32552 |
|
10.4 |
|
August 5, 2016 |
|
|
|
|
|
|
|
|
|
|
|
|
|
|
|
|
|
|
|
|
10.31 |
|
|
|
|
10-Q |
|
001-32552 |
|
10.5 |
|
August 5, 2016 |
|
|
|
|
|
|
|
|
|
|
|
|
|
|
|
|
|
|
|
|
10.32 |
|
|
|
|
10-Q |
|
001-32552 |
|
10.6 |
|
August 5, 2016 |
|
|
|
|
|
|
|
|
|
|
|
|
|
|
|
|
|
|
|
|
10.33 |
|
|
|
|
10-Q |
|
001-32552 |
|
10.7 |
|
August 5, 2016 |
|
|
|
|
|
|
|
|
|
|
|
|
|
|
|
|
|
|
|
|
10.34 |
|
Form of Jamba, Inc. Inducement Award Non-Statutory Stock Option Agreement (Non-Plan Award)** |
|
|
|
10-Q |
|
001-32552 |
|
10.8 |
|
August 5, 2016 |
|
|
|
|
|
|
|
|
|
|
|
|
|
|
|
|
|
|
|
10.35 |
|
|
|
|
10-Q |
|
001-32552 |
|
10.9 |
|
August 5, 2016 |
|
|
|
|
|
|
|
|
|
|
|
|
|
|
|
|
|
|
|
|
10.36 |
|
Form of Jamba, Inc. Inducement Award Time-Based Restricted Stock Units Agreement (Non-Plan Award)** |
|
|
|
10-Q |
|
001-32552 |
|
10.10 |
|
August 5, 2016 |
|
|
|
|
|
|
|
|
|
|
|
|
|
|
|
|
|
|
|
10.37 |
|
|
|
|
10-Q |
|
001-32552 |
|
10.11 |
|
August 5, 2016 |
|
|
|
|
|
|
|
|
|
|
|
|
|
|
|
|
|
|
|
|
10.38 |
|
|
|
|
10-Q |
|
001-32552 |
|
10.12 |
|
August 5, 2016 |
|
|
|
|
|
|
|
|
|
|
|
|
|
|
|
|
|
|
|
|
10.39 |
|
|
|
|
10-Q |
|
001-32552 |
|
10.1 |
|
November 7, 2016 |
|
|
95
|
Exhibit Number |
|
Description |
|
|
|
Form |
|
File No. |
|
Exhibit |
|
Filing Date |
|
Filed Herewith |
|
|
|
|
|
|
|
|
|
|
|
|
|
|
|
|
|
10.40 |
|
|
|
|
|
|
|
|
|
|
|
|
X |
|
|
|
|
|
|
|
|
|
|
|
|
|
|
|
|
|
|
10.41 |
|
|
|
|
|
|
|
|
|
|
|
|
X |
|
|
|
|
|
|
|
|
|
|
|
|
|
|
|
|
|
|
21.1 |
|
|
|
|
|
|
|
|
|
|
|
|
X |
|
|
|
|
|
|
|
|
|
|
|
|
|
|
|
|
|
|
23.1 |
|
Consent of Independent Registered Public Accounting Firm-KPMG LLP |
|
|
|
|
|
|
|
|
|
|
|
X |
|
|
|
|
|
|
|
|
|
|
|
|
|
|
|
|
|
24 |
|
|
|
|
|
|
|
|
|
|
|
|
X |
|
|
|
|
|
|
|
|
|
|
|
|
|
|
|
|
|
|
31.1 |
|
|
|
|
|
|
|
|
|
|
|
|
X |
|
|
|
|
|
|
|
|
|
|
|
|
|
|
|
|
|
|
31.2 |
|
|
|
|
|
|
|
|
|
|
|
|
X |
|
|
|
|
|
|
|
|
|
|
|
|
|
|
|
|
|
|
32.1 |
|
|
|
|
|
|
|
|
|
|
|
|
X |
|
|
|
|
|
|
|
|
|
|
|
|
|
|
|
|
|
|
32.2 |
|
|
|
|
|
|
|
|
|
|
|
|
X |
|
|
|
|
|
|
|
|
|
|
|
|
|
|
|
|
|
|
101.INS |
|
XBRL Instance Document |
|
|
|
|
|
|
|
|
|
|
|
X |
|
|
|
|
|
|
|
|
|
|
|
|
|
|
|
|
|
101.SCH |
|
XBRL Taxonomy Extension Schema Document |
|
|
|
|
|
|
|
|
|
|
|
X |
|
|
|
|
|
|
|
|
|
|
|
|
|
|
|
|
|
101.CAL |
|
XBRL Taxonomy Extension Calculation Linkbase Document |
|
|
|
|
|
|
|
|
|
|
|
X |
|
|
|
|
|
|
|
|
|
|
|
|
|
|
|
|
|
101.DEF |
|
XBRL Taxonomy Extension Definition Linkbase Document |
|
|
|
|
|
|
|
|
|
|
|
X |
|
|
|
|
|
|
|
|
|
|
|
|
|
|
|
|
|
101.LAB |
|
XBRL Taxonomy Extension Label Linkbase Document |
|
|
|
|
|
|
|
|
|
|
|
X |
|
|
|
|
|
|
|
|
|
|
|
|
|
|
|
|
|
101.PRE |
|
XBRL Taxonomy Extension Presentation Linkbase Document |
|
|
|
|
|
|
|
|
|
|
|
X |
|
* |
This exhibit (or portions thereof) has been filed separately with the Securities and Exchange Commission pursuant to an application for confidential treatment. The confidential portions of this exhibit have been omitted and are marked by an asterisk. |
|
** |
Management contract, or compensatory plan or arrangement. |
96
(3) Schedules to Financial Statements: Schedule II
All other financial statement schedules have been omitted because they are either inapplicable or the information required is provided in the Company’s Consolidated Financial Statements and Notes thereto or included in Part II, Item 8 of this Annual Report on Form 10-K.
97
Pursuant to the requirements of Section 13 or 15(d) of the Securities Exchange Act of 1934, the registrant has duly caused this report to be signed on its behalf by the undersigned, thereunto duly authorized, in the City of Frisco, State of Texas, on the 9th day of February 2018.
|
JAMBA, INC. |
||
|
|
|
|
|
By: |
|
/s/ David A. Pace |
|
|
|
David A. Pace |
|
|
|
Chief Executive Officer |
98
We the undersigned officers and directors of Jamba, Inc., hereby severally constitute and appoint David A. Pace and Marie L. Perry, or either of them, his attorneys-in-fact, for such person in any and all capacities, to sign any amendments to this report and to file the same, with exhibits thereto, and other documents in connection therewith, with the Securities and Exchange Commission, hereby ratifying and confirming all that either of said attorneys-in-fact, or substitute or substitutes, may do or cause to be done by virtue hereof.
Pursuant to the requirements of the Securities Exchange Act of 1934, this report has been signed below by the following persons on behalf of the registrant and in the capacities and on the dates indicated.
|
Name |
|
Title |
|
Date |
|
/s/ David A. Pace David A. Pace |
|
Chief Executive Officer, Director (Principal Executive Officer) |
|
February 9, 2018 |
|
|
|
|
|
|
|
/s/ Marie L. Perry Marie L. Perry |
|
Chief Financial Officer, Chief Administrative Officer, Executive Vice President and Secretary (Principal Financial Officer and Principal Accounting Officer) |
|
February 9, 2018 |
|
|
|
|
|
|
|
/s/ Michael A. Depatie Michael A. Depatie |
|
Director |
|
February 9, 2018
|
|
|
|
|
|
|
|
/s/ Lorna Donatone Lorna Donatone |
|
Director |
|
February 9, 2018
|
|
|
|
|
|
|
|
/s/ Richard L. Federico Richard L. Federico |
|
Director |
|
February 9, 2018
|
|
|
|
|
|
|
|
/s/ Andrew Heyer Andrew Heyer
|
|
Director |
|
February 9, 2018
|
|
/s/ James C. Pappas James C. Pappas |
|
Director |
|
February 9, 2018
|
|
|
|
|
|
|
|
/s/ Glenn W. Welling Glenn W. Welling |
|
Director |
|
February 9, 2018
|
99
SCHEDULE II
VALUATION AND QUALIFYING ACCOUNTS
Years Ended January 3, 2017, December 29, 2015 and December 30, 2014
(In thousands)
Allowance for Doubtful Accounts
|
|
|
Balance at the Beginning of the Period |
|
|
Charged to Expenses |
|
|
Charged (Credited) to Other Accounts |
|
|
Deductions |
|
|
Balance at the End of the Period |
|
|||||
|
Year ended January 3, 2017 |
|
$ |
618 |
|
|
$ |
1,560 |
|
|
$ |
— |
|
|
$ |
(370 |
) |
|
$ |
1,808 |
|
|
Year ended December 29, 2015 |
|
$ |
280 |
|
|
$ |
741 |
|
|
$ |
— |
|
|
$ |
(403 |
) |
|
$ |
618 |
|
|
Year ended December 30, 2014 |
|
$ |
291 |
|
|
$ |
54 |
|
|
$ |
— |
|
|
$ |
(65 |
) |
|
$ |
280 |
|
100