Attached files
| file | filename |
|---|---|
| 8-K - 8-K - TTM TECHNOLOGIES INC | d534744d8k.htm |

|
TTM Technologies, Inc.Lenders PresentationFebruary 2018Exhibit 99.1
|
DisclaimersForward-Looking StatementsThis communication may contain “forward-looking statements” within the meaning of the Private Securities Litigation Reform Act of 1995, including statements related to the future business outlook, events, and expectedperformance of TTM Technologies, Inc. (“TTM”, “we” or the “Company”). The words “anticipate,” “believe,” “plan,” “forecast,” “foresee,” “estimate,” “project,” “expect,” “seek,” “target,” “intend,” “goal” and other similar expressions,among others, generally identify “forward-looking statements,” which speak only as of the date the statements were made and are not guarantees of performance. Actual results may differ materially from these forward-lookingstatements. These statements reflect the current beliefs, expectations and assumptions of the management of TTM, and we believe such statements to have a reasonable basis.It is uncertain whether any of the events anticipated by the forward-looking statements will transpire or occur, or if any of them do, what impact they will have on the results of operations and financial condition of the Company.These forward-looking statements are based on assumptions that may not materialize, and involve certain risks and uncertainties, many of which are beyond our control, that could cause actual events or performance to differmaterially from those indicated in such forward-looking statements. Factors, risks, trends, and uncertainties that could cause actual results to differ materially from those projected, anticipated, or implied in forward-lookingstatements include, but are not limited to, TTM’s ability to successfully complete the acquisition of Anaren Holding Corp. (“Anaren”) (the “Acquisition”) on a timely basis, including receipt of required regulatory approvals andsatisfaction of other conditions; the conditions of the credit markets and TTM’s ability to issue debt to fund the transaction on acceptable terms; if the transaction is completed, the ability to retain Anaren’s customers andemployees, the ability to successfully integrate Anaren’s operations, product lines, technology and employees into TTM’s operations, and the ability to achieve the expected synergies as well as accretion in earnings, demandfor our products, market pressures on prices of our products, warranty claims, changes in product mix, contemplated significant capital expenditures and related financing requirements, our dependence upon a small number ofcustomers, and other factors set forth in the Company’s most recent Annual Report on Form 10-K and Quarterly Report on Form 10-Q and in the Company’s other filings filed with the Securities and Exchange Commission (the“SEC”), including under the heading “Risk Factors”, and which are available at the SEC’s website at www.sec.gov.None of Anaren, its affiliates or their respective representatives assume any responsibility for, or makes any representation or warranty, express or implied, (and they expressly disclaim any such representation or warranty andany liability related thereto) as to the accuracy, adequacy or completeness of the information contained in this communication or any other written or oral communication transmitted or made available to any person inconnection with this communication.TTM does not undertake any obligation to update any of these statements to reflect any new information, subsequent events or circumstances, or otherwise, except as may be required by law, even if experience or futurechanges make it clear that any projected results expressed in this communication or future communications to stockholders, press releases or Company statements will not be realized. In addition, the inclusion of any statementin this communication does not constitute an admission by us that the events or circumstances described in such statement are material.Use of Non-GAAP Financial MeasuresIn addition to the financial statements presented in accordance with U.S. generally accepted accounting principles (“GAAP”), TTM uses certain non-GAAP financial measures, including EBITDA, Adjusted EBITDA, Non-GAAPOperating Income, Non-GAAP Operating Margin, Non-GAAP EPS and Free Cash Flow. We present non-GAAP financial information to enable investors to seeTTM through the eyes of management and to provide better insight into our ongoing financial performance.A material limitation associated with the use of the above non-GAAP financial measures is that they have no standardized measurement prescribed by GAAP and may not be comparable to similar non-GAAP financialmeasures used by other companies. We compensate for these limitations by providing full disclosure of each non-GAAP financial measure and reconciliation to the most directly comparable GAAP financial measure. However,the non-GAAP financial measures should not be considered in isolation from, or as a substitute for, financial information prepared in accordance with GAAP.See Appendix for reconciliations of Adjusted EBITDA and Non-GAAP Operating Income to the most comparable GAAP metric. With respect to the Company’s outlook for non-GAAP earnings per share, we are unable to predictwith reasonable certainty or without unreasonable effort certain items that may affect such measure calculated and presented in accordance with GAAP. Our expected non-GAAP earnings per share excludes primarily thefuture impact of restructuring actions, impairment charges, unusual gains and losses, and tax adjustments. These reconciling items are highly variable and difficult to predict due to various factors outside of management’scontrol and could have a material impact on our future period earnings per share calculated and presented in accordance with GAAP. Accordingly, a reconciliation of non-GAAP earnings per share to such measure calculatedand presented in accordance with GAAP is not available without unreasonable effort and has not been provided.Data Used in This PresentationDue to rounding, numbers presented throughout this and other documents may not add up precisely to the totals provided and percentages may not precisely reflect the absolute figures.Third Party InformationThis presentation has been prepared by the Company and includes information from other sources believed by the Company to be reliable. No representation or warranty, express or implied, is made as to the fairness,accuracy or completeness of any of the opinions and conclusions set forth herein based on such information. This presentation may contain descriptions or summaries of certain documents and agreements, but suchdescriptions or summaries are qualified in their entirety by reference to the actual documents or agreements. Unless otherwise indicated, the information contained herein speaks only as of the date hereof and is subject tochange, completion or amendment without notice.
|
Agenda• Transaction Overview Sean Lynch, Barclays• TTM and Anaren at a Glance Tom Edman, CEO• Key Credit Highlights Tom Edman, CEO• TTM Recent Performance Highlights and Financial Policy Todd Schull, CFO• Syndication Overview Sean Lynch, Barclays• Appendix3
|
Transaction Overview4
|
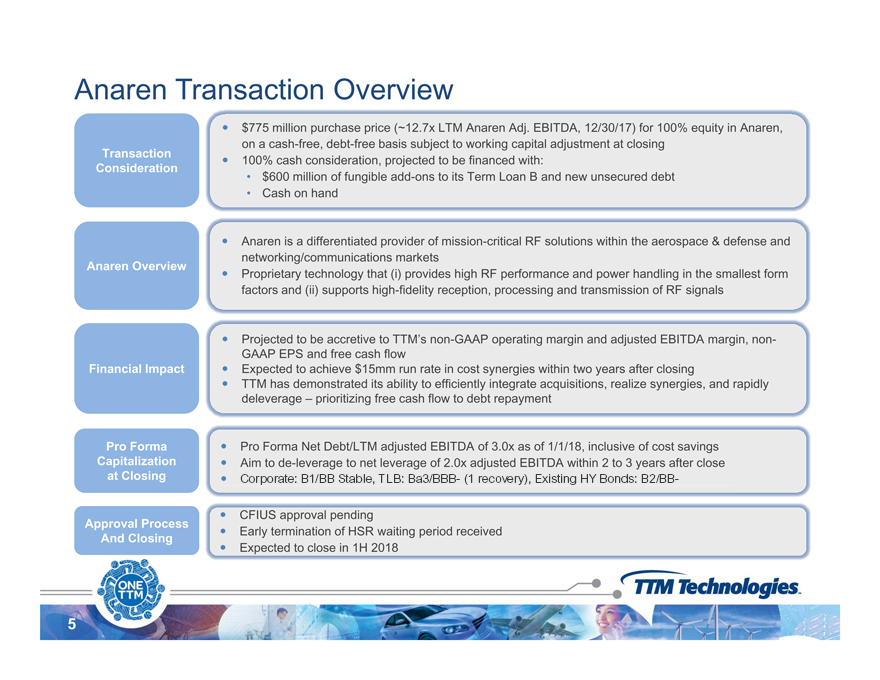
Anaren Transaction Overviewï,— $775 million purchase price (~12.7x LTM Anaren Adj. EBITDA, 12/30/17) for 100% equity in Anaren,on a cash-free, debt-free basis subject to working capital adjustment at closingï,— 100% cash consideration, projected to be financed with:• $600 million of fungible add-ons to its Term Loan B and new unsecured debt• Cash on handTransactionConsiderationï,— Anaren is a differentiated provider of mission-critical RF solutions within the aerospace & defense andnetworking/communications marketsï,— Proprietary technology that (i) provides high RF performance and power handling in the smallest formfactors and (ii) supports high-fidelity reception, processing and transmission of RF signalsAnaren Overviewï,— Projected to be accretive to TTM’s non-GAAP operating margin and adjusted EBITDA margin, non-GAAP EPS and free cash flowï,— Expected to achieve $15mm run rate in cost synergies within two years after closingï,— TTM has demonstrated its ability to integrate acquisitions synergies Financial Impactefficiently acquisitions, realize synergies, and rapidlydeleverage – prioritizing free cash flow to debt repaymentï,— Pro Forma Net Debt/LTM adjusted EBITDA of 3.0x as of 1/1/18, inclusive of cost savingsï,— Aim de leverage to net leverage of 2 0x closePro FormaCapitalizationï,— CFIUS approval pendingï,— Early termination of HSR waiting period receivedï,— Expected to close in 1H 2018Approval ProcessAnd Closingat Closing to de-2.0x adjusted EBITDA within 2 to 3 years after 5p Corporate: B1/BB stable, tlb: Ba3/BBB-(1 recovery), Existing HY Bands: B2/BB
|
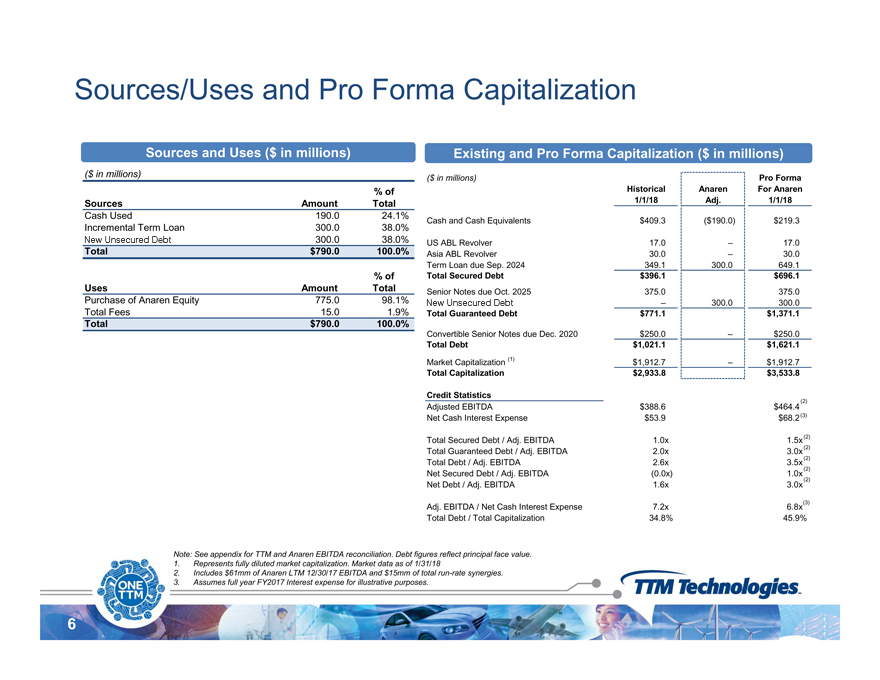
Sources/Uses and Pro Forma CapitalizationSources and Uses ($ in millions) Existing and Pro Forma Capitalization ($ in millions)($ in millions) Pro FormaHistorical Anaren For Anaren1/1/18 Adj. 1/1/18($ in millions)% ofSources Amount TotalCash and Cash Equivalents $409.3 ($190.0) $219.3US ABL Revolver 17.0 – 17.0Asia ABL Revolver 30.0 – 30.0Term Loan due Sep. 2024 349.1 300.0 649.1Total Secured Debt $396.1 $696.1Senior Notes due Oct. 2025 375.0 375.0Cash Used 190.0 24.1%Incremental Term Loan 300.0 38.0%Add-on Senior Notes 300.0 38.0%Total $790.0 100.0%% ofUses Amount TotalP h fA E it 775 0 98 1% Add-on Senior Notes – 300.0 300.0Total Guaranteed Debt $771.1 $1,371.1Convertible Senior Notes due Dec. 2020 $250.0 – $250.0Total Debt $1,021.1 $1,621.1Market Capitalization (1) $1,912.7 – $1,912.7Total Capitalization $2,933.8 $3,533.8Purchase of Anaren Equity 775.0 98.1%Total Fees 15.0 1.9%Total $790.0 100.0%(3)(2)(2)(2)(2)(2)Credit StatisticsAdjusted EBITDA $388.6 $464.4Net Cash Interest Expense $53.9 $68.2Total Secured Debt / Adj. EBITDA 1.0x 1.5xTotal Guaranteed Debt / Adj. EBITDA 2.0x 3.0xTotal Debt / Adj. EBITDA 2.6x 3.5xAnaren EBITDA reconciliation Debt figures reflect principal value(3)(2)Net Secured Debt / Adj. EBITDA (0.0x) 1.0xNet Debt / Adj. EBITDA 1.6x 3.0xAdj. EBITDA / Net Cash Interest Expense 7.2x 6.8xTotal Debt / Total Capitalization 34.8% 45.9%6Note: See appendix for TTM and reconciliation. face value.1. Represents fully diluted market capitalization. Market data as of 1/31/182. Includes $61mm of Anaren LTM 12/30/17 EBITDA and $15mm of total run-rate synergies.3. Assumes full year FY2017 Interest expense for illustrative purposes.New unsecured Debt New unsecured Debt
|
TTM and Anaren at a Glance7
|
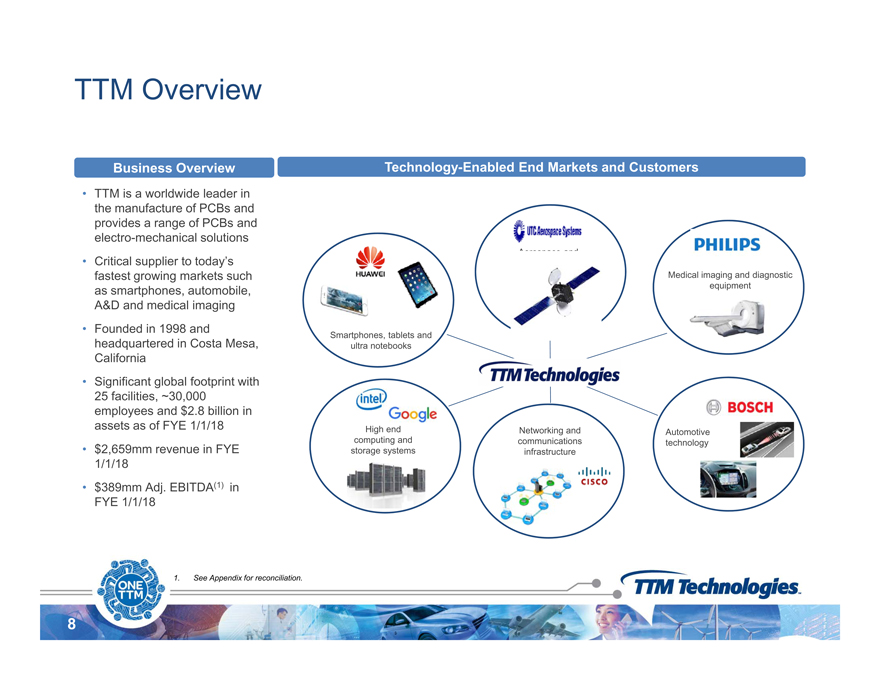
TTM Overview• TTM is a worldwide leader inBusiness Overview Technology-Enabled End Markets and Customersthe manufacture of PCBs andprovides a range of PCBs andelectro-mechanical solutions• Critical supplier to today’sfastest growing markets suchas smartphones, automobile,Aerospace anddefenseMedical imaging and diagnosticequipmentA&D and medical imaging• Founded in 1998 andheadquartered in Costa Mesa,California• Smartphones, tablets andultra notebooksSignificant global footprint with25 facilities, ~30,000employees and $2.8 billion inassets as of FYE 1/1/18• $2,659mm revenue in FYE1/1/18AutomotivetechnologyHigh endcomputing andstorage systemsNetworking andcommunicationsinfrastructure• $389mm Adj. EBITDA(1) inFYE 1/1/181. See Appendix for reconciliation.8
|
Strategic Rationale P id i i dd i ti db d d tTTM’s acquisition of Anaren is expected to…Provide RF engineering and design expertise and broaden our productportfolio Drive us into earlier and deeper engagement with customers Enhance revenue synergy opportunities in our diverse end markets Improve our financial profile9
|
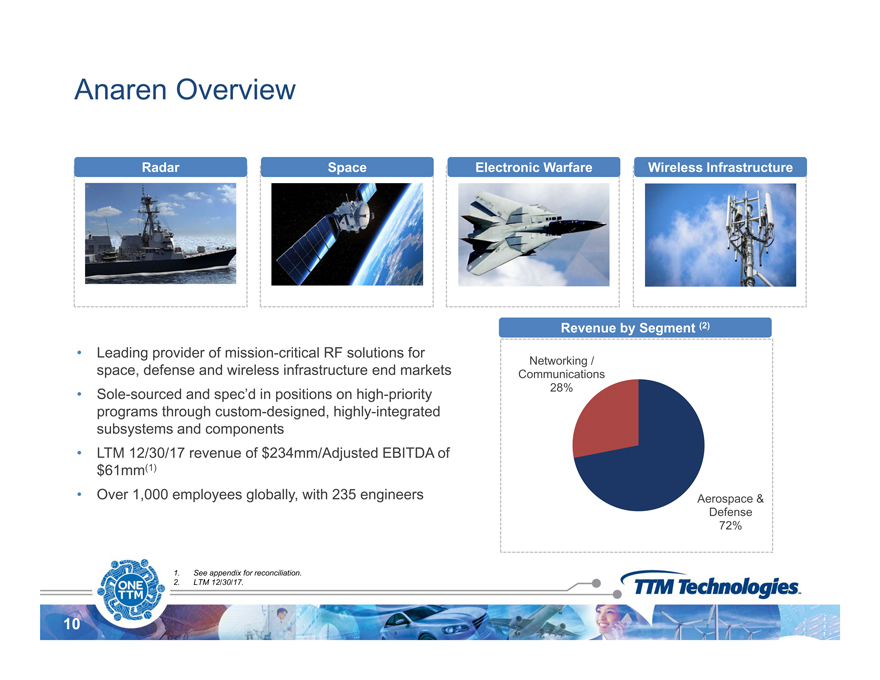
Anaren OverviewRadar Space Electronic Warfare Wireless InfrastructureNetworking /Communications• Leading provider of mission-critical RF solutions forspace, defense and wireless infrastructure end marketsRevenue by Segment (2)• Sole-sourced and spec’d in positions on high-priority 28%programs through custom-designed, highly-integratedsubsystems and components• LTM 12/30/17 revenue of $234mm/Adjusted EBITDA of$61mm(1)Aerospace &Defense72%• Over 1,000 employees globally, with 235 engineers101. See appendix for reconciliation.2. LTM 12/30/17.
|
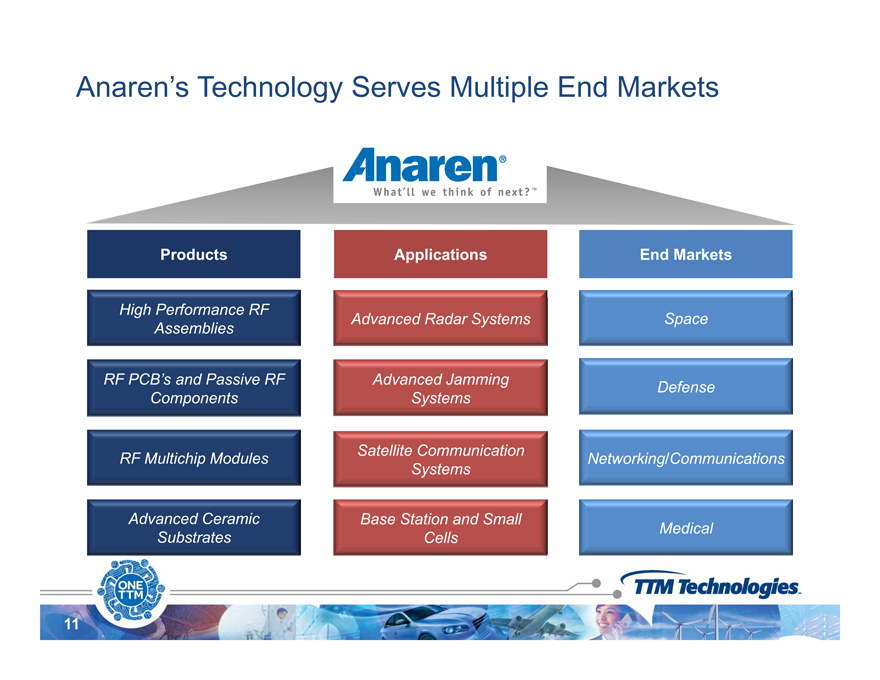
Anaren’s Technology Serves Multiple End Markets
|
Key Credit Highlights12
|
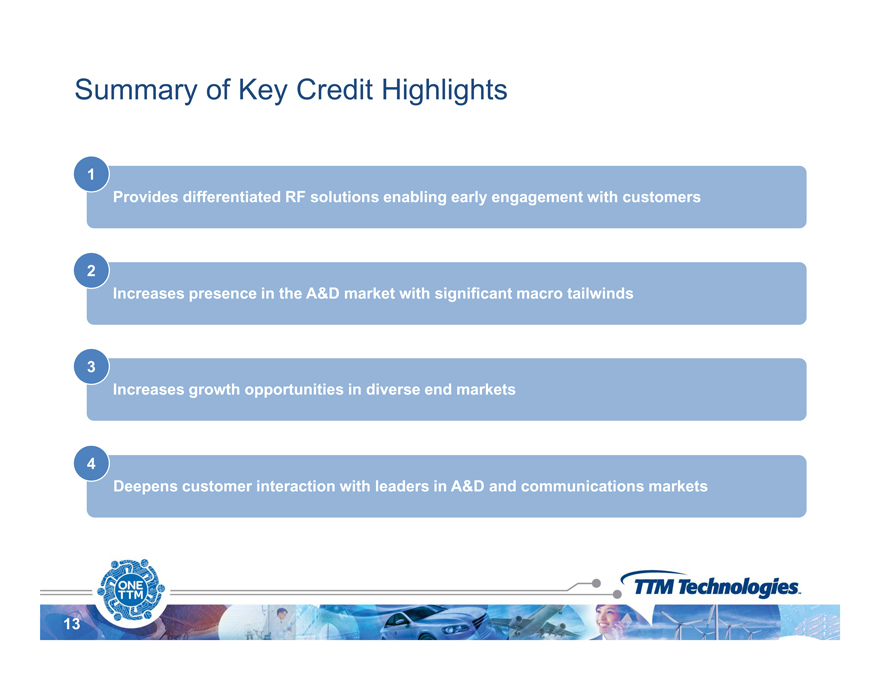
Summary of Key Credit HighlightsProvides differentiated RF solutions enabling early engagement with customers1Increases D significant macro tailwinds2presence in the A&market with 3Increases growth opportunities in diverse end markets4Deepens customer interaction with leaders in A&D and communications markets13
|
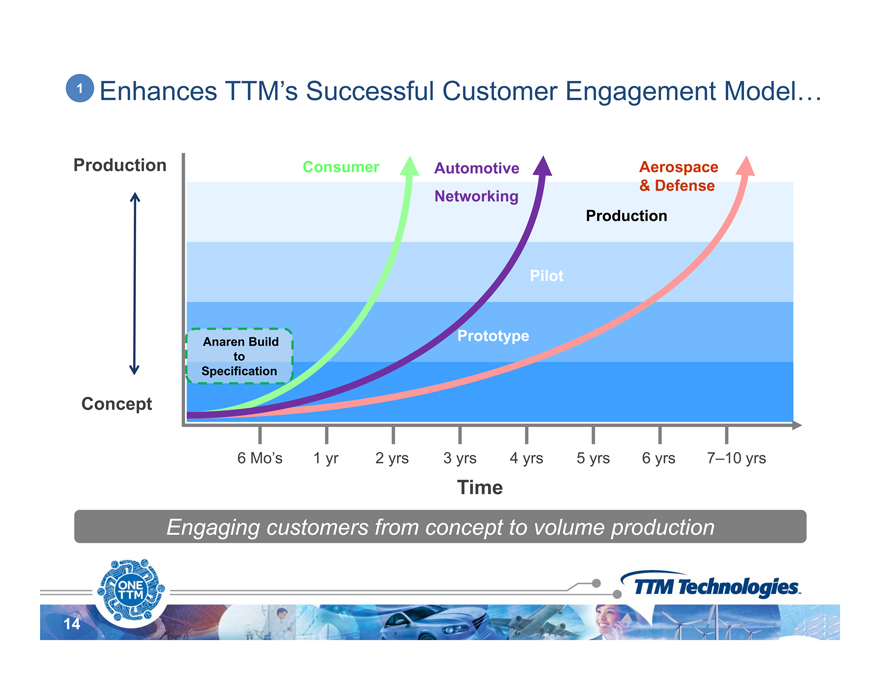
1 Enhances TTM’s Successful Customer Engagement Model…ProductionP d tiConsumer Aerospace& DefenseAutomotiveNetworkingPilotProductionAnaren BuildtoSpecificationPrototypeConcept6 Mo’s 1 yr 2 yrs 3 yrs 4 yrs 5 yrs 6 yrs 7–10 yrsTimeEngaging customers from concept to volume production14
|
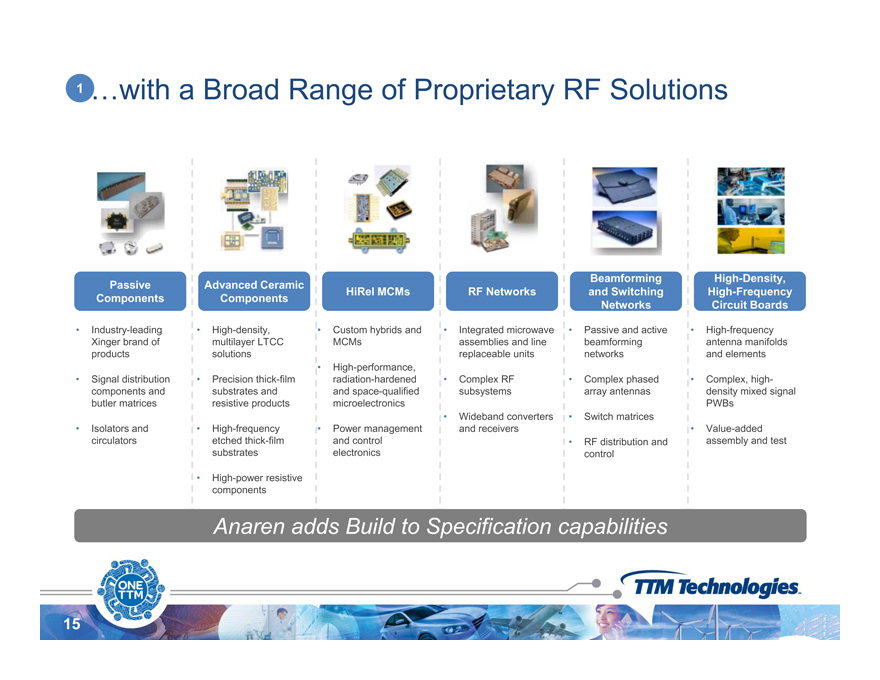
1…with a Broad Range of Proprietary RF SolutionsPassiveComponentsAdvanced CeramicComponentsHigh-Density,HiRel MCMs RF Networks High-FrequencyBeamformingand Switching• Industry-leadingXinger brand ofproducts• Signal distribution• High-density,multilayer LTCCsolutions• Precision thick-film• High-frequencyantenna manifoldsand elements• Complex, high-g q yCircuit BoardsgNetworks• Custom hybrids andMCMs• High-performance,radiation-hardened• Integrated microwaveassemblies and linereplaceable units• Complex RF• Passive and activebeamformingnetworksg • Complex phasedcomponents andbutler matrices• Isolators andcirculatorssubstrates andresistive products• High-frequencyetched thick-filmsubstratesp , gdensity mixed signalPWBs• Value-addedassembly and testand space-qualifiedmicroelectronics• Power managementand controlelectronicspsubsystems• Wideband convertersand receiversp parray antennas• Switch matrices• RF distribution andcontrol• High-power resistivecomponentsAnaren adds Build to Specification capabilities15
|
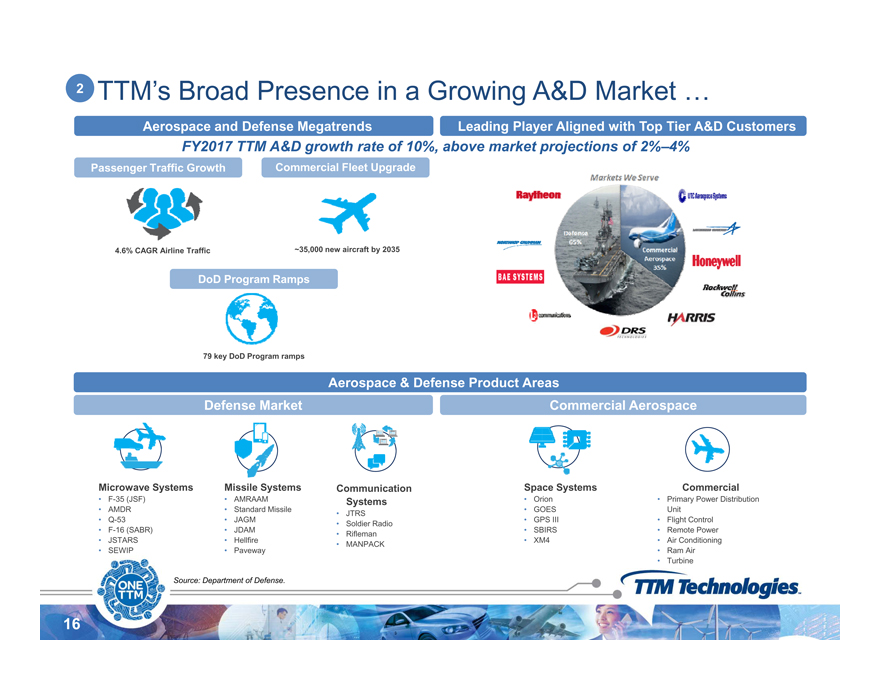
TTM’s Broad Presence in a Growing A&D Market …Leading Player 2Aerospace and Defense MegatrendsPassenger Traffic Growth Commercial Fleet UpgradeFY2017 TTM A&D growth rate of 10%, above market projections of 2%–4%Aligned with Top Tier A&D Customers4.6% CAGR Airline Traffic ~35,000 new aircraft by 2035DoD Program RampsAerospace & Defense Product Areas79 key DoD Program rampsDefense Market Commercial AerospaceMicrowave Systems• F-35 (JSF)• AMDR• Q-53• F-16 (SABR)• JSTARS• SEWIPMissile Systems• AMRAAM• Standard Missile• JAGM• JDAM• Hellfire• PavewayCommunicationSystems• JTRS• Soldier Radio• Rifleman• MANPACKSpace Systems• Orion• GOES• GPS III• SBIRS• XM4Commercial• Primary Power DistributionUnit• Flight Control• Remote Power• Air Conditioning• Ram Air16Source: Department of Defense.y• Turbine
|
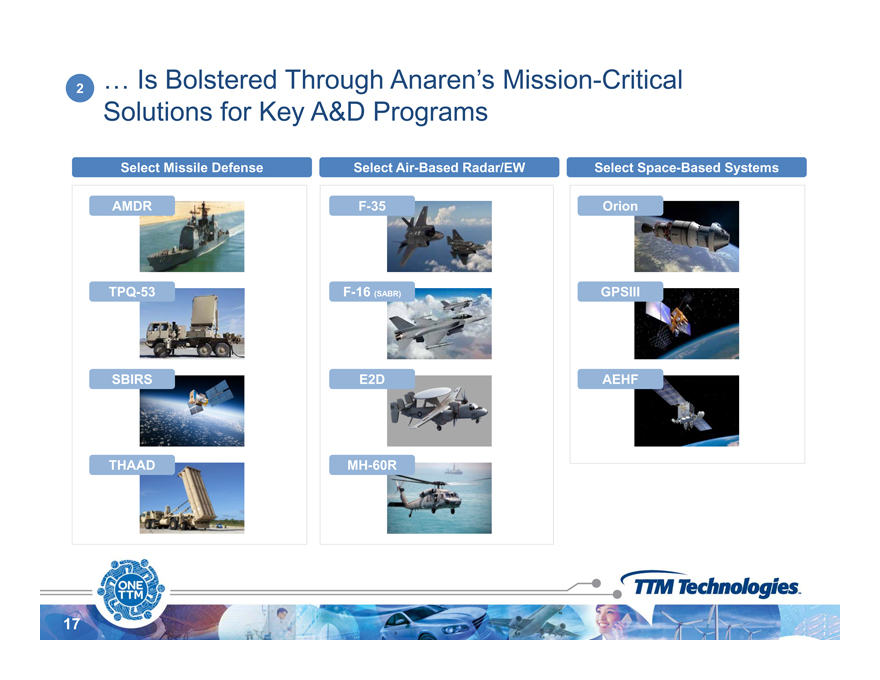
… Is Bolstered Through Anaren’s Mission-CriticalSolutions for Key A&D Programs2Select Missile Defense Select Air-Based Radar/EW Select Space-Based Systemsy gAMDR F-35 OrionTPQ-53 F-16 ( SABR) GPSIIISBIRS)E2DAEHFTHAADMH-60RMH 17
|
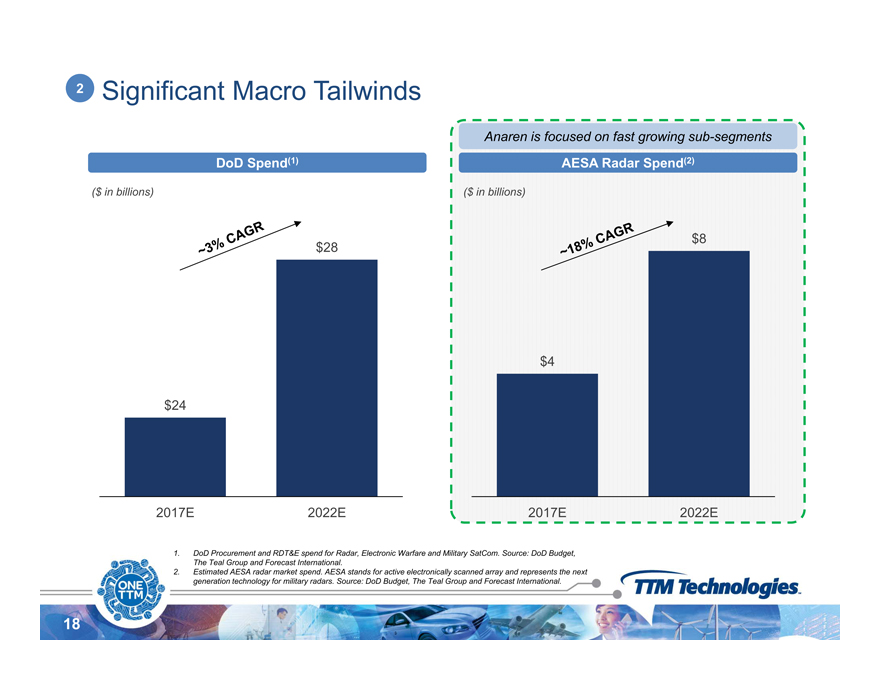
2 Significant Macro TailwindsDoD Spend(1) AESA Radar Spend(2)($ in billions) ($ in billions)Anaren is focused on fast growing sub-segments$28 $8$4$241 DoD Procurement and RDT&E spend for Radar Electronic SatCom Source: DoD Budget2017E 2022E 2017E 2022E181. Radar, Warfare and Military SatCom. Budget,The Teal Group and Forecast International.2. Estimated AESA radar market spend. AESA stands for active electronically scanned array and represents the nextgeneration technology for military radars. Source: DoD Budget, The Teal Group and Forecast International.
|
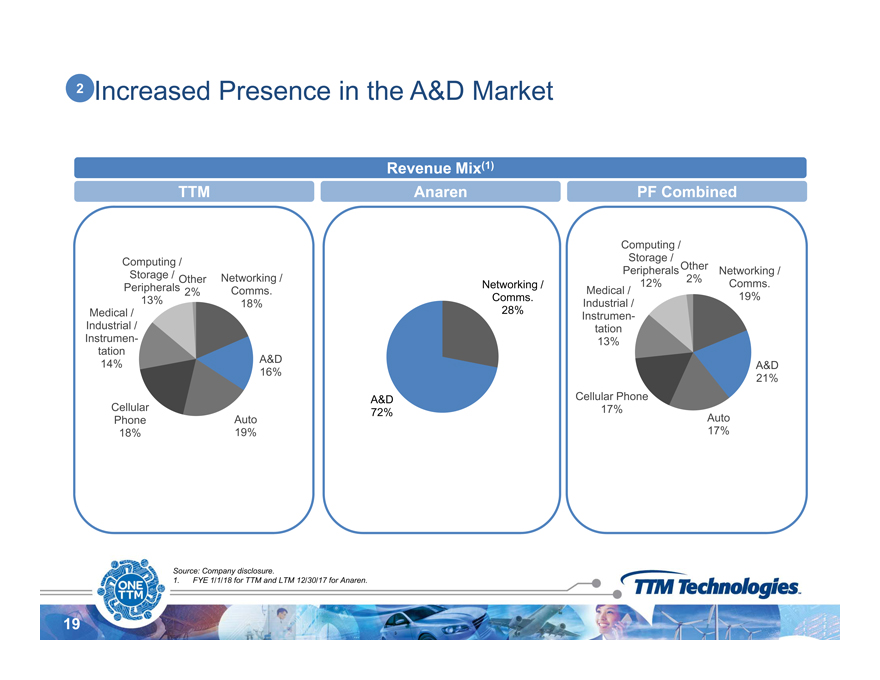
2 Increased Presence in the A&D MarketRevenue Mix(1)TTM Anaren PF CombinedNetworking /Comms.Computing /Storage /Peripherals13%Other2% Networking /CommsNetworking /Comms.Medical / 19%Computing /Storage /Peripherals12%Other2%18%A&D16%Medical /Industrial /Instrumentation14%Comms.28%A&D21%Industrial /Instrumentation13%Auto19%CellularPhone18%A&D72% Auto17%Cellular Phone17%19Source: Company disclosure.1. FYE 1/1/18 for TTM and LTM 12/30/17 for Anaren.
|
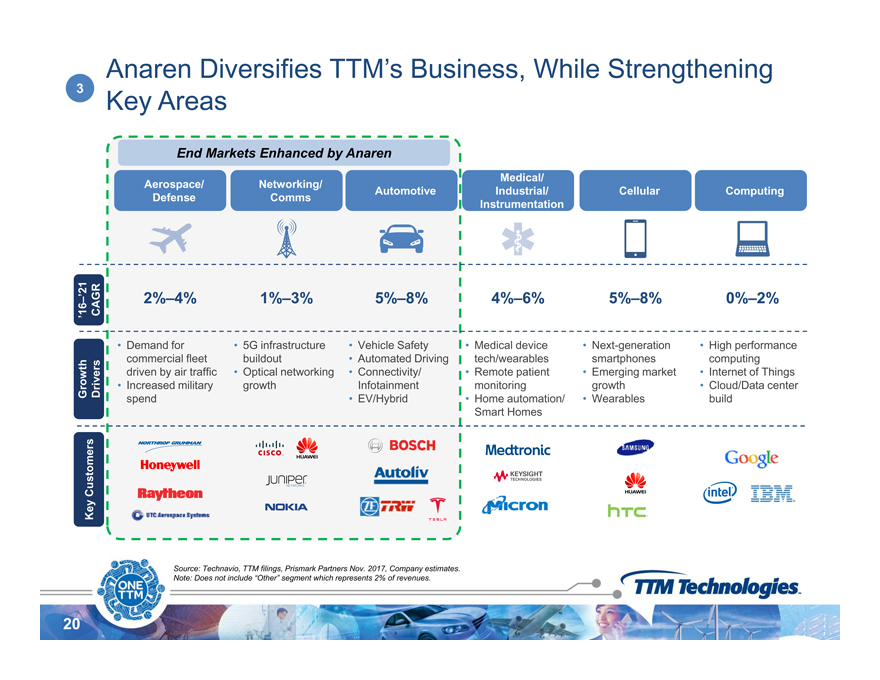
Anaren Diversifies TTM’s Business, While StrengtheningKey Areas 3Networking/CommsMedical/Industrial/InstrumentationAerospace/Defense Cellular ComputingEnd Markets Enhanced by AnarenAutomotive2% 4%1% 3% 4% 6%–’21GR5% 8%5% 8%0% 2%• 5G infrastructurebuildout• Optical networkingth1%–4%–• Medical devicetech/wearables• Remote patientit i2%–• Demand forcommercial fleetdriven by air trafficI d ilitowthvers’16–CAG5%–• Next-generationsmartphones• Emerging marketth0%–• High performancecomputing• Internet of ThingsCl d/D t t• Vehicle Safety• Automated Driving• Connectivity/I f t i t5%–growth monitoring• Home automation/Smart Homes• Increased militaryspendGroomers Drigrowth• Wearables• Cloud/Data centerbuildInfotainment• EV/HybridKey CustoSource: Technavio, TTM filings, Prismark Partners Nov. 2017, Company estimates.Note: Does not include “Other” segment which represents 2% of revenues.20
|
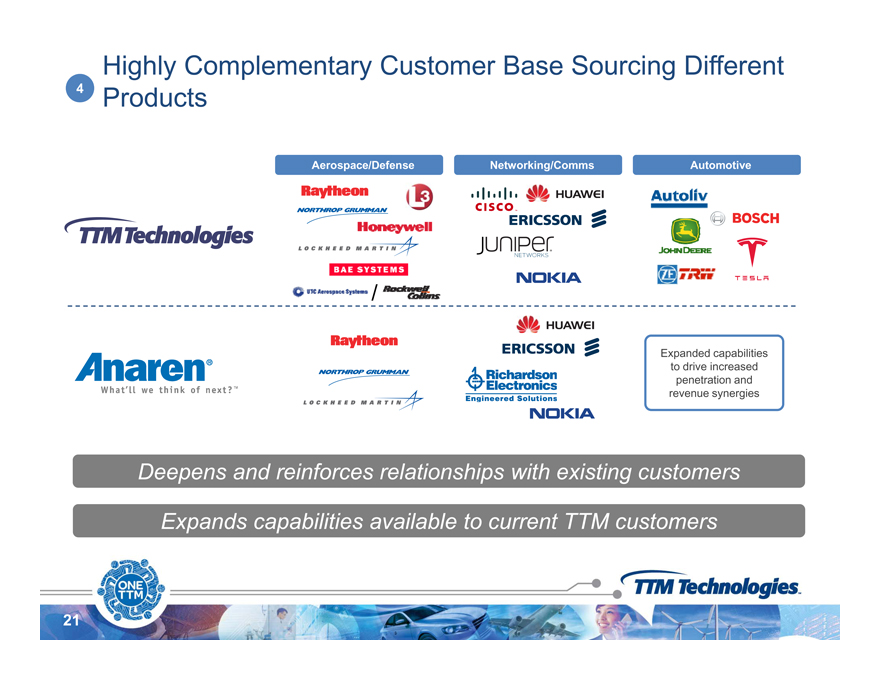
Highly Complementary Customer Base Sourcing Different4 ProductsAerospace/Defense Networking/Comms Automotive/Expanded capabilitiesto drive increasedpenetration andDeepens and reinforces relationships revenue synergieswith existing customersExpands capabilities available to current TTM customers21Products Applications End Markets
|
Recent Performance Highlights and Financial Policy22
|
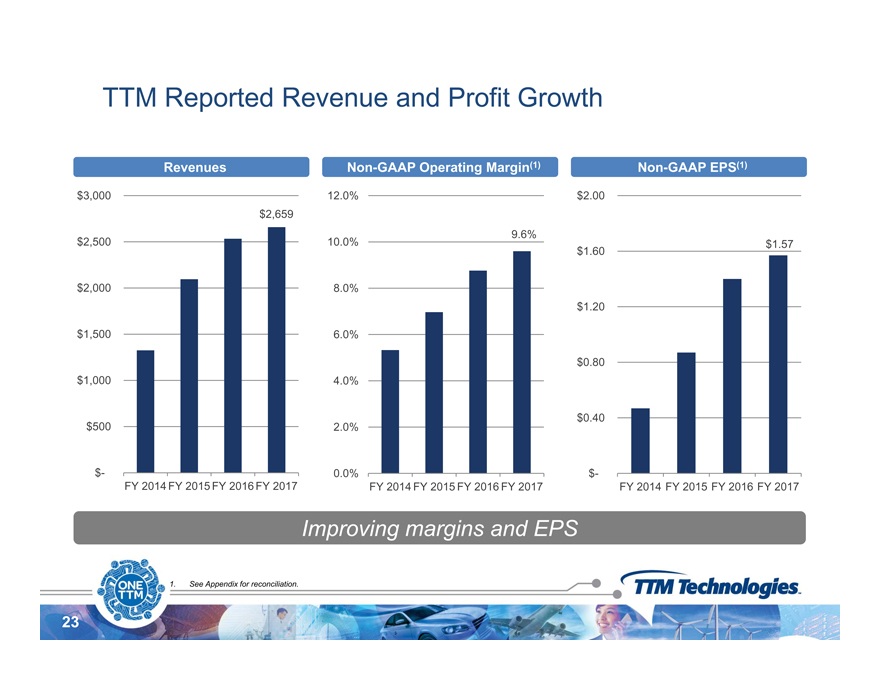
TTM Reported Revenue and Profit Growth$2 659$3,000 12.0% $2.00Revenues Non-GAAP Operating Margin(1) Non-GAAP EPS(1)2,659$2,000$2,5009.6%8.0%10.0% $1.60 $1.57$1 000$1,5004 0%6.0%$0.80$1.20$$5001,0002.0%4.0%$$0.40$-FY 2014 FY 2015 FY 2016 FY 20170.0%FY 2014 FY 2015 FY 2016 FY 2017$-FY 2014 FY 2015 FY 2016 FY 2017Improving margins and EPS231. See Appendix for reconciliation.
|
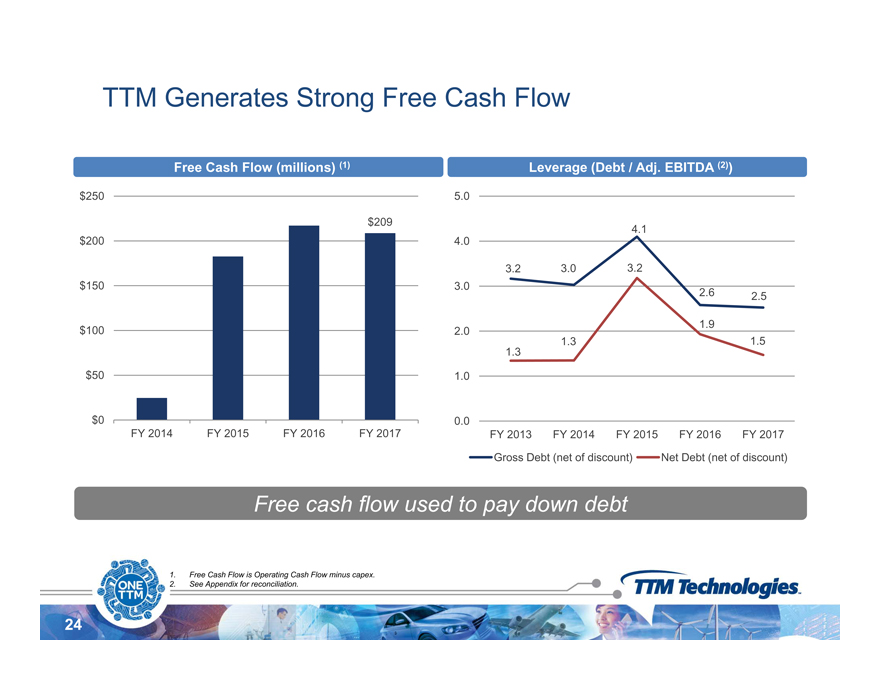
TTM Generates Strong Free Cash Flow$250 5.0Free Cash Flow (millions) (1) Leverage (Debt / Adj. EBITDA (2))$209$150$2003.2 3.04.12.6 2 53.23.04.0$50$1002.51.31.31.91.51.02.0$0FY 2014 FY 2015 FY 2016 FY 20170.0FY 2013 FY 2014 FY 2015 FY 2016 FY 2017Gross Debt (net of discount) Net Debt (net of discount)Free cash flow used to pay down debt241. Free Cash Flow is Operating Cash Flow minus capex.2. See Appendix for reconciliation.
|
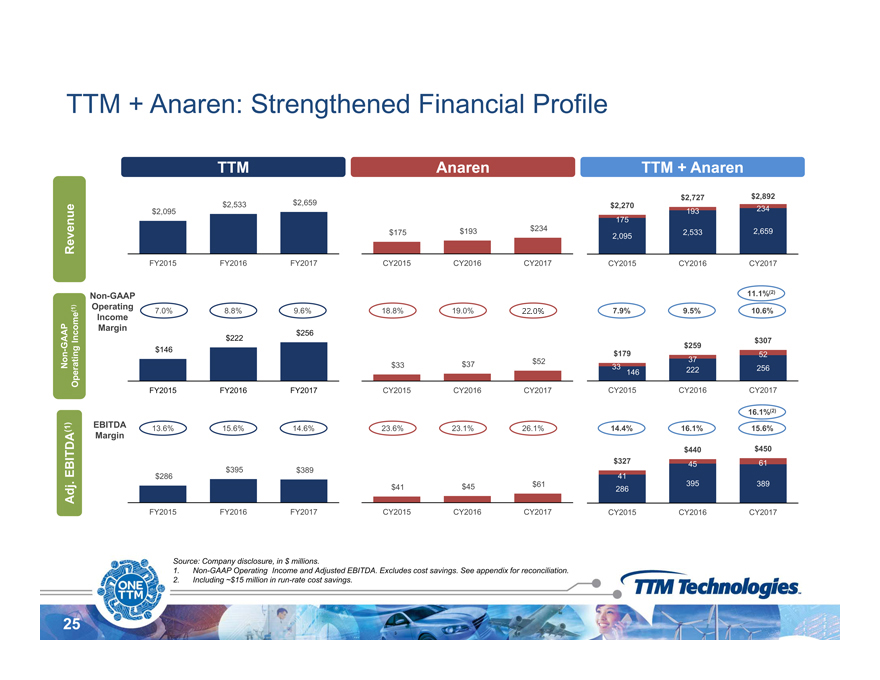
TTM + Anaren: Strengthened Financial ProfileueTTM Anaren TTM + Anaren$2 095$2,533 $2,659193$2,270 234$2,727 $2,892Revenu2,095FY2015 FY2016 FY2017$175 $193 $234CY2015 CY2016 CY20172,095 2,533 2,659175CY2015 CY2016 CY2017Non-GAAP11.1%(2)Non-GAAPOperating Income(1)$146$222 $256$33 $37 $527.0% 8.8% 9.6% 18.8% 19.0% 22.0% 7.9% 9.5% 10.6%OperatingIncomeMargin146 222 256 3337 52 $179$259 $307BITDA(1)O$395 $389$327 45 61$440 $450EBITDA 14.4% 16.1% 15.6%Margin16.1%(2)FY2015 FY2016 FY2017 CY2015 CY2016 CY201713.6% 15.6% 14.6% 23.6% 23.1% 26.1%CY2015 CY2016 CY2017Adj. EB$286FY2015 FY2016 FY2017$41 $45 $61CY2015 CY2016 CY2017286395 38941CY2015 CY2016 CY201725Source: Company disclosure, in $ millions.1. Non-GAAP Operating Income and Adjusted EBITDA. Excludes cost savings. See appendix for reconciliation.2. Including ~$15 million in run-rate cost savings.
|
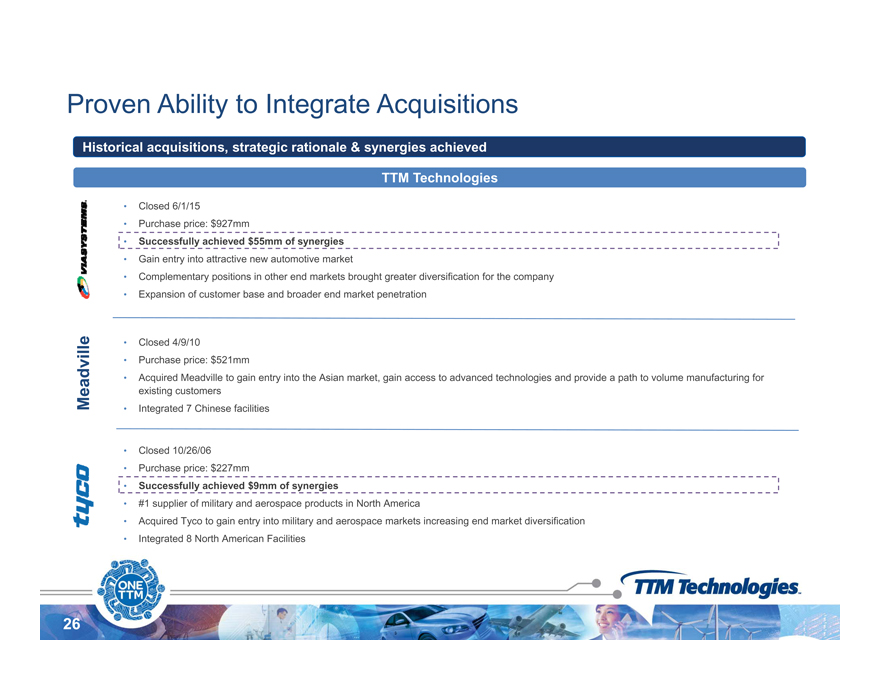
Proven Ability to Integrate AcquisitionsTTM TechnologiesHistorical acquisitions, strategic rationale & synergies achieved• Closed 6/1/15• Purchase price: $927mm• Successfully achieved $55mm of synergies• Gain entry into attractive new automotive market• Complementary positions in other end markets brought greater diversification for the company• Expansion of customer broader end • Closed 4/9/10• Purchase price: $521mm• Acquired Meadville to gain entry into the Asian market, gain access to advanced technologies and provide a path to volume manufacturing foradvillebase and market penetrationq g y g g p p gexisting customers• Integrated 7 Chinese facilitiesMea• Closed 10/26/06• Purchase price: $227mm• Successfully achieved $9mm of synergies• #1 supplier of military and aerospace products in North America• Acquired Tyco to gain entry into military and aerospace markets increasing end market diversification• Integrated 8 North American Facilities26
|
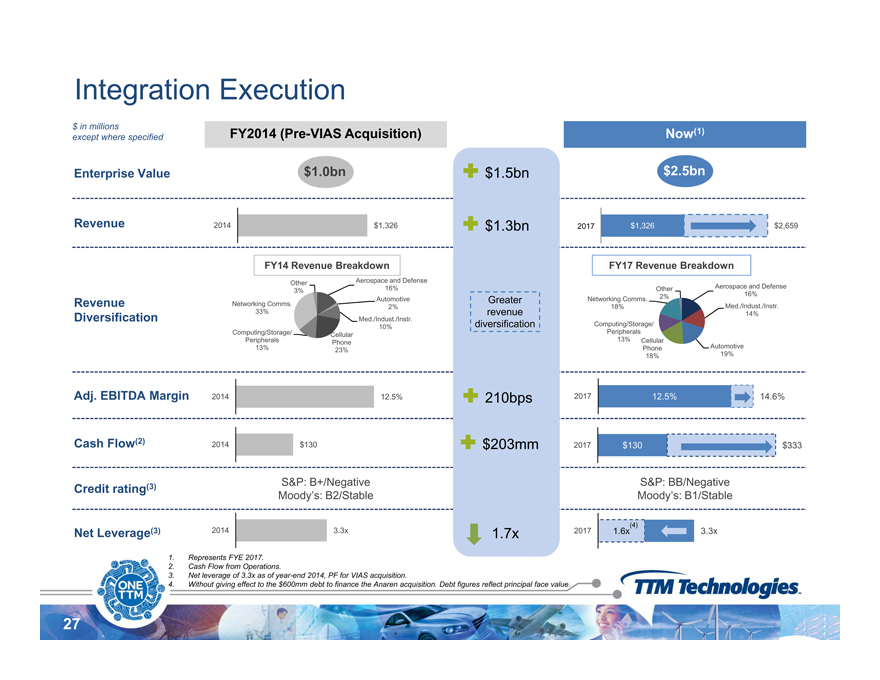
Integration Execution$ FY2014 (Pre-VIAS Acquisition) Now(1)Enterprise Valuein millionsexcept where specified$1.0bn  $1.5bn $2.5bnAerospace and Defense16%A t tiOther3%Revenue 2014 $1,326  $1.3bn 2017 $1,326 $2,659G tFY14 Revenue Breakdown FY17 Revenue BreakdownAerospace and Defense16%N t ki COtherAutomotive 2%2%Med./Indust./Instr.10%CellularPhone23%Computing/Storage/Peripherals13%Networking Comms.33%RevenueDiversificationGreaterrevenuediversificationMed./Indust./Instr.14%Automotive19%CellularPhone18%Computing/Storage/Peripherals13%Networking Comms.18%Adj. EBITDA MarginCash Flow(2)12.5% 14.6%0 0.1 0.220172014 $1302014 12.5%2017 $130 $333 210bps $203mmCredit rating(3) S&P: B+/NegativeMoody’s: B2/StableS&P: BB/NegativeMoody’s: B1/StableNet Leverage(3) 2014 ) 3.3x 2017 1.6x 3.3x01.7x (4)1. Represents FYE 2017.2. Cash Flow from Operations.3. Net leverage of 3.3x as of year-end 2014, PF for VIAS acquisition.4. Without giving effect to the $600mm debt to finance the Anaren acquisition. Debt figures reflect principal face value.27
|
Potential for Cost SavingsExpect to Achieve $15 million in Run-Rate Synergies within Two Years after ClosingKey Areas of Cost Rationalization:ï,— Production alignmentï,— Supplier spendï,— Staff savingsï,— Infrastructure and support costs28
|
TTM’s Financial Policy• Anticipated to have sizeable liquidity at closing, consisting of:TTM’s Financial Policy Overview• $250 million of anticipated availability under the revolving credit facilities inUnited States and Asia Pacific• ~$200 million of cashMaintain a strongliquidity profile• Prioritization of cash flow for accelerated debt repayment; line of sight on near termreversion of metrics to comfort levels• Aim to de-leverage to net leverage of 2.0x EBITDA within 2 to 3 years afterCapital allocationstrategy –Emphasis ondeleveragingde e e age et e e age o 0 adjusted t yea s a teclose• Expect limited M&A until leverage target achieved• No planned shareholder distributions29

|
Syndication Overview30
|
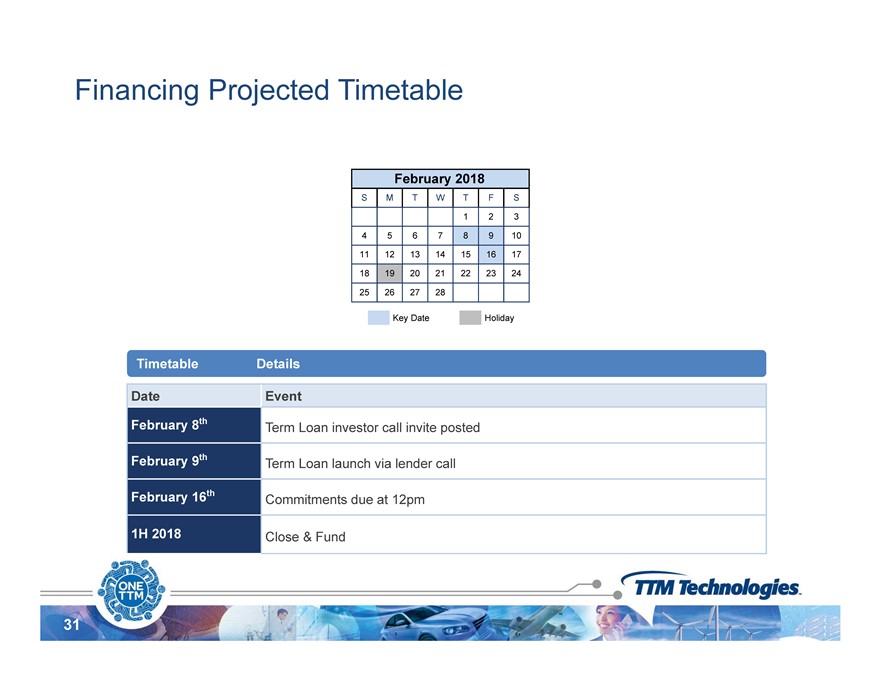
Financing Projected Timetable February 2018 S M T W T F S 1 2 3 4 5 6 7 8 9 10 11 12 13 14 15 16 17 18 19 20 21 22 23 24 25 26 27 28 Key Date Holiday Timetable Details Date Event February 8th Term Loan investor call invite posted February 9th Term Loan launch via lender call February 16th Commitments due at 12pm 1H 2018 Close & Fund ONE TTM TIM Technologies. 31
|
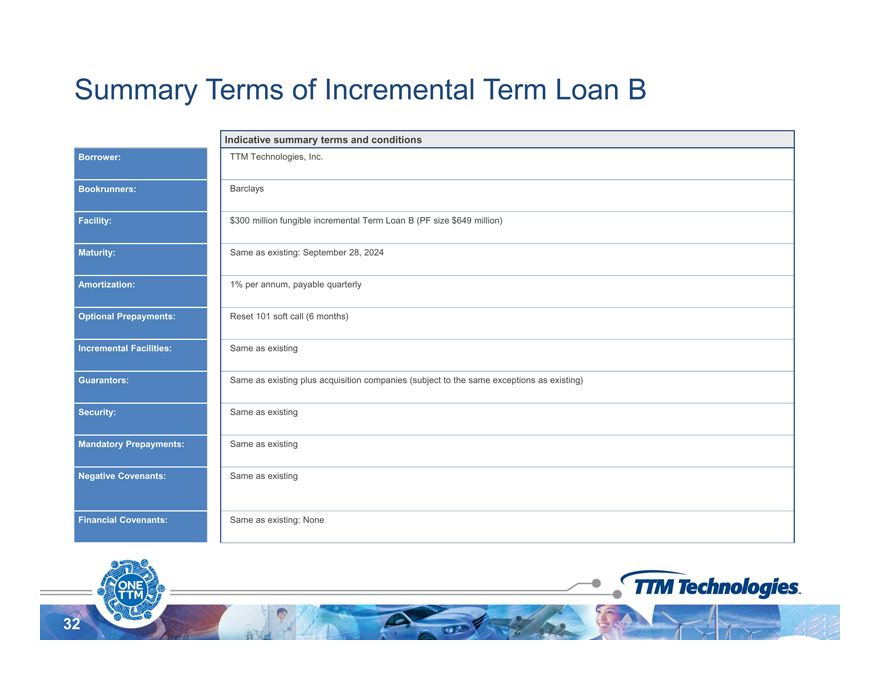
Summary Terms of Incremental Term Loan BIndicative summary terms and conditionsBorrower: TTM Technologies, Inc.Bookrunners: BarclaysFacility: $300 million fungible incremental Term Loan B (PF size $649 million)Maturity: Same as existing: September 28, 2024Amortization: 1% per annum, payable quarterlyOptional Prepayments: Reset 101 soft call (6 months)Incremental Facilities: Same as existingGuarantors: Same as existing plus acquisition companies (subject to the same exceptions as existing)Security: Same as existingMandatory Prepayments: Same as existingNegative Covenants: Same as existingFinancial Covenants: Same as existing: None32
|
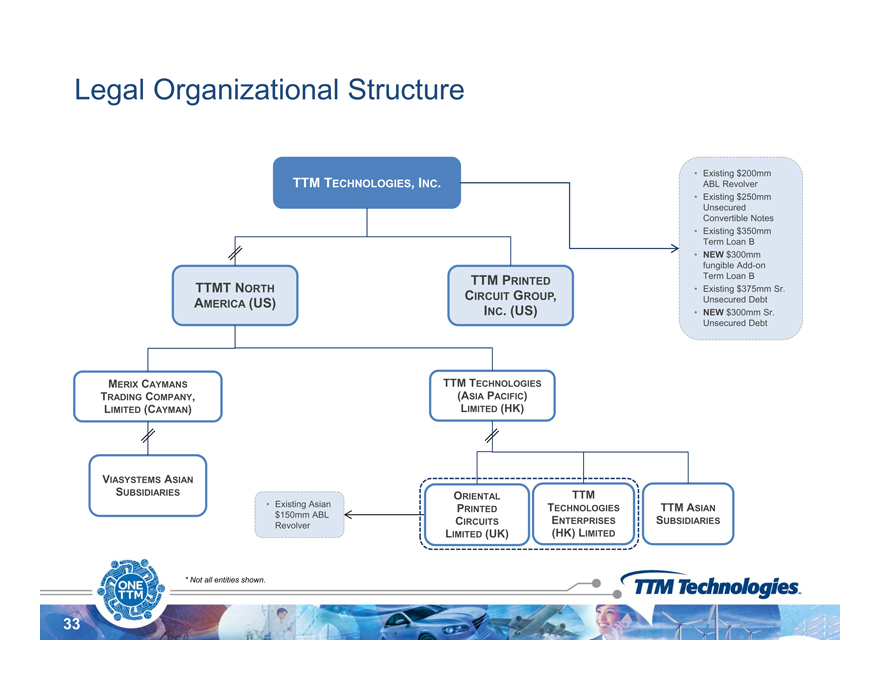
Legal Organizational Structure• Existing $200mmABL Revolver• Existing $250mmUnsecuredTTM TECHNOLOGIES, INC.Convertible Notes• Existing $350mmTerm Loan B• NEW $300mmfungible Add-onTerm Loan B• Existing $375mm Sr.U dDbtTTM PRINTEDCIRCUIT GROUP TTMT NORTHUnsecured Debt• NEW $300mm Sr.Unsecured DebtGROUP,AMERICA (US) INC. (US)MERIX CAYMANS TTM TECHNOLOGIESTRADING COMPANY,LIMITED (CAYMAN)(ASIA PACIFIC)LIMITED (HK)TTMTECHNOLOGIESENTERPRISES(HK) LIMITEDTTM ASIANSUBSIDIARIESVIASYSTEMS ASIANSUBSIDIARIES• Existing Asian$150mm ABLRevolverORIENTALPRINTEDCIRCUITSLIMITED (UK)33* Not all entities shown.
|
Appendix34
|
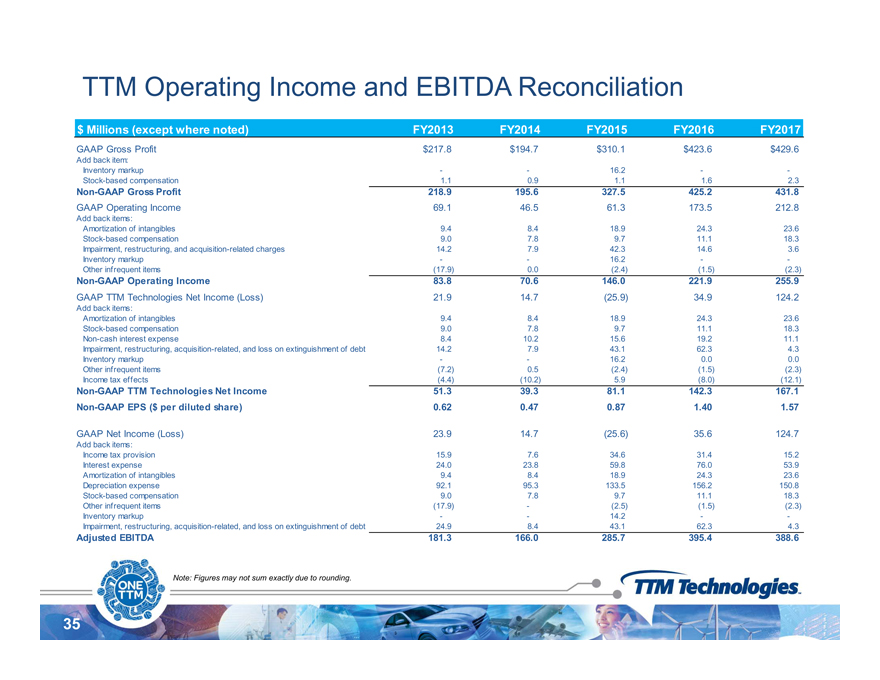
TTM Operating Income and EBITDA Reconciliation$ Milli ( t h t d) Millions except where noted) FY2013 FY2014 FY2015 FY2016 FY2017GAAP Gross Profit $217.8 $194.7 $310.1 $423.6 $429.6Add back item:Inventory markup — 16.2 —Stock-based compensation 1.1 0.9 1.1 1.6 2.3Non-GAAP Gross Profit 218.9 195.6 327.5 425.2 431.8GAAP Operating Income 69.1 46.5 61.3 173.5 212.8Add back items:Amortization of intangibles 9.4 8.4 18.9 24.3 23.6Stock-based compensation 9.0 7.8 9.7 11.1 18.3Impairment, restructuring, and acquisition-related charges 14.2 7.9 42.3 14.6 3.6Inventory markup — 16.2 —Other infrequent items (17.9) 0.0 (2.4) (1.5) (2.3)Non-GAAP Operating Income 83.8 70.6 146.0 221.9 255.9GAAP TTM Technologies Net Income (Loss) 21.9 14.7 (25.9) 34.9 124.2Add back items:Amortization of intangibles 9.4 8.4 18.9 24.3 23.6Stock-based compensation 9.0 7.8 9.7 11.1 18.3Non-cash interest expense 8.4 10.2 15.6 19.2 11.1Impairment, restructuring, acquisition-related, and loss on extinguishment of debt 14.2 7.9 43.1 62.3 4.3Inventory markup — 16.2 0.0 0.0Other infrequent items (7.2) 0.5 (2.4) (1.5) (2.3)Income tax effects (4.4) (10.2) 5.9 (8.0) (12.1)Non-GAAP TTM Technologies Net Income 51.3 39.3 81.1 142.3 167.1Non-GAAP EPS ($ per diluted share) 0.62 0.47 0.87 1.40 1.57GAAP Net Income (Loss) 23.9 14.7 (25.6) 35.6 124.7Add back items:Income tax provision 15.9 7.6 34.6 31.4 15.2Interest expense 24.0 23.8 59.8 76.0 53.9Amortization of intangibles 9.4 8.4 18.9 24.3 23.6Depreciation expense 92.1 95.3 133.5 156.2 150.8Stock-based compensation 9.0 7.8 9.7 11.1 18.3Other infrequent items (17.9)—(2.5) (1.5) (2.3)Inventory markup — 14.2 —Impairment, restructuring, acquisition-related, and loss on extinguishment of debt 24.9 8 .4 43.1 62.3 4.3Adjusted EBITDA 181.3 166.0 285.7 395.4 388.635Note: Figures may not sum exactly due to rounding.
|
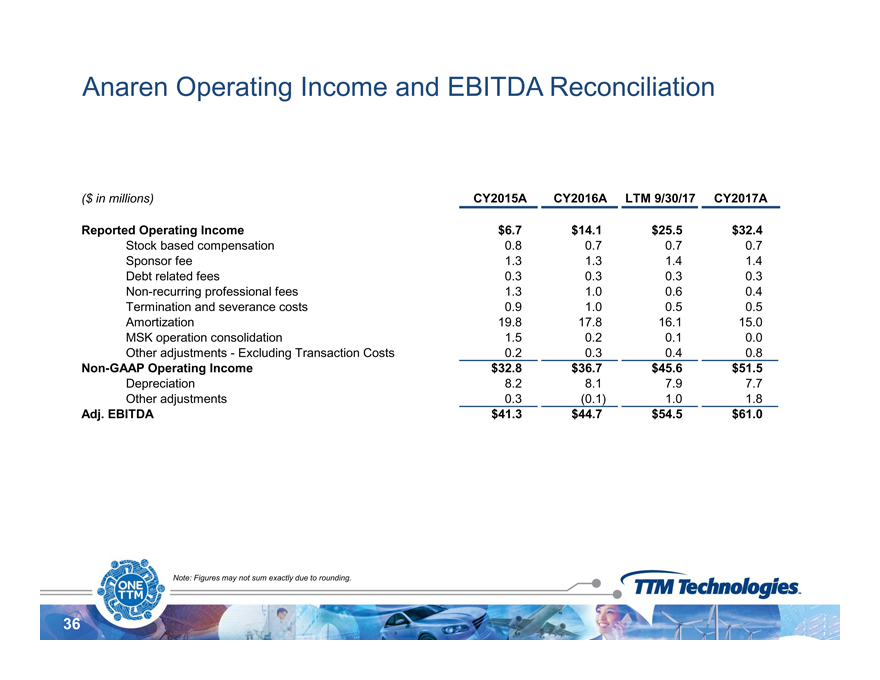
Anaren Operating Income and EBITDA Reconciliation($ in millions) CY2015A CY2016A LTM 9/30/17 CY2017AReported Operating Income $6.7 $14.1 $25.5 $32.4Stock based compensation 0.8 0.7 0.7 0.7Sponsor fee 1.3 1.3 1.4 1.4Debt related fees 0.3 0.3 0.3 0.3Non-recurring g professional fees 1.3 1.0 0.6 0.4Termination and severance costs 0.9 1.0 0.5 0.5Amortization 19.8 17.8 16.1 15.0MSK operation consolidation 1.5 0.2 0.1 0.0Other adjustments—Excluding Transaction Costs 0.2 0.3 0.4 0.8Non-GAAP Operating Income $32.8 $36.7 $45.6 $51.5Depreciation 8.2 8.1 7.9 7.7Other adjustments 0.3 (0.1) 1.0 1.8Adj. EBITDA $41.3 $44.7 $54.5 $61.036Note: Figures may not sum exactly due to rounding.High Performance RFAssembliesPCB’s Advanced Radar SystemsSpaceRF PCB s and Passive RFD fComponentsRF Multichip ModulesAdvanced JammingSystemsSatellite CommunicationSystemsNetworking/CommunicationsDefenseAdvanced CeramicSubstratesBase Station and SmallCellsMedical11cations