Attached files
| file | filename |
|---|---|
| EX-32 - EXHIBIT 32 - S&P Global Inc. | spgi-ex32x20171231xq4.htm |
| EX-31.2 - EXHIBIT 31.2 - S&P Global Inc. | spgi-ex312x20171231xq4.htm |
| EX-31.1 - EXHIBIT 31.1 - S&P Global Inc. | spgi-ex311x20171231xq4.htm |
| EX-23 - EXHIBIT 23 - S&P Global Inc. | spgi-ex23x20171231xq4.htm |
| EX-21 - EXHIBIT 21 - S&P Global Inc. | spgi-ex21x20171231xq4.htm |
| EX-12 - EXHIBIT 12 - S&P Global Inc. | spgi-ex12x20171231xq4.htm |
| EX-10.44 - EXHIBIT 10.44 - S&P Global Inc. | spgi-ex1044x20171231.htm |
| EX-10.43 - EXHIBIT 10.43 - S&P Global Inc. | spgi-ex1043x20171231.htm |
UNITED STATES SECURITIES AND EXCHANGE COMMISSION
WASHINGTON, D.C. 20549
FORM 10-K
þ | ANNUAL REPORT PURSUANT TO SECTION 13 OR 15(d) OF THE SECURITIES EXCHANGE ACT OF 1934 |
For the fiscal year ended December 31, 2017
OR
¨ | TRANSITION REPORT PURSUANT TO SECTION 13 OR 15(d) OF THE SECURITIES EXCHANGE ACT OF 1934 |
For the transition period from to
Commission File Number 1-1023

S&P Global Inc.
(Exact name of registrant as specified in its charter)
New York | 13-1026995 | |
(State or other jurisdiction of incorporation or organization) | (I.R.S. Employer Identification No.) | |
55 Water Street, New York, New York | 10041 | |
(Address of principal executive offices) | (Zip Code) | |
Registrant’s telephone number, including area code: 212-438-1000
Title of each class | Name of exchange on which registered | |
Common Stock — $1 par value | New York Stock Exchange | |
Securities registered pursuant to Section 12(g) of the Act: None
Indicate by check mark if the Registrant is a well-known seasoned issuer, as defined in Rule 405 of the Securities Act.
YES þ NO ¨
Indicate by check mark if the Registrant is not required to file reports pursuant to Section 13 or Section 15(d) of the Act.
YES ¨ NO þ
Indicate by check mark whether the Registrant (1) has filed all reports required to be filed by Section 13 or 15 (d) of the Securities Exchange Act of 1934 during the preceding 12 months (or for such shorter period that the Registrant was required to file such reports), and (2) has been subject to such filing requirements for the past 90 days.
YES þ NO ¨
Indicate by check mark whether the Registrant has submitted electronically and posted on its corporate website, if any, every Interactive Date File required to be submitted and posted pursuant to Rule 405 of Regulation S-T (§232.405 of this chapter) during the preceding 12 months (or for such shorter period that the Registrant was required to submit and post such files).
YES þ NO ¨
Indicate by check mark if disclosure of delinquent filers pursuant to Item 405 of Regulation S-K (§229.405 of this chapter) is not contained herein, and will not be contained, to the best of Registrant’s knowledge, in definitive proxy or information statements incorporated by reference in Part III of this Form 10-K or any amendment to this Form 10-K. þ
1
Indicate by check mark whether the Registrant is a large accelerated filer, an accelerated filer, a non-accelerated filer, or a smaller reporting company. See the definitions of “large accelerated filer,” “accelerated filer” and “small reporting company” in Rule 12b-2 of the Exchange Act. (Check one):
þ Large accelerated filer | o Accelerated filer | o Non-accelerated filer | o Smaller reporting company | o Emerging growth company | |||
(Do not check if a smaller reporting company) | |||||||
Indicate by check mark whether the registrant is a shell company (as defined in Rule 12b-2 of the Exchange Act).
YES ¨ NO þ
If an emerging growth company, indicate by check mark if the registrant has elected not to use the extended transition period for complying with any new or revised accounting standards provided pursuant to Section 13(a) of the Exchange Act. ¨
The aggregate market value of voting stock held by non-affiliates of the Registrant as of the last business day of the second fiscal quarter ended June 30, 2017, was $37.5 billion, based on the closing price of the common stock as reported on the New York Stock Exchange of $145.99 per common share. For purposes of this calculation, it is assumed that directors, executive officers and beneficial owners of more than 10% of the registrant outstanding stock are affiliates. The number of shares of common stock of the Registrant outstanding as of January 26, 2018 was 253.9 million shares.
Part III incorporates information by reference from the definitive proxy statement for the 2018 annual meeting of shareholders.
2
TABLE OF CONTENTS
PART I | ||
Item | Page | |
1 | ||
1a. | ||
1b. | ||
2 | ||
3 | ||
4 | ||
PART II | ||
5 | ||
6 | ||
7 | ||
7a. | ||
8. | ||
9. | ||
9a. | ||
9b. | ||
PART III | ||
10 | ||
11 | ||
12 | ||
13 | ||
14 | ||
PART IV | ||
15 | ||
16 | ||
3
FORWARD-LOOKING STATEMENTS
This Annual Report on Form 10-K contains “forward-looking statements,” as defined in the Private Securities Litigation Reform Act of 1995. These statements, which express management’s current views concerning future events, trends, contingencies or results, appear at various places in this report and use words like “anticipate,” “assume,” “believe,” “continue,” “estimate,” “expect,” “forecast,” “future,” “intend,” “plan,” “potential,” “predict,” “project,” “strategy,” “target” and similar terms, and future or conditional tense verbs like “could,” “may,” “might,” “should,” “will” and “would.” For example, management may use forward-looking statements when addressing topics such as: the outcome of contingencies; future actions by regulators; changes in the Company’s business strategies and methods of generating revenue; the development and performance of the Company’s services and products; the expected impact of acquisitions and dispositions; the Company’s effective tax rates; and the Company’s cost structure, dividend policy, cash flows or liquidity.
Forward-looking statements are subject to inherent risks and uncertainties. Factors that could cause actual results to differ materially from those expressed or implied in forward-looking statements include, among other things:
• | worldwide economic, political and regulatory conditions, including conditions that may result from legislative, regulatory and policy changes associated with the current U.S. administration or the United Kingdom’s withdrawal from the European Union; |
• | the rapidly evolving regulatory environment, in Europe,the United States and elsewhere, affecting Ratings, Market and Commodities Intelligence and Indices, including new and amended regulations and the Company’s compliance therewith; |
• | the Company’s ability to maintain adequate physical, technical and administrative safeguards to protect the security of confidential information and data, and the potential for unauthorized access to our systems or a system or network disruption that results in improper disclosure of confidential information or data, regulatory penalties and remedial costs; |
• | our ability to make acquisitions and dispositions and successfully integrate the businesses we acquire; |
• | the outcome of litigation, government and regulatory proceedings, investigations and inquiries; |
• | the health of debt and equity markets, including credit quality and spreads, the level of liquidity and future debt issuances; |
• | the demand and market for credit ratings in and across the sectors and geographies where the Company operates; |
• | concerns in the marketplace affecting the Company’s credibility or otherwise affecting market perceptions of the integrity or utility of independent credit ratings; |
• | the effect of competitive products and pricing, including the level of success of new product developments and global expansion; |
• | consolidation in the Company’s end-customer markets; |
• | the impact of customer cost-cutting pressures, including in the financial services industry and commodities markets; |
• | a decline in the demand for credit risk management tools by financial institutions; |
• | the level of merger and acquisition activity in the United States and abroad; |
• | the volatility of the energy marketplace and the health of the commodities markets; |
• | our ability to attract, incentivize and retain key employees; |
• | our ability to adjust to changes in European and United Kingdom markets as the United Kingdom leaves the European Union, and the impact of the United Kingdom’s departure on our credit rating activities and other European and United Kingdom offerings; |
• | the Company’s ability to successfully recover should it experience a disaster or other business continuity problem from a hurricane, flood, earthquake, terrorist attack, pandemic, security breach, cyber-attack, power loss, telecommunications failure or other natural or man-made event; |
• | changes in applicable tax or accounting requirements, including the impact of recent tax reform in the U.S.; |
• | the level of the Company’s future cash flows and capital investments; |
• | the impact on the Company’s revenue and net income caused by fluctuations in foreign currency exchange rates; and |
• | the Company’s exposure to potential criminal sanctions or civil penalties if it fails to comply with foreign and U.S. laws and regulations that are applicable in the domestic and international jurisdictions in which it operates, including sanctions laws relating to countries such as Iran, Russia, Sudan and Syria, anti-corruption laws such as the U.S. Foreign Corrupt Practices Act and the U.K. Bribery Act of 2010, and local laws prohibiting corrupt payments to government officials, as well as import and export restrictions. |
The factors noted above are not exhaustive. The Company and its subsidiaries operate in a dynamic business environment in which new risks emerge frequently. Accordingly, the Company cautions readers not to place undue reliance on any forward-looking statements, which speak only as of the dates on which they are made. The Company undertakes no obligation to update or revise any forward-looking statement to reflect events or circumstances arising after the date on which it is made, except as required by applicable law. Further information about the Company’s businesses, including information about factors that could materially affect its results of operations and financial condition, is contained in the Company’s filings with the SEC, including Item 1a, Risk Factors, in this Annual Report on Form 10-K.
4
PART I
Item 1. Business
Overview
S&P Global Inc. (together with its consolidated subsidiaries, the “Company,” the “Registrant,” “we,” “us” or “our”) is a leading provider of transparent and independent ratings, benchmarks, analytics and data to the capital and commodity markets worldwide. The capital markets include asset managers, investment banks, commercial banks, insurance companies, exchanges, trading firms and issuers; and the commodity markets include producers, traders and intermediaries within energy, metals, petrochemicals and agriculture. We serve our global customers through a broad range of products and services available through both third-party and proprietary distribution channels. We were incorporated in December of 1925 under the laws of the state of New York.
Our Businesses
Our operations consist of three reportable segments: Ratings, Market and Commodities Intelligence and S&P Dow Jones Indices ("Indices"). For a discussion on the competitive conditions in our businesses, see “MD&A – Segment Review” contained in Item 7, Management’s Discussion and Analysis of Financial Condition and Results of Operations, in this Annual Report on Form 10-K.
In December of 2017, we announced that S&P Global Platts, a business line within Market and Commodities Intelligence, will be managed as a separate business and comprise a separate reportable segment effective January 1, 2018. We will begin reporting the financial results of S&P Global Market Intelligence and S&P Global Platts as a separate reportable segments beginning with the first quarter of 2018.
Ratings
Ratings is an independent provider of credit ratings, research, and analytics to investors, issuers and other market participants. Credit ratings are one of several tools investors can use when making decisions about purchasing bonds and other fixed income investments. They are opinions about credit risk and our ratings express our opinion about the ability and willingness of an issuer, such as a corporation or state or city government, to meet its financial obligations in full and on time. Our credit ratings can also relate to the credit quality of an individual debt issue, such as a corporate or municipal bond, and the relative likelihood that the debt issue may default.
With offices in over 25 countries around the world, Ratings is an important part of the world's financial infrastructure and has played a leading role for over 150 years in providing investors with information and independent benchmarks for their investment and financial decisions as well as access to the capital markets. The key constituents Ratings serves are investors, corporations, governments, municipalities, commercial and investment banks, insurance companies, asset managers, and other debt issuers.
As the capital markets continue to evolve, Ratings is well-positioned to capitalize on opportunities, driven by continuing regulatory changes, through its global network, well-established position in corporate markets and strong investor reputation.
Ratings differentiates its revenue between transaction and non-transaction. Transaction revenue primarily includes fees associated with:
• | ratings related to new issuance of corporate and government debt instruments, and structured finance debt instruments; |
• | bank loan ratings; and |
• | corporate credit estimates, which are intended, based on an abbreviated analysis, to provide an indication of our opinion regarding creditworthiness of a company which does not currently have a Ratings credit rating. |
Non-transaction revenue primarily includes fees for surveillance of a credit rating, annual fees for customer relationship-based pricing programs, fees for entity credit ratings and global research and analytics.
Market and Commodities Intelligence
Market and Commodities Intelligence's portfolio of capabilities are designed to help the financial community, corporations and professional service firms track performance, generate better investment returns, identify new trading and investment ideas, perform risk analysis, develop mitigation strategies and provide high-value information to the commodity and energy markets that enable its customers to make better informed trading and business decisions. Key customers served by Market and Commodities Intelligence include investment managers, investment banks, private equity firms, insurance companies, commercial banks,
5
corporations, professional services firms, government agencies and regulators; and producers, traders and intermediaries within energy, metals and agriculture markets.
Market and Commodities Intelligence includes the following business lines:
• | Desktop — a product suite that provides data, analytics and third-party research for global finance professionals, which includes the Market Intelligence Desktop (which are inclusive of S&P Capital IQ and SNL Desktop products); |
• | Data Management Solutions — integrated data feeds and application programming interfaces that can be customized, which includes Computstat, GICS, Point In Time Financials and CUSIP; |
• | Risk Services — commercial arm that sells Ratings' credit ratings and related data, analytics and research, which includes subscription-based offerings, RatingsDirect® and RatingsXpress®; and |
• | S&P Global Platts — the leading independent provider of information and benchmark prices for the commodity and energy markets. S&P Global Platts provides essential price data, analytics, and industry insight that enable the commodity and energy markets to perform with greater transparency and efficiency. Additionally, S&P Global Platts generates revenue from licensing of our proprietary market price data and price assessments to commodity exchanges. |
We completed the sale of J.D. Power on September 7, 2016, with the results included in Market and Commodities Intelligence results through that date.
Indices
Indices is a global index provider maintaining a wide variety of indices to meet an array of investor needs. Indices’ mission is to provide transparent benchmarks to help with decision making, collaborate with the financial community to create innovative products and provide investors with tools to monitor world markets.
Indices primarily derives revenue from asset-linked fees based on the S&P and Dow Jones indices and to a lesser extent generates subscription revenue and transaction revenue. Specifically, Indices generates revenue from the following sources:
• | Investment vehicles — asset-linked fees such as exchange traded funds (“ETFs”) and mutual funds, that are based on S&P Dow Jones Indices' benchmarks and generate revenue through fees based on assets and underlying funds; |
• | Exchange traded derivatives — generate royalties based on trading volumes of derivatives contracts listed on various exchanges; |
• | Index-related licensing fees — fixed or variable annual and per-issue fees for over-the-counter derivatives and retail-structured products; and |
• | Data and customized index subscription fees — fees from supporting index fund management, portfolio analytics and research. |
Segment and Geographic Data
The relative contribution of our operating segments to operating revenue, operating profit, long-lived assets and geographic area for the three years ended December 31, 2017 are included in Note 12 – Segment and Geographic Information to the consolidated financial statements under Item 8, Consolidated Financial Statements and Supplementary Data, in this Annual Report on Form 10-K.
Our Personnel
As of December 31, 2017, we had approximately 20,400 employees located worldwide, of which approximately 5,200 were employed in the U.S.
Available Information
The Company's investor kit includes Annual Reports on Form 10-K, Proxy Statements, Quarterly Reports on Form 10-Q, current reports on Form 8-K, the current earnings release and amendments to those reports filed or furnished pursuant to Section 13(a) or 15(d) of the Exchange Act. For online access, go to http://investor.spglobal.com. Requests for printed copies, free of charge, can be e-mailed to investor.relations@spglobal.com or mailed to Investor Relations, S&P Global Inc., 55 Water Street, New York, NY 10041-0001. Interested parties can also call Investor Relations toll-free at 866-436-8502 (domestic callers) or 212-438-2192 (international callers). The information on our website is not, and shall not be deemed to be part hereof or incorporated into this or any of our filings with the Securities and Exchange Commission (“SEC”).
6
Access to more than 10 years of the Company's filings made with the SEC is available through the Company's Investor Relations website. Go to http://investor.spglobal.com and click on the SEC Filings link. In addition, these filings are available to the public on the Commission's website through their EDGAR filing system at www.sec.gov. Interested parties may also read and copy materials that the Company has filed with the SEC at the SEC's public reference room located at 100 F Street, NE, Washington, D.C. 20549 on official business days between the hours of 10AM and 3PM. Please call the Commission at 1-800-SEC-0330 for further information on the public reference room.
Item 1a. Risk Factors
The following risk factors and other information included in this annual report on Form 10-K should be carefully considered. The risks and uncertainties described below are not the only ones we face. These risks could materially and adversely affect our business, financial condition and results of operations. Additional risks and uncertainties not presently known to us or which we currently believe to be immaterial may also impair our business operations.
We operate in the capital and commodities markets. The capital markets include asset managers, investment banks, commercial banks, insurance companies, exchanges, trading firms, and issuers; the commodities markets include producers, traders and intermediaries within energy, metals, petrochemicals and agriculture. Certain risk factors are applicable to certain of our individual segments while other risk factors are applicable company-wide.
Exposure to litigation and government and regulatory proceedings, investigations and inquiries could have a material adverse effect on our business, financial condition or results of operations.
• | In the normal course of business, both in the United States and abroad, we and our subsidiaries are defendants in numerous legal proceedings and are often the subject of government and regulatory proceedings, investigations and inquiries, as discussed under Item 7, Management’s Discussion and Analysis of Financial Condition and Results of Operations, in this Annual Report on Form 10-K and in Note 13 - Commitments and Contingencies to the consolidated financial statements under Item 8, Consolidated Financial Statements and Supplementary Data, in this Annual Report on Form 10-K, and we face the risk that additional proceedings, investigations and inquiries will arise in the future. |
• | Many of these proceedings, investigations and inquiries relate to the ratings activity of S&P Global Ratings brought by issuers and alleged purchasers of rated securities. In addition, various government and self-regulatory agencies frequently make inquiries and conduct investigations into our compliance with applicable laws and regulations, including those related to ratings activities and antitrust matters. |
• | Any of these proceedings, investigations or inquiries could ultimately result in adverse judgments, damages, fines, penalties or activity restrictions, which could have a material adverse effect on our business, financial condition or results of operations. |
• | In view of the uncertainty inherent in litigation and government and regulatory enforcement matters, we cannot predict the eventual outcome of the matters we are currently facing or the timing of their resolution, or in most cases reasonably estimate what the eventual judgments, damages, fines, penalties or impact of activity restrictions may be. As a result, we cannot provide assurance that the outcome of the matters we are currently facing or that we may face in the future will not have a material adverse effect on our business, financial condition or results of operations. |
• | As litigation or the process to resolve pending matters progresses, as the case may be, we continuously review the latest information available and assess our ability to predict the outcome of such matters and the effects, if any, on our consolidated financial condition, cash flows, business and competitive position, which may require that we record liabilities in the consolidated financial statements in future periods. |
• | Legal proceedings impose additional expenses on the Company and require the attention of senior management to an extent that may significantly reduce their ability to devote time addressing other business issues. |
• | Risks relating to legal proceedings may be heightened in foreign jurisdictions that lack the legal protections or liability standards comparable to those that exist in the United States. In addition, new laws and regulations have been and may continue to be enacted that establish lower liability standards, shift the burden of proof or relax pleading requirements, thereby increasing the risk of successful litigations against the Company in the United States and in foreign jurisdictions. These litigation risks are often difficult to assess or quantify and could have a material adverse effect on our business, financial condition or results of operations. |
• | We may not have adequate insurance or reserves to cover these risks, and the existence and magnitude of these risks often remains unknown for substantial periods of time and could have a material adverse effect on our business, financial condition or results of operations. |
7
Our acquisitions and other strategic transactions may not produce anticipated results.
• | We have made and expect to continue to make acquisitions or enter into other strategic transactions to strengthen our business and grow our Company. Such transactions present significant challenges and risks. |
• | The market for acquisition targets and other strategic transactions is highly competitive, especially in light of industry consolidation, which may affect our ability to complete such transactions. |
• | If we are unsuccessful in completing such transactions or if such opportunities for expansion do not arise, our business, financial condition or results of operations could be materially adversely affected. |
• | If such transactions are completed, the anticipated growth and other strategic objectives of such transactions may not be fully realized, and a variety of factors may adversely affect any anticipated benefits from such transactions. For instance, the process of integration may require more resources than anticipated, we may assume unintended liabilities, there may be unexpected regulatory and operating difficulties and expenditures, we may fail to retain key personnel of the acquired business and such transactions may divert management’s focus from other business operations. |
• | The anticipated benefits from an acquisition or other strategic transaction may not be realized fully, or may take longer to realize than expected. As a result, the failure of acquisitions and other strategic transactions to perform as expected could have a material adverse effect on our business, financial condition or results of operations. |
Changes in the volume of securities issued and traded in domestic and/or global capital markets, asset levels and flows into investment products, changes in interest rates and volatility in the financial markets, and volatility in the commodities markets could have a material adverse effect on our business, financial condition or results of operations.
• | Our business is impacted by general economic conditions and volatility in the United States and world financial markets. |
• | Therefore, since a significant component of our credit-rating based revenue is transaction-based, and is essentially dependent on the number and dollar volume of debt securities issued in the capital markets, unfavorable financial or economic conditions that either reduce investor demand for debt securities or reduce issuers’ willingness or ability to issue such securities could reduce the number and dollar volume of debt issuances for which Ratings provides credit ratings. |
• | Our Indices business is impacted by market volatility, asset levels of investment products tracking indices, and trading volumes of certain exchange traded derivatives. A decrease in our revenues attributable to these products could have a material adverse effect on our business, financial condition or results of operations. Volatile capital markets, as well as changing investment styles, among other factors, may influence an investor’s decision to invest in and maintain an investment in an index-linked investment product. |
• | Increases in interest rates or credit spreads, volatility in financial markets or the interest rate environment, significant political or economic events, defaults of significant issuers and other market and economic factors may negatively impact the general level of debt issuance, the debt issuance plans of certain categories of borrowers, the level of derivatives trading and/or the types of credit-sensitive products being offered, any of which could have a material adverse effect on our business, financial condition or results of operations. |
• | Our Platts business is impacted by volatility in the commodities markets. Weak economic conditions, especially in our key markets, including the energy industry, could reduce demand for our products, impacting our revenues and margins. As a result of volatility in commodity prices and trading activity in physical commodities and commodities derivatives, we may encounter difficulty in achieving sustained market acceptance of past or future contract terms, which could have a material adverse effect on our financial position, results of operations and cash flows. |
• | Any weakness in the macroeconomic environment could constrain customer budgets across the markets we serve, potentially leading to a reduction in their employee headcount and a decrease in demand for our subscription-based products. |
Increasing regulation of our Ratings business in the United States, Europe and elsewhere can increase our costs of doing business and therefore could have a material adverse effect on our business, financial condition or results of operations.
• | The financial services industry is highly regulated, rapidly evolving and subject to the potential for increasing regulation in the United States, Europe and elsewhere. The businesses conducted by Ratings are in certain cases regulated under the Credit Rating Agency Reform Act of 2006 (the “Reform Act”), the Dodd-Frank Wall Street Reform and Consumer Protection Act (the “Dodd-Frank Act”), the U.S. Securities Exchange Act of 1934 (the “Exchange Act”), and/or the laws of the states or other jurisdictions in which they conduct business. |
• | In the past several years, the U.S. Congress, the International Organization of Securities Commissions ("IOSCO"), the SEC and the European Commission, including through the European Securities Market Authority ("ESMA"), as well as regulators in other countries in which Ratings operates, have been reviewing the role of rating agencies and their processes and the need for greater oversight or regulations concerning the issuance of credit ratings or the activities of credit rating agencies. Other laws, regulations and rules relating to credit rating agencies are being considered by local, national and |
8
multinational bodies and are likely to continue to be considered in the future, including provisions seeking to reduce regulatory and investor reliance on credit ratings, and liability standards applicable to credit rating agencies.
• | These laws and regulations, and any future rulemaking, could result in reduced demand for credit ratings and increased costs, which we may be unable to pass through to customers. In addition, there may be uncertainty over the scope, interpretation and administration of such laws and regulations. We may be required to incur significant expenses in order to comply with such laws and regulations and to mitigate the risk of fines, penalties or other sanctions. Legal proceedings could become increasingly lengthy and there may be uncertainty over and exposure to liability. It is difficult to accurately assess the future impact of legislative and regulatory requirements on our business and our customers’ businesses, and they may affect Ratings’ communications with issuers as part of the rating assignment process, alter the manner in which Ratings’ ratings are developed, affect the manner in which Ratings or its customers or users of credit ratings operate, impact the demand for ratings and alter the economics of the credit ratings business. Each of these developments increases the costs and legal risk associated with the issuance of credit ratings and may have a material adverse effect on our operations, profitability and competitiveness, the demand for credit ratings and the manner in which such ratings are utilized. |
• | Additional information regarding rating agencies is provided under Item 7, Management’s Discussion and Analysis of Financial Condition and Results of Operations, in this Annual Report on Form 10-K. |
Our Indices and Market and Commodities Intelligence businesses are subject to the potential for increased or changing regulation in the United States, Europe and elsewhere, which can increase our costs of doing business globally and therefore could have a material adverse effect on our business, financial condition or results of operations.
• | In addition to the extensive and evolving U.S. laws and regulations, foreign jurisdictions, principally in Europe, have taken measures to increase regulation of the financial services and commodities industries. |
• | In October of 2012, IOSCO issued its Principles for Oil Price Reporting Agencies ("PRA Principles"), which IOSCO states are intended to enhance the reliability of oil price assessments that are referenced in derivative contracts subject to regulation by IOSCO members. Platts has taken steps to align its operations with the PRA Principles and, as recommended by IOSCO in its final report on the PRA Principles, has aligned to the PRA Principles for other commodities for which it publishes benchmarks. |
• | In July of 2013, IOSCO issued its Principles for Financial Benchmarks ("Financial Benchmark Principles"), which are intended to promote the reliability of benchmark determinations, and address governance, benchmark quality and accountability mechanisms, including with regard to the indices published by Indices. Indices has taken steps to align its governance regime and operations with the Financial Benchmark Principles and engages an independent auditor to perform an annual reasonable assurance review of such alignment. |
• | The benchmark industry is subject to the new regulation in the European Union (the “EU Benchmark Regulation”) as well as potential increased regulation of financial benchmarks in other jurisdictions. The EU Benchmark Regulation was published on June 30, 2016, with provisions applicable to Indices and Platts, effective from January 1, 2018. ESMA has published additional guidance clarifying that existing benchmark administrators such as Indices and Platts may utilize the transitional provisions contained in the EU Benchmark Regulation, which provides them two (2) years to implement and seek authorization by an EU National Competent Authority by January 1, 2020, with their respective benchmark activities in Europe. This legislation will likely cause additional operating obligations but they are not expected to be material at this time, although the exact impact remains unclear. |
• | The EU has finalized a package of legislative measures called the Markets in Financial Instruments Directive and Regulation (collectively "MiFID II"), which revise and update the existing Markets in Financial Instruments Directive (2004) and its associated secondary legislation. MiFID II entered into force on July 2, 2014, and the substantive provisions apply in all EU Member States as of January 3, 2018. MiFID II includes provisions that, among other things: (i) mandate new conditions and requirements on the licensing of benchmarks for the purposes of clearing related securities and provide for non-discriminatory access to exchanges and clearing houses for this purpose; (ii) modify the categorization and treatment of certain classes of derivatives; (iii) expand the categories of trading venues that are subject to regulation; (iv) require the unbundling of investment research from other services, including execution services, and direct that investment firms must pay for research either out of a dedicated research payment account which is paid for by clients or from the investment firm’s profits; and (v) provide for the mandatory trading of certain derivatives on exchanges (complementing the mandatory derivative clearing requirements in the EU Market Infrastructure Regulation of 2011, or EMIR). The introduction of the MiFID II package may result in changes to the manner in which S&P Dow Jones Indices and Platts license their indices and price assessments, respectively, and could also have an indirect impact on the credit ratings and third-party research products offered by other divisions of the Company for use within the EU. MiFID II and the Market Abuse Regulation (“MAR”) may impose additional regulatory burdens on the activities of S&P Dow Jones Indices and Market and Commodities Intelligence in the EU, although the exact impact and costs are not yet known. |
• | Market and Commodities Intelligence operates regulated investment advisory businesses in the United States and the European Union. This business and other Market and Commodities Intelligence businesses may increasingly become |
9
subject to new or more stringent regulations that will increase the cost of doing business, which could have a material adverse effect on our business, financial condition or results of operations.
Recent and future legislation, regulatory reform or policy changes under the current U.S. administration could have a material effect on our business and results of operations.
• | The recently enacted tax reform in the United States significantly changes the tax rules applicable to U.S. domiciled corporations. Changes such as lower corporate tax rates, full expensing for qualified property, taxation of offshore earnings, limitations on interest expense deductions, and changes to the municipal bond tax exemption may impact demand for our products and services. At this time, we cannot assess what the overall effect of such legislation could be on our results of operations or cash flows. |
• | Other legislation, regulatory reform or policy changes under the current U.S. administration, such as financial services regulatory reform, U.S. oil deregulation, government-sponsored enterprise (GSE) reform and increased infrastructure spending could impact our business. At this time, we cannot predict the scope or nature of these changes or assess what the overall effect of such potential changes could be on our results of operations or cash flows. |
Regulatory changes and economic conditions leading up to and following the United Kingdom’s withdrawal from the European Union could have a material adverse effect on our business and results of operations.
• | Voters in the United Kingdom ("UK") approved an exit from the EU via a referendum on June 23, 2016. On March 29, 2017, the UK invoked Article 50 of the Treaty on the European Union, commencing the process to leave the EU (“Brexit”). Negotiations on the terms of the UK’s future relationship with the EU are ongoing, with the UK due to exit the EU on March 29, 2019. |
• | Any impact from Brexit on the Company will depend, in part, on the outcome of tariff, trade and other negotiations. In addition, Brexit could lead to legal uncertainty and potentially divergent national laws and regulations between the UK and the EU as the UK determines which EU laws to replace or replicate and the EU determines how to treat regulated activities (e.g., the activities of credit rating agencies) originating in the UK. Our businesses are subject to increasing regulation of the financial services and commodities industries in Europe. Potential changes in EU regulation and/or additional regulation in the UK could cause additional operating obligations and increased costs for our businesses. |
• | Changes to UK immigration policy as a result of Brexit could adversely affect our ability to retain talent for our European operations. |
• | Any of these effects of Brexit, and others we cannot anticipate, could adversely affect our business, business opportunities, results of operations, financial condition and cash flows. |
We may become subject to liability based on the use of our products by our clients.
• | Some of our products support the investment processes and other activities of our clients, which, in the aggregate, manage trillions of dollars of assets. Use of our products as part of such activities, including the investment process creates the risk that clients, or the parties whose assets are managed by our clients, may pursue claims against us for very significant dollar amounts, which could have a material adverse effect on our business, financial condition or results of operations. |
• | Any such claim, even if the outcome were to be ultimately favorable to us, would involve a significant commitment of our management, personnel, financial and other resources and could have a negative impact on our reputation. In addition, such claims and lawsuits could have a material adverse effect on our business, financial condition or results of operations. |
Increased competition could result in a loss of market share or revenue.
• | The markets for credit ratings, financial research, investment advisory services, market data, index-based products, and commodities price assessments and related news and information about these markets are intensely competitive. Ratings, Market and Commodities Intelligence and Indices compete domestically and internationally on the basis of a number of factors, including the quality of their ratings, data, research and advisory services, client service, reputation, price, geographic scope, range of products and technological innovation. |
• | While our businesses face competition from traditional content and analytics providers, we also face competition from non-traditional providers such as exchanges, asset managers, investment banks and technology-led companies that are adding content and analytics capabilities to their core businesses. |
• | In addition, in some of the countries in which Ratings competes, governments may provide financial or other support to locally-based rating agencies and may from time to time establish official credit rating agencies, credit ratings criteria or procedures for evaluating local issuers. |
• | Sustained downward pressure on oil and other commodities prices and trading activity in those markets could have a material adverse effect on the rate of growth of Platts’ revenue, including subscription and licensing fees. |
10
Introduction of new products or services could impact our profitability.
• | We operate in highly competitive markets that continue to change to adapt to customer needs. In order to maintain a competitive position, we must continue to invest in new offerings and new ways to deliver our products and services. These investments may not be profitable or may be less profitable than what we have experienced historically. |
• | We could experience threats to our existing businesses from the rise of new competitors due to the rapidly changing environment in which we operate. |
Our ability to develop, adapt, or implement new and improved processes and technology may adversely impact our business, financial condition or results of operations.
• | The rapid change of technology is a key feature of all of the markets in which we operate. To succeed in the future, we will need to deploy improved processes and technology to innovate, design, develop, assemble, test, market, and support new products and enhancements to our existing products in a timely and cost-effective manner. |
• | Innovation and constant development in support of new products and enhancements to existing products calls for the implementation of new and improved processes and technologies that require related change management efforts. |
• | The products we develop or license may contain undetected errors or defects despite testing. Such errors may exist during any part of a product’s life cycle and may persist notwithstanding extensive testing. Deploying products containing such errors may damage our reputation and the costs associated with remediating such errors may have an impact on our profitability. |
• | While we employ a certain level of internal and external resources to mitigate the risks associated with implementing process and technology improvements, we may face unexpected challenges in execution that may require more management attention than expected, thus diverting management time and energy from other businesses. The foregoing and other unforeseen factors could also result in business being disrupted for a period of time as well as additional commitments of financial resources. |
A significant increase in operating costs and expenses could have a material adverse effect on our profitability.
• | Our major expenditures include employee compensation and capital investments. |
• | We offer competitive salary and benefit packages in order to attract and retain the quality employees required to grow and expand our businesses. Compensation costs are influenced by general economic factors, including those affecting the cost of health insurance and postretirement benefits, and any trends specific to the employee skill sets we require. |
• | We make significant investments in information technology data centers and other technology initiatives and we cannot provide assurances that such investments will result in increased revenues. |
• | Although we believe we are prudent in our investment strategies and execution of our implementation plans, there is no assurance as to the ultimate recoverability of these investments. |
Increased availability of free or relatively inexpensive information sources may reduce demand for our products and could have a material adverse effect on our business, financial condition or results of operations.
• | In recent years, more public sources of free or relatively inexpensive information have become available, particularly through the Internet, and advances in public cloud computing and open source software may continue. |
• | Public sources of free or relatively inexpensive information may reduce demand for our products and services. Demand could also be reduced as a result of cost-cutting initiatives at certain companies and organizations. Although we believe our products are enhanced by our analysis, tools and applications, our financial results may be adversely affected if our customers choose to use these public sources as a substitute for our products or services. |
Consolidation of customers as well as staffing levels across our customer base could impact our available markets and revenue growth.
• | Our businesses have a customer base which is largely comprised of members from the corporate, financial services and commodities industries. The consolidation of customers resulting from mergers and acquisitions across these industries can result in reductions in the number of firms and workforce which can impact the size of our customer base. |
• | Our customers that strive to reduce their operating costs may seek to reduce their spending on our products and services. If a large number of smaller customers or a critical number of larger customers reduce their spending with us, our business, financial condition or results of operations could be materially and adversely affected. |
• | Alternatively, customers may use other strategies to reduce their overall spending on financial and commodity market products and services by consolidating their spending with fewer vendors, including by selecting other vendors with |
11
lower-cost offerings, or by self-sourcing their need for financial and commodity market products and services. If customers elect to consolidate their spending on financial and commodity market products and services with other vendors and not us, if we lose business to lower priced competitors, or if customers elect to self-source their product and service needs, our business, financial condition or results of operations could be materially and adversely affected.
• | A material portion of our revenues in our Indices business is concentrated in some of our largest customers, who have significant assets under management in index funds and exchange-traded funds. A loss of a substantial portion of revenue from our largest customers could have a material and adverse effect on our business, financial condition or results of operations. |
If we lose key outside suppliers of data and products or if the data or products of these suppliers have errors or are delayed, we may not be able to provide our clients with the information and products they desire.
• | Our ability to produce our products and develop new products is dependent upon the products of other suppliers, including certain data, software and service suppliers. Some of our products and their related value are dependent upon updates from our data suppliers and most of our information and data products are dependent upon continuing access to historical and current data. |
• | We utilize certain data provided by third-party data sources in a variety of ways, including large volumes of data from certain stock exchanges around the world. |
• | If the data from our suppliers has errors, is delayed, has design defects, is unavailable on acceptable terms or is not available at all, it could have a material adverse effect on our business, financial condition or results of operations. |
• | Some of our agreements with data suppliers allow them to cancel on short notice. Termination of one or more of our significant data agreements or exclusion from, or restricted use of, or litigation in connection with, a data provider’s information could decrease the available information for us to use (and offer our clients) and could have a material adverse effect on our business, financial condition or results of operations. |
Changes in the legislative, regulatory, and commercial environments in which we operate may materially and adversely impact our ability to collect, compile, use, and publish data and may impact our financial results.
• | Certain types of information we collect, compile, use, and publish, including offerings in our Market and Commodities Intelligence business, are subject to regulation by governmental authorities in jurisdictions in which we operate. In addition, there is increasing concern among certain privacy advocates and government regulators regarding marketing and privacy matters, particularly as they relate to individual privacy interests. |
• | There has been increased public attention regarding the use of personal information and data transfer, accompanied by legislation and regulations intended to strengthen data protection, information security and consumer and personal privacy. The law in these areas continues to develop and the changing nature of privacy laws in the U.S., the European Union and elsewhere could impact our processing of personal and sensitive information of our employees, vendors and customers. The European Union adopted a comprehensive General Data Privacy Regulation (the “GDPR”) in May 2016 that will replace the current EU Data Protection Directive and related country-specific legislation. The GDPR will become fully effective in May 2018. GDPR requires companies to satisfy new requirements regarding the handling of personal and sensitive data, including its use, protection and the ability of persons whose data is stored to correct or delete such data about themselves. |
• | Failure to comply with GDPR requirements could result in penalties of up to 4% of worldwide revenue. GDPR and other similar laws and regulations, as well as any associated inquiries or investigations or any other government actions, may be costly to comply with, result in negative publicity, increase our operating costs, require significant management time and attention, and subject us to remedies that may harm our business, including fines or demands or orders that we modify or cease existing business practices. |
• | Continued privacy concerns may result in new or amended laws and regulations. Future laws and regulations with respect to the collection, compilation, use, and publication of information and consumer privacy could result in limitations on our operations, increased compliance or litigation expense, adverse publicity, or loss of revenue, which could have a material adverse effect on our business, financial condition, and results of operations. It is also possible that we could be prohibited from collecting or disseminating certain types of data, which could affect our ability to meet our customers’ needs. |
Our ability to protect our intellectual property rights could impact our competitive position.
• | We consider many of our products and services to be proprietary. Failure to protect our intellectual property adequately could harm our reputation and affect our ability to compete effectively. Businesses we acquire may also have intellectual property portfolios which increase the complexity of managing our intellectual property portfolio and protecting our competitive position. |
12
• | Our products contain intellectual property delivered through a variety of digital and other media. Our ability to achieve anticipated results depends in part on our ability to defend our intellectual property rights against infringement and misappropriation. Our business, financial condition or results of operations could be materially and adversely affected by inadequate or changing legal and technological protections for intellectual property and proprietary rights in some jurisdictions and markets. |
• | Our products also contain intellectual property of third party sources. Any violation by us of the intellectual property rights of such third parties could result in termination of the relevant source agreement, litigation and reputational damage which could materially and adversely affects our business, financial condition or results of operations. |
We are exposed to multiple risks associated with the global nature of our operations.
• | The geographic breadth of our activities subjects us to significant legal, economic, operational, market, compliance and reputational risks. These include, among others, risks relating to: |
▪ | economic and political conditions around the world, |
▪ | inflation, |
▪ | fluctuation in interest rates and currency exchange rates, |
▪ | limitations that foreign governments may impose on the conversion of currency or the payment of dividends or other remittances to us from our non-U.S. subsidiaries, |
▪ | differing accounting principles and standards, |
▪ | unexpected increases in taxes or changes in U.S. or foreign tax laws, |
▪ | potential costs and difficulties in complying with a wide variety of foreign laws and regulations (including tax systems) administered by foreign government agencies, some of which may conflict with U.S. or other sources of law, |
▪ | changes in applicable laws and regulatory requirements, |
▪ | the possibility of nationalization, expropriation, price controls and other restrictive governmental actions, |
▪ | competition with local rating agencies that have greater familiarity, longer operating histories and/or support from local governments or other institutions, |
▪ | civil unrest, terrorism, unstable governments and legal systems, and other factors. |
Adverse developments in any of these areas could have a material adverse effect on our business, financial condition or results of operations.
• | Additionally, we are subject to complex U.S., European and other local laws and regulations that are applicable to our operations abroad, including trade sanctions laws, anti-corruption and anti-bribery laws such as the U.S. Foreign Corrupt Practices Act and the UK Bribery Act 2010, anti-money laundering laws, and other financial crimes laws. Although we have implemented internal controls, policies and procedures and employee training and compliance programs to deter prohibited practices, such measures may not be effective in preventing employees, contractors or agents from violating or circumventing such internal policies and violating applicable laws and regulations. Any determination that we have violated trade sanctions, anti-bribery or anti-corruption laws could have a material adverse effect on our business, financial condition or results of operations. |
• | Compliance with international and U.S. laws and regulations that apply to our international operations increases the cost of doing business in foreign jurisdictions. Violations of such laws and regulations may result in fines and penalties, criminal sanctions, administrative remedies, or restrictions on business conduct and could have a material adverse effect on our reputation, our ability to attract and retain employees, our business, financial condition or results of operations. |
Our inability to successfully recover should we experience a disaster or other business continuity problem could cause material financial loss, loss of human capital, regulatory actions, reputational harm or legal liability.
• | Should we experience a local or regional disaster or other business continuity problem, such as an earthquake, hurricane, flood, terrorist attack, pandemic, security breach, cyberattack, power loss, telecommunications failure or other natural or man-made disaster, our ability to continue to operate will depend, in part, on the availability of our personnel, our office facilities and the proper functioning of our computer, telecommunication and other related systems and operations. In such an event, we could experience operational challenges with regard to particular areas of our operations, such as key executive officers or personnel, that could have a material adverse effect on our business. |
• | We regularly assess and take steps to improve our existing business continuity plans and key management succession. However, a disaster on a significant scale or affecting certain of our key operating areas within or across regions, or our inability to successfully recover should we experience a disaster or other business continuity problem, could materially interrupt our business operations and result in material financial loss, loss of human capital, regulatory actions, reputational harm, damaged client relationships or legal liability. |
13
Outsourcing certain aspects of our business could result in disruption and increased costs.
• | We have outsourced certain functions to third-party service providers to leverage leading specialized capabilities and achieve cost efficiencies. Outsourcing these functions involves the risk that the third-party service providers may not perform to our standards or legal requirements, may not produce reliable results, may not perform in a timely manner, may not maintain the confidentiality of our proprietary information, or may fail to perform at all. Failure of these third parties to meet their contractual, regulatory, confidentiality, or other obligations to us could result in material financial loss, higher costs, regulatory actions and reputational harm. |
• | Outsourcing these functions also involves the risk that the third-party service providers may not maintain adequate physical, technical and administrative safeguards to protect the security of our confidential information and data. Failure of these third parties to maintain these safeguards could result in unauthorized access to our systems or a system or network disruption that could lead to improper disclosure of confidential information or data, regulatory penalties and remedial costs. |
• | We also rely on the business infrastructure and systems of third parties with whom we do business and to whom we outsource the maintenance and development of operational and technological functionality, including third-party cloud infrastructure. Our cloud infrastructure providers, or other service providers, could experience system breakdowns or failures, outages, downtime, cyberattacks, adverse changes to financial condition, bankruptcy or other adverse conditions, which could have a material adverse effect on our business and reputation. Thus, our plans to increase the amount of our infrastructure that we outsource to “the cloud” or to other third parties may increase our risk exposure. |
We rely heavily on network systems and the Internet and any failures or disruptions may adversely affect our ability to serve our customers.
• | Many of our products and services are delivered electronically, and our customers rely on our ability to process transactions rapidly and deliver substantial quantities of data on computer-based networks. Our customers also depend on the continued capacity, reliability and security of our electronic delivery systems, our websites and the Internet. |
• | Our ability to deliver our products and services electronically may be impaired due to infrastructure or network failures, malicious or defective software, human error, natural disasters, service outages at third-party Internet providers or increased government regulation. |
• | Delays in our ability to deliver our products and services electronically may harm our reputation and result in the loss of customers. In addition, a number of our customers entrust us with storing and securing their data and information on our servers. |
• | Although we have disaster recovery plans that include backup facilities for our primary data centers, our systems are not always fully redundant, and our disaster planning may not always be sufficient or effective. As such, these disruptions may affect our ability to store, handle and secure such data and information. |
Our operations and infrastructure may malfunction or fail, which could have a material adverse effect on our business, financial condition or results of operations.
• | Our ability to conduct business may be materially and adversely impacted by a disruption in the infrastructure that supports our businesses and the communities in which we are located, including New York City, the location of our headquarters, and major cities worldwide in which we have offices. |
• | This may include a disruption involving physical or technological infrastructure used by us or third parties with or through whom we conduct business, whether due to human error, natural disasters, power loss, telecommunication failures, break-ins, sabotage, intentional acts of vandalism, acts of terrorism, political unrest, war or otherwise. Our efforts to secure and plan for potential disruptions of our major operating systems may not be successful. |
• | We rely on our information technology environment and certain critical databases, systems and applications to support key product and service offerings. We believe we have appropriate policies, processes and internal controls to ensure the stability of our information technology, provide security from unauthorized access to our systems and maintain business continuity, but our business could be subject to significant disruption and our business, financial condition or results of operations could be materially and adversely affected by unanticipated system failures, data corruption or unauthorized access to our systems. |
• | We also do not have fully redundant systems for most of our smaller office locations and low-risk systems, and our disaster recovery plan does not include restoration of non-essential services. If a disruption occurs in one of our locations or systems and our personnel in those locations or those who rely on such systems are unable to utilize other systems or communicate with or travel to other locations, such persons’ ability to service and interact with our clients and customers may suffer. |
14
• | We cannot predict with certainty all of the adverse effects that could result from our failure, or the failure of a third party, to efficiently address and resolve these delays and interruptions. A disruption to our operations or infrastructure could have a material adverse effect on our business, financial condition or results of operations. |
We are exposed to risks related to cybersecurity and protection of confidential information.
• | Our operations rely on the secure processing, storage and transmission of confidential, sensitive and other types of data and information in our computer systems and networks and those of our third-party vendors. |
• | All of our businesses have access to material non-public information concerning the Company’s customers, including sovereigns, corporate issuers and other third parties around the world, the unauthorized disclosure of which could affect the trading markets for such customers’ securities and could damage such customers’ competitive positions. The cyber risks the Company faces range from cyberattacks common to most industries, to more sophisticated and targeted attacks intended to obtain unauthorized access to certain information or systems due in part to our prominence in the global marketplace, such as our ratings on debt issued by sovereigns and corporate issuers, or the composition of our indices. Unauthorized disclosure of this information could cause our customers to lose faith in our ability to protect their confidential information and therefore cause customers to cease doing business with us. |
• | Breaches of our or our vendors’ systems and networks, whether from circumvention of security systems, denial-of-service attacks or other cyberattacks, hacking, computer viruses or malware, employee error, malfeasance, physical breaches or other actions, may cause material interruptions or malfunctions in our or such vendors’ websites, applications or data processing, or may compromise the confidentiality and integrity of material information regarding us, our business or our customers. |
• | Misappropriation, improper modification, destruction, corruption or unavailability of our data and information due to cyber incidents, attacks or other security breaches could damage our brand and reputation, result in litigation and regulatory actions, and lead to loss of customer confidence in our security measures and reliability, which would harm our ability to retain customers and gain new ones. |
• | Although S&P Global and its affiliates devote significant resources to maintain and regularly update their systems and processes that are designed to protect the security of our computer systems, software, networks and other technology assets and the confidentiality, integrity and availability of information belonging to the enterprise and our customers, clients and employees, there is no assurance that all of our security measures will provide absolute security. |
• | Measures that we take to avoid or mitigate material incidents can be expensive, and may be insufficient, circumvented, or become obsolete. Any material incidents could cause us to experience reputational harm, loss of customers, regulatory actions, sanctions or other statutory penalties, litigation or financial losses that are either not insured against or not fully covered through any insurance maintained by us, and increased expenses related to addressing or mitigating the risks associated with any such material incidents. |
• | Cyber threats are rapidly evolving and are becoming increasingly sophisticated. Despite our efforts to ensure the integrity of our systems, as cyber threats evolve and become more difficult to detect and successfully defend against, one or more cyber threats might defeat the measures that we or our vendors take to anticipate, detect, avoid or mitigate such threats. Certain techniques used to obtain unauthorized access, introduce malicious software, disable or degrade service, or sabotage systems may be designed to remain dormant until a triggering event and we may be unable to anticipate these techniques or implement adequate preventative measures since techniques change frequently or are not recognized until launched, and because cyberattacks can originate from a wide variety of sources. |
• | If an actual or perceived breach of our security occurs, the market perception of the effectiveness of our security measures could be harmed and could result in damage to our reputation and a loss of confidence in the security of our products and services. |
• | The theft, loss, or misuse of personal data collected, used, stored, or transferred by us to run our business could result in significantly increased security costs or costs related to defending legal claims. Global privacy legislation, enforcement, and policy activity in this area are rapidly expanding and creating a complex regulatory compliance environment. Costs to comply with and implement these privacy-related and data protection measures could be significant. In addition, if despite our best efforts an inadvertent failure to comply with federal, state, or international privacy-related or data protection laws and regulations should occur, this could result in proceedings against us by governmental entities or others. |
• | Given the extent to which our businesses are privy to material non-public information concerning the Company’s customers, our data could be improperly used, including for insider trading by our employees and third party vendors with access to key systems. It is not always possible to deter misconduct by employees or third party vendors. The precautions we take to detect and prevent such activity, including implementing and training on insider trading policies for our employees and contractual obligations for our third party vendors, may not be effective in all cases. Any breach of our clients’ confidences as a result of employee or third party vendor misconduct could harm our reputation. |
• | Any of the foregoing could have a material adverse effect on our business, financial condition or results of operations. |
15
Inability to attract and retain key qualified personnel could have a material adverse effect on our business and results of operations.
• | The development, maintenance and support of our products and services are dependent upon the knowledge, experience and ability of our highly skilled, educated and trained employees. Accordingly, our business is dependent on successfully attracting and retaining talented employees. If the Company is less successful in its recruiting efforts, or if it is unable to retain key employees, its ability to develop and deliver successful products and services or achieve strategic goals may be adversely affected. |
Our brand and reputation are key assets and competitive advantages of our Company and our business may be affected by how we are perceived in the marketplace.
• | Our ability to attract and retain customers is affected by external perceptions of our brand and reputation. Negative perceptions or publicity could damage our reputation with customers, prospects and the public generally, which could negatively impact, among other things, our ability to attract and retain customers, employees and suppliers, as well as suitable candidates for acquisition or other combinations. |
16
Item 1b. Unresolved Staff Comments
None.
Item 2. Properties
Our corporate headquarters are located in leased premises located at 55 Water Street, New York, NY 10041. We lease office facilities at 97 locations; 31 are in the U.S. In addition, we own real property at 7 locations, of which 2 are in the U.S. Our properties consist primarily of office space used by each of our segments. We believe that all of our facilities are well maintained and are suitable and adequate for our current needs.
Item 3. Legal Proceedings
For information on our legal proceedings, see Note 13 – Commitments and Contingencies under Item 8, Consolidated Financial Statements and Supplementary Data, in this Annual Report on Form 10-K.
Item 4. Mine Safety Disclosures
Not applicable.
17
Executive Officers of the Registrant
The following individuals are the executive officers of the Company:
Name | Age | Position | ||
Douglas L. Peterson | 59 | President and Chief Executive Officer | ||
Ewout L. Steenbergen | 48 | Executive Vice President, Chief Financial Officer | ||
Ratings | ||||
John L. Berisford | 54 | President, S&P Global Ratings | ||
Market and Commodities Intelligence | ||||
Michael A. Chinn | 45 | President, S&P Global Market Intelligence & Executive Vice President, Data and Technology Innovation, S&P Global | ||
Martin E. Fraenkel | 57 | President, S&P Global Platts | ||
Martina L. Cheung | 42 | Head of Global Risk Services | ||
Indices | ||||
Alexander J. Matturri, Jr. | 59 | Chief Executive Officer, S&P Dow Jones Indices | ||
S&P Global Functions | ||||
Nicholas D. Cafferillo | 46 | Chief Technology Officer and Chief Operating Officer, S&P Global Market Intelligence | ||
Courtney C. Geduldig | 42 | Executive Vice President, Public Affairs | ||
S. Swamy Kocherlakota | 51 | Chief Information Officer | ||
Steven J. Kemps | 53 | Executive Vice President, General Counsel | ||
Nancy J. Luquette | 52 | Senior Vice President, Chief Risk & Audit Executive | ||
Mr. Berisford, prior to becoming President of S&P Global Ratings on November 3, 2015, was Executive Vice President, Human Resources since 2011. Prior to that, he held senior management positions at PepsiCo, including Senior Vice President, Human Resources for Pepsi Beverages Company.
Mr. Cafferillo, prior to becoming Chief Technology Officer on January 1, 2018, was and continues to serve as Chief Operating Officer, S&P Global Market Intelligence. Prior to joining S&P Global, Mr. Cafferillo was Chief Operating Officer of SNL Financial LC.
Ms. Cheung, prior to becoming Head of Global Risk Services on November 3, 2015, held management positions at S&P Global Ratings and was most recently S&P Global’s Chief Strategy Officer. Prior to joining S&P Global, she worked in the consulting industry, first in Accenture’s Financial Services Strategy group and later as a Partner at Mitchell Madison Consulting.
Mr. Chinn, prior to becoming President, S&P Global Market Intelligence and Executive Vice President, Data and Technology Innovation on January 1, 2018, he was President of Market and Commodities Intelligence since September 2016. Mr. Chinn has been and continues to be President of S&P Global Market Intelligence since September 2015. He was previously Chief Executive Officer of SNL since 2010 and President of SNL since 2000.
Mr. Fraenkel, prior to becoming President of S&P Global Platts in September 2016, was Global Head of Content, responsible for leading Platts’ 450-member global editorial and analytics team, as well as being a member of the Platts Executive Committee regarding the division’s strategy and offerings in data, pricing, news and analysis. Mr. Fraenkel joined S&P Global Platts in June 2015 from CME Group, where he was Managing Director and Global Head of Energy.
Ms. Geduldig, prior to becoming Executive Vice President, Public Affairs on May 1, 2015, was Managing Director, Global Government and Public Policy since 2013, and Vice President of Global Regulatory Affairs at S&P Global Ratings. Prior to that, she was Managing Director and Head of Federal Government Relations at the Financial Services Forum.
18
Mr. Kocherlakota, prior to becoming Chief Information Officer on January, 1, 2018, was Global Head of Infrastructure & Cloud and Enterprise Services since July, 2017. Prior to that, he was Senior Vice President, Global Head of Technology Operations & Infrastructure at Visa, Inc.
Mr. Kemps, prior to becoming Executive Vice President, General Counsel at S&P Global in August 2016, served as Executive Vice President and General Counsel at Quanta Services, where he oversaw all legal affairs and advised the business on regulatory, ethical and compliance matters. Prior to joining Quanta, he served as General Counsel of Hess Retail Corporation and Dean Foods Company.
Ms. Luquette, prior to becoming Senior Vice President, Chief Risk & Audit Executive for S&P Global in June 2016, led the S&P Global Internal Audit function and the Ratings Risk Review function for S&P Global Ratings as the Chief Audit Executive for the Company. She became S&P Global’s Chief Risk & Audit Executive and assumed leadership of the Risk Management function in June 2016. Before joining the Company, Ms. Luquette was Vice President and General Auditor for Avaya, and prior to that was a Partner in PwC’s Internal Audit and Global Risk Management Services practices.
Mr. Matturri, prior to becoming Chief Executive Officer at S&P Dow Jones Indices on July 2, 2012, served as an Executive Managing Director of S&P Indices. Prior to joining S&P Indices, Mr. Matturri served as Senior Vice President and Director of Global Equity Index Management at Northern Trust Global Investments (NTGI). He previously held management positions with Deutsche Asset Management’s Index and Quantitative Investment business and The Bank of New York.
Mr. Peterson, prior to becoming President and Chief Executive Officer on November 1, 2013, was President of Standard & Poor's Ratings Services since 2011. Prior to that, he was Chief Operating Officer of Citibank, NA.
Mr. Steenbergen, prior to becoming Executive Vice President and Chief Financial Officer at S&P Global in November 2016, was Executive Vice President and Chief Financial Officer of Voya Financial, Inc. Prior to his role as Voya's Chief Financial Officer, Mr. Steenbergen was Chief Financial Officer and Chief Risk Officer for ING Asia-Pacific and held a number of management roles for ING Group, including serving as regional general manager in Hong Kong and as a Chief Executive Officer of RVS, an ING Group company based in the Netherlands.
19
PART II
Item 5. Market for the Registrant’s Common Equity, Related Stockholder Matters and Issuer Purchases of Equity Securities
Price Range of Common Stock
On January 26, 2018, the closing price of our common stock was $183.80 per share as reported on the New York Stock Exchange (“NYSE”) under the ticker symbol “SPGI”. S&P Global Inc. began trading under its new ticker symbol "SPGI" on April 28, 2016. Previously, the Company's common stock traded on the NYSE under the ticker symbol "MHFI". The approximate number of record holders of our common stock as of January 26, 2018 was 3,093. The high and low sales prices of S&P Global Inc.'s common stock on the NYSE for the past two fiscal years are as follows:
2017 | 2016 | ||
First Quarter | $133.08 - $108.49 | $99.85 - $78.55 | |
Second Quarter | 150.40 - 127.60 | 112.75 - 95.83 | |
Third Quarter | 158.35 - 145.72 | 128.40 - 104.75 | |
Fourth Quarter | 174.07 - 153.25 | 127.68 - 107.21 | |
Year | 174.07 - 108.49 | 128.40 - 78.55 | |
The performance graph below compares our cumulative total shareholder return during the previous five years with a performance indicator of the overall market (i.e., S&P 500), and our peer group. The peer group consists of the following companies: Thomson Reuters Corporation, Moody’s Corporation, CME Group Inc., MSCI Inc., FactSet Research Systems Inc. and IHS Markit Ltd. Returns assume $100 invested on December 31, 2012 and total return includes reinvestment of dividends through December 31, 2017.
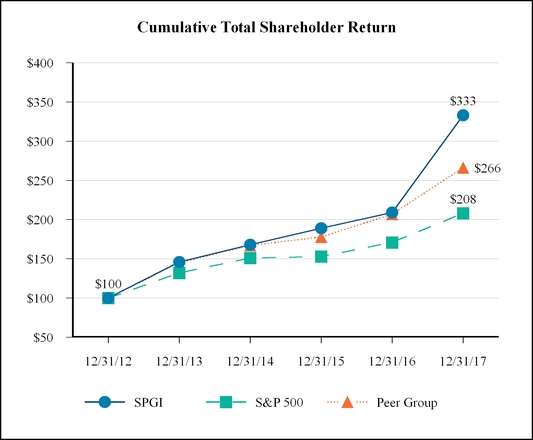
20
Dividends
We expect to continue our policy of paying regular cash dividends, although there is no assurance as to future dividend payments because they depend on future earnings, capital requirements and our financial condition. Regular quarterly dividends per share of our common stock for 2017 and 2016 were as follows:
2017 | 2016 | ||||||
$0.41 per quarter in 2017 | $ | 1.64 | |||||
$0.36 per quarter in 2016 | $ | 1.44 | |||||
On February 2, 2018, the Board of Directors approved an increase in the quarterly common stock dividend from $0.41 per share to $0.50 per share.
Transfer Agent and Registrar for Common Stock
Computershare is the transfer agent for S&P Global. Computershare maintains the records for the Company's registered shareholders and can assist with a variety of shareholder related services.
Shareholder correspondence should be mailed to:
Computershare
P.O. Box 505000
Louisville, KY 40233
Overnight correspondence should be mailed to:
Computershare
462 South 4th Street, Suite 1600
Louisville, KY 40202
Visit the Investor Center™ website to view and manage shareholder account online: www.computershare.com/investor
For shareholder assistance:
In the U.S. and Canada: | 888-201-5538 |
Outside the U.S. and Canada: | 201-680-6578 |
TDD for the hearing impaired: | 800-231-5469 |
TDD outside the U.S. and Canada: | 201-680-6610 |
E-mail address: | web.queries@computershare.com |
Shareholder online inquiries | https://www-us.computershare.com/investor/Contact |
Repurchase of Equity Securities
On December 4, 2013, the Board of Directors approved a share repurchase program authorizing the purchase of up to 50 million shares, which was approximately 18% of the Company's outstanding shares at that time. During the fourth quarter of 2017, we repurchased 1.4 million shares which included 0.5 million shares received from the conclusion of our accelerated share repurchase ("ASR") agreement that we entered into on August 1, 2017. Further discussion relating to our ASR agreement can be found in Note 9 - Equity. As of December 31, 2017, 19 million shares remained under our current repurchase program.
Repurchased shares may be used for general corporate purposes, including the issuance of shares for stock compensation plans and to offset the dilutive effect of the exercise of employee stock options. Our current repurchase program has no expiration date and purchases under this program may be made from time to time on the open market and in private transactions, depending on market conditions.
The following table provides information on our purchases of our outstanding common stock during the fourth quarter of 2017 pursuant to our current share repurchase program (column c). In addition to these purchases, the number of shares in column (a) include shares of common stock that are tendered to us to satisfy our employees’ tax withholding obligations in connection with the vesting of awards of restricted shares (we repurchase such shares based on their fair market value on the vesting date).
21
There were no other share repurchases during the quarter outside the repurchases noted below.
Period | (a) Total Number of Shares Purchased | (b) Average Price Paid per Share | (c) Total Number of Shares Purchased as Part of Publicly Announced Programs | (d) Maximum Number of Shares that may yet be Purchased Under the Programs | ||||||||
Oct. 1 - Oct. 31, 2017 1 | 470,341 | $ | 154.46 | 470,064 | 19.9 million | |||||||
Nov. 1 - Nov. 30, 2017 | 457,704 | 161.26 | 457,500 | 19.5 million | ||||||||
Dec. 1 - Dec. 31, 2017 | 483,119 | 169.37 | 479,400 | 19.0 million | ||||||||
Total — Qtr | 1,411,164 | $ | 161.77 | 1,406,964 | 19.0 million | |||||||
1 Includes 0.5 million shares received from the conclusion of our ASR agreement that we entered into on August 1, 2017.
Equity Compensation Plan
For information on securities authorized under our equity compensation plans, see Item 12, Security Ownership of Certain Beneficial Owners and Management and Related Stockholder Matters.
22
Item 6. Selected Financial Data
(in millions, except per share data) | 2017 | 2016 | 2015 | 2014 | 2013 | |||||||||||||||
Income statement data: | ||||||||||||||||||||
Revenue | $ | 6,063 | $ | 5,661 | $ | 5,313 | $ | 5,051 | $ | 4,702 | ||||||||||
Operating profit | 2,610 | 3,369 | 1,917 | 113 | 1,358 | |||||||||||||||
Income before taxes on income | 2,461 | 1 | 3,188 | 2 | 1,815 | 3 | 54 | 4 | 1,299 | 5 | ||||||||||
Provision for taxes on income | 823 | 6 | 960 | 547 | 245 | 425 | ||||||||||||||
Net income (loss) from continuing operations attributable to S&P Global Inc. | 1,496 | 2,106 | 1,156 | (293 | ) | 783 | ||||||||||||||
Earnings (loss) per share from continuing operations attributable to the S&P Global Inc. common shareholders: | ||||||||||||||||||||
Basic | 5.84 | 8.02 | 4.26 | (1.08 | ) | 2.85 | ||||||||||||||
Diluted | 5.78 | 7.94 | 4.21 | (1.08 | ) | 2.80 | ||||||||||||||
Dividends per share | 1.64 | 1.44 | 1.32 | 1.20 | 1.12 | |||||||||||||||
Operating statistics: | ||||||||||||||||||||
Return on average equity 7 | 223.0 | % | 472.0 | % | 324.3 | % | (1.4 | )% | 134.2 | % | ||||||||||
Income from continuing operations before taxes on income as a percent of revenue from continuing operations | 40.6 | % | 56.3 | % | 34.2 | % | 1.1 | % | 27.6 | % | ||||||||||
Net income (loss) from continuing operations as a percent of revenue from continuing operations | 27.0 | % | 39.4 | % | 23.9 | % | (3.8 | )% | 18.6 | % | ||||||||||
Balance sheet data: 7 | ||||||||||||||||||||
Working capital | $ | 1,110 | $ | 1,060 | $ | 388 | $ | 42 | $ | 612 | ||||||||||
Total assets | 9,425 | 8,669 | 8,183 | 6,773 | 6,060 | |||||||||||||||
Total debt | 3,569 | 3,564 | 3,611 | 795 | 794 | |||||||||||||||
Redeemable noncontrolling interest | 1,350 | 1,080 | 920 | 810 | 810 | |||||||||||||||
Equity | 768 | 701 | 243 | 539 | 1,344 | |||||||||||||||
Number of employees 8 | 20,400 | 20,000 | 20,400 | 17,000 | 16,400 | |||||||||||||||
1 | Includes the impact of the following items: legal settlement expenses of $55 million, employee severance charges of $44 million, a charge to exit leased facilities of $25 million, non-cash acquisition and disposition-related adjustments of $15 million, a pension related charge of $8 million, an asset write-off of $2 million and amortization of intangibles from acquisitions of $98 million. |
2 | Includes the impact of the following items: a $1.1 billion gain from our dispositions, a benefit related to net legal settlement insurance recoveries of $10 million, disposition-related costs of $48 million, a technology-related impairment charge of $24 million, employee severance charges of $6 million, a $3 million disposition-related reserve release, an acquisition-related cost of $1 million and amortization of intangibles from acquisitions of $96 million. |
3 | Includes the impact of the following items: costs related to identified operating efficiencies primarily related to employee severance charges of $56 million, net legal settlement expenses of $54 million, acquisition-related costs of $37 million, an $11 million gain on dispositions and amortization of intangibles from acquisitions of $67 million. |
4 | Includes the impact of the following items: $1.6 billion of legal and regulatory settlements, employee severance charges of $86 million, $4 million of professional fees largely related to corporate development activities and amortization of intangibles from acquisitions of $48 million. |
5 | Includes the impact of the following items: $77 million of legal settlements, $64 million charge for costs necessary to enable the separation of McGraw-Hill Education and reduce our cost structure, a $36 million non-cash impairment charge related to the sale of our data center, employee severance charges of $28 million, a charge to exit leased facilities of $13 million, a $24 million net gain from our dispositions and amortization of intangibles from acquisitions of $51 million. |
6 | Includes $149 million of tax expense due to U.S. tax reform, primarily associated with the deemed repatriation of foreign earnings, which was partially offset by a $21 million tax benefit related to prior year divestitures. |
7 | Includes the impact of the $1.1 billion gain on dispositions in 2016, the gain on sale of McGraw Hill Construction in 2014 and the gain on sale of McGraw-Hill Education in 2013. |
8 | Excludes discontinued operations. |
23
Item 7. Management’s Discussion and Analysis of Financial Condition and Results of Operations
The following Management's Discussion and Analysis (“MD&A”) provides a narrative of the results of operations and financial condition of S&P Global Inc. (together with its consolidated subsidiaries, the “Company,” “we,” “us” or “our”) for the years ended December 31, 2017 and 2016, respectively. The MD&A should be read in conjunction with the consolidated financial statements and accompanying notes included in this Annual Report on Form 10-K for the year ended December 31, 2017, which have been prepared in accordance with accounting principles generally accepted in the U.S. (“U.S. GAAP”).
The MD&A includes the following sections:
• | Overview |
• | Results of Operations |
• | Liquidity and Capital Resources |
• | Reconciliation of Non-GAAP Financial Information |
• | Critical Accounting Estimates |
• | Recent Accounting Standards |
Certain of the statements below are forward-looking statements within the meaning of the Private Securities Litigation Reform Act of 1995. In addition, any projections of future results of operations and cash flows are subject to substantial uncertainty. See Forward-Looking Statements on page 4 of this report.
OVERVIEW
We are a leading provider of transparent and independent ratings, benchmarks, analytics and data to the capital and commodity markets worldwide. The capital markets include asset managers, investment banks, commercial banks, insurance companies, exchanges, trading firms and issuers; and the commodity markets include producers, traders and intermediaries within energy, metals, petrochemicals and agriculture.
Our operations consist of three reportable segments: Ratings, Market and Commodities Intelligence and S&P Dow Jones Indices ("Indices").
• | Ratings is an independent provider of credit ratings, research and analytics, offering investors and other market participants information, ratings and benchmarks. |
• | Market and Commodities Intelligence is a global provider of multi-asset-class data, research and analytical capabilities, which integrate cross-asset analytics and desktop services and deliver their customers in the commodity and energy markets access to high-value information, data, analytic services and pricing and quality benchmarks. We completed the sale of J.D. Power on September 7, 2016, with the results included in Market and Commodities Intelligence results through that date. |
• | Indices is a global index provider maintaining a wide variety of valuation and index benchmarks for investment advisors, wealth managers and institutional investors. |
In December of 2017, we announced that S&P Global Platts, a business line within Market and Commodities Intelligence, will be managed as a separate business and comprise a separate reportable segment effective January 1, 2018. We will begin reporting the financial results of S&P Global Market Intelligence and S&P Global Platts as separate reportable segments beginning with the first quarter of 2018.
Major Portfolio Changes
The following significant changes by segment were made to our portfolio during the three years ended December 31, 2017:
2016
Market and Commodities Intelligence
• | In October of 2016, we completed the sale of Standard & Poor's Securities Evaluations, Inc. ("SPSE") and Credit Market Analysis ("CMA") for $425 million in cash to Intercontinental Exchange, an operator of global exchanges, clearing |
24
houses and data services. During year ended December 31, 2016, we recorded a pre-tax gain of $364 million ($297 million after-tax) in gain on dispositions in the consolidated statement of income related to the sale of SPSE and CMA.
• | In September of 2016, we completed the sale of J.D. Power for $1.1 billion to XIO Group, a global alternative investments firm headquartered in London. During the year ended December 31, 2016, we recorded a pre-tax gain of $728 million ($516 million after-tax) in gain on dispositions in the consolidated statement of income related to the sale of J.D. Power. |
• | In September of 2016, we acquired PIRA Energy Group ("PIRA"), a global provider of energy research and forecasting products and services. The purchase enhances Market and Commodities Intelligence's energy analytical capabilities by expanding its oil offering and strengthening its position in the natural gas and power markets. |
• | In June of 2016, we acquired RigData, a provider of daily information on rig activity for the natural gas and oil markets across North America. The purchase enhances Market and Commodities Intelligence's energy analytical capabilities by strengthening its position in natural gas and enhancing its oil offering. |
2015
Market and Commodities Intelligence
• | In September of 2015, we acquired SNL Financial LC ("SNL") for $2.2 billion. SNL is a global provider of news, data, and analytical tools to five sectors in the global economy: financial services, real estate, energy, media & communications, and metals & mining. SNL delivers information through its suite of web, mobile and direct data feed platforms that helps clients, including investment and commercial banks, investors, corporations, and regulators make decisions, improve efficiency, and manage risk. |
• | In July of 2015, we acquired the entire issued share capital of Petromedia Ltd and its operating subsidiaries (“Petromedia”), an independent provider of data, intelligence, news and tools to the global fuels market that offers a suite of products providing clients with actionable data and intelligence that enable informed decisions, minimize risk and increase efficiency. |
In 2015, we further reduced our real estate footprint by completing the consolidation of our corporate headquarters with our operations in New York City.
Increased Shareholder Return
During the three years ended December 31, 2017, we have returned approximately $4.3 billion to our shareholders through a combination of share repurchases and our quarterly dividends: we completed share repurchases of approximately $3.1 billion and distributed regular quarterly dividends totaling approximately $1.2 billion. Also, on February 2, 2018, the Board of Directors approved an increase in the quarterly common stock dividend from $0.41 per share to $0.50 per share.
Key Results
(in millions) | Year ended December 31, | % Change 1 | |||||||||||||
2017 | 2016 | 2015 | ’17 vs ’16 | ’16 vs ’15 | |||||||||||
Revenue | $ | 6,063 | $ | 5,661 | $ | 5,313 | 7% | 7% | |||||||
Operating profit 2 | $ | 2,610 | $ | 3,369 | $ | 1,917 | (23)% | 76% | |||||||
% Operating margin | 43 | % | 60 | % | 36 | % | |||||||||
Diluted earnings per share from net income | $ | 5.78 | $ | 7.94 | $ | 4.21 | (27)% | 89% | |||||||
25
1 | % changes in the tables throughout the MD&A are calculated off of the actual number, not the rounded number presented. |
2 | 2017 includes legal settlement expenses of $55 million, employee severance charges of $44 million, a charge to exit leased facilities of $25 million, non-cash acquisition and disposition-related adjustments of $15 million, a pension related charge of $8 million and an asset write-off of $2 million. 2016 includes a $1.1 billion gain from our dispositions, a benefit related to net legal settlement insurance recoveries of $10 million, disposition-related costs of $48 million, a technology-related impairment charge of $24 million, employee severance charges of $6 million, a $3 million disposition-related reserve release and acquisition-related costs of $1 million. 2015 includes costs related to identified operating efficiencies primarily related to employee severance charges of $56 million, net legal settlement expenses of $54 million, acquisition-related costs of $37 million and a gain of $11 million on the sale of our interest in a legacy McGraw Hill Construction investment. 2017, 2016 and 2015 also includes amortization of intangibles from acquisitions of $98 million, $96 million, and $67 million, respectively. |
2017
Revenue increased 7% driven by increases at Ratings and Indices, partially offset by a decrease at Market and Commodities Intelligence. The increase at Ratings was primarily due to growth in bank loan ratings revenue and corporate bond ratings revenue. Revenue growth at Indices was primarily due to higher levels of assets under management for exchange traded funds ("ETFs") and mutual funds. The decrease at Market and Commodities Intelligence was primarily due to the disposition of non-core businesses in 2016, partially offset by annualized contract value growth in the S&P Global Market Intelligence Desktop and Global Risk Services products and continued demand for Platts’ proprietary content at S&P Global Platts.
Operating profit decreased 23%. Excluding the unfavorable impact of the gain on dispositions in 2016 of 37 percentage points, higher net legal settlement expenses in 2017 of 2 percentage points, higher employee severance charges in 2017 of 1 percentage point, a charge to exit leased facilities of 1 percentage point and non-cash acquisition and disposition-related adjustments in 2017 of 1 percentage point, partially offset by the favorable impact of higher disposition-related costs in 2016 of 1 percentage point, operating profit increased 18%. This increase was primarily due to revenue growth at Ratings and Indices as discussed above, partially offset by higher compensation costs due to increased incentive costs and additional headcount.
2016
Revenue increased 7% driven by increases at all of our reportable segments. Revenue growth at Market and Commodities Intelligence was favorably impacted by the acquisition of SNL in September of 2015 and annualized contract value growth primarily driven by the S&P Capital IQ Desktop, Global Risk Services and certain data feed products within Data Management Solutions. Continued demand for S&P Global Platts’ proprietary content also contributed to revenue growth. These increases were partially offset by the unfavorable impact from our dispositions in 2016. Revenue growth at Ratings was driven by an increase in U.S. bank loan ratings revenue, corporate bond ratings revenue and surveillance fees. Revenue growth at Indices was due to higher average levels of assets under management for ETFs and mutual funds, an increase in data revenue and higher volumes for exchange-traded derivatives.
Operating profit increased 76%. Excluding the favorable impact of the gain from our dispositions of 59 percentage points, higher net legal settlement insurance recoveries in 2016 of 3 percentage points, higher employee severance charges in 2015 of 3 percentage points and higher acquisition-related costs in 2015 of 2 percentage points, partially offset by the unfavorable impact of higher disposition-related costs of 3 percentage points, higher amortization of intangibles from acquisitions of 2 percentage points and a technology-related impairment charge of 1 percentage point, operating profit increased 15%. This increase was primarily driven by revenue growth as discussed above. Decreased costs at Ratings and our legacy Capital IQ business due to reduced headcount following our 2015 restructuring actions also contributed to operating profit growth.
Our Strategy
We are a leading provider of transparent and independent ratings, benchmarks, analytics and data to the capital and commodity markets worldwide. Our purpose is to provide the intelligence that is essential for companies, governments and individuals to make decisions with conviction. We seek to deliver on this purpose within the framework of our core values of integrity, excellence and relevance.
We seek to deliver an exceptional, differentiated customer experience across the globe. We strive for operational excellence, continuous innovation, and a high performance culture driven by our best-in-class talent. In 2018, we will strive to deliver on our strategic priorities in the following four categories by:
26
Finance
• | Achieving financial targets and creating shareholder value by focusing on organic revenue growth and continuing to deliver margin expansion with a focus on operating leverage and efficiency opportunities; and |
• | Outperforming traditional and nontraditional competitors. |
Customer
• | Delivering greater customer value through deeper client and market insights, innovative solutions, stronger internal teamwork and reliable, nimble Go-to-Market processes; |
• | Enriching and modernizing the user experience to improve customer loyalty; |
• | Identifying and executing transformative growth opportunities; and |
• | Accelerating investments and coordination in building new products and in developing new markets. |
Operations
• | Enhancing planning and software engineering processes to speed up the delivery of content and products; |
• | Applying lean management, robotics, automation and machine learning to streamline internal workflow and deliver productivity; |
• | Strengthening our Digital Infrastructure capabilities, with emphasis on workplace services and cybersecurity; and |
• | Upholding our commitment to a disciplined and practical risk, control and compliance environment. |
People
• | Creating a performance culture to drive innovation, flexibility and agility to address customer needs; |
• | Committing to leadership development programs and skills training; |
• | Embracing and expanding diversity and inclusion in our workforce; and |
• | Enhancing and augmenting technology talent and skills across the company. |
There can be no assurance that we will achieve success in implementing any one or more of these strategies as a variety of factors could unfavorably impact operating results, including prolonged difficulties in the global credit markets and a change in the regulatory environment affecting our businesses. See Item 1a, Risk Factors, in this Annual Report on Form 10-K.
Further projections and discussion on our 2018 outlook for our segments can be found within “ – Results of Operations”.
27
RESULTS OF OPERATIONS
Consolidated Review
(in millions) | Year ended December 31, | % Change | |||||||||||||
2017 | 2016 | 2015 | ’17 vs ’16 | ’16 vs ’15 | |||||||||||
Revenue | $ | 6,063 | $ | 5,661 | $ | 5,313 | 7% | 7% | |||||||
Expenses: | |||||||||||||||
Operating-related expenses | 1,713 | 1,773 | 1,718 | (3)% | 3% | ||||||||||
Selling and general expenses | 1,560 | 1,439 | 1,532 | 8% | (6)% | ||||||||||
Depreciation and amortization | 180 | 181 | 157 | (1)% | 15% | ||||||||||
Total expenses | 3,453 | 3,393 | 3,407 | 2% | —% | ||||||||||
Gain on dispositions | — | (1,101 | ) | (11 | ) | N/M | N/M | ||||||||
Operating profit | 2,610 | 3,369 | 1,917 | (23)% | 76% | ||||||||||
Interest expense, net | 149 | 181 | 102 | (18)% | 77% | ||||||||||
Provision for taxes on income | 823 | 960 | 547 | (14)% | 76% | ||||||||||
Net income | 1,638 | 2,228 | 1,268 | (27)% | 76% | ||||||||||
Less: net income attributable to noncontrolling interests | (142 | ) | (122 | ) | (112 | ) | 16% | 9% | |||||||
Net income attributable to S&P Global Inc. | $ | 1,496 | $ | 2,106 | $ | 1,156 | (29)% | 82% | |||||||
N/M - not meaningful
Revenue
(in millions) | Year ended December 31, | % Change | |||||||||||||
2017 | 2016 | 2015 | ’17 vs ’16 | ’16 vs ’15 | |||||||||||
Subscription / Non-transaction revenue | $ | 3,796 | $ | 3,623 | $ | 3,260 | 5% | 11% | |||||||
Asset-linked fees | $ | 461 | $ | 381 | $ | 369 | 21% | 3% | |||||||
Non-subscription / Transaction revenue | $ | 1,806 | $ | 1,657 | $ | 1,684 | 9% | (2)% | |||||||
% of total revenue: | |||||||||||||||
Subscription / Non-transaction revenue | 63 | % | 64 | % | 61 | % | |||||||||
Asset-linked fees | 7 | % | 7 | % | 7 | % | |||||||||
Non-subscription / Transaction revenue | 30 | % | 29 | % | 32 | % | |||||||||
U.S. revenue | $ | 3,658 | $ | 3,461 | $ | 3,202 | 6% | 8% | |||||||
International revenue: | |||||||||||||||
European region | 1,473 | 1,330 | 1,265 | 11% | 5% | ||||||||||
Asia | 594 | 575 | 566 | 3% | 2% | ||||||||||
Rest of the world | 338 | 295 | 280 | 14% | 6% | ||||||||||
Total international revenue | $ | 2,405 | $ | 2,200 | $ | 2,111 | 9% | 4% | |||||||
% of total revenue: | |||||||||||||||
U.S. revenue | 60 | % | 61 | % | 60 | % | |||||||||
International revenue | 40 | % | 39 | % | 40 | % | |||||||||
28
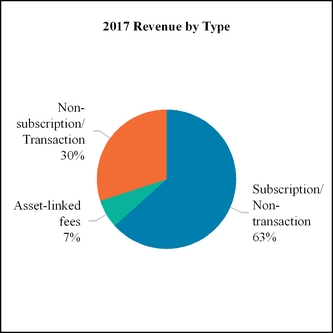
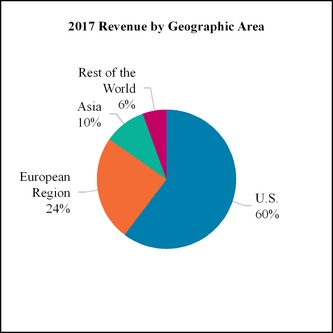
2017
Revenue increased 7% as compared to 2016. Subscription / non-transaction revenue increased primarily from growth in S&P Global Market Intelligence's average contract values, continued demand for Platts’ proprietary content and an increase in surveillance fees at Ratings, partially offset by the unfavorable impact of the disposition of non-core businesses in 2016. Asset-linked fees increased due to the impact of higher levels of assets under management for ETFs and mutual funds. Non-subscription / transaction revenue increased primarily due to bank loan ratings revenue and corporate bond ratings revenue at Ratings, partially offset by the unfavorable impact of the disposition of non-core businesses in 2016. See “Segment Review” below for further information.
Foreign exchange rates had a negligible impact on revenue. This impact refers to constant currency comparisons estimated by recalculating current year results of foreign operations using the average exchange rate from the prior year.
2016
Revenue increased 7% as compared to 2015. Subscription / non-transaction revenue increased primarily from the favorable impact of the acquisition of SNL in September 2015, growth in average contract values for our legacy Capital IQ products driven by an expansion in new and existing accounts, continued demand for S&P Global Platts' proprietary content and an increase in surveillance fees at Ratings. Asset-linked fees increased due to higher levels of assets under management for ETFs and mutual funds. Non-subscription / transaction revenue decreased primarily due to the unfavorable impact of the sale of J.D. Power on September 7, 2016, partially offset by an increase in U.S. bank loan ratings revenue and corporate bond ratings revenue at Ratings and higher volumes for exchange traded derivatives at Indices. See " – Segment Review" below for further information.
Foreign exchange rates had a negligible impact on revenue. This impact refers to constant currency comparisons estimated by recalculating current year results of foreign operations using the average exchange rate from the prior year.
29
Total Expenses
The following tables provide an analysis by segment of our operating-related expenses and selling and general expenses for the years ended December 31, 2017 and 2016:
(in millions) | 2017 | 2016 | % Change | ||||||||||||||||
Operating- related expenses | Selling and general expenses | Operating- related expenses | Selling and general expenses | Operating- related expenses | Selling and general expenses | ||||||||||||||
Ratings 1 | $ | 850 | $ | 581 | $ | 797 | $ | 442 | 7% | 32% | |||||||||
Market and Commodities Intelligence 2 | 833 | 699 | 958 | 774 | (13)% | (10)% | |||||||||||||
Indices | 139 | 111 | 116 | 104 | 21% | 7% | |||||||||||||
Intersegment eliminations 3 | (109 | ) | — | (98 | ) | — | (12)% | N/M | |||||||||||
Total segments | 1,713 | 1,391 | 1,773 | 1,320 | (3)% | 5% | |||||||||||||
Corporate 4 | — | 169 | — | 119 | N/M | 42% | |||||||||||||
$ | 1,713 | $ | 1,560 | $ | 1,773 | $ | 1,439 | (3)% | 8% | ||||||||||
N/M - not meaningful
1 | In 2017, selling and general expenses include legal settlement expenses of $55 million and employee severance charges of $25 million. In 2016, selling and general expenses include a benefit related to net legal settlement insurance recoveries of $10 million and employee severance charges of $6 million. |
2 | In 2017, selling and general expenses include non-cash acquisition and disposition-related adjustments of $15 million, employee severance charges of $9 million, a charge to exit a leased facility of $6 million, and an asset write-off of $2 million. In 2016, selling and general expenses include disposition-related costs of $48 million, a technology-related impairment charge of $24 million and acquisition-related costs of $1 million. |
3 | Intersegment eliminations relate to a royalty charged to Market and Commodities Intelligence for the rights to use and distribute content and data developed by Ratings. |
4 | In 2017, selling and general expenses include a charge to exit leased facilities of $19 million, employee severance charges of $10 million and a pension related charge of $8 million. In 2016, selling and general expenses include $3 million from a disposition-related reserve release. |
Operating-Related Expenses
Operating-related expenses decreased $60 million or 3% as compared to 2016. The decrease at Market and Commodities Intelligence was due to the disposition of non-core businesses in 2016. This decrease was partially offset by increases at Ratings and Indices due to higher compensation costs related to increased incentive costs and additional headcount.
Selling and General Expenses
Selling and general expenses increased 8%. Excluding the unfavorable impact of higher net legal settlement expenses in 2017 of 4 percentage points, higher employee severance charges in 2017 of 3 percentage points, a charge to exit leased facilities in 2017 of 2 percentage points and non-cash acquisition and disposition related costs in 2017 of 1 percentage point, partially offset by the favorable impact of higher disposition-related costs in 2016 of 3 percentage points and a technology-related impairment charge in 2016 of 2 percentage points, selling and general expenses increased 3 percentage points. The increase is due to higher compensation costs related to incentives and additional headcount at Ratings and Indices and an increase at Corporate primarily due to performance related incentive compensation and Company-wide technology projects. This increase was partially offset by a decrease at Market and Commodities Intelligence as a result of business divestitures in 2016.
Depreciation and Amortization
Depreciation and amortization remained relatively unchanged as compared to 2016, decreasing $1 million or 1%.
30
The following tables provide an analysis by segment of our operating-related expenses and selling and general expenses for the years ended December 31, 2016 and 2015:
(in millions) | 2016 | 2015 | % Change | ||||||||||||||||
Operating- related expenses | Selling and general expenses | Operating- related expenses | Selling and general expenses | Operating- related expenses | Selling and general expenses | ||||||||||||||
Ratings 1 | $ | 797 | $ | 442 | $ | 767 | $ | 541 | 4% | (18)% | |||||||||
Market and Commodities Intelligence 2 | 958 | 774 | 925 | 769 | 4% | 1% | |||||||||||||
Indices | 116 | 104 | 114 | 82 | 1% | 26% | |||||||||||||
Intersegment eliminations 3 | (98 | ) | — | (88 | ) | — | (10)% | N/M | |||||||||||
Total segments | 1,773 | 1,320 | 1,718 | 1,392 | 3% | (5)% | |||||||||||||
Corporate 4 | — | 119 | — | 140 | N/M | (15)% | |||||||||||||
$ | 1,773 | $ | 1,439 | $ | 1,718 | $ | 1,532 | 3% | (6)% | ||||||||||
N/M - not meaningful
1 | In 2016, selling and general expenses include a benefit related to net legal settlement insurance recoveries of $10 million and employee severance charges of $6 million. In 2015, selling and general expenses include net legal settlement expenses of $54 million and employee severance charges $13 million. |
2 | In 2016, selling and general expenses include disposition-related costs of $48 million, a technology-related impairment charge of $24 million and acquisition-related costs of $1 million. In 2015, selling and general expenses include acquisition-related costs related to the acquisition of SNL of $37 million and costs related to identified operating efficiencies primarily related to employee severance charges of $33 million. |
3 | Intersegment eliminations relate to a royalty charged to Market and Commodities Intelligence for the rights to use and distribute content and data developed by Ratings. |
4 | In 2016, selling and general expenses include $3 million from a disposition-related reserve release and 2015 includes costs related to identified operating efficiencies primarily related to employee severance charges of $10 million |
Operating-Related Expenses
Operating-related expenses increased $55 million or 3% as compared to 2015. The increase at Market and Commodities Intelligence was primarily driven by the acquisition of SNL in September of 2015, partially offset by decreases from our dispositions in 2016. The increase at Ratings and Indices were due to higher compensation costs related to additional headcount and increased incentive costs.
Selling and General Expenses
Selling and general expenses decreased 6%. Excluding the favorable impact of higher net legal settlement insurance recoveries in 2016 of 4 percentage points, higher employee severance charges in 2015 of 3 percentage points, higher acquisition-related costs in 2015 of 2 percentage points, partially offset by the unfavorable impact of disposition-related costs of 3 percentage points and a technology-related impairment charge of 1 percentage point, selling and general expenses decreased 1%. Decreases at Ratings were driven by reduced professional fees following the completion of the Company's program for the 2015 implementation of the Dodd-Frank Wall Street Reform and Consumer Protection Act and reduced legal fees following the resolution of a number of significant legal matters. This decrease was partially offset by an increase at Market and Commodities Intelligence driven by the acquisition of SNL in September of 2015, partially offset by decreases from our dispositions in 2016.
Depreciation and Amortization
Depreciation and amortization increased $24 million or 15% as compared to 2015, primarily due to higher intangible asset amortization in 2016 from the acquisition of SNL in September of 2015.
Gain on Dispositions
During 2016, we completed the following transactions that resulted in a pre-tax gain of $1.1 billion in gain on dispositions in the consolidated statement of income:
• | In October of 2016, we completed the sale of SPSE and CMA for $425 million in cash to Intercontinental Exchange, an operator of global exchanges, clearing houses and data services. We recorded a pre-tax gain of $364 million in gain on dispositions in the consolidated statement of income related to the sale of SPSE and CMA. Additionally, in October of 2016, we completed the sale of Equity and Fund Research ("Equity Research") to CFRA, a leading independent provider |
31
of forensic accounting research, analytics and advisory services. During the year ended December 31, 2016, we recorded a pre-tax gain of $9 million in gain on dispositions in the consolidated statement of income related to the sale of Equity Research.
• | In September of 2016, we completed the sale of J.D. Power for $1.1 billion to XIO Group, a global alternative investments firm headquartered in London. We recorded a pre-tax gain of $728 million in gain on dispositions in the consolidated statement of income related to the sale of J.D. Power. |
During 2015, we completed the sale of our interest in a legacy McGraw Hill Construction investment that resulted in a pre-tax gain of $11 million in gain on dispositions in the consolidated statement of income.
Operating Profit
We consider operating profit to be an important measure for evaluating our operating performance and we evaluate operating profit for each of the reportable business segments in which we operate.
We internally manage our operations by reference to operating profit with economic resources allocated primarily based on each segments contribution to operating profit. Segment operating profit is defined as operating profit before unallocated expense. Segment operating profit is not, however, a measure of financial performance under U.S. GAAP, and may not be defined and calculated by other companies in the same manner.
The table below reconciles segment operating profit to total operating profit:
(in millions) | Year ended December 31, | % Change | |||||||||||||
2017 | 2016 | 2015 | ’17 vs ’16 | ’16 vs ’15 | |||||||||||
Ratings 1 | $ | 1,524 | $ | 1,262 | $ | 1,078 | 21% | 17% | |||||||
Market and Commodities Intelligence 2 | 793 | 1,822 | 585 | (56)% | N/M | ||||||||||
Indices 3 | 471 | 412 | 392 | 14% | 5% | ||||||||||
Total segment operating profit | 2,788 | 3,496 | 2,055 | (20)% | 70% | ||||||||||
Unallocated expense 4 | (178 | ) | (127 | ) | (138 | ) | 40% | (8)% | |||||||
Total operating profit | $ | 2,610 | $ | 3,369 | $ | 1,917 | (23)% | 76% | |||||||
N/M - not meaningful
1 | 2017 includes legal settlement expenses of $55 million and employee severance charges of $25 million. 2016 includes a benefit related to net legal settlement insurance recoveries of $10 million and employee severance charges of $6 million. 2015 includes net legal settlement expenses of $54 million and employee severance charges of $13 million. 2017, 2016 and 2015 also includes amortization of intangibles from acquisitions of $4 million, $5 million and $5 million, respectively. |
2 | 2017 includes non-cash acquisition and disposition-related adjustments of $15 million, employee severance charges of $9 million, a charge to exit a leased facility of $6 million, and an asset write-off of $2 million. 2016 includes a $1.1 billion gain from our dispositions, disposition-related costs of $48 million, a technology-related impairment charge of $24 million and an acquisition-related cost of $1 million. 2015 includes acquisition-related costs related to the acquisition of SNL of $37 million and costs identified operating efficiencies primarily related to employee severance charges of $33 million. 2017, 2016 and 2015 includes amortization of intangibles from acquisitions of $87 million, $85 million and $57 million, respectively. |
3 | 2017, 2016 and 2015 includes amortization of intangibles from acquisitions of $7 million, $6 million and $5 million, respectively. |
4 | 2017 includes a charge to exit leased facilities of $19 million, employee severance charges of $10 million and a pension related charge of $8 million. 2016 includes $3 million from a disposition-related reserve release. 2015 includes a gain of $11 million related to the sale of our interest in a legacy McGraw Hill Construction investment and costs related to identified operating efficiencies primarily related to employee severance charges of $10 million. |
2017
Segment Operating Profit — Decreased $0.7 billion, or 20% as compared to 2016. Excluding the unfavorable impact of the gain on dispositions in 2016 of 36 percentage points, higher net legal settlement expenses in 2017 of 2 percentage points, higher employee severance charges in 2017 of 1 percentage point and non-cash acquisition and disposition-related adjustments in 2017 of 1 percentage point, partially offset by the favorable impact of higher disposition-related costs in 2016 of 2 percentage points and a technology-related impairment charge in 2016 of 1 percentage point, segment operating profit increased 17%. This increase
32
was primarily due to revenue growth at Ratings and Indices as discussed above, partially offset by higher compensation costs due to additional increased incentive costs and additional headcount. See “ – Segment Review” below for further information.
Unallocated Expense — Increased by $51 million or 40% as compared to 2016. These expenses, included in selling and general expenses, mainly include costs for corporate center functions, select initiatives and unoccupied office space. Excluding the unfavorable impact of a charge to exit leased facilities in 2017 of 14 percentage points, a pension related charge in 2017 of 7 percentage points, employee severance charges in 2017 of 8 percentage points and a disposition-related reserve release in 2016 of 2 percentage points, unallocated expense increased 9%. This increase was primarily due to performance related incentive compensation and Company-wide technology projects.
Foreign exchange rates had a favorable impact on operating profit of 1 percentage point. The foreign exchange rate impact refers to constant currency comparisons and the remeasurement of monetary assets and liabilities. Constant currency impacts are estimated by recalculating current year results of foreign operations using the average exchange rate from the prior year. Remeasurement impacts are based on the variance between current-year and prior-year foreign exchange rate fluctuations on monetary assets and liabilities denominated in currencies other than the individual business' functional currency.
2016
Segment Operating Profit — Increased $1.4 billion, or 70% as compared to 2015. Excluding the favorable impact of the gain from our dispositions of 55 percentage points, higher net legal settlement insurance recoveries in 2016 of 3 percentage points, higher acquisition-related costs in 2015 of 2 percentage points, higher employee severance charges in 2015 of 2 percentage points, partially offset by the unfavorable impact of a technology-related impairment charge of 1 percentage point, higher amortization of intangibles from acquisitions of 2 percentage points and higher disposition-related costs of 2 percentage points, segment operating profit increased 13%. Revenue growth at Market and Commodities Intelligence, Ratings and Indices were the primary drivers for the increase. Decreased costs at Ratings and our legacy Capital IQ business due to reduced headcount following our 2015 restructuring actions also contributed to segment operating profit growth. See “ – Segment Review” below for further information.
Unallocated Expense — Decreased by $11 million or 8% as compared to 2015. These expenses, included in selling and general expenses, mainly include costs for corporate center functions, select initiatives and unoccupied office space. Excluding the unfavorable impact of a gain on the sale of our interest in a legacy McGraw Hill Construction investment in 2015 of 8 percentage points, partially offset by the favorable impact of a disposition-related reserve release of 2 percentage points and higher employee severance charges in 2015 of 7 percentage points, unallocated expense decreased 7% due to higher 2016 pension income as well as a reduction in professional service fees.
Foreign exchange rates had a favorable impact on operating profit of 2 percentage points. The foreign exchange rate impact refers to constant currency comparisons and the remeasurement of monetary assets and liabilities. Constant currency impacts are estimated by recalculating current year results of foreign operations using the average exchange rate from the prior year. Remeasurement impacts are based on the variance between current-year and prior-year foreign exchange rate fluctuations on monetary assets and liabilities denominated in currencies other than the individual business' functional currency.
Interest Expense, net
Net interest expense for 2017 decreased $32 million or 18% as compared to 2016, primarily as a result of the favorable impact of lower interest rates on the $500 million of senior notes issued in 2016 compared to the $400 million senior notes that were repaid in the third quarter of 2016.
Net interest expense for 2016 increased $79 million or 77% as compared to 2015, primarily as a result of the $700 million of senior notes issued in the second quarter of 2015, the $2.0 billion of senior notes issued in the third quarter of 2015 and the $500 million of senior notes issued in the third quarter of 2016. Additionally, net interest expense in 2016 includes a redemption fee on the early payment of our 5.9% senior notes due in 2017. These increases were partially offset by the favorable impact of lower interest rates on the $500 million of senior notes issued in the third quarter of 2016.
Provision for Income Taxes
Comprehensive tax legislation, enacted through the Tax Cuts and Jobs Act (“TCJA”) on December 22, 2017, significantly modified U.S. corporate income tax law. Provisional amounts have been recorded in our financial statements based on the Company’s initial analysis of the TCJA. The Company may adjust these amounts in future periods if our interpretation of the TCJA changes or as additional guidance from the U.S. Treasury becomes available. As a result of the TCJA, a provisional amount of $149 million has been recorded which reflects a one-time tax charge of approximately $173 million on the deemed repatriation of foreign earnings
33
and a one-time tax benefit of approximately $24 million in respect of the re-valuation of net U.S. deferred tax liabilities at the reduced corporate income tax rate. While the TCJA reduced net income in 2017, the Company is anticipating an ongoing future benefit from the lower corporate income tax rate.
Our effective tax rate was 33.4% for 2017, and 30.1% for 2016 and 2015. The increase in 2017 was primarily due to the one-time tax charge for the deemed repatriation of foreign earnings, net of the recognition of excess tax benefits associated with share-based payments in the statement of income and the re-valuation of net U.S. deferred tax liabilities at the reduced corporate income tax rate.
The Company is continuously subject to tax examinations in various jurisdictions. In May 2017, the IRS issued a 30-Day Letter proposing to increase the Company’s federal income tax for the 2015 tax year by approximately $242 million. The proposed increase relates primarily to the IRS’s proposed disallowance of claimed tax deductions for certain amounts paid in 2015 to settle lawsuits by nineteen states and the District of Columbia. We vigorously disagree with the proposed adjustment and have filed a formal protest with the IRS to contest the matter before the IRS Appeals Office. This development does not materially change our initial assessment of the deductibility of our settlement payments.
Segment Review
Ratings
Ratings is an independent provider of credit ratings, research and analytics to investors, issuers and other market participants. Credit ratings are one of several tools investors can use when making decisions about purchasing bonds and other fixed income investments. They are opinions about credit risk and our ratings express our opinion about the ability and willingness of an issuer, such as a corporation or state or city government, to meet its financial obligations in full and on time. Our credit ratings can also relate to the credit quality of an individual debt issue, such as a corporate or municipal bond, and the relative likelihood that the issue may default.
Ratings differentiates its revenue between transaction and non-transaction. Transaction revenue primarily includes fees associated with:
• | ratings related to new issuance of corporate and government debt instruments, and structured finance debt instruments; |
• | bank loan ratings; and |
• | corporate credit estimates, which are intended, based on an abbreviated analysis, to provide an indication of our opinion regarding creditworthiness of a company which does not currently have a Ratings credit rating. |
Non-transaction revenue primarily includes fees for surveillance of a credit rating, annual fees for customer relationship-based pricing programs, fees for entity credit ratings and global research and analytics. Non-transaction revenue also includes an intersegment royalty charged to Market and Commodities Intelligence for the rights to use and distribute content and data developed by Ratings. Royalty revenue from Market and Commodities Intelligence for 2017, 2016 and 2015 was $100 million, $92 million and $83 million, respectively.
34
(in millions) | Year ended December 31, | % Change | ||||||||||||||||
2017 | 2016 | 2015 | ’17 vs ’16 | ’16 vs ’15 | ||||||||||||||
Revenue | $ | 2,988 | $ | 2,535 | $ | 2,428 | 18 | % | 4 | % | ||||||||
Transaction revenue | $ | 1,540 | $ | 1,178 | $ | 1,107 | 31 | % | 6 | % | ||||||||
Non-transaction revenue | $ | 1,448 | $ | 1,357 | $ | 1,321 | 7 | % | 3 | % | ||||||||
% of total revenue: | ||||||||||||||||||
Transaction revenue | 52 | % | 46 | % | 46 | % | ||||||||||||
Non-transaction revenue | 48 | % | 54 | % | 54 | % | ||||||||||||
U.S. revenue | $ | 1,716 | $ | 1,462 | $ | 1,390 | 17 | % | 5 | % | ||||||||
International revenue | $ | 1,272 | $ | 1,073 | $ | 1,038 | 19 | % | 3 | % | ||||||||
% of total revenue: | ||||||||||||||||||
U.S. revenue | 57 | % | 58 | % | 57 | % | ||||||||||||
International revenue | 43 | % | 42 | % | 43 | % | ||||||||||||
Operating profit 1 | $ | 1,524 | $ | 1,262 | $ | 1,078 | 21 | % | 17 | % | ||||||||
% Operating margin | 51 | % | 50 | % | 44 | % | ||||||||||||
1 | 2017 includes legal settlement expenses of $55 million and employee severance charges of $25 million. 2016 includes a benefit related to net legal settlement insurance recoveries of $10 million and employee severance charges of $6 million. 2015 includes net legal settlement expenses of $54 million and employee severance charges of $13 million. 2017, 2016 and 2015 also includes amortization of intangibles from acquisitions of $4 million, $5 million and $5 million, respectively. |
2017
Revenue increased 18%. Transaction revenue grew primarily due to growth in bank loan ratings revenue in the U.S. and Europe and an increase in corporate bond ratings revenue driven by an increase in corporate bond issuance. The increase in bank loan ratings revenue was driven by refinancing activity from the low interest rate environment. The increase in structured finance revenue driven by increased U.S. collateralized loan obligations and U.S. commercial mortgage-backed securities issuance also contributed to revenue growth. These increases were partially offset by a decline in public finance revenue driven by lower state and municipal bond issuance. Non-transaction revenue grew primarily due to an increase in surveillance fees and higher entity credit ratings revenue.
Operating profit increased 21%. Excluding the unfavorable impact of higher net legal settlement expenses in 2017 of 5 percentage points and higher employee severance charges in 2017 of 1 percentage point, operating profit increased 27%. This increase is primarily due to revenue growth, partially offset by higher compensation costs related to increased incentive costs and additional headcount. A reduction in legal fees and professional service fees also had a favorable impact on operating profit growth.
2016
Revenue increased 4%, which includes the unfavorable impact of foreign exchange rates that reduced revenue by 1 percentage point. Transaction revenue increased due to growth in U.S. bank loan ratings revenue and an increase in corporate bond ratings revenue largely driven by refinancing activity from the low interest rate environment, partially offset by a decrease in structured finance revenue. Revenue growth benefited from increased contract realization. Non-transaction revenue grew primarily due to an increase in surveillance fees, partially offset by a decline in Ratings Evaluation Service activity.
Operating profit increased 17%. Excluding the favorable impact of higher net legal settlement insurance recoveries in 2016 of 6 percentage points and lower employee severance charges in 2016 of 1 percentage point, operating profit increased 10%. The increase is due to both revenue growth and expense reduction. Reduced expenses were primarily driven by reduced professional fees following the completion of the Company's program for the 2015 implementation of the Dodd-Frank Wall Street Reform and Consumer Protection Act and reduced legal fees following the resolution of a number of significant legal matters. These decreases were partially offset by higher compensation costs related to increased incentive costs and additional headcount. Foreign exchange rates had a favorable impact on operating profit of 1 percentage point.
35
Market Issuance Volumes
We monitor market issuance volumes regularly within Ratings. Market issuance volumes noted within the discussion that follows are based on the domicile of the issuer. Issuance volumes can be reported in two ways: by “domicile” which is based on where an issuer is located or where the assets associated with an issue are located, or based on “marketplace” which is where the bonds are sold. The following tables depict changes in market issuance levels as compared to the prior year, based on a composite of Thomson Financial, Harrison Scott Publications, Dealogic and Ratings' internal estimates.
2017 Compared to 2016 | ||||||
Corporate Bond Issuance | U.S. | Europe | Global | |||
High-yield issuance | 24% | 63% | 53% | |||
Investment grade | 8% | (2)% | 1% | |||
Total new issue dollars — Corporate issuance | 10% | 5% | 6% | |||
• | Corporate issuance in the U.S. and Europe was up as a result of more favorable market conditions primarily due to tightening credit spreads and some issuers that went to market in advance of expected interest rate increases. Both high-yield and investment grade issuance comparisons also benefited from weakness in 2016 due to market volatility and political and economic uncertainty in the European markets. |
2017 Compared to 2016 | ||||||
Structured Finance | U.S. | Europe | Global | |||
Asset-backed securities (“ABS”) | 12% | (12)% | 7% | |||
Structured credit | 87% | 74% | 85% | |||
Commercial mortgage-backed securities (“CMBS”) | 20% | (5)% | 19% | |||
Residential mortgage-backed securities (“RMBS”) | 46% | (34)% | 3% | |||
Covered bonds | * | 9% | —% | |||
Total new issue dollars — Structured finance | 36% | 2% | 18% | |||
* Represents no activity in 2017 and 2016.
• | ABS issuance was up in the U.S. driven by an increase in auto transactions, commercial real estate loans and student loans. European ABS declined due to key auto issuers completing financing in the unsecured debt market. |
• | Issuance was up in the U.S. and European structured credit markets driven by increased collateralized loan obligations ("CLO") refinancing engagements primarily due to overall market conditions. |
• | CMBS issuance was up in the U.S. reflecting increased market volume due to a low interest rate environment and favorable reaction to the new risk retention rules. European CMBS issuance was down, although from a low 2016 base. |
• | RMBS volume in the U.S. was up driven primarily by favorable reaction to the new risk retention rules and favorable market conditions leading to increased activity in single family rentals, credit risk transfers, and non-qualified mortgage deals. EMEA issuance declined as central bank liquidity schemes provided other opportunities for funding sources. |
• | Covered bond (debt securities backed by mortgages or other high-quality assets that remain on the issuer's balance sheet) issuance in Europe was up partially due to the impact from the European Central Bank's covered bond asset purchase program. |
Industry Highlights and Outlook
Revenue increased in 2017 primarily due to an increase in bank loan ratings and corporate bond ratings revenue driven by refinancing activity from the low interest rate environment. High-yield and investment grade corporate issuance volumes increased as a result of more favorable market conditions primarily due to tightening credit spreads and some issuers that went to market in advance of expected interest rate increases.
36
Legal and Regulatory Environment
General
Ratings and many of the securities that it rates are subject to extensive regulation in both the U.S. and in other countries, and therefore existing and proposed laws and regulations can impact the Company’s operations and the markets in which it operates. Additional laws and regulations have been adopted but not yet implemented or have been proposed or are being considered. In addition, in certain countries, governments may provide financial or other support to locally-based rating agencies. For example, governments may from time to time establish official rating agencies or credit ratings criteria or procedures for evaluating local issuers. We have reviewed the new laws, regulations and rules which have been adopted and we have implemented, or are planning to implement, changes as required. We do not believe that such new laws, regulations or rules will have a material adverse effect on our financial condition or results of operations. Other laws, regulations and rules relating to credit rating agencies are being considered by local, national, foreign and multinational bodies and are likely to continue to be considered in the future, including provisions seeking to reduce regulatory and investor reliance on credit ratings, rotation of credit rating agencies and liability standards applicable to credit rating agencies. The impact on us of the adoption of any such laws, regulations or rules remains uncertain, but could increase the costs and legal risks relating to Ratings’ rating activities, or adversely affect our ability to compete, or result in changes in the demand for credit ratings.
In the normal course of business both in the U.S. and abroad, Ratings (or the legal entities comprising Ratings) are defendants in numerous legal proceedings and are often the subject of government and regulatory proceedings, investigations and inquiries. Many of these proceedings, investigations and inquiries relate to the ratings activity of Ratings and are or have been brought by purchasers of rated securities. In addition, various government and self-regulatory agencies frequently make inquiries and conduct investigations into Ratings’ compliance with applicable laws and regulations. Any of these proceedings, investigations or inquiries could ultimately result in adverse judgments, damages, fines, penalties or activity restrictions, which could adversely impact our consolidated financial condition, cash flows, business or competitive position.
U.S.
The businesses conducted by our Ratings segment are, in certain cases, regulated under the Credit Rating Agency Reform Act of 2006 (the “Reform Act”), the Dodd-Frank Wall Street Reform and Consumer Protection Act (the “Dodd Frank Act”), the Securities Exchange Act of 1934 (the “Exchange Act”) and/or the laws of the states or other jurisdictions in which they conduct business. The financial services industry is subject to the potential for increased regulation in the U.S.
S&P Global Ratings is a credit rating agency that is registered with the SEC as a Nationally Recognized Statistical Rating Organization (“NRSRO”). The SEC first began informally designating NRSROs in 1975 for use of their credit ratings in the determination of capital charges for registered brokers and dealers under the SEC’s Net Capital Rule. The Reform Act created a new SEC registration system for rating agencies that choose to register as NRSROs. Under the Reform Act, the SEC is given authority and oversight of NRSROs and can censure NRSROs, revoke their registration or limit or suspend their registration in certain cases. The rules implemented by the SEC pursuant to the Reform Act, the Dodd Frank Act and the Exchange Act address, among other things, prevention or misuse of material non-public information, conflicts of interest, documentation and assessment of internal controls, and improving transparency of ratings performance and methodologies. The public portions of the current version of S&P Global Ratings’ Form NRSRO are available on S&P Global Ratings’ website.
European Union
In the European Union, the credit rating industry is registered and supervised through a pan-European regulatory framework which is a compilation of three sets of legislative actions. In 2009, the European Parliament passed a regulation (“CRA1”) that established an oversight regime for the credit rating industry in the European Union, which became effective in 2010. CRA1 requires the registration, formal regulation and periodic inspection of credit rating agencies operating in the European Union. Ratings was granted registration in October of 2011. In January of 2011, the European Union established the European Securities and Markets Authority (“ESMA”), which, among other things, has direct supervisory responsibility for the registered credit rating industry throughout the European Union.
Additional rules augmenting the supervisory framework for credit rating agencies went into effect in 2013. Commonly referred to as CRA3, these rules, among other things:
• | impose various additional procedural requirements with respect to ratings of sovereign issuers; |
• | require member states to adopt laws imposing liability on credit rating agencies for an intentional or grossly negligent failure to abide by the applicable regulations; |
• | impose mandatory rotation requirements on credit rating agencies hired by issuers of securities for ratings of resecuritizations, which may limit the number of years a credit rating agency can issue ratings for such securities of a particular issuer; |
• | impose restrictions on credit rating agencies or their shareholders if certain ownership thresholds are crossed; and |
37
• | impose additional procedural and substantive requirements on the pricing of services. |
The financial services industry is subject to the potential for increased regulation in the European Union.
Other Jurisdictions
Outside of the U.S. and the European Union, regulators and government officials have also been implementing formal oversight of credit rating agencies. Ratings is subject to regulations in most of the foreign jurisdictions in which it operates and continues to work closely with regulators globally to promote the global consistency of regulatory requirements. Regulators in additional countries may introduce new regulations in the future.
For a further discussion of competitive and other risks inherent in our Ratings business, see Item 1a, Risk Factors, in this Annual Report on Form 10-K. For a further discussion of the legal and regulatory environment in our Ratings business, see Note 13 - Commitments and Contingencies to the consolidated financial statements under Item 8, Consolidated Financial Statements and Supplementary Data, in this Annual Report on Form 10-K.
Market and Commodities Intelligence
Market and Commodities Intelligence's portfolio of capabilities are designed to help the financial community, corporations and professional service firms track performance, generate better investment returns, identify new trading and investment ideas, perform risk analysis, develop mitigation strategies and provide high-value information to the commodity and energy markets that enable its customers to make better informed trading and business decisions.
In December of 2017, we announced that S&P Global Platts, a business line within Market and Commodities Intelligence, will be managed as a separate business and comprise a separate reportable segment effective January 1, 2018. We will begin reporting the financial results of S&P Global Market Intelligence and S&P Global Platts as separate reportable segments beginning with the first quarter of 2018.
In January of 2017, we completed the sale of Quant House SAS ("QuantHouse"), included in our Market and Commodities Intelligence segment, to QH Holdco, an independent third party. In November of 2016, we entered into a put option agreement that gave the Company the right, but not the obligation, to put the entire share capital of QuantHouse to QH Holdco. As a result, we classified the assets and liabilities of QuantHouse, net of our costs to sell, as held for sale, which is included in prepaid and other current assets and other current liabilities, respectively, in our consolidated balance sheet as of December 31, 2016 resulting in an aggregate loss of $31 million. On January 4, 2017, we exercised the put option, thereby entering into a definitive agreement to sell QuantHouse to QH Holdco. On January 9, 2017, we completed the sale of QuantHouse to QH Holdco.
In October of 2016, we completed the sale of SPSE and CMA for $425 million in cash to Intercontinental Exchange, an operator of global exchanges, clearing houses and data services. During the year ended December 31, 2016, we recorded a pre-tax gain of $364 million ($297 million after-tax) in gain on dispositions in the consolidated statement of income related to the sale of SPSE and CMA. Additionally, in October of 2016, we completed the sale of Equity Research, a business within our Market and Commodities Intelligence segment to CFRA, a leading independent provider of forensic accounting research, analytics and advisory services. During the year ended December 31, 2016, we recorded a pre-tax gain of $9 million ($5 million after-tax) in gain on dispositions in the consolidated statement of income related to the sale of Equity Research.
In September of 2016, we completed the sale of J.D. Power for $1.1 billion to XIO Group, a global alternative investments firm headquartered in London. During the year ended December 31, 2016, we recorded a pre-tax gain of $728 million ($516 million after-tax) in gain on dispositions in the consolidated statement of income related to the sale of J.D. Power.
Market and Commodities Intelligence includes the following business lines:
• | Desktop — a product suite that provides data, analytics and third-party research for global finance professionals, which includes the Market Intelligence Desktop (which are inclusive of S&P Capital IQ and SNL Desktop products); |
• | Data Management Solutions — integrated data feeds and application programming interfaces that can be customized, which includes Computstat, GICS, Point In Time Financials and CUSIP; |
• | Risk Services — commercial arm that sells Ratings' credit ratings and related data, analytics and research, which includes subscription-based offerings, RatingsDirect® and RatingsXpress®; and |
• | S&P Global Platts — the leading independent provider of information and benchmark prices for the commodity and energy markets. S&P Global Platts provides essential price data, analytics, and industry insight that enable the commodities and |
38
energy markets to perform with greater transparency and efficiency. Additionally, S&P Global Platts generates revenue from licensing of our proprietary market price data and price assessments to commodity exchanges.
We completed the sale of J.D. Power on September 7, 2016, with the results included in Market and Commodities Intelligence results through that date.
(in millions) | Year ended December 31, | % Change | ||||||||||||||||
2017 | 2016 | 2015 | ’17 vs ’16 | ’16 vs ’15 | ||||||||||||||
Revenue | $ | 2,452 | $ | 2,585 | $ | 2,376 | (5 | )% | 9 | % | ||||||||
Subscription revenue | $ | 2,317 | $ | 2,231 | $ | 1,911 | 4 | % | 17 | % | ||||||||
Non-subscription revenue | $ | 135 | $ | 354 | $ | 465 | (62 | )% | (24 | )% | ||||||||
% of total revenue: | ||||||||||||||||||
Subscription revenue | 95 | % | 86 | % | 80 | % | ||||||||||||
Non-subscription revenue | 5 | % | 14 | % | 20 | % | ||||||||||||
U.S. revenue | $ | 1,396 | $ | 1,523 | $ | 1,368 | (8 | )% | 11 | % | ||||||||
International revenue | $ | 1,056 | $ | 1,062 | $ | 1,008 | (1 | )% | 6 | % | ||||||||
% of total revenue: | ||||||||||||||||||
U.S. revenue | 57 | % | 59 | % | 58 | % | ||||||||||||
International revenue | 43 | % | 41 | % | 42 | % | ||||||||||||
Operating profit 1 | $ | 793 | $ | 1,822 | $ | 585 | (56 | )% | 212 | % | ||||||||
% Operating margin | 32 | % | 70 | % | 25 | % | ||||||||||||
1 | 2017 includes non-cash acquisition and disposition-related adjustments of $15 million, employee severance charges of $9 million, a charge to exit a leased facility of $6 million, and an asset write-off of $2 million. 2016 includes a $1.1 billion gain from our dispositions, disposition-related costs of $48 million, a technology-related impairment charge of $24 million and an acquisition-related cost of $1 million. 2015 includes acquisition-related costs related to the acquisition of SNL of $37 million and costs identified operating efficiencies primarily related to employee severance charges of $33 million. 2017, 2016 and 2015 includes amortization of intangibles from acquisitions of $87 million, $85 million and $57 million, respectively. |
2017
Revenue decreased 5% and was unfavorably impacted by 13 percentage points from the net impact of acquisitions and dispositions. Excluding these acquisitions and dispositions, revenue increased primarily driven by growth in annualized contract values in the Market Intelligence Desktop products, RatingsXpress® and RatingsDirect® from new and existing customers. The number of users and customers continued to grow for each of these products in 2017. Increases in annualized contract value for certain of our data feed products within Data Management Solutions also contributed to revenue growth. Additionally, strength in S&P Global Platts' proprietary content due to continued demand for market data and price assessment products across all commodity sectors, led by petroleum, contributed to revenue growth. Both domestic and international revenue decreased due to the unfavorable impact of the dispositions discussed below. In 2017, international revenue represented 43% of Market and Commodities Intelligence's total revenue compared to 41% in 2016. Revenue was favorably impacted by the acquisitions of RigData and PIRA in June of 2016 and September of 2016, respectively. Revenue was unfavorably impacted by the dispositions of J.D. Power in September of 2016, SPSE and CMA in October of 2016, Equity Fund Research in October of 2016 and QuantHouse in January of 2017. See Note 2 — Acquisitions and Divestitures for further discussion.
Operating profit decreased 56%. Excluding the unfavorable impact of the gain on dispositions in 2016 of 62 percentage points, non-cash acquisition and disposition-related adjustments in 2017 of 1 percentage point, partially offset by the favorable impact of disposition-related costs in 2016 of 2 percentage points and a technology-related impairment charge in 2016 of 1 percentage point, operating profit increased 4%. The increase is due to margin improvement from existing businesses, partially offset by the unfavorable impact of the dispositions discussed above.
39
2016
Revenue increased 9% and was favorably impacted by 1 percentage point of growth from the net impact of acquisitions and dispositions discussed below. Revenue growth was also driven by increases in annualized contract values in the S&P Capital IQ Desktop, RatingsXpress® and RatingsDirect® from new and existing customers. The number of users on the S&P Capital IQ Desktop and the number of customers at RatingsXpress® continued to grow in 2016. Increases in annualized contract value for certain of our data feed products within Data Management Solutions also contributed to revenue growth. Additionally, strength in S&P Global Platts' proprietary content due to continued demand for S&P Global Platts’ market data and price assessment products across all commodity sectors, led by petroleum, and continued licensing of our proprietary market price data and price assessments to various commodity exchanges contributed to revenue growth. Both domestic and international revenue increased, with international revenue representing 41% of Market and Commodities Intelligence's total revenue. Revenue was favorably impacted by the acquisitions of SNL, PIRA, RigData and Petromedia Ltd, partially offset by the unfavorable impact of the dispositions of J.D. Power, SPSE and CMA and Equity Research. See Note 2 — Acquisitions and Divestitures for further discussion.
Operating profit increased 212%. Excluding the favorable impact from the gain on dispositions of 194 percentage points, the favorable impact of higher acquisition-related costs in 2015 of 6 percentage points and higher employee severance charges in 2015 of 6 percentage points, partially offset by the unfavorable impact of higher disposition-related costs of 9 percentage points, higher amortization of intangibles from acquisitions of 5 percentage points and a technology-related impairment charge of 4 percentage points, operating profit increased 24%. This increase is due to revenue growth and the favorable impact of foreign exchange rates of 5 percentage points, partially offset by higher compensation costs and increased technology costs primarily as a result of the acquisition of SNL in September of 2015.
Industry Highlights and Outlook
In 2017, Market and Commodities Intelligence continued to benefit from organic revenue growth and SNL integration synergies. The segment also launched a beta version of the new Market Intelligence platform in 2017. Additionally, the segment integrated and leveraged recent acquisitions to develop and expand its analytical capabilities and offerings.
In 2018, both Market Intelligence and S&P Global Platts will continue to enhance its product offerings, pursue growth in new markets and geographies, and develop its analytical capabilities.
Legal and Regulatory Environment
Market Intelligence
The financial services industry is subject to the potential for increased regulation in the U.S. and abroad. Market Intelligence operates investment advisory businesses that are regulated in the U.S. under the U.S. Investment Advisers Act of 1940 (the “Investment Advisers Act”) and/or the laws of the states or other jurisdictions in which they conduct business.
Market Intelligence operates a business that is authorized and regulated in the United Kingdom by the Financial Conduct Authority (the “FCA”). As such, this business is authorized to arrange and advise on investments, and is also entitled to exercise a passport right to provide specified cross border services into other European Economic Area (“EEA”) States, and is to the conditions under the E.U. Markets in Financial Instruments Directive (“MiFID”).
The markets for research and investment advisory services are very competitive. Market Intelligence competes domestically and internationally on the basis of a number of factors, including the quality of its research and advisory services, client service, reputation, price, geographic scope, range of products and services, and technological innovation. For a further discussion of competitive and other risks inherent in our Market Intelligence business, see Item 1a, Risk Factors, in this Annual Report on Form 10-K.
S&P Global Platts
S&P Global Platts’ commodities price assessment and information business is subject to increasing regulatory scrutiny in the U.S. and abroad. As discussed below under the heading “Indices-Legal and Regulatory Environment”, the financial benchmarks industry is subject to the new pending benchmark regulation in the European Union (the “E.U. Benchmark Regulation”) as well as potential increased regulation in other jurisdictions. As a result of these measures, as well as measures that could be taken in other jurisdictions outside of Europe, S&P Global Platts will be required in due course to obtain registration or authorization in connection with its benchmark and price assessment activities in Europe and potentially elsewhere.
The European Union has finalized a package of legislative measures known as MiFID II ("MiFID II"), which revise and update the existing E.U. Markets in Financial Instruments Directive framework entered into force on July 2, 2014, and the substantive
40
provisions apply in all E.U. Member States as of January 3, 2018. MiFID II includes provisions that, among other things: (i) impose new conditions and requirements on the licensing of benchmarks and provide for non-discriminatory access to exchanges and clearing houses; (ii) modify the categorization and treatment of certain classes of derivatives; (iii) expand the categories of trading venue that are subject to regulation; (iv) require the unbundling of investment research and direct how asset managers pay for research either out of a research payment account or from a firm’s profits; and (v) provide for the mandatory trading of certain derivatives on exchanges (complementing the mandatory derivative clearing requirements in the E.U. Market Infrastructure Regulation of 2011). Although the MiFID II package is “framework” legislation (meaning that much of the detail of the rules will be set out in subordinate measures, including some technical standards yet to be adopted by the European Commission. The introduction of the MiFID II package may result in changes to the manner in which Platts licenses its price assessments. MiFID II and the Market Abuse Regulation (“MAR”) may impose additional regulatory burdens on Platts’s activities in the European Union, although the exact impact and costs are not yet known.
In October of 2012, IOSCO issued its PRA Principles which set out principles, which are intended to enhance the reliability of oil price assessments referenced in derivative contracts subject to regulation by IOSCO members. S&P Global Platts has taken steps to align its operations with the PRA Principles and as recommended by IOSCO in its final report on the PRA Principles, has aligned to the PRA Principles for other commodities for which it publishes benchmarks.
The markets for commodities price assessments and information are very competitive. S&P Global Platts competes domestically and internationally on the basis of a number of factors, including the quality of its assessments and other information it provides to the commodities and related markets, client service, reputation, price, range of products and services (including geographic coverage) and technological innovation. Furthermore, sustained downward pressure on oil and other commodities prices and trading activity in those markets could have a material adverse impact on the rate of growth of S&P Global Platts’ revenue. For a further discussion of competitive and other risks inherent in our Platts business, see Item 1a, Risk Factors, in this Annual Report on Form 10-K.
Indices
Indices is a global index provider maintaining a wide variety of indices to meet an array of investor needs. Indices’ mission is to provide transparent benchmarks to help with decision making, collaborate with the financial community to create innovative products and provide investors with tools to monitor world markets.
Indices primarily derives revenue from asset-linked fees based on the S&P and Dow Jones indices and to a lesser extent generates subscription revenue and transaction revenue. Specifically, Indices generates revenue from the following sources:
• | Investment vehicles — asset-linked fees such as ETFs and mutual funds, that are based on the S&P Dow Jones Indices' benchmarks and generate revenue through fees based on assets and underlying funds; |
• | Exchange traded derivatives — generate royalties based on trading volumes of derivatives contracts listed on various exchanges; |
• | Index-related licensing fees — fixed or variable annual and per-issue fees for over-the-counter derivatives and retail-structured products; and |
• | Data and customized index subscription fees — fees from supporting index fund management, portfolio analytics and research. |
41
(in millions) | Year ended December 31, | % Change | ||||||||||||||
2017 | 2016 | 2015 | ’17 vs ’16 | ’16 vs ’15 | ||||||||||||
Revenue | $ | 733 | $ | 639 | $ | 597 | 15% | 7% | ||||||||
Asset-linked fees | $ | 461 | $ | 381 | $ | 369 | 21% | 3% | ||||||||
Subscription revenue | $ | 141 | $ | 133 | $ | 116 | 6% | 14% | ||||||||
Transaction revenue | $ | 131 | $ | 125 | $ | 112 | 5% | 11% | ||||||||
% of total revenue: | ||||||||||||||||
Asset-linked fees | 63 | % | 60 | % | 62 | % | ||||||||||
Subscription revenue | 19 | % | 21 | % | 19 | % | ||||||||||
Transaction revenue | 18 | % | 19 | % | 19 | % | ||||||||||
U.S. revenue | $ | 603 | $ | 525 | $ | 488 | 15% | 8% | ||||||||
International revenue | $ | 130 | $ | 114 | $ | 109 | 14% | 5% | ||||||||
% of total revenue: | ||||||||||||||||
U.S. revenue | 82 | % | 82 | % | 82 | % | ||||||||||
International revenue | 18 | % | 18 | % | 18 | % | ||||||||||
Operating profit 1 | $ | 471 | $ | 412 | $ | 392 | 14% | 5% | ||||||||
Less: net income attributable to noncontrolling interests | $ | 127 | $ | 109 | $ | 101 | 16% | 8% | ||||||||
Net operating profit | $ | 344 | $ | 303 | $ | 291 | 14% | 4% | ||||||||
% Operating margin | 64 | % | 64 | % | 66 | % | ||||||||||
% Net operating margin | 47 | % | 47 | % | 49 | % | ||||||||||
1 | 2017, 2016 and 2015 includes amortization of intangibles from acquisitions of $7 million, $6 million and $5 million, respectively. |
2017
Revenue at Indices increased 15%, primarily driven by higher average levels of assets under management ("AUM") for ETFs and mutual funds. Revenue growth was favorably impacted by 1 percentage point from the acquisition of Trucost plc ("Trucost") in October of 2016. See Note 2 — Acquisitions and Divestitures for further discussion. Ending AUM for ETFs increased 31% to $1.343 trillion and average AUM for ETFs increased 34% to $1.167 trillion compared to 2016.
Operating profit grew 14%. The impact of revenue growth was partially offset by higher compensation costs and increased operating costs to support revenue growth and business initiatives at Indices. Higher compensation costs related to increased incentive costs and additional headcount partially related to the acquisition of Trucost.
2016
Revenue at Indices increased 7%, primarily driven by higher average levels of AUM for ETFs and mutual funds, an increase in data revenue and higher volumes for exchange-traded derivatives. Revenue growth was favorably impacted by less than one percentage point from the acquisition of Trucost. Ending AUM for ETFs increased 25% to $1.023 trillion and average AUM for ETFs increased 8% to $869 billion compared to 2015. Higher average levels of AUM for ETFs contributed to revenue growth primarily driven by the flow of investment funds to the U.S. equity markets in the second half of the year.
Operating profit grew 5%. Revenue growth was partially offset by higher compensation costs primarily driven by additional headcount related to the acquisition of Trucost, increased incentive costs and increased operating costs to support revenue growth and business initiatives at Indices.
42
Industry Highlights and Outlook
Indices continues to be the leading index provider for the ETF market space. In 2017, higher average levels of AUM for ETFs contributed to revenue growth. In 2017, Indices focused on continued Index innovation and growing international partnerships. In 2018, Indices will continue to pursue opportunities for innovation and seek to grow international partnerships.
Legal and Regulatory Environment
The financial benchmarks industry is subject to the new pending benchmark regulation in the European Union (the “E.U. Benchmark Regulation”) as well as potential increased regulation in other jurisdictions.
The E.U. Benchmark Regulation was published June 30, 2016 and included provisions applicable to Indices and Platts, which will become effective January 1, 2018. The E.U. Benchmark Regulation requires Indices and Platts in due course to obtain registration or authorization in connection with their respective benchmark activities in Europe. This legislation will likely cause additional operating obligations but they are not expected to be material at this time, although the exact impact remains unclear.
As discussed above under the heading “S&P Global Platts Legal and Regulatory Envioronment”, the European Union has finalized a package of legislative measures known as MiFID II The introduction of the MiFID II package may result in changes to the manner in which S&P Dow Jones Indices licenses its indices. MiFID II and the Market Abuse Regulation (“MAR”) may impose additional regulatory burdens on S&P Dow Jones Indices activities in the European Union, although the exact impact and costs are not yet known.
In July of 2013, the International Organization of Securities Commissions (“IOSCO”) issued Financial Benchmark Principles, intended to promote the reliability of benchmark determinations, and address governance, benchmark quality and accountability mechanisms, including with regard to the indices published by Indices. Even though the Financial Benchmark Principles are not binding law, Indices has taken steps to align its governance regime and operations with the Financial Benchmark Principles and engaged an independent auditor to perform a reasonable assurance review of such alignment.
The markets for index providers are very competitive. Indices competes domestically and internationally on the basis of a number of factors, including the quality of its benchmark indices, client service, reputation, price, range of products and services (including geographic coverage) and technological innovation. For a further discussion of competitive and other risks inherent in our Indices business, see Item 1a, Risk Factors, in this Annual Report on Form 10-K.
LIQUIDITY AND CAPITAL RESOURCES
We continue to maintain a strong financial position. Our primary source of funds for operations is cash from our businesses and our core businesses have been strong cash generators. In 2018, cash on hand, cash flows from operations and availability under our existing credit facility are expected to be sufficient to meet any additional operating and recurring cash needs into the foreseeable future. We use our cash for a variety of needs, including but not limited to: ongoing investments in our businesses, strategic acquisitions, share repurchases, dividends, repayment of debt, capital expenditures and investment in our infrastructure.
Cash Flow Overview
Cash and cash equivalents were $2.8 billion as of December 31, 2017, an increase of $0.4 billion as compared to December 31, 2016, and consisted of approximately 20% of domestic cash and 80% of cash held abroad.
(in millions) | Year ended December 31, | |||||||||||
2017 | 2016 | 2015 | ||||||||||
Net cash provided by (used for): | ||||||||||||
Operating activities from continuing operations | $ | 2,016 | $ | 1,560 | $ | 356 | ||||||
Investing activities from continuing operations | (209 | ) | 1,205 | (2,525 | ) | |||||||
Financing activities from continuing operations | (1,507 | ) | (1,696 | ) | 1,349 | |||||||
In 2017, free cash flow increased to $1.8 billion compared to $1.3 billion in 2016. The increase is primarily due to the increase in cash provided from operating activities as discussed below. Free cash flow is a non-GAAP financial measure and reflects our cash flow provided by operating activities less capital expenditures and distributions to noncontrolling interest holders. Capital expenditures include purchases of property and equipment and additions to technology projects. See “Reconciliation of Non-
43
GAAP Financial Information” below for a reconciliation of cash flow provided by operating activities, the most directly comparable U.S. GAAP financial measure, to free cash flow and free cash flow excluding certain items.
Operating activities
Cash provided by operating activities increased to $2.0 billion in 2017 compared to $1.6 billion in 2016. The increase is mainly due to higher results from operations, partially offset by the timing of estimated tax payments.
Cash provided by operating activities increased $1.2 billion to $1.6 billion in 2016 compared to $356 million in 2015. The increase is mainly due to the payment of legal and regulatory settlements in 2015 of $1.6 billion.
Investing activities
Our cash outflows from investing activities are primarily for acquisitions and capital expenditures, while cash inflows are primarily proceeds from dispositions.
Cash used for investing activities decreased to $209 million for 2017 as compared to cash provided by investing activities of $1.2 billion in 2016. The decrease is primarily due to proceeds from the sale of J.D. Power of $1.1 billion in 2016.
Cash provided by investing activities increased to $1.2 billion for 2016 as compared to cash used for investing activities of $2.5 billion in 2015. The increase is primarily due to proceeds from the sale of J.D. Power of $1.1 billion in 2016 compared to cash used for the acquisition of SNL of $2.2 billion in 2015.
Refer to Note 2 – Acquisitions and Divestitures to our consolidated financial statements for further information.
Financing activities
Our cash outflows from financing activities consist primarily of share repurchases, dividends and repayment of debt, while cash inflows are primarily inflows from long-term and short-term debt borrowings and proceeds from the exercise of stock options.
Cash used for financing activities decreased to $1.5 billion in 2017 from $1.7 billion in 2016. The decrease is primarily attributable to higher repayments of debt and higher cash paid for share repurchases in 2016, partially offset by the issuance of senior notes in 2016.
Cash used for financing activities was $1.7 billion in 2016 compared to cash provided by financing activities of $1.3 billion in 2015. The decrease is primarily attributable to higher proceeds received from the issuance of senior notes in 2015.
During 2017, we used cash to repurchase 6.8 million shares for $1.0 billion. We entered into an accelerated share repurchase ("ASR") agreement with a financial institution on August 1, 2017 to initiate share repurchases aggregating $500 million. We repurchased a total of 3.2 million shares under the ASR agreement for an average purchase price of $154.46 per share. See Note 9 — Equity for further discussion.
During 2016, we used cash to repurchase 10 million shares for $1.1 billion, which included 0.3 million shares for approximately $26 million that settled in January of 2016. Using a portion of the proceeds received from the sale of J.D. Power, we entered into an ASR agreement with a financial institution on September 7, 2016 to initiate share repurchases aggregating $750 million. We repurchased a total of 6.1 million shares under the ASR agreement for an average purchase price of $122.18 per share. See Note 9 — Equity for further discussion.
During 2015, we used cash to repurchase 9.8 million shares for $974 million. An additional 0.3 million shares were repurchased in the fourth quarter of 2015 for approximately $26 million, which settled in January of 2016.
On December 4, 2013, the Board of Directors approved a share repurchase program authorizing the purchase of up to 50 million shares, which was approximately 18% of the total shares of our outstanding common stock at that time. Our current repurchase program has no expiration date and purchases under this program may be made from time to time on the open market and in private transactions, depending on market conditions. As of December 31, 2017, 19 million shares remained available under our current repurchase program.
Discontinued Operations
Cash flows from discontinued operations reflects the classification of McGraw Hill Construction as a discontinued operation. Cash used for operating activities from discontinued operations of $129 million in 2015 relates to the tax payment on the gain on sale of McGraw Hill Construction.
44
Additional Financing
On June 30, 2017, we entered into a $1.2 billion five year-credit agreement (our "credit facility") that will terminate on June 30, 2022. This credit facility replaced our $1.2 billion five year credit facility that was scheduled to terminate on June 30, 2020. The previous credit facility was canceled immediately after the new credit facility became effective. There were no outstanding borrowings under the previous credit facility when it was replaced.
We have the ability to borrow a total of $1.2 billion through our commercial paper program, which is supported by our credit facility. There were no commercial paper borrowings outstanding as of December 31, 2017 and 2016.
Depending on our corporate credit rating, we pay a commitment fee of 8 to 17.5 basis points for our credit facility, whether or not amounts have been borrowed. We currently pay a commitment fee of 12.5 basis points. The interest rate on borrowings under our credit facility is, at our option, calculated using rates that are primarily based on either the prevailing London Inter-Bank Offer Rate, the prime rate determined by the administrative agent or the Federal Funds Rate. For certain borrowings under this credit facility, there is also a spread based on our corporate credit rating.
Our credit facility contains certain covenants. The only financial covenant requires that our indebtedness to cash flow ratio, as defined in our credit facility, is not greater than 4 to 1, and this covenant level has never been exceeded.
Dividends
On February 2, 2018, the Board of Directors approved an increase in the quarterly common stock dividend from $0.41 per share to $0.50 per share.
Contractual Obligations
We typically have various contractual obligations, which are recorded as liabilities in our consolidated balance sheets, while other items, such as certain purchase commitments and other executory contracts, are not recognized, but are disclosed herein. For example, we are contractually committed to contracts for information-technology outsourcing, certain enterprise-wide information-technology software licensing and maintenance and make certain minimum lease payments for the use of property under operating lease agreements.
We believe that the amount of cash and cash equivalents on hand, cash flow expected from operations and availability under our credit facility will be adequate for us to execute our business strategy and meet anticipated requirements for lease obligations, capital expenditures, working capital and debt service for 2018.
The following table summarizes our significant contractual obligations and commercial commitments as of December 31, 2017, over the next several years. Additional details regarding these obligations are provided in the notes to our consolidated financial statements, as referenced in the footnotes to the table:
(in millions) | Less than 1 Year | 1-3 Years | 3-5 Years | More than 5 Years | Total | ||||||||||||||
Debt: 1 | |||||||||||||||||||
Principal payments | $ | 399 | $ | 697 | $ | — | $ | 2,473 | $ | 3,569 | |||||||||
Interest payments | 138 | 254 | 217 | 657 | 1,266 | ||||||||||||||
Operating leases 2 | 122 | 192 | 140 | 516 | 970 | ||||||||||||||
Purchase obligations and other 3 | 110 | 100 | 31 | 78 | 319 | ||||||||||||||
Total contractual cash obligations | $ | 769 | $ | 1,243 | $ | 388 | $ | 3,724 | $ | 6,124 | |||||||||
1 | Our debt obligations are described in Note 5 – Debt to our consolidated financial statements. |
2 | Amounts shown include taxes and escalation payments, see Note 13 – Commitments and Contingencies to our consolidated financial statements for further discussion on our operating lease obligations. |
3 | Other consists primarily of commitments for unconditional purchase obligations in contracts for information-technology outsourcing and certain enterprise-wide information-technology software licensing and maintenance. |
45
As of December 31, 2017, we had $212 million of liabilities for unrecognized tax benefits. We have excluded the liabilities for unrecognized tax benefits from our contractual obligations table because, until formal resolutions are reached, reasonable estimates of the timing of cash settlements with the respective taxing authorities are not practicable.
As of December 31, 2017, we have recorded $1,350 million for our redeemable noncontrolling interest in our S&P Dow Jones Indices LLC partnership discussed in Note 9 – Equity to our consolidated financial statements. Specifically, this amount relates to the put option under the terms of the operating agreement of S&P Dow Jones Indices LLC, whereby, after December 31, 2017, CME Group and CME Group Index Services LLC ("CGIS") will have the right at any time to sell, and we are obligated to buy, at least 20% of their share in S&P Dow Jones Indices LLC. We have excluded this amount from our contractual obligations table because we are uncertain as to the timing and the ultimate amount of the potential payment we may be required to make.
We make contributions to our pension and postretirement plans in order to satisfy minimum funding requirements as well as additional contributions that we consider appropriate to improve the funded status of our plans. During 2017, we contributed $8 million and $25 million to our domestic and international retirement and postretirement plans, respectively. Expected employer contributions in 2018 are $9 million and $7 million for our domestic and international retirement and postretirement plans, respectively. In 2018, we may elect to make additional non-required contributions depending on investment performance and the pension plan status. See Note 7 – Employee Benefits to our consolidated financial statements for further discussion.
Off-Balance Sheet Arrangements
As of December 31, 2017 and 2016, we did not have any relationships with unconsolidated entities, such as entities often referred to as specific purpose or variable interest entities where we are the primary beneficiary, which would have been established for the purpose of facilitating off-balance sheet arrangements or other contractually narrow or limited purposes. As such we are not exposed to any financial liquidity, market or credit risk that could arise if we had engaged in such relationships.
46
RECONCILIATION OF NON-GAAP FINANCIAL INFORMATION
Free cash flow is a non-GAAP financial measure and reflects our cash flow provided by operating activities less capital expenditures and distributions to noncontrolling interest holders. Capital expenditures include purchases of property and equipment and additions to technology projects. Our cash flow provided by operating activities is the most directly comparable U.S. GAAP financial measure to free cash flow. Additionally, we have considered certain items in evaluating free cash flow, which are included in the table below.
We believe the presentation of free cash flow and free cash flow excluding certain items allows our investors to evaluate the cash generated from our underlying operations in a manner similar to the method used by management. We use free cash flow to conduct and evaluate our business because we believe it typically presents a more conservative measure of cash flows since capital expenditures and distributions to noncontrolling interest holders are considered a necessary component of ongoing operations. Free cash flow is useful for management and investors because it allows management and investors to evaluate the cash available to us to prepay debt, make strategic acquisitions and investments and repurchase stock.
The presentation of free cash flow and free cash flow excluding certain items are not intended to be considered in isolation or as a substitute for the financial information prepared and presented in accordance with U.S. GAAP. Free cash flow, as we calculate it, may not be comparable to similarly titled measures employed by other companies. The following table presents a reconciliation of our cash flow provided by operating activities to free cash flow excluding the impact of the items below:
(in millions) | Year ended December 31, | % Change | ||||||||||||||
2017 | 2016 | 2015 | ’17 vs ’16 | ’16 vs ’15 | ||||||||||||
Cash provided by operating activities | $ | 2,016 | $ | 1,560 | $ | 356 | 29% | N/M | ||||||||
Capital expenditures | (123 | ) | (115 | ) | (139 | ) | ||||||||||
Distributions to noncontrolling interest holders | (111 | ) | (116 | ) | (104 | ) | ||||||||||
Free cash flow | $ | 1,782 | $ | 1,329 | $ | 113 | 34% | N/M | ||||||||
Tax on gain from sale of J.D. Power | — | 200 | — | |||||||||||||
Tax on gain from sale of SPSE and CMA | 67 | — | — | |||||||||||||
Payment of legal and regulatory settlements | 4 | 150 | 1,624 | |||||||||||||
Legal settlement insurance recoveries | — | (77 | ) | (101 | ) | |||||||||||
Tax benefit from legal settlements | (2 | ) | (24 | ) | (250 | ) | ||||||||||
Free cash flow excluding above items | $ | 1,851 | $ | 1,578 | $ | 1,386 | 17% | 14% | ||||||||
N/M - not meaningful
CRITICAL ACCOUNTING ESTIMATES
Our discussion and analysis of our financial condition and results of operations is based upon our consolidated financial statements, which have been prepared in accordance with U.S. GAAP. The preparation of these financial statements requires us to make estimates and judgments that affect the reported amounts of assets, liabilities, revenues and expenses and related disclosure of contingent assets and liabilities. Unless otherwise indicated, all discussion and analysis of our financial condition and results of operations relate to our continuing operations.
On an ongoing basis, we evaluate our estimates and assumptions, including those related to revenue recognition, allowance for doubtful accounts, valuation of long-lived assets, goodwill and other intangible assets, pension plans, incentive compensation and stock-based compensation, income taxes, contingencies and redeemable noncontrolling interests. We base our estimates on historical experience, current developments and on various other assumptions that we believe to be reasonable under these circumstances, the results of which form the basis for making judgments about carrying values of assets and liabilities that cannot readily be determined from other sources. There can be no assurance that actual results will not differ from those estimates.
Management considers an accounting estimate to be critical if it required assumptions to be made that were uncertain at the time the estimate was made and changes in the estimate or different estimates could have a material effect on our results of operations. Management has discussed the development and selection of our critical accounting estimates with the Audit Committee of our Board of Directors. The Audit Committee has reviewed our disclosure relating to them in this MD&A.
We believe the following critical accounting policies require us to make significant judgments and estimates in the preparation of our consolidated financial statements:
47
Revenue recognition
Revenue is recognized as it is earned when services are rendered. We consider amounts to be earned once evidence of an arrangement has been obtained, services are performed, fees are fixed or determinable and collectability is reasonably assured. Revenue relating to products that provide for more than one deliverable is recognized based upon the relative fair value to the customer of each deliverable as each deliverable is provided. Revenue relating to agreements that provide for more than one service is recognized based upon the relative fair value to the customer of each service component as each component is earned. If the fair value to the customer for each service is not objectively determinable, we make our best estimate of the services’ standalone selling price and recognize revenue as earned as the services are delivered. The allocation of consideration received from multiple element arrangements that involve initial assignment of ratings and the future surveillance of ratings is determined through an analysis that considers cash consideration that would be received for instances when the service components are sold separately. In such cases, we defer portions of rating fees that we estimate will be attributed to future surveillance and recognize the deferred revenue ratably over the estimated surveillance periods. Advertising revenue is recognized when the page is run. Subscription income is recognized over the related subscription period.
For the years ended December 31, 2017, 2016 and 2015, no significant changes have been made to the underlying assumptions related to estimates of revenue or the methodologies applied. In 2018, we will be adopting a new accounting standard for the recognition of revenue. See Note 1 - Accounting Policies to our consolidated financial statements for further information related to the impact of the new revenue standard in 2018.
Allowance for doubtful accounts
The allowance for doubtful accounts reserve methodology is based on historical analysis, a review of outstanding balances and current conditions. In determining these reserves, we consider, amongst other factors, the financial condition and risk profile of our customers, areas of specific or concentrated risk as well as applicable industry trends or market indicators. The impact on operating profit for a one percentage point change in the allowance for doubtful accounts is approximately $14 million.
For the years ended December 31, 2017, 2016 and 2015, there were no material changes in our assumptions regarding the determination of the allowance for doubtful accounts. Based on our current outlook these assumptions are not expected to significantly change in 2018.
Accounting for the impairment of long-lived assets (including other intangible assets)
We evaluate long-lived assets for impairment whenever events or changes in circumstances indicate that the carrying amount of an asset may not be recoverable. Upon such an occurrence, recoverability of assets to be held and used is measured by comparing the carrying amount of an asset to current forecasts of undiscounted future net cash flows expected to be generated by the asset. If the carrying amount of the asset exceeds its estimated future cash flows, an impairment charge is recognized equal to the amount by which the carrying amount of the asset exceeds the fair value of the asset. For long-lived assets held for sale, assets are written down to fair value, less cost to sell. Fair value is determined based on market evidence, discounted cash flows, appraised values or management’s estimates, depending upon the nature of the assets.
For the year ended December 31, 2016, we recorded a non-cash impairment charge of $24 million related to a technology project at our Market and Commodities segment in selling and general expenses in our consolidated statement of income.
Goodwill and indefinite-lived intangible assets
Goodwill represents the excess of purchase price and related costs over the value assigned to the net tangible and identifiable intangible assets of businesses acquired. As of December 31, 2017 and 2016, the carrying value of goodwill and other indefinite-lived intangible assets was $3.7 billion, respectively. Goodwill and other intangible assets with indefinite lives are not amortized, but instead are tested for impairment annually during the fourth quarter each year or more frequently if events or changes in circumstances indicate that the asset might be impaired.
48
Goodwill
As part of our annual impairment test of our four reporting units, we initially perform a qualitative analysis evaluating whether any events and circumstances occurred that provide evidence that it is more likely than not that the fair value of any of our reporting units is less than its carrying amount. Reporting units are generally an operating segment or one level below an operating segment. Our qualitative assessment included, but was not limited to, consideration of macroeconomic conditions, industry and market conditions, cost factors, cash flows, changes in key Company personnel and our share price. If, based on our evaluation of the events and circumstances that occurred during the year we do not believe that it is more likely than not that the fair value of any of our reporting units is less than its carrying amount, no quantitative impairment test is performed. Conversely, if the results of our qualitative assessment determine that it is more likely than not that the fair value of any of our reporting units is less than its respective carrying amount we perform a two-step quantitative impairment test. For 2017, based on our qualitative assessments, we determined that it is more likely than not that our reporting units’ fair value was greater than their respective carrying amounts.
If the fair value of the reporting unit is less than the carrying value, a second step is performed which compares the implied fair value of the reporting unit's goodwill to the carrying value of the goodwill. The implied fair value of the goodwill is determined based on the difference between the fair value of the reporting unit and the net fair value of the identifiable assets and liabilities of the reporting unit. If the implied fair value of the goodwill is less than the carrying value, the difference is recognized as an impairment charge.
Indefinite-Lived Intangible Assets
We evaluate the recoverability of indefinite-lived intangible assets by first performing a qualitative analysis evaluating whether any events and circumstances occurred that provide evidence that it is more likely than not that the indefinite-lived asset is impaired. If, based on our evaluation of the events and circumstances that occurred during the year we do not believe that it is more likely than not that the indefinite-lived asset is impaired, no quantitative impairment test is performed. Conversely, if the results of our qualitative assessment determine that it is more likely than not that the indefinite-lived asset is impaired, a quantitative impairment test is performed. If necessary, the impairment test is performed by comparing the estimated fair value of the intangible asset to its carrying value. If the indefinite-lived intangible asset carrying value exceeds its fair value, an impairment analysis is performed using the income approach. The fair value of loss is recognized in an amount equal to that excess. Significant judgments inherent in these analyses include estimating the amount and timing of future cash flows and the selection of appropriate discount rates, royalty rates and long-term growth rate assumptions. Changes in these estimates and assumptions could materially affect the determination of fair value for this indefinite-lived intangible asset and could result in an impairment charge, which could be material to our financial position and results of operations.
We performed our impairment assessment of goodwill and indefinite-lived intangible assets and concluded that no impairment existed for the years ended December 31, 2017, 2016, and 2015.
Retirement plans and postretirement healthcare and other benefits
Our employee pension and other postretirement benefit costs and obligations are dependent on assumptions concerning the outcome of future events and circumstances, including compensation increases, long-term return on pension plan assets, healthcare cost trends, discount rates and other factors. In determining such assumptions, we consult with outside actuaries and other advisors where deemed appropriate. In accordance with relevant accounting standards, if actual results differ from our assumptions, such differences are deferred and amortized over the estimated remaining lifetime of the plan participants. While we believe that the assumptions used in these calculations are reasonable, differences in actual experience or changes in assumptions could affect the expense and liabilities related to our pension and other postretirement benefits.
The following is a discussion of some significant assumptions that we make in determining costs and obligations for pension and other postretirement benefits:
• | Discount rate assumptions are based on current yields on high-grade corporate long-term bonds. |
• | Healthcare cost trend assumptions are based on historical market data, the near-term outlook and an assessment of likely long-term trends. |
• | The expected return on assets assumption is calculated based on the plan’s asset allocation strategy and projected market returns over the long-term. |
49
Our discount rate and return on asset assumptions used to determine the net periodic pension and postretirement benefit cost on our U.S. retirement plans are as follows:
Retirement Plans | Postretirement Plans | |||||||||||||||||
January 1 | 2018 | 2017 | 2016 | 2018 | 2017 | 2016 | ||||||||||||
Discount rate | 3.68 | % | 4.14 | % | 4.47 | % | 3.40 | % | 3.69 | % | 3.90 | % | ||||||
Return on assets | 6.00 | % | 6.25 | % | 6.25 | % | ||||||||||||
Weighted-average healthcare cost rate | 6.50 | % | 7.00 | % | 7.00 | % | ||||||||||||
Stock-based compensation
Stock-based compensation expense is measured at the grant date based on the fair value of the award and is recognized over the requisite service period, which typically is the vesting period. Stock-based compensation is classified as both operating-related expense and selling and general expense in our consolidated statements of income.
We use a lattice-based option-pricing model to estimate the fair value of options granted. The following assumptions were used in valuing the options granted:
Year Ended | ||||
December 31, 2015 | ||||
Risk-free average interest rate | 0.2 - 1.9% | |||
Dividend yield | 1.4% | |||
Volatility | 21 - 39% | |||
Expected life (years) | 6.3 | |||
Weighted-average grant-date fair value per option | $ | 27.57 | ||
Because lattice-based option-pricing models incorporate ranges of assumptions, those ranges are disclosed. These assumptions are based on multiple factors, including historical exercise patterns, post-vesting termination rates, expected future exercise patterns and the expected volatility of our stock price. The risk-free interest rate is the imputed forward rate based on the U.S. Treasury yield at the date of grant. We use the historical volatility of our stock price over the expected term of the options to estimate the expected volatility. The expected term of options granted is derived from the output of the lattice model and represents the period of time that options granted are expected to be outstanding.
During 2015, we stopped granting stock options as part of our employees' total stock-based incentive awards. There were no stock options granted in 2017 and 2016 and a minimal amount of stock options granted in 2015.
Income taxes
Deferred tax assets and liabilities are recognized for the future tax consequences attributable to differences between financial statement carrying amounts of existing assets and liabilities and their respective tax bases. Deferred tax assets and liabilities are measured using enacted tax rates expected to be applied to taxable income in the years in which those temporary differences are expected to be recovered or settled. We recognize liabilities for uncertain tax positions taken or expected to be taken in income tax returns. Accrued interest and penalties related to unrecognized tax benefits are recognized in interest expense and operating expense, respectively.
Judgment is required in determining our provision for income taxes, deferred tax assets and liabilities and unrecognized tax benefits. In determining the need for a valuation allowance, the historical and projected financial performance of the operation that is recording a net deferred tax asset is considered along with any other pertinent information.
We file income tax returns in the U.S. federal jurisdiction, various states, and foreign jurisdictions, and we are routinely under audit by many different tax authorities. We believe that our accrual for tax liabilities is adequate for all open audit years based on our assessment of many factors including past experience and interpretations of tax law. This assessment relies on estimates and assumptions and may involve a series of complex judgments about future events. It is possible that examinations will be settled prior to December 31, 2018. If any of these tax audit settlements do occur within that period we would make any necessary adjustments to the accrual for unrecognized tax benefits.
For the years ended December 31, 2016 and 2015, we had determined that the undistributed earnings of our foreign subsidiaries were permanently reinvested within those foreign operations. Accordingly, we had not recorded deferred income taxes on these
50
indefinitely reinvested earnings. As of December 31, 2017, we have approximately $2.6 billion of undistributed earnings of our foreign subsidiaries. As a result of the TCJA, more than 70% of these $2.6 billion earnings will no longer be permanently reinvested. We will continue to permanently reinvest approximately $780 million of these undistributed earnings.
Contingencies
We are subject to a number of lawsuits and claims that arise in the ordinary course of business. We recognize a liability for such contingencies when both (a) information available prior to issuance of the financial statements indicates that it is probable that a liability had been incurred at the date of the financial statements and (b) the amount of loss can reasonably be estimated. We continually assess the likelihood of any adverse judgments or outcomes to our contingencies, as well as potential amounts or ranges of probable losses, and recognize a liability, if any, for these contingencies based on an analysis of each matter with the assistance of outside legal counsel and, if applicable, other experts. Because many of these matters are resolved over long periods of time, our estimate of liabilities may change due to new developments, changes in assumptions or changes in our strategy related to the matter. When we accrue for loss contingencies and the reasonable estimate of the loss is within a range, we record its best estimate within the range. We disclose an estimated possible loss or a range of loss when it is at least reasonably possible that a loss may have been incurred.
Redeemable Noncontrolling Interest
The fair value component of the redeemable noncontrolling interest in Indices business is based on a combination of an income and market valuation approach. Our income and market valuation approaches may incorporate Level 3 measures for instances when observable inputs are not available, including assumptions related to expected future net cash flows, long-term growth rates, the timing and nature of tax attributes, and the redemption features.
RECENT ACCOUNTING STANDARDS
See Note 1 – Accounting Policies to our consolidated financial statements for a detailed description of recent accounting standards. We do not expect these recent accounting standards to have a material impact on our results of operations, financial condition, or liquidity in future periods.
Item 7a. Quantitative and Qualitative Disclosures about Market Risk
Our exposure to market risk includes changes in foreign exchange rates. We have operations in various foreign countries where the functional currency is primarily the local currency. For international operations that are determined to be extensions of the parent company, the U.S. dollar is the functional currency. We typically have naturally hedged positions in most countries from a local currency perspective with offsetting assets and liabilities. During the year ended December 31, 2017, we entered into foreign exchange forward contracts in order to mitigate the change in fair value of specific assets and liabilities in the consolidated balance sheet. These forward contracts are not designated as hedges and do not qualify for hedge accounting. During the years ended December 31, 2017 and 2016, we entered into foreign exchange forward contracts to hedge the effect of adverse fluctuations in foreign currency exchange rates. We have not entered into any derivative financial instruments for speculative purposes. See Note 6 – Derivative Instruments to our consolidated financial statements for further information.
51
Item 8. Consolidated Financial Statements and Supplementary Data
TABLE OF CONTENTS
Page | |
5 Debt | |
52
Report of Independent Registered Public Accounting Firm
To the Shareholders and the Board of Directors of S&P Global Inc.
Opinion on the Financial Statements
We have audited the accompanying consolidated balance sheets of S&P Global Inc. (the Company) as of December 31, 2017 and 2016, and the related consolidated statements of income, comprehensive income, equity and cash flows for each of the three years in the period ended December 31, 2017, and the related notes and financial statement schedule listed in Item 15(a)(2) (collectively referred to as the “financial statements”). In our opinion, the financial statements present fairly, in all material respects, the consolidated financial position of the Company at December 31, 2017 and 2016, and the consolidated results of its operations and its cash flows for each of the three years in the period ended December 31, 2017, in conformity with U.S. generally accepted accounting principles.
We also have audited, in accordance with the standards of the Public Company Accounting Oversight Board (United States) (PCAOB), the Company's internal control over financial reporting as of December 31, 2017, based on criteria established in Internal Control-Integrated Framework issued by the Committee of Sponsoring Organizations of the Treadway Commission (2013 framework), and our report dated February 9, 2018 expressed an unqualified opinion thereon.
Basis for Opinion
These financial statements are the responsibility of the Company's management. Our responsibility is to express an opinion on the Company’s financial statements based on our audits. We are a public accounting firm registered with the PCAOB and are required to be independent with respect to the Company in accordance with the U.S. federal securities laws and the applicable rules and regulations of the Securities and Exchange Commission and the PCAOB.
We conducted our audits in accordance with the standards of the PCAOB. Those standards require that we plan and perform the audit to obtain reasonable assurance about whether the financial statements are free of material misstatement, whether due to error or fraud. Our audits included performing procedures to assess the risks of material misstatement of the financial statements, whether due to error or fraud, and performing procedures that respond to those risks. Such procedures included examining, on a test basis, evidence regarding the amounts and disclosures in the financial statements. Our audits also included evaluating the accounting principles used and significant estimates made by management, as well as evaluating the overall presentation of the financial statements. We believe that our audits provide a reasonable basis for our opinion.
/s/ ERNST & YOUNG LLP
We have served as the Company’s auditor since 1969.
New York, New York
February 9, 2018
53
Report of Independent Registered Public Accounting Firm
To the Shareholders and the Board of Directors of S&P Global Inc.
Opinion on Internal Control over Financial Reporting
We have audited S&P Global Inc.’s internal control over financial reporting as of December 31, 2017, based on criteria established in Internal Control-Integrated Framework issued by the Committee of Sponsoring Organizations of the Treadway Commission (2013 framework) (the COSO criteria). In our opinion, S&P Global Inc. (the Company) maintained, in all material respects, effective internal control over financial reporting as of December 31, 2017, based on the COSO criteria.
We also have audited, in accordance with the standards of the Public Company Accounting Oversight Board (United States) (PCAOB), the consolidated balance sheets of S&P Global Inc. as of December 31, 2017 and 2016, and the related consolidated statements of income, comprehensive income, equity and cash flows for each of the three years in the period ended December 31, 2017, and the related notes and financial statement schedule listed in Item 15(a)(2) and our report dated February 9, 2018 expressed an unqualified opinion thereon.
Basis for Opinion
The Company’s management is responsible for maintaining effective internal control over financial reporting and for its assessment of the effectiveness of internal control over financial reporting included in the accompanying Management’s Annual Report on Internal Control Over Financial Reporting. Our responsibility is to express an opinion on the Company’s internal control over financial reporting based on our audit. We are a public accounting firm registered with the PCAOB and are required to be independent with respect to the Company in accordance with the U.S. federal securities laws and the applicable rules and regulations of the Securities and Exchange Commission and the PCAOB.
We conducted our audit in accordance with the standards of the PCAOB. Those standards require that we plan and perform the audit to obtain reasonable assurance about whether effective internal control over financial reporting was maintained in all material respects.
Our audit included obtaining an understanding of internal control over financial reporting, assessing the risk that a material weakness exists, testing and evaluating the design and operating effectiveness of internal control based on the assessed risk, and performing such other procedures as we considered necessary in the circumstances. We believe that our audit provides a reasonable basis for our opinion.
Definition and Limitations of Internal Control Over Financial Reporting
A company’s internal control over financial reporting is a process designed to provide reasonable assurance regarding the reliability of financial reporting and the preparation of financial statements for external purposes in accordance with generally accepted accounting principles. A company’s internal control over financial reporting includes those policies and procedures that (1) pertain to the maintenance of records that, in reasonable detail, accurately and fairly reflect the transactions and dispositions of the assets of the company; (2) provide reasonable assurance that transactions are recorded as necessary to permit preparation of financial statements in accordance with generally accepted accounting principles, and that receipts and expenditures of the company are being made only in accordance with authorizations of management and directors of the company; and (3) provide reasonable assurance regarding prevention or timely detection of unauthorized acquisition, use, or disposition of the company’s assets that could have a material effect on the financial statements.
Because of its inherent limitations, internal control over financial reporting may not prevent or detect misstatements. Also, projections of any evaluation of effectiveness to future periods are subject to the risk that controls may become inadequate because of changes in conditions, or that the degree of compliance with the policies or procedures may deteriorate.
/s/ ERNST & YOUNG LLP
New York, New York
February 9, 2018
54
Consolidated Statements of Income
(in millions, except per share data) | Year Ended December 31, | ||||||||||
2017 | 2016 | 2015 | |||||||||
Revenue | $ | 6,063 | $ | 5,661 | $ | 5,313 | |||||
Expenses: | |||||||||||
Operating-related expenses | 1,713 | 1,773 | 1,718 | ||||||||
Selling and general expenses | 1,560 | 1,439 | 1,532 | ||||||||
Depreciation | 82 | 85 | 90 | ||||||||
Amortization of intangibles | 98 | 96 | 67 | ||||||||
Total expenses | 3,453 | 3,393 | 3,407 | ||||||||
Gain on dispositions | — | (1,101 | ) | (11 | ) | ||||||
Operating profit | 2,610 | 3,369 | 1,917 | ||||||||
Interest expense, net | 149 | 181 | 102 | ||||||||
Income before taxes on income | 2,461 | 3,188 | 1,815 | ||||||||
Provision for taxes on income | 823 | 960 | 547 | ||||||||
Net income | 1,638 | 2,228 | 1,268 | ||||||||
Less: net income attributable to noncontrolling interests | (142 | ) | (122 | ) | (112 | ) | |||||
Net income attributable to S&P Global Inc. | $ | 1,496 | $ | 2,106 | $ | 1,156 | |||||
Earnings per share attributable to S&P Global Inc. common shareholders: | |||||||||||
Net income: | |||||||||||
Basic | $ | 5.84 | $ | 8.02 | $ | 4.26 | |||||
Diluted | $ | 5.78 | $ | 7.94 | $ | 4.21 | |||||
Weighted-average number of common shares outstanding: | |||||||||||
Basic | 256.3 | 262.8 | 271.6 | ||||||||
Diluted | 258.9 | 265.2 | 274.6 | ||||||||
Actual shares outstanding at year end | 253.7 | 258.3 | 265.2 | ||||||||
Dividend declared per common share | $ | 1.64 | $ | 1.44 | $ | 1.32 | |||||
See accompanying notes to the consolidated financial statements.
55
Consolidated Statements of Comprehensive Income
(in millions) | Year Ended December 31, | ||||||||||
2017 | 2016 | 2015 | |||||||||
Net income | $ | 1,638 | $ | 2,228 | $ | 1,268 | |||||
Other comprehensive income: | |||||||||||
Foreign currency translation adjustment | 93 | (132 | ) | (111 | ) | ||||||
Income tax effect | — | (7 | ) | 1 | |||||||
93 | (139 | ) | (110 | ) | |||||||
Pension and other postretirement benefit plans | 52 | (27 | ) | 34 | |||||||
Income tax effect | (11 | ) | (10 | ) | (9 | ) | |||||
41 | (37 | ) | 25 | ||||||||
Unrealized loss on investment | (10 | ) | — | — | |||||||
Income tax effect | — | — | — | ||||||||
(10 | ) | — | — | ||||||||
Unrealized gain (loss) on forward exchange contracts | — | 4 | (1 | ) | |||||||
Income tax effect | — | (1 | ) | — | |||||||
— | 3 | (1 | ) | ||||||||
Comprehensive income | 1,762 | 2,055 | 1,182 | ||||||||
Less: comprehensive income attributable to nonredeemable noncontrolling interests | (15 | ) | (13 | ) | (11 | ) | |||||
Less: comprehensive income attributable to redeemable noncontrolling interests | (127 | ) | (109 | ) | (101 | ) | |||||
Comprehensive income attributable to S&P Global Inc. | $ | 1,620 | $ | 1,933 | $ | 1,070 | |||||
See accompanying notes to the consolidated financial statements.
56
Consolidated Balance Sheets
(in millions) | December 31, | ||||||
2017 | 2016 | ||||||
ASSETS | |||||||
Current assets: | |||||||
Cash and cash equivalents | $ | 2,779 | $ | 2,392 | |||
Short-term investments | 12 | 8 | |||||
Accounts receivable, net of allowance for doubtful accounts: 2017 - $33; 2016 - $28 | 1,319 | 1,122 | |||||
Prepaid and other current assets | 214 | 149 | |||||
Total current assets | 4,324 | 3,671 | |||||
Property and equipment: | |||||||
Buildings and leasehold improvements | 354 | 356 | |||||
Equipment and furniture | 475 | 452 | |||||
Total property and equipment | 829 | 808 | |||||
Less: accumulated depreciation | (554 | ) | (537 | ) | |||
Property and equipment, net | 275 | 271 | |||||
Goodwill | 2,989 | 2,949 | |||||
Other intangible assets, net | 1,388 | 1,506 | |||||
Other non-current assets | 449 | 272 | |||||
Total assets | $ | 9,425 | $ | 8,669 | |||
LIABILITIES AND EQUITY | |||||||
Current liabilities: | |||||||
Accounts payable | $ | 195 | $ | 183 | |||
Accrued compensation and contributions to retirement plans | 472 | 409 | |||||
Short-term debt | 399 | — | |||||
Income taxes currently payable | 77 | 95 | |||||
Unearned revenue | 1,613 | 1,509 | |||||
Accrued legal and regulatory settlements | 107 | 56 | |||||
Other current liabilities | 351 | 359 | |||||
Total current liabilities | 3,214 | 2,611 | |||||
Long-term debt | 3,170 | 3,564 | |||||
Pension and other postretirement benefits | 244 | 274 | |||||
Other non-current liabilities | 679 | 439 | |||||
Total liabilities | 7,307 | 6,888 | |||||
Redeemable noncontrolling interest | 1,350 | 1,080 | |||||
Commitments and contingencies (Note 13) | |||||||
Equity: | |||||||
Common stock, $1 par value: authorized - 600 million shares; issued - 412 million shares in 2017 and 2016 | 412 | 412 | |||||
Additional paid-in capital | 525 | 502 | |||||
Retained income | 10,025 | 9,210 | |||||
Accumulated other comprehensive loss | (649 | ) | (773 | ) | |||
Less: common stock in treasury - at cost: 2017 - 158 million shares; 2016 - 153 million shares | (9,602 | ) | (8,701 | ) | |||
Total equity – controlling interests | 711 | 650 | |||||
Total equity – noncontrolling interests | 57 | 51 | |||||
Total equity | 768 | 701 | |||||
Total liabilities and equity | $ | 9,425 | $ | 8,669 | |||
See accompanying notes to the consolidated financial statements.
57
Consolidated Statements of Cash Flows
(in millions) | Year Ended December 31, | ||||||||||
2017 | 2016 | 2015 | |||||||||
Operating Activities: | |||||||||||
Net income | $ | 1,638 | $ | 2,228 | $ | 1,268 | |||||
Adjustments to reconcile net income to cash provided by operating activities from continuing operations: | |||||||||||
Depreciation | 82 | 85 | 90 | ||||||||
Amortization of intangibles | 98 | 96 | 67 | ||||||||
Provision for losses on accounts receivable | 16 | 9 | 8 | ||||||||
Deferred income taxes | — | 79 | 280 | ||||||||
Stock-based compensation | 99 | 76 | 78 | ||||||||
Gain on dispositions | — | (1,101 | ) | (11 | ) | ||||||
Accrued legal and regulatory settlements | 55 | 54 | 119 | ||||||||
Other | 96 | 30 | 57 | ||||||||
Changes in operating assets and liabilities, net of effect of acquisitions and dispositions: | |||||||||||
Accounts receivable | (196 | ) | (177 | ) | (118 | ) | |||||
Prepaid and other current assets | 10 | 5 | 5 | ||||||||
Accounts payable and accrued expenses | 75 | 19 | (9 | ) | |||||||
Unearned revenue | 85 | 107 | 129 | ||||||||
Accrued legal and regulatory settlements | (4 | ) | (150 | ) | (1,624 | ) | |||||
Other current liabilities | (85 | ) | (19 | ) | (77 | ) | |||||
Net change in prepaid/accrued income taxes | 32 | 174 | 129 | ||||||||
Net change in other assets and liabilities | 15 | 45 | (35 | ) | |||||||
Cash provided by operating activities from continuing operations | 2,016 | 1,560 | 356 | ||||||||
Investing Activities: | |||||||||||
Capital expenditures | (123 | ) | (115 | ) | (139 | ) | |||||
Acquisitions, net of cash acquired | (83 | ) | (177 | ) | (2,396 | ) | |||||
Proceeds from dispositions | 2 | 1,498 | 14 | ||||||||
Changes in short-term investments | (5 | ) | (1 | ) | (4 | ) | |||||
Cash (used for) provided by investing activities from continuing operations | (209 | ) | 1,205 | (2,525 | ) | ||||||
Financing Activities: | |||||||||||
(Payments on)/additions to short-term debt, net | — | (143 | ) | 143 | |||||||
Proceeds from issuance of senior notes, net | — | 493 | 2,674 | ||||||||
Payments on senior notes | — | (421 | ) | — | |||||||
Dividends paid to shareholders | (421 | ) | (380 | ) | (363 | ) | |||||
Distributions to noncontrolling interest holders | (111 | ) | (116 | ) | (104 | ) | |||||
Repurchase of treasury shares | (1,001 | ) | (1,123 | ) | (974 | ) | |||||
Exercise of stock options | 75 | 88 | 86 | ||||||||
Contingent consideration payments | — | (39 | ) | (5 | ) | ||||||
Purchase of additional CRISIL shares | — | — | (16 | ) | |||||||
Employee withholding tax on share-based payments | (49 | ) | (55 | ) | (92 | ) | |||||
Cash (used for) provided by financing activities from continuing operations | (1,507 | ) | (1,696 | ) | 1,349 | ||||||
Effect of exchange rate changes on cash | 87 | (158 | ) | (67 | ) | ||||||
Cash provided by continuing operations | 387 | 911 | (887 | ) | |||||||
Discontinued Operations: | |||||||||||
Cash used for operating activities | — | — | (129 | ) | |||||||
Cash used for discontinued operations | — | — | (129 | ) | |||||||
Net change in cash and cash equivalents | 387 | 911 | (1,016 | ) | |||||||
Cash and cash equivalents at beginning of year | 2,392 | 1,481 | 2,497 | ||||||||
Cash and cash equivalents at end of year | $ | 2,779 | $ | 2,392 | $ | 1,481 | |||||
Cash paid during the year for: | |||||||||||
Interest (including discontinued operations) | $ | 139 | $ | 150 | $ | 65 | |||||
Income taxes (including discontinued operations) | $ | 709 | $ | 683 | $ | 260 | |||||
See accompanying notes to the consolidated financial statements.
58
Consolidated Statements of Equity
(in millions) | Common Stock $1 par | Additional Paid-in Capital | Retained Income | Accumulated Other Comprehensive Loss | Less: Treasury Stock | Total SPGI Equity | Noncontrolling Interests | Total Equity | |||||||||||||||||||||||
Balance as of December 31, 2014 | $ | 412 | $ | 493 | $ | 6,946 | $ | (514 | ) | $ | 6,849 | $ | 488 | $ | 51 | $ | 539 | ||||||||||||||
Comprehensive income 1 | 1,156 | (86 | ) | 1,070 | 11 | 1,081 | |||||||||||||||||||||||||
Dividends | (359 | ) | (359 | ) | (9 | ) | (368 | ) | |||||||||||||||||||||||
Share repurchases | 1,000 | (1,000 | ) | (2 | ) | (1,002 | ) | ||||||||||||||||||||||||
Employee stock plans, net of tax benefit | (18 | ) | (120 | ) | 102 | 102 | |||||||||||||||||||||||||
Change in redemption value of redeemable noncontrolling interest | (107 | ) | (107 | ) | (107 | ) | |||||||||||||||||||||||||
Other | — | (2 | ) | (2 | ) | ||||||||||||||||||||||||||
Balance as of December 31, 2015 | $ | 412 | $ | 475 | $ | 7,636 | $ | (600 | ) | $ | 7,729 | $ | 194 | $ | 49 | $ | 243 | ||||||||||||||
Comprehensive income 1 | 2,106 | (173 | ) | 1,933 | 13 | 1,946 | |||||||||||||||||||||||||
Dividends | (380 | ) | (380 | ) | (10 | ) | (390 | ) | |||||||||||||||||||||||
Share repurchases | 1,097 | (1,097 | ) | (1,097 | ) | ||||||||||||||||||||||||||
Employee stock plans, net of tax benefit | 27 | (125 | ) | 152 | 152 | ||||||||||||||||||||||||||
Change in redemption value of redeemable noncontrolling interest | (153 | ) | (153 | ) | (153 | ) | |||||||||||||||||||||||||
Other | 1 | 1 | (1 | ) | — | ||||||||||||||||||||||||||
Balance as of December 31, 2016 | $ | 412 | $ | 502 | $ | 9,210 | $ | (773 | ) | $ | 8,701 | $ | 650 | $ | 51 | $ | 701 | ||||||||||||||
Comprehensive income 1 | 1,496 | 124 | 1,620 | 15 | 1,635 | ||||||||||||||||||||||||||
Dividends | (421 | ) | (421 | ) | (10 | ) | (431 | ) | |||||||||||||||||||||||
Share repurchases | 1,001 | (1,001 | ) | (5 | ) | (1,006 | ) | ||||||||||||||||||||||||
Employee stock plans | 23 | (100 | ) | 123 | 8 | 131 | |||||||||||||||||||||||||
Change in redemption value of redeemable noncontrolling interest | (260 | ) | (260 | ) | (260 | ) | |||||||||||||||||||||||||
Other | — | (2 | ) | (2 | ) | ||||||||||||||||||||||||||
Balance as of December 31, 2017 | $ | 412 | $ | 525 | $ | 10,025 | $ | (649 | ) | $ | 9,602 | $ | 711 | $ | 57 | $ | 768 | ||||||||||||||
1 | Excludes $127 million, $109 million and $101 million in 2017, 2016 and 2015, respectively, attributable to redeemable noncontrolling interest. |
See accompanying notes to the consolidated financial statements.
59
Notes to the Consolidated Financial Statements
1. Accounting Policies
Nature of operations
S&P Global Inc. (together with its consolidated subsidiaries, the “Company,” the “Registrant,” “we,” “us” or “our”) is a leading provider of transparent and independent ratings, benchmarks, analytics and data to the capital and commodity markets worldwide. The capital markets include asset managers, investment banks, commercial banks, insurance companies, exchanges, trading firms and issuers; and the commodity markets include producers, traders and intermediaries within energy, metals, petrochemicals and agriculture.
Our operations consist of three reportable segments: Ratings, Market and Commodities Intelligence and S&P Dow Jones Indices ("Indices").
• | Ratings is an independent provider of credit ratings, research and analytics, offering investors and other market participants information, ratings and benchmarks. |
• | Market and Commodities Intelligence is a global provider of multi-asset-class data, research and analytical capabilities, which integrate cross-asset analytics and desktop services and deliver their customers in the commodity and energy markets access to high-value information, data, analytic services and pricing and quality benchmarks. We completed the sale of J.D. Power on September 7, 2016, with the results included in Market and Commodities Intelligence results through that date. |
• | Indices is a global index provider that maintains a wide variety of valuation and index benchmarks for investment advisors, wealth managers and institutional investors. |
See Note 12 – Segment and Geographic Information for further discussion on our operating segments, which are also our reportable segments.
Assets and Liabilities Held for Sale and Discontinued Operations
Assets and Liabilities Held for Sale
We classify a disposal group to be sold as held for sale in the period in which all of the following criteria are met: management, having the authority to approve the action, commits to a plan to sell the disposal group; the disposal group is available for immediate sale in its present condition subject only to terms that are usual and customary for sales of such disposal group; an active program to locate a buyer and other actions required to complete the plan to sell the disposal group have been initiated; the sale of the disposal group is probable, and transfer of the disposal group is expected to qualify for recognition as a completed sale within one year, except if events or circumstances beyond our control extend the period of time required to sell the disposal group beyond one year; the disposal group is being actively marketed for sale at a price that is reasonable in relation to its current fair value; and actions required to complete the plan indicate that it is unlikely that significant changes to the plan will be made or that the plan will be withdrawn.
A disposal group that is classified as held for sale is initially measured at the lower of its carrying value or fair value less any costs to sell. Any loss resulting from this measurement is recognized in the period in which the held for sale criteria are met. Conversely, gains are not recognized on the sale of a disposal group until the date of sale.
The fair value of a disposal group less any costs to sell is assessed each reporting period it remains classified as held for sale and any subsequent changes are reported as an adjustment to the carrying value of the disposal group, as long as the new carrying value does not exceed the carrying value of the disposal group at the time it was initially classified as held for sale. Upon determining that a disposal group meets the criteria to be classified as held for sale, the Company reports the assets and liabilities of the disposal group as held for sale in the current period in our consolidated balance sheets.
60
Discontinued Operations
Beginning on January 1, 2015, we adopted revised guidance for discontinued operations that raises the threshold for a disposal to qualify as a discontinued operation. In determining whether a disposal of a component of an entity or a group of components of an entity is required to be presented as a discontinued operation, we make a determination whether the disposal represents a strategic shift that had, or will have, a major effect on our operations and financial results. A component of an entity comprises operations and cash flows that can be clearly distinguished both operationally and for financial reporting purposes. If we conclude that the disposal represents a strategic shift, then the results of operations of the group of assets being disposed of (as well as any gain or loss on the disposal transaction) are aggregated for separate presentation apart from our continuing operating results in the consolidated financial statements. Unless otherwise indicated, all disclosures and amounts in the notes to our consolidated financial statements relate to our continuing operations.
Principles of consolidation
The consolidated financial statements include the accounts of all subsidiaries and our share of earnings or losses of joint ventures and affiliated companies under the equity method of accounting. All significant intercompany accounts and transactions have been eliminated.
Use of estimates
The preparation of financial statements in conformity with generally accepted accounting principles in the United States of America requires management to make estimates and assumptions that affect the amounts reported in the financial statements and accompanying notes. Actual results could differ from those estimates.
Cash and cash equivalents
Cash and cash equivalents include ordinary bank deposits and highly liquid investments with original maturities of three months or less that consist primarily of money market funds with unrestricted daily liquidity and fixed term time deposits. Such investments and bank deposits are stated at cost, which approximates market value, and were $2.8 billion and $2.4 billion as of December 31, 2017 and 2016, respectively. These investments are not subject to significant market risk.
Short-term investments
Short-term investments are securities with original maturities greater than 90 days that are available for use in our operations in the next twelve months. The short-term investments, primarily consisting of certificates of deposit and mutual funds, are classified as held-to-maturity and therefore are carried at cost. Interest and dividends are recorded in income when earned.
Accounts receivable
Credit is extended to customers based upon an evaluation of the customer’s financial condition. Accounts receivable, which include billings consistent with terms of contractual arrangements, are recorded at net realizable value.
Allowance for doubtful accounts
The allowance for doubtful accounts reserve methodology is based on historical analysis, a review of outstanding balances and current conditions. In determining these reserves, we consider, amongst other factors, the financial condition and risk profile of our customers, areas of specific or concentrated risk as well as applicable industry trends or market indicators.
Capitalized technology costs
We capitalize certain software development and website implementation costs. Capitalized costs only include incremental, direct costs of materials and services incurred to develop the software after the preliminary project stage is completed, funding has been committed and it is probable that the project will be completed and used to perform the function intended. Incremental costs are expenditures that are out-of-pocket to us and are not part of an allocation or existing expense base. Software development and website implementation costs are expensed as incurred during the preliminary project stage. Capitalized costs are amortized from the year the software is ready for its intended use over its estimated useful life, three to seven years, using the straight-line method. Periodically, we evaluate the amortization methods, remaining lives and recoverability of such costs. Capitalized software development and website implementation costs are included in other non-current assets and are presented net of accumulated amortization. Gross deferred technology costs were $186 million and $145 million as of December 31, 2017 and 2016, respectively. Accumulated amortization of deferred technology costs was $104 million and $91 million as of December 31, 2017 and 2016, respectively.
61
Fair Value
Certain assets and liabilities are required to be recorded at fair value and classified within a fair value hierarchy based on inputs used when measuring fair value. We have an immaterial amount of forward exchange contracts that are adjusted to fair value on a recurring basis.
Other financial instruments, including cash and cash equivalents and short-term investments, are recorded at cost, which approximates fair value because of the short-term maturity and highly liquid nature of these instruments. The fair value of our total debt borrowings were $3.8 billion and $3.7 billion as of December 31, 2017 and 2016, respectively, and was estimated based on quoted market prices.
Accounting for the impairment of long-lived assets (including other intangible assets)
We evaluate long-lived assets for impairment whenever events or changes in circumstances indicate that the carrying amount of an asset may not be recoverable. Upon such an occurrence, recoverability of assets to be held and used is measured by comparing the carrying amount of an asset to current forecasts of undiscounted future net cash flows expected to be generated by the asset. If the carrying amount of the asset exceeds its estimated future cash flows, an impairment charge is recognized equal to the amount by which the carrying amount of the asset exceeds the fair value of the asset. For long-lived assets held for sale, assets are written down to fair value, less cost to sell. Fair value is determined based on market evidence, discounted cash flows, appraised values or management’s estimates, depending upon the nature of the assets.
For the year ended December 31, 2016, we recorded a non-cash impairment charge of $24 million related to a technology project at our Market and Commodities Intelligence segment in selling and general expenses in our consolidated statement of income.
Goodwill and other indefinite-lived intangible assets
Goodwill represents the excess of purchase price and related costs over the value assigned to the net tangible and identifiable intangible assets of businesses acquired. Goodwill and other intangible assets with indefinite lives are not amortized, but instead are tested for impairment annually during the fourth quarter each year, or more frequently if events or changes in circumstances indicate that the asset might be impaired. We have four reporting units with goodwill that are evaluated for impairment.
We initially perform a qualitative analysis evaluating whether any events and circumstances occurred or exist that provide evidence that it is more likely than not that the fair value of any of our reporting units is less than its carrying amount. If, based on our evaluation we do not believe that it is more likely than not that the fair value of any of our reporting units is less than its carrying amount, no quantitative impairment test is performed. Conversely, if the results of our qualitative assessment determine that it is more likely than not that the fair value of any of our reporting units is less than their respective carrying amounts we perform a two-step quantitative impairment test.
When conducting the first step of our two step impairment test to evaluate the recoverability of goodwill at the reporting unit level, the estimated fair value of the reporting unit is compared to its carrying value including goodwill. Fair value of the reporting units are estimated using the income approach, which incorporates the use of the discounted free cash flow (“DCF”) analyses and are corroborated using the market approach, which incorporates the use of revenue and earnings multiples based on market data. The DCF analyses are based on the current operating budgets and estimated long-term growth projections for each reporting unit. Future cash flows are discounted based on a market comparable weighted average cost of capital rate for each reporting unit, adjusted for market and other risks where appropriate. In addition, we analyze any difference between the sum of the fair values of the reporting units and our total market capitalization for reasonableness, taking into account certain factors including control premiums.
If the fair value of the reporting unit is less than the carrying value, a second step is performed which compares the implied fair value of the reporting unit’s goodwill to the carrying value of the goodwill. The fair value of the goodwill is determined based on the difference between the fair value of the reporting unit and the net fair value of the identifiable assets and liabilities of the reporting unit. If the implied fair value of the goodwill is less than the carrying value, the difference is recognized as an impairment charge.
We evaluate the recoverability of indefinite-lived intangible assets by first performing a qualitative analysis evaluating whether any events and circumstances occurred that provide evidence that it is more likely than not that the indefinite-lived asset is impaired. If, based on our evaluation of the events and circumstances that occurred during the year we do not believe that it is more likely than not that the indefinite-lived asset is impaired, no quantitative impairment test is performed. Conversely, if the results of our qualitative assessment determine that it is more likely than not that the indefinite-lived asset is impaired, a quantitative impairment test is performed. If necessary, the impairment test is performed by comparing the estimated fair value of the intangible asset to its carrying value. If the indefinite-lived intangible asset carrying value exceeds its fair value, an impairment analysis is performed using the income approach. An impairment charge is recognized in an amount equal to that excess.
62
Significant judgments inherent in these analyses include estimating the amount and timing of future cash flows and the selection of appropriate discount rates, royalty rates and long-term growth rate assumptions. Changes in these estimates and assumptions could materially affect the determination of fair value for each reporting unit and indefinite-lived intangible asset and could result in an impairment charge, which could be material to our financial position and results of operations.
We performed our impairment assessment of goodwill and indefinite-lived intangible assets and concluded that no impairment existed for the years ended December 31, 2017, 2016 and 2015.
Foreign currency translation
We have operations in many foreign countries. For most international operations, the local currency is the functional currency. For international operations that are determined to be extensions of the parent company, the United States ("U.S.") dollar is the functional currency. For local currency operations, assets and liabilities are translated into U.S. dollars using end of period exchange rates, and revenue and expenses are translated into U.S. dollars using weighted-average exchange rates. Foreign currency translation adjustments are accumulated in a separate component of equity.
Revenue recognition
Revenue is recognized as it is earned when services are rendered. We consider amounts to be earned once evidence of an arrangement has been obtained, services are performed, fees are fixed or determinable and collectability is reasonably assured. Revenue relating to products that provide for more than one deliverable is recognized based upon the relative fair value to the customer of each deliverable as each deliverable is provided. Revenue relating to agreements that provide for more than one service is recognized based upon the relative fair value to the customer of each service component as each component is earned. If the fair value to the customer for each service is not objectively determinable, management makes its best estimate of the services’ stand-alone selling price and records revenue as it is earned over the service period. For arrangements that include multiple services, fair value of the service components are determined using an analysis that considers cash consideration that would be received for instances when the service components are sold separately. Advertising revenue is recognized when the page is run. Subscription income is recognized over the related subscription period.
Depreciation
The costs of property and equipment are depreciated using the straight-line method based upon the following estimated useful lives: buildings and improvements from 15 to 40 years and equipment and furniture from 2 to 10 years. The costs of leasehold improvements are amortized over the lesser of the useful lives or the terms of the respective leases.
Advertising expense
The cost of advertising is expensed as incurred. We incurred $33 million, $35 million and $33 million in advertising costs for the years ended December 31, 2017, 2016 and 2015, respectively.
Stock-based compensation
Stock-based compensation expense is measured at the grant date based on the fair value of the award and is recognized over the requisite service period, which typically is the vesting period. Stock-based compensation is classified as both operating-related expense and selling and general expense in the consolidated statements of income.
Income taxes
Deferred tax assets and liabilities are recognized for the future tax consequences attributable to differences between financial statement carrying amounts of existing assets and liabilities and their respective tax bases. Deferred tax assets and liabilities are measured using enacted tax rates expected to be applied to taxable income in the years in which those temporary differences are expected to be recovered or settled. We recognize liabilities for uncertain tax positions taken or expected to be taken in income tax returns. Accrued interest and penalties related to unrecognized tax benefits are recognized in interest expense and operating expense, respectively.
Judgment is required in determining our provision for income taxes, deferred tax assets and liabilities and unrecognized tax benefits. In determining the need for a valuation allowance, the historical and projected financial performance of the operation that is recording a net deferred tax asset is considered along with any other pertinent information.
We file income tax returns in the U.S. federal jurisdiction, various states, and foreign jurisdictions, and we are routinely under audit by many different tax authorities. We believe that our accrual for tax liabilities is adequate for all open audit years based on our assessment of many factors including past experience and interpretations of tax law. This assessment relies on estimates and assumptions and may involve a series of complex judgments about future events. It is possible that examinations will be settled
63
prior to December 31, 2018. If any of these tax audit settlements do occur within that period we would make any necessary adjustments to the accrual for unrecognized tax benefits.
For the years ended December 31, 2016 and 2015, we had determined that the undistributed earnings of our foreign subsidiaries were permanently reinvested within those foreign operations. Accordingly, we had not recorded deferred income taxes on these
indefinitely reinvested earnings. As of December 31, 2017, we have approximately $2.6 billion of undistributed earnings of our foreign subsidiaries. As a result of the TCJA, more than 70% of these $2.6 billion earnings will no longer be permanently reinvested. We will continue to permanently reinvest approximately $780 million of these undistributed earnings.
Redeemable Noncontrolling Interest
The agreement with the minority partners of our S&P Dow Jones Indices LLC joint venture established in June of 2012 contains redemption features whereby interests held by our minority partners are redeemable either (i) at the option of the holder or (ii) upon the occurrence of an event that is not solely within our control. Since redemption of the noncontrolling interest is outside of our control, this interest is presented on our consolidated balance sheets under the caption “Redeemable noncontrolling interest.” If the interest were to be redeemed, we would be required to purchase all of such interest at fair value on the date of redemption. We adjust the redeemable noncontrolling interest each reporting period to its estimated redemption value, but never less than its initial fair value, using a combination of an income and market valuation approach. Our income and market valuation approaches may incorporate Level 3 measures for instances when observable inputs are not available, including assumptions related to expected future net cash flows, long-term growth rates, the timing and nature of tax attributes, and the redemption features. Any adjustments to the redemption value will impact retained income. See Note 9 – Equity for further detail.
Contingencies
We accrue for loss contingencies when both (a) information available prior to issuance of the consolidated financial statements indicates that it is probable that a liability had been incurred at the date of the financial statements and (b) the amount of loss can reasonably be estimated. We continually assess the likelihood of any adverse judgments or outcomes to our contingencies, as well as potential amounts or ranges of probable losses, and recognize a liability, if any, for these contingencies based on an analysis of each matter with the assistance of outside legal counsel and, if applicable, other experts. Because many of these matters are resolved over long periods of time, our estimate of liabilities may change due to new developments, changes in assumptions or changes in our strategy related to the matter. When we accrue for loss contingencies and the reasonable estimate of the loss is within a range, we record our best estimate within the range. We disclose an estimated possible loss or a range of loss when it is at least reasonably possible that a loss may be incurred.
Recent Accounting Standards
In August of 2017, the Financial Accounting Standards Board ("FASB") issued guidance to enhance the hedge accounting model for both nonfinancial and financial risk components, which includes amendments to address certain aspects of recognition and presentation disclosure. The guidance is effective for reporting periods beginning after December 15, 2018. We do not expect this guidance to have a significant impact on our consolidated financial statements.
In May of 2017, the FASB issued guidance that provides clarification on when modification accounting should be used for changes to the terms or conditions of a share-based payment award. This guidance does not change the accounting for modifications but
clarifies when modification accounting guidance should be applied. Under the new guidance, an entity should apply modification accounting in response to a change in the terms and conditions of an entity's share-based payment awards unless three newly specified criteria are met. The guidance is effective for reporting periods beginning after December 15, 2017; however, early adoption is permitted. We do not expect this guidance to have a significant impact on our consolidated financial statements.
In March of 2017, the FASB issued guidance to enhance the presentation of net periodic pension cost and net periodic postretirement benefit cost. The guidance requires employers to report the service cost component in the same line item or items as other compensation costs arising from services rendered by the pertinent employees during the period, and requires the other components of net periodic pension cost and net periodic postretirement benefit cost to be presented in the income statement separately from the service cost component outside a subtotal of income from operations. Additionally, only the service cost component is eligible for capitalization. The guidance is effective for reporting periods beginning after December 15, 2017; however, early adoption is permitted. The guidance is required to be adopted retrospectively with respect to the income statement presentation requirement and prospectively for the capitalization requirement. The change in capitalization requirement will not have a material impact on our consolidated financial statements.We recorded a benefit of $25 million, $24 million and $3 million in 2017, 2016 and 2015, respectively, related to our net periodic benefit costs for our retirement and postretirement plans. These amounts are not necessarily indicative of future amounts that may arise in years following the implementation of this new guidance. See Note 7 – Employee Benefits for additional information related to our retirement and postretirement plans.
64
In January of 2017, the FASB issued guidance that simplifies the subsequent measurement of goodwill and eliminates Step 2 from the goodwill impairment test. Under the new guidance, an entity should perform its annual, or interim, goodwill impairment test by comparing the fair value of a reporting unit with its carrying amount. An entity should recognize an impairment charge for the amount by which the carrying amount exceeds the reporting unit's fair value; however, the loss recognized should not exceed the total amount of goodwill allocated to that reporting unit. Additionally, an entity should consider income tax effects from any tax deductible goodwill on the carrying amount of the reporting unit when measuring the goodwill impairment loss, if applicable. The guidance is effective for reporting periods beginning after December 15, 2019; however, early adoption is permitted. We do not expect this guidance to have a significant impact on our consolidated financial statements.
In January of 2017, the FASB issued guidance that clarifies the definition of a business with the objective of adding guidance to assist entities with evaluating whether transactions should be accounted for as acquisitions (or disposals) of assets or businesses. The guidance is effective for reporting periods beginning after December 15, 2017. We do not expect this guidance to have a significant impact on our consolidated financial statements.
In August of 2016, the FASB issued guidance providing amendments to eight specific statement of cash flows classification issues. The guidance is effective for reporting periods beginning after December 15, 2017; however, early adoption is permitted. We do not expect this guidance to have a significant impact on our consolidated financial statements.
In March of 2016, the FASB issued guidance to modify several aspects of accounting for share-based payment transactions, including the accounting for income taxes, forfeitures, statutory tax withholding requirements, as well as classification in the statement of cash flows. This guidance requires recognizing excess tax benefits and deficiencies as income tax expense or benefit in the statement of income, instead of in equity. The guidance was effective on January 1, 2017 and was adopted as follows: 1) prospectively for the recognition of excess tax benefits and deficiencies in the tax provision, 2) retrospectively for the classification of excess tax benefits and deficiencies in the statement of cash flows, and 3) retrospectively for the classification of cash paid for shares withheld to satisfy employee taxes in the statement of cash flows. For the year ended December 31, 2017, excess tax benefits from share-based payments of $72 million were recognized as an income tax benefit in our consolidated statements of income and classified as an operating activity in our consolidated statements of cash flows. For the years ended December 31, 2016 and 2015, we reclassified $41 million and $69 million, respectively, of excess tax benefits from share-based payments from a financing activity to an operating activity in our consolidated statements of cash flows. In addition, cash paid for shares withheld on the employees' behalf of $49 million was classified as a financing activity in our consolidated statements of cash flows for the year ended December 31, 2017. Cash paid for employee taxes of $55 million and $92 million were reclassified from an operating activity to a financing activity in our consolidated statements of cash flows for the years ended December 31, 2016 and 2015, respectively.
In February of 2016, the FASB issued guidance that amends accounting for leases. Under the new guidance, a lessee will recognize assets and liabilities but will recognize expenses similar to current lease accounting. The guidance is effective for reporting periods beginning after December 15, 2018; however, early adoption is permitted. The new guidance must be adopted using a modified retrospective approach to each prior reporting period presented with various optional practical expedients. We are currently evaluating the impact of the adoption of this guidance on our consolidated financial statements.
In January of 2016, the FASB issued guidance to enhance the reporting model for financial instruments, which includes amendments to address certain aspects of recognition, measurement, presentation and disclosure. The guidance is effective for reporting periods beginning after December 15, 2017. We do not expect this guidance to have a significant impact on our consolidated financial statements.
In May of 2014, the FASB and the International Accounting Standards Board (“IASB”) issued jointly a converged standard on the recognition of revenue from contracts with customers, which is intended to improve the financial reporting of revenue and comparability of the top line in financial statements globally. The core principle of the new standard is for the recognition of revenue to depict the transfer of goods or services to customers in amounts that reflect the payment to which the company expects to be entitled in exchange for those goods or services. The new standard will also result in enhanced revenue disclosures, provide guidance for transactions that were not previously addressed comprehensively and improve guidance for multiple-element arrangements. In August of 2015, the FASB issued guidance deferring the effective date of the new revenue standard by one year. Subsequently, the FASB issued implementation guidance related to the new revenue standard, including the following: In March of 2016, the FASB issued guidance to clarify the implementation guidance on principal versus agent considerations; in April of 2016, the FASB clarified guidance on performance obligations and the licensing implementation guidance; in May of 2016, the FASB issued a practical expedient in response to identified implementation issues. The new guidance will be effective for annual reporting periods beginning after December 15, 2017, including interim reporting periods within that reporting period. We have completed our evaluation of changes to our accounting policies, business processes, systems and internal controls to support the recognition and disclosure requirements under the new standard. We will adopt the new revenue standard effective January 1,
65
2018 using the modified retrospective transition method. Based on our analysis, adoption of the new standard will impact: (1) the capitalization of costs to obtain contracts with our customers and the related amortization period of those costs; (2) the timing of when fees for certain Ratings products that are recognized to match when the customer obtains control of the product; 3) the accounting for long-term deferred revenue in our Ratings segment which contain a financing component; and 4) the presentation of sales of certain of our jointly-owned products in our Market and Commodities Intelligence segment, where revenue will be recognized on a gross rather than net basis. The aggregate impact of these adjustments on our opening balance sheet will be an increase to retained earnings of approximately $40 million, with the increase driven primarily by the capitalization of costs to obtain contracts with our customers of approximately $79 million previously expensed, offset by the deferral of income associated with our Ratings products of approximately $14 million previously recognized in revenue, the net impact of recording expense associated with the significant financing component of Ratings' long term deferred revenue of approximately $12 million, and a net increase to the associated deferred tax assets and deferred tax liabilities associated with these adjustments of approximately $13 million.
Reclassification
Certain prior year amounts have been reclassified for comparability purposes.
2. Acquisitions and Divestitures
Acquisitions
2017
For the year ended December 31, 2017, we paid cash for acquisitions, net of cash acquired, totaling $83 million. None of our acquisitions were material either individually or in the aggregate, including the pro forma impact on earnings. All acquisitions were funded with cash flows from operations. Acquisitions completed during the year ended December 31, 2017 included:
• | In August of 2017, we acquired a 6.02% investment in Algomi Limited ("Algomi"), an innovative fintech company focused on providing software-enabled liquidity solutions to both buy-side and sell-side firms within the credit markets. Our investment in Algomi will help facilitate product collaboration and enable future business expansion. We accounted for the investment in Algomi using the cost method of accounting. The investment with Algomi is not material to our consolidated financial statements. |
• | In June of 2017, CRISIL, included within our Ratings segment, acquired 8.9% of the outstanding shares of CARE Ratings Limited ("CARE") from Canara Bank. CARE is a Securities and Exchange Board of India registered credit rating agency providing various rating and grading services in India whose shares are publicly traded on both the Bombay Stock Exchange and the National Stock Exchange of India. We accounted for the investment in CARE as available-for-sale using the fair value method of accounting. The investment balance as of December 31, 2017 of $54 million is included in other non-current assets in our consolidated balance sheet. The change in the fair value of this investment is reported in accumulated other comprehensive loss in our consolidated balance sheet. The investment in CARE is not material to our consolidated financial statements. |
2016
For the year ended December 31, 2016, we paid cash for acquisitions, net of cash acquired, totaling $177 million. None of our acquisitions were material either individually or in the aggregate, including the pro forma impact on earnings. All acquisitions were funded with cash flows from operations. Acquisitions completed during the year ended December 31, 2016 by segment included:
Market and Commodities Intelligence
• | In December of 2016, Market and Commodities Intelligence acquired a 2.54% equity investment in Kensho Technologies, Inc. ("Kensho"), a financial technology startup in market data analytics. We accounted for the acquisition of Kensho on a cost basis. Our investment in Kensho is not material to our consolidated financial statements. |
• | In September of 2016, Market and Commodities Intelligence acquired PIRA Energy Group ("PIRA"), a global provider of energy research and forecasting products and services. The purchase enhances Market and Commodities Intelligence's energy analytical capabilities by expanding its oil offering and strengthening its position in the natural gas and power markets. We accounted for the acquisition of PIRA using the purchase method of accounting. The acquisition of PIRA is not material to our consolidated financial statements. |
66
• | In June of 2016, Market and Commodities Intelligence acquired RigData, a provider of daily information on rig activity for the natural gas and oil markets across North America. The purchase enhances Market and Commodities Intelligence's energy analytical capabilities by strengthening its position in natural gas and enhancing its oil offering. We accounted for the acquisition of RigData using the purchase method of accounting. The acquisition of RigData is not material to our consolidated financial statements. |
• | In March of 2016, Market and Commodities Intelligence acquired Commodity Flow, a specialist technology and business intelligence service for the global waterborne commodity and energy markets. The purchase helps extend Market and Commodities Intelligence's trade flow analytical capabilities and complements its existing shipping services. We accounted for the acquisition of Commodity Flow using the purchase method of accounting. The acquisition of Commodity Flow is not material to our consolidated financial statements. |
Following our acquisition of PIRA, we made a contingent purchase price payment in 2016 for $34 million that has been reflected in the consolidated statement of cash flows as a financing activity.
Following our acquisition of National Automobile Dealers Association's Used Car Guide ("UCG") at J.D. Power in July of 2015, we made a contingent purchase price payment in 2016 for $5 million that has been reflected in the consolidated statement of cash flows as a financing activity.
Indices
• | In October of 2016, Indices acquired Trucost plc, a leader in carbon and environmental data and risk analysis through its subsidiary S&P Global Indices UK Limited. The purchase will build on Indices' current portfolio of Environmental, Social and Governance solutions. The acquisition of Trucost plc is not material to our consolidated financial statements. |
Ratings
• | In June of 2016, Ratings acquired a 49% equity investment in Thailand's TRIS Rating Company Limited from its parent company, TRIS Corporation Limited. The transaction extends an existing association between Ratings and TRIS Rating and deepens their commitment to capital markets in Thailand. We accounted for the acquisition of TRIS Rating Company using the equity method of accounting. The equity investment in TRIS Rating is not material to our consolidated financial statements. |
For acquisitions during 2016 that were accounted for using the purchase method, the excess of the purchase price over the fair value of the net assets acquired is allocated to goodwill and other intangibles. The goodwill recognized on our acquisitions is largely attributable to anticipated operational synergies and growth opportunities as a result of the acquisition. The intangible assets, excluding goodwill and indefinite-lived intangibles, will be amortized over their anticipated useful lives between 3 and 10 years which will be determined when we finalize our purchase price allocations. The goodwill for PIRA and RigData is expected to be deductible for tax purposes.
2015
For the year ended December 31, 2015, we paid cash for acquisitions, net of cash acquired, totaling $2.4 billion. We used the net proceeds of our $2.0 billion of senior notes issued in August of 2015 and cash on hand to finance the acquisition of SNL. All other acquisitions were funded with cash flows from operations. Acquisitions completed during the year ended December 31, 2015 by segment included:
Market and Commodities Intelligence
• | In September of 2015, we acquired SNL Financial LC ("SNL") for $2.2 billion. SNL is a global provider of news, data, and analytical tools to five sectors in the global economy: financial services, real estate, energy, media & communications, and metals & mining. SNL delivers information through its suite of web, mobile and direct data feed platforms that helps clients, including investment and commercial banks, investors, corporations, and regulators make decisions, improve efficiency, and manage risk. See below for further detail related to this transaction. |
67
• | In July of 2015, we acquired the entire issued share capital of Petromedia Ltd and its operating subsidiaries (“Petromedia”), an independent provider of data, intelligence, news and tools to the global fuels market that offers a suite of products that provides clients with actionable data and intelligence that enable informed decisions, minimize risk and increase efficiency. We accounted for the acquisition of Petromedia using the purchase method of accounting. The acquisition of Petromedia is not material to our consolidated financial statements. |
Following our acquisition of UCG at J.D. Power in July of 2015, we made a contingent purchase price payment in 2015 for $5 million that has been reflected in the consolidated statement of cash flows as a financing activity.
For acquisitions during 2015 that were accounted for using the purchase method, the excess of the purchase price over the fair value of the net assets acquired is allocated to goodwill and other intangibles. Intangible assets recorded for all transactions are amortized using the straight-line method for periods not exceeding 18 years.
Acquisition of SNL
Acquisition-Related Expenses
During the year ended December 31, 2015, the Company incurred approximately $37 million of acquisition-related costs related to the acquisition of SNL. These expenses are included in selling and general expenses in our consolidated statements of income.
Allocation of Purchase Price
Our acquisition of SNL was accounted for using the purchase method. Under the purchase method, the excess of the purchase price over the fair value of the net assets acquired is allocated to goodwill and other intangibles. The goodwill recognized is largely attributable to anticipated operational synergies and growth opportunities as a result of the acquisition. The intangible assets, excluding goodwill and indefinite-lived intangibles, will be amortized over their anticipated useful lives between 10 and 18 years. The goodwill is expected to be deductible for tax purposes.
The following table presents the final allocation of purchase price to the assets and liabilities of SNL as a result of the acquisition.
(in millions) | |||
Current assets | $ | 29 | |
Property, plant and equipment | 19 | ||
Goodwill | 1,574 | ||
Other intangible assets, net: | |||
Databases and software | 421 | ||
Customer relationships | 162 | ||
Tradenames | 185 | ||
Other intangibles | 4 | ||
Other intangible assets, net | 772 | ||
Other non-current assets | 1 | ||
Total assets acquired | 2,395 | ||
Current liabilities | (43 | ) | |
Unearned revenue | (117 | ) | |
Other non-current liabilities | (1 | ) | |
Total liabilities acquired | (161 | ) | |
Net assets acquired | $ | 2,234 | |
Supplemental Pro Forma Information
Supplemental information on an unaudited pro forma basis is presented below for the year ended December 31, 2015 as if the acquisition of SNL occurred on January 1, 2015. The pro forma financial information is presented for comparative purposes only, based on estimates and assumptions, which the Company believes to be reasonable but not necessarily indicative of the consolidated financial position or results of operations in future periods or the results that actually would have been realized had this acquisition
68
been completed at the beginning of 2015. The unaudited pro forma information includes intangible asset charges and incremental borrowing costs as a result of the acquisition, net of related tax, estimated using the Company's effective tax rate for continuing operations for the periods presented.
(in millions) | Year Ended | ||
December 31, 2015 | |||
Pro forma revenue | $ | 5,477 | |
Pro forma net income | $ | 1,258 | |
Non-cash investing activities
Liabilities assumed in conjunction with our acquisitions are as follows:
(in millions) | Year ended December 31, | ||||||||||
2017 | 2016 | 2015 | |||||||||
Fair value of assets acquired | $ | 83 | $ | 253 | $ | 2,576 | |||||
Cash paid (net of cash acquired) | 83 | 211 | 2,401 | ||||||||
Liabilities assumed | $ | — | $ | 42 | $ | 175 | |||||
Divestitures - Continuing Operations
2017
In April of 2017, we signed a letter of intent to sell our facility at East Windsor, New Jersey. The fixed assets of the facility of $5 million have been classified as held for sale, which is included in prepaid and other current assets in our consolidated balance sheet as of December 31, 2017.
In January of 2017, we completed the sale of Quant House SAS ("QuantHouse"), included in our Market and Commodities Intelligence segment, to QH Holdco, an independent third party. In November of 2016, we entered into a put option agreement that gave the Company the right, but not the obligation, to put the entire share capital of QuantHouse to QH Holdco. As a result, we classified the assets and liabilities of QuantHouse, net of our costs to sell, as held for sale, which were included in prepaid and other current assets and other current liabilities, respectively, in our consolidated balance sheet as of December 31, 2016 resulting in an aggregate loss of $31 million. On January 4, 2017, we exercised the put option, thereby entering into a definitive agreement to sell QuantHouse to QH Holdco. On January 9, 2017, we completed the sale of QuantHouse to QH Holdco.
The components of assets and liabilities held for sale related to QuantHouse, which were included in prepaid and other current assets and other current liabilities in the consolidated balance sheet, consist of the following:
(in millions) | December 31, 2016 | ||
Accounts receivable, net | $ | 4 | |
Other assets | 3 | ||
Assets of a business held for sale | $ | 7 | |
Accounts payable and accrued expenses | $ | 3 | |
Unearned revenue | 7 | ||
Other liabilities | 35 | ||
Liabilities of a business held for sale | $ | 45 | |
2016
During the year ended December 31, 2016, we completed the following dispositions that resulted in a net pre-tax gain of $1.1 billion, which was included in gain on dispositions in the consolidated statement of income:
69
• | In October of 2016, we completed the sale of Standard & Poor's Securities Evaluations, Inc. ("SPSE") and Credit Market Analysis ("CMA"), two businesses within our Market and Commodities Intelligence segment, for $425 million in cash to Intercontinental Exchange, an operator of global exchanges, clearing houses and data services. During the year ended December 31, 2016, we recorded a pre-tax gain of $364 million ($297 million after-tax) in gain on dispositions in the consolidated statement of income related to the sale of SPSE and CMA. Additionally, in October of 2016, we completed the sale of Equity and Fund Research ("Equity Research") to CFRA, a leading independent provider of forensic accounting research, analytics and advisory services. During the year ended December 31, 2016, we recorded a pre-tax gain of $9 million ($5 million after-tax) in gain on dispositions in the consolidated statement of income related to the sale of Equity Research. |
• | In September of 2016, we completed the sale of J.D. Power, included within our Market and Commodities Intelligence segment, for $1.1 billion to XIO Group, a global alternative investments firm headquartered in London. During the year ended December 31, 2016, we recorded a pre-tax gain of $728 million ($516 million after-tax) in gain on dispositions in the consolidated statement of income related to the sale of J.D. Power. |
2015
During the year ended December 31, 2015, we recorded a pre-tax gain of $11 million in gain on dispositions in the consolidated statement of income related to the sale of our interest in a legacy McGraw Hill Construction investment.
The operating profit of our businesses that were disposed of or held for sale for the years ending December 31, 2017, 2016, and 2015 is as follows:
(in millions) | Year ended December 31, | ||||||||||
2017 | 2016 | 2015 | |||||||||
Operating profit 1 | $ | — | $ | 62 | $ | 85 | |||||
1 The year ended December 31, 2016 excludes a pre-tax gain of $1.1 billion on our dispositions.
3. Goodwill and Other Intangible Assets
Goodwill
Goodwill represents the excess of purchase price and related costs over the value assigned to the net tangible and identifiable intangible assets of businesses acquired.
The change in the carrying amount of goodwill by segment is shown below:
(in millions) | Ratings | Market and Commodities Intelligence | Indices | Total | |||||||||||
Balance as of December 31, 2015 | $ | 114 | $ | 2,392 | $ | 376 | $ | 2,882 | |||||||
Acquisitions | — | 106 | 7 | 113 | |||||||||||
Dispositions | — | (35 | ) | — | (35 | ) | |||||||||
Other 1 | (5 | ) | (6 | ) | — | (11 | ) | ||||||||
Balance as of December 31, 2016 | 109 | 2,457 | 383 | 2,949 | |||||||||||
Other 1 | 5 | 27 | 8 | 40 | |||||||||||
Balance as of December 31, 2017 | $ | 114 | $ | 2,484 | $ | 391 | $ | 2,989 | |||||||
1 | Primarily relates to the impact of foreign exchange and valuation adjustments for prior period acquisitions. 2016 includes adjustments related to SNL and Petromedia. 2017 includes adjustments related to PIRA, Trucost, RigData and Commodity Flow. |
Goodwill additions and dispositions in the table above relate to transactions discussed in Note 2 – Acquisitions and Divestitures.
Other Intangible Assets
Other intangible assets include both indefinite-lived assets not subject to amortization and definite-lived assets subject to amortization. We have indefinite-lived assets with a carrying value of $714 million as of December 31, 2017 and 2016 that consist of the following:
70
• | $380 million and $90 million for Dow Jones Indices intellectual property and the Dow Jones tradename, respectively, that we recorded as part of the transaction to form S&P Dow Jones Indices LLC in 2012. |
• | $185 million within our Market and Commodities Intelligence segment for the SNL tradename. |
• | $59 million within our Indices segment for the Goldman Sachs Commodity Index intellectual property and the Broad Market Indices intellectual property. |
The following table summarizes our definite-lived intangible assets:
(in millions) | |||||||||||||||||||||||
Cost | Databases and software | Content | Customer relationships | Tradenames | Other intangibles | Total | |||||||||||||||||
Balance as of December 31, 2015 | $ | 510 | $ | 139 | $ | 168 | $ | 47 | $ | 269 | $ | 1,133 | |||||||||||
Acquisitions | — | — | — | — | 98 | 98 | |||||||||||||||||
Dispositions | — | — | — | (2 | ) | (8 | ) | (10 | ) | ||||||||||||||
Impairment 1 | (2 | ) | — | — | — | (22 | ) | (24 | ) | ||||||||||||||
Reclassifications | — | — | 165 | 1 | (166 | ) | — | ||||||||||||||||
Other (primarily Fx) | (2 | ) | — | (3 | ) | (1 | ) | (8 | ) | (14 | ) | ||||||||||||
Balance as of December 31, 2016 | 506 | 139 | 330 | 45 | 163 | 1,183 | |||||||||||||||||
Dispositions | (4 | ) | — | (2 | ) | — | — | (6 | ) | ||||||||||||||
Other 2 | 52 | — | 19 | 5 | (86 | ) | (10 | ) | |||||||||||||||
Balance as of December 31, 2017 | $ | 554 | $ | 139 | $ | 347 | $ | 50 | $ | 77 | $ | 1,167 | |||||||||||
Accumulated amortization | |||||||||||||||||||||||
Balance as of December 31, 2015 | $ | 88 | $ | 73 | $ | 60 | $ | 36 | $ | 67 | $ | 324 | |||||||||||
Current year amortization | 47 | 14 | 21 | 2 | 12 | 96 | |||||||||||||||||
Dispositions | — | — | — | (1 | ) | (6 | ) | (7 | ) | ||||||||||||||
Impairment 1 | (2 | ) | — | — | — | (10 | ) | (12 | ) | ||||||||||||||
Reclassifications | 2 | — | 5 | — | (7 | ) | — | ||||||||||||||||
Other (primarily Fx) | (3 | ) | — | (2 | ) | (1 | ) | (4 | ) | (10 | ) | ||||||||||||
Balance as of December 31, 2016 | 132 | 87 | 84 | 36 | 52 | 391 | |||||||||||||||||
Current year amortization | 52 | 14 | 22 | 4 | 6 | 98 | |||||||||||||||||
Dispositions | (3 | ) | — | (2 | ) | — | (1 | ) | (6 | ) | |||||||||||||
Reclassifications | 2 | — | 1 | 1 | (4 | ) | — | ||||||||||||||||
Other (primarily Fx) | 4 | — | 1 | 1 | 4 | 10 | |||||||||||||||||
Balance as of December 31, 2017 | $ | 187 | $ | 101 | $ | 106 | $ | 42 | $ | 57 | $ | 493 | |||||||||||
Net definite-lived intangibles: | |||||||||||||||||||||||
December 31, 2016 | $ | 374 | $ | 52 | $ | 246 | $ | 9 | $ | 111 | $ | 792 | |||||||||||
December 31, 2017 | $ | 367 | $ | 38 | $ | 241 | $ | 8 | $ | 20 | $ | 674 | |||||||||||
1 | Relates to a technology-related impairment charge at Market and Commodities Intelligence and recorded in selling and general expenses in the consolidated statement of income. |
2 | Primarily relates to the impact of foreign exchange and valuation adjustments for prior period acquisitions. 2017 includes adjustments related to PIRA, Trucost, RigData and Commodity Flow. |
71
Definite-lived intangible assets are being amortized on a straight-line basis over periods of up to 20 years. The weighted-average life of the intangible assets as of December 31, 2017 is approximately 12 years.
Amortization expense for the years ended December 31, 2017, 2016 and 2015 was $98 million, $96 million, and $67 million, respectively. Expected amortization expense for intangible assets over the next five years for the years ended December 31, assuming no further acquisitions or dispositions, is as follows:
(in millions) | 2018 | 2019 | 2020 | 2021 | 2022 | ||||||||||||||
Amortization expense | $ | 95 | $ | 88 | $ | 82 | $ | 70 | $ | 68 | |||||||||
4. Taxes on Income
Comprehensive tax legislation enacted through the Tax Cuts and Jobs Act (“TCJA”) on December 22, 2017, significantly modified U.S. corporate income tax law. Provisional amounts have been recorded in our financial statements based on the Company’s initial analysis of the TCJA. The Company may adjust these amounts in future periods if our interpretation of the TCJA changes or as additional guidance from the U.S. Treasury becomes available. As a result of the TCJA, a provisional amount of $149 million has been recorded which reflects a one-time tax charge of approximately $173 million on the deemed repatriation of foreign earnings and a one-time tax benefit of approximately $24 million in respect of the re-valuation of net U.S. deferred tax liabilities at the reduced corporate income tax rate.
Income before taxes on income resulting from domestic and foreign operations is as follows:
(in millions) | Year Ended December 31, | ||||||||||
2017 | 2016 | 2015 | |||||||||
Domestic operations | $ | 1,723 | $ | 2,585 | $ | 1,266 | |||||
Foreign operations | 738 | 603 | 549 | ||||||||
Total income before taxes | $ | 2,461 | $ | 3,188 | $ | 1,815 | |||||
The provision for taxes on income consists of the following:
(in millions) | Year Ended December 31, | ||||||||||
2017 | 2016 | 2015 | |||||||||
Federal: | |||||||||||
Current | $ | 489 | $ | 641 | $ | 90 | |||||
Deferred | 63 | 79 | 276 | ||||||||
Total federal | 552 | 720 | 366 | ||||||||
Foreign: | |||||||||||
Current | 194 | 133 | 111 | ||||||||
Deferred | (3 | ) | (4 | ) | (1 | ) | |||||
Total foreign | 191 | 129 | 110 | ||||||||
State and local: | |||||||||||
Current | 73 | 99 | 34 | ||||||||
Deferred | 7 | 12 | 37 | ||||||||
Total state and local | 80 | 111 | 71 | ||||||||
Total provision for taxes | $ | 823 | $ | 960 | $ | 547 | |||||
72
A reconciliation of the U.S. federal statutory income tax rate to our effective income tax rate for financial reporting purposes is as follows:
Year Ended December 31, | ||||||||
2017 | 2016 | 2015 | ||||||
U.S. federal statutory income tax rate | 35.0 | % | 35.0 | % | 35.0 | % | ||
State and local income taxes | 2.5 | 2.7 | 2.6 | |||||
Divestitures | — | (4.3 | ) | — | ||||
Foreign operations | (3.9 | ) | (2.0 | ) | (3.2 | ) | ||
Impact of TCJA | 6.0 | — | — | |||||
Stock-based compensation | (2.7 | ) | — | — | ||||
S&P Dow Jones Indices LLC joint venture | (1.8 | ) | (1.2 | ) | (2.0 | ) | ||
Tax credits and incentives | (2.1 | ) | (1.6 | ) | (2.9 | ) | ||
Other, net | 0.4 | 1.5 | 0.6 | |||||
Effective income tax rate | 33.4 | % | 30.1 | % | 30.1 | % | ||
The principal temporary differences between the accounting for income and expenses for financial reporting and income tax purposes are as follows:
(in millions) | December 31, | ||||||
2017 | 2016 | ||||||
Deferred tax assets: | |||||||
Legal and regulatory settlements | $ | 27 | $ | 23 | |||
Employee compensation | 50 | 78 | |||||
Accrued expenses | 47 | 87 | |||||
Postretirement benefits | 34 | 105 | |||||
Unearned revenue | 26 | 33 | |||||
Allowance for doubtful accounts | 8 | 11 | |||||
Loss carryforwards | 135 | 112 | |||||
Other | 45 | 3 | |||||
Total deferred tax assets | 372 | 452 | |||||
Deferred tax liabilities: | |||||||
Goodwill and intangible assets | (249 | ) | (320 | ) | |||
Fixed assets | (4 | ) | (3 | ) | |||
Other | — | — | |||||
Total deferred tax liabilities | (253 | ) | (323 | ) | |||
Net deferred income tax asset before valuation allowance | 119 | 129 | |||||
Valuation allowance | (127 | ) | (116 | ) | |||
Net deferred income tax (liability) asset | $ | (8 | ) | $ | 13 | ||
Reported as: | |||||||
Non-current deferred tax assets | $ | 59 | $ | 61 | |||
Non-current deferred tax liabilities | (67 | ) | (48 | ) | |||
Net deferred income tax (liability) asset | $ | (8 | ) | $ | 13 | ||
We record valuation allowances against deferred income tax assets when we determine that it is more likely than not that such deferred income tax assets will not be realized based upon all the available evidence. The valuation allowance is primarily related to operating losses.
We have not recorded deferred income taxes applicable to undistributed earnings of foreign subsidiaries that are indefinitely reinvested in foreign operations. Undistributed earnings that are indefinitely reinvested in foreign operations amounted to $780
73
million at December 31, 2017. Quantification of the deferred tax liability, if any, associated with indefinitely reinvested earnings is not practicable.
We made net income tax payments for continuing and discontinued operations totaling $709 million in 2017, $683 million in 2016, and $260 million in 2015. As of December 31, 2017, we had net operating loss carryforwards of $564 million, of which a major portion has an unlimited carryover period under current law.
A reconciliation of the beginning and ending amount of unrecognized tax benefits is as follows:
(in millions) | Year ended December 31, | ||||||||||
2017 | 2016 | 2015 | |||||||||
Balance at beginning of year | $ | 221 | $ | 162 | $ | 155 | |||||
Additions based on tax positions related to the current year | 23 | 48 | 24 | ||||||||
Additions for tax positions of prior years | 17 | 20 | 16 | ||||||||
Reduction for tax positions of prior years | (32 | ) | (3 | ) | (15 | ) | |||||
Reduction for settlements | (5 | ) | (6 | ) | (18 | ) | |||||
Expiration of applicable statutes of limitations | (12 | ) | — | — | |||||||
Balance at end of year | $ | 212 | $ | 221 | $ | 162 | |||||
The total amount of federal, state and local, and foreign unrecognized tax benefits as of December 31, 2017, 2016 and 2015 was $212 million, $221 million and $162 million, respectively, exclusive of interest and penalties. During the period ending December 31, 2017, the change in unrecognized tax benefits resulted in a net reduction of tax expense of $4 million.
We recognize accrued interest and penalties related to unrecognized tax benefits in interest expense and operating-related expense, respectively. In addition to the unrecognized tax benefits, as of December 31, 2017 and 2016, we had $59 million and $44 million, respectively, of accrued interest and penalties associated with unrecognized tax benefits. Based on the current status of income tax audits, we believe that the total amount of unrecognized tax benefits on the balance sheet may be reduced by up to approximately $60 million in the next twelve months as a result of the resolution of local tax examinations.
The U.S. federal income tax audits for 2016 and 2015 are in process. During 2017, we completed various state and foreign tax audits and, with few exceptions, we are no longer subject to federal, state and local, or non-U.S. income tax examinations by tax authorities for the years before 2010. The impact to tax expense in 2017, 2016 and 2015 was not material.
We file income tax returns in the U.S. federal jurisdiction, various states, and foreign jurisdictions, and we are routinely under audit by many different tax authorities. We believe that our accrual for tax liabilities is adequate for all open audit years based on an assessment of many factors including past experience and interpretations of tax law. This assessment relies on estimates and assumptions and may involve a series of complex judgments about future events. It is possible that tax examinations will be settled prior to December 31, 2018. If any of these tax audit settlements do occur within that period, we would make any necessary adjustments to the accrual for unrecognized tax benefits.
5. Debt
A summary of short-term and long-term debt outstanding is as follows:
(in millions) | December 31, | ||||||
2017 | 2016 | ||||||
2.5% Senior Notes, due 2018 1 | $ | 399 | $ | 398 | |||
3.3% Senior Notes, due 2020 2 | 697 | 696 | |||||
4.0% Senior Notes, due 2025 3 | 692 | 691 | |||||
4.4% Senior Notes, due 2026 4 | 892 | 891 | |||||
2.95% Senior Notes, due 2027 5 | 493 | 492 | |||||
6.55% Senior Notes, due 2037 6 | 396 | 396 | |||||
Total debt | 3,569 | 3,564 | |||||
Less: short-term debt including current maturities | 399 | — | |||||
Long-term debt | $ | 3,170 | $ | 3,564 | |||
74
1 | Interest payments are due semiannually on February 15 and August 15, and as of December 31, 2017, the unamortized debt discount and issuance costs total $1 million. |
2 | Interest payments are due semiannually on February 14 and August 14, and as of December 31, 2017, the unamortized debt discount and issuance costs total $3 million. |
3 | Interest payments are due semiannually on June 15 and December 15, and as of December 31, 2017, the unamortized debt discount and issuance costs total $8 million. |
4 | Interest payments are due semiannually on February 15 and August 15, and as of December 31, 2017, the unamortized debt discount and issuance costs total $8 million. |
5 | Interest payments are due semiannually on January 22 and July 22, and as of December 31, 2017, the unamortized debt discount and issuance costs total $7 million. |
6 | Interest payments are due semiannually on May 15 and November 15, and as of December 31, 2017, the unamortized debt discount and issuance costs total $4 million. |
Annual debt maturities are scheduled as follows based on book values as of December 31, 2017: $399 million due in 2018, no amounts due in 2019, $697 million due in 2020, no amounts due in 2021, and $2.5 billion due thereafter.
On September 22, 2016, we issued $500 million of 2.95% senior notes due in 2027. The notes are fully and unconditionally guaranteed by our wholly-owned subsidiary, Standard & Poor's Financial Services LLC. We used the net proceeds to fund the $400 million early repayment of our 5.9% senior notes due in 2017 on October 20, 2016, and intend to use the balance for general corporate purposes.
On August 18, 2015, we issued $2.0 billion of senior notes consisting of $400 million of 2.5% senior notes due in 2018, $700 million of 3.3% senior notes due in 2020 and $900 million of 4.4% senior notes due in 2026. The notes are fully and unconditionally guaranteed by our wholly-owned subsidiary, Standard & Poor's Financial Services LLC. We used the net proceeds to finance the acquisition of SNL.
On May 26, 2015, we issued $700 million of 4.0% senior notes due in 2025 and used a portion of the net proceeds for the repayment of short-term debt, including commercial paper. The 4.0% senior notes will mature on June 15, 2025 and are fully and unconditionally guaranteed by our wholly-owned subsidiary, Standard & Poor's Financial Services LLC.
On June 30, 2017, we entered into a revolving $1.2 billion five-year credit agreement (our "credit facility") that will terminate on June 30, 2022. This credit facility replaced our $1.2 billion five-year credit facility that was scheduled to terminate on June 30, 2020. The previous credit facility was canceled immediately after the new credit facility became effective. There were no outstanding borrowings under the previous credit facility when it was replaced.
We have the ability to borrow a total of $1.2 billion through our commercial paper program, which is supported by our credit facility. There were no commercial paper borrowings outstanding as of December 31, 2017 and 2016.
Depending on our corporate credit rating, we pay a commitment fee of 8 to 17.5 basis points for our credit facility, whether or not amounts have been borrowed. We currently pay a commitment fee of 12.5 basis points. The interest rate on borrowings under our credit facility is, at our option, calculated using rates that are primarily based on either the prevailing London Inter-Bank Offer Rate, the prime rate determined by the administrative agent or the Federal Funds Rate. For certain borrowings under this credit facility, there is also a spread based on our corporate credit rating.
Our credit facility contains certain covenants. The only financial covenant requires that our indebtedness to cash flow ratio, as defined in our credit facility, is not greater than 4 to 1, and this covenant level has never been exceeded.
6. | Derivative Instruments |
Our exposure to market risk includes changes in foreign exchange rates. We have operations in foreign countries where the functional currency is primarily the local currency. For international operations that are determined to be extensions of the parent company, the U.S. dollar is the functional currency. We typically have naturally hedged positions in most countries from a local currency perspective with offsetting assets and liabilities. As of December 31, 2017 and December 31, 2016, we have entered into foreign exchange forward contracts to mitigate or hedge the effect of adverse fluctuations in foreign currency exchange rates. Foreign currency forward contracts are recorded at fair value that is based on foreign currency exchange rates in active markets; therefore, we classify these derivative contracts within Level 2 of the fair value hierarchy. We do not enter into any derivative financial instruments for speculative purposes.
75
Undesignated Derivative Instruments
During the three months ended December 31, 2017, we entered into foreign exchange forward contracts in order to mitigate the change in fair value of specific assets and liabilities in the consolidated balance sheet. These forward contracts do not qualify for hedge accounting. As of December 31, 2017, the aggregate notional value of these outstanding forward contracts was $130 million. The changes in fair value of these forward contracts are recorded in prepaid and other assets in the consolidated balance sheet with their corresponding change in fair value recognized into selling and general expenses in the consolidated statement of income. The net gain recorded in selling and general expense for the year ended December 31, 2017 related to these contracts was $3 million.
Cash Flow Hedges
During the three months ended March 31, 2017 and December 31, 2017, we entered into a series of foreign exchange forward contracts to hedge a portion of our Indian rupee, British pound, and Euro exposures through the fourth quarter of 2017 and 2018, respectively. These contracts are intended to offset the impact of the movement of exchange rates on future revenue and operating costs and are scheduled to mature within twelve months. The changes in the fair value of these contracts are initially reported in accumulated other comprehensive loss in our consolidated balance sheet and are subsequently reclassified into revenue and selling and general expenses in the same period that the hedged transaction affects earnings.
During the three months ended March 31, 2016, we entered into a series of foreign exchange forward contracts to hedge a portion of our Indian Rupee exposure through the fourth quarter of 2016. These contracts were intended to offset the impact of the movement of exchange rates on future operating costs and matured at the end of each quarter during 2016. The changes in the fair value of these contracts were initially reported in accumulated other comprehensive loss in our consolidated balance sheet and subsequently reclassified into selling and general expenses in the same period that the hedge contract matures.
As of December 31, 2017, we estimate that $2 million of the net gains related to derivatives designated as cash flow hedges recorded in other comprehensive income is expected to be reclassified into earnings within the next twelve months. There was no material hedge ineffectiveness for the year ended December 31, 2017.
As of December 31, 2017 and December 31, 2016, the aggregate notional value of our outstanding foreign currency forward contracts designated as cash flow hedges was $307 million and $65 million, respectively.
The following table provides information on the location and fair value amounts of our cash flow hedges as of December 31, 2017 and December 31, 2016:
(in millions) | December 31, | December 31, | ||||||
Balance Sheet Location | 2017 | 2016 | ||||||
Derivatives designated as cash flow hedges: | ||||||||
Prepaid and other current assets | Foreign exchange forward contracts | $ | 3 | $ | 3 | |||
The following table provides information on the location and amounts of pre-tax gains (losses) on our cash flow hedges for the years ended December 31:
(in millions) | Gain (Loss) Recognized in Accumulated Other Comprehensive Loss (effective portion) | Location of Gain Reclassified from Accumulated Other Comprehensive Loss into Income (effective portion) | Gain (Loss) Reclassified from Accumulated Other Comprehensive Loss into Income (effective portion) | ||||||||||||||||||||||
Cash flow hedges - designated as hedging instruments | 2017 | 2016 | 2015 | 2017 | 2016 | 2015 | |||||||||||||||||||
Foreign exchange forward contracts | $ | — | $ | 3 | $ | — | Selling and general expenses | $ | 9 | $ | 4 | $ | — | ||||||||||||
76
The activity related to the change in unrealized gains (losses) in accumulated other comprehensive loss was as follows for the years ended December 31:
(in millions) | Year ended December 31, | ||||||||||
2017 | 2016 | 2015 | |||||||||
Net unrealized gains (losses) on cash flow hedges, net of taxes, beginning of year | $ | 2 | $ | (1 | ) | $ | (1 | ) | |||
Change in fair value, net of tax | 9 | 7 | — | ||||||||
Reclassification into earnings, net of tax | (9 | ) | (4 | ) | — | ||||||
Net unrealized gains (losses) on cash flow hedges, net of taxes, end of year | $ | 2 | $ | 2 | $ | (1 | ) | ||||
7. Employee Benefits
We maintain a number of active defined contribution retirement plans for our employees. The majority of our defined benefit plans are frozen. As a result, no new employees will be permitted to enter these plans and no additional benefits for current participants in the frozen plans will be accrued.
We also have supplemental benefit plans that provide senior management with supplemental retirement, disability and death benefits. Certain supplemental retirement benefits are based on final monthly earnings. In addition, we sponsor voluntary 401(k) plans under which we may match employee contributions up to certain levels of compensation as well as profit-sharing plans under which we contribute a percentage of eligible employees' compensation to the employees' accounts.
We also provide certain medical, dental and life insurance benefits for active and retired employees and eligible dependents. The medical and dental plans and supplemental life insurance plan are contributory, while the basic life insurance plan is noncontributory. We currently do not prefund any of these plans.
We recognize the funded status of our retirement and postretirement plans in the consolidated balance sheets, with a corresponding adjustment to accumulated other comprehensive loss, net of taxes. The amounts in accumulated other comprehensive loss represent net unrecognized actuarial losses and unrecognized prior service costs. These amounts will be subsequently recognized as net periodic pension cost pursuant to our accounting policy for amortizing such amounts.
77
Benefit Obligation
A summary of the benefit obligation and the fair value of plan assets, as well as the funded status for the retirement and postretirement plans as of December 31, 2017 and 2016, is as follows (benefits paid in the table below include only those amounts contributed directly to or paid directly from plan assets):
(in millions) | Retirement Plans | Postretirement Plans | |||||||||||||
2017 | 2016 | 2017 | 2016 | ||||||||||||
Net benefit obligation at beginning of year | $ | 2,260 | $ | 2,199 | $ | 57 | $ | 80 | |||||||
Service cost | 3 | 3 | — | — | |||||||||||
Interest cost | 74 | 78 | 2 | 2 | |||||||||||
Plan participants’ contributions | — | — | 3 | 4 | |||||||||||
Actuarial loss (gain) | 107 | 196 | (5 | ) | (6 | ) | |||||||||
Gross benefits paid | (110 | ) | (121 | ) | (8 | ) | (10 | ) | |||||||
Foreign currency effect | 38 | (75 | ) | — | — | ||||||||||
Other adjustments 1 | (43 | ) | (20 | ) | — | (13 | ) | ||||||||
Net benefit obligation at end of year | 2,329 | 2,260 | 49 | 57 | |||||||||||
Fair value of plan assets at beginning of year | 2,073 | 2,023 | — | — | |||||||||||
Actual return on plan assets | 263 | 259 | — | — | |||||||||||
Employer contributions | 8 | 8 | 25 | 6 | |||||||||||
Plan participants’ contributions | — | — | 3 | 4 | |||||||||||
Gross benefits paid | (110 | ) | (121 | ) | (8 | ) | (10 | ) | |||||||
Foreign currency effect | 31 | (74 | ) | — | |||||||||||
Other adjustments | (46 | ) | (22 | ) | — | ||||||||||
Fair value of plan assets at end of year | 2,219 | 2,073 | 20 | — | |||||||||||
Funded status | $ | (110 | ) | $ | (187 | ) | $ | (29 | ) | $ | (57 | ) | |||
Amounts recognized in consolidated balance sheets: | |||||||||||||||
Non-current assets | $ | 114 | $ | 46 | $ | — | $ | — | |||||||
Current liabilities | (9 | ) | (8 | ) | — | (8 | ) | ||||||||
Non-current liabilities | (215 | ) | (225 | ) | (29 | ) | (49 | ) | |||||||
$ | (110 | ) | $ | (187 | ) | $ | (29 | ) | $ | (57 | ) | ||||
Accumulated benefit obligation | $ | 2,319 | $ | 2,251 | |||||||||||
Plans with accumulated benefit obligation in excess of the fair value of plan assets: | |||||||||||||||
Projected benefit obligation | $ | 224 | $ | 674 | |||||||||||
Accumulated benefit obligation | $ | 214 | $ | 665 | |||||||||||
Fair value of plan assets | $ | — | $ | 441 | |||||||||||
Amounts recognized in accumulated other comprehensive loss, net of tax: | |||||||||||||||
Net actuarial loss (gain) | $ | 451 | $ | 483 | $ | (37 | ) | $ | (35 | ) | |||||
Prior service credit | 1 | 1 | (12 | ) | (13 | ) | |||||||||
Total recognized | $ | 452 | $ | 484 | $ | (49 | ) | $ | (48 | ) | |||||
1 | Relates to the impact of retiree annuity purchases. |
The actuarial loss included in accumulated other comprehensive loss for our retirement plans and expected to be recognized in net periodic pension cost during the year ending December 31, 2018 is $19 million. There is no prior service credit included in accumulated other comprehensive loss for our retirement plans expected to be recognized in net periodic benefit cost during the year ending December 31, 2018.
There is an immaterial amount of actuarial loss and prior service credit included in accumulated other comprehensive loss for our postretirement plans expected to be recognized in net periodic benefit cost during the year ending December 31, 2018.
78
Net Periodic Benefit Cost
For purposes of determining annual pension cost, prior service costs are being amortized straight-line over the average expected remaining lifetime of plan participants expected to receive benefits.
A summary of net periodic benefit cost for our retirement and postretirement plans for the years ended December 31, is as follows:
(in millions) | Retirement Plans | Postretirement Plans | |||||||||||||||||||||
2017 | 2016 | 2015 | 2017 | 2016 | 2015 | ||||||||||||||||||
Service cost | $ | 3 | $ | 3 | $ | 6 | $ | — | $ | — | $ | — | |||||||||||
Interest cost | 74 | 78 | 96 | 2 | 2 | 3 | |||||||||||||||||
Expected return on assets | (126 | ) | (122 | ) | (127 | ) | — | — | — | ||||||||||||||
Amortization of: | |||||||||||||||||||||||
Actuarial loss (gain) | 18 | 16 | 20 | (2 | ) | (1 | ) | — | |||||||||||||||
Prior service (credit) cost | — | — | — | (2 | ) | — | (1 | ) | |||||||||||||||
Other 1 | 8 | — | — | — | — | — | |||||||||||||||||
Net periodic benefit cost | $ | (23 | ) | $ | (25 | ) | $ | (5 | ) | $ | (2 | ) | $ | 1 | $ | 2 | |||||||
1 | Represents a charge related to our U.K retirement plan. |
Our U.K. retirement plan accounted for a benefit of $6 million in 2017, $10 million in 2016, and $10 million in 2015 of the net periodic benefit cost attributable to the funded plans.
Other changes in plan assets and benefit obligations recognized in other comprehensive income, net of tax for the years ended December 31, are as follows:
(in millions) | Retirement Plans | Postretirement Plans | |||||||||||||||||||||
2017 | 2016 | 2015 | 2017 | 2016 | 2015 | ||||||||||||||||||
Net actuarial (gain) loss | $ | (20 | ) | $ | 60 | $ | (6 | ) | $ | (3 | ) | $ | (12 | ) | $ | (17 | ) | ||||||
Recognized actuarial (gain) loss | (12 | ) | (10 | ) | (13 | ) | 1 | 1 | — | ||||||||||||||
Prior service (credit) cost | — | — | — | 1 | (8 | ) | 1 | ||||||||||||||||
Other 1 | (7 | ) | |||||||||||||||||||||
Total recognized | $ | (39 | ) | $ | 50 | $ | (19 | ) | $ | (1 | ) | $ | (19 | ) | $ | (16 | ) | ||||||
1 | Represents a charge related to our U.K retirement plan. |
The total cost for our retirement plans was $70 million for 2017, $69 million for 2016 and $91 million for 2015. Included in the total retirement plans cost are defined contribution plans cost of $70 million for 2017, $65 million for 2016 and $67 million for 2015.
79
Assumptions
Retirement Plans | Postretirement Plans | ||||||||||||||||
2017 | 2016 | 2015 | 2017 | 2016 | 2015 | ||||||||||||
Benefit obligation: | |||||||||||||||||
Discount rate 2 | 3.68 | % | 4.14 | % | 4.47 | % | 3.40 | % | 3.69 | % | 3.90 | % | |||||
Net periodic cost: | |||||||||||||||||
Weighted-average healthcare cost rate 1 | 7.00 | % | 7.00 | % | 7.00 | % | |||||||||||
Discount rate - U.S. plan 2 | 4.13 | % | 4.47 | % | 4.15 | % | 3.69 | % | 3.94 | % | 3.60 | % | |||||
Discount rate - U.K. plan 2 | 2.58 | % | 3.84 | % | 3.80 | % | |||||||||||
Return on assets 3 | 6.25 | % | 6.25 | % | 6.25 | % | |||||||||||
1 | The assumed weighted-average healthcare cost trend rate will decrease ratably from 7% in 2017 to 5% in 2024 and remain at that level thereafter. Assumed healthcare cost trends have an effect on the amounts reported for the healthcare plans. A one percentage point change in assumed healthcare cost trend creates the following effects: |
(in millions) | 1% point increase | 1% point decrease | |||||
Effect on postretirement obligation | $ | — | $ | — | |||
2 | Effective January 1, 2017, we changed our discount rate assumption on our U.S. retirement plans to 4.13% from 4.47% in 2016 and changed our discount rate assumption on our U.K. plan to 2.58% from 3.84% in 2016 . At the end of 2015, we changed our approach used to measure service and interest costs on all of our retirement plans. For 2015 and prior periods presented, we measured service and interest costs utilizing a single weighted-average discount rate derived from the yield curve used to measure the benefit obligation. For 2016 and 2017, we elected to measure service and interest costs by applying the specific spot rates along that yield curve to the plans' liability cash flows. We believe this new approach provides a more precise measurement of service and interest costs by aligning the timing of the plans' liability cash flows to the corresponding spot rates on the yield curve. This change does not affect the measurement of our benefit obligation. We have accounted for this change as a change in accounting estimate that is inseparable from a change in accounting principle and, accordingly, have accounted for it on a prospective basis. Pension and postretirement medical costs decreased by approximately $10 million in 2017 and $14 million in 2016 as a result of this change. |
3 | The expected return on assets assumption is calculated based on the plan’s asset allocation strategy and projected market returns over the long-term. Effective January 1, 2018, our return on assets assumption for the U.S. plan and U.K. plan decreased to 6.00% from 6.25%. |
Cash Flows
In December of 2003, the Medicare Prescription Drug, Improvement and Modernization Act of 2003 (the “Act”) was enacted. The Act established a prescription drug benefit under Medicare, known as “Medicare Part D”, and a federal subsidy to sponsors of retiree healthcare benefit plans that provide a benefit that is at least actuarially equivalent to Medicare Part D. Our benefits provided to certain participants are at least actuarially equivalent to Medicare Part D, and, accordingly, we are entitled to a subsidy.
Expected employer contributions in 2018 are $9 million and $7 million for our retirement and postretirement plans respectively. In 2018, we may elect to make additional non-required contributions depending on investment performance and the pension plan status. Information about the expected cash flows for our retirement and postretirement plans and the impact of the Medicare subsidy is as follows:
(in millions) | Postretirement Plans 2 | ||||||||||||||||||
Retirement 1 Plans | Gross payments | Retiree contributions | Medicare subsidy 3 | Net payments | |||||||||||||||
2018 | $ | 88 | $ | 9 | $ | (3 | ) | $ | — | $ | 6 | ||||||||
2019 | 90 | 8 | (3 | ) | — | 5 | |||||||||||||
2020 | 93 | 8 | (2 | ) | — | 6 | |||||||||||||
2021 | 96 | 7 | (2 | ) | — | 5 | |||||||||||||
2022 | 99 | 6 | (2 | ) | — | 4 | |||||||||||||
2023-2027 | 527 | 24 | (9 | ) | — | 15 | |||||||||||||
1 | Reflects the total benefits expected to be paid from the plans or from our assets including both our share of the benefit cost and the participants’ share of the cost. |
80
2 | Reflects the total benefits expected to be paid from our assets. |
3 | Expected medicare subsidy amounts, for the years presented, are less than $1 million. |
Fair Value of Plan Assets
In accordance with authoritative guidance for fair value measurements certain assets and liabilities are required to be recorded at fair value. Fair value is defined as the amount that would be received for selling an asset or paid to transfer a liability in an orderly transaction between market participants. A fair value hierarchy has been established which requires us to maximize the use of observable inputs and minimize the use of unobservable inputs when measuring fair value. The three levels of inputs used to measure fair value are as follows:
• | Level 1 - Unadjusted quoted prices in active markets for identical assets or liabilities. |
• | Level 2 - Observable inputs other than Level 1 prices, such as quoted prices for similar assets or liabilities; quoted prices in markets that are not active; or other inputs that are observable or can be corroborated by observable market data for substantially the full term of the assets or liabilities. |
• | Level 3 - Unobservable inputs that are supported by little or no market activity and that are significant to the fair value of the assets or liabilities. |
The fair value of our defined benefit plans assets as of December 31, 2017 and 2016, by asset class is as follows:
(in millions) | December 31, 2017 | ||||||||||||||
Total | Level 1 | Level 2 | Level 3 | ||||||||||||
Cash and short-term investments | $ | 10 | $ | 10 | $ | — | $ | — | |||||||
Equities: | |||||||||||||||
U.S. indexes 1 | 50 | 50 | — | — | |||||||||||
U.S. growth and value | 109 | 109 | — | — | |||||||||||
U.K. | 5 | 5 | — | — | |||||||||||
International, excluding U.K. | 45 | 45 | — | — | |||||||||||
Fixed income: | |||||||||||||||
Long duration strategy 2 | 1,076 | — | 1,076 | — | |||||||||||
Intermediate duration securities | 35 | — | 35 | — | |||||||||||
Agency mortgage backed securities | 5 | — | 5 | — | |||||||||||
Asset backed securities | 19 | — | 19 | — | |||||||||||
Non-agency mortgage backed securities 3 | 15 | — | 15 | — | |||||||||||
International, excluding U.K. | 18 | — | 18 | — | |||||||||||
Real Estate | |||||||||||||||
U.K. 4 | 39 | — | — | 39 | |||||||||||
Total | $ | 1,426 | $ | 219 | $ | 1,168 | $ | 39 | |||||||
Collective investment funds | $ | 793 | |||||||||||||
Total | $ | 2,219 | |||||||||||||
81
(in millions) | December 31, 2016 | ||||||||||||||
Total | Level 1 | Level 2 | Level 3 | ||||||||||||
Cash, short-term investments, and other | $ | 38 | $ | 38 | $ | — | $ | — | |||||||
Equities: | |||||||||||||||
U.S. indexes 1 | 69 | 69 | — | — | |||||||||||
U.S. growth and value | 103 | 103 | — | — | |||||||||||
U.K. | 3 | 3 | — | — | |||||||||||
International, excluding U.K. | 38 | 38 | — | — | |||||||||||
Fixed income: | |||||||||||||||
Long duration strategy 2 | 970 | — | 970 | — | |||||||||||
Intermediate duration securities | 32 | — | 32 | — | |||||||||||
Agency mortgage backed securities | 5 | — | 5 | — | |||||||||||
Asset backed securities | 19 | — | 19 | — | |||||||||||
Non-agency mortgage backed securities 3 | 20 | — | 20 | — | |||||||||||
International | 16 | — | 16 | — | |||||||||||
Real Estate | |||||||||||||||
U.K. 4 | 11 | — | — | 11 | |||||||||||
Total | $ | 1,324 | $ | 251 | $ | 1,062 | $ | 11 | |||||||
Collective investment funds | $ | 749 | |||||||||||||
Total | $ | 2,073 | |||||||||||||
1 | Includes securities that are tracked in the S&P Smallcap 600 index. |
2 | Includes securities that are mainly investment grade obligations of issuers in the U.S. |
3 | Includes U.S. mortgage-backed securities that are not backed by the U.S. government. |
4 | Includes a fund which holds real estate properties in the U.K. |
For securities that are quoted in active markets, the trustee/custodian determines fair value by applying securities’ prices obtained from its pricing vendors. For commingled funds that are not actively traded, the trustee applies pricing information provided by investment management firms to the unit quantities of such funds. Investment management firms employ their own pricing vendors to value the securities underlying each commingled fund. Underlying securities that are not actively traded derive their prices from investment managers, which in turn, employ vendors that use pricing models (e.g., discounted cash flow, comparables). The domestic defined benefit plans have no investment in our stock, except through the S&P 500 commingled trust index fund.
The trustee obtains estimated prices from vendors for securities that are not easily quotable and they are categorized accordingly as Level 3. The following table details further information on our plan assets where we have used significant unobservable inputs (Level 3):
(in millions) | Level 3 | ||
Balance as of December 31, 2016 | $ | 11 | |
Purchases | 28 | ||
Distributions | (1 | ) | |
Gain (loss) | 1 | ||
Balance as of December 31, 2017 | $ | 39 | |
Pension Trusts’ Asset Allocations
There are two pension trusts, one in the U.S. and one in the U.K.
• | The U.S. pension trust had assets of $1,739 million and $1,632 million as of December 31, 2017 and 2016 respectively, and the target allocations in 2017 include 68% fixed income, 27% domestic equities and 5% international equities. |
• | The U.K. pension trust had assets of $480 million and $441 million as of December 31, 2017 and 2016, respectively, and the target allocations in 2017 include 40% fixed income, 30% diversified growth funds, 20% equities and 10% real estate. |
82
The pension assets are invested with the goal of producing a combination of capital growth, income and a liability hedge. The mix of assets is established after consideration of the long-term performance and risk characteristics of asset classes. Investments are selected based on their potential to enhance returns, preserve capital and reduce overall volatility. Holdings are diversified within each asset class. The portfolios employ a mix of index and actively managed equity strategies by market capitalization, style, geographic regions and economic sectors. The fixed income strategies include U.S. long duration securities, opportunistic fixed income securities and U.K. debt instruments. The short-term portfolio, whose primary goal is capital preservation for liquidity purposes, is composed of government and government-agency securities, uninvested cash, receivables and payables. The portfolios do not employ any financial leverage.
U.S. Defined Contribution Plans
Assets of the defined contribution plans in the U.S. consist primarily of investment options which include actively managed equity, indexed equity, actively managed equity/bond funds, target date funds, S&P Global Inc. common stock, stable value and money market strategies. There is also a self-directed mutual fund investment option. The plans purchased 228,248 shares and sold 297,750 shares of S&P Global Inc. common stock in 2017 and purchased 216,035 shares and sold 437,283 shares of S&P Global Inc. common stock in 2016. The plans held approximately 1.5 million shares of S&P Global Inc. common stock as of December 31, 2017 and 1.6 million shares as of December 31, 2016, with market values of $255 million and $171 million, respectively. The plans received dividends on S&P Global Inc. common stock of $3 million and $2 million during the years ended December 31, 2017 and December 31, 2016 respectively.
8. Stock-Based Compensation
We issue stock-based incentive awards to our eligible employees and Directors under the 2002 Employee Stock Incentive Plan and a Director Deferred Stock Ownership Plan.
• | 2002 Employee Stock Incentive Plan (the “2002 Plan”) – The 2002 Plan permits the granting of nonqualified stock options, stock appreciation rights, performance stock, restricted stock and other stock-based awards. |
• | Director Deferred Stock Ownership Plan – Under this plan, common stock reserved may be credited to deferred stock accounts for eligible Directors. In general, the plan requires that 50% of eligible Directors’ annual compensation plus dividend equivalents be credited to deferred stock accounts. Each Director may also elect to defer all or a portion of the remaining compensation and have an equivalent number of shares credited to the deferred stock account. Recipients under this plan are not required to provide consideration to us other than rendering service. Shares will be delivered as of the date a recipient ceases to be a member of the Board of Directors or within five years thereafter, if so elected. The plan will remain in effect until terminated by the Board of Directors or until no shares of stock remain available under the plan. |
The number of common shares reserved for issuance are as follows:
(in millions) | December 31, | ||
2017 | 2016 | ||
Shares available for granting under the 2002 Plan | 33.8 | 33.5 | |
Options outstanding | 2.1 | 3.8 | |
Total shares reserved for issuance 1 | 35.9 | 37.3 | |
1 | Shares reserved for issuance under the Director Deferred Stock Ownership Plan are not included in the total, but are less than 0.1 million. |
We issue treasury shares upon exercise of stock options and the issuance of restricted stock and unit awards. To offset the dilutive effect of the exercise of employee stock options, we periodically repurchase shares. See Note 9 – Equity for further discussion.
83
Stock-based compensation expense and the corresponding tax benefit are as follows:
(in millions) | Year Ended December 31, | ||||||||||
2017 | 2016 | 2015 | |||||||||
Stock option expense | $ | 3 | $ | 7 | $ | 14 | |||||
Restricted stock and unit awards expense | 96 | 69 | 64 | ||||||||
Total stock-based compensation expense | $ | 99 | $ | 76 | $ | 78 | |||||
Tax benefit | $ | 38 | $ | 29 | $ | 29 | |||||
Stock Options
Stock options may not be granted at a price less than the fair market value of our common stock on the date of grant. Stock options granted vest over a three year service period in equal annual installments and have a maximum term of 10 years. Stock option compensation costs are recognized from the date of grant, utilizing a three-year graded vesting method. Under this method, one-third of the costs are ratably recognized over the first twelve months, one-third of the costs are ratably recognized over a twenty-four month period starting from the date of grant with the remaining costs ratably recognized over a thirty-six month period starting from the date of grant.
We use a lattice-based option-pricing model to estimate the fair value of options granted. The following assumptions were used in valuing the options granted:
Year Ended | |||
December 31, 2015 | |||
Risk-free average interest rate | 0.2 - 1.9% | ||
Dividend yield | 1.4% | ||
Volatility | 21 - 39% | ||
Expected life (years) | 6.3 | ||
Weighted-average grant-date fair value per option | $ | 27.57 | |
Because lattice-based option-pricing models incorporate ranges of assumptions, those ranges are disclosed. These assumptions are based on multiple factors, including historical exercise patterns, post-vesting termination rates, expected future exercise patterns and the expected volatility of our stock price. The risk-free interest rate is the imputed forward rate based on the U.S. Treasury yield at the date of grant. We use the historical volatility of our stock price over the expected term of the options to estimate the expected volatility. The expected term of options granted is derived from the output of the lattice model and represents the period of time that options granted are expected to be outstanding.
During 2015, we stopped granting stock options as part of our employees' total stock-based incentive awards. There were no stock options granted in 2017 and 2016 and a minimal amount of stock options granted in 2015.
Stock option activity is as follows:
(in millions, except per award amounts) | Shares | Weighted average exercise price | Weighted-average remaining years of contractual term | Aggregate intrinsic value | ||||||||
Options outstanding as of December 31, 2016 | 3.8 | $ | 43.36 | |||||||||
Exercised | (1.7 | ) | $ | 113.04 | ||||||||
Forfeited and expired 1 | — | $ | 72.35 | |||||||||
Options outstanding as of December 31, 2017 | 2.1 | $ | 44.09 | 3.5 | $ | 270 | ||||||
Options exercisable as of December 31, 2017 | 2.1 | $ | 44.08 | 3.5 | $ | 270 | ||||||
1 There are less 0.1 million shares forfeited and expired.
84
(in millions, except per award amounts) | Shares | Weighted-average grant-date fair value | |||||
Nonvested options outstanding as of December 31, 2016 | 0.2 | $ | 23.42 | ||||
Vested | (0.2 | ) | $ | 23.40 | |||
Forfeited 1 | — | $ | 24.22 | ||||
Nonvested options outstanding as of December 31, 2017 | — | $ | 27.52 | ||||
Total unrecognized compensation expense related to nonvested options 2 | $ | — | |||||
Weighted-average years to be recognized over | 0.1 | ||||||
1 | There are less than 0.1 million shares forfeited. |
2 | There is less than $1 million of unrecognized compensation expense related to nonvested options. |
The total fair value of our stock options that vested during the years ended December 31, 2017, 2016 and 2015 was $4 million, $7 million and $11 million, respectively.
Information regarding our stock option exercises is as follows:
(in millions) | Year Ended December 31, | ||||||||||
2017 | 2016 | 2015 | |||||||||
Net cash proceeds from the exercise of stock options | $ | 75 | $ | 88 | $ | 86 | |||||
Total intrinsic value of stock option exercises | $ | 118 | $ | 95 | $ | 94 | |||||
Income tax benefit realized from stock option exercises | $ | 64 | $ | 41 | $ | 49 | |||||
Restricted Stock and Unit Awards
Restricted stock and unit awards (performance and non-performance) have been granted under the 2002 Plan. Performance unit awards will vest only if we achieve certain financial goals over the performance period. Restricted stock non-performance awards have various vesting periods (generally three years), with vesting beginning on the first anniversary of the awards. Recipients of restricted stock and unit awards are not required to provide consideration to us other than rendering service.
The stock-based compensation expense for restricted stock and unit awards is determined based on the market price of our stock at the grant date of the award applied to the total number of awards that are anticipated to fully vest. For performance unit awards, adjustments are made to expense dependent upon financial goals achieved.
Restricted stock and unit activity for performance and non-performance awards is as follows:
(in millions, except per award amounts) | Shares | Weighted-average grant-date fair value | |||||
Nonvested shares as of December 31, 2016 | 1.0 | $ | 106.31 | ||||
Granted | 0.8 | $ | 147.12 | ||||
Vested | (1.0 | ) | $ | 156.16 | |||
Forfeited 1 | — | $ | 107.96 | ||||
Nonvested shares as of December 31, 2017 | 0.8 | $ | 124.91 | ||||
Total unrecognized compensation expense related to nonvested awards | $ | 66 | |||||
Weighted-average years to be recognized over | 1.6 | ||||||
1 | There are less than 0.1 million shares forfeited. |
85
Year Ended December 31, | |||||||||||
2017 | 2016 | 2015 | |||||||||
Weighted-average grant-date fair value per award | $ | 147.12 | $ | 93.01 | $ | 77.06 | |||||
Total fair value of restricted stock and unit awards vested | $ | 147 | $ | 99 | $ | 155 | |||||
Tax benefit relating to restricted stock activity | $ | 36 | $ | 26 | $ | 24 | |||||
9. Equity
Capital Stock
Two million shares of preferred stock, par value $1 per share, are authorized; none have been issued.
On February 2, 2018, the Board of Directors approved an increase in the dividends for 2018 to a quarterly rate of $0.50 per common share.
Year Ended December 31, | |||||||||||
2017 | 2016 | 2015 | |||||||||
Quarterly dividend rate | $ | 0.41 | $ | 0.36 | $ | 0.33 | |||||
Annualized dividend rate | $ | 1.64 | $ | 1.44 | $ | 1.32 | |||||
Dividends paid (in millions) | $ | 421 | $ | 380 | $ | 363 | |||||
Stock Repurchases
On December 4, 2013, the Board of Directors approved a share repurchase program authorizing the purchase of 50 million shares, which was approximately 18% of the total shares of our outstanding common stock at that time.
Share repurchases were as follows:
(in millions, except average price) | Year Ended December 31, | ||||||||||
2017 | 2016 | 2015 | |||||||||
Total number of shares purchased 1 | 6.8 | 9.7 | 10.1 | ||||||||
Average price paid per share 2 | $ | 147.74 | $ | 113.36 | $ | 99.00 | |||||
Total cash utilized 2 | $ | 1,001 | $ | 1,097 | $ | 1,000 | |||||
1 | 2017 and 2016 includes shares received as part of our accelerated share repurchase agreements as described in more detail below. |
2 | In December of 2015, 0.3 million shares were repurchased for approximately $26 million, which settled in January of 2016. Excluding these 0.3 million shares, the average price paid per share was $98.98. Cash used for financing activities only reflects those shares which settled during the year ended December 31, 2017, 2016 and 2015 resulting in $1,001 million, $1,123 million and $974 million of cash used to repurchase shares, respectively. |
Our purchased shares may be used for general corporate purposes, including the issuance of shares for stock compensation plans and to offset the dilutive effect of the exercise of employee stock options. As of December 31, 2017, 19 million shares remained available under our current share repurchase program. Our current share repurchase program has no expiration date and purchases under this program may be made from time to time on the open market and in private transactions, depending on market conditions.
Accelerated Share Repurchase Agreements
We entered into an accelerated share repurchase ("ASR") agreement with a financial institution on August 1, 2017 to initiate share repurchases aggregating $500 million. The ASR agreement was structured as an uncapped ASR agreement in which we paid $500 million and received an initial delivery of approximately 2.8 million shares, representing 85% of the $500 million at a price equal to the then market price of the Company. We completed the ASR agreement on October 31, 2017 and received an additional 0.5 million shares. We repurchased a total of 3.2 million shares under the ASR agreement for an average purchase price of $154.46 per share. The total number of shares repurchased under the ASR agreement is equal to $500 million divided by the volume weighted-average share price, less a discount. The repurchased shares are held in Treasury. The ASR agreement was executed under the current share repurchase program, approved on December 4, 2013.
86
Using a portion of the proceeds received from the sale of J.D. Power, we entered into an ASR agreement with a financial institution on September 7, 2016 to initiate share repurchases aggregating $750 million. The ASR agreement was structured as a capped ASR agreement in which we paid $750 million and received an initial delivery of approximately 4.4 million shares and an additional amount of 0.9 million shares during the month of September 2016, representing the minimum number of shares of our common stock to be repurchased based on a calculation using a specified capped price per share. We completed the ASR agreement on December 7, 2016 and received an additional 0.9 million shares, which settled on December 12, 2016. We repurchased a total of 6.1 million shares under the ASR agreement for an average purchase price of $122.18 per share. The total number of shares repurchased under the ASR agreement was based on the volume weighted-average share price, minus a discount, of our common stock over the term of the ASR agreement. The repurchased shares are held in Treasury. The ASR agreement was executed under the current share repurchase program, approved on December 4, 2013.
The ASR agreements were accounted for as two transactions: a stock purchase transaction and a forward stock purchase contract. The shares delivered under the ASR agreement resulted in a reduction of our outstanding shares used to determine our weighted average common shares outstanding for purposes of calculating basic and diluted earnings per share. The forward stock purchase contract was classified as an equity instrument.
Redeemable Noncontrolling Interests
The agreement with the minority partners that own 27% of our S&P Dow Jones Indices LLC joint venture contains redemption features whereby interests held by minority partners are redeemable either (i) at the option of the holder or (ii) upon the occurrence of an event that is not solely within our control. Specifically, under the terms of the operating agreement of S&P Dow Jones Indices LLC, after December 31, 2017, CME Group and CME Group Index Services LLC ("CGIS") will have the right at any time to sell, and we are obligated to buy, at least 20% of their share in S&P Dow Jones Indices LLC. In addition, in the event there is a change of control of the Company, for the 15 days following a change in control, CME Group and CGIS will have the right to put their interest to us at the then fair value of CME Group's and CGIS' minority interest.
If interests were to be redeemed under this agreement, we would generally be required to purchase the interest at fair value on the date of redemption. This interest is presented on the consolidated balance sheets outside of equity under the caption “Redeemable noncontrolling interest” with an initial value based on fair value for the portion attributable to the net assets we acquired, and based on our historical cost for the portion attributable to our S&P Index business. We adjust the redeemable noncontrolling interest each reporting period to its estimated redemption value, but never less than its initial fair value, considering a combination of an income and market valuation approach. Our income and market valuation approaches may incorporate Level 3 fair value measures for instances when observable inputs are not available, including assumptions related to expected future net cash flows, long-term growth rates, the timing and nature of tax attributes, and the redemption features. Any adjustments to the redemption value will impact retained income.
Noncontrolling interests that do not contain such redemption features are presented in equity.
Changes to redeemable noncontrolling interest during the year ended December 31, 2017 were as follows:
(in millions) | |||
Balance as of December 31, 2016 | $ | 1,080 | |
Net income attributable to noncontrolling interest | 127 | ||
Distributions to noncontrolling interest | (117 | ) | |
Redemption value adjustment | 260 | ||
Balance as of December 31, 2017 | $ | 1,350 | |
87
Accumulated Other Comprehensive Loss
The following table summarizes the changes in the components of accumulated other comprehensive loss for the year ended December 31, 2017:
(in millions) | Foreign Currency Translation Adjustment | Pension and Postretirement Benefit Plans 1 | Unrealized Gain (Loss) on Forward Exchange Contracts 2 | Unrealized Loss on Investment | Accumulated Other Comprehensive Loss | ||||||||||||||
Balance as of December 31, 2016 | $ | (332 | ) | $ | (443 | ) | $ | 2 | — | $ | (773 | ) | |||||||
Other comprehensive income before reclassifications | 93 | 30 | 9 | (10 | ) | 122 | |||||||||||||
Reclassifications from accumulated other comprehensive loss to net earnings | — | 11 | (9 | ) | — | 2 | |||||||||||||
Net other comprehensive income | 93 | 41 | — | (10 | ) | 124 | |||||||||||||
Balance as of December 31, 2017 | $ | (239 | ) | $ | (402 | ) | $ | 2 | $ | (10 | ) | $ | (649 | ) | |||||
1 | See Note 7 — Employee Benefits for additional details of items reclassed from accumulated other comprehensive loss to net earnings. |
2 | See Note 6 — Derivative Instruments for additional details of items reclassed from accumulated other comprehensive loss to net earnings. |
The net actuarial loss and prior service cost related to pension and other postretirement benefit plans included in other comprehensive income is net of a tax provision of $5 million for the year ended December 31, 2017.
10. Earnings per Share
Basic earnings per common share ("EPS") is computed by dividing net income attributable to the common shareholders of the Company by the weighted-average number of common shares outstanding. Diluted EPS is computed in the same manner as basic EPS, except the number of shares is increased to include additional common shares that would have been outstanding if potential common shares with a dilutive effect had been issued. Potential common shares consist primarily of stock options and restricted performance shares calculated using the treasury stock method.
The calculation for basic and diluted EPS is as follows:
(in millions, except per share data) | Year Ended December 31, | ||||||||||
2017 | 2016 | 2015 | |||||||||
Amount attributable to S&P Global Inc. common shareholders: | |||||||||||
Net income | $ | 1,496 | $ | 2,106 | $ | 1,156 | |||||
Basic weighted-average number of common shares outstanding | 256.3 | 262.8 | 271.6 | ||||||||
Effect of stock options and other dilutive securities | 2.6 | 2.4 | 3.0 | ||||||||
Diluted weighted-average number of common shares outstanding | 258.9 | 265.2 | 274.6 | ||||||||
Earnings per share attributable to S&P Global Inc. common shareholders: | |||||||||||
Net income: | |||||||||||
Basic | $ | 5.84 | $ | 8.02 | $ | 4.26 | |||||
Diluted | $ | 5.78 | $ | 7.94 | $ | 4.21 | |||||
Each period we have certain stock options and restricted performance shares that are potentially excluded from the computation of diluted EPS. The effect of the potential exercise of stock options is excluded when the average market price of our common stock is lower than the exercise price of the related option during the period or when a net loss exists because the effect would have been antidilutive. Additionally, restricted performance shares are excluded because the necessary vesting conditions had not been met or when a net loss exists. As of December 31, 2017, 2016 and 2015, there were no stock options excluded. Restricted
88
performance shares outstanding of 0.6 million, 0.7 million and 0.9 million as of December 31, 2017, 2016 and 2015, respectively, were excluded.
11. Restructuring
During 2017 and 2016, we continued to evaluate our cost structure and further identified cost savings associated with streamlining our management structure and our decision to exit non-strategic businesses. Our 2017 and 2016 restructuring plans consisted of a company-wide workforce reduction of approximately 520 and 230 positions, respectively, and are further detailed below. The charges for each restructuring plan are classified as selling and general expenses within the consolidated statements of income and the reserves are included in other current liabilities in the consolidated balance sheets.
In certain circumstances, reserves are no longer needed because of efficiencies in carrying out the plans or because employees previously identified for separation resigned from the Company and did not receive severance or were reassigned due to circumstances not foreseen when the original plans were initiated. In these cases, we reverse reserves through the consolidated statements of income during the period when it is determined they are no longer needed. There was approximately $7 million of reserves from the 2016 restructuring plan that we have reversed in 2017, which offset the initial charge of $30 million recorded for the 2016 restructuring plan. Also, there was approximately $7 million of reserves from the 2015 restructuring plan that we have reversed in 2016, which offset the initial charge of $63 million recorded for the 2015 restructuring plan.
The initial restructuring charge recorded and the ending reserve balance as of December 31, 2017 by segment is as follows:
2017 Restructuring Plan | 2016 Restructuring Plan | ||||||||||||||
(in millions) | Initial Charge Recorded | Ending Reserve Balance | Initial Charge Recorded | Ending Reserve Balance | |||||||||||
Ratings | $ | 25 | $ | 24 | $ | 14 | 4 | ||||||||
Market and Commodities Intelligence | 9 | 5 | 10 | 3 | |||||||||||
Indices | — | — | 1 | — | |||||||||||
Corporate | 10 | 10 | 5 | 1 | |||||||||||
Total | $ | 44 | $ | 39 | $ | 30 | $ | 8 | |||||||
For the year ended December 31, 2017, we have reduced the reserve for the 2017 restructuring plan by $5 million and for the years ended December 31, 2017 and 2016, we have reduced the reserve for the 2016 restructuring plan by $15 million and $7 million, respectively. The reductions primarily related to cash payments for employee severance costs.
12. Segment and Geographic Information
As discussed in Note 1 – Accounting Policies, we have three reportable segments: Ratings, Market and Commodities Intelligence and Indices.
Our Chief Executive Officer is our chief operating decision-maker and evaluates performance of our segments and allocates resources based primarily on operating profit. Segment operating profit does not include unallocated expense or interest expense, as these are costs that do not affect the operating results of our segments. We use the same accounting policies for our segments as those described in Note 1 – Accounting Policies.
89
Segment information for the years ended December 31 is as follows:
(in millions) | Revenue | Operating Profit | |||||||||||||||||||||
2017 | 2016 | 2015 | 2017 | 2016 | 2015 | ||||||||||||||||||
Ratings 1 | $ | 2,988 | $ | 2,535 | $ | 2,428 | $ | 1,524 | $ | 1,262 | $ | 1,078 | |||||||||||
Market and Commodities Intelligence 2 | 2,452 | 2,585 | 2,376 | 793 | 1,822 | 585 | |||||||||||||||||
Indices 3 | 733 | 639 | 597 | 471 | 412 | 392 | |||||||||||||||||
Intersegment elimination 4 | (110 | ) | (98 | ) | (88 | ) | — | — | — | ||||||||||||||
Total operating segments | 6,063 | 5,661 | 5,313 | 2,788 | 3,496 | 2,055 | |||||||||||||||||
Unallocated expense 5 | — | — | — | (178 | ) | (127 | ) | (138 | ) | ||||||||||||||
Total | $ | 6,063 | $ | 5,661 | $ | 5,313 | $ | 2,610 | $ | 3,369 | $ | 1,917 | |||||||||||
1 | Operating profit for the year ended December 31, 2017 includes legal settlement expenses of $55 million and employee severance charges of $25 million. Operating profit for the year ended December 31, 2016 primarily includes a benefit related to net legal settlement insurance recoveries of $10 million and employee severance charges of $6 million. Operating profit for the year ended December 31, 2015 includes net legal settlement expenses of $54 million and employee severance charges of $13 million. Additionally, operating profit includes amortization of intangibles from acquisitions of $4 million for the year ended December 31, 2017 and $5 million for the years ended December 31, 2016 and 2015. |
2 | Operating profit for the year ended December 31, 2017 includes non-cash acquisition and disposition-related adjustments of $15 million, employee severance charges of $9 million, a charge to exit a leased facility of $6 million, and an asset-write off of $2 million. Operating profit for the year ended December 31, 2016 includes a $1.1 billion gain from our dispositions, disposition-related costs of $48 million, a technology-related impairment charge of $24 million and an acquisition-related cost of $1 million. Operating profit for the year ended December 31, 2015 includes acquisition-related costs related to the acquisition of SNL of $37 million and costs related to identified operating efficiencies primarily related to employee severance charges of $33 million. Additionally, operating profit includes amortization of intangibles from acquisitions of $87 million, $85 million and $57 million for the years ended December 31, 2017, 2016 and 2015, respectively. |
3 | Operating profit includes amortization of intangibles from acquisitions of $7 million, $6 million and $5 million for the years ended December 31, 2017, 2016 and 2015, respectively. |
4 | Revenue for Ratings and expenses for Market and Commodities Intelligence include an intersegment royalty charged to Market and Commodities Intelligence for the rights to use and distribute content and data developed by Ratings. |
5 | The year ended December 31, 2017 includes a charge to exit leased facilities of $19 million, employee severance charges of $10 million and a pension related charge of $8 million. The year ended December 31, 2016 includes $3 million from a disposition-related reserve release. The year ended December 31, 2015 includes a gain of $11 million related to the sale of our interest in a legacy McGraw Hill Construction investment and costs related to identified operating efficiencies primarily related to employee severance charges of $10 million. |
(in millions) | Depreciation & Amortization | Capital Expenditures | |||||||||||||||||||||
2017 | 2016 | 2015 | 2017 | 2016 | 2015 | ||||||||||||||||||
Ratings | $ | 34 | $ | 34 | $ | 43 | $ | 45 | $ | 42 | $ | 48 | |||||||||||
Market and Commodities Intelligence | 128 | 131 | 99 | 52 | 57 | 78 | |||||||||||||||||
Indices | 9 | 8 | 8 | 3 | 3 | 4 | |||||||||||||||||
Total operating segments | 171 | 173 | 150 | 100 | 102 | 130 | |||||||||||||||||
Corporate | 9 | 8 | 7 | 23 | 13 | 9 | |||||||||||||||||
Total | $ | 180 | $ | 181 | $ | 157 | $ | 123 | $ | 115 | $ | 139 | |||||||||||
90
Segment information as of December 31 is as follows:
(in millions) | Total Assets | ||||||
2017 | 2016 | ||||||
Ratings | $ | 788 | $ | 612 | |||
Market and Commodities Intelligence | 4,172 | 4,104 | |||||
Indices | 1,270 | 1,247 | |||||
Total operating segments | 6,230 | 5,963 | |||||
Corporate 1 | 3,190 | 2,699 | |||||
Assets held for sale 2 | 5 | 7 | |||||
Total | $ | 9,425 | $ | 8,669 | |||
1 | Corporate assets consist principally of cash and cash equivalents, assets for pension benefits, deferred income taxes and leasehold improvements related to subleased areas. |
2 | Includes East Windsor, New Jersey facility and QuantHouse as of December 31, 2017 and 2016, respectively. |
We do not have operations in any foreign country that represent more than 7% of our consolidated revenue. Transfers between geographic areas are recorded at agreed upon prices and intercompany revenue and profit are eliminated. No single customer accounted for more than 10% of our consolidated revenue.
The following provides revenue and long-lived assets by geographic region:
(in millions) | Revenue | Long-lived Assets | |||||||||||||||||
Year ended December 31, | December 31, | ||||||||||||||||||
2017 | 2016 | 2015 | 2017 | 2016 | |||||||||||||||
U.S. | $ | 3,658 | $ | 3,461 | $ | 3,202 | $ | 4,285 | $ | 4,335 | |||||||||
European region | 1,473 | 1,330 | 1,265 | 346 | 341 | ||||||||||||||
Asia | 594 | 575 | 566 | 54 | 58 | ||||||||||||||
Rest of the world | 338 | 295 | 280 | 49 | 46 | ||||||||||||||
Total | $ | 6,063 | $ | 5,661 | $ | 5,313 | $ | 4,734 | $ | 4,780 | |||||||||
Revenue | Long-lived Assets | |||||||||||||
Year ended December 31, | December 31, | |||||||||||||
2017 | 2016 | 2015 | 2017 | 2016 | ||||||||||
U.S. | 60 | % | 61 | % | 60 | % | 91 | % | 91 | % | ||||
European region | 24 | 24 | 24 | 7 | 7 | |||||||||
Asia | 10 | 10 | 11 | 1 | 1 | |||||||||
Rest of the world | 6 | 5 | 5 | 1 | 1 | |||||||||
Total | 100 | % | 100 | % | 100 | % | 100 | % | 100 | % | ||||
See Note 2 – Acquisitions and Divestitures and Note 11 – Restructuring, for actions that impacted the segment operating results.
13. Commitments and Contingencies
Related Party Agreement
In June of 2012, we entered into a license agreement (the "License Agreement") with the holder of S&P Dow Jones Indices LLC noncontrolling interest, CME Group, which replaced the 2005 license agreement between Indices and CME Group. Under the terms of the License Agreement, S&P Dow Jones Indices LLC receives a share of the profits from the trading and clearing of CME Group's equity index products. During the years ended December 31, 2017, 2016 and 2015, S&P Dow Jones Indices LLC earned $74 million, $76 million and $63 million of revenue under the terms of the License Agreement, respectively. The entire amount of this revenue is included in our consolidated statement of income and the portion related to the 27% noncontrolling interest is removed in net income attributable to noncontrolling interests.
91
Rental Expense and Lease Obligations
We are committed under lease arrangements covering property, computer systems and office equipment. Leasehold improvements are amortized on a straight-line basis over the shorter of their economic lives or their lease term. Certain lease arrangements contain escalation clauses covering increased costs for various defined real estate taxes and operating services and the associated fees are recognized on a straight-line basis over the minimum lease period.
Rental expense for property and equipment under all operating lease agreements is as follows:
(in millions) | Year ended December 31, | ||||||||||
2017 | 2016 | 2015 | |||||||||
Gross rental expense | $ | 177 | $ | 179 | $ | 182 | |||||
Less: sublease revenue | (17 | ) | (16 | ) | (14 | ) | |||||
Less: rent credit | — | — | (4 | ) | |||||||
Net rental expense | $ | 160 | $ | 163 | $ | 164 | |||||
Cash amounts for future minimum rental commitments under existing non-cancelable leases with a remaining term of more than one year, along with minimum sublease rental income to be received under non-cancelable subleases are shown in the following table.
(in millions) | Rent commitment | Sublease income | Net rent | ||||||||
2018 | $ | 122 | $ | (17 | ) | $ | 105 | ||||
2019 | 109 | (17 | ) | 92 | |||||||
2020 | 83 | (3 | ) | 80 | |||||||
2021 | 71 | — | 71 | ||||||||
2022 | 69 | — | 69 | ||||||||
2023 and beyond | 516 | — | 516 | ||||||||
Total | $ | 970 | $ | (37 | ) | $ | 933 | ||||
Legal & Regulatory Matters
In the normal course of business both in the United States and abroad, the Company and its subsidiaries are defendants in a number of legal proceedings and are often the subject of government and regulatory proceedings, investigations and inquiries. Many of these proceedings, investigations and inquiries relate to the ratings activity of S&P Global Ratings brought by issuers and alleged purchasers of rated securities. In addition, various government and self-regulatory agencies frequently make inquiries and conduct investigations into our compliance with applicable laws and regulations, including those related to ratings activities and antitrust matters. Any of these proceedings, investigations or inquiries could ultimately result in adverse judgments, damages, fines, penalties or activity restrictions, which could adversely impact our consolidated financial condition, cash flows, business or competitive position.
The Company believes that it has meritorious defenses to the pending claims and potential claims in the matters described below and is diligently pursuing these defenses, and in some cases working to reach an acceptable negotiated resolution. However, in view of the uncertainty inherent in litigation and government and regulatory enforcement matters, we cannot predict the eventual outcome of these matters or the timing of their resolution, or in most cases reasonably estimate what the eventual judgments, damages, fines, penalties or impact of activity restrictions may be. As a result, we cannot provide assurance that the outcome of the matters described below will not have a material adverse effect on our consolidated financial condition, cash flows, business or competitive position. As litigation or the process to resolve pending matters progresses, as the case may be, we will continue to review the latest information available and assess our ability to predict the outcome of such matters and the effects, if any, on our consolidated financial condition, cash flows, business and competitive position, which may require that we record liabilities in the consolidated financial statements in future periods.
With respect to the matters identified below, we have recognized a liability when both (a) information available indicates that it is probable that a liability has been incurred as of the date of these financial statements and (b) the amount of loss can reasonably be estimated.
92
S&P Global Ratings
Financial Crisis Litigation
The Company and its subsidiaries continue to defend civil cases brought by private and public plaintiffs arising out of ratings activities prior to and during the global financial crisis of 2008-2009. Included in these civil cases are several lawsuits in Australia against the Company and Standard & Poor’s International, LLC relating to alleged investment losses in collateralized debt obligations (“CDOs”) rated by S&P Global Ratings. We can provide no assurance that we will not be obligated to pay significant amounts in order to resolve these matters on terms deemed acceptable.
U.S. Securities and Exchange Commission
As a nationally recognized statistical rating organization registered with the SEC under Section 15E of the Securities Exchange Act of 1934, S&P Global Ratings is in ongoing communication with the staff of the SEC regarding compliance with its extensive obligations under the federal securities laws. Although S&P Global Ratings seeks to promptly address any compliance issues that it detects or that the staff of the SEC raises, there can be no assurance that the SEC will not seek remedies against S&P Global Ratings for one or more compliance deficiencies.
Trani Prosecutorial Proceeding
In 2014, the prosecutor in the Italian city of Trani obtained criminal indictments against several current and former S&P Global Ratings managers and ratings analysts for alleged market manipulation, and against Standard & Poor’s Credit Market Services Europe under Italy’s vicarious liability statute, for having allegedly failed to properly supervise the ratings analysts and prevent them from committing market manipulation. The prosecutor’s theories were based on various actions by S&P Global Ratings taken with respect to Italian sovereign debt between May of 2011 and January of 2012. On March 30, 2017, following trial, the court in Trani issued an oral verdict acquitting each of the individual defendants and Standard & Poor’s Credit Market Services Europe of all charges, and on September 27, 2017, the court filed a written opinion supporting the verdict. The prosecutor did not appeal, and the verdict is now final.
Shareholder Derivative Actions
In August of 2015, two purported shareholders commenced a putative derivative action on behalf of the Company in New York State Supreme Court titled Retirement Plan for General Employees of the City of North Miami Beach and Robin Stein v. Harold McGraw III, et al. The complaint asserts claims for, among other things, breach of fiduciary duty, waste of corporate assets, and mismanagement against the board of directors and certain former directors and employees of the Company. Plaintiffs seek recovery from the defendants based primarily on allegations that S&P Global Ratings’ credit ratings practices for certain residential mortgage-backed securities and collateralized debt obligations misrepresented the credit risks of those securities, allegedly resulting in losses to the Company. In January of 2016, a different purported shareholder commenced a separate putative derivative action on behalf of the Company in New York State Supreme Court titled L.A. Grika v. Harold McGraw III, et al. The allegations in the complaint are substantially similar to those in the North Miami Beach matter. The complaint asserts claims for, among other things, breach of fiduciary duty, aiding and abetting breaches of fiduciary duty, unjust enrichment, contribution and indemnification against Harold McGraw III, Douglas L. Peterson, and nine former employees of the Company. The Grika matter was transferred to the judge presiding over the North Miami Beach matter. In December of 2016, the court issued orders granting the Company's motions to dismiss both the North Miami Beach and Grika matters. In January of 2017, the plaintiffs in both matters filed notices of appeal. Briefing on the North Miami Beach appeal is now complete, and oral argument was held on January 23, 2018. The plaintiff in the Grika matter filed a brief in support of his appeal on January 2, 2018, and the Company and the individual defendants filed briefs in opposition to the appeal on January 31, 2018.
93
14. Quarterly Financial Information (Unaudited)
(in millions, except per share data) | First quarter | Second quarter | Third quarter | Fourth quarter | Total year | ||||||||||||||
2017 | |||||||||||||||||||
Revenue | $ | 1,453 | $ | 1,509 | $ | 1,513 | $ | 1,589 | $ | 6,063 | |||||||||
Operating profit | $ | 648 | $ | 677 | $ | 658 | $ | 628 | $ | 2,610 | |||||||||
Net income | $ | 430 | $ | 457 | $ | 452 | $ | 299 | $ | 1,638 | |||||||||
Net income attributable to S&P Global common shareholders | $ | 399 | $ | 421 | $ | 414 | $ | 263 | $ | 1,496 | |||||||||
Earnings per share attributable to S&P Global Inc. common shareholders: | |||||||||||||||||||
Net income: | |||||||||||||||||||
Basic | $ | 1.54 | $ | 1.63 | $ | 1.62 | $ | 1.03 | $ | 5.84 | |||||||||
Diluted | $ | 1.53 | $ | 1.62 | $ | 1.61 | $ | 1.02 | $ | 5.78 | |||||||||
2016 1 | |||||||||||||||||||
Revenue | $ | 1,341 | $ | 1,482 | $ | 1,439 | $ | 1,399 | $ | 5,661 | |||||||||
Operating profit | $ | 512 | $ | 651 | $ | 1,348 | $ | 857 | $ | 3,369 | |||||||||
Net income | $ | 323 | $ | 412 | $ | 923 | $ | 569 | $ | 2,228 | |||||||||
Net income attributable to S&P Global common shareholders | $ | 294 | $ | 383 | $ | 892 | $ | 537 | $ | 2,106 | |||||||||
Earnings per share attributable to S&P Global Inc. common shareholders: | |||||||||||||||||||
Net income: | |||||||||||||||||||
Basic | $ | 1.11 | $ | 1.45 | $ | 3.39 | 2.07 | 8.02 | |||||||||||
Diluted | $ | 1.10 | $ | 1.44 | $ | 3.36 | 2.05 | 7.94 | |||||||||||
Note - Totals presented may not sum due to rounding.
1 | The third quarter of 2016 and the fourth of 2016 include a pre-tax gain on our dispositions of $722 million ($521 million after-tax) and $379 million ($297 million after-tax), respectively. See Note 2 – Acquisitions and Divestitures for further information. |
94
15. Condensed Consolidating Financial Statements
On September 22, 2016, we issued $500 million of 2.95% senior notes due in 2027. On May 26, 2015, we issued $700 million of 4.0% senior notes due in 2025. On August 18, 2015, we issued $2.0 billion of senior notes, consisting of $400 million of 2.5% senior notes due in 2018, $700 million of 3.3% senior notes due in 2020 and $900 million of 4.4% senior notes due in 2026. See Note 5 — Debt for additional information.
The senior notes described above are fully and unconditionally guaranteed by Standard & Poor's Financial Services LLC, a 100% owned subsidiary of the Company. The following condensed consolidating financial statements present the results of operations, financial position and cash flows of S&P Global Inc., Standard & Poor's Financial Services LLC, and the Non-Guarantor Subsidiaries of S&P Global Inc. and Standard & Poor's Financial Services LLC, and the eliminations necessary to arrive at the information for the Company on a consolidated basis.
Statement of Income | |||||||||||||||||||
Year Ended December 31, 2017 | |||||||||||||||||||
(in millions) | S&P Global Inc. | Standard & Poor's Financial Services LLC | Non-Guarantor Subsidiaries | Eliminations | S&P Global Inc. Consolidated | ||||||||||||||
Revenue | $ | 717 | $ | 1,780 | $ | 3,704 | $ | (138 | ) | $ | 6,063 | ||||||||
Expenses: | |||||||||||||||||||
Operating-related expenses | 108 | 482 | 1,261 | (138 | ) | 1,713 | |||||||||||||
Selling and general expenses | 162 | 345 | 1,053 | — | 1,560 | ||||||||||||||
Depreciation | 31 | 11 | 40 | — | 82 | ||||||||||||||
Amortization of intangibles | — | — | 98 | — | 98 | ||||||||||||||
Total expenses | 301 | 838 | 2,452 | (138 | ) | 3,453 | |||||||||||||
Operating profit | 416 | 942 | 1,252 | — | 2,610 | ||||||||||||||
Interest expense (income), net | 163 | — | (14 | ) | — | 149 | |||||||||||||
Non-operating intercompany transactions | 365 | (77 | ) | (2,463 | ) | 2,175 | — | ||||||||||||
(Loss) income before taxes on income | (112 | ) | 1,019 | 3,729 | (2,175 | ) | 2,461 | ||||||||||||
Provision for taxes on income | 26 | 370 | 427 | — | 823 | ||||||||||||||
Equity in net income of subsidiaries | 3,808 | — | — | (3,808 | ) | — | |||||||||||||
Net income | 3,670 | 649 | 3,302 | (5,983 | ) | 1,638 | |||||||||||||
Less: net income attributable to noncontrolling interests | — | — | — | (142 | ) | (142 | ) | ||||||||||||
Net income attributable to S&P Global Inc. | $ | 3,670 | $ | 649 | $ | 3,302 | $ | (6,125 | ) | $ | 1,496 | ||||||||
Comprehensive income | $ | 3,694 | $ | 649 | $ | 3,401 | $ | (5,982 | ) | $ | 1,762 | ||||||||
95
Statement of Income | |||||||||||||||||||
Year Ended December 31, 2016 | |||||||||||||||||||
(in millions) | S&P Global Inc. | Standard & Poor's Financial Services LLC | Non-Guarantor Subsidiaries | Eliminations | S&P Global Inc. Consolidated | ||||||||||||||
Revenue | $ | 667 | $ | 1,513 | $ | 3,607 | $ | (126 | ) | $ | 5,661 | ||||||||
Expenses: | |||||||||||||||||||
Operating-related expenses | 113 | 451 | 1,335 | (126 | ) | 1,773 | |||||||||||||
Selling and general expenses | 109 | 243 | 1,087 | — | 1,439 | ||||||||||||||
Depreciation | 38 | 9 | 38 | — | 85 | ||||||||||||||
Amortization of intangibles | — | — | 96 | — | 96 | ||||||||||||||
Total expenses | 260 | 703 | 2,556 | (126 | ) | 3,393 | |||||||||||||
Gain on dispositions | (1,072 | ) | — | (29 | ) | — | (1,101 | ) | |||||||||||
Operating profit | 1,479 | 810 | 1,080 | — | 3,369 | ||||||||||||||
Interest expense (income), net | 191 | — | (10 | ) | — | 181 | |||||||||||||
Non-operating intercompany transactions | 356 | (83 | ) | (941 | ) | 668 | — | ||||||||||||
Income before taxes on income | 932 | 893 | 2,031 | (668 | ) | 3,188 | |||||||||||||
Provision for taxes on income | 275 | 420 | 265 | — | 960 | ||||||||||||||
Equity in net income of subsidiaries | 2,412 | 294 | — | (2,706 | ) | — | |||||||||||||
Net income | 3,069 | 767 | 1,766 | (3,374 | ) | 2,228 | |||||||||||||
Less: net income attributable to noncontrolling interests | — | — | — | (122 | ) | (122 | ) | ||||||||||||
Net income attributable to S&P Global Inc. | $ | 3,069 | $ | 767 | $ | 1,766 | $ | (3,496 | ) | $ | 2,106 | ||||||||
Comprehensive income | $ | 3,099 | $ | 767 | $ | 1,563 | $ | (3,374 | ) | $ | 2,055 | ||||||||
96
Statement of Income | |||||||||||||||||||
Year Ended December 31, 2015 | |||||||||||||||||||
(in millions) | S&P Global Inc. | Standard & Poor's Financial Services LLC | Non-Guarantor Subsidiaries | Eliminations | S&P Global Inc. Consolidated | ||||||||||||||
Revenue | $ | 624 | $ | 2,141 | $ | 2,663 | $ | (115 | ) | $ | 5,313 | ||||||||
Expenses: | |||||||||||||||||||
Operating-related expenses | 137 | 737 | 959 | (115 | ) | 1,718 | |||||||||||||
Selling and general expenses | 184 | 254 | 1,094 | — | 1,532 | ||||||||||||||
Depreciation | 40 | 18 | 32 | — | 90 | ||||||||||||||
Amortization of intangibles | — | — | 67 | — | 67 | ||||||||||||||
Total expenses | 361 | 1,009 | 2,152 | (115 | ) | 3,407 | |||||||||||||
Gain on disposition | — | — | (11 | ) | — | (11 | ) | ||||||||||||
Operating profit | 263 | 1,132 | 522 | — | 1,917 | ||||||||||||||
Interest expense (income), net | 112 | — | (10 | ) | — | 102 | |||||||||||||
Non-operating intercompany transactions | 282 | 222 | (504 | ) | — | — | |||||||||||||
(Loss) income before taxes on income | (131 | ) | 910 | 1,036 | — | 1,815 | |||||||||||||
(Benefit) provision for taxes on income | (107 | ) | 358 | 296 | — | 547 | |||||||||||||
Equity in net income of subsidiaries | 1,473 | 272 | — | (1,745 | ) | — | |||||||||||||
Net income | 1,449 | 824 | 740 | (1,745 | ) | 1,268 | |||||||||||||
Less: net income attributable to noncontrolling interests | — | — | — | (112 | ) | (112 | ) | ||||||||||||
Net income attributable to S&P Global Inc. | $ | 1,449 | $ | 824 | $ | 740 | $ | (1,857 | ) | $ | 1,156 | ||||||||
Comprehensive income | $ | 1,446 | $ | 822 | $ | 655 | $ | (1,741 | ) | $ | 1,182 | ||||||||
97
Balance Sheet | |||||||||||||||||||
December 31, 2017 | |||||||||||||||||||
(in millions) | S&P Global Inc. | Standard & Poor's Financial Services LLC | Non-Guarantor Subsidiaries | Eliminations | S&P Global Inc. Consolidated | ||||||||||||||
ASSETS | |||||||||||||||||||
Current assets: | |||||||||||||||||||
Cash and cash equivalents | $ | 632 | $ | — | $ | 2,147 | $ | — | $ | 2,779 | |||||||||
Accounts receivable, net of allowance for doubtful accounts | 138 | 152 | 1,029 | — | 1,319 | ||||||||||||||
Intercompany receivable | 768 | 1,784 | 2,527 | (5,079 | ) | — | |||||||||||||
Prepaid and other current assets | 143 | (3 | ) | 86 | — | 226 | |||||||||||||
Total current assets | 1,681 | 1,933 | 5,789 | (5,079 | ) | 4,324 | |||||||||||||
Property and equipment, net of accumulated depreciation | 158 | 10 | 107 | — | 275 | ||||||||||||||
Goodwill | 261 | — | 2,719 | 9 | 2,989 | ||||||||||||||
Other intangible assets, net | — | — | 1,388 | — | 1,388 | ||||||||||||||
Investments in subsidiaries | 8,364 | 5 | 8,028 | (16,397 | ) | — | |||||||||||||
Intercompany loans receivable | 116 | — | 1,699 | (1,815 | ) | — | |||||||||||||
Other non-current assets | 215 | 61 | 174 | (1 | ) | 449 | |||||||||||||
Total assets | $ | 10,795 | $ | 2,009 | $ | 19,904 | $ | (23,283 | ) | $ | 9,425 | ||||||||
LIABILITIES AND EQUITY | |||||||||||||||||||
Current liabilities: | |||||||||||||||||||
Accounts payable | $ | 79 | $ | 23 | $ | 93 | $ | — | $ | 195 | |||||||||
Intercompany payable | 3,433 | 492 | 1,154 | (5,079 | ) | — | |||||||||||||
Accrued compensation and contributions to retirement plans | 145 | 86 | 241 | — | 472 | ||||||||||||||
Short-term debt | 399 | — | — | — | 399 | ||||||||||||||
Income taxes currently payable | 2 | — | 75 | — | 77 | ||||||||||||||
Unearned revenue | 293 | 193 | 1,127 | — | 1,613 | ||||||||||||||
Accrued legal settlements | — | 2 | 105 | — | 107 | ||||||||||||||
Other current liabilities | 136 | 21 | 194 | — | 351 | ||||||||||||||
Total current liabilities | 4,487 | 817 | 2,989 | (5,079 | ) | 3,214 | |||||||||||||
Long-term debt | 3,170 | — | — | — | 3,170 | ||||||||||||||
Intercompany loans payable | 101 | — | 1,715 | (1,816 | ) | — | |||||||||||||
Pension and other postretirement benefits | 180 | — | 64 | — | 244 | ||||||||||||||
Other non-current liabilities | 376 | 74 | 229 | — | 679 | ||||||||||||||
Total liabilities | 8,314 | 891 | 4,997 | (6,895 | ) | 7,307 | |||||||||||||
Redeemable noncontrolling interest | — | — | — | 1,350 | 1,350 | ||||||||||||||
Equity: | |||||||||||||||||||
Common stock | 412 | — | 2,318 | (2,318 | ) | 412 | |||||||||||||
Additional paid-in capital | (216 | ) | 602 | 9,256 | (9,117 | ) | 525 | ||||||||||||
Retained income | 12,156 | 516 | 3,782 | (6,429 | ) | 10,025 | |||||||||||||
Accumulated other comprehensive loss | (269 | ) | — | (426 | ) | 46 | (649 | ) | |||||||||||
Less: common stock in treasury | (9,602 | ) | — | (23 | ) | 23 | (9,602 | ) | |||||||||||
Total equity - controlling interests | 2,481 | 1,118 | 14,907 | (17,795 | ) | 711 | |||||||||||||
Total equity - noncontrolling interests | — | — | — | 57 | 57 | ||||||||||||||
Total equity | 2,481 | 1,118 | 14,907 | (17,738 | ) | 768 | |||||||||||||
Total liabilities and equity | $ | 10,795 | $ | 2,009 | $ | 19,904 | $ | (23,283 | ) | $ | 9,425 | ||||||||
98
Balance Sheet | |||||||||||||||||||
December 31, 2016 | |||||||||||||||||||
(in millions) | S&P Global Inc. | Standard & Poor's Financial Services LLC | Non-Guarantor Subsidiaries | Eliminations | S&P Global Inc. Consolidated | ||||||||||||||
ASSETS | |||||||||||||||||||
Current assets: | |||||||||||||||||||
Cash and cash equivalents | $ | 711 | $ | — | $ | 1,681 | $ | — | $ | 2,392 | |||||||||
Accounts receivable, net of allowance for doubtful accounts | 138 | 131 | 853 | — | 1,122 | ||||||||||||||
Intercompany receivable | (165 | ) | 837 | 870 | (1,542 | ) | — | ||||||||||||
Prepaid and other current assets | 77 | 2 | 79 | (1 | ) | 157 | |||||||||||||
Total current assets | 761 | 970 | 3,483 | (1,543 | ) | 3,671 | |||||||||||||
Property and equipment, net of accumulated depreciation | 159 | 1 | 111 | — | 271 | ||||||||||||||
Goodwill | 261 | — | 2,679 | 9 | 2,949 | ||||||||||||||
Other intangible assets, net | — | — | 1,506 | — | 1,506 | ||||||||||||||
Investments in subsidiaries | 5,464 | 680 | 7,826 | (13,970 | ) | — | |||||||||||||
Intercompany loans receivable | 17 | — | 1,354 | (1,371 | ) | — | |||||||||||||
Other non-current assets | 134 | 24 | 114 | — | 272 | ||||||||||||||
Total assets | $ | 6,796 | $ | 1,675 | $ | 17,073 | $ | (16,875 | ) | $ | 8,669 | ||||||||
LIABILITIES AND EQUITY | |||||||||||||||||||
Current liabilities: | |||||||||||||||||||
Accounts payable | $ | 73 | $ | 22 | $ | 88 | $ | — | $ | 183 | |||||||||
Intercompany payable | 1,324 | 40 | 177 | (1,541 | ) | — | |||||||||||||
Accrued compensation and contributions to retirement plans | 129 | 69 | 211 | — | 409 | ||||||||||||||
Income taxes currently payable | 43 | — | 52 | — | 95 | ||||||||||||||
Unearned revenue | 273 | 191 | 1,045 | — | 1,509 | ||||||||||||||
Accrued legal and regulatory settlements | 2 | 3 | 51 | 56 | |||||||||||||||
Other current liabilities | 163 | (54 | ) | 250 | — | 359 | |||||||||||||
Total current liabilities | 2,007 | 271 | 1,874 | (1,541 | ) | 2,611 | |||||||||||||
Long-term debt | 3,564 | — | — | — | 3,564 | ||||||||||||||
Intercompany loans payable | 11 | — | 1,360 | (1,371 | ) | — | |||||||||||||
Pension and other postretirement benefits | 196 | — | 78 | — | 274 | ||||||||||||||
Other non-current liabilities | 52 | 74 | 314 | (1 | ) | 439 | |||||||||||||
Total liabilities | 5,830 | 345 | 3,626 | (2,913 | ) | 6,888 | |||||||||||||
Redeemable noncontrolling interest | — | — | — | 1,080 | 1,080 | ||||||||||||||
Equity: | |||||||||||||||||||
Common stock | 412 | — | 2,460 | (2,460 | ) | 412 | |||||||||||||
Additional paid-in capital | (174 | ) | 1,154 | 10,485 | (10,963 | ) | 502 | ||||||||||||
Retained income | 9,721 | 176 | 1,034 | (1,721 | ) | 9,210 | |||||||||||||
Accumulated other comprehensive loss | (292 | ) | — | (525 | ) | 44 | (773 | ) | |||||||||||
Less: common stock in treasury | (8,701 | ) | — | (7 | ) | 7 | (8,701 | ) | |||||||||||
Total equity - controlling interests | 966 | 1,330 | 13,447 | (15,093 | ) | 650 | |||||||||||||
Total equity - noncontrolling interests | — | — | — | 51 | 51 | ||||||||||||||
Total equity | 966 | 1,330 | 13,447 | (15,042 | ) | 701 | |||||||||||||
Total liabilities and equity | $ | 6,796 | $ | 1,675 | $ | 17,073 | $ | (16,875 | ) | $ | 8,669 | ||||||||
99
Statement of Cash Flows | |||||||||||||||||||
Year Ended December 31, 2017 | |||||||||||||||||||
(in millions) | S&P Global Inc. | Standard & Poor's Financial Services LLC | Non-Guarantor Subsidiaries | Eliminations | S&P Global Inc. Consolidated | ||||||||||||||
Operating Activities: | |||||||||||||||||||
Net income | $ | 3,670 | $ | 649 | $ | 3,302 | $ | (5,983 | ) | $ | 1,638 | ||||||||
Adjustments to reconcile net income to cash provided by operating activities: | |||||||||||||||||||
Depreciation | 31 | 11 | 40 | — | 82 | ||||||||||||||
Amortization of intangibles | — | — | 98 | — | 98 | ||||||||||||||
Provision for losses on accounts receivable | 2 | 3 | 11 | — | 16 | ||||||||||||||
Deferred income taxes | 108 | (10 | ) | (98 | ) | — | — | ||||||||||||
Stock-based compensation | 35 | 22 | 42 | — | 99 | ||||||||||||||
Accrued legal settlements | — | — | 55 | — | 55 | ||||||||||||||
Other | 34 | 19 | 43 | — | 96 | ||||||||||||||
Changes in operating assets and liabilities, net of effect of acquisitions and dispositions: | |||||||||||||||||||
Accounts receivable | (2 | ) | (23 | ) | (171 | ) | — | (196 | ) | ||||||||||
Prepaid and current assets | (5 | ) | 3 | 12 | — | 10 | |||||||||||||
Accounts payable and accrued expenses | 22 | 97 | (44 | ) | — | 75 | |||||||||||||
Unearned revenue | 19 | 2 | 64 | — | 85 | ||||||||||||||
Accrued legal settlements | — | (1 | ) | (3 | ) | — | (4 | ) | |||||||||||
Other current liabilities | (42 | ) | (12 | ) | (31 | ) | — | (85 | ) | ||||||||||
Net change in prepaid/accrued income taxes | 41 | (18 | ) | 9 | — | 32 | |||||||||||||
Net change in other assets and liabilities | 7 | (6 | ) | 14 | — | 15 | |||||||||||||
Cash provided by operating activities | 3,920 | 736 | 3,343 | (5,983 | ) | 2,016 | |||||||||||||
Investing Activities: | |||||||||||||||||||
Capital expenditures | (55 | ) | (32 | ) | (36 | ) | — | (123 | ) | ||||||||||
Acquisitions, net of cash acquired | — | — | (83 | ) | — | (83 | ) | ||||||||||||
Proceeds from dispositions | — | — | 2 | — | 2 | ||||||||||||||
Changes in short-term investments | — | — | (5 | ) | — | (5 | ) | ||||||||||||
Cash used for investing activities | (55 | ) | (32 | ) | (122 | ) | — | (209 | ) | ||||||||||
Financing Activities: | |||||||||||||||||||
Dividends paid to shareholders | (421 | ) | — | — | — | (421 | ) | ||||||||||||
Distributions to noncontrolling interest holders | — | — | (111 | ) | — | (111 | ) | ||||||||||||
Repurchase of treasury shares | (1,001 | ) | — | — | — | (1,001 | ) | ||||||||||||
Exercise of stock options | 68 | — | 7 | — | 75 | ||||||||||||||
Employee withholding tax on share-based payments | (49 | ) | — | — | — | (49 | ) | ||||||||||||
Intercompany financing activities | (2,546 | ) | (704 | ) | (2,733 | ) | 5,983 | — | |||||||||||
Cash used for financing activities | (3,949 | ) | (704 | ) | (2,837 | ) | 5,983 | (1,507 | ) | ||||||||||
Effect of exchange rate changes on cash from continuing operations | 5 | — | 82 | — | 87 | ||||||||||||||
Net change in cash and cash equivalents | (79 | ) | — | 466 | — | 387 | |||||||||||||
Cash and cash equivalents at beginning of year | 711 | — | 1,681 | — | 2,392 | ||||||||||||||
Cash and cash equivalents at end of year | $ | 632 | $ | — | $ | 2,147 | $ | — | $ | 2,779 | |||||||||
100
Statement of Cash Flows | |||||||||||||||||||
Year Ended December 31, 2016 | |||||||||||||||||||
(in millions) | S&P Global Inc. | Standard & Poor's Financial Services LLC | Non-Guarantor Subsidiaries | Eliminations | S&P Global Inc. Consolidated | ||||||||||||||
Operating Activities: | |||||||||||||||||||
Net income | $ | 3,069 | $ | 767 | $ | 1,766 | $ | (3,374 | ) | $ | 2,228 | ||||||||
Adjustments to reconcile net income to cash provided by operating activities: | |||||||||||||||||||
Depreciation | 38 | 9 | 38 | — | 85 | ||||||||||||||
Amortization of intangibles | — | — | 96 | — | 96 | ||||||||||||||
Provision for losses on accounts receivable | 1 | — | 8 | — | 9 | ||||||||||||||
Deferred income taxes | 16 | (9 | ) | 72 | — | 79 | |||||||||||||
Stock-based compensation | 22 | 17 | 37 | — | 76 | ||||||||||||||
Gain on dispositions | (1,072 | ) | — | (29 | ) | — | (1,101 | ) | |||||||||||
Accrued legal and regulatory settlements | 3 | 1 | 50 | — | 54 | ||||||||||||||
Other | 48 | 5 | (23 | ) | — | 30 | |||||||||||||
Changes in operating assets and liabilities, net of effect of acquisitions and dispositions: | |||||||||||||||||||
Accounts receivable | (24 | ) | 187 | (340 | ) | — | (177 | ) | |||||||||||
Prepaid and current assets | (2 | ) | 10 | (3 | ) | — | 5 | ||||||||||||
Accounts payable and accrued expenses | (8 | ) | (39 | ) | 66 | — | 19 | ||||||||||||
Unearned revenue | 19 | (395 | ) | 483 | — | 107 | |||||||||||||
Accrued legal and regulatory settlements | — | (108 | ) | (42 | ) | — | (150 | ) | |||||||||||
Other current liabilities | (27 | ) | (27 | ) | 35 | — | (19 | ) | |||||||||||
Net change in prepaid/accrued income taxes | 141 | — | 33 | — | 174 | ||||||||||||||
Net change in other assets and liabilities | (9 | ) | 38 | 16 | — | 45 | |||||||||||||
Cash provided by operating activities | 2,215 | 456 | 2,263 | (3,374 | ) | 1,560 | |||||||||||||
Investing Activities: | |||||||||||||||||||
Capital expenditures | (68 | ) | (15 | ) | (32 | ) | — | (115 | ) | ||||||||||
Acquisitions, net of cash acquired | (144 | ) | — | (33 | ) | — | (177 | ) | |||||||||||
Proceeds from dispositions | 1,422 | — | 76 | — | 1,498 | ||||||||||||||
Changes in short-term investments | — | — | (1 | ) | — | (1 | ) | ||||||||||||
Cash provided by (used for) investing activities | 1,210 | (15 | ) | 10 | — | 1,205 | |||||||||||||
Financing Activities: | |||||||||||||||||||
Payments on short-term debt, net | (143 | ) | — | — | — | (143 | ) | ||||||||||||
Proceeds from issuance of senior notes, net | 493 | — | — | — | 493 | ||||||||||||||
Payments on senior notes | (421 | ) | — | — | — | (421 | ) | ||||||||||||
Dividends paid to shareholders | (380 | ) | — | — | — | (380 | ) | ||||||||||||
Distributions to noncontrolling interest holders | — | — | (116 | ) | — | (116 | ) | ||||||||||||
Repurchase of treasury shares | (1,123 | ) | — | — | — | (1,123 | ) | ||||||||||||
Exercise of stock options | 86 | — | 2 | — | 88 | ||||||||||||||
Contingent consideration payments | (5 | ) | — | (34 | ) | — | (39 | ) | |||||||||||
Employee withholding tax on share-based payments | (55 | ) | — | — | — | (55 | ) | ||||||||||||
Intercompany financing activities | (1,333 | ) | (441 | ) | (1,600 | ) | 3,374 | — | |||||||||||
Cash used for financing activities | (2,881 | ) | (441 | ) | (1,748 | ) | 3,374 | (1,696 | ) | ||||||||||
Effect of exchange rate changes on cash from continuing operations | — | — | (158 | ) | — | (158 | ) | ||||||||||||
Net change in cash and cash equivalents | 544 | — | 367 | — | 911 | ||||||||||||||
Cash and cash equivalents at beginning of year | 167 | — | 1,314 | — | 1,481 | ||||||||||||||
Cash and cash equivalents at end of year | $ | 711 | $ | — | $ | 1,681 | $ | — | $ | 2,392 | |||||||||
101
Statement of Cash Flows | |||||||||||||||||||
Year Ended December 31, 2015 | |||||||||||||||||||
(in millions) | S&P Global Inc. | Standard & Poor's Financial Services LLC | Non-Guarantor Subsidiaries | Eliminations | S&P Global Inc. Consolidated | ||||||||||||||
Operating Activities: | |||||||||||||||||||
Net income | $ | 1,449 | $ | 824 | $ | 740 | $ | (1,745 | ) | $ | 1,268 | ||||||||
Adjustments to reconcile net income to cash provided by (used for) operating activities from continuing operations: | |||||||||||||||||||
Depreciation | 40 | 18 | 32 | — | 90 | ||||||||||||||
Amortization of intangibles | — | — | 67 | — | 67 | ||||||||||||||
Provision for losses on accounts receivable | 1 | 1 | 6 | — | 8 | ||||||||||||||
Deferred income taxes | 33 | 290 | (43 | ) | — | 280 | |||||||||||||
Stock-based compensation | 23 | 24 | 31 | — | 78 | ||||||||||||||
Gain on disposition | — | — | (11 | ) | — | (11 | ) | ||||||||||||
Accrued legal and regulatory settlements | — | 110 | 9 | — | 119 | ||||||||||||||
Other | 23 | 16 | 18 | — | 57 | ||||||||||||||
Changes in operating assets and liabilities, net of effect of acquisitions and dispositions: | |||||||||||||||||||
Accounts receivable | 3 | (27 | ) | (94 | ) | — | (118 | ) | |||||||||||
Prepaid and current assets | (4 | ) | 14 | (5 | ) | — | 5 | ||||||||||||
Accounts payable and accrued expenses | 8 | (34 | ) | 17 | — | (9 | ) | ||||||||||||
Unearned revenue | (5 | ) | 66 | 68 | — | 129 | |||||||||||||
Accrued legal and regulatory settlements | — | (1,624 | ) | — | — | (1,624 | ) | ||||||||||||
Other current liabilities | (31 | ) | (35 | ) | (11 | ) | — | (77 | ) | ||||||||||
Net change in prepaid/accrued income taxes | 14 | — | 115 | — | 129 | ||||||||||||||
Net change in other assets and liabilities | 78 | 8 | (121 | ) | — | (35 | ) | ||||||||||||
Cash provided by (used for) operating activities from continuing operations | 1,632 | (349 | ) | 818 | (1,745 | ) | 356 | ||||||||||||
Investing Activities: | |||||||||||||||||||
Capital expenditures | (67 | ) | (10 | ) | (62 | ) | — | (139 | ) | ||||||||||
Acquisitions, net of cash acquired | (2,243 | ) | — | (153 | ) | — | (2,396 | ) | |||||||||||
Proceeds from dispositions | — | — | 14 | — | 14 | ||||||||||||||
Changes in short-term investments | — | — | (4 | ) | — | (4 | ) | ||||||||||||
Cash used for investing activities from continuing operations | (2,310 | ) | (10 | ) | (205 | ) | — | (2,525 | ) | ||||||||||
Financing Activities: | |||||||||||||||||||
Additions to short-term debt | 143 | — | — | — | 143 | ||||||||||||||
Proceeds from issuance of senior notes, net | 2,674 | — | — | — | 2,674 | ||||||||||||||
Dividends paid to shareholders | (363 | ) | — | — | — | (363 | ) | ||||||||||||
Distributions to noncontrolling interest holders | — | — | (104 | ) | — | (104 | ) | ||||||||||||
Repurchase of treasury shares | (974 | ) | — | — | — | (974 | ) | ||||||||||||
Exercise of stock options | 80 | — | 6 | — | 86 | ||||||||||||||
Contingent consideration payments | (5 | ) | — | — | — | (5 | ) | ||||||||||||
Purchase of additional CRISIL shares | — | — | (16 | ) | — | (16 | ) | ||||||||||||
Employee withholding tax on share-based payments | (92 | ) | — | — | — | (92 | ) | ||||||||||||
Intercompany financing activities | (2,020 | ) | 359 | (84 | ) | 1,745 | — | ||||||||||||
Cash (used for) provided by financing activities from continuing operations | (557 | ) | 359 | (198 | ) | 1,745 | 1,349 | ||||||||||||
Effect of exchange rate changes on cash from continuing operations | — | — | (67 | ) | — | (67 | ) | ||||||||||||
Cash provided by continuing operations | (1,235 | ) | — | 348 | — | (887 | ) | ||||||||||||
Discontinued Operations: | |||||||||||||||||||
Cash used for operating activities | — | — | (129 | ) | — | (129 | ) | ||||||||||||
Cash used for discontinued operations | — | — | (129 | ) | — | (129 | ) | ||||||||||||
Net change in cash and cash equivalents | (1,235 | ) | — | 219 | — | (1,016 | ) | ||||||||||||
Cash and cash equivalents at beginning of year | 1,402 | — | 1,095 | — | 2,497 | ||||||||||||||
Cash and cash equivalents at end of year | $ | 167 | $ | — | $ | 1,314 | $ | — | $ | 1,481 | |||||||||
102
Item 9. Changes in and Disagreements with Accountants on Accounting and Financial Disclosure
None.
Item 9a. Controls and Procedures
We have filed the required certifications under Section 302 of the Sarbanes-Oxley Act of 2002 incorporated herein by reference from Exhibits (31.1) and (31.2) to this Annual Report on Form 10-K. In addition we have filed the required certifications under Section 906 of the Sarbanes-Oxley Act of 2002 incorporated herein by reference from Exhibit (32) to this Annual Report on Form 10-K.
This Item 9a. includes information concerning the controls and control evaluations referred to in the required certifications.
Disclosure Controls and Procedures
We maintain disclosure controls and procedures that are designed so that information required to be disclosed in our reports filed with the SEC is recorded, processed, summarized and reported within the time periods specified in the SEC’s rules and forms, and that such information is accumulated and communicated to management, including our Chief Executive Officer (“CEO”) and Chief Financial Officer (“CFO”), as appropriate, to allow timely decisions regarding required disclosure.
As of December 31, 2017, an evaluation was performed under the supervision and with the participation of management, including the CEO and CFO, of the effectiveness of the design and operation of our disclosure controls and procedures (as defined in Rules 13a-15(e) and 15d-15(e) under the U.S. Securities Exchange Act of 1934). Based on that evaluation, management, including the CEO and CFO, concluded that our disclosure controls and procedures were effective as of December 31, 2017.
Management’s Annual Report on Internal Control Over Financial Reporting
Pursuant to Section 404 of the Sarbanes-Oxley Act of 2002 and as defined in Rules 13a-15(f) and 15d-15(f) under the Exchange Act, management is required to provide the following report on our internal control over financial reporting:
1. | Management is responsible for establishing and maintaining adequate internal control over financial reporting. |
2. | Management has evaluated the system of internal control using the Committee of Sponsoring Organizations of the Treadway Commission 2013 framework (“COSO 2013 framework”). Management has selected the COSO 2013 framework for its evaluation as it is a control framework recognized by the SEC and the Public Company Accounting Oversight Board that is free from bias, permits reasonably consistent qualitative and quantitative measurement of our internal controls, is sufficiently complete so that relevant controls are not omitted and is relevant to an evaluation of internal controls over financial reporting. |
3. | Based on management’s evaluation under this framework, management has concluded that our internal controls over financial reporting were effective as of December 31, 2017. There are no material weaknesses in our internal control over financial reporting that have been identified by management. |
4. | Our independent registered public accounting firm, Ernst & Young LLP, has audited our consolidated financial statements for the year ended December 31, 2017, and has issued their reports on the financial statements and the effectiveness of our internal control over financial reporting. These reports are located on pages 53 and 54 of this Annual Report on Form 10-K. |
Changes in Internal Control over Financial Reporting
There have been no changes in our internal control over financial reporting during the most recent quarter that have materially affected, or are reasonably likely to materially affect, our internal control over financial reporting.
Item 9b. Other Information
IRAN THREAT REDUCTION AND SYRIA HUMAN RIGHTS ACT DISCLOSURE
Pursuant to Section 219 of the Iran Threat Reduction and Syria Human Rights Act of 2012, which amended the Securities Exchange Act of 1934, an issuer is required to disclose in its annual or quarterly reports, as applicable, whether, during the reporting period, it or any of its affiliates knowingly engaged in certain activities, transactions or dealings relating to Iran or with individuals or
103
entities designated pursuant to certain Executive Orders. Disclosure is generally required even where the activities, transactions or dealings were conducted in compliance with applicable laws and regulations.
Revenue in 2017 attributable to the transactions or dealings by the Company described below was approximately $545,000 with net profit from such sales being a fraction of the revenues.
During 2017, one of the Company’s divisions, a provider of energy-related information in over 150 countries, sold information and informational materials, which are generally exempt from U.S. economic sanctions, to fifteen subscribers that are owned or controlled, or appear to be owned or controlled, by the Government of Iran (the “GOI”), including one that was also designated by the Treasury Department’s Office of Foreign Assets Control (“OFAC”) pursuant to Executive Order 13382 for part of the first quarter of 2016. The Company, among other things, offers customers that subscribe to its publications access to proprietary data, analytics, and industry information that enable commodities markets to perform with greater transparency and efficiency. This division provided such data related to the energy and petrochemicals markets to the subscribers referenced above, generating revenue that was a de minimis portion of both the division's and the Company’s revenue. Seven of the subscribers are identified by OFAC as GOI entities; and nine appear, based on publicly available information, to be owned or controlled by GOI entities. In addition, as previously reported, during the third quarter of 2017, this division entered into a contract to sell information and informational materials to another subscriber that is owned or controlled by the Government of Iran, and began to provide informational materials to this subscriber under the contract, but no revenues were received under this contract in 2017. We believe that these transactions were permissible under U.S. sanctions pursuant to certain statutory and regulatory exemptions for the exportation of information and informational materials. The Company will continue to monitor its provision of products and services to these Iranian customers so that such activity continues to be permissible under U.S. sanctions.
104
PART III
Item 10. Directors, Executive Officers and Corporate Governance
Information about our directors is contained under the caption “Board of Directors and Corporate Governance-Director Biographies” in our Proxy Statement for our 2018 Annual Meeting of Shareholders to be filed with the SEC within 120 days of the fiscal year ended December 31, 2017 (the “2018 Proxy Statement”) and is incorporated herein by reference.
The information under the heading “Executive Officers of the Registrant” in Part I of this Annual Report on Form 10-K is also incorporated herein by reference.
Code of Ethics
We have adopted a Code of Ethics that applies to our CEO, CFO, chief accounting officer and senior financial officers. To access such code, go to the Corporate Governance section of our Investor Relations website at http://investor.spglobal.com. Any waivers that may in the future be granted from such Code will be posted at such website address. In addition to our Code of Ethics for the CEO and senior financial officers noted above, the following documents may be found on our website at the above website address:
• | Code of Business Ethics for all employees; |
• | Code of Business Conduct and Ethics for Directors; |
• | Employee Complaint Procedures (Accounting and Auditing Matters); |
• | Certificate of Incorporation; |
• | By-Laws; |
• | Corporate Governance Guidelines; |
• | Audit Committee Charter; |
• | Compensation and Leadership Development Committee Charter; |
• | Nominating and Corporate Governance Committee Charter; |
• | Financial Policy Committee Charter; and |
• | Executive Committee Charter. |
The foregoing documents are also available in print, free of charge, to any shareholder who requests them. Requests for printed copies may be e-mailed to corporate.secretary@spglobal.com or mailed to the Corporate Secretary, S&P Global Inc., 55 Water Street, New York, NY 10041-0001.
Information about the procedures by which security holders may recommend nominees to our Board of Directors can be found in our 2018 Proxy Statement under the caption “Board of Directors and Corporate Governance-Committees of the Board of Directors-Nominating and Corporate Governance Committee” and is incorporated herein by reference.
Information concerning the composition of the Audit Committee and our Audit Committee financial experts is contained in our 2018 Proxy Statement under the caption “Board of Directors and Corporate Governance-Committees of the Board of Directors-Audit Committee” and is incorporated herein by reference.
New York Stock Exchange Certification
Promptly following the 2018 annual meeting of shareholders, we intend to file with the NYSE the CEO certification regarding our compliance with the NYSE’s corporate governance listing standards as required by NYSE Rule 303A.12. Last year, we filed this CEO certification with the NYSE on May 5, 2017.
Item 11. Executive Compensation
Information about director and executive officer compensation, Compensation Committee interlocks and the Compensation Committee Report is contained in our 2018 Proxy Statement under the captions “2017 Director Compensation,” “Board of Directors and Corporate Governance-Compensation Committee Interlocks and Insider Participation,” and is incorporated herein by reference.
105
Item 12. Security Ownership of Certain Beneficial Owners and Management and Related Stockholder Matters
Set forth below is information with respect to securities authorized for issuance under equity compensation plans:
The following table details our equity compensation plans as of December 31, 2017:
Equity Compensation Plans’ Information | ||||||||||
(a) | (b) | (c) | ||||||||
Plan category | Number of securities to be issued upon exercise of outstanding options, warrants and rights | Weighted-average exercise price of outstanding options, warrants and rights | Number of securities remaining available for future issuance under equity compensation plans (excluding securities reflected in column (a)) | |||||||
Equity compensation plans approved by security holders | 2,153,409 | 1 | $ | 44.09 | 33,839,258 | 2,3 | ||||
1 | Shares to be issued upon exercise of outstanding options under our Stock Incentive Plans. |
2 | Included in this number are 48,826 shares reserved for issuance under the Director Deferred Stock Ownership Plan. The remaining 33,790,432 shares are reserved for issuance under the 2002 Stock Incentive Plan (the “2002 Plan”) for Performance Stock, Restricted Stock, Other Stock-Based Awards, Stock Options and Stock Appreciation Rights. |
3 | Under the terms of the 2002 Plan, shares subject to an award or shares paid in settlement of a dividend equivalent reduce the number of shares available under the 2002 Plan by one share for each such share granted or paid. |
The 2002 Plan is also governed by certain share recapture provisions. The aggregate number of shares of stock available under the 2002 Plan for issuance are increased by the number of shares of stock granted as an award under the 2002 Plan that are:
• | forfeited, cancelled, settled in cash or property other than stock, or otherwise not distributable under the 2002 Plan; |
• | tendered or withheld to pay the exercise or purchase price of an award under the 2002 Plan or to satisfy applicable wage or other required tax withholding in connection with the exercise, vesting or payment of, or other event related to, an award under the 2002 Plan; or |
• | repurchased by us with the option proceeds in respect of the exercise of a stock option under the 2002 Plan. |
Information on the number of shares our common stock beneficially owned by each director and named executive officer, by all directors and executive officers as a group and on each beneficial owner of more than 5% of our common stock is contained under the caption “Ownership of Company Stock” in our 2018 Proxy Statement and is incorporated herein by reference.
Item 13. Certain Relationships and Related Transactions, and Director Independence
Information with respect to certain relationships and related transactions and director independence is contained under the captions “Board of Directors and Corporate Governance-Transactions with Related Persons” in our 2018 Proxy Statement and is incorporated herein by reference.
Item 14. Principal Accountant Fees and Services
During the year ended December 31, 2017, Ernst & Young LLP audited the consolidated financial statements of the Registrant and its subsidiaries.
Information on our Audit Committee’s pre-approval policy for audit services and information on our principal accountant fees and services is contained in our 2018 Proxy Statement under the caption “Independent Registered Public Accounting Firm’s Fees and Services” and is incorporated herein by reference.
106
PART IV
Item 15. Exhibits, Financial Statement Schedules
(a) Documents filed as part of this Annual Report on Form 10-K:
1. | Financial Statements |
• | Reports of Independent Registered Public Accounting Firm |
• | Consolidated Statements of Income for the three years ended December 31, 2017 |
• | Consolidated Statements of Comprehensive Income for the three years ended December 31, 2017 |
• | Consolidated Balance Sheets as of December 31, 2017 and 2016 |
• | Consolidated Statements of Cash Flows for the three years ended December 31, 2017 |
• | Consolidated Statements of Equity for the three years ended December 31, 2017 |
• | Notes to the Consolidated Financial Statements |
2. | Financial Schedule |
• | Schedule II—Valuation and Qualifying Accounts |
All other schedules have been omitted since the required information is not present or not present in amounts sufficient to require submission of the schedule, or because the information required is included in the consolidated financial statements or the notes thereto.
3. | Exhibits – The exhibits filed as part of this Annual Report on Form 10-K are listed in the Exhibit Index immediately preceding such Exhibits, and such Exhibit Index is incorporated herein by reference. |
107
S&P Global
Schedule II – Valuation and Qualifying Accounts
(in millions)
Additions/(deductions) | Balance at beginning of year | Net charges to income | Deductions and other 1 | Balance at end of year | |||||||||||
Year ended December 31, 2017 | |||||||||||||||
Allowance for doubtful accounts | $ | 28 | $ | 15 | $ | (11 | ) | $ | 33 | ||||||
Year ended December 31, 2016 | |||||||||||||||
Allowance for doubtful accounts | $ | 37 | $ | 8 | $ | (17 | ) | $ | 28 | ||||||
Year ended December 31, 2015 | |||||||||||||||
Allowance for doubtful accounts | $ | 38 | $ | 12 | $ | (13 | ) | $ | 37 | ||||||
1 | Primarily includes uncollectible accounts written off, net of recoveries, impact of acquisitions and divestitures and adjustments for foreign currency translation. |
108
Signatures
Pursuant to the requirements of Section 13 or 15(d) of the Securities Exchange Act of 1934, the Registrant has duly caused this Form 10-K to be signed on its behalf by the undersigned, thereunto duly authorized.
S&P Global Inc. |
Registrant |
By: |
/s/ Douglas L. Peterson |
Douglas L. Peterson |
President and Chief Executive Officer |
February 9, 2018
Each individual whose signature appears below constitutes and appoints Douglas L. Peterson and Ewout L. Steenbergen, and each of them singly, his or her true and lawful attorneys-in-fact and agents with full power of substitution, for him or her and in his or her name, place and stead, in any and all capacities, to sign any and all amendments to this Form 10-K filed with the Securities and Exchange Commission, granting unto said attorneys-in-fact and agents, and each of them, full power and authority to do and perform each and every act and thing requisite and necessary to be done in and about the premises, as fully to all intents and purposes as he or she might or could do in person, hereby ratifying and confirming all the said attorneys-in-fact and agents or any of them or their or his or her substitute or substitutes, may lawfully do or cause to be done by virtue hereof.
Pursuant to the requirements of the Securities Exchange Act of 1934, this report has been signed on February 9, 2018 on behalf of the Registrant by the following persons who signed in the capacities as set forth below under their respective names.
/s/ Douglas L. Peterson |
Douglas L. Peterson |
President and Chief Executive Officer and Director |
/s/ Ewout L. Steenbergen |
Ewout L. Steenbergen |
Executive Vice President and Chief Financial Officer |
/s/ Robert J. MacKay |
Robert J. MacKay |
Senior Vice President and Corporate Controller |
/s/ Charles E. Haldeman, Jr. |
Charles E. Haldeman, Jr. |
Chairman of the Board and Director |
/s/ Marco Alverà |
Marco Alverà |
Director |
/s/ William D. Green |
William D. Green |
Director |
/s/ Stephanie C. Hill |
Stephanie C. Hill |
Director |
/s/ Rebecca Jacoby |
Rebecca Jacoby |
Director |
/s/ Monique F. Leroux |
Monique F. Leroux |
Director |
/s/ Maria R. Morris |
Maria R. Morris |
Director |
/s/ Sir Michael Rake |
Sir Michael Rake |
Director |
/s/ Edward B. Rust, Jr. |
Edward B. Rust, Jr. |
Director |
/s/ Kurt L. Schmoke |
Kurt L. Schmoke |
Director |
/s/ Richard E. Thornburgh |
Richard E. Thornburgh |
Director |
109
110
(10.1 | ) | Form of Indemnification Agreement between Registrant and each of its directors and certain of its executive officers, incorporated by reference from Registrant’s Form 10-K for the fiscal year ended December 31, 2004. |
(10.2)* | Registrant’s 2002 Stock Incentive Plan, as amended and restated as of January 1, 2016, incorporated by reference from the Registrant’s Form 10-Q filed April 26, 2016. | |
(10.3)* | Form of Performance Share Unit Terms and Conditions, incorporated by reference from the Registrant's Form 10-K for the fiscal year ended December 31, 2014. | |
(10.4)* | Form of Performance Share Unit Terms and Conditions, as incorporated by reference from the Registrant’s Form 10-Q filed on April 28, 2015. | |
(10.5)* | Form of Performance Share Unit Terms and Conditions, incorporated by reference from the Registrant's Form 10-Q filed on April 26, 2016. | |
(10.6)* | Form of Restricted Stock Unit Award Terms and Conditions, as incorporated by reference from the Registrant’s Form 10-Q filed on April 28, 2015. | |
(10.7)* | Form of Restricted Stock Unit Award Terms and Conditions, incorporated by reference from the Registrant's Form 10-Q filed on April 26, 2016. | |
(10.8)* | Form of Stock Option Award, incorporated by reference from the Registrant's Form 10-K for the fiscal year ended December 31, 2013. | |
(10.9)* | Registrant’s Key Executive Short Term Incentive Compensation Plan, as amended effective January 1, 2016, incorporated by reference from Registrant’s Form 10-Q filed November 3, 2016. | |
(10.10)* | Registrant’s Key Executive Short-Term Incentive Deferred Compensation Plan, as amended and restated as of January 1, 2008, incorporated by reference from Registrant’s Form 10-K for the fiscal year ended December 31, 2007. | |
(10.11)* | Resolutions terminating deferrals under the Key Executive Short-Term Deferred Compensation Plan, dated October 23, 2014, incorporated by reference from the Registrant's Form 10-K for the fiscal year ended December 31, 2014. | |
(10.12)* | Registrant's Senior Executive Severance Plan, amended and restated as of January 1, 2016, incorporated by reference from the Registrant's Form 10-Q filed April 26, 2016. | |
(10.13) | $1,000,000,000 Four-Year Credit Agreement dated as of June 19, 2013 among the Registrant, Standard & Poor’s Financial Services LLC, as guarantor, the lenders listed therein, JP Morgan Chase Bank, N.A., as administrative agent, and Bank of America, N.A., as syndication agent, incorporated by reference from the Registrant’s Form 8-K filed June 20, 2013. | |
(10.14 | ) | Revolving Five-Year Credit Agreement, dated as of June 30, 2015, among the Company, Standard & Poor's Financial Services LLC, the lenders party thereto and JPMorgan Chase Bank, N.A., as administrative agent, as incorporated by reference from the Registrant’s Form 8-K filed on July 1, 2015. |
(10.15)* | Registrant’s Employee Retirement Plan Supplement, as amended and restated as of January 1, 2008, incorporated by reference from Registrant’s Form 10-K for the fiscal year ended December 31, 2007. | |
(10.16)* | First Amendment to Registrant’s Employee Retirement Plan Supplement, effective as of January 1, 2009, incorporated by reference from the Registrant’s Form 10-K for the fiscal year ended December 31, 2009. | |
(10.17)* | Second Amendment to Registrant’s Employee Retirement Plan Supplement, effective generally as of January 1, 2010, incorporated by reference from the Registrant’s Form 10-K for the fiscal year ended December 31, 2009. | |
(10.18)* | Third Amendment to Registrant’s Employee Retirement Plan Supplement, effective generally as of January 1, 2012, incorporated from the Registrant's Form 10-K for the fiscal year ended December 31, 2011. | |
111
(10.19)* | Fourth Amendment to Registrant’s Employee Retirement Plan Supplement, effective generally as of May 1, 2013, incorporated by reference from the Registrant's Form 10-K for the fiscal year ended December 31, 2013. | |
(10.20)* | Standard & Poor’s Employee Retirement Plan Supplement, as amended and restated as of January 1, 2008, incorporated by reference from the Registrant’s Form 10-K for the fiscal year ended December 31, 2009. | |
(10.21)* | First Amendment to Standard & Poor’s Employee Retirement Plan Supplement, effective as of December 2, 2009, incorporated by reference from the Registrant’s Form 10-K for the fiscal year ended December 31, 2009. | |
(10.22)* | Second Amendment to Standard & Poor’s Employee Retirement Plan Supplement, effective as of January 1, 2010, incorporated by reference from the Registrant’s Form 10-K for the fiscal year ended December 31, 2009. | |
(10.23)* | Third Amendment to Standard & Poor’s Employee Retirement Plan Supplement, effective as of January 1, 2012, incorporated from the Registrant's Form 10-K for the fiscal year ended December 31, 2011. | |
(10.24)* | Fourth Amendment to Standard & Poor’s Employee Retirement Plan Supplement, effective generally as of January 1, 2014, incorporated by reference from the Registrant's Form 10-K for the fiscal year ended December 31, 2013. | |
(10.25)* | Fifth Amendment to Standard & Poor’s Employee Retirement Plan Supplement, dated December 23, 2014, incorporated by reference from the Registrant's Form 10-K for the fiscal year ended December 31, 2014. | |
(10.26)* | Registrant’s 401(k) Savings and Profit Sharing Supplement, as amended and restated as of January 1, 2016, incorporated by reference from the Registrant's Form 10-Q filed April 26, 2016. | |
(10.27)* | Registrant’s Management Supplemental Death and Disability Benefits Plan, as amended and restated effective as of September 23, 2014, incorporated by reference from the Registrant's Form 10-K for the fiscal year ended December 31, 2014. | |
(10.28)* | Registrant’s Senior Executive Supplemental Death, Disability & Retirement Benefits Plan, as amended and restated as of January 1, 2008, incorporated by reference from Registrant's Form 10-K for the fiscal year ended December 31, 2007. | |
(10.29)* | Amendment to Registrant’s Senior Executive Supplemental Death, Disability & Retirement Benefits Plan, effective as of January 1, 2010, incorporated by reference from the Registrant’s Form 10-K for the fiscal year ended December 31, 2009. | |
(10.30)* | Registrant's Director Retirement Plan, incorporated by reference from Registrant’s Form SE filed March 29, 1990 in connection with Registrant’s Form 10-K for the fiscal year ended December 31, 1989. | |
(10.31)* | Resolutions Freezing Existing Benefits and Terminating Additional Benefits under Registrant’s Directors Retirement Plan, as adopted on January 31, 1996, incorporated by reference from Registrant’s Form 10-K for the fiscal year ended December 31, 1996. | |
(10.32)* | Registrant’s Director Deferred Compensation Plan, as amended and restated as of January 1, 2008, incorporated by reference from Registrant’s Form 10-K for the fiscal year ended December 31, 2007. | |
(10.33)* | Registrant’s Director Deferred Stock Ownership Plan, incorporated by reference from Registrant’s Form 10-K for the fiscal year ended December 31, 2010. | |
(10.34)* | Amendment dated December 9, 2011 to offer letter dated November 2, 2010 to Jack F. Callahan, Jr., Executive Vice President and Chief Financial Officer, incorporated from the Registrant's Form 10-K for the fiscal year ended December 31, 2011. | |
(10.35)* | Amendment dated December 9, 2011 to offer letter dated October 27, 2010 to John L. Berisford, Executive Vice President, Human Resources, incorporated from the Registrant's Form 10-K for the fiscal year ended December 31, 2011. | |
(10.36)* | Letter Agreement, dated July 11, 2013, with Harold McGraw III regarding his compensation arrangement for serving as Non-Executive Chairman of the Board, incorporated by reference from Registrant’s Form 8-K filed July 11, 2013. | |
112
(10.37)* | Separation Agreement dated September 24, 2015 between the Company and Neeraj Sahai, as incorporated by reference from the Registrant’s Registration Statement on Form S-4 filed on October 30, 2015. | |
(10.38)* | Letter Agreement dated February 18, 2016, with Imogen Dillon Hatcher regarding certain amendments to her Contract of Employment with McGraw-Hill International (U.K.) Limited, dated November 27, 2013, incorporated by reference from the Registrant's Form 10-Q filed on April 26, 2016. | |
(10.39)* | Separation Agreement and Release dated October 30, 2015 between the Company and Lucy Fato, incorporated by reference from the Registrant's Form 10-Q filed on April 26, 2016. | |
(10.40)* | Registrant’s Pay Recovery Policy, restated effective as of January 1, 2015, incorporated by reference from the Registrant's Form 10-K for the fiscal year ended December 31, 2014. | |
(10.41)* | S&P Ratings Services Pay Recovery Policy, effective as of October 1, 2014, incorporated by reference from the Registrant's Form 10-K for the fiscal year ended December 31, 2014. | |
(10.42) | Settlement Agreement dated February 2, 2015 among the Company, Standard & Poor's Financial Services LLC, the United States, acting through the Department of Justice, and various States and the District of Columbia, acting through their respective Attorneys General, incorporated by reference from the Registrant's Form 10-K for the fiscal year ended December 31, 2014. | |
(10.43 | ) | |
(10.44 | ) | |
(12) | ||
(21) | ||
(23) | ||
(31.1) | ||
(31.2) | ||
(32) | ||
(101.INS) | XBRL Instance Document | |
(101.SCH) | XBRL Taxonomy Extension Schema | |
(101.CAL) | XBRL Taxonomy Extension Calculation Linkbase | |
(101.LAB) | XBRL Taxonomy Extension Label Linkbase | |
(101.PRE) | XBRL Taxonomy Extension Presentation Linkbase | |
(101.DEF) | XBRL Taxonomy Extension Definition Linkbase | |
(101.LAB) | XBRL Taxonomy Extension Label Linkbase | |
(101.PRE) | XBRL Taxonomy Extension Presentation Linkbase | |
(101.DEF) | XBRL Taxonomy Extension Definition Linkbase | |
113
* These exhibits relate to management contracts or compensatory plan arrangements.
114
Item 16. Form 10-K Summary
None.
115