Attached files
| file | filename |
|---|---|
| 8-K - FORM 8-K - Ameris Bancorp | tv484971_8k.htm |
Exhibit 99.1
Ameris Bancorp 4 th Quarter 2017 Results Investor Presentation
This presentation contains certain performance measures determined by methods other than in accordance with accounting principles generally accepted in the United States of America (“GAAP”) . Management of Ameris Bancorp (the “Company”) uses these non - GAAP measures in its analysis of the Company’s performance . These measures are useful when evaluating the underlying performance and efficiency of the Company’s operations and balance sheet . The Company’s management believes that these non - GAAP measures provide a greater understanding of ongoing operations, enhance comparability of results with prior periods and demonstrate the effects of significant gains and charges in the current period . The Company’s management believes that investors may use these non - GAAP financial measures to evaluate the Company’s financial performance without the impact of unusual items that may obscure trends in the Company’s underlying performance . These disclosures should not be viewed as a substitute for financial measures determined in accordance with GAAP, nor are they necessarily comparable to non - GAAP performance measures that may be presented by other companies . Tangible common equity and Tier 1 capital ratios are non - GAAP measures . The Company calculates the Tier 1 capital ratio using current call report instructions . The Company’s management uses these measures to assess the quality of capital and believes that investors may find them useful in their evaluation of the Company . These capital measures may, or may not be necessarily comparable to similar capital measures that may be presented by other companies . This presentation may contain statements that constitute “forward - looking statements” within the meaning of Section 27 A of the Securities Act of 1933 , as amended, and Section 21 E of the Securities Exchange Act of 1934 , as amended . The words “believe”, “estimate”, “expect”, “intend”, “anticipate” and similar expressions and variations thereof identify certain of such forward - looking statements, which speak only as of the dates which they were made . The Company undertakes no obligation to publicly update or revise any forward - looking statements, whether as a result of new information, future events or otherwise . Readers are cautioned that any such forward - looking statements are not guarantees of future performance and involve risks and uncertainties and that actual results may differ materially from those indicated in the forward - looking statements as a result of various factors . Readers are cautioned not to place undue reliance on these forward - looking statements and are referred to the Company’s periodic filings with the Securities and Exchange Commission for a summary of certain factors that may impact the Company’s results of operations and financial condition . Cautionary Statements 1

Almost singular focus of our team right now is “to produce top quartile operating results, consistently” • Manage the momentum we have to produce 15 % + growth in loans and deposits in 2018 • Continue to manage stable margins in various growth and rate scenarios • Expand non - interest income lines where appropriate to manage their contribution to EPS and ROA • Continue efforts to leverage existing staff and infrastructure to hold efficiency ratio below 60 % Current Focus Consistent Operating Performance M&A Opportunities and Impact of Crossing $10 Billion • Evaluate M&A opportunities that fit within our culture • Opportunities that compliment our existing footprint or position us in growing MSAs • Fine tune our infrastructure and systems to cross $ 10 billion and continue growing Drive Earnings Per Share from Organic Sources • Organic Sources of loans from existing set of producers . More resources supporting our relationship managers to support much larger portfolios • Insulate ourselves from rate movements and economic swings with highly stable, non - rate sensitive deposits • Grow capital levels and book value through higher than average ROAs and ROTCE • Avoid concentrations ; take the long view 2

Earnings Summary – Operating Basis Quarter to Date Results Year To Date Results 4Q 17 4Q 16 Change 2017 2016 Change Operating Earnings $23,590 $22,205 6% $92,271 $80,627 14% Earnings Per Share $ 0.63 $ 0.63 - $ 2.48 $ 2.32 7% Return on Assets 1.20% 1.34% - 10% 1.26% 1.31% - 4% Return on TCE 13.91% 17.25% - 19% 14.66% 16.85% - 13% NIM (net of accretion) 3.82% 3.73% 2% 3.79% 3.74% 1% Efficiency Ratio 60.88% 58.29% 4% 60.27% 61.55% - 2% Net Overhead Ratio 1.77% 1.47% 20% 1.63% 1.57% 4% 3

4Q 2017 Operating Highlights • Organic Loan Growth of $138.2 million, or 10.1% annualized during 4Q 2017 (20.3% annualized for the YTD period) • Net Interest Margin expanded by 2bps compared to 3Q 2017 • Operating efficiency ratio of 60.88% compared to 61.09% in 3Q 2017 • Total Revenue of $93.1 million, growth of 14.1% compared to 4Q 2016 • Legacy non - accrual assets remained steady at 0.36% of total assets • Net income contribution from lines of business of $6.2 million or 26.3% of operating net income. Standalone efficiency ratio of 61.4% • TBV per share of $17.86, up 23.9% from 4Q 2016 4

Deferred Tax Adjustments • Deferred tax asset remeasurement resulted in a $13.4 million write - off of the deferred tax asset due to the Tax Cuts and Jobs Act – $0.36 negative earnings per share impact in 2017 • Significant decrease in federal tax expense going forward – Positive impact to EPS of approximately $0.44 - $0.47 – Positive impact to ROA of 21bps – 9 month earn - back – Estimated effective tax rate of 22.5% - 23%. • Reduction in margin due to tax equivalent adjustment on municipal securities and loans – Negative impact to margin of 6bps 5
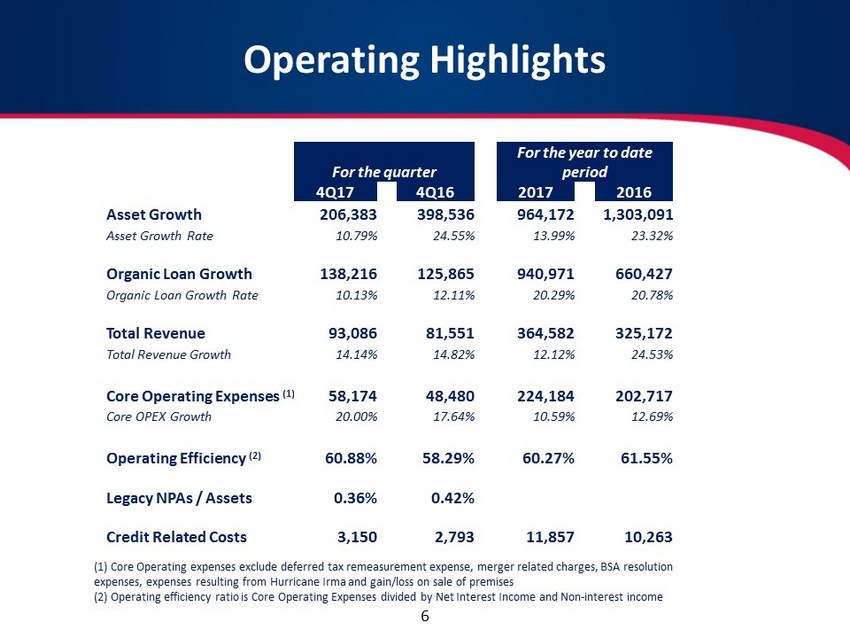
Operating Highlights (1) Core Operating expenses exclude deferred tax remeasurement expense, merger related charges, BSA resolution expenses, expenses resulting from Hurricane Irma and gain/loss on sale of premises (2) Operating efficiency ratio is Core Operating Expenses divided by Net Interest Income and Non - interest income For the quarter For the year to date period 4Q17 4Q16 2017 2016 Asset Growth 206,383 398,536 964,172 1,303,091 Asset Growth Rate 10.79% 24.55% 13.99% 23.32% Organic Loan Growth 138,216 125,865 940,971 660,427 Organic Loan Growth Rate 10.13% 12.11% 20.29% 20.78% Total Revenue 93,086 81,551 364,582 325,172 Total Revenue Growth 14.14% 14.82% 12.12% 24.53% Core Operating Expenses (1) 58,174 48,480 224,184 202,717 Core OPEX Growth 20.00% 17.64% 10.59% 12.69% Operating Efficiency (2) 60.88% 58.29% 60.27% 61.55% Legacy NPAs / Assets 0.36% 0.42% Credit Related Costs 3,150 2,793 11,857 10,263 6

Total Revenue Spread Revenues • $1.3 billion or 21.5% growth in average earning assets over 4Q 2016 • Steady to increasing margin despite strong growth in existing rate environment. Margin of 3.82% in current quarter compared to 3.73% a year ago Non - Interest Income • Mortgage Revenue – flat despite increase in volume – gain on sale became tighter during the year • Service charges – flat due to competitive service charge routines – focused on attracting quality customers to fund future loan growth • SBA revenues – increased 12.4% to $10.0 million during 2017 due to steady production and increased premium on sale $68.9 $72.5 $79.7 $83.3 $80.3 $85.0 $90.1 $92.9 $92.9 $25.0 $50.0 $75.0 $100.0 4Q 15 1Q 16 2Q 16 3Q 16 4Q 16 1Q 17 2Q 17 3Q 17 4Q17 Total Quarterly Revenue, excluding accretion (in millions) 7

Net Interest Margin Spread Income and Margin supported by: • Growth in average earning assets of $1.28 billion or 21.5% compared to 4Q16 • Margin higher by 2bps • 4.69% - Incremental margin on incremental asset growth. Exceptional result given rate environment Accretion income a decreasingly lower part of our revenues: • 2.9% of revenue in YTD 2017 • 4.3% of revenue in YTD 2016 • 4.5% of revenue in YTD 2015 Margin expansion despite $1.3 billion of growth in earning assets in current rate environment Loan Production Details Period Fixed Rate (2) Variable Rate (2) Total 4Q17 264.2 4.79% 203.9 5.03% 468.1 4.89% 3Q17 296.6 4.72% 167.1 4.77% 463.7 4.74% 4Q16 323.3 4.43% 175.4 4.27% 498.7 4.37% $46.5 $48.2 $51.3 $54.4 $56.0 $59.3 $61.9 $65.9 $69.4 3.75% 3.73% 3.79% 3.77% 3.80% 3.82% 3.00% 3.50% 4.00% 4.50% $20.0 $30.0 $40.0 $50.0 $60.0 $70.0 $80.0 4Q 15 1Q 16 2Q 16 3Q 16 4Q 16 1Q 17 2Q 17 3Q 17 4Q17 Net Interest Income before Accretion (in millions) 8

Expenses – 4Q17 • Increases in operating expenses are mostly attributable to : – Expenses in premium finance division, which was formed in December 2016 – Increased on - going salary and expenses related to improvement in the Company’s BSA department – Additional mortgage loan officers in strategic markets such as Charleston, Greenville and Jacksonville – Infrastructure and overhead in the new equipment finance division, which was formed in January 2017 1 – Recurring operating expenses exclude Problem loan and OREO costs, merger costs and special compliance charges in 4Q16 and 3Q 17. OPEX Highlights: Steady, Recurring Operating Expenses $9.2 $11.3 $12.1 $10.7 $13.7 $14.4 $16.6 $14.6 $38.2 $39.3 $39.6 $37.2 $38.1 $40.8 $41.0 $44.1 0.0 25.0 50.0 75.0 1Q 16 2Q 16 3Q 16 4Q 16 1Q 17 2Q 17 3Q 17 4Q 17 Core Operating Expenses (in millions) LOB Expenses Core Bank 9
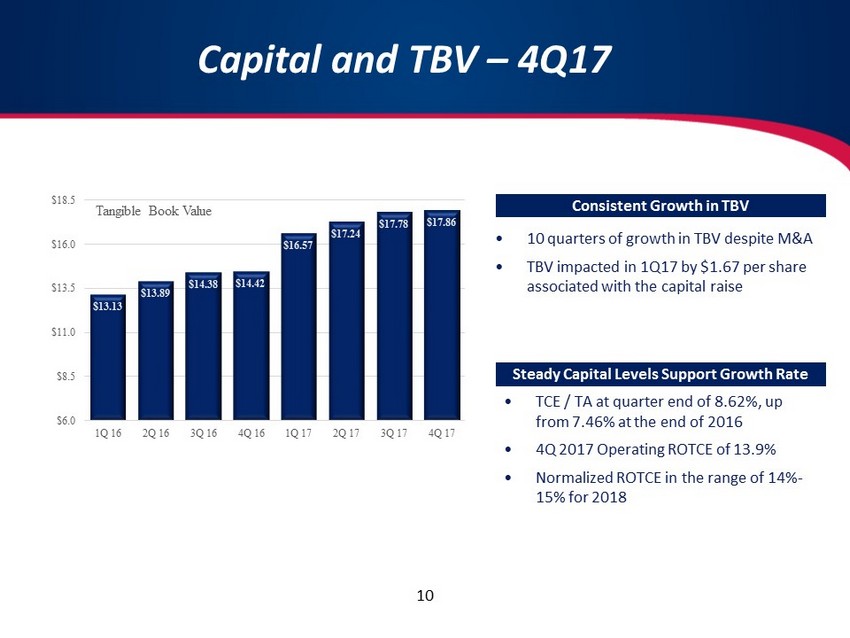
Capital and TBV – 4Q17 • 10 quarters of growth in TBV despite M&A • TBV impacted in 1Q17 by $1.67 per share associated with the capital raise Consistent Growth in TBV • TCE / TA at quarter end of 8.62%, up from 7.46% at the end of 2016 • 4Q 2017 Operating ROTCE of 13.9% • Normalized ROTCE in the range of 14% - 15% for 2018 Steady Capital Levels Support Growth Rate $13.13 $13.89 $14.38 $14.42 $16.57 $17.24 $17.78 $17.86 $6.0 $8.5 $11.0 $13.5 $16.0 $18.5 1Q 16 2Q 16 3Q 16 4Q 16 1Q 17 2Q 17 3Q 17 4Q 17 Tangible Book Value 10

Investment Rationale Attractive Multiples • Top Quartile ROA & Top Quartile Growth Rate • ROTCE’s approaching 15 % with normalized capital levels • Improving efficiency ratio at 60 % or better means incremental growth is materially more profitable Operating Performance M&A Opportunities • Disciplined Acquirer that announces deals with reliable metrics • Pending acquisitions augment organic growth and earnings momentum • Current capital position gives us significantly more flexibility in driving consideration mix and metrics • Historically trading at PE discount relative to our peers • TBV overhang eliminated with additional capital . Current TBV multiple reduced from 335 % in 4 Q 2016 to 270 % currently Peer group includes CSFL, SSB, STBZ, HOMB, OZRK, PSTB, LION, PNFP, SFNC, UCBI 11

Ameris Bancorp Press Release & Financial Highlights December 31, 2017