Attached files
| file | filename |
|---|---|
| EX-32.2 - EXHIBIT 32.2 - Limelight Networks, Inc. | llnw-12312017xex322.htm |
| EX-32.1 - EXHIBIT 32.1 - Limelight Networks, Inc. | llnw-12312017xex321.htm |
| EX-31.2 - EXHIBIT 31.2 - Limelight Networks, Inc. | llnw-12312017xex312.htm |
| EX-31.1 - EXHIBIT 31.1 - Limelight Networks, Inc. | llnw-12312017xex311.htm |
| EX-23.1 - EXHIBIT 23.1 - Limelight Networks, Inc. | llnw-12312017xex231.htm |
| EX-21.1 - EXHIBIT 21.1 - Limelight Networks, Inc. | llnw-12312017xex211.htm |
| EX-10.16 - EXHIBIT 10.16 - Limelight Networks, Inc. | llnw-12312017xex1016.htm |
UNITED STATES
SECURITIES AND EXCHANGE COMMISSION
Washington, D.C. 20549
Form 10-K
(Mark One)
þ | ANNUAL REPORT PURSUANT TO SECTION 13 OR 15(d) OF THE SECURITIES EXCHANGE ACT OF 1934 |
For the fiscal year ended December 31, 2017
OR
o | TRANSITION REPORT PURSUANT TO SECTION 13 OR 15(d) OF THE SECURITIES EXCHANGE ACT OF 1934. |
For the transition period from to
Commission file number 001-33508
Limelight Networks, Inc.
(Exact name of registrant as specified in its charter)
Delaware | 20-1677033 | |
(State or other jurisdiction of incorporation or organization) | (I.R.S. Employer Identification No.) | |
222 South Mill Avenue, 8th Floor
Tempe, AZ 85281
(Address of principal executive offices, including Zip Code)
(602) 850-5000
(Registrant’s telephone number, including area code)
Securities registered pursuant to Section 12(b) of the Act:
Title of each class | Name of each exchange on which registered | |
Common Stock, $0.001 par value | NASDAQ Global Select Market | |
Securities registered pursuant to Section 12(g) of the Act: None
Indicate by check mark if the registrant is a well-known seasoned issuer, as defined in Rule 405 of the Securities Act. Yes o No þ
Indicate by check mark if the registrant is not required to file reports pursuant to Section 13 or 15(d) of the Securities Exchange Act of 1934. Yes o No þ
Indicate by check mark whether the registrant (1) has filed all reports required to be filed by Section 13 or 15(d) of the Securities Exchange Act of 1934 during the preceding 12 months (or for such shorter period that the registrant was required to file such reports), and (2) has been subject to such filing requirements for the past 90 days. Yes þ No o
Indicate by check mark whether the registrant has submitted electronically and posted on its corporate Web site, if any, every Interactive Data File required to be submitted and posted pursuant to Rule 405 of Regulation S-T (§232.405 of this chapter) during the preceding 12 months (or for such shorter period that the registrant was required to submit and post such files). Yes þ No o
Indicate by check mark if disclosure of delinquent filers pursuant to Item 405 of Regulation S-K (§229.405 of this chapter) is not contained herein, and will not be contained, to the best of the registrant’s knowledge, in definitive proxy or information statements incorporated by reference in Part III of this Form 10-K or any amendment to this Form 10-K. o
Indicate by check mark whether the registrant is a large accelerated filer, an accelerated filer, a non-accelerated filer, a smaller reporting company, or an emerging growth company. See the definitions of “large accelerated filer,” “accelerated filer” “smaller reporting company” and "emerging growth company" in Rule 12b-2 of the Exchange Act.
Large accelerated filer o | Accelerated filer þ | Non-accelerated filer o | Smaller Reporting Company o |
Emerging Growth Company o | |||
(Do not check if a smaller reporting company) | |||
If an emerging growth company, indicate by check mark if the registrant has elected not to use the extended transition period for complying with any new or revised financial accounting standards provided pursuant to Section 13(a) of the Exchange Act. o
Indicate by check mark whether the registrant is a shell company (as defined in Rule 12b-2 of the Act). Yes o No þ
The aggregate market value of the voting and non-voting common stock held by non-affiliates of the registrant was approximately $217.5 million based on the last reported sale price of the common stock on the Nasdaq Global Select Market on June 30, 2017.
The number of shares outstanding of the registrant’s Common Stock, par value $0.001 per share, as of February 1, 2018: 110,826,546 shares.
DOCUMENTS INCORPORATED BY REFERENCE
Portions of the Proxy Statement for the Registrant’s 2018 Annual Meeting of Stockholders are incorporated by reference in Part III of this Form 10-K.
LIMELIGHT NETWORKS, INC.
ANNUAL REPORT ON FORM 10-K
For the Fiscal Year Ended December 31, 2017
TABLE OF CONTENTS
Page | ||
PART I | ||
Item 1. | ||
Item 1A. | ||
Item 1B. | ||
Item 2. | ||
Item 3. | ||
Item 4. | ||
PART II | ||
Item 5. | ||
Item 6. | ||
Item 7. | ||
Item 7A. | ||
Item 8. | ||
Item 9. | ||
Item 9A. | ||
Item 9B. | ||
PART III | ||
Item 10. | ||
Item 11. | ||
Item 12. | ||
Item 13. | ||
Item 14. | ||
PART IV | ||
Item 15. | ||
Item 16. | Form 10-K Summary | |
SPECIAL NOTE REGARDING FORWARD-LOOKING STATEMENTS
This Annual Report on Form 10-K contains forward-looking statements within the meaning of Section 27A of the Securities Act of 1933 and Section 21E of the Securities Exchange Act of 1934. All statements contained in this Annual Report on Form 10-K, other than statements of historical fact, are forward-looking statements. Forward-looking statements generally can be identified by the words “may,” “will,” “expect,” “believe,” “anticipate,” “intend,” “could,” “estimate,” or “continue,” and similar expressions. We have based these forward-looking statements largely on our current expectations and projections about future events, as well as trends that we believe may affect our financial condition, results of operations, business strategy, short-term and long-term business operations and objectives, and financial needs. These statements include, among other things:
• | our beliefs regarding delivery traffic growth trends and demands for digital content; |
• | our expectations regarding revenue, costs, expenses, gross margin, non-GAAP earnings per share, Adjusted EBITDA and capital expenditures; |
• | our plans regarding investing in our content delivery network, as well as other products and technologies; |
• | our beliefs regarding the growth of, and competition within, the content delivery industry; |
• | our beliefs regarding the growth of our business and how that impacts our liquidity and capital resources requirements; |
• | our expectations regarding headcount; |
• | the impact of certain new accounting standards and guidance as well as the time and cost of continued compliance with existing rules and standards; |
• | our plans with respect to investments in marketable securities; |
• | our expectations and strategies regarding acquisitions; |
• | our expectations regarding litigation and other pending or potential disputes; |
• | our estimations regarding taxes and belief regarding our tax reserves; |
• | our beliefs regarding the use of Non-GAAP financial measures; |
• | our approach to identifying, attracting and keeping new and existing customers, as well as our expectations regarding customer turnover; |
• | the sufficiency of our sources of funding; |
• | our belief regarding our interest rate risk; |
• | our beliefs regarding inflation risks; |
• | our beliefs regarding expense and productivity of and competition for our sales force; and |
• | our beliefs regarding the significance of our large customers. |
These forward-looking statements are subject to a number of risks, uncertainties and assumptions, including those described under the caption “Risk Factors” in Part I, Item 1A in this Annual Report on Form 10-K and those discussed in other documents we file with the Securities and Exchange Commission (SEC).
In addition, we operate in a very competitive and rapidly changing environment. New risks emerge from time to time. It is not possible for our management to predict all risks, nor can we assess the impact of all factors on our business or the extent to which any factor, or combination of factors, may cause actual results to differ materially from those contained in any forward-looking statements we may make. In light of these risks, uncertainties and assumptions, the future events and trends discussed in this Annual Report on Form 10-K may not occur and actual results could differ materially and adversely from those anticipated or implied in the forward-looking statements.
The forward-looking statements contained herein are based on our current expectations and assumptions and on information available as of the date of the filing of this Annual Report on Form 10-K. We undertake no obligation to revise or publicly release the results of any revision to these forward-looking statements, except as required by law. Given these risks and uncertainties, readers are cautioned not to place undue reliance on such forward-looking statements.
Unless expressly indicated or the context requires otherwise, the terms "Limelight," "we," "us," and "our" in this document refer to Limelight Networks, Inc., a Delaware corporation, and, where appropriate, its wholly owned subsidiaries. All information is presented in thousands, except per share amounts, customer count and where specifically noted.
1
PART I
Item 1. Business
Overview
Limelight operates a private, globally distributed, high-performance network and provides a suite of integrated services marketed as the Limelight Orchestrate Platform. These services include content delivery, video content management, website and web application acceleration, website and content security, and cloud storage services.
The services we provide help our customers optimize and deliver digital content to a wide variety of digital devices. These services provide advanced features to enable digital workflows for video publishing, content distribution for any device, and website and web application acceleration. Limelight services incorporate content and application security, file management, video transformation, distributed storage functionality, and the analytics and reporting associated with them. These services leverage our global network, which provides highly available, highly redundant storage, bandwidth, and computing resources, as well as connectivity to last-mile broadband network providers. Limelight’s high capacity, high speed private global network and distributed storage and compute capabilities are also well suited to the emerging Internet of Things (IoT) and edge compute workloads where rapid response times are needed.
We derive revenue primarily from the sale of components of the Limelight Orchestrate Platform. We also generate revenue through the sale of professional services and other infrastructure services, such as transit and rack space services. In addition, we also maintain relationships with resellers that purchase our services for resale to their end customers.
We provide our services to customers that we believe view Internet, mobile, social, and other digital initiatives as critical to their success, including traditional and emerging media companies operating in the television, music, radio, newspaper, magazine, movie, game, software, and social media industries, as well as to enterprises, technology companies, and government entities conducting business online. Our offerings enable our customers to deliver a high quality online experience and thereby improve brand perception, drive revenue, and enhance customer relationships.
We are a Delaware corporation formed in 2001. Our principal executive offices are located at 222 South Mill Avenue, 8th Floor, Tempe, Arizona 85281, and our main telephone number is (602) 850-5000. We began development of our infrastructure in 2001 and began generating meaningful revenue in 2002. We began international operations in 2004. As of December 31, 2017, we had approximately 717 active customers and had a presence in approximately 50 countries throughout the world.
We are registered as a reporting company under the Securities Exchange Act of 1934, as amended (Exchange Act). Accordingly, we file or furnish with the SEC annual reports on Form 10-K, quarterly reports on Form 10-Q, current reports on Form 8-K, and all amendments to such reports as required by the Exchange Act and the rules and regulations of the SEC. We refer to these reports as "Periodic Reports". The public may read and copy any Periodic Reports or other materials we file with the SEC at the SEC’s Public Reference Room at 100 F. Street, NE, Washington, DC 20549. Information on the operation of the Public Reference Room is available by calling 1-800-SEC-0330. In addition, the SEC maintains an Internet website that contains reports, proxy and information statements and other information regarding issuers, such as Limelight Networks, Inc., that file electronically with the SEC. The address of this website is www.sec.gov.
Our Internet website address is www.limelight.com. We make available, free of charge, on or through our Internet website our Periodic Reports and amendments to those Periodic Reports as soon as reasonably practicable after we electronically file them with the SEC. We are not, however, including the information contained on our website, or information that may be accessed through links on our website, as part of, or incorporating it by reference into, this annual report on Form 10-K.
Five Trends Driving Internet Congestion
We have identified five trends that point to an Internet of the future in which congestion may cause outages and prevent organizations from delivering the highest quality digital experiences. In this situation, the need and demand for private, global networks to deliver digital content become important. These trends are:
• | Shift to over the top (OTT) consumption for online video. Online video viewership continues to grow as does the number of connected devices for consuming content. In our September 2017 State of Online Video consumer report, we found that consumers watch approximately 5 hours and 45 minutes of online video per week on average, with Millennials far exceeding 7 hours. Viewing habits are shifting as well. There’s an increasing use of a multitude of devices to watch online video both inside and outside the home, ranging from computers and tablets to smart |
2
phones and streaming devices. This trend reflects that many top-tier content owners have either already launched their content direct-to-consumer (e.g., HBO, CBS, Showtime) or have announced plans to do so. In addition, content owners continue to join forces with media companies (e.g., Sony, Hulu, Dish Networks) to launch OTT subscription services enabling consumers to bundle together channels for a fraction of the cost of a cable subscription. As day-to-day consumption of video content shifts to Internet-based delivery, we believe this will put an increasing strain on the Internet placing additional pressure on organizations and service providers to take steps to protect the quality of the end-user experience as this increasing segment of traffic competes with other Internet activities, such as browsing websites and downloading digital content.
• | Broadcast Quality Online Video. Consumers are continuing to consume online streaming video in record numbers. Online video is rapidly growing towards becoming a primary method by which users consume video content, whether it’s via their personal computers, smartphones, tablets, smart televisions, or other connected devices. Yet, consumers continue to expect the same quality experience online as they would have in viewing broadcast television. This will put a significant burden on publishers to produce not just compelling content, but also to deliver it in a way that meets changing consumer expectations. To keep up, organizations have been forced to increase quality to provide a “broadcast-like” experience. For example, with the recent advent of 4K resolution devices, several large-scale online video providers are already streaming in this new format that requires, in most cases, four times the bandwidth of a traditional high definition stream. We believe that as more content is made available in 4K resolution (coupled with increasing sales of 4K-ready devices like televisions and computer monitors), more consumers will want to consume the higher-quality content, resulting in increased strain on Internet architecture and infrastructure. |
• | Growth of digital downloads. Consumers are becoming more accustomed to making purchases of movies, music, games, and applications digitally from a variety of retailers with the growing availability of higher bandwidth connections to connected devices. As a result, consumers accept larger download sizes. For example, releases of popular games have topped 50 gigabytes (GBs) in size. As digital purchases of massive files increase, we believe that this will cause more strain on the Internet’s infrastructure. We believe that this will result in additional pressure on organizations and service providers to take steps to avoid congestion, latency, lengthening download times, and increasingly interrupted downloads, all of which we believe would undermine an organization’s ability to deliver the best possible digital experience. |
• | Webpage size. Organizations are building more complex, interactive, and engaging digital experiences that rely heavily on imagery and multimedia content. This trend is reflected in the growing size of webpages. For example, today's average webpage requires users to download 2.5 MB worth of data, according to the HTTP-Archive, a site that tracks website performance and the technologies they use. We believe, through a highly congested Internet, these websites will become increasingly harder to deliver at the level of performance that users expect. |
• | The Internet of Things (IoT). Connected devices communicate with each other and with server-based resources via the Internet. Although it is unclear as to how much bandwidth this “background communication” will consume, as more devices become connected and begin communicating with each other and other resources, this traffic will compete with other Internet traffic such as streaming video and digital downloads. We believe IoT may complicate an organization’s ability to utilize the Internet to deliver high quality digital experiences. |
Seven Trends Illustrating Consumer Demand for Digital Content
The Internet is key for today’s digital business. Hypertext transfer protocol (HTTP) and other Internet protocols are critical to enabling organizations to digitize business processes and operations as well as provide the kinds of experiences that consumers worldwide have come to expect across a variety of devices. We believe there are seven trends that illustrate a demand for digital content, contribute to the overall usage of the Internet, increase potential congestion, and punctuate the need for a private, global network to meet the level of performance that users expect. We believe these trends are:
• | The continued growth of online video. Consumers are demanding and consuming video, music, and other forms of rich media over the Internet. According to Cisco's Visual Networking Index annual report, IP video will account for 82% of all consumer Internet traffic by 2021. Based on this trend, we expect that businesses will continue to incorporate video into their digital marketing efforts as a way to further differentiate their message from competitors and generate new opportunities for engagement. |
• | Mobile First. We believe that mobile will continue to be increasingly important as a primary method users employ to interact with online content, a position supported by our November 2017 State of The User Experience consumer research which indicated that smartphones are the most popular device for accessing online content. Mobile devices enable consumers to remain connected and engaged with an organization’s content when they are away from their |
3
primary computers or TVs and it’s clear that consumers are employing these devices more often to do so. However, in order for those consumers to remain engaged, the experience must be optimized across devices. An organization’s dynamic content and video has to be accessible regardless of device and provide the same engagement and interaction with those users.
• | The continued migration of information technology (IT) services into the cloud. Enterprises may seek to decrease infrastructure expenditures by moving to a “cloud-based” model in which application delivery and storage are available on-demand and paid for on an as-needed basis. We anticipate that the core cloud computing market will continue to grow at a rapid pace as the cloud increasingly becomes a mainstream IT strategy embraced by corporate enterprises and government agencies. According to Gartner, by 2020 the shift to cloud will affect more than $1 trillion in IT spending. The core cloud market includes platform-as-a-service (PaaS) and infrastructure-as-a-service (IaaS) offerings such as content delivery networks (CDN), as well as the cloud-delivered software used to build and manage a cloud environment. |
• | Increasing user expectations for digital experience performance. Websites are becoming increasingly complex and large, while user expectations for website performance are becoming more demanding. We anticipate that these demanding consumer expectations will drive a continued need for website and web application acceleration services. The combination of performance expectation coupled with multi-device delivery creates a considerable challenge for most organizations. |
• | Increasing need for scalable storage. The amount of data created each year has grown rapidly, and we believe this rapid growth in data production will create demand for flexible and scalable storage mechanisms to support growing libraries of digital content. We anticipate the need for cloud storage to increase because of the growing demand for video and other types of digital content. Organizations must consider their choice of storage solution carefully when the technology is part of a digital content delivery chain as the wrong selection can lead to incremental latency that can undermine digital experience performance. |
• | The evolution of digital marketing. As the global online economy has continued to expand and grow, it has become increasingly difficult for businesses to capture consumer attention. Because of this difficulty, we anticipate that marketing will continue to evolve from “broadcast advertising” to engaging with users through conversations associated with content in a variety of places including websites and social networks. We believe this kind of engagement requires that content be increasingly comprised of video and rich media, and be delivered in a manner that meets the high user expectations for the delivery and responsiveness of digital experiences. |
• | Global broadband speed increase. With each passing year, the average broadband connection speed is increasing around the world, especially as governmental agencies (such as the United States Federal Communications Commission) take an active role in ensuring that consumers have access to high-speed connections. The continued increase in speed is illustrative of consumer desire to access multimedia content (e.g. online video, game downloads, interactive web applications) through the Internet and how integral rich, digital experiences have become the way people conduct their lives on a daily basis. |
Requirements for delivering effective digital experiences
We believe that the challenges of delivering digital content, particularly related to rich media, dynamic content, and applications over the Internet to a wide variety of mobile and connected devices, have created a new set of technical, management, and economic requirements for organizations seeking to succeed in the online economy. We believe those requirements include the following:
• | Reduction of IT involvement. As businesses increasingly rely on cloud-based services they will require more intuitive web-based interfaces that enable adoption and usage of cloud-based services by the entire company or organization, regardless of location, with less direct IT support required. |
• | Security. Maintaining effective security is a challenge for any enterprise that operates an online presence. Threats, denial of service attacks, viruses, and piracy can impact online web presence in many ways, including compromising personal and sensitive information, loss of customer trust and loyalty, loss of revenue, and negative publicity and brand reputation. Businesses require services that employ a number of software and network features to mitigate the risk of unauthorized access to content and network-related attacks against web properties, digital content, and applications. There continues to be an increasing number of high profile security incidents that continue to raise the awareness, and strategic importance of, security in our industry. |
4
• | Conditional access to content. Consumers increasingly expect the ability to consume any form of media content online. To meet this expectation, traditional media companies are making their enormous libraries of content, such as television shows and movies, available for viewing online. Content providers often have regulations with respect to where they can display, or store their content, due to industry requirements or geographic location. Accordingly, companies require powerful features that enable them to control where content is stored, for how long, and in what regions it can be delivered. |
• | Ability to scale capacity to handle rapidly accelerating demand. Online businesses must scale delivery of their web presence smoothly as the quantity of their site visitors or audience increases to avoid delays for users. When a large number of users simultaneously access a particular digital content asset like a video, the operator must be able to meet that surge in demand without making users wait. Rapidly accelerating demand can be related to a single event, such as a breaking news story or seasonal shopping, or can be spread across an entire library of content, such as when a social media website surges in popularity. The continued increase in video and other rich media consumption, and the growing size of digital content objects, contributes to concerns that Internet bandwidth may be supply constrained in the future. |
• | Ability to easily publish and deliver online video. As the consumer demand for online video grows, businesses and organizations may be required to adopt video into their marketing messages. However, there are a host of complexities involved in developing and implementing a “video publishing workflow.” Businesses will require intuitive tools that enable them to manage their video portfolio, and quickly and efficiently publish and deliver their video content at scale with quality performance. Additionally, businesses will require that video content can be converted automatically for playing on any mobile device with the opportunity to integrate advertisements. |
• | Multi-device delivery. With the increasing popularity of smartphones and tablets, businesses and organizations must ensure that their content, whether dynamic web pages or video, display properly in mobile formats. However, adding this requirement to existing content publishing workflows may greatly complicate internal processes that may result in delays for making content available to end users. Additionally, because many mobile devices have separate requirements, businesses will require features for automatically delivering correctly formatted content. |
• | Reliability and Consistency. Throughout the path data must traverse to reach a user, problems with the underlying infrastructure supporting the Internet can occur. For example, servers can crash or network connections can fail. Network, datacenter, or service provider outages can mean frustrated users, lost audiences, and missed revenue opportunities. Businesses require a massively redundant network that they can depend on to ensure the reliable and consistent delivery of their digital experiences. |
Our Services
We believe our integrated suite of services, coupled with our global network, are responsive to the trends driving Internet growth and address the requirements for delivering effective digital experiences. Our primary services include the following:
• | Content delivery services improve the reliability and performance of digital content delivery by using our global network to deliver rich media files such as video, music, games, and software, or live streaming of corporate or entertainment events. We support all major formats as well as dynamic and static webpages. |
• | Mobile device media delivery services help publishers deliver properly-formatted, device-optimized live and on-demand video to almost any media-enabled device by creating multiple output formats. These services automatically transform and package the live and on demand streams at the time they are requested, creating the format needed for playback by the requesting device. |
• | Video content management services help organizations manage, publish, syndicate, analyze, and monetize video content through a cloud-based service. Services also include an extensible off-the-shelf video player for quick deployment and monetization features that enable customers to integrate advertising into the video playback experience. |
• | Performance services improve web experiences by speeding up the loading of web pages for faster action and provide consistent performance from any geography for dynamic and personalized content, online commerce transactions, and web applications. |
5
• | Cloud-based storage services provide customers with the scalable, redundant, geographically diverse storage of media and enterprise content, offering policies for global geographic placement, content workflow, and business logic controls while maintaining the highest levels of performance for object retrieval. |
• | Cloud-based content security services mitigate a variety of attacks against websites and protect against unauthorized access or theft of content. These services include protection against Distributed Denial of Service (DDoS) attacks, Web Application Firewall (WAF) protection, and conditional access controls that restrict access to digital content through rights management, geographic and IP address restriction and HTTP request and response flows. |
• | Edge services make it easy to process, analyze, and aggregate information close to where it is being generated. These edge capabilities together with Limelight’s global private network provide fast and secure infrastructure for low-latency data processing. |
Limelight Global Network
Our global network provides highly available, highly redundant storage, bandwidth, and computing resources in support of our services and solutions. This architecture, managed by our proprietary software, automatically responds to network and datacenter outages and disruptions. All of our delivery locations are interconnected via our global network and also connected to multiple Internet backbone and broadband Internet service provider (ISP) networks. This global network has three main features:
• | Densely configured, high-capacity. Our global network consists of dense clusters of specially configured servers organized into large, multi-tiered, logical delivery locations. The extensive storage capacity of these logical locations leads to fewer cache misses to our network of servers than we believe would occur in other CDN architectures and provides significant scalability and responsiveness to surges in end-user demand. The clustering of many high-performance CPUs provides us with aggregated computational power. |
• | Many connections to other networks. Our logical locations are directly connected to hundreds of ISPs and other user access networks, which are computer networks connected to end-users. In addition, for dedicated connectivity between our logical locations, we operate a dedicated fiber optic backbone and metro area networks. Also, our infrastructure has multiple connections to the Internet. In combination, these connections enable us to frequently bypass the often-congested public Internet, improving the delivery speed of content. |
• | Intelligent software to manage the network. We have developed proprietary software that manages our global network. This software manages, among other things, the delivery of digital content, the retrieval of dynamic content, storage and retrieval of objects, activity logging, and information reporting. |
We continue to expand our architecture through the use of “smart POPs.” These smaller POPs are less dense than our traditional densely-configured metro POPs and are designed to be quickly and more cost-effectively deployed within existing networks. In addition, we continue to explore and implement ways to improve throughput and efficiency of our infrastructure through the use of advanced technologies, hardware tuning, and software refinement that help us deliver more content, more quickly, for less cost.
Segment and Geographic Information
We operate in one industry segment, providing content delivery and related services and solutions for global businesses to help them deliver their digital content across Internet, mobile, and social channels. We operate in three geographic areas - Americas; Europe, Middle East and Africa (EMEA); and Asia Pacific. For the years ended December 31, 2017, 2016, and 2015, approximately 37%, 40%, and 40%, respectively, of our total revenue was derived from our operations outside the Americas. For the years ended December 31, 2017, 2016, and 2015, we derived approximately 55%, 46%, and 48%, respectively of our international revenue from EMEA and approximately 45%, 54%, and 52%, respectively, of our international revenue from Asia Pacific. During 2017, we had three countries, Japan, the United Kingdom, and the United States that represented more than 10% of our total revenues. During 2016 and 2015, we had two countries, Japan and the United States, that represented more than 10% of our total revenues. For a description of risks attendant to our foreign operations, see the section titled “Risk Factors” set forth in Part 1, Item 1A of this annual report on Form 10-K. For more segment and geographic information, including revenue from customers, a measure of profit or loss, and total assets for each of the last three fiscal years, see our Consolidated Financial Statements included in this annual report on Form 10-K, including Note 21 thereto.
6
Sales, Service and Marketing
Our sales and service professionals are located in five offices in the United States with an additional nine office locations in EMEA and Asia Pacific. We target media, high tech, software, gaming, enterprise, and other organizations for which the delivery of digital content is critical to the success of their business.
Our sales and service organization includes employees in telesales and field sales, professional services, account management, and solutions engineering. As of December 31, 2017, we had approximately 130 employees in our sales organization. Our ability to achieve revenue growth in the future will depend in large part on whether we successfully recruit, train, and retain sufficient sales, technical, and global services personnel, and how well we establish and maintain our distribution and reseller relationships. We believe that the complexity of our services will continue to require highly trained global sales and services personnel.
To support our sales efforts and promote the Limelight brand, we conduct marketing programs. Our marketing strategies include an active public relations campaign, advertisements, events and trade shows, digital marketing activities, strategic alliances, and on-going customer communication programs. As of December 31, 2017, we had 26 employees in our global marketing organization.
Customers
Our customers operate in the media, entertainment, gaming, software, enterprise, retail and other sectors. As of December 31, 2017, we had approximately 717 active customers worldwide, including many widely recognized names in the fields of online video, digital music, news media, games, rich media applications, and software delivery.
For the year ended December 31, 2017, we had one customer, Amazon, who accounted for 10% or more of our total revenue. For the years ended December 31, 2016 and 2015, respectively, we had no customer who accounted for 10% or more of our total revenue. In the past, the customers that comprise our top 20 customers have continually changed, and our large customers may not continue to be as significant going forward as they have been in the past.
From time to time we have discontinued service to customers for non-payment. Although we did not receive continuing revenue from these former customers, these changes provided for a stronger mix of customers across our base, decreased our days sales outstanding, and allowed us to recoup network capacity to help meet future growth needs. We continue to focus on acquiring and retaining high quality customers across all market segments.
Competition
We operate in the digital content delivery market, which is rapidly evolving and highly competitive. We expect this competitive environment to continue. We believe that the principal competitive factors affecting this market fall into four primary categories: management, delivery, security, and metrics.
Management for digital content is measured by the features available for managing, publishing, and delivering digital content across multiple channels and to multiple devices.
Delivery for digital content is measured by scale and performance. We measure scale by the number of physical locations in the network and the capabilities of the network to deliver large amounts of content to locations around the world and to absorb unplanned spikes in requests for content. We measure performance by file delivery time, end-user media consumption rates, quality of the end-user experience, and scalability, both in terms of average capacity and special event capacity.
Security for digital content is measured by the features available for addressing attacks against digital properties (e.g., websites) and protecting content from unauthorized view, transmission, or access.
In addition, metrics around the ability to efficiently locate and deliver web content, the ease of implementation, the ability to customize systems for unique content types and mixes, reliability, security, consumer engagement, and cost efficiency continue to be key criteria for this market.
The market for digital content delivery is increasingly complex and can require multiple vendors to provide customers with a complete set of tools and services to manage and deliver all of their digital content to all audiences as part of a global digital presence. We believe that in those situations where multiple vendors are required, Limelight is one of the few CDNs with the scale, performance, and reach required to deliver digital content to global audiences. We also believe the combination of cloud-based software and infrastructure/bandwidth associated with our physical global network solve multiple challenges for
7
customers by removing the need to install, manage, or provision software and hardware to satisfy the requirements for storing and delivering digital content.
We believe our future success will depend on our ability to continue to enhance the performance, integration, and functionality of our existing suite of services and of our global network, and on our ability to add additional services and functionality to meet the market’s increasing expectations regarding digital content delivery and consumer engagement.
The global digital content delivery market is fragmented, but we face primary competition from Akamai, Level 3, Amazon, CDNetworks, Fastly, Highwinds and Verizon Digital Media Services.
The principal methods of competition in this market include scale, performance, service, ease of use, product features, and price. We believe we are competitive across these dimensions. Product feature competition is intense, requiring continuous investment in innovation.
Research and Development
Our research and development organization is responsible for the design, development, testing, and certification of the software, hardware, and network architecture of our global network and support of our content delivery and other Limelight Orchestrate Platform solutions. As of December 31, 2017, we had 162 employees and employee equivalents in our research and development group. Our research and development personnel are primarily located in Boston, Massachusetts; Grand Rapids, Michigan; Seattle, Washington; Lviv, Ukraine, and at our headquarters in Tempe, Arizona. Our engineering efforts support product development across all of our service areas, as well as innovation related to the global network itself. We test our services to ensure scalability in times of peak demand. We use internally developed and third-party software to monitor and to improve the performance of our network in the major Internet consumer markets around the world where we provide services for our customers. Our research and development expenses were $25,342, $24,335, and $28,016 in 2017, 2016, and 2015, respectively, including stock-based compensation expense of $2,322, $2,104, and $2,236 in 2017, 2016, and 2015, respectively.
Intellectual Property
Our success depends in part upon our ability to protect our core technology and other intellectual capital. To accomplish this, we rely on a combination of intellectual property rights, including patents, trade secrets, copyrights, trademarks, domain registrations, and contractual protections.
As of December 31, 2017, we had received 136 patents in the United States, expiring between 2023 and 2034, and we had 2 U.S. patent applications pending. We do not have any issued patents in foreign countries. We do not know whether any of our patent applications will result in the issuance of a patent or whether the examination process will require us to narrow our claims. Any patents that may be issued to us may be contested, circumvented, found unenforceable or invalidated, and we may not be able to prevent third parties from infringing them. Therefore, we cannot predict the exact effect of having a patent with certainty.
As of December 31, 2017, we had received four trademarks in the United States. Our name, Limelight Networks, has been filed for multiple classes in the United States, Australia, Canada, the European Union, India, Japan, South Korea and Singapore. We have 27 non United States trademarks registered. There is a risk that pending trademark applications may not issue, and that those trademarks that have issued may be challenged by others who believe they have superior rights to the marks.
We generally control access to and use of our proprietary software and other confidential information through the use of internal and external controls, including physical and electronic security, contractual protections with employees, contractors, customers and partners, and domestic and foreign copyright laws.
Despite our efforts to protect our trade secrets and proprietary rights and other intellectual property rights by following sound business practices, licenses, and confidentiality agreements, there is risk that unauthorized parties may still copy or otherwise obtain and use our software and technology. In addition, we have been expanding our international operations, and effective patent, copyright, trademark, and trade secret protection may not be available or may be limited in foreign countries. Further, expansion of our business with additional employees, locations, and legal jurisdictions may create greater risk that our trade secrets and proprietary rights will be harmed. If we fail to effectively protect our intellectual property and other proprietary rights, our business could be harmed.
Third parties could claim that our products or technologies infringe their proprietary rights. The Internet content delivery services industry is characterized by the existence of a large number of patents, trademarks, and copyrights and by frequent litigation based on allegations of infringement or other violations of intellectual property rights. We expect that infringement claims may further increase as the number of products, services, and competitors in our market increases. Further,
8
continued success in this market may provide an impetus to those who might use intellectual property litigation as a weapon against us. We have been the target of intellectual property infringement claims in the past and may be the target of such claims by third parties in the future.
During 2017, we were party to the 2016 Akamai Litigations, which alleged that aspects of our content delivery network infringed upon third party patent rights. More information about the cases are described in further detail under Note 11 “Contingencies - Legal Matters" of the Notes to Consolidated Financial Statements included in Part II, Item 8 of this annual report on Form 10-K.
Employees
As of December 31, 2017, we had 533 employees and employee equivalents. Of these, 364 are based in the Americas, 120 are based in EMEA and 49 are based in Asia Pacific. None of our employees are represented by a labor union, and we have not experienced any work stoppages to date. We consider the relationships with our employees to be positive.
Executive Officers of the Registrant
Our executive officers and their ages and positions as of February 1, 2017 are as follows:
Name | Age | Position |
Robert A. Lento | 56 | President, Chief Executive Officer and Director |
Sajid Malhotra | 54 | Chief Financial Officer |
Michael D. DiSanto | 45 | Chief Administrative and Legal Officer and Secretary |
Kurt Silverman | 61 | Senior Vice President, Development & Delivery |
George E. Vonderhaar | 57 | Chief Sales Officer |
Robert A. Lento has served as our Chief Executive Officer since November 2012 and has served as a member of our board of directors since January 2013. Prior to joining us, Mr. Lento was a senior sales executive at Convergys Corporation, a provider of customer management services, from July 1998 to May 2012, most recently serving as President - Information Management Division from September 2007 to May 2012. Prior to that, from 1997 to 1998, Mr. Lento served as President of LAN Systems for Donnelly Enterprise Solutions, Inc., a provider of information management solutions. From 1989 to 1996, Mr. Lento served in leadership positions at ENTEX Information Services, Inc., a provider of computing infrastructure services. Mr. Lento received a B.S. in Management from the State University of New York.
Sajid Malhotra has served as our Chief Financial Officer since April 2016. Mr. Malhotra has also served as our Interim Chief Financial Officer from December 2015 to April 2016, Chief Strategy Officer from June 2015 to December 2015 and was our Senior Vice President, Strategy, Facilities, Investor Relations and Procurement from March 2014 to June 2015. Prior to joining us, from September 2012 to March 2013, Mr. Malhotra was an independent consultant focused on strategic and financial consulting, communication, and value creation. Prior to that, from 2006 to 2012, Mr. Malhotra was the Senior Vice President of Strategy, Marketing and Mergers and Acquisitions for Convergys Corporation. Prior to joining Convergys, Mr. Malhotra held several senior executive positions with NCR Corporation and AT&T. Mr. Malhotra earned his bachelor’s degree in computer science and a master’s degree of business administration in finance from PACE University in New York.
Michael D. DiSanto has served as our Senior Vice President, Chief Administrative and Legal Officer and Secretary since April 2015. Prior to joining us, Mr. DiSanto was a partner at the law firm Bingham McCutchen LLP from 2013 to 2014. From 2010 to 2013, Mr. DiSanto was a partner at the law firm Dinsmore & Shohl LLP. From 2008 to 2010, Mr. DiSanto was a partner at the law firm Reed Smith. Mr. DiSanto received a B.A. from Vanderbilt University and his J.D. from Santa Clara University School of Law.
Kurt Silverman has served as our Senior Vice President, Development & Delivery since September 2013. Prior to joining Limelight, Mr. Silverman was CEO and President of Slashsoft Corp., a strategic technology consulting firm for large scale real time systems from May 2012 until September 2013. Prior to that, Mr. Silverman served as SVP of Development and Delivery for Convergys Information Management Group from August 2011 to May 2012. Prior to that, Mr. Silverman held multiple executive management positions, including most recently as Global CTO and SVP Large Global Accounts at Comverse Networks, Inc., CTO and SVP R&D at CSG International, CTO & VP at Lucent/Bell Labs, and VP Development at Kenan Systems Corporation. Mr. Silverman received both a B.S. and M.S from the Massachusetts Institute of Technology.
George E. Vonderhaar has served as our Chief Sales Officer since January 2013. Prior to joining us, Mr. Vonderhaar served in various capacities for Convergys Corporation, a provider of customer management services, from 1984 through 2012, including as Senior Vice President, General Manager - Cable and Satellite from January 2011 until the division was acquired by
9
NEC Corporation in May 2012, where Mr. Vonderhaar then served as Vice President, General Manager North America Cable from May 2012 to July 2012. Mr. Vonderhaar also was Senior Vice President - Human Resources Management at Convergys Corporation from April 2006 through June 2010, when the Human Resources Outsourcing division was acquired by NorthgateArinso, where Mr. Vonderhaar then served as Vice President, Client Services and General Manager from June 2010 to December 2010. Mr. Vonderhaar also served as General Manager - Mobile Cable Solutions Group at Convergys Corporation from November 2004 to April 2006. Mr. Vonderhaar received a B.S. in Business Administration from Marquette University.
Item 1A. Risk Factors
Investing in our common stock involves a high degree of risk. You should carefully consider the risks and uncertainties described below, together with all of the other information in this Annual Report on Form 10-K, including the section titled “Management’s Discussion and Analysis of Financial Condition and Results of Operations” in Part II, Item 7, and our consolidated financial statements and related notes, before making a decision to invest in our common stock. The risks and uncertainties described below may not be the only ones we face. If any of the risks actually occur, our business, financial condition, operating results and prospects could be materially and adversely affected. In that event, the market price of our common stock could decline, and you could lose part or all of your investment. All information is presented in thousands, except per share amounts, customer count, head count and where specifically noted.
Risks Related to Our Business
We currently face competition from established competitors and may face competition from others in the future.
We compete in markets that are intensely competitive, rapidly changing and characterized by frequently declining prices. In these markets, vendors offer a wide range of alternate solutions. We have experienced and expect to continue to experience increased competition on price, features, functionality, integration and other factors. Several of our current competitors, as well as a number of our potential competitors, have longer operating histories, greater name recognition, broader customer relationships and industry alliances, and substantially greater financial, technical and marketing resources than we do. As a consequence of the competitive dynamics in our markets, we have experienced reductions in our prices, and an increased requirement for product advancement and innovation in order to remain competitive, which in turn have adversely affected and may continue to adversely affect our revenue, gross margin and operating results.
Our primary competitors for the content delivery service offering of our Orchestrate Platform include Akamai, Level 3, Amazon, Fastly, CDNetworks, Highwinds and Verizon Digital Media Services. In addition, a number of companies have recently entered or are currently attempting to enter our market, either directly or indirectly, as a result of the growth in the content delivery market. These new entrants include companies that have built internal content delivery networks to solely deliver their own traffic, rather than relying solely, largely or in part on content delivery specialists, such as us. Some of these new entrants may become significant competitors in the future. Given the relative ease by which customers typically can switch among content delivery service providers, differentiated offerings or pricing by competitors could lead to a rapid loss of customers. Some of our current or potential competitors may bundle their offerings with other services, software or hardware in a manner that may discourage content providers from purchasing the services that we offer. In addition, we face different market characteristics and competition with local content delivery service providers as we expand internationally. Many of these international competitors are very well positioned within their local markets. Increased competition could result in price reductions and revenue shortfalls, loss of customers and loss of market share, which could harm our business, financial condition and results of operations.
We face different competitors for the other service offerings of our Orchestrate Platform. However, the competitive landscape is different from content delivery in this area in that the process of changing vendors can be more costly and complicated for the customer, which could make it difficult for us to attract new customers and increase our market share.
Several of our competitors have greater financial and sales resources than we do. Many have been offering similar services in the markets in which we compete longer than we have. We may not be able to successfully compete against these or new competitors. If we are unable to increase our customer base and increase our market share, our business, financial condition and results of operations may suffer.
Any unplanned interruption or degradation in the functioning or availability of our network or services, or attacks on or disruptions to our internal information technology systems, could lead to increased costs, a significant decline in our revenue and harm to our reputation.
Our business is dependent on providing our customers with fast, efficient, and reliable distribution of content delivery and digital asset management services over the Internet every minute of every day. Many of our customers depend primarily or
10
exclusively on our services to operate their businesses. Consequently, any disruption, or substantial and extensive degradation, of our services could have a material impact on our customers’ businesses. Our network or services could be disrupted by numerous events, including natural disasters, failure or refusal of our third-party network providers to provide the necessary capacity or access, failure of our software or global network infrastructure and power losses. In addition, we deploy our servers in third-party co-location facilities, and these third-party co-location providers could experience system outages or other disruptions that could constrain our ability to deliver our services. We may also experience disruptions caused by software viruses, unauthorized hacking of our systems, security breaches or other cyberattacks by unauthorized users. Any hacking of our systems or other cyberattacks could lead to the unauthorized release of confidential information that could damage our customers’ business and reputation, as well as our own. The economic costs to us to eliminate or alleviate cyber or other security problems, viruses, worms, malicious software programs, and other security vulnerabilities could be significant, and our efforts to address these problems may not be successful and could result in interruptions, delays, cessation of service, and loss of existing or potential customers. In addition, our release of a security-related solution may increase our visibility as a security-focused company and make us a more attractive target for attacks on our infrastructure intended to steal information about our technology, financial data, or customer information or take other actions that would be damaging to our customers and us.
We could experience a significant, unplanned disruption, or substantial and extensive degradation of our services, or our network may fail in the future. Despite our significant infrastructure investments, we may have insufficient communications and server capacity to address these or other disruptions, which could result in interruptions in our services. Any widespread interruption or substantial and extensive degradation in the functioning of our Orchestrate Platform services for any reason would reduce our revenue and could harm our business and results of operations. If such a widespread interruption occurred, or if we failed to deliver content to users as expected during a high-profile media event, game release or other well-publicized circumstance, our reputation could be damaged severely. Moreover, any disruptions, significant degradation, cybersecurity threats, security breaches, or attacks on our internal information technology systems could undermine confidence in our services and cause us to lose customers or make it more difficult to attract new ones, either of which could harm our business and results of operations.
We have a history of losses and we may not achieve or maintain profitability in the future.
Since 2006, we have been profitable only one year, which was as a result of a reversal of a significant reserve for litigation. We incur significant share-based compensation expense, which has substantial impact on our results of operations. We have also incurred, and may continue to incur, significant costs associated with litigation. Our share-based compensation expense and any material ongoing litigation costs could adversely affect our ability to achieve and maintain profitability in the future.
We also may not achieve sufficient revenue to achieve or maintain profitability and thus may continue to incur losses in the future for a number of reasons, including, among others:
• | slowing demand for our services; |
• | increasing competition and competitive pricing pressures; |
• | any inability to provide our services in a cost-effective manner; |
• | the incurrence of unforeseen expenses, difficulties, complications and delays; and |
• | other risks described in this report. |
If we fail to achieve and maintain profitability, the price of our common stock could decline, and our business, financial condition and results of operations could suffer.
If we are unable to sell our services at acceptable prices relative to our costs, our revenue and gross margins will decrease and our business and financial results will suffer.
Prices for content delivery services have fallen in recent years and are likely to fall further in the future. We have invested significant amounts in purchasing capital equipment as part of our effort to increase the capacity of our global content delivery network. Our investments in our infrastructure are based upon our assumptions regarding future demand, as well as prices that we will be able to charge for our services. These assumptions may prove to be wrong. If the price that we are able to charge customers to deliver their content falls to a greater extent than we anticipate, if we over-estimate future demand for our services, or if our costs to deliver our services do not fall commensurate with any future price declines, we may not be able to achieve acceptable rates of return on our infrastructure investments, and our gross profit and results of operations may suffer dramatically.
As we further expand our global network and the Orchestrate Platform, and as we refresh our network equipment, we are dependent on significant future growth in demand for our services to justify additional capital expenditures. If we fail to
11
generate significant additional demand for our services, our results of operations will suffer, and we may fail to achieve planned or expected financial results. There are numerous factors that could, alone or in combination with other factors, impede our ability to increase revenue, moderate expenses or maintain gross margins, including:
• | continued price declines arising from significant competition; |
• | increasing settlement fees for certain peering relationships; |
• | failure to increase sales of our Orchestrate Platform services; |
• | increases in electricity, bandwidth and rack space costs or other operating expenses, and failure to achieve decreases in these costs and expenses relative to decreases in the prices we can charge for our Orchestrate Platform services and products; |
• | failure of our current and planned services and software to operate as expected; |
• | loss of any significant customers or loss of existing customers at a rate greater than our increase in new customers or our sales to existing customers; |
• | failure to increase sales of our Orchestrate Platform services to current customers as a result of their ability to reduce their monthly usage of our services to their minimum monthly contractual commitment; |
• | failure of a significant number of customers to pay our fees on a timely basis or at all or to continue to purchase our Orchestrate Platform services in accordance with their contractual commitments; and |
• | inability to attract high quality customers to purchase and implement our current and planned services. |
A significant portion of our revenue is derived collectively from our video content management services, website and web application acceleration services, cloud security and cloud storage services. These services tend to have higher gross margins than our content delivery services. We may not be able to achieve the growth rates in revenue from such services that we or our investors expect or have experienced in the past. If we are unable to achieve the growth rates in revenue that we expect for these service offerings, our revenue and operating results could be significantly and negatively affected.
Our ability to use our net operating losses to offset future taxable income may be subject to certain limitations.
Our ability to use our net operating losses to offset future taxable income may be subject to certain limitations. As of December 31, 2017, we had federal and state net operating loss carryforwards, or NOLs, of $176,000 and $115,500, respectively, due to prior period losses. In general, under Section 382 of the Internal Revenue Code of 1986, as amended, or the Code, a corporation that undergoes an “ownership change” can be subject to limitations on its ability to utilize its NOLs to offset future taxable income. Our existing NOLs may be subject to limitations arising from past ownership changes. Future changes in our stock ownership, some of which are outside of our control, could result in an ownership change under Section 382 of the Code. In addition, under the Tax Cuts and Jobs Act (the Tax Act), the amount of post 2017 NOLs that we are permitted to deduct in any taxable year is limited to 80% of our taxable income in such year, where taxable income is determined without regard to the NOL deduction itself. In addition, the Tax Act generally eliminates the ability to carry back any NOL to prior taxable years, while allowing post 2017 unused NOLs to be carried forward indefinitely. There is a risk that due to changes under the Tax Act, regulatory changes, or other unforeseen reasons, our existing NOLs could expire or otherwise be unavailable to offset future income tax liabilities. For these reasons, we may not be able to realize a tax benefit from the use of our NOLs, whether or not we attain profitability.
Our involvement in litigation may have a material adverse effect on our financial condition and operations.
We are currently involved in multiple intellectual property lawsuits (see discussion of such lawsuits in Note 11 "Contingencies - Legal Matters" of the Notes to Consolidated Financial Statements included in Part II, Item 8 of this annual report on Form 10-K).
The outcome of all litigation, including intellectual property litigation, is inherently unpredictable. If we are ultimately held liable for patent infringement in the Akamai and XO Litigation, it could seriously impact our ability to conduct our business and to offer our products and services to our customers. For example, a permanent injunction could prevent us from offering one or more of our current or planned services, which could impact the viability of those portions of our business. Similarly, if we are ultimately held liable for patent infringement in the 2016 Akamai Litigation, one or more of our products and services could be adversely affected. Any such finding of infringement in either case could also harm our revenue, expenses, market share, reputation, liquidity and overall financial position.
Further, if we are unsuccessful in asserting our claims in the Akamai and XO Litigation, our rights to enforce the intellectual property asserted by us may be impaired or we could lose some or all of our rights to such intellectual property. Similarly, if we are unsuccessful with our counterclaims of patent infringement in the 2016 Akamai Litigation, our rights to enforce the intellectual property asserted by us in that case may be impaired or we could lose some or all of our rights to such intellectual property.
12
We are from time to time party to other lawsuits in addition to that described above. The expenses of defending these lawsuits, particularly fees paid to our lawyers and expert consultants, have been significant to date. If the cost of prosecuting or defending current or future lawsuits continues to be significant, it may continue to adversely affect our operating results during the pendency of such lawsuits. Lawsuits also require a diversion of management and technical personnel time and attention away from other activities to pursue the defense or prosecution of such matters. In addition, adverse rulings in such lawsuits either alone or cumulatively may have an adverse impact on our revenue, expenses, market share, reputation, liquidity and financial condition.
If we are required to seek funding, such funding may not be available on acceptable terms or at all.
We may need to obtain funding due to a number of factors, including a shortfall in revenue, increased expenses, final adverse judgments in litigation matters, increased investment in capital equipment or the acquisition of significant businesses or technologies. We believe that our cash, cash equivalents and marketable securities classified as current plus cash from operations will be sufficient to fund our operations and proposed capital expenditures for at least the next 12 months. However, we may need or desire funding before such time. If we do need to obtain funding, it may not be available on commercially reasonable terms or at all. If we are unable to obtain sufficient funding, our business would be harmed. Even if we were able to find outside funding sources, we might be required to issue securities in a transaction that could be highly dilutive to our investors or we may be required to issue securities with greater rights than the securities we have outstanding today. We might also be required to take other actions that could lessen the value of our common stock, including borrowing money on terms that are not favorable to us. If we are unable to generate or raise capital that is sufficient to fund our operations, we may be required to curtail operations, reduce our capabilities or cease operations in certain jurisdictions or completely.
We may have difficulty scaling and adapting our existing architecture to accommodate increased traffic and technology advances or changing business requirements. This could lead to the loss of customers and cause us to incur unexpected expenses to make network improvements.
Our content delivery and other Orchestrate Platform services are highly complex and are designed to be deployed in and across numerous large and complex networks. Our global network infrastructure has to perform well and be reliable for us to be successful. The greater the user traffic and the greater the complexity of our solutions and services, the more resources we will need to invest in additional infrastructure and support. Further, as a result of the ’703 Litigation, we made significant investment in designing and implementing changes to our network architecture. We have spent and expect to continue to spend substantial amounts on the purchase and lease of equipment and data centers and the upgrade of our technology and network infrastructure to handle increased traffic over our network, implement changes to our network architecture and integrate existing solutions and to roll out new solutions and services. This expansion is expensive and complex and could result in inefficiencies, operational failures or defects in our network and related software. If we do not implement such changes or expand successfully, or if we experience inefficiencies and operational failures, the quality of our solutions and services and user experience could decline. From time to time, we have needed to correct errors and defects in our software or in other aspects of our network. In the future, there may be additional errors and defects that may harm our ability to deliver our services, including errors and defects originating with third party networks or software on which we rely. These occurrences could damage our reputation and lead to the loss of current and potential customers, which would harm our operating results and financial condition. We must continuously upgrade our infrastructure in order to keep pace with our customers’ evolving demands. Cost increases or the failure to accommodate increased traffic or these evolving business demands without disruption could harm our operating results and financial condition.
If we are unable to develop new services and enhancements to existing services or fail to predict and respond to emerging technological trends and customers’ changing needs, our operating results and market share may suffer.
The market for our Orchestrate Platform services is characterized by rapidly changing technology, evolving industry standards, and new product and service introductions. Our operating results depend on our ability to understand user preferences or predict industry changes. Our operating results also depend on our ability to modify our solutions and services on a timely basis or develop and introduce new services into existing and emerging markets. The process of developing new technologies is complex and uncertain. We must commit significant resources to developing new services or enhancements to our existing services before knowing whether our investments will result in services the market will accept. Furthermore, we may not successfully execute our technology initiatives because of errors in planning or timing, technical hurdles that we fail to overcome in a timely fashion, misunderstandings about market demand or a lack of appropriate resources. As prices for content delivery services fall, we will increasingly rely on new product offerings and other Orchestrate Platform service offerings to maintain or increase our gross margins. Failures in execution, delays in bringing new or improved products or services to market, failure to effectively integrate service offerings, or market acceptance of new services we introduce could result in competitors providing those solutions before we do, which could lead to loss of market share, revenue and earnings.
13
We depend on a limited number of customers for a substantial portion of our revenue in any fiscal period, and the loss of, or a significant shortfall in demand from, these customers could significantly harm our results of operations.
During any given fiscal period, a relatively small number of customers typically account for a significant percentage of our revenue. For the year ended December 31, 2017, sales to our top 20 customers accounted for approximately 66% of our total revenue. During the year ended December 31, 2017, we had one customer, Amazon, who represented 10% or more of our total revenue.
In the past, the customers that comprised our top 20 customers have continually changed, and we also have experienced significant fluctuations in our individual customers’ usage of, or decreased usage of, our services. As a consequence, we may not be able to adjust our expenses in the short term to address the unanticipated loss of a large customer during any particular period. As such, we may experience significant, unanticipated fluctuations in our operating results that may cause us to not meet our expectations or those of stock market analysts, which could cause our stock price to decline.
Rapidly evolving technologies or new business models could cause demand for our Orchestrate Platform services to decline or could cause these services to become obsolete.
Customers, potential customers or third parties may develop technological or business model innovations that address digital delivery requirements in a manner that is, or is perceived to be, equivalent or superior to our Orchestrate Platform service offerings. This is particularly true as our customers increase their operations and begin expending greater resources on delivering their content using third party solutions. If we fail to offer content delivery, video content management and other related services that are competitive to in-sourced solutions, we may lose additional customers or fail to attract customers that may consider pursuing this in-sourced approach, and our business and financial results would suffer.
If competitors introduce new products or services that compete with or surpass the quality or the price or performance of our services, we may be unable to renew our agreements with existing customers or attract new customers at the prices and levels that allow us to generate attractive rates of return on our investment. We may not anticipate such developments and may be unable to adequately compete with these potential solutions. In addition, our customers’ business models may change in ways that we do not anticipate, and these changes could reduce or eliminate our customers’ needs for our services. If this occurred, we could lose customers or potential customers, and our business and financial results would suffer.
As a result of these or similar potential developments, it is possible that competitive dynamics in our market may require us to reduce our prices faster than we anticipate, which could harm our revenue, gross margin and operating results.
Failure to effectively enhance our sales capabilities could harm our ability to increase our customer base and achieve broader market acceptance of our services.
Increasing our customer base and achieving broader market acceptance of our services will depend to a significant extent on our ability to enhance our sales and marketing operations. We have a concentration of our sales force at our headquarters in Tempe, Arizona, but we also have a widely deployed field sales force. We have aligned our sales resources to improve our sales productivity and efficiency and to bring our sales personnel closer to our current and potential customers. Adjustments to our sales force have been and will continue to be expensive and could cause some near-term productivity impairments. As a result, we may not be successful in improving the productivity and efficiency of our sales force, which could cause our results of operations to suffer.
We believe that there is significant competition for both inside and direct sales personnel with the sales skills and technical knowledge that we require. Our ability to achieve significant growth in revenue in the future will depend, in large part, on our success in recruiting, training and retaining sufficient numbers of inside and direct sales personnel. New hires require significant training and, in most cases, take a significant period of time before they achieve full productivity. Our recent hires and planned hires may not become as productive as we would like, and we may be unable to hire or retain sufficient numbers of qualified individuals in the future in the markets where we do business. Our business will be seriously harmed if our sales force productivity efforts do not generate a corresponding significant increase in revenue.
Many of our significant current and potential customers are pursuing emerging or unproven business models, which, if unsuccessful, or ineffective at monetizing delivery of their content, could lead to a substantial decline in demand for our content delivery and other Orchestrate Platform services.
Because the proliferation of broadband Internet connections and the subsequent monetization of content libraries for distribution to Internet users are relatively recent phenomena, many of our customers’ business models that center on the delivery of rich media and other content to users remain unproven. Some of our customers will not be successful in selling advertising, subscriptions, or otherwise monetizing the content we deliver on their behalf and consequently may not be
14
successful in creating a profitable business model. This will result in some of our customers discontinuing their Internet or web-based business operations and discontinuing use of our services and solutions. Further, any deterioration and related uncertainty in the global financial markets and economy could result in, among other things, reductions in available capital and liquidity from banks and other providers of credit, fluctuations in equity and currency values worldwide, and concerns that portions of the worldwide economy may be in a prolonged recessionary period. Any one or more of these occurrences could materially adversely impact our customers’ access to capital or willingness to spend capital on our services or, in some cases, ultimately cause the customer to file for protection from creditors under applicable insolvency or bankruptcy laws or simply go out of business. This uncertainty may also impact our customers’ levels of cash liquidity, which could affect their ability or willingness to timely pay for services that they will order or have already ordered from us. From time to time we discontinue service to customers for non-payment of services. We expect further customers may discontinue operations or not be willing or able to pay for services that they have ordered from us. Further loss of customers may adversely affect our financial results.
If we are unable to attract new customers or to retain our existing customers, our revenue could be lower than expected and our operating results may suffer.
To increase our revenue, we must add new customers and sell additional services to existing customers and encourage existing customers to increase their usage levels. If our existing and prospective customers do not perceive our services to be of sufficiently high value and quality, we may not be able to retain our current customers or attract new customers. We sell our services pursuant to service agreements that generally include some form of financial minimum commitment. Our customers have no obligation to renew their contracts for our services after the expiration of their initial commitment, and these service agreements may not be renewed at the same or higher level of service, if at all. Moreover, under some circumstances, some of our customers have the right to cancel their service agreements prior to the expiration of the terms of their agreements. Aside from minimum financial commitments, customers are not obligated to use our services for any particular type or amount of traffic. These facts, in addition to the changing competitive landscape in our market, means that we cannot accurately predict future customer renewal rates or usage rates. Our customers’ renewal rates may decline or fluctuate as a result of a number of factors, including:
• | their satisfaction or dissatisfaction with our services; |
• | the quality and reliability of our content delivery network; |
• | the prices of our services; |
• | the prices of services offered by our competitors; |
• | discontinuation by our customers of their Internet or web-based content distribution business; |
• | mergers and acquisitions affecting our customer base; and |
• | reductions in our customers’ spending levels. |
If our customers do not renew their service agreements with us, or if they renew on less favorable terms, our revenue may decline and our business may suffer. Similarly, our customer agreements often provide for minimum commitments that are often significantly below our customers’ historical usage levels. Consequently, even if we have agreements with our customers to use our services, these customers could significantly curtail their usage without incurring any penalties under our agreements. In this event, our revenue would be lower than expected and our operating results could suffer.
It also is an important component of our growth strategy to market our services and solutions to particular industries or market segments. As an organization, we may not have significant experience in selling our services into certain of these markets. Our ability to successfully sell our services into these markets to a meaningful extent remains unproven. If we are unsuccessful in such efforts, our business, financial condition and results of operations could suffer.
Rapid increase in the use of mobile and alternative devices to access the Internet present significant development and deployment challenges.
The number of people who access the Internet through devices other than PCs, including mobile devices, game consoles and television set-top devices, has increased dramatically in the past few years. The capabilities of these devices are advancing dramatically and the increasing need to provide a high-quality video experience will present us and other providers with significant challenges. If we are unable to deliver our service offerings to a substantial number of alternative device users and at a high quality, or if we are slow to develop services and technologies that are more compatible with these devices, we may fail to capture a significant share of an increasingly important portion of the market. Such a failure could limit our ability to compete effectively in an industry that is rapidly growing and changing, which, in turn, could cause our business, financial condition and results of operations to suffer.
We need to defend our intellectual property and processes against patent or copyright infringement claims, which may cause us to incur substantial costs and threaten our ability to do business.
15
Companies, organizations or individuals, including our competitors and non-practicing entities, may hold or obtain patents or other proprietary rights that would prevent, limit or interfere with our ability to make, use or sell our services or develop new services, which could make it more difficult for us to operate our business. From time to time, we may receive inquiries from holders of patents inquiring whether we infringe their proprietary rights. Companies holding Internet-related patents or other intellectual property rights are increasingly bringing suits alleging infringement of such rights or otherwise asserting their rights and seeking licenses. Any litigation or claims, whether or not valid, could result in substantial costs and diversion of resources from the defense of such claims. In addition, many of our agreements with customers require us to defend and indemnify those customers for third-party intellectual property infringement claims against them, which could result in significant additional costs and diversion of resources. If we are determined to have infringed upon a third party’s intellectual property rights, we may also be required to do one or more of the following:
• | cease selling, incorporating or using products or services that incorporate the challenged intellectual property; |
• | pay substantial damages; |
• | obtain a license from the holder of the infringed intellectual property right, which license may or may not be available on reasonable terms or at all; or |
• | redesign products or services. |
If we are forced to litigate any claims or to take any of these other actions, our business may be seriously harmed.
Our business may be adversely affected if we are unable to protect our intellectual property rights from unauthorized use or infringement by third parties.
We rely on a combination of patent, copyright, trademark and trade secret laws and restrictions on disclosure to protect our intellectual property rights. We have applied for patent protection in the United States and a number of foreign countries. These legal protections afford only limited protection and laws in foreign jurisdictions may not protect our proprietary rights as fully as in the United States. Monitoring infringement of our intellectual property rights is difficult, and we cannot be certain that the steps we have taken will prevent unauthorized use of our intellectual property rights. Developments and changes in patent law, such as changes in interpretations of the joint infringement standard, could restrict how we enforce certain patents we hold. We also cannot be certain that any pending or future patent applications will be granted, that any future patent will not be challenged, invalidated or circumvented, or that rights granted under any patent that may be issued will provide competitive advantages to us.
Our results of operations may fluctuate in the future. As a result, we may fail to meet or exceed the expectations of securities analysts or investors, which could cause our stock price to decline.
Our results of operations may fluctuate as a result of a variety of factors, many of which are outside of our control. If our results of operations fall below the expectations of securities analysts or investors, the price of our common stock could decline substantially. In addition to the effects of other risks discussed in this section, fluctuations in our results of operations may be due to a number of factors, including, among others:
• | our ability to increase sales to existing customers and attract new customers to our content delivery and other Orchestrate Platform services; |
• | the addition or loss of large customers, or significant variation in their use of our content delivery and other Orchestrate Platform services; |
• | costs associated with current or future intellectual property lawsuits and other lawsuits; |
• | service outages or third party security breaches to our platform or to one or more of our customers’ platforms; |
• | the amount and timing of operating costs and capital expenditures related to the maintenance and expansion of our business, operations and infrastructure and the adequacy of available funds to meet those requirements; |
• | the timing and success of new product and service introductions by us or our competitors; |
• | the occurrence of significant events in a particular period that result in an increase in the use of our content delivery and other Orchestrate Platform services, such as a major media event or a customer’s online release of a new or updated video game or operating system; |
• | changes in our pricing policies or those of our competitors; |
• | the timing of recognizing revenue; |
• | limitations of the capacity of our global network and related systems; |
• | the timing of costs related to the development or acquisition of technologies, services or businesses; |
• | the potential write-down or write-off of intangible or other long-lived assets; |
• | general economic, industry and market conditions (such as fluctuations experienced in the stock and credit markets during times of deteriorated global economic conditions) and those conditions specific to Internet usage; |
• | limitations on usage imposed by our customers in order to limit their online expenses; and |
16
• | war, threat of war or terrorist actions, including cyber terrorism targeted at us, our customers, or both, and inadequate cybersecurity. |
We believe that our revenue and results of operations may vary significantly in the future and that period-to-period comparisons of our operating results may not be meaningful. You should not rely on the results of one period as an indication of future performance.
We generate our revenue primarily from the sale of content delivery services, and the failure of the market for these services to expand as we expect or the reduction in spending on those services by our current or potential customers would seriously harm our business.
While we offer our customers a number of services and solutions associated with our Orchestrate Platform, we generate the majority of our revenue from charging our customers for the content delivered on their behalf through our global network. We are subject to an elevated risk of reduced demand for these services. Furthermore, if the market for delivery of rich media content in particular does not continue to grow as we expect or grows more slowly, then we may fail to achieve a return on the significant investment we are making to prepare for this growth. Our success, therefore, depends on the continued and increasing reliance on the Internet for delivery of media content and our ability to cost-effectively deliver these services. Many different factors may have a general tendency to limit or reduce the number of users relying on the Internet for media content, the amount of content consumed by our customers’ users, or the number of providers making this content available on-line, including, among others:
• | a general decline in Internet usage; |
• | third party restrictions on on-line content (including copyright restrictions, digital rights management and restrictions in certain geographic regions); |
• | system impairments or outages, including those caused by hacking or cyberattacks; and |
• | a significant increase in the quality or fidelity of off-line media content beyond that available online to the point where users prefer the off-line experience. |
The influence of any of these or other factors may cause our current or potential customers to reduce their spending on content delivery services, which would seriously harm our operating results and financial condition.
We could incur charges due to impairment of goodwill and long-lived assets.
As of December 31, 2017, we had a goodwill balance of approximately $77,054, which is subject to periodic testing for impairment. Our long-lived assets also are subject to periodic testing for impairment. A significant amount of judgment is involved in the periodic testing. Failure to achieve sufficient levels of cash flow could result in impairment charges for goodwill or fixed asset impairment for long-lived assets, which could have a material adverse effect on our reported results of operations. Our goodwill impairment analysis also includes a comparison of the aggregate estimated fair value of our reporting unit to our total market capitalization. If our stock trades below our book value, a significant and sustained decline in our stock price and market capitalization could result in goodwill impairment charges. During times of financial market volatility, significant judgment will be used to determine the underlying cause of the decline and whether stock price declines are short-term in nature or indicative of an event or change in circumstances. Impairment charges, if any, resulting from the periodic testing are non-cash.
Our operations are dependent in part upon communications capacity provided by third party telecommunications providers. A material disruption of the communications capacity we have leased could harm our results of operations, reputation and customer relations.
We lease private line capacity for our backbone from third party providers. Our contracts for private line capacity generally have terms of three to four years. The communications capacity we have leased may become unavailable for a variety of reasons, such as physical interruption, technical difficulties, contractual disputes, or the financial health of our third party providers. Also, industry consolidation among communications providers could result in fewer viable market alternatives, which could have an impact on our costs of providing services. Alternative providers are currently available; however, it could be time consuming and expensive to promptly identify and obtain alternative third party connectivity. Additionally, as we grow, we anticipate requiring greater private line capacity than we currently have in place. If we are unable to obtain such capacity from third party providers on terms commercially acceptable to us or at all, our business and financial results would suffer. Similarly, if we are unable to timely deploy enough network capacity to meet the needs of our customer base or effectively manage the demand for our services, our reputation and relationships with our customers would be harmed, which, in turn, could harm or business, financial condition and results of operations.
17
We face risks associated with international operations that could harm our business.
We have operations in numerous foreign countries and may continue to expand our sales and support organizations internationally. As part of our business strategy, we intend to expand our international network infrastructure. Expansion could require us to make significant expenditures, including the hiring of local employees or resources, in advance of generating any revenue. As a consequence, we may fail to achieve profitable operations that will compensate our investment in international locations. We are subject to a number of risks associated with international business activities that may increase our costs, lengthen our sales cycle and require significant management attention. These risks include:
• | increased expenses associated with sales and marketing, deploying services and maintaining our infrastructure in foreign countries; |
• | competition from local content delivery service providers, many of which are very well positioned within their local markets; |
• | challenges caused by distance, language and cultural differences; |
• | unexpected changes in regulatory requirements preventing or limiting us from operating our global network or resulting in unanticipated costs and delays; |
• | interpretations of laws or regulations that would subject us to regulatory supervision or, in the alternative, require us to exit a country, which could have a negative impact on the quality of our services or our results of operations; |
• | longer accounts receivable payment cycles and difficulties in collecting accounts receivable; |
• | corporate and personal liability for violations of local laws and regulations; |
• | currency exchange rate fluctuations and repatriation of funds; |
• | potentially adverse tax consequences; |
• | credit risk and higher levels of payment fraud; and |
• | foreign exchange controls that might prevent us from repatriating cash earned in countries outside the United States. |
International operations are subject to significant additional risks not generally faced in our domestic operations, including, but not limited to, risks relating to legal systems that may not adequately protect contract and intellectual property rights, policies and taxation, the physical infrastructure of the country, as well as risks relating to potential political turmoil and currency exchange controls. There can be no assurance that these international risks will not materially adversely affect our business. For example, our operations include software development and quality assurance activities in Ukraine, which has experienced social unrest in recent years. Should there be significant productivity losses, or if we become unable to conduct operations in Ukraine in the future, and our contingency plans are unsuccessful in addressing the related risks, our business could be adversely affected.
Our business depends on continued and unimpeded access to third party controlled end-user access networks.
Our content delivery services depend on our ability to access certain end-user access networks in order to complete the delivery of rich media and other on-line content to end-users. Some operators of these networks may take measures that could degrade, disrupt or increase the cost of our or our customers’ access to certain of these end-user access networks. Such measures may include restricting or prohibiting the use of their networks to support or facilitate our services, or charging increased fees to us, our customers or end-users in connection with our services. In 2015, the U.S. Federal Communications Commission (FCC) released network neutrality and open internet rules that reclassified broadband Internet access services as a telecommunications service subject to some elements of common carrier regulation. Among other things, the FCC order prohibited blocking or discriminating against lawful services and applications and prohibited "paid prioritization," or providing faster speeds or other benefits in return for compensation. In December 2017, the FCC overturned these rules. As a result, we or our customers could experience increased cost or slower data on these third-party networks. If we or our customers experience increased cost in delivering content to end users, or otherwise, or if end users perceive a degradation of quality, our business and that of our customers may be significantly harmed. This or other types of interference could result in a loss of existing customers, increased costs and impairment of our ability to attract new customers, thereby harming our revenue and growth.
In addition, the performance of our infrastructure depends in part on the direct connection of our global network to a large number of end-user access networks, known as peering, which we achieve through mutually beneficial cooperation with these networks. In some instances, network operators charge us for the peering connections. If, in the future, a significant percentage of these network operators elected to no longer peer with our network or peer with our network on less favorable economic terms, then the performance of our infrastructure could be diminished, our costs could increase and our business could suffer.
If our ability to deliver media files in popular proprietary content formats was restricted or became cost-prohibitive, demand for our content delivery services could decline, we could lose customers and our financial results could suffer.
18
Our business depends on our ability to deliver media content in all major formats. If our legal right or technical ability to store and deliver content in one or more popular proprietary content formats, such as HTTP Live Streaming and Multimedia Messaging Services, was limited, our ability to serve our customers in these formats would be impaired and the demand for our content delivery and other Orchestrate Platform services would decline by customers using these formats. Owners of propriety content formats may be able to block, restrict or impose fees or other costs on our use of such formats, which could lead to additional expenses for us and for our customers, or which could prevent our delivery of this type of content altogether. Such interference could result in a loss of existing customers, increased costs and impairment of our ability to attract new customers, which would harm our revenue, operating results and growth.
We use certain “open-source” software the use of which could result in our having to distribute our proprietary software, including our source code, to third parties on unfavorable terms, which could materially affect our business.
Certain of our service offerings use software that is subject to open-source licenses. Open-source code is software that is freely accessible, usable and modifiable. Certain open-source code is governed by license agreements, the terms of which could require users of such open-source code to make any derivative works of such open-source code available to others on unfavorable terms or at no cost. Because we use open-source code, we may be required to take remedial action to protect our proprietary software. Such action could include replacing certain source code used in our software, discontinuing certain of our products or features or taking other actions that could divert resources away from our development efforts.
In addition, the terms relating to disclosure of derivative works in many open-source licenses are unclear. We periodically review our compliance with the open-source licenses we use and do not believe we will be required to make our proprietary software freely available. Nevertheless, if a court interprets one or more such open-source licenses in a manner that is unfavorable to us, we could be required to make some components of our software available at no cost, which could materially and adversely affect our business and financial condition.
If we are unable to retain our key employees and hire qualified sales and technical personnel, our ability to compete could be harmed.
Our future success depends upon the continued services of our executive officers and other key technology, sales, marketing and support personnel who have critical industry experience and relationships that they rely on in implementing our business plan. There is increasing competition for talented individuals with the specialized knowledge to deliver Orchestrate Platform services and this competition affects both our ability to retain key employees and hire new ones. Historically, we have experienced a significant amount of employee turnover, especially with respect to our sales personnel. As a result, a significant number of our sales personnel are relatively new and may need time to become fully productive. The loss of the services of any of our key employees could disrupt our operations, delay the development and introduction of our services, and negatively impact our ability to sell our services.
We are subject to the effects of fluctuations in foreign exchange rates, which could affect our operating results.
The financial condition and results of operations of our operating foreign subsidiaries are reported in the relevant local currency and are then translated into U.S. dollars at the applicable currency exchange rate for inclusion in our consolidated U.S. dollar financial statements. Also, although a large portion of our customer and vendor agreements are denominated in U.S. dollars, we may be exposed to fluctuations in foreign exchange rates with respect to customer agreements with certain of our international customers. Exchange rates between these currencies and U.S. dollars in recent years have fluctuated significantly and may do so in the future. In addition to currency translation risk, we incur currency transaction risk whenever one of our operating subsidiaries enters into a transaction using a different currency than the relevant local currency. Given the volatility of exchange rates, we may be unable to manage our currency transaction risks effectively. Currency fluctuations could have a material adverse effect on our future international sales and, consequently, on our financial condition and results of operations.
As part of our business strategy, we may acquire businesses or technologies and may have difficulty integrating these operations.
We have completed a number of business acquisitions and may seek to acquire businesses or technologies that are complementary to our business in the future. Acquisitions are often complex and involve a number of risks to our business, including, among others;
• | the difficulty of integrating the operations, services, solutions and personnel of the acquired companies; |
• | the potential disruption of our ongoing business; |
• | the potential distraction of management; |
• | the possibility that our business culture and the business culture of the acquired companies will not be compatible; |
19
• | the difficulty of incorporating or integrating acquired technology and rights with or into our other services and solutions; |
• | expenses related to the acquisition and to the integration of the acquired companies; |
• | the impairment of relationships with employees and customers as a result of any integration of new personnel; |
• | employee turnover from the acquired companies or from our current operations as we integrate businesses; |
• | risks related to the businesses of acquired companies that may continue to impact the businesses following the merger; and |
• | potential unknown liabilities associated with acquired companies. |
Any inability to integrate services, solutions, operations or personnel in an efficient and timely manner could harm our results of operations.
If we are not successful in completing acquisitions that we may pursue in the future, we may be required to reevaluate our business strategy, and we may incur substantial expenses and devote significant management time and resources without a productive result. In addition, future acquisitions will require the use of our available cash or dilutive issuances of securities. Future acquisitions or attempted acquisitions could also harm our ability to achieve profitability.
Internet-related and other laws relating to taxation issues, privacy, data security, and consumer protection and liability for content distributed over our network could harm our business.
Laws and regulations that apply to communications and commerce conducted over the Internet are becoming more prevalent, both in the United States and internationally, and may impose additional burdens on companies conducting business on-line or providing Internet-related services such as ours. Increased regulation could negatively affect our business directly, as well as the businesses of our customers, which could reduce their demand for our services. For example, tax authorities abroad may impose taxes on the Internet-related revenue we generate based on where our internationally deployed servers are located. In addition, domestic and international taxation laws are subject to change. Our services, or the businesses of our customers, may become subject to increased taxation, which could harm our financial results either directly or by forcing our customers to scale back their operations and use of our services in order to maintain their operations. Also, the Communications Act of 1934, as amended by the Telecommunications Act of 1996 (the Act), and the regulations promulgated by the FCC under Title II of the Act, may impose obligations on the Internet and those participants involved in Internet-related businesses. In addition, the laws relating to the liability of private network operators for information carried on, processed by or disseminated through their networks are unsettled, both in the United States and abroad. Network operators have been sued in the past, sometimes successfully, based on the content of material disseminated through their networks. We may become subject to legal claims such as defamation, invasion of privacy and copyright infringement in connection with content stored on or distributed through our network. In addition, our reputation could suffer as a result of our perceived association with the type of content that some of our customers deliver. If we need to take costly measures to reduce our exposure to the risks posed by laws and regulations that apply to communications and commerce conducted over the Internet, or are required to defend ourselves against related claims, our financial results could be negatively affected.
Several other federal laws also could expose us to liability and impose significant additional costs on us. For example, the Digital Millennium Copyright Act has provisions that limit, but do not eliminate, our liability for the delivery of customer content that infringe copyrights or other rights, so long as we comply with certain statutory requirements. In addition, the Children’s On-line Privacy Protection Act restricts the ability of on-line services to collect information from minors and the Protection of Children from Sexual Predators Act of 1998 requires on-line service providers to report evidence of violations of federal child pornography laws under certain circumstances. Also, there are emerging regulation and industry standards regarding the collection and use of personal information and protecting the security of data on networks. Compliance with these laws, regulations and standards is complex and any failure on our part to comply with these regulations may subject us to additional liabilities.
Privacy concerns could lead to regulatory and other limitations on our business, including our ability to use “cookies” and video player “cookies” that are crucial to our ability to provide services to our customers.
Our ability to compile data for customers depends on the use of “cookies” and video player “cookies” to identify certain on-line behavior that allows our customers to measure a website or video’s effectiveness. A cookie is a small file of information stored on a user’s computer that allows us to recognize that user’s browser or video player when the user makes a request for a web page or to play a video. Government authorities inside the United States concerned with the privacy of Internet users have suggested the enactment of legislation that would regulate cookies and/or require certain disclosures regarding cookies. Bills aimed at regulating the collection, use and/or storage of personal data from Internet users are currently pending in United States Congress and many state legislatures. Attempts at such regulation may be drafted in such a way as to limit or otherwise regulate the collection of certain technology like cookies, thereby creating restrictions that could reduce our
20
ability to use them. In addition, the Federal Trade Commission and the Department of Commerce have conducted hearings regarding user profiling, the collection of non-personally identifiable information and on-line privacy.
Our foreign operations may also be adversely affected by regulatory action outside the United States. These regulations, which can be enforced by private parties or governmental entities, are constantly evolving and can be subject to significant change. For example, the European Union has enacted an electronic communications directive that imposes certain restrictions on the use of cookies, requires certain disclosures with respect to cookie usages and also places restrictions on the sending of unsolicited communications. Each European Union member country was required to enact legislation to comply with the provisions of the electronic communications directive. Germany has also enacted additional laws limiting the use of user profiling, and other countries, both in and out of the European Union, may impose similar limitations.
Internet users may directly limit or eliminate the placement of cookies on their computers by using third-party software that blocks cookies, or by disabling or restricting the cookie functions of their Internet browser software and in their video player software. Internet browser software upgrades also may result in limitations on the use of cookies. Technologies like the Platform for Privacy Preferences Project may limit collection of cookies. Plaintiffs’ attorneys also have organized class action suits against companies related to the use of cookies and several companies, including companies in the Internet advertising industry, have had claims brought against them before the Federal Trade Commission regarding the collection and use of Internet user information. We may be subject to such suits in the future, which could limit or eliminate our ability to collect such information. If our ability to use cookies were substantially restricted due to the foregoing, or for any other reason, we would have to generate and use other technology or methods that allow the gathering of user data in order to provide services to customers. This change in technology or methods could require significant re-engineering time and resources, and may not be complete in time to avoid negative consequences to our business. In addition, alternative technology or methods might not be available on commercially reasonable terms, if at all. If the use of cookies is prohibited and we are not able to efficiently and cost effectively create new technology, our business, financial condition and results of operations would be materially adversely affected. In addition, any compromise of security that results in the release of Internet users’ and/or our customers’ data could seriously limit the adoption of our service offerings as well as harm our reputation and brand, expose us to liability and subject us to reporting obligations under various state laws, which could have an adverse effect on our business. The risk that these types of events could seriously harm our business is likely to increase as the amount of data stored for customers on our servers and the number of countries where we operate has been increasing, and we may need to expend significant resources to protect against security breaches, which could have an adverse effect on our business, financial condition or results of operations.
Also, a number of new privacy laws coming into effect and/or proposals pending could affect our business. For example, the European Commission has enacted a general data protection regulation that becomes effective in May 2018 and will supersede current EU data protection legislation, impose more stringent EU data protection requirements, and provide for greater penalties for noncompliance. Additionally, in October 2015, the European Court of Justice invalidated the U.S.-EU Safe Harbor framework that had been in place since 2000, which allowed companies to meet certain European legal requirements for the transfer of personal data from the European Economic Area to the United States. Although U.S. and EU authorities reached a political agreement regarding a new potential means for legitimizing personal data transfers from the European Economic Area to the United States, the EU-U.S. Privacy Shield, there continue to be concerns about whether the EU-US Privacy Shield will face additional challenges (similar to the fate of the Safe Harbor framework). We expect that for the immediate future, we will continue to face uncertainty as to whether our efforts to comply with our obligations under European privacy laws will be sufficient. If we are investigated by a European data protection authority, we may face fines and other penalties. Any such investigation or charges by European data protection authorities could have a negative effect on our existing business and on our ability to attract and retain new customers. These existing and proposed laws and regulations can be costly to comply with, could expose us to significant penalties for non-compliance, can delay or impede the development or adoption of our products and services, reduce the overall demand for our services, result in negative publicity, increase our operating costs, require significant management time and attention, slow the pace at which we close (or prevent us from closing) sales transactions, and subject us to claims or other remedies, including fines or demands that we modify or cease existing business practices.
Our business requires the continued development of effective business support systems to support our customer growth and related services.
The growth of our business depends on our ability to continue to develop effective business support systems. This is a complicated undertaking requiring significant resources and expertise. Business support systems are needed for:
• | implementing customer orders for services; |
• | delivering these services; and |
• | timely and accurate billing for these services. |
21
Because our business plan provides for continued growth in the number of customers that we serve and services offered, there is a need to continue to develop our business support systems on a schedule sufficient to meet proposed service roll-out dates. The failure to continue to develop effective business support systems could harm our ability to implement our business plans and meet our financial goals and objectives.
We have incurred, and will continue to incur significant costs as a result of operating as a public company, and our management is required to devote substantial time to compliance initiatives.
As a public company, we have incurred, and will continue to incur, significant expenses, including accounting, legal and other professional fees, insurance premiums, investor relations costs, and costs associated with compensating our independent directors. In addition, rules implemented by the SEC and the Nasdaq Global Select Market impose additional requirements on public companies, including requiring changes in corporate governance practices. For example, the listing requirements of the Nasdaq Global Select Market require that we satisfy certain corporate governance requirements relating to independent directors, audit committees, distribution of annual and interim reports, stockholder meetings, stockholder approvals, solicitation of proxies, conflicts of interest, stockholder voting rights and codes of conduct. Our management and other personnel need to devote a substantial amount of time to these compliance initiatives. Moreover, these rules and regulations increase our legal and financial compliance costs and make some activities more time-consuming and costly. For example, these rules and regulations make it more difficult and more expensive for us to obtain director and officer liability insurance.
If the accounting estimates we make, and the assumptions on which we rely, in preparing our financial statements prove inaccurate, our actual results may be adversely affected.
Our financial statements have been prepared in accordance with accounting principles generally accepted in the United States. The preparation of these financial statements requires us to make estimates and judgments about, among other things, taxes, revenue recognition, share-based compensation costs, contingent obligations and doubtful accounts. These estimates and judgments affect the reported amounts of our assets, liabilities, revenue and expenses, the amounts of charges accrued by us, and related disclosure of contingent assets and liabilities. We base our estimates on historical experience and on various other assumptions that we believe to be reasonable under the circumstances and at the time they are made. If our estimates or the assumptions underlying them are not correct, we may need to accrue additional charges or reduce the value of assets that could adversely affect our results of operations, investors may lose confidence in our ability to manage our business and our stock price could decline.
If we fail to maintain proper and effective internal controls or fail to implement our controls and procedures with respect to acquired or merged operations, our ability to produce accurate financial statements could be impaired, which could adversely affect our operating results, our ability to operate our business and investors’ views of us.
We must ensure that we have adequate internal financial and accounting controls and procedures in place so that we can produce accurate financial statements on a timely basis. We are required to spend considerable effort on establishing and maintaining our internal controls, which is costly and time-consuming and needs to be re-evaluated frequently.
We have operated as a public company since June 2007, and we will continue to incur significant legal, accounting, and other expenses as we comply with the Sarbanes-Oxley Act of 2002, as well as new rules implemented from time to time by the SEC and the Nasdaq Global Select Market. These rules impose various requirements on public companies, including requiring changes in corporate governance practices, increased reporting of compensation arrangements and other requirements. Our management and other personnel will continue to devote a substantial amount of time to these compliance initiatives. Moreover, new rules and regulations will likely increase our legal and financial compliance costs and make some activities more time-consuming and costly. These rules and regulations could also make it more difficult for us to attract and retain qualified persons to serve on our board of directors, our board committees or as executive officers.
Section 404 of the Sarbanes-Oxley Act of 2002 requires that we include in our annual report our assessment of the effectiveness of our internal control over financial reporting and our audited financial statements as of the end of each fiscal year. Furthermore, our independent registered public accounting firm, Ernst & Young LLP (EY), is required to report on whether it believes we maintained, in all material respects, effective internal control over financial reporting as of the end of the year. Our continued compliance with Section 404 will require that we incur substantial expense and expend significant management time on compliance related issues, including our efforts in implementing controls and procedures related to acquired or merged operations. We currently do not have an internal audit group and use an international accounting firm to assist us with our assessment of the effectiveness of our internal controls over financial reporting. In future years, if we fail to timely complete this assessment, or if EY cannot timely attest, there may be a loss of public confidence in our internal controls, the market price of our stock could decline, and we could be subject to regulatory sanctions or investigations by the Nasdaq Global Select Market, the SEC or other regulatory authorities, which would require additional financial and management
22
resources. In addition, any failure to implement required new or improved controls, or difficulties encountered in their implementation, could harm our operating results or cause us to fail to timely meet our regulatory reporting obligations.
Changes in financial accounting standards or practices may cause adverse, unexpected financial reporting fluctuations and affect our reported results of operations.
A change in accounting standards or practices can have a significant effect on our operating results and may affect our reporting of transactions completed before the change is effective. New accounting pronouncements and varying interpretations of existing accounting pronouncements have occurred and may occur in the future. Changes to existing rules or the questioning of current practices may adversely affect our reported financial results or the way we conduct our business.
Divestiture of our businesses or product lines, including those that we have acquired or will acquire, may materially adversely affect our financial condition, results of operations or cash flows, or may result in impairment charges that may adversely affect our results of operations.
Divestitures involve risks, including difficulties in the separation of operations, services, products and personnel, the diversion of management’s attention from other business concerns, the disruption of our business, the potential loss of key employees and the retention of uncertain contingent liabilities related to the divested business, any of which could result in a material adverse effect to our financial condition, results of operations or cash flows. Divestitures of previously acquired businesses may result in significant asset impairment charges, including those related to goodwill and other intangible assets, which could have a material adverse effect on our financial condition and results of operations. Future impairment may result from, among other things, deterioration in the performance of the acquired business or product line, adverse market conditions and changes in the competitive landscape, adverse changes in applicable laws or regulations, including changes that restrict the activities of the acquired business or product line, changes in accounting rules and regulations, and a variety of other circumstances. The amount of any impairment is recorded as a charge to the statement of operations. We may never realize the full value of our goodwill and intangible assets, and any determination requiring the write-off of a significant portion of these assets may have an adverse effect on our financial condition and results of operations. We cannot assure you that we will be successful in managing these or any other significant risks that we encounter in divesting a business or product line.
Risks Related to Ownership of Our Common Stock
The trading price of our common stock has been, and is likely to continue to be, volatile.
The trading prices of our common stock and the securities of technology companies generally have been highly volatile. Factors affecting the trading price of our common stock will include:
•variations in our operating results;
• | announcements of technological innovations, new services or service enhancements, strategic alliances or significant agreements by us or by our competitors; |
• | commencement or resolution of, our involvement in and uncertainties arising from litigation; |
•recruitment or departure of key personnel;
• | changes in the estimates of our operating results or changes in recommendations by any securities analysts that elect to follow our common stock; |
• | if we or our stockholders sell substantial amounts of our common stock (including shares issued upon the exercise of options and warrants); |
•developments or disputes concerning our intellectual property or other proprietary rights;
•the gain or loss of significant customers;
•market conditions in our industry, the industries of our customers and the economy as a whole; and
•adoption or modification of regulations, policies, procedures or programs applicable to our business.
In addition, if the market for technology stocks or the stock market in general experiences loss of investor confidence, the trading price of our common stock could decline for reasons unrelated to our business, operating results or financial
23
condition. The trading price of our common stock might also decline in reaction to events or speculation of events that affect other companies in our industry even if these events do not directly affect us.
If securities or industry analysts do not publish research or reports about our business or if they issue an adverse or misleading opinion or report, our stock, our stock price and trading volume could decline.
The trading market for our common stock will be influenced by the research and reports that industry or securities analysts publish about us or our business. If any of the analysts who cover us issue an adverse or misleading opinion regarding our stock, our stock price would likely decline. If one or more of these analysts cease coverage of our company or fail to publish reports on us regularly, we could lose visibility in the financial markets, which in turn could cause our stock price or trading volume to decline.
Insiders have substantial control over us and will be able to influence corporate matters.
As of December 31, 2017, our directors and executive officers and their affiliates beneficially owned, in the aggregate, approximately 18% of our outstanding common stock, including approximately 14% beneficially owned by investment entities affiliated with Goldman, Sachs & Co. These stockholders are able to exercise significant influence over all matters requiring stockholder approval, including the election of directors and approval of significant corporate transactions, such as a merger or other sale of our company or its assets. This concentration of ownership could limit other stockholders’ ability to influence corporate matters and may have the effect of delaying or preventing a third party from acquiring control over us.
Future equity issuances or a sale of a substantial number of shares of our common stock may cause the price of our common stock to decline.
Because we may need to raise additional capital in the future to continue to expand our business and our research and development activities, among other things, we may conduct additional equity offerings. If we or our stockholders sell substantial amounts of our common stock (including shares issued upon the exercise of options and warrants) in the public market, the market price of our common stock could fall. For example, in November 2017 investment entities affiliated with Goldman, Sachs & Co. sold 15,000,000 shares of our commons stock in a registered public offering, and such entities may sell additional shares in the future. A decline in the market price of our common stock could make it more difficult for us to sell equity or equity-related securities in the future at a time and price that we deem appropriate.
Anti-takeover provisions in our charter documents and Delaware law could discourage, delay or prevent a change in control of our company and may affect the trading price of our common stock.
Provisions of our amended and restated certificate of incorporation and bylaws, as well as provisions of Delaware law, could make it more difficult for a third party to acquire us, even if doing so would benefit our stockholders. These provisions:
• | establish that members of the board of directors may be removed only for cause upon the affirmative vote of stockholders owning a majority of our capital stock; |
• | authorize the issuance of “blank check” preferred stock that could be issued by our board of directors to increase the number of outstanding shares and thwart a takeover attempt; |
• | limit who may call special meetings of stockholders; |
• | prohibit stockholder action by written consent, thereby requiring stockholder actions to be taken at a meeting of the stockholders; |
• | establish advance notice requirements for nominations for election to the board of directors or for proposing matters that can be acted upon at stockholder meetings; |
• | provide for a board of directors with staggered terms; and |
• | provide that the authorized number of directors may be changed only by a resolution of our board of directors. |
In addition, Section 203 of the Delaware General Corporation Law, which imposes certain restrictions relating to transactions with major stockholders, may discourage, delay or prevent a third party from acquiring us.
Item 1B. Unresolved Staff Comments
None.
24
Item 2. Properties
Our global corporate headquarters is located in approximately 32,000 square feet of leased office space in Tempe, Arizona. We also lease space for a data center and warehouse in Phoenix, Arizona. We lease offices in several other locations in the United States and Canada, including in or near San Francisco, California; Lexington, Kentucky; Boston, Massachusetts; Grand Rapids, Michigan; New York, New York; Seattle, Washington; and Toronto, Canada. We also lease offices in Europe and Asia in or near London, England; Paris, France; Munich, Germany; Bangalore, India; Lviv, Ukraine; Tokyo, Japan; Seoul, Korea; and Singapore. We believe our facilities are sufficient to meet our needs for the foreseeable future and, if needed, additional space will be available at a reasonable cost.
Item 3. Legal Proceedings
For a description of our material pending legal proceedings, please refer to Note 11 “Contingencies - Legal Matters" of the Notes to Consolidated Financial Statements included in Part II, Item 8 of this annual report on Form 10-K, which is incorporated herein by reference.
Item 4. Mine Safety Disclosures.
Not applicable.
25
PART II
Item 5. | Market for Registrant’s Common Equity, Related Stockholder Matters and Issuer Purchases of Equity Securities |
Market Information
Our common stock, par value $0.001 per share, trades on The Nasdaq Global Select Market under the symbol “LLNW”.
The following table sets forth, for the periods indicated, the high and low intraday sale price per share of our common stock on The Nasdaq Global Select Market:
High | Low | ||||||
2016: | |||||||
First Quarter | $ | 1.99 | $ | 0.90 | |||
Second Quarter | $ | 1.87 | $ | 1.17 | |||
Third Quarter | $ | 2.04 | $ | 1.38 | |||
Fourth Quarter | $ | 2.90 | $ | 1.70 | |||
2017: | |||||||
First Quarter | $ | 2.70 | $ | 2.02 | |||
Second Quarter | $ | 3.51 | $ | 2.41 | |||
Third Quarter | $ | 4.25 | $ | 2.85 | |||
Fourth Quarter | $ | 6.05 | $ | 3.95 | |||
Holders
As of February 1, 2018, there were 250 holders of record of our common stock.
Dividends
We have never paid or declared any cash dividends on shares of our common stock or other securities and do not anticipate paying any cash dividends in the foreseeable future. We currently intend to retain all future earnings, if any, for use in the operation of our business.
Issuers Purchases of Equity Securities
None
STOCK PERFORMANCE GRAPH
The graph set forth below compares the cumulative total stockholder return on our common stock between December 31, 2012 and December 31, 2017, with the cumulative total return of (i) the Nasdaq Composite Index and (ii) the S&P Information Technology Sector Index, over the same period. This graph assumes the investment of $100 on December 31, 2012 in our common stock, the Nasdaq Composite Index and the S&P Information Technology Sector Index, and assumes the reinvestment of dividends, if any. The comparisons shown in the graph below are based upon historical data. We caution that the stock price performance shown in the graph below is not necessarily indicative of, nor is it intended to forecast, the potential future performance of our common stock.
26
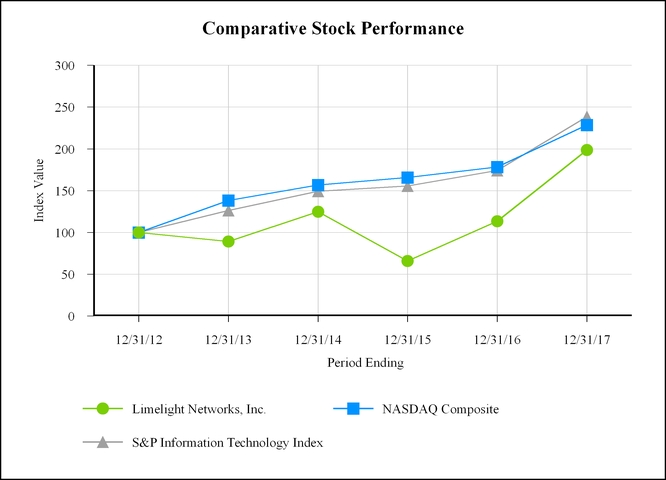
This graph assumes an investment on December 31, 2012 of $100 in our common stock (based on the closing sale price of our common stock), and in each of such indices (including the reinvestment of all dividends). Measurement points are to the last trading day for each respective period. The performance shown is not necessarily indicative of future performance.
27
Item 6. Selected Financial Data
The following selected consolidated financial data should be read in conjunction with our Consolidated Financial Statements and related notes and with “Management Discussion and Analysis of Financial Condition and Results of Operations” and other financial data included elsewhere in this annual report on Form 10-K. On December 23, 2013, we sold our Web Content Management business resulting in a gain on sale of $3,836 which is included in Other, net, for the year ended December 31, 2013. This sale was not treated as a discontinued operation because the operations and cash flows of our Web Content Management business cannot be clearly distinguished, operationally or for financial reporting purposes, from the rest of the Company. On August 1, 2016, we entered into a settlement and license agreement with Akamai with respect to the ‘703 and certain other related patents, which settled all asserted and unasserted claims with respect to the licensed patents. The terms of the agreement require us to pay $54,000 over twelve equal quarterly installments, which began on August 1, 2016. We took a charge in the year ended December 31, 2016 for the full, undiscounted amount of $54,000, per our accounting policy. All information is presented in thousands, except per share amounts, customer count and where specifically noted.
Limelight Networks, Inc. | |||||||||||||||||||
Year Ended December 31, | |||||||||||||||||||
2017 | 2016 | 2015 | 2014 | 2013 | |||||||||||||||
Revenues | $ | 184,360 | $ | 168,234 | $ | 170,912 | $ | 162,259 | $ | 173,433 | |||||||||
Cost of revenue: | |||||||||||||||||||
Cost of services (1) | 78,423 | 78,857 | 84,818 | 82,176 | 88,783 | ||||||||||||||
Depreciation — network | 18,138 | 18,032 | 17,975 | 16,673 | 22,942 | ||||||||||||||
Total cost of revenue | 96,561 | 96,889 | 102,793 | 98,849 | 111,725 | ||||||||||||||
Gross profit | 87,799 | 71,345 | 68,119 | 63,410 | 61,708 | ||||||||||||||
Operating expenses: | |||||||||||||||||||
General and administrative (1) | 32,053 | 30,042 | 25,027 | 28,176 | 31,904 | ||||||||||||||
Sales and marketing (1) | 36,098 | 32,945 | 37,868 | 37,458 | 41,474 | ||||||||||||||
Research and development (1) | 25,342 | 24,335 | 28,016 | 20,965 | 22,003 | ||||||||||||||
Depreciation and amortization | 2,376 | 2,452 | 2,929 | 3,529 | 5,804 | ||||||||||||||
Provision for litigation | — | 54,000 | — | — | — | ||||||||||||||
Total operating expenses | 95,869 | 143,774 | 93,840 | 90,128 | 101,185 | ||||||||||||||
Operating loss | (8,070 | ) | (72,429 | ) | (25,721 | ) | (26,718 | ) | (39,477 | ) | |||||||||
Other income (expense): | |||||||||||||||||||
Interest expense | (80 | ) | (918 | ) | (29 | ) | (32 | ) | (76 | ) | |||||||||
Interest income | 494 | 123 | 317 | 276 | 321 | ||||||||||||||
Other, net | 452 | (98 | ) | 1,748 | 1,821 | 4,643 | |||||||||||||
Total other income (expense) | 866 | (893 | ) | 2,036 | 2,065 | 4,888 | |||||||||||||
Loss from continuing operations before income taxes | (7,204 | ) | (73,322 | ) | (23,685 | ) | (24,653 | ) | (34,589 | ) | |||||||||
Income tax provision (benefit) | 426 | 603 | 267 | 203 | 387 | ||||||||||||||
Loss from continuing operations | (7,630 | ) | (73,925 | ) | (23,952 | ) | (24,856 | ) | (34,976 | ) | |||||||||
Discontinued operations: | |||||||||||||||||||
Income (loss) from discontinued operations, net of income taxes | — | — | — | 265 | (426 | ) | |||||||||||||
Net loss | $ | (7,630 | ) | $ | (73,925 | ) | $ | (23,952 | ) | $ | (24,591 | ) | $ | (35,402 | ) | ||||
Net (loss) income per share: | |||||||||||||||||||
Basic and diluted | |||||||||||||||||||
Continuing operations | $ | (0.07 | ) | $ | (0.71 | ) | $ | (0.24 | ) | $ | (0.25 | ) | $ | (0.36 | ) | ||||
Discontinued operations | — | — | — | — | (0.01 | ) | |||||||||||||
Total | $ | (0.07 | ) | $ | (0.71 | ) | $ | (0.24 | ) | $ | (0.25 | ) | $ | (0.37 | ) | ||||
Weighted average shares used in per share calculation: | |||||||||||||||||||
Basic and diluted | 108,814 | 104,350 | 100,105 | 98,365 | 96,851 | ||||||||||||||
28
(1)Includes share-based compensation as follows:
Limelight Networks, Inc. | |||||||||||||||||||
Year Ended December 31, | |||||||||||||||||||
2017 | 2016 | 2015 | 2014 | 2013 | |||||||||||||||
Cost of services | $ | 1,450 | $ | 1,493 | $ | 2,047 | $ | 1,956 | $ | 1,873 | |||||||||
General and administrative | 6,502 | 7,070 | 5,398 | 4,741 | 5,971 | ||||||||||||||
Sales and marketing | 2,470 | 2,792 | 2,657 | 2,317 | 2,245 | ||||||||||||||
Research and development | 2,322 | 2,104 | 2,236 | 1,477 | 2,256 | ||||||||||||||
Total | $ | 12,744 | $ | 13,459 | $ | 12,338 | $ | 10,491 | $ | 12,345 | |||||||||
Limelight Networks, Inc. | |||||||||||||||||||
Year Ended December 31, | |||||||||||||||||||
2017 | 2016 | 2015 | 2014 | 2013 | |||||||||||||||
Consolidated Balance Sheet Data: | |||||||||||||||||||
Cash and cash equivalents and marketable securities, current | $ | 49,316 | $ | 66,187 | $ | 73,002 | $ | 93,084 | $ | 118,462 | |||||||||
Non-current marketable securities | 40 | 40 | 40 | 40 | 46 | ||||||||||||||
Working capital | 44,607 | 56,643 | 86,080 | 100,218 | 123,265 | ||||||||||||||
Property and equipment, net | 28,991 | 30,352 | 36,143 | 32,636 | 32,905 | ||||||||||||||
Total assets | 196,448 | 208,129 | 225,627 | 241,341 | 268,298 | ||||||||||||||
Provision for litigation | 18,000 | 18,000 | — | — | — | ||||||||||||||
Provision for litigation, less current portion | 9,000 | 27,000 | — | — | — | ||||||||||||||
Long-term debt, less current portion | — | — | 1,436 | 135 | 358 | ||||||||||||||
Total stockholders’ equity | 144,145 | 137,568 | 198,097 | 212,163 | 237,331 | ||||||||||||||
29
Item 7. Management’s Discussion and Analysis of Financial Condition and Results of Operations
This annual report on Form 10-K contains “forward-looking statements” within the meaning of Section 21E of the Securities Exchange Act of 1934, as amended. Forward-looking statements include, among other things, statements as to industry trends, our future expectations, operations, financial condition and prospects, business strategies and other matters that do not relate strictly to historical facts. These statements are often identified by the use of words such as “may,” “will,” “expect,” “believe,” “anticipate,” “intend,” “could,” “estimate,” or “continue,” and similar expressions or variations. These statements are based on the beliefs and assumptions of our management based on information currently available to management. Such forward-looking statements are subject to risks, uncertainties and other factors that could cause actual results and the timing of certain events to differ materially from future results expressed or implied by such forward-looking statements. Factors that could cause or contribute to such differences include, but are not limited to, those identified below, and those discussed in the section titled “Risk Factors” set forth in Part I, Item 1A and in the "Special Note Regarding Forward-Looking Statements" preceding Part I of this annual report on Form 10-K. Given these risks and uncertainties, readers are cautioned not to place undue reliance on such forward-looking statements. We undertake no obligation to update any forward-looking statements to reflect events or circumstances after the date of such statements. Prior period information has been modified to conform to current year presentation. All information is presented in thousands, except per share amounts, customer count and where specifically noted.
Overview
We were founded in 2001 as a provider of content delivery network services to deliver digital content over the Internet. We began development of our infrastructure in 2001 and began generating meaningful revenue in 2002. Today, we operate a globally distributed, high-performance, computing platform (our global network) and provide a suite of integrated services including content delivery services, video content management services, performance services for website and web application acceleration and security, and cloud storage services. The suite of services that we offer collectively comprises our Limelight Orchestrate Platform (the Orchestrate Platform). Our mission is to securely manage and globally deliver digital content, building customer satisfaction through exceptional reliability and performance.
We derive revenue primarily from the sale of components of the Orchestrate Platform. Our delivery services represent approximately 78% of our total revenue for the year ended December 31, 2017. We also generate revenue through the sale of professional services and other infrastructure services, such as transit and rack space services.
We operate in markets that are highly competitive. We have experienced and expect to continue to experience increased competition in price, features, functionality, integration and other factors leading to customer churn and customers operating their own network. Competition and technology advancements have resulted in declining average selling prices in the industry. We believe continued increases in content delivery traffic growth rates, driven by increased migration of applications and data to the cloud, continued growth rates of mobile devices and increased consumption of rich media content and larger file sizes, are all important trends that will continue to outpace declining average selling prices in the industry.
For the year ended December 31, 2017, we had one customer, Amazon, who accounted for 10% or more of our total revenue. For the years ended December 31, 2016, and 2015, respectively, we had no customer who accounted for 10% or more of our total revenue. Changes in revenue are driven by a small subset of large customers who have low contractually committed obligations.
In addition to these revenue-related trends, our profitability is impacted by trends in our costs of services and operating expenses. We continuously work with our vendors to optimize our data center footprint. We continuously renegotiate our infrastructure contracts in order to scale our operations based on traffic levels and lower bandwidth costs per unit. Our operating expenses are largely driven by payroll and related employee costs. Our headcount increased from 510 at December 31, 2016, to 533 as of December 31, 2017.
On August 1, 2016, we entered into a settlement and license agreement with Akamai with respect to the ‘703 and certain other related patents. The agreement settles all asserted and unasserted claims with respect to the licensed patents. The terms of the agreement require us to pay $54,000 over twelve equal quarterly installments beginning on August 1, 2016. As of December 31, 2017, there remained $27,000 due to Akamai under the terms of the settlement and license agreement.
Please see our discussion in Note 11 "Contingencies - Legal Matters" of the Notes to Consolidated Financial Statements included in Part II, Item 8 of this annual report on Form 10-K for more information on this and other lawsuits.
Based on current conditions, we expect 2018 revenue to be between $196,000 and $200,000. We expect more than a 100 basis point improvement in gross margin for the full year. We expect non-GAAP earnings per share of between $0.11 and
30
$0.15 per share, and adjusted EBITDA of between $32,000 and $36,000. In addition, we expect capital expenditures to be between $22,000 and $24,000 for the full year.
The following table summarizes our revenue, costs and expenses for the years ended December 31, 2017, 2016, and 2015 (in thousands of dollars and as a percentage of total revenue).
Year Ended December 31, | ||||||||||||||||||||
2017 | 2016 | 2015 | ||||||||||||||||||
Revenues | $ | 184,360 | 100.0 | % | $ | 168,234 | 100.0 | % | $ | 170,912 | 100.0 | % | ||||||||
Cost of revenue | 96,561 | 52.4 | % | 96,889 | 57.6 | % | 102,793 | 60.1 | % | |||||||||||
Gross profit | 87,799 | 47.6 | % | 71,345 | 42.4 | % | 68,119 | 39.9 | % | |||||||||||
Operating expenses | 95,869 | 52.0 | % | 89,774 | 53.4 | % | 93,840 | 54.9 | % | |||||||||||
Provision for litigation | — | — | % | 54,000 | 32.1 | % | — | — | % | |||||||||||
Operating loss | (8,070 | ) | (4.4 | )% | (72,429 | ) | (43.1 | )% | (25,721 | ) | (15.0 | )% | ||||||||
Total other income (expense) | 866 | 0.5 | % | (893 | ) | (0.5 | )% | 2,036 | 1.2 | % | ||||||||||
Loss before income taxes | (7,204 | ) | (3.9 | )% | (73,322 | ) | (43.6 | )% | (23,685 | ) | (13.9 | )% | ||||||||
Income tax expense | 426 | 0.2 | % | 603 | 0.4 | % | 267 | 0.2 | % | |||||||||||
Net loss | $ | (7,630 | ) | (4.1 | )% | $ | (73,925 | ) | (43.9 | )% | $ | (23,952 | ) | (14.0 | )% | |||||
Use of Non-GAAP Financial Measures
To evaluate our business, we consider and use non-generally accepted accounting principles (Non-GAAP) net income (loss), EBITDA and Adjusted EBITDA as supplemental measures of operating performance. These measures include the same adjustments that management takes into account when it reviews and assesses operating performance on a period-to-period basis. We consider Non-GAAP net income (loss) to be an important indicator of overall business performance. We define Non-GAAP net income (loss) to be U.S. GAAP net loss, adjusted to exclude provision for litigation, share-based compensation, litigation expenses and amortization of intangible assets. We believe that EBITDA provides a useful metric to investors to compare us with other companies within our industry and across industries. We define EBITDA as U.S. GAAP net loss, adjusted to exclude depreciation and amortization, interest expense, interest and other (income) expense and income tax expense. We define Adjusted EBITDA as EBITDA adjusted to exclude provision for litigation, share-based compensation and litigation expenses. We use Adjusted EBITDA as a supplemental measure to review and assess operating performance. Our management uses these Non-GAAP financial measures because, collectively, they provide valuable information on the performance of our on-going operations, excluding non-cash charges, taxes and non-core activities (including interest payments related to financing activities). These measures also enable our management to compare the results of our on-going operations from period to period, and allow management to review the performance of our on-going operations against our peer companies and against other companies in our industry and adjacent industries. We believe these measures also provide similar insights to investors, and enable investors to review our results of operations “through the eyes of management.”
Furthermore, our management uses these Non-GAAP financial measures to assist them in making decisions regarding our strategic priorities and areas for future investment and focus.
In our February 7, 2018, earnings press release, as furnished on Form 8-K, we included Non-GAAP net income (loss), EBITDA and Adjusted EBITDA. The terms Non-GAAP net income (loss), EBITDA and Adjusted EBITDA are not defined under U.S. GAAP, and are not measures of operating income, operating performance or liquidity presented in accordance with U.S. GAAP. Our Non-GAAP net income (loss), EBITDA and Adjusted EBITDA have limitations as analytical tools, and when assessing our operating performance, Non-GAAP net income (loss), EBITDA and Adjusted EBITDA should not be considered in isolation, or as a substitute for net loss or other consolidated income statement data prepared in accordance with U.S. GAAP. Some of these limitations include, but are not limited to:
• | EBITDA and Adjusted EBITDA do not reflect our cash expenditures or future requirements for capital expenditures or contractual commitments; |
• | these measures do not reflect changes in, or cash requirements for, our working capital needs; |
• | Non- GAAP net income (loss) and Adjusted EBITDA do not reflect the cash requirements necessary for litigation costs, including provision for litigation and litigation expenses; |
31
• | these measures do not reflect the interest expense, or the cash requirements necessary to service interest or principal payments, on our debt that we may incur; |
• | these measures do not reflect income taxes or the cash requirements for any tax payments; |
• | although depreciation and amortization are non-cash charges, the assets being depreciated and amortized will be replaced sometime in the future, and EBITDA and Adjusted EBITDA do not reflect any cash requirements for such replacements; |
• | while share-based compensation is a component of operating expense, the impact on our financial statements compared to other companies can vary significantly due to such factors as the assumed life of the options and the assumed volatility of our common stock; and |
• | other companies may calculate Non-GAAP net income (loss), EBITDA and Adjusted EBITDA differently than we do, limiting their usefulness as comparative measures. |
We compensate for these limitations by relying primarily on our U.S. GAAP results and using Non-GAAP net income (loss), EBITDA, and Adjusted EBITDA only as supplemental support for management’s analysis of business performance. Non-GAAP net income (loss), EBITDA and Adjusted EBITDA are calculated as follows for the periods presented.
Reconciliation of Non-GAAP Financial Measures
In accordance with the requirements of Item 10(e) of Regulation S-K, we are presenting the most directly comparable U.S. GAAP financial measures and reconciling the unaudited Non-GAAP financial metrics to the comparable U.S. GAAP measures.
Reconciliation of U.S. GAAP Net Loss to Non-GAAP Net Income (Loss)
(Unaudited)
Year Ended December 31, | |||||||||||
2017 | 2016 | 2015 | |||||||||
U.S. GAAP net loss | $ | (7,630 | ) | $ | (73,925 | ) | $ | (23,952 | ) | ||
Provision for litigation | — | 54,000 | — | ||||||||
Share-based compensation | 12,744 | 13,459 | 12,338 | ||||||||
Litigation expenses | 5,518 | 7,284 | (613 | ) | |||||||
Amortization of intangible assets | — | 14 | 1,063 | ||||||||
Non-GAAP net income (loss) | $ | 10,632 | $ | 832 | $ | (11,164 | ) | ||||
Reconciliation of U.S. GAAP Net Loss to EBITDA to Adjusted EBITDA
(Unaudited)
Year Ended December 31, | |||||||||||
2017 | 2016 | 2015 | |||||||||
U.S. GAAP net loss | $ | (7,630 | ) | $ | (73,925 | ) | $ | (23,952 | ) | ||
Depreciation and amortization | 20,514 | 20,484 | 20,904 | ||||||||
Interest expense | 80 | 918 | 29 | ||||||||
Interest and other (income) expense | (946 | ) | (25 | ) | (2,065 | ) | |||||
Income tax expense | 426 | 603 | 267 | ||||||||
EBITDA | $ | 12,444 | $ | (51,945 | ) | $ | (4,817 | ) | |||
Provision for litigation | — | 54,000 | — | ||||||||
Share-based compensation | 12,744 | 13,459 | 12,338 | ||||||||
Litigation expenses | 5,518 | 7,284 | (613 | ) | |||||||
Adjusted EBITDA | $ | 30,706 | $ | 22,798 | $ | 6,908 | |||||
32
Critical Accounting Policies and Estimates
The preparation of consolidated financial statements and related disclosures in conformity with U.S. GAAP requires management to make judgments, assumptions, and estimates that affect the amounts reported in the consolidated financial statements and accompanying notes. Note 2 to the consolidated financial statements describes the significant accounting policies and methods used in the preparation of the consolidated financial statements. The accounting policies described below are significantly affected by critical accounting estimates. Such accounting policies require significant judgments, assumptions, and estimates used in the preparation of the consolidated financial statements, and actual results could differ materially from the amounts reported based on these policies.
Revenue Recognition
We derive revenue primarily from the sale of services that comprise components of the Orchestrate Platform. Our customers generally execute contracts with terms of one year or longer, which we refer to as recurring revenue contracts or long-term contracts. These contracts generally commit the customer to a minimum monthly level of usage with additional charges applicable for actual usage above the monthly minimum commitment. We define usage as customer data sent or received using our content delivery service, or content that is hosted or cached by us at the request or direction of our customer. We recognize the monthly minimum as revenue each month provided that an enforceable contract has been signed by both parties, the service has been delivered to the customer, the fee for the service is fixed or determinable, and collection is reasonably assured. Should a customer’s usage of our services exceed the monthly minimum commit, we recognize revenue for such excess in the period of the usage. For annual or other non-monthly period revenue commitments, we recognize revenue monthly based upon the customer’s actual usage each month of the commitment period and only recognize any remaining committed amount for the applicable period in the last month thereof.
Certain of our revenue arrangements consist of multi-element arrangements. Revenue arrangements with multiple deliverables are divided into separate units of accounting if each deliverable has stand-alone value to the customer. Our multiple-element arrangements may include a combination of some or all of the following: content delivery services, video content management services, performance services for website and web application acceleration and security, professional services, cloud storage and sale of equipment. Each of these products has stand-alone value and is sold separately. In the absence of vendor specific objective evidence (VSOE) or third-party evidence of selling prices, consideration would be allocated based on management’s best estimate of such prices. The deliverables within multiple-element arrangements are provided over the same contract period, and therefore, revenue is recognized over the same period.
We may charge the customer an installation fee when the services are first activated. We do not charge installation fees for contract renewals. Installation fees are recorded as deferred revenue and recognized as revenue ratably over the estimated life of the customer arrangement as installation fees do not have standalone value.
We also derive revenue from services and events sold as discrete, non-recurring events or based solely on usage. For these services, we recognize revenue after an enforceable contract has been signed by both parties, the fee is fixed or determinable, the event or usage has occurred, and collection is reasonably assured.
At the inception of a customer contract for service, we make an assessment as to that customer’s ability to pay for the services provided. If we subsequently determine that collection from the customer is not reasonably assured, we record an allowance for doubtful accounts and bad debt expense or deferred revenue for all of that customer’s unpaid invoices and cease recognizing revenue for continued services provided until cash is received.
Deferred revenue represents amounts billed to customers for which revenue has not been recognized. Deferred revenue primarily consists of the unearned portion of monthly billed service fees; prepayments made by customers for future periods and deferred installation fees.
Accounts Receivable and Related Reserves
Trade accounts receivable are recorded at the invoiced amounts and do not bear interest. We record reserves as a reduction of our accounts receivable balance for service credits and for doubtful accounts. Estimates are used in determining both of these reserves. The allowance for doubtful accounts charges are included as a component of general and administrative expenses.
Our allowance for doubtful accounts is based upon a calculation that uses our aging of accounts receivable and applies a reserve percentage to the specific age of the receivable to estimate the allowance for doubtful accounts. The reserve percentages are determined based on our historical write-off experience. These estimates could change significantly if our
33
customers’ financial condition changes or if the economy in general deteriorates. In the event such conditions become known, we specifically identify balances for necessary reserves.
Our reserve for future service credits relates to service credits that are expected to be issued to customers during the ordinary course of business. These credits typically relate to customer disputes and billing adjustments and are estimated at the time the revenue is recognized and recorded as a reduction of revenues. Estimates for service credits are based on an analysis of credits issued in previous periods.
Goodwill and Other Intangible Assets
We have recorded goodwill and other intangible assets as a result of past business acquisitions. Goodwill is recorded when the purchase price paid for an acquisition exceeds the estimated fair value of the net identified tangible and intangible assets acquired. In each of our acquisitions, the objective of the acquisition was to expand our product offerings and customer base and to achieve synergies related to cross selling opportunities, all of which contributed to the recognition of goodwill.
We test goodwill for impairment on an annual basis or more frequently if events or changes in circumstances indicate that goodwill might be impaired. We concluded that we have one reporting unit and assigned the entire balance of goodwill to this reporting unit. The estimated fair value of the reporting unit is determined using our market capitalization as of our annual impairment assessment date or more frequently if circumstances indicate the goodwill might be impaired. Items that could reasonably be expected to negatively affect key assumptions used in estimating fair value include but are not limited to:
• | sustained decline in our stock price due to a decline in our financial performance due to the loss of key customers, loss of key personnel, emergence of new technologies or new competitors and/or unfavorable outcomes of intellectual property disputes; |
• | decline in overall market or economic conditions leading to a decline in our stock price; and |
• | decline in observed control premiums paid in business combinations involving comparable companies. |
The estimated fair value of the reporting unit is determined using a market approach. Our market capitalization is adjusted for a control premium based on the estimated average and median control premiums of transactions involving companies comparable to us. As of the annual impairment testing date of October 31, 2017, we determined that goodwill was not impaired. We noted that the estimated fair value of our reporting unit exceeded carrying value by approximately $618,431 or 435%, using the market capitalization plus an estimated control premium of 40% on the annual impairment testing date. There were no indicators of impairment subsequent to the annual impairment testing date.
As of December 31, 2017, we have no other unamortized intangible assets. However, in prior years, our other intangible assets represented existing technologies and customer relationship intangibles. Other intangible assets are amortized over their respective estimated lives, ranging from less than one year to six years. In the event that facts and circumstances indicate intangibles or other long-lived assets may be impaired, we evaluate the recoverability and estimated useful lives of such assets. Amortization of other intangible assets is included in depreciation and amortization in the accompanying consolidated statements of operations.
Impairment and Useful Lives of Long-Lived Assets
We review our long-lived assets, such as fixed assets and amortizable intangible assets, for impairment whenever events or changes in circumstances indicate that the carrying amount of the assets may not be recoverable. Events that would trigger an impairment review include a change in the use of the asset or forecasted negative cash flows related to the asset. When such events occur, we compare the carrying amount of the asset to the undiscounted expected future cash flows related to the asset. If this comparison indicates that impairment is present, the amount of the impairment is calculated as the difference between the carrying amount and the fair value of the asset. If a readily determinable market price does not exist, fair value is estimated using discounted expected cash flows attributable to the asset. The estimates required to apply this accounting policy include forecasted usage of the long-lived assets, the useful lives of these assets, and expected future cash flows. Changes in these estimates could materially impact results from operations.
Contingencies
We record contingent liabilities resulting from asserted and unasserted claims when it is probable that a loss has been incurred and the amount of the loss is reasonably estimable. We disclose contingent liabilities when there is a reasonable possibility that the ultimate loss will exceed the recorded liability. Additionally, estimating the loss, or range of loss, associated with a contingency requires analysis of multiple factors, and changes in law or other developments may ultimately cause our
34
judgments to change. Therefore, actual losses in any future period are inherently uncertain and may be materially different from our estimate.
Deferred Taxes and Tax Reserves
Our provision for income taxes is comprised of a current and a deferred portion. The current income tax provision is calculated as the estimated taxes payable or refundable on tax returns for the current year. The deferred income tax provision is calculated for the estimated future tax effects attributable to temporary differences and carryforwards using expected tax rates in effect during the years in which the differences are expected to reverse or the carryforwards are expected to be realized.
We currently have net deferred tax assets consisting of net operating loss carryforwards, tax credit carryforwards and deductible temporary differences. Management periodically weighs the positive and negative evidence to determine if it is more likely than not that some or all of the deferred tax assets will be realized. Forming a conclusion that a valuation allowance is not required is difficult when there is negative evidence such as cumulative losses in recent years. As a result of our recent cumulative losses, we have recorded a valuation allowance to reduce our deferred tax assets to the amount that is more likely than not to be realized. In the event we were to determine that we would be able to realize our deferred income tax assets in the future in excess of their net recorded amount, we would make an adjustment to the valuation allowance which would reduce the provision for income taxes in the period of such realization.
We have recorded certain tax reserves to address potential exposures involving our income tax and sales and use tax positions. These potential tax liabilities result from the varying application of statutes, rules, regulations and interpretations by different taxing jurisdictions. Our estimate of the value of our tax reserves contain assumptions based on past experiences and judgments about the interpretation of statutes, rules and regulations by taxing jurisdictions. It is possible that the costs of the ultimate tax liability or benefit from these matters may be materially more or less than the amount that we estimated.
Uncertainty in income taxes is recognized in our financial statements under guidance that prescribes a two-step process to determine the amount of tax benefit to be recognized. First, the tax position must be evaluated to determine the likelihood that it will be sustained upon external examination. If the tax position is deemed more-likely-than-not to be sustained, the tax position is then assessed to determine the amount of benefit to recognize in the financial statements. The amount of the benefit that may be recognized is the largest amount that has a greater than 50% likelihood of being realized upon ultimate settlement. Our unrecognized tax benefit from uncertain tax positions decreased by $13 from January 1, 2017 to December 31, 2017. We anticipate that our unrecognized tax benefits may increase or decrease within twelve months of the reporting date, as audits or reviews are initiated or settled and as a result of settling potential tax liabilities in certain foreign jurisdictions. It is not currently reasonably possible to estimate the range of change. We recognize interest and penalties related to unrecognized tax benefits in our tax provision.
Our effective tax rate is influenced by the recognition of tax positions pursuant to the more likely than not standard that such positions will be sustained upon examination by the taxing authority. In addition, other factors such as changes in tax laws, rulings by taxing authorities and court decisions, and significant changes in our operations through acquisitions or divestitures can have a material impact on the effective tax rate. Differences between our estimated and actual effective income tax rates and related liabilities are recorded in the period they become known.
We conduct business in various foreign countries. As a multinational corporation, we are subject to taxation in multiple locations, and the calculation of our foreign tax liabilities involves dealing with uncertainties in the application of complex tax laws and regulations in various taxing jurisdictions. If we ultimately determine that the payment of these liabilities will be unnecessary, we reverse the liability and recognize a tax benefit during the period in which we determine the liability no longer applies. Conversely, we record additional tax charges in a period in which we determine that a recorded tax liability is less than we expect the ultimate assessment to be.
The application of tax laws and regulations is subject to legal and factual interpretation, judgment and uncertainty. Tax laws and regulations themselves are subject to change as a result of changes in fiscal policy, changes in legislation, the evolution of regulations and court rulings. Therefore, the actual liability for United States or foreign taxes may be materially different from our estimates, which could result in the need to record additional tax liabilities or potentially reverse previously recorded tax liabilities.
On December 22, 2017, the Tax Cuts and Jobs Act (the Tax Act) significantly revised the U.S. corporate income tax law, by among other things, reducing the corporate income tax rate to 21% for tax years beginning in 2018, implementing a modified territorial system that includes a one-time transition tax on deemed repatriated earnings of foreign subsidiaries and creating new taxes on certain foreign sourced earnings. Also on December 22, 2017, The Securities and Exchange Commission staff issued Staff Accounting Bulletin (SAB) 118 to provide guidance for companies that are not able to complete their accounting for the income tax effects of the Tax Act in the period of enactment. SAB 118 provides for a measurement period of
35
up to one year from the date of enactment. During the measurement period, companies need to reflect adjustments to any provisional amounts if it obtains, prepares or analyzes additional information about facts and circumstances that existed as of the enactment date that, if known, would have affected the income tax effects initially reported as provisional amounts.
At December 31, 2017, we have not yet completed our analysis of the Tax Act; however, in certain circumstances, as described below, we have made a reasonable estimate of the effects of the Tax Act.
Provisional Amounts
Income tax expense for the year ending December 31, 2017 includes a $41 tax benefit related to the re-measurement of a deferred tax liability on a long-lived asset. The remaining impact from the re-measurement of our net U.S. deferred tax asset at the lower 21% rate was offset by the valuation allowance.
The one-time transition tax is based on our total post-1986 earnings and profits (E&P) that we previously deferred from U.S. income taxes. We recorded a provisional amount for our one-time transition tax liability for all of our foreign subsidiaries. The transition tax that we calculated resulted in an immaterial amount of additional federal taxable income. The additional taxable income from the transition tax was offset by NOLs and did not result in cash taxes payable. No additional income taxes have been provided for any remaining undistributed foreign earnings not subject to the transition tax, or any additional outside basis differences inherent in these entities, as these amounts continue to be indefinitely reinvested in foreign operations. Determining the amount of unrecognized deferred tax liability related to any remaining undistributed earnings not subject to the transition tax and additional outside basis difference in these entities (i.e. basis difference in excess of that subject to the one-time transition tax) is not practicable.
The tax provision incorporates assumptions made based upon our current interpretation of the Tax Act, and may change as we receive additional clarification and implementation guidance and as the interpretation of the Tax Act evolves over time.
The Tax Act contains several base broadening provisions that became effective on January 1, 2018 that we do not expect to have a material impact on future earnings due to our NOL and valuation allowance position. Also effective for 2018 is a new Global Intangible Low-Taxed Income inclusion (GILTI). We do not expect the GILTI to have a material impact on future earnings due to our NOL and valuation allowance position. We will account for the impact of the GILTI in the period we become subject to its provisions.
Share-Based Compensation
We account for our share-based compensation awards using the fair-value method. The grant date fair value was determined using the Black-Scholes-Merton pricing model. The Black-Scholes-Merton valuation calculation requires us to make key assumptions such as future stock price volatility, expected terms, risk-free rates, and dividend yield. Our expected volatility is derived from our volatility rate as a publicly traded company. The expected term is based on our historical experience. The risk-free interest factor is based on the United States Treasury yield curve in effect at the time of the grant for zero coupon United States Treasury notes with maturities of approximately equal to each grant’s expected term. We have never paid cash dividends and do not currently intend to pay cash dividends, and therefore, we have assumed a 0% dividend yield.
We develop an estimate of the number of share-based awards that will be forfeited due to employee turnover. We will continue to use judgment in evaluating the expected term, volatility, and forfeiture rate related to our own share-based awards on a prospective basis, and in incorporating these factors into the model. If our actual experience differs significantly from the assumptions used to compute our share-based compensation cost, or if different assumptions had been used, we may have recorded too much or too little share-based compensation cost.
We apply the straight-line attribution method to recognize compensation costs associated with awards that are not subject to graded vesting. For awards that are subject to graded vesting and performance based awards, we recognize compensation costs separately for each vesting tranche. We also estimate when and if performance-based awards will be earned. If an award is not considered probable of being earned, no amount of share-based compensation is recognized. If the award is deemed probable of being earned, related compensation expense is recorded over the estimated service period. To the extent our estimates of awards considered probable of being earned changes, the amount of share-based compensation recognized will also change.
36
Results of Continuing Operations
Comparison of the Years Ended December 31, 2017 and 2016
Revenue
We derive revenue primarily from the sale of components of the Orchestrate Platform. We also generate revenue through the sale of professional services and other infrastructure services, such as transit and rack space services.
The following table reflects our revenue for the year ended December 31, 2017, compared to December 31, 2016:
Year Ended December 31, | ||||||||||||||
Increase | Percent | |||||||||||||
2017 | 2016 | (Decrease) | Change | |||||||||||
Revenue | $ | 184,360 | $ | 168,234 | $ | 16,126 | 9.6 | % | ||||||
Our revenue increased during the year ended December 31, 2017, versus 2016 primarily due to an increase in our content delivery revenue, which was driven by increases in volumes with certain of our larger customers. The increase in volumes in 2017 was partially offset by a small decrease in our average selling price versus the comparable 2016 period.
Our active customers worldwide decreased to 717 as of December 31, 2017, compared to 851 as of December 31, 2016. We are continuing our selective approach to accepting profitable business by following a clear process for identifying customers that value quality, performance, availability, and service.
During the years ended December 31, 2017 and 2016, sales to our top 20 customers accounted for approximately 66% and 62%, respectively of our total revenue. The customers that comprised our top 20 customers change, and our large customers may not continue to be as significant going forward as they have been in the past.
During the year ended December 31, 2017, we had one customer, Amazon, who represented 10% or more of our total revenue. During the year ended December 31, 2016, we had no customer who represented 10% or more of our total revenue.
Revenue by geography is based on the location of the customer from which the revenue is earned. The following table sets forth revenue by geographic area (in thousands and as a percentage of total revenue):
Year Ended December 31, | |||||||||||
2017 | 2016 | ||||||||||
Americas | $ | 116,112 | 63.0 | % | $ | 100,421 | 59.7 | % | |||
EMEA | 37,212 | 20.2 | % | 31,326 | 18.6 | % | |||||
Asia Pacific | 31,036 | 16.8 | % | 36,487 | 21.7 | % | |||||
Total revenue | $ | 184,360 | 100.0 | % | $ | 168,234 | 100.0 | % | |||
Cost of Revenue
Cost of revenue consists primarily of fees paid to network providers for bandwidth and backbone, costs incurred for non-settlement free peering and connection to Internet service providers, and fees paid to data center operators for housing of our network equipment in third party network data centers, also known as co-location costs. Cost of revenue also includes leased warehouse space and utilities, depreciation of network equipment used to deliver our content delivery services, payroll and related costs, and share-based compensation for our network operations and professional services personnel. Other costs include professional fees and outside services, travel and travel-related expenses and royalty expenses.
37
Cost of revenue was composed of the following (in thousands and as a percentage of total revenue):
Year Ended December 31, | |||||||||||||
2017 | 2016 | ||||||||||||
Bandwidth and co-location fees | $ | 54,033 | 29.3 | % | $ | 56,596 | 33.6 | % | |||||
Depreciation - network | 18,138 | 9.8 | % | 18,032 | 10.7 | % | |||||||
Payroll and related employee costs | 16,651 | 9.0 | % | 15,061 | 9.0 | % | |||||||
Share-based compensation | 1,450 | 0.8 | % | 1,493 | 0.9 | % | |||||||
Other costs | 6,289 | 3.4 | % | 5,707 | 3.4 | % | |||||||
Total cost of revenue | $ | 96,561 | 52.4 | % | $ | 96,889 | 57.6 | % | |||||
Our cost of revenue decreased in aggregate dollars and as a percentage of revenue for the year ended December 31, 2017, versus 2016 primarily as a result of the following:
• | Bandwidth and co-location fees decreased primarily due to decreased peering and co-location costs reflecting our continued co-location consolidation efforts and contract negotiations with our vendors. Our peering and co-location costs decreased in both aggregate dollars and as a percentage of total revenue due to improved server and operational efficiencies resulting in additional revenue without corresponding proportional costs. |
This decrease was partially off-set by an increase in:
• | Payroll and related employee costs due to increased operations personnel and higher annual variable compensation; and |
• | Increased other costs primarily due to other cost of sales, travel, fees and licenses and outside labor costs. |
General and Administrative
General and administrative expense was composed of the following (in thousands and as a percentage of total revenue):
Year Ended December 31, | |||||||||||||
2017 | 2016 | ||||||||||||
Payroll and related employee costs | $ | 12,521 | 6.8 | % | $ | 7,845 | 4.7 | % | |||||
Professional fees and outside services | 3,213 | 1.7 | % | 3,289 | 2.0 | % | |||||||
Share-based compensation | 6,502 | 3.5 | % | 7,070 | 4.2 | % | |||||||
Litigation expenses | 5,518 | 3.0 | % | 7,284 | 4.3 | % | |||||||
Other costs | 4,299 | 2.3 | % | 4,554 | 2.7 | % | |||||||
Total general and administrative | $ | 32,053 | 17.4 | % | $ | 30,042 | 17.9 | % | |||||
Our general and administrative expense increased in aggregate dollars and decreased as a percentage of total revenue for the year ended December 31, 2017, versus 2016. The increase in aggregate dollars was primarily due to increased payroll and related employee costs due to higher headcount, average salaries, and annual variable compensation. These increases were partially off-set by a decrease in litigation expenses related to our intellectual property lawsuits. Other costs decreased as a result of a state sales tax refund received in the second quarter of 2017 which off-set an increase in bad debt.
We expect our general and administrative expenses for 2018 to increase slightly in aggregate dollars compared to 2017, but to remain consistent as a percentage of revenue.
38
Sales and Marketing
Sales and marketing expense was composed of the following (in thousands and as a percentage of total revenue):
Year Ended December 31, | |||||||||||||
2017 | 2016 | ||||||||||||
Payroll and related employee costs | $ | 25,064 | 13.6 | % | $ | 22,379 | 13.3 | % | |||||
Share-based compensation | 2,470 | 1.3 | % | 2,792 | 1.7 | % | |||||||
Marketing programs | 2,002 | 1.1 | % | 1,416 | 0.8 | % | |||||||
Other costs | 6,562 | 3.6 | % | 6,358 | 3.8 | % | |||||||
Total sales and marketing | $ | 36,098 | 19.6 | % | $ | 32,945 | 19.6 | % | |||||
Our sales and marketing expense increased in aggregate dollars and remained constant as a percentage of total revenue for the year ended December 31, 2017, versus 2016. The increase in sales and marketing expense was primarily as a result of the following:
• | increased payroll and related employee costs due to increased headcount and higher variable compensation; |
• | increased marketing spending related to public relations, advertising and trade shows; and |
• | increased other costs which related to our annual sales meeting, off-set by lower fees and licenses. |
These increases were partially offset by decreased share-based compensation costs.
We expect our sales and marketing expenses for 2018 to increase compared with 2017 as we expand our sales force and marketing efforts.
Research and Development
Research and development expense was composed of the following (in thousands and as a percentage of total revenue):
Year Ended December 31, | |||||||||||||
2017 | 2016 | ||||||||||||
Payroll and related employee costs | $ | 18,647 | 10.1 | % | $ | 18,270 | 10.9 | % | |||||
Share-based compensation | 2,322 | 1.3 | % | 2,104 | 1.3 | % | |||||||
Other costs | 4,373 | 2.4 | % | 3,961 | 2.4 | % | |||||||
Total research and development | $ | 25,342 | 13.7 | % | $ | 24,335 | 14.5 | % | |||||
Our research and development expense increased in aggregate dollars and decreased as a percentage of total revenue for the year ended December 31, 2017, versus 2016. The increase in aggregate dollars was primarily due to increased payroll and related employee costs due to higher annual variable compensation, partially offset by lower average salaries. Additionally, other costs increased primarily due to an increase in outside labor costs.
We expect our research and development expenses for 2018 to remain consistent with 2017.
Depreciation and Amortization (Operating Expenses)
Depreciation and amortization expense was $2,376, or 1.3% of revenue, for the year ended December 31, 2017, versus $2,452, or 1.5% of revenue for 2016. Depreciation expense consists of depreciation on equipment and furnishings used by general administrative, sales and marketing, and research and development personnel. Amortization expense consists of amortization of intangible assets acquired in business combinations.
Interest Expense
Interest expense was $80 for the year ended December 31, 2017, versus $918 for 2016. This decrease was primarily due to a reduction in interest on our line of credit borrowings, capital leases, fees and the amortization of fees associated with our Credit Agreement. See Note 8 of Notes to Consolidated Financial Statements included in Part II, Item 8 of this annual report on Form 10-K for additional information related to our Credit Agreement.
39
Interest Income
Interest income was $494 for the year ended December 31, 2017, versus $123 for 2016. Interest income includes interest earned on invested cash balances and marketable securities.
Other Income (Expense)
Other income (expense) was $452 for the year ended December 31, 2017, versus $(98) for 2016. For the year ended December 31, 2017, other income consisted primarily of the gain on sale of fixed assets and foreign currency transaction gains and losses.
For the year ended December 31, 2016, other income consisted primarily of foreign currency transaction gains and losses, the gain on sale of fixed assets, and the receipt of a state tax refund related to a previously divested business.
Income Tax Expense
Income tax expense for the year ended December 31, 2017, was $426 versus $603 for 2016. Income tax expense on the loss before taxes was different than the statutory income tax rate primarily due to our providing for a valuation allowance on deferred tax assets in certain jurisdictions, and recording of state and foreign tax expense for the year. The effective income tax rate is based primarily upon income or loss for the year, the composition of the income or loss in different countries, and adjustments, if any, for the potential tax consequences, benefits or resolutions for tax audits.
On December 22, 2017, the Tax Cuts and Jobs Act (the Tax Act) significantly revised the U.S. corporate income tax law, by among other things, reducing the corporate income tax rate to 21% for tax years beginning in 2018, implementing a modified territorial system that includes a one-time transition tax on deemed repatriated earnings of foreign subsidiaries and creating new taxes on certain foreign sourced earnings.
Income tax expense for the year ending December 31, 2017 includes a $41 tax benefit related to the re-measurement of a deferred tax liability on a long-lived asset resulting from the federal corporate rate reduction to 21%. The remaining impact from the re-measurement of our net U.S. deferred tax asset at the lower 21% rate was offset by the valuation allowance.
Comparison of the Years Ended December 31, 2016 and 2015
Revenue
The following table reflects our revenue for the year ended December 31, 2016, compared to December 31, 2015:
Year Ended December 31, | ||||||||||||||
Increase | Percent | |||||||||||||
2016 | 2015 | (Decrease) | Change | |||||||||||
Revenue | $ | 168,234 | $ | 170,912 | $ | (2,678 | ) | (1.6 | )% | |||||
Our revenue decreased during the year ended December 31, 2016, versus 2015 primarily due to a decrease in our content delivery revenue, which was driven by a decrease in our average selling price, partially offset by increases in volumes primarily with certain of our larger customers.
Our active customers worldwide decreased to 851 as of December 31, 2016, compared to 963 as of December 31, 2015. We are continuing our selective approach to accepting profitable business by following a clear process for identifying customers that value quality, performance, availability, and service.
During the year ended December 31, 2016 and 2015, sales to our top 20 customers accounted for approximately 62% and 57%, respectively of our total revenue. The customers that comprised our top 20 customers change, and our large customers may not continue to be as significant going forward as they have been in the past.
During the year ended December 31, 2016 and 2015, we had no customer who represented 10% or more of our total revenue.
40
Revenue by geography is based on the location of the customer from which the revenue is earned. The following table sets forth revenue by geographic area (in thousands and as a percentage of total revenue):
Year Ended December 31, | |||||||||||
2016 | 2015 | ||||||||||
Americas | $ | 100,421 | 59.7 | % | $ | 102,505 | 60.0 | % | |||
EMEA | 31,326 | 18.6 | % | 32,505 | 19.0 | % | |||||
Asia Pacific | 36,487 | 21.7 | % | 35,902 | 21.0 | % | |||||
Total revenue | $ | 168,234 | 100.0 | % | $ | 170,912 | 100.0 | % | |||
Cost of Revenue
Cost of revenue was composed of the following (in thousands and as a percentage of total revenue):
Year Ended December 31, | |||||||||||||
2016 | 2015 | ||||||||||||
Bandwidth and co-location fees | $ | 56,596 | 33.6 | % | $ | 58,608 | 34.3 | % | |||||
Depreciation - network | 18,032 | 10.7 | % | 17,975 | 10.5 | % | |||||||
Payroll and related employee costs | 15,061 | 9.0 | % | 17,960 | 10.5 | % | |||||||
Share-based compensation | 1,493 | 0.9 | % | 2,047 | 1.2 | % | |||||||
Other costs | 5,707 | 3.4 | % | 6,203 | 3.6 | % | |||||||
Total cost of revenue | $ | 96,889 | 57.6 | % | $ | 102,793 | 60.1 | % | |||||
Our cost of revenue decreased in aggregate dollars and as a percentage of revenue for the year ended December 31, 2016, versus 2015 primarily as a result of the following:
• | decreased payroll and related employee costs due to lower average salary per employee and a reduction in variable compensation. This decrease includes the reduction of payroll and related employee costs resulting from the reorganization of job responsibilities on April 1, 2015 (as further discussed below); |
• | decreased bandwidth and co-location fees. Co-location fees decreased as a result of our continued consolidation efforts, partially offset by an increase in bandwidth costs due to higher deliver traffic volume; and |
• | decreased other costs primarily due to lower professional fees, travel and facilities expenses. |
Effective April 1, 2015, we reorganized the job responsibilities of certain employees, and as a result, such employee expenses were moved from cost of services to research and development, on a prospective basis. This reorganization resulted in approximately $650 per quarter of payroll and related employee costs starting in the second quarter of 2015 to be allocated to research and development, which were previously allocated to cost of services.
General and Administrative
General and administrative expense was composed of the following (in thousands and as a percentage of total revenue):
Year Ended December 31, | |||||||||||||
2016 | 2015 | ||||||||||||
Payroll and related employee costs | $ | 7,845 | 4.7 | % | $ | 10,105 | 5.9 | % | |||||
Professional fees and outside services | 3,289 | 2.0 | % | 4,134 | 2.4 | % | |||||||
Share-based compensation | 7,070 | 4.2 | % | 5,398 | 3.2 | % | |||||||
Litigation expenses | 7,284 | 4.3 | % | (613 | ) | (0.4 | )% | ||||||
Other costs | 4,554 | 2.7 | % | 6,003 | 3.5 | % | |||||||
Total general and administrative | $ | 30,042 | 17.9 | % | $ | 25,027 | 14.6 | % | |||||
Our general and administrative expense increased in aggregate dollars and increased as a percentage of total revenue for the year ended December 31, 2016, versus 2015. The increase was primarily due to increased litigation expenses related to
41
our intellectual property lawsuits and an increase in share-based compensation. Litigation expenses in the year ended December 31, 2015 include a vendor negotiated reduction to litigation expense of $1,200.
These increases were partially offset by decreased payroll and related employee costs, which was driven by lower general and administrative headcount, lower average salary per employee and decreased variable compensation. In addition, professional fees decreased as a result of lower general legal fees.
Sales and Marketing
Sales and marketing expense was composed of the following (in thousands and as a percentage of total revenue):
Year Ended December 31, | |||||||||||||
2016 | 2015 | ||||||||||||
Payroll and related employee costs | $ | 22,379 | 13.3 | % | $ | 25,402 | 14.9 | % | |||||
Share-based compensation | 2,792 | 1.7 | % | 2,657 | 1.6 | % | |||||||
Marketing programs | 1,416 | 0.8 | % | 1,690 | 1.0 | % | |||||||
Other costs | 6,358 | 3.8 | % | 8,119 | 4.8 | % | |||||||
Total sales and marketing | $ | 32,945 | 19.6 | % | $ | 37,868 | 22.2 | % | |||||
Our sales and marketing expense decreased in both aggregate dollars and as a percentage of total revenue for the year ended December 31, 2016, versus 2015. The decrease in sales and marketing expense was primarily as a result of the following:
• | decreased payroll and related employee costs due to lower average salaries for sales and marketing personnel and a reduction in variable compensation; |
• | decreased other costs which was primarily lower travel and entertainment expenses, reduced other employee costs and lower professional fees (consulting and recruiting); and |
• | decreased marketing and public relations spending related to advertising and trade shows. |
These decreases were partially offset by increased share-based compensation costs.
Research and Development
Research and development expense was composed of the following (in thousands and as a percentage of total revenue):
Year Ended December 31, | |||||||||||||
2016 | 2015 | ||||||||||||
Payroll and related employee costs | $ | 18,270 | 10.9 | % | $ | 21,445 | 12.5 | % | |||||
Share-based compensation | 2,104 | 1.3 | % | 2,236 | 1.3 | % | |||||||
Other costs | 3,961 | 2.4 | % | 4,335 | 2.5 | % | |||||||
Total research and development | $ | 24,335 | 14.5 | % | $ | 28,016 | 16.4 | % | |||||
Our research and development expense decreased in aggregate dollars and as a percentage of total revenue for the year ended December 31, 2016, versus 2015. The decrease was primarily due to decreased payroll and related employee costs due to decreased headcount and decreased other costs, which was driven by reduced travel and entertainment expenses, reduced professional fees, which were primarily consulting costs, reduced fees and licenses and lower other employee costs.
Effective April 1, 2015, we reorganized the job responsibilities of certain employees, and as a result, such employee expenses were moved from cost of services to research and development, on a prospective basis. This reorganization resulted in approximately $650 of payroll and related employee costs starting in the second quarter of 2015 being allocated to research and development, which were previously allocated to cost of services.
42
Depreciation and Amortization (Operating Expenses)
Depreciation and amortization expense was $2,452, or 1.5% of revenue, for the year ended December 31, 2016, versus $2,929, or 1.7% of revenue for 2015. Depreciation expense consists of depreciation on equipment and furnishings used by general administrative, sales and marketing, and research and development personnel. Amortization expense consists of amortization of intangible assets acquired in business combinations. The decrease for the year ended December 31, 2016 was the result of lower amortization of intangible assets.
Interest Expense
Interest expense was $918 for the year ended December 31, 2016, versus $29 for 2015. This increase was primarily due to interest on our line of credit borrowings, capital leases, fees and the amortization of fees associated with our Credit Agreement. See Note 8 of Notes to Consolidated Financial Statements included in Part II, Item 8 of this annual report on Form 10-K for additional information related to our Credit Agreement.
Interest Income
Interest income was $123 for the year ended December 31, 2016, versus $317 for 2015. Interest income includes interest earned on invested cash balances and marketable securities.
Other Income (Expense)
Other income (expense) was $(98) for the year ended December 31, 2016, versus $1,748 for 2015. For the year ended December 31, 2016, other income consisted primarily of foreign currency transaction gains and losses, the gain on sale of fixed assets, and the receipt of a state tax refund related to a previously divested business.
For the year ended December 31, 2015, other income consists primarily of foreign currency transaction gains and losses, the $275 gain on the conversion of our investment in a convertible debt security into preferred shares and gain on sale of assets.
Income Tax Expense
Income tax expense for the year ended December 31, 2016, was $603 versus $267 for 2015. Income tax expense on the loss before taxes was different than the statutory income tax rate primarily due to our providing for a valuation allowance on deferred tax assets in certain jurisdictions, and recording of state and foreign tax expense for the year. The effective income tax rate is based primarily upon income or loss for the year, the composition of the income or loss in different countries, and adjustments, if any, for the potential tax consequences, benefits or resolutions for tax audits.
Liquidity and Capital Resources
As of December 31, 2017, our cash, cash equivalents and marketable securities classified as current totaled $49,316. Included in this amount is approximately $3,557 of cash and cash equivalents held outside the United States. Changes in cash, cash equivalents and marketable securities are dependent upon changes in, among other things, working capital items such as deferred revenues, accounts payable, accounts receivable, accrued provision for litigation and various accrued expenses, as well as purchases of property and equipment and changes in our capital and financial structure due to debt repurchases and issuances, stock option exercises, sales of equity investments and similar events.
In August 2016, we entered into a settlement and license agreement with Akamai with respect to the ‘703 and certain other related patents. The agreement settles all asserted and unasserted claims with respect to the licensed patents. The terms of the agreement require us to pay $54,000 over twelve equal quarterly installments beginning on August 1, 2016. As of December 31, 2017, there remained $27,000 due to Akamai under the terms of the settlement and license agreement.
We believe that our existing cash, cash equivalents and marketable securities, and available borrowing capacity will be sufficient to meet our anticipated cash needs for at least the next 12 months. If the assumptions underlying our business plan regarding future revenue and expenses change or if unexpected opportunities or needs arise, we may seek to raise additional cash by selling equity or debt securities.
The major components of changes in cash flows for the years ended December 31, 2017, 2016, and 2015 are discussed in the following paragraphs.
43
Operating Activities
Net cash provided by operating activities was $5,498 for the year ended December 31, 2017, versus $6,558 for 2016, a decrease of $1,060. Changes in operating assets and liabilities of $(21,425) during the year ended December 31, 2017, versus $(7,937) in 2016 were primarily due to:
• | provision for litigation decreased by $18,000 as a result of our settlement agreement payments made to Akamai; |
• | accounts receivable increased $5,912 during the year ended December 31, 2017 as a result of timing of collections as compared to a $760 increase in the comparable 2016 period; |
• | prepaid expenses and other current assets increased $342 during the year ended December 31, 2017, due to an increase in prepaid bandwidth expenses and VAT receivables, compared to a $4,648 decrease in the comparable 2016 period; and |
• | accounts payable and other current liabilities increased $4,019 during the year ended December 31, 2017, versus a decrease of $1,757 for the comparable 2016 period due to increased variable compensation accruals and the timing of vendor payments. |
Net cash provided by operating activities was $6,558 for the year ended December 31, 2016, versus $6,441 for 2015, an increase of $117. Changes in operating assets and liabilities of ($7,937) during the year ended December 31, 2016, versus ($2,535) in 2015 were primarily due to:
• | accounts receivable increased $760 during the year ended December 31, 2016, due to the timing of billings net of collections, and an increase in our days sales outstanding (DSO) as compared to a $5,210 increase in 2015; |
• | prepaid expenses and other current assets decreased $4,648 during the year ended December 31, 2016, due to the receipt of VAT refunds and the amortization of prepaid bandwidth expenses compared to a $194 increase in 2015; |
• | other assets decreased $580 during the year ended December 31, 2016, versus a decrease of $3,064 for 2015 primarily due to a reduction in vendor deposits and other long term assets; |
• | accounts payable and other current liabilities decreased $1,757 during the year ended December 31, 2016, versus an increase of $85 for 2015 due to the timing of vendor payments and the payment of 2015 accrued compensation; |
• | deferred revenue decreased $822 during the year ended December 31, 2016, versus a decrease of $932 for 2015 due to recognition of revenue and churn in our deferred revenue balance; and |
• | provision for litigation decreased by $9,000 during the year ended December 31, 2016 as a result of our settlement agreement payments made to Akamai. |
Cash provided by operating activities may not be sufficient to cover new purchases of property and equipment during 2018 and potential litigation expenses associated with patent litigation, including any potential payment required on the ultimate outcomes of the associated litigation. The timing and amount of future working capital changes and our ability to manage our days sales outstanding will also affect the future amount of cash used in or provided by operating activities.
Investing Activities
Net cash used in investing activities was $4,802 for the year ended December 31, 2017, versus $25,373 for 2016 and $18,915 for the year ended December 31, 2015. Net cash used in investing activities was primarily related to the purchase of marketable securities, and capital expenditures primarily for servers and network equipment associated with the build-out and expansion of our global computing platform, partially offset by cash received from the sale and maturities of marketable securities.
We expect to have ongoing capital expenditure requirements as we continue to invest in and expand our content delivery network. During 2017, we made capital expenditures of $20,725, which represented approximately 11% of our total revenue. We currently expect an increase in capital expenditures in 2018 compared to 2017, as we continue to increase the capacity of our global network and re-fresh our systems.
Financing Activities
Net cash used in financing activities was $1,848 for the year ended December 31, 2017, versus $3,924 for 2016. Net cash used in financing activities in the year ended December 31, 2017, primarily relates to payments of employee tax withholdings related to the net settlement of vested restricted stock units of $4,496, offset by cash received from the exercise of stock options and our employee stock purchase plan of $2,648.
44
Net cash used in financing activities was $3,924 for the year ended December 31, 2016, versus $19 for 2015. Net cash used in financing activities in the year ended December 31, 2016, related to payments made on our capital lease obligations of $4,685 and payments of employee tax withholdings related to the net settlement of vested restricted stock units of $1,982, offset by cash received from the exercise of stock options and our employee stock purchase plan of $2,743.
Line of Credit
In October 2017, we entered into a Third Amendment (Third Amendment) to the Loan and Security Agreement (the Credit Agreement) with Silicon Valley Bank (SVB) originally entered into in November 2015. Under the Third Amendment, we have increased the maximum principal commitment amount from $5,000 to $10,000. The Third Amendment extends the Credit Agreement one year. All outstanding borrowings owed under the Credit Agreement become due and payable no later than the final maturity date of November 2, 2019.
As of December 31, 2017, we had no outstanding borrowings, and we had availability under the Credit Agreement of approximately $10,000.
Financial Covenants and Borrowing Limitations
The Credit Agreement requires, and any future credit facilities will likely require, us to comply with specified financial requirements that may limit the amount we can borrow. A breach of any of these covenants could result in a default. Our ability to satisfy those covenants depends principally upon our ability to meet or exceed certain financial performance results. Any debt agreements we enter into in the future may further limit our ability to enter into certain types of transactions.
Under the Third Amendment, we are required to maintain a minimum liquidity of $10,000 at all times, measured quarterly, with a minimum of $5,000 of the $10,000 in cash at SVB. We are also subject to certain customary limitations on our ability to, among other things, incur debt, grant liens, make acquisitions and other investments, make certain restricted payments such as dividends, dispose of assets or undergo a change in control. As of December 31, 2017, we were in compliance with all covenants under the Credit Agreement.
For a more detailed discussion regarding our Credit Agreement, please refer to Note 8 "Line of Credit" of the Notes to Consolidated Financial Statements included in Part II, Item 8 of this Annual Report on Form 10-K.
We may be prevented from taking advantage of business opportunities that arise because of the limitations imposed on us by restrictive covenants within the Credit Agreement. These restrictions may also limit our ability to plan for or react to market conditions, meet capital needs or otherwise restrict our activities or business plans and adversely affect our ability to finance our operations, enter into acquisitions, execute our business strategy, effectively compete with companies that are not similarly restricted or engage in other business activities that would be in our interest. In the future, we may also incur debt obligations that might subject us to additional and different restrictive covenants that could affect our financial and operational flexibility. We cannot assure you that we will be granted waivers or amendments to the indenture governing the Credit Agreement, or such other debt obligations if for any reason we are unable to comply with our obligations thereunder or that we will be able to refinance our debt on acceptable terms, or at all, should we seek to do so. Any such limitations on borrowing under the Credit Agreement, including payments related to litigation, could have a material adverse impact on our liquidity and our ability to continue as a going concern could be impaired.
Capital leases
We occasionally acquire equipment under capital lease agreements. The outstanding balance for capital leases was approximately $1,902 as of December 31, 2015. During the year ended December 31, 2016, we paid $4,236, which represented the outstanding balance for all capital lease obligations at that time. As of December 31, 2016 and 2017, we had no outstanding capital lease obligations.
Share repurchases
On March 14, 2017, our board of directors authorized a $25,000 share repurchase program. Any shares repurchased under this program will be canceled and returned to authorized but unissued status. This new share repurchase program replaces the $9,500 remaining from the previously announced $15,000 share repurchase program. During the years ended December 31, 2017 and 2016, respectively, we did not repurchase any shares under the repurchase programs. During the year ended December 31, 2015, we repurchased 293 shares.
45
Contractual Obligations, Contingent Liabilities, and Commercial Commitments
In the normal course of business, we make certain long-term commitments for operating leases, primarily office facilities, bandwidth, and computer rack space. These leases expire on various dates ranging from 2018 to 2022. We expect that the growth of our business will require us to continue to add to and increase our long-term commitments in 2018 and beyond. As a result of our growth strategies, we believe that our liquidity and capital resources requirements will grow.
The following table presents our contractual obligations and commercial commitments, as of December 31, 2017 over the next five years and thereafter (in thousands):
Payments Due by Period | ||||||||||||||||||||
Less than | More than | |||||||||||||||||||
Total | 1 year | 1-3 years | 3-5 years | 5 years | ||||||||||||||||
Operating Leases | ||||||||||||||||||||
Bandwidth leases | $ | 31,605 | $ | 21,103 | $ | 10,476 | $ | 26 | $ | — | ||||||||||
Co-location leases | 13,464 | 10,684 | 2,780 | — | — | |||||||||||||||
Real estate leases | 4,947 | 2,666 | 1,867 | 414 | — | |||||||||||||||
Total operating leases | 50,016 | 34,453 | 15,123 | 440 | — | |||||||||||||||
Settlement agreement | 27,000 | 18,000 | 9,000 | — | — | |||||||||||||||
Total commitments | $ | 77,016 | $ | 52,453 | $ | 24,123 | $ | 440 | $ | — | ||||||||||
Off Balance Sheet Arrangements
As of December 31, 2017, we are not involved in any off-balance sheet arrangements, as defined in Item 303(a)(4)(ii) of SEC Regulation S-K.
New Accounting Pronouncements
See Item 8 of Part II, “Financial Statements and Supplementary Data - Note 2 - Summary of Significant Accounting Policies - Recent Accounting Standards.”
Item 7A. Quantitative and Qualitative Disclosures about Market Risk
Interest Rate Risk
Our exposure to market risk for changes in interest rates relates primarily to our debt and investment portfolio. In our investment portfolio, we do not use derivative financial instruments. Our investments are primarily with our commercial and investment banks and, by policy, we limit the amount of risk by investing primarily in money market funds, United States Treasury obligations, high quality corporate and municipal obligations, and certificates of deposit. Interest expense on our line of credit will fluctuate as the interest rate for the line of credit floats based at our option of one, two, three or six-month LIBOR plus a margin of 2.50% or an Alternative Base Rate (ABR), which is defined as the Wall Street Journal prime rate. An increase in interest rates of 100 basis points would add $10 of interest expense per year, to our financial position or results of operations, for each $1,000 drawn on the line of credit. As of December 31, 2017, there were no outstanding borrowings against the line of credit.
Foreign Currency Risk
We operate in the Americas, EMEA and Asia-Pacific. As a result of our international business activities, our financial results could be affected by factors such as changes in foreign currency exchange rates or economic conditions in foreign markets, and there is no assurance that exchange rate fluctuations will not harm our business in the future. We have foreign currency exchange rate exposure on our results of operations as it relates to revenues and expenses denominated in foreign currencies. A portion of our cost of revenues and operating expenses are denominated in foreign currencies as are our revenues associated with certain international customers. To the extent that the U.S. dollar weakens, similar foreign currency denominated transactions in the future will result in higher revenues and higher cost of revenues and operating expenses, with expenses having the greater impact on our financial results. Similarly, our revenues and expenses will decrease if the U.S. dollar strengthens against these foreign currencies. Although we will continue to monitor our exposure to currency fluctuations, and, where appropriate, may use financial hedging techniques in the future to minimize the effect of these
46
fluctuations, we are not currently engaged in any financial hedging transactions. Assuming a 10% weakening of the U.S. dollar relative to our foreign currency denominated revenues and expenses, our net loss for the year ended December 31, 2017, would have been higher by approximately $1,946. There are inherent limitations in the sensitivity analysis presented, primarily due to the assumption that foreign exchange rate movements across multiple jurisdictions are similar and would be linear and instantaneous. As a result, the analysis is unable to reflect the potential effects of more complex markets or other changes that could arise, which may positively or negatively affect our results of operations.
Inflation Risk
We do not believe that inflation has had a material effect on our business, financial condition, or results of operations. If our costs were to become subject to significant inflationary pressures, we may not be able to fully offset such higher costs through price increases. Our inability or failure to do so could harm our business, financial condition and results of operations.
Credit Risk
During any given fiscal period, a relatively small number of customers typically account for a significant percentage of our revenue. For example, in 2017, 2016, and 2015, sales to our top 20 customers accounted for approximately 66%, 62% and 57%, respectively, of our total revenue. During 2017, we had one customer, Amazon, who represented 10% or more of our total revenue. During 2016 and 2015, we had no customer who represented 10% or more of our total revenue. In 2018, we anticipate that our top 20 customer concentration levels will remain consistent with 2017. In the past, the customers that comprised our top 20 customers have continually changed, and our large customers may not continue to be as significant going forward as they have been in the past.
47
Item 8. Financial Statements and Supplementary Data
LIMELIGHT NETWORKS, INC.
Index to Consolidated Financial Statements and Schedule
Page | |
48
Report of Independent Registered Public Accounting Firm
To the Stockholders and the Board of Directors of Limelight Networks, Inc.
Opinion on the Financial Statements
We have audited the accompanying consolidated balance sheets of Limelight Networks, Inc. (the Company) as of December 31, 2017 and 2016, and the related consolidated statements of operations, comprehensive loss, stockholders’ equity, and cash flows for each of the three years in the period ended December 31, 2017, and the related notes and the financial statement schedule listed in the Index at Item 15(a) (collectively referred to as the “financial statements”). In our opinion, the financial statements present fairly, in all material respects, the consolidated financial position of the Company at December 31, 2017 and 2016, and the consolidated results of its operations and its cash flows for each of the three years in the period ended December 31, 2017, in conformity with U.S. generally accepted accounting principles.
We also have audited, in accordance with the standards of the Public Company Accounting Oversight Board (United States) (PCAOB), the Company’s internal control over financial reporting as of December 31, 2017, based on criteria established in Internal Control-Integrated Framework issued by the Committee of Sponsoring Organizations of the Treadway Commission (2013 framework) and our report dated February 8, 2018 expressed an unqualified opinion thereon.
Basis for Opinion
These financial statements are the responsibility of the Company's management. Our responsibility is to express an opinion on the Company’s financial statements based on our audits. We are a public accounting firm registered with the PCAOB and are required to be independent with respect to the Company in accordance with the U.S. federal securities laws and the applicable rules and regulations of the Securities and Exchange Commission and the PCAOB.
We conducted our audits in accordance with the standards of the PCAOB. Those standards require that we plan and perform the audit to obtain reasonable assurance about whether the financial statements are free of material misstatement, whether due to error or fraud. Our audits included performing procedures to assess the risks of material misstatement of the financial statements, whether due to error or fraud, and performing procedures that respond to those risks. Such procedures included examining, on a test basis, evidence regarding the amounts and disclosures in the financial statements. Our audits also included evaluating the accounting principles used and significant estimates made by management, as well as evaluating the overall presentation of the financial statements. We believe that our audits provide a reasonable basis for our opinion.
/s/ Ernst & Young LLP
We have served as the Company’s auditor since 2006.
Phoenix, Arizona
February 8, 2018
49
Limelight Networks, Inc.
Consolidated Balance Sheets
(In thousands, except per share data)
December 31, 2017 | December 31, 2016 | ||||||
ASSETS | |||||||
Current assets: | |||||||
Cash and cash equivalents | $ | 20,912 | $ | 21,734 | |||
Marketable securities | 28,404 | 44,453 | |||||
Accounts receivable, net | 32,381 | 27,418 | |||||
Income taxes receivable | 98 | 125 | |||||
Prepaid expenses and other current assets | 5,397 | 4,865 | |||||
Total current assets | 87,192 | 98,595 | |||||
Property and equipment, net | 28,991 | 30,352 | |||||
Marketable securities, less current portion | 40 | 40 | |||||
Deferred income taxes | 1,506 | 1,105 | |||||
Goodwill | 77,054 | 76,243 | |||||
Other assets | 1,665 | 1,794 | |||||
Total assets | $ | 196,448 | $ | 208,129 | |||
LIABILITIES AND STOCKHOLDERS’ EQUITY | |||||||
Current liabilities: | |||||||
Accounts payable | $ | 4,439 | $ | 8,790 | |||
Deferred revenue | 1,187 | 2,138 | |||||
Income taxes payable | 452 | 188 | |||||
Provision for litigation | 18,000 | 18,000 | |||||
Other current liabilities | 18,507 | 12,836 | |||||
Total current liabilities | 42,585 | 41,952 | |||||
Deferred income taxes | 144 | 152 | |||||
Deferred revenue, less current portion | 16 | 22 | |||||
Provision for litigation, less current portion | 9,000 | 27,000 | |||||
Other long-term liabilities | 558 | 1,435 | |||||
Total liabilities | 52,303 | 70,561 | |||||
Commitments and contingencies | |||||||
Stockholders’ equity: | |||||||
Convertible preferred stock, $0.001 par value; 7,500 shares authorized; 0 shares issued and outstanding | — | — | |||||
Common stock, $0.001 par value; 300,000 shares authorized; 110,824 and 107,059 shares issued and outstanding at December 31, 2017 and 2016, respectively | 111 | 107 | |||||
Additional paid-in capital | 502,312 | 490,819 | |||||
Accumulated other comprehensive loss | (8,328 | ) | (11,038 | ) | |||
Accumulated deficit | (349,950 | ) | (342,320 | ) | |||
Total stockholders’ equity | 144,145 | 137,568 | |||||
Total liabilities and stockholders’ equity | $ | 196,448 | $ | 208,129 | |||
The accompanying notes are an integral part of the consolidated financial statements.
50
Limelight Networks, Inc.
Consolidated Statements of Operations
(In thousands, except per share data)
Years Ended December 31, | |||||||||||
2017 | 2016 | 2015 | |||||||||
Revenues | $ | 184,360 | $ | 168,234 | $ | 170,912 | |||||
Cost of revenue: | |||||||||||
Cost of services (1) | 78,423 | 78,857 | 84,818 | ||||||||
Depreciation — network | 18,138 | 18,032 | 17,975 | ||||||||
Total cost of revenue | 96,561 | 96,889 | 102,793 | ||||||||
Gross profit | 87,799 | 71,345 | 68,119 | ||||||||
Operating expenses: | |||||||||||
General and administrative | 32,053 | 30,042 | 25,027 | ||||||||
Sales and marketing | 36,098 | 32,945 | 37,868 | ||||||||
Research and development | 25,342 | 24,335 | 28,016 | ||||||||
Depreciation and amortization | 2,376 | 2,452 | 2,929 | ||||||||
Provision for litigation | — | 54,000 | — | ||||||||
Total operating expenses | 95,869 | 143,774 | 93,840 | ||||||||
Operating loss | (8,070 | ) | (72,429 | ) | (25,721 | ) | |||||
Other income (expense): | |||||||||||
Interest expense | (80 | ) | (918 | ) | (29 | ) | |||||
Interest income | 494 | 123 | 317 | ||||||||
Other, net | 452 | (98 | ) | 1,748 | |||||||
Total other income (expense) | 866 | (893 | ) | 2,036 | |||||||
Loss before income taxes | (7,204 | ) | (73,322 | ) | (23,685 | ) | |||||
Income tax expense | 426 | 603 | 267 | ||||||||
Net loss | $ | (7,630 | ) | $ | (73,925 | ) | $ | (23,952 | ) | ||
Net loss per share: | |||||||||||
Basic and diluted | $ | (0.07 | ) | $ | (0.71 | ) | $ | (0.24 | ) | ||
Weighted average shares used in per share calculation: | |||||||||||
Basic and diluted | 108,814 | 104,350 | 100,105 | ||||||||
____________
(1) | Cost of services excludes amortization related to intangibles, including existing technologies, customer relationships, and trade names and trademarks, which are included in depreciation and amortization |
The accompanying notes are an integral part of the consolidated financial statements.
51
LIMELIGHT NETWORKS, INC.
Consolidated Statements of Comprehensive Loss
(In thousands)
Years Ended December 31, | |||||||||||
2017 | 2016 | 2015 | |||||||||
Net loss | $ | (7,630 | ) | $ | (73,925 | ) | $ | (23,952 | ) | ||
Other comprehensive gain (loss), net of tax: | |||||||||||
Unrealized gain (loss) on investments | 59 | (84 | ) | (1 | ) | ||||||
Foreign exchange translation gain (loss) | 2,651 | (142 | ) | (3,025 | ) | ||||||
Other comprehensive gain (loss), net of tax | 2,710 | (226 | ) | (3,026 | ) | ||||||
Comprehensive loss | $ | (4,920 | ) | $ | (74,151 | ) | $ | (26,978 | ) | ||
The accompanying notes are an integral part of the consolidated financial statements.
52
Limelight Networks, Inc.
Consolidated Statements of Stockholders’ Equity
(In thousands)
Common Stock | Additional Paid-In Capital | Accumulated Other Comprehensive Loss | Accumulated Deficit | Total | ||||||||||||||||||
Shares | Amount | |||||||||||||||||||||
Balance at December 31, 2014 | 98,409 | $ | 98 | $ | 464,294 | $ | (7,786 | ) | $ | (244,443 | ) | $ | 212,163 | |||||||||
Net loss | — | — | — | — | (23,952 | ) | (23,952 | ) | ||||||||||||||
Change in unrealized loss on available-for-sale investments, net of taxes | — | — | — | (1 | ) | — | (1 | ) | ||||||||||||||
Foreign currency translation adjustment, net of taxes | — | — | — | (3,025 | ) | — | (3,025 | ) | ||||||||||||||
Exercise of common stock options | 607 | 1 | 1,052 | — | — | 1,053 | ||||||||||||||||
Vesting of restricted stock units | 3,069 | 3 | (3 | ) | — | — | — | |||||||||||||||
Restricted stock units surrendered in lieu of withholding taxes | (876 | ) | (1 | ) | (2,627 | ) | — | — | (2,628 | ) | ||||||||||||
Issuance of common stock under employee stock purchase plan | 1,383 | 1 | 2,965 | — | — | 2,966 | ||||||||||||||||
Purchases of common stock | (293 | ) | — | (817 | ) | — | — | (817 | ) | |||||||||||||
Share-based compensation | — | — | 12,338 | — | — | 12,338 | ||||||||||||||||
Balance at December 31, 2015 | 102,299 | $ | 102 | 477,202 | (10,812 | ) | (268,395 | ) | 198,097 | |||||||||||||
Net loss | — | — | — | — | (73,925 | ) | (73,925 | ) | ||||||||||||||
Change in unrealized loss on available-for-sale investments, net of taxes | — | — | — | (84 | ) | — | (84 | ) | ||||||||||||||
Foreign currency translation adjustment, net of taxes | — | — | — | (142 | ) | — | (142 | ) | ||||||||||||||
Exercise of common stock options | 850 | — | 1,243 | — | — | 1,243 | ||||||||||||||||
Vesting of restricted stock units | 3,753 | 4 | (4 | ) | — | — | — | |||||||||||||||
Restricted stock units surrendered in lieu of withholding taxes | (1,167 | ) | — | (1,979 | ) | — | — | (1,979 | ) | |||||||||||||
Issuance of common stock under employee stock purchase plan | 1,324 | 1 | 1,497 | — | — | 1,498 | ||||||||||||||||
Share-based compensation | — | — | 12,860 | — | — | 12,860 | ||||||||||||||||
Balance at December 31, 2016 | 107,059 | $ | 107 | 490,819 | (11,038 | ) | (342,320 | ) | 137,568 | |||||||||||||
Net loss | — | — | — | — | (7,630 | ) | (7,630 | ) | ||||||||||||||
Change in unrealized loss on available-for-sale investments, net of taxes | — | — | — | 59 | — | 59 | ||||||||||||||||
Foreign currency translation adjustment, net of taxes | — | — | — | 2,651 | — | 2,651 | ||||||||||||||||
Exercise of common stock options | 384 | — | 1,074 | — | — | 1,074 | ||||||||||||||||
Vesting of restricted stock units | 4,004 | 4 | (4 | ) | — | — | — | |||||||||||||||
Restricted stock units surrendered in lieu of withholding taxes | (1,310 | ) | (1 | ) | (4,496 | ) | — | — | (4,497 | ) | ||||||||||||
53
Common Stock | Additional Paid-In Capital | Accumulated Other Comprehensive Loss | Accumulated Deficit | Total | ||||||||||||||||||
Shares | Amount | |||||||||||||||||||||
Issuance of common stock under employee stock purchase plan | 687 | 1 | 1,573 | — | — | 1,574 | ||||||||||||||||
Share-based compensation | — | — | 13,346 | — | — | 13,346 | ||||||||||||||||
Balance at December 31, 2017 | 110,824 | $ | 111 | $ | 502,312 | $ | (8,328 | ) | $ | (349,950 | ) | $ | 144,145 | |||||||||
The accompanying notes are an integral part of the consolidated financial statements.
54
Limelight Networks, Inc.
Consolidated Statements of Cash Flows
(In thousands)
Years Ended December 31, | |||||||||||
2017 | 2016 | 2015 | |||||||||
Operating activities | |||||||||||
Net loss | $ | (7,630 | ) | $ | (73,925 | ) | $ | (23,952 | ) | ||
Adjustments to reconcile net loss to net cash provided by operating activities: | |||||||||||
Depreciation and amortization | 20,514 | 20,484 | 20,904 | ||||||||
Share-based compensation | 12,744 | 13,459 | 12,338 | ||||||||
Accrual of provision for litigation | — | 54,000 | — | ||||||||
Foreign currency remeasurement loss (gain) | 798 | 585 | (1,591 | ) | |||||||
Deferred income taxes | (325 | ) | 170 | 46 | |||||||
Gain on sale of property and equipment | (410 | ) | (514 | ) | — | ||||||
Accounts receivable charges | 949 | 137 | 1,037 | ||||||||
Amortization of premium on marketable securities | 283 | 67 | 194 | ||||||||
Realized loss on sale of marketable securities | — | 32 | — | ||||||||
Changes in operating assets and liabilities: | |||||||||||
Accounts receivable | (5,912 | ) | (760 | ) | (5,210 | ) | |||||
Prepaid expenses and other current assets | (342 | ) | 4,648 | (194 | ) | ||||||
Income taxes receivable | 38 | 39 | 44 | ||||||||
Other assets | 270 | 580 | 3,064 | ||||||||
Accounts payable and other current liabilities | 4,019 | (1,757 | ) | 85 | |||||||
Deferred revenue | (957 | ) | (822 | ) | (932 | ) | |||||
Income taxes payable | 249 | (8 | ) | (80 | ) | ||||||
Payments for provision for litigation | (18,000 | ) | (9,000 | ) | — | ||||||
Other long term liabilities | (790 | ) | (857 | ) | 688 | ||||||
Net cash provided by operating activities | 5,498 | 6,558 | 6,441 | ||||||||
Investing activities | |||||||||||
Purchases of marketable securities | (14,930 | ) | (45,629 | ) | (16,821 | ) | |||||
Sale and maturities of marketable securities | 30,756 | 29,315 | 22,620 | ||||||||
Purchases of property and equipment | (20,725 | ) | (9,563 | ) | (24,714 | ) | |||||
Proceeds from sale of property and equipment | 97 | 504 | — | ||||||||
Net cash used in investing activities | (4,802 | ) | (25,373 | ) | (18,915 | ) | |||||
Financing activities | |||||||||||
Principal payments on capital lease obligations | — | (4,685 | ) | (453 | ) | ||||||
Payment of employee tax withholdings related to restricted stock vesting | (4,496 | ) | (1,982 | ) | (2,627 | ) | |||||
Cash paid for purchase of common stock | — | — | (957 | ) | |||||||
Proceeds from employee stock plans | 2,648 | 2,743 | 4,018 | ||||||||
Net cash used in financing activities | (1,848 | ) | (3,924 | ) | (19 | ) | |||||
Effect of exchange rate changes on cash and cash equivalents | 330 | (207 | ) | (594 | ) | ||||||
Net decrease in cash and cash equivalents | (822 | ) | (22,946 | ) | (13,087 | ) | |||||
Cash and cash equivalents, beginning of year | 21,734 | 44,680 | 57,767 | ||||||||
Cash and cash equivalents, end of year | $ | 20,912 | $ | 21,734 | $ | 44,680 | |||||
Supplement disclosure of cash flow information | |||||||||||
Cash paid during the year for interest | $ | 44 | $ | 720 | $ | 29 | |||||
Cash paid during the year for income taxes, net of refunds | $ | 486 | $ | 542 | $ | 379 | |||||
Property and equipment acquired through capital leases | $ | — | $ | 2,659 | $ | 2,035 | |||||
The accompanying notes are an integral part of the consolidated financial statements.
55
Limelight Networks, Inc.
Notes to Consolidated Financial Statements
December 31, 2017
(In thousands, except per share amounts and where specifically noted)
1. Nature of Business
Limelight operates a globally distributed, high-performance network and provides a suite of integrated services marketed under the Limelight Orchestrate Platform which include content delivery, video content management, website and web application acceleration, website and content security, and cloud storage services.
We were incorporated in Delaware in 2003, and have operated in the Phoenix metropolitan area since 2001 and elsewhere throughout the United States since 2003. We began international operations in 2004.
2. Summary of Significant Accounting Policies
Basis of Presentation
The accompanying consolidated financial statements have been prepared in accordance with U.S. generally accepted accounting principles (U.S. GAAP). The consolidated financial statements include accounts of Limelight and our wholly owned subsidiaries. All significant intercompany balances and transactions have been eliminated. In addition, certain other reclassifications have been made to prior period amounts to conform to the current period presentation.
Use of Estimates
The preparation of the consolidated financial statements and related disclosures in conformity with U.S. GAAP requires management to make judgments, assumptions, and estimates that affect the amounts reported in the consolidated financial statements and accompanying notes. Actual results and outcomes may differ from those estimates. The results of operations presented in this annual report on Form 10-K are not necessarily indicative of the results that may be expected for the year ending December 31, 2018, or for any future periods.
Foreign Currency Translation
We translate assets and liabilities of foreign subsidiaries, whose functional currency is their local currency, at exchange rates in effect at the balance sheet date. We translate revenue and expenses at the monthly average exchange rates. We include accumulated net translation adjustments in stockholders’ equity as a component of accumulated other comprehensive income (loss).
The functional currency of our international subsidiaries is the local currency. Due to changes in exchange rates between reporting periods and changes in certain account balances, the foreign currency translation adjustment will change from period to period. During the years ended December 31, 2017, 2016, and 2015, we recorded foreign currency translation gains (losses) of $2,651, $(142), and $(3,025), respectively, in our statements of comprehensive loss. During the years ended December 31, 2017, 2016, and 2015, we recorded a foreign currency re-measurement gain (loss) of approximately $41, $(982), and $1,341, respectively, in other income (expense) in the consolidated statements of operations.
Recent Accounting Standards
Adopted Accounting Pronouncements
In November 2015, the Financial Accounting Standards Board (FASB) issued Accounting Standard Update (ASU) 2015-17, which requires entities to present deferred tax assets (DTAs) and deferred tax liabilities (DTLs) as noncurrent in a classified balance sheet. ASU 2015-17 is effective for financial statements issued for annual periods beginning after December 15, 2016, and interim periods within those annual periods. We adopted this guidance effective January 1, 2017 on a retrospective basis. The impact of adoption of this ASU was that $88 of current DTAs in our consolidated balance sheet for the year ended December 31, 2016, has been reclassified to noncurrent DTAs.
In March 2016, the FASB issued ASU 2016-09, which amends the existing accounting standards for share-based payments, including the accounting for income taxes and forfeitures, as well as the classifications on the statements of cash flows. We adopted this guidance effective January 1, 2017. Beginning January 1, 2017, stock-based compensation excess tax benefits or tax deficiencies are reflected in the Consolidated Statements of Operations as a component of the provision for taxes, whereas they previously were recognized as additional paid in capital in the stockholders’ deficit in the Consolidated
56
Balance Sheets. We have elected to continue to estimate forfeitures expected to occur to determine stock-based compensation expense. Additionally, beginning with the three months ended March 31, 2017, and on a prospective basis, the Consolidated Statements of Cash Flows now requires excess tax benefits be presented as an operating activity rather than as a financing activity, while the payment of withholding taxes on the settlement of stock-based compensation awards continues to be presented as a financing activity. The implementation of this guidance did not have a material impact on the Consolidated Statements of Cash Flows for the year ended December 31, 2017.
During the year ended December 31, 2017, there was no change to beginning retained earnings for previously unrecognized tax benefits. The increase of $5,200 to the net operating loss carryforward deferred tax asset was fully offset by an increase to the valuation allowance. During the year ended December 31, 2017 we did not record excess tax benefits on stock options and restricted stock units as a result of the adoption of ASU 2016-09 because such amounts are fully offset by our valuation allowance.
Recently Issued Accounting Pronouncements
In May 2014, the FASB issued ASU 2014-09, which provides guidance for revenue recognition. The standard’s core principle is that a company will recognize revenue when it transfers promised goods or services to customers in an amount that reflects the consideration to which the company expects to be entitled in exchange for those goods or services. In doing so, companies will need to use more judgment and make more estimates than under today’s guidance. In August 2015, the FASB issued ASU 2015-14, which defers the effective date of ASU 2014-09 for all entities by one year. Accordingly, public business entities should apply the guidance in ASU 2014-09 to annual reporting periods (including interim periods within those periods) beginning after December 15, 2017. We will use the modified retrospective approach upon adoption of this guidance effective January 1, 2018. We have utilized a comprehensive approach to assess the impact of the guidance on our contract portfolio. We have reviewed our current accounting policies and practices to identify potential differences resulting from the application of the new requirements to our revenue contracts, including evaluation of performance obligations in the contract, estimating the amount of variable consideration to include in the transaction price, allocating the transaction price to each separate performance obligation and accounting treatment of costs to obtain and fulfill contracts. In addition, we will update certain disclosures, as applicable, included in our financial statements to meet the requirements of the new guidance.
We are substantially complete with our review of contracts with our customers and we expect to record a cumulative effect adjustment to accumulated deficit upon adoption of the new revenue standard as of January 1, 2018. The cumulative adjustment is related to incremental upfront contract acquisition costs (such as sales commissions) for customer contracts. The new standard requires these costs to be capitalized and amortized over the estimated life of the asset. Currently, these costs are expensed as incurred. The cumulative adjustment will decrease the accumulated deficit by approximately $1,100. We anticipate the resulting contract acquisition asset will be amortized over a period of 30 months. We will evaluate the contract assets for impairment on a periodic basis.
For the majority of our contracts, we expect no change from ASU 2014-09, whereby we recognize revenue based on actual monthly usage at an agreed upon rate. We have some contracts with customers that contain minimum commitments over a period of 12 months or longer. Currently, we either accrue or defer revenue based on actual usage compared to the ratable amount billed over the contractual term. Under the new guidance, we are required to evaluate the impact of estimating variable consideration related to these types of contracts. We will use the expected value method to estimate the total revenue of the contract, constrained by the probability that there would not be a significant revenue reversal in a future period, and recognize a pro-rata share of the total revenue of the contract each month. This change will result in a net decrease to our accumulated deficit of approximately $600. We will continue to evaluate the expected value of revenue over the term of the contract and adjust revenue recognition as appropriate. We do not expect the adoption of ASU 2014-09 will have any impact on our operating cash flows.
In February 2016, the FASB issued ASU No. 2016-02, which establishes a right-of-use model that requires a lessee to record a right-of-use asset and a lease liability on the balance sheet for most leases. Leases will be classified as either finance or operating, with classification affecting the pattern of expense recognition in the income statement. This guidance is effective for fiscal years beginning after December 15, 2018, including interim periods within that reporting period. We do not plan to early adopt this ASU. We are in the process of implementing changes to our systems, processes and controls, as part of our review of existing lease agreements, and are in the process of evaluating the potential impacts of this new guidance on our consolidated financial statements and related disclosures.
In August 2016, the FASB issued ASU No. 2016-15, which amends Accounting Standards Codification 230, to clarify guidance on the classification of certain cash receipts and payments in the statement of cash flows. The FASB issued ASU 2016-15 with the intent of reducing diversity in practice with respect to eight types of cash flows. This guidance is effective for fiscal years beginning after December 15, 2017, including interim periods within those fiscal years. We have adopted this
57
guidance effective January 1, 2018, and do not expect this new guidance to have a material impact on our consolidated financial statements.
In January 2017, the FASB issued ASU 2017-04, which simplifies the accounting for goodwill impairment. The updated guidance eliminates Step 2 of the impairment test, which requires entities to calculate the implied fair value of goodwill to measure a goodwill impairment charge. Instead, entities will record an impairment charge based on the excess of a reporting unit’s carrying amount over its fair value, determined in Step 1. This guidance will become effective for us in fiscal years beginning after December 15, 2019, including interim periods within that reporting period. We will adopt this guidance using a prospective approach. Earlier adoption is permitted for interim or annual goodwill impairment tests performed on testing dates after January 1, 2017. We do not plan to early adopt this ASU, and we are currently evaluating the impact of this guidance on our consolidated financial statements.
In May 2017, the FASB issued ASU 2017-09, which clarifies when changes to the terms or conditions of a share-based payment award must be accounted for as modifications. ASU 2017-09 will reduce diversity in practice and result in fewer changes to the terms of an award being accounted for as modifications. Under ASU 2017-09, an entity will not apply modification accounting to a share-based payment award if the award's fair value, vesting conditions and classification as an equity or liability instrument are the same immediately before and after the change. ASU 2017-09 will be applied prospectively to awards modified on or after the adoption date. The guidance is effective for annual periods, and interim periods within those annual periods, beginning after December 15, 2017. We have adopted this guidance effective January 1, 2018, and do not expect this new guidance to have a material impact on our consolidated financial statements.
Revenue Recognition
We derive revenue primarily from the sale of services that comprise components of our Orchestrate Platform. Our customers generally execute contracts with terms of one year or longer, which are referred to as recurring revenue contracts or long-term contracts. These contracts may commit the customer to a minimum monthly level of usage with additional charges applicable for actual usage above the monthly minimum commitment, or are entirely usage based. We define usage as customer data sent or received using our content delivery service, or content that is hosted or cached by us at the request or direction of our customers. We recognize the monthly minimum as revenue each month provided that an enforceable contract has been signed by both parties, the service has been delivered to the customer, the fee for the service is fixed or determinable, and collection is reasonably assured. Should a customer’s usage of our services exceed the monthly minimum commitment, we recognize revenue for such excess in the period of the usage. For annual or other non-monthly period revenue commitments, we recognize revenue monthly based upon the customer’s actual usage each month of the commitment period and only recognize any remaining committed amount for the applicable period in the last month thereof.
Certain of our revenue arrangements consist of multi-element arrangements. Revenue arrangements with multiple deliverables are divided into separate units of accounting if each deliverable has stand-alone value to the customer. Our multiple-element arrangements may include a combination of some or all of the following: content delivery services, video content management services, performance services for website and web application acceleration and security, professional services, cloud storage and sale of equipment. Each of these products has stand-alone value and is sold separately. In the absence of vendor specific objective evidence (VSOE) or third-party evidence of selling prices, consideration would be allocated based on management’s best estimate of such prices. The deliverables within multiple-element arrangements are provided over the same contract period, and therefore, revenue is recognized over the same period.
We may charge the customer an installation fee when the services are first activated. We do not charge installation fees for contract renewals. Installation fees are recorded as deferred revenue and recognized as revenue ratably over the estimated life of the customer arrangement as installation fees do not have standalone value.
We also derive revenue from services and events sold as discrete, non-recurring events or based solely on usage. For these services, we recognize revenue after an enforceable contract has been signed by both parties, the fee is fixed or determinable, the event or usage has occurred, and collection is reasonably assured.
At the inception of a customer contract for service, we make an assessment as to that customer’s ability to pay for the services provided. If we subsequently determine that collection from the customer is not reasonably assured, we record an allowance for doubtful accounts and bad debt expense or deferred revenue for all of that customer’s unpaid invoices and cease recognizing revenue for continued services provided until cash is received. Cash received from customers related to sales tax is not included in revenue.
Deferred revenue represents amounts billed to customers for which revenue has not been recognized. Deferred revenue primarily consists of the unearned portion of monthly billed service fees; prepayments made by customers for future periods and deferred installation fees.
58
Cash and Cash Equivalents
We hold our cash and cash equivalents in checking, money market, and highly-liquid investments. We consider all highly liquid investments with maturities of three months or less when purchased to be cash equivalents. Cash and cash equivalents are deposited in or managed by major financial institutions and at times exceed Federal Deposit Insurance Corporation insurance limits.
Investments in Marketable Securities
Management determines the appropriate classification of its marketable securities at the time of purchase and reevaluates such classification as of each balance sheet date. We have classified our investments in marketable securities as available-for-sale and as current, as our marketable securities are available to fund current operations, and carry such investments at fair value. Available-for-sale investments are initially recorded at cost with changes in fair value recorded through comprehensive loss. Realized gains and losses and declines in value judged to be other than temporary are determined based on the specific identification method and are reported in the statements of operations. We periodically review our investments for other-than-temporary declines in fair value based on the specific identification method and would write down investments to their fair value if and when an other-than-temporary decline has occurred.
Accounts Receivable
Trade accounts receivable are recorded at the invoiced amounts and do not bear interest. We record reserves against our accounts receivable balance for service credits and for doubtful accounts. Estimates are used in determining both of these reserves. The allowance for doubtful accounts charges are included as a component of general and administrative expenses.
The allowance for doubtful accounts is based upon a calculation that uses our aging of accounts receivable and applies a reserve percentage to the specific age of the receivable to estimate the allowance for doubtful accounts. The reserve percentages are determined based on our historical write-off experience. These estimates could change significantly if our customers’ financial condition changes or if the economy in general deteriorates. In the event such conditions become known, we specifically identify balances for necessary reserves.
Our reserve for service credits relates to credits that are expected to be issued to customers during the ordinary course of business. These credits typically relate to customer disputes and billing adjustments and are estimated at the time the revenue is recognized and recorded as a reduction of revenues. Estimates for service credits are based on an analysis of credits issued in previous periods.
Property and Equipment
Property and equipment are carried at cost less accumulated depreciation or amortization. Depreciation and amortization are computed using the straight-line method over the assets’ estimated useful lives of the applicable asset.
Network equipment | 3 years |
Computer equipment and software | 3 years |
Furniture and fixtures | 3-5 years |
Other equipment | 3-5 years |
Leasehold improvements are amortized over the shorter of the asset’s estimated useful life or the respective lease term. Repairs and maintenance are charged to expense as incurred.
Goodwill and Other Intangible Assets
Goodwill represents costs in excess of fair values assigned to the underlying net assets of the acquired company. Goodwill is not amortized but instead is tested for impairment annually or more frequently if events or changes in circumstances indicate goodwill might be impaired. We have concluded that we have one reporting unit and assigned the entire balance of goodwill to this reporting unit. The estimated fair value of the reporting unit is determined using a market approach. Our market capitalization is adjusted for a control premium based on the estimated average and median control premiums of transactions involving companies comparable to us. As of our annual impairment testing date of October 31, 2017, management determined that goodwill was not impaired. Management determined that the estimated fair value of its reporting unit exceeded carrying value by approximately $618,431 or 435%, using our market capitalization plus an estimated control premium of 40% on October 31, 2017. There were no indicators of impairment subsequent to the annual impairment testing date.
59
As of December 31, 2017, we have no other unamortized intangible assets. However, in prior years, our other intangible assets represented existing technologies and customer relationship intangibles. Other intangible assets are amortized over their respective estimated lives, ranging from less than one year to six years. In the event that facts and circumstances indicate intangibles or other long-lived assets may be impaired, we evaluate the recoverability and estimated useful lives of such assets. Other intangible assets are included in other assets in the accompanying consolidated balance sheets. Amortization of other intangible assets is included in depreciation and amortization in the accompanying consolidated statements of operations.
Contingencies
We record contingent liabilities resulting from asserted and unasserted claims when it is probable that a loss has been incurred and the amount of the loss is reasonably estimable. We disclose contingent liabilities when there is a reasonable possibility that the ultimate loss will exceed the recorded liability. Additionally, estimating the loss, or range of loss, associated with a contingency requires analysis of multiple factors, and changes in law or other developments may ultimately cause our judgments to change. Therefore, actual losses in any future period are inherently uncertain and may be materially different from our estimate.
Long-Lived Assets
We review our long-lived assets for impairment annually, or whenever events or circumstances indicate that the carrying amount of an asset may not be fully recoverable. We recognize an impairment loss if the sum of the expected long-term undiscounted cash flows that the long-lived asset is expected to generate is less than the carrying amount of the long-lived asset being evaluated. We treat any write-downs as permanent reductions in the carrying amounts of the assets. We believe the carrying amounts of our long-lived assets at December 31, 2017, and 2016, are fully realizable and have not recorded any impairment losses.
Deferred Rent and Lease Accounting
We lease bandwidth, co-location and office space in various locations. At the inception of each lease, we evaluate the lease terms to determine whether the lease will be accounted for as an operating or a capital lease. The term of the lease used for this evaluation includes renewal option periods only in instances where the exercise of the renewal option can be reasonably assured and failure to exercise the option would result in an economic penalty. We record tenant improvement allowances granted under the lease agreements as leasehold improvements within property and equipment and within deferred rent.
For leases that contain rent escalation provisions, we record the total rent payable during the lease term on a straight-line basis over the term of the lease (including any “rent free” period beginning upon possession of the premises), and record any difference between the actual rent paid and the straight-line rent expense recorded as increases or decreases in deferred rent.
Cost of Revenue
Cost of revenues consists primarily of fees paid to network providers for bandwidth and backbone, costs incurred for non-settlement free peering and connection to Internet service provider networks and fees paid to data center operators for housing network equipment in third party network data centers, also known as co-location costs. Cost of revenues also includes leased warehouse space and utilities, depreciation of network equipment used to deliver our content delivery services, payroll and related costs, and share-based compensation for our network operations and professional services personnel.
We enter into contracts for bandwidth with third party network providers with terms typically ranging from several months to five years. These contracts generally commit us to pay minimum monthly fees plus additional fees for bandwidth usage above contracted minimums. A portion of the global computing platform traffic delivery is completed through direct connection to ISP networks, called peering.
Research and Development
Research and development costs consist primarily of payroll and related personnel costs for the design, development, deployment, testing, operation, and enhancement of our services, and network. Costs incurred in the development of our services are expensed as incurred.
60
Advertising Costs
Costs associated with advertising are expensed as incurred. Advertising expenses, which are comprised of Internet, trade show, and publications advertising, were approximately $2,001, $1,411, and $1,669 for the years ended December 31, 2017, 2016, and 2015, respectively.
Income Taxes
We account for income taxes under the asset and liability method, which requires the recognition of deferred tax assets and liabilities for the expected future tax consequences of events that have been included in the financial statements. Under this method, deferred tax assets and liabilities are determined based on the differences between the financial statements and tax basis of assets and liabilities using enacted tax rates in effect for the year in which the differences are expected to reverse. The effect of a change in tax rates on deferred tax assets and liabilities is recognized in income in the period that includes the enactment date.
We record net deferred tax assets to the extent we believe these assets will more likely than not be realized. In making such determination, we consider all available positive and negative evidence, including scheduled reversals of deferred tax liabilities, projected future taxable income, tax planning strategies, and recent financial performance on a jurisdiction by jurisdiction basis. In the event we were to determine that we would be able to realize our deferred income tax assets in the future in excess of their net recorded amount, we would make an adjustment to the valuation allowance, which would reduce the provision for income taxes.
We recognize uncertain income tax positions in our financial statements when it is more-likely-than-not the position will be sustained upon examination.
On December 22, 2017, the Tax Cuts and Jobs Act (the Tax Act) significantly revised the U.S. corporate income tax law, by among other things, reducing the corporate income tax rate to 21% for tax years beginning in 2018, implementing a modified territorial system that includes a one-time transition tax on deemed repatriated earnings of foreign subsidiaries and creating new taxes on certain foreign sourced earnings. Also on December 22, 2017, The Securities and Exchange Commission staff issued Staff Accounting Bulletin (SAB) 118 to provide guidance for companies that are not able to complete their accounting for the income tax effects of the Tax Act in the period of enactment. SAB 118 provides for a measurement period of up to one year from the date of enactment. During the measurement period, companies need to reflect adjustments to any provisional amounts if it obtains, prepares or analyzes additional information about facts and circumstances that existed as of the enactment date that, if known, would have affected the income tax effects initially reported as provisional amounts.
At December 31, 2017 we have not yet completed our analysis of the Tax Act; however, in certain circumstances, as described below, we have made a reasonable estimate of the effects of the Tax Act.
Provisional Amounts
Income tax expense for the year ending December 31, 2017 includes a $41 tax benefit related to the re-measurement of a deferred tax liability on a long-lived asset. The remaining impact from the re-measurement of our net U.S. deferred tax asset at the lower 21% rate was offset by the valuation allowance.
The one-time transition tax is based on our total post-1986 earnings and profits (E&P) that we previously deferred from US income taxes. We recorded a provisional amount for our one-time transition tax liability for all of our foreign subsidiaries. The transition tax that we calculated resulted in an immaterial amount of additional federal taxable income. The additional taxable income from the transition tax was offset by NOLs and did not result in cash taxes payable. No additional income taxes have been provided for any remaining undistributed foreign earnings not subject to the transition tax, or any additional outside basis differences inherent in these entities, as these amounts continue to be indefinitely reinvested in foreign operations. Determining the amount of unrecognized deferred tax liability related to any remaining undistributed earnings not subject to the transition tax and additional outside basis difference in these entities (i.e. basis difference in excess of that subject to the one-time transition tax) is not practicable.
The tax provision incorporates assumptions made based upon our current interpretation of the Tax Act, and may change as we receive additional clarification and implementation guidance and as the interpretation of the Tax Act evolves over time.
The Tax Act contains several base broadening provisions that became effective on January 1, 2018 that we do not expect to have a material impact on future earnings due to our NOL and valuation allowance position. Also effective for 2018 is a new Global Intangible Low-Taxed Income inclusion (GILTI). We do not expect the GILTI to have a material impact on
61
future earnings due to our NOL and valuation allowance position. We will account for the impact of the GILTI in the period we become subject to its provisions.
Fair Value of Financial Instruments
The carrying amounts of cash and cash equivalents approximate fair value due to the nature and short maturity of those instruments. The respective fair values of marketable securities are determined based on quoted market prices or other readily available market information, which approximate fair values. The carrying amounts of accounts receivable, accounts payable, and accrued liabilities reported in the consolidated balance sheets approximate their respective fair values due to the immediate or short-term maturity of these financial instruments.
Share-Based Compensation
We measure all employee share-based compensation awards using the fair-value method. The grant date fair value was determined using the Black-Scholes-Merton pricing model. The Black-Scholes-Merton valuation calculation requires us to make key assumptions such as future stock price volatility, expected terms, risk-free rates, and dividend yield. Our expected volatility is derived from our own volatility rate as a publicly traded company over the expected term of the awards. The expected term is based on our historical experience. The risk-free interest factor is based on the United States Treasury yield curve in effect at the time of the grant for zero coupon United States Treasury notes with maturities of approximately equal to each grant’s expected term. We have never paid cash dividends and do not currently intend to pay cash dividends, and therefore, have assumed a 0% dividend yield. We develop an estimate of the number of share-based awards that will be forfeited due to employee turnover. We will continue to use judgment in evaluating the expected term, volatility, and forfeiture rate related to our own share-based awards on a prospective basis, and in incorporating these factors into the model.
We apply the straight-line attribution method to recognize compensation costs associated with awards that are not subject to graded vesting. For awards that are subject to graded vesting and performance based awards, we recognize compensation costs separately for each vesting tranche. We also estimate when and if performance-based awards will be earned. If an award is not considered probable of being earned, no amount of share-based compensation is recognized. If the award is deemed probable of being earned, related compensation expense is recorded over the estimated service period. To the extent our estimate of awards considered probable of being earned changes, the amount of share-based compensation recognized will also change.
3. Investments in Marketable Securities
The following is a summary of marketable securities (designated as available-for-sale) at December 31, 2017:
Amortized Cost | Gross Unrealized Gains | Gross Unrealized Losses | Estimated Fair Value | ||||||||||||
Certificate of deposit | $ | 40 | $ | — | $ | — | $ | 40 | |||||||
Corporate notes and bonds | 28,472 | — | 68 | 28,404 | |||||||||||
Total marketable securities | $ | 28,512 | $ | — | $ | 68 | $ | 28,444 | |||||||
At December 31, 2017, we evaluated our marketable securities and determined unrealized losses were due to fluctuations in interest rates. We do not believe any of the unrealized losses represented an other-than-temporary impairment based on our evaluation of available evidence as of December 31, 2017. Our intent is to hold these investments to such time as these assets are no longer impaired.
62
The amortized cost and estimated fair value of the marketable securities at December 31, 2017, by maturity, are shown below:
Amortized Cost | Gross Unrealized Gains | Gross Unrealized Losses | Estimated Fair Value | ||||||||||||
Available-for-sale securities | |||||||||||||||
Due in one year or less | $ | 23,924 | $ | — | $ | 62 | $ | 23,862 | |||||||
Due after one year and through five years | 4,588 | — | 6 | 4,582 | |||||||||||
$ | 28,512 | $ | — | $ | 68 | $ | 28,444 | ||||||||
The following is a summary of marketable securities (designated as available-for-sale) at December 31, 2016:
Amortized Cost | Gross Unrealized Gains | Gross Unrealized Losses | Estimated Fair Value | ||||||||||||
Certificate of deposit | $ | 40 | $ | — | $ | — | $ | 40 | |||||||
Commercial paper | 8,228 | — | 6 | 8,222 | |||||||||||
Corporate notes and bonds | 36,353 | — | 122 | 36,231 | |||||||||||
Total marketable securities | $ | 44,621 | $ | — | $ | 128 | $ | 44,493 | |||||||
The amortized cost and estimated fair value of the marketable securities at December 31, 2016, by maturity, are shown below:
Amortized Cost | Gross Unrealized Gains | Gross Unrealized Losses | Estimated Fair Value | ||||||||||||
Available-for-sale securities | |||||||||||||||
Due in one year or less | $ | 27,920 | $ | — | $ | 52 | $ | 27,868 | |||||||
Due after one year and through five years | 16,701 | — | 76 | 16,625 | |||||||||||
$ | 44,621 | $ | — | $ | 128 | $ | 44,493 | ||||||||
4. Accounts Receivable
Accounts receivable include:
December 31, | |||||||
2017 | 2016 | ||||||
Accounts receivable | $ | 33,519 | $ | 28,260 | |||
Less: credit allowance | (240 | ) | (225 | ) | |||
Less: allowance for doubtful accounts | (898 | ) | (617 | ) | |||
Total accounts receivable, net | $ | 32,381 | $ | 27,418 | |||
5. Prepaid Expenses and Other Current Assets
Prepaid expenses and other current assets include:
December 31, | |||||||
2017 | 2016 | ||||||
Prepaid bandwidth and backbone | $ | 1,487 | $ | 698 | |||
VAT receivable | 1,454 | 1,296 | |||||
Prepaid expenses and insurance | 1,870 | 2,321 | |||||
Vendor deposits and other | 586 | 550 | |||||
Total prepaid expenses and other current assets | $ | 5,397 | $ | 4,865 | |||
63
6. Goodwill
We have recorded goodwill as a result of past business acquisitions. Goodwill is recorded when the purchase price paid for an acquisition exceeds the estimated fair value of the net identified tangible and intangible assets acquired. In each of our acquisitions, the objective of the acquisition was to expand our product offerings and customer base and to achieve synergies related to cross selling opportunities, all of which contributed to the recognition of goodwill.
The changes in the carrying amount of goodwill for the years ended December 31, 2017, and 2016, were as follows:
Balance, December 31, 2015 | $ | 76,143 | |
Foreign currency translation adjustment | 100 | ||
Balance, December 31, 2016 | 76,243 | ||
Foreign currency translation adjustment | 811 | ||
Balance, December 31, 2017 | $ | 77,054 | |
7. Property and Equipment
Property and equipment include:
December 31, | |||||||
2017 | 2016 | ||||||
Network equipment | $ | 107,916 | $ | 108,416 | |||
Computer equipment and software | 9,801 | 10,282 | |||||
Furniture and fixtures | 2,432 | 2,432 | |||||
Leasehold improvements | 3,969 | 5,127 | |||||
Other equipment | 183 | 182 | |||||
124,301 | 126,439 | ||||||
Less: accumulated depreciation | (95,310 | ) | (96,087 | ) | |||
Total property and equipment, net | $ | 28,991 | $ | 30,352 | |||
Cost of revenue depreciation expense related to property and equipment was approximately $18,138, $18,032, and $17,975, respectively, for the years ended December 31, 2017, 2016, and 2015, respectively.
Operating expense depreciation and amortization expense related to property and equipment was approximately $2,376, $2,438, and $1,866, respectively, for the years ended December 31, 2017, 2016, and 2015, respectively.
8. Line of Credit
In October 2017, we entered into a Third Amendment (Third Amendment) to the Loan and Security Agreement (the Credit Agreement) with Silicon Valley Bank (SVB) originally entered into in November 2015. Under the Third Amendment, we have increased the maximum principal commitment amount from $5,000 to $10,000. Our borrowing capacity is the lesser of the commitment amount or 80% of eligible accounts receivable. The Third Amendment extends the Credit Agreement one year. All outstanding borrowings owed under the Credit Agreement become due and payable no later than the final maturity date of November 2, 2019.
As of December 31, 2017, we had no outstanding borrowings, and we had availability under the Credit Agreement of approximately $10,000. We had no outstanding borrowings at December 31, 2016, and had availability under the Credit Agreement of approximately $5,000.
As of December 31, 2017, borrowings under the Credit Agreement bear interest at our option of one, two, three or six-month LIBOR plus a margin of 2.50% or an Alternative Base Rate (ABR), which is defined as the Wall Street Journal prime rate. We incurred a commitment fee (issuance costs) of $25 upon entering into the Third Amendment. In addition, there is an unused line fee of 0.20% (20 basis points) under the Third Amendment. Commitment fees are included in prepaid expenses and other current assets and as amortized are charged to interest expense. During the year ended December 31, 2017 and 2016, respectively, interest expense was $0 and $205, respectively, and commitment fees expense and amortization was $80 and $321, respectively. For the year ended December 31, 2015, interest expense and commitment fees expense and amortization was not material.
64
Any borrowings are secured by essentially all of our domestic personal property, with a negative pledge on intellectual property. SVB’s security interest in our foreign subsidiaries is limited to 65% of voting stock of each such foreign subsidiary.
Under the Third Amendment, we are required to maintain a minimum liquidity of $10,000 at all times, measured quarterly, with a minimum of $5,000 of the $10,000 in cash at SVB. We are also subject to certain customary limitations on our ability to, among other things, incur debt, grant liens, make acquisitions and other investments, make certain restricted payments such as dividends, dispose of assets or undergo a change in control. As of December 31, 2017, we were in compliance with all covenants under the Credit Agreement.
9. Other Current Liabilities
Other current liabilities include:
December 31, | |||||||
2017 | 2016 | ||||||
Accrued compensation and benefits | $ | 12,181 | $ | 5,061 | |||
Accrued cost of revenue | 3,170 | 2,178 | |||||
Accrued legal fees | 383 | 262 | |||||
Deferred rent | 434 | 730 | |||||
Other accrued expenses | 2,339 | 4,605 | |||||
Total other current liabilities | $ | 18,507 | $ | 12,836 | |||
10. Other Long Term Liabilities
Other long term liabilities include:
December 31, | |||||||
2017 | 2016 | ||||||
Deferred rent | $ | 327 | $ | 1,186 | |||
Income taxes payable | 231 | 249 | |||||
Total other long term liabilities | $ | 558 | $ | 1,435 | |||
11. Contingencies
Legal Matters
Akamai ‘703 Litigation
In June 2006, Akamai Technologies, Inc. (Akamai) and the Massachusetts Institute of Technology (MIT) filed a lawsuit against us in the United States District Court for the District of Massachusetts alleging that we were infringing multiple patents assigned to MIT and exclusively licensed by MIT to Akamai. In February 2008, a jury returned a verdict in this lawsuit, finding that we infringed four claims of U.S. Patent No. 6,108,703 (the ’703 patent) and awarded Akamai damages of approximately $45,500, which included lost profits, reasonable royalties and price erosion damages for the period April 2005 through December 31, 2007. We litigated this matter vigorously for years, during which time the jury verdict was overturned in 2009, and then, after more than six years of appeals by both Akamai and us in the Federal Circuit and the Supreme Court of the United States, the jury verdict was ultimately reinstated. A series of motions and hearings followed the reinstatement, and in July 2016, the District Court entered final judgment in the case. In August 2016, we entered into a settlement and license agreement with Akamai with respect to the ‘703 and certain other related patents, which settled all asserted and unasserted claims with respect to the licensed patents. The terms of the agreement require us to pay $54,000 over twelve equal quarterly installments, which began on August 1, 2016. We took a charge in the quarter ended June 30, 2016 for the full, undiscounted amount of $54,000. As of December 31, 2017, there remained $27,000 due to Akamai under the terms of the settlement and license agreement.
Akamai and XO Litigation
In November 2015, we filed a lawsuit against Akamai and XO Communications in the District Court for the Eastern District of Virginia alleging the infringement of six of our patents covering a broad range of inventions that we believe are critical to the effective and efficient delivery of bytes by a content delivery network (the Akamai and XO Litigation). Akamai
65
also filed counterclaims in April 2016, alleging the infringement of five of its patents. We filed an answer to Akamai’s counterclaims, denying each of the allegations of infringement in May 2016. At this time, we believe a loss is neither probable nor reasonably possible, and as such, no provision for this lawsuit has been recorded in the consolidated financial statements. We intend to vigorously protect and enforce our intellectual property rights as plaintiffs in this dispute and also vigorously defend against each of the counterclaims.
2016 Akamai Litigations
In February 2016, Akamai filed a complaint against us in the District Court for the District of Massachusetts alleging infringement of three of its patents. In April 2016, Akamai amended its complaint by withdrawing one of the asserted patents. In April 2016, we filed our answer to the complaint, denying each of the allegations of infringement, and asserting two counterclaims alleging infringement of two of our patents. In December 2016, Akamai filed a second complaint against us in the District Court for the District of Massachusetts alleging infringement of three additional patents. In February 2017, we filed our answer to the complaint, denying each of the allegations of infringement. The two cases were then consolidated into a single action by the court. At this time, we believe a loss is neither probable nor reasonably possible in either pending matter in the District of Massachusetts, and as such, no provision for these lawsuits have been recorded in the consolidated financial statements. We intend to vigorously defend against Akamai’s claims and vigorously protect and enforce our intellectual property rights via our counterclaims in this dispute.
Legal and other expenses associated with litigation have been significant. We include these litigation expenses in general and administrative expenses as incurred, as reported in the consolidated statement of operations.
Other Matters
We are subject to various other legal proceedings and claims, either asserted or unasserted, arising in the ordinary course of business. While the outcome of these claims cannot be predicted with certainty, management does not believe the outcome of any of these matters will have a material adverse effect on our business, financial position, results of operations, or cash flows. Litigation relating to the content delivery services industry is not uncommon, and we are, and from time to time have been, subject to such litigation. No assurances can be given with respect to the extent or outcome of any such litigation in the future.
Taxes
We are subject to indirect taxation in various states and foreign jurisdictions. Laws and regulations that apply to communications and commerce conducted over the Internet are becoming more prevalent, both in the United States and internationally, and may impose additional burdens on us conducting business online or providing Internet-related services. Increased regulation could negatively affect our business directly, as well as the businesses of our customers, which could reduce their demand for our services. For example, tax authorities in various states and abroad may impose taxes on the Internet-related revenue we generate based on regulations currently being applied to similar but not directly comparable industries.
There are many transactions and calculations where the ultimate tax determination is uncertain. In addition, domestic and international taxation laws are subject to change. In the future, we may come under audit, which could result in changes to our tax estimates. We believe we maintain adequate tax reserves, that are not material in amount, to offset potential liabilities that may arise upon audit. Although we believe our tax estimates and associated reserves are reasonable, the final determination of tax audits and any related litigation could be materially different than the amounts established for tax contingencies. To the extent these estimates ultimately prove to be inaccurate, the associated reserves would be adjusted, resulting in the recording of a benefit or expense in the period in which a change in estimate or a final determination is made.
12. Net Loss per Share
We calculate basic and diluted loss per weighted average share. We use the weighted-average number of shares of common stock outstanding during the period for the computation of basic earnings per share. Diluted earnings per share include the dilutive effect of all potentially dilutive common stock, including awards granted under our equity incentive compensation plans in the weighted-average number of shares of common stock outstanding.
66
The following table sets forth the components used in the computation of basic and diluted net loss per share for the periods indicated:
Years Ended December 31, | |||||||||||
2017 | 2016 | 2015 | |||||||||
Net loss | $ | (7,630 | ) | $ | (73,925 | ) | $ | (23,952 | ) | ||
Basic and diluted weighted average outstanding shares of common stock | 108,814 | 104,350 | 100,105 | ||||||||
Basic and diluted net loss per share | $ | (0.07 | ) | $ | (0.71 | ) | $ | (0.24 | ) | ||
For the years ended December 31, 2017, 2016 and 2015, the following potentially dilutive common stock, including awards granted under our equity incentive compensation plans were excluded from the computation of diluted net loss per share because including them would have been anti-dilutive.
Years Ended December 31, | ||||||||
2017 | 2016 | 2015 | ||||||
Employee stock purchase plan | 80 | 114 | 134 | |||||
Stock options | 2,643 | 71 | 1,245 | |||||
Restricted stock units | 3,332 | 1,122 | 2,420 | |||||
6,055 | 1,307 | 3,799 | ||||||
13. Stockholders’ Equity
Common Stock
On March 14, 2017, our board of directors authorized a $25,000 share repurchase program. Any shares repurchased under this program will be canceled and returned to authorized but unissued status. This new share repurchase program replaces the $9,500 remaining from the previously announced $15,000 share repurchase program. We did not purchase any shares during the years ended December 31, 2017 and 2016, respectively. During the year ended December 31, 2015, we purchased and canceled 293 shares for $817, including commissions and expenses. All repurchased shares were canceled and returned to authorized but unissued status.
Amended and Restated Equity Incentive Plan
We established the 2007 Equity Incentive Plan, or the 2007 Plan, which allows for the grant of equity, including stock options and restricted stock unit awards. In June 2016, our stockholders approved the Amended and Restated Equity Incentive Plan, or the Restated 2007 Plan, which amended and restated the 2007 Plan. Approval of the Restated 2007 Plan replaced the terms and conditions of the 2007 Plan with the terms and conditions of the Restated 2007 Plan and extended the term of the plan to April 2026. There was no increase in the aggregate amount of shares available for issuance. The total number of shares authorized for issuance under the Restated 2007 Plan as of December 31, 2017 was approximately 6,302.
Employee Stock Purchase Plan
In June 2013, our stockholders approved our 2013 Employee Stock Purchase Plan (ESPP). The ESPP allows participants to purchase our common stock at a 15% discount of the lower of the beginning or end of the offering period using the closing price on that day. During the years ended December 31, 2017, 2016, and 2015, we issued 687, 1,324, and 954 shares, respectively, under the ESPP. Total cash proceeds from the purchase of shares under the ESPP were approximately $1,574, $1,498, and $1,511, respectively for the years ended December 31, 2017, 2016, and 2015. As of December 31, 2017, shares reserved for issuance to employees under this plan totaled 630 and we held employee contributions of approximately $301 (included in other current liabilities) for future purchases under the ESPP.
Preferred Stock
Our board of directors have authorized the issuance of up to 7,500 shares of preferred stock at December 31, 2017. The preferred stock may be issued in one or more series pursuant to a resolution or resolutions providing for such issuance duly adopted by the board of directors. As of December 31, 2017, the Board had not adopted any resolutions for the issuance of preferred stock.
67
14. Accumulated Other Comprehensive Loss
Changes in the components of accumulated other comprehensive loss, net of tax, for the year ended December 31, 2017, was as follows:
Unrealized | |||||||||||
Gains (Losses) on | |||||||||||
Foreign | Available for | ||||||||||
Currency | Sale Securities | Total | |||||||||
Balance, December 31, 2016 | $ | (10,910 | ) | $ | (128 | ) | $ | (11,038 | ) | ||
Other comprehensive gain before reclassifications | 2,651 | 59 | 2,710 | ||||||||
Amounts reclassified from accumulated other comprehensive loss | — | — | — | ||||||||
Net current period other comprehensive gain | 2,651 | 59 | 2,710 | ||||||||
Balance, December 31, 2017 | $ | (8,259 | ) | $ | (69 | ) | $ | (8,328 | ) | ||
15. Share-Based Compensation
Incentive Compensation Plans
We maintain Incentive Compensation Plans (the Plans) to attract, motivate, retain, and reward high quality executives and other employees, officers, directors, and consultants by enabling such persons to acquire or increase a proprietary interest in the Company. The Plans are intended to be qualified plans under the Internal Revenue Code.
The Plans allow us to award stock option grants and restricted stock units (RSUs) to employees, directors and consultants of the Company. During 2017, we granted awards to employees and directors. The exercise price of incentive stock options granted under the Plan may not be granted at less than 100% of the fair market value of our common stock on the date of the grant.
Data pertaining to stock option activity under the Plans are as follows:
Number of Shares | Weighted Average Exercise Price | |||||
(In thousands) | ||||||
Balance at December 31, 2014 | 16,872 | $ | 3.66 | |||
Granted | 3,649 | 2.64 | ||||
Exercised | (607 | ) | 1.73 | |||
Cancelled/Forfeitures | (5,247 | ) | 4.08 | |||
Balance at December 31, 2015 | 14,667 | 3.33 | ||||
Granted | 3,589 | 2.22 | ||||
Exercised | (850 | ) | 1.46 | |||
Cancelled/Forfeitures | (1,389 | ) | 3.38 | |||
Balance at December 31, 2016 | 16,017 | 3.18 | ||||
Granted | 2,082 | 4.56 | ||||
Exercised | (384 | ) | 2.79 | |||
Cancelled/Forfeitures | (752 | ) | 11.04 | |||
Balance at December 31, 2017 | 16,963 | 2.99 | ||||
68
The following table summarizes the information about stock options outstanding and exercisable at December 31, 2017:
Options Outstanding | Options Exercisable | ||||||||||||||||
Exercise Price | Number of Options Outstanding | Weighted Average Remaining Contractual Life (Years) | Weighted Average Exercise Price | Number of Options Exercisable | Weighted Average Exercise Price | ||||||||||||
(In thousands) | (In thousands) | ||||||||||||||||
$ 0.00 — $ 1.50 | — | — | $ | — | — | $ | — | ||||||||||
$ 1.51 — $ 3.00 | 12,228 | 6.9 | 2.26 | 8,721 | 2.26 | ||||||||||||
$ 3.01 — $ 4.50 | 1,761 | 4.7 | 3.69 | 1,590 | 3.69 | ||||||||||||
$ 4.51 — $ 6.00 | 2,411 | 6.9 | 5.31 | 973 | 5.11 | ||||||||||||
$ 6.01 — $ 7.50 | 363 | 0.4 | 6.37 | 363 | 6.37 | ||||||||||||
$ 7.51 — $ 15.00 | 200 | 2.9 | 8.32 | 200 | 8.32 | ||||||||||||
16,963 | 11,847 | ||||||||||||||||
The weighted-average grant-date fair value of options granted during the years ended December 31, 2017, 2016, and 2015 on a per-share basis was approximately $2.38, $1.22, and $1.38, respectively. The total intrinsic value of the options exercised during the years ended December 31, 2017, 2016, and 2015 was approximately $594, $411, and $621, respectively. The aggregate intrinsic value of options outstanding at December 31, 2017 is approximately $27,596. The weighted average remaining contractual term of options currently exercisable at December 31, 2017 was 5.5 years.
The fair value of options awarded were estimated on the grant date using the following weighted average assumptions:
Years Ended December 31, | ||||||||
2017 | 2016 | 2015 | ||||||
Expected volatility | 53.94 | % | 58.30 | % | 54.53 | % | ||
Expected term, years | 6.13 | 5.99 | 5.99 | |||||
Risk-free interest | 2.11 | % | 1.76 | % | 1.80 | % | ||
Expected dividends | — | % | — | % | — | % | ||
Unrecognized share-based compensation related to stock options totaled $8,058 at December 31, 2017. We expect to amortize unvested stock compensation related to stock options over a weighted average period of approximately 2.4 years at December 31, 2017.
The following table summarizes the RSUs outstanding (in thousands):
Years Ended December 31, | ||||||||
2017 | 2016 | 2015 | ||||||
RSUs with service-based vesting conditions | 5,809 | 6,673 | 6,265 | |||||
Each RSU represents the right to receive one share of our common stock upon vesting. The fair value of these RSUs was calculated based upon our closing stock price on the date of grant.
69
Data pertaining to RSUs activity under the Plans is as follows:
Number of Units | Weighted Average Fair Value | |||||
(In thousands) | ||||||
Balance at December 31, 2014 | 6,820 | $ | 2.30 | |||
Granted | 4,156 | 3.00 | ||||
Vested | (3,069 | ) | 2.31 | |||
Forfeitures | (1,642 | ) | 2.54 | |||
Balance at December 31, 2015 | 6,265 | 2.70 | ||||
Granted | 5,024 | 1.76 | ||||
Vested | (3,753 | ) | 2.49 | |||
Forfeitures | (863 | ) | 2.29 | |||
Balance at December 31, 2016 | 6,673 | 2.16 | ||||
Granted | 3,435 | 3.05 | ||||
Vested | (4,004 | ) | 2.16 | |||
Forfeitures | (295 | ) | 2.23 | |||
Balance at December 31, 2017 | 5,809 | 2.68 | ||||
The weighted-average grant-date fair value of RSUs granted during the years ended December 31, 2017, 2016, and 2015 was approximately $3.05, $1.76, and $3.00, respectively. The total intrinsic value of the units vested during the years ended December 31, 2017, 2016, and 2015 was approximately $8,638, $9,363, and $7,088, respectively. The aggregate intrinsic value of RSUs outstanding at December 31, 2017 is $25,619.
At December 31, 2017 there was approximately $12,961 of total unrecognized compensation costs related to RSUs. That cost is expected to be recognized over a weighted-average period of approximately 2.16 years as of December 31, 2017.
Total unrecognized aggregate share-based compensation expense totaled approximately $21,019 at December 31, 2017, which is expected to be recognized over a weighted average period of approximately 2.25 years.
The following table summarizes the components of share-based compensation expense included in our consolidated statement of operations:
Years Ended December 31, | |||||||||||
2017 | 2016 | 2015 | |||||||||
Share-based compensation expense by type: | |||||||||||
Stock options | $ | 3,813 | $ | 3,742 | $ | 4,131 | |||||
Restricted stock units | 8,402 | 9,121 | 7,620 | ||||||||
ESPP | 529 | 596 | 587 | ||||||||
Total share-based compensation expense | $ | 12,744 | $ | 13,459 | $ | 12,338 | |||||
Share-based compensation expense included in the consolidated statements of operations: | |||||||||||
Cost of services | $ | 1,450 | $ | 1,493 | $ | 2,047 | |||||
General and administrative expense | 6,502 | 7,070 | 5,398 | ||||||||
Sales and marketing expense | 2,470 | 2,792 | 2,657 | ||||||||
Research and development expense | 2,322 | 2,104 | 2,236 | ||||||||
Total share-based compensation expense | $ | 12,744 | $ | 13,459 | $ | 12,338 | |||||
On September 18, 2015, the compensation committee of our board of directors approved a stock for salary program and a stock for bonus program, wherein eligible participants elected to receive payment of his or her base salary and/or bonus in shares of our common stock beginning on January 1, 2016. The shares of common stock were issued under our 2007 Equity Incentive Plan. Eligible program participants include our Chief Executive Officer and his direct reports.
The stock for salary program permitted eligible participants to receive 0, 25, 50, 75, or 100% of his or her 2016 salary (including any increases that may occur during the year) in shares of our common stock. On the last trading day of each calendar month, each participant will received the number of shares of our common stock determined by dividing (i) 1/12th of
70
his or her enrolled salary by (ii) the trailing 30-day closing average of our common stock, rounded up to the nearest whole share. Once an election is made, it runs for the full year 2016 and is irrevocable. Participation levels may not be changed after the close of the enrollment period. Once purchased, there is no vesting period for the shares. During 2016, our Chief Executive Officer and two of his direct reports participated in the program. Each of the three participants elected to receive 50% of their respective salary in stock. As a result of their participation in the program, we issued 335 shares of common stock and recorded $572 of stock based compensation expense.
16. Related Party Transactions
In July 2006, an aggregate of 39,869,960 shares of Series B Preferred Stock was issued at a purchase price of $3.26 per share to certain accredited investors in a private placement transaction. As a result of this transaction, entities affiliated with Goldman, Sachs & Co., one of the lead underwriters of our initial public offering (IPO), became holders of more than 10% of our common stock. On June 14, 2007, upon the closing of our IPO, all outstanding shares of our Series B Preferred Stock automatically converted into shares of common stock on a 1-for-1 share basis. On December 5, 2017, Goldman, Sachs & Co. sold 15,000,000 shares of our common stock. As of December 31, 2017, 2016, and 2015 Goldman, Sachs & Co. owned approximately 14%, 28% and 30%, respectively, of our outstanding common stock.
We had no material related party transactions during the years ended December 31, 2017, 2016 and 2015.
17. Leases and Purchase Commitments
Operating Leases
We are committed to various non-cancellable operating leases for office space and office equipment which expire through 2022. Certain leases contain provisions for renewal options and rent escalations upon expiration of the initial lease terms. Approximate future minimum lease payments over the remaining lease periods as of December 31, 2017 are as follows:
2018 | $ | 2,666 | |
2019 | 1,320 | ||
2020 | 547 | ||
2021 | 359 | ||
2022 | 55 | ||
Thereafter | — | ||
Total minimum payments | $ | 4,947 | |
Purchase Commitments
We have non-cancellable long-term commitments for bandwidth usage and co-location with various networks and Internet service providers or ISPs.
The following summarizes minimum commitments as of December 31, 2017:
2018 | $ | 31,787 | |
2019 | 12,697 | ||
2020 | 559 | ||
2021 | 24 | ||
2022 | 2 | ||
Thereafter | — | ||
Total minimum payments | $ | 45,069 | |
Rent and operating expense relating to these operating lease agreements and bandwidth and co-location agreements was approximately $56,785, $59,415, and $61,571, respectively, for the years ended December 31, 2017, 2016, and 2015.
71
18. Concentrations
During the year ended December 31, 2017, we had one customer, Amazon, who represented 10% or more of our total revenues. During the years ended December 31, 2016, and 2015, respectively, we had no customer who represented 10% or more of total revenue.
Revenue from customers located within the United States, our country of domicile, was approximately $112,166, $94,105, and $96,469, respectively, for the years ended December 31, 2017, 2016, and 2015.
During the year ended December 31, 2017, we had three countries Japan, the United Kingdom and the United States, which accounted for 10% or more of our total revenues. During the years ended December 31, 2016, and 2015, respectively, we had two countries, Japan and the United States, which accounted for 10% or more of our total revenues.
19. Income Taxes
Our loss before income taxes consists of the following:
Years Ended December 31, | |||||||||||
2017 | 2016 | 2015 | |||||||||
(Loss) income before income taxes: | |||||||||||
United States | $ | (8,963 | ) | $ | (74,130 | ) | $ | (24,105 | ) | ||
Foreign | 1,759 | 808 | 420 | ||||||||
$ | (7,204 | ) | $ | (73,322 | ) | $ | (23,685 | ) | |||
The components of the provision for income taxes are as follows:
Years Ended December 31, | |||||||||||
2017 | 2016 | 2015 | |||||||||
Current: | |||||||||||
Federal | $ | — | $ | — | $ | — | |||||
State | 40 | 103 | 103 | ||||||||
Foreign | 711 | 330 | 210 | ||||||||
Total current | 751 | 433 | 313 | ||||||||
Deferred: | |||||||||||
Federal | (34 | ) | 15 | 17 | |||||||
State | 3 | — | — | ||||||||
Foreign | (294 | ) | 155 | (63 | ) | ||||||
Total deferred | (325 | ) | 170 | (46 | ) | ||||||
Total provision | $ | 426 | $ | 603 | $ | 267 | |||||
72
A reconciliation of the U.S. federal statutory rate to our effective income tax rate is shown in the table below:
Years Ended December 31, | ||||||||||||||||||||
2017 | 2016 | 2015 | ||||||||||||||||||
Amount | Percent | Amount | Percent | Amount | Percent | |||||||||||||||
U.S. federal statutory tax rate | $ | (2,521 | ) | 35.0 | % | $ | (25,663 | ) | 35.0 | % | $ | (8,290 | ) | 35.0 | % | |||||
Valuation allowance | (30,938 | ) | 429.5 | % | 23,184 | (31.6 | )% | 3,821 | (16.0 | )% | ||||||||||
Foreign income taxes | (179 | ) | 2.5 | % | 338 | (0.5 | )% | 86 | (0.5 | )% | ||||||||||
State income taxes | 90 | (1.2 | )% | 100 | (0.2 | )% | 92 | (0.5 | )% | |||||||||||
Non-deductible expenses | 149 | (2.1 | )% | 323 | (0.4 | )% | 552 | (2.0 | )% | |||||||||||
Uncertain tax positions | (20 | ) | 0.3 | % | (136 | ) | 0.2 | % | (86 | ) | — | % | ||||||||
Non-deductible officer compensation | 638 | (8.9 | )% | — | — | % | — | — | % | |||||||||||
Share-based compensation | 873 | (12.1 | )% | 2,439 | (3.3 | )% | 4,064 | (17.0 | )% | |||||||||||
Federal rate change impact | 32,415 | (450.0 | )% | — | — | % | — | — | % | |||||||||||
Other | (81 | ) | 1.1 | % | 18 | — | % | 28 | — | % | ||||||||||
Provision for income taxes | $ | 426 | (5.9 | )% | $ | 603 | (0.8 | )% | $ | 267 | (1.0 | )% | ||||||||
Deferred income taxes reflect the net tax effects of temporary differences between the carrying amounts of assets and liabilities for financial reporting purposes and the amounts used for income tax purpose. Significant components of our deferred tax assets and liabilities are as follows:
December 31, | |||||||
2017 | 2016 | ||||||
Deferred tax assets: | |||||||
Share-based compensation | $ | 6,047 | $ | 10,463 | |||
Net operating loss and tax credit carry-forwards | 43,543 | 52,798 | |||||
Legal settlement | 6,738 | 17,151 | |||||
Deferred revenue | 1,084 | 878 | |||||
Accounts receivable reserves | 224 | 235 | |||||
Fixed assets | 2,222 | 3,317 | |||||
Other | 311 | 771 | |||||
Total deferred tax assets | 60,169 | 85,613 | |||||
Deferred tax liabilities: | |||||||
Prepaid expenses | (81 | ) | (112 | ) | |||
Other | (8 | ) | (323 | ) | |||
Total deferred tax liabilities | (89 | ) | (435 | ) | |||
Valuation allowance | (58,718 | ) | (84,226 | ) | |||
Net deferred tax assets | $ | 1,362 | $ | 952 | |||
In addition to the deferred tax assets listed in the table above, we have unrecorded tax benefits of $13,860 at December 31, 2016 primarily attributable to the difference between the amount of the financial statement expense and the allowable tax deduction associated with employee stock options and RSUs. As a result of net operating loss (NOL) carryforwards, we were not able to recognize the excess tax benefits of stock option deductions prior to the adoption of ASU 2016-09 on January 1, 2017 because the deductions did not reduce income tax payable. Although not recognized for financial reporting purposes prior to January 1, 2017, this unrecorded tax benefit is available to reduce future income and is incorporated into the disclosed amounts of our federal and state NOL carryforwards, discussed below.
The federal and state NOL carryforwards relate to prior years’ NOLs, which may be used to reduce tax liabilities in future years. At December 31, 2017, we had $176,000 federal and $115,500 state NOL carryforwards, including the NOLs discussed in the preceding paragraph. Our federal NOL will begin to expire in 2027 and the state NOL carryforwards will begin to expire in 2019. Pursuant to Sections 382 and 383 of the Internal Revenue Code, the utilization of NOLs and other tax attributes may be subject to substantial limitations if certain ownership changes occur during a three-year testing period (as defined by the Internal Revenue Code). We did not have any state tax credit carryforwards as of December 31, 2017.
73
We reduce the carrying amounts of deferred tax assets by a valuation allowance if, based on the evidence available, it is more-likely-than-not that such assets will not be realized. In making the assessment under the more-likely-than-not standard, appropriate consideration must be given to all positive and negative evidence related to the realization of the deferred tax assets. This assessment considers, among other matters, the nature, frequency and severity of current and cumulative losses, forecasts of future profitability, the duration of statutory carry-forward periods by jurisdiction, unitary versus stand-alone state tax filings, our experience with loss carryforwards not expiring unutilized, and all tax planning alternatives that may be available.
A valuation allowance has been recorded against our deferred tax assets, with the exception of deferred tax assets at certain foreign subsidiaries as management cannot conclude that it is more-likely-than-not that these assets will be realized. As of December 31, 2017, no valuation allowance was provided on $1,600 of deferred tax assets associated with certain NOLs because it was believed that they will be used to offset our liabilities relating to our uncertain tax positions.
Estimated liabilities for unrecognized tax benefits are included in “other liabilities” on the consolidated balance sheet. These contingent liabilities relate to various tax matters that result from uncertainties in the application of complex income tax regulations in the numerous jurisdictions in which we operate. As of December 31, 2017, unrecognized tax benefits were $1,817, of which approximately $220, if recognized, would favorably impact the effective tax rate and the remaining balance would be substantially offset by valuation allowances.
A summary of the activities associated with our reserve for unrecognized tax benefits, interest and penalties follow:
Unrecognized Tax Benefits | |||
Balance at January 1, 2016 | $ | 1,968 | |
Additions for tax positions related to current year | — | ||
Additions for tax positions related to prior years | — | ||
Settlements | — | ||
Adjustment related to foreign currency translation | (7 | ) | |
Reductions related to the lapse of applicable statute of limitations | (131 | ) | |
Reduction for tax positions of prior years | — | ||
Balance at December 31, 2016 | 1,830 | ||
Additions for tax positions related to current year | — | ||
Additions for tax positions related to prior years | 26 | ||
Settlements | — | ||
Adjustment related to foreign currency translation | 3 | ||
Reductions related to the lapse of applicable statute of limitations | (42 | ) | |
Reduction for tax positions of prior years | — | ||
Balance at December 31, 2017 | $ | 1,817 | |
We recognize interest and penalties related to unrecognized tax benefits in our tax provision. As of December 31, 2017, we had an interest and penalties accrual related to unrecognized tax benefits of $12, which decreased during 2017 by $4. We anticipate our unrecognized tax benefits may increase or decrease within twelve months of the reporting date, as audits or reviews are initiated or settled and as a result of settled potential tax liabilities in certain foreign jurisdictions. It is not currently reasonably possible to estimate the range of change.
We file income tax returns in jurisdictions with varying statues of limitations. Tax years 2014 through 2016 remain subject to examination by federal tax authorities. Tax years 2013 through 2016 generally remain subject to examination by state tax authorities. As of December 31, 2017, we are not under any federal or state income tax examinations.
On December 22, 2017, the Tax Cuts and Jobs Act (the Tax Act) significantly revised the U.S. corporate income tax law, by among other things, reducing the corporate income tax rate to 21% for tax years beginning in 2018, implementing a modified territorial system that includes a one-time transition tax on deemed repatriated earnings of foreign subsidiaries and creating new taxes on certain foreign sourced earnings.
Also on December 22, 2017, The Securities and Exchange Commission staff issued Staff Accounting Bulletin (SAB) 118 to provide guidance for companies that are not able to complete their accounting for the income tax effects of the Tax Act in the period of enactment. SAB 118 provides for a measurement period of up to one year from the date of enactment. During the measurement period, companies need to reflect adjustments to any provisional amounts if it obtains, prepares or analyzes
74
additional information about facts and circumstances that existed as of the enactment date that, if known, would have affected the income tax effects initially reported as provisional amounts.
At December 31, 2017 we have not yet completed our analysis of the Tax Act; however, in certain circumstances, as described below, we have made a reasonable estimate of the effects of the Tax Act.
Provisional Amounts
Income tax expense for the year ending December 31, 2017 includes a $41 tax benefit related to the re-measurement of a deferred tax liability on a long-lived asset. The remaining impact from the re-measurement of our net U.S. deferred tax asset at the lower 21% rate was offset by the valuation allowance.
The one-time transition tax is based on our total post-1986 earnings and profits (E&P) that we previously deferred from U.S. income taxes. We recorded a provisional amount for our one-time transition tax liability for all of our foreign subsidiaries. The transition tax that we calculated resulted in an immaterial amount of additional federal taxable income. The additional taxable income from the transition tax was offset by NOLs and did not result in cash taxes payable.
No additional income taxes have been provided for any remaining undistributed foreign earnings not subject to the transition tax, or any additional outside basis differences inherent in these entities, as these amounts continue to be indefinitely reinvested in foreign operations. Determining the amount of unrecognized deferred tax liability related to any remaining undistributed earnings not subject to the transition tax and additional outside basis difference in these entities (i.e. basis difference in excess of that subject to the one-time transition tax) is not practicable.
The tax provision incorporates assumptions made based upon the Company’s current interpretation of the Tax Act, and may change as we receive additional clarification and implementation guidance and as the interpretation of the Tax Act evolves over time.
The Tax Act contains several base broadening provisions that became effective on January 1, 2018 that we do not expect to have a material impact on future earnings due to our NOL and valuation allowance position. Also effective for 2018 is a new Global Intangible Low-Taxed Income inclusion (GILTI). We do not expect the GILTI to have a material impact on future earnings due to our NOL and valuation allowance position. We will account for the effects of the GILTI in the period we become subject to its provisions.
20. 401(k) Plan
We manage the Limelight Networks 401(k) Plan covering effectively all of our employees. The plan is a 401(k) profit sharing plan in which participating employees are fully vested in any contributions they make.
We will match employee deferrals as follows: a dollar-for-dollar match on eligible employee’s deferral that does not exceed 3% of compensation for the year and a 50% match on the next 2% of the employee deferrals. Our employees may elect to reduce their current compensation up to the statutory limit. We made matching contributions of approximately $1,327, $1,345, and $1,434 during the years ended December 31, 2017, 2016, and 2015, respectively.
21. Segment Reporting and Geographic Information
Our chief operating decision maker (whom is our Chief Executive Officer) reviews the financial information presented on a consolidated basis for purposes of allocating resources and evaluating our financial performance. We operate in one industry segment — content delivery and related services and we operate in three geographic areas — Americas, Europe, Middle East and Africa (EMEA) and Asia Pacific.
75
Revenue by geography is based on the location of the customer from which the revenue is earned. The following table sets forth revenue by geographic area:
Years Ended December 31, | |||||||||||||||||
2017 | 2016 | 2015 | |||||||||||||||
Americas | $ | 116,112 | 63.0 | % | $ | 100,421 | 59.7 | % | $ | 102,505 | 60.0 | % | |||||
EMEA | 37,212 | 20.2 | % | 31,326 | 18.6 | % | 32,505 | 19.0 | % | ||||||||
Asia Pacific | 31,036 | 16.8 | % | 36,487 | 21.7 | % | 35,902 | 21.0 | % | ||||||||
Total revenue | $ | 184,360 | 100.0 | % | $ | 168,234 | 100.0 | % | $ | 170,912 | 100.0 | % | |||||
The following table sets forth long-lived assets by geographic area:
Years Ended December 31, | |||||||||||
2017 | 2016 | 2015 | |||||||||
Long-lived Assets | |||||||||||
Americas | $ | 17,119 | $ | 18,665 | $ | 19,692 | |||||
International | 11,872 | 11,687 | 16,466 | ||||||||
Total long-lived assets | $ | 28,991 | $ | 30,352 | $ | 36,158 | |||||
22. Fair Value Measurements
We evaluate our financial instruments within the three-tier fair value hierarchy, which prioritizes the inputs used in measuring fair value. These tiers include:
Level 1 - defined as observable inputs such as quoted prices in active markets;
Level 2 - defined as other than quoted prices in active markets that are either directly or indirectly observable; and
Level 3 - defined as unobservable inputs in which little or no market data exists, therefore requiring an entity to develop its own assumptions.
As of December 31, 2017, and 2016, we held certain assets and liabilities that were required to be measured at fair value on a recurring basis. The following is a summary of fair value measurements at December 31, 2017:
___________
Fair Value Measurements at Reporting Date Using | |||||||||||||||
Description | Total | Quoted Prices In Active Markets for Identical Assets (Level 1) | Significant Other Observable Inputs (Level 2) | Significant Unobservable Inputs (Level 3) | |||||||||||
Assets: | |||||||||||||||
Money market funds (2) | $ | 6,789 | $ | 6,789 | $ | — | $ | — | |||||||
Certificate of deposit (1) | 40 | — | 40 | — | |||||||||||
Corporate notes and bonds (1) | 28,404 | — | 28,404 | — | |||||||||||
Total assets measured at fair value | $ | 35,233 | $ | 6,789 | $ | 28,444 | $ | — | |||||||
(1) | Classified in marketable securities |
(2) | Classified in cash and cash equivalents |
76
The following is a summary of fair value measurements at December 31, 2016:
____________
Fair Value Measurements at Reporting Date Using | |||||||||||||||
Description | Total | Quoted Prices In Active Markets for Identical Assets (Level 1) | Significant Other Observable Inputs (Level 2) | Significant Unobservable Inputs (Level 3) | |||||||||||
Assets: | |||||||||||||||
Money market funds (2) | $ | 301 | $ | 301 | $ | — | $ | — | |||||||
Certificate of deposit (1) | 40 | — | 40 | — | |||||||||||
Commercial paper (1) | 8,222 | — | 8,222 | — | |||||||||||
Corporate notes and bonds (1) | 36,231 | — | 36,231 | — | |||||||||||
Total assets measured at fair value | $ | 44,794 | $ | 301 | $ | 44,493 | $ | — | |||||||
(1) | Classified in marketable securities |
(2) | Classified in cash and cash equivalents |
The carrying amount of cash equivalents approximates fair value because their maturity is less than three months. The carrying amount of short-term and long-term marketable securities approximates fair value as the securities are marked to market as of each balance sheet date with any unrealized gains and losses reported in stockholders’ equity. The carrying amount of accounts receivable, accounts payable and accrued liabilities approximates fair value due to the short-term maturity of the amounts.
23. Quarterly Financial Results (unaudited)
The following tables sets forth certain unaudited quarterly results of operations for the years ended December 31, 2017 and 2016. Amounts may not foot due to rounding.
In the opinion of management, this information has been prepared on the same basis as the audited consolidated financial statements and all necessary adjustments, consisting only of normal recurring adjustments, have been included in the amounts below for a fair statement of the quarterly information when read in conjunction with the audited consolidated financial statements and related notes included elsewhere in this annual report on Form 10-K:
For the Three Months Ended | |||||||||||||||
March 31, 2017 | June 30, 2017 | Sept. 30, 2017 | Dec. 31, 2017 | ||||||||||||
Revenues | $ | 44,735 | $ | 45,370 | $ | 46,069 | $ | 48,186 | |||||||
Gross profit | $ | 21,171 | $ | 21,375 | $ | 22,276 | $ | 22,977 | |||||||
Net loss | $ | (3,337 | ) | $ | (1,625 | ) | $ | (1,756 | ) | $ | (912 | ) | |||
Basic and diluted net loss per share | $ | (0.03 | ) | $ | (0.01 | ) | $ | (0.02 | ) | $ | (0.01 | ) | |||
Basic and diluted weighted average common shares outstanding | 107,363 | 108,422 | 109,342 | 110,128 | |||||||||||
For the Three Months Ended | |||||||||||||||
March 31, 2016 | June 30, 2016 (a) | Sept. 30, 2016 | Dec. 31, 2016 | ||||||||||||
Revenues | $ | 41,422 | $ | 43,560 | $ | 39,473 | $ | 43,778 | |||||||
Gross profit | $ | 16,644 | $ | 18,800 | $ | 16,238 | $ | 19,662 | |||||||
Net loss | $ | (5,946 | ) | $ | (57,938 | ) | $ | (6,122 | ) | $ | (3,919 | ) | |||
Basic and diluted net loss per share | $ | (0.06 | ) | $ | (0.56 | ) | $ | (0.06 | ) | $ | (0.04 | ) | |||
Basic and diluted weighted average common shares outstanding | 102,693 | 103,904 | 104,860 | 105,942 | |||||||||||
(a) During the quarter ended June 30, 2016, we recorded a $54,000 provision for litigation related to the Akamai settlement and license agreement.
Item 9. Changes in and Disagreements with Accountants on Accounting and Financial Disclosure
None.
Item 9A. Controls and Procedures
Evaluation of Disclosure Controls and Procedures
We maintain disclosure controls and procedures that are designed to ensure that information required to be disclosed in our reports under the Exchange Act is recorded, processed, summarized and reported within the time periods specified in the SEC’s rules and forms, and that such information is accumulated and communicated to management, including our Chief Executive Officer and Chief Financial Officer, as appropriate, to allow timely decisions regarding required disclosure.
We carried out an evaluation, under the supervision and with the participation of our management, including our Chief Executive Officer and Chief Financial Officer, of the effectiveness of our disclosure controls and procedures, as defined in Rules 13a-15(e) and 15d-15(e) of the Exchange Act, as of December 31, 2017. Based upon that evaluation, our Chief Executive Officer and Chief Financial Officer have concluded that our disclosure controls and procedures were effective as of December 31, 2017.
Changes in Internal Control over Financial Reporting
There were no changes in our internal control over financial reporting during the quarter ended December 31, 2017 that materially affected, or are reasonably likely to materially affect, our internal control over financial reporting.
Management’s Annual Report on Internal Control over Financial Reporting
Our management is responsible for establishing and maintaining adequate internal control over financial reporting as defined in Rules 13a-15(f) and 15d-15(f) under the Exchange Act. Our internal control over financial reporting is designed to provide reasonable assurance regarding the reliability of financial reporting and the preparation of financial statements for external purposes in accordance with U.S. GAAP. Our internal control over financial reporting includes those policies and procedures that: (i) pertain to the maintenance of records that, in reasonable detail, accurately and fairly reflect the transactions and dispositions of our assets; (ii) provide reasonable assurance that transactions are recorded as necessary to permit preparation of financial statements in accordance with U.S. GAAP, and that our receipts and expenditures are being made only in accordance with authorizations of our management and directors; and (iii) provide reasonable assurance regarding prevention or timely detection of unauthorized acquisition, use or disposition of our assets that could have a material effect on the financial statements.
Because of its inherent limitations, internal control over financial reporting may not prevent or detect misstatements. Also, projections of any evaluation of effectiveness to future periods are subject to the risk that controls may become inadequate because of changes in conditions, or that the degree of compliance with the policies or procedures may deteriorate.
Under the supervision of our Chief Executive Officer and Chief Financial Officer, our management assessed the effectiveness of our internal control over financial reporting as of December 31, 2017. In making this assessment, management used the criteria set forth in the Internal Control-Integrated Framework issued by the Committee of Sponsoring Organizations of the Treadway Commission (COSO) (2013 framework). Based on this assessment, our management has concluded that our internal control over financial reporting was effective as of December 31, 2017.
Our financial statements included in this annual report on Form 10-K have been audited by Ernst & Young LLP, independent registered public accounting firm, as indicated in the report included elsewhere herein. Ernst & Young LLP has also provided an attestation report on the Company’s internal control over financial reporting.
Limitations on Effectiveness of Controls and Procedures
In designing and evaluating the disclosure controls and procedures, management recognizes that any controls and procedures, no matter how well designed and operated, can provide only reasonable assurance of achieving the desired control objectives. In addition, the design of disclosure controls and procedures must reflect the fact that there are resource constraints
77
and that management is required to apply its judgment in evaluating the benefits of possible controls and procedures relative to their costs.
78
Report of Independent Registered Public Accounting Firm
To the Stockholders and the Board of Directors of Limelight Networks, Inc.
Opinion on Internal Control over Financial Reporting
We have audited Limelight Networks, Inc.’s internal control over financial reporting as of December 31, 2017, based on criteria established in Internal Control-Integrated Framework issued by the Committee of Sponsoring Organizations of the Treadway Commission (2013 framework) (the COSO criteria). In our opinion, Limelight Networks, Inc. (the Company) maintained, in all material respects, effective internal control over financial reporting as of December 31, 2017, based on the COSO criteria.
We also have audited, in accordance with the standards of the Public Company Accounting Oversight Board (United States) (PCAOB), the consolidated balance sheets of the Company as of December 31, 2017 and 2016, and the related consolidated statements of operations, comprehensive loss, stockholders’ equity, and cash flows for each of the three years in the period ended December 31, 2017 of the Company and our report dated February 8, 2018 expressed an unqualified opinion thereon.
Basis for Opinion
The Company’s management is responsible for maintaining effective internal control over financial reporting and for its assessment of the effectiveness of internal control over financial reporting included in the accompanying Management’s Report on Internal Control Over Financial Reporting. Our responsibility is to express an opinion on the Company’s internal control over financial reporting based on our audit. We are a public accounting firm registered with the PCAOB and are required to be independent with respect to the Company in accordance with the U.S. federal securities laws and the applicable rules and regulations of the Securities and Exchange Commission and the PCAOB.
We conducted our audit in accordance with the standards of the PCAOB. Those standards require that we plan and perform the audit to obtain reasonable assurance about whether effective internal control over financial reporting was maintained in all material respects.
Our audit included obtaining an understanding of internal control over financial reporting, assessing the risk that a material weakness exists, testing and evaluating the design and operating effectiveness of internal control based on the assessed risk, and performing such other procedures as we considered necessary in the circumstances. We believe that our audit provides a reasonable basis for our opinion.
Definition and Limitations of Internal Control Over Financial Reporting
A company’s internal control over financial reporting is a process designed to provide reasonable assurance regarding the reliability of financial reporting and the preparation of financial statements for external purposes in accordance with generally accepted accounting principles. A company’s internal control over financial reporting includes those policies and procedures that (1) pertain to the maintenance of records that, in reasonable detail, accurately and fairly reflect the transactions and dispositions of the assets of the company; (2) provide reasonable assurance that transactions are recorded as necessary to permit preparation of financial statements in accordance with generally accepted accounting principles, and that receipts and expenditures of the company are being made only in accordance with authorizations of management and directors of the company; and (3) provide reasonable assurance regarding prevention or timely detection of unauthorized acquisition, use, or disposition of the company’s assets that could have a material effect on the financial statements.
Because of its inherent limitations, internal control over financial reporting may not prevent or detect misstatements. Also, projections of any evaluation of effectiveness to future periods are subject to the risk that controls may become inadequate because of changes in conditions, or that the degree of compliance with the policies or procedures may deteriorate.
/s/ Ernst & Young LLP
Phoenix, Arizona
February 8, 2018
79
Item 9B. Other Information
None.
80
PART III
Item 10. Directors, Executive Officers and Corporate Governance
The information required by this item relating to our directors and nominees is included under the captions “Proposal One: Election of Directors,” “— Information About the Directors and Nominees,” and “Board of Directors Meetings and Committees — Nominating and Governance Committee” in our Proxy Statement related to the 2018 Annual Meeting of Shareholders and is incorporated herein by reference.
The information required by this item regarding our Audit Committee is included under the caption “Board of Directors Meetings and Committees” in our Proxy Statement related to the 2018 Annual Meeting of Shareholders and is incorporated herein by reference.
The information required by this item relating to our executive officers is included under the caption “Executive Officers of the Registrant” in Part I of this annual report on Form 10-K.
The information required by this item regarding compliance with Section 16(a) of the Securities Act of 1934 is included under the caption “Executive Compensation and Other Matters — Section 16(a) Beneficial Ownership Reporting Compliance” in our Proxy Statement related to the 2018 Annual Meeting of Shareholders and is incorporated herein by reference.
We have adopted a code of ethics and business conduct that applies to our Chief Executive Officer, Chief Financial Officer and all other principal executive and senior financial officers and all employees, officers and directors. This code of ethics and business conduct is posted on our website. The Internet address for our website is www.limelight.com, and the code of ethics may be found from our main webpage by clicking first on “About Limelight” and then on “Investors Home”, next on “Corporate Governance”, and finally on “Code of Ethics” under Governance Documents.
We intend to satisfy any disclosure requirement under Item 5.05 of Form 8-K regarding an amendment to, or waiver from, a provision of this code of ethics by posting such information on our website, on the webpage found by clicking through to “Code of Ethics” as specified above.
Item 11. Executive Compensation
The information appearing under the headings “Executive Compensation and Other Matters,” “— Director Compensation,” “Board of Directors Meetings and Committees — Compensation Committee Interlocks and Insider Participation,” and “— Compensation Committee Report” in our Proxy Statement related to the 2018 Annual Meeting of Shareholders is incorporated herein by reference.
Item 12. Security Ownership of Certain Beneficial Owners and Management and Related Stockholder Matters
The information required by this item relating to security ownership of certain beneficial owners and management is included under the heading “Security Ownership of Certain Beneficial Owners and Management” in our Proxy Statement related to the 2018 Annual Meeting of Shareholders, and is incorporated herein by reference.
81
Equity Compensation Plan Information
The following table provides information regarding our current equity compensation plans as of December 31, 2017 (shares in thousands):
Plan category | Number of securities to be issued upon exercise of outstanding options, warrants and rights (a) | Weighted-average exercise price of outstanding options, warrants and rights (b) | Number of securities remaining available for future issuance under equity compensation plans (excluding securities reflected in column (a)) (c) | ||||||
Equity compensation plans approved by security holders | 16,963 | $ | 2.99 | 6,302 | |||||
Equity compensation plans not approved by security holders | — | — | — | ||||||
Total | 16,963 | $ | 2.99 | 6,302 | |||||
Item 13. Certain Relationships, Related Transactions, and Director Independence
The information required by this item relating to review, approval or ratification of transactions with related persons is included under the heading “Certain Relationships and Related Transactions,” and the information required by this item relating to director independence is included under the headings “Proposal One: Election of Directors” and “Board of Directors Meetings and Committees — Board Independence,” in each case in our Proxy Statement related to the 2018 Annual Meeting of Shareholders, and is incorporated herein by reference.
Item 14. Principal Accounting Fees and Services
The information required by this item is included under the headings “Audit Committee Report—Principal Accountant Fees and Services” and “— Audit Committee Pre-Approval Policy,” in each case in our Proxy Statement related to the 2018 Annual Meeting of Shareholders, and is incorporated herein by reference.
82
PART IV
Item 15. Exhibits and Financial Statement Schedules.
(a) | Documents included in this annual report on Form 10-K. |
(1) | Financial Statements. See Item 8 — Financial Statements and Supplementary Data included in this annual report on Form 10-K. |
(2) | Financial Schedules. The schedule listed below is filed as part of this annual report on Form 10-K: |
Page | |
Schedule II — Valuation and Qualifying Accounts | |
All other schedules are omitted as the information required is inapplicable or the information is presented in the consolidated financial statements and the related notes.
(b) | Exhibits. The exhibits required by Item 601 of Regulation S-K are listed in the Exhibit Index immediately preceding the exhibits and are incorporated herein. |
83
INDEX TO EXHIBITS
___________
Exhibit Number | Exhibit Title | |
3.1(1) | ||
3.2(2) | ||
4.1(3) | ||
10.1(3) | ||
10.2(3) | ||
10.3(3) | ||
10.3.01(4) | ||
10.4(5) | ||
10.5(6) | ||
10.6(7) | ||
10.7(8) | ||
10.8(9) | ||
10.9(10) | ||
10.10(11) | ||
10.10.01(12) | ||
10.11(13) | ||
10.11.01(14) | ||
10.11.02(15) | ||
10.12(16) | ||
10.13(17) | ||
10.13.01(18) | ||
10.13.02(19) | ||
10.14(20) | ||
10.14.01(21) | ||
10.14.02(22) | ||
10.15(23) | ||
10.15.01(24) | ||
10.16(25) | ||
10.16.01(26) | ||
84
10.16.02(27) | ||
10.17(28) | ||
10.17.01(29) | ||
10.18(30) | ||
10.19(31) | ||
21.1 | ||
23.1 | ||
24.1 | ||
31.1 | ||
31.2 | ||
32.1* | ||
32.2* | ||
101.INS | XBRL INSTANCE DOCUMENT. | |
101.SCH | XBRL TAXONOMY EXTENSION SCHEMA DOCUMENT. | |
101.CAL | XBRL TAXONOMY EXTENSION CALCULATION LINKBASE DOCUMENT. | |
101.DEF | XBRL TAXONOMY EXTENSION DEFINITION LINKBASE DOCUMENT. | |
101.LAB | XBRL TAXONOMY EXTENSION LABEL LINKBASE DOCUMENT. | |
101.PRE | XBRL TAXONOMY EXTENSION PRESENTATION LINKBASE DOCUMENT. | |
____________
(1) | Incorporated by reference to Exhibit 3.1 of the Registrant’s Current Report on Form 8-K filed on June 14, 2011. |
(2) | Incorporated by reference to Exhibit 3.2 of the Registrant's Form 8-K filed on February 19, 2013. |
(3) | Incorporated by reference to the same number exhibit of the Registrant’s Form S-1 Registration Statement (Registration No. 333-141516), declared effective by the Securities and Exchange Commission on June 7, 2007. |
(4) | Incorporated by reference to Exhibit 10.3.01 of the Registrant’s Quarterly Report on Form 10-Q filed on October 27, 2016. |
(5) | Incorporated by reference to Exhibit 10.12 of the Registrant’s Form S-1 Registration Statement (Registration No. 333-141516), declared effective by the Securities and Exchange Commission on June 7, 2007. |
(6) | Incorporated by reference to Exhibit 99.1 of the Registrant’s Current Report on Form 8-K filed on May 19, 2009. |
(7) | Incorporated by reference to Exhibit (a)(1)(I) of the Registrant’s Schedule TO filed on May 15, 2008. |
(8) | Incorporated by reference to Exhibit (a)(1)(J) of the Registrant’s Schedule TO filed on May 15, 2008. |
(9) | Incorporated by reference to Exhibit 10.32 of the Registrant’s Quarterly Report on Form 10-Q filed on November 5, 2010. |
(10) | Incorporated by reference to Exhibit 10.20 of the Registrant's Annual Report on Form 10-K filed on March 1, 2013. |
(11) | Incorporated by reference to Exhibit 10.21 of the Registrant’s Annual Report on Form 10-K filed on March 1, 2013. |
(12) | Incorporated by reference to Exhibit 10.1 of the Registrant’s Quarterly Report on Form 10-Q filed on April 28, 2016. |
(13) | Incorporated by reference to Exhibit 10.22 of the Registrant's Annual Report on Form 10-K filed on March 1, 2013. |
(14) | Incorporated by reference to Exhibit 10.3 of the Registrant's Form 8-K filed on June 19, 2015. |
(15) | Incorporated by reference to Exhibit 10.3 of the Registrant’s Quarterly Report on Form 10-Q filed on April 28, 2016. |
85
(16) | Incorporated by reference to Exhibit 10.23 of the Registrant's Quarterly Report on Form 10-Q filed on August 8, 2013. |
(17) | Incorporated by reference to Exhibit 10.24 of the Registrant's Quarterly Report on Form 10-Q filed on August 8, 2013. |
(18) | Incorporated by reference to Exhibit 10.1 of the Registrant's Form 8-K filed on June 19, 2015. |
(19) | Incorporated by reference to Exhibit 10.16.02 of the Registrant's Annual Report on Form 10-K filed on February 11, 2016. |
(20) | Incorporated by reference to Exhibit 10.17 of the Registrant’s Annual Report on Form 10-K filed on February 17, 2015. |
(21) | Incorporated by reference to Exhibit 10.2 of the Registrant's Form 8-K filed on June 19, 2015. |
(22) | Incorporated by reference to Exhibit 10.2 of the Registrant’s Quarterly Report on Form 10-Q filed on April 28, 2016. |
(23) | Incorporated by reference to Exhibit 10.2 of the Registrant’s Quarterly Report on Form 10-Q filed on May 1, 2015. |
(24) | Incorporated by reference to Exhibit 10.5 of the Registrant’s Quarterly Report on Form 10-Q filed on April 28, 2016. |
(25) | Incorporated by reference to Exhibit 10.1 of the Registrant's Form 8-K filed on November 3, 2015. |
(26) | Incorporated by reference to Exhibit 10.19.01 of the Registrant’s Quarterly Report on Form 10-Q filed on October 27, 2016. |
(27) | Filed herewith |
(28) | Incorporated by reference to Exhibit 10.17 of the Registrant’s Annual Report on Form 10-K filed on February 17, 2017. |
(29) | Incorporated by reference to Exhibit 10.4 of the Registrant’s Quarterly Report on Form 10-Q filed on April 28, 2016. |
(30) | Incorporated by reference to Exhibit 10.6 of the Registrant’s Quarterly Report on Form 10-Q filed on April 28, 2016. |
(31) | Incorporated by reference to Exhibit 10.1 of the Registrant’s Form 8-K filed on August 1, 2016. |
* | This exhibit shall not be deemed “filed” for purposes of Section 18 of the Securities Exchange Act of 1934 or otherwise subject to the liabilities of that Section, nor shall it be deemed incorporated by reference in any filings under the Securities Act of 1933 or the Securities Exchange Act of 1934, whether made before or after the date hereof and irrespective of any general incorporation language in any filings. |
† | Confidential treatment has been requested or granted for portions of this exhibit by the Securities and Exchange Commission. |
86
Item 16. Form 10-K Summary.
None
87
SIGNATURES
Pursuant to the requirements of Section 13 or 15(d) of the Securities Exchange Act of 1934, the registrant has duly caused this report to be signed on its behalf by the undersigned, thereunto duly authorized.
LIMELIGHT NETWORKS, INC. | |||
Date: | February 8, 2018 | By: | /S/ SAJID MALHOTRA |
Sajid Malhotra Chief Financial Officer (Principal Financial Officer) | |||
POWER OF ATTORNEY
KNOW ALL PERSONS BY THESE PRESENTS, that each person whose signature appears below constitutes and appoints Robert A. Lento and Sajid Malhotra and each of them, each with the power of substitution, their attorney-in-fact, to sign any amendments to this Annual Report on Form 10-K (including post-effective amendments), and to file the same, with exhibits thereto and other documents in connection therewith, with the Securities and Exchange Commission, hereby ratifying and confirming all that each of said attorneys-in-fact, or their substitute or substitutes, may do or cause to be done by virtue hereof.
Pursuant to the requirements of the Securities Act of 1934, this report has been signed below by the following persons on behalf of the registrant and in the capacities and on the dates indicated.
Signature | Title | Date | ||
/S/ ROBERT A. LENTO | President, Chief Executive Officer and Director (Principal Executive Officer) | February 8, 2018 | ||
Robert A. Lento | ||||
/S/ SAJID MALHOTRA | Chief Financial Officer (Principal Financial Officer) | February 8, 2018 | ||
Sajid Malhotra | ||||
/S/ DANIEL R. BONCEL | Vice President, Finance (Principal Accounting Officer) | February 8, 2018 | ||
Daniel R. Boncel | ||||
/S/ WALTER D. AMARAL | Non-Executive Chairman of the Board and Director | February 8, 2018 | ||
Walter D. Amaral | ||||
/S/ DOUG BEWSHER | Director | February 8, 2018 | ||
Doug Bewsher | ||||
/S/ JEFFREY T. FISHER | Director | February 8, 2018 | ||
Jeffrey T. Fisher | ||||
/S/ SCOTT GENEREUX | Director | February 8, 2018 | ||
Scott Genereux | ||||
/S/ MARK MIDLE | Director | February 8, 2018 | ||
Mark Midle | ||||
/S/ DAVID C. PETERSCHMIDT | Director | February 8, 2018 | ||
David C. Peterschmidt | ||||
88
LIMELIGHT NETWORKS, INC.
SCHEDULE II — VALUATION AND QUALIFYING ACCOUNTS
(In thousands)
Additions | Deductions | |||||||||||||||
Description | Balance at Beginning of Period | Charged to Costs and Expenses | Charged Against Revenue | Write-Offs Net of Recoveries | Balance at End of Period | |||||||||||
Year ended December 31, 2015: | ||||||||||||||||
Allowances deducted from asset accounts: | ||||||||||||||||
Reserves for accounts receivable | $ | 1,834 | 1,037 | 81 | 1,148 | $ | 1,804 | |||||||||
Deferred tax asset valuation allowance | $ | 54,654 | 4,587 | — | — | $ | 59,241 | |||||||||
Year ended December 31, 2016: | ||||||||||||||||
Allowances deducted from asset accounts: | ||||||||||||||||
Reserves for accounts receivable | $ | 1,804 | 137 | (234 | ) | 864 | $ | 843 | ||||||||
Deferred tax asset valuation allowance | $ | 59,241 | 24,985 | — | — | $ | 84,226 | |||||||||
Year ended December 31, 2017: | ||||||||||||||||
Allowances deducted from asset accounts: | ||||||||||||||||
Reserves for accounts receivable | $ | 843 | 949 | 14 | 668 | $ | 1,138 | |||||||||
Deferred tax asset valuation allowance | $ | 84,226 | (25,508 | ) | — | — | $ | 58,718 | ||||||||
89