Attached files
| file | filename |
|---|---|
| EX-99.1 - EX-99.1 - SYNAPTICS Inc | d511584dex991.htm |
| 8-K - FORM 8-K - SYNAPTICS Inc | d511584d8k.htm |

Second Quarter Fiscal 2018 Earnings February 7, 2018 Exhibit 99.2
This presentation contains forward-looking statements that are subject to the safe harbors created under the Securities Act of 1933, as amended (the “Securities Act”), and the Securities Exchange Act of 1934, as amended (the “Exchange Act”). Forward-looking statements give our current expectations and projections relating to our financial condition, results of operations, plans, objectives, future performance and business, and can be identified by the fact that they do not relate strictly to historical or current facts. Such forward-looking statements may include words such as ”expect,” “anticipate,” “intend,” “believe,” “estimate,” “plan,” “target,” “strategy,” “continue,” “may,” “will,” “should,” variations of such words, or other words and terms of similar meaning. All forward-looking statements reflect our best judgment and are based on several factors relating to our operations and business environment, all of which are difficult to predict and many of which are beyond our control. Such factors include, but are not limited to, the risks as identified in the “Risk Factors,” “Management’s Discussion and Analysis of Financial Condition and Results of Operations” and “Business” sections of our Annual Report on Form 10-K for the fiscal year ended June 24, 2017, and other risks as identified from time to time in our Securities and Exchange Commission reports. Forward-looking statements are based on information available to us on the date hereof, and we do not have, and expressly disclaim, any obligation to publicly release any updates or any changes in our expectations, or any change in events, conditions, or circumstances on which any forward-looking statement is based. Our actual results and the timing of certain events could differ materially from the forward-looking statements. These forward-looking statements do not reflect the potential impact of any mergers, acquisitions, or other business combinations that had not been completed as of the date of this presentation. Safe Harbor Statement
Non-GAAP Results •In evaluating our business, we consider and use non-GAAP net income, which we define as net income excluding share-based compensation, acquisition related costs, and certain other non-cash or recurring and non-recurring items we do not believe are indicative of our core operating performance as a supplemental measure of operating performance. •Non-GAAP net income is not a measurement of our financial performance under GAAP and should not be considered as an alternative to GAAP net income. We present non-GAAP net income because we consider it an important supplemental measure of our performance since it facilitates operating performance comparisons from period to period by eliminating potential differences in net income caused by the existence and timing of share-based compensation charges, acquisition related costs, and certain other non-cash or recurring and non-recurring items. •Non-GAAP net income has limitations as an analytical tool and should not be considered in isolation or as a substitute for our GAAP net income. The principal limitations of this measure are that it does not reflect our actual expenses and may thus have the effect of inflating our net income and net income per share as compared to our operating results reported under GAAP. •Please see our second quarter fiscal 2018 press release for additional discussion of our use of non-GAAP financial measures, and the tables attached to the end of this presentation for a complete reconciliation of GAAP to non-GAAP financial measures used in this presentation.
Synaptics Key Commentary Retail availability now of Vivo phone with world’s first Clear ID™ optical in-display fingerprint Over 30 new far-field voice customer product launches expected in calendar Q1 of 2018 Expect mass production of OLED display drivers in calendar Q2 of 2018 Chip-on-film that enables LCD infinity displays expected to deliver meaningful volumes in calendar Q3 of 2018 Anticipate calendar 2018 growth driven by in-display, chip-on-film, OLED display drivers and far-field voice
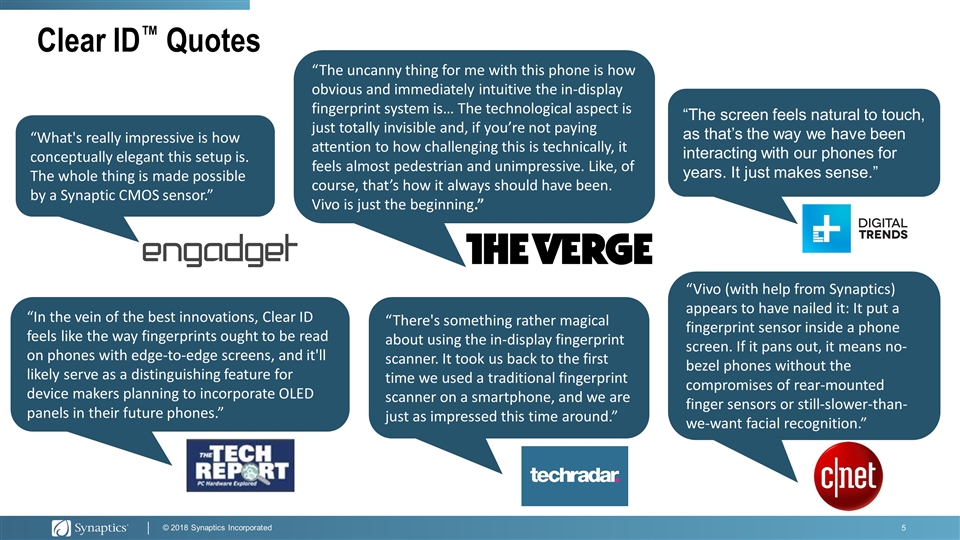
Clear ID™ Quotes “What's really impressive is how conceptually elegant this setup is. The whole thing is made possible by a Synaptic CMOS sensor.” “The uncanny thing for me with this phone is how obvious and immediately intuitive the in-display fingerprint system is… The technological aspect is just totally invisible and, if you’re not paying attention to how challenging this is technically, it feels almost pedestrian and unimpressive. Like, of course, that’s how it always should have been. Vivo is just the beginning.” “In the vein of the best innovations, Clear ID feels like the way fingerprints ought to be read on phones with edge-to-edge screens, and it'll likely serve as a distinguishing feature for device makers planning to incorporate OLED panels in their future phones.” “There's something rather magical about using the in-display fingerprint scanner. It took us back to the first time we used a traditional fingerprint scanner on a smartphone, and we are just as impressed this time around.” “The screen feels natural to touch, as that’s the way we have been interacting with our phones for years. It just makes sense.” “Vivo (with help from Synaptics) appears to have nailed it: It put a fingerprint sensor inside a phone screen. If it pans out, it means no-bezel phones without the compromises of rear-mounted finger sensors or still-slower-than-we-want facial recognition.”
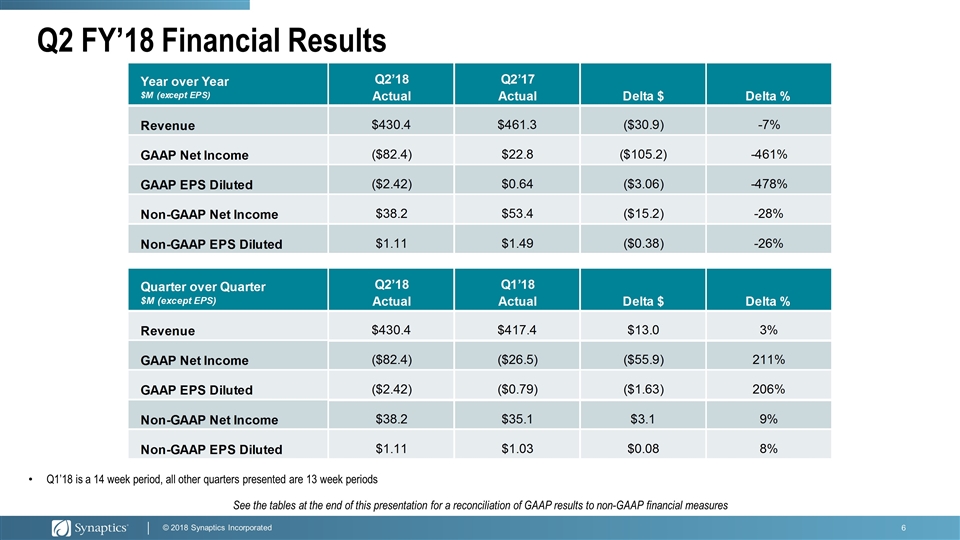
Q2 FY’18 Financial Results Q1’18 is a 14 week period, all other quarters presented are 13 week periods See the tables at the end of this presentation for a reconciliation of GAAP results to non-GAAP financial measures
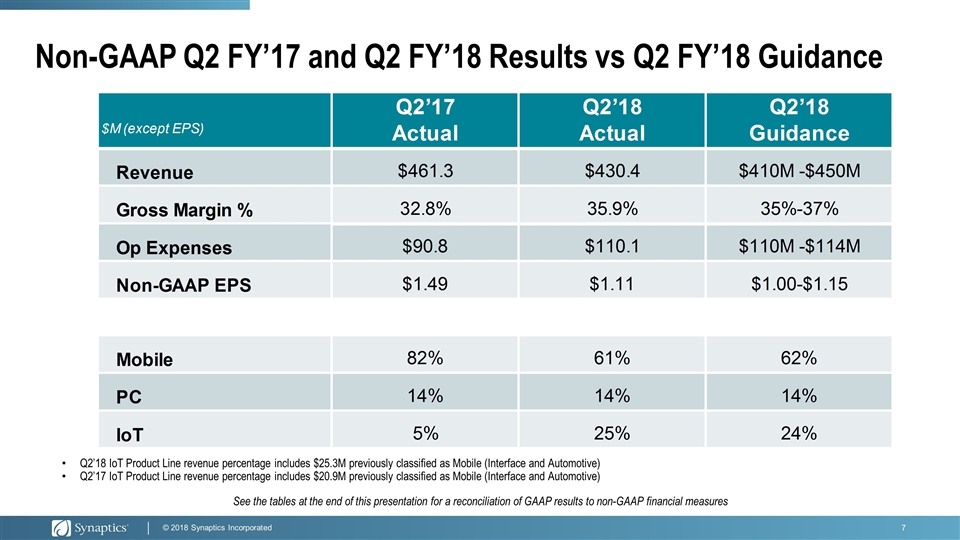
Non-GAAP Q2 FY’17 and Q2 FY’18 Results vs Q2 FY’18 Guidance Q2’18 IoT Product Line revenue percentage includes $25.3M previously classified as Mobile (Interface and Automotive) Q2’17 IoT Product Line revenue percentage includes $20.9M previously classified as Mobile (Interface and Automotive) See the tables at the end of this presentation for a reconciliation of GAAP results to non-GAAP financial measures
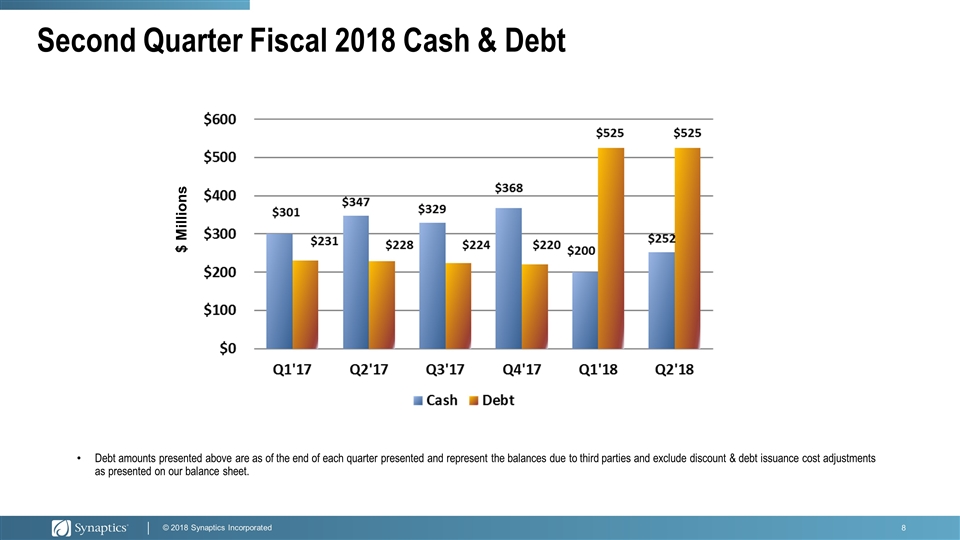
Second Quarter Fiscal 2018 Cash & Debt Debt amounts presented above are as of the end of each quarter presented and represent the balances due to third parties and exclude discount & debt issuance cost adjustments as presented on our balance sheet. $ Millions
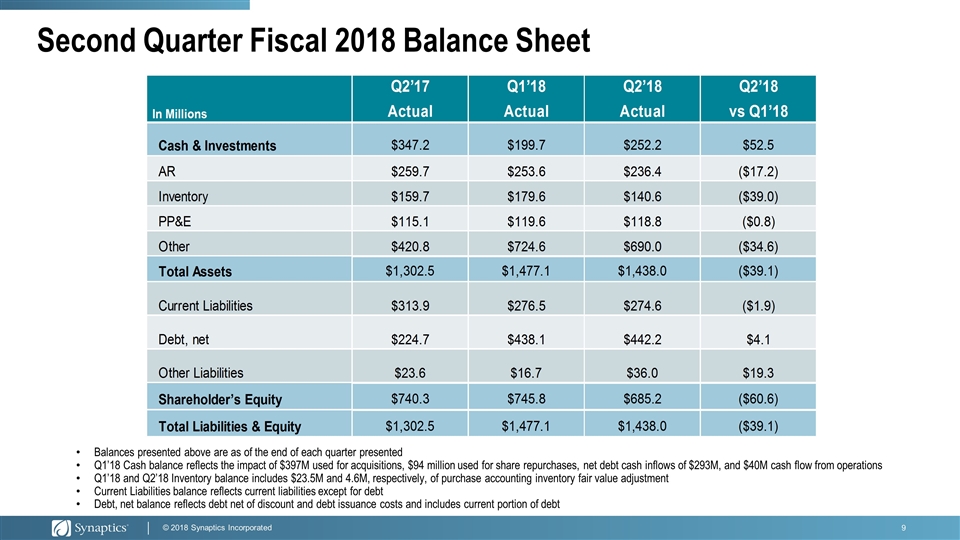
Second Quarter Fiscal 2018 Balance Sheet Balances presented above are as of the end of each quarter presented Q1’18 Cash balance reflects the impact of $397M used for acquisitions, $94 million used for share repurchases, net debt cash inflows of $293M, and $40M cash flow from operations Q1’18 and Q2’18 Inventory balance includes $23.5M and 4.6M, respectively, of purchase accounting inventory fair value adjustment Current Liabilities balance reflects current liabilities except for debt Debt, net balance reflects debt net of discount and debt issuance costs and includes current portion of debt
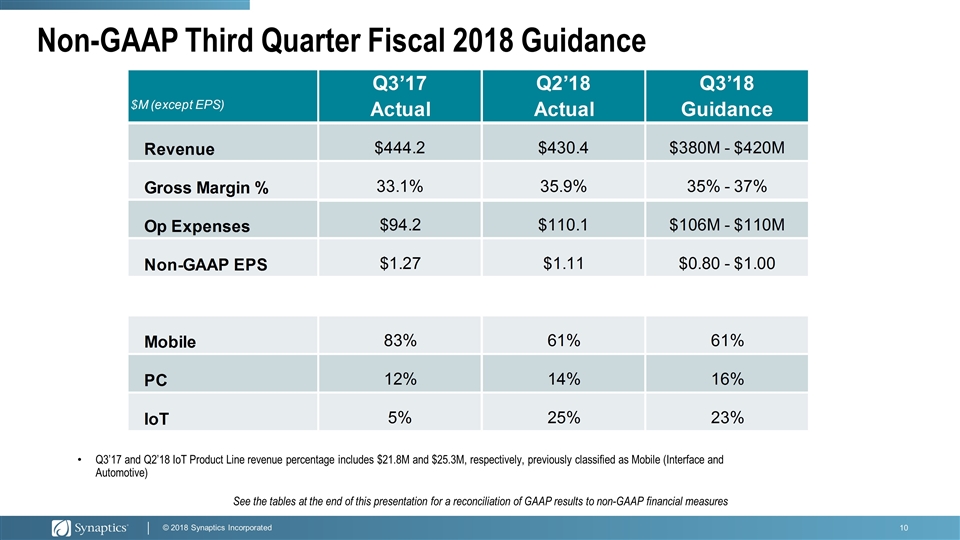
Non-GAAP Third Quarter Fiscal 2018 Guidance See the tables at the end of this presentation for a reconciliation of GAAP results to non-GAAP financial measures Q3’17 and Q2’18 IoT Product Line revenue percentage includes $21.8M and $25.3M, respectively, previously classified as Mobile (Interface and Automotive)
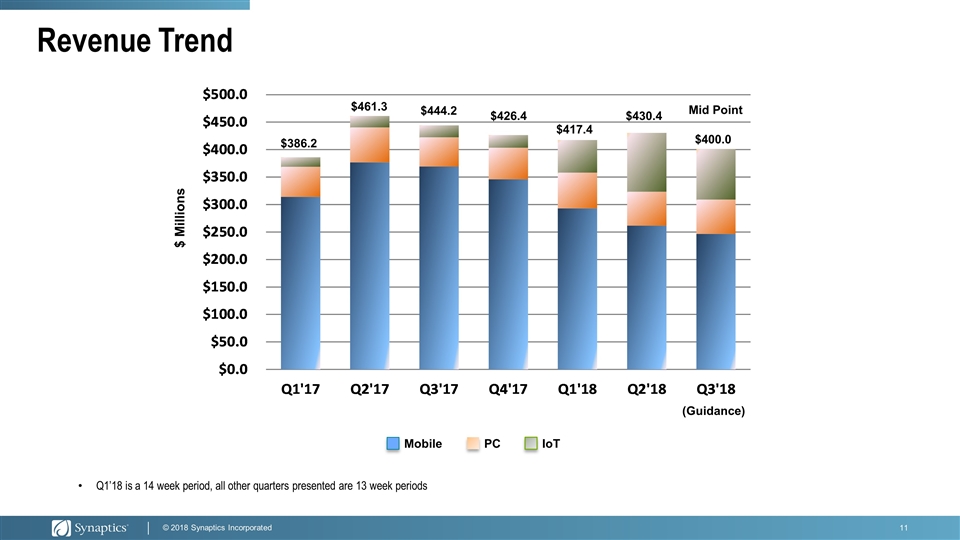
Revenue Trend Q1’18 is a 14 week period, all other quarters presented are 13 week periods (Guidance) $ Millions Mobile PC IoT $386.2 $461.3 $444.2 $426.4 $417.4 $430.4 $400.0 Mid Point
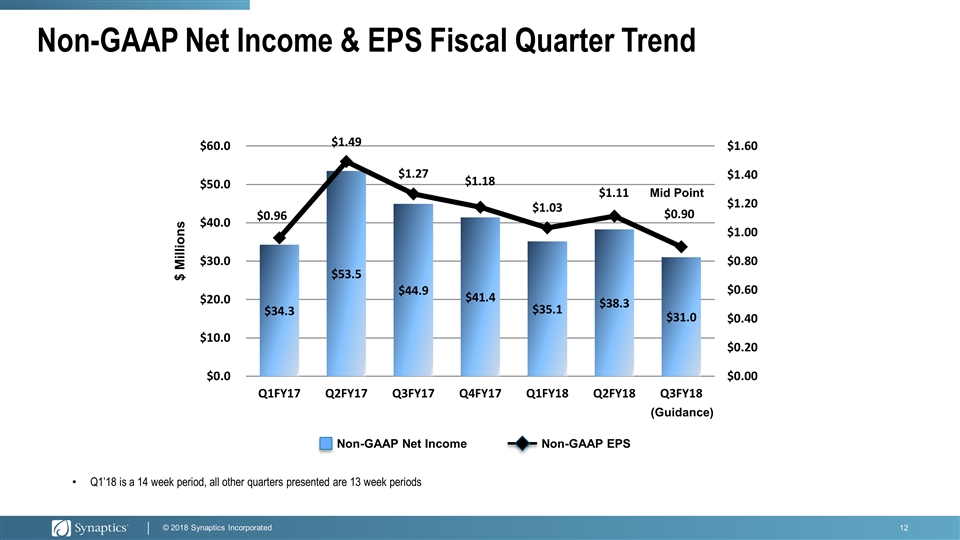
Non-GAAP Net Income & EPS Fiscal Quarter Trend Non-GAAP Net Income Non-GAAP EPS Q1’18 is a 14 week period, all other quarters presented are 13 week periods Mid Point (Guidance) $ Millions
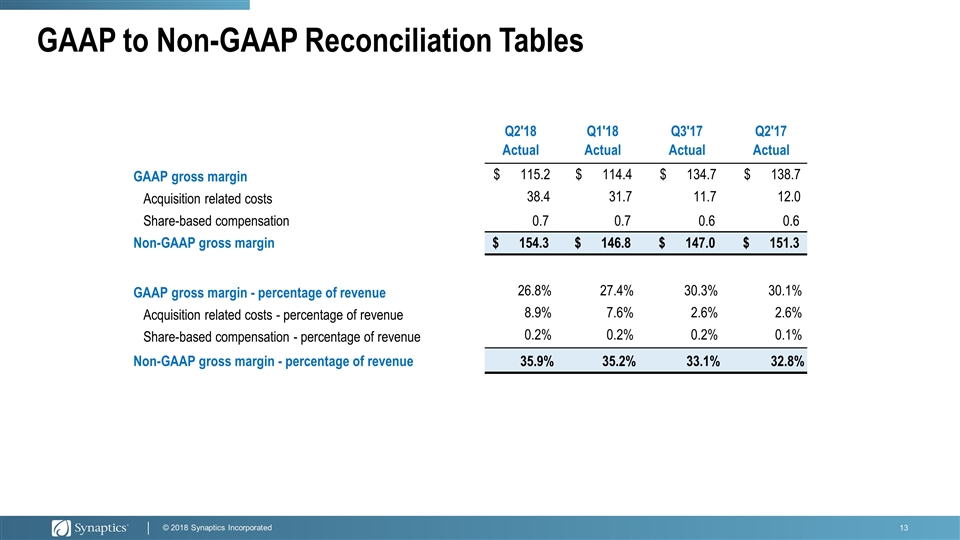
GAAP to Non-GAAP Reconciliation Tables Q2'18 Actual Q1'18 Actual Q3'17 Actual Q2'17 Actual GAAP gross margin $ 115.2 $ 114.4 $ 134.7 $ 138.7 Acquisition related costs 38.4 31.7 11.7 12.0 Share-based compensation 0.7 0.7 0.6 0.6 Non-GAAP gross margin 154.3 $ 146.8 $ 147.0 $ 151.3 $ GAAP gross margin - percentage of revenue 26.8% 27.4% 30.3% 30.1% Acquisition related costs - percentage of revenue 8.9% 7.6% 2.6% 2.6% Share-based compensation - percentage of revenue 0.2% 0.2% 0.2% 0.1% Non-GAAP gross margin - percentage of revenue 35.9% 35.2% 33.1% 32.8%
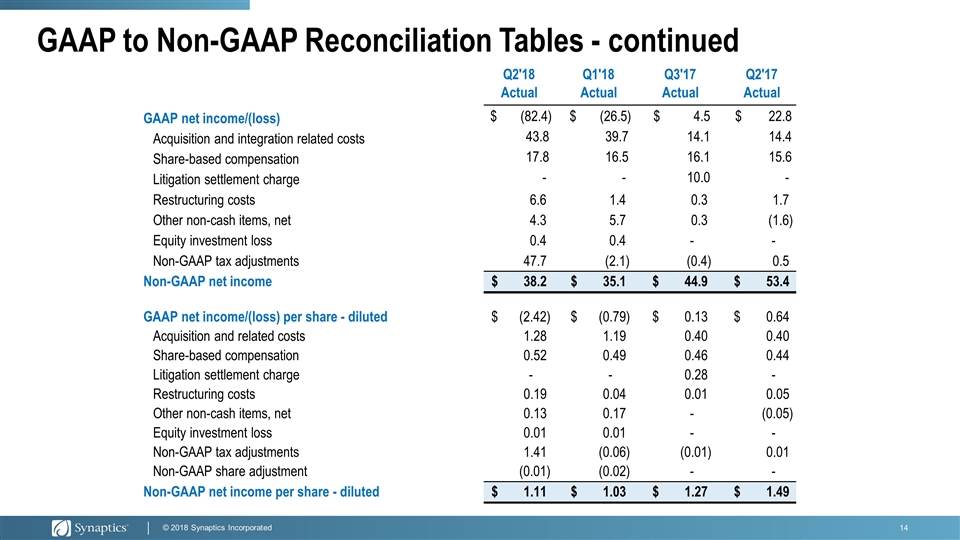
GAAP to Non-GAAP Reconciliation Tables - continued Q2'18 Actual Q1'18 Actual Q3'17 Actual Q2'17 Actual GAAP net income/(loss) $ (82.4) $ (26.5) $ 4.5 $ 22.8 Acquisition and integration related costs 43.8 39.7 14.1 14.4 Share-based compensation 17.8 16.5 16.1 15.6 Litigation settlement charge - - 10.0 - Restructuring costs 6.6 1.4 0.3 1.7 Other non-cash items, net 4.3 5.7 0.3 (1.6) Equity investment loss 0.4 0.4 - - Non-GAAP tax adjustments 47.7 (2.1) (0.4) 0.5 Non-GAAP net income 38.2 $ 35.1 $ 44.9 $ 53.4 $ GAAP net income/(loss) per share - diluted (2.42) $ (0.79) $ 0.13 $ 0.64 $ Acquisition and related costs 1.28 1.19 0.40 0.40 Share-based compensation 0.52 0.49 0.46 0.44 Litigation settlement charge - - 0.28 - Restructuring costs 0.19 0.04 0.01 0.05 Other non-cash items, net 0.13 0.17 - (0.05) Equity investment loss 0.01 0.01 - - Non-GAAP tax adjustments 1.41 (0.06) (0.01) 0.01 Non-GAAP share adjustment (0.01) (0.02) - - Non-GAAP net income per share - diluted 1.11 $ 1.03 $ 1.27 $ 1.49 $
