Attached files
| file | filename |
|---|---|
| EX-99.1 - EXHIBIT 99.1 - Carlyle Group Inc. | cg20171231ex-991.htm |
| 8-K - 8-K - Carlyle Group Inc. | cg201712318-kcover.htm |
Exhibit 99.2

For Immediate Release
February 7, 2018
The Carlyle Group Announces Fourth Quarter and Full Year 2017 Financial Results
• | U.S. GAAP results included net income attributable to The Carlyle Group L.P. common unitholders of $53 million and $238 million, or $0.49 and $2.38 per common unit on a diluted basis, for Q4 2017 and 2017, respectively |
• | Economic Income of $366 million and $1.3 billion, and Economic Net Income of $1.01 and $3.47 per Adjusted Unit on a post-tax basis in Q4 2017 and in 2017, respectively, driven by carry fund appreciation of 5% in Q4 2017 and 20% in 2017 |
• | Distributable Earnings of $156 million on a pre-tax basis for Q4 2017 and $670 million in 2017; Distributable Earnings per common unit of $0.44 in Q4 2017 and $1.88 in 2017, on a post-tax basis |
• | Declared a quarterly distribution of $0.33 per common unit for Q4 2017; Aggregate distribution of $1.41 per common unit for 2017 |
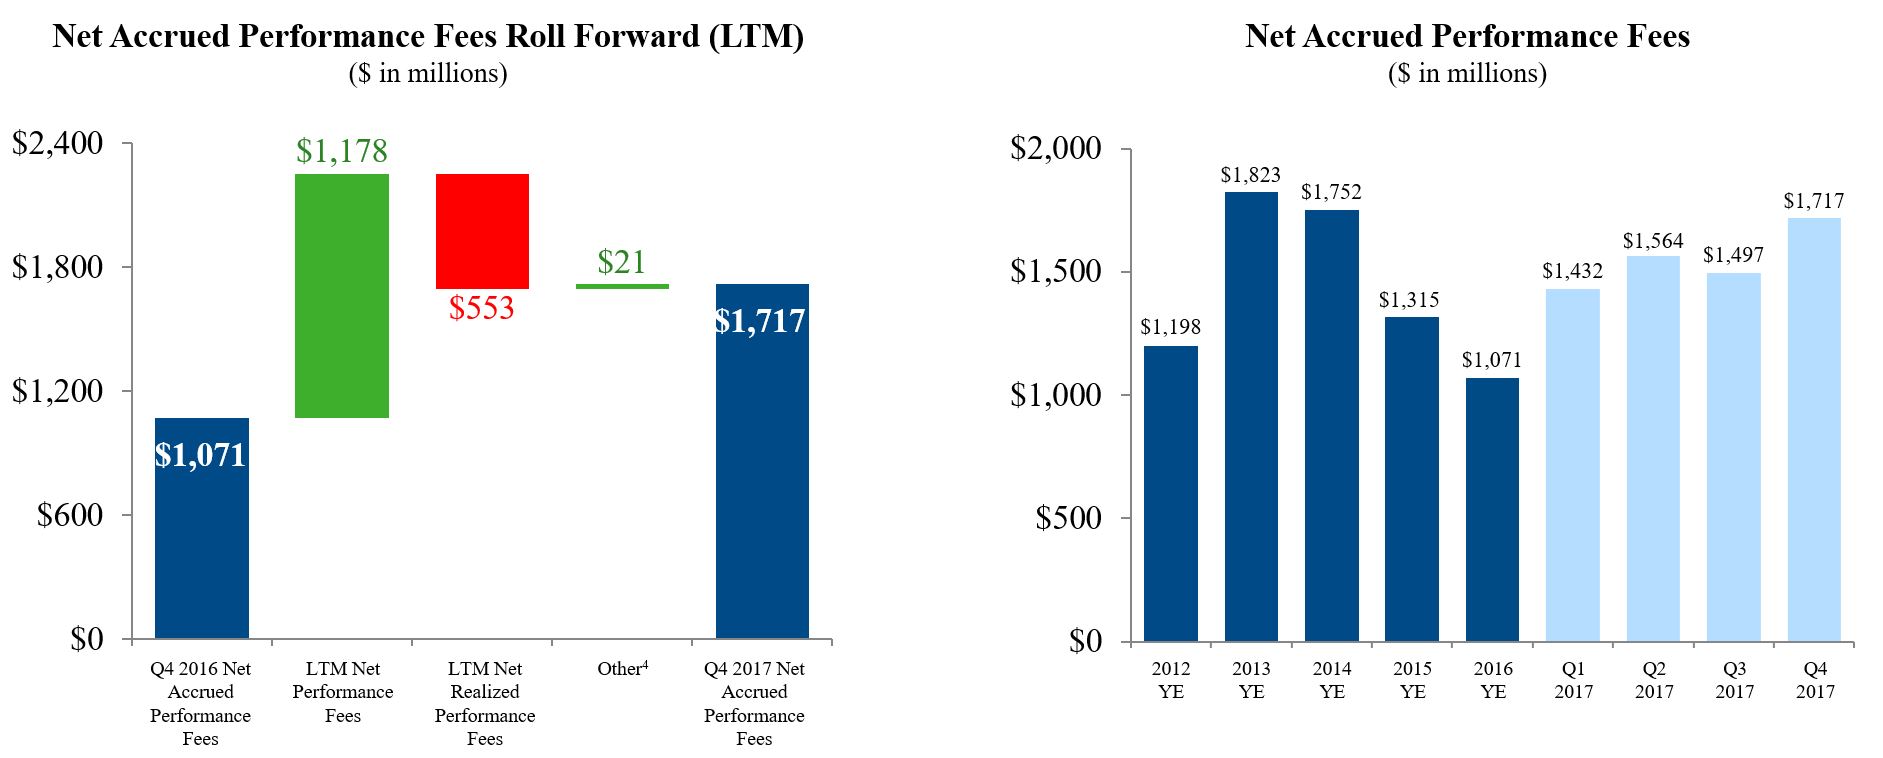
• | Net accrued performance fees of $1.7 billion as of Q4 2017, up 60% over Q4 2016 |
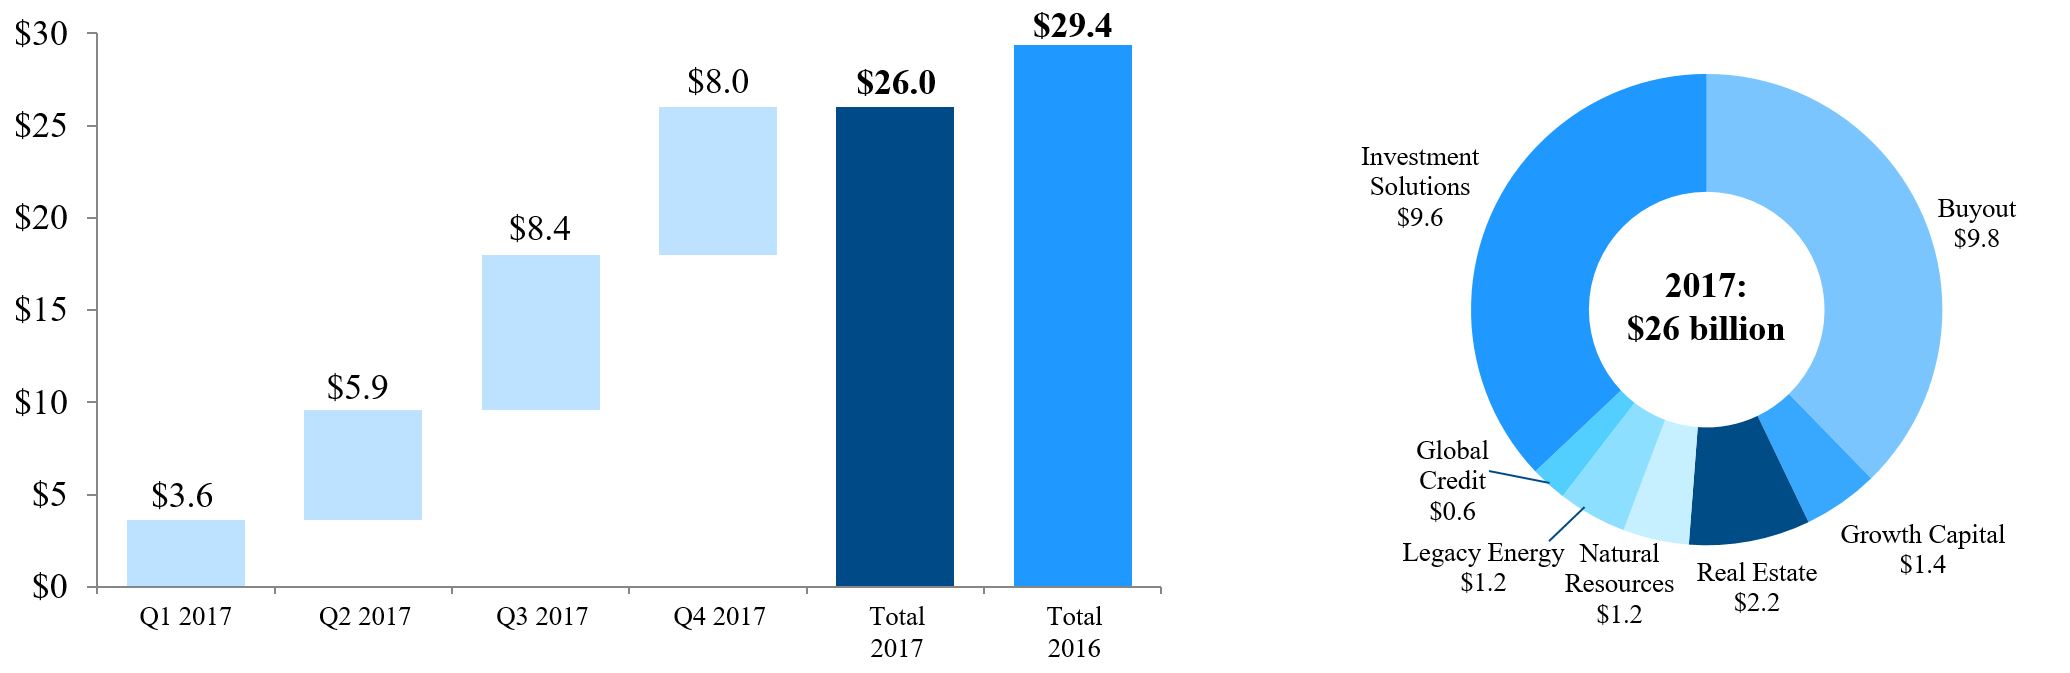
• | $8.0 billion of realized proceeds in Q4 2017 and $26.0 billion realized in 2017 |
• | $7.2 billion of invested capital in Q4 2017 and a record $22.0 billion invested in 2017 |
• | $24.7 billion of new capital raised in Q4 2017 and a record $43.3 billion in 2017 |
Washington, DC – Global alternative asset manager The Carlyle Group L.P. (NASDAQ: CG) today reported its unaudited results for the fourth quarter and full year ended December 31, 2017.
Carlyle Co-CEOs Kewsong Lee and Glenn Youngkin said, “We concluded 2017 with great momentum in all of our businesses. We had record activity across several dimensions during 2017, deploying $22 billion into new investments and raising $43 billion of capital across the platform. Our investment performance was exceptional with 20% appreciation across our carry funds, and we realized $26 billion of proceeds for our carry fund investors.”
U.S. GAAP results for Q4 2017 and 2017 included income before provision for income taxes of $395 million and $1,132 million, and net income attributable to The Carlyle Group L.P. common unitholders of $53 million and $238 million, or net income per common unit of $0.49 and $2.38, on a diluted basis. Total balance sheet assets were $12 billion as of December 31, 2017.
Note: Economic Income is the Non-GAAP financial measure that was formerly defined as “Economic Net Income.” Economic Income represents a pre-tax earnings measure, while Economic Net Income now represents earnings after-tax and after preferred unit distributions. In addition, we have updated our definition of Fee Related Earnings (“FRE”) to exclude the effects of net interest (defined as the difference between interest income and interest expense in our segment results).
Page | 1
Tax Reform Impact on Financial Results
Following the passage of the Tax Cuts and Jobs Act of 2017, we revalued our net deferred tax assets and tax receivable agreement liability. This resulted in a net charge in our Q4 2017 U.S. GAAP earnings of $42 million. The revaluation of our net deferred tax assets increased our provision for income taxes by $113 million in Q4 2017, while the revaluation of our tax receivable liability resulted in $71 million of other non-operating income in the quarter. This non-cash charge did not affect Economic Income or Distributable Earnings.
Distributions |
The Board of Directors has declared a quarterly distribution of $0.33 per common unit to holders of record at the close of business on February 20, 2018, payable on February 27, 2018. For full year 2017, the Board of Directors declared $1.41 in aggregate distributions to common unitholders.
The Board of Directors has declared a quarterly distribution of $0.367188 per preferred unit to preferred unitholders of record at the close of business on March 1, 2018, payable on March 15, 2018.
Distribution Policy
It is Carlyle’s intention to cause Carlyle Holdings to make quarterly distributions to its partners, including The Carlyle Group L.P.’s wholly owned subsidiaries, that will enable The Carlyle Group L.P. to pay a quarterly distribution of approximately 75% of Distributable Earnings Attributable to Common Unitholders for the quarter. Carlyle’s general partner may adjust the distribution for amounts determined to be necessary or appropriate to provide for the conduct of its business, to make appropriate investments in its business and its funds or to comply with applicable law or any of its financing agreements, or to provide for future cash requirements such as tax-related payments, giveback obligations and distributions to unitholders for any ensuing quarter. The amount to be distributed could also be adjusted upward in any one quarter. The declaration and payment of any distributions is at the sole discretion of Carlyle’s general partner, which may change or eliminate the distribution policy at any time.
Page | 2
Carlyle Consolidated GAAP Results |
The Carlyle Group L.P.
Summary U.S. GAAP Condensed Consolidated Statements of Operations (Unaudited)
Three Months Ended | Year Ended | ||||||||||||||||||||||
Dec 31, 2016 | Mar 31, 2017 | Jun 30, 2017 | Sep 30, 2017 | Dec 31, 2017 | Dec 31, 2016 | Dec 31, 2017 | |||||||||||||||||
(Dollars in millions, except per unit data) | |||||||||||||||||||||||
Revenues | |||||||||||||||||||||||
Fund management fees | $ | 259.0 | $ | 246.3 | $ | 238.8 | $ | 262.5 | $ | 279.3 | $ | 1,076.1 | $ | 1,026.9 | |||||||||
Total performance fees | 181.0 | 681.6 | 543.6 | 285.6 | 583.1 | 751.8 | 2,093.9 | ||||||||||||||||
Total investment income | 34.3 | 46.3 | 59.0 | 37.2 | 89.5 | 160.5 | 232.0 | ||||||||||||||||
Revenue from consolidated entities | 92.7 | 135.5 | 5.6 | 44.7 | 45.1 | 262.0 | 230.9 | ||||||||||||||||
All other revenues | 8.9 | 10.4 | 61.4 | 9.9 | 10.8 | 23.9 | 92.5 | ||||||||||||||||
Total revenues | 575.9 | 1,120.1 | 908.4 | 639.9 | 1,007.8 | 2,274.3 | 3,676.2 | ||||||||||||||||
Expenses | |||||||||||||||||||||||
Base compensation | 176.6 | 146.0 | 151.0 | 174.1 | 181.6 | 647.1 | 652.7 | ||||||||||||||||
Equity-based compensation | 68.8 | 72.8 | 88.0 | 81.0 | 78.5 | 334.6 | 320.3 | ||||||||||||||||
Total performance fee related compensation | 76.2 | 317.1 | 257.1 | 137.6 | 276.5 | 353.1 | 988.3 | ||||||||||||||||
General, administrative and other expenses | 158.5 | 93.8 | 95.8 | (18.7 | ) | 105.9 | 521.1 | 276.8 | |||||||||||||||
Expenses from consolidated entities and loss on deconsolidation of Urbplan | 90.9 | 164.8 | 96.9 | 101.7 | 36.7 | 336.1 | 400.1 | ||||||||||||||||
Interest and other nonoperating expense (income) | 3.0 | 15.0 | 16.6 | 16.9 | (54.4 | ) | 50.1 | (5.9 | ) | ||||||||||||||
Total expenses | 574.0 | 809.5 | 705.4 | 492.6 | 624.8 | 2,242.1 | 2,632.3 | ||||||||||||||||
Net investment gains of consolidated funds | 10.0 | 17.1 | 40.7 | 18.6 | 12.0 | 13.1 | 88.4 | ||||||||||||||||
Income before provision for income taxes | 11.9 | 327.7 | 243.7 | 165.9 | 395.0 | 45.3 | 1,132.3 | ||||||||||||||||
Provision (benefit) for income taxes | (2.7 | ) | 5.8 | 13.2 | (1.3 | ) | 107.2 | 30.0 | 124.9 | ||||||||||||||
Net income | 14.6 | 321.9 | 230.5 | 167.2 | 287.8 | 15.3 | 1,007.4 | ||||||||||||||||
Net income attributable to non-controlling interests in consolidated entities | 70.8 | 3.3 | 16.5 | 27.6 | 25.1 | 41.0 | 72.5 | ||||||||||||||||
Net income (loss) attributable to Carlyle Holdings | (56.2 | ) | 318.6 | 214.0 | 139.6 | 262.7 | (25.7 | ) | 934.9 | ||||||||||||||
Net income (loss) attributable to non-controlling interests in Carlyle Holdings | (47.3 | ) | 235.6 | 156.4 | 95.0 | 203.8 | (32.1 | ) | 690.8 | ||||||||||||||
Net income (loss) attributable to The Carlyle Group L.P. | (8.9 | ) | 83.0 | 57.6 | 44.6 | 58.9 | 6.4 | 244.1 | |||||||||||||||
Net income attributable to Series A Preferred Unitholders | — | — | — | — | 6.0 | — | 6.0 | ||||||||||||||||
Net income (loss) attributable to The Carlyle Group L.P. Common Unitholders | $ | (8.9 | ) | $ | 83.0 | $ | 57.6 | $ | 44.6 | $ | 52.9 | $ | 6.4 | $ | 238.1 | ||||||||
Net income (loss) attributable to The Carlyle Group L.P. per common unit | |||||||||||||||||||||||
Basic | $ | (0.11 | ) | $ | 0.97 | $ | 0.65 | $ | 0.47 | $ | 0.53 | $ | 0.08 | $ | 2.58 | ||||||||
Diluted | $ | (0.16 | ) | $ | 0.90 | $ | 0.59 | $ | 0.43 | $ | 0.49 | $ | (0.08 | ) | $ | 2.38 | |||||||
Income before provision for income taxes(1) was $395 million and $12 million for Q4 2017 and Q4 2016, respectively, and $1,132 million and $45 million for 2017 and 2016, respectively. The increase in income before provision for income taxes in Q4 2017 compared to Q4 2016 was primarily due to a $202 million increase in net performance fees, a $55 million increase in investment income, and a $53 million decrease in general, administrative and other expenses. As it relates to the full year, the increase in income before provision for income taxes was primarily due to a $707 million increase in net performance fees, a $244 million decrease in general, administrative and other expenses, and a $72 million increase in investment income, primarily due to our investments in NGP. The variance in general, administrative and other expenses in 2017 as compared to 2016 primarily reflects $175 million in commodities charges and $25 million in insurance recoveries in 2016 as compared to the $68 million net insurance recovery and the $25 million reversal of the CCC litigation reserve in 2017. Q4 2017 and the full year 2017 also include within other non-operating income a $71 million reduction in the tax receivable liability resulting from the Tax Cuts and Jobs Act of 2017.
Net income (loss) attributable to The Carlyle Group L.P. Common Unitholders was $53 million or $0.49 per common unit on a diluted basis for Q4 2017 and $238 million or $2.38 per common unit on a diluted basis for 2017. The provision for income taxes for Q4 2017 and the full year 2017 includes $113 million related to the revaluation of the net deferred tax assets resulting from the Tax Cuts and Jobs Act of 2017.
(1) Income before provision for income taxes is the GAAP measure that is most directly comparable to Economic Income (EI) and Distributable Earnings, which management uses to measure the performance of the business. In most periods, income before provision for income taxes will be lower than EI principally due to excluding from EI equity compensation from equity issued in conjunction with the initial public offering, acquisitions and strategic investments, as well as other acquisition-related charges, including amortization of intangibles and impairment. In periods of positive earnings, net income (loss) attributable to The Carlyle Group L.P. Common Unitholders typically will be lower than EI as net income (loss) attributable to The Carlyle Group L.P. Common Unitholders only includes the portion of earnings (approximately 30% before taxes as of December 31, 2017) that is attributable to the public unitholders whereas the calculation of EI reflects the adjusted earnings attributable to all unitholders. A full reconciliation is included on page 34. See "Non-GAAP Financial Information and Other Key Terms" for additional information.
Page | 3
Non-GAAP Operating Results |
Carlyle Group Summary ($ in millions, except unit and per unit amounts) | ||||||||||||||||||||||||||||||
Annual | % Change | |||||||||||||||||||||||||||||
$ in millions, except per unit data and where noted | ||||||||||||||||||||||||||||||
Q4 2016 | Q1 2017 | Q2 2017 | Q3 2017 | Q4 2017 | 2017 | QoQ | YoY | Annual | ||||||||||||||||||||||
Economic Income | $ | 5.6 | $ | 400.1 | $ | 300.1 | $ | 202.7 | $ | 366.4 | $1,269.3 | 81% | 6,443% | 315% | ||||||||||||||||
Fee Related Earnings | (132.4 | ) | 37.1 | 20.2 | 108.0 | 26.7 | 192.0 | (75)% | 120% | 3,468% | ||||||||||||||||||||
Net Performance Fees | 60.7 | 394.1 | 299.4 | 147.0 | 337.3 | 1,177.8 | 129% | 456% | 199% | |||||||||||||||||||||
Realized Net Performance Fees | 135.6 | 35.3 | 182.1 | 216.9 | 118.3 | 552.6 | (45)% | (13)% | (12)% | |||||||||||||||||||||
Distributable Earnings | 7.4 | 55.4 | 198.9 | 259.9 | 155.8 | 670.0 | (40)% | 2,005% | 3% | |||||||||||||||||||||
Economic Income, Tax and Per Unit Information | ||||||||||||||||||||||||||||||
Economic Income | $ | 5.6 | $ | 400.1 | $ | 300.1 | $ | 202.7 | $ | 366.4 | $ | 1,269.3 | ||||||||||||||||||
Less (Add): Provision (Benefit) for income taxes (1) | (0.8 | ) | 35.5 | 25.3 | 10.4 | 13.2 | 84.4 | |||||||||||||||||||||||
Less: Preferred unit distributions | — | — | — | — | 6.0 | 6.0 | ||||||||||||||||||||||||
Economic Net Income (after taxes) | $ | 6.4 | $ | 364.6 | $ | 274.8 | $ | 192.3 | $ | 347.2 | $ | 1,178.9 | ||||||||||||||||||
Adjusted Units (in millions) | 330.2 | 333.7 | 337.5 | 342.8 | 343.5 | (2) | 342.9 | (2) | ||||||||||||||||||||||
Economic Net Income (after taxes and preferred unit distributions) per Adjusted Unit | $ | 0.02 | $ | 1.09 | $ | 0.81 | $ | 0.56 | $ | 1.01 | $ | 3.47 | ||||||||||||||||||
Distributable Earnings, Tax and Per Unit Information | ||||||||||||||||||||||||||||||
Distributable Earnings | $ | 7.4 | $ | 55.4 | $ | 198.9 | $ | 259.9 | $ | 155.8 | $ | 670.0 | ||||||||||||||||||
Less: Estimated foreign, state, and local taxes (3) | 5.4 | 6.8 | 5.6 | 5.4 | 5.0 | 22.8 | ||||||||||||||||||||||||
Less: Preferred unit distributions | — | — | — | — | 6.0 | 6.0 | ||||||||||||||||||||||||
Distributable Earnings, After Taxes and Preferred Unit Distributions | $ | 2.0 | $ | 48.6 | $ | 193.3 | $ | 254.5 | $ | 144.8 | $ | 641.2 | ||||||||||||||||||
Allocating Distributable Earnings for only public unitholders of The Carlyle Group L.P. | ||||||||||||||||||||||||||||||
Distributable Earnings to The Carlyle Group L.P. | $ | 0.5 | $ | 13.0 | $ | 55.6 | $ | 74.7 | $ | 43.3 | $ | 186.6 | ||||||||||||||||||
(Add) / Less: Estimated current corporate income taxes (4) | 1.2 | 1.5 | 1.8 | 1.4 | (0.5 | ) | 4.2 | |||||||||||||||||||||||
Distributable Earnings Attributable to Common Unitholders | $ | (0.7 | ) | $ | 11.5 | $ | 53.8 | $ | 73.3 | $ | 43.8 | $ | 182.4 | |||||||||||||||||
Units in public float (in millions) | 85.7 | 88.1 | 96.2 | 98.3 | 100.5 | (5) | 100.5 | (5) | ||||||||||||||||||||||
Distributable Earnings, net, per The Carlyle Group L.P. common unit outstanding | $ | 0.00 | $ | 0.13 | $ | 0.56 | $ | 0.75 | $ | 0.44 | $ | 1.88 | ||||||||||||||||||
Distribution per common unit | $ | 0.16 | $ | 0.10 | $ | 0.42 | $ | 0.56 | $ | 0.33 | $ | 1.41 | ||||||||||||||||||
Note: Totals may not sum due to rounding.
(1) Represents the implied provision for income taxes that was calculated using a similar methodology as that used in calculating the provision for income taxes for The Carlyle Group L.P., without any reduction for non-controlling interests and without the impact of the Tax Cuts and Jobs Act of 2017.
(2) For information regarding our calculation of Adjusted Units as of December 31, 2017, please see page 35.
(3) Represents the implied provision for current income taxes that was calculated using a similar methodology as that used in calculating the provision for current income taxes for The Carlyle Group L.P., without any reduction for non-controlling interests.
(4) Represents current corporate income taxes payable on Distributable Earnings allocated to Carlyle Holdings I GP Inc. and estimated current Tax Receivable Agreement payments owed.
(5) Includes 372,864 common units issued in February 2018 in connection with the vesting of deferred restricted common units. For purposes of this calculation, these common units have been added to the common units outstanding as of December 31, 2017 because they will be eligible to participate in the unitholder distribution that will be paid on the common units in February 2018.
Page | 4
Carry Fund Appreciation and Net Accrued Performance Fees |
Carlyle's carry fund portfolio appreciated 5% during Q4 2017 and 20% in 2017. During Q4 2017, the public portfolio in our Corporate Private Equity, Real Assets and Global Credit carry funds appreciated 9% and the private portfolio appreciated 6%. Investment Solutions carry funds appreciated 3% during Q4 2017 and 10% in 2017. Fourth quarter carry fund valuations were positively impacted by strength in our sixth U.S. Buyout fund (CP VI), fourth Asia Buyout fund (CAP IV), third Europe Buyout fund (CEP III), seventh U.S. Real Estate fund (CRP VII) and the eleventh NGP carry fund (NGP XI), all of which are currently accruing performance fees.
2015 | 2016 | 2017 | Net Accrued Performance Fees | |||||||||||||||||||||||
Fund Valuations ($ in millions) | Q1 | Q2 | Q3 | Q4 | Q1 | Q2 | Q3 | Q4 | Q1 | Q2 | Q3 | Q4 | Q4 2017 | |||||||||||||
Overall Carry Fund Appreciation / (Depreciation) (1) | 8% | 3% | (1)% | 2% | 0% | 4% | 3% | 5% | 6% | 5% | 3% | 5% | ||||||||||||||
Corporate Private Equity (2) | 8% | 5% | (3)% | 3% | 1% | 4% | 3% | 4% | 9% | 8% | 4% | 8% | $1,140 | |||||||||||||
Buyout | 9% | 4% | (3)% | 3% | 1% | 4% | 3% | 4% | 9% | 9% | 3% | 8% | $1,098 | |||||||||||||
Growth Capital | 3% | 11% | 0% | 0% | (2)% | 3% | 0% | 3% | 7% | 4% | 6% | 6% | $42 | |||||||||||||
Real Assets (2) | 2% | 0% | (5)% | 0% | 1% | 7% | 4% | 4% | 5% | 6% | 2% | 4% | $476 | |||||||||||||
Real Estate | 11% | 4% | 6% | 6% | 8% | 8% | 0% | 3% | 5% | 6% | 3% | 3% | $312 | |||||||||||||
Natural Resources (3) | 1% | 0% | (4)% | 0% | (2)% | 11% | 12% | 0% | 7% | 6% | 5% | 8% | $180 | |||||||||||||
Legacy Energy | (3)% | (3)% | (17)% | (7)% | (3)% | 3% | 1% | 9% | 3% | 4% | (3)% | 2% | $(16) | |||||||||||||
Global Credit Carry Funds (2) | 3% | 2% | (9)% | (4)% | (12)% | (2)% | 0% | 2% | 7% | 0% | 0% | 1% | $27 | |||||||||||||
Investment Solutions Carry Funds (2) | 13% | 4% | 4% | 2% | 0% | 3% | 2% | 7% | 3% | 1% | 3% | 3% | $74 | |||||||||||||
Net Accrued Performance Fees | $1,717 | |||||||||||||||||||||||||
(1) Appreciation/(Depreciation) represents unrealized gain/(loss) for the period on a total return basis before fees and expenses. The percentage of return is calculated as: ending remaining investment fair market value plus net investment outflow (sales proceeds minus net purchases) minus beginning remaining investment fair market value divided by beginning remaining investment fair market value. Fund only, does not include co-investment.
(2) We generally earn performance fees (or carried interest) from our carry funds representing a 20% allocation of profits generated on third-party capital, and on which the general partner receives a special residual allocation of income from limited partners, which we refer to as carried interest, in the event that specified investment returns are achieved by the fund. Disclosures referring to carry funds also include the impact of certain commitments that do not earn carried interest, but are either part of, or associated with our carry funds. The rate of carried interest, as well as the share of carried interest allocated to Carlyle, may vary across the carry fund platform. See "Non-GAAP Financial Information and Other Key Terms" for more information.
(3) Natural Resources is comprised of NGP, infrastructure, power and international energy funds.
(4) Other primarily reflects the impact of foreign exchange translation.
Page | 5
Carlyle All Segment Results |
• | Economic Income was $366 million in Q4 2017, driven by 5% carry fund appreciation in the quarter. Economic Income for 2017 of $1.3 billion increased 315% compared to 2016, supported by 20% annual appreciation in our carry funds. |
• | Distributable Earnings of $156 million in Q4 2017 included $27 million in Fee Related Earnings and $118 million in net realized performance fees. DE per common unit was $0.44 for Q4 2017 and $1.88 for 2017. |
• | Fee Related Earnings were $27 million in Q4 2017 and $192 million in 2017. Excluding net insurance recoveries in Global Credit, 2017 FRE would have been $124 million. Q4 2017 management fees of $290 million increased 9% versus Q4 2016. Q4 2017 fundraising expenses were $34 million compared to $14 million in Q4 2016, and are included in indirect compensation expense for our internal costs and in general and administrative expenses for our external costs. |
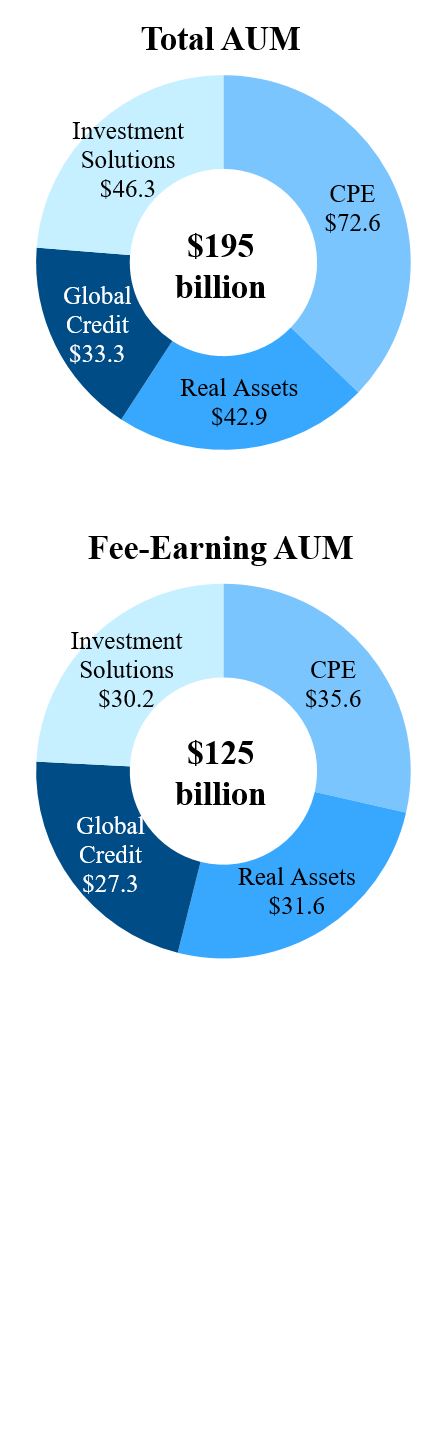
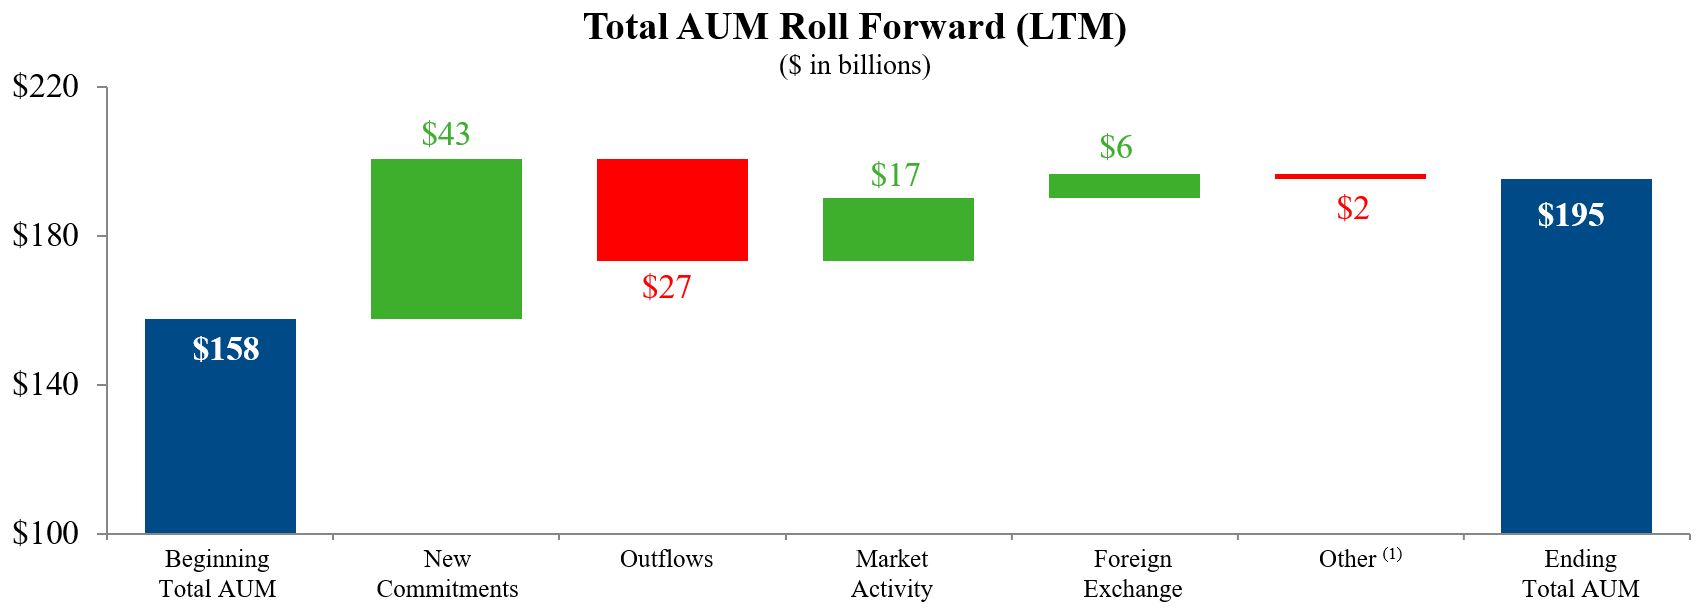
• | Total Assets Under Management ("AUM") of $195 billion increased 24% compared to Q4 2016 through a combination of $43 billion in fundraising and fund appreciation, partially offset by $26 billion in realized proceeds to fund investors. |
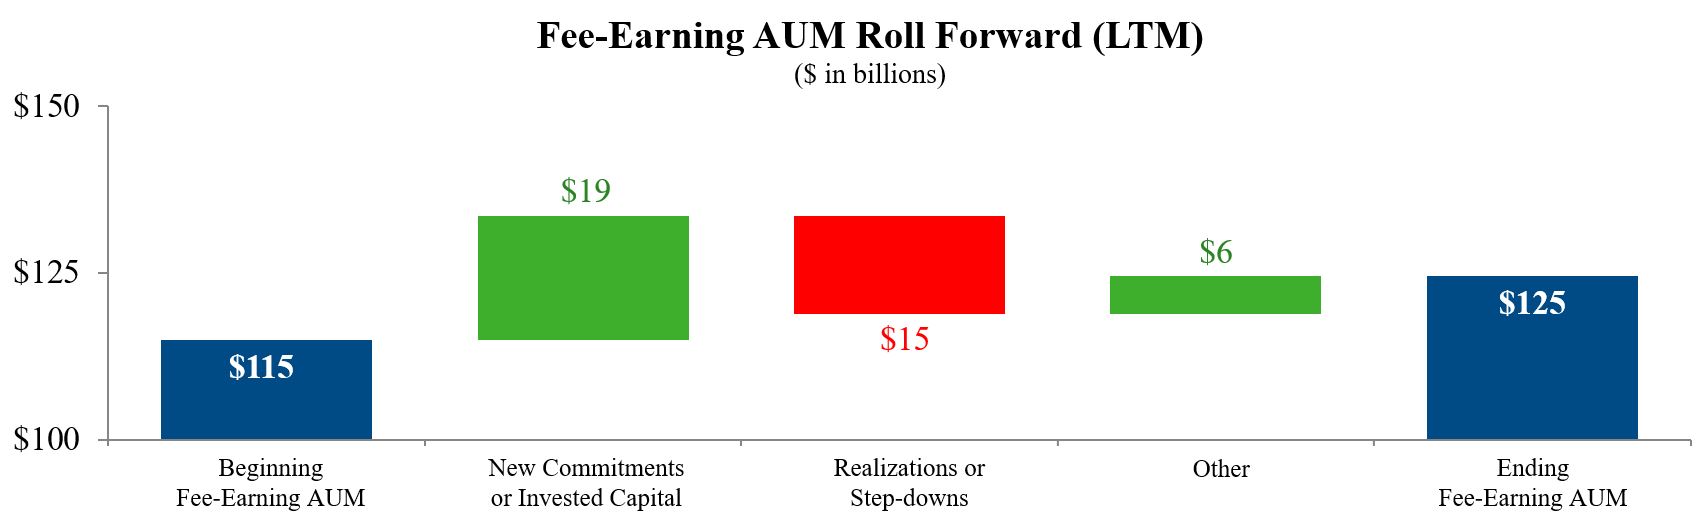
• | Fee Earning AUM of $125 billion increased 8% from Q4 2016. As of year-end 2017, there was $22 billion in pending Fee Earning AUM that will turn on fees either through the activation of the underlying fund or additional capital deployment. |
Business Drivers | |||||||||
$ in billions, unless noted | Q4 2016 | Q4 2017 | Prior LTM | LTM | |||||
Fundraising | $2.7 | $24.7 | $8.2 | $43.3 | |||||
Invested Capital1 | 6.1 | 7.2 | 17.9 | 22.0 | |||||
Realized Proceeds1 | 8.5 | 8.0 | 29.4 | 26.0 | |||||
Carry Fund Appreciation1 | 5% | 5% | 12% | 20% | |||||
Financial Metrics | |||||||||
$ in millions | Q4 2016 | Q4 2017 | Prior LTM | LTM | |||||
Fee Related Earnings (FRE) | $(132) | $27 | $33 | $192 | |||||
+ | Net Realized Performance Fees | 136 | 118 | 625 | 553 | ||||
+ | Realized Investment Income/(Loss) | 17 | 22 | 45 | (26) | ||||
+ | Net Interest | (13) | (12) | (51) | (49) | ||||
= | Distributable Earnings (DE) | $7 | $156 | $652 | $670 | ||||
Fee Related Earnings (FRE) | $(132) | $27 | $33 | $192 | |||||
+ | Net Performance Fees | 61 | 337 | 394 | 1,178 | ||||
+ | Investment Income/(Loss) | 15 | 41 | 50 | 47 | ||||
– | Equity-based Compensation | 24 | 27 | 120 | 124 | ||||
– | Net Interest | 13 | 12 | 51 | 49 | ||||
– | Other2 | (100) | — | — | (25) | ||||
= | Economic Income | $6 | $366 | $306 | $1,269 | ||||
(1) For carry funds only.
(2) Includes a $100 million reserve for ongoing litigation and contingencies taken in FRE in Q4 2016, which had been taken in EI in a prior period and which was allocated to the segments in the following manner: Corporate Private Equity ($50 million), Real Assets ($21 million), Global Credit ($19 million) and Investment Solutions ($10 million). Additionally, includes the reduction of a $25 million reserve for ongoing litigation and contingencies in 2017, which was allocated to the segments in the following manner: Corporate Private Equity ($(13) million), Real Assets ($(6) million), Global Credit ($(4) million) and Investment Solutions ($(2) million).
Page | 6
Corporate Private Equity (CPE) |
• | Corporate Private Equity carry funds appreciated 8% in the quarter, driving net performance fees of $260 million. For the year, CPE carry funds appreciated 32% and generated $878 million in net performance fees. |
• | Economic Income was $249 million in Q4 2017 and $896 million for 2017, 300% higher than 2016. |
• | Fee Related Earnings were ($17) million in Q4 2017, with the loss primarily attributable to fundraising expense of $31 million due to record quarterly fundraising of $19.1 billion, with associated management fees not yet activated. As of year-end, CPE had $18 billion in pending Fee-Earning AUM that had not yet activated fees. |
• | Distributable Earnings of $73 million in Q4 2017 reflect $85 million in net realized performance fees, $10 million in realized investment income and the loss in Fee Related Earnings. Realizations of $3.4 billion in Q4 2017 were slightly lower than Q4 2016. Net realized performance fees of $85 million declined versus Q4 2016 as a lower proportion of exits produced realized performance fees compared to prior periods. For the year, CPE Distributable Earnings of $488 million were lower than 2016. |
• | Invested $3.6 billion in Q4 2017 into 31 different investments. For 2017 overall, CPE invested a record $11.1 billion, 41% higher than 2016. Notable investments during Q4 2017 include SBI Card (CAP IV), TCW Group (CGP), BenefitMall (CSFSP II), MedRisk HoldCo (CP VI), Net Health Systems (CEOF II), and ADB SafeGate and Praesidiad (CEP IV). |
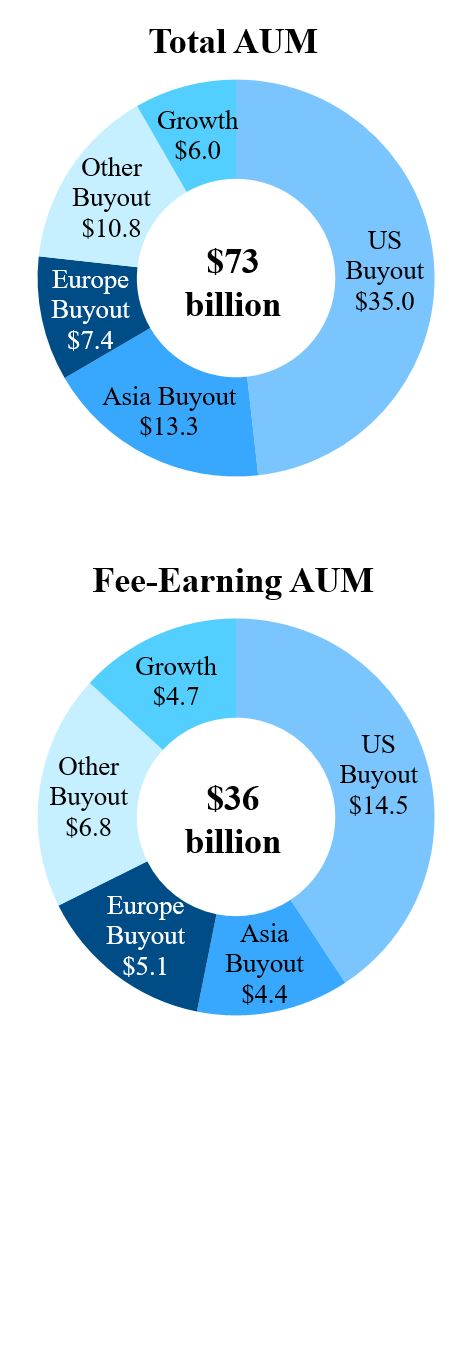
• | Assets Under Management reached a record $72.6 billion and increased 43% compared to Q4 2016. During the fourth quarter, we held first closes on our latest vintage U.S. Buyout funds and Asia Buyout funds totaling $18.8 billion. |
Business Drivers | ||||||||
$ in billions, unless noted | Q4 2016 | Q4 2017 | Prior LTM | LTM | ||||
Fundraising | $0.0 | $19.1 | $0.8 | $20.5 | ||||
Invested Capital1 | 2.6 | 3.6 | 7.9 | 11.1 | ||||
Realized Proceeds1 | 3.6 | 3.4 | 14.8 | 11.2 | ||||
Carry Fund Appreciation1 | 4% | 8% | 11% | 32% | ||||
Financial Metrics | ||||||||
$ in millions | Q4 2016 | Q4 2017 | Prior LTM | LTM | ||||
Fund Management Fees | $122 | $119 | $499 | $471 | ||||
Net Realized Performance Fees | 159 | 85 | 588 | 459 | ||||
Net Performance Fees | — | 260 | 154 | 878 | ||||
Realized Investment Income | 14 | 10 | 60 | 25 | ||||
Investment Income | 15 | 24 | 49 | 62 | ||||
Fee Related Earnings (FRE) | $25 | $(17) | $116 | $26 | ||||
Distributable Earnings (DE) | $191 | $73 | $739 | $488 | ||||
Economic Income | $71 | $249 | $224 | $896 | ||||
(1) For carry funds only.
Page | 7
Real Assets |
• | Real Assets carry funds appreciated 4% in the quarter, driving net performance fees of $63 million. For the year, Real Assets carry funds appreciated 19%. Natural Resources appreciated 30% and Real Estate funds appreciated 17% leading to $243 million in net performance fees. |
• | Economic Income was $98 million in Q4 2017 and $215 million in 2017, driven by strong appreciation and growth in Fee Related Earnings. Excluding a charge in Q3 2017 related to our disposal of Urbplan Desenvolvimento Urbano S.A., Economic Income would have been $280 million for 2017. |
• | Fee Related Earnings were $34 million in Q4 2017, more than double Q4 2016 as management fees increased 32% due to new capital raised, primarily in the latest vintage NGP carry fund and our latest vintage U.S. Real Estate fund. |
• | Distributable Earnings were $50 million in Q4 2017 and $25 million in 2017. Excluding the Urbplan charge, Distributable Earnings would have been $115 million for 2017. Net realized performance fees were $10 million in Q4 2017. Realizations of $1.4 billion and $4.6 billion in Q4 2017 and 2017, respectively, were lower than the prior year. |
• | Invested $1.6 billion in the quarter $4.4 billion in 2017, slightly lower than 2016. During Q4 2017, Real Estate invested $0.5 billion and Natural Resources invested $1.1 billion. |
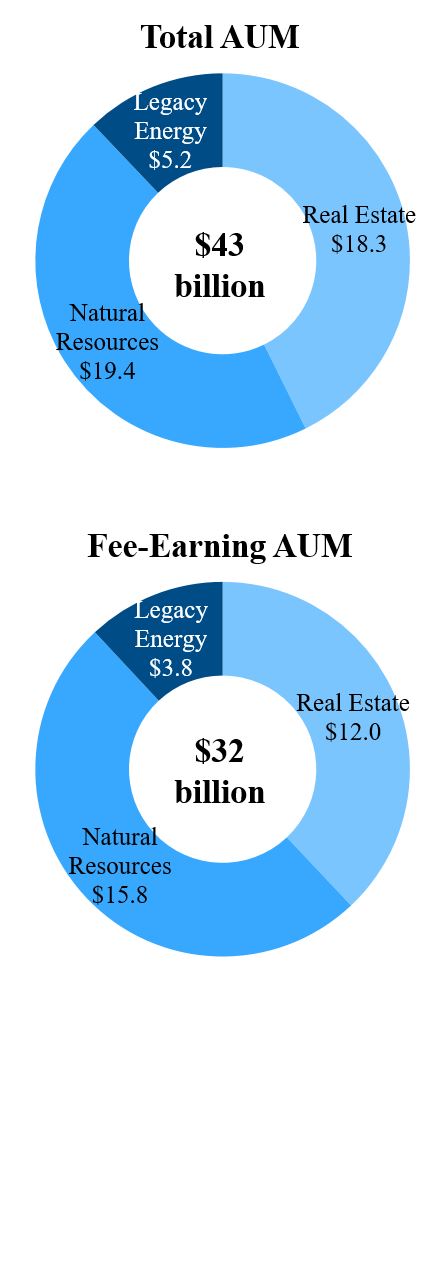
• | Assets Under Management of $42.9 billion increased 25% compared to Q4 2016, driven by a combination of appreciation and capital raised. Fundraising of $3.2 billion in Q4 2017 includes closes in the latest vintage NGP carry fund and our U.S. Real Estate carry funds. Fundraising totaled $10.2 billion for 2017. |
Business Drivers | ||||||||
$ in billions, unless noted | Q4 2016 | Q4 2017 | Prior LTM | LTM | ||||
Fundraising | $0.3 | $3.2 | $1.2 | $10.2 | ||||
Invested Capital1 | 2.2 | 1.6 | 5.1 | 4.4 | ||||
Realized Proceeds1 | 2.0 | 1.4 | 5.6 | 4.6 | ||||
Carry Fund Appreciation1 | 4% | 4% | 18% | 19% | ||||
Financial Metrics | ||||||||
$ in millions | Q4 2016 | Q4 2017 | Prior LTM | LTM | ||||
Fund Management Fees | $59 | $78 | $251 | $264 | ||||
Net Realized Performance Fees | (30) | 10 | 16 | 50 | ||||
Net Performance Fees | 52 | 63 | 208 | 243 | ||||
Realized Investment Income/(Loss) | 1 | 9 | (21) | (63) | ||||
Investment Income/(Loss) | (4) | 12 | (19) | (37) | ||||
Fee Related Earnings (FRE) | $13 | $34 | $69 | $52 | ||||
Distributable Earnings (DE) | $(20) | $50 | $49 | $25 | ||||
Economic Income | $73 | $98 | $217 | $215 | ||||
(1) For carry funds only.
Page | 8
Global Credit |
• | Economic Income of $2 million in Q4 2017 was higher relative to a loss in Q4 2016. Economic Income was $107 million in 2017 which included $68 million in insurance recoveries in excess of related commodities charges. Global Credit carry funds appreciated 1% in the quarter and 11% for 2017. |
• | Fee Related Earnings were $1 million in Q4 2017 and $82 million for 2017, which included the positive impact of the net insurance recoveries. Q4 2017 fund management fees of $51 million increased 20% year over year when excluding the impact of catch-up management fees and hedge fund related revenue in Q4 2016. |
• | Distributable Earnings of $23 million in Q4 2017 include net realized performance fees of $21 million from our carry funds. Realized Proceeds were $0.3 billion in Q4 2017 and $0.6 billion for 2017. |
• | Invested $0.8 billion in Global Credit carry funds in the quarter and $2.1 billion in 2017, both higher than prior periods. Direct lending originated gross new loans of approximately $500 million in the quarter and $1.9 billion in 2017. Our structured credit team raised CLO par value of $1.2 billion in the quarter and $4.2 billion in 2017. |
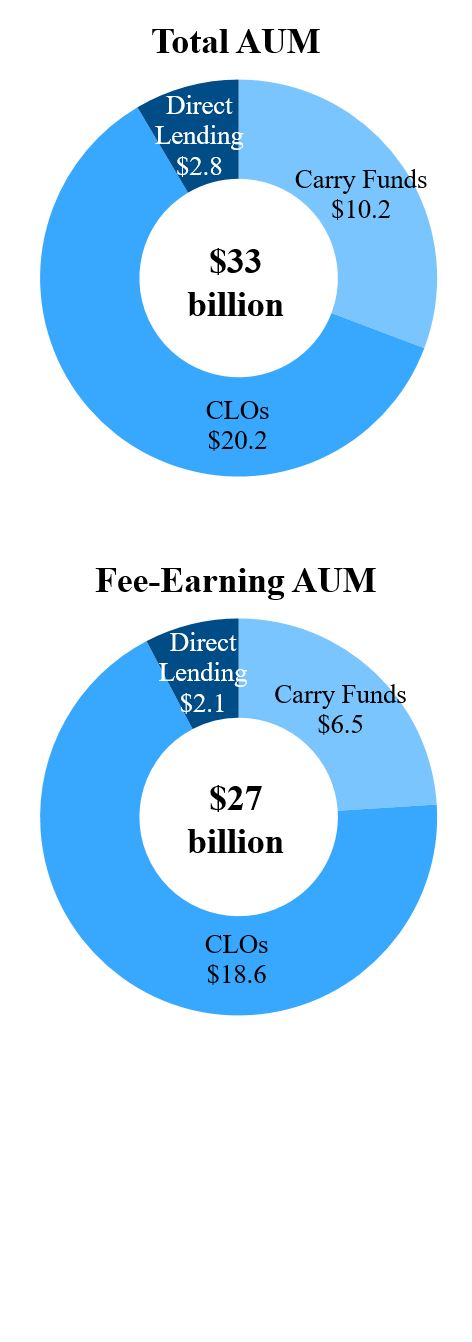
• | Assets Under Management of $33.3 billion increased 13% compared to Q4 2016, driven by fundraising, foreign exchange and carry fund appreciation. Q4 2017 fundraising of $1.7 billion includes four CLOs, follow-on closes in our new private BDCs, Structured Credit fund, and managed accounts. Fundraising totaled $6.6 billion for 2017. Fee-Earning Assets Under Management of $27.3 billion increased 13% compared to Q4 2016. |
Business Drivers | ||||||||
$ in billions, unless noted | Q4 2016 | Q4 2017 | Prior LTM | LTM | ||||
Fundraising | $1.3 | $1.7 | $3.5 | $6.6 | ||||
Invested Capital1 | 0.4 | 0.8 | 0.7 | 2.1 | ||||
Realized Proceeds1 | 0.1 | 0.3 | 0.4 | 0.6 | ||||
Carry Fund Appreciation1 | 2% | 1% | (11)% | 11% | ||||
Financial Metrics | ||||||||
$ in millions | Q4 2016 | Q4 2017 | Prior LTM | LTM | ||||
Fund Management Fees | $48 | $51 | $196 | $192 | ||||
Net Realized Performance Fees | 6 | 21 | 19 | 40 | ||||
Net Performance Fees | 4 | 3 | 20 | 31 | ||||
Realized Investment Income | 2 | 3 | 5 | 12 | ||||
Investment Income | 3 | 4 | 20 | 17 | ||||
Fee Related Earnings (FRE) | $(175) | $1 | $(175) | $82 | ||||
Distributable Earnings (DE) | $(169) | $23 | $(157) | $127 | ||||
Economic Income | $(155) | $2 | $(159) | $107 | ||||
(1) For carry funds only.
Page | 9
Investment Solutions |
• | Investment Solutions carry funds appreciated 3% in the quarter and 10% for the year. Excluding the impact of foreign exchange translation, Investment Solutions carry funds appreciated 5% in Q4 2017 and 19% for 2017. |
• | Economic Income was $18 million in Q4 2017 and $51 million for 2017, up 111% from 2016. Fund appreciation drove record quarterly and annual net performance fees of $11 million and $25 million, respectively, in Q4 2017 and 2017. |
• | Fee Related Earnings were $9 million in Q4 2017, up 107% compared to Q4 2016, as higher Fee Earning AUM drove a 14% increase in management fees and expenses declined. For 2017, FRE of $32 million increased 38% compared to 2016. |
• | Distributable Earnings were $10 million in Q4 2017 and $30 million in 2017, up 49% compared to 2016. |
• | Invested $1.2 billion in Investment Solutions carry funds and vehicles during Q4 2017 and $4.4 billion in 2017, slightly higher than 2016. |
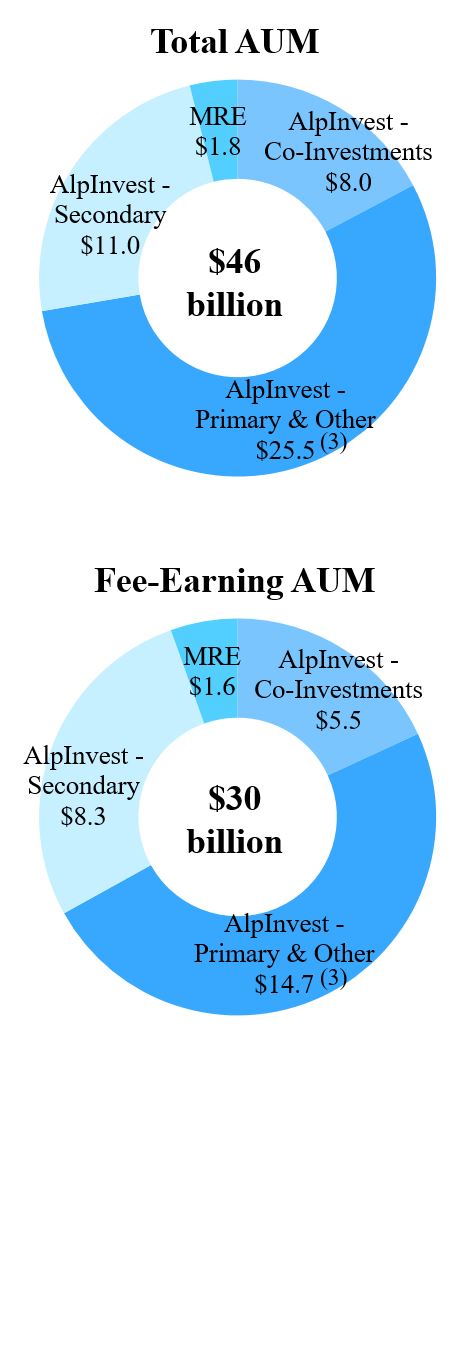
• | Assets Under Management of $46.3 billion increased 7% compared to Q4 2016, largely attributable to market appreciation and the impact of foreign exchange. Fundraising of $0.7 billion in Q4 2017 included closings in AlpInvest Co-Investment, Mezzanine and Fund vehicles, and fundraising was a record $5.9 billion for 2017. Fee-Earning Assets Under Management of $30.2 billion were up 11% compared to Q4 2016. |
Business Drivers | ||||||||
$ in billions, unless noted | Q4 2016 | Q4 2017 | Prior LTM | LTM | ||||
Fundraising1 | $1.1 | $0.7 | $2.8 | $5.9 | ||||
Invested Capital2 | 0.9 | 1.2 | 4.3 | 4.4 | ||||
Realized Proceeds2 | 2.8 | 2.9 | 8.6 | 9.6 | ||||
Carry Fund Appreciation2 | 7% | 3% | 12% | 10% | ||||
Financial Metrics | ||||||||
$ in millions | Q4 2016 | Q4 2017 | Prior LTM | LTM | ||||
Fund Management Fees | $37 | $42 | $140 | $155 | ||||
Net Realized Performance Fees | 1 | 2 | 2 | 3 | ||||
Net Performance Fees | 5 | 11 | 13 | 25 | ||||
Realized Investment Income/(Loss) | — | — | — | — | ||||
Investment Income | 1 | 1 | — | 4 | ||||
Fee Related Earnings (FRE) | $5 | $9 | $23 | $32 | ||||
Distributable Earnings (DE) | $4 | $10 | $20 | $30 | ||||
Economic Income | $17 | $18 | $24 | $51 | ||||
(1) Net funds raised excludes acquisitions.
(2) For carry funds only.
(3) Includes Mezzanine funds.
Page | 10
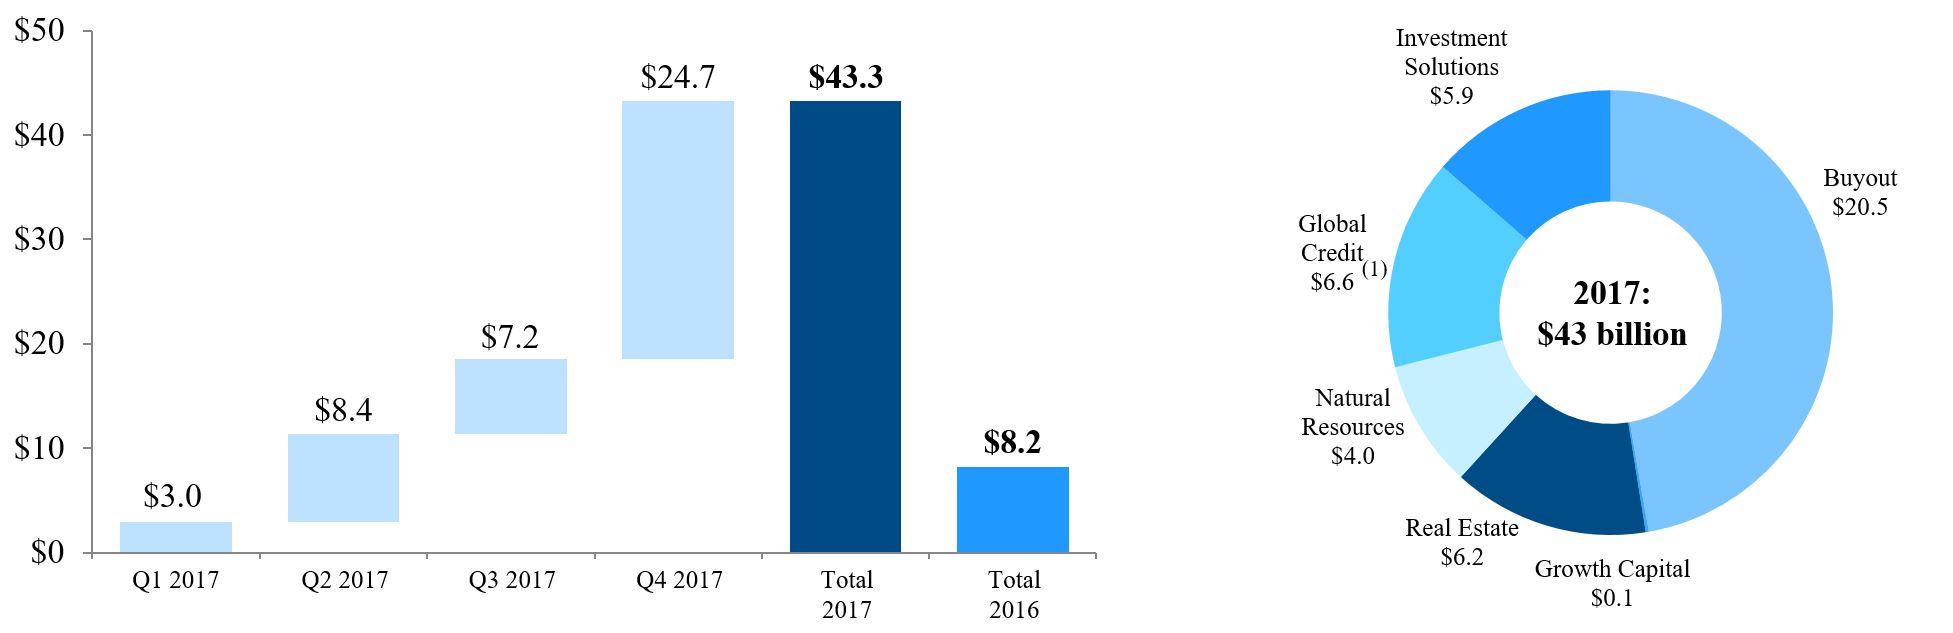
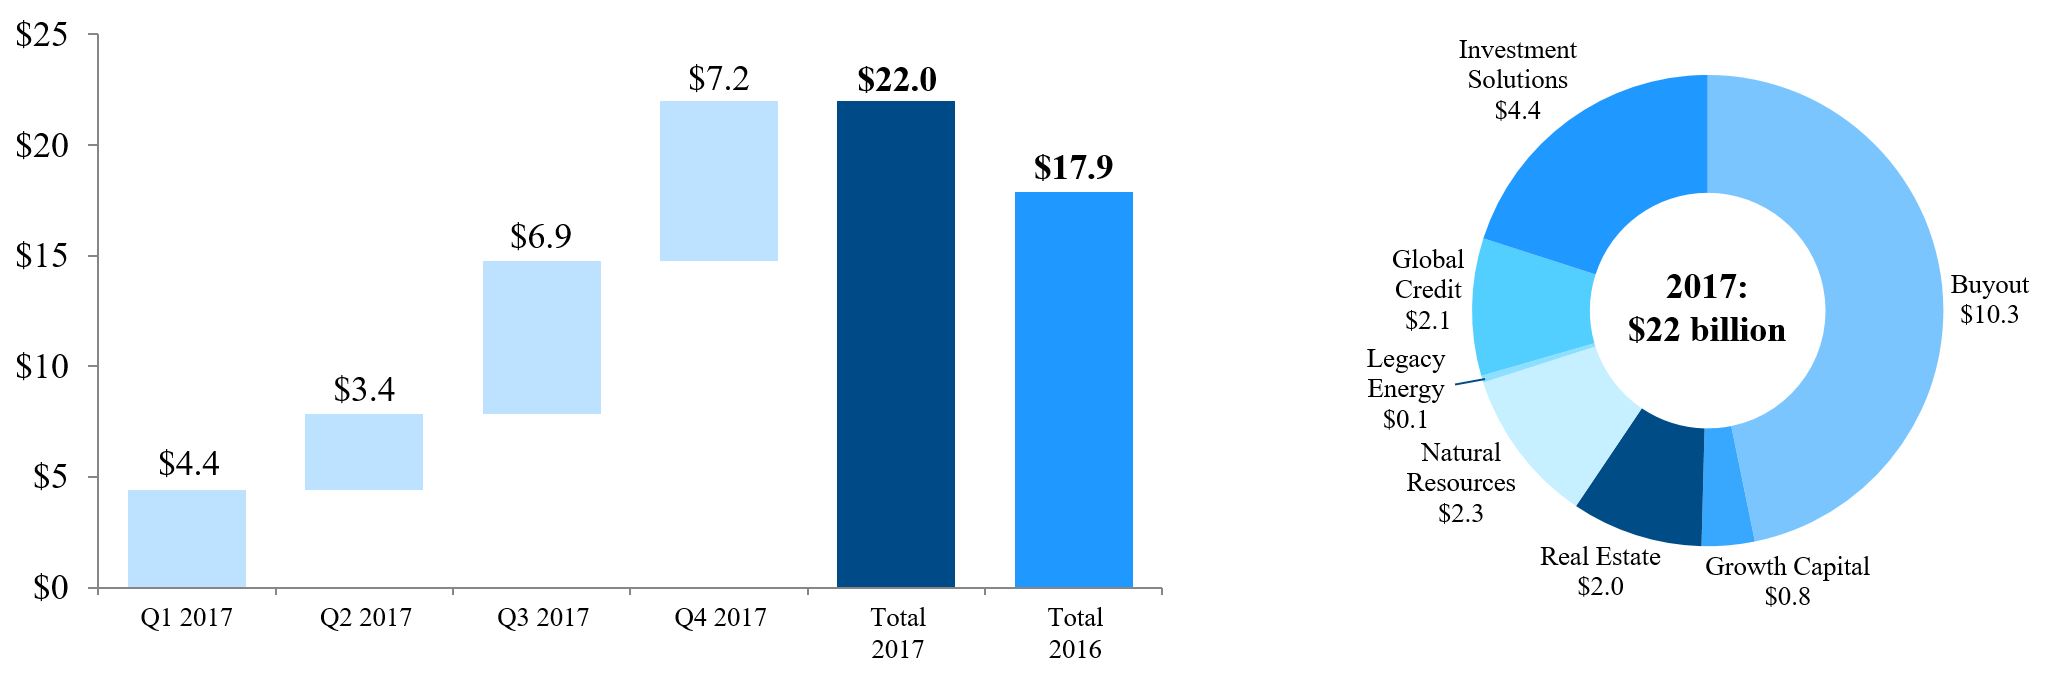
Fund Activity Metrics ($ billions) |
By Quarter | By Sub-segment | |
Fundraising |
Invested Capital |
Realized Proceeds |
Note: Totals may not sum due to rounding. Invested Capital and Realized Proceeds reflect carry funds only.
(1) Net of redemptions.
Page | 11
Assets Under Management and Remaining Fair Value of Capital |
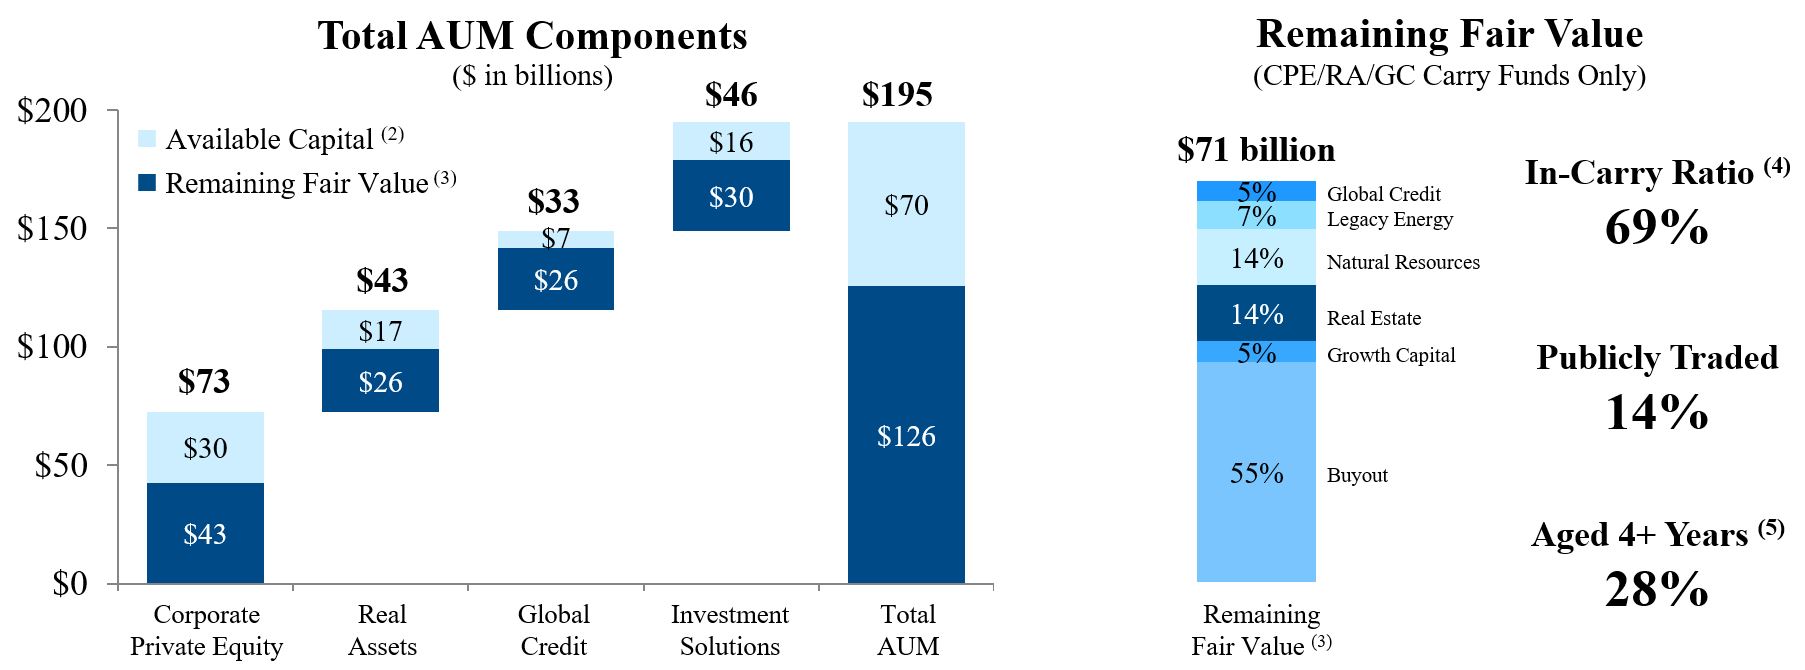
Assets Under Management of $195 billion increased 24% compared to $158 billion in Q4 2016. The remaining fair value of $71 billion in our Corporate Private Equity, Real Assets and Global Credit carry funds was up 27% compared to Q4 2016.
vs. Last Quarter | vs. One Year Ago | ||||||||
$ in billions, unless noted | Q4 2017 | Q3 2017 | % | Q4 2016 | % | ||||
Corporate Private Equity | 72.6 | 55.7 | 30% | 50.9 | 43% | ||||
Real Assets | 42.9 | 39.8 | 8% | 34.3 | 25% | ||||
Global Credit | 33.3 | 31.9 | 4% | 29.4 | 13% | ||||
Investment Solutions | 46.3 | 47.0 | (2)% | 43.1 | 7% | ||||
Total | 195.1 | 174.4 | 12% | 157.6 | 24% | ||||
Note: Data as of December 31, 2017. Totals may not sum due to rounding. For definitions of AUM roll forward components, see footnotes on page 22.
(1) Primarily comprised of expiring dry powder, the impact of capital calls for fees and expenses and change in gross asset value for our business development companies.
(2) Available capital refers to the amount of capital commitments available to be called for investments, which may be reduced for equity invested that is funded via fund credit facility and expected to be called from investors at a later date, plus any additional assets/liabilities at the fund level other than active investments. Amounts previously called may be added back to available capital following certain distributions.
(3) Remaining Fair Value reflects the unrealized carrying value of investments for all carry funds, related co-investment vehicles and separately managed accounts, the aggregate collateral balance of our CLOs and the gross asset value of our business development companies.
(4) The In-Carry Ratio represents percentage of Remaining Fair Value in an accrued carry position.
(5) Reflects the percentage of Remaining Fair Value attributable to investments originated in Q4 2013 or prior. Investments that include follow-on tranches are fully recognized based on the date of the initial investment activity.
Page | 12
Fee Earning Assets Under Management |
Fee Earning Assets Under Management of $125 billion increased 8% from Q4 2016. This amount excludes the positive impact of pending Fee Earning Assets Under Management, which was $22 billion as of Q4 2017, up from $4 billion as of Q4 2016.
vs. Last Quarter | vs. One Year Ago | ||||||||
$ in billions, unless noted | Q4 2017 | Q3 2017 | % | Q4 2016 | % | ||||
Corporate Private Equity | 35.6 | 35.6 | 0% | 36.3 | (2)% | ||||
Real Assets | 31.6 | 29.8 | 6% | 27.5 | 15% | ||||
Global Credit | 27.3 | 26.0 | 5% | 24.1 | 13% | ||||
Investment Solutions | 30.2 | 30.3 | 0% | 27.1 | 11% | ||||
Total | 124.6 | 121.8 | 2% | 115.0 | 8% | ||||
Note: As of December 31, 2017.
Balance Sheet Highlights |
The amounts presented below exclude the effect of U.S. GAAP consolidation eliminations on investments and accrued performance fees, as well as cash and debt associated with Carlyle’s consolidated funds. All data is as of December 31, 2017.
• | Cash and Cash Equivalents and Corporate Treasury Investments(1) of $1.4 billion. |
• | On-balance sheet investments attributable to unitholders of $933 million(2), excluding the equity investment by Carlyle in NGP Energy Capital Management. |
• | Net accrued performance fees attributable to unitholders of $1.7 billion. These performance fees are comprised of $3.7 billion of gross accrued performance fees, less $0.1 billion in accrued giveback obligation and $1.9 billion in accrued performance fee compensation and non-controlling interest. |
• | Debt obligations, consisting of loans, senior notes, and promissory notes totaling $1.6 billion. |
• | On September 13, 2017, Carlyle issued 16 million of its 5.875% Series A Preferred Units at $25.00 per unit for total gross proceeds of $400 million. |
(1) Corporate Treasury Investments represent investments in U.S. Treasury and government agency obligations, commercial paper, certificates of deposit, other investment grade securities and other investments with original maturities of greater than three months when purchased.
(2) Included in our on-balance sheet investments is approximately $275 million of loans used to finance our investments in CLOs .
Page | 13
Conference Call
Carlyle will host a conference call at 8:30 a.m. EST on Wednesday, February 7, 2018, to announce its fourth quarter and full year 2017 financial results. The call may be accessed by dialing +1 (800) 850-2903 (U.S.) or +1 (253) 237-1169 (international) and referencing “The Carlyle Group Financial Results Call.” The conference call will be webcast simultaneously via a link on Carlyle’s investor relations website at ir.carlyle.com and an archived replay of the webcast also will be available on the website soon after the live call.
About The Carlyle Group
The Carlyle Group (NASDAQ: CG) is a global alternative asset manager with $195 billion of assets under management across 317 investment vehicles as of December 31, 2017. Carlyle’s purpose is to invest wisely and create value on behalf of its investors, many of whom are public pensions. Carlyle invests across four segments – Corporate Private Equity, Real Assets, Global Credit and Investment Solutions – in Africa, Asia, Australia, Europe, the Middle East, North America and South America. Carlyle has expertise in various industries, including: aerospace, defense & government services, consumer & retail, energy, financial services, healthcare, industrial, real estate, technology & business services, telecommunications & media and transportation. The Carlyle Group employs more than 1,600 people in 31 offices across six continents.
Web: www.carlyle.com
Videos: www.youtube.com/onecarlyle
Tweets: www.twitter.com/onecarlyle
Podcasts: www.carlyle.com/about-carlyle/market-commentary
Contacts:
Public Market Investor Relations Media
Daniel Harris Elizabeth Gill
Phone: +1 (212) 813-4527 Phone: +1 (202) 729-5385
daniel.harris@carlyle.com elizabeth.gill@carlyle.com
Forward Looking Statements
This press release may contain forward-looking statements within the meaning of Section 27A of the Securities Act of 1933 and Section 21E of the Securities Exchange Act of 1934. These statements include, but are not limited to, statements related to our expectations regarding the performance of our business, our financial results, our liquidity and capital resources, contingencies, our distribution policy, and other non-historical statements. You can identify these forward-looking statements by the use of words such as “outlook,” “believes,” “expects,” “potential,” “continues,” “may,” “will,” “should,” “seeks,” “approximately,” “predicts,” “intends,” “plans,” “estimates,” “anticipates” or the negative version of these words or other comparable words. Such forward-looking statements are subject to various risks, uncertainties and assumptions. Accordingly, there are or will be important factors that could cause actual outcomes or results to differ materially from those indicated in these statements including, but not limited to, those described under the section entitled “Risk Factors” in our Annual Report on Form 10-K for the year ended December 31, 2016 filed with the SEC on February 16, 2017, as such factors may be updated from time to time in our periodic filings with the SEC, which are accessible on the SEC’s website at www.sec.gov. These factors should not be construed as exhaustive and should be read in conjunction with the other cautionary statements that are included in this release and in our filings with the SEC. We undertake no obligation to publicly update or review any forward-looking statements, whether as a result of new information, future developments or otherwise, except as required by applicable law.
This release does not constitute an offer for any Carlyle fund.
Page | 14
The Carlyle Group L.P.
GAAP Statement of Operations (Unaudited)
Three Months Ended | Year Ended | |||||||||||||||
Dec 31, 2016 | Dec 31, 2017 | Dec 31, 2016 | Dec 31, 2017 | |||||||||||||
(Dollars in millions, except unit and per unit data) | ||||||||||||||||
Revenues | ||||||||||||||||
Fund management fees | $ | 259.0 | $ | 279.3 | $ | 1,076.1 | $ | 1,026.9 | ||||||||
Performance fees | ||||||||||||||||
Realized | 224.4 | 244.6 | 1,129.5 | 1,097.3 | ||||||||||||
Unrealized | (43.4 | ) | 338.5 | (377.7 | ) | 996.6 | ||||||||||
Total performance fees | 181.0 | 583.1 | 751.8 | 2,093.9 | ||||||||||||
Investment income | ||||||||||||||||
Realized | 20.7 | 28.4 | 112.9 | 70.4 | ||||||||||||
Unrealized | 13.6 | 61.1 | 47.6 | 161.6 | ||||||||||||
Total investment income | 34.3 | 89.5 | 160.5 | 232.0 | ||||||||||||
Interest and other income | 8.9 | 10.8 | 23.9 | 36.7 | ||||||||||||
Interest and other income of Consolidated Funds | 59.1 | 45.1 | 166.9 | 177.7 | ||||||||||||
Revenue of a real estate VIE | 33.6 | — | 95.1 | 109.0 | ||||||||||||
Total revenues | 575.9 | 1,007.8 | 2,274.3 | 3,676.2 | ||||||||||||
Expenses | ||||||||||||||||
Compensation and benefits | ||||||||||||||||
Base compensation | 176.6 | 181.6 | 647.1 | 652.7 | ||||||||||||
Equity-based compensation | 68.8 | 78.5 | 334.6 | 320.3 | ||||||||||||
Performance fee related | ||||||||||||||||
Realized | 157.5 | 118.8 | 580.5 | 520.7 | ||||||||||||
Unrealized | (81.3 | ) | 157.7 | (227.4 | ) | 467.6 | ||||||||||
Total compensation and benefits | 321.6 | 536.6 | 1,334.8 | 1,961.3 | ||||||||||||
General, administrative and other expenses | 158.5 | 105.9 | 521.1 | 276.8 | ||||||||||||
Interest | 15.0 | 17.1 | 61.3 | 65.5 | ||||||||||||
Interest and other expenses of Consolidated Funds | 41.2 | 36.7 | 128.5 | 197.6 | ||||||||||||
Interest and other expenses of a real estate VIE | 49.7 | — | 207.6 | 202.5 | ||||||||||||
Other non-operating (income) expense | (12.0 | ) | (71.5 | ) | (11.2 | ) | (71.4 | ) | ||||||||
Total expenses | 574.0 | 624.8 | 2,242.1 | 2,632.3 | ||||||||||||
Other income | ||||||||||||||||
Net investment gains of Consolidated Funds | 10.0 | 12.0 | 13.1 | 88.4 | ||||||||||||
Income before provision for income taxes | 11.9 | 395.0 | 45.3 | 1,132.3 | ||||||||||||
Provision (benefit) for income taxes | (2.7 | ) | 107.2 | 30.0 | 124.9 | |||||||||||
Net income | 14.6 | 287.8 | 15.3 | 1,007.4 | ||||||||||||
Net income attributable to non-controlling interests in consolidated entities | 70.8 | 25.1 | 41.0 | 72.5 | ||||||||||||
Net income (loss) attributable to Carlyle Holdings | (56.2 | ) | 262.7 | (25.7 | ) | 934.9 | ||||||||||
Net income (loss) attributable to non-controlling interests in Carlyle Holdings | (47.3 | ) | 203.8 | (32.1 | ) | 690.8 | ||||||||||
Net income (loss) attributable to The Carlyle Group L.P. | (8.9 | ) | 58.9 | 6.4 | 244.1 | |||||||||||
Net income attributable to Series A Preferred Unitholders | — | 6.0 | — | 6.0 | ||||||||||||
Net income (loss) attributable to The Carlyle Group L.P. Common Unitholders | $ | (8.9 | ) | $ | 52.9 | $ | 6.4 | $ | 238.1 | |||||||
Net income (loss) attributable to The Carlyle Group L.P. per common unit | ||||||||||||||||
Basic | $ | (0.11 | ) | $ | 0.53 | $ | 0.08 | $ | 2.58 | |||||||
Diluted (1) | $ | (0.16 | ) | $ | 0.49 | $ | (0.08 | ) | $ | 2.38 | ||||||
Weighted-average common units | ||||||||||||||||
Basic | 84,654,647 | 99,026,789 | 82,714,178 | 92,136,959 | ||||||||||||
Diluted | 309,337,312 | 107,639,911 | 308,522,990 | 100,082,548 | ||||||||||||
(1) Included in net income (loss) attributable to The Carlyle Group L.P. common unitholders on a fully diluted basis is incremental net income (loss) from the assumed exchange of Carlyle Holdings partnership units of $(40.7) million and $(32.1) million for the three months and year ended December 31, 2016, respectively.
Page | 15
Total Segment Information (Unaudited)
The following table sets forth information in the format used by management when making resource deployment decisions and in assessing the performance of our segments. The information below is the aggregate results of our four segments.
Three Months Ended | Year Ended | |||||||||||||||||||
Total Segment Revenues | Dec 31, 2016 | Sep 30, 2017 | Dec 31, 2017 | Dec 31, 2016 | Dec 31, 2017 | |||||||||||||||
(Dollars in millions) | ||||||||||||||||||||
Fund level fee revenues | ||||||||||||||||||||
Fund management fees | $ | 265.8 | $ | 278.4 | $ | 289.8 | $ | 1,085.8 | $ | 1,081.0 | ||||||||||
Portfolio advisory fees, net | 3.8 | 4.1 | 3.7 | 16.6 | 16.7 | |||||||||||||||
Transaction fees, net | 6.9 | 6.1 | 11.9 | 31.2 | 26.9 | |||||||||||||||
Total fee revenues | 276.5 | 288.6 | 305.4 | 1,133.6 | 1,124.6 | |||||||||||||||
Performance fees | ||||||||||||||||||||
Realized | 296.6 | 411.0 | 238.6 | 1,215.8 | 1,085.3 | |||||||||||||||
Unrealized | (158.2 | ) | (125.6 | ) | 376.9 | (464.1 | ) | 1,089.6 | ||||||||||||
Total performance fees | 138.4 | 285.4 | 615.5 | 751.7 | 2,174.9 | |||||||||||||||
Investment income (loss) | ||||||||||||||||||||
Realized | 17.0 | (53.4 | ) | 22.4 | 44.9 | (25.8 | ) | |||||||||||||
Unrealized | (2.5 | ) | 18.1 | 18.3 | 5.4 | 73.0 | ||||||||||||||
Total investment income (loss) | 14.5 | (35.3 | ) | 40.7 | 50.3 | 47.2 | ||||||||||||||
Interest income | 2.2 | 5.4 | 5.5 | 10.2 | 16.7 | |||||||||||||||
Other income | 3.9 | 3.4 | 4.0 | 12.8 | 15.4 | |||||||||||||||
Total Segment Revenues | $ | 435.5 | $ | 547.5 | $ | 971.1 | $ | 1,958.6 | $ | 3,378.8 | ||||||||||
Three Months Ended | Year Ended | |||||||||||||||||||
Total Segment Expenses | Dec 31, 2016 | Sep 30, 2017 | Dec 31, 2017 | Dec 31, 2016 | Dec 31, 2017 | |||||||||||||||
(Dollars in millions) | ||||||||||||||||||||
Compensation and benefits | ||||||||||||||||||||
Direct base compensation | $ | 99.7 | $ | 132.5 | $ | 120.3 | $ | 437.1 | $ | 464.5 | ||||||||||
Indirect base compensation | 49.1 | 44.8 | 60.1 | 164.2 | 193.5 | |||||||||||||||
Equity-based compensation | 24.4 | 30.4 | 26.7 | 119.6 | 123.9 | |||||||||||||||
Performance fee related | ||||||||||||||||||||
Realized | 161.0 | 194.1 | 120.3 | 590.5 | 532.7 | |||||||||||||||
Unrealized | (83.3 | ) | (55.7 | ) | 157.9 | (232.5 | ) | 464.4 | ||||||||||||
Total compensation and benefits | 250.9 | 346.1 | 485.3 | 1,078.9 | 1,779.0 | |||||||||||||||
General, administrative, and other indirect expenses | 156.8 | (26.5 | ) | 94.4 | 483.5 | 233.9 | ||||||||||||||
Depreciation and amortization expense | 7.2 | 8.2 | 7.9 | 29.0 | 31.1 | |||||||||||||||
Interest expense | 15.0 | 17.0 | 17.1 | 61.3 | 65.5 | |||||||||||||||
Total Segment Expenses | $ | 429.9 | $ | 344.8 | $ | 604.7 | $ | 1,652.7 | $ | 2,109.5 | ||||||||||
Three Months Ended | Year Ended | |||||||||||||||||||
Total Segments | Dec 31, 2016 | Sep 30, 2017 | Dec 31, 2017 | Dec 31, 2016 | Dec 31, 2017 | |||||||||||||||
(Dollars in millions) | ||||||||||||||||||||
Total Segment Revenues | $ | 435.5 | $ | 547.5 | $ | 971.1 | $ | 1,958.6 | $ | 3,378.8 | ||||||||||
Total Segment Expenses | 429.9 | 344.8 | 604.7 | 1,652.7 | 2,109.5 | |||||||||||||||
Economic Income | $ | 5.6 | $ | 202.7 | $ | 366.4 | $ | 305.9 | $ | 1,269.3 | ||||||||||
(-) Net Performance Fees | 60.7 | 147.0 | 337.3 | 393.7 | 1,177.8 | |||||||||||||||
(-) Investment Income (Loss) | 14.5 | (35.3 | ) | 40.7 | 50.3 | 47.2 | ||||||||||||||
(+) Equity-based compensation | 24.4 | 30.4 | 26.7 | 119.6 | 123.9 | |||||||||||||||
(+) Net Interest | 12.8 | 11.6 | 11.6 | 51.1 | 48.8 | |||||||||||||||
(+) Reserve for Litigation and Contingencies | (100.0 | ) | (25.0 | ) | — | — | (25.0 | ) | ||||||||||||
(=) Fee Related Earnings | $ | (132.4 | ) | $ | 108.0 | $ | 26.7 | $ | 32.6 | $ | 192.0 | |||||||||
(+) Realized Net Performance Fees | 135.6 | 216.9 | 118.3 | 625.3 | 552.6 | |||||||||||||||
(+) Realized Investment Income (Loss) | 17.0 | (53.4 | ) | 22.4 | 44.9 | (25.8 | ) | |||||||||||||
(+) Net Interest | (12.8 | ) | (11.6 | ) | (11.6 | ) | (51.1 | ) | (48.8 | ) | ||||||||||
(=) Distributable Earnings | $ | 7.4 | $ | 259.9 | $ | 155.8 | $ | 651.7 | $ | 670.0 | ||||||||||
Page | 16
Total Segment Information (Unaudited), cont.
Three Months Ended | Year Ended | |||||||||||||||||||||||||||
Total Segment Revenues | Dec 31, 2016 | Mar 31, 2017 | Jun 30, 2017 | Sep 30, 2017 | Dec 31, 2017 | Dec 31, 2016 | Dec 31, 2017 | |||||||||||||||||||||
(Dollars in millions) | ||||||||||||||||||||||||||||
Segment fee revenues | ||||||||||||||||||||||||||||
Fund management fees | $ | 265.8 | $ | 255.6 | $ | 257.2 | $ | 278.4 | $ | 289.8 | $ | 1,085.8 | $ | 1,081.0 | ||||||||||||||
Portfolio advisory fees, net | 3.8 | 4.0 | 4.9 | 4.1 | 3.7 | 16.6 | 16.7 | |||||||||||||||||||||
Transaction fees, net | 6.9 | 7.7 | 1.2 | 6.1 | 11.9 | 31.2 | 26.9 | |||||||||||||||||||||
Total fee revenues | 276.5 | 267.3 | 263.3 | 288.6 | 305.4 | 1,133.6 | 1,124.6 | |||||||||||||||||||||
Performance fees | ||||||||||||||||||||||||||||
Realized | 296.6 | 83.0 | 352.7 | 411.0 | 238.6 | 1,215.8 | 1,085.3 | |||||||||||||||||||||
Unrealized | (158.2 | ) | 631.7 | 206.6 | (125.6 | ) | 376.9 | (464.1 | ) | 1,089.6 | ||||||||||||||||||
Total performance fees | 138.4 | 714.7 | 559.3 | 285.4 | 615.5 | 751.7 | 2,174.9 | |||||||||||||||||||||
Investment income (loss) | ||||||||||||||||||||||||||||
Realized | 17.0 | (5.4 | ) | 10.6 | (53.4 | ) | 22.4 | 44.9 | (25.8 | ) | ||||||||||||||||||
Unrealized | (2.5 | ) | 16.0 | 20.6 | 18.1 | 18.3 | 5.4 | 73.0 | ||||||||||||||||||||
Total investment income (loss) | 14.5 | 10.6 | 31.2 | (35.3 | ) | 40.7 | 50.3 | 47.2 | ||||||||||||||||||||
Interest income | 2.2 | 3.4 | 2.4 | 5.4 | 5.5 | 10.2 | 16.7 | |||||||||||||||||||||
Other income | 3.9 | 5.2 | 2.8 | 3.4 | 4.0 | 12.8 | 15.4 | |||||||||||||||||||||
Total Segment Revenues | $ | 435.5 | $ | 1,001.2 | $ | 859.0 | $ | 547.5 | $ | 971.1 | $ | 1,958.6 | $ | 3,378.8 | ||||||||||||||
Three Months Ended | Year Ended | |||||||||||||||||||||||||||
Total Segment Expenses | Dec 31, 2016 | Mar 31, 2017 | Jun 30, 2017 | Sep 30, 2017 | Dec 31, 2017 | Dec 31, 2016 | Dec 31, 2017 | |||||||||||||||||||||
(Dollars in millions) | ||||||||||||||||||||||||||||
Compensation and benefits | ||||||||||||||||||||||||||||
Direct base compensation | $ | 99.7 | $ | 108.3 | $ | 103.4 | $ | 132.5 | $ | 120.3 | $ | 437.1 | $ | 464.5 | ||||||||||||||
Indirect base compensation | 49.1 | 39.0 | 49.6 | 44.8 | 60.1 | 164.2 | 193.5 | |||||||||||||||||||||
Equity-based compensation | 24.4 | 30.1 | 36.7 | 30.4 | 26.7 | 119.6 | 123.9 | |||||||||||||||||||||
Performance fee related | ||||||||||||||||||||||||||||
Realized | 161.0 | 47.7 | 170.6 | 194.1 | 120.3 | 590.5 | 532.7 | |||||||||||||||||||||
Unrealized | (83.3 | ) | 272.9 | 89.3 | (55.7 | ) | 157.9 | (232.5 | ) | 464.4 | ||||||||||||||||||
Total compensation and benefits | 250.9 | 498.0 | 449.6 | 346.1 | 485.3 | 1,078.9 | 1,779.0 | |||||||||||||||||||||
General, administrative, and other indirect expenses | 156.8 | 80.6 | 85.4 | (26.5 | ) | 94.4 | 483.5 | 233.9 | ||||||||||||||||||||
Depreciation and amortization expense | 7.2 | 7.5 | 7.5 | 8.2 | 7.9 | 29.0 | 31.1 | |||||||||||||||||||||
Interest expense | 15.0 | 15.0 | 16.4 | 17.0 | 17.1 | 61.3 | 65.5 | |||||||||||||||||||||
Total Segment Expenses | $ | 429.9 | $ | 601.1 | $ | 558.9 | $ | 344.8 | $ | 604.7 | $ | 1,652.7 | $ | 2,109.5 | ||||||||||||||
Three Months Ended | Year Ended | |||||||||||||||||||||||||||
Total Segments | Dec 31, 2016 | Mar 31, 2017 | Jun 30, 2017 | Sep 30, 2017 | Dec 31, 2017 | Dec 31, 2016 | Dec 31, 2017 | |||||||||||||||||||||
(Dollars in millions) | ||||||||||||||||||||||||||||
Total Segment Revenues | $ | 435.5 | $ | 1,001.2 | $ | 859.0 | $ | 547.5 | $ | 971.1 | $ | 1,958.6 | $ | 3,378.8 | ||||||||||||||
Total Segment Expenses | 429.9 | 601.1 | 558.9 | 344.8 | 604.7 | 1,652.7 | 2,109.5 | |||||||||||||||||||||
Economic Income | $ | 5.6 | $ | 400.1 | $ | 300.1 | $ | 202.7 | $ | 366.4 | $ | 305.9 | $ | 1,269.3 | ||||||||||||||
(-) Net Performance Fees | 60.7 | 394.1 | 299.4 | 147.0 | 337.3 | 393.7 | 1,177.8 | |||||||||||||||||||||
(-) Investment Income (Loss) | 14.5 | 10.6 | 31.2 | (35.3 | ) | 40.7 | 50.3 | 47.2 | ||||||||||||||||||||
(+) Equity-based compensation | 24.4 | 30.1 | 36.7 | 30.4 | 26.7 | 119.6 | 123.9 | |||||||||||||||||||||
(+) Net Interest | 12.8 | 11.6 | 14.0 | 11.6 | 11.6 | 51.1 | 48.8 | |||||||||||||||||||||
(+) Reserve for Litigation and Contingencies | (100.0 | ) | — | — | (25.0 | ) | — | — | (25.0 | ) | ||||||||||||||||||
(=) Fee Related Earnings | $ | (132.4 | ) | $ | 37.1 | $ | 20.2 | $ | 108.0 | $ | 26.7 | $ | 32.6 | $ | 192.0 | |||||||||||||
(+) Realized Net Performance Fees | 135.6 | 35.3 | 182.1 | 216.9 | 118.3 | 625.3 | 552.6 | |||||||||||||||||||||
(+) Realized Investment Income (Loss) | 17.0 | (5.4 | ) | 10.6 | (53.4 | ) | 22.4 | 44.9 | (25.8 | ) | ||||||||||||||||||
(+) Net Interest | (12.8 | ) | (11.6 | ) | (14.0 | ) | (11.6 | ) | (11.6 | ) | (51.1 | ) | (48.8 | ) | ||||||||||||||
(=) Distributable Earnings | $ | 7.4 | $ | 55.4 | $ | 198.9 | $ | 259.9 | $ | 155.8 | $ | 651.7 | $ | 670.0 | ||||||||||||||
Page | 17
Corporate Private Equity Segment Results (Unaudited)
Three Months Ended | Year Ended | |||||||||||||||||||||||||||
Corporate Private Equity | Dec 31, 2016 | Mar 31, 2017 | Jun 30, 2017 | Sep 30, 2017 | Dec 31, 2017 | Dec 31, 2016 | Dec 31, 2017 | |||||||||||||||||||||
(Dollars in millions) | ||||||||||||||||||||||||||||
Revenues | ||||||||||||||||||||||||||||
Segment fee revenues | ||||||||||||||||||||||||||||
Fund management fees | $ | 122.0 | $ | 115.7 | $ | 117.7 | $ | 118.3 | $ | 119.3 | $ | 498.9 | $ | 471.0 | ||||||||||||||
Portfolio advisory fees, net | 3.3 | 3.8 | 4.5 | 3.6 | 3.3 | 14.5 | 15.2 | |||||||||||||||||||||
Transaction fees, net | 6.9 | 7.7 | 1.2 | 5.3 | 8.2 | 31.2 | 22.4 | |||||||||||||||||||||
Total fee revenues | 132.2 | 127.2 | 123.4 | 127.2 | 130.8 | 544.6 | 508.6 | |||||||||||||||||||||
Performance fees | ||||||||||||||||||||||||||||
Realized | 285.3 | 51.3 | 272.1 | 345.4 | 162.7 | 1,060.5 | 831.5 | |||||||||||||||||||||
Unrealized | (281.3 | ) | 515.3 | 142.9 | (193.2 | ) | 316.6 | (777.5 | ) | 781.6 | ||||||||||||||||||
Total performance fees | 4.0 | 566.6 | 415.0 | 152.2 | 479.3 | 283.0 | 1,613.1 | |||||||||||||||||||||
Investment income (Loss) | ||||||||||||||||||||||||||||
Realized | 13.7 | 0.2 | 8.9 | 6.5 | 9.8 | 60.3 | 25.4 | |||||||||||||||||||||
Unrealized | 1.7 | 5.5 | 13.3 | 4.1 | 14.1 | (11.0 | ) | 37.0 | ||||||||||||||||||||
Total investment income | 15.4 | 5.7 | 22.2 | 10.6 | 23.9 | 49.3 | 62.4 | |||||||||||||||||||||
Interest income | 0.7 | 1.1 | 0.8 | 1.8 | 1.8 | 3.4 | 5.5 | |||||||||||||||||||||
Other income | 2.0 | 1.3 | 1.3 | 1.6 | 1.8 | 6.0 | 6.0 | |||||||||||||||||||||
Total revenues | 154.3 | 701.9 | 562.7 | 293.4 | 637.6 | 886.3 | 2,195.6 | |||||||||||||||||||||
Expenses | ||||||||||||||||||||||||||||
Compensation and benefits | ||||||||||||||||||||||||||||
Direct base compensation | 45.0 | 55.4 | 54.7 | 65.3 | 60.3 | 210.8 | 235.7 | |||||||||||||||||||||
Indirect base compensation | 23.2 | 18.7 | 18.0 | 18.3 | 50.0 | 78.8 | 105.0 | |||||||||||||||||||||
Equity-based compensation | 13.3 | 15.0 | 17.8 | 14.5 | 13.2 | 69.3 | 60.5 | |||||||||||||||||||||
Performance fee related | ||||||||||||||||||||||||||||
Realized | 126.7 | 26.1 | 121.6 | 147.7 | 77.5 | 472.1 | 372.9 | |||||||||||||||||||||
Unrealized | (122.7 | ) | 227.8 | 69.4 | (76.1 | ) | 141.5 | (342.6 | ) | 362.6 | ||||||||||||||||||
Total compensation and benefits | 85.5 | 343.0 | 281.5 | 169.7 | 342.5 | 488.4 | 1,136.7 | |||||||||||||||||||||
General, administrative, and other indirect expenses | (12.4 | ) | 35.0 | 28.4 | 20.5 | 35.9 | 131.9 | 119.8 | ||||||||||||||||||||
Depreciation and amortization expense | 3.4 | 3.7 | 3.7 | 4.1 | 3.8 | 13.6 | 15.3 | |||||||||||||||||||||
Interest expense | 7.0 | 6.8 | 7.3 | 7.0 | 6.8 | 28.2 | 27.9 | |||||||||||||||||||||
Total expenses | 83.5 | 388.5 | 320.9 | 201.3 | 389.0 | 662.1 | 1,299.7 | |||||||||||||||||||||
Economic Income | $ | 70.8 | $ | 313.4 | $ | 241.8 | $ | 92.1 | $ | 248.6 | $ | 224.2 | $ | 895.9 | ||||||||||||||
(-) Net Performance Fees | — | 312.7 | 224.0 | 80.6 | 260.3 | 153.5 | 877.6 | |||||||||||||||||||||
(-) Investment Income | 15.4 | 5.7 | 22.2 | 10.6 | 23.9 | 49.3 | 62.4 | |||||||||||||||||||||
(+) Equity-based compensation | 13.3 | 15.0 | 17.8 | 14.5 | 13.2 | 69.3 | 60.5 | |||||||||||||||||||||
(+) Net Interest | 6.3 | 5.7 | 6.5 | 5.2 | 5.0 | 24.8 | 22.4 | |||||||||||||||||||||
(+) Reserve for Litigation and Contingencies | (49.8 | ) | — | — | (12.5 | ) | — | — | (12.5 | ) | ||||||||||||||||||
(=) Fee Related Earnings | $ | 25.2 | $ | 15.7 | $ | 19.9 | $ | 8.1 | $ | (17.4 | ) | $ | 115.5 | $ | 26.3 | |||||||||||||
(+) Realized Net Performance Fees | 158.6 | 25.2 | 150.5 | 197.7 | 85.2 | 588.4 | 458.6 | |||||||||||||||||||||
(+) Realized Investment Income | 13.7 | 0.2 | 8.9 | 6.5 | 9.8 | 60.3 | 25.4 | |||||||||||||||||||||
(+) Net Interest | (6.3 | ) | (5.7 | ) | (6.5 | ) | (5.2 | ) | (5.0 | ) | (24.8 | ) | (22.4 | ) | ||||||||||||||
(=) Distributable Earnings | $ | 191.2 | $ | 35.4 | $ | 172.8 | $ | 207.1 | $ | 72.6 | $ | 739.4 | $ | 487.9 | ||||||||||||||
Page | 18
Real Assets Segment Results (Unaudited)
Three Months Ended | Year Ended | |||||||||||||||||||||||||||
Real Assets | Dec 31, 2016 | Mar 31, 2017 | Jun 30, 2017 | Sep 30, 2017 | Dec 31, 2017 | Dec 31, 2016 | Dec 31, 2017 | |||||||||||||||||||||
(Dollars in millions) | ||||||||||||||||||||||||||||
Revenues | ||||||||||||||||||||||||||||
Segment fee revenues | ||||||||||||||||||||||||||||
Fund management fees | $ | 59.1 | $ | 56.0 | $ | 58.2 | $ | 71.4 | $ | 78.0 | $ | 251.1 | $ | 263.6 | ||||||||||||||
Portfolio advisory fees, net | 0.1 | 0.1 | 0.1 | 0.4 | 0.2 | 0.2 | 0.8 | |||||||||||||||||||||
Transaction fees, net | — | — | — | 0.8 | 3.7 | — | 4.5 | |||||||||||||||||||||
Total fee revenues | 59.2 | 56.1 | 58.3 | 72.6 | 81.9 | 251.3 | 268.9 | |||||||||||||||||||||
Performance fees | ||||||||||||||||||||||||||||
Realized | (26.7 | ) | 13.5 | 39.7 | 20.4 | 18.4 | 53.1 | 92.0 | ||||||||||||||||||||
Unrealized | 108.2 | 78.7 | 60.6 | 60.8 | 68.2 | 274.0 | 268.3 | |||||||||||||||||||||
Total performance fees | 81.5 | 92.2 | 100.3 | 81.2 | 86.6 | 327.1 | 360.3 | |||||||||||||||||||||
Investment income (loss) | ||||||||||||||||||||||||||||
Realized | 0.8 | (8.1 | ) | 0.3 | (64.6 | ) | 9.2 | (20.6 | ) | (63.2 | ) | |||||||||||||||||
Unrealized | (5.1 | ) | 5.2 | 6.8 | 12.4 | 2.3 | 1.4 | 26.7 | ||||||||||||||||||||
Total investment income (loss) | (4.3 | ) | (2.9 | ) | 7.1 | (52.2 | ) | 11.5 | (19.2 | ) | (36.5 | ) | ||||||||||||||||
Interest income | 0.4 | 0.6 | 0.4 | 1.0 | 1.0 | 1.7 | 3.0 | |||||||||||||||||||||
Other income | 0.6 | 0.4 | 0.3 | 0.6 | 0.9 | 1.6 | 2.2 | |||||||||||||||||||||
Total revenues | 137.4 | 146.4 | 166.4 | 103.2 | 181.9 | 562.5 | 597.9 | |||||||||||||||||||||
Expenses | ||||||||||||||||||||||||||||
Compensation and benefits | ||||||||||||||||||||||||||||
Direct base compensation | 16.7 | 19.7 | 17.4 | 24.5 | 16.0 | 72.1 | 77.6 | |||||||||||||||||||||
Indirect base compensation | 10.9 | 10.9 | 19.9 | 14.8 | 4.9 | 39.1 | 50.5 | |||||||||||||||||||||
Equity-based compensation | 6.0 | 8.8 | 9.3 | 8.7 | 8.1 | 26.3 | 34.9 | |||||||||||||||||||||
Performance fee related | ||||||||||||||||||||||||||||
Realized | 2.8 | 6.8 | 17.4 | 9.2 | 8.2 | 37.6 | 41.6 | |||||||||||||||||||||
Unrealized | 26.7 | 19.3 | 19.2 | 21.6 | 15.2 | 81.9 | 75.3 | |||||||||||||||||||||
Total compensation and benefits | 63.1 | 65.5 | 83.2 | 78.8 | 52.4 | 257.0 | 279.9 | |||||||||||||||||||||
General, administrative, and other indirect expenses | (3.6 | ) | 15.6 | 26.5 | 10.5 | 25.9 | 67.1 | 78.5 | ||||||||||||||||||||
Depreciation and amortization expense | 1.5 | 1.8 | 1.6 | 1.9 | 1.8 | 5.9 | 7.1 | |||||||||||||||||||||
Interest expense | 3.9 | 4.1 | 4.4 | 4.2 | 4.3 | 16.0 | 17.0 | |||||||||||||||||||||
Total expenses | 64.9 | 87.0 | 115.7 | 95.4 | 84.4 | 346.0 | 382.5 | |||||||||||||||||||||
Economic Income | $ | 72.5 | $ | 59.4 | $ | 50.7 | $ | 7.8 | $ | 97.5 | $ | 216.5 | $ | 215.4 | ||||||||||||||
(-) Net Performance Fees | 52.0 | 66.1 | 63.7 | 50.4 | 63.2 | 207.6 | 243.4 | |||||||||||||||||||||
(-) Investment Income (Loss) | (4.3 | ) | (2.9 | ) | 7.1 | (52.2 | ) | 11.5 | (19.2 | ) | (36.5 | ) | ||||||||||||||||
(+) Equity-based compensation | 6.0 | 8.8 | 9.3 | 8.7 | 8.1 | 26.3 | 34.9 | |||||||||||||||||||||
(+) Net Interest | 3.5 | 3.5 | 4.0 | 3.2 | 3.3 | 14.3 | 14.0 | |||||||||||||||||||||
(+) Reserve for Litigation and Contingencies | (21.6 | ) | — | — | (5.8 | ) | — | — | (5.8 | ) | ||||||||||||||||||
(=) Fee Related Earnings | $ | 12.7 | $ | 8.5 | $ | (6.8 | ) | $ | 15.7 | $ | 34.2 | $ | 68.7 | $ | 51.6 | |||||||||||||
(+) Realized Net Performance Fees | (29.5 | ) | 6.7 | 22.3 | 11.2 | 10.2 | 15.5 | 50.4 | ||||||||||||||||||||
(+) Realized Investment Income (Loss) | 0.8 | (8.1 | ) | 0.3 | (64.6 | ) | 9.2 | (20.6 | ) | (63.2 | ) | |||||||||||||||||
(+) Net Interest | (3.5 | ) | (3.5 | ) | (4.0 | ) | (3.2 | ) | (3.3 | ) | (14.3 | ) | (14.0 | ) | ||||||||||||||
(=) Distributable Earnings | $ | (19.5 | ) | $ | 3.6 | $ | 11.8 | $ | (40.9 | ) | $ | 50.3 | $ | 49.3 | $ | 24.8 | ||||||||||||
Page | 19
Global Credit Segment Results (Unaudited)
Three Months Ended | Year Ended | |||||||||||||||||||||||||||
Global Credit | Dec 31, 2016 | Mar 31, 2017 | Jun 30, 2017 | Sep 30, 2017 | Dec 31, 2017 | Dec 31, 2016 | Dec 31, 2017 | |||||||||||||||||||||
(Dollars in millions) | ||||||||||||||||||||||||||||
Revenues | ||||||||||||||||||||||||||||
Segment fee revenues | ||||||||||||||||||||||||||||
Fund management fees | $ | 48.1 | $ | 48.1 | $ | 45.1 | $ | 47.6 | $ | 50.7 | $ | 195.5 | $ | 191.5 | ||||||||||||||
Portfolio advisory fees, net | 0.4 | 0.1 | 0.3 | 0.1 | 0.2 | 1.1 | 0.7 | |||||||||||||||||||||
Transaction fees, net | — | — | — | — | — | — | — | |||||||||||||||||||||
Total fee revenues | 48.5 | 48.2 | 45.4 | 47.7 | 50.9 | 196.6 | 192.2 | |||||||||||||||||||||
Performance fees | ||||||||||||||||||||||||||||
Realized | 15.1 | 5.6 | 17.2 | 15.0 | 37.6 | 36.6 | 75.4 | |||||||||||||||||||||
Unrealized | (3.4 | ) | 14.5 | (1.6 | ) | 2.6 | (31.8 | ) | 1.2 | (16.3 | ) | |||||||||||||||||
Total performance fees | 11.7 | 20.1 | 15.6 | 17.6 | 5.8 | 37.8 | 59.1 | |||||||||||||||||||||
Investment income | ||||||||||||||||||||||||||||
Realized | 2.4 | 2.4 | 1.5 | 4.7 | 3.3 | 5.1 | 11.9 | |||||||||||||||||||||
Unrealized | 0.4 | 4.2 | 0.1 | — | 1.1 | 15.3 | 5.4 | |||||||||||||||||||||
Total investment income | 2.8 | 6.6 | 1.6 | 4.7 | 4.4 | 20.4 | 17.3 | |||||||||||||||||||||
Interest income | 1.0 | 1.6 | 1.0 | 2.0 | 2.5 | 4.7 | 7.1 | |||||||||||||||||||||
Other income | 1.2 | 3.4 | 1.1 | 1.1 | 1.2 | 4.7 | 6.8 | |||||||||||||||||||||
Total revenues | 65.2 | 79.9 | 64.7 | 73.1 | 64.8 | 264.2 | 282.5 | |||||||||||||||||||||
Expenses | ||||||||||||||||||||||||||||
Compensation and benefits | ||||||||||||||||||||||||||||
Direct base compensation | 21.1 | 17.1 | 15.2 | 23.0 | 23.9 | 87.4 | 79.2 | |||||||||||||||||||||
Indirect base compensation | 9.9 | 6.6 | 7.6 | 6.7 | 4.4 | 32.6 | 25.3 | |||||||||||||||||||||
Equity-based compensation | 3.8 | 4.3 | 7.5 | 5.1 | 3.8 | 17.6 | 20.7 | |||||||||||||||||||||
Performance fee related | ||||||||||||||||||||||||||||
Realized | 9.5 | 2.7 | 8.2 | 7.3 | 16.8 | 17.6 | 35.0 | |||||||||||||||||||||
Unrealized | (1.6 | ) | 6.8 | (0.7 | ) | 0.8 | (14.2 | ) | 0.6 | (7.3 | ) | |||||||||||||||||
Total compensation and benefits | 42.7 | 37.5 | 37.8 | 42.9 | 34.7 | 155.8 | 152.9 | |||||||||||||||||||||
General, administrative, and other indirect expenses | 172.9 | 23.2 | 21.8 | (63.6 | ) | 21.9 | 250.0 | 3.3 | ||||||||||||||||||||
Depreciation and amortization expense | 1.6 | 1.2 | 1.3 | 1.3 | 1.3 | 6.2 | 5.1 | |||||||||||||||||||||
Interest expense | 2.8 | 2.6 | 3.2 | 4.2 | 4.5 | 11.3 | 14.5 | |||||||||||||||||||||
Total expenses | 220.0 | 64.5 | 64.1 | (15.2 | ) | 62.4 | 423.3 | 175.8 | ||||||||||||||||||||
Economic Income (Loss) | $ | (154.8 | ) | $ | 15.4 | $ | 0.6 | $ | 88.3 | $ | 2.4 | $ | (159.1 | ) | $ | 106.7 | ||||||||||||
(-) Net Performance Fees | 3.8 | 10.6 | 8.1 | 9.5 | 3.2 | 19.6 | 31.4 | |||||||||||||||||||||
(-) Investment Income | 2.8 | 6.6 | 1.6 | 4.7 | 4.4 | 20.4 | 17.3 | |||||||||||||||||||||
(+) Equity-based compensation | 3.8 | 4.3 | 7.5 | 5.1 | 3.8 | 17.6 | 20.7 | |||||||||||||||||||||
(+) Net Interest | 1.8 | 1.0 | 2.2 | 2.2 | 2.0 | 6.6 | 7.4 | |||||||||||||||||||||
(+) Reserve for Litigation and Contingencies | (19.0 | ) | — | — | (4.1 | ) | — | — | (4.1 | ) | ||||||||||||||||||
(=) Fee Related Earnings | $ | (174.8 | ) | $ | 3.5 | $ | 0.6 | $ | 77.3 | $ | 0.6 | $ | (174.9 | ) | $ | 82.0 | ||||||||||||
(+) Realized Net Performance Fees | 5.6 | 2.9 | 9.0 | 7.7 | 20.8 | 19.0 | 40.4 | |||||||||||||||||||||
(+) Realized Investment Income | 2.4 | 2.4 | 1.5 | 4.7 | 3.3 | 5.1 | 11.9 | |||||||||||||||||||||
(+) Net Interest | (1.8 | ) | (1.0 | ) | (2.2 | ) | (2.2 | ) | (2.0 | ) | (6.6 | ) | (7.4 | ) | ||||||||||||||
(=) Distributable Earnings | $ | (168.6 | ) | $ | 7.8 | $ | 8.9 | $ | 87.5 | $ | 22.7 | $ | (157.4 | ) | $ | 126.9 | ||||||||||||
Page | 20
Investment Solutions Segment Results (Unaudited)
Three Months Ended | Year Ended | |||||||||||||||||||||||||||
Investment Solutions | Dec 31, 2016 | Mar 31, 2017 | Jun 30, 2017 | Sep 30, 2017 | Dec 31, 2017 | Dec 31, 2016 | Dec 31, 2017 | |||||||||||||||||||||
(Dollars in millions) | ||||||||||||||||||||||||||||
Revenues | ||||||||||||||||||||||||||||
Segment fee revenues | ||||||||||||||||||||||||||||
Fund management fees | $ | 36.6 | $ | 35.8 | $ | 36.2 | $ | 41.1 | $ | 41.8 | $ | 140.3 | $ | 154.9 | ||||||||||||||
Portfolio advisory fees, net | — | — | — | — | — | 0.8 | — | |||||||||||||||||||||
Transaction fees, net | — | — | — | — | — | — | — | |||||||||||||||||||||
Total fee revenues | 36.6 | 35.8 | 36.2 | 41.1 | 41.8 | 141.1 | 154.9 | |||||||||||||||||||||
Performance fees | ||||||||||||||||||||||||||||
Realized | 22.9 | 12.6 | 23.7 | 30.2 | 19.9 | 65.6 | 86.4 | |||||||||||||||||||||
Unrealized | 18.3 | 23.2 | 4.7 | 4.2 | 23.9 | 38.2 | 56.0 | |||||||||||||||||||||
Total performance fees | 41.2 | 35.8 | 28.4 | 34.4 | 43.8 | 103.8 | 142.4 | |||||||||||||||||||||
Investment income (loss) | ||||||||||||||||||||||||||||
Realized | 0.1 | 0.1 | (0.1 | ) | — | 0.1 | 0.1 | 0.1 | ||||||||||||||||||||
Unrealized | 0.5 | 1.1 | 0.4 | 1.6 | 0.8 | (0.3 | ) | 3.9 | ||||||||||||||||||||
Total investment income (loss) | 0.6 | 1.2 | 0.3 | 1.6 | 0.9 | (0.2 | ) | 4.0 | ||||||||||||||||||||
Interest income | 0.1 | 0.1 | 0.2 | 0.6 | 0.2 | 0.4 | 1.1 | |||||||||||||||||||||
Other income | 0.1 | 0.1 | 0.1 | 0.1 | 0.1 | 0.5 | 0.4 | |||||||||||||||||||||
Total revenues | 78.6 | 73.0 | 65.2 | 77.8 | 86.8 | 245.6 | 302.8 | |||||||||||||||||||||
Expenses | ||||||||||||||||||||||||||||
Compensation and benefits | ||||||||||||||||||||||||||||
Direct base compensation | 16.9 | 16.1 | 16.1 | 19.7 | 20.1 | 66.8 | 72.0 | |||||||||||||||||||||
Indirect base compensation | 5.1 | 2.8 | 4.1 | 5.0 | 0.8 | 13.7 | 12.7 | |||||||||||||||||||||
Equity-based compensation | 1.3 | 2.0 | 2.1 | 2.1 | 1.6 | 6.4 | 7.8 | |||||||||||||||||||||
Performance fee related | ||||||||||||||||||||||||||||
Realized | 22.0 | 12.1 | 23.4 | 29.9 | 17.8 | 63.2 | 83.2 | |||||||||||||||||||||
Unrealized | 14.3 | 19.0 | 1.4 | (2.0 | ) | 15.4 | 27.6 | 33.8 | ||||||||||||||||||||
Total compensation and benefits | 59.6 | 52.0 | 47.1 | 54.7 | 55.7 | 177.7 | 209.5 | |||||||||||||||||||||
General, administrative, and other indirect expenses | (0.1 | ) | 6.8 | 8.7 | 6.1 | 10.7 | 34.5 | 32.3 | ||||||||||||||||||||
Depreciation and amortization expense | 0.7 | 0.8 | 0.9 | 0.9 | 1.0 | 3.3 | 3.6 | |||||||||||||||||||||
Interest expense | 1.3 | 1.5 | 1.5 | 1.6 | 1.5 | 5.8 | 6.1 | |||||||||||||||||||||
Total expenses | 61.5 | 61.1 | 58.2 | 63.3 | 68.9 | 221.3 | 251.5 | |||||||||||||||||||||
Economic Income (Loss) | $ | 17.1 | $ | 11.9 | $ | 7.0 | $ | 14.5 | $ | 17.9 | $ | 24.3 | $ | 51.3 | ||||||||||||||
(-) Net Performance Fees | 4.9 | 4.7 | 3.6 | 6.5 | 10.6 | 13.0 | 25.4 | |||||||||||||||||||||
(-) Investment Income (Loss) | 0.6 | 1.2 | 0.3 | 1.6 | 0.9 | (0.2 | ) | 4.0 | ||||||||||||||||||||
(+) Equity-based compensation | 1.3 | 2.0 | 2.1 | 2.1 | 1.6 | 6.4 | 7.8 | |||||||||||||||||||||
(+) Net Interest | 1.2 | 1.4 | 1.3 | 1.0 | 1.3 | 5.4 | 5.0 | |||||||||||||||||||||
(+) Reserve for Litigation and Contingencies | (9.6 | ) | — | — | (2.6 | ) | — | — | (2.6 | ) | ||||||||||||||||||
(=) Fee Related Earnings | $ | 4.5 | $ | 9.4 | $ | 6.5 | $ | 6.9 | $ | 9.3 | $ | 23.3 | $ | 32.1 | ||||||||||||||
(+) Realized Net Performance Fees | 0.9 | 0.5 | 0.3 | 0.3 | 2.1 | 2.4 | 3.2 | |||||||||||||||||||||
(+) Realized Investment Income (Loss) | 0.1 | 0.1 | (0.1 | ) | — | 0.1 | 0.1 | 0.1 | ||||||||||||||||||||
(+) Net Interest | (1.2 | ) | (1.4 | ) | (1.3 | ) | (1.0 | ) | (1.3 | ) | (5.4 | ) | (5.0 | ) | ||||||||||||||
(=) Distributable Earnings | $ | 4.3 | $ | 8.6 | $ | 5.4 | $ | 6.2 | $ | 10.2 | $ | 20.4 | $ | 30.4 | ||||||||||||||
Page | 21
Total Assets Under Management Roll Forward (Unaudited)
Three Months Ended December 31, 2017 | ||||||||||||||||||||
(USD in millions) | Corporate Private Equity | Real Assets | Global Credit | Investment Solutions (6) | Total | |||||||||||||||
Total AUM | ||||||||||||||||||||
Balance, Beginning of Period | $ | 55,743 | $ | 39,768 | $ | 31,875 | $ | 47,042 | $ | 174,428 | ||||||||||
New Commitments (1) | 19,129 | 3,172 | 1,897 | 613 | 24,811 | |||||||||||||||
Outflows (2) | (5,145 | ) | (984 | ) | (717 | ) | (3,029 | ) | (9,875 | ) | ||||||||||
Market Appreciation/(Depreciation) (3) | 2,870 | 1,004 | 39 | 1,293 | 5,206 | |||||||||||||||
Foreign Exchange Gain/(Loss) (4) | 147 | 6 | 123 | 531 | 807 | |||||||||||||||
Other (5) | (186 | ) | (78 | ) | 107 | (159 | ) | (316 | ) | |||||||||||
Balance, End of Period | $ | 72,558 | $ | 42,888 | $ | 33,324 | $ | 46,291 | $ | 195,061 | ||||||||||
For the Twelve Months Ended December 31, 2017 | ||||||||||||||||||||
(USD in millions) | Corporate Private Equity | Real Assets | Global Credit | Investment Solutions (6) | Total | |||||||||||||||
Total AUM | ||||||||||||||||||||
Balance, Beginning of Period | $ | 50,864 | $ | 34,252 | $ | 29,399 | $ | 43,092 | $ | 157,607 | ||||||||||
New Commitments (1) | 20,544 | 10,205 | 6,643 | 5,454 | 42,846 | |||||||||||||||
Outflows (2) | (9,377 | ) | (4,247 | ) | (3,981 | ) | (9,804 | ) | (27,409 | ) | ||||||||||
Market Appreciation/(Depreciation) (3) | 9,668 | 3,614 | 177 | 3,645 | 17,104 | |||||||||||||||
Foreign Exchange Gain/(Loss) (4) | 1,145 | 112 | 829 | 4,407 | 6,493 | |||||||||||||||
Other (5) | (286 | ) | (1,048 | ) | 257 | (503 | ) | (1,580 | ) | |||||||||||
Balance, End of Period | $ | 72,558 | $ | 42,888 | $ | 33,324 | $ | 46,291 | $ | 195,061 | ||||||||||
(1) New Commitments reflects the impact of gross fundraising during the period. For funds or vehicles denominated in foreign currencies, this reflects translation at the average quarterly rate, while the separately reported Fundraising metric is translated at the spot rate for each individual closing.
(2) Outflows includes distributions in our carry funds and related co-investment vehicles, NGP management fee funds and separately managed accounts, as well as runoff of CLO collateral balances.
(3) Market Appreciation/(Depreciation) generally represents realized and unrealized gains (losses) on portfolio investments in our carry funds and related co-investment vehicles, NGP management fee funds and separately managed accounts.
(4) Represents the impact of foreign exchange rate fluctuations on the translation of our non-U.S. dollar denominated funds. Activity during the period is translated at the average rate for the period. Ending balances are translated at the spot rate as of the period end.
(5) Includes expiring dry powder, the impact of capital calls for fees and expenses, change in gross asset value for our business development companies and other changes in AUM.
(6) The fair market values for our Investment Solutions carry funds are based on the latest available valuations of the underlying limited partnership interests (in most cases as of September 30, 2017) as provided by their general partners, plus the net cash flows since the latest valuation, up to December 31, 2017.
Page | 22
Fee Earning AUM Roll Forward (Unaudited)
Three Months Ended December 31, 2017 | ||||||||||||||||||||
(USD in millions) | Corporate Private Equity | Real Assets (7) | Global Credit | Investment Solutions | Total | |||||||||||||||
Fee earning AUM | ||||||||||||||||||||
Balance, Beginning of Period | $ | 35,603 | $ | 29,820 | $ | 26,012 | $ | 30,346 | $ | 121,781 | ||||||||||
Inflows, including Fee-paying Commitments (1) | 1,256 | 3,308 | 275 | 959 | 5,798 | |||||||||||||||
Outflows, including Distributions (2) | (1,393 | ) | (1,772 | ) | (104 | ) | (1,638 | ) | (4,907 | ) | ||||||||||
Subscriptions, net of Redemptions (3) | — | — | — | — | — | |||||||||||||||
Changes in CLO collateral balances (4) | — | — | 860 | — | 860 | |||||||||||||||
Market Appreciation/(Depreciation) (5) | 19 | 28 | 10 | 73 | 130 | |||||||||||||||
Foreign Exchange and other (6) | 99 | 215 | 209 | 410 | 933 | |||||||||||||||
Balance, End of Period | $ | 35,584 | $ | 31,599 | $ | 27,262 | $ | 30,150 | $ | 124,595 | ||||||||||
For the Twelve Months Ended December 31, 2017 | ||||||||||||||||||||
(USD in millions) | Corporate Private Equity | Real Assets (7) | Global Credit | Investment Solutions | Total | |||||||||||||||
Fee earning AUM | ||||||||||||||||||||
Balance, Beginning of Period | $ | 36,327 | $ | 27,487 | $ | 24,126 | $ | 27,054 | $ | 114,994 | ||||||||||
Inflows, including Fee-paying Commitments (1) | 2,086 | 8,812 | 1,413 | 6,234 | 18,545 | |||||||||||||||
Outflows, including Distributions (2) | (3,692 | ) | (4,925 | ) | (265 | ) | (5,776 | ) | (14,658 | ) | ||||||||||
Subscriptions, net of Redemptions (3) | — | — | — | — | — | |||||||||||||||
Changes in CLO collateral balances (4) | — | — | 843 | — | 843 | |||||||||||||||
Market Appreciation/(Depreciation) (5) | 31 | 73 | 13 | (207 | ) | (90 | ) | |||||||||||||
Foreign Exchange and other (6) | 832 | 152 | 1,132 | 2,845 | 4,961 | |||||||||||||||
Balance, End of Period | $ | 35,584 | $ | 31,599 | $ | 27,262 | $ | 30,150 | $ | 124,595 | ||||||||||
(1) Inflows represent limited partner capital raised and capital invested by our carry funds and the NGP management fee funds outside the investment period, weighted-average investment period or commitment fee period. Inflows do not include funds raised of $22.1 billion, which are not yet earning fees.
(2) Outflows represent limited partner distributions from our carry funds and NGP management fee funds, changes in basis for our carry funds where the investment period, weighted-average investment period or commitment fee period has expired, and reductions for funds that are no longer calling for fees.
(3) Represents the net result of subscriptions to and redemptions from our hedge funds, mutual fund and fund of hedge funds vehicles.
(4) Represents the change in the aggregate Fee-earning collateral balances at par of our CLOs/structured products, as of the quarterly cut-off dates.
(5) Market Appreciation/(Depreciation) represents realized and unrealized gains (losses) on portfolio investments in our carry funds based on the lower of cost or fair value and net asset value.
(6) Includes activity of funds with fees based on gross asset value. Represents the impact of foreign exchange rate fluctuations on the translation of our non-U.S. dollar denominated funds. Activity during the period is translated at the average rate for the period. Ending balances are translated at the spot rate as of the period end.
(7) Energy II, Energy III, Energy IV, Renew I, and Renew II (collectively, the “Legacy Energy Funds”), are managed with Riverstone Holdings LLC and its affiliates. Affiliates of both Carlyle and Riverstone act as investment advisers to each of the Legacy Energy Funds. With the exception of Energy IV and Renew II, where Carlyle has a minority representation on the funds’ management committees, management of each of the Legacy Energy Funds is vested in committees with equal representation by Carlyle and Riverstone, and the consent of representatives of both Carlyle and Riverstone is required for investment decisions. As of December 31, 2017, the Legacy Energy Funds had, in the aggregate, approximately $5.2 billion in AUM and $3.8 billion in Fee earning AUM. NGP VII, NGP VIII, NGP IX, or in the case of NGP M&R, NGP ETP I, and NGP ETP II, certain affiliated entities (collectively, the “NGP management fee funds”) and NGP X, NGP GAP and NGP XI (referred to herein as, "carry funds"), are managed by NGP Energy Capital Management. As of December 31, 2017, the NGP management fee funds and carry funds had, in the aggregate, approximately $13.0 billion in AUM and $11.2 billion in Fee earning AUM.
Page | 23
Corporate Private Equity Fund Performance (Unaudited)
The fund return information reflected in this discussion and analysis is not indicative of the performance of The Carlyle Group L.P. and is also not necessarily indicative of the future performance of any particular fund. An investment in The Carlyle Group L.P. is not an investment in any of our funds. There can be no assurance that any of our existing or future funds will achieve similar returns.
TOTAL INVESTMENTS | REALIZED/PARTIALLY REALIZED INVESTMENTS (5) | ||||||||||||||||||||||||||||||||||
As of December 31, 2017 | As of December 31, 2017 | ||||||||||||||||||||||||||||||||||
Corporate Private Equity | Fund Inception Date (1) | Committed Capital | Cumulative Invested Capital (2) | Total Fair Value (3) | MOIC(4) | Gross IRR (7) (12) | Net IRR (8) (12) | Cumulative Invested Capital (2) | Total Fair Value (3) | MOIC(4) | Gross IRR (7) | ||||||||||||||||||||||||
(Reported in Local Currency, in Millions) | (Reported in Local Currency, in Millions) | ||||||||||||||||||||||||||||||||||
Fully Invested/Committed Funds (6) | |||||||||||||||||||||||||||||||||||
CP II | 10/1994 | $ | 1,331.1 | $ | 1,362.4 | $ | 4,072.2 | 3.0x | 34 | % | 25 | % | $ | 1,362.4 | $ | 4,072.2 | 3.0x | 34 | % | ||||||||||||||||
CP III | 2/2000 | $ | 3,912.7 | $ | 4,031.6 | $ | 10,146.9 | 2.5x | 27 | % | 21 | % | $ | 4,031.6 | $ | 10,146.9 | 2.5x | 27 | % | ||||||||||||||||
CP IV | 12/2004 | $ | 7,850.0 | $ | 7,612.6 | $ | 17,937.9 | 2.4x | 16 | % | 13 | % | $ | 7,612.6 | $ | 17,937.9 | 2.4x | 16 | % | ||||||||||||||||
CP V | 5/2007 | $ | 13,719.7 | $ | 13,190.9 | $ | 27,362.9 | 2.1x | 18 | % | 14 | % | $ | 9,350.8 | $ | 24,962.3 | 2.7x | 26 | % | ||||||||||||||||
CEP I | 12/1997 | € | 1,003.6 | € | 981.6 | € | 2,126.5 | 2.2x | 18 | % | 11 | % | € | 981.6 | € | 2,126.5 | 2.2x | 18 | % | ||||||||||||||||
CEP II | 9/2003 | € | 1,805.4 | € | 2,048.4 | € | 4,122.3 | 2.0x | 36 | % | 20 | % | € | 1,883.8 | € | 4,106.8 | 2.2x | 43 | % | ||||||||||||||||
CEP III | 12/2006 | € | 5,294.9 | € | 5,116.1 | € | 11,572.3 | 2.3x | 19 | % | 14 | % | € | 4,284.4 | € | 10,419.8 | 2.4x | 20 | % | ||||||||||||||||
CAP I | 12/1998 | $ | 750.0 | $ | 627.7 | $ | 2,521.8 | 4.0x | 25 | % | 18 | % | $ | 627.7 | $ | 2,521.8 | 4.0x | 25 | % | ||||||||||||||||
CAP II | 2/2006 | $ | 1,810.0 | $ | 1,628.2 | $ | 3,051.5 | 1.9x | 11 | % | 8 | % | $ | 1,628.2 | $ | 3,051.5 | 1.9x | 11 | % | ||||||||||||||||
CAP III | 5/2008 | $ | 2,551.6 | $ | 2,543.2 | $ | 4,817.2 | 1.9x | 18 | % | 12 | % | $ | 2,071.8 | $ | 4,380.2 | 2.1x | 20 | % | ||||||||||||||||
CJP I | 10/2001 | ¥ | 50,000.0 | ¥ | 47,291.4 | ¥ | 138,902.1 | 2.9x | 61 | % | 37 | % | ¥ | 47,291.4 | ¥ | 138,902.1 | 2.9x | 61 | % | ||||||||||||||||
CJP II | 7/2006 | ¥ | 165,600.0 | ¥ | 141,866.7 | ¥ | 216,622.1 | 1.5x | 8 | % | 4 | % | ¥ | 126,166.7 | ¥ | 191,642.2 | 1.5x | 7 | % | ||||||||||||||||
CGFSP I | 9/2008 | $ | 1,100.2 | $ | 1,080.7 | $ | 2,462.1 | 2.3x | 20 | % | 14 | % | $ | 977.9 | $ | 2,318.7 | 2.4x | 22 | % | ||||||||||||||||
CGFSP II | 4/2013 | $ | 1,000.0 | $ | 897.2 | $ | 1,320.5 | 1.5x | 24% | 15% | $ | 193.2 | $ | 407.3 | 2.1x | 32 | % | ||||||||||||||||||
CEOF I | 5/2011 | $ | 1,119.1 | $ | 1,164.5 | $ | 1,569.6 | 1.3x | 12 | % | 8 | % | $ | 346.9 | $ | 827.7 | 2.4x | 38 | % | ||||||||||||||||
CETP II | 2/2007 | € | 521.6 | € | 437.4 | € | 1,253.6 | 2.9x | 28 | % | 19 | % | € | 278.8 | € | 1,140.8 | 4.1x | 36 | % | ||||||||||||||||
CAGP IV | 6/2008 | $ | 1,041.4 | $ | 954.1 | $ | 1,459.9 | 1.5x | 12 | % | 7 | % | $ | 502.1 | $ | 928.6 | 1.8x | 16 | % | ||||||||||||||||
All Other Funds (9) | Various | $ | 4,655.4 | $ | 7,220.2 | 1.6x | 16 | % | 7 | % | $ | 3,747.5 | $ | 6,048.6 | 1.6x | 17 | % | ||||||||||||||||||
Coinvestments and Other (10) | Various | $ | 11,040.3 | $ | 24,964.7 | 2.3x | 36 | % | 33 | % | $ | 6,998.2 | $ | 20,778.0 | 3.0x | 36 | % | ||||||||||||||||||
Total Fully Invested/Committed Funds | $ | 62,787.0 | $ | 134,994.5 | 2.2x | 26 | % | 19 | % | $ | 49,921.3 | $ | 122,707.5 | 2.5x | 27 | % | |||||||||||||||||||
Funds in the Investment Period (6) | |||||||||||||||||||||||||||||||||||
CP VI | 5/2012 | $ | 13,000.0 | $ | 11,753.9 | $ | 16,265.3 | 1.4x | 20% | 13% | |||||||||||||||||||||||||
CEP IV | 8/2013 | € | 3,669.5 | € | 3,074.2 | € | 3,720.3 | 1.2x | 18% | 7% | |||||||||||||||||||||||||
CAP IV | 11/2012 | $ | 3,880.4 | $ | 3,184.1 | $ | 5,206.6 | 1.6x | 31% | 20% | |||||||||||||||||||||||||
CGP | 12/2014 | $ | 3,588.0 | $ | 2,668.7 | $ | 2,795.1 | 1.0x | 5% | 4% | |||||||||||||||||||||||||
CJP III | 8/2013 | ¥ | 119,505.1 | ¥ | 60,094.5 | ¥ | 105,936.6 | 1.8x | NM | NM | |||||||||||||||||||||||||
CEOF II | 3/2015 | $ | 2,400.0 | $ | 1,150.1 | $ | 1,332.4 | 1.2x | NM | NM | |||||||||||||||||||||||||
All Other Funds (11) | Various | $ | 1,385.1 | $ | 1,822.4 | 1.3x | NM | NM | |||||||||||||||||||||||||||
Total Funds in the Investment Period | $ | 24,371.2 | $ | 32,834.9 | 1.3x | 21 | % | 12 | % | $ | 1,391.0 | $ | 3,731.1 | 2.7x | 58 | % | |||||||||||||||||||
TOTAL CORPORATE PRIVATE EQUITY (13) | $ | 87,158.2 | $ | 167,829.4 | 1.9x | 26 | % | 18 | % | $ | 51,312.2 | $ | 126,438.7 | 2.5x | 27 | % | |||||||||||||||||||
Page | 24
Real Assets and Global Credit Carry Funds Fund Performance (Unaudited)
TOTAL INVESTMENTS | REALIZED/PARTIALLY REALIZED INVESTMENTS (5) | ||||||||||||||||||||||||||||||||||
As of December 31, 2017 | As of December 31, 2017 | ||||||||||||||||||||||||||||||||||
Real Assets | Fund Inception Date (1) | Committed Capital | Cumulative Invested Capital (2) | Total Fair Value (3) | MOIC(4) | Gross IRR (7) (12) | Net IRR (8) (12) | Cumulative Invested Capital (2) | Total Fair Value (3) | MOIC(4) | Gross IRR (7) (12) | ||||||||||||||||||||||||
(Reported in Local Currency, in Millions) | (Reported in Local Currency, in Millions) | ||||||||||||||||||||||||||||||||||
Fully Invested/Committed Funds (6) | |||||||||||||||||||||||||||||||||||
CRP III | 11/2000 | $ | 564.1 | $ | 522.5 | $ | 1,850.3 | 3.5x | 44 | % | 30 | % | $ | 522.5 | $ | 1,850.3 | 3.5x | 44 | % | ||||||||||||||||
CRP IV | 12/2004 | $ | 950.0 | $ | 1,282.2 | $ | 2,022.6 | 1.6x | 8 | % | 5 | % | $ | 1,191.6 | $ | 1,962.7 | 1.6x | 8 | % | ||||||||||||||||
CRP V | 11/2006 | $ | 3,000.0 | $ | 3,430.0 | $ | 5,669.6 | 1.7x | 12 | % | 9 | % | $ | 2,942.0 | $ | 4,972.5 | 1.7x | 14 | % | ||||||||||||||||
CRP VI | 9/2010 | $ | 2,340.0 | $ | 2,219.3 | $ | 4,012.7 | 1.8x | 29 | % | 20 | % | $ | 1,581.6 | $ | 3,190.4 | 2.0x | 33 | % | ||||||||||||||||
CRP VII | 3/2014 | $ | 4,161.6 | $ | 3,220.4 | $ | 4,282.4 | 1.3x | 21% | 12% | $ | 315.2 | $ | 593.9 | 1.9x | 33 | % | ||||||||||||||||||
CEREP I | 3/2002 | € | 426.6 | € | 517.0 | € | 698.6 | 1.4x | 14 | % | 7 | % | € | 517.0 | € | 698.6 | 1.4x | 14 | % | ||||||||||||||||
CEREP II | 4/2005 | € | 762.7 | € | 833.8 | € | 128.1 | 0.2x | Neg | Neg | € | 826.7 | € | 132.3 | 0.2x | Neg | |||||||||||||||||||
CEREP III | 5/2007 | € | 2,229.5 | € | 2,025.7 | € | 2,432.2 | 1.2x | 4 | % | 1 | % | € | 1,706.7 | € | 2,247.6 | 1.3x | 6 | % | ||||||||||||||||
CIP | 9/2006 | $ | 1,143.7 | $ | 1,069.8 | $ | 1,427.6 | 1.3x | 6 | % | 3 | % | $ | 997.1 | $ | 1,365.1 | 1.4x | 6% | |||||||||||||||||
NGP X | 1/2012 | $ | 3,586.0 | $ | 3,267.2 | $ | 4,185.6 | 1.3x | 9 | % | 6 | % | $ | 1,382.9 | $ | 2,505.2 | 1.8x | 24 | % | ||||||||||||||||
NGP XI | 6/2014 | $ | 5,325.0 | $ | 3,696.7 | $ | 5,348.6 | 1.4x | 38% | 32% | $ | 228.9 | $ | 471.3 | 2.1x | 169 | % | ||||||||||||||||||
Energy II | 7/2002 | $ | 1,100.0 | $ | 1,334.8 | $ | 3,130.9 | 2.3x | 81 | % | 55 | % | $ | 1,334.8 | $ | 3,130.9 | 2.3x | 81% | |||||||||||||||||
Energy III | 10/2005 | $ | 3,800.0 | $ | 3,569.7 | $ | 5,513.1 | 1.5x | 10 | % | 7 | % | $ | 2,873.9 | $ | 5,045.9 | 1.8x | 14 | % | ||||||||||||||||
Energy IV | 12/2007 | $ | 5,979.1 | $ | 6,262.0 | $ | 8,167.3 | 1.3x | 8 | % | 5 | % | $ | 4,066.5 | $ | 6,012.2 | 1.5x | 14% | |||||||||||||||||
Renew II | 3/2008 | $ | 3,417.5 | $ | 2,809.4 | $ | 4,188.8 | 1.5x | 9 | % | 6 | % | $ | 1,555.3 | $ | 2,440.9 | 1.6x | 12 | % | ||||||||||||||||
All Other Funds (14) | Various | $ | 2,939.5 | $ | 3,289.7 | 1.1x | 4 | % | Neg | $ | 2,662.1 | $ | 3,019.5 | 1.1x | 5% | ||||||||||||||||||||
Coinvestments and Other (10) | Various | $ | 6,039.4 | $ | 9,880.3 | 1.6x | 16 | % | 13 | % | $ | 4,180.4 | $ | 7,228.9 | 1.7x | 20 | % | ||||||||||||||||||
Total Fully Invested/Committed Funds | $ | 45,721.8 | $ | 66,887.1 | 1.5x | 12 | % | 8 | % | $ | 29,501.8 | $ | 47,490.4 | 1.6x | 16 | % | |||||||||||||||||||
Funds in the Investment Period (6) | |||||||||||||||||||||||||||||||||||
CRP VIII | 5/2017 | $ | 5,010.7 | $ | 229.8 | $ | 222.5 | 1.0x | NM | NM | |||||||||||||||||||||||||
CIEP I | 9/2013 | $ | 2,500.0 | $ | 988.8 | $ | 1,510.4 | 1.5x | 28% | 11% | |||||||||||||||||||||||||
NGP XII | 7/2017 | $ | 2,776.7 | $ | 241.0 | $ | 241.0 | 1.0x | NM | NM | |||||||||||||||||||||||||
CPP II | 6/2014 | $ | 1,526.9 | $ | 643.9 | $ | 706.3 | 1.1x | NM | NM | |||||||||||||||||||||||||
CPI | 5/2016 | $ | 1,144.0 | $ | 863.4 | $ | 968.3 | 1.1x | NM | NM | |||||||||||||||||||||||||
All Other Funds (15) | Various | $ | 391.5 | $ | 359.1 | 0.9x | NM | NM | |||||||||||||||||||||||||||
Total Funds in the Investment Period | $ | 3,358.4 | $ | 4,007.5 | 1.2x | 17 | % | 5 | % | $ | — | $ | — | n/a | n/a | ||||||||||||||||||||
TOTAL Real Assets (13) | $ | 49,080.2 | $ | 70,894.6 | 1.4x | 12 | % | 8 | % | $ | 29,501.8 | $ | 47,490.4 | 1.6x | 16 | % | |||||||||||||||||||
Page | 25
TOTAL INVESTMENTS | ||||||||||||||||||||||
As of December 31, 2017 | Inception to December 31, 2017 | |||||||||||||||||||||
Global Credit (Carry Funds Only) | Fund Inception Date (1) | Committed Capital | Cumulative Invested Capital (17) | Total Fair Value (3) | MOIC (4) | Gross IRR (7) (12) | Net IRR (8) (12) | |||||||||||||||
(Reported in Local Currency, in Millions) | ||||||||||||||||||||||
Fully Invested/Committed Funds (6) | ||||||||||||||||||||||
CSP II | 6/2007 | $ | 1,352.3 | $ | 1,352.3 | $ | 2,465.6 | 1.8x | 17 | % | 11 | % | ||||||||||
CSP III | 8/2011 | $ | 702.8 | $ | 702.8 | $ | 1,163.4 | 1.7x | 32 | % | 20 | % | ||||||||||
CEMOF I | 12/2010 | $ | 1,382.5 | $ | 1,599.9 | $ | 1,419.4 | 0.9x | Neg | Neg | ||||||||||||
All Other Funds (16) | $ | 1,438.5 | $ | 1,998.3 | 1.4x | 12 | % | 7 | % | |||||||||||||
Coinvestments and Other (10) | $ | 976.4 | $ | 938.6 | 1.0x | NM | NM | |||||||||||||||
Total Fully Invested/Committed Funds | $ | 6,069.9 | $ | 7,985.3 | 1.3x | 12 | % | 6 | % | |||||||||||||
Funds in the Investment Period (6) | ||||||||||||||||||||||
CSP IV | 3/2016 | $ | 2,500.0 | $ | 661.4 | $ | 766.7 | 1.2x | NM | NM | ||||||||||||
CEMOF II | 2/2015 | $ | 2,819.2 | $ | 878.4 | $ | 933.1 | 1.1x | NM | NM | ||||||||||||
All Other Funds | $ | 173.9 | $ | 179.5 | 1.0x | NM | NM | |||||||||||||||
Total Funds in the Investment Period | $ | 1,713.7 | $ | 1,879.3 | 1.1x | NM | NM | |||||||||||||||
TOTAL Global Credit | $ | 7,783.6 | $ | 9,864.6 | 1.3x | 12 | % | 6 | % | |||||||||||||
Page | 26
Investment Solutions Fund Performance (Unaudited)
TOTAL INVESTMENTS | ||||||||||||||||||||||
As of December 31, 2017 | ||||||||||||||||||||||
Investment Solutions (19) | Vintage Year | Fund Size | Cumulative Invested Capital (2)(20) | Total Fair Value (3)(20) | MOIC (4) | Gross IRR (12) (21) | Net IRR (8) (12) | |||||||||||||||
(Reported in Local Currency, in Millions) | ||||||||||||||||||||||
AlpInvest | ||||||||||||||||||||||
Fully Committed Funds (18) | ||||||||||||||||||||||
Main Fund I - Fund Investments | 2000 | € | 5,174.6 | € | 4,151.9 | € | 6,831.8 | 1.6x | 12 | % | 11 | % | ||||||||||
Main Fund II - Fund Investments | 2003 | € | 4,545.0 | € | 4,727.2 | € | 7,509.9 | 1.6x | 10 | % | 9 | % | ||||||||||
Main Fund III - Fund Investments | 2005 | € | 11,500.0 | € | 12,476.5 | € | 19,895.6 | 1.6x | 10 | % | 9 | % | ||||||||||
Main Fund IV - Fund Investments | 2009 | € | 4,877.3 | € | 4,921.5 | € | 7,860.7 | 1.6x | 16 | % | 16 | % | ||||||||||
Main Fund V - Fund Investments | 2012 | € | 5,080.0 | € | 3,839.2 | € | 4,856.9 | 1.3x | 13 | % | 12 | % | ||||||||||
Main Fund VI - Fund Investments | 2015 | € | 1,106.4 | € | 393.1 | € | 403.0 | 1.0x | NM | NM | ||||||||||||
Main Fund I - Secondary Investments | 2002 | € | 519.4 | € | 469.8 | € | 884.0 | 1.9x | 57 | % | 53 | % | ||||||||||
Main Fund II - Secondary Investments | 2003 | € | 998.4 | € | 983.6 | € | 1,799.8 | 1.8x | 27 | % | 26 | % | ||||||||||
Main Fund III - Secondary Investments | 2006 | € | 2,250.0 | € | 2,271.1 | € | 3,448.5 | 1.5x | 11 | % | 10 | % | ||||||||||
Main Fund IV - Secondary Investments | 2010 | € | 1,859.1 | € | 1,895.7 | € | 3,213.3 | 1.7x | 20 | % | 19 | % | ||||||||||
Main Fund V - Secondary Investments | 2011 | € | 4,272.8 | € | 3,739.8 | € | 5,658.7 | 1.5x | 22 | % | 20 | % | ||||||||||
Main Fund II - Co-Investments | 2003 | € | 1,090.0 | € | 891.1 | € | 2,491.5 | 2.8x | 44 | % | 42 | % | ||||||||||
Main Fund III - Co-Investments | 2006 | € | 2,760.0 | € | 2,696.9 | € | 3,739.2 | 1.4x | 5 | % | 5 | % | ||||||||||
Main Fund IV - Co-Investments | 2010 | € | 1,475.0 | € | 1,309.6 | € | 3,436.7 | 2.6x | 24 | % | 22 | % | ||||||||||
Main Fund V - Co-Investments | 2012 | € | 1,122.2 | € | 1,000.8 | € | 2,402.5 | 2.4x | 34 | % | 31 | % | ||||||||||
Main Fund VI - Co-Investments | 2014 | € | 1,114.6 | € | 907.0 | € | 1,372.3 | 1.5x | 25 | % | 22 | % | ||||||||||
Main Fund II - Mezzanine Investments | 2004 | € | 700.0 | € | 739.0 | € | 1,018.0 | 1.4x | 8 | % | 7 | % | ||||||||||
Main Fund III - Mezzanine Investments | 2006 | € | 2,000.0 | € | 1,905.8 | € | 2,583.3 | 1.4x | 10 | % | 9 | % | ||||||||||
All Other Funds (22) | Various | € | 1,945.0 | € | 2,697.6 | 1.4x | 14 | % | 11 | % | ||||||||||||
Total Fully Committed Funds | € | 51,264.6 | € | 82,103.3 | 1.6x | 13 | % | 12 | % | |||||||||||||
Funds in the Commitment Period (18) | ||||||||||||||||||||||
Main Fund VI - Secondary Investments | 2017 | € | 4,263.5 | € | 668.9 | € | 769.0 | 1.1x | NM | NM | ||||||||||||
Main Fund VII - Co-Investments | 2017 | € | 2,442.5 | € | 288.7 | € | 290.2 | 1.0x | NM | NM | ||||||||||||
All Other Funds (22) | Various | € | 667.5 | € | 868.9 | 1.3x | 21 | % | 17 | % | ||||||||||||
Total Funds in the Commitment Period | € | 1,625.1 | € | 1,928.1 | 1.2x | 22 | % | 14 | % | |||||||||||||
TOTAL ALPINVEST | € | 52,889.7 | € | 84,031.4 | 1.6x | 13 | % | 12 | % | |||||||||||||
TOTAL ALPINVEST (USD) (23) | $ | 63,577.0 | $ | 101,011.4 | 1.6x | |||||||||||||||||
Metropolitan Real Estate | ||||||||||||||||||||||
Fully Committed Funds (18) | Various | $ | 2,978.4 | $ | 3,826.2 | 1.3x | 7 | % | 4 | % | ||||||||||||
Funds in the Commitment Period (18) | Various | $ | 110.6 | $ | 123.6 | 1.1x | NM | NM | ||||||||||||||
TOTAL METROPOLITAN REAL ESTATE | $ | 3,089.0 | $ | 3,949.8 | 1.3x | 7 | % | 4 | % | |||||||||||||
(1) The data presented herein that provides “inception to date” performance results of our segments relates to the period following the formation of the first fund within each segment. For our Corporate Private Equity segment our first fund was formed in 1990. For our Real Assets segment our first fund was formed in 1997.
(2) Represents the original cost of all capital called for investments since inception of the fund.
(3) Represents all realized proceeds combined with remaining fair value, before management fees, expenses and carried interest.
(4) Multiple of invested capital (“MOIC”) represents total fair value, before management fees, expenses and carried interest, divided by cumulative invested capital.
(5) An investment is considered realized when the investment fund has completely exited, and ceases to own an interest in, the investment. An investment is considered partially realized when the total amount of proceeds received in respect of such investment, including dividends, interest or other distributions and/or return of capital, represents at least 85% of invested capital and such investment is not yet fully realized. Because part of our value creation strategy involves pursuing best exit alternatives, we believe information regarding Realized/Partially Realized MOIC and Gross IRR, when considered together with the other investment performance metrics presented, provides investors with meaningful information regarding our investment performance by removing the impact of investments where significant realization activity has not yet occurred. Realized/Partially Realized MOIC and Gross IRR have limitations as measures of investment performance, and should not be considered in isolation. Such limitations include the fact that these measures do not include the performance of earlier stage and other investments that do not satisfy the criteria provided above. The exclusion of such investments will have a positive impact on Realized/Partially Realized MOIC and Gross IRR in instances when the MOIC and Gross IRR in respect of such investments are less than the aggregate MOIC and
Page | 27
Gross IRR. Our measurements of Realized/Partially Realized MOIC and Gross IRR may not be comparable to those of other companies that use similarly titled measures. We do not present Realized/Partially Realized performance information separately for funds that are still in the investment period because of the relatively insignificant level of realizations for funds of this type. However, to the extent such funds have had realizations, they are included in the Realized/Partially Realized performance information presented for Total Corporate Private Equity and Total Real Assets.
(6) Fully Invested funds are past the expiration date of the investment period as defined in the respective limited partnership agreement. In instances where a successor fund has had its first capital call, the predecessor fund is categorized as fully invested.
(7) Gross Internal Rate of Return (“Gross IRR”) represents the annualized IRR for the period indicated on Limited Partner invested capital based on contributions, distributions and unrealized value before management fees, expenses and carried interest.
(8) Net Internal Rate of Return (“Net IRR”) represents the annualized IRR for the period indicated on Limited Partner invested capital based on contributions, distributions and unrealized value after management fees, expenses and carried interest. Fund level IRRs are based on aggregate Limited Partner cash flows, and this blended return may differ from that of individual Limited Partners. As a result, certain funds may generate accrued performance fees with a blended Net IRR that is below the preferred return hurdle for that fund.
(9) Aggregate includes the following funds: CP I, CMG, CVP I, CVP II, CUSGF III, CEVP, CETP I, CAVP I, CAVP II, CAGP III, CSABF, Mexico, CBPF, and MENA.
(10) Includes co-investments and certain other stand-alone investments arranged by us.
(11) Aggregate, which is considered not meaningful, includes the following funds and their respective commencement dates: CSSAF (April 2012) , CPF I (June 2012), CCI (December 2012), CETP III (May 2014), CAGP V (May 2016), and CBPF II (November 2017).
(12) For funds marked “NM,” IRR may be positive or negative, but is not considered meaningful because of the limited time since initial investment and early stage of capital deployment. For funds marked “Neg,” IRR is negative as of reporting period end.
(13) For purposes of aggregation, funds that report in foreign currency have been converted to U.S. dollars at the reporting period spot rate.
(14) Aggregate includes the following funds: CRP I, CRP II, CAREP I, CAREP II, CRCP I, CPOCP, Renew I and Energy I.
(15) Aggregate includes NGP GAP and CCR. Return is not considered meaningful, as the investment period commenced in December 2013 for NGP GAP and October 2016 for CCR.
(16) Aggregate includes the following funds: CMP I, CMP II, CSP I, and CASCOF.
(17) Represents the original cost of investments net of investment level recallable proceeds which is adjusted to reflect recyclability of invested capital for the purpose of calculating the fund MOIC.
(18) Fully Committed funds are past the expiration date of the commitment period as defined in the respective limited partnership agreement.
(19) Includes private equity and mezzanine primary fund investments, secondary fund investments and co-investments originated by the AlpInvest team, as well as real estate primary fund investments, secondary fund investments and co-investments originated by the Metropolitan Real Estate team. Excluded from the performance information shown are a) investments that were not originated by AlpInvest, and b) Direct Investments, which was spun off from AlpInvest in 2005 and c) LP co-investment vehicles. As of December 31, 2017, these excluded investments represent $0.3 billion of AUM at AlpInvest.
(20) To exclude the impact of FX, all AlpInvest foreign currency cash flows have been converted to Euro at the reporting period spot rate.
(21) Gross Internal Rate of Return (“Gross IRR”) represents the annualized IRR for the period indicated on Limited Partner invested capital based on investment contributions, distributions and unrealized value of the underlying investments, before management fees, expenses and carried interest at the AlpInvest/Metropolitan Real Estate level.
(22) Aggregate includes Main Fund VII - Fund Investments, Main Fund VIII - Fund Investments, Main Fund I - Co-Investments, Main Fund I - Mezzanine Investments, Main Fund IV - Mezzanine Investments, Main Fund V - Mezzanine Investments, AlpInvest CleanTech Funds and funds which are not included as part of a main fund.
(23) Represents the U.S. dollar equivalent balance translated at the spot rate as of period end.
Page | 28
Remaining Fair Value Analysis
Remaining Fair Value (1) | Unrealized MOIC (2) | Total MOIC (3) | % Invested (4) | In Accrued Carry/ (Giveback) (5) | LTM Realized Carry/ (Giveback) (6) | Catch-up Rate | Fee Initiation Date (7) | Quarters Since Fee Initiation | Original Investment Period End Date | |||
As of December 31, 2017 | ||||||||||||
Corporate Private Equity | (Reported in Local Currency, in Millions) | |||||||||||
CP VI | $ | 13,613.2 | 1.3x | 1.4x | 90% | X | 100% | Jun-13 | 19 | May-18 | ||
CAP IV | $ | 4,683.3 | 1.6x | 1.6x | 82% | X | 100% | Jul-13 | 18 | Nov-18 | ||
CEP IV | € | 3,246.1 | 1.2x | 1.2x | 84% | X | 100% | Sep-14 | 14 | Aug-19 | ||
CGP | $ | 2,782.8 | 1.0x | 1.0x | 74% | 100% | Jan-15 | 12 | Dec-20 | |||
CP V | $ | 2,672.7 | 0.7x | 2.1x | 96% | X | X | 100% | Jun-07 | 43 | May-13 | |
CEP III | € | 1,398.2 | 1.6x | 2.3x | 97% | X | X | 100% | Jul-07 | 42 | Dec-12 | |
CEOF II | $ | 1,220.3 | 1.1x | 1.2x | 48% | 80% | Nov-15 | 9 | Mar-21 | |||
CAP III | $ | 1,203.7 | 2.0x | 1.9x | 100% | X | X | 100% | Jun-08 | 39 | May-14 | |
CGFSP II | $ | 885.4 | 1.4x | 1.5x | 90% | X | 100% | Jun-13 | 19 | Dec-17 | ||
CEOF I | $ | 765.9 | 0.9x | 1.3x | 104% | X | 80% | Sep-11 | 26 | May-17 | ||
CJP III | ¥ | 78,171.1 | 1.6x | 1.8x | 50% | X | 100% | Sep-13 | 18 | Feb-20 | ||
CAGP IV | $ | 515.8 | 1.2x | 1.5x | 92% | 100% | Aug-08 | 38 | Jun-14 | |||
CGFSP I | $ | 210.6 | 1.2x | 2.3x | 98% | X | X | 100% | Oct-08 | 37 | Sep-14 | |
CJP II | ¥ | 21,555.0 | 1.4x | 1.5x | 86% | 80% | Oct-06 | 45 | Jul-12 | |||
CP IV | $ | 187.1 | 2.0x | 2.4x | 97% | X | X | 80% | Apr-05 | 51 | Dec-10 | |
CETP II | € | 111.5 | 0.7x | 2.9x | 84% | X | X | 100% | Jan-08 | 40 | Jul-13 | |
All Other Funds (8) | $ | 2,669.5 | 1.2x | 2.1x | NM | NM | ||||||
Coinvestment and Other (9) | $ | 4,623.9 | 1.2x | 2.3x | NM | NM | ||||||
Total Corporate Private Equity (12) | $ | 42,636.8 | 1.2x | 1.9x | ||||||||
Real Assets | ||||||||||||
NGP XI | $ | 4,684.7 | 1.4x | 1.4x | 69% | X | 80% | Feb-15 | 12 | Oct-19 | ||
CRP VII | $ | 3,625.0 | 1.3x | 1.3x | 77% | X | 80% | Jun-14 | 15 | Mar-19 | ||
Energy IV | $ | 2,820.6 | 1.0x | 1.3x | 104% | (X) | 80% | Feb-08 | 40 | Dec-13 | ||
NGP X | $ | 1,788.2 | 1.0x | 1.3x | 91% | 80% | Jan-12 | 24 | May-17 | |||
Renew II | $ | 1,708.6 | 0.8x | 1.5x | 82% | (X) | 80% | Mar-08 | 40 | May-14 | ||
CIEP I | $ | 1,428.2 | 1.5x | 1.5x | 40% | X | 80% | Oct-13 | 17 | Sep-19 | ||
CRP V | $ | 1,323.8 | 2.1x | 1.7x | 114% | X | 50% | Nov-06 | 45 | Nov-11 | ||
CPI | $ | 928.2 | 1.1x | 1.1x | n/a | X | 50% | May-16 | 7 | Apr-21 | ||
CRP VI | $ | 772.7 | 1.3x | 1.8x | 95% | X | X | 50% | Mar-11 | 28 | Mar-16 | |
CRP IV | $ | 626.7 | 3.6x | 1.6x | 135% | 50% | Jan-05 | 52 | Dec-09 | |||
CPP II | $ | 590.6 | 1.1x | 1.1x | 42% | 80% | Sep-14 | 14 | Apr-21 | |||
CRP III | $ | 464.5 | 140.3x | 3.5x | 93% | X | X | 50% | Mar-01 | 68 | May-05 | |
CEREP III | € | 233.0 | 0.7x | 1.2x | 91% | 67% | Jun-07 | 43 | May-11 | |||
Energy III | $ | 264.7 | 0.3x | 1.5x | 94% | (X) | 80% | Nov-05 | 49 | Oct-11 | ||
NGP XII | $ | 241.0 | 1.0x | 1.0x | 9% | 80% | Nov-17 | 1 | Oct-19 | |||
CRP VIII | $ | 222.5 | 1.0x | 1.0x | 5% | 80% | Aug-17 | 2 | May-22 | |||
All Other Funds (10) | $ | 664.6 | 0.7x | 1.3x | NM | NM | ||||||
Coinvestment and Other (9) | $ | 2,490.8 | 1.1x | 1.6x | NM | NM | ||||||
Total Real Assets (12) | $ | 24,925.6 | 1.2x | 1.4x | ||||||||
Global Credit | ||||||||||||
CEMOF II | $ | 892.4 | 1.0x | 1.1x | 31% | 100% | Dec-15 | 9 | Feb-20 | |||
CEMOF I | $ | 859.2 | 0.6x | 0.9x | 116% | 100% | Dec-10 | 29 | Dec-15 | |||
CSP IV | $ | 633.6 | 1.1x | 1.2x | 26% | X | 100% | Feb-17 | 4 | Jun-20 | ||
CSP III | $ | 324.8 | 1.1x | 1.7x | 100% | X | X | 80% | Dec-11 | 25 | Aug-15 | |
All Other Funds (11) | $ | 366.1 | 0.9x | 1.6x | NM | NM | ||||||
Coinvestment and Other (9) | $ | 797.4 | 0.8x | 1.0x | NM | NM | ||||||
Total Global Credit | $ | 3,873.5 | 0.8x | 1.3x | ||||||||
Page | 29
Remaining Fair Value Analysis, Notes
(1) Remaining Fair Value reflects the unrealized carrying value of investments for Corporate Private Equity, Real Assets and Global Credit carry funds and related co-investment vehicles. Significant funds with remaining fair value of greater than $100 million are listed individually.
(2) Unrealized multiple of invested capital (“MOIC”) represents remaining fair market value, before management fees, expenses and carried interest, divided by investment cost.
(3) Total MOIC represents total fair value, before management fees, expenses and carried interest, divided by cumulative invested capital. For certain funds, represents the original cost of investments net of investment-level recallable proceeds, which is adjusted to reflect recyclability of invested capital for the purpose of calculating the fund MOIC.
(4) Represents cumulative equity invested as of the reporting period divided by total commitments. Amount can be greater than 100% due to the re-investment of recallable distributions to fund investors.
(5) Fund has accrued carry/(giveback) as of the reporting period.
(6) Fund has realized carry in the last twelve months.
(7) Represents the date of the first capital contribution for management fees.
(8) Aggregate includes the following funds: CMG, CP I, CP II, CP III, CEP I, CEP II, CAP I, CAP II, CBPF, CBPF II, CJP I, CEVP, CETP I, CETP III, CCI, CAVP I, CAVP II, CAGP III, CAGP V, Mexico, MENA, CSABF, CSSAF, CPF, CVP I, CVP II, and CUSGF III. In Accrued Carry/(Clawback) and LTM Realized Carry not indicated because the indicator does not apply to each fund within the aggregate.
(9) Includes co-investments, prefund investments and certain other stand-alone investments arranged by us. In Accrued Carry/(Giveback) and LTM Realized Carry not indicated because the indicator does not apply to each fund within the aggregate.
(10) Aggregate includes the following funds: CRP I, CRP II, CRCP I, CEREP I, CEREP II, CAREP I, CAREP II, CCR, CPOCP, CGIOF, NGP GAP, Energy I, Energy II and Renew I. In Accrued Carry/(Clawback) and LTM Realized Carry not indicated because the indicator does not apply to each fund within the aggregate.
(11) Aggregate includes the following funds: CSP I, CSP II, CMP I, CMP II, CSC, CCOF, and CASCOF. In Accrued Carry/(Clawback) and LTM Realized Carry not indicated because the indicator does not apply to each fund within the aggregate.
(12) For purposes of aggregation, funds that report in foreign currency have been converted to U.S. dollars at the reporting period spot rate.
Page | 30
Largest Publicly Traded Positions in Carry Funds (1)
Rank | Largest Publicly Traded Equity Positions | Fund(s) | Q4 2017 Value (2,3) | ||
1 | CoreSite Realty Corporation | CRP III, CRP IV, CRP V | $ | 1,582,516,803 | |
2 | Focus Media Information Technology Co., Ltd. | CAP III | 1,350,958,023 | ||
3 | PNB Housing Finance Limited | CAP IV | 1,211,450,697 | ||
4 | WildHorse Resource Development Corp. | NGP X(4), NGP XI (4) | 999,400,000 | ||
5 | Enviva Partners, LP | RENEW II | 919,242,330 | ||
6 | China Literature Limited | CAP IV | 727,016,932 | ||
7 | Pattern Energy Group Holdings, L.P. | RENEW II | 711,500,000 | ||
8 | USA Compression | ENERGY IV | 467,372,580 | ||
9 | Centennial Resource Development, Inc. | CP VI, NGP X (4) | 238,852,845 | ||
10 | Wesco Holdings, Inc. | CP IV | 170,916,929 | ||
Top 10 Positions | 8,379,227,139 | ||||
Total Public Equity Portfolio (carry fund only) | 9,659,216,008 | ||||
% of public portfolio in top 10 positions | 87 | % | |||
(1) Excludes Investment Solutions carry funds
(2) Figures represent gross investment results, inclusive of Carlyle-sponsored coinvestments. May include portion of private business in value.
(3) In U.S. dollars, or converted to U.S. dollars at the prevailing exchange rate on the last day of the fiscal period.
Note: Includes all classes of shares irrespective of trading status.
(4) These funds are advised by NGP, which is a separately registered investment adviser.
Page | 31
Reconciliation for Total Segment Information (Unaudited)
Three Months Ended December 31, 2016 | ||||||||||||||||||
Total Reportable Segments | Consolidated Funds | Reconciling Items | Carlyle Consolidated | |||||||||||||||
(Dollars in millions) | ||||||||||||||||||
Revenues | $ | 435.5 | $ | 59.1 | $ | 81.3 | (a) | $ | 575.9 | |||||||||
Expenses | $ | 429.9 | $ | 47.2 | $ | 96.9 | (b) | $ | 574.0 | |||||||||
Other income | $ | — | $ | 10.0 | $ | — | (c) | $ | 10.0 | |||||||||
Economic income (loss) | $ | 5.6 | $ | 21.9 | $ | (15.6 | ) | (d) | $ | 11.9 | (1) | |||||||
Three Months Ended March 31, 2017 | ||||||||||||||||||
Total Reportable Segments | Consolidated Funds | Reconciling Items | Carlyle Consolidated | |||||||||||||||
(Dollars in millions) | ||||||||||||||||||
Revenues | $ | 1,001.2 | $ | 42.9 | $ | 76.0 | (a) | $ | 1,120.1 | |||||||||
Expenses | $ | 601.1 | $ | 53.0 | $ | 155.4 | (b) | $ | 809.5 | |||||||||
Other income | $ | — | $ | 17.1 | $ | — | (c) | $ | 17.1 | |||||||||
Economic income (loss) | $ | 400.1 | $ | 7.0 | $ | (79.4 | ) | (d) | $ | 327.7 | (1) | |||||||
Three Months Ended June 30, 2017 | ||||||||||||||||||
Total Reportable Segments | Consolidated Funds | Reconciling Items | Carlyle Consolidated | |||||||||||||||
(Dollars in millions) | ||||||||||||||||||
Revenues | $ | 859.0 | $ | 45.0 | $ | 4.4 | (a) | $ | 908.4 | |||||||||
Expenses | $ | 558.9 | $ | 91.9 | $ | 54.6 | (b) | $ | 705.4 | |||||||||
Other income | $ | — | $ | 40.7 | $ | — | (c) | $ | 40.7 | |||||||||
Economic income (loss) | $ | 300.1 | $ | (6.2 | ) | $ | (50.2 | ) | (d) | $ | 243.7 | (1) | ||||||
Three Months Ended September 30, 2017 | ||||||||||||||||||
Total Reportable Segments | Consolidated Funds | Reconciling Items | Carlyle Consolidated | |||||||||||||||
(Dollars in millions) | ||||||||||||||||||
Revenues | $ | 547.5 | $ | 44.7 | $ | 47.7 | (a) | $ | 639.9 | |||||||||
Expenses | $ | 344.8 | $ | 52.3 | $ | 95.5 | (b) | $ | 492.6 | |||||||||
Other income | $ | — | $ | 18.6 | $ | — | (c) | $ | 18.6 | |||||||||
Economic income (loss) | $ | 202.7 | $ | 11.0 | $ | (47.8 | ) | (d) | $ | 165.9 | (1) | |||||||
Three Months Ended December 31, 2017 | ||||||||||||||||||
Total Reportable Segments | Consolidated Funds | Reconciling Items | Carlyle Consolidated | |||||||||||||||
(Dollars in millions) | ||||||||||||||||||
Revenues | $ | 971.1 | $ | 45.1 | $ | (8.4 | ) | (a) | $ | 1,007.8 | ||||||||
Expenses | $ | 604.7 | $ | 43.2 | $ | (23.1 | ) | (b) | $ | 624.8 | ||||||||
Other income | $ | — | $ | 47.1 | $ | (35.1 | ) | (c) | $ | 12.0 | ||||||||
Economic income (loss) | $ | 366.4 | $ | 49.0 | $ | (20.4 | ) | (d) | $ | 395.0 | (1) | |||||||
(1) The amount in the "Carlyle Consolidated" column is income before provision for income taxes, which is the GAAP measure that is most directly comparable to Economic Income (Loss).
Page | 32
Reconciliation for Total Segment Information, cont. (Unaudited)
(a) | The Revenues adjustment principally represents fund management and performance fees earned from the Consolidated Funds that were eliminated in consolidation to arrive at Carlyle’s total revenues, adjustments for amounts attributable to non-controlling interests in consolidated entities, adjustments related to expenses associated with the investments in NGP Management and its affiliates that are included in operating captions or are excluded from the segment results, adjustments to reflect Carlyle’s share of Urbplan’s net losses as a component of investment income until Urbplan was deconsolidated during 2017, the inclusion of tax expenses associated with certain performance fees, and adjustments to reflect Carlyle’s ownership interests in Claren Road (through January 2017) and ESG (through June 2016) that were included in Revenues in the Partnership’s segment reporting. |
(b) | The Expense adjustment represents the elimination of intercompany expenses of the Consolidated Funds payable to Carlyle, the inclusion of certain tax expenses associated with performance fee compensation, adjustments related to expenses associated with the investment in NGP management that are included in operating captions, adjustments to reflect Carlyle’s share of Urbplan’s net losses as a component of investment income until Urbplan was deconsolidated during 2017, changes in the tax receivable agreement liability, charges and credits associated with Carlyle corporate actions and non-recurring items and adjustments to reflect Carlyle’s economic interests in Claren Road (through January 2017) and ESG (through June 2016), as detailed below: |
Three Months Ended | ||||||||||||||||||||
Dec 31, 2016 | Mar 31, 2017 | Jun 30, 2017 | Sep 30, 2017 | Dec 31, 2017 | ||||||||||||||||
(Dollars in millions) | ||||||||||||||||||||
Equity-based compensation issued in conjunction with the initial public offering, acquisitions and strategic investments | $ | 48.1 | $ | 67.0 | $ | 58.5 | $ | 58.3 | $ | 57.4 | ||||||||||
Acquisition related charges, including amortization of intangibles and impairment | 27.2 | 8.8 | 9.2 | 7.2 | 10.5 | |||||||||||||||
Other non-operating expense (income) | (12.0 | ) | — | 0.1 | — | (71.5 | ) | |||||||||||||
Tax (expense) benefit associated with performance fee compensation | 1.0 | (2.9 | ) | (2.4 | ) | (1.7 | ) | (2.2 | ) | |||||||||||
Non-Carlyle economic interests in acquired business | 38.3 | 87.5 | (4.9 | ) | 46.2 | (13.1 | ) | |||||||||||||
Severance and other adjustments | 0.3 | 2.8 | 7.5 | 0.6 | 2.3 | |||||||||||||||
Elimination of expenses of Consolidated Funds | (6.0 | ) | (7.8 | ) | (13.4 | ) | (15.1 | ) | (6.5 | ) | ||||||||||
$ | 96.9 | $ | 155.4 | $ | 54.6 | $ | 95.5 | $ | (23.1 | ) | ||||||||||
(c) | The Other Income (Loss) adjustment results from the Consolidated Funds which were eliminated in consolidation to arrive at Carlyle’s total Other Income (Loss). |
Page | 33
(d) | Reconciliation for Economic Income and Distributable Earnings (Unaudited) |
Three Months Ended | Year Ended | |||||||||||||||||||||||||||
Dec 31, 2016 | Mar 31, 2017 | Jun 30, 2017 | Sep 30, 2017 | Dec 31, 2017 | Dec 31, 2016 | Dec 31, 2017 | ||||||||||||||||||||||
(Dollars in millions) | ||||||||||||||||||||||||||||
Income before provision for income taxes | $ | 11.9 | $ | 327.7 | $ | 243.7 | $ | 165.9 | $ | 395.0 | $ | 45.3 | $ | 1,132.3 | ||||||||||||||
Adjustments: | ||||||||||||||||||||||||||||
Equity-based compensation issued in conjunction with the initial public offering, acquisitions and strategic investments | 48.1 | 67.0 | 58.5 | 58.3 | 57.4 | 223.4 | 241.2 | |||||||||||||||||||||
Acquisition related charges, including amortization of intangibles and impairment | 27.2 | 8.8 | 9.2 | 7.2 | 10.5 | 94.2 | 35.7 | |||||||||||||||||||||
Other non-operating expense (income)1 | (12.0 | ) | — | 0.1 | — | (71.5 | ) | (11.2 | ) | (71.4 | ) | |||||||||||||||||
Tax (expense) benefit associated with performance fees | 1.0 | (2.9 | ) | (2.4 | ) | (1.7 | ) | (2.2 | ) | (15.1 | ) | (9.2 | ) | |||||||||||||||
Net (income) loss attributable to non-controlling interests in consolidated entities | (70.8 | ) | (3.3 | ) | (16.5 | ) | (27.6 | ) | (25.1 | ) | (41.0 | ) | (72.5 | ) | ||||||||||||||
Severance and other adjustments | 0.2 | 2.8 | 7.5 | 0.6 | 2.3 | 10.3 | 13.2 | |||||||||||||||||||||
Economic Income | $ | 5.6 | $ | 400.1 | $ | 300.1 | $ | 202.7 | $ | 366.4 | $ | 305.9 | $ | 1,269.3 | ||||||||||||||
Net performance fees | 60.7 | 394.1 | 299.4 | 147.0 | 337.3 | 393.7 | 1,177.8 | |||||||||||||||||||||
Investment income (loss) | 14.5 | 10.6 | 31.2 | (35.3 | ) | 40.7 | 50.3 | 47.2 | ||||||||||||||||||||
Equity-based compensation | 24.4 | 30.1 | 36.7 | 30.4 | 26.7 | 119.6 | 123.9 | |||||||||||||||||||||
Net Interest | 12.8 | 11.6 | 14.0 | 11.6 | 11.6 | 51.1 | 48.8 | |||||||||||||||||||||
Reserve for Litigation and Contingencies | (100.0 | ) | — | — | (25.0 | ) | — | — | (25.0 | ) | ||||||||||||||||||
Fee Related Earnings | $ | (132.4 | ) | $ | 37.1 | $ | 20.2 | $ | 108.0 | $ | 26.7 | $ | 32.6 | $ | 192.0 | |||||||||||||
Realized performance fees, net of related compensation | 135.6 | 35.3 | 182.1 | 216.9 | 118.3 | 625.3 | 552.6 | |||||||||||||||||||||
Realized investment income (loss) | 17.0 | (5.4 | ) | 10.6 | (53.4 | ) | 22.4 | 44.9 | (25.8 | ) | ||||||||||||||||||
Net Interest | (12.8 | ) | (11.6 | ) | (14.0 | ) | (11.6 | ) | (11.6 | ) | (51.1 | ) | (48.8 | ) | ||||||||||||||
Distributable Earnings | $ | 7.4 | $ | 55.4 | $ | 198.9 | $ | 259.9 | $ | 155.8 | $ | 651.7 | $ | 670.0 | ||||||||||||||
1) Included in other non-operating expense (income) for the three months and year ended December 31, 2017 is a $71.5 million adjustment for the revaluation of the tax receivable agreement liability as a result of the passage of the Tax Cuts and Jobs Act of 2017.
Page | 34
Reconciliation for Economic Income and Distributable Earnings, cont.
(Unaudited)
Three Months Ended | Year Ended | |||||||
Dec 31, 2017 | Dec 31, 2017 | |||||||
(Dollars in millions, except unit and per unit amounts) | ||||||||
Economic Income | $ | 366.4 | $ | 1,269.3 | ||||
Less (Add): Provision (Benefit) for Income Taxes | 13.2 | 84.4 | ||||||
Less: Preferred unit distributions | $ | 6.0 | $ | 6.0 | ||||
Economic Net Income | $ | 347.2 | $ | 1,178.9 | ||||
Economic Net Income per Adjusted Unit(1) | $ | 1.01 | $ | 3.47 | ||||
Distributable Earnings | $ | 155.8 | $ | 670.0 | ||||
Less: Estimated foreign, state, and local taxes | 5.0 | 22.8 | ||||||
Less: Preferred unit distributions | 6.0 | 6.0 | ||||||
Distributable Earnings, After Taxes and Preferred Unit Distributions | $ | 144.8 | $ | 641.2 | ||||
Distributable Earnings to The Carlyle Group L.P. | $ | 43.3 | $ | 186.6 | ||||
(Add) / Less: Estimated current corporate income taxes and TRA payments | (0.5 | ) | 4.2 | |||||
Distributable Earnings Attributable to Common Unitholders | $ | 43.8 | $ | 182.4 | ||||
Distributable Earnings, net, per The Carlyle Group L.P. common unit outstanding(2) | 0.44 | $ | 1.88 | |||||
(1) Adjusted Units were determined as follows: | ||||||||
The Carlyle Group L.P. common units outstanding | 100,100,650 | 100,100,650 | ||||||
Carlyle Holdings partnership units not held by The Carlyle Group L.P. | 234,813,858 | 234,813,858 | ||||||
Dilutive effect of unvested deferred restricted common units | 8,015,178 | 7,347,645 | ||||||
Issuable Carlyle Holdings partnership units | 597,944 | 597,944 | ||||||
Total Adjusted Units | 343,527,630 | 342,860,097 | ||||||
(2) | As of December 31, 2017, there were 100,100,650 outstanding common units of The Carlyle Group L.P. In February 2018, an additional estimated 372,864 common units were issued in connection with the vesting of deferred restricted common units. For purposes of this calculation, these common units have been added to the common units outstanding as of December 31, 2017 because they will be eligible to participate in the unitholder distribution that will be paid in February 2018. The resulting total common units outstanding used for this calculation are 100,473,514. |
Page | 35
The Carlyle Group L.P.
GAAP Balance Sheet (Unaudited)
As of December 31, 2017 | ||||||||||||||||
Consolidated Operating Entities | Consolidated Funds | Eliminations | Consolidated | |||||||||||||
(Dollars in millions) | ||||||||||||||||
Assets | ||||||||||||||||
Cash and cash equivalents | $ | 1,000.1 | $ | — | $ | — | $ | 1,000.1 | ||||||||
Cash and cash equivalents held at Consolidated Funds | — | 377.6 | — | 377.6 | ||||||||||||
Restricted cash | 28.7 | — | — | 28.7 | ||||||||||||
Corporate treasury investments | 376.3 | — | — | 376.3 | ||||||||||||
Accrued performance fees | 3,670.6 | — | — | 3,670.6 | ||||||||||||
Investments | 1,844.2 | — | (219.9 | ) | 1,624.3 | |||||||||||
Investments of Consolidated Funds | — | 4,534.3 | — | 4,534.3 | ||||||||||||
Due from affiliates and other receivables, net | 262.4 | — | (5.3 | ) | 257.1 | |||||||||||
Due from affiliates and other receivables of Consolidated Funds, net | — | 50.8 | — | 50.8 | ||||||||||||
Fixed assets, net | 100.4 | — | — | 100.4 | ||||||||||||
Deposits and other | 54.1 | — | — | 54.1 | ||||||||||||
Intangible assets, net | 35.9 | — | — | 35.9 | ||||||||||||
Deferred tax assets | 170.4 | — | — | 170.4 | ||||||||||||
Total assets | $ | 7,543.1 | $ | 4,962.7 | $ | (225.2 | ) | $ | 12,280.6 | |||||||
Liabilities and partners’ capital | ||||||||||||||||
Debt obligations | $ | 1,573.6 | $ | — | $ | — | $ | 1,573.6 | ||||||||
Loans payable of Consolidated Funds | — | 4,303.8 | — | 4,303.8 | ||||||||||||
Accounts payable, accrued expenses and other liabilities | 355.1 | — | — | 355.1 | ||||||||||||
Accrued compensation and benefits | 2,222.6 | — | — | 2,222.6 | ||||||||||||
Due to affiliates | 229.9 | — | — | 229.9 | ||||||||||||
Deferred revenue | 82.1 | — | — | 82.1 | ||||||||||||
Deferred tax liabilities | 75.6 | — | — | 75.6 | ||||||||||||
Other liabilities of Consolidated Funds | — | 422.1 | — | 422.1 | ||||||||||||
Accrued giveback obligations | 66.8 | — | — | 66.8 | ||||||||||||
Total liabilities | 4,605.7 | 4,725.9 | — | 9,331.6 | ||||||||||||
Total partners’ capital | 2,937.4 | 236.8 | (225.2 | ) | 2,949.0 | |||||||||||
Total liabilities and partners’ capital | $ | 7,543.1 | $ | 4,962.7 | $ | (225.2 | ) | $ | 12,280.6 | |||||||
Page | 36
The Carlyle Group L.P.
Non-GAAP Financial Information and Other Key Terms
Non-GAAP Financial Information
Carlyle discloses in this press release the following financial measures that are calculated and presented on the basis of methodologies other than in accordance with generally accepted accounting principles in the United States of America:
• | Economic Income or “EI,” represents segment net income which includes certain tax expense associated with performance fees and excludes the impact of all other income taxes, changes in the tax receivable agreement liability, acquisition-related items including amortization and impairment of acquired intangibles and contingent consideration taking the form of earn-outs, charges associated with equity-based compensation issued in Carlyle’s initial public offering or in acquisitions or strategic investments, corporate actions and infrequently occurring or unusual events. Carlyle believes the inclusion or exclusion of these items provides investors with a meaningful indication of its core operating performance. For segment reporting purposes, revenues and expenses, and accordingly segment net income, are presented on a basis that deconsolidates certain Carlyle funds, related co-investment entities and collateralized loan obligations (“CLOs”) (referred to collectively as the “Consolidated Funds”) that Carlyle consolidates in its consolidated financial statements pursuant to U.S. GAAP. Total Segment EI equals the aggregate of EI for all segments. Carlyle believes that reporting EI is helpful to understanding its business and that investors should review the same supplemental financial measure that management uses to analyze its segment performance. |
• | Fee Related Earnings or “FRE,” is a component of EI and is used to assess the ability of the business to cover base compensation and operating expenses from fee revenues other than performance fees. FRE differs from income (loss) before provision for income taxes computed in accordance with U.S. GAAP in that it adjusts for the items included in the calculation of EI and also adjusts EI to exclude net performance fees, investment income (loss), from investments in Carlyle funds, equity-based compensation, net interest and certain general, administrative and other expenses when the timing of any future payment is uncertain. FRE is reported as part of Carlyle’s segment results. |
• | Distributable Earnings or “DE,” is FRE plus realized net performance fees and realized investment income (loss), and is used to assess performance and amounts potentially available for distribution from Carlyle Holdings to its unitholders. DE is intended to show the amount of net realized earnings without the effects of Consolidated Funds. DE is evaluated regularly by management in making resource deployment and compensation decisions across our four reportable segments. Management also uses DE in our budgeting, forecasting, and the overall management of our segments. DE is reported as part of Carlyle's segment results. |
Income before provision for income taxes is the GAAP financial measure most comparable to Economic Income, Fee Related Earnings, and Distributable Earnings. Reconciliations of these non-GAAP financial measures to income before provision for income taxes are included within this press release. These non-GAAP financial measures should be considered in addition to and not as a substitute for, or superior to, financial measures presented in accordance with U.S. GAAP.
Page | 37
Other Key Terms
“Assets under management” or “AUM” refers to the assets we manage or advise. Our AUM equals the sum of the following:
(a) the aggregate fair value of our carry funds and related co-investment vehicles, NGP management fee funds and separately managed accounts, plus the capital that Carlyle is entitled to call from investors in those funds and vehicles (including Carlyle commitments to those funds and vehicles and those of senior Carlyle professionals and employees) pursuant to the terms of their capital commitments to those funds and vehicles;
(b) | the amount of aggregate collateral balance and principal cash at par or aggregate principal amount of the notes of our CLOs and other structured products (inclusive of all positions); |
(c) | the net asset value (pre-redemptions and subscriptions) of our long/short credit, emerging markets, multi-product macroeconomic, fund of hedge funds vehicles, mutual fund and other hedge funds; and |
(d) | the gross assets (including assets acquired with leverage) of our business development companies, plus the capital that Carlyle is entitled to call from investors in those vehicles pursuant to the terms of their capital commitments to those vehicles. |
AUM includes certain energy and renewable resources funds that Carlyle jointly advises with Riverstone Holdings L.L.C. (“Riverstone”) and certain NGP management fee funds and carry funds advised by NGP Energy Capital Management. Carlyle’s calculation of AUM (but not Fee Earning AUM) includes uncalled commitments to, and the fair value of invested capital in, investment funds from Carlyle and its personnel, regardless of whether such commitments or invested capital are subject to management or performance fees.
“Available capital” refers to the amount of capital commitments available to be called for investments, which may be reduced for equity invested that is funded via fund credit facility and expected to be called from investors at a later date, plus any additional assets/liabilities at the fund level other than active investments. Amounts previously called may be added back to available capital following certain distributions.
“Carlyle funds,” “our funds” and “our investment funds” refer to the investment funds and vehicles advised by Carlyle.
“Carry funds” generally refers to closed-end investment vehicles, in which commitments are drawn down over a specified investment period, and in which the general partner receives a special residual allocation of income from limited partners, which we refer to as carried interest, in the event that specified investment returns are achieved by the fund. Disclosures referring to carry funds will also include the impact of certain commitments which do not earn carried interest, but are either part of, or associated with our carry funds. The rate of carried interest, as well as the share of carried interest allocated to Carlyle, may vary across the carry fund platform. Carry funds generally include the following investment vehicles across our four business segments:
• | Corporate Private Equity (all): Buyout & growth funds advised by Carlyle |
• | Real Assets: Real estate, power, infrastructure and energy funds advised by Carlyle, as well as those energy funds advised by NGP Capital Management in which Carlyle is entitled to receive a share of carried interest |
• | Global Credit: Distressed credit, corporate mezzanine and energy credit funds, and other closed-end credit funds advised by Carlyle |
• | Investment Solutions: Funds and vehicles advised by AlpInvest Partners B.V. (“AlpInvest”) and Metropolitan Real Estate Equity Management, LLC (“Metropolitan), which include fund, secondary and co-investment strategies |
Carry funds specifically exclude those funds advised by NGP Capital Management in which Carlyle is not entitled to receive a share of carried interest (or “NGP management fee funds”), collateralized loan obligation vehicles (CLOs), business development companies, and our hedge fund platform.
“Catch-up management fees” refer to those amounts of management fees charged to fund investors in subsequent closings of a fund which apply to the time period between the fee initiation date and the subsequent closing date.
Page | 38
“Distributable Earnings Attributable to Common Unitholders” refers to The Carlyle Group L.P.'s share of Distributable Earnings, After Taxes (other than corporate income taxes attributable to The Carlyle Group L.P.) and Preferred Unit Distributions, net of corporate income taxes attributable to The Carlyle Group L.P. and amounts payable under the tax receivable agreement.
“Expired available capital” occurs when a fund has passed the investment and follow-on periods and can no longer invest capital into new or existing deals. Any remaining available capital, typically a result of either recycled distributions or specific reserves established for the follow-on period that are not drawn, can only be called for fees and expenses and is therefore removed from the total AUM calculation.
“Fee earning assets under management” or “Fee earning AUM” refers to the assets we manage or advise from which we derive recurring fund management fees. Our Fee earning AUM is generally based on one of the following, once fees have been activated:
(a) | the amount of limited partner capital commitments, generally for carry funds where the original investment period has not expired, for AlpInvest carry funds during the commitment fee period and for Metropolitan carry funds during the weighted-average investment period of the underlying funds (see “Fee earning AUM based on capital commitments” in the table below for the amount of this component at each period); |
(b) | the remaining amount of limited partner invested capital at cost, generally for carry funds and certain co-investment vehicles where the original investment period has expired and Metropolitan carry funds after the expiration of the weighted-average investment period of the underlying funds(see “Fee earning AUM based on invested capital” in the table below for the amount of this component at each period); |
(c) | the amount of aggregate fee-earning collateral balance at par of our collateralized loan obligations (“CLOs”), as defined in the fund indentures (typically exclusive of equities and defaulted positions) as of the quarterly cut-off date for each CLO (see “Fee earning AUM based on collateral balances, at par” in the table below for the amount of this component at each period); |
(d) | the external investor portion of the net asset value of our hedge fund and fund of hedge funds vehicles (pre redemptions and subscriptions), as well as certain carry funds (see “Fee earning AUM based on net asset value” in the table below for the amount of this component at each period); |
(e) | the gross assets (including assets acquired with leverage), excluding cash and cash equivalents of our business development companies and certain carry funds (see “Fee earning AUM based on lower of cost or fair value and other” in the table below for the amount of this component at each period); and |
(f) | the lower of cost or fair value of invested capital, generally for AlpInvest carry funds where the commitment fee period has expired and certain carry funds where the investment period has expired, (see “Fee earning AUM based on lower of cost or fair value and other” in the table below for the amount of this component at each period). |
Fee Earning AUM includes certain energy and renewable resources carry funds that Carlyle jointly advises with Riverstone and certain NGP management fee funds and carry funds advised by NGP Energy Capital Management. Fee Earning AUM includes only those assets which earn a material fee.
For most of our carry funds, total AUM includes the fair value of the capital invested, whereas Fee earning AUM includes the amount of capital commitments or the remaining amount of invested capital, depending on whether the original investment period for the fund has expired. As such, Fee earning AUM may be greater than total AUM when the aggregate fair value of the remaining investments is less than the cost of those investments.
“NGP management fee funds” refer to those funds advised by NGP Energy Capital Management (together with its affiliates and subsidiaries) from which we only receive management fees.
“Net accrued performance fees” refers to the accrued performance fees that are attributable to Carlyle’s unitholders. This balance is comprised of accrued performance fees less: accrued giveback obligations, accrued performance fee compensation, performance fee-related tax obligations, and accrued performance fees attributable to non-controlling
Page | 39
interests. This balance also excludes net accrued performance fees that have been realized but will be collected in subsequent periods.
“Net performance fees” refers to the performance fees from Carlyle funds and vehicles net of the portion allocated to Carlyle investment professionals (including related tax expense) which is reflected as performance fee related compensation expense.
“Performance fees” consist principally of carried interest from carry funds and incentive fees or allocations from certain Global Credit vehicles. Carlyle is generally entitled to a 20% allocation (or 10% to 20% on certain longer-dated carry funds as well as some external co-investment vehicles, or approximately 2% to 10% in the case of most of the Investment Solutions carry funds and vehicles) of the net realized income or gain as a carried interest after returning the invested capital, the allocation of preferred returns of generally 7% to 9% (or 4% to 7% for certain longer-dated carry funds) and the return of certain fund costs (subject to catch-up provisions as set forth in the fund limited partnership agreement). Carried interest revenue, which is a component of performance fees in Carlyle’s consolidated financial statements, is recognized by Carlyle upon appreciation of the valuation of the applicable funds’ investments above certain return hurdles as set forth in each respective partnership agreement and is based on the amount that would be due to Carlyle pursuant to the fund partnership agreement at each period end as if the funds were liquidated at such date.
“Realized net performance fees” refers to the realized performance fees from Carlyle funds and vehicles net of the portion allocated to Carlyle investment professionals which is reflected as realized performance fee related compensation expense, and any performance fee-related tax obligations.
“VIE” refers to a variable interest entity, as that term is defined in Accounting Standards Codification Topic 810, Consolidation.
Page | 40