Attached files
| file | filename |
|---|---|
| EX-23.3 - EX-23.3 - Cadence Bancorporation | d521048dex233.htm |
| EX-23.2 - EX-23.2 - Cadence Bancorporation | d521048dex232.htm |
| EX-5.1 - EX-5.1 - Cadence Bancorporation | d521048dex51.htm |
Table of Contents
As filed with the Securities and Exchange Commission on February 7, 2018.
Registration No. 333-222824
UNITED STATES
SECURITIES AND EXCHANGE COMMISSION
Washington, D.C. 20549
Amendment No. 1
to
FORM S-1
REGISTRATION STATEMENT
UNDER
THE SECURITIES ACT OF 1933
CADENCE BANCORPORATION
(Exact name of registrant as specified in its charter)
| Delaware | 001-38058 | 47-1329858 | ||
| (State or other jurisdiction of incorporation or organization) |
(Commission File Number) |
(I.R.S. Employer Identification Number) |
2800 Post Oak Boulevard, Suite 3800
Houston, Texas 77056
(713) 871-4000
(Address, including zip code, and telephone number, including area code, of registrant’s principal executive offices)
Valerie C. Toalson
Chief Financial Officer
Cadence Bancorporation
2800 Post Oak Boulevard, Suite 3800
Houston, Texas 77056
Telephone: (713) 871-4000
(Name, address, including zip code, and telephone number, including area code, of agent for service)
With copies to:
| David E. Shapiro, Esq. Mark F. Veblen, Esq. Wachtell, Lipton, Rosen & Katz 51 West 52nd Street New York, New York 10019 Telephone: (212) 403-1000 Facsimile: (212) 403-2000 |
Jerry W. Powell Executive Vice President and General Counsel Cadence Bancorporation 2800 Post Oak Boulevard, Suite 3800 Houston, Texas 77056 Telephone: (713) 871-4000 Facsimile: (713) 634-4930 |
Mitchell Eitel, Esq. Catherine M. Clarkin, Esq. Sullivan & Cromwell LLP 125 Broad Street New York, New York 10004 Telephone: (212) 558-4000 Facsimile: (212) 558-3588 |
Approximate date of commencement of proposed sale to the public: As soon as practicable after this Registration Statement becomes effective.
If any of the securities being registered on this Form are to be offered on a delayed or continuous basis pursuant to Rule 415 under the Securities Act of 1933, check the following box. ☐
If this Form is filed to register additional securities for an offering pursuant to Rule 462(b) under the Securities Act, check the following box and list the Securities Act registration statement number of the earlier effective registration statement for the same offering. ☐
If this Form is a post-effective amendment filed pursuant to Rule 462(c) under the Securities Act, check the following box and list the Securities Act registration statement number of the earlier effective registration statement for the same offering. ☐
If this Form is a post-effective amendment filed pursuant to Rule 462(d) under the Securities Act, check the following box and list the Securities Act registration statement number of the earlier effective registration statement for the same offering. ☐
Indicate by check mark whether the registrant is a large accelerated filer, an accelerated filer, a non-accelerated filer, or a smaller reporting company. See definitions of “large accelerated filer,” “accelerated filer,” “smaller reporting company” and “emerging growth company” in Rule 12b-2 of the Exchange Act (Check one):
| Large accelerated filer | ☐ | Accelerated filer | ☐ | |||
| Non-accelerated filer | ☒ | Smaller reporting company | ☐ | |||
| Emerging growth company | ☒ |
If an emerging growth company, indicate by check mark if the registrant has elected not to use the extended transition period for complying with any new or revised financial accounting standards provided to Section 7(a)(2)(B) of the Securities Act. ☐
CALCULATION OF REGISTRATION FEE
|
| ||||||||
| Title of Each Class of Securities to Be Registered |
Amount to be Registered(1) |
Proposed Maximum Price per Share(2) |
Proposed Maximum Aggregate Offering Price(2) |
Amount of Registration Fee | ||||
| Class A common stock, par value $0.01 per share |
8,050,000 | $28.21 |
$227,090,500 | $28,272.77(3) | ||||
|
| ||||||||
|
| ||||||||
| (1) | Includes 1,050,000 shares of Class A common stock that the underwriters have the option to purchase from the selling stockholder. |
| (2) | Estimated solely for purposes of calculating the registration fee in accordance with Rule 457(c) under the Securities Act of 1933. The price per share and aggregate offering price are based on the average of the high and low price of the registrant’s common stock on January 31, 2018, as reported on the New York Stock Exchange. |
| (3) | Previously paid. |
The Registrant hereby amends this Registration Statement on such date as may be necessary to delay its effective date until the Registrant shall file a further amendment which specifically states that this Registration Statement shall thereafter become effective in accordance with Section 8(a) of the Securities Act of 1933, or until this Registration Statement shall become effective on such date as the Securities and Exchange Commission, acting pursuant to said Section 8(a), may determine.
Table of Contents
The information in this preliminary prospectus is not complete and may be changed. The selling stockholder may not sell these securities until the Registration Statement filed with the Securities and Exchange Commission is effective. This preliminary prospectus is not an offer to sell nor does it seek an offer to buy these securities in any jurisdiction where the offer or sale is not permitted.
SUBJECT TO COMPLETION, DATED FEBRUARY 7, 2018.
7,000,000 Shares

Class A Common Stock
Cadence Bancorp, LLC, the selling stockholder identified in this prospectus, is offering 7,000,000 shares of our Class A common stock. We will not receive any of the proceeds from the sale of shares by the selling stockholder. Our Class A common stock is listed on the New York Stock Exchange (the “NYSE”) under the symbol “CADE.” The last reported sale price of our Class A common stock on the NYSE on February 6, 2018 was $26.75 per share.
After the completion of this offering, Cadence Bancorp, LLC will continue to own a majority of the voting power of our Class A common stock. As a result, Cadence Bancorp, LLC will continue to effectively control our management and affairs for so long as it holds at least a majority of the voting power of our capital stock. We will remain a “controlled company” within the meaning of the corporate governance standards of the NYSE immediately following the completion of this offering. See “Security Ownership of Beneficial Owners, Management and the Selling Stockholder.”
We are an “emerging growth company” under the federal securities laws and, as such, are eligible for reduced public company reporting and other requirements. Investing in our Class A common stock involves risk. See “Risk Factors,” beginning on page 34.
Neither the Securities and Exchange Commission nor any other regulatory body has approved or disapproved of these securities or passed upon the adequacy or accuracy of this prospectus. Any representation to the contrary is a criminal offense.
The shares of our Class A common stock that you purchase in this offering will not be savings accounts, deposits or other obligations of any of our bank or non-bank subsidiaries and are not insured or guaranteed by the Federal Deposit Insurance Corporation or any other governmental agency.
| Per Share |
Total | |||||||
| Public offering price |
$ | $ | ||||||
| Underwriting discounts and commissions(1) |
$ | $ | ||||||
| Proceeds to the selling stockholder, before expenses |
$ | $ | ||||||
| (1) | See “Underwriting” for additional information regarding the underwriting discounts and commissions and certain expenses payable to the underwriters by us. |
To the extent that the underwriters sell more than 7,000,000 shares of Class A common stock, the underwriters have the option to purchase up to an additional 1,050,000 shares from the selling stockholder at the public offering price less the underwriting discounts and commissions within 30 days from the date of this prospectus.
The underwriters expect to deliver the shares of Class A common stock against payment in New York, New York on , 2018.
Joint Book-Running Managers
| Goldman Sachs & Co. LLC | J.P. Morgan |
| Keefe, Bruyette & Woods A Stifel Company |
Sandler O’Neill + Partners, L.P. | |
Co-Managers
| Baird | Raymond James | RBC Capital Markets | Stephens Inc. |
Prospectus dated , 2018.
Table of Contents
| Page | ||||
| 1 | ||||
| 28 | ||||
| Summary Selected Historical Consolidated Financial Information |
30 | |||
| 34 | ||||
| 71 | ||||
| 73 | ||||
| 74 | ||||
| 75 | ||||
| 76 | ||||
| 77 | ||||
| 80 | ||||
| Management’s Discussion and Analysis of Financial Condition and Results of Operations |
83 | |||
| 169 | ||||
| 193 | ||||
| 200 | ||||
| 210 | ||||
| Security Ownership of Beneficial Owners, Management and the Selling Stockholder |
211 | |||
| 214 | ||||
| 217 | ||||
| 223 | ||||
| 225 | ||||
| 228 | ||||
| Certain Material United States Federal Income Tax Considerations for Non-U.S. Holders |
239 | |||
| 242 | ||||
| 251 | ||||
| 252 | ||||
| 252 | ||||
| F-1 | ||||
i
Table of Contents
About This Prospectus
You should rely only on the information contained in this prospectus or in any free writing prospectus we may authorize to be delivered to you. We, the selling stockholder and the underwriters have not authorized anyone to provide you with different or additional information. If anyone provides you with different or additional information, you should not rely on it. We, the selling stockholder and the underwriters are not making an offer of these securities in any jurisdiction where the offer is not permitted. The information contained in this prospectus is accurate only as of the date of this prospectus. Our business, financial condition, results of operations and prospects may have changed since that date. No action is being taken in any jurisdiction outside the United States to permit a public offering of our securities or possession or distribution of this prospectus in that jurisdiction. Persons who come into possession of this prospectus in jurisdictions outside the United States are required to inform themselves about, and to observe, any restrictions as to the offering and the distribution of this prospectus applicable to those jurisdictions.
Explanatory Note
Unless otherwise indicated or the context otherwise requires, all references in this prospectus to “we,” “our,” “us,” “ourselves,” “the Company,” “the company,” and “our company” refer to Cadence Bancorporation, a Delaware corporation, and its consolidated subsidiaries after giving effect to the reorganization transactions described in this prospectus. For all periods prior to the completion of such reorganization transactions, these terms refer to Cadence Financial Corporation, a Mississippi corporation, and its consolidated subsidiaries. All references to the “selling stockholder” or our “controlling stockholder” refer to Cadence Bancorp, LLC, a Delaware limited liability company and our controlling stockholder. All references in this prospectus to “Cadence Bank” or “the Bank” refer to Cadence Bank, National Association (N.A.), our wholly owned bank subsidiary. Unless otherwise indicated, references to our “common stock” include our Class A common stock and our Class B non-voting common stock. All information in this prospectus reflects a 75-for-1 pro rata stock split, which we refer to as the “stock split,” whereby each share of Class A common stock received 74 additional shares of Class A common stock in a stock dividend that occurred on April 7, 2017. All references in this prospectus to our “IPO” refer to our initial public offering of 8,625,000 shares of our Class A common stock that was completed on April 19, 2017. All references in the prospectus to our “November 2017 offering” refer to the secondary offering of 10,925,000 shares of our Class A common stock by the selling stockholder that was completed on November 13, 2017.
Market and Industry Data
Although we are responsible for all of the disclosures contained in this prospectus, this prospectus contains industry, market and competitive position data and forecasts that are based on industry publications and studies conducted by independent third parties. The industry publications and third-party studies generally state that the information that they contain has been obtained from sources believed to be reliable, although they do not guarantee the accuracy or completeness of such information. Although we believe that the market position, market opportunity and market size information included in this prospectus is generally reliable, we have not verified the data, which is inherently imprecise. The forward-looking statements included in this prospectus related to industry, market and competitive data position may be materially different than actual results.
ii
Table of Contents
Implications of Being an Emerging Growth Company
As a company with less than $1.07 billion in revenues during our last fiscal year, we qualify as an “emerging growth company” under the Jumpstart Our Business Startups Act of 2012 (the “JOBS Act”). An emerging growth company may take advantage of reduced reporting and other requirements that are otherwise generally applicable to public companies. As an emerging growth company:
| • | we may present less than five years of selected historical financial data; |
| • | we are exempt from the requirement to obtain an attestation and report from our auditors on management’s assessment of our internal control over financial reporting under the Sarbanes-Oxley Act of 2002; |
| • | we are permitted to have an extended transition period for adopting any new or revised accounting standards that may be issued by the Financial Accounting Standards Board (“FASB”) or the SEC; |
| • | we are permitted to provide less extensive disclosure about our executive compensation arrangements; and |
| • | we are not required to give our stockholders nonbinding advisory votes on executive compensation or golden parachute arrangements. |
We have elected to take advantage of the scaled disclosures and other relief described above in this prospectus, and we may take advantage of these exemptions until December 31, 2022 or such earlier time that we are no longer an “emerging growth company.” In general, we would cease to be an “emerging growth company” if we have more than $1.07 billion in annual revenues, we have more than $700 million in market value of our common stock held by non-affiliates on any June 30 after we have been public for a year, or we issue more than $1.0 billion of non-convertible debt over a three year period. As a result, we could cease to be an “emerging growth company” as soon as the end of the 2018 fiscal year. For so long as we may choose to take advantage of some or all of these reduced burdens, the level of information that we provide stockholders may be different than you might get from other public companies in which you hold stock.
iii
Table of Contents
This summary highlights selected information contained elsewhere in this prospectus. This summary does not contain all of the information that you should consider before deciding to purchase Class A common stock in this offering. You should read the entire prospectus carefully, including the section titled “Risk Factors,” our consolidated financial statements, and the related notes thereto and “Management’s Discussion and Analysis of Financial Condition and Results of Operations,” before making an investment decision.
Company Overview
Cadence Bancorporation is a bank holding company and a Delaware corporation headquartered in Houston, Texas, and is the parent company of Cadence Bank. Formed in 2009 by banking industry veterans, we secured $1.0 billion of capital commitments in 2010 and built our franchise on the heels of three successful acquisitions: Cadence Bank in March 2011, the franchise of Superior Bank in April 2011 and Encore Bank, N.A. in July 2012. Today, we are a growth-oriented, middle-market focused commercial relationship bank providing a broad range of banking and wealth management services to businesses, high net worth individuals, business owners and retail customers through a network of 65 branches as of September 30, 2017, with branches in Alabama (25), Florida (14), Texas (11), Mississippi (11) and Tennessee (4). We completed our initial public offering and listing on the NYSE in April 2017. We have outperformed consensus analyst estimates of earnings per share for each quarter since our IPO, as well as consensus analyst estimates following our IPO (as of June 1, 2017) for our total assets and total deposits at the end of 2017. As of September 30, 2017, we had $10.5 billion of assets, $8.0 billion of gross loans, $8.5 billion in deposits and $1.3 billion in shareholders’ equity. We generated $87.7 million of net income for the nine months ended September 30, 2017 and $65.8 million of net income for the year ended December 31, 2016.
We are focused on expanding our position in our markets primarily through organic growth, but also through strategic merger and acquisition opportunities. Through our experienced and motivated team of commercial relationship managers and our integrated, client-centric approach to banking, we have successfully grown each of our businesses. We believe our franchise is positioned for continued growth as a result of (i) our attractive geographic footprint, (ii) our focus and ability to provide differentiated, customized service to a wide variety of industries and clients, (iii) our stable and cost efficient deposit funding base, (iv) our veteran board of directors, management team, and relationship managers, (v) our capital position and (vi) our credit quality and risk management processes.
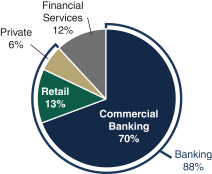
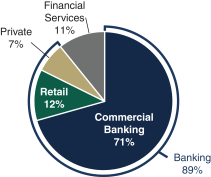
Business Segments
We are a full service commercial bank focused on building long-lasting relationships with our customers. We provide a variety of deposit products and lending services to commercial and consumer customers, as well as wealth management, insurance and private banking services. We operate through three operating segments: Banking, Financial Services and Corporate.
1
Table of Contents
Banking Segment
Banking is our primary operating segment and offers a range of deposit products and lending services through our Commercial Banking, Retail Banking and Private Banking business lines. As of September 30, 2017, we had $8.0 billion of gross loans and $8.5 billion of deposits. Since December 31, 2012, our loans and deposits have grown at a 15.8% and 13.6% compound annual growth rate (which we sometimes refer to as “CAGR”), respectively.
| Loan Composition (30-Sep-17) |
Deposit Composition (30-Sep-17) | |
|
|
Note: Percentages do not equal 100% due to rounding.
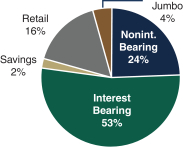
The quality of our deposit franchise and access to stable funding are key components of our success. We offer traditional retail deposit products, including checking accounts, savings accounts, money market accounts and other deposit accounts through our branch network and our online, mobile and telephone banking platforms. Additionally, we offer our commercial clients a host of deposit products and treasury and cash management services. Our deposits provide meaningful franchise value as a cost efficient and stable source of funding to support our growth. As of September 30, 2017, we had $8.5 billion of total deposits with a total deposit cost of 0.58% (0.52% excluding brokered deposits) for the third quarter of 2017.
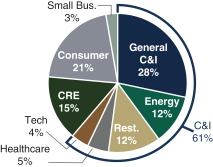
Commercial Banking. Commercial banking is the core foundation of our business, and we believe our client-centric approach and focus on delivering unmatched customer service to our middle-market relationships (characterized as businesses with annual revenues of $10 million to $500 million) sets us apart from our peers. Our relationships are founded on our ability to provide a differentiated customer experience through our ability to deliver an increased level of service, quick decision-making and tailored solutions to our clients. Our team of 55 commercial relationship managers and seven senior executives maintains over 6,300 relationships. We provide a full range of commercial deposit products, treasury and cash management services and traditional and specialized lending products to our customers. As of September 30, 2017, we had $6.1 billion of loans in our Commercial Banking business line representing 76% of our total loan portfolio.
| • | Commercial and Industrial: We have significant expertise in middle-market commercial and industrial lending (“C&I”). Through a team of 39 dedicated and experienced C&I relationship managers, we cover approximately 5,500 customer relationships across a wide variety of industries. Our success is the result of our relationship managers’ product and market expertise and our focus on delivering high quality, customized service to our clients, which has allowed us to grow our C&I loan portfolio at a 19.9% CAGR since December 31, 2012, while maintaining conservative underwriting standards. As of September 30, 2017, we had $4.9 billion of C&I loans, representing 61% of our total loan portfolio. Our C&I nonperforming loans totaled $82 million as of September 30, 2017, of which all but $0.2 million related to our energy portfolio. Included in the $82 million as of September 30, 2017 is a $9.9 million nonperforming energy credit that was reclassified as held-for-sale (“HFS”). Of the energy portfolio nonperforming loans, over 85% at September 30, 2017 were paying in accordance with |
2
Table of Contents
| contractual terms. As of September 30, 2017, less than 2% of our energy loans were noncurrent nonperforming. |
| • | Commercial Real Estate: Commercial real estate (“CRE”) lending provides financing for the office, industrial, retail and multi-family sectors. Our relationship managers take a conservative approach to CRE lending, focusing on what we believe to be high quality credits with low advance rates, strong collateral profiles and attractive cash flow characteristics. As of September 30, 2017, we had $1.2 billion of CRE loans, representing 15% of our total loan portfolio. Our CRE lending is focused on income-producing properties with strong cash flow characteristics. As of September 30, 2017, we had $1.1 billion of income-producing loans representing 94% of our CRE portfolio. Our CRE nonperforming loans totaled $0.5 million as of September 30, 2017, representing 0.04% of our total CRE portfolio. |
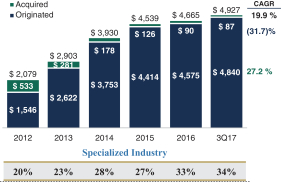
| • | Specialized Industry Lending: Through our specialized industry lending business, which is part of our C&I portfolio, we provide unique expertise and differentiated service capabilities to clients in the restaurant industry, healthcare, and technology sectors. The national scope of our lending presence in these industries and their contribution to our local economies provide a unique growth opportunity and geographic diversification of our portfolio. Our team of six dedicated and experienced relationship managers has established deep relationships as a result of their knowledge of the unique financial needs and risks of our clients. We have developed industry-specific underwriting guidelines and concentration limits that have proven successful in managing our exposures and limiting our credit risk. |
| Originated Specialized Industry Portfolio |
Balance as of September 30, 2017 ($MM) |
% of Total Loans | Compound Annual Growth Rate Since 2012 |
|||||||||
| Restaurant industry |
$ | 980 | 12.2 | % | 31.6 | % | ||||||
| Healthcare |
385 | 4.8 | 22.9 | |||||||||
| Technology |
333 | 4.1 | 114.2 | |||||||||
|
|
|
|
|
|
|
|||||||
| Total |
$ | 1,698 | 21.1 | % | 34.8 | % | ||||||
|
|
|
|
|
|
|
|||||||
Note: The Technology specialized industry portfolio was established in 2013. Accordingly, the CAGR for Technology in the table above is shown since 2013.
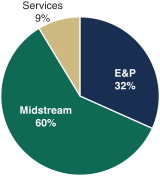
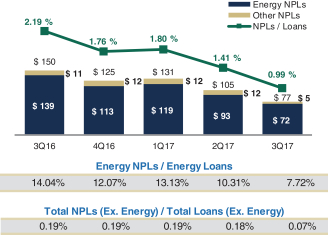
| • | Energy Lending: Energy lending, which is part of our C&I portfolio, is an important part of our business as energy production and energy related industries are meaningful contributors to the economy in our primary markets. Our team of six energy relationship managers has significant product and customer experience through a range of economic cycles. We have developed strict underwriting standards for each of our sub-portfolios (exploration and production, midstream and services) and we actively monitor our exposures to ensure they fit within our risk tolerance framework and internal concentration limits. Our experience and industry knowledge provide significant advantages over peers and position us to drive attractive returns while appropriately managing concentration risk. As of September 30, 2017, we had $933 million of energy loans, representing 11.6% of our total portfolio. Our energy sector nonperforming loans totaled $82 million as of September 30, 2017 including $68 million E&P, $8 million midstream and $6 million services. As of September 30, 2017, less than 2% of our energy loans were noncurrent nonperforming (over 85% of our nonperforming energy loans were paying in accordance with contractual terms). |
3
Table of Contents
| Energy Portfolio Composition (30-Sep-17) |
|
Note: Percentages do not equal 100% due to rounding.
Retail Banking. Our Retail Banking line of business offers a broad range of banking services to consumers and small businesses through our branch network and online and mobile distribution channels. We offer a variety of retail deposit products and lending services, consisting of mortgage loans (first mortgages and home equity lines and loans), small business loans and personal installment loans. We serve over 63,000 households and 14,000 small businesses. As of September 30, 2017, we had $1.9 billion of loans in our Retail Banking business line, representing 24% of our total loan portfolio.
| • | Residential Real Estate: We provide a range of residential real estate products including fixed and adjustable rate loans for purchase or refinance purposes, conforming and jumbo mortgages and home equity products primarily to customers within our geographic footprint. We take a comprehensive and conservative approach to mortgage underwriting resulting in over 80% of our portfolio having original FICO scores of 700 or greater and approximately 74% of our originated first lien portfolio having original loan-to-values of 85% or less. As of September 30, 2017, we had $1.6 billion of residential real estate loans, representing 20% of our total loan portfolio. Our residential real estate nonperforming loans totaled $3.7 million as of September 30, 2017, and were primarily related to residential real estate loans in the acquired portfolio. |
| • | Other Consumer and Small Business Loans: We offer consumer loans to our customers for personal, family and household purposes, including auto, boat and personal installment loans. Additionally, we offer business administration products to assist in the financing needs of small businesses in our footprint. As of September 30, 2017, we had $72 million of other consumer loans and $218 million of small business loans, representing 1% and 3% of our total loan portfolio, respectively. Our small business nonperforming loans totaled $0.8 million as of September 30, 2017 and were primarily related to small business loans in the acquired portfolio. |
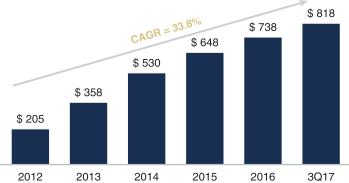
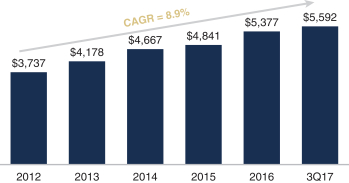
Private Banking. Our Private Banking business line offers specialized banking services to affluent and high net worth clients and business owners. Our dedicated team of 15 relationship managers works directly with clients to develop customized banking solutions, through tailored loan and deposit products, based on risk tolerance and financial goals. From December 31, 2012 to September 30, 2017, we have grown our private banking loans at a 33.8% CAGR.
4
Table of Contents
| Private Banking Loan Balance Over Time |
|
Note: $ in millions as of December 31 each year, unless otherwise noted.
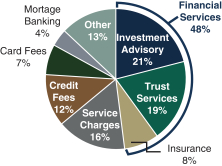
Financial Services Segment
Our Financial Services segment provides a comprehensive and integrated set of investment, retirement, estate, college and business succession planning, retail brokerage, personal and institutional trust services and insurance services through three product lines: Investment Management, Trust Services and Insurance Services. As of September 30, 2017 we had $5.6 billion of assets under management / administration.
Investment Management. We offer a variety of investment management services to affluent and high net worth individuals and families through our Linscomb & Williams brand, which has been serving clients for over 45 years. Through a team of 11 advisors, we focus on providing customized investment solutions to best fit our clients’ risk tolerance and achieve their financial objectives. Additionally, through our Cadence Investment Services brand, we provide asset management and financial planning services to primarily our retail and small business customer base. As of September 30, 2017, we had $3.3 billion of investment management assets under management.
Trust Services. Our team consists of 30 experienced trust officers and portfolio managers. We offer retirement, personal trusts and estates, portfolio management, institutional trusts and court appointed trust services to high net worth individuals and families. As of September 30, 2017, we had $2.3 billion of trust assets under administration.
Insurance Services. Through our Cadence Insurance Services brand, we offer a variety of business and personal insurance products and have approximately 7,200 policy holders, both retail and commercial customers, including life insurance, disability insurance, long-term care insurance, homeowner’s insurance, property and casualty insurance, key person insurance and buy-sell agreements. Our insurance services business has experienced revenue growth of approximately 5% annually from December 31, 2012 to December 31, 2016, despite declines in the insurance rate environment.
5
Table of Contents
| Assets Under Management / Administration |
|
Note: $ in millions as of December 31 each year, unless otherwise noted.
Corporate Segment
Our Corporate Segment reflects parent-only activities, including debt and capital raising, and intercompany eliminations. Our corporate segment contributes negligibly to our total revenues.
| 2016 Segment Revenue |
3Q17 YTD Segment Revenue | |
|
| |
| Note: | For the year ended December 31, 2016 and nine months ended September 30, 2017. Excludes corporate segment. Percentages do not equal 100% due to rounding. |
Our Markets
We define our markets broadly as Texas and the southeast United States. Our active banking operations are located principally in five states, which we refer to as our geographic footprint (our “footprint”), where we operate 65 branches as of September 30, 2017 throughout Texas, Alabama, Florida, Mississippi and Tennessee. Historically, our primary regional focus has been Houston, although we operate and continue to expand our operations throughout our footprint. We focus on serving these regional markets, although we also serve specialized industries clients both within our geographic footprint and throughout the United States, as many of
6
Table of Contents
our clients in these industries have operations nationwide. As a result of our relationships and our commitment to the markets and customers we serve, we have experienced meaningful market share gains since 2012.
| Branch Footprint |
Deposit Detail as of June 30, 2017 |
|||||||||||||||||||||||||||||
|
|
Deposits (Sbn) |
# of Branches |
Mkt. Share |
CAGR/Bps D Since 2012 | Estimated Growth | |||||||||||||||||||||||||
| Deposits | Mkt Share | Population | HHI | |||||||||||||||||||||||||||
| State |
||||||||||||||||||||||||||||||
| TX |
$ | 3.1 | 11 | 0.4 | % | 17.0 | % | 15bps | 1.4 | % | 1.8 | % | ||||||||||||||||||
| AL |
2.7 | 25 | 2.8 | 17.5 | 130 | 0.3 | 1.6 | |||||||||||||||||||||||
| FL |
1.3 | 14 | 0.2 | 14.2 | 8 | 1.3 | 2.0 | |||||||||||||||||||||||
| MS |
0.6 | 11 | 1.2 | 0.6 | (14 | ) | 0.1 | 0.9 | ||||||||||||||||||||||
| TN |
0.1 | 4 | 0.1 | 3.5 | (1 | ) | 0.8 | 2.0 | ||||||||||||||||||||||
|
|
|
|
|
|
|
|
|
|
|
|
|
|
|
|||||||||||||||||
| Total |
$ | 7.9 | 65 | — | % | 14.3 | % | — | 1.2 | % | 1.9 | % | ||||||||||||||||||
|
|
|
|
|
|
|
|
|
|
|
|
|
|
|
|||||||||||||||||
| Top 5 MSA |
||||||||||||||||||||||||||||||
| Houston |
$ | 3.1 | 9 | 1.3 | % | 16.4 | % | 48bps | 1.6 | % | 1.5 | % | ||||||||||||||||||
| Birmingham |
1.8 | 10 | 4.9 | 29.0 | 309 | 0.3 | 2.0 | |||||||||||||||||||||||
| Tampa |
0.8 | 8 | 1.0 | 24.4 | 54 | 1.3 | 2.2 | |||||||||||||||||||||||
| Huntsville |
0.3 | 4 | 4.4 | 7.4 | 68 | 0.9 | 1.0 | |||||||||||||||||||||||
| Sarasota |
0.3 | 3 | 1.7 | 7.2 | 19 | 1.5 | 2.2 | |||||||||||||||||||||||
| Other MSA |
1.4 | 24 | — | 5.9 | — | — | — | |||||||||||||||||||||||
| Non-MSA |
0.1 | 7 | — | — | — | — | — | |||||||||||||||||||||||
|
|
|
|
|
|
|
|
|
|
|
|
|
|
|
|||||||||||||||||
| Total |
$ | 7.9 | 65 | — | % | 15.4 | % | — | 1.2 | % | 1.7 | % | ||||||||||||||||||
|
|
|
|
|
|
|
|
|
|
|
|
|
|
|
|||||||||||||||||
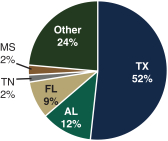
While we are focused on driving growth across all of our markets and products, we believe our Texas presence will be the largest contributor to future asset growth, with funding support from our deposit base in Texas and the southeast United States. As of September 30, 2017, 52% of our loans and 40% of our deposits were in Texas, and we originated 37% of our loan commitments in Texas for the nine months ended September 30, 2017. Loan commitments originated to borrowers outside of the markets in which we operate (represented by the “Other” category in the graphs below) are primarily in our specialized industries portfolio, within our Commercial Banking business line.
| Loans by Geography (30-Sep-17) |
Deposits by Geography (30-Sep-17) | |
|
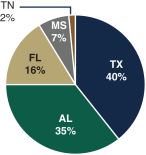
| |
| Note: | Geography of our loans and deposits is measured by the state of the client’s primary residence on file. Percentages do not equal 100% due to rounding. |
Our markets have demographic, economic and competitive dynamics that we believe are favorable to executing our growth strategy. Texas serves as our primary growth market, and we believe its combination of size, attractive business climate, strong growth characteristics and economic diversity provides significant opportunity to continue to build our business. Our Southeast footprint provides a strong presence in markets with stable growth and low-cost deposit funding.
7
Table of Contents
Texas
Large and Growing Population. We believe Texas’ population and growth outlook provide significant consumer and commercial growth opportunities. Texas is the second most populated state in the U.S., and Houston, the largest metropolitan area in which we operate (measured by deposits) and where our business historically has been principally located, is the fifth most populated metropolitan area in the U.S. as of September 2017, according to the U.S. Census Bureau. From 2012 to 2016, Texas had the second fastest population growth among all states in the U.S. at 6.9%, and Houston was the fastest growing metropolitan area among the top 25 largest metropolitan areas in the U.S. with 10.0% growth, according to the U.S. Census Bureau. Additionally, Houston boasts one of the youngest populations among large metropolitan areas according to the Greater Houston Partnership. Texas is estimated to grow 7.1% and Houston is estimated to grow 8.3% from 2018 to 2023, as compared to 3.5% for the broader U.S., according to Nielsen. Texas is also home to four of the six fastest growing metropolitan populations among the top 50 largest metropolitan areas in the U.S. based on 2018-2023 estimated growth rates, according to Nielsen.
| Texas Population Growth (000) |
Houston Population Growth (000) | |
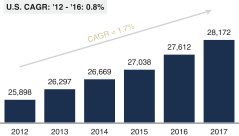
|
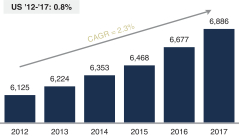
| |
Source: U.S. Census data from Nielsen.
8
Table of Contents
Robust Job Market and Favorable Outlook. From December 2007 to December 2017, Texas has grown nonagricultural employment by 17.8% compared to the national average of 6.5%, according to the U.S. Bureau of Labor Statistics (the “BLS”). As of December 2017, Texas ranked as the second largest state and Houston ranked as the sixth largest metropolitan area for nonagricultural jobs in the U.S., employing more than 12.4 million and 3.0 million people, respectively, according to the BLS. Houston has more jobs than 36 U.S. states, according to the BLS. We believe the job growth outlook for Texas is favorable as a result of an increasingly diversified state economy and stabilizing energy prices. Texas is projected to experience 1.9% annual job growth from 2014 to 2024 compared to 0.6% for the broader U.S. according to the Labor Market & Career Information Department (“LMCI”) of the Texas Workforce Commission and the BLS, with much of the growth coming from non-energy related industries like healthcare, hospitality & leisure and business services, among others.
| Houston Total Job Growth |
Growing Non-Energy Jobs (000s) | |
|
|
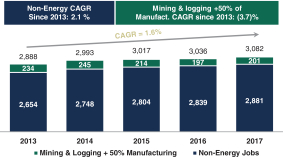
| |
Source: U.S. Department of Labor and Greater Houston Partnership.
9
Table of Contents
Economically Diverse. Texas has $1.7 trillion of gross state product (“GSP”), as of March 2017, and Houston has over $478 billion of gross domestic product (“GDP”), as of December 2016, ranking Texas as the second largest state economy and Houston as the 4th largest metropolitan area economy in the U.S. according to the U.S. Department of Commerce. Texas’ GSP and Houston’s GDP would rank as the tenth largest and the 23rd largest economies, respectively, among all countries in the world according to the World Bank. Texas’ attractive business climate and high standard of living has made it home to 50 Fortune 500 companies and over 367,000 businesses with less than 1,000 employees according to Fortune Magazine and the U.S. Census Bureau. Houston boasts 20 Fortune 500 headquarters and 41 Fortune 1000 headquarters, the fourth most among metropolitan areas according to Fortune Magazine. The Texas economy has become increasingly diverse with no single industry accounting for more than 14% of Texas GSP and the top 10 industries contributing 79% of the state’s GSP. Additionally, Texas’ extensive trade infrastructure, including 11 deep water ports, has made Texas the leading exporter among all U.S. states for 14 consecutive years and a leading destination for foreign direct investment according to the U.S. Department of Commerce.
| Texas Gross State Product by Industry |
Houston Gross Domestic Product by Industry | |
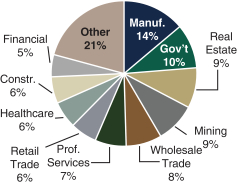
|
| |
| Source: | Texas gross state product by industry per the U.S. Department of Commerce as of March 31, 2017. Houston Gross Domestic Product by Industry per the U.S. Department of Commerce as of December 31, 2015. Percentages do not equal 100% due to rounding. |
Attractive Business Climate. In April 2017, Texas ranked as the best state for business according to Chief Executive Magazine’s annual survey of the U.S.’s top CEOs, the 13th consecutive year Texas has received the designation. We believe Texas’ size, infrastructure, vibrant and growing workforce, quality of life and friendly tax model (low state business tax and no personal income tax) have resulted in significant business growth and attracted numerous corporate relocations.
Southeast Markets (Alabama, Florida, Mississippi, Tennessee)
Access to a Large Population and Stable Economy. Our Southeast markets provide access to over 35.1 million people as of July 2016 and over 546,000 businesses with fewer than 1,000 employees as of 2014 according to the U.S. Census Bureau. These states have shown an average population growth of 4.5% from 2012 to 2016 and are estimated to grow by an average of 4.9% from 2018 to 2023 according to the U.S. Census Bureau and Nielsen. From 2012 to 2016, our Southeastern states’ consolidated gross state product realized an average 4.6% CAGR according to the U.S. Department of Commerce.
High Quality, Low-Cost Deposit Source. Our Southeast markets provided access to over $865 billion of deposits as of June 30, 2017, according to the Federal Deposit Insurance Corporation (the “FDIC”). Deposits in
10
Table of Contents
these markets have experienced faster growth than deposits in other U.S. states over the last year and have proven to be lower cost compared to the broader industry over the last three years. From June 30, 2015 to June 30, 2017, deposits in our Southeast markets grew 5.6% as compared to 5.5% for other U.S. states, according to the FDIC. The average cost of deposits over the last three years for all banks with $1 billion to $50 billion in assets headquartered in our Southeast markets was 0.37%, as compared to 0.40% for U.S. banks in that asset range located in other states, according to regulatory filings.
Our Competitive Strengths
Well Positioned in Attractive Markets in Texas and the Southeast
We believe we are well positioned across our footprint as a result of our expertise and commitment to our customers and markets. We are the second largest commercial lender and second largest bank by deposits among domestically-owned banks headquartered in Houston, Texas as of June 30, 2017. Since 2012, we have increased our deposit market share in key metropolitan markets such as Houston, Texas, Birmingham, Alabama, and Tampa, Florida, and we believe each of our markets offer unique opportunities to enhance our franchise. Texas’ size, growth profile and thriving economy offer significant opportunities to build new commercial relationships, while our Southeast footprint combines steady growth, economic diversity and attractive deposit characteristics to supplement and complement our Texas franchise.
Proven Business Model Focused on Client Relationships and Differentiated Service
Our business model and approach to clients is simple. We use our breadth of products combined with our customer and market expertise to create a unique banking experience for our clients. We also focus on complementary products and services where we have a specific expertise and the opportunity to build customized banking solutions for our customers’ needs. We have an experienced group of relationship managers who focus on a client-centered, relationship-driven banking model. We attempt to leverage our industry, market and client knowledge and customer relationships rather than competing solely on price and structure. We believe our expertise in energy lending and our specialized industries is comparable to those of large financial institutions, as evidenced by our knowledge and experience in these areas, and provides high quality growth opportunities. Additionally, our experienced management team and board of directors provide support to our relationship managers in establishing, maintaining and nurturing client relationships. Our client-centric approach has promoted our growth by giving us access to select business and lending opportunities to which we believe an institution of our size would not typically have access.
Demonstrated Growth Driven by Texas Franchise and Middle Market C&I focus, including Specialized Industries
Our relationship banking approach and focus on customer service combined with our product and market expertise have allowed us to grow our loan portfolio at a 15.8% CAGR since December 31, 2012. The majority of our loan growth has come from our Texas footprint where we have gained market share and capitalized on a healthy and growing economy. As of September 30, 2017, 52% of our loans were based in Texas, and 37% of our originations for the nine months ended September 30, 2017 were from Texas-based customers. Similarly, our considerable commercial lending expertise has been a significant source of growth, with total C&I accounting for 70.6% of our total loan growth and specialized industry lending, a component of our C&I portfolio, accounting for 31.9% of our total loan growth since December 31, 2012. We have originated an average of $912 million of loan commitments in each quarter since December 31, 2012. We are committed to our business model and our
11
Table of Contents
clients, and we believe the quality of our underwriting practices and risk management infrastructure will allow us to continue to grow through a range of economic cycles.
| Total Loans |
C&I Loans | |
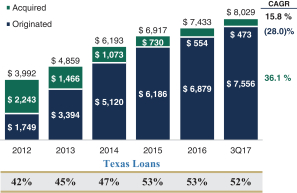
|
| |
Note: $ in millions as of December 31 each year, unless otherwise noted.
Mid-Sized Bank with Large Bank Skill Set and Talent
Since our inception, we have strived to build a client-centric bank that is supported by a larger bank infrastructure and mentality. Our board, management team and many of our relationship managers joined us from larger institutions, drawn by their entrepreneurial spirit and the opportunity to build a “better” large bank. We have dedicated significant time and resources to ensure that our infrastructure, technology and risk management systems are capable of supporting sustained growth and the evolving needs of our clients. We believe the combination of our personalized service and our large bank capabilities provides a differentiated service offering to our middle market clients.
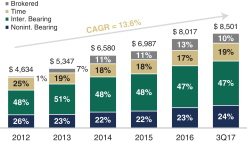
Balance Sheet Funded with Growing, Low-Cost Deposit Portfolio
We have focused on building a high quality, low cost deposit franchise through a combination of our retail channel and our extensive commercial relationships. As of September 30, 2017, deposits account for 94% of our funding sources. Our deposit base provides an efficient and stable source of funding, as evidenced by our cost of total deposits less brokered deposits of 0.52% for the nine months ended September 30, 2017. Our deposit footprint encompasses markets that we view as demonstrating robust economic conditions with the potential for strong deposit growth. In addition to our branch footprint and broader retail strategy, our ability to access deposit funding from our commercial and public sector relationships as well as our wealth management business provides a wide range of deposit sources to support our organic growth initiatives. In particular, we have experienced meaningful growth in our treasury and cash management products as a result of our ability to develop tailored offerings to support our customers’ needs. We also utilize brokered deposits to manage routine loan, security and deposit flows and maintain a healthy availability for contingent liquidity purposes. We generally target a brokered deposit to total deposit ratio of less than 15% to 20% and as of September 30, 2017,
12
Table of Contents
our brokered deposits totaled $824 million, or 9.7% of total deposits. Our deposit portfolio has grown at a 13.6% CAGR since December 31, 2012.
| Note: | $ in millions as of December 31 each year, unless otherwise noted. Percentages do not equal 100% due to rounding. |
Disciplined Underwriting and Well Established Risk Management Framework
As a bank holding company established on the heels of the Great Recession, we understand the importance of a strong risk management infrastructure. Since our formation, we have strived to build a culture focused on risk management that is supported by disciplined credit underwriting and a robust set of policies and procedures. We have a comprehensive approach to enterprise risk management which is focused on credit, strategic, reputational, operational, compliance, liquidity and interest rate risk. Our product and business managers actively monitor the risk profile of their business with formal oversight from our Enterprise Risk Management and Internal Audit teams. Additionally, over the last two years we have been preparing for the operational, regulatory and risk management complexities associated with crossing $10 billion of assets, a milestone which we passed in the third quarter of 2017. We have added 46 risk management and audit specialists across the Bank since 2013 and have invested over $2 million into our risk management infrastructure.
13
Table of Contents
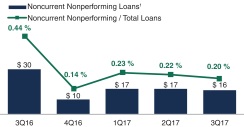
Our credit underwriting methodology is specific to each of our businesses to ensure that we capture the unique risks associated with the various industries we cover and the products we offer. We have a centralized credit authority led by a team of highly experienced credit professionals. We utilize a dual risk rating framework and maintain a comprehensive and tested set of guidelines that allow us to effectively manage exposures and closely monitor risk at the loan level. We have proven our ability to manage and work through high risk, underperforming assets that were part of our initial acquisitions, and we have stabilized our energy portfolio through individual strategies dependent on each credit’s circumstances. We believe our commitment to prudent risk management has allowed us to successfully work through past credit challenges and positions us to maintain strong credit and risk performance as we continue to grow our franchise. Since 2016, we have reduced our nonperforming loans, 93% of which are sourced in our energy portfolio, by 39%. 79% of our nonperforming loans are current as of September 30, 2017.
| Noncurrent Nonperforming Loans1 / Total |
Nonperforming Loans / Total Loans | |
|
|
| |
Attractive Run-Rate Core Profitability and Return Profile
We strive to consistently deliver outsized loan growth, utilize our relationships to drive fee opportunities and prudently manage our expense base to drive operating leverage. We believe this combination positions us to deliver competitive returns.
| • | We have consistently delivered strong loan growth as a result of the growth in our markets, our motivated team of relationship managers and our intense focus on customer service. We believe these factors will provide ample opportunities to maintain our strong growth trajectory. Since December 31, 2012, our loan portfolio has grown at a 15.8% CAGR. |
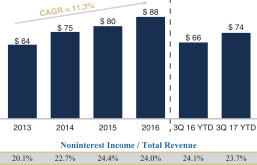
| • | Our diversified and complementary noninterest income offering provides an opportunity to leverage our commercial and retail banking relationships to drive stable noninterest income growth. With $5.6 billion of assets under management / administration, we have built an integrated wealth management platform that is led by a team of experienced advisors and offers a comprehensive set of |
| 1 | Noncurrent nonperforming loans defined as originated loans and acquired non-credit impaired loans that are nonperforming loans +30 past due. $ in millions unless otherwise noted. Nonperforming loans are based on originated loans and acquired non-credit impaired loans. |
14
Table of Contents
| financial planning and trust services. For the nine months ended September 30, 2017, our non-interest income to total revenue ratio was 23.7%, and we grew noninterest income at an 11.3% CAGR from 2013 to 2016. |
| Noninterest Income |
Noninterest Income Distribution (3Q17 YTD) | |
|
| |
Note: $ in millions for each year ended December 31, unless otherwise noted.
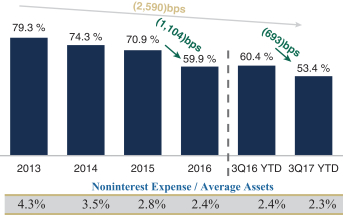
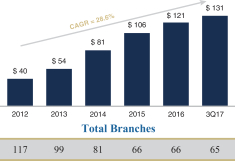
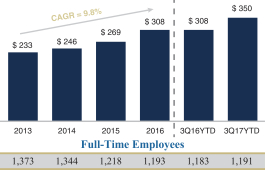
| • | We are committed to maintaining a culture focused on expense management which has led to consistently improving expense ratios over the last five years despite our growth and crossing over $10 billion in assets in the third quarter of 2017. Our focus on optimizing our branch footprint, making prudent investments in technology and leveraging employee capacity has allowed us to reduce our expense base each year since 2013. We have reduced our branch footprint from a high of 117 branches in 2012 to 65 branches as of September 30, 2017, centralizing our branch footprint to primarily focus on high traffic and strategic locations while significantly reducing our occupancy, branch and employee expenses. During that period, we closed or sold 3 branches in Texas, 22 in Alabama, 14 in Florida, 8 in Mississippi, 2 in Georgia and 3 in Tennessee. Additionally, our employee base has become increasingly efficient with revenue per employee growing at a 9.8% CAGR between December 31, 2013 and December 31, 2016. Our improvement in operating efficiency has allowed us to grow assets at a 13.9% CAGR while reducing our noninterest expense at a 4.6% CAGR between December 31, 2013 and December 31, 2016. This has led to an approximate 20 percentage point improvement in our efficiency ratio and a 190 basis point improvement in our noninterest expense to average asset ratio between December 31, 2013 and December 31, 2016.2 Given the overall growth of the company and specifically the growth over $10 billion in assets, the historical expense base declines are not anticipated to continue. |
| 2 | Efficiency ratio is a non-GAAP financial measure. We define efficiency ratio as noninterest expenses divided by our operating revenue, which is equal to net interest income plus noninterest income. See “Non-GAAP Financial Measures” for additional information. |
15
Table of Contents
| Efficiency Ratio |
|
| Deposits / Branch ($MM) |
Revenue / Employee $(000) | |
|
| |
| • | Our focus on commercial lending and the quality of our deposit franchise has resulted in an asset sensitive balance sheet. As of September 30, 2017, 71% of our loans are floating rate and we estimate a 6.9%, or $24.5 million, net interest income benefit in a +200bps immediate interest rate shock scenario. Excluding our current interest rate hedges, which began rolling off at the end of 2017, the net interest income benefit would be 13.2%, or $46.9 million. Although we do not anticipate unwinding the current interest rate hedges prior to maturity, we believe excluding the current interest rate hedges provides clarification as to the organic asset sensitivity of our balance sheet. We do not currently expect to enter into interest rate swap or like arrangements in order to manage interest rate risk in the near-term. |
16
Table of Contents
| • | Through our success in delivering consistent growth while prudently managing expenses, our pre-tax, pre-provision (“PTPP”) earnings increased at a 30.8% CAGR from 2013 to 2016. Additionally, our PTPP earnings for the nine months ended September 30, 2017 represent 34.5% growth over our PTPP earnings for the nine months ended September 30, 2016.3 |
| Pre-Tax, Pre-Provision Earnings |
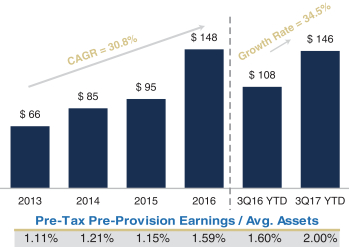
|
Note: $ in millions for each year ended December 31, unless otherwise noted.
Respected Veteran Management Team and Board of Directors
We have a seasoned management team with experience managing growth and risk over a number of years and through various economic cycles. Our executive management team has significant experience overseeing commercial and consumer banking, mergers and acquisitions, financial management, systems integrations, operations and technology, credit and regulatory compliance. We believe our executive management team’s reputation and performance history give us an advantage in hiring and retaining experienced bankers and executing on our growth strategy. Further, our board of directors includes highly accomplished industry veterans with broad experience operating and working in the financial services industry. Our management team’s and board of directors’ extensive experience managing large institutions provides invaluable insight and assistance as we navigate the operational and regulatory complexities associated with crossing $10 billion of assets.
Our management team consists of veteran banking executives:
| • | Paul B. Murphy, Jr., our Chairman and Chief Executive Officer, leads our management team. Mr. Murphy brings over 37 years of banking experience, of which nine years were at Allied/First Interstate and 20 years were at Amegy Bank of Texas. At Amegy Bank of Texas, Mr. Murphy helped lead its growth from an institution with $50 million in assets and a single location, to assets of $11 billion and 85 Texas branches by 2010. In 2005, Mr. Murphy led the sale of Amegy Bank of Texas to Zions, generating a return of approximately 36 times and a 16-year IRR in excess of 25% for initial investors. Mr. Murphy was a co-Founder of Amegy Bank of Texas where he served as President from 1996 and Chief Executive Officer from 2000 until 2010. |
| 3 | Pre-tax, pre-provision earnings is a non-GAAP financial measure, defined as loan income before taxes plus provision for credit losses. We believe the most directly comparable GAAP financial measure is income before taxes. See “Non-GAAP Financial Measures” for additional information. |
17
Table of Contents
| • | Samuel M. Tortorici, our President, has over 31 years of banking experience in various leadership roles in the financial services industry including 24 years at AmSouth Bancorp and Regions Financial. At Regions Financial, Mr. Tortorici most recently served as head of the commercial and industrial lending business spanning the Southeast, Midwest and Texas, and representing $40 billion in loans and deposits. Prior to Regions’ acquisition of AmSouth in 2006, Mr. Tortorici held various leadership positions at AmSouth including Chief Financial Officer. |
| • | Valerie C. Toalson, our Executive Vice President and Chief Financial Officer, has over 31 years of banking experience in finance, accounting, financial and regulatory reporting, treasury and investor relations. Prior to joining our management team, Ms. Toalson served as Executive Vice President and Chief Financial Officer of BankAtlantic Bancorp. Ms. Toalson also held various senior management positions at BOK Financial Corporation/Bank of Oklahoma and served as a financial services audit manager at PricewaterhouseCoopers earlier in her career. |
| • | R. H. “Hank” Holmes, is President and Business Services Executive. Mr. Holmes brings more than 24 years of banking expertise, 18 of which were at Amegy Bank of Texas where his experience included credit, commercial real estate, private banking and special assets. Mr. Holmes was a member of the Amegy Bank of Texas executive management team for 10 years. |
| • | J. Randall Schultz, is Executive Vice President and Specialized Industries Services Executive. Mr. Schultz brings more than 35 years of banking experience, 26 of which were with Bank of America. His professional experience includes credit, international, commercial, corporate and investment banking, and global treasury services. |
Our board of directors includes highly accomplished industry veterans with broad experience in the financial services industry. In addition to Paul B. Murphy, Jr., Chairman and Chief Executive Officer, our board of directors consists of the following individuals:
| • | William B. Harrison, Jr., our Lead Director, and former Chairman and Chief Executive Officer of JPMorgan Chase & Co., Chase Manhattan, and Chemical Bank; |
| • | Robert K. Steel, Chief Executive Officer of Perella Weinberg Partners and former Chief Executive Officer of Wachovia Corporation, as well as Under Secretary for Domestic Finance at the U.S. Department of the Treasury; |
| • | Scott Stuart, co-founder of Sageview Capital and previously a partner and investment committee member at Kohlberg Kravis Roberts & Co., L.P.; and |
| • | J. Richard Fredericks, a founding partner of Main Management LLC, and former Ambassador to Switzerland, as well as Senior Managing Director at Montgomery Securities. |
Marc Shapiro is a Senior Advisory Director. Mr. Shapiro was formerly the non-executive Chairman of J.P. Morgan Chase & Co.’s Texas operations, and Vice Chairman for Finance and Risk Management of J.P. Morgan Chase & Co. from 1997 through 2003.
Stanley Levy is an Advisory Director. Mr. Levy is currently Chief Operating Officer of Morgan Group after previously serving as Managing Director of Real Estate & Lodging Investment Banking for the southern region at J.P. Morgan Chase & Co.
We believe the interests of our management team and board of directors are aligned with our stockholders. Following this offering, our management team and board will continue to own membership units of Cadence Bancorp, LLC, the selling stockholder in this offering and our controlling stockholder (substantially all of the assets of which consist of shares of our Class A common stock), and the members of our board of directors will continue to serve as directors of Cadence Bancorp, LLC.
18
Table of Contents
Our Strategy
Our strategy is to build a premier commercial bank primarily through organically growing our client base, but also through pursuing mergers and acquisitions opportunistically. We regularly evaluate our strategic growth options. We focus on middle-market commercial lending (characterized as lending to businesses with annual revenues of $10 million to $500 million) and provide a broad range of banking services to businesses, high net worth individuals, business owners and retail customers. We believe the local economies in our geographic footprint offer us significant growth opportunities that we can capitalize on through our focus on providing more personalized service compared to larger financial institutions, and our ability to realize greater economies of scale compared to smaller community banks.
In addition, our management team possesses significant executive-level leadership experience at Fortune 500 financial services companies, and we believe this experience provides us with an important advantage in executing our business strategy. Our management team and experienced relationship managers have long-standing client relationships and operating experience in the markets we serve, and we believe these attributes will continue to position us to build market share.
Leverage our Relationships and Service Capabilities to Drive Organic Growth
We have demonstrated robust loan growth in our markets, driven by our client relationships and client development efforts. We believe our loan growth has been a direct result of our people and our strategy, which focuses on a client-centered, service oriented approach. Further, we believe our relationship managers’ entrepreneurial spirit, decision-making autonomy, flexibility and market expertise offers us unique growth opportunities not available to many of our peers. We intend to leverage the quality of our team, our existing relationships and our institutional approach (“delivering the firm”) to building tailored banking solutions to drive deeper relationships and increase penetration in our markets. Additionally, we are dedicated to investing in our team to ensure they continue to meet our high standard of excellence, while attracting and developing early career talent that embodies our entrepreneurial spirit and drives incremental relationships and loan growth.
Grow our Core Deposit Franchise
The strength of our deposit franchise is derived from the long-standing relationships we have with our clients and the strong ties we have to the markets we serve. Our deposit footprint has provided, and we believe will continue to provide, primary support for our loan growth. Deposits comprise 94% of our total funding as of September 30, 2017. A key part of our strategy is to continue to enhance our funding sources by expanding the ways in which we reach our customers, including increased adoption of mobile and digital platforms and optimization of our product offerings, treasury management services and client service capabilities. Additionally, we believe our distinctive commercial and public sector relationships will supplement our retail deposit base and will help drive additional deposit growth and funding opportunities to support our loan growth.
Prudently Invest in our Business to Drive Operating Leverage and Support our Risk Management Framework
We believe it is critical to prudently invest in our business in order to provide the best possible customer experience and build a scalable infrastructure that can support our growth while driving operating leverage through reduced expenses. We have a history of making successful investments, starting with the acquisition and integration of our three predecessor banks, and carried on through internal infrastructure investments, ongoing talent acquisition, investments in our management team, the implementation of an integrated technology platform and ongoing investments into optimization of our delivery channels. Our past investments have yielded significant benefits to our business, and we believe a focus on investing in our people, our technology and our processes will allow us to drive further operational efficiencies.
19
Table of Contents
Build our Fee-Based Business through New Business Initiatives and Existing Customer Relationships
We have built a successful base of fee businesses—in both our Banking segment and our Financial Services segment—that provide complementary products and services to our core banking business. Each of our fee-based businesses is run by an experienced team and has infrastructure to support additional growth. We believe our integrated approach to our commercial relationships, along with our growing market position and the expertise and knowledge of our team, will provide significant new business opportunities.
Engage in Opportunistic M&A
We prioritize organic growth but regularly evaluate acquisition opportunities that we believe could produce attractive returns for our stockholders. In particular, we may consider acquisition opportunities that could improve our market position in geographies with attractive demographics and business growth trends (including Texas and the southeast United States), expand our branch network in existing markets, enhance our ratio of loans to deposits, increase our earnings power and/or enhance our suite of products. We believe our acquisition and integration experience provides an advantage in identifying and executing on strategically and financially compelling opportunities that could supplement our organic growth strategy. We may pursue an acquisition or merger, including a material transaction, as part of our strategic growth strategy.
Our Controlling Stockholder
Prior to our IPO in April 2017, all of the issued and outstanding shares of our Class A common stock were held by Cadence Bancorp, LLC, and the selling stockholder in this offering. As of the date of this registration statement, the selling stockholder owns approximately 76.6% of our Class A common stock. After the completion of this offering, Cadence Bancorp, LLC will own approximately 68.3% of our Class A common stock (or approximately 67.0% if the underwriters exercise in full their option to purchase additional shares from the selling stockholder). This level of share ownership is sufficient to control the vote on all matters and transactions requiring stockholder approval. See “Risk Factors—Risks Relating to an Investment in Our Class A Common Stock” and “Security Ownership of Beneficial Owners, Management and the Selling Stockholder.” The management team of the selling stockholder is led by members of our executive management team, including Paul B. Murphy, Jr., Samuel M. Tortorici and Valerie C. Toalson. The board of directors of the selling stockholder includes all five members of our board of directors, our Senior Advisory Director, Marc Shapiro, and our Advisory Director, Stanley Levy, who also serve in the same capacity for the selling stockholder. This could result in conflicts of interest. See “Risk Factors—Risks Relating to an Investment in Our Class A Common Stock.” The selling stockholder does not currently conduct any business other than managing the Company and has not engaged in any capital-raising activities subsequent to its formation other than those related to the Company and its subsidiaries. We do not control when, if at all, the selling stockholder may cease to be a controlling stockholder of the Company. See “Risk Factors—Risks Relating to Cadence Bancorp, LLC and Our Status as a Controlled Company—We do not have control over when, if at all, the selling stockholder may decide to sell the shares of our Class A common stock that it will beneficially own following this offering.”
Authorization and Purposes of Class B Non-Voting Common Stock and Preferred Stock
Our certificate of incorporation authorizes us to issue up to 300,000,000 shares of Class A common stock, $0.01 par value per share, 300,000,000 shares of Class B non-voting common stock, $0.01 par value per share, and 50,000,000 shares of preferred stock, $0.01 par value per share. As of the date of this registration statement, there were 83,625,000 shares of our Class A common stock outstanding. See “Description of Capital Stock.”
20
Table of Contents
Class B Non-Voting Common Stock
Our certificate of incorporation provides that, except with respect to voting rights and conversion rights, the Class A common stock and Class B non-voting common stock are treated equally and identically. See “Description of Capital Stock—Capital Stock—Class A Common Stock and Class B Non-Voting Common Stock.” Holders of Class B non-voting common stock have no voting power, and have no right to participate in any meeting of stockholders or to have notice thereof, except as required by applicable law and except that any action that would significantly and adversely affect the rights of the Class B non-voting common stock with respect to the modification of the terms of the securities or dissolution will require the approval of the Class B non-voting common stock voting separately as a class.
Although we do not currently have any plans, arrangements or understandings to issue shares of our Class B non-voting common stock and we do not currently have any shares of Class B non-voting common stock outstanding, nor do we expect any shares of Class B non-voting common stock to be outstanding immediately following this offering, our certificate of incorporation authorizes Class B non-voting common stock to provide us with the ability to issue non-voting shares to stockholders if they would otherwise become subject to certain bank regulatory requirements. With certain limited exceptions, federal regulations prohibit a person or company or a group of persons deemed to be “acting in concert” from, directly or indirectly, acquiring more than 10% (or 5% if the acquirer is a bank holding company) of any class of our voting stock, obtaining the ability to control in any manner the election of a majority of our directors or otherwise direct the management or policies of our company without prior notice or application to, and the approval of, the Federal Reserve System (the “Federal Reserve”). See “Risk Factors—Risks Relating to the Regulation of Our Industry—There are substantial regulatory limitations on changes of control of bank holding companies.” As a result, our certificate of incorporation provides that, in certain circumstances, certain of our shares of our Class A common stock held by the selling stockholder, our controlling stockholder, may be converted into shares of our Class B non-voting common stock. See “Description of Capital Stock—Capital Stock—Class A Common Stock and Class B Non-Voting Common Stock—Conversion of Class A Common Stock Upon LLC Distribution.”
Preferred Stock
Although we do not currently have any shares of preferred stock outstanding, nor do we expect to have any shares of preferred stock outstanding immediately following this offering, shares of preferred stock may be issuable from time to time in order to provide us with the ability in the future to raise capital to fund our business and operations.
Summary Risk Factors
There are a number of risks that you should consider before investing in our Class A common stock. These risks are discussed more fully in the section titled “Risk Factors,” beginning on page 34, and include, but are not limited to:
| • | business and economic conditions generally and in the financial services industry, nationally and within our local market areas; |
| • | the unexpected loss of key officers and other members of our management team, upon whom we rely heavily; |
| • | economic, market, operational, liquidity, credit and interest rate risks associated with our business; |
| • | deterioration of our asset quality; |
| • | increased competition in the financial services industry, nationally, regionally or locally, which may adversely affect pricing and terms; |
21
Table of Contents
| • | the fact that the selling stockholder is our controlling stockholder, its management will overlap with ours, and its and its management’s interests may conflict with ours or yours in the future; and |
| • | the fact that we operate in a highly regulated environment, which could restrain our growth and profitability. |
Corporate Information
Our principal executive office is located at 2800 Post Oak Boulevard, Suite 3800, Houston, Texas 77056, and our telephone number is (713) 871-4000. Our website address is www.cadencebancorporation.com. The information contained on our website is not a part of, nor incorporated by reference into, this prospectus.
Recent Developments
Preliminary Unaudited Results as of and for the Year and Quarter Ended December 31, 2017
On January 24, 2018, we issued a press release reporting preliminary unaudited results of operations for the year and three months ended December 31, 2017 that included the information set forth below. We do not intend to update or otherwise revise this preliminary financial information other than through the release of our Form 10-K for the year ended December 31, 2017. These preliminary results should be read in conjunction with the sections titled ‘‘Management’s Discussion and Analysis of Financial Condition and Results of Operations’’ and ‘‘Summary Historical Consolidated Financial Information’’ and our financial statements and related notes thereto presented elsewhere in this prospectus. For additional information related to our preliminary results, see Exhibit 99.1 to the registration statement of which this prospectus forms a part.(1)
| • | Our net income for the fourth quarter of 2017 was $14.7 million. Excluding a one-time charge of $19.0 million, or $0.22 per share recorded in income tax expense (the “one-time tax charge”) related to the enactment of the Tax Cuts and Jobs Act (“Tax Reform”) in December 2017, after-tax earnings for the fourth quarter of 2017 were $33.7 million, representing an increase of $1.1 million, or 3.4%, as compared to the third quarter of 2017, and an increase of $4.7 million, or 16.2%, compared to the fourth quarter of 2016. |
| • | On a per-share basis, our net income for the fourth quarter of 2017 was $0.17 per share. Excluding the one-time tax charge, after-tax earnings per share for the fourth quarter of 2017 was $0.39, the same as that of the third quarter of 2017 and up $0.01 from the fourth quarter of 2016. The year-over-year per share comparison was impacted by the issuance of 8.625 million shares in our initial public offering in April 2017. |
| • | During the fourth quarter of 2017, annualized returns on average assets, common equity and tangible common equity were 0.55%, 4.32% and 5.71%, respectively. During the fourth quarter of 2017, annualized returns on average assets, common equity and tangible common equity(1) excluding the one-time tax charge were 1.26%, 9.92% and 13.11%, respectively, as compared to 1.29%, 9.78% and 13.04%, respectively, for the third quarter of 2017. |
| • | Our net income for the year ended December 31, 2017 was $102.4 million, compared to net income for the year ended December 31, 2016 of $65.8 million. Excluding the one-time tax charge, after-tax earnings for the year ended December 31, 2017 were $121.4 million,(1) an increase of $55.6 million, or 84.5%, compared to the year ended December 31, 2016. |
| 1 | These preliminary unaudited results include non-GAAP financial measures. See “Reconciliation of Non-GAAP Financial Measures” for a reconciliation of our non-GAAP measures to the most directly comparable GAAP financial measures. |
22
Table of Contents
| • | On a per-share basis, our net income for the year ended December 31, 2017 was $1.25 per share, compared to $0.87 per share for the year ended December 31, 2016. Excluding the one-time tax charge, after-tax earnings per share for the year ended December 31, 2017 was $1.48(1) per share, an increase of $0.61 per share, or 71%, as compared to the year ended December 31, 2016. |
| • | Returns on average assets, common equity and tangible common equity(1) for the year ended December 31, 2017 were 1.02%, 8.16% and 11.08%, respectively. Returns on average assets, common equity and tangible common equity(1) excluding the one-time tax charge were 1.21%, 9.68% and 13.14%, respectively, as compared to 0.71%, 6.01% and 8.68%, respectively, for the year ended December 31, 2016. |
| • | Total assets were $10.9 billion as of December 31, 2017, an increase of $1.4 billion, or 14.9%, as compared to $9.5 billion as of December 31, 2016. Loans were $8.3 billion as of December 31, 2017, an increase of $820.7 million, or 11.0%, as compared to $7.4 billion as of December 31, 2016. Core deposits (total deposits excluding brokered) of $8.2 billion as of December 31, 2017 grew $1.2 billion, or 17.8%, from December 31, 2016. |
| • | Tax equivalent net interest margin (“NIM”) for the fourth quarter of 2017 was 3.59% as compared to 3.52% for the third quarter of 2017 and 3.31% for the fourth quarter of 2016. The year-over-year increase in NIM is primarily a result of our asset sensitive balance sheet and earning asset yields increasing more significantly than our funding costs in the recent rising rate environment. The linked quarter increase in NIM was due to timing of recovery accretion on acquired-impaired loans. |
| • | Earning asset yields for the fourth quarter of 2017 were 4.41%, up from 4.30% in the third quarter of 2017 and up from 3.96% in the fourth quarter of 2016. Loan yields were 4.72% as compared to 4.55% for the third quarter of 2017 and 4.26% for the fourth quarter of 2016. Yield on loans, excluding acquired-impaired loans, were 4.47%, 4.41% and 4.03% for the fourth quarter of 2017, third quarter of 2017 and fourth quarter of 2016, respectively. Total cost of deposits for the fourth quarter of 2017 was 69 basis points as compared to 64 basis points in the linked quarter and 47 basis points in the fourth quarter of 2016. Total cost of funds for the fourth quarter of 2017 was 89 basis points as compared to 84 basis points in the linked quarter and 69 basis points in the fourth quarter of 2016. |
| • | Net interest income for the fourth quarter of 2017 was $87.9 million, an increase of $6.7 million, or 8.3%, from the third quarter of 2017 and an increase of $15.4 million, or 21.3%, from the same period 2016. Total accretion for acquired-impaired loans was $8.1 million in the fourth quarter of 2017, up $2.3 million from the third quarter of 2017 and up $0.3 million from the fourth quarter of 2016. |
| • | Noninterest income for the fourth quarter of 2017 was $25.7 million, a decrease of $1.5 million, or 5.4%, from the third quarter of 2017, and an increase of $3.3 million, or 14.7%, from the same period of 2016. The changes were driven primarily by the sale of the assets of a specialty insurance unit in the third quarter of 2017 and the seasonality of mortgage banking revenue and more mortgages being held on the balance sheet versus sold. |
| • | Assets under Management increased to $5.6 billion as of December 31, 2017, an increase of $51.4 million from September 20, 2017 and $266.2 million from December 31, 2016. |
| • | Noninterest expense for the fourth quarter of 2017 was $66.4 million, an increase of $9.8 million from $56.5 million for the third quarter of 2017, and an increase of $11.0 million from $55.4 million during the same period in 2016. Increases in the fourth quarter of 2017 included non-routine expenses related to legacy bank pre-acquisition legal costs, secondary offering costs, consulting and other expenses, including: |
| • | Salaries and employee benefits expense included an increase in incentives of $0.7 million driven by improved operating performance of the bank and company valuation. |
| • | Other real estate (“ORE”) costs for the fourth quarter of 2017 included $0.6 million in ORE writedowns and another $0.4 million in ORE losses on sales, as we reduced our ORE by $11.2 million during the quarter to $7.6 million at December 31, 2017. |
23
Table of Contents
| • | Data processing expense for the fourth quarter of 2017 included $0.5 million in costs associated with a trust system upgrade and conversion. |
| • | Consulting and professional fees in the fourth quarter of 2017 included $1.2 million in expenses specific to the November 2017 secondary offering, and $0.8 million in non-routine tax consulting costs. |
| • | Legal expense for the fourth quarter of 2017 included $2.0 million in legal costs associated with certain pre-acquisition related litigation and contingencies related to a legacy acquired bank. |
| • | Other expenses for the fourth quarter of 2017 included $0.8 million in unfunded commitments provision driven by loan growth, $0.6 million related to technology licensing updates, as well as other seasonal variances in expenses. |
| • | Non-interest expense for the year ended December 31, 2017 was $233.4 million as compared to $220.2 million during the same period of 2016, an increase of $13.2 million, or 6.0%. |
| • | The efficiency ratio(1) for the fourth quarter of 2017 was 58.44%, as compared to the fourth quarter of 2016 and third quarter of 2017 ratios of 58.40% and 52.20%, respectively. The efficiency ratio for the year ended December 31, 2017 was 54.77%, compared to 59.86% in the prior year, reflecting ongoing focus on managing expense and expanding revenue. Total 2017 revenues increased $58.2 million or 15.8% over 2016, while total 2017 expenses increased $13.2 million or 6.0% over 2016. The fourth quarter of 2017 represents the ninth consecutive quarter of improvements in the efficiency ratio for Cadence. |
| • | The effective tax rate for the quarter ended December 31, 2017 was 71.6% as compared to 34.9% in the third quarter of 2017 and 35.1% in the fourth quarter of 2016. Excluding the effects of Tax Reform, our effective tax rate for the quarter and year ended December 31, 2017 was 34.8%(1) and 33.7%, respectively. Considering the effects of Tax Reform, we estimate our effective tax rate will range between 21% to 22% in 2018. |
In addition, we reported selected balance sheet and asset quality information as of and for the three months and year ended December 31, 2017 as follows:
| • | Loans of $8.3 billion, an increase of $224.5 million, or 2.8%, from September 30, 2017, and an increase of $820.7 million, or 11.0%, from December 31, 2016. The increase was driven primarily by our specialized industries, general C&I and residential portfolios, with energy loans representing approximately 11.3% of total loans as of December 31, 2017. As of December 31, 2017, 70% of our loans were floating rate. |
| • | Total deposits of $9.0 billion, an increase of $510.4 million, or 6.0%, from September 30, 2017, and an increase of $994.8 million, or 12.4%, from December 31, 2016. The fourth quarter 2017 deposit increases reflect growth in core deposits, with a key focus on expansion of commercial deposit relationships and treasury management services. |
| • | Noninterest bearing deposits as a percent of total deposits increased to 24.9%, up from 24.4% at September 30, 2017 and 23.0% at December 31, 2016, respectively. |
| • | Brokered deposits of $0.8 million, or 8.8% of total deposits, down from 9.7% and 13.0% of total deposits as of September 30, 2017 and December 31, 2016, respectively. |
| • | Nonperforming assets (“NPAs”) continued to decline during the quarter, totaling $70.7 million, or 0.9%, of total loans, net of unearned income, OREO and other NPAs as of December 31, 2017, down from $121.8 million, or 1.5%, as of September 30, 2017, and down from $166.2 million, or 2.2%, as of December 31, 2016. The decline as compared to the prior year is to continued improvements of energy credits, with energy portfolio NPAs totaling $58.7 million at December 31, 2017 down from $98.2 million at September 30, 2017. As of December 31, 2017, $58.7 million, or 83.0%, of the NPAs |
24
Table of Contents
| related to the energy portfolio. Additionally, of the $42.8 million in energy nonperforming loans included in total NPAs as of December 31, 2017, over 75% were paying in accordance with contractual terms. |
| • | Nonperforming loans, a component of NPAs, declined to 0.58% of total loans, net of unearned income, as of December 31, 2017, down from 1.73% as of December 31, 2016. Energy nonperforming loans were 4.6% of total energy loans as of December 31, 2017, down from 7.7% as of September 30, 2017. Energy loans were 11.3% of total loans as of December 31, 2017, down from 11.6% as of September 30, 2017. |
| • | Net-charge offs as a percent of average loans for the full year amounted to 0.06% in 2017, and an improvement from 0.65% in 2016. Net-charge offs were $2.7 million and $4.4 million for the quarter and year ended December 31, 2017, respectively, as compared to $3.7 million and $46.9 million for the quarter and year ended December 31, 2016, respectively, and $173 thousand for the three months ended September 30, 2017. The allowance for credit losses (“ACL”) was $87.6 million, or 1.06% of total loans, as of December 31, 2017, as compared to $94.8 million, or 1.18% of total loans, as of September 30, 2017 and $82.3 million, or 1.11% of total loans, as of December 30, 2016. The decline in the ACL during the fourth quarter of 2017 compared to the prior quarter resulted primarily from the reduction in non-performing loans and related valuation reserves (largely from the energy portfolio), improved environmental factors in the energy sector, and the reversal of approximately $2.0 million in consumer mortgage reserves recorded in the third quarter of 2017 associated with Hurricanes Harvey and Irma. Loan provisions (reversals) for the fourth quarter of 2017 were $(4.5) million as compared to $(5.2) million in the prior year quarter and $1.7 million in the third quarter of 2017. |
Dividend
On January 24, 2018, our board of directors declared a quarterly cash dividend in the amount of $0.125 per share of outstanding Class A common stock, representing an annualized dividend of $0.50 per share. The dividend will be paid on March 20, 2018 to holders of record on March 1, 2018.
25
Table of Contents
The following tables reconcile the non-GAAP measures referred to in the preliminary unaudited results described above for the periods presented:
Reconciliation of Non-GAAP Financial Measures
| As of and for the Three Months Ended | As of and for the Years Ended December 31, |
|||||||||||||||||||||||||||
| (In thousands) | December 31, 2017 |
September 30, 2017 |
June 30, 2017 |
March 31, 2017 |
December 31, 2016 |
2017 | 2016 | |||||||||||||||||||||
| Efficiency ratio |
||||||||||||||||||||||||||||
| Noninterest expenses (numerator) |
$ | 66,371 | $ | 56,530 | $ | 56,134 | $ | 54,321 | $ | 55,394 | $ | 233,356 | $ | 220,180 | ||||||||||||||
|
|
|
|
|
|
|
|
|
|
|
|
|
|
|
|||||||||||||||
| Net interest income |
$ | 87,911 | $ | 81,163 | $ | 82,384 | $ | 74,758 | $ | 72,498 | $ | 326,216 | $ | 279,439 | ||||||||||||||
| Noninterest income |
25,656 | 27,124 | 22,989 | 24,105 | 22,360 | 99,874 | 88,403 | |||||||||||||||||||||
|
|
|
|
|
|
|
|
|
|
|
|
|
|
|
|||||||||||||||
| Operating revenue (denominator) |
$ | 113,567 | $ | 108,287 | $ | 105,373 | $ | 98,863 | $ | 94,858 | $ | 426,090 | $ | 367,842 | ||||||||||||||
|
|
|
|
|
|
|
|
|
|
|
|
|
|
|
|||||||||||||||
| Efficiency ratio |
58.44 | % | 52.20 | % | 53.27 | % | 54.95 | % | 58.40 | % | 54.77 | % | 59.86 | % | ||||||||||||||
|
|
|
|
|
|
|
|
|
|
|
|
|
|
|
|||||||||||||||
| Adjusted noninterest expenses and operating revenue |
||||||||||||||||||||||||||||
| Noninterest expense |
$ | 66,371 | $ | 56,530 | $ | 56,134 | $ | 54,321 | $ | 55,394 | $ | 233,356 | $ | 220,180 | ||||||||||||||
| Less: Branch closure expenses |
55 | 50 | 47 | 46 | 47 | 198 | 238 | |||||||||||||||||||||
|
|
|
|
|
|
|
|
|
|
|
|
|
|
|
|||||||||||||||
| Adjusted noninterest expenses |
$ | 66,316 | $ | 56,480 | $ | 56,087 | $ | 54,275 | $ | 55,347 | $ | 233,158 | $ | 219,942 | ||||||||||||||
|
|
|
|
|
|
|
|
|
|
|
|
|
|
|
|||||||||||||||
| Net interest income |
$ | 87,911 | $ | 81,163 | $ | 82,384 | $ | 74,758 | $ | 72,498 | $ | 326,216 | $ | 279,439 | ||||||||||||||
| Noninterest income |
25,656 | 27,124 | 22,989 | 24,105 | 22,360 | 99,874 | 88,403 | |||||||||||||||||||||
| Less: Securities gains (losses), net |
16 | 1 | (244 | ) | 81 | 1,267 | (146 | ) | 3,736 | |||||||||||||||||||
|
|
|
|
|
|
|
|
|
|
|
|
|
|
|
|||||||||||||||
| Adjusted operating revenue |
$ | 113,551 | $ | 108,286 | $ | 105,617 | $ | 98,782 | $ | 93,591 | $ | 426,236 | $ | 364,106 | ||||||||||||||
|
|
|
|
|
|
|
|
|
|
|
|
|
|
|
|||||||||||||||
| Tangible common equity ratio |
||||||||||||||||||||||||||||
| Shareholders’ equity |
$ | 1,359,056 | $ | 1,340,848 | $ | 1,304,054 | $ | 1,105,976 | $ | 1,080,498 | $ | 1,359,056 | $ | 1,080,498 | ||||||||||||||
| Less: Goodwill and other intangible assets, net |
(328,040 | ) | (329,124 | ) | (330,261 | ) | (331,450 | ) | (332,691 | ) | (328,040 | ) | (332,691 | ) | ||||||||||||||
|
|
|
|
|
|
|
|
|
|
|
|
|
|
|
|||||||||||||||
| Tangible common shareholders’ equity |
1,031,016 | 1,011,724 | 973,793 | 774,526 | 747,807 | 1,031,016 | 747,807 | |||||||||||||||||||||
|
|
|
|
|
|
|
|
|
|
|
|
|
|
|
|||||||||||||||
| Total assets |
10,948,926 | 10,502,261 | 9,811,557 | 9,720,937 | 9,530,888 | 10,948,926 | 9,530,888 | |||||||||||||||||||||
| Less: Goodwill and other intangible assets, net |
(328,040 | ) | (329,124 | ) | (330,261 | ) | (331,450 | ) | (332,691 | ) | (328,040 | ) | (332,691 | ) | ||||||||||||||
|
|
|
|
|
|
|
|
|
|
|
|
|
|
|
|||||||||||||||
| Tangible assets |
$ | 10,620,886 | $ | 10,173,137 | $ | 9,481,296 | $ | 9,389,487 | $ | 9,198,197 | $ | 10,620,886 | $ | 9,198,197 | ||||||||||||||
|
|
|
|
|
|
|
|
|
|
|
|
|
|
|
|||||||||||||||
| Tangible common equity ratio |
9.71 | % | 9.95 | % | 10.27 | % | 8.25 | % | 8.13 | % | 9.71 | % | 8.13 | % | ||||||||||||||
|
|
|
|
|
|
|
|
|
|
|
|
|
|
|
|||||||||||||||
| Tangible book value per share |
||||||||||||||||||||||||||||
| Shareholders’ equity |
$ | 1,359,056 | $ | 1,340,848 | $ | 1,304,054 | $ | 1,105,976 | $ | 1,080,498 | $ | 1,359,056 | $ | 1,080,498 | ||||||||||||||
| Less: Goodwill and other intangible assets, net |
(328,040 | ) | (329,124 | ) | (330,261 | ) | (331,450 | ) | (332,691 | ) | (328,040 | ) | (332,691 | ) | ||||||||||||||
|
|
|
|
|
|
|
|
|
|
|
|
|
|
|
|||||||||||||||
| Tangible common shareholders’ equity |
$ | 1,031,016 | $ | 1,011,724 | $ | 973,793 | $ | 774,526 | $ | 747,807 | $ | 1,031,016 | $ | 747,807 | ||||||||||||||
|
|
|
|
|
|
|
|
|
|
|
|
|
|
|
|||||||||||||||
| Common shares issued |
83,625,000 | 83,625,000 | 83,625,000 | 75,000,000 | 75,000,000 | 83,625,000 | 75,000,000 | |||||||||||||||||||||
|
|
|
|
|
|
|
|
|
|
|
|
|
|
|
|||||||||||||||
| Tangible book value per share |
$ | 12.33 | $ | 12.10 | $ | 11.64 | $ | 10.33 | $ | 9.97 | $ | 12.33 | $ | 9.97 | ||||||||||||||
|
|
|
|
|
|
|
|
|
|
|
|
|
|
|
|||||||||||||||
| Return on average tangible common equity |
||||||||||||||||||||||||||||
| Average common equity |
$ | 1,348,867 | $ | 1,320,884 | $ | 1,251,217 | $ | 1,090,905 | $ | 1,094,182 | $ | 1,253,861 | $ | 1,093,604 | ||||||||||||||
| Less: Average intangible assets |
(328,697 | ) | (329,816 | ) | (330,977 | ) | (332,199 | ) | (333,640 | ) | (330,411 | ) | (336,054 | ) | ||||||||||||||
|
|
|
|
|
|
|
|
|
|
|
|
|
|
|
|||||||||||||||
| Average tangible common shareholders’ equity |
$ | 1,020,170 | $ | 991,068 | $ | 920,240 | $ | 758,706 | $ | 760,542 | $ | 923,450 | $ | 757,550 | ||||||||||||||
|
|
|
|
|
|
|
|
|
|
|
|
|
|
|
|||||||||||||||
| Net income |
$ | 14,691 | $ | 32,577 | $ | 28,968 | $ | 26,117 | $ | 28,985 | $ | 102,353 | $ | 65,774 | ||||||||||||||
|
|
|
|
|
|
|
|
|
|
|
|
|
|
|
|||||||||||||||
| Return on average tangible common equity(1) |
5.71 | % | 13.04 | % | 12.63 | % | 13.96 | % | 15.16 | % | 11.08 | % | 8.68 | % | ||||||||||||||
|
|
|
|
|
|
|
|
|
|
|
|
|
|
|
|||||||||||||||
| Pre-tax, pre-provision net earnings |
||||||||||||||||||||||||||||
| Income before taxes |
$ | 51,671 | $ | 50,034 | $ | 42,538 | $ | 38,756 | $ | 44,686 | $ | 182,999 | $ | 98,314 | ||||||||||||||
| Plus: Provision for credit losses |
(4,475 | ) | 1,723 | 6,701 | 5,786 | (5,222 | ) | 9,735 | 49,348 | |||||||||||||||||||
|
|
|
|
|
|
|
|
|
|
|
|
|
|
|
|||||||||||||||
| Pre-tax, pre-provision net earnings |
$ | 47,196 | $ | 51,757 | $ | 49,239 | $ | 44,542 | $ | 39,464 | $ | 192,734 | $ | 147,662 | ||||||||||||||
|
|
|
|
|
|
|
|
|
|
|
|
|
|
|
|||||||||||||||
26
Table of Contents
| As of and for the Three Months Ended |
As of and for the Year Ended |
|||||||
| (In thousands) | December 31, 2017 | December 31, 2017 | ||||||
| Reconciliation of Non-GAAP Financial Measures Related to One-Time Tax Charge |
||||||||
| Net income excluding one-time tax charge |
||||||||
| Net income |
$ | 14,691 | $ | 102,353 | ||||
| Add: One-time tax charge |
19,022 | 19,022 | ||||||
|
|
|
|
|
|||||
| Net income excluding one-time tax charge |
$ | 33,713 | $ | 121,375 | ||||
|
|
|
|
|
|||||
| Earnings per share |
||||||||
| Earnings per diluted common share |
$ | 0.17 | $ | 1.25 | ||||
| One-time tax charge per share |
0.22 | 0.23 | ||||||
|
|
|
|
|
|||||
| Earnings per diluted common share excluding one-time tax charge |
$ | 0.39 | $ | 1.48 | ||||
|
|
|
|
|
|||||
| Return on Average Assets |
||||||||
| Net income excluding one-time tax charge |
$ | 33,713 | $ | 121,375 | ||||
| Average assets |
10,586,245 | 10,020,036 | ||||||
|
|
|
|
|
|||||
| Return on average assets excluding one-time tax charge(1) |
1.26 | % | 1.21 | % | ||||
|
|
|
|
|
|||||
| Return on Average Common Equity |
||||||||
| Net income excluding one-time tax charge |
$ | 33,713 | $ | 121,375 | ||||
| Average common equity |
1,348,867 | 1,253,861 | ||||||
|
|
|
|
|
|||||
| Return on average common equity excluding one-time tax charge(1) |
9.92 | % | 9.68 | % | ||||
|
|
|
|
|
|||||
| Return on Average Tangible Common Equity |
||||||||
| Net income excluding one-time tax charge |
$ | 33,713 | $ | 121,375 | ||||
| Average tangible common shareholders’ equity |
1,020,170 | 923,450 | ||||||
|
|
|
|
|
|||||
| Return on average tangible common shareholder’s equity excluding one-time tax charge(1) |
13.11 | % | 13.14 | % | ||||
|
|
|
|
|
|||||
| Effective Tax Rate |
||||||||
| Income before taxes |
$ | 51,671 | $ | 182,999 | ||||
|
|
|
|
|
|||||
| Income tax expense |
36,980 | 80,646 | ||||||
| Less: one-time tax charge |
19,022 | 19,022 | ||||||
|
|
|
|
|
|||||
| Income tax expense excluding one-time tax charge |
17,958 | 61,624 | ||||||
|
|
|
|
|
|||||
| Effective tax rate excluding one-time tax charge |
34.8 | % | 33.7 | % | ||||
|
|
|
|
|
|||||
| (1) | Annualized for the three-month periods. |
The preliminary financial results presented above are not a comprehensive statement of our financial performance for the year and quarter ended December 31, 2017. Our independent registered public accounting firm, Ernst & Young LLP, has not audited or reviewed, and does not express an opinion with respect to this information. When our Form 10-K for the year ended December 31, 2017 is filed with the SEC, it will contain additional disclosure and any adjustments necessary, in the opinion of management, for a fair presentation of such information. We are required to consider all available information through the finalization of our financial statements and their possible impact on our financial conditions and results of operations for the period, including the impact of such information on the complex judgments and estimates referred to above. As a result, subsequent information or events may lead to material differences between the information about the results of operations described herein and the results of operations described in our subsequent quarterly report. Accordingly, you should not place undue reliance on these preliminary financial results.
27
Table of Contents
| Class A common stock offered by the selling stockholder |
7,000,000 shares. |
| Option to purchase additional shares of Class A common stock from the selling stockholder |
1,050,000 shares. |
| Common stock to be outstanding after this offering |
83,625,000 shares of Class A common stock and no shares of Class B non-voting common stock.1 |
| Use of proceeds |
We will not receive any of the proceeds from the sale of the shares of Class A common stock being sold in this offering. All of the shares in this offering are being sold by the selling stockholder. |
| Regulatory ownership restrictions |
We are a bank holding company. A holder of shares of common stock (or group of holders acting in concert) that (i) directly or indirectly owns, controls or has the power to vote 5% or more (if the holder is a bank holding company) or 10% or more (for any other holders) of any class of voting securities of the Company, (ii) directly or indirectly owns, controls or has the power to vote 25% or more of the total equity of the Company, or (iii) is otherwise deemed to “control” the Company under applicable regulatory standards, may be subject to important restrictions and notice or approval requirements. For a further discussion of regulatory ownership restrictions, see “Supervision and Regulation.” |
| Dividends |
On January 24, 2018, our board of directors declared a quarterly cash dividend in the amount of $0.125 per share of outstanding Class A common stock, representing an annualized dividend of $0.50 per share. The dividend will be paid on March 20, 2018 to holders of record on March 1, 2018. Although we currently expect to continue to pay quarterly dividends, any future determination to pay dividends on our common stock will be made by our board of directors and will depend upon our results of operations, financial condition, capital requirements, regulatory and contractual restrictions, our business strategy and other factors that our board of directors deems relevant. See “Dividend Policy.” |
| 1 | Based on 83,625,000 shares of Class A common stock and no shares of Class B non-voting common stock issued and outstanding as of the date of this registration statement. Unless otherwise indicated, information contained in this prospectus regarding the number of shares of our common stock outstanding immediately after this offering does not include: |
| • | 6,827,250 shares of Class A common stock reserved for future issuance under the Cadence Bancorporation 2015 Omnibus Incentive Plan; and |
| • | 672,750 performance-based restricted stock unit awards granted and treated as issued for financial reporting purposes but due to performance-based restriction, not yet actually issued or vested under the Cadence Bancorporation 2015 Omnibus Incentive Plan. Accordingly, such performance-based restricted stock unit awards treated as issued may vary depending on performance factors. |
28
Table of Contents
| Class A common stock and Class B |
Our Class A common stock possesses all of the voting power for all matters requiring action by holders of our common stock, with certain limited exceptions. Our certificate of incorporation provides that, except with respect to voting rights and conversion rights, the Class A common stock and Class B non-voting common stock are treated equally and identically. See “Description of Capital Stock.” |
| Listing |
Our Class A common stock is listed on the NYSE under the trading symbol “CADE.” |
| Risk factors |
Investing in our common stock involves risks. See “Risk Factors,” beginning on page 34, for a discussion of certain factors that you should carefully consider before making an investment decision. |
Unless otherwise indicated, the information contained in this prospectus is as of the date set forth on the cover of this prospectus, and assumes that the underwriters’ option to purchase additional shares is not exercised.
29
Table of Contents
Summary Selected Historical Consolidated Financial Information
The following table summarizes certain selected consolidated financial data for the periods presented. The selected historical financial data as of and for the three and nine months ended September 30, 2017 and 2016 have been derived from our unaudited interim consolidated financial statements, and the selected historical financial data as of and for the years ended December 31, 2016, 2015 and 2014 have been derived from our audited consolidated financial statements, both of which are included elsewhere in this prospectus.
The historical consolidated financial information presented below contains financial measures that are not presented in accordance with U.S. generally accepted accounting principles and which have not been audited. See “Non-GAAP Financial Measures.”
You should read the following information, together with “Risk Factors,” “Use of Proceeds,” “Capitalization,” “Management’s Discussion and Analysis of Financial Condition and Results of Operations,” and our consolidated financial statements and notes thereto included elsewhere in this prospectus.
| As of and for the Three Months Ended September 30, |
As of and for the Nine Months Ended September 30, |
As of and for the Years Ended December 31, |
||||||||||||||||||||||||||
| 2017 | 2016 | 2017 | 2016 | 2016 | 2015 | 2014 | ||||||||||||||||||||||
| (In thousands, except per share data) |
||||||||||||||||||||||||||||
| Statement of Income Data: |
||||||||||||||||||||||||||||
| Interest and dividend income |
$ | 99,503 | $ | 84,654 | $ | 288,497 | $ | 248,182 | $ | 335,250 | $ | 293,067 | $ | 287,246 | ||||||||||||||
| Interest expense |
18,340 | 14,228 | 50,192 | 41,241 | 55,811 | 45,289 | 32,158 | |||||||||||||||||||||
|
|
|
|
|
|
|
|
|
|
|
|
|
|
|
|||||||||||||||
| Net interest income |
81,163 | 70,426 | 238,305 | 206,941 | 279,439 | 247,778 | 255,088 | |||||||||||||||||||||
| Provision for credit losses |
1,723 | 29,627 | 14,210 | 54,570 | 49,348 | 35,984 | 14,118 | |||||||||||||||||||||
|
|
|
|
|
|
|
|
|
|
|
|
|
|
|
|||||||||||||||
| Net interest income after provision |
79,440 | 40,799 | 224,095 | 152,371 | 230,091 | 211,794 | 240,970 | |||||||||||||||||||||
| Noninterest income |
||||||||||||||||||||||||||||
| —service fees and revenue |
23,014 | 20,879 | 67,647 | 61,416 | 81,976 | 79,437 | 71,743 | |||||||||||||||||||||
| —other noninterest income |
4,110 | 1,912 | 6,571 | 4,627 | 6,427 | 466 | 3,327 | |||||||||||||||||||||
| Noninterest expense |
56,530 | 54,876 | 166,985 | 164,786 | 220,180 | 232,332 | 245,147 | |||||||||||||||||||||
|
|
|
|
|
|
|
|
|
|
|
|
|
|
|
|||||||||||||||
| Income before income taxes |
50,034 | 8,714 | 131,328 | 53,628 | 98,314 | 59,365 | 70,893 | |||||||||||||||||||||
| Income tax expense |
17,457 | 2,107 | 43,666 | 16,839 | 32,540 | 20,109 | 26,060 | |||||||||||||||||||||
|
|
|
|
|
|
|
|
|
|
|
|
|
|
|
|||||||||||||||
| Net income |
32,577 | 6,607 | 87,662 | 36,789 | 65,774 | 39,256 | 44,833 | |||||||||||||||||||||
| Preferred stock dividends |
— | — | — | — | — | — | 1,370 | |||||||||||||||||||||
| Accretion of discount on preferred stock |
— | — | — | — | — | — | 2,273 | |||||||||||||||||||||
|
|
|
|
|
|
|
|
|
|
|
|
|
|
|
|||||||||||||||
| Net income available to common shareholders |
$ | 32,577 | $ | 6,607 | $ | 87,662 | $ | 36,789 | $ | 65,774 | $ | 39,256 | $ | 41,190 | ||||||||||||||
|
|
|
|
|
|
|
|
|
|
|
|
|
|
|
|||||||||||||||
| Period-End Balance Sheet Data: |
||||||||||||||||||||||||||||
| Investment securities, available-for-sale |
$ | 1,198,032 | $ | 1,031,319 | $ | 1,198,032 | $ | 1,031,319 | $ | 1,139,347 | $ | 720,810 | $ | 552,397 | ||||||||||||||
| Total loans, net of unearned income |
8,028,938 | 7,207,313 | 8,028,938 | 7,207,313 | 7,432,711 | 6,916,520 | 6,192,793 | |||||||||||||||||||||
| Originated loans |
7,556,135 | 6,618,324 | 7,556,135 | 6,618,324 | 6,878,645 | 6,186,465 | 5,120,227 | |||||||||||||||||||||
| Acquired noncredit impaired loans (“ANCI”) |
198,797 | 242,026 | 198,797 | 242,026 | 229,784 | 295,911 | 440,915 | |||||||||||||||||||||
| Acquired credit impaired loans (“ACI”) |
274,006 | 346,963 | 274,006 | 346,963 | 324,282 | 434,144 | 631,651 | |||||||||||||||||||||
| Allowance for credit losses (“ACL”) |
94,765 | 91,169 | 94,765 | 91,169 | 82,268 | 79,783 | 53,520 | |||||||||||||||||||||
| ACL—originated loans |
84,725 | 79,944 | 84,725 | 79,944 | 71,012 | 64,386 | 32,242 | |||||||||||||||||||||
| ACL—ANCI loans |
1,458 | 694 | 1,458 | 694 | 978 | 1,063 | 1,475 | |||||||||||||||||||||
| ACL—ACI loans |
8,582 | 10,531 | 8,582 | 10,531 | 10,278 | 14,334 | 19,803 | |||||||||||||||||||||
| Total assets |
10,502,261 | 9,444,010 | 10,502,261 | 9,444,010 | 9,530,888 | 8,811,511 | 7,944,804 | |||||||||||||||||||||
| Total deposits |
8,501,102 | 7,917,289 | 8,501,102 | 7,917,289 | 8,016,749 | 6,987,351 | 6,579,889 | |||||||||||||||||||||
| Noninterest-bearing deposits |
2,071,594 | 1,642,480 | 2,071,594 | 1,642,480 | 1,840,955 | 1,534,433 | 1,467,137 | |||||||||||||||||||||
| Interest-bearing deposits |
6,429,508 | 6,274,809 | 6,429,508 | 6,274,809 | 6,175,794 | 5,452,918 | 5,112,752 | |||||||||||||||||||||
| Borrowings and subordinated debentures |
572,683 | 332,787 | 572,683 | 332,787 | 331,712 | 702,545 | 288,067 | |||||||||||||||||||||
| Total shareholders’ equity |
1,340,848 | 1,111,783 | 1,340,848 | 1,111,783 | 1,080,498 | 1,054,208 | 1,014,337 | |||||||||||||||||||||
30
Table of Contents
| As of and for the Three Months Ended September 30, |
As of and for the Nine Months Ended September 30, |
As of and for the Years Ended December 31, |
||||||||||||||||||||||||||
| 2017 | 2016 | 2017 | 2016 | 2016 | 2015 | 2014 | ||||||||||||||||||||||
| (In thousands, except share data) |
||||||||||||||||||||||||||||
| Per Share Data: |
||||||||||||||||||||||||||||
| Earnings |
||||||||||||||||||||||||||||
| Basic |
$ | 0.39 | $ | 0.09 | $ | 1.09 | $ | 0.49 | $ | 0.88 | $ | 0.52 | $ | 0.55 | ||||||||||||||
| Diluted(1) |
0.39 | 0.09 | 1.09 | 0.49 | 0.87 | 0.52 | 0.55 | |||||||||||||||||||||
| Book value per common share |
16.03 | 14.82 | 16.03 | 14.82 | 14.41 | 14.06 | 13.52 | |||||||||||||||||||||
| Tangible book value(2) |
12.10 | 10.37 | 12.10 | 10.37 | 9.97 | 9.53 | 8.89 | |||||||||||||||||||||
| Weighted average common shares outstanding |
||||||||||||||||||||||||||||
| Basic |
83,625,000 | 75,000,000 | 80,212,912 | 75,000,000 | 75,000,000 | 75,000,000 | 75,000,000 | |||||||||||||||||||||
| Diluted(1) |
83,955,685 | 75,258,375 | 80,558,337 | 75,258,375 | 75,294,600 | 75,116,100 | 75,000,000 | |||||||||||||||||||||
| Performance Ratios: |
||||||||||||||||||||||||||||
| Return on average common equity(4) |
9.78 | % | 2.35 | % | 9.59 | % | 4.49 | % | 6.01 | % | 3.78 | % | 4.15 | % | ||||||||||||||
| Return on average equity(4) |
9.78 | 2.35 | 9.59 | 4.49 | 6.01 | 3.78 | 4.44 | |||||||||||||||||||||
| Return on average tangible common |
13.04 | 3.36 | 13.16 | 6.50 | 8.68 | 5.65 | 6.45 | |||||||||||||||||||||
| Return on average assets(4) |
1.29 | 0.28 | 1.19 | 0.54 | 0.71 | 0.47 | 0.64 | |||||||||||||||||||||
| Net interest margin(4) |
3.52 | 3.27 | 3.56 | 3.30 | 3.30 | 3.29 | 4.06 | |||||||||||||||||||||
| Service fees and revenue to average |
0.91 | 0.88 | 0.92 | 0.90 | 0.89 | 0.96 | 1.02 | |||||||||||||||||||||
| Efficiency ratio(2) |
52.20 | 58.87 | 53.43 | 60.36 | 59.86 | 70.90 | 74.25 | |||||||||||||||||||||
| Asset Quality Ratios: |
||||||||||||||||||||||||||||
| Total nonperforming assets (“NPAs”) to total loans plus OREO and NPIs(5) |
1.51 | % | 2.52 | % | 1.51 | % | 2.52 | % | 2.22 | % | 1.48 | % | 1.15 | % | ||||||||||||||
| Originated portfolio NPAs to originated loans plus OREO and NPIs(5) |
1.32 | 2.34 | 1.32 | 2.34 | 2.04 | 0.89 | 0.13 | |||||||||||||||||||||
| ANCI NPAs to ANCI loans plus OREO and NPIs |
1.91 | 1.40 | 1.91 | 1.40 | 1.74 | 1.71 | 1.52 | |||||||||||||||||||||
| ACI NPAs to ACI loans plus OREO and NPIs |
6.18 | 6.53 | 6.18 | 6.53 | 6.24 | 9.13 | 8.66 | |||||||||||||||||||||
| Total ACL to total loans |
1.18 | 1.26 | 1.18 | 1.26 | 1.11 | 1.15 | 0.86 | |||||||||||||||||||||
| ACL to originated loans |
1.12 | 1.21 | 1.12 | 1.21 | 1.03 | 1.04 | 0.63 | |||||||||||||||||||||
| ACL to ANCI loans |
0.73 | 0.29 | 0.73 | 0.29 | 0.43 | 0.36 | 0.33 | |||||||||||||||||||||
| ACL to ACI loans |
3.13 | 3.04 | 3.13 | 3.04 | 3.17 | 3.30 | 3.14 | |||||||||||||||||||||
| ACL to total nonperforming loans (“NPLs”)(5) |
122.66 | 59.34 | 122.66 | 59.34 | 63.80 | 114.25 | 219.64 | |||||||||||||||||||||
| ACL to originated loans NPLs(5) |
115.07 | 54.50 | 115.07 | 54.50 | 58.49 | 116.56 | 498.48 | |||||||||||||||||||||
| ACL to ANCI NPLs |
42.86 | 21.21 | 42.86 | 21.21 | 25.29 | 30.10 | 35.26 | |||||||||||||||||||||
| ACL to ACI NPLs |
NM | 284.24 | NM | 284.24 | 280.59 | 129.53 | 144.38 | |||||||||||||||||||||
| Net charge-offs to average loans(4) |
0.01 | 1.41 | 0.03 | 0.81 | 0.65 | 0.15 | 0.09 | |||||||||||||||||||||
| Capital Ratios: |
||||||||||||||||||||||||||||
| Total shareholders’ equity to assets |
12.77 | % | 11.77 | % | 12.77 | % | 11.77 | % | 11.34 | % | 11.96 | % | 12.77 | % | ||||||||||||||
| Tangible common equity ratio(2) |
9.95 | 8.54 | 9.95 | 8.54 | 8.13 | 8.44 | 8.78 | |||||||||||||||||||||
| Common equity tier 1 (CET1) (transitional)(3) |
10.79 | 8.82 | 10.79 | 8.82 | 8.84 | 8.70 | NA | |||||||||||||||||||||
| Tier 1 leverage capital |
11.12 | 8.73 | 11.12 | 8.73 | 8.89 | 9.20 | 9.50 | |||||||||||||||||||||
| Tier 1 common capital(3) |
NA | NA | NA | NA | NA | NA | 8.71 | |||||||||||||||||||||
| Tier 1 risk-based capital |
11.17 | 9.17 | 11.17 | 9.17 | 9.19 | 9.00 | 9.20 | |||||||||||||||||||||
| Total risk-based capital |
13.18 | 11.38 | 13.18 | 11.38 | 11.22 | 11.10 | 10.70 | |||||||||||||||||||||
| (1) | Includes common stock equivalents (“CSE”) of 330,685 and 258,375 for the three months ended September 30, 2017 and 2016, 345,425 and 258,375 for the nine months ended September 30, 2017 and 2016, and 294,600, 116,100 and -0- for the years ended December 31, 2016, 2015 and 2014. |
| (2) | Considered a non-GAAP financial measure. See “Non-GAAP Financial Measures” for a reconciliation of our non-GAAP measures to the most directly comparable GAAP financial measure. |
| (3) | As of January 1, 2015, the capital component common equity Tier 1 became applicable under the Federal Reserve’s revised regulatory capital rules. See “Supervision and Regulation—Bank Holding Company Regulation—Regulatory Capital” for additional information about common equity Tier 1 and the Federal Reserve’s revised regulatory capital rules. |
31
Table of Contents
| (4) | Annualized for the three and nine months ended September 30, 2017 and 2016. |
| (5) | Included in our NPAs as of September 30, 2017 is a $9.9 million nonperforming energy credit that was reclassified as held-for-sale (HFS) and is being carried at lower of cost or market value (“LOCOM”). Because the credit was reclassified to HFS it has not been included in our investment loan portfolio ratios in order for these ratios to be comparable to prior periods. |
NM—not meaningful.
32
Table of Contents
The following table summarizes certain selected unaudited quarterly consolidated financial data for the periods presented. You should read the following information, together with “Risk Factors,” “Use of Proceeds,” “Capitalization,” “Management’s Discussion and Analysis of Financial Condition and Results of Operations,” and our consolidated financial statements and notes thereto included elsewhere in this prospectus.
| As of and for the three months ended | ||||||||||||||||||||
| September 30, 2017 |
June 30, 2017 |
March 31, 2017 |
December 31, 2016 |
September 30, 2016 |
||||||||||||||||
| (In thousands, except share data) | ||||||||||||||||||||
| Statement of Operations Data: |
||||||||||||||||||||
| Net interest income |
$ | 81,163 | $ | 82,384 | $ | 74,758 | $ | 72,498 | $ | 70,426 | ||||||||||
| Provision for credit losses |
1,723 | 6,701 | 5,786 | (5,222 | ) | 29,627 | ||||||||||||||
|
|
|
|
|
|
|
|
|
|
|
|||||||||||
| Net interest income after provision |
79,440 | 75,683 | 68,972 | 77,720 | 40,799 | |||||||||||||||
| Noninterest income |
27,124 | 22,989 | 24,105 | 22,360 | 22,791 | |||||||||||||||
| Noninterest expense |
56,530 | 56,134 | 54,321 | 55,394 | 54,876 | |||||||||||||||
|
|
|
|
|
|
|
|
|
|
|
|||||||||||
| Income before income taxes |
50,034 | 42,538 | 38,756 | 44,686 | 8,714 | |||||||||||||||
| Income tax expense |
17,457 | 13,570 | 12,639 | 15,701 | 2,107 | |||||||||||||||
|
|
|
|
|
|
|
|
|
|
|
|||||||||||
| Net income |
$ | 32,577 | $ | 28,968 | $ | 26,117 | $ | 28,985 | $ | 6,607 | ||||||||||
|
|
|
|
|
|
|
|
|
|
|
|||||||||||
| Period-End Balance Sheet Data: |
||||||||||||||||||||
| Total assets |
$ | 10,502,261 | $ | 9,811,557 | $ | 9,720,937 | $ | 9,530,888 | $ | 9,444,010 | ||||||||||
| Total loans, net of unearned income |
8,028,938 | 7,716,621 | 7,561,472 | 7,432,711 | 7,207,313 | |||||||||||||||
| Total investment securities, available-for-sale |
1,198,032 | 1,079,935 | 1,116,280 | 1,139,347 | 1,031,319 | |||||||||||||||
| Total deposits |
8,501,102 | 7,930,383 | 7,841,710 | 8,016,749 | 7,917,289 | |||||||||||||||
| Total shareholders’ equity |
1,340,848 | 1,304,054 | 1,105,976 | 1,080,498 | 1,111,783 | |||||||||||||||
| Performance Ratios: |
||||||||||||||||||||
| Net interest margin(1) |
3.52 | % | 3.71 | % | 3.46 | % | 3.31 | % | 3.27 | % | ||||||||||
| Efficiency ratio(2) |
52.20 | 53.27 | 54.95 | 58.40 | 58.87 | |||||||||||||||
| Return on average assets(1) |
1.29 | 1.19 | 1.10 | 1.20 | 0.28 | |||||||||||||||
| Return on average tangible common equity(1)(2) |
13.04 | 12.63 | 13.96 | 15.16 | 3.36 | |||||||||||||||
| Asset Quality Ratios: |
||||||||||||||||||||
| Total NPAs to total loans plus OREO and NPIs |
1.51 | % | 1.82 | % | 2.25 | % | 2.22 | % | 2.51 | % | ||||||||||
| Net charge-offs (recoveries) to average loans(1) |
0.01 | 0.09 | (0.01 | ) | 0.20 | 1.41 | ||||||||||||||
| Total ACL to total loans |
1.18 | 1.21 | 1.17 | 1.11 | 1.26 | |||||||||||||||
| ACL to total NPLs |
122.66 | 88.81 | 65.80 | 63.83 | 59.34 | |||||||||||||||
| Capital Ratios: |
||||||||||||||||||||
| Total shareholders’ equity to assets |
12.77 | % | 13.29 | % | 11.38 | % | 11.34 | % | 11.77 | % | ||||||||||
| Tangible common equity to tangible assets(2) |
9.95 | 10.27 | 8.25 | 8.13 | 8.54 | |||||||||||||||
| Common equity tier 1 (CET1) (transitional) |
10.79 | 10.92 | 8.99 | 8.84 | 8.82 | |||||||||||||||
| Tier 1 leverage capital |
11.12 | 11.00 | 9.10 | 8.89 | 8.73 | |||||||||||||||
| Tier 1 risk-based capital |
11.17 | 11.31 | 9.36 | 9.19 | 9.17 | |||||||||||||||
| Total risk-based capital |
13.18 | 13.41 | 11.43 | 11.22 | 11.38 | |||||||||||||||
| (1) | Annualized for each three month period. |
| (2) | Considered a non-GAAP financial measure. See “Non-GAAP Financial Measures” for a reconciliation of our non-GAAP measures to the most directly comparable GAAP financial measure. |
33
Table of Contents
Investment in our Class A common stock involves a high degree of risk. In addition to other information contained in this prospectus, you should carefully consider the following factors before acquiring shares of our Class A common stock offered by this prospectus. The occurrence of any of the following risks might cause you to lose all or a part of your investment. Some statements in this prospectus, including statements in the following risk factors section, constitute forward-looking statements. Please refer to “Cautionary Note Regarding Forward-Looking Statements.”
Risks Relating to Our Business
As a business operating in the financial services industry, our business and operations may be adversely affected in numerous and complex ways by economic conditions.
Our businesses and operations, which primarily consist of commercial banking activities, including offering financial products and services to middle-market commercial business, high net worth individuals and business owners, are sensitive to business and economic conditions in the United States generally and in Texas and the southeast United States, the principal markets where we conduct business, in particular. The economic conditions in these local markets may be different from the economic conditions in the United States as a whole. If the U.S. economy or the economy in any of our principal markets weaken, our growth and profitability from our lending, deposit and investment operations could be constrained. Uncertainty about the federal fiscal policy-making process, the medium- and long-term fiscal outlook of the federal government, and future tax rates and tax policies is a concern for businesses, consumers and investors in the United States, including our customers. In addition, economic conditions in foreign countries, could affect the stability of global financial markets, which could hinder U.S. economic growth. For example, the potential for hostilities with North Korea, political and civil unrest in the Middle East and in Eastern Europe and Russia and concerns about the European Union (“EU”), including Britain’s June 23, 2016 referendum to exit the EU and the stability of the EU’s sovereign debt, have caused uncertainty and disruption for financial markets globally. It is possible that other EU member states may experience financial troubles in the future, or may choose to follow Britain’s lead and leave the EU. Weak economic conditions are characterized by deflation, fluctuations in debt and equity capital markets, a lack of liquidity and/or depressed prices in the secondary market for mortgage loans, increased delinquencies on mortgage, consumer and commercial loans, residential and commercial real estate price declines, and lower home sales and commercial activity. The current economic environment is also characterized by interest rates at historically low levels, which impacts our ability to attract deposits and to generate attractive earnings through our investment portfolio. All of these factors are detrimental to our business, and the interplay between these factors can be complex and unpredictable. Unfavorable market conditions can result in a deterioration in the credit quality of our borrowers and the demand for our products and services, an increase in the number of loan delinquencies, defaults and charge-offs, additional provisions for credit losses, adverse asset values, and an overall material adverse effect on the quality of our loan portfolio.
Our business is also significantly affected by monetary and related policies of the U.S. federal government and its agencies. Changes in any of these policies are influenced by macroeconomic conditions and other factors that are beyond our control. Adverse economic conditions and government policy responses to such conditions could have a material adverse effect on our business, financial condition and results of operations. It is not clear what impact, if any, the U.S. presidential administration will have on U.S. monetary policies or what policy responses the administration may seek to implement in the event of changing economic conditions.
Our success will depend in significant part upon our ability to maintain a sufficiently large interest margin between the rates of interest we receive on loans and other investments and the rates we pay out on deposits and other liabilities. The monetary and economic factors listed above, and the need to pay rates sufficient to attract deposits, may adversely affect our ability to maintain an interest margin sufficient to result in operating profits.
34
Table of Contents
Our business depends on our ability to successfully manage credit risk.
Our business depends on our ability to successfully measure and manage credit risk. As a lender, we are exposed to the risk that the principal of, or interest on, a loan will not be repaid timely or at all or that the value of any collateral supporting a loan will be insufficient to cover our outstanding exposure. In addition, we are exposed to risks with respect to the period of time over which the loan may be repaid, risks relating to proper loan underwriting, risks resulting from changes in economic and industry conditions, and risks inherent in dealing with individual loans and borrowers. The creditworthiness of a borrower is affected by many factors including local market conditions and general economic conditions. If the overall economic climate in the United States, generally, or our market areas, specifically, experiences material disruption, our borrowers may experience difficulties in repaying their loans, the collateral we hold may decrease in value or become illiquid, and the level of nonperforming loans, charge-offs and delinquencies could rise and require significant additional provisions for credit losses. Additional factors related to the credit quality of commercial loans include the quality of the management of the business and the borrower’s ability both to properly evaluate changes in the supply and demand characteristics affecting our market for products and services and to effectively respond to those changes. Additional factors related to the credit quality of commercial real estate loans include tenant vacancy rates and the quality of management of the property.
Our risk management practices, such as monitoring the concentration of our loans within specific industries and our credit approval, review and administrative practices, may not adequately reduce credit risk, and our credit administration personnel, policies and procedures may not adequately adapt to changes in economic or any other conditions affecting customers and the quality of the loan portfolio. Many of our loans are made to small and medium-sized businesses that are less able to withstand competitive, economic and financial pressures than larger borrowers. Consequently, we may have significant exposure if any of these borrowers becomes unable to pay their loan obligations as a result of economic or market conditions, or personal circumstances, such as divorce or death. A failure to effectively measure and limit the credit risk associated with our loan portfolio may result in loan defaults, foreclosures and additional charge-offs, and may necessitate that we significantly increase our allowance for credit losses, each of which could adversely affect our net income. As a result, our inability to successfully manage credit risk could have a material adverse effect on our business, financial condition and results of operations.
Our allowance for credit losses may prove to be insufficient to absorb potential losses in our loan portfolio, which may adversely affect our business, financial condition and results of operations.
As a lender, we are exposed to the risk that our customers will be unable to repay their loans in accordance with their terms and that any collateral securing the payment of their loans may not be sufficient to assure repayment. Credit losses are inherent in the business of making loans and could have a material adverse effect on our operating results. We have established our allowance for credit losses, or ACL, and maintain it at a level considered adequate by management to absorb probable credit losses based on our analysis of the quality of our loan portfolio, market environment and other factors we deem to be relevant to this analysis. The allowance for credit losses represents our estimate of probable losses in the portfolio at each balance sheet date and is based upon relevant information available to us. The allowance contains provisions for probable losses that have been identified relating to specific borrowing relationships, as well as probable losses inherent in the loan portfolio and credit undertakings that are not specifically identified. Additions to the allowance for credit losses, which are charged to earnings through the provision for credit losses, are determined based on a variety of factors, including an analysis of the loan portfolio, historical loss experience and an evaluation of current economic conditions in our market areas. The determination of the appropriate level of the allowance for credit losses inherently involves a high degree of subjectivity and requires us to make significant estimates of current credit risks and future trends, all of which may undergo material changes. Although our management has established an allowance for credit losses it believes is adequate to absorb probable and reasonably estimable losses in our loan portfolio, the allowance may not be adequate. We could sustain credit losses that are significantly higher than the amount of our allowance for credit losses. Higher credit losses could arise for a variety of reasons, including
35
Table of Contents
changes in economic, operating and other conditions within our markets, as well as changes in the financial condition, cash flows, and operations of our borrowers.
As of September 30, 2017, our allowance for credit losses as a percentage of total loans was 1.18% and as a percentage of total nonperforming loans was 122.66%. Additional credit losses will likely occur in the future and may occur at a rate greater than we have previously experienced. We may be required to take additional provisions for credit losses in the future to further supplement the allowance for credit losses, either due to management’s decision to do so or requirements by our banking regulators. In addition, bank regulatory agencies will periodically review our allowance for credit losses, the policies and procedures we use to determine the level of the allowance and the value attributed to nonperforming loans or to real estate acquired through foreclosure. Such regulatory agencies may require us to recognize future charge-offs. In addition, in June 2016, the Financial Accounting Standards Board issued a new accounting standard that will replace the current approach under GAAP for establishing allowances for credit losses, which generally considers only past event and current conditions, with a forward-looking methodology that reflects the expected credit losses over the lives of financial assets, starting when such assets are first acquired. Under the revised methodology, credit losses will be measured based on past events, current conditions and reasonable and supportable forecasts that affect the collectability of financial assets. The standard is expected to result in increases to allowance levels generally and will require the application of the revised methodology to existing financial assets through a one-time adjustment to retained earnings upon initial effectiveness. The standard will be effective for us in 2020. See “Notes to Consolidated Financial Statements—Note 1—Summary of Accounting Policies—Pending Accounting Pronouncements” for additional information about the standard. Any increases in the allowance for credit losses will result in a decrease in net income and, if the increases reduce retained earnings and capital, it could have a material adverse effect on our business, financial condition and results of operations.
The security interest that we have in our clients’ assets may not be sufficient to protect us from a partial or complete loss if we are required to foreclose.
Lending is a substantial part of our business, and each loan carries a certain risk that it will not be repaid in accordance with its terms. Our loans are often secured by a lien on specified collateral of our clients. However, the collateral may not protect us from suffering a partial or complete loss if we move to foreclose on the collateral. Factors that could reduce the value of the collateral that we have a security interest in include, among other things:
| • | changes in general economic and industry conditions; |
| • | changes in the real estate markets in which we lend; |
| • | inherent uncertainties in the future value of the collateral; |
| • | the financial condition and/or cash flows of the borrower and/or the project being financed; and |
| • | any representation by the borrower of, or failure to keep adequate records related to, important information concerning the collateral. |
Any one or more of the preceding factors could materially impair our ability to collect on specified collateral of our clients in the event loans we have made to such clients are not repaid in accordance with their terms, which could have a material adverse effect on our business, financial condition and results of operations.
Liquidity risk could impair our ability to fund operations and meet our obligations as they become due and could jeopardize our financial condition.
Liquidity is essential to our business. Liquidity risk is the potential that we will be unable to meet our obligations as they become due because of an inability to liquidate assets or obtain adequate funding. We require sufficient liquidity to meet customer loan requests, customer deposit maturities and withdrawals, payments on our debt obligations as they come due and other cash commitments under both normal operating conditions and
36
Table of Contents
other unpredictable circumstances, including events causing industry or general financial market stress. Our access to deposits may be affected by the liquidity needs of our depositors. We depend on deposit account balances and other forms of customer deposits as our primary source of funding for our lending activities. A key part of our liquidity plan and funding strategy is to increase our deposit base as a source of funds. We might have difficulty replacing such funds in the future, especially if a large number of our depositors seek to withdraw their accounts, regardless of the reason. Liquidity risk can increase due to a number of factors, including an over-reliance on a particular source of funding or market-wide phenomena such as market dislocation and major disasters. Our inability to raise funds through deposits, borrowings, the sale of loans, and other sources could have a substantial negative effect on liquidity. Our access to funding sources in amounts adequate to finance our activities or on acceptable terms could be impaired by factors that affect our organization specifically or the financial services industry or economy in general. We rely on brokered deposits as a source of liquidity and generally target a brokered deposit to total deposit ratio of less than 15% to 20%. Brokered deposits have a high deposit cost compared to our core deposits. Factors that could detrimentally impact access to liquidity sources include, but are not limited to, a decrease in the level of our business activity as a result of a downturn in the markets in which our loans are concentrated (including a downturn resulting from natural disasters affecting those markets) or adverse regulatory actions against us or changes in the liquidity needs of our depositors. Market conditions or other events could also negatively affect the level or cost of funding, affecting our ongoing ability to accommodate liability maturities and deposit withdrawals, meet contractual obligations (including any unfunded credit commitments), and fund asset growth and new business transactions at a reasonable cost, in a timely manner, and without adverse consequences.
A failure to maintain adequate liquidity or any substantial, unexpected, and/or prolonged change in the level or cost of liquidity could impair our ability to fund operations and meet our obligations as they become due and could have a material adverse effect on our business, financial condition and results of operations.
The borrowing needs of our clients may increase, especially during a challenging economic environment, which could result in increased borrowing against our contractual obligations to extend credit.
A commitment to extend credit is a formal agreement to lend funds to a client as long as there is no violation of any condition established under the agreement. The actual borrowing needs of our clients under these credit commitments have historically been lower than the contractual amount of the commitments. A significant portion of these commitments expire without being drawn upon. Because of the credit profile of our clients, we typically have a substantial amount of total unfunded credit commitments, which is not reflected on our balance sheet. As of September 30, 2017, we had $3.2 billion in unfunded credit commitments to our clients. Actual borrowing needs of our clients may exceed our expectations, including due to unexpected impacts from a natural disaster, but especially during a challenging economic environment when our clients’ companies may be more dependent on our credit commitments due to the lack of available credit elsewhere, the increasing costs of credit, or the limited availability of financings from venture firms. This could adversely affect our liquidity, which could impair our ability to fund operations and meet obligations as they become due and could have a material adverse effect on our business, financial condition and results of operations. See “Risk Factors—Risks Relating to Our Business—Liquidity risk could impair our ability to fund operations and meet our obligations as they become due and could jeopardize our financial condition.”
We are subject to interest rate risk, which could adversely affect our financial condition and profitability.
The majority of our banking assets are subject to changes in interest rates. For example, as of September 30, 2017, 78% of our loan portfolio consisted of floating and adjustable interest rate loans. Like most financial institutions, our earnings significantly depend on our net interest income, the principal component of our earnings, which is the difference between interest earned by us from our interest-earning assets, such as loans and investment securities, and interest paid by us on our interest-bearing liabilities, such as deposits and borrowings. We expect that we will periodically experience “gaps” in the interest rate sensitivities of our assets and liabilities, meaning that either our interest-bearing liabilities will be more sensitive to changes in market interest rates than
37
Table of Contents
our interest-earning assets, or vice versa. In either event, if market interest rates should move contrary to our position, this “gap” will negatively impact our earnings. The impact on earnings is more adverse when the slope of the yield curve flattens, that is, when short-term interest rates increase more than long-term interest rates or when long-term interest rates decrease more than short-term interest rates. Many factors beyond our control impact interest rates, including economic conditions, governmental monetary policies, inflation, recession, changes in unemployment, the money supply, and disorder and instability in domestic and foreign financial markets. Changes in monetary policies of the various government agencies could influence not only the interest we receive on loans and securities and the interest we pay on deposits and borrowings, but such changes could also affect our ability to originate loans and obtain deposits, the fair value of our financial assets and liabilities, and the average duration of our assets.
In any future declining interest rate environment, there may be an increase in prepayments on loans as borrowers refinance their loans at lower rates. Interest rate increases often result in larger payment requirements for our floating interest rate borrowers, which increases the potential for default. At the same time, the marketability of the property securing a loan may be adversely affected by any reduced demand resulting from higher interest rates. An increase (or decrease) in interest rates may also require us to increase (or decrease) the interest rates that we pay on our deposits.
Changes in interest rates also can affect the value of loans, securities and other assets. An increase in interest rates that adversely affects the ability of borrowers to pay the principal or interest on loans may lead to increases in nonperforming assets, charge-offs and delinquencies, further increases to the allowance for credit losses, and a reduction of income recognized, among others, which could have a material adverse effect on our results of operations and cash flows. Further, when we place a loan on non-accrual status, we reverse any accrued but unpaid interest receivable, which decreases interest income. At the same time, we continue to have a cost to fund the loan, which is reflected as interest expense, without any interest income to offset the associated funding expense. Thus, an increase in the amount of nonperforming assets could have a material adverse impact on our net interest income.
Additionally, an increase in interest rates may not increase our net interest income to the same extent we currently anticipate based on our modeling estimates and the assumptions underlying such modeling. Our failure to benefit from an increased interest rate environment to the extent we currently estimate, to the same extent as our competitors or at all could have a material adverse effect on our business, financial condition and results of operations.
If short-term interest rates remain at their historically low levels for a prolonged period, and assuming longer term interest rates fall further, we could experience net interest margin compression as our rates on our interest earning assets would decline while rates on our interest-bearing liabilities could fail to decline in tandem. Similarly, if short-term interest rates increase and long-term interest rates do not increase, or increase but at a slower rate, we could experience net interest margin compression as our rates on interest earning assets decline measured relative to rates on our interest-bearing liabilities. Any such occurrence could have a material adverse effect on our net interest income and on our business, financial condition and results of operations. See “Management’s Discussion and Analysis of Financial Condition and Results of Operations—Quantitative and Qualitative Disclosures about Market Risk.”
The geographic concentration of our markets in Houston and other parts of Texas and the southeast United States makes our business susceptible to downturns in the local economies and depressed banking markets, including the downturns in the energy industry, effects of natural disasters in the region and decreases in oil prices. These factors as well as other geography-specific risks could materially and adversely affect us.
Unlike larger financial institutions that are more geographically diversified, we are a regional banking franchise concentrated in Houston and other parts of Texas and the southeast United States. As of September 30, 2017, 52% of our total loans (by dollar amount) were in Texas, 12% were in Alabama and 9% were in Florida. A
38
Table of Contents
deterioration in local economic conditions in the loan market or in the residential or commercial real estate markets could have a material adverse effect on the quality of our portfolio, the demand for our products and services, the ability of borrowers to timely repay loans, and the value of the collateral securing loans. If the population, employment or income growth in one of our markets is negative or slower than projected, income levels, deposits and real estate development could be adversely impacted.
The effects of adverse weather events may negatively affect our local economies or disrupt our operations, which would have an adverse effect on our business or results of operations.
Like other coastal areas, our geographic markets in Texas and the southeast United States are susceptible to severe weather, including hurricanes, flooding, tornadoes, droughts, wildfires, hailstorms and damaging winds. In August 2017, Hurricane Harvey made landfall near Corpus Christi, Texas and also struck the Houston area and parts of eastern Texas and Louisiana, causing record flooding, power outages, significant damage to impacted residential and commercial properties and disruptions to normal economic activity in certain of our market areas. Additionally, in September 2017, Hurricane Irma made landfall near Naples, Florida in southwest Florida, with impacts throughout much of south, central and eastern Florida, including flooding, power outages and various degrees of wind damage to certain residential and commercial properties. Although we currently expect that the credit impact of Hurricanes Harvey and Irma will be minimal, we continue to assess the impact on the performance of our loans in the affected market areas. In addition, the occurrence of other adverse weather and natural or man-made disasters in the future could destroy, or cause a decline in the value of, mortgaged properties, crops or other assets that serve as our collateral and increase the risk of delinquencies, defaults, foreclosures and losses on our loans, damage our banking facilities and offices, negatively impact regional economic conditions, result in a decline in local loan demand, loan originations and deposit availability and negatively impact the implementation of our growth strategy. Any one or more of these developments could have a material adverse effect on our business, financial condition and results of operations.
Sustained low oil prices, volatility in oil prices and downturns in the energy industry, including in Texas, could materially and adversely affect us.
The economy in Texas has dependence on the energy industry. A downturn or lack of growth in the energy industry and energy-related business, including sustained low oil prices or the failure of oil prices to rise in the future, could adversely affect our results of operations and financial condition. Oil and gas prices declined significantly during 2014 and 2015, and, despite a subsequent partial rebound since 2016, the full impact to the broad economy, to banks in general, and to us, of these decreases and overall oil and gas price volatility is yet to be determined. As of September 30, 2017, energy lending comprised approximately 12% of our loan portfolio and contributed 12% of our revenues. Prolonged or further pricing pressure on oil and gas could lead to increased credit stress in our energy portfolio, increased losses associated with our energy portfolio, increased utilization of our contractual obligations to extend credit and weaker demand for energy lending. Such a decline or general uncertainty resulting from continued volatility could have other adverse impacts such as job losses in industries tied to energy, increased spending habits, lower borrowing needs, higher transaction deposit balances or a number of other effects that are difficult to isolate or quantify, particularly in states with significant dependence on the energy industry such as Texas, all of which could have a material adverse effect on our business, financial condition and results of operations.
A failure in or breach of our operational or security systems or infrastructure, or those of our third-party providers, could result in financial losses to us and/or in the disclosure or misuse of confidential or proprietary information, including client information, each of which could adversely affect our financial condition, damage our reputation and subject us to litigation.
As a financial institution, we may be the target of fraudulent activity that may result in financial losses to us or our clients, privacy breaches against our clients or damage to our reputation. Such fraudulent activity may take many forms, including check fraud, electronic fraud, wire fraud, phishing, unauthorized intrusion into or use of our systems, and other dishonest acts. We provide our clients with the ability to bank remotely, including online
39
Table of Contents
over the Internet and over the telephone. The secure transmission of confidential information over the Internet and other remote channels is a critical element of remote banking.
Additionally, our customers and employees have been, and will continue to be, targeted by parties using fraudulent e-mails and other communications in attempts to misappropriate passwords, bank account information or other personal information or to introduce viruses or other malware through “Trojan horse” programs to our information systems and/or our customers’ computers. Information security risks for financial institutions related to these types of attacks have generally increased in recent years in part because of the proliferation of new technologies, the use of the Internet and telecommunications technologies to conduct financial transactions, and the increased sophistication and activities of organized crime, hackers, terrorists, activists, and other external parties, including foreign state-sponsored parties. Though we endeavor to mitigate these threats through product improvements, use of encryption and authentication technology and customer and employee education, such cyberattacks against us or our merchants and our third party service providers remain a serious issue.
Our operations are dependent upon our ability to protect the computer systems and network infrastructure utilized by us, including our Internet, telephone and other remote channel banking activities, our debit and credit card payment processing activities, and our customer relationship management, general ledger, deposit, loans and other systems, against damage from physical break-ins, cybersecurity breaches and other disruptive problems caused by the Internet or other users. Such computer break-ins and other disruptions would jeopardize the security of information stored in and transmitted through our computer systems and network infrastructure, which may result in significant liability, damage our reputation and inhibit current and potential customers from using our Internet banking services. While we maintain security measures to mitigate the risk of cybersecurity breaches, it is possible that we may not be able to anticipate, detect or recognize threats to its systems or to implement effective preventive measures against all security breaches of these types, especially because the techniques used change frequently or are not recognized until launched, and because cyberattacks can originate from a wide variety of sources, including third parties. Controls employed by our information technology department and cloud vendors could prove inadequate. These risks may increase in the future as we continue to increase our Internet-based product offerings and expand our internal usage of web-based products and applications. In addition, maintaining our security measures to seek to protect against the latest types of threats entails significant costs and creates risks associated with implementing new systems and integrating them with existing ones.
A breach of our security that results in unauthorized access to our data could expose us to a disruption or challenges relating to our daily operations, as well as to data loss, litigation, damages, fines and penalties, significant increases in compliance costs (such as repairing systems or adding new personnel or protection technologies), and reputational damage (including customer dissatisfaction), any of which could have a material adverse effect on our business, financial condition and results of operations.
We depend on our information technology and telecommunications systems of third parties, and any systems failures, interruptions or data breaches involving these systems could adversely affect our operations and financial condition.
Our business depends on the successful and uninterrupted functioning of our information technology and telecommunications systems, third-party servicers and financial intermediaries. We outsource many of our major systems, such as data processing, loan servicing and deposit processing systems. The failure of these systems, or the termination of a third-party software license or service agreement on which any of these systems is based, could interrupt our operations, and we could experience difficulty in implementing replacement solutions. In many cases, our operations rely heavily on the secure processing, storage and transmission of information and the monitoring of a large number of transactions on a minute-by-minute basis, and even a short interruption in service could have significant consequences. In addition, we interact with and rely on financial counterparties, regulators and retailers for whom we process transactions. Each of these third parties may be targets of the same types of fraudulent activity, computer break-ins and other cybersecurity breaches described in the immediately
40
Table of Contents
preceding risk factor, and the cybersecurity measures that they maintain to mitigate the risk of such activity may be different than our own.
Because our information technology and telecommunications systems interface with and depend on third-party systems, we could experience service denials if demand for such services exceeds capacity or such third-party systems fail or experience interruptions. If significant, sustained or repeated, a system failure or service denial could compromise our ability to operate effectively, damage our reputation, result in a loss of customer business, and subject us to additional regulatory scrutiny and possible financial liability, any of which could have a material adverse effect on our business, financial condition and results of operations. In addition, failure of third parties to comply with applicable laws and regulations, or fraud or misconduct on the part of employees of any of these third parties could disrupt our operations or adversely affect our reputation. We may also incur costs as a result of data or security breaches of third parties with whom we do not have a significant direct relationship. For example, various retailers and companies processing payments on their behalf have reported that they were victims of cyberattacks in which large amounts of their customers’ data, including debit and credit card information, was obtained. In these situations, we generally incur costs to replace compromised cards and address fraudulent transaction activity affecting our customers.
As a result of financial entities and technology systems becoming more interdependent and complex, a cyber incident, information breach or loss, or technology failure that compromises the systems or data of one or more financial entities could have a material impact on counterparties or other market participants, including ourselves. For example, security breaches such as the Equifax incident made public in September 2017 may result in our customers requesting to freeze their credit accounts, which may impact the speed at which we can open or our ability to open new accounts. We have taken measures to implement backup systems and other safeguards to support our operations, but our ability to conduct business may be adversely affected by any significant disruptions to us or to third parties with whom we interact.
We are subject to laws regarding the privacy, information security and protection of personal information and any violation of these laws or another incident involving personal, confidential or proprietary information of individuals could damage our reputation and otherwise adversely affect our operations and financial condition.
Our business requires the collection and retention of large volumes of customer data, including personally identifiable information in various information systems that we maintain and in those maintained by third parties with whom we contract to provide data services. We also maintain important internal company data such as personally identifiable information about our employees and information relating to our operations. We are subject to complex and evolving laws and regulations governing the privacy and protection of personal information of individuals (including customers, employees, suppliers and other third parties). For example, our business is subject to the Gramm-Leach-Bliley Act which, among other things: (i) imposes certain limitations on our ability to share nonpublic personal information about our customers with nonaffiliated third parties; (ii) requires that we provide certain disclosures to customers about our information collection, sharing and security practices and afford customers the right to “opt out” of any information sharing by us with nonaffiliated third parties (with certain exceptions); and (iii) requires that we develop, implement and maintain a written comprehensive information security program containing appropriate safeguards based on our size and complexity, the nature and scope of our activities, and the sensitivity of customer information we process, as well as plans for responding to data security breaches. Various state and federal banking regulators and states have also enacted data security breach notification requirements with varying levels of individual, consumer, regulatory or law enforcement notification in certain circumstances in the event of a security breach. Ensuring that our collection, use, transfer and storage of personal information complies with all applicable laws and regulations can increase our costs. Furthermore, we may not be able to ensure that all of our clients, suppliers, counterparties and other third parties have appropriate controls in place to protect the confidentiality of the information that they exchange with us, particularly where such information is transmitted by electronic means. If personal, confidential or proprietary information of customers or others were to be mishandled or misused (in
41
Table of Contents
situations where, for example, such information was erroneously provided to parties who are not permitted to have the information, or where such information was intercepted or otherwise compromised by third parties), we could be exposed to litigation or regulatory sanctions under personal information laws and regulations. Concerns regarding the effectiveness of our measures to safeguard personal information, or even the perception that such measures are inadequate, could cause us to lose customers or potential customers for our products and services and thereby reduce our revenues. Accordingly, any failure or perceived failure to comply with applicable privacy or data protection laws and regulations may subject us to inquiries, examinations and investigations that could result in requirements to modify or cease certain operations or practices or in significant liabilities, fines or penalties, and could damage our reputation and otherwise adversely affect our operations and financial condition.
We continually encounter technological change.
The financial services industry is continually undergoing rapid technological change with frequent introductions of new technology-driven products and services. The effective use of technology increases efficiency and enables financial institutions to better serve customers and to reduce costs. Our future success depends, in part, upon our ability to address the needs of our customers by using technology to provide products and services that will satisfy customer demands, as well as to create additional efficiencies in our operations. Many of our competitors have substantially greater resources to invest in technological improvements than we do. As a result, they may be able to offer additional or superior products to those that we will be able to provide, which would put us at a competitive disadvantage. We may not be able to effectively implement new technology-driven products and services or be successful in marketing these products and services to our customers. In addition, the implementation of technological changes and upgrades to maintain current systems and integrate new ones may also cause service interruptions, transaction processing errors and system conversion delays, may cause us to fail to comply with applicable laws, and may cause us to incur additional expenses, which may be substantial. Failure to successfully keep pace with technological change affecting the financial services industry and avoid interruptions, errors and delays could have a material adverse effect on our business, financial condition or results of operations.
We expect that new technologies and business processes applicable to the consumer credit industry will continue to emerge and these new technologies and business processes may be better than those we currently use. Because the pace of technological change is high and our industry is intensely competitive, we may not be able to sustain our investment in new technology as critical systems and applications become obsolete or as better ones become available. A failure to maintain current technology and business processes could cause disruptions in our operations or cause our products and services to be less competitive, all of which could have a material adverse effect on our business, financial condition or results of operations.
We rely heavily on our management team and could be adversely affected by the unexpected loss of key personnel.
We are led by an experienced management team with substantial experience in the markets that we serve, and our operating strategy focuses on providing products and services through long-term relationship managers. Accordingly, our success depends in large part on the performance of our key personnel, as well as on our ability to attract, motivate and retain highly qualified senior and middle management. Competition for employees is intense, and we may be unsuccessful in locating key personnel with the combination of skills and attributes required to execute our business plan. The cost of hiring, incentivizing, and retaining skilled personnel may continue to increase. We may not be successful in retaining our key employees, and the unexpected loss of services of one or more of our key personnel, including our relationship managers, could also have a material adverse effect on our business because of their skills, knowledge of our market, years of industry experience, relationship-centric banking model, and the difficulty of promptly finding qualified replacement personnel. If the services of any of our key personnel should become unavailable for any reason, we may not be able to identify and hire qualified persons on terms acceptable to us, which could have a material effect on our business, financial condition and results of operations.
42
Table of Contents
Our indebtedness could affect our ability to meet our obligations and may otherwise restrict our activities.
As of September 30, 2017, the Company and its subsidiaries had approximately $572.7 million of gross indebtedness on a consolidated basis ($50.6 million of which represents junior subordinated debt reflected on the Company’s balance sheet at $36.4 million after purchase accounting adjustment, net of amortization). Included in this indebtedness, as of September 30, 2017, the Company had $98.6 million of subordinated debt. Total interest expense on all outstanding indebtedness was $15.6 million on a pre-tax basis for the nine months ended September 30, 2017 (based on current LIBOR rates). Our subordinated indebtedness will mature between 2019 and 2029; our junior subordinated indebtedness will mature between 2033 and 2037. See “Description of Certain Indebtedness.” An increase in interest rates would increase our interest expense. See “Management’s Discussion and Analysis of Financial Condition and Results of Operations—Quantitative and Qualitative Disclosures about Market Risk.”
Our indebtedness could have important consequences. For example, it could limit our ability to borrow money for our working capital, capital expenditures, debt service requirements or other corporate purposes; require us to dedicate a substantial portion of our cash flow to payments on our indebtedness, which would reduce the amount of cash flow available to fund working capital, capital expenditures, product development and other corporate requirements; increase our vulnerability to general adverse economic and industry conditions; and limit our ability to respond to business opportunities, including growing our business through acquisitions. In addition, the instruments governing our indebtedness contain certain restrictive covenants, including with respect to consolidating or merging the Company or the Bank into another entity or transferring substantially all of their respective assets or properties. Certain of the Company’s debt also contains restrictions on the Company’s ability to assign or grant a security interest in or otherwise dispose of any shares of the voting stock of the Bank. Failure to meet any of these covenants could result in an event of default under these agreements. If an event of default occurs under these agreements, the lenders could elect to declare all amounts outstanding under these agreements to be immediately due and payable. See “Description of Certain Indebtedness.”
Our principal source of funds for interest and repayment of principal upon the maturity of our debt is dividends received directly from our subsidiaries, including the Bank. Federal and state statutes and regulations limit the amount of dividends that the Bank may pay to us, with or without regulatory approval. We may not receive dividends sufficient to fund our debt obligations. In addition, we may not be able to refinance our indebtedness on substantially similar terms, or at all, at or prior to the time that it comes due.
We rely on customer deposits as a significant source of funding, and our deposits may decrease in the future.
We rely on customer deposits as a significant source of funding. Competition among U.S. banks for customer deposits is intense, and may increase the cost of deposits or prevent new deposits, and may otherwise negatively affect our ability to grow our deposit base. Our deposit accounts may decrease in the future, and any such decrease could have an adverse impact on our sources of funding, which impact could be material. Any changes we make to the rates offered on our deposit products to remain competitive with other financial institutions may adversely affect our profitability and liquidity. The demand for the deposit products we offer may also be reduced due to a variety of factors such as demographic patterns, changes in customer preferences, reductions in consumers’ disposable income, regulatory actions that decrease customer access to particular products or the availability of competing products. In addition, a portion of our deposits are brokered deposits and the Federal Deposit Insurance Corporation (“FDIC”) uninsured deposits. The levels of these types of deposits that we hold may be more volatile during changing economic conditions. As of September 30, 2017, approximately $0.8 billion, or 9.7%, of our deposits consisted of brokered deposits.
We face significant competition to attract and retain customers and clients, which could adversely affect our growth and profitability.
We operate in the highly competitive banking industry and face significant competition in originating loans, attracting deposits and providing other financial services for customers from bank and non-bank competitors, particularly regional and nationwide institutions, including U.S. banks, mortgage banking companies, consumer
43
Table of Contents
finance companies, credit unions, insurance companies, and other institutional lenders and purchasers of loans. Many of our competitors are significantly larger and have significantly more resources, greater name recognition, larger market share, and more extensive and established branch networks than we do. Because of their scale, many of these competitors can be more aggressive than we can on loan and deposit pricing. Also, many of our non-bank competitors have fewer regulatory constraints and may have lower cost structures. In addition, they may maintain a wider range of product offerings than we do, including more technology-based banking tools. We expect competition to continue to intensify due to financial institution consolidation; legislative, regulatory and technological changes; and the emergence of alternative banking sources.
Our ability to compete successfully will depend on a number of factors, including, among other things:
| • | our ability to build and maintain long-term customer relationships while ensuring high ethical standards and safe and sound banking practices; |
| • | our ability to leverage existing client relationships; |
| • | our ability to build ancillary business through participation in Shared National Credits, or SNCs; |
| • | the success of our focused calling efforts; |
| • | our ability to attract and retain qualified employees to operate our business effectively; |
| • | our ability to expand our market position; |
| • | the scope, relevance and pricing of products and services that we offer; |
| • | customer satisfaction with our products and services; |
| • | industry and general economic trends; and |
| • | our ability to keep pace with technological advances and to invest in new technology. |
Customer and client loyalty can also be influenced by a competitor’s new products, especially offerings that could provide cost savings or a higher return to the customer. Increased competition could require us to increase the rates that we pay on deposits or lower the rates that we offer on loans, which could reduce our profitability. Our failure to compete effectively in our markets could restrain our growth or cause us to lose market share, which could have a material adverse effect on our business, financial condition and results of operations. We may also face a competitive disadvantage as a result of our concentration in Texas and the southeast United States and will be unable, as compared to our more geographically diversified peers, to spread our operating costs across a broader market.
If we are not able to continue the historical levels of growth in our loan and deposit levels and market share, we may not be able to maintain our historical earnings trends.
Since our formation in 2009, we have consummated three major acquisitions, which have significantly contributed to growth in our loan and deposit levels and market share. We are pursuing an organic growth strategy focused on growing market share. This strategy may not sustain our historical rate of growth or our ability to grow at all. Our ability to execute our growth strategy, including by opening new branches, depends on a variety of factors, such as economic conditions and competition, which are beyond our control, and access to capital and liquidity to fund such growth. We may not be able to obtain the financing necessary to fund internal growth and we may not pursue growth through new acquisitions. Sustainable growth requires that we manage our risks by following prudent underwriting standards, balancing loan and deposit growth without increasing interest rate risk or compressing our net interest margin, maintaining more than adequate capital at all times, hiring and retaining qualified employees, and successfully implementing strategic projects and initiatives. Our growth strategy may also change from time to time as a result of various internal and external factors. For example, natural disasters and other events beyond our control may also adversely affect our growth. If we are not able to continue our historical levels of growth, we may not be able to maintain these historical earnings trends. The absence of these growth opportunities or our ability to manage our growth successfully, could have a material adverse effect on our business, financial condition and results of operations.
44
Table of Contents
We may not be able to manage our growth effectively, which could adversely affect our business profitability and financial condition.
We may face a variety of risks and difficulties in pursuing our organic growth strategy and managing our growth, including, among other things:
| • | maintaining asset quality; |
| • | finding suitable markets for expansion; |
| • | attracting funding to support additional growth; |
| • | managing execution risks; |
| • | attracting and retaining qualified management; |
| • | maintaining adequate regulatory capital; |
| • | managing a growing number of client relationships; |
| • | scaling technology platforms; and |
| • | achieving expected additional capacity of our relationship managers. |
To manage our growth and maintain adequate information and reporting systems within our organization, we must identify, hire and retain qualified associates, particularly in the accounting and operational areas of our business. We must also successfully implement improvements to, or integrate, our management information and control systems, procedures and processes in an efficient or timely manner and identify deficiencies in existing systems and controls. In particular, our controls and procedures must be able to accommodate an increase in loan volume in various markets and the infrastructure that comes with expanding operations, including new branches. Our growth strategy may divert management from our existing franchises and may require us to incur additional expenditures to expand our administrative and operational infrastructure. If we are unable to effectively manage and grow our banking franchise, we may experience compliance and operational problems, have to slow the pace of growth, or have to incur additional expenditures beyond current projections to support such growth, any one of which could materially and adversely affect our business, financial condition, results of operations and future prospects.
Greater seasoning of our loan portfolio could increase risk of credit defaults in the future.
A portion of loans in our loan portfolio and of our lending relationships are of relatively recent origin. The average age of our originated loans as of September 30, 2017 is 2.11 years. In general, loans do not begin to show signs of credit deterioration or default until they have been outstanding for some period of time (which varies by loan duration and loan type), a process referred to as “seasoning.” As a result, a portfolio of older loans will usually behave more predictably than a newer portfolio. Because a portion of our portfolio is relatively new, the current level of delinquencies and defaults may not represent the level that may prevail as the portfolio becomes more seasoned. If delinquencies and defaults increase, we may be required to increase our provision for credit losses, which could have a material adverse effect on our business, financial condition and results of operations.
We depend on the accuracy and completeness of information provided to us by our borrowers and counterparties and any misrepresented information could adversely affect our business, results of operations and financial condition.
In deciding whether to approve loans or to enter into other transactions with borrowers and counterparties, we rely on information furnished to us by, or on behalf of, borrowers and counterparties, including financial statements, credit reports and other financial information. We also rely on representations of borrowers and counterparties as to the accuracy and completeness of that information and, with respect to financial statements,
45
Table of Contents
on reports of independent auditors. If any of this information is intentionally or negligently misrepresented and such misrepresentation is not detected prior to loan funding, the value of the loan may be significantly lower than expected and we may be subject to regulatory action. Whether a misrepresentation is made by the loan applicant, another third party, or one of our employees, we generally bear the risk of loss associated with the misrepresentation. Our controls and processes may not have detected, or may not detect all, misrepresented information in our loan originations or from our business clients. Any such misrepresented information could adversely affect our business, financial condition and results of operations.
We may not be able to raise additional capital in the future.
In the future, should we need additional capital to implement our business plan, support our business, expand our operations, or meet applicable capital requirements, we may not be able to raise additional funds in the form of additional debt or equity. Our ability to raise additional capital, if needed, will depend on, among other things, conditions in the capital markets at that time, and our financial condition, results of operations and prospects. Economic conditions and a loss of confidence in financial institutions may increase our cost of funding and limit access to certain customary sources of capital, including inter-bank borrowings, repurchase agreements and borrowings from the discount window of the Federal Reserve System (the “Federal Reserve”).
Such capital may not be available on acceptable terms, or at all. Any occurrence that may limit our access to the capital markets, such as a decline in the confidence of debt purchasers, depositors of our bank or counterparties participating in the capital markets or other disruption in the capital markets, may adversely affect our capital costs and our ability to raise capital and, in turn, our liquidity. Further, if we need to raise capital in the future, we may have to do so when many other financial institutions are also seeking to raise capital and would then have to compete with those institutions for investors. An inability to raise additional capital on acceptable terms when needed could have a material adverse effect on our business, financial condition or results of operations.
As a public company, we are required to meet periodic reporting requirements under the rules and regulations of the Securities and Exchange Commission (the “SEC”). Complying with federal securities laws as a public company is expensive.
Prior to becoming a public company in April 2017, we were not required to comply with the requirements of the SEC to have our consolidated financial statements completed, reviewed or audited and filed within SEC-specified time frames. As a publicly traded company, we are now required to file periodic reports containing our consolidated financial statements with the SEC within a specified time following the completion of quarterly and annual periods. Any failure by us to file our periodic reports with the SEC in a timely manner could harm our reputation and cause investors and potential investors to lose confidence in us and reduce the market price of our Class A common stock.
The current economic environment poses significant challenges and could adversely affect our financial condition and results of operations.
We are operating in a challenging and uncertain economic environment. Financial institutions continue to be affected by uncertainty in the real estate market, the credit markets, and the national financial market generally. We retain direct exposure to the commercial and, to a lesser extent, residential, real estate markets, and we are affected by events in these markets. The uncertainty in economic conditions has subjected us and other financial institutions to increased regulatory scrutiny. In addition, deterioration in local economic conditions in our markets could result in losses beyond that provided for in our allowance for credit losses and result in increased loan delinquencies, problem assets, and foreclosures. This may also result in declining demand for products and services, decreased deposits and increased borrowings under our current contractual obligations to extend credit, all of which would adversely impact our liquidity positions, and declining values for loan collateral, which in turn would reduce customers’ borrowing power and the value of assets and collateral associated with our existing loans.
46
Table of Contents
Continued uncertainty regarding, and potential deterioration in, the fiscal position of the U.S. federal government and possible downgrades in U.S. Treasury and federal agency securities could adversely affect us and our banking operations.
The long-term outlook for the fiscal position of the U.S. federal government is uncertain, as illustrated by the 2011 downgrade by certain rating agencies of the credit rating of the U.S. government and federal agencies. In addition to causing economic and financial market disruptions, uncertainty regarding the fiscal position of the U.S. federal government (which could lead to, among other things, a future credit ratings downgrade of the U.S. government and federal agencies, failure to raise the U.S. statutory debt limit, or deterioration in the fiscal outlook of the U.S. federal government), could adversely affect the market value of the U.S. and other government and governmental agency securities that we hold, the availability of those securities as collateral for borrowing and our ability to access capital markets on favorable terms. In particular, it could increase interest rates and disrupt payment systems, money markets, and long-term or short-term fixed income markets, adversely affecting the cost and availability of funding, which could negatively affect our profitability. Also, the adverse consequences of this uncertainty could extend to those to whom we extend credit and could adversely affect their ability to repay their loans. Any of these developments could have a material adverse effect on our business, financial condition and results of operations.
We may be adversely affected by the soundness of other financial institutions.
Our ability to engage in routine funding transactions could be adversely affected by the actions and commercial soundness of other financial institutions. Financial services companies are interrelated as a result of trading, clearing, counterparty, and other relationships. We have exposure to different industries and counterparties including through transactions with counterparties in the financial services industry, including brokers and dealers, commercial banks, investment banks and other institutional clients. As a result, defaults by, or even rumors or questions about the soundness of, one or more financial services companies, or the financial services industry generally, have historically led to market-wide liquidity problems and could lead to losses or defaults by us or by other institutions. These losses or defaults could have a material effect on our business, financial condition and results of operations.
We have a significant deferred tax asset that may not be fully realized in the future.
Our net deferred tax asset totaled $61.4 million as of September 30, 2017, which included $15.7 million attributable to federal and state net operating loss carryforwards. Our net deferred tax asset as of December 31, 2017 was significantly lower due to new federal tax legislation (commonly referred to as the “Tax Cuts and Jobs Act”). The ultimate realization of a deferred tax asset is generally dependent upon the generation of future taxable income during the period prior to the expiration of the applicable net operating losses. In addition, a portion of our net operating losses are currently subject to the limitations of Section 382 of the Internal Revenue Code, which may limit our ability to offset future taxable income. As of September 30, 2017, $41.9 million of our net operating loss carryforward was limited to $3.1 million per year, which will require us to generate at least $3.1 million of taxable income annually through the year 2030 to fully realize the deferred tax asset. We recorded a one-time charge in income tax expense of $19.0 million (or $0.22 per share of Class A common stock) related to the Tax Cuts and Jobs Act enacted in December 2017 requiring a re-measurement of our deferred tax asset. The value of our deferred tax asset is also derived in part from estimates and assumptions regarding our expected future tax liability. If our estimates and assumptions about future taxable income or our future tax liability are not accurate, including as a result of the application of the Tax Cuts and Jobs Act or any changes to tax laws and regulations applicable to us, the value of our deferred tax asset may not be recoverable and may result in a valuation allowance that would negatively impact our earnings.
47
Table of Contents
Many of our loans are to commercial borrowers, which have unique risks compared to other types of loans.
As of September 30, 2017, we had approximately $6.1 billion of commercial loans comprising of $4.9 billion in commercial and industrial and $1.2 billion in commercial real estate, representing approximately 76% of our total loan portfolio. Because payments on these loans are often dependent on the successful operation or development of the property or business involved, their repayment is sensitive to adverse conditions in the real estate market and the general economy. Accordingly, downturns in the real estate market and economy increase the risk related to commercial loans, particularly commercial real estate loans. Commercial loans are also subject to loan specific risks, including risks associated with construction, cost overruns, project completion risk, general contractor credit risk and risks associated with the ultimate sale or use of the completed construction. If a decline in economic conditions, natural disasters affecting commercial development or other issues cause difficulties for our borrowers of these types of business loans, if we fail to evaluate the credit of these loans accurately when we underwrite them or if we do not continue to monitor adequately the performance of these loans, our lending portfolio could experience delinquencies, defaults and credit losses that could have a material adverse effect on our business, financial condition or results of operations.
Our loan portfolio has significant concentration in energy and our specialized industries.
Much of our lending activity is concentrated in energy and our specialized industries. As of September 30, 2017, we had a total of $1.7 billion of loans, or 21.1% of our total loans, to companies operating in the restaurant industry, healthcare and technology industries, and $0.9 billion, or 11.7%, to companies operating in the energy sector. These industries and businesses are sensitive to economic conditions and complex factors (such as supply chain factors), which may expose us to the risk of economic downturns and other risks unique to these industries. Oil prices can fluctuate widely on a month-to-month basis in response to a variety of factors that are beyond our control. Factors that contribute to price fluctuations include instability in oil-producing regions, worldwide economic conditions, weather conditions, the supply and price of domestic and foreign oil, natural gas and natural gas liquids, consumer demand, the price and availability of alternative fuels, the proximity to, and capacity of, transportation facilities and the effect of worldwide energy conservation measures. Adverse economic conditions or business conditions relating to these industries could negatively impact our operating results more than if our loan portfolio was not concentrated in these industries.
A significant portion of our loan portfolio is comprised of participation and shared national credits, which could have a material adverse effect on our ability to monitor the lending relationships and lead to an increased risk of loss.
We achieved a significant portion of our loan growth in our initial years of operation by participating in loans originated by other institutions and by participating in shared national credits, broadly defined as loans to larger institutions by a group of participating lenders where the client’s needs are larger than any individual lender can prudently provide, and in which other lenders serve as the agent bank. Additionally, our specialized industries lending includes larger, national companies that tend to be served through shared national credits. As of September 30, 2017, $3.1 billion, or approximately 38% of our total loans, consisted of participations or shared national credits in which we are not the lead bank. Our reduced control over the monitoring and management of these relationships, particularly participations in large bank groups, could lead to increased risk of loss, which could have a material adverse effect on our business, financial condition, results of operations and future prospects.
The amount of nonperforming and classified assets may increase significantly, resulting in additional losses, and costs and expenses that will negatively affect our operations and financial condition.
At September 30, 2017, we had a total of approximately $122 million of nonperforming assets or approximately 1.16% of total assets. Total assets classified as “substandard,” “doubtful” or “loss” as of September 30, 2017 were approximately $299 million, or approximately 2.8% of total assets.
48
Table of Contents
An asset is generally considered “substandard” if it is inadequately protected by the current net worth and paying capacity of the borrower or of the collateral pledged, if any. “Substandard” assets include those characterized by the “distinct possibility” that we will sustain “some loss” if the deficiencies are not corrected. Assets classified as “doubtful” have all of the weaknesses inherent in those classified “substandard” with the added characteristic that the weaknesses present make “collection or liquidation in full,” on the basis of currently existing facts, conditions, and values, “highly questionable and improbable.” Assets classified as “loss” are those considered “uncollectible” and of such little value that their continuance as assets without the establishment of a specific loss reserve is not warranted.
Should the amount of nonperforming assets increase in the future, we may incur losses, and the costs and expenses to maintain such assets likewise can be expected to increase and potentially negatively affect earnings. Any additional increase in losses due to such assets could have a material adverse effect on our business, financial condition and results of operations. Such effects may be particularly pronounced in a market of reduced real estate values and excess inventory.
The amount of other real estate owned (“OREO”) may increase significantly, resulting in additional losses, and costs and expenses that will negatively affect our business, results of operations and financial conditions. In addition, certain of our OREO assets may take longer to liquidate, which may result in additional losses and costs and expenses that will negatively affect our business, results of operations and financial condition.
We foreclose on and take title to the real estate serving as collateral as part of our business. Real estate owned by us and not used in the ordinary course of our operations is referred to as “other real estate owned” or “OREO” property. At September 30, 2017, we held approximately $19 million of OREO. In the event the amount of OREO should increase due to an increase in defaults on bank loans, our losses, and the costs and expenses to maintain the real estate likewise would increase. In addition, approximately $5 million of our OREO assets consist of residential properties that often take longer to liquidate, which may increase the costs and expenses associated with our OREO assets. Any additional increase in losses, and maintenance costs and expenses due to OREO such as personnel costs, insurance and taxes, completion and repair costs, valuation adjustments and other expenses associated with property ownership and funding costs associated with OREO property may have material adverse effects on our business, financial condition, and results of operations. Such effects may be particularly pronounced in a market of reduced real estate values and excess inventory, which may make the disposition of OREO properties more difficult, increase maintenance costs and expenses, reduce our ultimate realization from any OREO sales, and/or result in a write down of the carrying value of the OREO properties, all of which could have a material adverse effect on our business, financial condition and results of operations.
Nonperforming assets take significant time and resources to resolve and adversely affect our results of operations and financial condition.
Nonperforming assets adversely affect our net income in various ways. We generally do not record interest income on nonperforming loans or OREO, thereby adversely affecting our income and increasing loan administration costs. When we take collateral in foreclosures and similar proceedings, we are required to mark the related asset to the then fair market value of the collateral, which may ultimately result in a loss. An increase in the level of nonperforming assets increases our risk profile and may impact the capital levels regulators believe are appropriate in light of the ensuing risk profile. While we seek to reduce problem assets through loan workouts, restructurings, and otherwise, decreases in the value of the underlying collateral, or in these borrowers’ performance or financial condition, whether or not due to economic and market conditions beyond our control, could have a material effect on our business, financial condition and results of operations. In addition, the resolution of nonperforming assets requires significant commitments of time from management, which may materially and adversely impact their ability to perform their other responsibilities. We may not experience future increases in the value of nonperforming assets.
49
Table of Contents
By engaging in derivative transactions, we are exposed to credit and market risk, which could adversely affect our profitability and financial condition.
We manage interest rate risk by, among other things, utilizing derivative instruments to minimize significant unplanned fluctuations in earnings that are caused by interest rate volatility. For example, in June 2015, we purchased $982 million in notional of interest rate swap contracts designated as hedging instruments in cash flow hedges, and in March 2016, we purchased $350 million of interest rate swap contracts designated as hedging instruments in cash flow hedges. See “Management’s Discussion and Analysis of Financial Condition and Results of Operations.” Hedging interest rate risk is a complex process, requiring sophisticated models and constant monitoring, and is not a perfect science. Due to interest rate fluctuations, hedged assets and liabilities will appreciate or depreciate in market value. The effect of this unrealized appreciation or depreciation will generally be offset by income or loss on the derivative instruments that are linked to the hedged assets and liabilities. By engaging in derivative transactions, we are exposed to credit and market risk. If the counterparty fails to perform, credit risk exists to the extent of the fair value gain in the derivative. Market risk exists to the extent that interest rates change in ways that are significantly different from what we expected when we entered into the derivative transaction. The existence of credit and market risk associated with our derivative instruments could adversely affect our net interest income and, therefore, could have a material effect on our business, financial condition and results of operations. Our current interest rate hedges began to roll off at the end of 2017 and we do not currently expect to enter into interest rate swaps or like arrangements in the near-term. Failure to manage interest rate risk could have a material adverse effect on our business. See “Management’s Discussion and Analysis of Financial Condition and Results of Operations—Quantitative and Qualitative Disclosures about Market Risk.”
The fair value of our investment securities may decline.
As of September 30, 2017, the fair value of our investment securities portfolio was approximately $1.20 billion. Factors beyond our control can significantly influence the fair value of securities in our portfolio and can cause potential adverse changes to the fair value of these securities. These factors include, but are not limited to, rating agency actions in respect of the securities, defaults by, or other adverse events affecting, the issuer or with respect to the underlying securities, and changes in market interest rates and continued instability in the capital markets. Any of these factors, among others, could cause other-than-temporary impairments and realized and/or unrealized losses in future periods and declines in other comprehensive income, which could have a material effect on our business, financial condition and results of operations. The process for determining whether impairment of a security is other-than-temporary usually requires complex, subjective judgments about the future financial performance and liquidity of the issuer and any collateral underlying the security to assess the probability of receiving all contractual principal and interest payments on the security.
Any future acquisitions will subject us to a variety of risks, including execution risks, failure to realize anticipated transaction benefits, and failure to overcome integration risks, which could adversely affect our growth and profitability.
We regularly consider potential acquisition opportunities that we believe would support our businesses and enhance our profitability. In the event that we do pursue acquisitions, we may have difficulty executing on acquisitions and may not realize the anticipated benefits of any transaction we complete. Any of the foregoing matters could materially and adversely affect us.
Generally, any acquisition of target financial institutions, branches or other banking assets by us will require approval by, and cooperation from, a number of governmental regulatory agencies, possibly including the Board of Governors of the Federal Reserve, the Office of the Comptroller of the Currency (the “OCC”) and the FDIC, as well as state banking regulators. Such regulators could deny our application, which would restrict our growth, or the regulatory approvals may not be granted on terms that are acceptable to us. For example, we could be required to sell branches as a condition to receiving regulatory approvals, and such a condition may not be acceptable to us or may reduce the benefit of an acquisition.
50
Table of Contents
As to any acquisition that we complete, we may fail to realize some or all of the anticipated transaction benefits if the integration process takes longer or is more costly than expected or otherwise fails to meet our expectations.
In addition, acquisition activities could be material to our business and involve a number of risks, including the following:
| • | incurring time and expense associated with identifying and evaluating potential acquisitions and negotiating potential transactions, resulting in our attention being diverted from the operation of our existing business; |
| • | using inaccurate estimates and judgments to evaluate credit, operations, management and market risks with respect to the target institution or assets; |
| • | projected results may vary significantly from actual results; |
| • | intense competition from other banking organizations and other inquirers for acquisitions; |
| • | potential exposure to unknown or contingent liabilities of banks and businesses we acquire; |
| • | unexpected asset quality problems; |
| • | the time and expense required to integrate the operations and personnel of the combined businesses; |
| • | experiencing higher operating expenses relative to operating income from the new operations; |
| • | creating an adverse short-term effect on our results of operations; |
| • | losing key employees and customers as a result of an acquisition that is poorly received; |
| • | significant problems relating to the conversion of the financial and customer data of the entity; |
| • | integration of acquired customers into our financial and customer product systems; |
| • | risk of assuming businesses with internal control deficiencies; or |
| • | risks of impairment to goodwill or other than temporary impairment of investment securities. |
Depending on the condition of any institution or assets or liabilities that we may acquire, that acquisition may, at least in the near term, adversely affect our capital and earnings and, if not successfully integrated with our organization, may continue to have such effects over a longer period. We may not be successful in overcoming these risks or any other problems encountered in connection with potential acquisitions, and any acquisition we may consider will be subject to prior regulatory approval. Also, acquisitions may involve the payment of a premium over book and market values and, therefore, some dilution of our tangible book value and net income per common share may occur in connection with any future transaction. Our inability to overcome these risks could have a material adverse effect on our profitability, return on equity and return on assets, our ability to implement our business strategy and enhance stockholder value, which, in turn, could have a material adverse effect on our business, financial condition and results of operations. Additionally, our inability to overcome these risks could materially and adversely affect the market price of our Class A common stock, which could make it difficult to sell your shares at the volume, price or time desired.
If the goodwill that we record in connection with a business acquisition becomes impaired, it could require charges to earnings, which would have a negative impact on our financial condition and results of operations.
Goodwill represents the amount by which the purchase price exceeds the fair value of net assets we acquire in a business combination. We review goodwill for impairment at least annually, or more frequently if events or changes in circumstances indicate the carrying value of the asset might be impaired.
51
Table of Contents
We evaluate for potential impairment by comparing the estimated fair value with the carrying amount of each reporting unit. If the carrying amount of the reporting unit exceeds the estimated fair value of that reporting unit, an impairment loss is recognized in an amount equal to the excess of the carrying value of goodwill over the implied fair value of the goodwill. Factors that could cause an impairment charge include adverse changes to macroeconomic conditions, declines in the profitability of the reporting unit or declines in the tangible book value of the reporting unit. At September 30, 2017, our goodwill totaled $317.8 million. Although we have not recorded any impairment charges since we initially recorded the goodwill, our future evaluations of goodwill may result in findings of impairment and related impairment losses, which could have a material adverse effect on our business, financial condition and results of operations.
We are required to make significant estimates and assumptions in the preparation of our financial statements. These estimates and assumptions may not be accurate and are subject to change.
The preparation of our consolidated financial statements in conformity with GAAP requires our management to make significant estimates and assumptions that affect the reported amounts of assets and liabilities and disclosures of contingent assets and liabilities at the date of the consolidated financial statements, and the reported amounts of income and expense during the reporting periods. Critical estimates are made by management in determining, among other things, the accounting for business combinations, estimates of fair value, allowance for credit losses, accounting for acquired loans and other real estate owned and valuation of our deferred tax asset. If our underlying estimates and assumptions prove to be incorrect or if events occur that require us to revise our previous estimates or assumptions, our financial condition and results of operations may be materially adversely affected.
We are subject to certain operational risks, including, but not limited to, employee or customer fraud, the obligation to repurchase sold loans in the event of a documentation error, and data processing system failures and errors.
Employee errors and employee and customer misconduct could subject us to financial losses or regulatory sanctions and seriously harm our reputation. Misconduct by our employees could include, among other things, improper use of confidential information or engaging in unauthorized activities on behalf of our customers. It is not always possible to prevent such employee errors and misconduct or documentation errors, and the precautions we take to prevent and detect this activity may not be effective in all cases. Employee errors and misconduct could also subject us to financial claims for negligence.
While we maintain a system of internal controls and insurance coverage to mitigate against operational risks, if our internal controls fail to prevent or detect an occurrence, or if any resulting loss is not insured or exceeds applicable insurance limits, it could have a material adverse effect on our business, financial condition and results of operations.
In addition, we rely heavily upon information supplied by third parties, including the information contained in credit applications, property appraisals, title information, equipment pricing and valuation and employment and income documentation, in deciding which loans we will originate, as well as the terms of those loans. If any of the information upon which we rely is misrepresented, either fraudulently or inadvertently, and the misrepresentation is not detected prior to asset funding, the value of the asset may be significantly lower than expected, or we may fund a loan that we would not have funded or on terms we would not have extended. Whether a misrepresentation is made by the applicant or another third party, we generally bear the risk of loss associated with such misrepresentation. A loan subject to a material misrepresentation is typically unsellable or subject to repurchase if it is sold prior to detection of the misrepresentation. The sources of the misrepresentations are often difficult to identify, and it is often difficult to recover any of the monetary losses we may suffer.
52
Table of Contents
We are subject to environmental liability risk associated with our lending activities.
We own certain of our properties, and, in the course of our business, we may purchase real estate, or we may foreclose on and take title to real estate. As a result, we could be subject to environmental liabilities with respect to these properties. We may be held liable to a governmental entity or to third parties for property damage, personal injury, investigation and clean-up costs incurred by these parties in connection with environmental contamination or may be required to investigate or clean up hazardous or toxic substances or chemical releases at a property. The costs associated with investigation or remediation activities could be substantial and could exceed the value of the underlying properties. In addition, if we are the owner or former owner of a contaminated site, we may be subject to common law claims by third parties based on damages and costs resulting from environmental contamination emanating from the property. Any significant environmental liabilities could have a material adverse effect on our business, financial condition and results of operations.
We offer third-party products including mutual funds, annuities, life insurance, individual securities and other wealth management products which could experience significant declines in value subjecting us to reputational damage and litigation risk.
We offer third-party products including mutual funds, annuities, life insurance, individual securities and other wealth management products. If these products do not generate competitive risk-adjusted returns that satisfy clients in a variety of asset classes, we will have difficulty maintaining existing business and attracting new business. Additionally, our wealth management business involves the risk that clients or others may sue us, claiming that we have failed to perform under a contract or otherwise failed to carry out a duty owed to them. This risk may be heightened during periods when credit, equity or other financial markets are deteriorating in value or are particularly volatile, or when clients or investors are experiencing losses. Significant declines in the performance of these third-party products could subject us to reputational damage and litigation risk.
We are subject to litigation, which could result in substantial judgment or settlement costs.
We are regularly involved in litigation matters in the ordinary course of business. While we believe that these litigation matters should not have a material adverse effect on our business, financial condition, results of operations or future prospects, we may be unable to successfully defend or resolve any current or future litigation matters, in which case those litigation matters could have a material adverse effect on our business, financial condition and results of operations.
Acts or threats of terrorism and political or military actions taken by the United States or other governments could adversely affect general economic or industry conditions.
Geopolitical conditions may affect our earnings. Acts or threats of terrorism and political or military actions taken by the United States or other governments, including in response to terrorism or similar activity, could have a material adverse effect on our business, financial condition and results of operations.
Risks Relating to the Regulation of Our Industry
Our business, financial condition, results of operations and future prospects could be adversely affected by the highly regulated environment in which we operate.
As a bank holding company, we are subject to federal supervision and regulation. Federal regulation of the banking industry, along with tax and accounting laws, regulations, rules and standards, may limit our operations significantly and control the methods by which we conduct business, just as they limit those of other banking organizations. In addition, compliance with laws and regulations can be difficult and costly, and changes to laws and regulations can impose additional compliance costs. The Dodd-Frank Wall Street Reform and Consumer Protection Act (the “Dodd-Frank Act”), which imposes significant regulatory and compliance changes on financial institutions, is an example of this type of federal regulation. Many of these regulations are intended to
53
Table of Contents
protect depositors, customers, the public, the banking system as a whole or the FDIC insurance funds, not stockholders. Regulatory requirements and discretion affect our lending practices, capital structure, investment practices, dividend policy and many other aspects of our business. There are laws and regulations which restrict transactions between us and our subsidiaries. These requirements may constrain our operations, and the adoption of new laws and changes to or repeal of existing laws may have a further impact on our business, financial condition, results of operations and future prospects. Also, the burden imposed by those federal and state regulations may place banks in general, including our Bank in particular, at a competitive disadvantage compared to their non-bank competitors. We are also subject to requirements with respect to the confidentiality of information obtained from clients concerning their identities, business and personal financial information, employment, and other matters. We require our personnel to agree to keep all such information confidential and we monitor compliance. Failure to comply with confidentiality requirements could result in material liability and adversely affect our business, financial condition, results of operations and future prospects.
Bank holding companies and financial institutions are extensively regulated and currently face an uncertain regulatory environment. Applicable laws, regulations, interpretations, enforcement policies and accounting principles have been subject to significant changes in recent years, and may be subject to significant future changes. Future changes may have a material adverse effect on our business, financial condition and results of operations.
Federal and state regulatory agencies may adopt changes to their regulations or change the manner in which existing regulations are applied. We cannot predict the substance or effect of pending or future legislation or regulation or the application of laws and regulations to our Company. Compliance with current and potential regulation, as well as regulatory scrutiny, may significantly increase our costs, impede the efficiency of our internal business processes, require us to increase our regulatory capital, and limit our ability to pursue business opportunities in an efficient manner by requiring us to expend significant time, effort and resources to ensure compliance and respond to any regulatory inquiries or investigations. In addition, press coverage and other public statements that assert some form of wrongdoing by financial services companies (including press coverage and public statements that do not involve us) may result in regulatory inquiries or investigations, which, independent of the outcome, may be time-consuming and expensive and may divert time, effort and resources from our business. Evolving regulations and guidance concerning executive compensation may also impose limitations on us that affect our ability to compete successfully for executive and management talent.
In addition, given the current economic and financial environment, regulators may elect to alter standards or the interpretation of the standards used to measure regulatory compliance or to determine the adequacy of liquidity, certain risk management or other operational practices for financial services companies in a manner that impacts our ability to implement our strategy and could affect us in substantial and unpredictable ways, and could have a material adverse effect on our business, financial condition and results of operations. Furthermore, the regulatory agencies have extremely broad discretion in their interpretation of the regulations and laws and their interpretation of the quality of our loan portfolio, securities portfolio and other assets. If any regulatory agency’s assessment of the quality of our assets, operations, lending practices, investment practices, capital structure or other aspects of our business differs from our assessment, we may be required to take additional charges or undertake or refrain from taking actions that would have the effect of materially reducing our earnings, capital ratios and share price.
Because our total assets exceeded $10 billion as of September 30, 2017, we will become subject to additional regulatory requirements, which could have an adverse effect on our financial condition or results of operations.
Various federal banking laws and regulations, including rules adopted by the Federal Reserve pursuant to the requirements of the Dodd-Frank Act, impose heightened requirements on certain large banks and bank holding companies. Most of these rules apply primarily to bank holding companies with at least $50 billion in total consolidated assets, but certain rules also apply to banks and bank holding companies with at least $10 billion in total consolidated assets.
54
Table of Contents
Our total assets were $10.5 billion and Cadence Bank’s total assets were $10.5 billion as of September 30, 2017, the first quarter-end as of which total assets exceeded $10 billion. As a result, after September 30, 2018, which we expect will be the fourth consecutive quarter in which total average consolidated assets exceed $10 billion (and any applicable phase-in period), we and Cadence Bank will, among other requirements:
| • | be required to perform annual stress tests; |
| • | be required to establish a dedicated risk committee of our board of directors responsible for overseeing our enterprise-risk management policies, commensurate with our capital structure, risk profile, complexity, size and other risk-related factors, and including as a member at least one risk management expert; |
| • | calculate our FDIC deposits assessment base using a performance score and loss-severity score system; |
| • | be subject to deposit insurance surcharges under the FDIC’s rule increasing the reserve ratio for the Deposit Insurance Fund (“DIF”) to 1.35%; |
| • | be subject to more frequent regulatory examinations; and |
| • | may be subject to examination for compliance with federal consumer protection laws by the Consumer Financial Protection Bureau (the “CFPB”). |
In addition, Cadence and Cadence Bank will be affected by the Durbin Amendment to the Dodd-Frank Act regarding limits on debit card interchange fees. The Durbin Amendment gave the Federal Reserve Board the authority to establish rules regarding interchange fees charged for electronic debit transactions by a payment card issuer that, together with its affiliates, has assets of $10 billion or more and to enforce a new statutory requirement that such fees be reasonable and proportional to the actual cost of a transaction to the issuer. The Federal Reserve Board has adopted rules under this provision that limit the swipe fees that a debit card issuer can charge a merchant for a transaction to the sum of 21 cents and five basis points times the value of the transaction, plus up to one cent for fraud prevention costs.
Furthermore, after September 30, 2018, which we expect will be the fourth consecutive quarter in which total average consolidated assets exceed $10 billion (and any applicable phase-in period), deposit insurance assessments and expenses related to regulatory compliance are likely to increase, and interchange fee income will decrease, the cumulative effect of which may be significant, and are on a cumulative basis, currently anticipated to be less than $6.5 million after-tax annually. The ultimate impact of the heightened scrutiny to which we will be subject is uncertain but we may be adversely affected and may incur increased costs related to regulatory oversight. In preparation for these additional regulations, we have engaged third parties to provide DFAST readiness assessments and roadmaps, and large bank deposit insurance assessment implementation guidance. Over the last couple years, we have made targeted enhancements to our risk management framework, systems and personnel in anticipation of continued growth over $10 billion.
Legislative and regulatory actions taken now or in the future may increase our costs and impact our business, governance structure, financial condition or results of operations. Proposed legislative and regulatory actions, including changes to financial regulation, may not occur on the timeframe that is expected, or at all, which could result in additional uncertainly for our business.
We and our subsidiaries are subject to extensive regulation by multiple regulatory bodies. These regulations may affect the manner and terms of delivery of our services. If we do not comply with governmental regulations, we may be subject to fines, penalties, lawsuits or material restrictions on our businesses in the jurisdiction where the violation occurred, which may adversely affect our business operations. Changes in these regulations can significantly affect the services that we provide as well as our costs of compliance with such regulations. In addition, adverse publicity and damage to our reputation arising from the failure or perceived failure to comply with legal, regulatory or contractual requirements could affect our ability to attract and retain customers.
55
Table of Contents
Current and recent-past economic conditions, particularly in the financial markets, have resulted in government regulatory agencies and political bodies placing increased focus and scrutiny on the financial services industry. The Dodd-Frank Act significantly changed the regulation of financial institutions and the financial services industry. The Dodd-Frank Act and the regulations thereunder affect large and small financial institutions, including several provisions that will affect how community banks, thrifts and small bank and thrift holding companies will be regulated in the future.
The Dodd-Frank Act, among other things, imposed new capital requirements on bank holding companies; changed the base for FDIC insurance assessments to a bank’s average consolidated total assets minus average tangible equity, rather than upon its deposit base; and permanently raised the current standard deposit insurance limit to $250,000 and expanded the FDIC’s authority to raise insurance premiums. Pursuant to the legislation, the FDIC has raised the ratio of reserves to deposits from 1.15% to 1.35% for deposit insurance purposes and imposed surcharges on insured depository institutions with assets of at least $10 billion, which will continue through the earlier of the quarter that the reserve ratio first reaches or exceeds 1.35% and December 31, 2018. The Dodd-Frank Act also limited interchange fees payable on debit card transactions for institutions that, together with their affiliates, have assets of $10 billion or more. The Dodd-Frank Act established the CFPB as an independent entity within the Federal Reserve, which has broad rulemaking, supervisory and enforcement authority over consumer financial products and services, including deposit products, residential mortgages, home-equity loans and credit cards, and contains provisions on mortgage-related matters, such as steering incentives, determinations as to a borrower’s ability to repay and prepayment penalties. The Dodd-Frank Act also included provisions that affect corporate governance and executive compensation at all publicly traded companies and allows financial institutions to pay interest on business checking accounts. These changes also may require us to invest significant management attention and resources to make any necessary changes to operations to comply, and could have a material adverse effect on our business, financial condition and results of operations.
The Dodd-Frank Act eliminated certain hybrid securities, including trust preferred securities from Tier 1 capital, although certain trust preferred securities issued prior to May 19, 2010 by bank holding companies with total consolidated assets of $15 billion or less will continue to be includable in Tier 1 capital until 2019. This provision also required the federal banking agencies to establish minimum leverage and risk-based capital requirements that will apply to both insured banks and their holding companies.
The Tax Cuts and Jobs Act was enacted in December 2017. This legislation made significant changes to the U.S. Internal Revenue Code, many of which are highly complex and may require interpretations and implementing regulations. As a result, we may incur meaningful expenses (including professional fees) as the new legislation is implemented and the expected impact of certain aspects of the legislation is unclear and subject to change.
New proposals for legislation continue to be introduced in the U.S. Congress that could further substantially increase regulation of the financial services industry, impose restrictions on the operations and general ability of firms within the industry to conduct business consistent with historical practices, including in the areas of compensation, interest rates, financial product offerings and disclosures, and have an effect on bankruptcy proceedings with respect to consumer residential real estate mortgages, among other things. Federal and state regulatory agencies also frequently adopt changes to their regulations or change the manner in which existing regulations are applied. In addition, President Donald Trump has issued an executive order directing the review of existing financial regulations. The Trump administration has also indicated in public statements that the Dodd-Frank Act will be under scrutiny and that some of its provisions and the rules promulgated thereunder may be revised, repealed or amended. In June 2017, the U.S. House of Representatives approved the Financial Choice Act, which would revise, repeal and amend various provisions of and rules promulgated under the Dodd-Frank Act. However, it has been indicated that the Financial Choice Act is not expected to be passed by the U.S. Senate in its current form. These statements and actions have created uncertainty regarding changes to the Dodd-Frank Act that could apply to us in the future.
56
Table of Contents
Certain aspects of current or proposed regulatory or legislative changes, including to laws applicable to the financial industry, if enacted or adopted, may impact the profitability of our business activities, require more oversight or change certain of our business practices, including the ability to offer new products, obtain financing, attract deposits, make loans and achieve satisfactory interest spreads, and could expose us to additional costs, including increased compliance costs. These changes also may require us to invest significant management attention and resources to make any necessary changes to operations to comply, and could have a material adverse effect on our business, financial condition and results of operations. In addition, any proposed legislative or regulatory changes, including those that could benefit our business, financial condition and results of operations, may not occur on the timeframe that is proposed, or at all, which could result in additional uncertainty for our business.
Regulatory initiatives regarding bank capital requirements may require heightened capital.
Regulatory capital rules, adopted in July 2013, implement higher minimum capital requirements for bank holding companies and banks. The rules, which implement the Basel III regulatory capital reforms from the Basel Committee on Banking Supervision, include a common equity Tier 1 capital requirement and establish criteria that instruments must meet to be considered common equity Tier 1 capital, additional Tier 1 capital or Tier 2 capital. These enhancements were intended to both improve the quality and increase the quantity of capital required to be held by banking organizations, and to better equip the U.S. banking system to deal with adverse economic conditions. The capital rules require banks and bank holding companies to maintain a minimum common equity Tier 1 capital ratio of 4.5%, a minimum total Tier 1 capital ratio of 6%, a minimum total capital ratio of 8%, and a minimum leverage ratio of 4%. Bank holding companies and banks are also required to hold a capital conservation buffer of common equity Tier 1 capital of 2.5% (when fully phased in) to avoid limitations on capital distributions and discretionary executive compensation payments. The revised capital rules will also require banks to maintain a common equity Tier 1 capital ratio of 6.5%, a Tier 1 capital ratio of 8%, a total capital ratio of 10% and a leverage ratio of 5% to be deemed “well capitalized” for purposes of certain rules and prompt corrective action requirements.
In December 2017, the Basel Committee on Banking Supervision published standards that it described as the finalization of the Basel III regulatory framework (commonly referred to as Basel IV). Among other things, these standards revise the Basel Committee’s standardized approach for credit risk and provide a new standardized approach for operational risk capital. Under the Basel framework, these standards will generally be effective on January 1, 2022, with an aggregate output floor phasing in through January 1, 2027. Under the current U.S. capital rules, operational risk capital requirements and a capital floor apply only to advanced approaches institutions, and not to the Company or the Bank. The impact of Basel IV on us will depend on the manner in which it is implemented by the federal bank regulators.
The Federal Reserve may also set higher capital requirements for holding companies whose circumstances warrant it. For example, holding companies experiencing internal growth or making acquisitions are expected to maintain strong capital positions substantially above the minimum supervisory levels, without significant reliance on intangible assets. At this time, the bank regulatory agencies are more inclined to impose higher capital requirements to meet well-capitalized standards, and future regulatory change could impose higher capital standards as a routine matter. The Company’s, its subsidiaries’ and the selling stockholder’s regulatory capital ratios currently are in excess of the levels established for “well-capitalized” institutions.
Any new standards may require the Company, the Bank or the selling stockholder to maintain materially more capital, with common equity as a more predominant component, or manage the configuration of our assets and liabilities to comply with formulaic liquidity requirements. Our ability to raise additional capital depends on conditions in the capital markets, economic conditions and a number of other factors, including investor perceptions regarding the banking industry, market conditions and governmental activities, and on our financial condition and performance. Accordingly, we may not be able to raise additional capital if needed or on terms acceptable to us. Failure to maintain capital to meet current or future regulatory requirements could significantly
57
Table of Contents
impact our return on equity, financial condition, operations, capital position and ability to pursue business opportunities which could have a material adverse effect on our business, financial condition and results of operations.
Regulators periodically examine our business and we may be required to remediate adverse examination findings.
The Federal Reserve, the FDIC and the OCC periodically examine our business, including our compliance with laws and regulations, and we may become subject to other regulatory agency examinations in the future. If, as a result of an examination, a federal banking agency were to determine that our financial condition, capital resources, asset quality, earnings prospects, management, liquidity, or other aspects of any of our operations had become unsatisfactory, or that we were in violation of any law or regulation, it may require us to take a number of different remedial actions as it deems appropriate. These actions include the power to enjoin “unsafe or unsound” practices, to require affirmative action to correct any conditions resulting from any violation or practice, to issue an administrative order that can be judicially enforced, to direct an increase in our capital, to restrict our growth by preventing us from acquiring other financial institutions or limiting our ability to expand our business by engaging in new activities, to change the asset composition of our portfolio or balance sheet, to assess civil monetary penalties against our officers or directors, to remove officers and directors and, if it is concluded that such conditions cannot be corrected or there is an imminent risk of loss to depositors, to terminate our deposit insurance and place us into receivership or conservatorship. Any regulatory action against us could have a material adverse effect on our business, financial condition and results of operations.
Our FDIC deposit insurance premiums and assessments may increase.
The deposits of the Bank are insured by the FDIC up to legal limits and, accordingly, subject to the Bank’s payment of FDIC deposit insurance assessments. The Bank’s regular assessments are based on its average consolidated total assets minus average tangible equity as well as by risk classification, which includes regulatory capital levels and the level of supervisory concern. High levels of bank failures since the beginning of the most recent financial crisis and increases in the statutory deposit insurance limits have increased resolution costs to the FDIC and put significant pressure on the DIF. To maintain a strong funding position and restore the reserve ratios of the DIF, the FDIC increased deposit insurance assessment rates and charged a special assessment to all FDIC-insured financial institutions. The FDIC has also imposed surcharges on insured depository institutions with assets of at least $10 billion. Further increases in assessment rates or special assessments may occur in the future, especially if there are significant additional financial institution failures. Any future special assessments, increases in assessment rates or required prepayments in FDIC insurance premiums could reduce our profitability or limit our ability to pursue certain business opportunities, which could have a material adverse effect on our business, financial condition and results of operations.
The Federal Reserve may require us to commit capital resources to support Cadence Bank.
As a matter of policy, the Federal Reserve expects a bank holding company to act as a source of financial and managerial strength to a subsidiary bank and to commit resources to support such subsidiary bank. The Dodd-Frank Act codified the Federal Reserve’s policy on serving as a source of financial strength. Under the “source of strength” doctrine, the Federal Reserve may require a bank holding company to make capital injections into a troubled subsidiary bank and may charge the bank holding company with engaging in unsafe and unsound practices for failure to commit resources to a subsidiary bank. A capital injection may be required at times when the holding company may not have the resources to provide it and therefore may be required to borrow the funds or raise capital. Any loans by a holding company to its subsidiary banks are subordinate in right of payment to deposits and to certain other indebtedness of such subsidiary bank. In the event of a bank holding company’s bankruptcy, the bankruptcy trustee will assume any commitment by the holding company to a federal bank regulatory agency to maintain the capital of a subsidiary bank. Moreover, bankruptcy law provides that claims based on any such commitment will be entitled to a priority of payment over the claims of the institution’s
58
Table of Contents
general unsecured creditors, including the holders of its note obligations. Thus, any borrowing that must be done by the bank holding company to make the required capital injection becomes more difficult and expensive and could have a material adverse effect on our business, financial condition and results of operations.
Future consumer legislation or actions could harm our competitive position.
In addition to the enactment of the Dodd-Frank Act, various legislative bodies have also recently been considering altering the existing framework governing creditors’ rights, including legislation that would result in, or allow, loan modifications of various sorts. Such legislation may change banking statutes and the operating environment in substantial and unpredictable ways. If enacted, such legislation could increase the cost of doing business; limit permissible activities; or affect the competitive balance among banks, savings associations, credit unions, and other financial institutions. We cannot predict whether new legislation will be enacted, and if enacted, the effect that it or any regulations would have on our activities, financial condition, or results of operations.
We are subject to numerous laws designed to protect consumers, including the Community Reinvestment Act of 1977 (the “CRA”) and fair lending laws, and failure to comply with these laws could lead to a wide variety of sanctions.
The CRA, the Equal Credit Opportunity Act, the Fair Housing Act and other fair lending laws and regulations impose non-discriminatory lending requirements on financial institutions. The Department of Justice and other federal agencies, including the CFPB, are responsible for enforcing these laws and regulations. A successful regulatory challenge to an institution’s performance under the CRA or fair lending laws and regulations could result in a wide variety of sanctions, including damages and civil money penalties, injunctive relief, restrictions on mergers and acquisitions activity, restrictions on expansion, and restrictions on entering new business lines. In the case of the CRA, the performance of a financial institution in meeting the credit needs of its community and its overall CRA rating are factors that will be taken into consideration when the federal banking agencies evaluate applications related to mergers and acquisitions, as well as branch opening and relocations. Private parties may also have the ability to challenge an institution’s performance under fair lending laws in private class action litigation. Such actions could have a material adverse effect on our business, financial condition and results of operations.
Federal, state and local consumer lending laws may restrict our ability to originate certain mortgage loans or increase our risk of liability with respect to such loans and could increase our cost of doing business.
Federal, state and local laws have been adopted that are intended to eliminate certain lending practices considered “predatory.” These laws prohibit practices such as steering borrowers away from more affordable products, selling unnecessary insurance to borrowers, repeatedly refinancing loans and making loans without a reasonable expectation that the borrowers will be able to repay the loans irrespective of the value of the underlying property. It is our policy not to make predatory loans, but these laws create the potential for liability with respect to our lending and loan investment activities. They increase our cost of doing business and, ultimately, may prevent us from making certain loans and cause us to reduce the average percentage rate or the points and fees on loans that we do make.
The expanding body of federal, state and local regulations and/or the licensing of loan servicing, collections or other aspects of our business and our sales of loans to third parties may increase the cost of compliance and the risks of noncompliance and subject us to litigation.
We service some of our own loans, and loan servicing is subject to extensive regulation by federal, state and local governmental authorities as well as to various laws and judicial and administrative decisions imposing requirements and restrictions on those activities. The volume of new or modified laws and regulations has increased in recent years and, in addition, some individual municipalities have begun to enact laws that restrict
59
Table of Contents
loan servicing activities including delaying or temporarily preventing foreclosures or forcing the modification of certain mortgages. If regulators impose new or more restrictive requirements, we may incur additional significant costs to comply with such requirements which may further adversely affect us. In addition, were we to be subject to regulatory investigation or regulatory action regarding our loan modification and foreclosure practices, our financial condition and results of operation could be adversely affected.
In addition, we and our legacy companies have sold loans to third parties. In connection with these sales, we or certain of our subsidiaries or legacy companies make or have made various representations and warranties, breaches of which may result in a requirement that we repurchase the loans, or otherwise make whole or provide other remedies to counterparties. These aspects of our business or our failure to comply with applicable laws and regulations could possibly lead to: civil and criminal liability; loss of licensure; damage to our reputation in the industry; fines and penalties and litigation, including class action lawsuits; and administrative enforcement actions. Any of these outcomes could materially and adversely affect us.
Potential limitations on incentive compensation contained in proposed federal agency rulemaking may adversely affect our ability to attract and retain our highest performing employees.
In April 2011 and May 2016, the Federal Reserve, other federal banking agencies and the SEC jointly published proposed rules designed to implement provisions of the Dodd-Frank Act prohibiting incentive compensation arrangements that would encourage inappropriate risk taking at covered financial institutions, which includes a bank or bank holding company with $1 billion or more in assets, such as Cadence Bank. It cannot be determined at this time whether or when a final rule will be adopted and whether compliance with such a final rule will substantially affect the manner in which we structure compensation for our executives and other employees. Depending on the nature and application of the final rules, we may not be able to successfully compete with certain financial institutions and other companies that are not subject to some or all of the rules to retain and attract executives and other high performing employees. If this were to occur, relationships that we have established with our clients may be impaired and our business, financial condition and results of operations could be adversely affected, perhaps materially.
Failure to comply with economic and trade sanctions or with applicable anti-corruption laws could have a material adverse effect on our business, financial condition and results of operations.
The Office of Foreign Assets Control administers and enforces economic and trade sanctions against targeted foreign countries and regimes, under authority of various laws, including designated foreign countries, nationals and others. We are responsible for, among other things, blocking accounts of, and transactions with, such persons and countries, prohibiting unlicensed trade and financial transactions with them and reporting blocked transactions after their occurrence. Through our company and the Bank, and our agents and employees, we are subject to the Foreign Corrupt Practices Act (“FCPA”), which prohibits offering, promising, giving, or authorizing others to give anything of value, either directly or indirectly, to a non-U.S. government official in order to influence official action or otherwise gain an unfair business advantage. The Company is also subject to applicable anti-corruption laws in the jurisdictions in which it may operate. The Company has implemented policies, procedures, and internal controls that are designed to comply with economic and trade sanctions or with applicable anti-corruption laws, including the FCPA. Failure to comply with economic and trade sanctions or with applicable anti-corruption laws, including the FCPA, could have serious legal and reputational consequences for us.
60
Table of Contents
Risks Relating to Cadence Bancorp, LLC and Our Status as a Controlled Company
Immediately following this offering, Cadence Bancorp, LLC will hold approximately 68.3% of the voting power of our common stock and will continue to effectively control our management and affairs. This will prevent you and other minority stockholders from influencing significant corporate decisions and may result in conflicts of interest.
Immediately following the completion of this offering, Cadence Bancorp, LLC will own approximately 68.3% of our outstanding Class A common stock (or approximately 67.0% if the underwriters exercise in full their option to purchase additional shares). As a result, Cadence Bancorp, LLC will continue to own shares sufficient for the majority vote over all matters requiring a stockholder vote, including:
| • | the election of directors; |
| • | mergers, consolidations and acquisitions; |
| • | the sale of all or substantially all of our assets and other decisions affecting our capital structure; the amendment of our certificate of incorporation and our bylaws; and |
| • | our winding up and dissolution. |
This concentration of ownership may delay, deter or prevent acts that would be favored by our other stockholders. The interests of Cadence Bancorp, LLC may not always coincide with our interests or the interests of our other stockholders. This concentration of ownership may also have the effect of delaying, preventing or deterring a change in control of us or other strategic transactions involving us. In particular, we expect that, pending a dissolution or other wind-down, Cadence Bancorp, LLC would be incented to maintain sufficient ownership of our Class A common stock to continue to comply with regulatory capital requirements applicable to it and to avoid potentially being deemed to be an investment company for purposes of the Investment Company Act of 1940. In addition, Cadence Bancorp, LLC may seek to cause us to take courses of action that, in its judgment, could enhance its investment in us, but which might involve risks to our other stockholders or adversely affect us or our other stockholders, including investors in this offering. As a result, the market price of our Class A common stock could decline or stockholders might not receive a premium over the then-current market price of our common stock upon a change in control. In addition, this concentration of share ownership may adversely affect the market price of our Class A common stock because investors may perceive disadvantages in owning shares in a company with significant stockholders.
In addition, all of our directors and certain of our executive officers also serve as directors of Cadence Bancorp, LLC. All of our directors and certain of our executive officers also hold equity interests and/or incentive interests in Cadence Bancorp, LLC. Because of these overlapping interests, certain decisions concerning our operations or financial structure may present conflicts of interest amongst our directors and certain of our executive officers and their interests may conflict with yours.
We do not have control over when, if at all, Cadence Bancorp, LLC may decide to sell the shares of our Class A common stock that it will beneficially own following this offering.
After the completion of this offering, Cadence Bancorp, LLC will beneficially own 68.3% of our outstanding Class A common stock (or 67.0% if the underwriters exercise their option to purchase additional shares of Class A common stock in full). The timing of any further sales by Cadence Bancorp, LLC of shares of our Class A common stock or any other transaction in which Cadence Bancorp, LLC divests any part of its interest in us following this offering is unknown at this time and will be subject to the investment strategy and objectives of Cadence Bancorp, LLC and its members, market conditions and other considerations as well as a lock-up agreement by Cadence Bancorp, LLC in connection with this offering. See “Underwriting.” There can be no assurance of the time period over which any such further dispositions will occur or that they will occur at all. Any delay by Cadence Bancorp, LLC in completing, or uncertainty about its ability or intention to complete, the divestiture of our Class A common stock that it beneficially owns could have a material adverse effect on our
61
Table of Contents
company and the market price for our Class A common stock. In addition, in certain circumstances certain of our shares of our Class A common stock held by the selling stockholder may be converted into shares of our Class B non-voting common stock. See “Description of Capital Stock—Capital Stock—Class A Common Stock and Class B Non-Voting Common Stock—Conversion of Class A Common Stock Upon LLC Distribution.” This conversion would decrease the number of outstanding shares of our Class A common stock and, therefore, could result in a holder of our Class A common stock holding in excess of a prescribed regulatory thresholds. See “Supervision and Regulation.”
Our controlling shareholder, Cadence Bancorp, LLC, is a bank holding company, and its failure to maintain adequate capital could have adverse consequences for us and for Cadence Bank.
The regulatory capital rules described in the risk factors “—Regulatory initiatives regarding bank capital requirements may require heightened capital” and “—The Federal Reserve may require us to commit capital resources to support Cadence Bank” above and under the heading “Supervision and Regulation—Bank Holding Company Regulation—Rules on Regulatory Capital” also apply to Cadence Bancorp, LLC, our controlling shareholder and a bank holding company. Substantially all of Cadence Bancorp, LLC’s assets consist of its ownership of shares of the Company’s common stock, and the Company is a non-depository institution consolidated subsidiary of Cadence Bancorp, LLC. Under the capital rules, capital of a banking organization’s consolidated subsidiary that is held by third parties (“minority interests”) is not included in the common equity Tier 1 capital of such banking organization on a consolidated basis unless the issuing subsidiary is a depository institution. Because they are not being issued by Cadence Bank, the shares of Class A common stock issued by us in our IPO and any other shares of our Class A common stock that we issue in the future, as well as the shares of Class A common stock being sold by Cadence Bancorp, LLC in this offering, in previous offerings and in any future disposition, will not constitute common equity Tier 1 capital of Cadence Bancorp, LLC on a consolidated basis for purposes of these rules. Therefore, as a result of this offering and any such other transactions, we will have higher levels of common equity Tier 1 capital than Cadence Bancorp, LLC with respect to the same amount of consolidated risk weighted assets and consolidated assets and therefore higher common equity Tier 1 and other regulatory capital ratios than Cadence Bancorp, LLC. If we were to issue additional common stock in the future and Cadence Bancorp, LLC did not also issue additional Common Equity Tier 1 capital, or if Cadence Bancorp, LLC were to sell any additional shares of the Company’s common stock owned by it following the completion of this offering, this divergence in Common Equity Tier 1 regulatory capital ratios could increase, including quite significantly in certain circumstances.
Additionally, on December 14, 2015, the Federal Reserve issued a final rule regarding bank holding companies with non-traditional capital structures, such as limited liability companies, which we refer to as LLCs. The rule provides generic examples of certain mechanics or provisions in organizing documents of bank holding companies with non-traditional capital structures, such as Cadence Bancorp, LLC, that may render membership interests (or other form of equity) ineligible as common equity Tier 1 capital. See “Supervision and Regulation—Regulatory Capital.” Bank holding companies had until July 1, 2016, to bring relevant capital instruments into compliance with the capital rules, including the guidance in the final rule noted above. Cadence Bancorp, LLC believes that its membership interests are consistent with the capital rules. It is possible that the Federal Reserve could engage in further rulemaking or provide additional guidance regarding the capital of non-traditional capital structures or Cadence Bancorp, LLC’s membership interests specifically, including in connection with future acquisitions or transactions that require regulatory approval or review. Depending on the nature and extent of additional rulemaking or guidance from the Federal Reserve, if any, a portion of Cadence Bancorp, LLC’s membership interests could fail to qualify as common equity Tier 1 capital, which, unless otherwise remedied, could have a material adverse effect on Cadence Bancorp, LLC’s regulatory capital position and the ability of Cadence Bancorp, LLC or the Company to consummate future acquisitions or transactions.
For so long as Cadence Bancorp, LLC is treated as a bank holding company with respect to Cadence Bank and us, the Federal Reserve may take into account the regulatory capital levels of Cadence Bancorp, LLC in its supervision of us, including in determining whether to approve regulatory applications by us such as in
62
Table of Contents
connection with proposed acquisitions, which in certain circumstances could lead to limitations on our activities, including our ability to grow through acquisitions or organically. In addition, for so long as our assets are reflected, on a consolidated basis, in the regulatory capital ratios of Cadence Bancorp, LLC, we may face limitations on our growth or the composition of our balance sheet if growth in, or changes to the composition of, our balance sheet would result in Cadence Bancorp, LLC failing to satisfy applicable regulatory capital requirements, in particular if the divergence, discussed above, between the capital levels of Cadence Bancorp, LLC and the Company increase significantly.
In the event that Cadence Bancorp, LLC fails to maintain required regulatory capital ratios (whether as a result of rulemaking rendering equity ineligible or otherwise), including the ratio of common equity Tier 1 capital to risk-weighted assets, the Federal Reserve could take supervisory actions against Cadence Bancorp, LLC that may also negatively affect us and Cadence Bank. Any such actions could significantly impact our return on equity, financial condition, operations, capital position, ability to pursue organic growth, ability to pay dividends, business opportunities and acquisitions, all of which could have a material adverse effect on our business, financial condition and results of operations.
Shares of our Class A common stock held by Cadence Bancorp, LLC may be converted into Class B non-voting common stock.
A percentage of the shares of our Class A common stock held by the selling stockholder, may be converted into shares of our Class B non-voting common stock. Each share of our Class A common stock owned by Cadence Bancorp, LLC will automatically convert into a share of Class B non-voting common stock upon a distribution or other transfer of shares to a member of Cadence Bancorp, LLC, or upon the liquidation of Cadence Bancorp, LLC, to the extent that such distribution, transfer or liquidation would otherwise result in such member of Cadence Bancorp, LLC, together with its affiliates, owning in excess of 9.9% of our Class A common stock (or any class of our voting securities), excluding for purposes of this calculation any reduction in ownership resulting from transfers by such holder of our voting securities. In addition, Cadence Bancorp, LLC has the right to cause shares of Class A common stock owned by it to convert into shares of Class B non-voting common stock to the extent that a distribution or other transfer to a member of Cadence Bancorp, LLC, or a liquidation of Cadence Bancorp, LLC, would otherwise result in shares of Class A common stock being received in respect of non-voting units of Cadence Bancorp, LLC. Such conversions would decrease the number of outstanding shares of our Class A common stock and, therefore, could result in a holder of our Class A common stock holding in excess of prescribed regulatory thresholds. See “Supervision and Regulation.”
We are a “controlled company” within the meaning of applicable stock exchange rules and, as a result, qualify for exemptions from certain corporate governance requirements.
Cadence Bancorp, LLC currently controls a majority of the voting power of our common stock, and will continue to do so immediately following the completion of this offering. Under applicable stock exchange rules, a listed company of which more than 50% of the voting power for the election of directors is held by another person or group of persons acting together is a “controlled company,” and such a company may elect not to comply with certain corporate governance requirements, including the requirement to have a majority of our board of directors be independent, to have an independent compensation committee with a written compensation committee charter meeting the requirements of the New York Stock Exchange (“NYSE”) or to have an independent nominating committee with a written charter meeting the requirements of the NYSE.
We currently utilize some of these exemptions. Accordingly, our stockholders may not have the same protections afforded to stockholders of companies that are subject to all of the corporate governance requirements. We do not know when Cadence Bancorp, LLC will cease to control a majority of the voting power of our common stock.
63
Table of Contents
The market price of our Class A common stock could be negatively affected by sales of substantial amounts of our common stock in the public markets.
Sales of a substantial number of shares of our Class A common stock in the public market, or the perception that large sales could occur, could cause the market price of our Class A common stock to decline or limit our future ability to raise capital through an offering of equity securities.
As of the date of this registration statement, there were 83,625,000 shares of our Class A common stock outstanding. Of our issued and outstanding shares of Class A common stock, the 7,000,000 shares sold in this offering (or 8,050,000 shares if the underwriters exercise their option to purchase additional shares in full) will be freely transferable, except for any shares held by our “affiliates,” as that term is defined in Rule 144 under the Securities Act of 1933, as amended (the “Securities Act”), in respect of which the applicable holding period has not yet passed. Following completion of the offering, approximately 68.3% of our outstanding Class A common stock (or 67.0% if the underwriters exercise their option to purchase additional shares in full) will be held by Cadence Bancorp, LLC and can be resold into the public markets in the future in accordance with the requirements of Rule 144. See “Shares Eligible for Future Sale.”
Pursuant to the Registration Rights Agreement, Cadence Bancorp, LLC has the right, in certain circumstances, to require us to register their shares of our common stock under the Securities Act, including for sale into the public markets. See “Certain Relationships and Related Party Transactions—Registration Rights Agreement.” Upon the effectiveness of such a registration statement, all shares covered by the registration statement will be freely transferable. In addition, if Cadence Bancorp, LLC distributes or otherwise transfers shares of our common stock to holders of its membership units, those unitholders would benefit from the registration rights under the Registration Rights Agreement. The shares of our Class A common stock held by those unitholders of Cadence Bancorp, LLC would then be able to be resold into the public markets in connection with the exercise of those registration rights or in accordance with the requirements of Rule 144 under the Securities Act, in each case after the expiration of the lockup period described below.
We and our executive officers, directors and the selling stockholder have agreed with the underwriters that, subject to certain exceptions, we expect to enter into with the underwriters in connection with the offering, we and they will not directly or indirectly sell or otherwise transfer their shares for a period of 90 days after the completion of the offering. See “Shares Eligible for Future Sale—Lock-Up Agreements.”
The market price of our Class A common stock may decline significantly when the restrictions on resale by our existing stockholders lapse. A decline in the price of our Class A common stock might impede our ability to raise capital through the issuance of additional common stock or other equity securities.
Risks Relating to an Investment in Our Class A Common Stock
There is a limited public trading history for our Class A common stock. An active, liquid market for our Class A common stock may not be sustained upon completion of this offering, which may impair your ability to sell your shares. As a result, the public offering price in this offering may not be indicative of the price at which our Class A common stock will trade in the future.
Our shares of Class A common stock have only been listed on the NYSE since April 13, 2017. Prior to that date, our Class A common stock was not publicly traded. The selling stockholder currently holds 76.6% of the outstanding shares of our Class A common stock and will hold up to 68.3% of the outstanding shares of our Class A common stock upon the completion of this offering. An active, liquid trading market for our Class A common stock may not be sustained following the offering, including as a result of the number of shares held by the selling stockholder, the limited period of time which our shares have been publicly traded or other factors. Without an active, liquid trading market for our Class A common stock, stockholders may not be able to sell their shares at the volume, prices and times desired. Moreover, the lack of an established market could materially and adversely affect the value of our Class A common stock. The public offering price for our Class A common stock
64
Table of Contents
will be determined by negotiations between the selling stockholder and the representatives of the underwriters and may not be indicative of prices that will prevail in the open market following this offering. Consequently, you may not be able to sell your Class A common stock at our above the public offering price or at any other price or at the time that you would like to sell. In addition, the market price of our Class A common stock could decline significantly due to actual or anticipated issuances or sales of our Class A common stock in the future, including by the selling stockholder and/or its unitholders. An inactive market may also impair our ability to raise capital by selling our Class A common stock and may impair our ability to expand our business by using our Class A common stock as consideration. In addition, there is a limited public trading history for our Class A common stock. As a result, the public offering price in this offering may not be indicative of the price at which our Class A common stock will trade in the future.
The market price of our Class A common stock may be subject to substantial fluctuations, which may make it difficult for you to sell your shares at the volume, prices and times desired.
The market price of our Class A common stock may be highly volatile, which may make it difficult for you to sell your shares at the volume, prices and times desired. There are many factors that may impact the market price and trading volume of our Class A common stock, including, without limitation:
| • | actual or anticipated fluctuations in our operating results, financial condition or asset quality; |
| • | changes in economic or business conditions; |
| • | failure to meet market predictions of our earnings; |
| • | the effects of, and changes in, trade, monetary and fiscal policies, including the interest rate policies of the Federal Reserve; |
| • | publication of research reports about us, our competitors, or the financial services industry generally, or changes in, or failure to meet, estimates made by securities analysts or ratings agencies of our financial and operating performance, or lack of research reports by industry analysts or ceasing of coverage; |
| • | operating and stock price performance of companies that investors deemed comparable to us; |
| • | future issuances of our Class A common stock or other securities; |
| • | additions or departures of key personnel; |
| • | proposed or adopted changes in laws, regulations or policies affecting us; |
| • | perceptions in the marketplace regarding our competitors and/or us; |
| • | our treatment as an “emerging growth company” under the federal securities laws; |
| • | changes in accounting principles, policies and guidelines; |
| • | rapidly changing technology; |
| • | significant acquisitions or business combinations, strategic partnerships, joint ventures or capital commitments by or involving our competitors or us; |
| • | other economic, competitive, governmental, regulatory and technological factors affecting our operations, pricing, products and services; and |
| • | other news, announcements or disclosures (whether by us or others) related to us, our competitors, our markets or the financial services industry. |
The stock market and, in particular, the market for financial institution stocks, have experienced substantial fluctuations in recent years, which in many cases have been unrelated to the operating performance and prospects of particular companies. In addition, significant fluctuations in the trading volume in our Class A common stock may cause significant price variations to occur. Increased market volatility may materially and adversely affect the market price of our Class A common stock, which could make it difficult to sell your shares at the volume, prices and times desired.
65
Table of Contents
There are substantial regulatory limitations on changes of control of bank holding companies that may discourage investors from purchasing shares of our common stock.
With certain limited exceptions, federal regulations prohibit a person or company or a group of persons deemed to be “acting in concert” from, directly or indirectly, acquiring more than 10% (5% if the acquirer is a bank holding company) of any class of our voting stock or obtaining the ability to control in any manner the election of a majority of our directors or otherwise direct the management or policies of our company without prior notice or application to, and the approval of, the Federal Reserve. Companies investing in banks and bank holding companies receive additional review and may be required to become bank holding companies, subject to regulatory supervision. Accordingly, prospective investors must be aware of and comply with these requirements, if applicable, in connection with any purchase of shares of our common stock. These provisions could discourage third parties from seeking to acquire significant interests in us or in attempting to acquire control of us, which, in turn, could adversely affect the market price of our common stock.
Securities analysts may not continue coverage on our Class A common stock, which could adversely affect the market for our Class A common stock.
The trading market for our Class A common stock depends in part on the research and reports that securities analysts publish about us and our business. We do not have any control over these securities analysts, and they may not cover our Class A common stock. If securities analysts do not continue to cover our Class A common stock, the lack of research coverage may adversely affect our market price. If our Class A common stock is the subject of an unfavorable report, the price of our Class A common stock may decline. If one or more of these analysts cease to cover us or fail to publish regular reports on us, we could lose visibility in the financial markets, which could cause the price or trading volume of our Class A common stock to decline.
As a public company, we incur significant legal, accounting, insurance, compliance and other expenses. Any deficiencies in our financial reporting or internal controls could materially and adversely affect us, including resulting in material misstatements in our financial statements, and the market price of our Class A common stock.
As a public company, we incur significant legal, accounting, insurance and other expenses. These costs and compliance with the rules of the SEC and the rules of the applicable stock exchange may further increase our legal and financial compliance costs and make some activities more time consuming and costly. Beginning with our Annual Report on Form 10-K for our 2018 fiscal year, SEC rules will require that our Chief Executive Officer and Chief Financial Officer periodically certify the existence and effectiveness of our internal control over financial reporting. Beginning with the time we are no longer an “emerging growth company” as defined in the JOBS Act, but no later than December 31, 2023, our independent registered public accounting firm will be required to attest to our assessment of our internal control over financial reporting. This process will require significant documentation of policies, procedures and systems, review of that documentation by our internal auditing and accounting staff and our outside independent registered public accounting firm, and testing of our internal control over financial reporting by our internal auditing and accounting staff and our outside independent registered public accounting firm. This process will involve considerable time and attention from management, which could prevent us from successfully implementing our business initiatives and improving our business, results of operations and financial condition, may strain our internal resources, and will increase our operating costs. We may experience higher than anticipated operating expenses and outside auditor fees during the implementation of these changes and thereafter.
During the course of our testing, we may identify deficiencies that would have to be remediated to satisfy the SEC rules for certification of our internal control over financial reporting. A material weakness is defined by the standards issued by the Public Company Accounting Oversight Board as a deficiency, or combination of deficiencies, in internal control over financial reporting that results in a reasonable possibility that a material misstatement of our annual or interim financial statements will not be prevented or detected on a timely basis. As
66
Table of Contents
a consequence, we would have to disclose in periodic reports we file with the SEC any material weakness in our internal control over financial reporting. The existence of a material weakness would preclude management from concluding that our internal control over financial reporting is effective and would preclude our independent auditors from attesting to our assessment of the effectiveness of our internal control over financial reporting is effective. In addition, disclosures of deficiencies of this type in our SEC reports could cause investors to lose confidence in our financial reporting, may negatively affect the market price of our Class A common stock, and could result in the delisting of our securities from the securities exchanges on which they trade. Moreover, effective internal controls are necessary to produce reliable financial reports and to prevent fraud. If we have deficiencies in our disclosure controls and procedures or internal control over financial reporting, it may materially and adversely affect us.
Material weaknesses in our financial reporting or internal controls could adversely affect our business.
A material weakness is a deficiency, or a combination of deficiencies, in internal control over financial reporting, such that there is a reasonable possibility that a material misstatement of the company’s annual or interim financial statements will not be prevented or detected on a timely basis. In connection with management’s assessment of internal control over financial reporting, we identified a material weakness in our internal control over financial reporting during the audit of our consolidated financial statements for the year ended December 31, 2014, related to our understanding of third party data inputs used only in the accounting of acquired credit impaired loans (“ACI”) under ASC 310-30. We have implemented measures designed to address the internal control material weakness and expect to continue to implement measures designed to improve our internal control over financial reporting. These measures include, among other things, enhancing both applicable input controls and reconciliations of the applicable third party data inputs, and supplementing our personnel training. While we believe these measures will mitigate the risk related to the aforementioned internal control material weakness, we cannot be certain that, at some point in the future, another material weakness will not be identified or our internal controls will not fail to detect a matter they are designed to prevent, and failure to remedy such material weaknesses could result in a material misstatement in our financial statements and have a material adverse impact on our business, financial condition and results of operations. The identification of any additional material weakness could also result in investors losing confidence in our internal controls and questioning our reported financial information, which, among other things, could have a negative impact on the trading price of our Class A common stock. Additionally, we could become subject to increased regulatory scrutiny and a higher risk of stockholder litigation, which could result in significant additional expenses and require additional financial and management resources.
We are an “emerging growth company,” and the reduced reporting and other requirements applicable to emerging growth companies may make our Class A common stock less attractive to investors.
We are an “emerging growth company,” as defined in the JOBS Act. For as long as we continue to be an emerging growth company, we may take advantage of exemptions from various reporting and other requirements that are applicable to other public companies that are not emerging growth companies, including, but not limited to, not being required to comply with the auditor attestation requirements of Section 404 of the Sarbanes-Oxley Act, being permitted to have an extended transition period for adopting any new or revised accounting standards that may be issued by the Public Company Accounting Oversight Board or the SEC, reduced disclosure obligations regarding executive compensation in our periodic reports and proxy statements, and exemptions from the requirements of holding a non-binding advisory vote on executive compensation and stockholder approval of any golden parachute payments not previously approved. We may take advantage of these and other exemptions until we are no longer an emerging growth company. We could be an emerging growth company until December 31, 2022, although we could lose that status sooner if our gross revenues exceed $1.07 billion, if we issue more than $1.0 billion in non-convertible debt in a three year period, or if the market value of our Class A common stock held by non-affiliates exceeds $700 million as of any June 30 more than one year after our IPO, in which case we would no longer be an emerging growth company as of the following December 31. As a result, we could cease to be an “emerging growth company” as soon as the end of the 2018 fiscal year. We cannot
67
Table of Contents
predict if investors will find our Class A common stock less attractive because we may rely on these exemptions, or if we choose to rely on additional exemptions in the future. If some investors find our Class A common stock less attractive as a result, there may be a less active trading market for our Class A common stock and our stock price may be more volatile.
Because we have elected to use the extended transition period for complying with new or revised accounting standards for an “emerging growth company” our financial statements may not be comparable to companies that comply with these accounting standards as of the public company effective dates.
We have elected to use the extended transition period for complying with new or revised accounting standards under Section 7(a)(2)(B) of the Securities Act. This election allows us to delay the adoption of new or revised accounting standards that have different effective dates for public and private companies until those standards apply to private companies. As a result of this election, our financial statements may not be comparable to companies that comply with these accounting standards as of the public company effective dates. Consequently, our financial statements may not be comparable to companies that comply with public company effective dates. Because our financial statements may not be comparable to companies that comply with public company effective dates, investors may have difficulty evaluating or comparing our business, performance or prospects in comparison to other public companies, which may have a negative impact on the value and liquidity of our common stock. We cannot predict if investors will find our common stock less attractive because we plan to rely on this exemption. If some investors find our common stock less attractive as a result, there may be a less active trading market for our common stock and our stock price may be more volatile.
Future equity issuances could result in dilution, which could cause our Class A common stock price to decline and future sales of our Class A common stock could depress the market price of our Class A common stock.
As of the date of this registration statement, we have 83,625,000 shares of Class A common stock issued and outstanding, and no issued and outstanding shares of our Class B non-voting common stock. Although we do not currently have any plans, arrangements or understandings to issue any shares of our Class A common stock during the 12-month period following the date of this registration statement other than pursuant to the equity compensation arrangements described in this registration statement (see “Executive Compensation” and “Director Compensation”), actual or anticipated issuances or sales of substantial amounts of our Class A common stock following this offering could cause the market price of our Class A common stock to decline significantly and make it more difficult for us to sell equity or equity-related securities in the future at a time and on terms that we deem appropriate. The issuance of any shares of our Class A common stock in the future also would, and equity-related securities could, dilute the percentage ownership interest held by stockholders prior to such issuance. We may issue all of these shares without any action or approval by our stockholders, and these shares, once issued (including upon exercise of outstanding options), will be available for sale into the public market, subject to the restrictions described below, if applicable, for affiliate holders.
Our future ability to pay dividends is subject to restrictions.
We currently conduct substantially all of our operations through our subsidiaries, and a significant part of our income is attributable to dividends from the Bank and we principally rely on the profitability of the Bank to conduct operations and satisfy obligations. Our principal source of funds to pay dividends on our common and preferred stock and service any of our obligations are dividends received directly from our subsidiaries, including Cadence Bank and Cadence Insurance. As is the case with all financial institutions, the profitability of the Bank is subject to the fluctuating cost and availability of money, changes in interest rates, and in economic conditions in general. In addition, various federal and state statutes and regulations limit the amount of dividends that the Bank may pay to us, with or without regulatory approval.
Holders of our Class A common stock are entitled to receive only such cash dividends as our board of directors may declare out of funds legally available for such payments. Any declaration and payment of
68
Table of Contents
dividends on Class A common stock will depend upon our earnings and financial condition, liquidity and capital requirements, the general economic and regulatory climate, our ability to service any equity or debt obligations senior to the Class A common stock, and other factors deemed relevant by the board of directors. Furthermore, consistent with our business plans, growth initiatives, capital availability, projected liquidity needs, and other factors, we have made, and will continue to make, capital management decisions and policies that could adversely impact the amount of dividends, if any, paid to our common stockholders.
On January 24, 2018, our board of directors declared a quarterly dividend of $0.125 per share of outstanding Class A common stock, payable on March 20, 2018 to stockholders of record on the close of business on March 1, 2018. Although we currently expect to continue to pay quarterly dividends, any future determination relating to our dividend policy will be made by our board of directors and will depend on a number of factors. We are subject to certain restrictions on the payment of cash dividends as a result of banking laws, regulations and policies. Finally, our ability to pay dividends to our stockholders depends on our receipt of dividends from the Bank, which is also subject to restrictions on dividends as a result of banking laws, regulations and policies. See “Dividend Policy.”
Our corporate governance documents, and certain corporate and banking laws applicable to us, could make a takeover more difficult, thereby depressing the trading price of our Class A Common Stock.
Certain provisions of our articles of incorporation and bylaws, and corporate and federal banking laws, could delay, defer, or prevent a third party from acquiring control of our organization or conduct a proxy contest, even if those events were perceived by many of our stockholders as beneficial to their interests. These provisions and the corporate and banking laws and regulations applicable to us:
| • | enable our board of directors to issue additional shares of authorized, but unissued capital stock; |
| • | enable our board of directors to issue “blank check” preferred stock with such designations, rights and preferences as may be determined from time to time by the board; |
| • | enable our board of directors to increase the size of the board and fill the vacancies created by the increase; |
| • | enable our board of directors to serve for three year terms; |
| • | may prohibit large stockholders, in particular those owning 15% or more of our outstanding voting stock, from merging or combining with us for a certain period of time; |
| • | provide for a plurality voting standard in the election of directors; |
| • | do not provide for cumulative voting in the election of directors; |
| • | enable our board of directors to amend our bylaws without stockholder approval; |
| • | do not allow for the removal of directors without cause; |
| • | limit the right of stockholders to call a special meeting; |
| • | do not allow stockholder action by less than unanimous written consent if less than 50.1% of our outstanding Class A common stock is owned by Cadence Bancorp, LLC; |
| • | require advance notice for director nominations and other stockholder proposals; and |
| • | require prior regulatory application and approval of any transaction involving control of our organization. |
These provisions may discourage potential acquisition proposals and could delay or prevent a change in control, including under circumstances in which our stockholders might otherwise receive a premium over the market price of our shares. See “Description of Capital Stock.” In addition Cadence Bancorp, LLC currently owns, and will continue to own immediately following the completion of this offering, shares sufficient for the majority vote over all matters requiring a stockholder vote, which may delay, deter or prevent acts that would be
69
Table of Contents
favored by our other stockholders. See “—Immediately following this offering, Cadence Bancorp, LLC will hold approximately 68.3% of the voting power of our common stock and will effectively control our management and affairs. This will prevent you and other minority stockholders from influencing significant corporate decisions and may result in conflicts of interest.”
An investment in our Class A common stock is not an insured deposit and is subject to risk of loss.
Your investment in our Class A common stock will not be a bank deposit and will not be insured or guaranteed by the FDIC or any other government agency. Your investment will be subject to investment risk, and you must be capable of affording the loss of your entire investment.
The return on your investment in our common stock is uncertain.
An investor in our Class A common stock may not realize a substantial return on his or her investment, or may not realize any return at all. Further, as a result of the uncertainty and risks associated with our operations, many of which are described in this “Risk Factors” section, it is possible that an investor could lose his or her entire investment.
70
Table of Contents
Cautionary Note Regarding Forward-Looking Statements
This prospectus contains forward-looking statements. These forward-looking statements reflect our current views with respect to, among other things, future events and our results of operations, financial condition and financial performance. These statements are often, but not always, made through the use of words or phrases such as “may,” “should,” “could,” “predict,” “potential,” “believe,” “will likely result,” “expect,” “continue,” “will,” “anticipate,” “seek,” “estimate,” “intend,” “plan,” “projection,” “would” and “outlook,” or the negative version of those words or other comparable words of a future or forward-looking nature. These forward-looking statements are not historical facts, and are based on current expectations, estimates and projections about our industry, management’s beliefs and certain assumptions made by management, many of which, by their nature, are inherently uncertain and beyond our control. Accordingly, we caution you that any such forward-looking statements are not guarantees of future performance and are subject to risks, assumptions and uncertainties that are difficult to predict. Although we believe that the expectations reflected in these forward-looking statements are reasonable as of the date made, actual results may prove to be materially different from the results expressed or implied by the forward-looking statements.
There are or will be important factors that could cause our actual results to differ materially from those indicated in these forward-looking statements, including, but not limited to, the following:
| • | business and economic conditions generally and in the financial services industry, nationally and within our current and future geographic market areas; |
| • | economic, market, operational, liquidity, credit and interest rate risks associated with our business; |
| • | lack of seasoning in our loan portfolio; |
| • | deteriorating asset quality and higher loan charge-offs; |
| • | the laws and regulations applicable to our business; |
| • | our ability to achieve organic loan and deposit growth and the composition of such growth; |
| • | increased competition in the financial services industry, nationally, regionally or locally; |
| • | our ability to maintain our historical earnings trends; |
| • | our ability to raise additional capital to implement our business plan; |
| • | material weaknesses in our internal control over financial reporting; |
| • | systems failures or interruptions involving our information technology and telecommunications systems or third-party servicers; |
| • | the composition of our management team and our ability to attract and retain key personnel; |
| • | the fiscal position of the U.S. federal government and the soundness of other financial institutions; |
| • | our ability to monitor our lending relationships; |
| • | the composition of our loan portfolio, including the identity of our borrowers and the concentration of loans in energy-related industries and in our specialized industries; |
| • | the portion of our loan portfolio that is comprised of participations and shared national credits; |
| • | the amount of nonperforming and classified assets we hold; |
| • | time and effort necessary to resolve nonperforming assets; |
| • | our ability to identify potential candidates for, consummate, and achieve synergies resulting from, potential future acquisitions; |
71
Table of Contents
| • | environmental liability associated with our lending activities; |
| • | the geographic concentration of our markets in Texas and the southeast United States; |
| • | the commencement and outcome of litigation and other legal proceedings against us or to which we may become subject; |
| • | the impact of recent and future legislative and regulatory changes, including changes in banking, securities and tax laws and regulations, such as the Dodd-Frank Act, and their application by our regulators, and the impact if potential expected changes do not occur; |
| • | requirements to remediate adverse examination findings; |
| • | changes in the scope and cost of FDIC deposit insurance premiums; |
| • | implementation of regulatory initiatives regarding bank capital requirements that may require heightened capital; |
| • | the obligations associated with being a public company; |
| • | our success at managing the risks involved in the foregoing items; |
| • | our modeling estimates related to an increased interest rate environment; |
| • | our ability to achieve the cost savings and efficiencies in connection with branch closures; and |
| • | our estimates as to our expected operational leverage and the expected additional loan capacity of our relationship managers. |
The foregoing factors should not be construed as exhaustive and should be read together with the other cautionary statements included in this prospectus. If one or more events related to these or other risks or uncertainties materialize, or if our underlying assumptions prove to be incorrect, actual results may differ materially from what we anticipate. Accordingly, you should not place undue reliance on any such forward-looking statements. Any forward-looking statement speaks only as of the date on which it is made, and we do not undertake any obligation to publicly update or review any forward-looking statement, whether as a result of new information, future developments or otherwise. New factors emerge from time to time, and it is not possible for us to predict which will arise. In addition, we cannot assess the impact of each factor on our business or the extent to which any factor, or combination of factors, may cause actual results to differ materially from those contained in any forward-looking statements.
72
Table of Contents
We will not receive any proceeds from the sale of our Class A common stock in this offering, including the sale of any shares pursuant to the underwriters’ option to purchase additional shares. All of the shares in this offering are being sold by the selling stockholder. See “Security Ownership of Beneficial Owners, Management and the Selling Stockholder.” All proceeds from the sale of these shares, net of underwriting discounts and commissions and estimated offering expenses payable by the selling stockholder, will be received by the selling stockholder.
73
Table of Contents
On January 24, 2018, our board of directors declared a quarterly dividend of $0.125 per share of outstanding Class A common stock, payable on March 20, 2018 to stockholders of record on the close of business on March 1, 2018.
Although we currently expect to continue to pay quarterly dividends, any future determination relating to our dividend policy will be made by our board of directors and will depend on a number of factors, including: (1) our historic and projected financial condition, liquidity and results of operations, (2) our capital levels and needs, (3) tax considerations, (4) any acquisitions or potential acquisitions that we may examine, (5) statutory and regulatory prohibitions and other limitations, (6) the terms of any credit agreements or other borrowing arrangements that restrict our ability to pay cash dividends, (7) general economic conditions and (8) other factors deemed relevant by our board of directors. We are not obligated to pay dividends on our common stock and are subject to restrictions on paying dividends on our common stock.
As a Delaware corporation, we are subject to certain restrictions on dividends under the Delaware General Corporation Law (the “DGCL”). Generally, a Delaware corporation may only pay dividends either out of “surplus” or out of the current or the immediately preceding year’s net profits. Surplus is defined as the excess, if any, at any given time, of the total assets of a corporation over its total liabilities and statutory capital. The value of a corporation’s assets can be measured in a number of ways and may not necessarily equal their book value.
In addition, we are subject to certain restrictions on the payment of cash dividends as a result of banking laws, regulations and policies. See “Supervision and Regulation—Bank Holding Company Regulation—Safe and Sound Banking Practices.”
Because we are a bank holding company and do not engage directly in business activities of a material nature, our ability to pay dividends to our stockholders depends, in large part, upon our receipt of dividends from the Bank, which is also subject to numerous limitations on the payment of dividends under federal and state banking laws, regulations and policies. See “Supervision and Regulation—Bank Regulation—Safe and Sound Banking Practices.”
74
Table of Contents
Price Range of Our Class A Common Stock
Our Class A common stock has been listed on the NYSE under the symbol “CADE” since April 13, 2017. The following table sets forth, for the periods indicated, the high and low sale prices in dollars on the NYSE for our Class A common stock with respect to the periods indicated.
| High | Low | |||||||
| Quarter ended June 30, 2017 (from April 13, 2017) |
$ | 23.71 | $ | 20.50 | ||||
| Quarter ended September 30, 2017 |
$ | 23.23 | $ | 20.00 | ||||
| Quarter ended December 31, 2017 |
$ | 27.12 | $ | 21.81 | ||||
| Quarter ended March 31, 2018 (through February 6, 2018) |
$ | 28.77 | $ | 26.03 | ||||
On February 6, 2018, the last reported sale price for our Class A common stock on the NYSE was $26.75 per share. As of the date of this registration statement, there were 2 stockholders of record of our Class A common stock.
75
Table of Contents
The following table shows our capitalization, including regulatory capital ratios, and our cash and cash equivalents, on a consolidated basis, as of September 30, 2017.
You should read the following table in conjunction with the sections titled “Selected Historical Consolidated Financial Information,” and “Management’s Discussion and Analysis of Financial Condition and Results of Operations” and our consolidated financial statements and related notes appearing elsewhere in this prospectus.
| As of September 30, 2017 |
||||
| (dollars in thousands) (unaudited) |
||||
| Cash and cash equivalents |
$ | 589,382 | ||
| Long-term debt |
319,537 | |||
| Shareholders’ equity: |
||||
| Preferred stock |
— | |||
| Class A Common Stock, 83,625,000 shares issued and outstanding |
836 | |||
| Class B Non-Voting Common Stock, none issued and outstanding |
— | |||
| Additional paid-in capital |
1,036,585 | |||
| Retained earnings |
320,276 | |||
| Accumulated other comprehensive loss, net |
(16,849 | ) | ||
|
|
|
|||
| Total shareholders’ equity(1) |
1,340,848 | |||
|
|
|
|||
| Total long-term debt plus shareholders’ equity |
$ | 1,660,385 | ||
|
|
|
|||
| Capital ratios: |
||||
| Total shareholders’ equity to assets |
12.77 | % | ||
| Tangible common equity ratio(2) |
9.95 | |||
| Common equity tier 1 (transitional) |
10.79 | |||
| Tier 1 leverage capital |
11.12 | |||
| Tier 1 risk-based capital |
11.17 | |||
| Total risk-based capital |
13.18 | |||
| (1) | References in this section to the number of shares of our common stock outstanding after this offering are based on shares of our common stock issued and outstanding as of the date of this registration statement. Unless otherwise noted, these references exclude any shares reserved for issuance under the Cadence Bancorporation 2015 Omnibus Incentive Plan. |
| (2) | Tangible common equity ratio is a non-GAAP financial measure. The tangible common equity ratio is defined as the ratio of tangible common equity divided by total assets less goodwill and other intangible assets. For a reconciliation of the non-GAAP measure to the most directly comparable GAAP financial measure, please see “Non-GAAP Financial Measures.” |
76
Table of Contents
Selected Historical Consolidated Financial Information
The following table summarizes certain selected consolidated financial data for the periods presented. The selected historical financial data as of and for the three and nine months ended September 30, 2017 and 2016 have been derived from our unaudited interim consolidated financial statements, and the selected historical financial data as of and for the years ended December 31, 2016, 2015 and 2014 have been derived from our audited consolidated financial statements, both of which are included elsewhere in this prospectus.
The historical consolidated financial information presented below contains financial measures that are not presented in accordance with U.S. generally accepted accounting principles and which have not been audited. See “Non-GAAP Financial Measures.”
You should read the following information, together with “Risk Factors,” “Use of Proceeds,” “Capitalization,” “Management’s Discussion and Analysis of Financial Condition and Results of Operations,” and our consolidated financial statements and notes thereto included elsewhere in this prospectus.
| As of and for the Three Months Ended September 30, |
As of and for the Nine Months Ended September 30, |
As of and for the Years Ended December 31, |
||||||||||||||||||||||||||
| 2017 | 2016 | 2017 | 2016 | 2016 | 2015 | 2014 | ||||||||||||||||||||||
| (In thousands, except per share data) | ||||||||||||||||||||||||||||
| Statement of Income Data: |
||||||||||||||||||||||||||||
| Interest and dividend income |
$ | 99,503 | $ | 84,654 | $ | 288,497 | $ | 248,182 | $ | 335,250 | $ | 293,067 | $ | 287,246 | ||||||||||||||
| Interest expense |
18,340 | 14,228 | 50,192 | 41,241 | 55,811 | 45,289 | 32,158 | |||||||||||||||||||||
|
|
|
|
|
|
|
|
|
|
|
|
|
|
|
|||||||||||||||
| Net interest income |
81,163 | 70,426 | 238,305 | 206,941 | 279,439 | 247,778 | 255,088 | |||||||||||||||||||||
| Provision for credit losses |
1,723 | 29,627 | 14,210 | 54,570 | 49,348 | 35,984 | 14,118 | |||||||||||||||||||||
|
|
|
|
|
|
|
|
|
|
|
|
|
|
|
|||||||||||||||
| Net interest income after provision |
79,440 | 40,799 | 224,095 | 152,371 | 230,091 | 211,794 | 240,970 | |||||||||||||||||||||
| Noninterest income |
||||||||||||||||||||||||||||
| —service fees and revenue |
23,014 | 20,879 | 67,647 | 61,416 | 81,976 | 79,437 | 71,743 | |||||||||||||||||||||
| —other noninterest income |
4,110 | 1,192 | 6,571 | 4,627 | 6,427 | 466 | 3,327 | |||||||||||||||||||||
| Noninterest expense |
56,530 | 54,876 | 166,985 | 164,786 | 220,180 | 232,332 | 245,147 | |||||||||||||||||||||
|
|
|
|
|
|
|
|
|
|
|
|
|
|
|
|||||||||||||||
| Income before income taxes |
50,034 | 8,714 | 131,328 | 53,628 | 98,314 | 59,365 | 70,893 | |||||||||||||||||||||
| Income tax expense |
17,457 | 2,107 | 43,666 | 16,839 | 32,540 | 20,109 | 26,060 | |||||||||||||||||||||
|
|
|
|
|
|
|
|
|
|
|
|
|
|
|
|||||||||||||||
| Net income |
32,577 | 6,607 | 87,662 | 36,789 | 65,774 | 39,256 | 44,833 | |||||||||||||||||||||
| Preferred stock dividends |
— | — | — | — | — | — | 1,370 | |||||||||||||||||||||
| Accretion of discount on preferred |
— | — | — | — | — | — | 2,273 | |||||||||||||||||||||
|
|
|
|
|
|
|
|
|
|
|
|
|
|
|
|||||||||||||||
| Net income available to common shareholders |
$ | 32,577 | $ | 6,607 | $ | 87,662 | $ | 36,789 | $ | 65,774 | $ | 39,256 | $ | 41,190 | ||||||||||||||
|
|
|
|
|
|
|
|
|
|
|
|
|
|
|
|||||||||||||||
| Period-End Balance Sheet Data: |
||||||||||||||||||||||||||||
| Investment securities, available-for-sale |
$ | 1,198,032 | $ | 1,031,319 | $ | 1,198,032 | $ | 1,031,319 | $ | 1,139,347 | $ | 720,810 | $ | 552,397 | ||||||||||||||
| Total loans, net of unearned income |
8,028,938 | 7,207,313 | 8,028,938 | 7,207,313 | 7,432,711 | 6,916,520 | 6,192,793 | |||||||||||||||||||||
| Originated loans |
7,556,135 | 6,618,324 | 7,556,135 | 6,618,324 | 6,878,645 | 6,186,465 | 5,120,227 | |||||||||||||||||||||
| Acquired noncredit impaired loans (“ANCI”) |
198,797 | 242,026 | 198,797 | 242,026 | 229,784 | 295,911 | 440,915 | |||||||||||||||||||||
| Acquired credit impaired loans (“ACI”) |
274,006 | 346,963 | 274,006 | 346,963 | 324,282 | 434,144 | 631,651 | |||||||||||||||||||||
| Allowance for credit losses (“ACL”) |
94,765 | 91,169 | 94,765 | 91,169 | 82,268 | 79,783 | 53,520 | |||||||||||||||||||||
| ACL—originated loans |
84,725 | 79,944 | 84,725 | 79,944 | 71,012 | 64,386 | 32,242 | |||||||||||||||||||||
| ACL—ANCI loans |
1,458 | 694 | 1,458 | 694 | 978 | 1,063 | 1,475 | |||||||||||||||||||||
| ACL—ACI loans |
8,582 | 10,531 | 8,582 | 10,531 | 10,278 | 14,334 | 19,803 | |||||||||||||||||||||
| Total assets |
10,502,261 | 9,444,010 | 10,502,261 | 9,444,010 | 9,530,888 | 8,811,511 | 7,944,804 | |||||||||||||||||||||
| Total deposits |
8,501,102 | 7,917,289 | 8,501,102 | 7,917,289 | 8,016,749 | 6,987,351 | 6,579,889 | |||||||||||||||||||||
| Noninterest-bearing deposits |
2,071,594 | 1,642,480 | 2,071,594 | 1,642,480 | 1,840,955 | 1,534,433 | 1,467,137 | |||||||||||||||||||||
| Interest-bearing deposits |
6,429,508 | 6,274,809 | 6,429,508 | 6,274,809 | 6,175,794 | 5,452,918 | 5,112,752 | |||||||||||||||||||||
| Borrowings and subordinated debentures |
572,683 | 332,787 | 572,683 | 332,787 | 331,712 | 702,545 | 288,067 | |||||||||||||||||||||
| Total shareholders’ equity |
1,340,848 | 1,111,783 | 1,340,848 | 1,111,783 | 1,080,498 | 1,054,208 | 1,014,337 | |||||||||||||||||||||
77
Table of Contents
| As of and for the Three Months Ended September 30, |
As of and for the Nine Months Ended September 30, |
As of and for the Years Ended December 31, |
||||||||||||||||||||||||||
| 2017 | 2016 | 2017 | 2016 | 2016 | 2015 | 2014 | ||||||||||||||||||||||
| (In thousands, except per share data) | ||||||||||||||||||||||||||||
| Per Share Data: |
||||||||||||||||||||||||||||
| Earnings |
||||||||||||||||||||||||||||
| Basic |
$ | 0.39 | $ | 0.09 | $ | 1.09 | $ | 0.49 | $ | 0.88 | $ | 0.52 | $ | 0.55 | ||||||||||||||
| Diluted(1) |
0.39 | 0.09 | 1.09 | 0.49 | 0.87 | 0.52 | 0.55 | |||||||||||||||||||||
| Book value per common share |
16.03 | 14.82 | 16.03 | 14.82 | 14.41 | 14.06 | 13.52 | |||||||||||||||||||||
| Tangible book value(2) |
12.10 | 10.37 | 12.10 | 10.37 | 9.97 | 9.53 | 8.89 | |||||||||||||||||||||
| Weighted average common shares outstanding |
||||||||||||||||||||||||||||
| Basic |
83,625,000 | 75,000,000 | 80,212,912 | 75,000,000 | 75,000,000 | 75,000,000 | 75,000,000 | |||||||||||||||||||||
| Diluted(1) |
83,955,685 | 75,258,375 | 80,558,337 | 75,258,375 | 75,294,600 | 75,116,100 | 75,000,000 | |||||||||||||||||||||
| Performance Ratios: |
||||||||||||||||||||||||||||
| Return on average common equity(4) |
9.78 | % | 2.35 | % | 9.59 | % | 4.49 | % | 6.01 | % | 3.78 | % | 4.15 | % | ||||||||||||||
| Return on average equity(4) |
9.78 | 2.35 | 9.59 | 4.49 | 6.01 | 3.78 | 4.44 | |||||||||||||||||||||
| Return on average tangible common equity(2)(4) |
13.04 | 3.36 | 13.16 | 6.50 | 8.68 | 5.65 | 6.45 | |||||||||||||||||||||
| Return on average assets(4) |
1.29 | 0.28 | 1.19 | 0.54 | 0.71 | 0.47 | 0.64 | |||||||||||||||||||||
| Net interest margin(4) |
3.52 | 3.27 | 3.56 | 3.30 | 3.30 | 3.29 | 4.06 | |||||||||||||||||||||
| Service fees and revenue to average assets(4) |
0.91 | 0.88 | 0.92 | 0.90 | 0.89 | 0.96 | 1.02 | |||||||||||||||||||||
| Efficiency ratio(2) |
52.20 | 58.87 | 53.43 | 60.36 | 59.86 | 70.90 | 74.25 | |||||||||||||||||||||
| Asset Quality Ratios: |
||||||||||||||||||||||||||||
| Total nonperforming assets (“NPAs”) to total loans plus OREO and NPIs(5) |
1.51 | % | 2.52 | % | 1.51 | % | 2.52 | % | 2.22 | % | 1.48 | % | 1.15 | % | ||||||||||||||
| Originated portfolio NPAs to originated loans plus OREO and NPIs(5) |
1.32 | 2.34 | 1.32 | 2.34 | 2.04 | 0.89 | 0.13 | |||||||||||||||||||||
| ANCI NPAs to ANCI loans plus OREO and NPIs |
1.91 | 1.40 | 1.91 | 1.40 | 1.74 | 1.71 | 1.52 | |||||||||||||||||||||
| ACI NPAs to ACI loans plus OREO and NPIs |
6.18 | 6.53 | 6.18 | 6.53 | 6.24 | 9.13 | 8.66 | |||||||||||||||||||||
| Total ACL to total loans |
1.18 | 1.26 | 1.18 | 1.26 | 1.11 | 1.15 | 0.86 | |||||||||||||||||||||
| ACL to originated loans |
1.12 | 1.21 | 1.12 | 1.21 | 1.03 | 1.04 | 0.63 | |||||||||||||||||||||
| ACL to ANCI loans |
0.73 | 0.29 | 0.73 | 0.29 | 0.43 | 0.36 | 0.33 | |||||||||||||||||||||
| ACL to ACI loans |
3.13 | 3.04 | 3.13 | 3.04 | 3.17 | 3.30 | 3.14 | |||||||||||||||||||||
| ACL to total nonperforming loans (“NPLs”)(5) |
122.66 | 59.34 | 122.66 | 59.34 | 63.80 | 114.25 | 219.64 | |||||||||||||||||||||
| ACL to originated loans NPLs(5) |
115.07 | 54.50 | 115.07 | 54.50 | 58.49 | 116.56 | 498.48 | |||||||||||||||||||||
| ACL to ANCI NPLs |
42.86 | 21.21 | 42.86 | 21.21 | 25.29 | 30.10 | 35.26 | |||||||||||||||||||||
| ACL to ACI NPLs |
NM | 284.24 | NM | 284.24 | 280.59 | 129.53 | 144.38 | |||||||||||||||||||||
| Net charge-offs to average loans(4) |
0.01 | 1.41 | 0.03 | 0.81 | 0.65 | 0.15 | 0.09 | |||||||||||||||||||||
| Capital Ratios: |
||||||||||||||||||||||||||||
| Total shareholders’ equity to assets |
12.77 | % | 11.77 | % | 12.77 | % | 11.77 | % | 11.34 | % | 11.96 | % | 12.77 | % | ||||||||||||||
| Tangible common equity ratio(2) |
9.95 | 8.54 | 9.95 | 8.54 | 8.13 | 8.44 | 8.78 | |||||||||||||||||||||
| Common equity tier 1 (CET1) (transitional)(3) |
10.79 | 8.82 | 10.79 | 8.82 | 8.84 | 8.70 | NA | |||||||||||||||||||||
| Tier 1 leverage capital |
11.12 | 8.73 | 11.12 | 8.73 | 8.89 | 9.20 | 9.50 | |||||||||||||||||||||
| Tier 1 common capital(3) |
NA | NA | NA | NA | NA | NA | 8.71 | |||||||||||||||||||||
| Tier 1 risk-based capital |
11.17 | 9.17 | 11.17 | 9.17 | 9.19 | 9.00 | 9.20 | |||||||||||||||||||||
| Total risk-based capital |
13.18 | 11.38 | 13.18 | 11.38 | 11.22 | 11.10 | 10.70 | |||||||||||||||||||||
| (1) | Includes common stock equivalents (“CSE”) of 330,685 and 258,375 for the three months ended September 30, 2017 and 2016, 345,425 and 258,375 for the nine months ended September 30, 2017 and 2016, and 294,600, 116,100 and -0- for the years ended December 31, 2016, 2015 and 2014. |
| (2) | Considered a non-GAAP financial measure. See “Non-GAAP Financial Measures” for a reconciliation of our non-GAAP measures to the most directly comparable GAAP financial measure. |
| (3) | As of January 1, 2015, the capital component common equity Tier 1 became applicable under the Federal Reserve’s revised regulatory capital rules. See “Supervision and Regulation—Bank Holding Company Regulation—Regulatory Capital” for additional information about common equity Tier 1 and the Federal Reserve’s revised regulatory capital rules. |
| (4) | Annualized for the three and nine months ended September 30, 2017 and 2016. |
| (5) | Included in our NPAs as of September 30, 2017 is a $9.9 million nonperforming energy credit that was reclassified as held-for-sale (HFS) and is being carried at lower of cost or market value (“LOCOM”). Because the credit was reclassified to HFS it has not been included in our investment loan portfolio ratios in order for these ratios to be comparable to prior periods. |
NM—not meaningful.
78
Table of Contents
The following table summarizes certain selected unaudited quarterly consolidated financial data for the periods presented. You should read the following information, together with “Risk Factors,” “Use of Proceeds,” “Capitalization,” “Management’s Discussion and Analysis of Financial Condition and Results of Operations,” and our consolidated financial statements and notes thereto included elsewhere in this prospectus.
| As of and for the three months ended | ||||||||||||||||||||
| September 30, 2017 |
June 30, 2017 |
March 31, 2017 |
December 31, 2016 |
September 30, 2016 |
||||||||||||||||
| (In thousands, except share data) | ||||||||||||||||||||
| Statement of Operations Data: |
||||||||||||||||||||
| Net interest income |
$ | 81,163 | $ | 82,384 | $ | 74,758 | $ | 72,498 | $ | 70,426 | ||||||||||
| Provision for credit losses |
1,723 | 6,701 | 5,786 | (5,222 | ) | 29,627 | ||||||||||||||
|
|
|
|
|
|
|
|
|
|
|
|||||||||||
| Net interest income after provision |
79,440 | 75,683 | 68,972 | 77,720 | 40,799 | |||||||||||||||
| Noninterest income |
27,124 | 22,989 | 24,105 | 22,360 | 22,791 | |||||||||||||||
| Noninterest expense |
56,530 | 56,134 | 54,321 | 55,394 | 54,876 | |||||||||||||||
|
|
|
|
|
|
|
|
|
|
|
|||||||||||
| Income before income taxes |
50,034 | 42,538 | 38,756 | 44,686 | 8,714 | |||||||||||||||
| Income tax expense |
17,457 | 13,570 | 12,639 | 15,701 | 2,107 | |||||||||||||||
|
|
|
|
|
|
|
|
|
|
|
|||||||||||
| Net income |
$ | 32,577 | $ | 28,968 | $ | 26,117 | $ | 28,985 | $ | 6,607 | ||||||||||
|
|
|
|
|
|
|
|
|
|
|
|||||||||||
| Period-End Balance Sheet Data: |
||||||||||||||||||||
| Total assets |
$ | 10,502,261 | $ | 9,811,557 | $ | 9,720,937 | $ | 9,530,888 | $ | 9,444,010 | ||||||||||
| Total loans, net of unearned income |
8,028,938 | 7,716,621 | 7,561,472 | 7,432,711 | 7,207,313 | |||||||||||||||
| Total investment securities, available-for-sale |
1,198,032 | 1,079,935 | 1,116,280 | 1,139,347 | 1,031,319 | |||||||||||||||
| Total deposits |
8,501,102 | 7,930,383 | 7,841,710 | 8,016,749 | 7,917,289 | |||||||||||||||
| Total shareholders’ equity |
1,340,848 | 1,304,054 | 1,105,976 | 1,080,498 | 1,111,783 | |||||||||||||||
| Performance Ratios: |
||||||||||||||||||||
| Net interest margin(1) |
3.52 | % | 3.71 | % | 3.46 | % | 3.31 | % | 3.27 | % | ||||||||||
| Efficiency ratio(2) |
52.20 | 53.27 | 54.95 | 58.40 | 58.87 | |||||||||||||||
| Return on average assets(1) |
1.29 | 1.19 | 1.10 | 1.20 | 0.28 | |||||||||||||||
| Return on average tangible common equity(1)(2) |
13.04 | 12.63 | 13.96 | 15.16 | 3.36 | |||||||||||||||
| Asset Quality Ratios: |
||||||||||||||||||||
| Total NPAs to total loans plus OREO and NPIs |
1.51 | % | 1.82 | % | 2.25 | % | 2.22 | % | 2.51 | % | ||||||||||
| Net charge-offs (recoveries) to average loans(1) |
0.01 | 0.09 | (0.01 | ) | 0.20 | 1.41 | ||||||||||||||
| Total ACL to total loans |
1.18 | 1.21 | 1.17 | 1.11 | 1.26 | |||||||||||||||
| ACL to total NPLs |
122.66 | 88.81 | 65.80 | 63.83 | 59.34 | |||||||||||||||
| Capital Ratios: |
||||||||||||||||||||
| Total shareholders’ equity to assets |
12.77 | % | 13.29 | % | 11.38 | % | 11.34 | % | 11.77 | % | ||||||||||
| Tangible common equity to tangible assets(2) |
9.95 | 10.27 | 8.25 | 8.13 | 8.54 | |||||||||||||||
| Common equity tier 1 (CET1) (transitional) |
10.79 | 10.92 | 8.99 | 8.84 | 8.82 | |||||||||||||||
| Tier 1 leverage capital |
11.12 | 11.00 | 9.10 | 8.89 | 8.73 | |||||||||||||||
| Tier 1 risk-based capital |
11.17 | 11.31 | 9.36 | 9.19 | 9.17 | |||||||||||||||
| Total risk-based capital |
13.18 | 13.41 | 11.43 | 11.22 | 11.38 | |||||||||||||||
| (1) | Annualized for each three month period. |
| (2) | Considered a non-GAAP financial measure. See “Non-GAAP Financial Measures” for a reconciliation of our non-GAAP measures to the most directly comparable GAAP financial measure. |
79
Table of Contents
We identify “efficiency ratio,” “adjusted noninterest expense,” “adjusted operating revenue,” “tangible common equity,” “tangible common equity ratio,” “return on average tangible common equity,” “tangible book value per share” and “pre-tax pre-provision net earnings” as “non-GAAP financial measures.” In accordance with the SEC’s rules, we identify certain financial measures as non-GAAP financial measures if such financial measures exclude or include amounts in the most directly comparable measures calculated and presented in accordance with generally accepted accounting principles (“GAAP”) in effect in the United States in our statements of income, balance sheet or statements of cash flows. Non-GAAP financial measures do not include operating and other statistical measures, ratios or statistical measures calculated using exclusively financial measures calculated in accordance with GAAP.
The non-GAAP financial measures that we discuss in this prospectus should not be considered in isolation or as a substitute for the most directly comparable or other financial measures calculated in accordance with GAAP. Moreover, the manner in which we calculate these non-GAAP financial measures may differ from that of other companies reporting measures with similar names and, therefore, may not be comparable to our non-GAAP financial measures.
Efficiency ratio is defined as noninterest expenses divided by operating revenue, which is equal to net interest income plus noninterest income. We believe that this measure is important to many investors in the marketplace who wish to assess our performance versus that of our peers.
Our adjusted noninterest expenses represent total noninterest expenses net of any merger, restructuring or branch closing costs. Our adjusted operating revenue is equal to net interest income plus noninterest income excluding gains and losses on sales of securities and branches. In our judgment, the adjustments made to noninterest expense and operating revenue allow management and investors to better assess our performance by removing the volatility that is associated with certain other discrete items that are unrelated to our core business.
Tangible common equity is defined as total shareholders’ equity, excluding preferred stock, less goodwill and other intangible assets. We believe that this measure is important to many investors in the marketplace who are interested in changes from period to period in common shareholders’ equity exclusive of changes in intangible assets. Goodwill, an intangible asset that is recorded in a purchase business combination, has the effect of increasing both common equity and assets while not increasing our tangible common equity or tangible assets.
The tangible common equity ratio is defined as the ratio of tangible common equity divided by total assets less goodwill and other intangible assets. We believe that this measure is important to many investors in the marketplace who are interested in relative changes from period to period in common equity and total assets, each exclusive of changes in intangible assets. We believe that the most directly comparable GAAP financial measure is total shareholders’ equity to total assets.
Return on average tangible common equity is defined as net income divided by average tangible common equity. We believe the most directly comparable GAAP financial measure is the return on average common equity.
Tangible book value per share is defined as book value, excluding the impact of goodwill and other intangible assets, if any, divided by shares of our common stock outstanding. Tangible book value per share has been adjusted to reflect the stock split that occurred on April 7, 2017 in connection with our IPO.
Pre-tax, pre-provision net earnings is defined as income before taxes and provision for credit losses. We believe the most directly comparable GAAP financial measure is income before taxes.
80
Table of Contents
The information provided below presents a reconciliation of each of our non-GAAP financial measures to the most directly comparable GAAP financial measure.
| As of and for the three months ended September 30, |
As of and for the nine months ended September 30, |
As of and for the year ended December 31, |
||||||||||||||||||||||||||||||
| 2017 | 2016 | 2017 | 2016 | 2016 | 2015 | 2014 | 2013 | |||||||||||||||||||||||||
| (In thousands) | ||||||||||||||||||||||||||||||||
| Efficiency ratio |
||||||||||||||||||||||||||||||||
| Noninterest expenses (numerator) |
$ | 56,530 | $ | 54,876 | $ | 166,985 | $ | 164,786 | $ | 220,180 | $ | 232,332 | $ | 245,147 | $ | 253,670 | ||||||||||||||||
|
|
|
|
|
|
|
|
|
|
|
|
|
|
|
|
|
|||||||||||||||||
| Net interest income |
$ | 81,163 | $ | 70,426 | $ | 238,305 | $ | 206,941 | $ | 279,439 | $ | 247,778 | $ | 255,088 | $ | 255,649 | ||||||||||||||||
| Noninterest income |
27,124 | 22,791 | 74,218 | 66,043 | 88,403 | 79,903 | 75,070 | 64,115 | ||||||||||||||||||||||||
|
|
|
|
|
|
|
|
|
|
|
|
|
|
|
|
|
|||||||||||||||||
| Operating revenue (denominator) |
$ | 108,287 | $ | 93,217 | $ | 312,523 | $ | 272,984 | $ | 367,842 | $ | 327,681 | $ | 330,158 | $ | 319,764 | ||||||||||||||||
|
|
|
|
|
|
|
|
|
|
|
|
|
|
|
|
|
|||||||||||||||||
| Efficiency ratio |
52.20 | % | 58.87 | % | 53.43 | % | 60.36 | % | 59.86 | % | 70.90 | % | 74.25 | % | 79.33 | % | ||||||||||||||||
|
|
|
|
|
|
|
|
|
|
|
|
|
|
|
|
|
|||||||||||||||||
| Adjusted noninterest expenses and operating revenue |
||||||||||||||||||||||||||||||||
| Noninterest expense |
$ | 56,530 | $ | 54,876 | $ | 166,985 | $ | 164,786 | $ | 220,180 | $ | 232,332 | $ | 245,147 | $ | 253,670 | ||||||||||||||||
| Less: Branch closure expenses |
50 | 52 | 143 | 191 | 238 | 2,074 | 5,222 | 1,033 | ||||||||||||||||||||||||
| Less: Merger and acquisition costs |
— | — | — | — | — | — | — | 958 | ||||||||||||||||||||||||
|
|
|
|
|
|
|
|
|
|
|
|
|
|
|
|
|
|||||||||||||||||
| Adjusted noninterest expenses |
$ | 56,480 | $ | 54,824 | $ | 166,842 | $ | 164,595 | $ | 219,942 | $ | 230,258 | $ | 239,925 | $ | 251,679 | ||||||||||||||||
|
|
|
|
|
|
|
|
|
|
|
|
|
|
|
|
|
|||||||||||||||||
| Net interest income |
$ | 81,163 | $ | 70,426 | $ | 238,305 | $ | 206,941 | $ | 279,439 | $ | 247,778 | $ | 255,088 | $ | 255,649 | ||||||||||||||||
| Noninterest income |
27,124 | 22,791 | 74,218 | 66,043 | 88,403 | 79,903 | 75,070 | 64,115 | ||||||||||||||||||||||||
| Less: Losses on sale of branches |
— | — | — | — | — | (1,501 | ) | (763 | ) | — | ||||||||||||||||||||||
| Less: Securities (losses) gains, net |
1 | 1,386 | (162 | ) | 2,469 | 3,736 | 1,171 | 659 | 2,877 | |||||||||||||||||||||||
|
|
|
|
|
|
|
|
|
|
|
|
|
|
|
|
|
|||||||||||||||||
| Adjusted operating revenue |
$ | 108,286 | $ | 91,831 | $ | 312,685 | $ | 270,515 | $ | 364,106 | $ | 328,011 | $ | 330,262 | $ | 316,887 | ||||||||||||||||
|
|
|
|
|
|
|
|
|
|
|
|
|
|
|
|
|
|||||||||||||||||
| Tangible common equity ratio |
||||||||||||||||||||||||||||||||
| Shareholders’ equity |
$ | 1,340,848 | $ | 1,111,783 | $ | 1,340,848 | $ | 1,111,783 | $ | 1,080,498 | $ | 1,054,208 | $ | 1,014,337 | $ | 1,003,506 | ||||||||||||||||
| Less: Preferred stock |
— | — | — | — | — | — | — | (30,641 | ) | |||||||||||||||||||||||
| Less: Goodwill and other intangible assets, net |
(329,124 | ) | (334,246 | ) | (329,124 | ) | (334,246 | ) | (332,691 | ) | (339,223 | ) | (347,651 | ) | (357,977 | ) | ||||||||||||||||
|
|
|
|
|
|
|
|
|
|
|
|
|
|
|
|
|
|||||||||||||||||
| Tangible common shareholders’ equity |
1,011,724 | 777,537 | 1,011,724 | 777,537 | 747,807 | 714,985 | 666,686 | 614,888 | ||||||||||||||||||||||||
|
|
|
|
|
|
|
|
|
|
|
|
|
|
|
|
|
|||||||||||||||||
| Total assets |
10,502,261 | 9,444,010 | 10,502,261 | 9,444,010 | 9,530,888 | 8,811,511 | 7,944,804 | 6,453,043 | ||||||||||||||||||||||||
| Less: Goodwill and other intangible assets, net |
(329,124 | ) | (334,246 | ) | (329,124 | ) | (334,246 | ) | (332,691 | ) | (339,223 | ) | (347,651 | ) | (357,977 | ) | ||||||||||||||||
|
|
|
|
|
|
|
|
|
|
|
|
|
|
|
|
|
|||||||||||||||||
| Tangible assets |
$ | 10,173,137 | $ | 9,109,764 | $ | 10,173,137 | $ | 9,109,764 | $ | 9,198,197 | $ | 8,472,288 | $ | 7,597,153 | $ | 6,095,066 | ||||||||||||||||
|
|
|
|
|
|
|
|
|
|
|
|
|
|
|
|
|
|||||||||||||||||
| Tangible common equity ratio |
9.95 | % | 8.54 | % | 9.95 | % | 8.54 | % | 8.13 | % | 8.44 | % | 8.78 | % | 10.09 | % | ||||||||||||||||
|
|
|
|
|
|
|
|
|
|
|
|
|
|
|
|
|
|||||||||||||||||
81
Table of Contents
| As of and for the three months ended September 30, |
As of and for the nine months ended September 30, |
As of and for the year ended December 31, |
||||||||||||||||||||||||||||||
| 2017 | 2016 | 2017 | 2016 | 2016 | 2015 | 2014 | 2013 | |||||||||||||||||||||||||
| (In thousands) | ||||||||||||||||||||||||||||||||
| Tangible book value per share |
||||||||||||||||||||||||||||||||
| Shareholders’ equity |
$ | 1,340,848 | $ | 1,111,783 | $ | 1,340,848 | $ | 1,111,783 | $ | 1,080,498 | $ | 1,054,208 | $ | 1,014,337 | $ | 1,003,506 | ||||||||||||||||
| Less: Preferred stock |
— | — | — | — | — | — | — | (30,641 | ) | |||||||||||||||||||||||
| Less: Goodwill and other intangible assets, net |
(329,124 | ) | (334,246 | ) | (329,124 | ) | (334,246 | ) | (332,691 | ) | (339,223 | ) | (347,651 | ) | (357,977 | ) | ||||||||||||||||
|
|
|
|
|
|
|
|
|
|
|
|
|
|
|
|
|
|||||||||||||||||
| Tangible common shareholders’ equity |
$ | 1,011,724 | $ | 777,537 | $ | 1,011,724 | $ | 777,537 | $ | 747,807 | $ | 714,985 | $ | 666,686 | $ | 614,888 | ||||||||||||||||
|
|
|
|
|
|
|
|
|
|
|
|
|
|
|
|
|
|||||||||||||||||
| Common shares issued |
83,625,000 | 75,000,000 | 83,625,000 | 75,000,000 | 75,000,000 | 75,000,000 | 75,000,000 | 75,000,000 | ||||||||||||||||||||||||
|
|
|
|
|
|
|
|
|
|
|
|
|
|
|
|
|
|||||||||||||||||
| Tangible book value per share |
$ | 12,10 | $ | 10.37 | $ | 12.10 | $ | 10.37 | $ | 9.97 | $ | 9.53 | $ | 8.89 | $ | 8.20 | ||||||||||||||||
|
|
|
|
|
|
|
|
|
|
|
|
|
|
|
|
|
|||||||||||||||||
| Return on average tangible common equity |
||||||||||||||||||||||||||||||||
| Average common equity |
$ | 1,320,884 | $ | 1,118,603 | $ | 1,221,845 | $ | 1,093,409 | $ | 1,093,604 | $ | 1,038,680 | $ | 991,525 | $ | 910,113 | ||||||||||||||||
| Less: Average intangible assets |
(329,816 | ) | (335,215 | ) | (330,989 | ) | (336,865 | ) | (336,054 | ) | (343,566 | ) | (353,014 | ) | (364,375 | ) | ||||||||||||||||
|
|
|
|
|
|
|
|
|
|
|
|
|
|
|
|
|
|||||||||||||||||
| Average tangible common shareholders’ equity |
$ | 991,068 | $ | 783,388 | $ | 890,856 | $ | 756,544 | $ | 757,550 | $ | 695,114 | $ | 638,511 | $ | 545,738 | ||||||||||||||||
|
|
|
|
|
|
|
|
|
|
|
|
|
|
|
|
|
|||||||||||||||||
| Net income |
$ | 32,577 | $ | 6,607 | $ | 87,662 | $ | 36,789 | $ | 65,774 | $ | 39,256 | $ | 44,823 | $ | 103,642 | ||||||||||||||||
|
|
|
|
|
|
|
|
|
|
|
|
|
|
|
|
|
|||||||||||||||||
| Return on average tangible common equity(1) |
13.04 | % | 3.35 | % | 13.16 | % | 6.50 | % | 8.68 | % | 5.65 | % | 6.45 | % | 18.99 | % | ||||||||||||||||
|
|
|
|
|
|
|
|
|
|
|
|
|
|
|
|
|
|||||||||||||||||
| Pre-tax, pre-provision net earnings |
||||||||||||||||||||||||||||||||
| Income before taxes |
$ | 50,034 | $ | 8,714 | $ | 131,328 | $ | 53,628 | $ | 98,314 | $ | 59,365 | $ | 70,893 | $ | 47,393 | ||||||||||||||||
| Plus: Provision for credit losses |
1,723 | 29,627 | 14,210 | 54,570 | 49,348 | 35,984 | 14,118 | 18,601 | ||||||||||||||||||||||||
|
|
|
|
|
|
|
|
|
|
|
|
|
|
|
|
|
|||||||||||||||||
| Pre-tax, pre-provision net earnings |
$ | 51,757 | $ | 38,341 | $ | 145,538 | $ | 108,198 | $ | 147,662 | $ | 95,349 | $ | 85,011 | $ | 65,994 | ||||||||||||||||
|
|
|
|
|
|
|
|
|
|
|
|
|
|
|
|
|
|||||||||||||||||
| (1) | Annualized for the three and nine months ended September 30, 2017 and 2016. |
82
Table of Contents
Management’s Discussion and Analysis of
Financial Condition and Results of Operations
The following discussion should be read in conjunction with the “Selected Historical Consolidated Financial Information,” and our financial statements and related notes thereto included elsewhere in this prospectus. In addition to historical information, this discussion contains forward-looking statements that involve risks, uncertainties and assumptions that could cause actual results to differ materially from management’s expectations. Factors that could cause such differences are discussed in the sections entitled “Cautionary Note Regarding Forward-Looking Statements” and “Risk Factors.” We assume no obligation to update any of these forward-looking statements.
General
The following discussion and analysis presents our results of operations and financial condition on a consolidated basis. Because we conduct our material business operations through our bank subsidiary, Cadence Bank, the discussion and analysis relates to activities primarily conducted by the Bank. We generate most of our revenue from interest on loans and investments and fee-based revenues. Our primary source of funding for our loans is deposits. Our largest expenses are interest on these deposits and salaries and related employee benefits. We measure our performance primarily through our net income, pre-tax and pre-loan provision earnings, net interest margin, efficiency ratio, ratio of allowance for credit losses to total loans, return on average assets and return on average equity, among other metrics, while maintaining appropriate regulatory leverage and risk-based capital ratios.
Overview
Cadence Bancorporation is a bank holding company and a Delaware corporation headquartered in Houston, Texas, and is the parent company of Cadence Bank. With $10.5 billion in assets, $8.0 billion in total loans (net of unearned discounts and fees), $8.5 billion in deposits and $1.3 billion in shareholders’ equity as of September 30, 2017, we currently operate a network of 65 branch locations across Texas, Alabama, Florida, Mississippi and Tennessee. We focus on middle-market commercial lending, complemented by retail banking and wealth management services, and provide a broad range of banking services to businesses, high net worth individuals and business owners.
We operate Cadence Bancorporation through three operating segments: Banking, Financial Services and Corporate. Our Banking Segment, which represented approximately 93% of our total revenues for the nine months ended September 30, 2017 and 93% of our total revenues for fiscal years 2016 and the 2015, consists of our Commercial Banking, Retail Banking and Private Banking lines of business. Our Commercial Banking activities focus on commercial and industrial (“C&I”), community banking, business banking and commercial real estate lending and treasury management services to clients in our geographic footprint in Texas and the southeast United States. Within our Commercial Banking line of business, we focus on select industries, which we refer to as our “specialized industries,” in which we believe we have specialized experience and service capabilities. These industries include franchise restaurant, healthcare and technology. Energy lending is also an important part of our business as energy production and energy related industries are meaningful contributors to the economy in our primary markets. In our Retail Banking business line, we offer a broad range of banking services through our branch network to serve the needs of consumers and small businesses. In our Private Banking business line, we offer banking services, such as deposit services and residential mortgage lending, to affluent clients and business owners. Our Financial Services Segment includes our Trust, Retail Brokerage, Investment Services and Insurance businesses. These businesses offer products independently to their own customers as well as to Banking Segment clients. Investment Services operates through the “Linscomb & Williams” name and Insurance operates though the “Cadence Insurance” name. The products offered by the businesses in our Financial Services Segment primarily generate non-banking service fee income. Our Corporate Segment reflects parent-only activities, including debt and capital raising, and intercompany eliminations.
83
Table of Contents
We are focused on organic growth and expanding our position in our markets. We believe that our franchise is positioned for continued growth as a result of prudent lending in our markets through experienced relationship managers and a client-centered, relationship-driven banking model, with particular emphasis on Texas-based expansion and our focus and capabilities in serving specialized industries. We believe our continued growth is supported by (i) our attractive geographic footprint, (ii) the stable and cost efficient deposit funding provided by our acquired franchises (each of which was a long-standing institution with an established customer network), (iii) our veteran board of directors and management team, (iv) our capital position and (v) our credit quality and risk management processes.
Our Acquisitions
A key component of establishing our banking franchise was to expand our businesses through the acquisition of financial institutions, including distressed financial institutions. In March 2011, we completed our first acquisition by acquiring Cadence Bank, N.A., based in Starkville, Mississippi, including its 38 branches and $1.2 billion in deposits. Cadence Bank was founded in 1885 and at the time of the acquisition had a long history of providing full financial services, including banking, trust, mortgage and investment products in Mississippi, Tennessee, Alabama, Florida and Georgia. In April 2011, we assumed all of the deposits and acquired substantially all the assets of Superior Bank F.S.B. from the FDIC in an assisted transaction under which the FDIC agreed to provide loss sharing in respect of covered assets. (On January 5, 2016, a settlement agreement was finalized with the FDIC to end the loss share agreement at a nominal cost.) Included in the transaction were 73 retail branches across Alabama and Florida and six mortgage offices in Alabama, Florida and Tennessee. Superior Bank was established in 1957 and was headquartered in Tampa, Florida. In connection with the acquisition, we acquired $2.6 billion in deposits. In July 2012, we acquired Encore Bancshares Inc., a financial holding company headquartered in Houston, Texas, established in 1928. At the time of the acquisition, Encore Bancshares offered banking, wealth management and insurance services through Encore Bank, N.A., and its affiliated companies. Encore Bank operated 12 branches with $1.2 billion in deposits. The addition of Encore’s trust services and Linscomb & Williams wealth management, as well as Town & Country Insurance, enhanced our ability to provide our customers with wealth management, trust and insurance services.
84
Table of Contents
The following table sets forth the fair value of the assets and liabilities we acquired in each of our acquisitions as of the applicable acquisition date:
| Cadence Financial Corporation |
Superior Bank, F.S.B. |
Encore Bancshares, Inc. |
Total | |||||||||||||
| (In thousands) | ||||||||||||||||
| Cash and cash equivalents |
$ | 224,727 | $ | 371,681 | $ | 245,729 | $ | 842,137 | ||||||||
| Securities |
366,923 | 238,538 | 252,590 | 858,051 | ||||||||||||
| Loans(1) |
765,114 | 1,765,717 | 1,035,549 | 3,566,380 | ||||||||||||
| Premises and equipment |
27,871 | 1,881 | 10,017 | 39,769 | ||||||||||||
| Goodwill |
63,506 | 119,134 | 135,177 | 317,817 | ||||||||||||
| Core deposit intangible |
10,054 | 17,032 | 39,400 | 66,486 | ||||||||||||
| FDIC indemnification asset |
— | 288,096 | — | 288,096 | ||||||||||||
| Other assets |
56,500 | 57,904 | 51,640 | 166,044 | ||||||||||||
|
|
|
|
|
|
|
|
|
|||||||||
| Fair value of assets acquired |
1,514,695 | 2,859,983 | 1,770,102 | 6,144,780 | ||||||||||||
|
|
|
|
|
|
|
|
|
|||||||||
| Deposits |
1,264,546 | 2,676,480 | 1,218,471 | 5,159,497 | ||||||||||||
| Other liabilities |
181,362 | 212,506 | 272,597 | 666,465 | ||||||||||||
| Preferred stock |
— | — | 28,343 | 28,343 | ||||||||||||
|
|
|
|
|
|
|
|
|
|||||||||
| Fair value of liabilities assumed |
1,445,908 | 2,888,986 | 1,519,411 | 5,854,305 | ||||||||||||
|
|
|
|
|
|
|
|
|
|||||||||
| Net cash paid (received) |
$ | 68,787 | $ | (29,003 | ) | $ | 250,691 | $ | 290,475 | |||||||
|
|
|
|
|
|
|
|
|
|||||||||
| (1) | As of September 30, 2017 our acquired loan portfolios have declined to $473 million before related allowance for credit losses of $10 million. |
Upon acquisition, each acquired business was integrated into our franchise, and is not tracked or monitored on an independent basis. Accordingly, the impact of each acquisition on our revenue, expenses and earnings cannot be specifically isolated and quantified.
Key Factors Affecting Our Business and Financial Statements
We believe our business and results of operations will be impacted in the future by various trends and conditions, including the following:
Interest rates: We anticipate that longer term interest rates will at some point increase over the historic lows experienced since the recent financial crisis. Based on our asset sensitivity as discussed in “Business—Our Competitive Strengths—Attractive Run-Rate Core Profitability and Return Profile,” we believe that once rates do increase, we will generate incrementally more interest income than the increased interest expense required to maintain our deposits and funding sources. While historical trends in rising rate environments can be used as a potential indicator for the necessity and pace of deposit repricing, deposit repricing may be required to occur more quickly and perhaps at greater levels than would have been experienced historically.
Banking laws and regulations: The banking industry continues to experience intense regulatory focus, and continual revision of rules and regulations. We anticipate that this environment of heightened scrutiny will continue for the industry and for Cadence Bank specifically, since we exceeded $10.0 billion in assets during the quarter ended September 30, 2017, which is included in the “mid-sized” bank category for supervision purposes. At and above $10.0 billion in assets, Cadence Bank will become subject to additional regulations, including regulation by the CFPB and subject to the Durbin Amendments and the requirements to undergo company-wide stress tests (“DFAST”).
Asset quality: As our originated loan portfolio has grown and seasoned, our asset quality indicators have matured and normalized although some negative trending occurred within our energy portfolio primarily related to that industry’s downturn in 2015-2016. We believe our underwriting practices are prudent and we strive to
85
Table of Contents
maintain long-term credit quality metrics that are favorable to peers. Our acquired portfolios were marked to fair value at acquisition and the carrying value of these portfolios has declined significantly.
Cost efficiency: Since 2011, we have invested significantly in our infrastructure, including our management, lending teams, systems and integration. As a result, our ratio of expenses to revenue was historically greater than that experienced by many of our peer financial institutions. While we anticipate ongoing investment in our business, the pace of normalized expense growth has increased at a slower rate than our revenue growth, which resulted in a meaningful declining trend in our efficiency ratio (as defined in “Non-GAAP Financial Measures”) since 2013. Given costs associated with the company’s recent growth and specifically the growth over $10 billion in assets, this declining ratio trend may be adversely impacted in the near term due to our expectation that historical expense base declines will not continue, although the ratio is expected to continue a more modest overall declining trend over a longer term.
Competition: The industry and businesses in which we operate are highly competitive, and as the economy continues to improve slowly, we anticipate that competition will continue to increase. We may see increased competition in different areas including market rates, underwriting, products and structure. While we seek to maintain an appropriate risk-adjusted spread on our business, we anticipate that we will experience continued pressure on our net interest margins as we operate in this competitive environment.
Acquired loan accretion and costs: As a result of our acquisitions, we have recognized accretion in our interest income as a result of the accretable difference on our acquired credit-impaired (“ACI”) loan portfolio. Total scheduled accretion reflected in interest income was $67 million, $46 million and $31 million for the years ended December 31, 2014, 2015 and 2016, respectively, and $5.6 million and $18.0 million for the three and nine months ended September 30, 2017. As these acquired portfolios are reduced through payoffs, paydowns, foreclosures or charge-offs, the scheduled accretion declines. (In addition to scheduled accretion, a portion of our accretion recognized in a period represents recovery income from higher cash flows received than were expected on non-pooled loans, or received sooner than expected. These cash flows vary and are difficult to estimate.) Accordingly, we expect the proportion of our revenues attributable to scheduled accretion to continue to decline as the related assets are reduced and for the recovery income to trend downward. Conversely, absent future acquisitions, we expect the proportion of our revenues attributable to our organically originated portfolio will continue to increase. Additionally, we incur expenses and provisions related to special assets and loans targeted for work-out attributable to the acquired loan portfolios. Just as the accretion is impacted as these portfolios decline, these special assets costs are also anticipated to decline and become a lesser percentage of our operating expenses and loan provisions going forward. Total special asset expense was $5.8 million, $3.0 million and $1.8 million for the years ended December 31, 2014, 2015 and 2016, respectively, and $0.2 million and $0.8 million for the three and nine months ended September 30, 2017. Total provision for credit losses related to the acquired loan portfolios (both ACI and ANCI) was $(4.4) million, $(5.5) million and $(3.5) million for the years ended December 31, 2014, 2015 and 2016, respectively, and $(1.5) million and $(2.0) million for the three and nine months ended September 30, 2017.
Primary Factors Used to Evaluate Our Business
As a financial institution, we manage and evaluate various aspects of both our results of operations and our financial condition. We evaluate the levels and trends of the line items included in our balance sheet and income statement, as well as various financial ratios that are commonly used in our industry. We analyze these ratios and financial trends against our budgeted performance and the financial condition and performance of comparable financial institutions in our region and nationally. Our financial information is prepared in accordance with GAAP. Application of these principles requires management to make complex and subjective estimates and judgments that affect the amounts reported in the following discussion and in our consolidated financial statements and accompanying notes. For more information on our accounting policies and estimates, including in respect of business combinations, fair value measurement, allowances for credit losses, OREO and deferred tax assets, and our decision not to opt out of the extended transition period applicable to an emerging growth
86
Table of Contents
company under the JOBS Act for adopting any new or revised accounting standards that may be issued, see “Critical Accounting Policies and Estimates.”
Statement of Operations Metrics
Net Interest Income
Net interest income represents the amount by which interest income on interest-earning assets exceeds interest expense incurred on interest-bearing liabilities. The net interest margin represents net interest income divided by average interest-earning assets. We earn interest income from interest, dividends and fees earned on interest-earning assets, the recognition of accretable yield associated with ACI loans, and the amortization and accretion of discounts and premiums on investment securities. We incur interest expense on interest-bearing liabilities, including interest-bearing deposits, borrowings and other forms of indebtedness as well as from amortization and accretion of discounts and premiums on purchased time deposits and debt. We seek to improve our net interest income by originating loans we believe to be high-quality and funding these assets primarily with lower-cost customer deposits.
Provision for Credit Losses
The provision for credit losses is the amount of expense that, based on our judgment, is required to maintain the allowance for credit losses at an adequate level to absorb probable losses inherent in the loan portfolio at the balance sheet date. The determination of the amount of the allowance is complex and involves a high degree of judgment and subjectivity. See “—Asset Quality,” “—Allowance for Credit Losses” and “—Critical Accounting Policies and Estimates.”
Noninterest Income
Noninterest income includes service charges on deposit accounts, debit card income, mortgage loan revenue, treasury management fees, investment advisory and trust fees, insurance, retail brokerage fees, other operating income and investment securities gains and losses.
Noninterest Expense
Noninterest expense includes salary and employee benefits, net occupancy expense, merger related expenses, accounting, legal and other professional expenses, FDIC and OCC assessments, special asset related expenses and other operating expenses. We monitor the ratio of noninterest expense to net revenues (net interest income plus noninterest income), which is commonly known as the efficiency ratio.
Net Income
We evaluate our net income using the common industry ratio, return on assets (“ROA”), which is equal to net income for the period annualized, divided by the average of total assets for the period, and return on shareholders’ equity (“ROE”), which is equal to net income for the period annualized, divided by the average of total shareholders’ equity for the period. Management may also measure performance by comparing earnings before tax, adjusted for certain items related to its acquisitions, such as provision on acquired loans, branch closure expenses, merger costs, intangible asset amortization and increased yield on the acquired loan portfolio due to cash flow improvements.
87
Table of Contents
Balance Sheet Drivers
Loan Growth
In addition to completing and integrating our acquisitions, we have demonstrated loan growth in our targeted markets.
We monitor new loan production on a weekly basis by loan type, borrower type, market and profitability. Our operating strategy focuses on growing assets by originating loans that we believe to be high credit quality with competitive pricing. For the nine months ended September 30, 2017, total loans (net of unearned discounts and fees) increased $596.2 million to $8.03 billion from $7.43 billion at December 31, 2016 which increased $516.2 million from $6.91 billion at December 31, 2015 which increased $723.7 million from $6.19 billion at December 31, 2014.
Asset Quality
Since 2011, we have focused on originating high-quality loans and disposing of acquired nonperforming assets while balancing rapid disposition with maximizing economic outcome. We are continually working to improve the diversification of our portfolio by reducing the acquired portfolios and increasing the contribution of organically originated commercial and consumer loans.
We focus on asset quality strength by aiming to maintain robust underwriting standards and proactive monitoring and reporting of the loan portfolio. We seek to maintain effective credit risk management through collaboration between our lines of business, credit administration and enterprise risk management. We believe that prudent underwriting, proactive monitoring of the portfolio and early detection of problem loans support Cadence’s ability to maintain high asset quality standards. Our nonperforming loans totaled $77.3 million as of September 30, 2017, or 0.96% of total loans compared to $128.9 million, or 1.73% of total loans as of December 31, 2016. During early 2016, banking regulators revised their definition of nonaccrual for E&P loans as it relates to leverage, including second-lien debt, in which we do not participate. As a result, the nonaccrual status of certain loans in that portfolio has been affected. As of September 30, 2017, we had $82.0 million in energy credits considered nonperforming, of which more than 85% were current under their contractual terms. Included in the $82.0 million in energy credits as of September 30, 2017 is a $9.9 million nonperforming energy credit that was reclassified as held-for-sale (“HFS”) during the third quarter of 2017 and is being carried at lower of cost or market value (“LOCOM”). Because this credit was reclassified to HFS it has not been included in our loan portfolio held-for-investment ratios in order for these ratios to be comparable to prior periods. However, this HFS nonaccrual E&P was included as part of our other nonperforming assets. Total nonperforming assets totaled $121.8 million as of September 30, 2017, or 1.16% of total assets compared to $166.1 million, or 1.74% as of December 31, 2016. See “—Financial Condition—Asset Quality.”
Credit risk is governed and reported up to the board of directors primarily through our senior credit risk management committee. The senior credit risk management committee reviews credit portfolio management information such as problem loans, delinquencies, concentrations of credit, asset quality trends and portfolio analysis, and approves policy updates and changes.
As of September 30, 2017, $274 million, or 3.4%, of our loan portfolio is comprised of ACI loans, which are loans that at the date of acquisition exhibit evidence of credit deterioration since origination and for which it is probable that we will not collect all principal and interest payments in accordance with the terms of the loan agreement. At acquisition, the expected shortfall in future cash flows, as compared to the contractual amount due, is recognized as a nonaccretable discount. Any excess of expected cash flows over the acquisition date fair value is known as the accretable discount, and is recognized as accretion income over the life of each pool or individual loan. ACI loans that meet the criteria for nonaccrual of interest at the time of acquisition may be considered performing upon acquisition, regardless of whether the customer is contractually delinquent, if the timing and expected cash flows on such loans can be reasonably estimated and if collection of the new carrying value (fair
88
Table of Contents
value) of such loans is expected. However, if the timing or amount of the expected cash flows cannot be reasonably estimated, an ACI loan is placed in nonaccruing status. Expected cash flows over the acquisition date fair value are periodically re-estimated utilizing the same cash flow methodology used at the time of acquisition and subsequent decreases to the expected cash flows will generally result in a provision for credit losses charge in the consolidated statements of income. Conversely, subsequent increases in expected cash flows result in a transfer from the non-accretable discount to the accretable discount, which has a positive impact on accretion income prospectively. These cash flow evaluations are inherently subjective as they require material estimates, all of which may be susceptible to significant change. See “—Critical Accounting Policies and Estimates.”
Deposit Growth
We monitor deposit growth by account type, market, rate, source and average balance on an ongoing basis. We seek to fund loan growth primarily with customer deposits.
Liquidity
We manage and measure our liquidity risk by monitoring the composition of our funding mix, monitoring liquidity ratios, maintaining minimum liquidity thresholds and performing forward cash flow gap reports in various scenarios designed to simulate possible stressed liquidity environments. We attempt to limit our liquidity risk by setting Board approved concentration limits on sources of funds, limits on liquidity ratios used to measure liquidity risk, and maintaining required levels of on-hand liquidity.
Capital
We manage capital to comply with our internal planning targets and regulatory capital standards. We monitor capital levels on an ongoing basis, perform periodic evaluations under stress scenarios and project capital levels in connection with our growth plans to ensure appropriate capital levels. We evaluate a number of capital ratios, including Tier 1 capital to total adjusted assets (the leverage ratio), Tier 1 capital and common equity Tier 1 capital to risk-weighted assets, and our tangible common equity ratio.
Operating Highlights
The year ended December 31, 2016 was our fourth full fiscal year of operations after the completion of the acquisition of Encore in 2012, our most recent acquisition. These operations resulted in the following highlights for the first nine months of 2017 and the year ended December 31, 2016:
| • | Strong Balance Sheet Growth: |
| • | We have grown our total loans (net of unearned discounts and fees) from $3.99 billion as of December 31, 2012 to $8.03 billion as of September 30, 2017, an increase of over 100% over 19 quarters; |
| • | Our originated loan portfolio (net of unearned interest and fees) has grown from $1.75 billion to $7.56 billion over the same time period, which we believe evidences our strong relationship lending franchise; |
| • | Total deposits have grown from $4.63 billion as of December 31, 2012 to $8.50 billion as of September 30, 2017, an increase of 84%; and |
| • | C&I is 64% of our total originated loans as of September 30, 2017 compared to 88% as of December 31, 2012. |
| • | Improving Operating Metrics and Controlled Expenses: |
| • | Our adjusted operating revenue was $108.3 million and $312.7 million for the three and nine months ended September 30, 2017, respectively, compared to $91.8 million and $270.5 million for the three and nine months ended September 30, 2016; |
89
Table of Contents
| • | Our efficiency ratio was 52.20% and 53.43% for the three and nine months ended September 30, 2017, respectively, compared to 58.87% and 60.36% for the three and nine months ended September 30, 2016; |
| • | Our service fee revenue totaled $23.0 million and $67.6 million for the three and nine months ended September 30, 2017, respectively, and $82.0 million for the year ended December 30, 2016, compared to $20.9 million and $61.4 million for the three and nine months ended September 30, 2016, respectively, and $79.4 million for the year ended December 30, 2015; and |
| • | Our adjusted noninterest expense totaled $56.5 million and $166.8 million for the three and nine months ended September 30, 2017, respectively, and $219.9 million for the year ended December 30, 2016, compared to $54.8 million and $164.6 million for the three and nine months ended September 30, 2016, respectively, and $230.3 million for the year ended December 30, 2015. |
| • | Low-Risk Balance Sheet: |
| • | 6% of our loan portfolio as of September 30, 2017 was acquired and marked to estimated fair value through purchase accounting, at the time of the 2011 and 2012 acquisitions with the balance reflecting organically originated loans since 2011; |
| • | 65% of our investment portfolio is made up of U.S. Treasury or Agency direct or issued securities as of September 30, 2017; and |
| • | Strong capital with Tier 1 leverage ratio of 11.12% as of September 30, 2017 at our banking subsidiary. |
90
Table of Contents
Overview
We operate Cadence Bancorporation through three operating segments: Banking, Financial Services and Corporate.
Our Banking Segment includes our Commercial Banking, Retail Banking and Private Banking lines of business. Our Commercial Banking line of business includes a general business services component primarily focusing on commercial and industrial (“C&I”), community banking, business banking and commercial real estate lending and treasury management services to clients in our geographic footprint in Texas and the southeast United States. In addition, our Commercial Banking line of business includes within C&I a separate component that focuses on select industries (which we refer to as our “specialized industries”) in which we believe we have specialized experience and service capabilities, including restaurant industry, healthcare and technology. We serve clients in these specialized industries both within our geographic footprint and throughout the United States as a result of the national orientation of many of these businesses. Energy lending is also an important part of our business as energy production and energy related industries are meaningful contributors to the economy in our primary markets. Our Retail Banking line of business offers a broad range of retail banking services including mortgage services through our branch network to serve the needs of consumer and small businesses in our geographic footprint. Our Private Banking line of business offers banking services and loan products tailored to the needs of our high-net worth clients in our geographic footprint.
Our Financial Services Segment includes our Trust, Retail Brokerage, Investment Services and Insurance businesses. These businesses offer products independently to their own customers as well as to Banking Segment clients. Investment Services operates through the “Linscomb & Williams” name and Insurance operates though the “Cadence Insurance” name. The products offered by the businesses in our Financial Services Segment primarily generate non-banking service fee income. Our Corporate Segment reflects parent-only activities, including debt and capital raising, and intercompany eliminations.
While this section reviews financial performance from a business segment perspective, it should be read in conjunction with the discussion of Results of Operations, and our consolidated financial statements and notes thereto for a full understanding of our consolidated financial performance.
Business segment results are determined based upon our management reporting system, which assigns balance sheet and income statement items to each of the business segments. The process is based on our organizational and management structure and, accordingly, the results derived are not necessarily comparable with similar information published by other financial institutions and the results are not necessarily prepared in accordance with generally accepted accounting principles.
The following table presents the operating results of our segments for the periods presented:
| Segments | ||||||||||||||||
| Banking | Financial Services |
Corporate | Consolidated | |||||||||||||
| (In thousands) | ||||||||||||||||
| Three Months Ended September 30, 2017 |
||||||||||||||||
| Net interest income |
$ | 87,123 | $ | (2,340 | ) | $ | (3,620 | ) | $ | 81,163 | ||||||
| Provision for credit losses |
1,723 | — | — | 1,723 | ||||||||||||
| Noninterest income |
13,967 | 12,798 | 359 | 27,124 | ||||||||||||
| Noninterest expense |
46,785 | 9,087 | 658 | 56,530 | ||||||||||||
| Income tax expense (benefit) |
18,404 | 480 | (1,427 | ) | 17,457 | |||||||||||
|
|
|
|
|
|
|
|
|
|||||||||
| Net income (loss) |
$ | 34,178 | $ | 891 | $ | (2,492 | ) | $ | 32,577 | |||||||
|
|
|
|
|
|
|
|
|
|||||||||
91
Table of Contents
| Segments | ||||||||||||||||
| Banking | Financial Services |
Corporate | Consolidated | |||||||||||||
| (In thousands) | ||||||||||||||||
| Three Months Ended September 30, 2016 |
||||||||||||||||
| Net interest income |
$ | 74,970 | $ | (58 | ) | $ | (4,486 | ) | $ | 70,426 | ||||||
| Provision for credit losses |
29,627 | — | — | 29,627 | ||||||||||||
| Noninterest income |
12,078 | 10,613 | 100 | 22,791 | ||||||||||||
| Noninterest expense |
46,890 | 7,943 | 43 | 54,876 | ||||||||||||
| Income tax expense (benefit) |
3,685 | 914 | (2,492 | ) | 2,107 | |||||||||||
|
|
|
|
|
|
|
|
|
|||||||||
| Net income (loss) |
$ | 6,846 | $ | 1,698 | $ | (1,937 | ) | $ | 6,607 | |||||||
|
|
|
|
|
|
|
|
|
|||||||||
| Nine Months Ended September 30, 2017 |
||||||||||||||||
| Net interest income |
$ | 252,240 | $ | (873 | ) | $ | (13,062 | ) | $ | 238,305 | ||||||
| Provision for credit losses |
14,210 | — | — | 14,210 | ||||||||||||
| Noninterest income |
37,178 | 36,517 | 523 | 74,218 | ||||||||||||
| Noninterest expense |
139,239 | 26,361 | 1,385 | 166,985 | ||||||||||||
| Income tax expense (benefit) |
47,589 | 3,249 | (7,172 | ) | 43,666 | |||||||||||
|
|
|
|
|
|
|
|
|
|||||||||
| Net income (loss) |
$ | 88,380 | $ | 6,034 | $ | (6,752 | ) | $ | 87,662 | |||||||
|
|
|
|
|
|
|
|
|
|||||||||
| Nine Months Ended September 30, 2016 |
||||||||||||||||
| Net interest income |
$ | 220,577 | $ | (88 | ) | $ | (13,548 | ) | $ | 206,941 | ||||||
| Provision for credit losses |
54,570 | — | — | 54,570 | ||||||||||||
| Noninterest income |
33,664 | 32,232 | 147 | 66,043 | ||||||||||||
| Noninterest expense |
140,276 | 24,349 | 161 | 164,786 | ||||||||||||
| Income tax expense (benefit) |
20,788 | 2,728 | (6,677 | ) | 16,839 | |||||||||||
|
|
|
|
|
|
|
|
|
|||||||||
| Net income (loss) |
$ | 38,607 | $ | 5,067 | $ | (6,885 | ) | $ | 36,789 | |||||||
|
|
|
|
|
|
|
|
|
|||||||||
| Year Ended December 31, 2016 |
||||||||||||||||
| Net interest income |
$ | 297,701 | $ | (201 | ) | $ | (18,061 | ) | $ | 279,439 | ||||||
| Provision for credit losses |
49,348 | — | — | 49,348 | ||||||||||||
| Noninterest income |
45,499 | 42,727 | 177 | 88,403 | ||||||||||||
| Noninterest expense |
186,874 | 32,334 | 972 | 220,180 | ||||||||||||
| Income tax expense (benefit) |
37,442 | 3,567 | (8,469 | ) | 32,540 | |||||||||||
|
|
|
|
|
|
|
|
|
|||||||||
| Net income (loss) |
$ | 69,536 | $ | 6,625 | $ | (10,387 | ) | $ | 65,774 | |||||||
|
|
|
|
|
|
|
|
|
|||||||||
| Year Ended December 31, 2015 |
||||||||||||||||
| Net interest income |
$ | 265,450 | $ | (36 | ) | $ | (17,636 | ) | $ | 247,778 | ||||||
| Provision for credit losses |
35,984 | — | — | 35,984 | ||||||||||||
| Noninterest income |
38,697 | 40,964 | 242 | 79,903 | ||||||||||||
| Noninterest expense |
200,544 | 31,393 | 395 | 232,332 | ||||||||||||
| Income tax expense (benefit) |
23,673 | 3,337 | (6,901 | ) | 20,109 | |||||||||||
|
|
|
|
|
|
|
|
|
|||||||||
| Net income (loss) |
$ | 43,946 | $ | 6,198 | $ | (10,888 | ) | $ | 39,256 | |||||||
|
|
|
|
|
|
|
|
|
|||||||||
| Year Ended December 31, 2014 |
||||||||||||||||
| Net interest income |
$ | 266,226 | $ | (37 | ) | $ | (11,101 | ) | $ | 255,088 | ||||||
| Provision for credit losses |
14,118 | — | — | 14,118 | ||||||||||||
| Noninterest income |
34,603 | 40,199 | 268 | 75,070 | ||||||||||||
| Noninterest expense |
213,173 | 32,008 | (34 | ) | 245,147 | |||||||||||
| Income tax expense (benefit) |
25,739 | 2,854 | (2,533 | ) | 26,060 | |||||||||||
|
|
|
|
|
|
|
|
|
|||||||||
| Net income (loss) |
$ | 47,799 | $ | 5,300 | $ | (8,266 | ) | $ | 44,833 | |||||||
|
|
|
|
|
|
|
|
|
|||||||||
92
Table of Contents
Banking Segment
Our Banking Segment is our largest business segment and generates the majority of our net income. Net income for the Banking Segment was $34.2 million and $88.4 million for the three and nine month periods ended September 30, 2017, respectively, compared to $6.8 million and $38.6 million for the three and nine months ended September 30, 2016, respectively. Net income for the Banking Segment was $69.5 million for the year ended December 31, 2016 compared to $44.0 million and $47.8 million for the years ended December 31, 2015 and 2014, respectively.
Our Banking Segment’s net income is composed of net interest earned on our loan and investment portfolios, in addition to service fees and revenue from our deposit and loan customers. The Banking Segment expense includes all interest expense on our deposit accounts and other bank liabilities, operational and administrative expenses related to the business conducted in this segment and the provision for credit losses on our loan portfolio. All of these income and expense components, including noninterest expense, are discussed in greater detail elsewhere in this section.
Financial Services Segment
Our Financial Services Segment primarily generates non-banking fee revenue from trust services, insurance, investment and retail brokerage services. Net income for the Financial Services Segment was $0.9 million and $6.0 million for the three and nine month periods ended September 30, 2017, respectively, compared to $1.7 and $5.1 million for the three and nine month periods ended September 30, 2016, respectively. Net income for the Financial Services Segment was $6.6 million for the year ended December 31, 2016, compared to $6.2 million and $5.3 million for the years ended December 31, 2015 and 2014, respectively. The significant increase between 2015 and 2014 was related to an increase in revenue from trust services. For additional discussion, please see “—Noninterest income” and “—Noninterest expense.”
Corporate Segment
The loss in our Corporate Segment is primarily driven by the interest expense on our corporate senior and subordinated debt. Net loss for the Corporate Segment was $(2.5) million and $(6.8) million for the three and nine months ended September 30, 2017, respectively, compared to $(1.9) million and $(6.9) million for the three and nine months ended September 30, 2016. Net loss for the Corporate Segment was $(10.4) million for the year ended December 31, 2016, compared to $(10.9) million and $(8.3) million for the years ended December 31, 2015 and 2014, respectively. For additional discussion, please refer to “—Net interest income” and “—Borrowing.”
93
Table of Contents
Results of Operations
Earnings
We reported net income for the three and nine months ended September 30, 2017 of $32.6 million and $87.7 million, respectively, compared to $6.6 million and $36.8 million for the three and nine months ended September 30, 2016, respectively. Our net income for the year ended December 31, 2016 totaled $65.8 million compared to $39.3 million and $44.8 million for the years December 31, 2015 and 2014, respectively. The following table presents key earnings data for the periods indicated:
| As of and for the Three Months Ended September 30, |
As of and for the Nine Months Ended September 30, |
As of and for the Year Ended December 31, |
||||||||||||||||||||||||||
| 2017 | 2016 | 2017 | 2016 | 2016 | 2015 | 2014 | ||||||||||||||||||||||
| (In thousands, except per share data) | ||||||||||||||||||||||||||||
| Net income |
$ | 32,577 | $ | 6,607 | $ | 87,662 | $ | 36,789 | $ | 65,774 | $ | 39,256 | $ | 44,833 | ||||||||||||||
| Net income applicable to common shareholders |
32,577 | 6,607 | 87,662 | 36,789 | 65,774 | 39,256 | 41,190 | |||||||||||||||||||||
| Net income per common share |
||||||||||||||||||||||||||||
| —basic(1)(4) |
0.39 | 0.09 | 1.09 | 0.49 | 0.88 | 0.52 | 0.55 | |||||||||||||||||||||
| —diluted(2)(4) |
0.39 | 0.09 | 1.09 | 0.49 | 0.87 | 0.52 | 0.55 | |||||||||||||||||||||
| Net interest margin(5) |
3.52 | % | 3.27 | 3.56 | % | 3.30 | % | 3.30 | % | 3.29 | % | 4.06 | % | |||||||||||||||
| Net interest spread(5) |
3.20 | 3.04 | 3.28 | 3.08 | 3.08 | 3.10 | 3.89 | |||||||||||||||||||||
| Return on average assets(5) |
1.29 | 0.28 | 1.19 | 0.54 | 0.71 | 0.47 | 0.64 | |||||||||||||||||||||
| Return on average common equity(5) |
9.78 | 2.35 | 9.59 | 4.49 | 6.01 | 3.78 | 4.15 | |||||||||||||||||||||
| Return on average tangible common equity(3)(5) |
13.04 | 3.36 | 13.16 | 6.50 | 8.68 | 5.65 | 6.45 | |||||||||||||||||||||
| Return on average equity(5) |
9.78 | 2.35 | 9.59 | 4.49 | 6.01 | 3.78 | 4.44 | |||||||||||||||||||||
| (1) | 75 million of our outstanding shares are owned by the selling stockholder. |
| (2) | Includes CSE of 330,685 and 258,375 for the three months ended September 30, 2017 and 2016, respectively, 345,425 and 258,375 for the nine months ended September 30, 2017 and 2016, respectively, and 294,600, 116,100 and -0- for the years ended December 31, 2016, 2015 and 2014, respectively. |
| (3) | Considered a non-GAAP financial measure. See “Non-GAAP Financial Measures” for a reconciliation of our non-GAAP measures to the most directly comparable GAAP financial measure. |
| (4) | Per share information has been adjusted to reflect the stock split that occurred on April 7, 2017. |
| (5) | Annualized for the three and nine months ended September 30, 2017 and 2016. |
Net Interest Income
The largest component of our net income is net interest income, which is the difference between the income earned on interest-earning assets and interest paid on deposits and borrowings. We manage our interest-earning assets and funding sources to maximize our net interest margin. (See “—Quantitative and Qualitative Disclosures about Market Risk” for a discussion regarding our interest rate risk). Net interest income is determined by the rates earned on our interest-earning assets, rates paid on our interest-bearing liabilities, the relative amounts of interest-earning assets and interest-bearing liabilities, the degree of mismatch and the maturity and re-pricing characteristics of our interest-earning assets and interest-bearing liabilities. Net interest income divided by average interest-earning assets represents our net interest margin. The yield on our net earning assets less the yield on our interest bearing liabilities represents our net interest spread.
Interest earned on our loan portfolio is the largest component of our interest income. Our originated and ANCI portfolios are presented at the principal amount outstanding net of deferred origination fees and unamortized discounts and premiums. Interest income is recognized based on the principal balance outstanding
94
Table of Contents
and the stated rate of the loan. Loan origination fees and certain direct origination costs are capitalized and recognized as an adjustment of the yield on the related loan. ANCI loans acquired through our acquisitions were initially recorded at fair value. Discounts or premiums created when the loans were recorded at their estimated fair values at acquisition are being accreted over the remaining term of the loan as an adjustment to the related loan’s yield.
The performance of loans within our ACI portfolio impacts interest income as the remaining discounts and proceeds received in excess of expected cash flow are realized in interest income when these loans are closed through payoff, charge off, workout, sale or foreclosure. At acquisition, the expected shortfall in future cash flows on our ACI portfolio, as compared to the contractual amount due, was recognized as a non-accretable discount. Any excess of expected cash flows over the acquisition date fair value is known as the accretable discount, and is recognized as accretion income over the life of each pool or individual ACI loan. Expected cash flows over the acquisition date fair value are re-estimated quarterly utilizing the same cash flow methodology used at the time of acquisition. Any subsequent decreases to the expected cash flows will generally result in a provision for credit losses charge in the consolidated statements of income. Conversely, subsequent increases in expected cash flows result in a transfer from the non-accretable discount to the accretable discount, which has a positive impact on accretion income prospectively.
The following table summarizes the amount of interest income related to our ACI portfolio for the periods presented:
| Three Months Ended September 30, |
Nine Months Ended September 30, |
Year Ended December 31, |
||||||||||||||||||||||||||
| 2017 | 2016 | 2017 | 2016 | 2016 | 2015 | 2014 | ||||||||||||||||||||||
| (In thousands) | ||||||||||||||||||||||||||||
| Scheduled accretion for the period |
$ | 5,550 | $ | 7,296 | $ | 17,955 | $ | 24,024 | $ | 30,870 | $ | 46,042 | $ | 66,801 | ||||||||||||||
| Recovery income for the period |
290 | 1,360 | 5,350 | 4,732 | 5,699 | 9,970 | 21,291 | |||||||||||||||||||||
|
|
|
|
|
|
|
|
|
|
|
|
|
|
|
|||||||||||||||
| Total interest realized on the ACI portfolio |
$ | 5,840 | $ | 8,656 | $ | 23,305 | $ | 28,756 | $ | 36,569 | $ | 56,012 | $ | 88,092 | ||||||||||||||
|
|
|
|
|
|
|
|
|
|
|
|
|
|
|
|||||||||||||||
| Yield on ACI Portfolio |
||||||||||||||||||||||||||||
| Scheduled accretion for the period |
7.86 | % | 8.15 | % | 8.02 | % | 8.29 | % | 8.23 | % | 8.62 | % | 8.88 | % | ||||||||||||||
| Recovery income for the period |
0.41 | 1.52 | 2.39 | 1.63 | 1.52 | 1.87 | 2.83 | |||||||||||||||||||||
|
|
|
|
|
|
|
|
|
|
|
|
|
|
|
|||||||||||||||
| Total yield on the ACI portfolio |
8.27 | % | 9.67 | % | 10.41 | % | 9.92 | % | 9.75 | % | 10.49 | % | 11.71 | % | ||||||||||||||
|
|
|
|
|
|
|
|
|
|
|
|
|
|
|
|||||||||||||||
As of September 30, 2017, the weighted average contractual interest rate on the remaining active ACI portfolio loans was approximately 4.65%.
The following table is a rollforward of the accretable difference on our ACI portfolio for the periods indicated:
| Three Months Ended September 30, |
Nine Months Ended September 30, |
For the Year Ended December 31, |
||||||||||||||||||||||||||
| 2017 | 2016 | 2017 | 2016 | 2016 | 2015 | 2014 | ||||||||||||||||||||||
| (In thousands) | ||||||||||||||||||||||||||||
| Balance at beginning of period |
$ | 85,788 | $ | 107,973 | $ | 98,728 | $ | 122,791 | $ | 122,791 | $ | 163,631 | $ | 242,966 | ||||||||||||||
| Decreases from accretion, maturities / payoffs, foreclosures and charge-offs |
(7,937 | ) | (10,851 | ) | (27,246 | ) | (33,988 | ) | (43,760 | ) | (71,711 | ) | (97,660 | ) | ||||||||||||||
| Reclass from nonaccretable difference |
4,248 | 4,248 | 10,617 | 12,567 | 19,697 | 30,871 | 18,325 | |||||||||||||||||||||
|
|
|
|
|
|
|
|
|
|
|
|
|
|
|
|||||||||||||||
| Balance at end of period |
$ | 82,099 | $ | 101,370 | $ | 82,099 | $ | 101,370 | $ | 98,728 | $ | 122,791 | $ | 163,631 | ||||||||||||||
|
|
|
|
|
|
|
|
|
|
|
|
|
|
|
|||||||||||||||
95
Table of Contents
Three Months Ended September 30, 2017 and 2016
Our net interest income, fully-tax equivalent (FTE), for the three months ended September 30, 2017 and 2016 was $82.9 million and $71.7 million, respectively, an increase of $11.2 million. Our net interest margin for the three months ended September 30, 2017 and 2016 was 3.52% and 3.27%, respectively, an increase of 25 basis points. The yield on our total loan portfolio increased 31 basis points to 4.55% for the three months ended September 30, 2017 compared to 4.24% for the three months ended September 30, 2016 due to an increase in the rate and volume of our originated portfolio. The following table sets forth, on a tax equivalent basis, the components of our net interest income with the effect that the varying levels of interest-earning assets and interest-bearing liabilities and the applicable rates have had on changes in net interest income for the three months ended September 30, 2017:
| Three Months Ended September 30, 2017 vs. 2016 |
||||||||||||||||||||
| Net Interest Income | Increase | Changes Due To (1) | ||||||||||||||||||
| (In thousands) | 2017 | 2016 | (Decrease) | Rate | Volume | |||||||||||||||
| Increase (decrease) in: |
||||||||||||||||||||
| Income from interest-earning assets: |
||||||||||||||||||||
| Interest and fees on loans: |
||||||||||||||||||||
| Originated and ANCI loans |
$ | 84,321 | $ | 68,411 | $ | 15,910 | $ | 8,286 | $ | 7,624 | ||||||||||
| ACI portfolio |
5,840 | 8,656 | (2,816 | ) | (1,140 | ) | (1,676 | ) | ||||||||||||
| Interest on securities: |
||||||||||||||||||||
| Taxable |
4,610 | 3,866 | 744 | 928 | (184 | ) | ||||||||||||||
| Tax-exempt(2) |
5,046 | 3,671 | 1,375 | 208 | 1,168 | |||||||||||||||
| Interest on federal funds and short-term investments |
1,072 | 662 | 410 | 605 | (195 | ) | ||||||||||||||
| Interest on other investments |
380 | 673 | (293 | ) | (388 | ) | 94 | |||||||||||||
|
|
|
|
|
|
|
|
|
|
|
|||||||||||
| Total interest income |
101,269 | 85,939 | 15,330 | 8,499 | 6,831 | |||||||||||||||
| Expense from interest-bearing liabilities: |
||||||||||||||||||||
| Interest on demand deposits |
7,300 | 4,494 | 2,806 | 2,583 | 223 | |||||||||||||||
| Interest on savings deposits |
113 | 110 | 3 | 3 | — | |||||||||||||||
| Interest on time deposits |
5,665 | 4,676 | 989 | 1,501 | (512 | ) | ||||||||||||||
| Interest on other borrowings |
2,926 | 2,670 | 256 | (843 | ) | 1,099 | ||||||||||||||
| Interest on subordinated debentures |
2,336 | 2,278 | 58 | 43 | 15 | |||||||||||||||
|
|
|
|
|
|
|
|
|
|
|
|||||||||||
| Total interest expense |
18,340 | 14,228 | 4,112 | 3,287 | 825 | |||||||||||||||
|
|
|
|
|
|
|
|
|
|
|
|||||||||||
| Net interest income |
$ | 82,929 | $ | 71,711 | $ | 11,218 | $ | 5,212 | $ | 6,006 | ||||||||||
|
|
|
|
|
|
|
|
|
|
|
|||||||||||
| (1) | The change in interest income due to both rate and volume has been allocated to rate and volume changes in proportion to the relationship of the absolute dollar amounts of the changes in each. |
| (2) | Interest income and yields are presented on a tax equivalent basis using a Federal tax rate of 35% on our state, county and municipal investment portfolios. |
96
Table of Contents
Our total interest income (FTE) for the three months ended September 30, 2017 totaled $101.3 million compared to $85.9 million in the three months ended September 30, 2016. This increase is primarily the result of an increase in the volume and yield of our originated loans and an increase in the volume of our investment portfolio. The yield on our originated loan portfolio reflects an increase in LIBOR rates in our loan portfolio. We also increased the level of our investments in tax-exempt securities which increased the interest income volume on our investment securities portfolio.
| Three Months Ended | ||||||||||||||||||||||||
| September 30, 2017 | September 30, 2016 | |||||||||||||||||||||||
| (In thousands) | Average Balance |
Interest Income |
Yield | Average Balance |
Interest Income |
Yield | ||||||||||||||||||
| Loans, net of unearned income |
||||||||||||||||||||||||
| Originated loans |
$ | 7,389,566 | $ | 81,585 | 4.38 | % | $ | 6,619,157 | $ | 64,999 | 3.91 | % | ||||||||||||
| ANCI loans |
197,990 | 2,736 | 5.48 | 250,164 | 3,412 | 5.43 | ||||||||||||||||||
| ACI Loans |
280,238 | 5,840 | 8.27 | 356,044 | 8,656 | 9.67 | ||||||||||||||||||
|
|
|
|
|
|
|
|
|
|
|
|
|
|||||||||||||
| Total loans |
$ | 7,867,794 | $ | 90,161 | 4.55 | % | $ | 7,225,365 | $ | 77,067 | 4.24 | % | ||||||||||||
|
|
|
|
|
|
|
|
|
|
|
|
|
|||||||||||||
The yield on our ACI portfolio fluctuates due to the volume and timing of cash flows received or expected to be received. The yield on our ACI portfolio for the three months ended September 30, 2017 was 8.27% compared to 9.67% for the three months ended September 30, 2016. During the three months ended September 30, 2017, interest income on the ACI portfolio included $0.3 million in recovery income, compared to $1.4 million in the three months ended September 30, 2016. These amounts were realized on certain individual loans that were settled before expected, or where we received amounts above our estimates. Excluding these amounts, the yield on our ACI loans would have been 7.86% for the three months ended September 30, 2017 compared to 8.15% for the three months ended September 30, 2016. Our total loan yield, excluding these amounts, would have been 4.53 % and 4.17 % for the three months ended September 30, 2017 and 2016, respectively.
Our interest expense for the three months ended September 30, 2017 and 2016 was $18.3 million and $14.2 million, respectively, an increase of $4.1 million. This increase is primarily related to the impact of higher market rates on our interest bearing demand accounts and time deposits. Our cost of interest bearing deposits increased to 0.84% for the three months ended September 30, 2017 compared to 0.60% for the three months ended September 30, 2016. Our cost of borrowings for the three months ended September 30, 2017 and 2016 was 4.31% and 5.35%, respectively, and is primarily related to an increase in lower cost FHLB advances offset by an increase in LIBOR rates from the prior period.
97
Table of Contents
The following table presents, on a tax equivalent basis, for the three months ended September 30, 2017 and 2016, our average balance sheet and our average yields on assets and average costs of liabilities. Average yields are calculated by dividing income or expense by the average balance of the corresponding assets or liabilities. Average balances have been calculated on a daily basis, except for ACI loans, which is a monthly average.
| Three Months Ended September 30, | ||||||||||||||||||||||||
| 2017 | 2016 | |||||||||||||||||||||||
| (In thousands) | Average Balance |
Income/ Expense |
Yield/ Rate |
Average Balance |
Income/ Expense |
Yield/ Rate |
||||||||||||||||||
| ASSETS |
||||||||||||||||||||||||
| Interest-earning assets: |
||||||||||||||||||||||||
| Loans, net of unearned income(1) |
||||||||||||||||||||||||
| Originated and ANCI loans |
$ | 7,587,556 | $ | 84,321 | 4.41 | % | $ | 6,869,321 | $ | 68,411 | 3.96 | % | ||||||||||||
| ACI portfolio |
280,238 | 5,840 | 8.27 | 356,044 | 8,656 | 9.67 | ||||||||||||||||||
|
|
|
|
|
|
|
|
|
|||||||||||||||||
| Total loans |
7,867,794 | 90,161 | 4.55 | 7,225,365 | 77,067 | 4.24 | ||||||||||||||||||
| Investment securities |
||||||||||||||||||||||||
| Taxable |
760,269 | 4,610 | 2.41 | 796,625 | 3,866 | 1.93 | ||||||||||||||||||
| Tax-exempt(2) |
408,913 | 5,046 | 4.90 | 314,211 | 3,671 | 4.65 | ||||||||||||||||||
|
|
|
|
|
|
|
|
|
|||||||||||||||||
| Total investment securities |
1,169,182 | 9,656 | 3.28 | 1,110,836 | 7,537 | 2.70 | ||||||||||||||||||
| Federal funds sold and short-term investments |
267,684 | 1,072 | 1.59 | 354,720 | 662 | 0.74 | ||||||||||||||||||
| Other investments |
49,661 | 380 | 3.04 | 42,896 | 673 | 6.24 | ||||||||||||||||||
|
|
|
|
|
|
|
|
|
|||||||||||||||||
| Total interest-earning assets |
9,354,321 | 101,269 | 4.30 | 8,733,817 | 85,939 | 3.91 | ||||||||||||||||||
| Noninterest-earning assets: |
||||||||||||||||||||||||
| Cash and due from banks |
60,760 | 45,873 | ||||||||||||||||||||||
| Premises and equipment |
65,308 | 69,247 | ||||||||||||||||||||||
| Accrued interest and other assets |
639,188 | 644,340 | ||||||||||||||||||||||
| Allowance for credit losses |
(94,706 | ) | (93,132 | ) | ||||||||||||||||||||
|
|
|
|
|
|||||||||||||||||||||
| Total assets |
$ | 10,024,871 | $ | 9,400,145 | ||||||||||||||||||||
|
|
|
|
|
|||||||||||||||||||||
| LIABILITIES AND SHAREHOLDERS’ EQUITY |
||||||||||||||||||||||||
| Interest-bearing liabilities: |
||||||||||||||||||||||||
| Demand deposits |
$ | 4,329,086 | $ | 7,300 | 0.67 | % | $ | 4,130,126 | $ | 4,494 | 0.43 | % | ||||||||||||
| Savings deposits |
180,099 | 113 | 0.25 | 180,452 | 110 | 0.24 | ||||||||||||||||||
| Time deposits |
1,648,000 | 5,665 | 1.36 | 1,835,371 | 4,676 | 1.01 | ||||||||||||||||||
|
|
|
|
|
|
|
|
|
|||||||||||||||||
| Total interest-bearing deposits |
6,157,185 | 13,078 | 0.84 | 6,145,949 | 9,280 | 0.60 | ||||||||||||||||||
| Other borrowings |
349,925 | 2,926 | 3.32 | 234,072 | 2,670 | 4.54 | ||||||||||||||||||
| Subordinated debentures |
134,873 | 2,336 | 6.87 | 134.120 | 2,278 | 6.76 | ||||||||||||||||||
|
|
|
|
|
|
|
|
|
|||||||||||||||||
| Total interest-bearing liabilities |
6,641,983 | 18,340 | 1.10 | 6,514,141 | 14,228 | 0.87 | ||||||||||||||||||
| Noninterest-bearing liabilities: |
||||||||||||||||||||||||
| Demand deposits |
1,982,784 | 1,697,633 | ||||||||||||||||||||||
| Accrued interest and other liabilities |
79,220 | 69,768 | ||||||||||||||||||||||
|
|
|
|
|
|||||||||||||||||||||
| Total liabilities |
8,703,987 | 8,281,542 | ||||||||||||||||||||||
| Shareholders’ equity |
1,320,884 | 1,118,603 | ||||||||||||||||||||||
|
|
|
|
|
|||||||||||||||||||||
| Total liabilities and shareholders’ equity |
$ | 10,024,871 | $ | 9,400,145 | ||||||||||||||||||||
|
|
|
|
|
|||||||||||||||||||||
| Net interest income/net interest spread |
82,929 | 3.20 | % | 71,711 | 3.04 | % | ||||||||||||||||||
|
|
|
|
|
|||||||||||||||||||||
| Net yield on earning assets/net interest margin |
3.52 | % | 3.27 | % | ||||||||||||||||||||
|
|
|
|
|
|||||||||||||||||||||
| Taxable equivalent adjustment: |
||||||||||||||||||||||||
| Investment securities |
(1,766 | ) | (1,285 | ) | ||||||||||||||||||||
|
|
|
|
|
|||||||||||||||||||||
| Net interest income |
$ | 81,163 | $ | 70,426 | ||||||||||||||||||||
|
|
|
|
|
|||||||||||||||||||||
| (1) | Nonaccrual loans are included in loans, net of unearned income. No adjustment has been made for these loans in the calculation of yields. |
| (2) | Interest income and yields are presented on a taxable equivalent basis using a tax rate of 35%. |
98
Table of Contents
Nine months ended September 30, 2017 and 2016
Our net interest income, fully-tax equivalent (FTE), for the nine months ended September 30, 2017 and 2016 was $243.7 million and $210.0 million, respectively, an increase of $33.8 million. Our net interest margin for the nine months ended September 30, 2017 and 2016 was 3.56% and 3.30%, respectively, an increase of 26 basis points. The yield on our total loan portfolio increased 29 basis points to 4.54% for the nine months ended September 30, 2017 compared to 4.25% for the nine months ended September 30, 2016 due to an increase in the rate and volume of our originated portfolio offset by a decline in the volume of our higher yielding ACI portfolio. The following table sets forth, on a tax equivalent basis, the components of our net interest income with the effect that the varying levels of interest-earning assets and interest-bearing liabilities and the applicable rates have had on changes in net interest income for the nine months ended September 30, 2017:
| Nine Months Ended September 30, 2017 vs. 2016 |
||||||||||||||||||||
| Net Interest Income | Increase (Decrease) |
Changes Due To(1) | ||||||||||||||||||
| (In thousands) | 2017 | 2016 | Rate | Volume | ||||||||||||||||
| Increase (decrease) in: |
||||||||||||||||||||
| Income from interest-earning assets: |
||||||||||||||||||||
| Interest and fees on loans: |
||||||||||||||||||||
| Originated and ANCI loans |
$ | 238,095 | $ | 197,747 | $ | 40,348 | $ | 20,395 | $ | 19,953 | ||||||||||
| ACI portfolio |
23,305 | 28,756 | (5,451 | ) | 1,359 | (6,810 | ) | |||||||||||||
| Interest on securities: |
||||||||||||||||||||
| Taxable |
13,089 | 12,420 | 669 | 973 | (304 | ) | ||||||||||||||
| Tax-exempt(2) |
15,506 | 8,651 | 6,855 | 508 | 6,347 | |||||||||||||||
| Interest on fed funds and short-term investments |
2,184 | 1,636 | 548 | 898 | (350 | ) | ||||||||||||||
| Interest on other investments |
1,745 | 2,000 | (255 | ) | (406 | ) | 151 | |||||||||||||
|
|
|
|
|
|
|
|
|
|
|
|||||||||||
| Total interest income |
293,924 | 251,210 | 42,714 | 23,727 | 18,987 | |||||||||||||||
| Expense from interest-bearing liabilities: |
||||||||||||||||||||
| Interest on demand deposits |
19,186 | 12,858 | 6,328 | 5,241 | 1,087 | |||||||||||||||
| Interest on savings deposits |
344 | 312 | 32 | 25 | 7 | |||||||||||||||
| Interest on time deposits |
15,084 | 12,867 | 2,217 | 2,887 | (670 | ) | ||||||||||||||
| Interest on other borrowings |
8,623 | 8,361 | 262 | (1,089 | ) | 1,351 | ||||||||||||||
| Interest on subordinated debentures |
6,955 | 6,843 | 112 | 72 | 40 | |||||||||||||||
|
|
|
|
|
|
|
|
|
|
|
|||||||||||
| Total interest expense |
50,192 | 41,241 | 8,951 | 7,136 | 1,815 | |||||||||||||||
|
|
|
|
|
|
|
|
|
|
|
|||||||||||
| Net interest income |
$ | 243,732 | $ | 209,969 | $ | 33,763 | $ | 16,591 | $ | 17,172 | ||||||||||
|
|
|
|
|
|
|
|
|
|
|
|||||||||||
Our total interest income (FTE) for the nine months ended September 30, 2017 totaled $293.9 million compared to $251.2 million in the nine months ended September 30, 2016. This increase is primarily the result of an increase in the volume and yield of our originated loans offset by declines in the volume and yield of our ACI portfolio and an increase in the volume of our investment portfolio. The yield on our originated loan portfolio reflects the increase in LIBOR rates in our loan portfolio. We also increased the level of our investments in tax-exempt securities which increased the interest income volume on our investment securities portfolio.
99
Table of Contents
The following table presents a comparison of loan portfolio yield for the nine months ended September 30, 2017 and 2016:
| Nine Months Ended | ||||||||||||||||||||||||
| September 30, 2017 | September 30, 2016 | |||||||||||||||||||||||
| (In thousands) | Average Balance |
Interest Income |
Yield | Average Balance |
Interest Income |
Yield | ||||||||||||||||||
| Loans, net of unearned income |
||||||||||||||||||||||||
| Originated loans |
$ | 7,185,554 | $ | 229,705 | 4.27 | % | $ | 6,468,699 | $ | 186,874 | 3.86 | % | ||||||||||||
| ANCI loans |
206,072 | 8,390 | 5.44 | 267,278 | 10,873 | 5.43 | ||||||||||||||||||
| ACI Loans |
299,172 | 23,305 | 10.41 | 387,234 | 28,756 | 9.92 | ||||||||||||||||||
|
|
|
|
|
|
|
|
|
|
|
|
|
|||||||||||||
| Total loans |
$ | 7,690,798 | $ | 261,400 | 4.54 | % | $ | 7,123,211 | $ | 226,503 | 4.25 | % | ||||||||||||
|
|
|
|
|
|
|
|
|
|
|
|
|
|||||||||||||
The yield on our ACI portfolio fluctuates due to the volume and timing of cash flows received or expected to be received. The yield on our ACI portfolio for the nine months ended September 30, 2017 was 10.41% compared to 9.92% for the nine months ended September 30, 2016. During the nine months ended September 30, 2017, interest income on the ACI portfolio included $5.4 million in recovery income, compared to $4.7 million in the nine months ended September 30, 2016. These amounts were realized on certain individual loans that were settled before expected, or where we received amounts above our estimates. Excluding these amounts, the yield on our ACI loans would have been 8.02% for the nine months ended September 30, 2017 compared to 8.29% for the nine months ended September 30, 2016. Our total loan yield, excluding these amounts, would have been 4.45 % and 4.16 % for the nine months ended September 30, 2017 and 2016, respectively.
Our interest expense for the nine months ended September 30, 2017 and 2016 was $50.2 million and $41.2 million, respectively, an increase of $9.0 million. This increase is primarily related to the impact of higher market rates on our interest bearing demand accounts and time deposits. Our cost of interest bearing deposits increased to 0.75% for the nine months ended September 30, 2017 compared to 0.59% for the nine months ended September 30, 2016. Our cost of borrowings was 4.25% and 4.65% for the nine months ended September 30, 2017 and 2016, respectively. The decline reflects our purchase of senior debt and increases in lower cost Federal Home Loan Bank (“FHLB”) advances.
100
Table of Contents
The following table presents, on a tax equivalent basis, for the nine months ended September 30, 2017 and 2016, our average balance sheet and our average yields on assets and average costs of liabilities. Average yields are calculated by dividing income or expense by the average balance of the corresponding assets or liabilities. Average balances have been calculated on a daily basis, except for ACI loans, which is a monthly average.
| Nine Months Ended September 30, | ||||||||||||||||||||||||
| 2017 | 2016 | |||||||||||||||||||||||
| (In thousands) | Average Balance |
Income/ Expense |
Yield/ Rate |
Average Balance |
Income/ Expense |
Yield/ Rate |
||||||||||||||||||
| ASSETS |
||||||||||||||||||||||||
| Interest-earning assets: |
||||||||||||||||||||||||
| Loans, net of unearned income(1) |
||||||||||||||||||||||||
| Originated and ANCI loans |
$ | 7,391,626 | $ | 238,095 | 4.31 | % | $ | 6,735,977 | $ | 197,747 | 3.92 | % | ||||||||||||
| ACI portfolio |
299,172 | 23,305 | 10.41 | 387,234 | 28,756 | 9.92 | ||||||||||||||||||
|
|
|
|
|
|
|
|
|
|||||||||||||||||
| Total loans |
7,690,798 | 261,400 | 4.54 | 7,123.211 | 226,503 | 4.25 | ||||||||||||||||||
| Investment securities |
||||||||||||||||||||||||
| Taxable |
723,871 | 13,089 | 2.42 | 741,536 | 12,420 | 2.24 | ||||||||||||||||||
| Tax-exempt(2) |
407,511 | 15,506 | 5.09 | 239,801 | 8,651 | 4.82 | ||||||||||||||||||
|
|
|
|
|
|
|
|
|
|||||||||||||||||
| Total investment securities |
1,131,382 | 28,595 | 3.38 | 981,337 | 21,071 | 2.87 | ||||||||||||||||||
| Federal funds sold and short-term investments |
281,454 | 2,184 | 1.04 | 345,838 | 1,636 | 0.63 | ||||||||||||||||||
| Other investments |
49,263 | 1,745 | 4.74 | 45,599 | 2,000 | 5.86 | ||||||||||||||||||
|
|
|
|
|
|
|
|
|
|||||||||||||||||
| Total interest-earning assets |
9,152,897 | 293,924 | 4.29 | 8,495,985 | 251,210 | 3.95 | ||||||||||||||||||
| Noninterest-earning assets: |
||||||||||||||||||||||||
| Cash and due from banks |
57,837 | 48,481 | ||||||||||||||||||||||
| Premises and equipment |
65,663 | 69,855 | ||||||||||||||||||||||
| Accrued interest and other assets |
641,331 | 636,862 | ||||||||||||||||||||||
| Allowance for credit losses |
(89,156 | ) | (88,660 | ) | ||||||||||||||||||||
|
|
|
|
|
|||||||||||||||||||||
| Total assets |
$ | 9,828,572 | $ | 9,162,523 | ||||||||||||||||||||
|
|
|
|
|
|||||||||||||||||||||
| LIABILITIES AND SHAREHOLDERS’ EQUITY |
||||||||||||||||||||||||
| Interest-bearing liabilities: |
||||||||||||||||||||||||
| Demand deposits |
$ | 4,338,645 | $ | 19,186 | 0.59 | % | $ | 4,027,944 | $ | 128,584 | 0.43 | % | ||||||||||||
| Savings deposits |
182,877 | 344 | 0.25 | 178,163 | 312 | 0.23 | ||||||||||||||||||
| Time deposits |
1,618,298 | 15,084 | 1.25 | 1,702,380 | 12,867 | 1.01 | ||||||||||||||||||
|
|
|
|
|
|
|
|
|
|||||||||||||||||
| Total interest-bearing deposits |
6,139,820 | 34,614 | 0.75 | 5,908,487 | 26,037 | 0.59 | ||||||||||||||||||
| Other borrowings |
355,393 | 8,623 | 3.24 | 302,867 | 8,361 | 3.69 | ||||||||||||||||||
| Subordinated debentures |
134,692 | 6,955 | 6.90 | 133,916 | 6,843 | 6.83 | ||||||||||||||||||
|
|
|
|
|
|
|
|
|
|||||||||||||||||
| Total interest-bearing liabilities |
6,629,905 | 50,192 | 1.01 | 6,345,270 | 41,241 | 0.87 | ||||||||||||||||||
| Noninterest-bearing liabilities: |
||||||||||||||||||||||||
| Demand deposits |
1,895,754 | 1,656,166 | ||||||||||||||||||||||
| Accrued interest and other liabilities |
81,068 | 67,678 | ||||||||||||||||||||||
|
|
|
|
|
|||||||||||||||||||||
| Total liabilities |
1,976,822 | 8,069,114 | ||||||||||||||||||||||
| Shareholders’ equity |
1,221,845 | 1,093,409 | ||||||||||||||||||||||
|
|
|
|
|
|||||||||||||||||||||
| Total liabilities and shareholders’ equity |
$ | 9,828,572 | $ | 9,162,523 | ||||||||||||||||||||
|
|
|
|
|
|||||||||||||||||||||
| Net interest income/net interest spread |
243,732 | 3.28 | % | 209,969 | 3.08 | % | ||||||||||||||||||
|
|
|
|
|
|||||||||||||||||||||
| Net yield on earning assets/net interest margin |
3.56 | % | 3.30 | % | ||||||||||||||||||||
|
|
|
|
|
|||||||||||||||||||||
| Taxable equivalent adjustment: |
||||||||||||||||||||||||
| Investment securities |
(5,427 | ) | (3,028 | ) | ||||||||||||||||||||
|
|
|
|
|
|||||||||||||||||||||
| Net interest income |
$ | 238,305 | $ | 206,941 | ||||||||||||||||||||
|
|
|
|
|
|||||||||||||||||||||
| (1) | Nonaccrual loans are included in loans, net of unearned income. No adjustment has been made for these loans in the calculation of yields. |
| (2) | Interest income and yields are presented on a taxable equivalent basis using a tax rate of 35%. |
101
Table of Contents
Years Ended December 31, 2016 and 2015
Our net interest income, fully-tax equivalent (FTE), for the years ended December 31, 2016 and 2015 was $284.2 million and $249.1 million, respectively, an increase of $35.1 million. Our net interest margin for the years ended December 31, 2016 and 2015 was 3.30% and 3.29%, respectively, an increase of 1 basis points. The yield on our total loan portfolio increased 5 basis points to 4.25% for the year ended December 31, 2016 compared to 4.20% for the year ended December 31, 2015 due to an increase in the rate and volume of our lower yielding originated portfolio and the decline of our higher yielding ACI portfolio. The following table sets forth, on a tax equivalent basis, the components of our net interest income with the effect that the varying levels of interest-earning assets and interest-bearing liabilities and the applicable rates have had on changes in net interest income for the years ended 2016 and 2015:
| Years Ended December 31, 2016 vs. 2015 | ||||||||||||||||||||
| Net Interest Income | Increase (Decrease) |
Changes Due To(1) | ||||||||||||||||||
| 2016 | 2015 | Rate | Volume | |||||||||||||||||
| (In thousands) | ||||||||||||||||||||
| Increase (decrease) in: |
||||||||||||||||||||
| Income from interest-earning assets: |
||||||||||||||||||||
| Interest and fees on loans: |
||||||||||||||||||||
| Originated and ANCI loans |
$ | 268,984 | $ | 216,422 | $ | 52,562 | $ | 19,960 | $ | 32,602 | ||||||||||
| ACI portfolio |
36,569 | 56,012 | (19,443 | ) | (3,727 | ) | (15,716 | ) | ||||||||||||
| Interest on securities: |
||||||||||||||||||||
| Taxable |
15,838 | 14,329 | 1,509 | (1,566 | ) | 3,075 | ||||||||||||||
| Tax-exempt(2) |
13,464 | 3,743 | 9,721 | (556 | ) | 10,277 | ||||||||||||||
| Interest on federal funds and short-term investments |
2,419 | 1,564 | 855 | 893 | (38 | ) | ||||||||||||||
| Interest on other investments |
2,688 | 2,307 | 381 | 210 | 171 | |||||||||||||||
|
|
|
|
|
|
|
|
|
|
|
|||||||||||
| Total interest income |
339,962 | 294,377 | 45,585 | 15,214 | 30,371 | |||||||||||||||
| Expense from interest-bearing liabilities: |
||||||||||||||||||||
| Interest on demand deposits |
17,832 | 12,610 | 5,222 | 4,234 | 988 | |||||||||||||||
| Interest on savings deposits |
423 | 443 | (20 | ) | 36 | (56 | ) | |||||||||||||
| Interest on time deposits |
17,191 | 12,768 | 4,423 | 673 | 3,750 | |||||||||||||||
| Interest on other borrowings |
11,215 | 10,914 | 301 | (781 | ) | 1,082 | ||||||||||||||
| Interest on subordinated debentures |
9,150 | 8,554 | 596 | 38 | 558 | |||||||||||||||
|
|
|
|
|
|
|
|
|
|
|
|||||||||||
| Total interest expense |
55,811 | 45,289 | 10,522 | 4,200 | 6,322 | |||||||||||||||
|
|
|
|
|
|
|
|
|
|
|
|||||||||||
| Net interest income |
$ | 284,151 | $ | 249,088 | $ | 35,063 | $ | 11,014 | $ | 24,049 | ||||||||||
|
|
|
|
|
|
|
|
|
|
|
|||||||||||
| (1) | The change in interest income due to both rate and volume has been allocated to rate and volume changes in proportion to the relationship of the absolute dollar amounts of the changes in each. |
| (2) | Interest income and yields are presented on a tax equivalent basis using a Federal tax rate of 35% on our state, county and municipal investment portfolios. |
Our total interest income (FTE) for the year ended December 31, 2016 totaled $340.0 million compared to $294.4 million in the year ended December 31, 2015. This increase is primarily the result of an increase in the volume and yield of our originated loans offset by declines in the volume and yield of our ACI portfolio and an increase in the volume of our investment portfolio. The yield on our originated loan portfolio reflects an increase in LIBOR and increases in our residential loan portfolio. In addition, during June 2015 and first quarter 2016 we entered into $1.33 billion of interest rate swaps hedging the 1-month LIBOR variable rate index to a weighted average fixed rate of 1.35%. See Note 6 to the December 31, 2016 consolidated financial statements and “Quantitative and Qualitative Disclosures about Market Risk—Derivative Positions.” We also increased the level of our investments in tax-exempt securities to realign the sector composition of our portfolio which increased the interest volume on our investment securities portfolio.
102
Table of Contents
The following table presents a comparison of loan portfolio yield for the years 2016 and 2015:
| Year Ended | ||||||||||||||||||||||||
| December 31, 2016 | December 31, 2015 | |||||||||||||||||||||||
| Average Balance |
Interest Income |
Yield | Average Balance |
Interest Income |
Yield | |||||||||||||||||||
| (In thousands) | ||||||||||||||||||||||||
| Loans, net of unearned income |
||||||||||||||||||||||||
| Originated loans |
$ | 6,553,303 | $ | 254,971 | 3.89 | % | $ | 5,587,886 | $ | 197,395 | 3.53 | % | ||||||||||||
| ANCI loans |
258,313 | 14,013 | 5.42 | 366,361 | 19,027 | 5.19 | ||||||||||||||||||
| ACI Loans |
375,019 | 36,569 | 9.75 | 533,824 | 56,012 | 10.49 | ||||||||||||||||||
|
|
|
|
|
|
|
|
|
|
|
|
|
|||||||||||||
| Total loans |
$ | 7,186,635 | $ | 305,553 | 4.25 | % | $ | 6,488,071 | $ | 272,434 | 4.20 | % | ||||||||||||
|
|
|
|
|
|
|
|
|
|
|
|
|
|||||||||||||
The yield on our ACI portfolio fluctuates due to the volume and timing of cash flows received or expected to be received. The yield on our ACI portfolio for the year ended December 31, 2016 was 9.75% compared to 10.49% for the year ended December 31, 2015. During the year ended December 31, 2016, interest income on the ACI portfolio included $5.7 million in remaining discount and recovery income, compared to $10.0 million in the year ended December 31, 2015. These amounts were realized on certain individual loans that were settled before expected, or where we received amounts above our estimates. Excluding these amounts, the yield on our ACI loans would have been 8.23% for the year ended December 31, 2016 compared to 8.63% for the year ended December 31, 2015. Our total loan yield, excluding these amounts, would have been 4.17% and 4.05% for the years 2016 and 2015, respectively.
Our interest expense for the years ended December 31, 2016 and 2015 was $55.8 million and $45.3 million, respectively, an increase of $10.5 million. This increase is primarily related to higher market rates on our interest bearing demand accounts and higher volumes of time deposits. Our cost of interest bearing deposits increased to 0.59% for the year ended December 31, 2016 compared to 0.48% for the year ended December 31, 2015 as our cost of borrowings declined to 4.50% from 4.69% reflecting the higher volume of FHLB advances during the period.
103
Table of Contents
The following table presents, on a tax equivalent basis, for the years ended December 31, 2016 and 2015, our average balance sheet and our average yields on assets and average costs of liabilities. Average yields are calculated by dividing income or expense by the average balance of the corresponding assets or liabilities. Average balances have been calculated on a daily basis, except for ACI loans, which is a monthly average.
| Years Ended December 31, | ||||||||||||||||||||||||
| 2016 | 2015 | |||||||||||||||||||||||
| Average Balance |
Income/ Expense |
Yield/ Rate |
Average Balance |
Income/ Expense |
Yield/ Rate |
|||||||||||||||||||
| (In thousands) | ||||||||||||||||||||||||
| ASSETS |
||||||||||||||||||||||||
| Interest-earning assets: |
||||||||||||||||||||||||
| Loans, net of unearned income(1) |
||||||||||||||||||||||||
| Originated and ANCI loans |
$ | 6,811,616 | $ | 268,984 | 3.95 | % | $ | 5,954,247 | $ | 216,422 | 3.63 | % | ||||||||||||
| ACI portfolio |
375,019 | 36,569 | 9.75 | 533,824 | 56,012 | 10.49 | ||||||||||||||||||
|
|
|
|
|
|
|
|
|
|||||||||||||||||
| Total loans |
7,186,635 | 305,553 | 4.25 | 6,488,071 | 272,434 | 4.20 | ||||||||||||||||||
| Investment securities |
||||||||||||||||||||||||
| Taxable |
725,100 | 15,838 | 2.18 | 590,411 | 14,329 | 2.43 | ||||||||||||||||||
| Tax-exempt(2) |
276,217 | 13,464 | 4.87 | 66,693 | 3,743 | 5.61 | ||||||||||||||||||
|
|
|
|
|
|
|
|
|
|||||||||||||||||
| Total investment securities |
1,001,317 | 29,302 | 2.93 | 657,104 | 18,072 | 2.75 | ||||||||||||||||||
| Federal funds sold and short-term investments |
368,669 | 2,419 | 0.66 | 377,558 | 1,564 | 0.41 | ||||||||||||||||||
| Other investments |
46,364 | 2,688 | 5.80 | 43,259 | 2,307 | 5.33 | ||||||||||||||||||
|
|
|
|
|
|
|
|
|
|||||||||||||||||
| Total interest-earning assets |
8,602,985 | 339,962 | 3.95 | 7,565,992 | 294,377 | 3.89 | ||||||||||||||||||
| Noninterest-earning assets: |
||||||||||||||||||||||||
| Cash and due from banks |
47,569 | 46,233 | ||||||||||||||||||||||
| Premises and equipment |
69,290 | 72,120 | ||||||||||||||||||||||
| Accrued interest and other assets |
642,049 | 649,056 | ||||||||||||||||||||||
| Allowance for credit losses |
(90,264 | ) | (58,501 | ) | ||||||||||||||||||||
|
|
|
|
|
|||||||||||||||||||||
| Total assets |
$ | 9,271,629 | $ | 8,274,900 | ||||||||||||||||||||
|
|
|
|
|
|||||||||||||||||||||
| LIABILITIES AND STOCKHOLDERS’ EQUITY |
||||||||||||||||||||||||
| Interest-bearing liabilities: |
||||||||||||||||||||||||
| Demand deposits |
$ | 4,122,667 | $ | 17,832 | 0.43 | % | $ | 3,850,261 | $ | 12,610 | 0.33 | % | ||||||||||||
| Savings deposits |
178,397 | 423 | 0.24 | 201,435 | 443 | 0.22 | ||||||||||||||||||
| Time deposits |
1,665,833 | 17,191 | 1.03 | 1,297,175 | 12,768 | 0.98 | ||||||||||||||||||
|
|
|
|
|
|
|
|
|
|||||||||||||||||
| Total interest-bearing deposits |
5,966,897 | 35,446 | 0.59 | 5,348,871 | 25,821 | 0.48 | ||||||||||||||||||
| Other borrowings |
318,668 | 11,215 | 3.52 | 288,863 | 10,914 | 3.78 | ||||||||||||||||||
| Subordinated debentures |
134,017 | 9,150 | 6.83 | 125,824 | 8,554 | 6.80 | ||||||||||||||||||
|
|
|
|
|
|
|
|
|
|||||||||||||||||
| Total interest-bearing liabilities |
6,419,582 | 55,811 | 0.87 | 5,763,558 | 45,289 | 0.79 | ||||||||||||||||||
| Noninterest-bearing liabilities: |
||||||||||||||||||||||||
| Demand deposits |
1,688,405 | 1,407,089 | ||||||||||||||||||||||
| Accrued interest and other liabilities |
70,038 | 65,573 | ||||||||||||||||||||||
|
|
|
|
|
|||||||||||||||||||||
| Total liabilities |
8,178,025 | 7,236,220 | ||||||||||||||||||||||
| Stockholders’ equity |
1,093,604 | 1,038,680 | ||||||||||||||||||||||
|
|
|
|
|
|||||||||||||||||||||
| Total liabilities and stockholders’ equity |
$ | 9,271,629 | $ | 8,274,900 | ||||||||||||||||||||
|
|
|
|
|
|||||||||||||||||||||
| Net interest income/net interest spread |
284,151 | 3.08 | % | 249,088 | 3.10 | % | ||||||||||||||||||
|
|
|
|
|
|||||||||||||||||||||
| Net yield on earning assets/net interest margin |
3.30 | % | 3.29 | % | ||||||||||||||||||||
|
|
|
|
|
|||||||||||||||||||||
| Taxable equivalent adjustment: |
||||||||||||||||||||||||
| Investment securities |
(4,712 | ) | (1,310 | ) | ||||||||||||||||||||
|
|
|
|
|
|||||||||||||||||||||
| Net interest income |
$ | 279,439 | $ | 247,778 | ||||||||||||||||||||
|
|
|
|
|
|||||||||||||||||||||
| (1) | Nonaccrual loans are included in loans, net of unearned income. No adjustment has been made for these loans in the calculation of yields. |
| (2) | Interest income and yields are presented on a taxable equivalent basis using a tax rate of 35%. |
104
Table of Contents
Years Ended December 31, 2015 and 2014
Our net interest income (FTE) for the years ended December 31, 2015 and 2014 was $249.1 million and $255.3 million, respectively, a decrease of $6.2 million. Our net interest margin for the years ended December 31, 2015 and 2014 was 3.29% and 4.06%, respectively, a decrease of 77 basis points driven by lower yield on total loans and higher costs of funds. The yield on our loan portfolio declined 80 basis points to 4.20% for the year ended December 31, 2015 from 5.00% for the year ended December 31, 2014 due to an increase in the volume of our lower yielding originated portfolio and the decline of our higher yielding ACI portfolio. The following table sets forth, on a tax equivalent basis, the components of our net interest income with the effect that the varying levels of interest-earning assets and interest-bearing liabilities and the applicable rates have had on changes in net interest income for the years ended December 31, 2015 and 2014:
| Year Ended December 31, 2015 vs. 2014 | ||||||||||||||||||||
| Net Interest Income | Increase (Decrease) |
Changes Due To(1) | ||||||||||||||||||
| 2015 | 2014 | Rate | Volume | |||||||||||||||||
| (In thousands) | ||||||||||||||||||||
| Increase (decrease) in: |
||||||||||||||||||||
| Income from interest-earning assets: |
||||||||||||||||||||
| Interest and fees on loans: |
||||||||||||||||||||
| Originated and ANCI loans |
$ | 216,422 | $ | 183,286 | $ | 33,136 | $ | (14,275 | ) | $ | 47,411 | |||||||||
| ACI portfolio |
56,012 | 88,092 | (32,080 | ) | (8,472 | ) | (23,608 | ) | ||||||||||||
| Interest on securities: |
||||||||||||||||||||
| Taxable |
14,329 | 12,919 | 1,410 | (529 | ) | 1,939 | ||||||||||||||
| Tax-exempt(2) |
3,743 | 502 | 3,241 | (105 | ) | 3,346 | ||||||||||||||
| Interest on federal funds and short-term investments |
1,564 | 653 | 911 | 726 | 185 | |||||||||||||||
| Interest on other investments |
2,307 | 1,971 | 336 | (62 | ) | 398 | ||||||||||||||
|
|
|
|
|
|
|
|
|
|
|
|||||||||||
| Total interest income |
294,377 | 287,423 | 6,954 | (22,717 | ) | 29,671 | ||||||||||||||
| Expense from interest-bearing liabilities: |
||||||||||||||||||||
| Interest on demand deposits |
12,610 | 9,326 | 3,284 | 997 | 2,287 | |||||||||||||||
| Interest on savings deposits |
443 | 607 | (164 | ) | (46 | ) | (118 | ) | ||||||||||||
| Interest on time deposits |
12,768 | 10,140 | 2,628 | 1,219 | 1,409 | |||||||||||||||
| Interest on other borrowings |
10,914 | 7,593 | 3,321 | (1,904 | ) | 5,225 | ||||||||||||||
| Interest on subordinated debentures |
8,554 | 4,492 | 4,062 | 13 | 4,049 | |||||||||||||||
|
|
|
|
|
|
|
|
|
|
|
|||||||||||
| Total interest expense |
45,289 | 32,158 | 13,131 | 279 | 12,852 | |||||||||||||||
|
|
|
|
|
|
|
|
|
|
|
|||||||||||
| Net interest income |
$ | 249,088 | $ | 255,265 | $ | (6,177 | ) | $ | (22,996 | ) | $ | 16,819 | ||||||||
|
|
|
|
|
|
|
|
|
|
|
|||||||||||
| (1) | The change in interest due to both rate and volume has been allocated to rate and volume changes in proportion to the relationship of the absolute dollar amounts of the changes in each. |
| (2) | Interest income and yields are presented on a tax equivalent basis using a Federal tax rate of 35% on our state, county and municipal investment portfolios. |
105
Table of Contents
Our total interest income in 2015 totaled $294.4 million compared to $287.4 million in 2014. This increase is primarily the result of an increase in the volume of our originated loans offset by declines in the volume and yield of our ACI portfolio. The following table presents a comparison of loan portfolio yield for 2015 to 2014:
| Year Ended | ||||||||||||||||||||||||
| December 31, 2015 | December 31, 2014 | |||||||||||||||||||||||
| Average Balance |
Interest Income |
Yield | Average Balance |
Interest Income |
Yield | |||||||||||||||||||
| (In thousands) | ||||||||||||||||||||||||
| Loans, net of unearned income |
||||||||||||||||||||||||
| Originated loans |
$ | 5,587,886 | $ | 197,395 | 3.53 | % | $ | 4,177,309 | $ | 156,692 | 3.75 | % | ||||||||||||
| ANCI loans |
366,361 | 19,027 | 5.19 | 500,763 | 26,594 | 5.31 | ||||||||||||||||||
| ACI Loans |
533,824 | 56,012 | 10.49 | 752,198 | 88,092 | 11.71 | ||||||||||||||||||
|
|
|
|
|
|
|
|
|
|
|
|
|
|||||||||||||
| Total loans |
$ | 6,488,071 | $ | 272,434 | 4.20 | % | $ | 5,430,270 | $ | 271,378 | 5.00 | % | ||||||||||||
|
|
|
|
|
|
|
|
|
|
|
|
|
|||||||||||||
The yield on our ACI portfolio for the year ended December 31, 2015 was 10.49% compared to 11.71% for the year ended December 31, 2014. During the year ended December 31, 2015, interest income on the ACI portfolio included $10.0 million in remaining discount and recovery income, compared to $21.3 million in the year ended December 31, 2014. These amounts were realized on certain individual loans that were settled before the expected payoff date or where we received amounts above what had been estimated. Excluding these amounts, the yield on our ACI loans would have been 8.62% and 8.88% for the years ended December 31, 2015 and 2014, respectively. Our total loan yield, excluding these amounts, would have been 4.05% and 4.61% for the years ended December 31, 2015 and 2014, respectively.
Our interest expense for the years ended December 31, 2015 and 2014 was $45.3 million and $32.2 million, respectively, an increase of $13.1 million. This increase is primarily related to higher deposit volumes and borrowings. The increase in deposit accounts reflected our strategy to fund loan growth primarily through increases in our core deposit base. The higher debt levels strengthened our liquidity position and improved our regulatory capital ratios. Our cost of deposits increased 4 basis points to 0.48% for the year ended December 31, 2015 from 0.44% for the year ended December 31, 2014. Our total cost of funds on our interest-bearing liabilities increased 11 basis points to 0.79% for the year ended December 31, 2015 from 0.68% for the year ended December 31, 2014.
106
Table of Contents
The following tables depict, on a tax equivalent basis, certain information for each of the years ended December 31, 2015 and December 31, 2014, related to our average balance sheet and our average yields on assets and average costs of liabilities. Such yields are derived by dividing income or expense by the average balance of the corresponding assets or liabilities. Average balances have been calculated on a daily basis, except for ACI loans, which is a monthly average.
| Year Ended December 31, | ||||||||||||||||||||||||
| 2015 | 2014 | |||||||||||||||||||||||
| Average Balance |
Income/ Expense |
Yield/ Rate |
Average Balance |
Income/ Expense |
Yield/ Rate |
|||||||||||||||||||
| (In thousands) | ||||||||||||||||||||||||
| ASSETS |
||||||||||||||||||||||||
| Interest-earning assets: |
||||||||||||||||||||||||
| Loans, net of unearned income(1) |
||||||||||||||||||||||||
| Originated and ANCI loans |
$ | 5,954,247 | $ | 216,422 | 3.63 | % | $ | 4,678,072 | $ | 183,286 | 3.92 | % | ||||||||||||
| ACI portfolio |
533,824 | 56,012 | 10.49 | 752,198 | 88,092 | 11.71 | ||||||||||||||||||
|
|
|
|
|
|
|
|
|
|||||||||||||||||
| Total loans |
6,488,071 | 272,434 | 4.20 | 5,430,270 | 271,378 | 5.00 | ||||||||||||||||||
| Investment securities |
||||||||||||||||||||||||
| Taxable |
590,411 | 14,329 | 2.43 | 510,940 | 12,919 | 2.53 | ||||||||||||||||||
| Tax-exempt(2) |
66,693 | 3,743 | 5.61 | 7,364 | 502 | 6.82 | ||||||||||||||||||
|
|
|
|
|
|
|
|
|
|||||||||||||||||
| Total investment securities |
657,104 | 18,072 | 2.75 | 518,304 | 13,421 | 2.59 | ||||||||||||||||||
| Federal funds sold and short-term investments |
377,558 | 1,564 | 0.41 | 303,886 | 653 | 0.21 | ||||||||||||||||||
| Other investments |
43,259 | 2,307 | 5.33 | 35,850 | 1,970 | 5.50 | ||||||||||||||||||
|
|
|
|
|
|
|
|
|
|||||||||||||||||
| Total interest-earning assets |
7,565,992 | 294,377 | 3.89 | 6,288,310 | 287,422 | 4.57 | ||||||||||||||||||
| Noninterest-earning assets: |
||||||||||||||||||||||||
| Cash and due from banks |
46,233 | 53,225 | ||||||||||||||||||||||
| Premises and equipment |
72,120 | 84,217 | ||||||||||||||||||||||
| Accrued interest and other assets |
649,056 | 668,309 | ||||||||||||||||||||||
| Allowance for credit losses |
(58,501 | ) | (46,870 | ) | ||||||||||||||||||||
|
|
|
|
|
|||||||||||||||||||||
| Total assets |
$ | 8,274,900 | $ | 7,047,191 | ||||||||||||||||||||
|
|
|
|
|
|||||||||||||||||||||
| LIABILITIES AND STOCKHOLDERS’ EQUITY |
||||||||||||||||||||||||
| Interest-bearing liabilities: |
||||||||||||||||||||||||
| Demand deposits |
$ | 3,850,261 | $ | 12,610 | 0.33 | % | $ | 3,131,698 | $ | 9,326 | 0.30 | % | ||||||||||||
| Savings deposits |
201,435 | 443 | 0.22 | 256,427 | 607 | 0.24 | ||||||||||||||||||
| Time deposits |
1,297,175 | 12,768 | 0.98 | 1,146,571 | 10,140 | 0.88 | ||||||||||||||||||
|
|
|
|
|
|
|
|
|
|||||||||||||||||
| Total interest-bearing deposits |
5,348,871 | 25,821 | 0.48 | 4,534,696 | 20,073 | 0.44 | ||||||||||||||||||
| Other borrowings |
288,863 | 10,914 | 3.78 | 158,015 | 7,593 | 4.81 | ||||||||||||||||||
| Subordinated debentures |
125,824 | 8,554 | 6.80 | 66,248 | 4,492 | 6.78 | ||||||||||||||||||
|
|
|
|
|
|
|
|
|
|||||||||||||||||
| Total interest-bearing liabilities |
5,763,558 | 45,289 | 0.79 | 4,758,959 | 32,158 | 0.68 | ||||||||||||||||||
| Noninterest-bearing liabilities: |
||||||||||||||||||||||||
| Demand deposits |
1,407,089 | 1,222,625 | ||||||||||||||||||||||
| Accrued interest and other liabilities |
65,573 | 55,772 | ||||||||||||||||||||||
|
|
|
|
|
|||||||||||||||||||||
| Total liabilities |
7,236,220 | 6,037,356 | ||||||||||||||||||||||
| Stockholders’ equity |
1,038,680 | 1,009,835 | ||||||||||||||||||||||
|
|
|
|
|
|||||||||||||||||||||
| Total liabilities and stockholders’ equity |
$ | 8,274,900 | $ | 7,047,191 | ||||||||||||||||||||
|
|
|
|
|
|||||||||||||||||||||
| Net interest income/net interest spread |
249,088 | 3.10 | % | 255,264 | 3.89 | % | ||||||||||||||||||
|
|
|
|
|
|||||||||||||||||||||
| Net yield on earning assets/ net interest margin |
3.29 | % | 4.06 | % | ||||||||||||||||||||
|
|
|
|
|
|||||||||||||||||||||
| Taxable equivalent adjustment: |
||||||||||||||||||||||||
| Investment securities |
(1,310 | ) | (176 | ) | ||||||||||||||||||||
|
|
|
|
|
|||||||||||||||||||||
| Net interest income |
$ | 247,778 | $ | 255,088 | ||||||||||||||||||||
|
|
|
|
|
|||||||||||||||||||||
| (1) | Nonperforming loans are included in loans, net of unearned income. No adjustment has been made for these loans in the calculation of yields. |
| (2) | Interest income and yields are presented on a tax equivalent basis using a Federal tax rate of 35%. |
107
Table of Contents
Provision for Credit Losses
The provision for credit losses is based on management’s quarterly assessment of the adequacy of our ACL which, in turn, is based on such factors as the composition of our loan portfolio and its inherent risk characteristics, the level of nonperforming loans and net charge-offs, both current and historic, local economic and credit conditions, the direction of collateral values, and regulatory guidelines. The provision for credit losses is charged against earnings in order to maintain our allowance for credit losses, which reflects management’s best estimate of probable losses inherent in our loan portfolio at the balance sheet date (see “—Allowance for Credit Losses”).
Under accounting standards for business combinations, acquired loans are recorded at fair value with no credit loss allowance on the date of acquisition. A provision for credit losses is recorded in periods after the date of acquisition for the emergence of new probable and estimable losses on acquired non-credit impaired (“ANCI”) loans. A provision for credit losses is recognized on our ACI loans after the date of acquisition based on the re-estimation of expected cash flows. See “—Asset Quality” and “—Critical Accounting Policies and Estimates.”
The provision for credit losses totaled $1.7 million and $14.2 million for the three and nine months ended September 30, 2017, compared to $29.6 million and $54.6 million for the three and nine months ended September 30, 2016. The provision for credit losses totaled $49.4 million for the year ended December 31, 2016, compared to $36.0 million and $14.1 million for the years ended December 31, 2015 and 2014, respectively. The following is a summary of our provision for credit losses for the periods indicated presented by originated, ANCI and ACI portfolios:
| Three Months Ended September 30, |
Nine Months Ended September 30, |
Years Ended December 31, |
||||||||||||||||||||||||||
| 2017 | 2016 | 2017 | 2016 | 2016 | 2015 | 2014 | ||||||||||||||||||||||
| (In thousands) | ||||||||||||||||||||||||||||
| Originated Loans |
||||||||||||||||||||||||||||
| Commercial and industrial |
$ | (432 | ) | $ | 29,290 | $ | 8,656 | $ | 53,125 | $ | 46,024 | $ | 36,860 | $ | 15,557 | |||||||||||||
| Commercial real estate |
811 | 57 | 3,564 | 1,765 | 2,378 | 1,791 | 679 | |||||||||||||||||||||
| Consumer |
2,689 | 275 | 3,633 | 1,402 | 1,772 | 1,969 | 1,450 | |||||||||||||||||||||
| Small business |
109 | 99 | 328 | 1,761 | 2,681 | 879 | 789 | |||||||||||||||||||||
|
|
|
|
|
|
|
|
|
|
|
|
|
|
|
|||||||||||||||
| Total originated loans |
3,177 | 29,721 | 16,181 | 58,053 | 52,855 | 41,499 | 18,475 | |||||||||||||||||||||
|
|
|
|
|
|
|
|
|
|
|
|
|
|
|
|||||||||||||||
| ANCI Loans |
||||||||||||||||||||||||||||
| Commercial and industrial |
31 | (33 | ) | 639 | (196 | ) | (169 | ) | 31 | (854 | ) | |||||||||||||||||
| Commercial real estate |
— | (237 | ) | (42 | ) | (211 | ) | (85 | ) | 193 | (148 | ) | ||||||||||||||||
| Consumer |
(154 | ) | 33 | (146 | ) | 188 | 225 | 17 | 1,838 | |||||||||||||||||||
| Small business |
(69 | ) | (47 | ) | (224 | ) | (60 | ) | (10 | ) | 144 | 830 | ||||||||||||||||
|
|
|
|
|
|
|
|
|
|
|
|
|
|
|
|||||||||||||||
| Total ANCI |
(192 | ) | (284 | ) | 227 | (279 | ) | (39 | ) | 385 | 1,666 | |||||||||||||||||
|
|
|
|
|
|
|
|
|
|
|
|
|
|
|
|||||||||||||||
| ACI Loans |
||||||||||||||||||||||||||||
| Commercial and industrial |
278 | (39 | ) | 95 | (2,179 | ) | (2,073 | ) | (1,536 | ) | (1,931 | ) | ||||||||||||||||
| Commercial real estate |
(1,195 | ) | (763 | ) | (877 | ) | (876 | ) | (904 | ) | (966 | ) | (2,901 | ) | ||||||||||||||
| Consumer |
(345 | ) | 992 | (1,416 | ) | (149 | ) | (491 | ) | (3,398 | ) | (1,191 | ) | |||||||||||||||
| Small business |
— | — | — | — | — | — | — | |||||||||||||||||||||
|
|
|
|
|
|
|
|
|
|
|
|
|
|
|
|||||||||||||||
| Total ACI |
(1,262 | ) | 190 | (2,198 | ) | (3,204 | ) | (3,468 | ) | (5,900 | ) | (6,023 | ) | |||||||||||||||
|
|
|
|
|
|
|
|
|
|
|
|
|
|
|
|||||||||||||||
| Total Loans |
||||||||||||||||||||||||||||
| Commercial and industrial |
(123 | ) | 29,218 | 9,390 | 50,750 | 43,782 | 35,355 | 12,772 | ||||||||||||||||||||
| Commercial real estate |
(384 | ) | (943 | ) | 2,645 | 678 | 1,389 | 1,018 | (2,370 | ) | ||||||||||||||||||
| Consumer |
2,190 | 1,300 | 2,071 | 1,441 | 1,506 | (1,412 | ) | 2,097 | ||||||||||||||||||||
| Small business |
40 | 52 | 104 | 1,701 | 2,671 | 1,023 | 1,619 | |||||||||||||||||||||
|
|
|
|
|
|
|
|
|
|
|
|
|
|
|
|||||||||||||||
| Total provision for credit losses |
$ | 1,723 | $ | 29,627 | $ | 14,210 | $ | 54,570 | $ | 49,348 | $ | 35,984 | $ | 14,118 | ||||||||||||||
|
|
|
|
|
|
|
|
|
|
|
|
|
|
|
|||||||||||||||
108
Table of Contents
Our originated loan portfolio is categorized into specific risk segments that are subject to estimated loss rates according to their respective segment and risk rating. The primary driver of the originated ACL is the underlying credit quality of the loans, which have seen credit risk migration trends as the portfolio has become more seasoned and as our energy segments have experienced stress from lower oil and gas prices. We recognized $1.7 million and $14.2 million in provision during the three and nine months ended September 30, 2017, respectively, which included $3.2 million and $16.2 million provision related to the originated portfolio. The $3.2 million and $16.2 million in originated loan provision for the three and nine months ended September 30, 2017 is primarily attributable to loan growth within the originated General C&I and CRE portfolios, an approximately $2.0 million addition to the Consumer provision in the third quarter of 2017 associated with heightened risks surrounding certain of our mortgage loan customers impacted by the hurricanes in the quarter and a $2.6 million charge-off in the Exploration and Production portfolio during the second quarter of 2017.
Two “Category 4” hurricanes moved through our geographic footprint during the quarter. Hurricane Harvey made landfall in Texas in late August and Hurricane Irma hit Florida in early September. Our technology and operations in the affected areas continued to function throughout the storms, and we were able to re-open all but one of our 25 branches in the impacted footprint for regular business hours within days of the storm and with negligible repairs and costs, and all branches are now open. Based on our outreach to and analysis of our commercial customers, most with robust business continuity and disaster recovery plans, we have not identified any expected losses in the commercial portfolio to date. Based on our outreach to and analysis of our mortgage customers in the impacted areas, and in consideration of factors that increase the risks associated with these mortgages, we concluded that increasing reserves by approximately $2.0 million was appropriate as of September 30, 2017. We will continue to closely monitor all of our impacted customers as recovery efforts continue in the area.
We recognized $29.6 million and $54.6 million in provision during the three and nine month periods ended September 30, 2016, respectively. This included $29.7 million and $58.1 million provision, respectively, related to the originated portfolio. Of the $58.1 million in originated loan provision for the nine month period ended September 30, 2016, approximately $34.0 million is attributable to our energy credits which includes an increase in the December 31, 2015 energy credit ACL balance of $4.8 million to $31.9 million and charge-offs of two energy credits totaling $29.2 million. An additional $12.2 million in provision is attributable to a single credit in the healthcare sector. The remaining provision of approximately $11.2 million during the nine-month period ended September 30, 2016 is related to loan growth and normal credit migration.
We recognized $49.4 million in provision during the year ended December 31, 2016, which included $52.9 million provision related to the originated portfolio. Of the $52.9 million in originated loan provision for the year ended December 31, 2016, approximately $29.0 million is attributable to our energy credits which includes a decrease in the December 31, 2016 energy credit ACL balance of $2.6 million to $24.6 million and net charge-offs of two energy credits totaling $31.6 million. The decrease of $2.6 million in the energy ACL resulted primarily from repayments on adversely classified energy credits and the positive migration of adversely classified energy credits that resulted from improvements in oil and gas prices in the latter part of 2016. An additional $12.2 million in provision is attributable to a single credit in the healthcare sector. The remaining provision of approximately $11.7 million is related to loan growth and normal credit migration.
The $36.0 million provision expense recorded for the year ended December 31, 2015 includes $41.5 million on the originated portfolio which is primarily due to credit migration in our energy-related credits.
The provision expense recorded for the year ended December 31, 2014 on the originated portfolio of $18.5 million was due primarily to loan growth and the downgrades of three specific energy-related credits. These downgrades generated approximately $6.19 million in incremental ACL, or 36% of the total annual dollar increase for the originated ACL.
The provision for credit losses (impairment reversal) on our ACI portfolio was $(3.5) million for the year ended December 31, 2016. These amounts are primarily related to changes in credit quality and payments
109
Table of Contents
received in excess of expected cash flows in the C&I and commercial real estate portfolios. The impairment reversal on our ACI portfolio was $(5.9) million for the year ended December 31, 2015. This amount includes impairment reversals primarily on the pay down of residential loans and the payoff of a significant specifically reviewed C&I loan. The impairment reversal on our ACI portfolio was $(6.0) million for the year ended December 31, 2014. This amount includes impairment reversals primarily on residential pools where terms of individual loans to borrowers in these pools were modified which increased the expected cash flows on these loan pools. In addition, we received recoveries on certain specifically reviewed C&I and commercial real estate loans.
Noninterest Income
Noninterest income is a component of our revenue and is comprised primarily of income generated from the services we provide our customers.
Three and Nine Months Ended September 30, 2017 Compared to September 30, 2016
Noninterest income totaled $27.1 million and $74.2 million for the three and nine months ended September 30, 2017, compared to $22.8 million and $66.0 million for the three and nine months ended September 30, 2016. The increase in our service fees and revenue is primarily attributable to investment advisory revenue, trust services income, service charges on deposits, credit-related fees and other service fee revenue.
The following table compares noninterest income for the three and nine months ended September 30, 2017 and 2016:
| Three Months Ended September 30, |
Nine Months Ended September 30, |
|||||||||||||||||||||||
| 2017 | 2016 | % Change | 2017 | 2016 | % Change | |||||||||||||||||||
| (In thousands) | ||||||||||||||||||||||||
| Investment advisory revenue |
$ | 5,283 | $ | 4,733 | 11.6 | % | $ | 15,260 | $ | 13,990 | 9.1 | % | ||||||||||||
| Trust services revenue |
4,613 | 3,959 | 16.5 | 14,428 | 12,000 | 20.2 | ||||||||||||||||||
| Service charges on deposit accounts |
3,920 | 3,555 | 10.3 | 11,519 | 10,179 | 13.2 | ||||||||||||||||||
| Credit-related fees |
3,306 | 2,690 | 22.9 | 8,794 | 7,870 | 11.7 | ||||||||||||||||||
| Insurance revenue |
1,950 | 1,863 | 4.7 | 5,908 | 6,140 | (3.8 | ) | |||||||||||||||||
| Bankcard fees |
1,803 | 1,823 | (1.1 | ) | 5,477 | 5,330 | 2.8 | |||||||||||||||||
| Mortgage banking revenue |
965 | 1,459 | (33.9 | ) | 3,044 | 3,644 | (16.5 | ) | ||||||||||||||||
| Other service fees earned |
1,174 | 797 | 47.3 | 3,217 | 2,263 | 42.2 | ||||||||||||||||||
|
|
|
|
|
|
|
|
|
|
|
|
|
|||||||||||||
| Total service fees and revenue |
23,014 | 20,879 | 10.2 | 67,647 | 61,416 | 10.1 | ||||||||||||||||||
|
|
|
|
|
|
|
|
|
|
|
|
|
|||||||||||||
| Securities gains (losses), net |
1 | 1,386 | NM | (162 | ) | 2,469 | NM | |||||||||||||||||
| Other |
4,109 | 526 | NM | 6,733 | 2,158 | NM | ||||||||||||||||||
|
|
|
|
|
|
|
|
|
|
|
|
|
|||||||||||||
| Total other noninterest income |
4,110 | 1,912 | 115.0 | 6,571 | 4,627 | 42.0 | ||||||||||||||||||
|
|
|
|
|
|
|
|
|
|
|
|
|
|||||||||||||
| Total noninterest income |
$ | 27,124 | $ | 22,791 | 19.0 | % | $ | 74,218 | $ | 66,043 | 12.4 | % | ||||||||||||
|
|
|
|
|
|
|
|
|
|
|
|
|
|||||||||||||
NM—not meaningful.
Investment Advisory Revenue. Our investment advisory revenue is comprised largely of investment management and financial planning revenues generated through our subsidiary Linscomb & Williams, Inc. (“L&W”). The 11.6% and 9.1% increase in investment advisory revenue for the three and nine months ended September 30, 2017, respectively, to $5.3 million and $15.3 million, respectively, was mostly due to growth in assets under management due to both new customer origination and market improvements.
Trust Services Revenue. We earn fees from our customers for trust services. For the three months ended September 30, 2017 and 2016, trust fees totaled $4.6 million and $4.0 million, respectively, an increase of
110
Table of Contents
$0.7 million, or 16.5%. For the nine months ended September 30, 2017 and 2016, trust fees totaled $14.4 million and $12.0 million, respectively, an increase of $2.4 million, or 20.2%. The increase was primarily due to growth in trust assets under management and through customer expansion.
Service Charges on Deposit Accounts. We earn fees from our customers for deposit-related services. For the three months ended September 30, 2017 and 2016, service charges and fees totaled $3.9 million and $3.6 million, which is an increase of 10.3%. For the nine months ended September 30, 2017 and 2016, service charges and fees totaled $11.5 million and $10.2 million, which is an increase of 13.2%. The increase was largely due to an increase in account analysis fees.
Credit-Related Fees. Our credit-related fees include fees related to credit advisory services, unfunded commitment fees and letter of credit fees. For the three and nine months ended September 30, 2017, credit-related fees increased 22.9% and 11.7%, respectively, to $3.3 million and $8.8 million, respectively, compared to $2.7 million and $7.9 million for the three and nine months ended September 30, 2016, primarily as a result of an increase in unfunded commitment, capital market and letter of credit fees.
Insurance Revenue. Our insurance revenue is comprised of insurance commissions generated through our wholly-owned subsidiary, Cadence Insurance. Our insurance revenue was $2.0 million and $5.9 million for the three and nine months ended September 30, 2017 compared to $1.9 million and $6.1 million for the same periods in 2016. The decrease of 3.8%, for the nine months ended September 30, 2017 is the result of lower contingent commissions from insurance carriers and lower commercial premiums.
Bankcard Fees. Our bankcard fees are comprised of automated teller machine (“ATM”) network fees and debit card revenue. Our bankcard fees were $1.8 million and $5.5 million for the three and nine months ended September 30, 2017, respectively. The increase of 2.8% for the nine months ended September 30, 2017 was primarily due to increased volume and customer expansion.
Mortgage Banking Revenue. Our mortgage banking revenue is comprised of mortgage loan sales and servicing income. The decreases of $0.5 million and $0.6 million or 33.9% and 16.5%, for the three and nine months ended September 30, 2017, respectively, were mostly due to lower gains related to decreased volumes.
Other Service Fees. Our other service fees include retail services fees. For the three and nine months ended September 30, 2017, other service fees totaled $1.2 million and $3.2 million, respectively. The increase over the three and nine months ended September 30, 2016 was largely due to an increase in foreign exchange income.
Other Income. The increase in other income for the three and nine months ended September 30, 2017, respectively, compared to the three and nine months ended September 30, 2016 is primarily related to the increase in equity investments in certain limited partnership investments, a one-time $1.1 million gain on the sale of the assets of a specialty insurance unit, partially offset by a decline in the estimated fair value of a net profits interests in oil and gas reserves due to lower forecasted production.
Year Ended December 31, 2016 Compared to December 31, 2015
Noninterest income totaled $88.4 million for the year ended December 31, 2016, compared to $79.9 million for the year ended December 31, 2015. This increase in revenue is attributable to investment advisory revenue, trust services income, service charges on deposits, insurance revenue and security gains.
111
Table of Contents
The following table compares noninterest income for the years ended December 31, 2016 and 2015:
| Year Ended December 31, | ||||||||||||
| 2016 | 2015 | % Change | ||||||||||
| (In thousands) | ||||||||||||
| Investment advisory revenue |
$ | 18,811 | $ | 17,681 | 6.4 | % | ||||||
| Trust services revenue |
16,109 | 15,800 | 2.0 | |||||||||
| Service charges on deposit accounts |
13,793 | 12,464 | 10.7 | |||||||||
| Credit-related fees |
10,729 | 12,495 | (14.1 | ) | ||||||||
| Insurance revenue |
7,717 | 7,107 | 8.6 | |||||||||
| Bankcard fees |
7,270 | 7,213 | 0.8 | |||||||||
| Mortgage banking revenue |
4,663 | 4,384 | 6.4 | |||||||||
| Other service fees earned |
2,884 | 2,293 | 25.8 | |||||||||
|
|
|
|
|
|
|
|||||||
| Total service fees and revenue |
81,976 | 79,437 | 3.2 | |||||||||
|
|
|
|
|
|
|
|||||||
| Securities gains, net |
3,736 | 1,171 | 219.0 | |||||||||
| Other |
2,691 | (705 | ) | NM | ||||||||
|
|
|
|
|
|
|
|||||||
| Total other noninterest income |
6,427 | 466 | NM | |||||||||
|
|
|
|
|
|
|
|||||||
| Total noninterest income |
$ | 88,403 | $ | 79,903 | 10.6 | % | ||||||
|
|
|
|
|
|
|
|||||||
NM—not meaningful.
Investment Advisory Revenue. Our investment advisory revenue is comprised largely of investment management and financial planning revenues generated through our subsidiary L&W. The 6.4% increase in investment advisory revenue for the year ended December 31, 2016, to $18.8 million was primarily due to growth in assets under management.
Trust Services Revenue. We earn fees from our customers for trust services. For the years ended December 31, 2016 and 2015, trust fees totaled $16.1 million and $15.8 million, an increase of $0.3 million, or 2.0%. The increase was primarily due to growth in Trust assets under administration.
Service Charges on Deposit Accounts. We earn fees from our customers for deposit-related services. For the year ended December 31, 2016, service charges and fees totaled $13.8 million, which is an increase of 10.7%, primarily due to an increase in our core deposit base.
Credit-Related Fees. Our credit-related fees primarily include fees related to credit advisory services and unfunded commitment fees. For the year ended December 31, 2016, credit-related fees decreased 14.1% to $10.7 million compared to $12.5 million for the year ended December 31, 2015 primarily as a result of additional capital market and letter of credit fees recognized in 2015.
Insurance Revenue. Our insurance revenue is comprised primarily of insurance commissions generated through our wholly-owned subsidiary, Cadence Insurance. Our insurance revenue of $7.7 million for the year ended December 31, 2016 increased 8.6%, due to increased commission revenue.
Bankcard Fees. Our bankcard fees are comprised primarily of ATM network fees and debit card revenue. Our bankcard fees of $7.3 million for the year ended December 31, 2016 increased 0.8% compared to the same period in 2015 primarily due to increased volume.
Mortgage Banking Revenue. Our mortgage banking revenue is comprised primarily of mortgage loan sales and servicing income. The increase of $0.3 million, or 6.4%, from the year ended December 31, 2015 was primarily due to an increase in net gains from loans originated for sale.
112
Table of Contents
Other Service Fees. Our other service fees primarily include retail services fees. For the year ended December 31, 2016, other service fees totaled $2.9 million, which is an increase over the year ended December 31, 2015. The increase was primarily due to an increase in foreign exchange income.
Year Ended December 31, 2015 Compared to December 31, 2014
Noninterest income totaled $79.9 million for the year ended December 31, 2015, compared to $75.1 million for the year ended December 31, 2014, with service fees and revenue increasing $7.7 million, or 10.7%, to $79.4 million, driven by increases in trust services income, service charges on deposits and credit-related fees. The following table compares noninterest income for the years ended December 31, 2015 and 2014:
| Year Ended December 31, | ||||||||||||
| 2015 | 2014 | % Change | ||||||||||
| (In thousands) | ||||||||||||
| Investment advisory revenue |
$ | 17,681 | $ | 18,052 | (2.1 | )% | ||||||
| Trust services revenue |
15,800 | 14,496 | 9.0 | |||||||||
| Service charges on deposit accounts |
12,464 | 11,674 | 6.8 | |||||||||
| Credit-related fees |
12,495 | 6,161 | 102.8 | |||||||||
| Insurance revenue |
7,107 | 7,237 | (1.8 | ) | ||||||||
| Bankcard fees |
7,213 | 7,667 | (5.9 | ) | ||||||||
| Mortgage banking revenue |
4,384 | 4,435 | (1.1 | ) | ||||||||
| Other service fees earned |
2,293 | 2,021 | 13.5 | |||||||||
|
|
|
|
|
|
|
|||||||
| Total service fees and revenue |
79,437 | 71,743 | 10.7 | |||||||||
|
|
|
|
|
|
|
|||||||
| Securities gains, net |
1,171 | 659 | 77.7 | |||||||||
| Other |
(705 | ) | 2,668 | (126.4 | ) | |||||||
|
|
|
|
|
|
|
|||||||
| Total other noninterest income |
466 | 3,327 | (86.0 | ) | ||||||||
|
|
|
|
|
|
|
|||||||
| Total noninterest income |
$ | 79,903 | $ | 75,070 | 6.4 | % | ||||||
|
|
|
|
|
|
|
|||||||
Investment Advisory Revenue. Our investment advisory revenue is primarily comprised of investment and financial planning revenues generated through our subsidiary L&W. Our investment advisory revenue declined 2.1%, or $0.4 million to $17.7 million as a result of market declines during the period.
Credit-Related Fees. Our credit-related fees primarily include fees related to credit advisory services and unfunded commitment fees. For the year ended December 31, 2015, credit-related fees totaled $12.5 million, an increase of $6.3 million over the year ended December 31, 2014. The increase was primarily due to high overall growth in our lending business.
Trust Services Revenue. We earn fees from our customers for trust services. For the year ended December 31, 2015, trust fees totaled $15.8 million. The increase of $1.3 million, or 9.0%, over the year ended December 31, 2014 was primarily due to growth in Trust assets under administration.
Service Charges on Deposit Accounts. We earn fees from our customers for deposit-related services. For the year ended December 31, 2015, service charges and fees totaled $12.5 million compared to $11.7 million in the prior year. The increase of $0.8 million was due to an increase in sales of treasury management services to our corporate and commercial customers, offset in part by the impact of branch sales during this period.
Insurance Revenue. Our insurance revenue is comprised primarily of insurance commissions generated through our wholly owned subsidiary Cadence Insurance. The decrease in 2015 of $0.1 million, or 1.8%, over the year ended December 31, 2014 was primarily due to a decrease in commission revenue as a result of a slower market.
113
Table of Contents
Bankcard Fees. Our bankcard fees are comprised primarily of ATM network fees and debit card revenue. The decrease of $0.5 million, or 5.9%, over the year ended December 31, 2014 was primarily due to our branch closures.
Mortgage Banking Revenue. Our mortgage loan income is comprised primarily of mortgage loan sales and servicing income and remained flat at $4.4 million for the year ended December 31, 2015 compared to 2014.
Other Service Fees. Our other service fees earned are comprised primarily of retail services fees. For the year ended December 31, 2015, other service fees increased 13.5% to $2.3 million. This increase was due to an increase in foreign exchange income.
Noninterest Expenses
Three and Nine Months Ended September 30, 2017 Compared to September 30, 2016
Noninterest expense was $56.5 million and $167.0 million for the three and nine months ended September 30, 2017, respectively, compared to $54.9 million and $164.8 million for the three and nine months ended September 30, 2016, respectively. The slight increase of $1.7 million and $2.2 million, or 3.0% and 1.3%, respectively, for the three and nine months ended September 30, 2017, compared to the same periods in 2016 reflects our broad efforts to manage expenses.
The following table compares noninterest expense for the three and nine months ended September 30, 2017 and 2016:
| Three Months Ended September 30, |
Nine Months Ended September 30, |
|||||||||||||||||||||||
| 2017 | 2016 | % Change | 2017 | 2016 | % Change | |||||||||||||||||||
| (In thousands) | ||||||||||||||||||||||||
| Noninterest Expenses |
||||||||||||||||||||||||
| Salaries and employee benefits |
$ | 35,007 | $ | 31,086 | 12.6 | % | $ | 103,956 | $ | 96,929 | 7.2 | % | ||||||||||||
| Premises and equipment |
7,419 | 7,130 | 4.1 | 21,292 | 20,507 | 3.8 | ||||||||||||||||||
| Intangible asset amortization |
1,136 | 1,607 | (29.3 | ) | 3,567 | 4,977 | (28.3 | ) | ||||||||||||||||
| Net cost of operation of other real estate owned |
453 | 1,126 | (59.8 | ) | 1,175 | 1,916 | (38.7 | ) | ||||||||||||||||
| Data processing |
1,688 | 1,530 | 10.3 | 5,086 | 4,513 | 12.7 | ||||||||||||||||||
| Special asset expenses |
215 | 391 | (45.0 | ) | 824 | 742 | 11.1 | |||||||||||||||||
| Consulting and professional fees |
2,069 | 2,040 | 1.4 | 4,710 | 4,441 | 6.1 | ||||||||||||||||||
| Loan related expenses |
532 | 1,071 | (50.3 | ) | 1,569 | 2,252 | (30.3 | ) | ||||||||||||||||
| FDIC insurance |
889 | 1,912 | (53.5 | ) | 3,336 | 5,711 | (41.6 | ) | ||||||||||||||||
| Communications |
650 | 535 | 21.5 | 1,980 | 1,915 | 3.4 | ||||||||||||||||||
| Advertising and public relations |
521 | 303 | 71.9 | 1,365 | 1,025 | 33.2 | ||||||||||||||||||
| Legal expenses |
612 | 337 | 81.6 | 1,552 | 2,059 | (24.6 | ) | |||||||||||||||||
| Branch closure expenses |
50 | 52 | (3.8 | ) | 143 | 191 | (25.1 | ) | ||||||||||||||||
| Other |
5,289 | 5,756 | (8.1 | ) | 16,430 | 17,608 | (6.7 | ) | ||||||||||||||||
|
|
|
|
|
|
|
|
|
|
|
|
|
|||||||||||||
| Total |
$ | 56,530 | $ | 54,876 | 3.0 | % | $ | 166,985 | $ | 164,786 | 1.3 | % | ||||||||||||
|
|
|
|
|
|
|
|
|
|
|
|
|
|||||||||||||
Salaries and Employee Benefits. Salaries and employee benefit costs are the largest component of noninterest expense and include employee payroll expense, incentive compensation, health insurance, benefit plans and payroll taxes. Salaries and employee benefits increased $3.9 million and $7.0 million, or 12.6% and 7.2%, for the three and nine months ended September 30, 2017, respectively, compared to 2016, largely due to short and long-term incentive costs as salary expense remained relatively level. The increase in long-term incentive costs is related to achieving higher levels of performance targets and higher corporate valuation; the short-term incentive is related to business growth. The following table provides additional detail of our salaries and employee benefits expense for the periods presented:
114
Table of Contents
| Three Months Ended September 30, |
Nine Months Ended September 30, |
|||||||||||||||
| (In thousands) | 2017 | 2016 | 2017 | 2016 | ||||||||||||
| Salaries and employee benefits |
||||||||||||||||
| Regular compensation |
$ | 20,495 | $ | 19,672 | $ | 61,754 | $ | 60,422 | ||||||||
| Incentive compensation |
10,354 | 7,630 | 27,623 | 22,529 | ||||||||||||
| Taxes and employee benefits |
4,158 | 3,784 | 14,579 | 13,978 | ||||||||||||
|
|
|
|
|
|
|
|
|
|||||||||
| Total salaries and employee benefits |
$ | 35,007 | $ | 31,086 | $ | 103,956 | $ | 96,929 | ||||||||
|
|
|
|
|
|
|
|
|
|||||||||
Premises and Equipment. Rent, depreciation and maintenance costs comprise the majority of premises and equipment expenses, which increased $289 thousand and $785 thousand, or 4.1% and 3.8%, for the three and nine months ended September 30, 2017, respectively, compared to the three and nine months ended September 30, 2016. This increase includes the increase in certain maintenance costs and the effect of a one-time lease termination credit recognized in 2016.
Intangible Asset Amortization. In conjunction with our previous acquisitions, we recorded core deposit and other customer intangible assets of approximately $66.0 million, which are being amortized on an accelerated basis over a seven- to ten-year period.
Net Cost of Operation of Other Real Estate Owned. Net cost of operation of other real estate owned primarily represents our gains (losses) on other real estate owned resulting from the sale or write-down of foreclosed property. During the three and nine months ended September 30, 2017, we had net losses from the sale/write-down of foreclosed properties totaling $0.1 million and $0.4 million, respectively, compared to $0.8 million thousand and $1.3 million for the three and nine months ended September 30, 2016, respectively. Our other costs of operations continue to decline as the volume and complexity of these properties diminishes. See “—Nonperforming Assets” for detail of foreclosed properties as of September 30, 2017.
Data Processing. Data processing expense for our operating systems totaled $1.7 million and $5.1 million for the three and nine months ended September 30, 2017, respectively, compared to $1.5 million and $4.5 million for the three and nine months ended September 30, 2016, an increase of 10.3% and 12.7%, respectively. The increases reflect growth in our business as well as implementations and enhancement of various technologies.
Special Asset Expenses. Special asset expenses include costs related to the management and resolution of our loan portfolio. For the three and nine months ended September 30, 2017, special asset expenses were $215 thousand and $824 thousand, respectively. Our special asset expenses have been steadily declining and while these costs can fluctuate between periods, we expect these expenses to remain low in the foreseeable future.
Consulting and Professional Services. Consulting and professional services expenses include consulting, audit and professional fees paid to external parties. For the three and nine months ended September 30, 2017, our consulting and professional services increased $29 thousand and $269 thousand, respectively, or 1.4% and 6.1%, respectively, compared to the three and nine months ended September 30, 2016 as a result of the engagement of outside consultants related to regulatory compliance and additional costs of being a public company.
Loan-Related Expenses. Loan-related expenses include costs related to maintaining our various loan portfolios. For the three and nine months ended September 30, 2017, our loan-related expenses totaled $0.5 million and $1.6 million, respectively, compared to $1.1 million and $2.3 million for the three and nine months ended September 30, 2016, respectively. The decrease is related to insurance costs on serviced loans and may fluctuate between periods.
FDIC Insurance. We are subject to risk-based assessment fees by the FDIC for deposit insurance. For the three and nine months ended September 30, 2017 and 2016, FDIC insurance expense declined $1.0 million and
115
Table of Contents
$2.4 million, respectively, due to the increase in our levels of capital, and the reduction in our nonperformimg loans and brokered deposits.
Communications. Communications expenses include expenses related to both voice and data communications. During the three and nine months ended September 30, 2017, our communications expenses increased slightly to $0.7 million and $2.0 million from $0.5 million and $1.9 million for the three and nine months ended September 30, 2016, due to an increase in data communications services.
Advertising and Public Relations. Advertising and public relations expenses for the three and nine months ended September 30, 2017 increased $218 thousand and $340 thousand, respectively, or 71.9% and 33.2%, respectively. The increases were driven by overall business growth as well as our initial public offering in April 2017. Our advertising and public relations expenses are seasonal and can fluctuate between quarters.
Legal Expenses. Our legal expenses include fees paid to outside counsel related to general legal matters as well as loan resolutions. For the three months ended September 30, 2017, our legal fees increased $275 thousand, or 81.6% compared to the same period in the prior year related to increased litigation expenses. For the nine months ended September 30, 2017, legal fees decreased $507 thousand, or 24.6%, compared to the same period in the prior year, primarily due to reduced general litigation expenses associated with loan workouts.
Branch Closure Expenses. During 2017 and 2016, we incurred certain trailing costs related to branch closures.
Other. Other expenses include costs for insurance, supplies, education and training, and other operational expenses. For the three and nine months ended September 30, 2017, other noninterest expenses declined 8.1% and 6.7% compared to the three and nine months ended September 30, 2016, respectively.
Year Ended December 31, 2016 Compared to December 31, 2015
Noninterest expense was $220.2 million for the year ended December 31, 2016, compared to $232.3 million for the year ended December 31, 2015. The decrease of $12.1 million, or 5.2%, for the year ended December 31, 2016, compared to the same period in 2015 reflects our initiatives to control costs in all areas of our company. Reductions in salary and employee benefits, premises and equipment, intangible asset amortization, special asset expenses, branch closure expenses and communications were the primary contributors to the cost reductions during 2016.
116
Table of Contents
The following table compares noninterest expense for the years ended December 31, 2016 and 2015:
| Year Ended December 31, | ||||||||||||
| 2016 | 2015 | % Change | ||||||||||
| (In thousands) | ||||||||||||
| Noninterest Expenses |
||||||||||||
| Salaries and employee benefits |
$ | 125,068 | $ | 128,267 | (2.5 | )% | ||||||
| Premises and equipment |
27,982 | 29,781 | (6.0 | ) | ||||||||
| Intangible asset amortization |
6,532 | 8,428 | (22.5 | ) | ||||||||
| Net cost of operation of other real estate owned |
3,033 | 5,238 | (42.1 | ) | ||||||||
| Data processing |
6,280 | 6,092 | 3.1 | |||||||||
| Special asset expenses |
1,788 | 3,000 | (40.4 | ) | ||||||||
| Consulting and professional fees |
6,728 | 5,671 | 18.6 | |||||||||
| Loan related expenses |
3,114 | 3,745 | (16.8 | ) | ||||||||
| FDIC insurance |
7,228 | 5,027 | 43.8 | |||||||||
| Communications |
2,656 | 3,249 | (18.3 | ) | ||||||||
| Advertising and public relations |
1,369 | 2,295 | (40.3 | ) | ||||||||
| Legal expenses |
2,721 | 3,159 | (13.9 | ) | ||||||||
| Branch closure expenses |
238 | 2,074 | (88.5 | ) | ||||||||
| Other |
25,443 | 26,306 | (3.3 | ) | ||||||||
|
|
|
|
|
|
|
|||||||
| Total |
$ | 220,180 | $ | 232,332 | (5.2 | )% | ||||||
|
|
|
|
|
|
|
|||||||
Salaries and Employee Benefits. Salaries and employee benefit costs are the largest component of noninterest expense and include employee payroll expense, incentive compensation, health insurance, benefit plans and payroll taxes. Salaries and employee benefits decreased $3.2 million, or 2.5%, for the year ended December 31, 2016, compared to 2015, largely reflecting the sale of certain retail branches in the first and fourth quarters of 2015.
Premises and Equipment. Rent, depreciation and maintenance costs comprise the majority of occupancy and equipment expenses, which decreased $1.8 million, or 6.0%, for the year ended December 31, 2016, compared to the year ended December 31, 2015, due to the sale of certain retail branches in the first and fourth quarters of 2015.
Intangible Asset Amortization. In conjunction with our acquisitions, we recorded core deposit and other customer intangible assets of approximately $66.0 million, which are being amortized on an accelerated basis over a seven- to ten-year period.
Net Cost of Operation of Other Real Estate Owned. Net cost of operation of other real estate owned primarily represents our gains (losses) on other real estate owned, comprised of activity from the sale or write-down of foreclosed property. During the year ended December 31, 2016, we had net losses from the sale/write-down of foreclosed properties totaling $(2.2) million, compared to $(3.1) million for the year ended December 31, 2015. Our other costs of operations continue to decline as the volume and complexity of these properties diminishes. See “—Nonperforming Assets” for detail of foreclosed properties as of December 31, 2016.
Data Processing. Data processing expense for our operating systems totaled $6.3 million for the year ended December 31, 2016, compared to $6.1 million for the year ended December 31, 2015, an increase of 3.1%, which reflects our efforts to enhance the functionality of the internet banking platform used by our commercial customers.
Special Asset Expenses. Special asset expenses include costs incurred by our special assets group related to the management and resolution of our acquired loan portfolio. For the year ended December 31, 2016, special
117
Table of Contents
asset expenses were $1.8 million, a decrease of 40.4%. Our special asset expenses have been steadily declining and we expect these expenses to remain low in the foreseeable future.
Consulting and Professional Services. Professional services include consulting, audit and professional fees paid to external parties. For the year ended December 31, 2016, our consulting and professional services increased $1.1 million, or 18.6%, compared to the year ended December 31, 2015. This increase is primarily related to an increase in various professional fees.
Loan-Related Expenses. Loan-related expenses include costs primarily for servicing and other costs related to our loan portfolio. For the year ended December 31, 2016, our loan-related expenses totaled $3.1 million, compared to $3.8 million for the year ended December 31, 2015. This decrease is primarily related to loan servicing and other mortgage banking expenses as we moved our residential portfolio from an outside servicer into our internal loan servicing process.
FDIC Insurance. We are subject to risk-based assessment fees by the FDIC for deposit insurance. For the years ended December 31, 2016 and 2015, FDIC insurance expense totaled $7.2 million and $5.0 million, respectively.
Communications. Communications expenses include expenses related to both voice and data communications. For the year ended December 31, 2016, our communications expenses declined $0.6 million, or 18.3%, to $2.7 million from $3.3 million for the year ended December 31, 2015. This decline was the primarily due to the Company’s upgrade of voice and data communication services and branch consolidation.
Advertising and Public Relations. Advertising and public relations expenses for the year ended December 31, 2016 decreased $0.9 million, or 40.3%. Our advertising and public relations expenses are seasonal and can fluctuate between quarters.
Legal Expenses. Our legal expenses include fees paid to outside counsel related to general legal matters as well as loan resolution in the acquired credit impaired loan portfolios. For the year ended December 31, 2016, our legal fees decreased $0.4 million, or 13.9%, compared to the year ended December 31, 2015, primarily due to reduced litigation expenses.
Branch Closure Expenses. During 2016, we incurred certain trailing costs related to branch closures.
Other. These expenses include costs for insurance, supplies, education and training, and other operations. For the year ended December 31, 2016, other noninterest expenses totaled $25.4 million compared to $26.3 million for the year ended December 31, 2015.
Year Ended December 31, 2015 Compared to December 31, 2014
Noninterest expense was $232.3 million for the year ended December 31, 2015, compared to $245.2 million for the year ended December 31, 2014. The decrease of $12.9 million, or 5.2%, for the year ended December 31, 2015 compared to 2014 which reflects our initiatives to control costs in all areas of our Company. Cost reductions in salary and benefits, premises and equipment, intangible asset amortization, communication expenses, professional fees, and special asset expenses were the primary contributors to the decline.
118
Table of Contents
The following table compares noninterest expense for the years ended December 31, 2015 and 2014:
| Year Ended December 31, | ||||||||||||
| 2015 | 2014 | % Change | ||||||||||
| (In thousands) | ||||||||||||
| Noninterest Expenses |
||||||||||||
| Salaries and employee benefits |
$ | 128,267 | $ | 130,617 | (1.8 | )% | ||||||
| Premises and equipment |
29,781 | 32,721 | (9.0 | ) | ||||||||
| Intangible asset amortization |
8,428 | 10,326 | (18.4 | ) | ||||||||
| Net cost of operation of other real estate owned |
5,238 | 1,806 | 190.0 | |||||||||
| Data processing |
6,092 | 6,052 | 0.7 | |||||||||
| Special asset expenses |
3,000 | 5,852 | (48.7 | ) | ||||||||
| Consulting and professional fees |
5,671 | 6,278 | (9.7 | ) | ||||||||
| Loan related expenses |
3,745 | 5,166 | (27.5 | ) | ||||||||
| FDIC insurance |
5,027 | 4,747 | 5.9 | |||||||||
| Communications |
3,249 | 3,768 | (13.8 | ) | ||||||||
| Advertising and public relations |
2,295 | 3,353 | (31.6 | ) | ||||||||
| Legal expenses |
3,159 | 2,501 | 26.3 | |||||||||
| Branch closure expenses |
2,074 | 5,222 | (60.3 | ) | ||||||||
| Other |
26,306 | 26,738 | (1.6 | ) | ||||||||
|
|
|
|
|
|
|
|||||||
| Total |
$ | 232,332 | $ | 245,147 | (5.2 | )% | ||||||
|
|
|
|
|
|
|
|||||||
Salaries and Employee Benefits. Salaries and employee benefit costs are the largest component of noninterest expense and include employee payroll expense, incentive compensation, health insurance, benefit plans and payroll taxes. Salaries and employee benefits decreased by $2.4 million, or 1.8%, for the year ended December 31, 2015 compared to the same period in 2014, largely reflecting the completion of our retail branch consolidation and sales.
Premises and Equipment. Rent, depreciation and maintenance costs comprise the majority of occupancy and equipment expenses, which decreased by $2.9 million, or 9.0%, in the year ended December 31, 2015, compared to the year ended December 31, 2014 primarily due to the closing of several retail branches during 2015.
Intangible Asset Amortization. In conjunction with our acquisitions, we recorded core deposit and other customer intangible assets of approximately $66.0 million, which are being amortized on an accelerated basis over a seven- to ten-year period.
Net Cost of Operation of Other Real Estate Owned. Net cost of operation of other real estate owned primarily represents our gains (losses) on other real estate owned, comprised of activity from the sale or write-down of foreclosed property. During the year ended December 31, 2015, we had net losses from the sale/write-down of foreclosed properties totaling $(3.1) million compared to net gains of $0.1 million for the year ended December 31, 2014.
Data Processing. Data processing expense for our operating systems remained level at $6.1 million for the years ended December 31, 2015 and December 31, 2014.
Special Asset Expenses. Special asset expenses include costs incurred by our special assets group related to the management and resolution of our acquired loan portfolio. For the year ended December 31, 2015, special asset expenses were $3.0 million compared to $5.8 million for the year ended December 31, 2014, a decrease of 48.7%. These costs have continued to decline as we work to reduce this portfolio of assets.
119
Table of Contents
Consulting and Professional Services. Professional services include consulting, audit and professional fees paid to external parties. For the year ended December 31, 2015, our consulting and professional services decreased $0.7 million, or 9.7%, compared to the year ended December 31, 2014, which is primarily related to a decline in consulting fees.
Loan-Related Expenses. Loan-related expenses include costs primarily related to servicing and other costs related to our loan portfolio. For the year ended December 31, 2015, our loan-related expenses decreased $1.4 million, or 27.5%, compared to the year ended December 31, 2014. This decrease is primarily related to loan servicing and other mortgage banking expenses as we moved our residential portfolio from an outside servicer into our internal loan servicing process.
FDIC Insurance. We are subject to risk-based assessment fees by the FDIC for deposit insurance. For the years ended December 31, 2015 and 2014, FDIC insurance expense totaled $5.0 million and $4.7 million, respectively.
Communications. Communications expenses include expenses related to both voice and data communications. For the year ended December 31, 2015, our communications expenses decreased $0.5 million, or 13.8%, compared to the year ended December 31, 2014 primarily due to the Company’s upgrade of voice and data communication services.
Advertising and Public Relations. Advertising and public relations expenses for the years ended December 31, 2015 and 2014 totaled $2.3 million and $3.4 million, respectively. These costs include promotional campaigns supporting the growth of loans and deposits and to increase the awareness of Cadence in the communities that it serves.
Legal Expenses. Our legal expenses include fees paid to outside counsel related to loan resolution in the acquired credit impaired loan portfolios and other legal matters. For the year ended December 31, 2015, our legal fees increased $0.7 million, or 26.3%, compared to the year ended December 31, 2014, due primarily to the resolution of loans.
Branch Closure Expenses. In the fourth quarter of 2014, we closed 17 branches located primarily in Alabama and Florida, and in July 2015, we closed 8 branches in Alabama, Mississippi and Texas. The majority of the branches closed have Cadence offices nearby where our customers can conduct their banking business, and efforts were made to retain these customers through direct contact and by emphasizing our online and mobile banking solutions.
Other. Other expenses include costs for insurance, supplies, education and training, and other operations. For the years ended December 31, 2015 and 2014, other noninterest expenses totaled $26.3 million and $26.7 million, respectively.
Income Tax Expense
Income tax expense for the three and nine months ended September 30, 2017 was $17.5 million and $43.7 million, respectively, compared to $2.1 million and $16.8 million for the three and nine months ended September 30, 2016. The effective tax rate was 34.9% and 33.3% for the three and nine months ended September 30, 2017, respectively, compared to 24.2% and 31.4% for the three and nine months ended September 30, 2016. The increase in the effective tax rate for the three and nine months ended September 30, 2017 compared to the three and nine months ended September 30, 2016 was primarily driven by an increase in income before income taxes.
Income tax expense for the year ended December 31, 2016 was $32.5 million compared to $20.1 million for the year ended December 31, 2015. The effective tax rate was 33.1% for the year ended December 31, 2016 compared to 33.9% for the year ended December 31, 2015. The decrease in the effective tax rate for the year
120
Table of Contents
ended December 31, 2016 compared to the year ended December 31, 2015 was primarily driven by an increase in tax-exempt securities income.
Income tax expense for the year ended December 31, 2015 was $20.1 million compared to $26.1 million for the same period in 2014. The effective tax rate was 33.9% for the year ended December 31, 2015 and 36.8% for the year ended December 31, 2014. The decrease in the effective tax rate for the year ended December 31, 2015 compared to the year ended December 31, 2014 was primarily driven by an increase in tax-exempt securities income. See Note 11 to the Consolidated Financial Statements and “—Critical Accounting Policies and Estimates” for additional disclosures and discussion regarding income taxes.
Our effective tax rate is impacted by pre-tax income, tax-exempt income, and the increase in the cash surrender value of bank-owned life insurance. The effective tax rate is also affected by discrete items that may occur in any given period, but are not consistent from period to period, which may impact the comparability of the effective tax rate between periods.
Financial Condition
The following table summarizes selected components of our balance sheet as of the periods indicated.
| As of September 30, 2017 |
As of December 31, | Average Balance for the | Average Balance for the Year Ended December 31, |
|||||||||||||||||||||||||||||||||
| Three Months Ended September 30, 2017 |
Nine Months Ended September 30, 2017 |
|||||||||||||||||||||||||||||||||||
| 2016 | 2015 | 2014 | 2016 | 2015 | 2014 | |||||||||||||||||||||||||||||||
| (In thousands) |
||||||||||||||||||||||||||||||||||||
| Total assets |
$ | 10,502,261 | $ | 9,530,888 | $ | 8,811,511 | $ | 7,944,804 | $ | 10,024,871 | $ | 9,828,572 | $ | 9,271,629 | $ | 8,274,900 | $ | 7,047,191 | ||||||||||||||||||
| Total interest-earning assets |
9,824,610 | 8,832,706 | 8,047,615 | 7,212,229 | 9,354,321 | 9,152,897 | 8,602,985 | 7,565,992 | 6,288,310 | |||||||||||||||||||||||||||
| Total interest-bearing liabilities |
7,002,191 | 6,507,506 | 6,155,463 | 5,400,819 | 6,641,983 | 6,629,905 | 6,419,582 | 5,763,558 | 4,758,959 | |||||||||||||||||||||||||||
| Short-term and other investments |
575,380 | 242,401 | 384,322 | 457,775 | 317,345 | 330,717 | 415,033 | 420,817 | 339,736 | |||||||||||||||||||||||||||
| Securities available for sale |
1,198,032 | 1,139,347 | 720,810 | 552,397 | 1,169,182 | 1,131,382 | 1,001,317 | 657,104 | 518,304 | |||||||||||||||||||||||||||
| Loans, net of unearned income |
8,028,938 | 7,432,711 | 6,916,520 | 6,192,793 | 7,867,794 | 7,690,798 | 7,186,635 | 6,488,071 | 5,430,270 | |||||||||||||||||||||||||||
| Goodwill |
317,817 | 317,817 | 317,817 | 317,817 | 317,817 | 317,817 | 317,817 | 317,817 | 317,817 | |||||||||||||||||||||||||||
| Noninterest bearing deposits |
2,071,594 | 1,840,955 | 1,534,433 | 1,467,137 | 1,982,784 | 1,895,754 | 1,688,405 | 1,407,089 | 1,222,625 | |||||||||||||||||||||||||||
| Interest bearing deposits |
6,429,508 | 6,175,794 | 5,452,918 | 5,112,752 | 6,157,185 | 6,139,820 | 5,966,897 | 5,348,871 | 4,534,696 | |||||||||||||||||||||||||||
| Borrowings and subordinated debentures |
572,683 | 331,712 | 702,545 | 288,067 | 484,798 | 490,085 | 452,685 | 414,687 | 224,263 | |||||||||||||||||||||||||||
| Shareholders’ equity |
1,340,848 | 1,080,498 | 1,054,208 | 1,014,337 | 1,320,884 | 1,221,845 | 1,093,604 | 1,038,680 | 1,009,835 | |||||||||||||||||||||||||||
Investment Portfolio
Our available-for-sale securities portfolio increased $58.7 million, or 5.2%, to $1.20 billion at September 30, 2017, from $1.14 billion at December 31, 2016. At September 30, 2017, our investment security portfolio was 12.2% of our total interest-earning assets and produced an average taxable equivalent yield of 3.28% and 3.38% for the three and nine months ended September 30, 2017.
121
Table of Contents
The following table sets forth the fair value of the available-for-sale securities at the dates indicated:
Investment Portfolio
| September 30, 2017 |
December 31, | Percent Change | ||||||||||||||||||||||||||
| QE 2017 vs YE 2016 |
2016 vs 2015 |
2015 vs 2014 |
||||||||||||||||||||||||||
| 2016 | 2015 | 2014 | ||||||||||||||||||||||||||
| (In thousands) | ||||||||||||||||||||||||||||
| Investment securities available for sale: |
||||||||||||||||||||||||||||
| U.S. Treasury securities |
$ | 97,688 | $ | 96,785 | $ | — | $ | — | 0.9 | % | 100.0 | % | — | % | ||||||||||||||
| U.S. Agency securities |
84,165 | 97,528 | 90,793 | 28,227 | (13.7 | ) | 7.4 | 221.7 | ||||||||||||||||||||
| Mortgage-backed securities issued or guaranteed by U.S. agencies (MBS): |
||||||||||||||||||||||||||||
| Residential pass-through: |
||||||||||||||||||||||||||||
| Guaranteed by GNMA |
112,535 | 153,153 | 280,190 | 267,944 | (26.5 | ) | (45.3 | ) | 4.6 | |||||||||||||||||||
| Issued by FNMA and FHLMC |
384,042 | 265,328 | 121,707 | 119,830 | 44.7 | 118.0 | 1.6 | |||||||||||||||||||||
| Other residential mortgage-backed securities |
40,568 | 47,561 | 75,577 | 112,415 | (14.7 | ) | (37.1 | ) | (32.8 | ) | ||||||||||||||||||
| Commercial mortgage-backed securities |
60,990 | 62,613 | 24,809 | — | (2.6 | ) | 152.4 | 100.0 | ||||||||||||||||||||
|
|
|
|
|
|
|
|
|
|
|
|
|
|
|
|||||||||||||||
| Total MBS |
598,135 | 528,655 | 502,283 | 500,189 | (13.1 | ) | 5.3 | 0.4 | ||||||||||||||||||||
|
|
|
|
|
|
|
|
|
|
|
|
|
|
|
|||||||||||||||
| State, county and municipal securities |
412,216 | 410,812 | 122,320 | 18,608 | (0.3 | ) | 235.9 | 557.4 | ||||||||||||||||||||
| Other securities |
5,828 | 5,567 | 5,414 | 5,373 | 4.7 | 2.8 | 0.8 | |||||||||||||||||||||
|
|
|
|
|
|
|
|
|
|
|
|
|
|
|
|||||||||||||||
| Total investment securities available for sale |
$ | 1,198,032 | $ | 1,139,347 | $ | 720,810 | $ | 552,397 | 5.2 | % | 58.1 | % | 30.5 | % | ||||||||||||||
|
|
|
|
|
|
|
|
|
|
|
|
|
|
|
|||||||||||||||
See “—Maturity Distribution of Investment Securities,” below for information regarding the contractual maturities and duration of our investment securities portfolio.
122
Table of Contents
The following table summarizes the investment securities with unrealized losses at September 30, 2017 by aggregated major security type and length of time in a continuous unrealized loss position:
| September 30, 2017 | ||||||||||||||||||||||||
| Less than 12 Months | More than 12 Months | Total | ||||||||||||||||||||||
| (In thousands) | Fair Value | Unrealized Losses |
Fair Value | Unrealized Losses |
Fair Value | Unrealized Losses |
||||||||||||||||||
| Temporarily Impaired |
||||||||||||||||||||||||
| U.S. Treasury securities |
$ | — | $ | — | $ | 97,688 | $ | 2,927 | $ | 97,688 | $ | 2,927 | ||||||||||||
| U.S. Agency securities |
138 | — | 25,784 | 103 | 25,922 | 103 | ||||||||||||||||||
| Mortgage-backed securities: |
||||||||||||||||||||||||
| Residential pass-through |
173,854 | 1,922 | 23,190 | 407 | 197,044 | 2,329 | ||||||||||||||||||
| Other residential mortgage-backed securities |
2,896 | 22 | 15,643 | 739 | 18,539 | 761 | ||||||||||||||||||
| Commercial mortgage-backed securities |
41,476 | 2,164 | 19,514 | 1,622 | 60,990 | 3,786 | ||||||||||||||||||
|
|
|
|
|
|
|
|
|
|
|
|
|
|||||||||||||
| Total MBS |
218,226 | 4,108 | 58,347 | 2,768 | 276,573 | 6,876 | ||||||||||||||||||
| State, county and municipal securities |
140,067 | 4,134 | 93,325 | 7,351 | 233,392 | 11,485 | ||||||||||||||||||
| Equity securities |
— | — | 4,313 | 134 | 4,313 | 134 | ||||||||||||||||||
|
|
|
|
|
|
|
|
|
|
|
|
|
|||||||||||||
| Total temporarily impaired securities |
$ | 358,431 | $ | 8,242 | $ | 279,457 | $ | 13,283 | $ | 637,888 | $ | 21,525 | ||||||||||||
|
|
|
|
|
|
|
|
|
|
|
|
|
|||||||||||||
None of the unrealized losses relate to the marketability of the securities or the issuer’s ability to honor redemption of the obligations. We have adequate liquidity, no plans to sell securities and the ability and intent to hold securities to maturity resulting in full recovery of the indicated impairment. Accordingly, the unrealized losses on these securities have been determined to be temporary.
Loan Portfolio
We originate commercial and industrial loans, commercial real estate loans (including construction loans), residential mortgages and other consumer loans. A strong emphasis is placed on the commercial portfolio, consisting of commercial and industrial and commercial real estate loan types, with over 76% of the portfolio residing in these loan types as of September 30, 2017. Our commercial portfolio is further diversified by industry concentration and includes loans to clients in specialized industries, including restaurant, healthcare and technology. Additional commercial lending activities include energy, construction, general corporate loans, business banking and community banking loans. Mortgage, wealth management and retail make up the majority of the consumer portfolio.
123
Table of Contents
The following tables present total loans outstanding by portfolio component and class of financing receivable as of December 31, 2012 through September 30, 2017. The tables below are presented using a risk-based perspective of the loan portfolio. Total loan balances include ANCI loans, originated loans and ACI loans combined. Subsequent tables present the ANCI, ACI and originated loans separately.
| Total Loans | ||||||||||||||||||||||||
| September 30, 2017 |
December 31, 2016 |
December 31, 2015 |
December 31, 2014 |
December 31, 2013 |
December 31, 2012 |
|||||||||||||||||||
| (In thousands) | ||||||||||||||||||||||||
| Commercial and Industrial |
||||||||||||||||||||||||
| General C&I |
$ | 2,620,240 | $ | 2,416,665 | $ | 2,383,348 | $ | 1,935,457 | $ | 1,426,509 | $ | 1,113,357 | ||||||||||||
| Energy sector |
932,981 | 939,369 | 1,067,990 | 1,088,691 | 794,550 | 501,446 | ||||||||||||||||||
| Restaurant industry |
979,735 | 864,085 | 626,197 | 513,368 | 400,981 | 276,652 | ||||||||||||||||||
| Healthcare |
394,345 | 445,103 | 461,903 | 392,731 | 281,405 | 187,713 | ||||||||||||||||||
|
|
|
|
|
|
|
|
|
|
|
|
|
|||||||||||||
| Total commercial and industrial |
4,927,301 | 4,665,222 | 4,539,438 | 3,930,247 | 2,903,445 | 2,079,168 | ||||||||||||||||||
|
|
|
|
|
|
|
|
|
|
|
|
|
|||||||||||||
| Commercial Real Estate |
||||||||||||||||||||||||
| Income producing |
1,145,810 | 1,001,703 | 831,362 | 817,598 | 629,850 | 646,973 | ||||||||||||||||||
| Land and development |
73,107 | 71,004 | 64,546 | 82,974 | 109,111 | 83,641 | ||||||||||||||||||
|
|
|
|
|
|
|
|
|
|
|
|
|
|||||||||||||
| Total commercial real estate |
1,218,917 | 1,072,707 | 895,908 | 900,572 | 738,961 | 730,614 | ||||||||||||||||||
|
|
|
|
|
|
|
|
|
|
|
|
|
|||||||||||||
| Consumer |
||||||||||||||||||||||||
| Residential real estate |
1,616,157 | 1,457,170 | 1,256,850 | 1,166,808 | 1,092,400 | 1,119,967 | ||||||||||||||||||
| Other |
72,326 | 68,689 | 93,293 | 98,331 | 94,926 | 60,340 | ||||||||||||||||||
|
|
|
|
|
|
|
|
|
|
|
|
|
|||||||||||||
| Total consumer |
1,688,483 | 1,525,859 | 1,350,143 | 1,265,139 | 1,187,326 | 1,180,307 | ||||||||||||||||||
|
|
|
|
|
|
|
|
|
|
|
|
|
|||||||||||||
| Small Business Lending |
218,277 | 193,641 | 151,342 | 120,478 | 55,420 | 26,567 | ||||||||||||||||||
|
|
|
|
|
|
|
|
|
|
|
|
|
|||||||||||||
| Total (Gross of Unearned Discount and Fees) |
8,052,978 | 7,457,429 | 6,936,831 | 6,216,436 | 4,885,152 | 4,016,656 | ||||||||||||||||||
|
|
|
|
|
|
|
|
|
|
|
|
|
|||||||||||||
| Unearned Discount and Fees |
(24,040 | ) | (24,718 | ) | (20,311 | ) | (23,643 | ) | (25,912 | ) | (24,280 | ) | ||||||||||||
|
|
|
|
|
|
|
|
|
|
|
|
|
|||||||||||||
| Total (Net of Unearned Discount and Fees) |
$ | 8,028,938 | $ | 7,432,711 | $ | 6,916,520 | $ | 6,192,793 | $ | 4,859,240 | $ | 3,992,376 | ||||||||||||
|
|
|
|
|
|
|
|
|
|
|
|
|
|||||||||||||
| Covered by FDIC Loss Sharing Agreements(1) |
$ | — | $ | — | $ | 189,152 | $ | 329,620 | $ | 468,864 | $ | 665,797 | ||||||||||||
|
|
|
|
|
|
|
|
|
|
|
|
|
|||||||||||||
124
Table of Contents
| Total Originated loans | ||||||||||||||||||||||||
| September 30, 2017 |
December 31, 2016 |
December 31, 2015 |
December 31, 2014 |
December 31, 2013 |
December 31, 2012 |
|||||||||||||||||||
| (In thousands) | ||||||||||||||||||||||||
| Commercial and Industrial |
||||||||||||||||||||||||
| General C&I |
$ | 2,542,261 | $ | 2,337,364 | $ | 2,272,750 | $ | 1,774,372 | $ | 1,183,105 | $ | 656,247 | ||||||||||||
| Energy sector |
932,981 | 939,369 | 1,067,990 | 1,088,682 | 794,227 | 479,728 | ||||||||||||||||||
| Restaurant industry |
979,735 | 864,085 | 626,197 | 513,368 | 395,946 | 265,664 | ||||||||||||||||||
| Healthcare |
385,385 | 434,663 | 446,792 | 376,297 | 249,061 | 144,725 | ||||||||||||||||||
|
|
|
|
|
|
|
|
|
|
|
|
|
|||||||||||||
| Total commercial and industrial |
4,840,362 | 4,575,481 | 4,413,729 | 3,752,719 | 2,622,339 | 1,546,364 | ||||||||||||||||||
|
|
|
|
|
|
|
|
|
|
|
|
|
|||||||||||||
| Commercial Real Estate |
||||||||||||||||||||||||
| Income producing |
1,048,441 | 886,676 | 674,263 | 554,213 | 226,978 | 27,853 | ||||||||||||||||||
| Land and development |
71,597 | 67,555 | 57,239 | 53,894 | 68,302 | 4,031 | ||||||||||||||||||
|
|
|
|
|
|
|
|
|
|
|
|
|
|||||||||||||
| Total commercial real estate |
1,120,038 | 954,231 | 731,502 | 608,107 | 295,280 | 31,884 | ||||||||||||||||||
|
|
|
|
|
|
|
|
|
|
|
|
|
|||||||||||||
| Consumer |
||||||||||||||||||||||||
| Residential real estate |
1,340,724 | 1,125,048 | 830,925 | 587,354 | 369,065 | 140,457 | ||||||||||||||||||
| Other |
67,981 | 59,819 | 84,821 | 81,438 | 76,414 | 28,080 | ||||||||||||||||||
|
|
|
|
|
|
|
|
|
|
|
|
|
|||||||||||||
| Total consumer |
1,408,705 | 1,184,867 | 915,746 | 668,792 | 445,479 | 168,537 | ||||||||||||||||||
|
|
|
|
|
|
|
|
|
|
|
|
|
|||||||||||||
| Small Business Lending |
207,575 | 184,483 | 140,047 | 106,475 | 47,047 | 14,119 | ||||||||||||||||||
|
|
|
|
|
|
|
|
|
|
|
|
|
|||||||||||||
| Total (Gross of Unearned Discount and Fees) |
7,576,680 | 6,899,062 | 6,201,024 | 5,136,093 | 3,410,145 | 1,760,904 | ||||||||||||||||||
|
|
|
|
|
|
|
|
|
|
|
|
|
|||||||||||||
| Unearned Discount and Fees |
(20,545 | ) | (20,417 | ) | (14,559 | ) | (15,866 | ) | (16,509 | ) | (12,010 | ) | ||||||||||||
|
|
|
|
|
|
|
|
|
|
|
|
|
|||||||||||||
| Total (Net of Unearned Discount and Fees) |
$ | 7,556,135 | $ | 6,878,645 | $ | 6,186,465 | $ | 5,120,227 | $ | 3,393,636 | $ | 1,748,894 | ||||||||||||
|
|
|
|
|
|
|
|
|
|
|
|
|
|||||||||||||
| Percent to total loans |
94.11 | % | 92.55 | % | 89.44 | % | 82.68 | % | 69.84 | % | 43.81 | % | ||||||||||||
|
|
|
|
|
|
|
|
|
|
|
|
|
|||||||||||||
125
Table of Contents
| Total ANCI loans | ||||||||||||||||||||||||
| September 30, 2017 |
December 31, 2016 |
December 31, 2015 |
December 31, 2014 |
December 31, 2013 |
December 31, 2012 |
|||||||||||||||||||
| (In thousands) | ||||||||||||||||||||||||
| Commercial and Industrial |
||||||||||||||||||||||||
| General C&I |
$ | 51,876 | $ | 47,592 | $ | 55,320 | $ | 81,808 | $ | 122,631 | $ | 234,584 | ||||||||||||
| Energy sector |
— | — | — | 9 | 323 | 21,718 | ||||||||||||||||||
| Restaurant industry |
— | — | — | — | 2,426 | 8,465 | ||||||||||||||||||
| Healthcare |
2,720 | 4,102 | 8,396 | 9,561 | 14,260 | 24,317 | ||||||||||||||||||
|
|
|
|
|
|
|
|
|
|
|
|
|
|||||||||||||
| Total commercial and industrial |
54,596 | 51,694 | 63,716 | 91,378 | 139,640 | 289,084 | ||||||||||||||||||
|
|
|
|
|
|
|
|
|
|
|
|
|
|||||||||||||
| Commercial Real Estate |
||||||||||||||||||||||||
| Income producing |
14,735 | 18,354 | 27,185 | 52,661 | 87,149 | 147,105 | ||||||||||||||||||
| Land and development |
1,510 | 1,952 | 2,726 | 4,723 | 7,433 | 11,564 | ||||||||||||||||||
|
|
|
|
|
|
|
|
|
|
|
|
|
|||||||||||||
| Total commercial real estate |
16,245 | 20,306 | 29,911 | 57,384 | 94,582 | 158,669 | ||||||||||||||||||
|
|
|
|
|
|
|
|
|
|
|
|
|
|||||||||||||
| Consumer |
||||||||||||||||||||||||
| Residential real estate |
117,801 | 145,747 | 190,794 | 273,222 | 343,370 | 491,861 | ||||||||||||||||||
| Other |
2,948 | 7,180 | 5,947 | 12,705 | 10,985 | 19,870 | ||||||||||||||||||
|
|
|
|
|
|
|
|
|
|
|
|
|
|||||||||||||
| Total consumer |
120,749 | 152,927 | 196,741 | 285,927 | 354,355 | 511,731 | ||||||||||||||||||
|
|
|
|
|
|
|
|
|
|
|
|
|
|||||||||||||
| Small Business Lending |
10,702 | 9,158 | 11,295 | 14,003 | 8,373 | 12,448 | ||||||||||||||||||
|
|
|
|
|
|
|
|
|
|
|
|
|
|||||||||||||
| Total (Gross of Unearned Discount and Fees) |
202,292 | 234,085 | 301,663 | 448,692 | 596,950 | 971,932 | ||||||||||||||||||
|
|
|
|
|
|
|
|
|
|
|
|
|
|||||||||||||
| Unearned Discount and Fees |
(3,495 | ) | (4,301 | ) | (5,752 | ) | (7,777 | ) | (9,403 | ) | (12,270 | ) | ||||||||||||
|
|
|
|
|
|
|
|
|
|
|
|
|
|||||||||||||
| Total (Net of Unearned Discount and Fees) |
$ | 198,797 | $ | 229,784 | $ | 295,911 | $ | 440,915 | $ | 587,547 | $ | 959,662 | ||||||||||||
|
|
|
|
|
|
|
|
|
|
|
|
|
|||||||||||||
| Percent to total loans |
2.48 | % | 3.09 | % | 4.28 | % | 7.12 | % | 12.09 | % | 24.04 | % | ||||||||||||
|
|
|
|
|
|
|
|
|
|
|
|
|
|||||||||||||
126
Table of Contents
| Total ACI loans | ||||||||||||||||||||||||
| September 30, 2017 |
December 31, 2016 |
December 31, 2015 |
December 31, 2014 |
December 31, 2013 |
December 31, 2012 |
|||||||||||||||||||
| (In thousands) | ||||||||||||||||||||||||
| Commercial and Industrial |
||||||||||||||||||||||||
| General C&I(2) |
$ | 26,103 | $ | 31,709 | $ | 55,278 | $ | 79,277 | $ | 120,773 | $ | 222,526 | ||||||||||||
| Energy sector |
— | — | — | — | — | — | ||||||||||||||||||
| Restaurant industry |
— | — | — | — | 2,609 | 2,523 | ||||||||||||||||||
| Healthcare |
6,240 | 6,338 | 6,715 | 6,873 | 18,084 | 18,671 | ||||||||||||||||||
|
|
|
|
|
|
|
|
|
|
|
|
|
|||||||||||||
| Total commercial and industrial |
32,343 | 38,047 | 61,993 | 86,150 | 141,466 | 243,720 | ||||||||||||||||||
|
|
|
|
|
|
|
|
|
|
|
|
|
|||||||||||||
| Commercial Real Estate |
||||||||||||||||||||||||
| Income producing |
82,634 | 96,673 | 129,914 | 210,724 | 315,723 | 472,015 | ||||||||||||||||||
| Non-income producing |
— | 1,497 | 4,581 | 24,357 | 33,376 | 68,046 | ||||||||||||||||||
|
|
|
|
|
|
|
|
|
|
|
|
|
|||||||||||||
| Total commercial real estate |
82,634 | 98,170 | 134,495 | 235,081 | 349,099 | 540,061 | ||||||||||||||||||
|
|
|
|
|
|
|
|
|
|
|
|
|
|||||||||||||
| Consumer |
||||||||||||||||||||||||
| Residential real estate |
157,632 | 186,375 | 235,131 | 306,232 | 379,965 | 487,649 | ||||||||||||||||||
| Other |
1,397 | 1,690 | 2,525 | 4,188 | 7,527 | 12,390 | ||||||||||||||||||
|
|
|
|
|
|
|
|
|
|
|
|
|
|||||||||||||
| Total consumer |
159,029 | 188,065 | 237,656 | 310,420 | 387,492 | 500,039 | ||||||||||||||||||
|
|
|
|
|
|
|
|
|
|
|
|
|
|||||||||||||
| Small Business Lending |
— | — | — | — | — | — | ||||||||||||||||||
| Total (Gross of Unearned Discount and Fees) |
274,006 | 324,282 | 434,144 | 631,651 | 878,057 | 1,283,820 | ||||||||||||||||||
|
|
|
|
|
|
|
|
|
|
|
|
|
|||||||||||||
| Unearned Discount and Fees |
— | — | — | — | — | — | ||||||||||||||||||
|
|
|
|
|
|
|
|
|
|
|
|
|
|||||||||||||
| Total (Net of Unearned Discount and Fees) |
$ | 274,006 | $ | 324,282 | $ | 434,144 | $ | 631,651 | $ | 878,057 | $ | 1,283,820 | ||||||||||||
|
|
|
|
|
|
|
|
|
|
|
|
|
|||||||||||||
| Percent to total loans |
3.41 | % | 4.36 | % | 6.28 | % | 10.20 | % | 18.07 | % | 32.16 | % | ||||||||||||
|
|
|
|
|
|
|
|
|
|
|
|
|
|||||||||||||
| (1) | As of December 31, 2012, we had submitted to the FDIC under our loss sharing agreements in respect of the Superior transaction claims in excess of the first loss threshold of $347 million and had been reimbursed the 80% of the covered losses by the FDIC up to this initial threshold. Subsequent claims between $347 million and $504 million are not reimbursable under the loss share agreement. On January 5, 2016 a settlement agreement was finalized with the FDIC to end the loss share agreement at a nominal cost and we had no indemnification asset recorded as December 31, 2015. |
| (2) | This category for ACI loans includes all pooled commercial and industrial loans, which may contain certain energy, restaurant industry, healthcare or services loan types. |
Commercial and Industrial. C&I loans increased by $262.1 million, or 5.6%, from December 31, 2016 to September 30, 2017, $387.9 million, or 8.5%, since December 31, 2015, and $997.1 million, or 25.4%, since December 31, 2014. C&I loans represented 61.2% of our total loan portfolio at September 30, 2017, compared to 62.6% of total loans at December 31, 2016, 65.4% of total loans at December 31, 2015 and 63.2% of total loans at December 31, 2014. During the first quarter of 2016, we reclassifed, and subsequently sold, $297 million in commercial loans to held for sale, of which $144 million was related to our Memphis commercial lending business and $153 million related to our convenience and gas loan portfolio. This Memphis loan sale was completed in the first quarter of 2016 and the convenience and gas sale was completed in the second quarter of 2016 with no significant gains or losses recognized on either transaction. Both of these loan sales were executed as a result of product/line of business profitability analyses.
127
Table of Contents
Approximately half of the originated commercial loan portfolio (combining C&I and CRE) consists of shared national credits, which vary by industry and geography. These transactions are generally relationship-based and have the potential for ancillary business. As of September 30, 2017, 91% of the shared national credit portfolio, or $2.8 billion, resides in the commercial and industrial segment of the loan portfolio, on a loan balance basis. As of September 30, 2017, the largest category of shared national credits is the Energy sector, representing 25% of the shared national credits portfolio, or $757 million as of September 30, 2017 compared to 29% of the shared national credits portfolio, or $782 million as of December 31, 2016. The next largest category of shared national credits is the Restaurant industry at 24% of all shared national credits, or $744 million, as of September 30, 2017, compared to 24% and $663 million as of December 31, 2016. The remaining amount of the shared national credit portfolio can be found in the services, healthcare and other categories and, to a lesser amount, the CRE segment of the loan portfolio. Additionally, all shared national credits are part of the originated loan portfolio.
A significant percentage, by ending principal balance, of our shared national credits customers are located within Texas at 42%, with the remaining in Alabama (7%), Florida (8%), Colorado (5%), California (5%) and all other states (33%).
Our C&I loan growth reflects our strategic focus on this broad loan category. We seek further diversification within C&I loans by industry to mitigate concentration risk in any one industry and/or risk type. Our specialized industries are significant drivers of the growth and diversification of this portion of our loan portfolio. Energy and specialized industries lending have experienced teams with extensive knowledge on their particular industry, allowing for quality underwriting and relationship-based lending.
General C&I. As of September 30, 2017 our general C&I category included the following types of loans: finance and insurance (18%), professional services (11%), real estate (9%) commodities excluding energy (8%), manufacturing (7%), transportation (7%), media and telecom (8%) and other (32%). Average general C&I loan size was $6.2 million as of September 30, 2017. Generally C&I loans typically provide working capital, equipment financing and financing for expansion and are generally secured by assignments of corporate assets including accounts receivable, inventory and/or equipment.
128
Table of Contents
Energy. Energy lending is an important part of our business and our energy team is comprised of experienced lenders with significant product expertise and long-standing relationships. Additionally, energy production and energy related industries are substantial contributors to the economies in the Houston metropolitan area and the state of Texas. As of September 30, 2017, energy loans outstanding totaled $933.0 million, or 11.6% of total loans compared to $939 million, or 12.6% as of December 31, 2016 with an average outstanding loan size of $10.6 million. We strive for a rigorous and thorough approach to energy underwriting and credit monitoring. As a result of the stress on oil and gas prices during the periods reported we have experienced downgrades, increased loan provisions and certain losses in the energy sector loans. As of September 30, 2017 we had an allowance for credit losses of $23.2 million for our energy loans, or 2.49% of the energy portfolio compared to $24.6 million, or 2.61% as of December 31, 2016. (See “—Provision for Credit Losses” and “—Allowance for Credit Losses”). As of September 30, 2017, we had $82.0 million of nonperforming energy credits, of which more than 85% were current with their contractual terms compared to $113.4 million of nonperforming energy credits as of December 31, 2016. In addition, 17.3% of the energy portfolio was criticized or classified as of September 30, 2017 compared to 28.8% at December 31, 2016. We recorded recoveries of $519 thousand and charge-offs of $2.6 million on our energy portfolio during the nine months ended September 30, 2017. As presented in the following table our energy lending business is comprised of three areas: Exploration and Production (“E&P”), Midstream and Energy Services:
| Energy Sector | As of September 30, 2017 | |||||||||||||||||||||||||||||||
| September 30, 2017 |
December 31, 2016 |
December 31, 2015 |
December 31, 2014 |
December 31, 2013 |
December 31, 2012 |
Unfunded Commitments |
Criticized/ Classified |
|||||||||||||||||||||||||
| (In thousands) | ||||||||||||||||||||||||||||||||
| Outstanding Balance |
||||||||||||||||||||||||||||||||
| E&P |
$ | 294,953 | $ | 371,870 | $ | 520,798 | $ | 563,123 | $ | 462,959 | $ | 256,001 | $ | 166,977 | $ | 116,760 | ||||||||||||||||
| Midstream |
558,187 | 472,053 | 414,720 | 334,737 | 205,241 | 116,913 | 467,023 | 7,886 | ||||||||||||||||||||||||
| Energy Services |
79,841 | 95,446 | 132,472 | 190,822 | 126,027 | 106,814 | 57,607 | 36,786 | ||||||||||||||||||||||||
|
|
|
|
|
|
|
|
|
|
|
|
|
|
|
|
|
|||||||||||||||||
| Total energy sector |
$ | 932,981 | $ | 939,369 | $ | 1,067,990 | $ | 1,088,682 | $ | 794,227 | $ | 479,728 | $ | 691,607 | $ | 161,432 | ||||||||||||||||
|
|
|
|
|
|
|
|
|
|
|
|
|
|
|
|
|
|||||||||||||||||
| Percent of total loans |
11.6 | % | 12.6 | % | 15.4 | % | 17.5 | % | 16.3 | % | 11.9 | % | ||||||||||||||||||||
|
|
|
|
|
|
|
|
|
|
|
|
|
|||||||||||||||||||||
| Allocated ACL |
||||||||||||||||||||||||||||||||
| E&P |
$ | 19,040 | $ | 13,018 | $ | 22,218 | $ | 2,544 | $ | 1,005 | $ | 886 | ||||||||||||||||||||
| Midstream |
1,476 | 5,878 | 2,402 | 1,856 | 616 | 557 | ||||||||||||||||||||||||||
| Energy Services |
2,695 | 5,657 | 2,481 | 7,626 | 1,653 | 1,420 | ||||||||||||||||||||||||||
|
|
|
|
|
|
|
|
|
|
|
|
|
|||||||||||||||||||||
| Total |
$ | 23,211 | $ | 24,553 | $ | 27,101 | $ | 12,026 | $ | 3,274 | $ | 2,863 | ||||||||||||||||||||
|
|
|
|
|
|
|
|
|
|
|
|
|
|||||||||||||||||||||
| ACL as a Percentage of Outstanding Balances |
||||||||||||||||||||||||||||||||
| E&P |
6.46 | % | 3.50 | % | 4.27 | % | 0.45 | % | 0.22 | % | 0.35 | % | ||||||||||||||||||||
| Midstream |
0.26 | 1.25 | 0.58 | 0.55 | 0.30 | 0.48 | ||||||||||||||||||||||||||
| Energy Services |
3.38 | 5.93 | 1.87 | 4.00 | 1.31 | 1.33 | ||||||||||||||||||||||||||
|
|
|
|
|
|
|
|
|
|
|
|
|
|||||||||||||||||||||
| Total |
2.49 | % | 2.61 | % | 2.54 | % | 1.10 | % | 0.41 | % | 0.60 | % | ||||||||||||||||||||
|
|
|
|
|
|
|
|
|
|
|
|
|
|||||||||||||||||||||
E&P loans outstanding totaled $295.0 million and comprised approximately 31.6% of outstanding energy loans as of September 30, 2017 compared to $371.9 million, or 40% of outstanding energy loans as of December 31, 2016. E&P customers are primarily businesses that derive a majority of their revenues from the sale of oil and gas and whose credit needs require technical evaluation of oil and gas reserves. Emphasis for E&P is on high quality, independent producers with proven track records. Our E&P credit underwriting includes a combination of well-by-well analyses, frequent updates to our pricing decks and engaging energy engineers to actively monitor the portfolio and provide credit redeterminations, at a minimum, every six months. At least quarterly, and more frequently during periods of higher commodity price volatility, we adjust the base and sensitivity price decks on which we value our clients’ oil and gas reserves. Generally, we seek to follow the shape of the NYMEX strips for oil and natural gas, but at a discount to the strip. In periods of higher commodity prices, our discount from the strip is higher whereas in lower price periods our discount is lower. The price decks utilized in our engineering analysis are approved by our senior credit risk management committee. Borrowing base redeterminations occur every spring and fall, with the spring redeterminations
129
Table of Contents
completed prior to the end of the second quarter and fall determinations completed prior to the end of the fourth quarter. E&P unfunded commitments totaled $167.0 million as of September 30, 2017, or 64% of the outstanding balance to total unfunded commitments. Throughout the oil and gas downturn, a majority of our current clients raised outside capital, equitized a portion of their debt, and/or monetized some or all of their assets. Proceeds from these transactions were used to reduce debt, pre-fund capital programs, and/or to bolster their liquidity positions. We believe that our clients’ access to outside public and private capital to date has generally been good. In addition, the acquisitions and divestitures markets generally appear to continue to be open and available to our clients.
Midstream loans outstanding totaled $558.2 million and comprised approximately 59.8% of outstanding energy loans as of September 30, 2017 compared to $472.1 million, or approximately 50% of outstanding energy loans as of December 31, 2016. Midstream lending is generally to customers who handle the gathering, treating and processing, storage or transportation of oil and gas. These customers’ businesses are generally less price sensitive than other energy segments given the nature of their fee-based revenue streams. Underwriting guidelines for the Midstream portfolio generally require a first lien on all assets as collateral.
Energy Services loans outstanding totaled $79.8 million and comprised approximately 8.6% of outstanding energy as of September 30, 2017 compared to $95.4 million, or approximately 10% of outstanding energy loans, as of December 31, 2016. Energy Services lending targets oilfield service companies that provide equipment and services used in the exploration for and extraction of oil and natural gas. Customers consist of a wide variety of businesses, including production equipment manufacturers, chemical sales, water transfer, rig equipment and other early and late stage services companies. The Company expects that additions to the Energy Services portfolio in the current environment would be on a limited basis, with any new loans primarily issued for short-term working capital facilities.
Specialized lending. The following table includes our specialized lending portfolio as of the dates presented:
| Originated C&I Loans—Specialized Industries | ||||||||||||||||||||||||||||
| September 30, 2017 |
December 31, 2016 |
December 31, 2015 |
December 31, 2014 |
December 31, 2013 |
December 31, 2012 |
Unfunded Commitments |
||||||||||||||||||||||
| (In thousands) | ||||||||||||||||||||||||||||
| Specialized Industries |
||||||||||||||||||||||||||||
| Restaurant industry |
$ | 979,735 | $ | 864,085 | $ | 626,197 | $ | 513,368 | $ | 395,946 | $ | 265,664 | $ | 255,558 | ||||||||||||||
| Healthcare |
385,385 | 434,663 | 446,792 | 376,297 | 249,061 | 144,725 | 164,365 | |||||||||||||||||||||
| Technology |
332,614 | 218,162 | 145,944 | 215,156 | 19,127 | — | 71,905 | |||||||||||||||||||||
|
|
|
|
|
|
|
|
|
|
|
|
|
|
|
|||||||||||||||
| Total specialized industries |
$ | 1,697,734 | $ | 1,516,910 | $ | 1,218,933 | $ | 1,104,821 | $ | 664,134 | $ | 410,389 | $ | 491,828 | ||||||||||||||
|
|
|
|
|
|
|
|
|
|
|
|
|
|
|
|||||||||||||||
Restaurant industry and healthcare are the largest components of our specialized industries. For these industries we focus on larger corporate clients, who are typically well-known within the industry. The client coverage for both of these components is national in scope, given the size and capital needs of the majority of the clients. Additionally, in the restaurant sector we focus on major franchisees and the operating companies of “branded” restaurant concepts. Our healthcare portfolio focuses on middle market healthcare providers with diversified payer mix, while our technology portfolio focuses on the technology sub-segments of software and services, network and communications infrastructure, and internet and mobility applications. Given these customer profiles, we frequently participate in such credits with two or more banks through syndication. As of September 30, 2017, average loan sizes were $11.6 million for restaurant industry, $4.8 million for healthcare and $10.4 million for technology.
130
Table of Contents
Commercial Real Estate. Commercial real estate (“CRE”) loans increased by $146.2 million, or 13.6%, since December 31, 2016, as compared to $323.0 million, or 19.7%, since December 31, 2015 and $318.3 million, or 35.3%, since December 31, 2014. CRE loans represented 15.1% of our total loan portfolio at September 30, 2017, compared to 14.4% of total loans at December 31, 2016, 12.9% of total loans at December 31, 2015 and 14.5% of total loans at December 31, 2014. As of September 30, 2017, the average CRE loan size was $3.0 million. Commercial construction loans primarily reside in the Income Producing segment of CRE. Income Producing CRE includes non-owner occupied loans secured by commercial real estate, regardless of the phase of the loan (construction vs completed). All owner occupied CRE loans reside in the various C&I segments in which the underlying risk exists. All REITS and income producing types are included in the Income Producing CRE segment. Our CRE lending team is a group of experienced relationship managers focusing on construction and income producing property lending which generally have property and sponsors located in our geographic footprint. Following the Superior, Cadence and Encore acquisitions, we actively reduced this acquired portfolio over the past five years. We will continue to make CRE loans going forward, with attention on high credit quality and requirement for high equity ownership in the projects for originated loans. CRE loans are secured by a variety of property types, including multi-family dwellings, office buildings, industrial properties and retail facilities. This will be managed and monitored using concentration levels that are considered appropriate by management and the Board of Directors. As of September 30, 2017, the CRE loan types included multifamily (24%), office buildings (24%), retail (12%), industrial (7%), REIT (8%), A&D (1%), residential (6%) and other (18%).
Consumer. Consumer loans increased by $162.6 million, or 10.7%, from December 2016 to September 30, 2017, by $338.3 million, or 25.1%, from December 31, 2015 to September 30, 2017, and by $423.3 million, or 33.5%, from December 31, 2014 to September 30, 2017. Consumer loans represent 21.0% of total loans at September 30, 2017, compared to 20.5% of total loans at December 31, 2016, 19.5% of total loans at December 31, 2015 and 20.3% of total loans at December 31, 2014. We originate residential real estate mortgages that are held for investment as well as held for sale in the secondary market. Approximately 16.6% of the consumer portfolio relates to acquired portfolios compared to 22% as of December 31, 2016. New residential mortgage origination growth is primarily first mortgage real estate loans targeted to be in Texas going forward. Our originated consumer loan portfolio totaled $1.4 billion as of September 30, 2017, an increase of $223.8 million or 18.9% from December 31, 2016, an increase of $493.0 million or 53.8% from December 31, 2015 and an increase of $739.9 million or 110.6% since December 31, 2014. These loans typically carry a higher interest rate than loans within our C&I and CRE portfolios.
Small Business. Small Business loans increased by $24.6 million, or 12.7% from December 31, 2016 to September 30, 2017, $66.9 million, or 44.2% from December 31, 2015 to September 30, 2017 and $97.8 million, or 81.2% from December 31, 2014 to September 30, 2017. Small business loans represent 2.7% of the total loan portfolio at September 30, 2017, compared to 2.6% of total loans at December 31, 2016, 2.2% of total loans at December 31, 2015 and 1.9% of total loans as of December 31, 2014. The small business category is now defined as all commercial loans with a transactional exposure of $1.5 million or less and relationship exposure of $2.0 million or less. The limit was increased in the second quarter of 2014 from commercial loans with an exposure of $1.0 million or less. These loans are centrally underwritten in the Cadence Loan Center, using defined underwriting standards that are applied consistently throughout the category.
Concentrations of Credit. Our concentrations of credit are closely and consistently monitored by the Company. Individual concentration limits are assessed and established, as needed, on a quarterly basis and measured as a percentage of risk-based capital. All concentrations greater than 25% of risk-based capital require a concentration limit, which is monitored and reported to the board of directors on at least a quarterly basis. In addition to the loans categorized in the loan portfolio section, we manage concentration limits for leveraged loans, technology loans, specialty chemical, and non-specialized enterprise value loans.
We evaluate the appropriateness of our underwriting standards in response to changes in national and regional economic conditions, including energy prices, interest rates, real estate values, and employment levels.
131
Table of Contents
Underwriting standards and credit monitoring activities are assessed and enhanced in response to changes in these conditions.
FDIC Indemnification. As part of our acquisition of the Superior franchise from the FDIC, we entered loss sharing agreements with the FDIC. Under the agreements, the FDIC was obligated to reimburse us for losses with respect to covered assets beginning with the first dollar of loss incurred at 80% on the first $347 million in covered losses, 0% on the losses between $347 million and $504 million, and then 80% of losses in excess of $504 million. The loss sharing agreements consisted of a single-family shared-loss agreement and a commercial and other loans shared-loss agreement. The single family shared-loss agreement provided for FDIC loss sharing and reimbursement to us for recoveries to the FDIC for ten years from April 15, 2011 for single-family residential loans. On January 5, 2016 a settlement agreement was finalized with the FDIC to end the loss share agreements at a nominal cost and we had no indemnification asset recorded as of December 31, 2015.
Asset Quality
We focus on asset quality strength through robust underwriting, proactive monitoring and reporting of the loan portfolio and collaboration between the lines of business, credit administration and risk management.
Credit risk is governed and reported up to the board of directors primarily through our senior credit risk management committee. The senior credit risk management committee reviews credit portfolio management information such as problem loans, delinquencies, concentrations of credit, asset quality trends, portfolio analysis, policy updates and changes, and other relevant information. Further, both senior loan committee and credit transition committee, the primary channels for credit approvals, report up through senior credit risk management committee. The senior loan committee generally approves all loans with relationship exposure greater than $5 million. Dual signature authority is utilized for loan approvals below the $5 million threshold. Additionally, the credit transition committee manages all material credit actions for classified credits greater than $5 million. Our board of directors receives information concerning asset quality measurements and trends on at least a quarterly basis if not more frequently. While we continue to proactively monitor the loan portfolio, external factors, such as an economic downturn, can lead to negative consequences such as lowered earnings and unemployment leading to the inability to make loan payments.
Credit policies have been established for each type of lending activity in which we engage, with a particular focus given to the commercial side of the Bank. Polices are evaluated and updated as needed based on changes in guidance and regulations as well as business needs of the Bank.
Each loan’s creditworthiness is assessed and assigned a risk rating, based on both the borrower strength as well as the collateral protection of the loan. Each risk rating takes into account the probability of default as well as loss given default. Risk rating accuracy and reporting are critical tools for monitoring the portfolio as well as determining the allowance for credit losses. Assigned risk ratings are periodically reviewed for accuracy and adjusted as appropriate for all relationships greater than $2.5 million.
Acquired Loans. Loans acquired in acquisitions are initially recorded at fair value with no carryover of the related allowance for credit losses. The fair value of the loans is determined using market participant assumptions in estimating the amount and timing of principal and interest cash flows initially expected to be collected on the loans and discounting those cash flows at an appropriate market rate of interest.
Under the accounting model for acquired loans, the excess of cash flows expected to be collected over the carrying amount of the loans, referred to as the “accretable yield,” is accreted into interest income over the life of the loans using the effective yield method. Accordingly, acquired loans are not subject to classification as nonaccrual in the same manner as originated loans. Rather, acquired loans are considered to be accruing loans because their interest income relates to the accretable yield recognized and not to contractual interest payments. However, if the timing or amount of the expected cash flows cannot be reasonably estimated an ACI loan may be
132
Table of Contents
placed in nonaccruing status. The excess of an ACI loan’s contractually required payments over the cash flows expected to be collected is the nonaccretable difference. As such, charge-offs on acquired loans are first applied to the nonaccretable difference and then to any related allowance for credit losses recognized subsequent to the acquisition. A decrease in expected cash flows in subsequent periods may indicate that the ACI loan pool or specifically reviewed loan is impaired, which would require the establishment of an allowance for credit losses by a charge to the provision for credit losses.
Select asset quality metrics presented below distinguish between the originated, ANCI and ACI portfolios.
Nonperforming Assets. Nonperforming assets (“NPAs”) primarily consist of nonperforming loans and property acquired through foreclosures or repossession (or other real estate owned or “OREO”). The following tables present nonperforming assets and additional asset quality data for the dates indicated:
| As of September 30, 2017 | ||||||||||||||||
| (Recorded Investment in thousands) | Originated | ANCI | ACI | Total | ||||||||||||
| Nonperforming loans (“NPLs”): |
||||||||||||||||
| Commercial and industrial |
$ | 72,219 | $ | — | $ | — | $ | 72,219 | ||||||||
| Commercial real estate |
— | 300 | 225 | 525 | ||||||||||||
| Consumer |
1,101 | 2,588 | — | 3,689 | ||||||||||||
| Small business |
312 | 514 | — | 826 | ||||||||||||
|
|
|
|
|
|
|
|
|
|||||||||
| Total NPLs |
73,632 | 3,402 | 225 | 77,259 | ||||||||||||
| OREO acquired in foreclosure and other NPAs |
26,270 | 408 | 17,815 | 44,493 | ||||||||||||
|
|
|
|
|
|
|
|
|
|||||||||
| Total NPAs |
$ | 99,902 | $ | 3,810 | $ | 18,040 | $ | 121,752 | ||||||||
|
|
|
|
|
|
|
|
|
|||||||||
| NPLs as a percentage of total loans |
0.92 | % | 0.04 | % | 0.00 | % | 0.96 | % | ||||||||
|
|
|
|
|
|
|
|
|
|||||||||
| NPLs as a percentage of portfolio |
0.97 | % | 1.71 | % | 0.08 | % | ||||||||||
|
|
|
|
|
|
|
|||||||||||
| NPAs as a percentage of loans plus OREO/other NPAs |
1.24 | % | 0.05 | % | 0.22 | % | 1.51 | % | ||||||||
|
|
|
|
|
|
|
|
|
|||||||||
| NPAs as a percentage of portfolio plus OREO/other NPAs |
1.32 | % | 1.91 | % | 6.18 | % | ||||||||||
|
|
|
|
|
|
|
|||||||||||
| NPAs as a percentage of total assets |
0.95 | % | 0.04 | % | 0.17 | % | 1.16 | % | ||||||||
|
|
|
|
|
|
|
|
|
|||||||||
| Accruing 90 days or more past due |
$ | 41 | $ | 197 | $ | 18,856 | $ | 19,094 | ||||||||
|
|
|
|
|
|
|
|
|
|||||||||
133
Table of Contents
| As of December 31, 2016 | ||||||||||||||||
| (Recorded Investment in thousands) | Originated | ANCI | ACI | Total | ||||||||||||
| NPLs: |
||||||||||||||||
| Commercial and industrial |
$ | 120,473 | $ | 125 | $ | 1,818 | $ | 122,416 | ||||||||
| Commercial real estate |
— | 341 | 1,845 | 2,186 | ||||||||||||
| Consumer |
798 | 2,732 | — | 3,530 | ||||||||||||
| Small business |
132 | 673 | — | 805 | ||||||||||||
|
|
|
|
|
|
|
|
|
|||||||||
| Total NPLs |
121,403 | 3,871 | 3,663 | 128,937 | ||||||||||||
| OREO acquired in foreclosure and other NPAs |
19,425 | 127 | 17,679 | 37,231 | ||||||||||||
|
|
|
|
|
|
|
|
|
|||||||||
| Total NPAs |
$ | 140,828 | $ | 3,998 | $ | 21,342 | $ | 166,168 | ||||||||
|
|
|
|
|
|
|
|
|
|||||||||
| NPLs as a percentage of total loans |
1.63 | % | 0.05 | % | 0.05 | % | 1.73 | % | ||||||||
|
|
|
|
|
|
|
|
|
|||||||||
| NPLs as a percentage of portfolio |
1.76 | % | 1.68 | % | 1.13 | % | ||||||||||
|
|
|
|
|
|
|
|||||||||||
| NPAs as a percentage of loans plus OREO/other NPAs |
1.89 | % | 0.05 | % | 0.29 | % | 2.22 | % | ||||||||
|
|
|
|
|
|
|
|
|
|||||||||
| NPAs as a percentage of portfolio plus OREO/other NPAs |
2.04 | % | 1.74 | % | 6.24 | % | ||||||||||
|
|
|
|
|
|
|
|||||||||||
| NPAs as a percentage of total assets |
1.48 | % | 0.04 | % | 0.22 | % | 1.74 | % | ||||||||
|
|
|
|
|
|
|
|
|
|||||||||
| Accruing 90 days or more past due |
$ | 331 | $ | 255 | $ | 18,364 | $ | 18,950 | ||||||||
|
|
|
|
|
|
|
|
|
|||||||||
| As of December 31, 2015 | ||||||||||||||||
| (Recorded Investment in thousands) | Originated | ANCI | ACI | Total | ||||||||||||
| NPLs: |
||||||||||||||||
| Commercial and industrial |
$ | 54,974 | $ | 50 | $ | 8,210 | $ | 63,234 | ||||||||
| Commercial real estate |
66 | — | 2,856 | 2,922 | ||||||||||||
| Consumer |
108 | 2,737 | — | 2,845 | ||||||||||||
| Small business |
90 | 744 | — | 834 | ||||||||||||
|
|
|
|
|
|
|
|
|
|||||||||
| Total NPLs |
55,238 | 3,531 | 11,066 | 69,835 | ||||||||||||
| OREO acquired in foreclosure and other NPAs |
— | 1,544 | 31,428 | 32,972 | ||||||||||||
|
|
|
|
|
|
|
|
|
|||||||||
| Total NPAs |
$ | 55,238 | $ | 5,075 | $ | 42,494 | $ | 102,807 | ||||||||
|
|
|
|
|
|
|
|
|
|||||||||
| NPLs as a percentage of total loans |
0.80 | % | 0.05 | % | 0.16 | % | 1.01 | % | ||||||||
|
|
|
|
|
|
|
|
|
|||||||||
| NPLs as a percentage of portfolio |
0.89 | % | 1.19 | % | 2.55 | % | ||||||||||
|
|
|
|
|
|
|
|||||||||||
| NPAs as a percentage of loans plus OREO/other NPAs |
0.79 | % | 0.07 | % | 0.61 | % | 1.48 | % | ||||||||
|
|
|
|
|
|
|
|
|
|||||||||
| NPAs as a percentage of portfolio plus OREO/other NPAs |
0.89 | % | 1.71 | % | 9.13 | % | ||||||||||
|
|
|
|
|
|
|
|||||||||||
| NPAs as a percentage of total assets |
0.63 | % | 0.06 | % | 0.48 | % | 1.17 | % | ||||||||
|
|
|
|
|
|
|
|
|
|||||||||
| Accruing 90 days or more past due |
$ | 378 | $ | 1,068 | $ | 24,655 | $ | 26,101 | ||||||||
|
|
|
|
|
|
|
|
|
|||||||||
134
Table of Contents
| As of December 31, 2014 | ||||||||||||||||
| (Recorded Investment in thousands) | Originated | ANCI | ACI | Total | ||||||||||||
| NPLs: |
||||||||||||||||
| Commercial and industrial |
$ | 6,182 | $ | 70 | $ | 8,210 | $ | 14,462 | ||||||||
| Commercial real estate |
2 | 25 | 5,506 | 5,533 | ||||||||||||
| Consumer |
174 | 3,754 | — | 3,928 | ||||||||||||
| Small business |
110 | 334 | — | 444 | ||||||||||||
|
|
|
|
|
|
|
|
|
|||||||||
| Total NPLs |
6,468 | 4,183 | 13,716 | 24,367 | ||||||||||||
| OREO acquired in foreclosure and other NPAs |
— | 2,565 | 44,895 | 47,460 | ||||||||||||
|
|
|
|
|
|
|
|
|
|||||||||
| Total NPAs |
$ | 6,468 | $ | 6,748 | $ | 58,611 | $ | 71,827 | ||||||||
|
|
|
|
|
|
|
|
|
|||||||||
| NPLs as a percentage of total loans |
0.10 | % | 0.07 | % | 0.22 | % | 0.39 | % | ||||||||
|
|
|
|
|
|
|
|
|
|||||||||
| NPLs as a percentage of portfolio |
0.13 | % | 0.93 | % | 2.17 | % | ||||||||||
|
|
|
|
|
|
|
|||||||||||
| NPAs as a percentage of loans plus OREO/other NPAs |
0.10 | % | 0.11 | % | 0.94 | % | 1.15 | % | ||||||||
|
|
|
|
|
|
|
|
|
|||||||||
| NPAs as a percentage of portfolio plus OREO/other NPAs |
0.13 | % | 1.52 | % | 8.66 | % | ||||||||||
|
|
|
|
|
|
|
|||||||||||
| NPAs as a percentage of total assets |
0.08 | % | 0.08 | % | 0.74 | % | 0.90 | % | ||||||||
|
|
|
|
|
|
|
|
|
|||||||||
| Accruing 90 days or more past due |
$ | 324 | $ | 205 | $ | 53,041 | $ | 53,570 | ||||||||
|
|
|
|
|
|
|
|
|
|||||||||
Nonperforming Loans. Commercial loans, including small business loans, are generally placed on nonaccrual status when principal or interest is past due 90 days or more unless the loan is well secured and in the process of collection, or when the loan is specifically determined to be impaired. When a commercial loan is placed on nonaccrual status, interest accrued but not received is generally reversed against interest income.
Consumer loans, including residential first and second lien loans secured by real estate, are generally placed on nonaccrual status when they are 120 or more days past due. When a consumer loan is placed on nonaccrual status, interest accrued but not received is generally reversed against interest income.
Generally, cash receipts on nonperforming loans are used to reduce principal rather than recorded as interest income. Past due status is determined based upon contractual terms. A nonaccrual loan may be returned to accrual status when repayment is reasonably assured and there has been demonstrated performance under the terms of the loan or, if applicable, under the terms of the restructured loan. For the three and nine months ended September 30, 2017, approximately $2.1 million and $6.9 million, respectively, of contractual interest accrued on nonperforming loans was not recognized in earnings; however, approximately $0.4 million and $1.4 million, respectively, of contractual interest received was recognized on the cash basis. For the year ended December 31, 2016, approximately $8.2 million of contractual interest accrued on nonperforming loans was not recognized in earnings; however, approximately $1.1 million of contractual interest received was recognized on the cash basis.
Our nonperforming loans have decreased to 0.96% of our loan portfolio as of September 30, 2017 compared to 1.73% of our loan portfolio as of December 31, 2016, with the decrease primarily due to energy credits within our originated portfolio. As of September 30, 2017, we had $82.0 million in energy credits considered nonperforming, of which more than 85% were current under their contractual terms (see “Potential Problem Loans” below). Included in the $82 million as of September 30, 2017 is a $9.9 million nonperforming energy credit that was reclassified as held-for-sale (“HFS”) during the third quarter of 2017 and is being carried at lower of cost or market value (“LOCOM”). Because this credit was reclassified to HFS it has not been included in our loan portfolio held-for-investment ratios in order for these ratios to be comparable to prior periods. However, this HFS nonaccrual E&P was included in the table above as part of our other NPAs (see—Originated Nonperforming Assets below).
135
Table of Contents
During early 2016, banking regulators revised their definition of nonaccrual for E&P loans as it relates to leverage, including second-lien debt, in which we do not participate. As a result it has affected the nonaccrual status of certain loans in that portfolio. The following table includes our originated nonperforming loans and assets for the periods presented.
| As of | ||||||||||||||||||||||||
| September 30, 2017 |
December 31, 2016 |
December 31, 2015 |
December 31, 2014 |
December 31, 2013 |
December 31, 2012 |
|||||||||||||||||||
| (Recorded Investment in thousands) | ||||||||||||||||||||||||
| NPLs: |
||||||||||||||||||||||||
| Commercial and industrial |
||||||||||||||||||||||||
| Energy—E&P |
$ | 57,739 | $ | 95,453 | $ | 36,361 | $ | — | $ | — | $ | — | ||||||||||||
| —Midstream |
7,886 | 10,689 | 1,580 | — | — | — | ||||||||||||||||||
| —Service |
6,402 | 7,242 | 9,818 | 6,182 | 1,910 | — | ||||||||||||||||||
| Other commercial |
193 | 7,089 | 7,215 | — | 99 | 28 | ||||||||||||||||||
| Commercial real estate |
— | — | 66 | 2 | 28 | 47 | ||||||||||||||||||
| Consumer |
1,101 | 798 | 108 | 174 | 145 | 22 | ||||||||||||||||||
| Small business |
311 | 132 | 90 | 110 | 26 | 48 | ||||||||||||||||||
|
|
|
|
|
|
|
|
|
|
|
|
|
|||||||||||||
| Total NPLs—originated portfolio |
73,632 | 121,403 | 55,238 | 6,468 | 2,208 | 145 | ||||||||||||||||||
| E&P—net profits interests |
16,193 | 19,425 | — | — | — | — | ||||||||||||||||||
| Foreclosed OREO |
140 | — | — | — | — | — | ||||||||||||||||||
| Originated E&P loan transferred to HFS |
9,937 | — | — | — | — | — | ||||||||||||||||||
|
|
|
|
|
|
|
|
|
|
|
|
|
|||||||||||||
| Total nonperforming assets (“NPAs”)—originated portfolio |
$ | 99,902 | $ | 140,828 | $ | 55,238 | $ | 6,468 | $ | 2,208 | $ | 145 | ||||||||||||
|
|
|
|
|
|
|
|
|
|
|
|
|
|||||||||||||
| NPLs as a percentage of total loans |
0.91 | % | 1.63 | % | 0.80 | % | 0.10 | % | 0.05 | % | 0.00 | % | ||||||||||||
|
|
|
|
|
|
|
|
|
|
|
|
|
|||||||||||||
Other Real Estate Owned. Other real estate owned consists of properties acquired through foreclosure and unutilized bank-owned properties. These properties, as held for sale properties, are initially recorded at fair value, less estimated costs to sell, on the date of foreclosure (establishing a new cost basis for the property). Subsequent to the foreclosure date the OREO is maintained at the lower of cost or fair value. Any write-down to fair value required at the time of foreclosure is charged to the allowance for credit losses. Subsequent gains or losses on other real estate owned resulting from either the sale of the property or additional valuation allowances required due to further declines in fair value are reported in other noninterest expense.
The balance of foreclosed OREO was $18.8 million as of September 30, 2017 compared to $18.9 million as of December 31, 2016, with 94.6% related to foreclosures resulting from our ACI loan portfolio. Approximately 24.0% of our foreclosed OREO, or $4.5 million , is comprised of single-family residential properties located in Alabama and Florida. OREO also included a $6.7 million tract of undeveloped timber land in Florida and $1.2 million commercial office complex in Florida we foreclosed in the second quarter of 2017. As of September 30, 2017 and December 31, 2016, there had been no additions to OREO resulting from foreclosure or repossession from a shared national credit. However, we did receive during the second and fourth quarters of 2016, $19.1 million in net profits interests (“NPIs”) in certain oil and gas reserves related to energy credit bankruptcies related to two energy portfolio shared national credits that were charged-off in 2016. We recorded the NPIs at estimated fair value using a discounted cash flow analysis applied to the expected cash flows from the producing developed wells. These NPIs are considered financial instruments and recorded at fair value and are subject to the volatility of oil and gas prices and other operational factors outside of our control. The balance of the NPIs was $16.2 million as of September 30, 2017 compared to $19.4 million as of December 31, 2016.
136
Table of Contents
The decrease was primarily attributable to a decline in the estimated fair value due to lower production forecasts for one of the NPIs. The following tables present the balances of our OREO and NPIs as of the dates indicated:
| September 30, 2017 | ||||||||||||||||||||
| Originated | ANCI | ACI | Other | Total | ||||||||||||||||
| (In thousands) | ||||||||||||||||||||
| Acquired through foreclosure |
||||||||||||||||||||
| Land |
$ | — | $ | 140 | $ | 8,288 | $ | — | $ | 8,428 | ||||||||||
| Residential property |
140 | 245 | 4,250 | — | 4,635 | |||||||||||||||
| Commercial property |
— | 23 | 5,277 | — | 5,300 | |||||||||||||||
|
|
|
|
|
|
|
|
|
|
|
|||||||||||
| Total foreclosed OREO |
140 | 408 | 17,815 | — | 18,363 | |||||||||||||||
| Unutilized bank-owned properties |
||||||||||||||||||||
| Land |
— | — | — | 473 | 473 | |||||||||||||||
|
|
|
|
|
|
|
|
|
|
|
|||||||||||
| Total unutilized bank owned property |
— | — | — | 473 | 473 | |||||||||||||||
|
|
|
|
|
|
|
|
|
|
|
|||||||||||
| Total OREO |
140 | 408 | 17,815 | 473 | 18,836 | |||||||||||||||
|
|
|
|
|
|
|
|
|
|
|
|||||||||||
| Other assets—net profits interests |
26,130 | — | — | — | 26,130 | |||||||||||||||
|
|
|
|
|
|
|
|
|
|
|
|||||||||||
| Total OREO and other assets |
$ | 26,270 | $ | 408 | $ | 17,815 | $ | 473 | $ | 44,966 | ||||||||||
|
|
|
|
|
|
|
|
|
|
|
|||||||||||
| As of December 31, 2016 | ||||||||||||||||||||
| Originated | ANCI | ACI | Other | Total | ||||||||||||||||
| (In thousands) | ||||||||||||||||||||
| Acquired through foreclosure |
||||||||||||||||||||
| Land |
$ | — | $ | — | $ | 10,183 | $ | — | $ | 10,183 | ||||||||||
| Residential property |
97 | 104 | 4,937 | — | 5,138 | |||||||||||||||
| Commercial property |
— | 23 | 2,559 | — | 2,582 | |||||||||||||||
|
|
|
|
|
|
|
|
|
|
|
|||||||||||
| Total foreclosed OREO |
97 | 127 | 17,679 | — | 17,903 | |||||||||||||||
| Unutilized bank-owned properties |
||||||||||||||||||||
| Land |
— | — | — | 756 | 756 | |||||||||||||||
| Commercial property |
— | — | — | 216 | 216 | |||||||||||||||
|
|
|
|
|
|
|
|
|
|
|
|||||||||||
| Total unutilized bank-owned property |
— | — | — | 972 | 972 | |||||||||||||||
|
|
|
|
|
|
|
|
|
|
|
|||||||||||
| Total OREO |
97 | 127 | 17,679 | 972 | 18,875 | |||||||||||||||
|
|
|
|
|
|
|
|
|
|
|
|||||||||||
| Other asset—net profits interests |
19,425 | — | — | — | 19,425 | |||||||||||||||
|
|
|
|
|
|
|
|
|
|
|
|||||||||||
| Total OREO and other asset |
$ | 19,522 | $ | 127 | $ | 17,679 | $ | 972 | $ | 38,300 | ||||||||||
|
|
|
|
|
|
|
|
|
|
|
|||||||||||
137
Table of Contents
| As of December 31, 2015 | ||||||||||||||||
| ANCI | ACI | Other | Total | |||||||||||||
| (In thousands) | ||||||||||||||||
| Acquired through foreclosure |
||||||||||||||||
| Land |
$ | 187 | $ | 7,282 | $ | — | $ | 7,469 | ||||||||
| Residential property |
1,334 | 12,429 | — | 13,763 | ||||||||||||
| Commercial property |
23 | 11,717 | — | 11,740 | ||||||||||||
|
|
|
|
|
|
|
|
|
|||||||||
| Total foreclosed OREO |
1,544 | 31,428 | — | 32,972 | ||||||||||||
| Unutilized bank-owned properties |
||||||||||||||||
| Commercial property |
— | — | 3,012 | 3,012 | ||||||||||||
|
|
|
|
|
|
|
|
|
|||||||||
| Total OREO |
$ | 1,544 | $ | 31,428 | $ | 3,012 | $ | 35,984 | ||||||||
|
|
|
|
|
|
|
|
|
|||||||||
| As of December 31, 2014 | ||||||||||||||||
| ANCI | ACI | Other | Total | |||||||||||||
| (In thousands) | ||||||||||||||||
| Acquired through foreclosure |
||||||||||||||||
| Land |
$ | 199 | $ | 8,236 | $ | — | $ | 8,435 | ||||||||
| Residential property |
2,325 | 18,672 | — | 20,997 | ||||||||||||
| Commercial property |
41 | 17,987 | — | 18,028 | ||||||||||||
|
|
|
|
|
|
|
|
|
|||||||||
| Total foreclosed OREO |
2,565 | 44,895 | — | 47,460 | ||||||||||||
| Unutilized bank-owned properties |
||||||||||||||||
| Land |
— | — | 45 | 45 | ||||||||||||
| Commercial property |
— | — | 8,481 | 8,481 | ||||||||||||
|
|
|
|
|
|
|
|
|
|||||||||
| Total unutilized bank-owned property |
— | — | 8,526 | 8,526 | ||||||||||||
|
|
|
|
|
|
|
|
|
|||||||||
| Total OREO |
$ | 2,565 | $ | 44,895 | $ | 8,526 | $ | 55,986 | ||||||||
|
|
|
|
|
|
|
|
|
|||||||||
|
|
|
|
|
|
|
|
|
|||||||||
Past Due 90 Days and Accruing. We classify certain loans with principal or interest past due 90 days or more as accruing loans if those loans are well secured and in the process of collection, or are specifically determined to be impaired as accruing loans. The bulk of the accruing 90 days or more past due loans reside in the ACI portfolio, of which approximately half consists of single family residential loans, the bulk of which are located in Florida and Alabama, with the remainder consisting of commercial real estate loans. These loans are monitored on a weekly basis by both the lines of business and credit administration. As of September 30, 2017 and December 31, 2016, 2015 and 2014, there were no shared national credits that were 90 days or more past due and accruing.
Troubled Debt Restructuring. We attempt to work with borrowers when necessary to extend or modify loan terms to better align with the borrower’s ability to repay. Extensions and modifications to loans are made in accordance with internal policies and guidelines which conform to regulatory guidance. Each occurrence is unique to the borrower and is evaluated separately. The Bank considers regulatory guidelines when restructuring loans to ensure that prudent lending practices are followed. Qualifying criteria and payment terms are structured by the borrower’s current and prospective ability to comply with the modified terms of the loan.
A modification is classified as a troubled debt restructuring (a “TDR”) if the borrower is experiencing financial difficulty and it is determined that we have granted a concession to the borrower. We may determine that a borrower is experiencing financial difficulty if the borrower is currently in default on any of its debt, or if it is probable that a borrower may default in the foreseeable future without the modification. Concessions could include reductions of interest rates, extension of the maturity date at a rate lower than the current market rate for a new loan with similar risk, reduction of accrued interest, principal forgiveness, forbearance, or other
138
Table of Contents
concessions. The assessments of whether a borrower is experiencing or will likely experience financial difficulty and whether a concession has been granted is highly subjective in nature, and management’s judgment is required when determining whether a modification is classified as a TDR.
All TDRs are reported as impaired. An impaired classification may be removed if the borrower demonstrates compliance with the modified terms and the restructuring agreement specifies an interest rate equal to that which would be provided to a borrower with similar credit at the time of restructuring. Nonperforming loans and impaired loans have unique definitions. Some loans may be included in both categories, whereas other loans may only be included in one category. As of September 30, 2017 there were 5 shared national credit borrowers that were considered TDRs, totaling $32.3 million. As of December 31, 2016 there were 6 shared national credit borrowers that were considered TDRs, totaling $44.5 million. As of December 31, 2015 there were two shared national credit borrowers that were considered TDRs, totaling $14.7 million. As of December 31, 2014, there were no shared national credits that were considered TDRs. The following table summarizes our TDR activity for the three and nine months ended September 30, 2017 and 2016, and the years ended December 31, 2016, 2015 and 2014:
ANCI Loans and Originated Loans that were modified into TDRs
| For the Three Months Ended September 30, 2017 |
For the Three Months Ended September 30, 2016 |
|||||||||||||||||||||||||||||||
| Loans Modified into TDRs During the Period |
TDRs Experiencing Payment Default(1) during the Period |
Loans Modified into TDRs During the Period |
TDRs Experiencing Payment Default(1) during the Period |
|||||||||||||||||||||||||||||
| (Dollars in thousands) | Number of TDRs |
Recorded Investment |
Number of TDRs |
Recorded Investment |
Number of TDRs |
Recorded Investment |
Number of TDRs |
Recorded Investment |
||||||||||||||||||||||||
| Commercial and Industrial |
||||||||||||||||||||||||||||||||
| General C&I |
— | $ | — | — | $ | — | 1 | $ | 7,896 | — | $ | — | ||||||||||||||||||||
| Energy Sector |
— | — | — | — | 3 | 29,107 | — | — | ||||||||||||||||||||||||
|
|
|
|
|
|
|
|
|
|
|
|
|
|
|
|
|
|||||||||||||||||
| Total Commercial and Industrial |
— | — | — | — | 4 | 37,003 | — | — | ||||||||||||||||||||||||
| Consumer |
||||||||||||||||||||||||||||||||
|
|
|
|
|
|
|
|
|
|
|
|
|
|
|
|
|
|||||||||||||||||
| Other |
1 | 285 | ||||||||||||||||||||||||||||||
|
|
|
|
|
|
|
|
|
|
|
|
|
|
|
|
|
|||||||||||||||||
| Total |
1 | $ | 285 | — | $ | — | 4 | $ | 37,003 | — | $ | — | ||||||||||||||||||||
|
|
|
|
|
|
|
|
|
|
|
|
|
|
|
|
|
|||||||||||||||||
139
Table of Contents
| For the Nine Months Ended September 30, 2017 | For the Nine Months Ended September 30, 2016 | |||||||||||||||||||||||||||||||
| Loans Modified into TDRs During the Period |
TDRs Experiencing Payment Default(1) during the Period |
Loans Modified into TDRs During the Period |
TDRs Experiencing Payment Default(1) during the Period |
|||||||||||||||||||||||||||||
| (Dollars in thousands) | Number of TDRs |
Recorded Investment |
Number of TDRs |
Recorded Investment |
Number of TDRs |
Recorded Investment |
Number of TDRs |
Recorded Investment |
||||||||||||||||||||||||
| Commercial and Industrial |
||||||||||||||||||||||||||||||||
| General C&I |
1 | $ | 193 | — | $ | — | 1 | $ | 7,896 | — | $ | — | ||||||||||||||||||||
| Energy sector |
— | — | — | — | 4 | 35,945 | — | — | ||||||||||||||||||||||||
|
|
|
|
|
|
|
|
|
|
|
|
|
|
|
|
|
|||||||||||||||||
| Total commercial and industrial |
1 | 193 | — | — | 5 | 43,841 | — | — | ||||||||||||||||||||||||
| Consumer |
||||||||||||||||||||||||||||||||
| Residential real estate |
1 | 462 | — | — | 1 | 336 | — | — | ||||||||||||||||||||||||
| Other |
1 | 285 | — | — | 1 | 184 | — | — | ||||||||||||||||||||||||
|
|
|
|
|
|
|
|
|
|
|
|
|
|
|
|
|
|||||||||||||||||
| Total Consumer |
2 | 747 | — | — | 2 | 520 | — | — | ||||||||||||||||||||||||
|
|
|
|
|
|
|
|
|
|
|
|
|
|
|
|
|
|||||||||||||||||
| Small Business Lending |
1 | 145 | — | — | — | — | — | — | ||||||||||||||||||||||||
|
|
|
|
|
|
|
|
|
|
|
|
|
|
|
|
|
|||||||||||||||||
| Total |
4 | $ | 1,085 | — | $ | — | 7 | $ | 44,361 | — | $ | — | ||||||||||||||||||||
|
|
|
|
|
|
|
|
|
|
|
|
|
|
|
|
|
|||||||||||||||||
| For the Year Ended December 31, 2016 | ||||||||||||||||
| Loans Modified into TDRs During the Period |
TDRs Experiencing Payment Default(1) during the Period |
|||||||||||||||
| (Dollars in thousands) | Number of TDRs |
Recorded Investment |
Number of TDRs |
Recorded Investment |
||||||||||||
| Commercial and Industrial |
||||||||||||||||
| General C&I |
1 | $ | 5,496 | — | — | |||||||||||
| Energy sector |
5 | 38,113 | — | — | ||||||||||||
|
|
|
|
|
|
|
|
|
|||||||||
| Total commercial and industrial |
6 | 43,609 | — | — | ||||||||||||
|
|
|
|
|
|
|
|
|
|||||||||
| Consumer |
||||||||||||||||
| Residential real estate |
1 | 334 | — | — | ||||||||||||
| Other |
1 | 200 | — | — | ||||||||||||
|
|
|
|
|
|
|
|
|
|||||||||
| Total commercial and industrial |
2 | 534 | — | — | ||||||||||||
|
|
|
|
|
|
|
|
|
|||||||||
| Small Business Lending |
1 | 552 | — | — | ||||||||||||
|
|
|
|
|
|
|
|
|
|||||||||
| Total |
9 | $ | 44,695 | — | $ | — | ||||||||||
|
|
|
|
|
|
|
|
|
|||||||||
| (1) | Default is defined as the earlier of the troubled debt restructuring being placed on non-accrual status or obtaining 90 day past due status with respect to principal and/or interest payments. |
140
Table of Contents
| For the Year Ended December 31, 2015 | For the Year Ended December 31, 2014 | |||||||||||||||||||||||||||||||
| Loans Modified into TDRs During the Period |
TDRs Experiencing Payment Default(1) During the Period |
Loans Modified into TDRs During the Period |
TDRs Experiencing Payment Default(1) During the Period |
|||||||||||||||||||||||||||||
| (Dollars in thousands) | Number of TDRs |
Recorded Investment |
Number of TDRs |
Recorded Investment |
Number of TDRs |
Recorded Investment |
Number of TDRs |
Recorded Investment |
||||||||||||||||||||||||
| Commercial and Industrial |
||||||||||||||||||||||||||||||||
| General C&I |
3 | $ | 9,840 | — | $ | — | 1 | $ | 2,773 | — | $ | — | ||||||||||||||||||||
| Energy Sector |
2 | 16,619 | — | — | — | — | — | — | ||||||||||||||||||||||||
|
|
|
|
|
|
|
|
|
|
|
|
|
|
|
|
|
|||||||||||||||||
| Total commercial and industrial |
5 | 26,459 | — | — | 1 | 2,773 | — | — | ||||||||||||||||||||||||
|
|
|
|
|
|
|
|
|
|
|
|
|
|
|
|
|
|||||||||||||||||
| Consumer |
||||||||||||||||||||||||||||||||
| Residential real estate |
5 | 273 | — | — | 7 | 1,256 | 1 | 101 | ||||||||||||||||||||||||
| Other |
1 | 306 | — | — | — | — | — | — | ||||||||||||||||||||||||
|
|
|
|
|
|
|
|
|
|
|
|
|
|
|
|
|
|||||||||||||||||
| Total consumer |
6 | 579 | — | — | 7 | 1,256 | 1 | 101 | ||||||||||||||||||||||||
|
|
|
|
|
|
|
|
|
|
|
|
|
|
|
|
|
|||||||||||||||||
| Small Business Lending |
— | — | 2 | 459 | 1 | 176 | 2 | 1,078 | ||||||||||||||||||||||||
|
|
|
|
|
|
|
|
|
|
|
|
|
|
|
|
|
|||||||||||||||||
| Total |
11 | $ | 27,038 | 2 | $ | 459 | 9 | $ | 4,205 | 3 | $ | 1,179 | ||||||||||||||||||||
|
|
|
|
|
|
|
|
|
|
|
|
|
|
|
|
|
|||||||||||||||||
| (1) | Default is defined as the earlier of the troubled debt restructuring being placed on non-accrual status or obtaining 90 day past due status with respect to principal and/or interest payments. |
ACI Loans that were modified into TDRs. There were no ACI loans modified in a TDR for the three and nine months ended September 30, 2017. In the nine months ended September 30, 2016, there was one ACI loan modified in a TDR with a recorded investment of $954 thousand in income producing commercial real estate. There were no TDRs experiencing payment default during the three and nine months ended September 30, 2017 and 2016. Default is defined as the earlier of the troubled debt restructuring being placed on non-accrual status or obtaining 90 day past due status with respect to principal and interest payments.
| For the Year Ended December 31, 2016 |
||||||||||||||||
| Loans Modified in TDRs During the Period |
TDRs Experiencing Payment Default(1) During the Period |
|||||||||||||||
| (Dollars in thousands) | Number of TDRs |
Recorded Investment |
Number of TDRs |
Recorded Investment |
||||||||||||
| Commercial Real Estate |
||||||||||||||||
| Income producing |
1 | $ | 954 | — | $ | — | ||||||||||
|
|
|
|
|
|
|
|
|
|||||||||
| Total commercial real estate |
1 | 954 | — | — | ||||||||||||
|
|
|
|
|
|
|
|
|
|||||||||
| Total |
1 | $ | 954 | — | $ | — | ||||||||||
|
|
|
|
|
|
|
|
|
|||||||||
141
Table of Contents
| For the Year Ended December 31, 2015 |
For the Year Ended December 31, 2014 |
|||||||||||||||||||||||||||||||
| Loans Modified in TDRs During the Period |
TDRs Experiencing Payment Default(1) During the Period |
Loans Modified in TDRs During the Period |
TDRs Experiencing Payment Default(1) During the Period |
|||||||||||||||||||||||||||||
| (Dollars in thousands) | Number of TDRs |
Recorded Investment |
Number of TDRs |
Recorded Investment |
Number of TDRs |
Recorded Investment |
Number of TDRs |
Recorded Investment |
||||||||||||||||||||||||
| Commercial Real Estate |
||||||||||||||||||||||||||||||||
| Income producing |
1 | $ | 625 | — | $ | — | — | $ | — | — | $ | — | ||||||||||||||||||||
| Land and development |
— | — | — | — | 1 | 1,854 | — | — | ||||||||||||||||||||||||
|
|
|
|
|
|
|
|
|
|
|
|
|
|
|
|
|
|||||||||||||||||
| Total commercial real estate |
1 | 625 | — | — | 1 | 1,854 | — | — | ||||||||||||||||||||||||
|
|
|
|
|
|
|
|
|
|
|
|
|
|
|
|
|
|||||||||||||||||
| Total |
1 | $ | 625 | — | $ | — | 1 | $ | 1,854 | — | $ | — | ||||||||||||||||||||
|
|
|
|
|
|
|
|
|
|
|
|
|
|
|
|
|
|||||||||||||||||
Potential Problem Loans. Potential problem loans represent loans that are currently performing, but for which known information about possible credit problems of the related borrowers causes management to have doubts as to the ability of such borrowers to comply with the present loan repayment terms and which may result in disclosure of such loans as nonperforming at some time in the future. These loans are not included in the amounts of nonaccrual or restructured loans presented above. We cannot predict the extent to which economic conditions or other factors may impact borrowers and the potential problem loans. Accordingly, there can be no assurance that other loans will not become 90 days or more past due, be placed on nonaccrual status, become restructured, or require increased allowance coverage and provision for credit losses. We have identified three credits as a potential problem loan at September 30, 2017 totaling approximately $27.1 million. These credits are classified in the general C&I and Restaurant segments of our portfolio. Any potential problem loans are assessed for loss exposure consistent with the methods described in Notes 1 and 3 to our Consolidated Financial Statements.
We expect the levels of nonperforming assets and potential problem loans to fluctuate in response to changing economic and market conditions, and the relative sizes of the respective loan portfolios, along with our degree of success in resolving problem assets. We seek to take a proactive approach with respect to the identification and resolution of problem loans.
Allowance for Credit Losses
The allowance for credit losses (“ACL”) is maintained at a level that management believes is adequate to absorb all probable losses on loans inherent in the loan portfolio as of the reporting date. Events that are not within the Company’s control, such as changes in economic factors, could change subsequent to the reporting date and could cause increases or decreases to the ACL. The amount of the allowance is affected by loan charge-offs, which decrease the allowance; recoveries on loans previously charged off, which increase the allowance; and the provision for credit losses charged to earnings, which increases the allowance. In determining the provision for credit losses, management monitors fluctuations in the ACL resulting from actual charge-offs and recoveries and reviews the size and composition of the loan portfolio in light of current and anticipated economic conditions (see “—Balance Sheet Drivers—Asset Quality” above and Notes 1 and 3 to the Consolidated Financial Statements). This evaluation is inherently subjective as it requires estimates that are susceptible to significant revision as more information becomes available or as events change.
Total ACL for the period ending September 30, 2017 was $94.8 million, or 1.18% on total loans (net of unearned discounts and fees) of $8.03 billion. This compares with $82.3 million on loans of $7.43 billion, or 1.11% at December 31, 2016, $79.8 million on loans of $6.92 billion, or 1.15% at December 31, 2015 and $53.5 million on loans of $6.19 billion, or 0.86% at December 31, 2014. The following tables present the allocation of the allowance for credit losses and the percentage of these loans to total loans. The allocation below is neither indicative of the specific amounts or the loan categories in which future charge-offs may occur, nor is it
142
Table of Contents
an indicator of any future loss trends. The allocation of the allowance to each category does not restrict the use of the allowance to absorb any losses in any category.
| Allowance for Credit Losses | Percent of ACL to Each Category of Loans |
Percent of Loans in Each Category to Total Loans |
||||||||||||||||||||||||||||||||||||||||||||||
| September 30, 2017 |
December 31, | September 30, 2017 |
December 31, | September 30, 2017 |
December 31, | |||||||||||||||||||||||||||||||||||||||||||
| 2016 | 2015 | 2014 | 2016 | 2015 | 2014 | 2016 | 2015 | 2014 | ||||||||||||||||||||||||||||||||||||||||
| (In thousands) | ||||||||||||||||||||||||||||||||||||||||||||||||
| Originated Loans |
||||||||||||||||||||||||||||||||||||||||||||||||
| Commercial and industrial |
$ | 60,757 | $ | 54,213 | $ | 53,169 | $ | 24,825 | 1.26 | % | 1.19 | % | 1.21 | % | 0.66 | % | 60.11 | % | 61.36 | % | 63.63 | % | 60.38 | % | ||||||||||||||||||||||||
| Commercial real estate |
10,786 | 7,205 | 4,825 | 3,156 | 0.96 | 0.76 | 0.66 | 0.52 | 13.91 | 12.80 | 10.55 | 9.78 | ||||||||||||||||||||||||||||||||||||
| Consumer |
9,022 | 5,687 | 4,325 | 3,072 | 0.64 | 0.48 | 0.47 | 0.46 | 17.49 | 15.89 | 13.20 | 10.76 | ||||||||||||||||||||||||||||||||||||
| Small business |
4,160 | 3,907 | 2,067 | 1,189 | 2.00 | 2.12 | 1.48 | 1.12 | 2.58 | 2.47 | 2.02 | 1.71 | ||||||||||||||||||||||||||||||||||||
|
|
|
|
|
|
|
|
|
|
|
|
|
|
|
|
|
|||||||||||||||||||||||||||||||||
| Total originated loans |
84,725 | 71,012 | 64,386 | 32,242 | 1.12 | 1.03 | 1.04 | 0.63 | 94.09 | 92.52 | 89.39 | 82.63 | ||||||||||||||||||||||||||||||||||||
|
|
|
|
|
|
|
|
|
|
|
|
|
|
|
|
|
|||||||||||||||||||||||||||||||||
| ANCI Loans |
||||||||||||||||||||||||||||||||||||||||||||||||
| Commercial and industrial |
883 | 299 | 425 | 348 | 1.62 | 0.58 | 0.67 | 0.38 | 0.68 | 0.69 | 0.92 | 1.47 | ||||||||||||||||||||||||||||||||||||
| Commercial real estate |
202 | 243 | 227 | 51 | 1.24 | 1.20 | 0.76 | 0.09 | 0.20 | 0.27 | 0.43 | 0.92 | ||||||||||||||||||||||||||||||||||||
| Consumer |
93 | 131 | 105 | 277 | 0.08 | 0.09 | 0.05 | 0.10 | 1.50 | 2.05 | 2.84 | 4.60 | ||||||||||||||||||||||||||||||||||||
| Small business |
280 | 305 | 306 | 799 | 2.62 | 3.33 | 2.71 | 5.71 | 0.13 | 0.12 | 0.16 | 0.23 | ||||||||||||||||||||||||||||||||||||
|
|
|
|
|
|
|
|
|
|
|
|
|
|
|
|
|
|||||||||||||||||||||||||||||||||
| Total ANCI |
1,458 | 978 | 1,063 | 1,475 | 0.73 | 0.43 | 0.36 | 0.33 | 2.51 | 3.13 | 4.35 | 7.22 | ||||||||||||||||||||||||||||||||||||
|
|
|
|
|
|
|
|
|
|
|
|
|
|
|
|
|
|||||||||||||||||||||||||||||||||
| ACI Loans |
||||||||||||||||||||||||||||||||||||||||||||||||
| Commercial and industrial |
103 | 176 | 2,230 | 3,757 | 0.32 | 0.46 | 3.60 | 4.36 | 0.40 | 0.51 | 0.89 | 1.39 | ||||||||||||||||||||||||||||||||||||
| Commercial real estate |
1,964 | 2,655 | 3,084 | 3,843 | 2.38 | 2.70 | 2.29 | 1.63 | 1.03 | 1.32 | 1.94 | 3.78 | ||||||||||||||||||||||||||||||||||||
| Consumer |
6,515 | 7,447 | 9,020 | 12,203 | 4.10 | 3.96 | 3.80 | 3.93 | 1.97 | 2.52 | 3.43 | 4.98 | ||||||||||||||||||||||||||||||||||||
| Small business |
— | — | — | — | — | — | — | — | — | — | — | — | ||||||||||||||||||||||||||||||||||||
|
|
|
|
|
|
|
|
|
|
|
|
|
|
|
|
|
|||||||||||||||||||||||||||||||||
| Total ACI |
8,582 | 10,278 | 14,334 | 19,803 | 3.13 | 3.17 | 3.30 | 3.14 | 3.40 | 4.35 | 6.26 | 10.15 | ||||||||||||||||||||||||||||||||||||
|
|
|
|
|
|
|
|
|
|
|
|
|
|
|
|
|
|||||||||||||||||||||||||||||||||
| Total Loans |
||||||||||||||||||||||||||||||||||||||||||||||||
| Commercial and industrial |
61,743 | 54,688 | 55,824 | 28,930 | 1.26 | 1.18 | 1.23 | 0.74 | 61.19 | % | 62.56 | % | 65.44 | % | 63.24 | % | ||||||||||||||||||||||||||||||||
| Commercial real estate |
12,952 | 10,103 | 8,136 | 7,050 | 1.06 | 0.94 | 0.91 | 0.78 | 15.14 | 14.39 | 12.91 | 14.48 | ||||||||||||||||||||||||||||||||||||
| Consumer |
15,630 | 13,265 | 13,450 | 15,552 | 0.93 | 0.87 | 1.00 | 1.24 | 20.96 | 20.46 | 19.47 | 20.34 | ||||||||||||||||||||||||||||||||||||
| Small business |
4,440 | 4,212 | 2,373 | 1,988 | 2.03 | 2.18 | 1.57 | 1.65 | 2.71 | 2.59 | 2.18 | 1.94 | ||||||||||||||||||||||||||||||||||||
|
|
|
|
|
|
|
|
|
|
|
|
|
|
|
|
|
|
|
|
|
|
|
|
|
|||||||||||||||||||||||||
| Total allowance for credit losses |
$ | 94,765 | $ | 82,268 | $ | 79,783 | $ | 53,520 | 1.18 | % | 1.11 | % | 1.15 | % | 0.86 | % | 100.00 | % | 100.00 | % | 100.00 | % | 100.00 | % | ||||||||||||||||||||||||
|
|
|
|
|
|
|
|
|
|
|
|
|
|
|
|
|
|
|
|
|
|
|
|
|
|||||||||||||||||||||||||
Originated ACL. The ACL on our originated loan portfolio totaled $84.7 million, or 1.12% on loans of $7.6 billion as of September 30, 2017 compared to $71.0 million, or 1.03% on loans of $6.9 billion, $64.4 million, or 1.04% on loans of $6.2 billion, and $32.2 million, or 0.63% on loans of $5.1 billion, for the periods ended December 31, 2016, 2015 and 2014, respectively. The primary driver of the originated ACL is the net new loan growth as well as the underlying credit quality of the loans. The underlying credit quality changes were driven by stress in our energy portfolio and general migration related to the seasoning of the General C&I portfolio. Our loans are categorized into specific risk segments and are subject to loss rates according to their segment and risk rating. As September 30, 2017, $60.8 million, or 71.7%, of our originated ACL is attributable to our C&I loan segment compared to $54.2 million, or 76.3%, $53.2 million, or 82%, and $24.8 million, or 77%, as of December 31, 2016, 2015 and 2014, respectively. The ACL as a percentage of the C&I portfolio has increased to 1.26% as of September 30, 2017 from 1.19% as of December 31, 2016, 1.21% as of December 31, 2015 and 0.66% as December 31, 2014. The increase in the level of ACL as a percentage of C&I loans as of September 30, 2017 from December 31, 2016 is primarily the result of overall loan growth, the migration of a few credits within the criticized status in the General C&I portfolio,
143
Table of Contents
and specific impairment on two energy credits where collateral values have declined, primarily as a result of related commodity prices.
The level of criticized and classified loans in the C&I portfolio is presented in the following tables.
| As of September 30, 2017 | ||||||||||||||||||||
| (Recorded Investment in thousands) | General C&I | Energy Sector | Restaurant Industry |
Healthcare | Total | |||||||||||||||
| Originated Loans |
||||||||||||||||||||
| Special mention |
$ | 84,846 | $ | — | $ | 4,647 | $ | 45 | $ | 89,538 | ||||||||||
| Substandard |
34,580 | 150,929 | 10,907 | — | 196,416 | |||||||||||||||
| Doubtful |
— | 10,503 | — | — | 10,503 | |||||||||||||||
|
|
|
|
|
|
|
|
|
|
|
|||||||||||
| Total |
$ | 119,426 | $ | 161,432 | $ | 15,554 | $ | 45 | $ | 296,457 | ||||||||||
|
|
|
|
|
|
|
|
|
|
|
|||||||||||
| As of December 31, 2016 | ||||||||||||||||||||
| (Recorded Investment in thousands) | General C&I | Energy Sector | Restaurant Industry |
Healthcare | Total | |||||||||||||||
| Originated Loans |
||||||||||||||||||||
| Special mention |
$ | 36,419 | $ | 30,433 | $ | 16,169 | $ | 9,479 | $ | 92,500 | ||||||||||
| Substandard |
26,968 | 239,457 | — | — | 266,425 | |||||||||||||||
| Doubtful |
— | 789 | — | — | 789 | |||||||||||||||
|
|
|
|
|
|
|
|
|
|
|
|||||||||||
| Total |
$ | 63,387 | $ | 270,679 | $ | 16,169 | $ | 9,479 | $ | 359,714 | ||||||||||
|
|
|
|
|
|
|
|
|
|
|
|||||||||||
| As of December 31, 2015 | ||||||||||||||||||||
| (Recorded Investment in thousands) | General C&I | Energy Sector | Restaurant Industry |
Healthcare | Total | |||||||||||||||
| Originated Loans |
||||||||||||||||||||
| Special mention |
$ | 14,056 | $ | 104,781 | $ | 25,313 | $ | 212 | $ | 144,362 | ||||||||||
| Substandard |
42,705 | 241,032 | — | 5,097 | 288,834 | |||||||||||||||
| Doubtful |
— | — | — | — | — | |||||||||||||||
|
|
|
|
|
|
|
|
|
|
|
|||||||||||
| Total |
$ | 56,761 | $ | 345,813 | $ | 25,313 | $ | 5,309 | $ | 433,196 | ||||||||||
|
|
|
|
|
|
|
|
|
|
|
|||||||||||
| As of December 31, 2014 | ||||||||||||||||||||
| (Recorded Investment in thousands) | General C&I | Energy Sector | Restaurant Industry |
Healthcare | Total | |||||||||||||||
| Originated Loans |
||||||||||||||||||||
| Special mention |
$ | 991 | $ | 9,467 | $ | 13,372 | $ | — | $ | 23,830 | ||||||||||
| Substandard |
33 | 19,670 | — | — | 19,703 | |||||||||||||||
| Doubtful |
— | — | — | — | — | |||||||||||||||
|
|
|
|
|
|
|
|
|
|
|
|||||||||||
| Total |
$ | 1,024 | $ | 29,137 | $ | 13,372 | $ | — | $ | 43,533 | ||||||||||
|
|
|
|
|
|
|
|
|
|
|
|||||||||||
As of September 30, 2017, $10.8 million, or 13% of our originated ACL is attributable to the CRE loan segment compared to $7.2 million, or 10.1%, as of December 31, 2016. The ACL as a percentage of the CRE portfolio has increased to 0.96% as of September 30, 2017 from 0.76% as of December 31, 2016, primarily as a result of qualitative considerations and some grade migration in the CRE portfolio.
In addition to quantitative elements, certain qualitative and environmental factors are also considered at management’s discretion, which are generally based on a combination of internal and external factors and trends. At September 30, 2017, these totaled $13.6 million and accounted for approximately 16.0% of the originated ACL compared to $16.7 million, or 23.5%, as of December 31, 2016, with the most significant consideration being the stress on the energy industry from the volatility of oil and gas prices, and the amount of losses realized
144
Table of Contents
in the energy portfolio in 2016 and 2015. Approximately $7.6 million and $16.0 million as of September 30, 2017 and December 31, 2016, respectively, of these qualitative reserves were allocated to the energy portfolio.
Two “Category 4” hurricanes moved through our geographic footprint during the quarter. Hurricane Harvey made landfall in Texas in late August and Hurricane Irma hit Florida in early September. Based on our outreach to and analysis of our commercial customers, most with robust business continuity and disaster recovery plans, we have not identified any expected losses in the commercial portfolio to date. Based on our outreach to and analysis of our mortgage customers in the impacted areas, and in consideration of factors that increase the risks associated with these mortgages, we concluded that increasing reserves by approximately $2.0 million was appropriate as of September 30, 2017. We will continue to closely monitor all of our impacted customers as recovery efforts continue in the area.
As of September 30, 2017 and December 31, 2016, $39.3 million, or 46.4%, and $31.7 million, or 45.7%, respectively of the total originated ACL, was attributable to shared national credits. During the second quarter of 2017, we recorded a $2.6 million charge-off to a single E&P credit that was a shared national credit. During 2016 we recorded gross charge-offs of two energy portfolio credits totaling $32.9 million that were shared national credits. The ACL is estimated based on the underlying credit quality of the loan, primarily based on its risk segment and risk rating. This methodology is consistent whether or not a loan is a shared national credit.
The following table includes the charge-off and recoveries on our originated portfolio for the periods presented :
| Originated Charge-offs and Recoveries | ||||||||||||||||||||||||||||||||||||
| Three Months Ended September 30, |
Nine Months Ended September 30, |
Years Ended December 31, | ||||||||||||||||||||||||||||||||||
| 2017 | 2016 | 2017 | 2016 | 2016 | 2015 | 2014 | 2013 | 2012 | ||||||||||||||||||||||||||||
| (In thousands) | ||||||||||||||||||||||||||||||||||||
| Charge-offs: |
||||||||||||||||||||||||||||||||||||
| Commercial and industrial |
||||||||||||||||||||||||||||||||||||
| Energy |
||||||||||||||||||||||||||||||||||||
| —E&P |
$ | — | $ | 24,533 | $ | 2,551 | $ | 29,857 | $ | 32,893 | $ | 3,200 | $ | — | $ | — | $ | — | ||||||||||||||||||
| —Midstream |
— | — | — | — | — | 617 | — | — | — | |||||||||||||||||||||||||||
| —Services |
— | — | — | — | — | 4,699 | — | — | — | |||||||||||||||||||||||||||
| Healthcare |
— | — | — | 12,207 | 12,207 | — | — | — | — | |||||||||||||||||||||||||||
| Other commercial |
— | 922 | 237 | 1,268 | 1,268 | — | 843 | 193 | 363 | |||||||||||||||||||||||||||
| Commercial real estate |
— | — | — | — | — | 123 | — | — | 296 | |||||||||||||||||||||||||||
| Consumer |
132 | 177 | 383 | 480 | 634 | 936 | 662 | 738 | 1,101 | |||||||||||||||||||||||||||
| Small business |
— | — | 120 | 142 | 841 | — | — | 1 | — | |||||||||||||||||||||||||||
|
|
|
|
|
|
|
|
|
|
|
|
|
|
|
|
|
|
|
|||||||||||||||||||
| Total charge-offs |
132 | 25,632 | 3,291 | $ | 43,954 | 47,843 | 9,575 | 1,505 | 932 | 1,760 | ||||||||||||||||||||||||||
|
|
|
|
|
|
|
|
|
|
|
|
|
|
|
|
|
|
|
|||||||||||||||||||
| Recoveries: |
||||||||||||||||||||||||||||||||||||
| Commercial and industrial |
44 | 656 | 677 | 1,276 | 1,386 | — | — | 173 | 30 | |||||||||||||||||||||||||||
| Commercial real estate |
11 | — | 18 | — | 3 | — | — | 207 | — | |||||||||||||||||||||||||||
| Consumer |
29 | 34 | 85 | 183 | 225 | 220 | 309 | 419 | 404 | |||||||||||||||||||||||||||
| Small business |
— | — | 44 | — | — | — | — | — | — | |||||||||||||||||||||||||||
|
|
|
|
|
|
|
|
|
|
|
|
|
|
|
|
|
|
|
|||||||||||||||||||
| Total recoveries |
84 | 690 | 824 | 1,459 | 1,614 | 220 | 309 | 799 | 434 | |||||||||||||||||||||||||||
|
|
|
|
|
|
|
|
|
|
|
|
|
|
|
|
|
|
|
|||||||||||||||||||
| Net charge-offs |
$ | 48 | $ | 24,942 | $ | 2,467 | $ | 42,495 | $ | 46,229 | $ | 9,355 | $ | 1,196 | $ | 133 | $ | 1,326 | ||||||||||||||||||
|
|
|
|
|
|
|
|
|
|
|
|
|
|
|
|
|
|
|
|||||||||||||||||||
145
Table of Contents
ANCI ACL. The ACL on our ANCI loans totaled $1.5 million on $198.8 million in loans, or 0.73% at September 30, 2017, compared to $1.0 million, or 0.43%, $1.1 million, or 0.36%, and $1.5 million, or 0.33%, at December 31, 2016, 2015 and 2014, respectively. The increase in the ANCI reserve between December 31, 2016 and September 30, 2017 is related to a single credit amounting to $0.3 million that migrated to criticized status during the second quarter of 2017. ANCI loans were recorded at fair value at the date of each acquisition and are pooled for ACL assessment based on risk segment, with the majority of the ANCI loans within the consumer residential category. Any net shortage of credit mark indicates the need for an allowance on that segment of loans with certain loans individually reviewed for specific impairment.
ACI ACL. The ACL on our ACI loans totaled $8.6 million on $274.0 million in loans, or 3.13%, at September 30, 2017, compared to $10.3 million, or 3.17%, $14.3 million, or 3.30%, and $19.8 million, or 3.14%, at December 31, 2016, 2015 and 2014, respectively. At the time of our acquisitions, we estimated the fair value of the total acquired loan portfolio by segregating the portfolio into loan pools with similar characteristics and certain specifically-reviewed non-homogeneous loans. The similar characteristics used to establish the pools included:
| • | risk rating; |
| • | the loan type based on regulatory reporting guidelines; namely whether the loan was a residential, construction, consumer, or commercial loan; and |
| • | the nature of collateral. |
Since the acquisition dates, the expected cash flows have been re-estimated quarterly utilizing the same cash flow methodology used at the time of each acquisition. Any subsequent decreases to the expected cash flows generally result in a provision for credit losses. Conversely, subsequent increases in expected cash flows result first in the reversal of any impairment, then in a transfer from the non-accretable discount to the accretable discount, which would have a positive impact on accretion income prospectively. These cash flow evaluations are inherently subjective, as they require material estimates, all of which may be susceptible to significant change.
The largest component of our ACI ACL is attributable to our consumer category, primarily first and second-lien residential loans, that represents 76% of the ACI ACL at September 30, 2017 compared to 72.5% of the ACI ACL at December 31, 2016. This component of the ACL has declined $0.9 million to $6.5 million since December 31, 2016 due to impairment reversals on the residential pools, largely driven by loan pay-offs.
The commercial real estate component comprises 23% of the ACI ACL at September 30, 2017 and has decreased $0.7 million to $2.0 million since December 31, 2016.
146
Table of Contents
The following is a summary rollforward of the activity in the ACI loans, ACI ACL and the accretable discount for the periods presented:
| ACI Loans(1) | ACI ACL(2) | Accretable Discount(3) | ||||||||||||||||||||||||||||||||||
| Years Ended December 31, | Years Ended December 31, | Years Ended December 31, | ||||||||||||||||||||||||||||||||||
| 2016 | 2015 | 2014 | 2016 | 2015 | 2014 | 2016 | 2015 | 2014 | ||||||||||||||||||||||||||||
| (In Billions) | ||||||||||||||||||||||||||||||||||||
| Balance at beginning of period |
$ | 0.43 | $ | 0.63 | $ | 0.88 | $ | (0.01 | ) | $ | (0.02 | ) | $ | (0.03 | ) | $ | 0.12 | $ | 0.16 | $ | 0.24 | |||||||||||||||
| Interest accretion |
0.03 | 0.05 | 0.07 | — | — | — | (0.03 | ) | (0.05 | ) | (0.07 | ) | ||||||||||||||||||||||||
| Payments |
(0.14 | ) | (0.25 | ) | (0.28 | ) | — | 0.01 | — | — | (0.02 | ) | (0.03 | ) | ||||||||||||||||||||||
| Charge-offs and foreclosures |
— | — | (0.04 | ) | — | — | 0.01 | — | — | — | ||||||||||||||||||||||||||
| Transfer from nonaccretable discount |
— | — | — | — | — | — | — | 0.03 | 0.02 | |||||||||||||||||||||||||||
|
|
|
|
|
|
|
|
|
|
|
|
|
|
|
|
|
|
|
|||||||||||||||||||
| Balance at end of period |
$ | 0.32 | $ | 0.43 | $ | 0.63 | $ | (0.01 | ) | $ | (0.01 | ) | $ | (0.02 | ) | $ | 0.09 | $ | 0.12 | $ | 0.16 | |||||||||||||||
|
|
|
|
|
|
|
|
|
|
|
|
|
|
|
|
|
|
|
|||||||||||||||||||
| (1) | See “Loan Portfolio” above for portfolio components as of the end of each reported period. |
| (2) | See below for a rollforward of the ACI ACL by portfolio component. |
| (3) | See “Results of Operations—Net Interest Income” and Notes 1 and 3 to the Consolidated Financial Statements, respectively for additional disclosure regarding the accretable discount. |
For the year ended December 31, 2016, we had transfers from the non-accretable discount to the accretable discount of $19.7 million. Estimated expected cash flows at the fourth quarter re-estimation date of October 31, 2016 totaled $455 million. For the years ended December 31, 2015 and 2014, we had transfers from the non-accretable discount to the accretable discount of $30.9 million and $18.3 million, respectively. Estimated expected cash flows at the fourth quarter re-estimation dates of October 31, 2015 and 2014 totaled $586 million and $853 million, respectively.
As of December 31, 2016, the accretable discount on our residential real estate portfolio was $54.8 million, or 55.5%, of the total accretable discount, with the related residential pools having an average life between two and six years. The average life of our remaining non-residential pools and specifically-reviewed loans is generally less than four years.
The largest component of our ACI ACL is our consumer category that primarily includes our acquired residential loans and represents 72.5% of the ACI ACL at December 31, 2016. This component of the ACL has declined $1.6 million to $7.4 million since December 31, 2015 because of impairment reversals on the residential pools primarily as loans have paid-off. A significant portion of this allowance is related to a second lien pool.
The commercial real estate component comprises 25.8% of the ACI ACL at December 31, 2016 and has decreased $0.4 million to $2.7 million since December 31, 2015 primarily due to pay downs.
The commercial and industrial component comprises 0.5% of the ACI ACL at December 31, 2016 and has decreased $2.1 million to $176 thousand since December 31, 2015 primarily due to an impairment reversal related to a recovery of a pooled loan.
147
Table of Contents
The following table summarizes certain information with respect to our ACL on the total loan portfolio and the composition of charge-offs and recoveries for the periods indicated. Subsequent tables present this information separately for the originated, ANCI and ACI portfolios:
| Total Loans | ||||||||||||||||||||||||||||
| Three Months Ended September 30, |
Nine Months Ended September 30, |
Years Ended December 31, | ||||||||||||||||||||||||||
| 2017 | 2016 | 2017 | 2016 | 2016 | 2015 | 2014 | ||||||||||||||||||||||
| (In thousands) | ||||||||||||||||||||||||||||
| Allowance for credit losses at beginning of period |
$ | 93,215 | $ | 87,147 | $ | 82,268 | $ | 79,783 | $ | 79,783 | $ | 53,520 | $ | 44,269 | ||||||||||||||
| Charge-offs: |
||||||||||||||||||||||||||||
| Commercial and industrial |
440 | 25,455 | 3,301 | 43,332 | 46,368 | 8,525 | 1,033 | |||||||||||||||||||||
| Commercial real estate |
— | — | — | — | — | 271 | 4,668 | |||||||||||||||||||||
| Consumer |
141 | 1,413 | 543 | 1,906 | 2,093 | 1,291 | 3,313 | |||||||||||||||||||||
| Small business |
— | — | 167 | 142 | 841 | 647 | 293 | |||||||||||||||||||||
|
|
|
|
|
|
|
|
|
|
|
|
|
|
|
|||||||||||||||
| Total charge-offs |
581 | 26,868 | 4,011 | 45,380 | 49,302 | 10,734 | 9,307 | |||||||||||||||||||||
|
|
|
|
|
|
|
|
|
|
|
|
|
|
|
|||||||||||||||
| Recoveries: |
||||||||||||||||||||||||||||
| Commercial and industrial |
71 | 675 | 966 | 1,331 | 1,449 | 64 | 1,335 | |||||||||||||||||||||
| Commercial real estate |
76 | 519 | 204 | 566 | 578 | 339 | 1,781 | |||||||||||||||||||||
| Consumer |
196 | 67 | 837 | 292 | 403 | 601 | 1,309 | |||||||||||||||||||||
| Small business |
65 | 2 | 291 | 7 | 9 | 9 | 15 | |||||||||||||||||||||
|
|
|
|
|
|
|
|
|
|
|
|
|
|
|
|||||||||||||||
| Total recoveries |
408 | 1,263 | 2,298 | 2,196 | 2,439 | 1,013 | 4,440 | |||||||||||||||||||||
|
|
|
|
|
|
|
|
|
|
|
|
|
|
|
|||||||||||||||
| Net charge-offs |
173 | 25,605 | 1,713 | 43,184 | 46,863 | 9,721 | 4,867 | |||||||||||||||||||||
|
|
|
|
|
|
|
|
|
|
|
|
|
|
|
|||||||||||||||
| Provision for credit losses: |
||||||||||||||||||||||||||||
| Commercial and industrial |
(123 | ) | 29,218 | 9,390 | 50,750 | 43,782 | 35,355 | 12,772 | ||||||||||||||||||||
| Commercial real estate |
(384 | ) | (943 | ) | 2,645 | 678 | 1,389 | 1,018 | (2,370 | ) | ||||||||||||||||||
| Consumer |
2,190 | 1,300 | 2,071 | 1,441 | 1,506 | (1,412 | ) | 2,097 | ||||||||||||||||||||
| Small business |
40 | 52 | 104 | 1,701 | 2,671 | 1,023 | 1,619 | |||||||||||||||||||||
|
|
|
|
|
|
|
|
|
|
|
|
|
|
|
|||||||||||||||
| Total provision for credit losses |
1,723 | 29,627 | 14,210 | 54,570 | 49,348 | 35,984 | 14,118 | |||||||||||||||||||||
|
|
|
|
|
|
|
|
|
|
|
|
|
|
|
|||||||||||||||
| Allowance for credit losses at end of period |
$ | 94,765 | $ | 91,169 | $ | 94,765 | $ | 91,169 | $ | 82,268 | $ | 79,783 | $ | 53,520 | ||||||||||||||
|
|
|
|
|
|
|
|
|
|
|
|
|
|
|
|||||||||||||||
| Loans at end of period, net of unearned income |
$ | 8,028,938 | $ | 7,207,313 | $ | 8,028,938 | $ | 7,207,313 | $ | 7,432,711 | $ | 6,916,520 | $ | 6,192,793 | ||||||||||||||
| Average loans, net of unearned |
7,867,794 | 7,225,365 | 7,690,798 | 7,123,211 | 7,186,635 | 6,488,071 | 5,430,270 | |||||||||||||||||||||
| Ratio of ending allowance to ending loans |
1.18 | % | 1.26 | % | 1.18 | % | 1.26 | % | 1.11 | % | 1.15 | % | 0.86 | % | ||||||||||||||
| Ratio of net charge-offs to average loans(1) |
0.01 | 1.41 | 0.03 | 0.81 | 0.65 | 0.15 | 0.09 | |||||||||||||||||||||
| Net charge-offs as a percentage of: |
||||||||||||||||||||||||||||
| Provision for credit losses |
10.04 | 86.42 | 12.05 | 79.14 | 94.96 | 27.01 | 34.47 | |||||||||||||||||||||
| Allowance for credit losses(1) |
0.72 | 111.42 | 2.42 | 63.10 | 56.96 | 12.18 | 9.09 | |||||||||||||||||||||
| Allowance for credit losses as a percentage of nonperforming loans |
122.66 | 59.34 | 122.66 | 59.34 | 63.80 | 114.25 | 219.64 | |||||||||||||||||||||
148
Table of Contents
| Originated Loans | ||||||||||||||||||||||||||||
| Three Months Ended September 30, |
Nine Months Ended September 30, |
Years Ended December 31, | ||||||||||||||||||||||||||
| 2017 | 2016 | 2017 | 2016 | 2016 | 2015 | 2014 | ||||||||||||||||||||||
| (In thousands) | ||||||||||||||||||||||||||||
| Allowance for credit losses at beginning of period |
$ | 81,596 | $ | 75,165 | $ | 71,011 | $ | 64,386 | $ | 64,386 | $ | 32,242 | $ | 14,963 | ||||||||||||||
| Charge-offs: |
||||||||||||||||||||||||||||
| Commercial and industrial |
— | 25,455 | 2,788 | 43,332 | 46,368 | 8,516 | 843 | |||||||||||||||||||||
| Commercial real estate |
— | — | — | — | — | 123 | — | |||||||||||||||||||||
| Consumer |
132 | 177 | 383 | 480 | 634 | 936 | 662 | |||||||||||||||||||||
| Small business |
— | — | 120 | 142 | 841 | — | — | |||||||||||||||||||||
|
|
|
|
|
|
|
|
|
|
|
|
|
|
|
|||||||||||||||
| Total charge-offs |
132 | 25,632 | 3,291 | 43,954 | 47,843 | 9,575 | 1,505 | |||||||||||||||||||||
|
|
|
|
|
|
|
|
|
|
|
|
|
|
|
|||||||||||||||
| Recoveries: |
||||||||||||||||||||||||||||
| Commercial and industrial |
44 | 656 | 677 | 1,276 | 1,386 | — | — | |||||||||||||||||||||
| Commercial real estate |
11 | — | 18 | — | 3 | — | — | |||||||||||||||||||||
| Consumer |
29 | 34 | 85 | 183 | 225 | 220 | 309 | |||||||||||||||||||||
| Small business |
— | — | 44 | — | — | — | — | |||||||||||||||||||||
|
|
|
|
|
|
|
|
|
|
|
|
|
|
|
|||||||||||||||
| Total recoveries |
84 | 690 | 824 | 1,459 | 1,614 | 220 | 309 | |||||||||||||||||||||
|
|
|
|
|
|
|
|
|
|
|
|
|
|
|
|||||||||||||||
| Net charge-offs |
48 | 24.942 | 2,467 | 42,495 | 46,229 | 9,355 | 1,196 | |||||||||||||||||||||
|
|
|
|
|
|
|
|
|
|
|
|
|
|
|
|||||||||||||||
| Provision for credit losses: |
||||||||||||||||||||||||||||
| Commercial and industrial |
(432 | ) | 29,290 | 8,656 | 53,125 | 46,024 | 36,860 | 15,557 | ||||||||||||||||||||
| Commercial real estate |
811 | 57 | 3,564 | 1,765 | 2,378 | 1,791 | 679 | |||||||||||||||||||||
| Consumer |
2,689 | 275 | 3,633 | 1,402 | 1,772 | 1,969 | 1,450 | |||||||||||||||||||||
| Small business |
109 | 99 | 328 | 1,761 | 2,681 | 879 | 789 | |||||||||||||||||||||
|
|
|
|
|
|
|
|
|
|
|
|
|
|
|
|||||||||||||||
| Total provision for credit losses |
3,177 | 29,721 | 16,181 | 58,053 | 52,855 | 41,499 | 18,475 | |||||||||||||||||||||
|
|
|
|
|
|
|
|
|
|
|
|
|
|
|
|||||||||||||||
| Allowance for credit losses at end of period |
$ | 84,725 | $ | 79,944 | $ | 84,725 | $ | 79,944 | $ | 71,012 | $ | 64,386 | $ | 32,242 | ||||||||||||||
|
|
|
|
|
|
|
|
|
|
|
|
|
|
|
|||||||||||||||
| Loans at end of period, net of unearned income |
$ | 7,556,135 | $ | 6,618,324 | $ | 7,556,135 | $ | 6,618,324 | $ | 6,878,645 | $ | 6,186,465 | $ | 5,120,227 | ||||||||||||||
| Ratio of ending allowance to ending loans |
1.12 | % | 1.21 | % | 1.12 | % | 1.21 | % | 1.03 | % | 1.04 | % | 0.63 | % | ||||||||||||||
| Net charge-offs as a percentage of: |
||||||||||||||||||||||||||||
| Provision for credit losses |
1.51 | 83.92 | 15.25 | 73.20 | 87.47 | 22.55 | 6.47 | |||||||||||||||||||||
| Allowance for credit losses(1) |
0.22 | 124,12 | 3.89 | 71.00 | 65.28 | 14.53 | 3.71 | |||||||||||||||||||||
| Allowance for credit losses as a percentage of nonperforming loans |
115.07 | 54.50 | 115.07 | 54.50 | 58.49 | 116.56 | 498.48 | |||||||||||||||||||||
149
Table of Contents
| ANCI Loans | ||||||||||||||||||||||||||||
| Three Months Ended September 30, |
Nine Months Ended September 30, |
Years Ended December 31, | ||||||||||||||||||||||||||
| 2017 | 2016 | 2017 | 2016 | 2016 | 2015 | 2014 | ||||||||||||||||||||||
| (In thousands) | ||||||||||||||||||||||||||||
| Allowance for credit losses at beginning of period |
$ | 1,468 | $ | 978 | $ | 979 | $ | 1,063 | $ | 1,063 | $ | 1,475 | $ | 2,091 | ||||||||||||||
| Charge-offs: |
||||||||||||||||||||||||||||
| Commercial and industrial |
65 | — | 99 | — | — | — | 190 | |||||||||||||||||||||
| Commercial real estate |
— | — | — | — | — | 25 | — | |||||||||||||||||||||
| Consumer |
9 | 144 | 160 | 334 | 367 | 329 | 2,266 | |||||||||||||||||||||
| Small business |
— | — | 47 | — | — | 647 | 293 | |||||||||||||||||||||
|
|
|
|
|
|
|
|
|
|
|
|
|
|
|
|||||||||||||||
| Total charge-offs |
74 | 144 | 306 | 334 | 367 | 1,001 | 2,749 | |||||||||||||||||||||
|
|
|
|
|
|
|
|
|
|
|
|
|
|
|
|||||||||||||||
| Recoveries: |
||||||||||||||||||||||||||||
| Commercial and industrial |
27 | 11 | 43 | 35 | 44 | 48 | 2 | |||||||||||||||||||||
| Commercial real estate |
— | 100 | — | 100 | 101 | 8 | 62 | |||||||||||||||||||||
| Consumer |
164 | 31 | 268 | 102 | 168 | 139 | 388 | |||||||||||||||||||||
| Small business |
65 | 2 | 247 | 7 | 9 | 9 | 15 | |||||||||||||||||||||
|
|
|
|
|
|
|
|
|
|
|
|
|
|
|
|||||||||||||||
| Total recoveries |
256 | 144 | 558 | 244 | 322 | 204 | 467 | |||||||||||||||||||||
|
|
|
|
|
|
|
|
|
|
|
|
|
|
|
|||||||||||||||
| Net charge-offs (recoveries) |
(182 | ) | — | (252 | ) | 90 | 45 | 797 | 2,282 | |||||||||||||||||||
|
|
|
|
|
|
|
|
|
|
|
|
|
|
|
|||||||||||||||
| Provision for credit losses: |
||||||||||||||||||||||||||||
| Commercial and industrial |
31 | (33 | ) | 639 | (196 | ) | (169 | ) | 31 | (854 | ) | |||||||||||||||||
| Commercial real estate |
— | (237 | ) | (42 | ) | (211 | ) | (85 | ) | 193 | (148 | ) | ||||||||||||||||
| Consumer |
(154 | ) | 33 | (146 | ) | 188 | 225 | 17 | 1,838 | |||||||||||||||||||
| Small business |
(69 | ) | (47 | ) | (224 | ) | (60 | ) | (10 | ) | 144 | 830 | ||||||||||||||||
|
|
|
|
|
|
|
|
|
|
|
|
|
|
|
|||||||||||||||
| Total provision for credit losses |
(192 | ) | (284 | ) | 227 | (279 | ) | (39 | ) | 385 | 1,666 | |||||||||||||||||
|
|
|
|
|
|
|
|
|
|
|
|
|
|
|
|||||||||||||||
| Allowance for credit losses at end of period |
$ | 1,458 | $ | 694 | $ | 1,458 | $ | 694 | $ | 979 | $ | 1,063 | $ | 1,475 | ||||||||||||||
|
|
|
|
|
|
|
|
|
|
|
|
|
|
|
|||||||||||||||
| Loans at end of period, net of unearned income |
$ | 198,797 | $ | 242,026 | $ | 198,797 | $ | 242,026 | $ | 229,784 | $ | 295,911 | $ | 440,915 | ||||||||||||||
| Ratio of ending allowance to ending loans |
0.73 | % | 0.29 | % | 0.73 | % | 0.29 | % | 0.43 | % | 0.36 | % | 0.33 | % | ||||||||||||||
| Net charge-offs (recoveries) as a percentage of: |
||||||||||||||||||||||||||||
| Provision for credit losses |
94.79 | — | (111.01 | ) | (32.26 | ) | (115.38 | ) | 206.49 | 136.97 | ||||||||||||||||||
| Allowance for credit losses(1) |
(49.52 | ) | — | (23.11 | ) | 17.32 | 4.61 | 74.65 | 154.71 | |||||||||||||||||||
| Allowance for credit losses as a percentage of nonperforming loans |
42.86 | 21.21 | 42.86 | 21.21 | 25.29 | 30.16 | 35.26 | |||||||||||||||||||||
150
Table of Contents
| ACI Loans | ||||||||||||||||||||||||||||
| Three Months Ended September 30, |
Nine Months Ended September 30, |
Years Ended December 31, | ||||||||||||||||||||||||||
| 2017 | 2016 | 2017 | 2016 | 2016 | 2015 | 2014 | ||||||||||||||||||||||
| (In thousands) | ||||||||||||||||||||||||||||
| Allowance for credit losses at beginning of period |
$ | 10,151 | $ | 11,004 | $ | 10,278 | $ | 14,334 | $ | 14,334 | $ | 19,803 | $ | 27,215 | ||||||||||||||
| Charge-offs: |
||||||||||||||||||||||||||||
| Commercial and industrial |
375 | — | 414 | — | — | 9 | — | |||||||||||||||||||||
| Commercial real estate |
— | — | — | — | — | 123 | 4,668 | |||||||||||||||||||||
| Consumer |
— | 1,092 | — | 1,092 | 1,092 | 26 | 385 | |||||||||||||||||||||
| Small business |
— | — | — | |||||||||||||||||||||||||
|
|
|
|
|
|
|
|
|
|
|
|
|
|
|
|||||||||||||||
| Total charge-offs |
375 | 1,092 | 414 | 1,092 | 1,092 | 158 | 5,053 | |||||||||||||||||||||
|
|
|
|
|
|
|
|
|
|
|
|
|
|
|
|||||||||||||||
| Recoveries: |
||||||||||||||||||||||||||||
| Commercial and industrial |
— | 8 | 246 | 20 | 20 | 16 | 1,333 | |||||||||||||||||||||
| Commercial real estate |
65 | 419 | 186 | 466 | 474 | 331 | 1,719 | |||||||||||||||||||||
| Consumer |
3 | 2 | 484 | 7 | 10 | 242 | 612 | |||||||||||||||||||||
| Small business |
— | — | — | — | — | — | — | |||||||||||||||||||||
|
|
|
|
|
|
|
|
|
|
|
|
|
|
|
|||||||||||||||
| Total recoveries |
68 | 429 | 916 | 493 | 504 | 589 | 3,664 | |||||||||||||||||||||
|
|
|
|
|
|
|
|
|
|
|
|
|
|
|
|||||||||||||||
| Net charge-offs (recoveries) |
307 | 663 | (502 | ) | 599 | 588 | (431 | ) | 1,389 | |||||||||||||||||||
|
|
|
|
|
|
|
|
|
|
|
|
|
|
|
|||||||||||||||
| Provision for credit losses: |
||||||||||||||||||||||||||||
| Commercial and industrial |
278 | (39 | ) | 95 | (2,179 | ) | (2,073 | ) | (1,536 | ) | (1,931 | ) | ||||||||||||||||
| Commercial real estate |
(1,195 | ) | (763 | ) | (877 | ) | (876 | ) | (904 | ) | (966 | ) | (2,901 | ) | ||||||||||||||
| Consumer |
(345 | ) | 992 | (1,416 | ) | (149 | ) | (491 | ) | (3,398 | ) | (1,191 | ) | |||||||||||||||
| Small business |
— | — | — | — | — | — | — | |||||||||||||||||||||
|
|
|
|
|
|
|
|
|
|
|
|
|
|
|
|||||||||||||||
| Total provision for credit losses |
(1,262 | ) | 190 | (2,198 | ) | (3,204 | ) | (3,468 | ) | (5,900 | ) | (6,023 | ) | |||||||||||||||
|
|
|
|
|
|
|
|
|
|
|
|
|
|
|
|||||||||||||||
| Allowance for credit losses at end of period |
$ | 8,582 | $ | 10,531 | $ | 8,582 | $ | 10,531 | $ | 10,278 | $ | 14,334 | $ | 19,803 | ||||||||||||||
|
|
|
|
|
|
|
|
|
|
|
|
|
|
|
|||||||||||||||
| Loans at end of period, net of unearned income |
$ | 274,006 | $ | 346,963 | $ | 274,006 | $ | 346,963 | $ | 324,282 | $ | 434,144 | $ | 631,651 | ||||||||||||||
| Ratio of ending allowance to ending loans |
3.13 | % | 3.04 | % | 3.13 | % | 3.04 | % | 3.17 | % | 3.30 | % | 3.14 | % | ||||||||||||||
| Net charge-offs (recoveries) as a percentage of: |
||||||||||||||||||||||||||||
| Provision for credit losses |
(24.33 | ) | 348.95 | 22.84 | (18.70 | ) | (16.96 | ) | 7.31 | (23.06 | ) | |||||||||||||||||
| Allowance for credit losses(1) |
14.19 | 25.08 | (7.82 | ) | 7.60 | 5.74 | (3.01 | ) | 7.01 | |||||||||||||||||||
| Allowance for credit losses as a percentage of nonperforming |
NM | 284.51 | NM | 284.24 | 280.59 | 129.53 | 144.38 | |||||||||||||||||||||
| (1) | Annualized for the three and nine months ended September 30, 2017 and 2016. |
NM—not meaningful.
151
Table of Contents
Deposits. Our strategy is to fund asset growth primarily with customer deposits in order to maintain a stable liquidity profile and a more competitive cost of funds. We categorize deposits as brokered and non-brokered consistent with the banking industry. All customer deposits are non-brokered. The following table illustrates the growth in our deposits during the periods indicated:
| Percentage Change | ||||||||||||||||||||||||||||||||||||||||||||
| Percent to Total | 3Q 2017 vs YE 2016 |
YE 2016 vs YE 2015 |
YE 2015 vs YE 2014 |
|||||||||||||||||||||||||||||||||||||||||
| September 30, 2017 |
December 31, | September 30, 2017 |
December 31, | |||||||||||||||||||||||||||||||||||||||||
| 2016 | 2015 | 2014 | 2016 | 2015 | 2014 | |||||||||||||||||||||||||||||||||||||||
| (In thousands) | ||||||||||||||||||||||||||||||||||||||||||||
| Noninterest-bearing demand |
$ | 2,071,594 | $ | 1,840,955 | $ | 1,534,433 | $ | 1,467,137 | 24.4 | % | 23.0 | % | 22.0 | % | 22.3 | % | 12.5 | % | 20.0 | % | 4.6 | % | ||||||||||||||||||||||
| Interest-bearing demand |
4,505,370 | 4,541,412 | 3,947,181 | 3,604,587 | 53.0 | 56.6 | 56.5 | 54.8 | (0.8 | ) | 15.1 | 9.5 | ||||||||||||||||||||||||||||||||
| Savings |
177,935 | 180,687 | 174,642 | 222,036 | 2.1 | 2.3 | 2.5 | 3.4 | (1.5 | ) | 3.5 | (21.4 | ) | |||||||||||||||||||||||||||||||
| Time deposits less than $100,000 |
749,265 | 605,579 | 579,417 | 538,251 | 8.8 | 7.6 | 8.3 | 8.2 | 23.7 | 4.5 | 7.7 | |||||||||||||||||||||||||||||||||
| Time deposits greater than $100,000 |
996,938 | 848,116 | 751,678 | 747,878 | 11.7 | 10.5 | 10.7 | 11.3 | 17.6 | 12.8 | 0.5 | |||||||||||||||||||||||||||||||||
|
|
|
|
|
|
|
|
|
|
|
|
|
|
|
|
|
|
|
|
|
|
|
|||||||||||||||||||||||
| Total deposits (including brokered) |
$ | 8,501,102 | $ | 8,016,749 | $ | 6,987,351 | $ | 6,579,889 | 100.0 | % | 100.0 | % | 100.0 | % | 100.0 | % | 6.0 | % | 14.7 | % | 6.2 | % | ||||||||||||||||||||||
|
|
|
|
|
|
|
|
|
|
|
|
|
|
|
|
|
|
|
|
|
|
|
|||||||||||||||||||||||
| Total brokered deposits |
$ | 824,147 | $ | 1,041,858 | $ | 887,183 | $ | 755,940 | 9.7 | % | 13.0 | % | 12.7 | % | 11.5 | % | (20.9 | )% | 17.4 | % | 17.4 | % | ||||||||||||||||||||||
|
|
|
|
|
|
|
|
|
|
|
|
|
|
|
|
|
|
|
|
|
|
|
|||||||||||||||||||||||
Non-brokered deposit growth primarily resulted from organic customer acquisition. A significant portion of the deposit growth was related to money market accounts and interest bearing checking, due to market trends in the current low rate environment shifting from traditional certificates of deposits and savings.
The following table sets forth our average deposits and the average rates expensed for the periods indicated:
| Three Months Ended | ||||||||||||||||
| September 30, 2017 | September 30, 2016 | |||||||||||||||
| (In thousands) | Average Amount Outstanding |
Average Rate Paid |
Average Amount Outstanding |
Average Rate Paid |
||||||||||||
| Noninterest-bearing demand |
$ | 1,982,784 | — | % | $ | 1,697,633 | — | % | ||||||||
| Interest-bearing deposits |
||||||||||||||||
| Interest-bearing demand |
4,329,086 | 0.67 | 4,130,126 | 0.43 | ||||||||||||
| Savings |
180,099 | 0.25 | 180,452 | 0.24 | ||||||||||||
| Time deposits |
1,648,000 | 1.36 | 1,835,371 | 1.01 | ||||||||||||
|
|
|
|
|
|
|
|
|
|||||||||
| Total interest bearing deposits |
6,157,185 | 0.84 | 6,145,949 | 0.60 | ||||||||||||
|
|
|
|
|
|
|
|
|
|||||||||
| Total average deposits |
$ | 8,139,969 | 0.64 | % | $ | 7,843,582 | 0.47 | % | ||||||||
|
|
|
|
|
|
|
|
|
|||||||||
152
Table of Contents
| Nine Months Ended | ||||||||||||||||
| September 30, 2017 | September 30, 2016 | |||||||||||||||
| (In thousands) | Average Amount Outstanding |
Average Rate Paid |
Average Amount Outstanding |
Average Rate Paid |
||||||||||||
| Noninterest-bearing demand |
$ | 1,895,754 | — | % | $ | 1,656,166 | — | % | ||||||||
| Interest-bearing deposits |
||||||||||||||||
| Interest-bearing demand |
4,338,645 | 0.59 | 4,027,944 | 0.43 | ||||||||||||
| Savings |
182,877 | 0.25 | 178,163 | 0.23 | ||||||||||||
| Time deposits |
1,618,298 | 1.25 | 1,702,380 | 1.01 | ||||||||||||
|
|
|
|
|
|
|
|
|
|||||||||
| Total interest bearing deposits |
6,139,820 | 0.75 | 5,908,487 | 0.59 | ||||||||||||
|
|
|
|
|
|
|
|
|
|||||||||
| Total average deposits |
$ | 8,035,574 | 0.58 | % | $ | 7,564,653 | 0.46 | % | ||||||||
|
|
|
|
|
|
|
|
|
|||||||||
| Year Ended December 31, | ||||||||||||||||||||||||
| 2016 | 2015 | 2014 | ||||||||||||||||||||||
| Average Amount Outstanding |
Average Rate Paid |
Average Amount Outstanding |
Average Rate Paid |
Average Amount Outstanding |
Average Rate Paid |
|||||||||||||||||||
| (In thousands) | ||||||||||||||||||||||||
| Noninterest-bearing demand |
$ | 1,688,405 | — | % | $ | 1,407,089 | — | % | $ | 1,222,625 | — | % | ||||||||||||
| Interest-bearing deposits |
||||||||||||||||||||||||
| Interest-bearing demand |
4,122,667 | 0.45 | 3,850,261 | 0.33 | 3,131,698 | 0.30 | ||||||||||||||||||
| Savings |
178,397 | 0.24 | 201,435 | 0.22 | 256,427 | 0.24 | ||||||||||||||||||
| Time deposits |
1,665,833 | 1.03 | 1,297,175 | 0.98 | 1,146,571 | 0.88 | ||||||||||||||||||
|
|
|
|
|
|
|
|
|
|
|
|
|
|||||||||||||
| Total interest bearing deposits |
5,966,897 | 0.59 | 5,348,871 | 0.48 | 4,534,696 | 0.44 | ||||||||||||||||||
|
|
|
|
|
|
|
|
|
|
|
|
|
|||||||||||||
| Total average deposits |
$ | 7,655,302 | 0.46 | % | $ | 6,755,960 | 0.38 | % | $ | 5,757,321 | 0.35 | % | ||||||||||||
|
|
|
|
|
|
|
|
|
|
|
|
|
|||||||||||||
Borrowings
The following is a summary of our borrowings for the periods indicated:
| September 30, 2017 |
December 31, | |||||||||||||||
| 2016 | 2015 | 2014 | ||||||||||||||
| (In thousands) | ||||||||||||||||
| Summary of Borrowings |
||||||||||||||||
| Securities sold under repurchase agreements |
$ | 3,146 | $ | 3,494 | $ | 5,840 | $ | 12,044 | ||||||||
| Advances from FHLB |
250,000 | — | 370,000 | — | ||||||||||||
| Senior debt, net of debt issuance cost |
184,557 | 193,788 | 193,085 | 182,459 | ||||||||||||
| Subordinated debt, net of debt issuance cost |
98,627 | 98,441 | 98,171 | 58,761 | ||||||||||||
| Junior subordinated debentures |
36,353 | 35,989 | 35,449 | 34,803 | ||||||||||||
|
|
|
|
|
|
|
|
|
|||||||||
| Total borrowings |
$ | 572,683 | $ | 331,712 | $ | 702,545 | $ | 288,067 | ||||||||
|
|
|
|
|
|
|
|
|
|||||||||
| Average total borrowings—YTD |
$ | 490,085 | $ | 452,685 | $ | 414,687 | $ | 224,263 | ||||||||
|
|
|
|
|
|
|
|
|
|||||||||
The increase in advances from the FHLB are short-term fixed and daily rate credits.
153
Table of Contents
Our securities sold under agreements to repurchase generally mature within one to seven days from the transaction date. Securities underlying the repurchase agreements remain under the control of the Bank.
On June 16, 2014, we completed a $245 million unregistered multi-tranche debt transaction and, in March 2015, we completed an unregistered $50 million debt transaction ($10 million senior; $40 million subordinated). These transactions enhanced our liquidity and the Bank’s capital levels to support balance sheet growth. Details of the debt transaction are as follows (in thousands):
| September 30, 2017 |
||||
| Senior debt |
||||
| 5-year senior holding company note, interest rate 4.875%, due June 28, 2019 |
$ | 135,000 | ||
| 7-year senior holding company note, interest rate 5.375%, due June 28, 2021 |
50,000 | |||
| 4-year senior holding company note, interest rate 4.875%, due June 28, 2019 |
10,000 | |||
|
|
|
|||
| Total senior debt |
$ | 195,000 | ||
|
|
|
|||
| Subordinated debt |
||||
| 15-year, 10-year callable, subordinated holding company note, interest rate 7.250%, due June 28, 2029 |
$ | 35,000 | ||
| 15-year, 10-year callable, subordinated Bank note, interest rate 6.250%, due June 28, 2029 |
25,000 | |||
| 10-year, 5-year callable, subordinated holding company note, interest rate 6.5000% until March 2020, variable rate at 3-month LIBOR plus 4.663% until maturity of March 2025 |
40,000 | |||
|
|
|
|||
| Total subordinated debt |
$ | 100,000 | ||
|
|
|
|||
The senior transactions completed in 2014 were structured as 5- and 7-year maturities to provide holding company liquidity and to stagger our debt maturity profile. The $25 million and $35 million subordinated debt transactions were structured with a 15-year maturity, 10-year call provision, and fixed-to-floating rate notes in order to maximize both regulatory capital treatment and flexibility. The $40 million subordinated debt transaction was structured with a 10-year maturity and a 5-year call provision. The senior transaction completed in March 2015 includes a 4-year maturity. The subordinated debt structure is designed to achieve full Tier 2 capital treatment for 10 years.
On March 21, 2014, we entered into a loan agreement with an unaffiliated third party to borrow up to $75 million, less applicable debt issuance costs, with interest payable monthly at a variable rate of LIBOR plus 5%, due monthly. Of the net cash proceeds of $73.9 million, $60 million was contributed to the Bank as equity in the first quarter of 2014. We retired the debt in June 2014 upon completion of the multi-tranche debt transaction discussed above.
154
Table of Contents
In conjunction with our acquisitions of Cadence and Encore, we assumed certain junior subordinated debentures, which were marked to their fair value as of the acquisition dates. The related mark is being amortized over the remaining term of the junior subordinated debentures. The following is a list of our junior subordinated debt as of the dates indicated:
| September 30, 2017 |
December 31, | |||||||||||||||
| 2016 | 2015 | 2014 | ||||||||||||||
| (In thousands) | ||||||||||||||||
| Junior Subordinated Debentures |
||||||||||||||||
| 3-month LIBOR plus 2.85% junior subordinated debentures, due 2033 |
$ | 30,000 | $ | 30,000 | $ | 30,000 | $ | 30,000 | ||||||||
| 3-month LIBOR plus 2.95% junior subordinated debentures, due 2033 |
5,155 | 5,155 | 5,155 | 5,155 | ||||||||||||
| 3-month LIBOR plus 1.75% junior subordinated debentures, due 2037 |
15,464 | 15,464 | 15,464 | 15,464 | ||||||||||||
|
|
|
|
|
|
|
|
|
|||||||||
| Total par value |
50,619 | 50,619 | 50,619 | 50,619 | ||||||||||||
| Purchase accounting adjustment, net of amortization |
(14,266 | ) | (14,630 | ) | (15,170 | ) | (15,816 | ) | ||||||||
|
|
|
|
|
|
|
|
|
|||||||||
| Total junior subordinated debentures |
$ | 36,353 | $ | 35,989 | $ | 35,449 | $ | 34,803 | ||||||||
|
|
|
|
|
|
|
|
|
|||||||||
Shareholders’ Equity
Tangible Common Equity
As of September 30, 2017, our ratio of shareholders’ equity to total assets was 12.77%, as compared to 11.34%, 11.96% and 12.77% as of December 31, 2016, 2015 and 2014, respectively. Our shareholders’ equity increased in 2017 as a result of earnings and our initial public offering. Our tangible common equity ratio was 9.95% as of September 30, 2017 compared to 8.13%, 8.44% and 8.78%, respectively, as of December 31, 2016, 2015 and 2014. We believe that this non-GAAP financial measure provides investors with information useful in understanding our financial performance and, specifically, our capital position. The tangible common equity ratio is calculated as tangible common shareholders’ equity divided by tangible assets. Tangible common equity is calculated as total shareholders’ equity less goodwill and other intangible assets, net, and tangible assets are total assets less goodwill and other intangible assets, net. The following table provides a reconciliation of tangible common equity to GAAP total common shareholders’ equity and tangible assets to GAAP total assets:
| September 30, 2017 |
December 31, | |||||||||||||||
| 2016 | 2015 | 2014 | ||||||||||||||
| (In thousands) | ||||||||||||||||
| Shareholders’ equity |
$ | 1,340,848 | $ | 1,080,498 | $ | 1,054,208 | $ | 1,014,337 | ||||||||
| Less: Goodwill and other intangible assets, net |
(329,124 | ) | (332,691 | ) | (339,223 | ) | (347,651 | ) | ||||||||
|
|
|
|
|
|
|
|
|
|||||||||
| Tangible common shareholders’ equity |
$ | 1,011,724 | $ | 747,807 | $ | 714,985 | $ | 666,686 | ||||||||
|
|
|
|
|
|
|
|
|
|||||||||
| Total assets |
$ | 10,502,261 | $ | 9,530,888 | $ | 8,811,511 | $ | 7,944,804 | ||||||||
| Less: Goodwill and other intangible assets, net |
(329,124 | ) | (332,691 | ) | (339,223 | ) | (347,651 | ) | ||||||||
|
|
|
|
|
|
|
|
|
|||||||||
| Tangible assets |
$ | 10,173,137 | $ | 9,198,197 | $ | 8,472,288 | $ | 7,597,153 | ||||||||
|
|
|
|
|
|
|
|
|
|||||||||
| Tangible common equity ratio |
9.95 | % | 8.13 | % | 8.44 | % | 8.78 | % | ||||||||
|
|
|
|
|
|
|
|
|
|||||||||
Regulatory Capital
We are subject to regulatory capital requirements that require us to maintain certain minimum common equity Tier 1 capital, Tier 1 leverage, Tier 1 risk-based and total risk-based ratios. At September 30, 2017, our
155
Table of Contents
capital ratios exceeded these requirements (see “Borrowing” above for details regarding subordinated debt). Our actual regulatory capital amounts and ratios at September 30, 2017 are presented in the following table:
| September 30, 2017 | ||||||||||||||||
| Cadence Bancorporation | Cadence Bank N.A. | |||||||||||||||
| (In thousands) | Amount | Ratio | Amount | Ratio | ||||||||||||
| Actual |
||||||||||||||||
| Tier 1 leverage |
$ | 1,079,726 | 11.1 | % | $ | 1,181,066 | 12.2 | % | ||||||||
| Common equity Tier 1 (CET1) |
1,042,920 | 10.8 | 1,132,506 | 11.7 | ||||||||||||
| Tier 1 risk-based capital |
1,079,726 | 11.2 | 1,181,066 | 12.2 | ||||||||||||
| Total risk-based capital |
1,273,724 | 13.2 | 1,301,129 | 13.5 | ||||||||||||
| Minimum levels |
||||||||||||||||
| Tier 1 leverage |
$ | 388,553 | 4.0 | % | $ | 388,516 | 4.0 | % | ||||||||
| Common equity Tier 1 (CET1) |
434,801 | 4.5 | 434,726 | 4.5 | ||||||||||||
| Tier 1 risk-based capital |
579,734 | 6.0 | 579,635 | 6.0 | ||||||||||||
| Total risk-based capital |
772,979 | 8.0 | 772,846 | 8.0 | ||||||||||||
| To Be Well Capitalized |
||||||||||||||||
| Tier 1 leverage |
NA | NA | $ | 485,645 | 5.0 | % | ||||||||||
| Common equity Tier 1 (CET1) |
NA | NA | 627,938 | 6.5 | ||||||||||||
| Tier 1 risk-based capital |
NA | NA | 772,846 | 8.0 | ||||||||||||
| Total risk-based capital |
NA | NA | 966,058 | 10.0 | ||||||||||||
Liquidity and Capital Resources
Overview
We measure and seek to manage liquidity risk by a variety of processes, including monitoring the composition of our funding mix; monitoring financial ratios specifically designed to measure liquidity risk; maintaining a minimum liquidity cushion; and performing forward cash flow gap forecasts in various liquidity stress testing scenarios designed to simulate possible stressed liquidity environments. We attempt to limit our liquidity risk by setting board-approved concentration limits on sources of funds and limits on liquidity ratios used to measure liquidity risk, and maintaining adequate levels of on-hand liquidity. We use the following ratios to monitor and analyze our liquidity:
| • | Total Loans to Total Deposits—the ratio of our outstanding loans to total deposits. |
| • | Non-Brokered Deposits to Total Deposits—the ratio of our deposits that are organically originated through commercial and branch activity to total deposits. |
| • | Brokered Deposits to Total Deposits—the ratio of our deposits generated through wholesale sources to total deposits. |
| • | Highly Liquid Assets to Uninsured Large Depositors—the ratio of cash and highly liquid assets to uninsured deposits with a current depository relationship greater than $10,000,000. |
| • | Wholesale Funds Usage—the ratio of our current borrowings to all available wholesale sources with potential maturities greater than one day. |
| • | Wholesale Funds to Total Assets—the ratio of current outstanding wholesale funding to assets. |
As of September 30, 2017, all of our liquidity measures were within our established guidelines.
The goal of liquidity management is to ensure that we maintain adequate funds to meet changes in loan demand or any deposit withdrawals. Additionally, we strive to maximize our earnings by investing our excess funds in securities and other assets. To meet our short-term liquidity needs, we seek to maintain a targeted cash
156
Table of Contents
position and have borrowing capacity through many wholesale sources including correspondent banks, the FHLB and the Federal Reserve Bank. To meet long-term liquidity needs, we additionally depend on the repayment of loans, sales of loans, term wholesale borrowings, brokered deposits and the maturity or sale of investment securities. See “—Maturity Distribution of Investment Securities” and “—Selected Loan Maturity and Interest Rate Sensitivity.”
Maturity Distribution of Investment Securities
The following table shows the scheduled contractual maturities, average book yields (not tax-equivalent) and duration of our investment securities held at December 31, 2016. Within our investment securities portfolio, expected maturities will differ from contractual maturities because borrowers have the right to call or prepay obligations without call or prepayment penalties in certain instances. During the nine months ended September 30, 2017, we received cash proceeds from calls/maturities and paydowns on our investment securities portfolio totaling approximately $72 million.
| Contractual Maturity | ||||||||||||||||||||||||||||||||||||||||||||
| Within One Year |
After One but Within Five Years |
After Five but Within Ten Years |
After Ten Years |
Total | ||||||||||||||||||||||||||||||||||||||||
| Amount | Yield | Amount | Yield | Amount | Yield | Amount | Yield | Amount | Yield | Duration | ||||||||||||||||||||||||||||||||||
| (In thousands) | ||||||||||||||||||||||||||||||||||||||||||||
| Investment securities |
||||||||||||||||||||||||||||||||||||||||||||
| U.S. treasury securities |
$ | — | — | % | $ | 100,736 | 0.96 | % | $ | — | — | % | $ | — | — | % | $ | 100,736 | 0.96 | % | 4.36 | |||||||||||||||||||||||
| U.S. agency securities |
2,262 | 2.15 | 5,875 | 2.45 | 7,013 | 1.96 | 82,190 | 2.16 | 97,340 | 2.15 | 4.00 | |||||||||||||||||||||||||||||||||
| Mortgage-backed securities |
— | — | 609 | 3.29 | 37,062 | 2.94 | 497,078 | 2.71 | 534,749 | 2.72 | 4.10 | |||||||||||||||||||||||||||||||||
| State, county and municipal securities |
1,514 | 5.05 | 3,561 | 4.77 | 5,656 | 5.23 | 427,924 | 4.73 | 438,655 | 4.73 | 8.13 | |||||||||||||||||||||||||||||||||
|
|
|
|
|
|
|
|
|
|
|
|
|
|||||||||||||||||||||||||||||||||
| Total amortized cost—debt securities |
3,776 | 3.31 | 110,781 | 1.17 | 49,731 | 3.07 | 1,007,192 | 3.52 | 1,171,480 | 3.28 | 5.97 | |||||||||||||||||||||||||||||||||
|
|
|
|||||||||||||||||||||||||||||||||||||||||||
| Equity securities |
5,580 | — | — | — | 5,580 | |||||||||||||||||||||||||||||||||||||||
|
|
|
|
|
|
|
|
|
|
|
|||||||||||||||||||||||||||||||||||
| Total amortized cost |
$ | 9,356 | 3.31 | % | $ | 110,781 | 1.17 | % | $ | 49,731 | 3.07 | % | $ | 1,007,192 | 3.52 | % | $ | 1,177,060 | 3.28 | % | ||||||||||||||||||||||||
|
|
|
|
|
|
|
|
|
|
|
|
|
|
|
|
|
|
|
|
|
|||||||||||||||||||||||||
157
Table of Contents
Selected Loan Maturity
The repayment of loans as they mature is a source of long-term liquidity for us. The following table sets forth our loans by category maturing within specified intervals as of December 31, 2016. The information presented is based on the contractual maturities of the individual loans, including loans that may be subject to renewal at their contractual maturity. Renewal of such loans is subject to review and credit approval, as well as modification of terms upon their maturity. Consequently, management believes this treatment presents fairly the maturity and re-pricing of the loan portfolio.
| Rate Structure for Loans Maturing Over One Year |
||||||||||||||||||||||||
| One Year or Less |
Over One Year through Five Years |
Over Five Years |
Total | Fixed Interest Rate |
Floating or Adjustable Rate |
|||||||||||||||||||
| (In thousands) | ||||||||||||||||||||||||
| Commercial and Industrial |
||||||||||||||||||||||||
| General C&I |
$ | 386,982 | $ | 1,016,053 | $ | 1,013,630 | $ | 2,416,665 | $ | 215,463 | $ | 1,814,220 | ||||||||||||
| Energy sector |
101,724 | 799,503 | 38,142 | 939,369 | 8,414 | 829,231 | ||||||||||||||||||
| Restaurant industry |
18,392 | 548,043 | 297,651 | 864,085 | 4,909 | 840,785 | ||||||||||||||||||
| Healthcare |
54,719 | 261,940 | 128,444 | 445,103 | 32,685 | 357,699 | ||||||||||||||||||
|
|
|
|
|
|
|
|
|
|
|
|
|
|||||||||||||
| Total commercial and industrial |
561,817 | 2,625,539 | 1,477,867 | 4,665,222 | 261,471 | 3,841,935 | ||||||||||||||||||
| Commercial Real Estate |
||||||||||||||||||||||||
| Income producing |
297,491 | 502,755 | 201,457 | 1,001,703 | 159,788 | 544,424 | ||||||||||||||||||
| Land and development |
6,235 | 44,087 | 20,682 | 71,004 | 22,287 | 42,482 | ||||||||||||||||||
| Total commercial real estate |
303,726 | 546,842 | 222,139 | 1,072,707 | 182,075 | 586,906 | ||||||||||||||||||
| Consumer |
||||||||||||||||||||||||
| Residential real estate |
11,821 | 24,353 | 1,420,996 | 1,457,170 | 814,236 | 631,113 | ||||||||||||||||||
| Other |
44,232 | 16,952 | 7,505 | 68,689 | 17,129 | 7,328 | ||||||||||||||||||
|
|
|
|
|
|
|
|
|
|
|
|
|
|||||||||||||
| Total consumer |
56,053 | 41,305 | 1,428,501 | 1,525,859 | 831,365 | 638,441 | ||||||||||||||||||
| Small Business Lending |
44,178 | 52,988 | 96,475 | 193,641 | 132,901 | 16,562 | ||||||||||||||||||
|
|
|
|
|
|
|
|
|
|
|
|
|
|||||||||||||
| Total loans |
$ | 965,773 | $ | 3,266,674 | $ | 3,224,982 | $ | 7,457,429 | $ | 1,407,812 | $ | 5,083,844 | ||||||||||||
|
|
|
|
|
|
|
|
|
|
|
|
|
|||||||||||||
Maturities of Time Deposits
The aggregate amount of time deposits in denominations of $100,000 or more as of September 30, 2017 and December 31, 2016, 2015 and 2014 was $996.9 million, $848.1 million, $751.7 million and $747.9 million, respectively.
At September 30, 2017, the scheduled maturities of time deposits greater than $100,000 were as follows:
| September 30, 2017 | ||||||||
| (In thousands) | Amount | Average Interest Rate |
||||||
| Under 3 months |
$ | 43,963 | 0.84 | % | ||||
| 3 to 6 months |
111,533 | 1.14 | ||||||
| 6 to 12 months |
383,238 | 1.35 | ||||||
| 12 to 24 months |
393,950 | 1.60 | ||||||
| 24 to 36 months |
45,351 | 1.61 | ||||||
| 36 to 48 months |
8,676 | 1.57 | ||||||
| Over 48 months |
10,227 | 1.39 | ||||||
|
|
|
|
|
|||||
| Total |
$ | 996,938 | 1.42 | % | ||||
|
|
|
|
|
|||||
158
Table of Contents
Cash Flow Analysis
Cash and cash equivalents
At September 30, 2017, we had $589.4 million cash and cash equivalents on hand, an increase of $340.5 million or 136.8% over our cash and cash equivalents of $248.9 million at December 31, 2016. At September 30, 2017 our cash and cash equivalents comprised 5.61% of total assets compared to 2.61% at December 31, 2016. We monitor our liquidity position and increase or decrease our short-term liquid assets as necessary. The higher balance in cash and cash equivalents at September 30, 2017 is due to timing of net loan fundings and customer deposits at the end of the quarter.
Nine Months Ended September 30, 2017 Compared to September 30, 2016
As shown in the Condensed Consolidated Statements of Cash Flows, operating activities provided $149.8 million in the nine months ended September 30, 2017 compared to $71.7 million in the nine months ended September 30, 2016. The increase in operating funds during the nine months ended September 30, 2017 was due primarily to an increase in net income and an increase in proceeds from the sale of held for sale loans, offset by an increase in originations of loans held for sale and a decrease in other assets related to the refund of a bid deposit made in the fourth quarter of 2016 to acquire a large treasury management deposit account.
Investing activities during the nine months ended September 30, 2017 used $689.4 million of net funds, primarily due to net loan fundings of $614.0 million and purchases of securities of $278.3 million, partially offset by sales and other cash flows from available for sale securities. This compares to investing activities during the nine months ended September 30, 2016 using $670.0 million of net funds, primarily due to net loan fundings of $654.5 million and the purchase of available for sale securities of $743.2 million, partially offset by sales of certain commercial loans of $328.8 million.
Financing activities during the nine months ended September 30, 2017 provided net funds of $880.0 million, due to $250.0 million in advances from FHLB, net proceeds of $155.6 million from the issuance of common stock and an increase in deposits of $484.4 million. This compares to financing activities during the nine months ended September 30, 2016 providing net funds of $559.0 million, resulting from an increase in deposits of $930.0 million and a decrease in short-term FHLB borrowings of $370.0 million.
Year Ended December 31, 2016 Compared to December 31, 2015
As shown in the Condensed Consolidated Statements of Cash Flows, operating activities provided $118.0 million in the year ended December 31, 2016 compared to $110.2 million in the year ended December 31, 2015. The increase in operating funds during the year ended December 31, 2016 was due primarily to an increase in net income.
Investing activities during the year ended December 31, 2016 were a $993.4 million net user of funds, primarily due to loan funding and the purchase of certain available for sale securities. This compares to investing activities during the year ended December 31, 2015 of $1.188 billion net use of funds, which was primarily due to an increase in loan funding of $805.1 million and net cash used in branch sales of $208.4 million.
Financing activities were a net provider of funds during the year ended December 31, 2016 of $657.1 million, as an increase in deposits provided $1.030 billion in funds and we repaid $370 million in advances from FHLB. This compares to net funds provided of $1.1 billion, resulting from an increase in deposits of $661.9 million, increase in short-term FHLB borrowings and the issuance of debt.
Year Ended December 31, 2015 Compared to December 31, 2014
As shown in the Consolidated Statements of Cash Flows, operating activities provided $110.2 million in 2015 compared to $92.7 million in 2014. The increase in operating funds during 2015 is primarily due to a net
159
Table of Contents
increase in the proceeds from the sale of mortgage loans held for sale over a net use of funds from the origination of mortgage loans held for sale and a decline in the amount of accrued interest receivable.
Investing activities in 2015 resulted in a $1.2 billion net use of funds, primarily due to an increase in loan funding of $805.1 million and net cash used in branch sales of $208.4 million. Investing activities during 2014 resulted in a $1.4 billion net use of funds primarily due to an increase in loan funding of $1.4 billion offset in part by proceeds from the sale of foreclosed property of $50.8 million.
Financing activities were a $1.1 billion net provider of funds in 2015, resulting from an increase in deposits of $661.9 million, increase in short-term FHLB borrowings and the issuance of debt. Financing activities were a $1.4 billion net provider of funds in 2014, resulting from an increase in deposits of $1.2 billion and issuance of debt.
Contractual Cash Obligations
We have entered into certain contractual obligations and commercial commitments in the normal course of business that involve elements of credit risk, interest rate risk and liquidity risk.
The following tables summarize these relationships as of December 31, 2016 by contractual cash obligations and commercial commitments:
| Payments Due by Period | ||||||||||||||||||||
| Total | Less than One Year |
One to Three Years |
Four to Five Years |
After Five Years |
||||||||||||||||
| (In thousands) | ||||||||||||||||||||
| Contractual Cash Obligations |
||||||||||||||||||||
| Senior debt |
$ | 195,000 | $ | — | $ | 145,000 | $ | 50,000 | $ | — | ||||||||||
| Operating leases(1) |
56,832 | 9,793 | 18,383 | 15,031 | 13,625 | |||||||||||||||
| Subordinated debt |
100,000 | — | — | — | 100,000 | |||||||||||||||
| Junior subordinated debentures |
50,619 | — | — | — | 50,619 | |||||||||||||||
| Limited partnership investments(2) |
14,738 | 14,660 | 26 | 26 | 26 | |||||||||||||||
| Other(3) |
3,762 | 164 | 924 | 384 | 2,290 | |||||||||||||||
|
|
|
|
|
|
|
|
|
|
|
|||||||||||
| Total contractual cash obligations |
$ | 420,951 | $ | 24,617 | $ | 164,333 | $ | 65,441 | $ | 166,560 | ||||||||||
|
|
|
|
|
|
|
|
|
|
|
|||||||||||
| (1) | See Note 4 to our 2016 Consolidated Financial Statements. The above includes rent and other cost due under the lease such as property taxes. |
| (2) | Includes remaining capital commitments to certain limited partnership investments. |
| (3) | Represents unfunded post-retirement benefit obligations of the legacy banks. See Note 13 to our 2016 Consolidated Financial Statements. |
The following table includes our commitments to extend credit including home equity lines, overdraft protection lines and letters of credit as of September 30, 2017.
| Commitments by Period | ||||||||||||||||||||
| Total | Less than One Year |
One to Three Years |
Four to Five Years |
After Five Years |
||||||||||||||||
| (In thousands) | ||||||||||||||||||||
| Commitments to extend credit |
$ | 3,035,455 | $ | 601,478 | $ | 1,128,929 | $ | 1,056,871 | $ | 248,177 | ||||||||||
| Standby letters of credit |
102,145 | 18,323 | 48,901 | 34,921 | — | |||||||||||||||
| Performance letters of credit |
22,635 | 12,317 | 6,968 | 3,350 | — | |||||||||||||||
| Commercial letters of credit |
1,797 | — | 1,408 | 389 | — | |||||||||||||||
|
|
|
|
|
|
|
|
|
|
|
|||||||||||
| Total |
$ | 3,162,032 | $ | 632,119 | $ | 1,186,206 | $ | 1,095,531 | $ | 248,177 | ||||||||||
|
|
|
|
|
|
|
|
|
|
|
|||||||||||
160
Table of Contents
Such financial instruments are recorded when they are funded and not on the date of entry into the obligation to extend credit. Commitments to extend credit and letters of credit include some exposure to credit loss in the event of default by the customer and exposure to liquidity risk during economic downturns. See “Risk Factors—Risks Relating to Our Business.” The borrowing needs of our clients may increase, especially during a challenging economic environment, which could result in increased borrowing against our contractual obligations to extend credit. Commitments to extend credit are agreements to lend to a customer as long as there is no violation of any condition established in the contract. Letters of credit are conditional commitments issued to guarantee the performance of a customer to a third party. The credit policies and procedures for such commitments are the same as those used for lending activities. Because these instruments have fixed maturity dates and because a number expire without being drawn upon, they generally do not present significant liquidity risk in a normal operating environment. No significant losses on commitments were incurred during the periods ended September 30, 2017 and December 31, 2016, 2015 or 2014. We do not currently anticipate any significant future losses as a result of these transactions.
Quantitative and Qualitative Disclosures about Market Risk
Market risk is the exposure to unanticipated changes in net interest earnings or changes in the fair value of financial instruments due to fluctuations in interest rates, exchange rates and equity prices. Our primary market risk is interest rate risk.
Interest Rate Risk (“IRR”) is the risk that changing market interest rates may lead to an unexpected decline in our earnings or capital. The main causes of interest rate risk are the differing structural characteristics of the balance sheet’s assets, liabilities and off balance sheet obligations and their cumulative net reaction to changing interest rates. These structural characteristics include timing differences in maturity or repricing and the effect of embedded options such as loan prepayments, securities prepayments and calls, interest rate caps and floors, and deposit withdrawal options. In addition to these sources of interest rate risk, basis risk results from differences in the spreads between various market interest rates and changes in the slope of the yield curve which can contribute to additional interest rate risk.
We evaluate interest rate risk and develop guidelines regarding balance sheet composition and re-pricing, funding sources and pricing, and off-balance sheet commitments that aim to moderate interest rate risk. We use computer simulations that reflect various interest rate scenarios and the related impact on net interest income over specified periods of time. We refer to this process as asset/liability management, or “ALM.”
The primary objective of ALM is to seek to manage interest rate risk and desired risk tolerance for potential fluctuations in net interest income (“NII”) throughout interest rate cycles, which we aim to achieve by maintaining a balance of interest rate sensitive earning assets and liabilities. In general, we seek to maintain a desired risk tolerance with asset and liability balances within maturity and repricing categories to limit our exposure to earnings volatility and changes in the value of assets and liabilities as interest rates fluctuate over time. Adjustments to maturity categories can be accomplished either by lengthening or shortening the duration of either an individual asset or liability category, or externally with interest rate contracts, such as interest rate swaps, caps and floors. See “—Interest Rate Exposures” for a more detailed discussion of our various derivative positions.
Our asset and liability management strategy is formulated and monitored by our Asset/Liability Management Committee (“ALCO”) in accordance with policies approved by the board of directors. The ALCO meets regularly to review, among other things, the sensitivity of our assets and liabilities to interest rate changes, the book and market values of assets and liabilities, unrealized gains and losses, recent purchase and sale activity, maturities of investments and borrowings, and projected future transactions. The ALCO also establishes and approves pricing and funding decisions with respect to overall asset and liability composition. The ALCO reports regularly to our board of directors.
161
Table of Contents
Financial simulation models are the primary tools we use to measure interest rate risk exposures. By examining a range of hypothetical deterministic interest rate scenarios, these models provide management with information regarding the potential impact on NII and Economic Value of Equity (“EVE”) caused by changes in interest rates.
The models simulate the cash flows and accounting accruals generated by the financial instruments on our balance sheet at a given month-end, as well as the cash flows generated by the new business we anticipate over a 36-month forecast horizon. Numerous assumptions are made in the modeling process, including balance sheet composition, the pricing, re-pricing and maturity characteristics of existing business and new business. Additionally, loan and investment prepayment, administered rate account elasticity and other option risks are considered as well as the uncertainty surrounding future customer behavior. Because of the limitations inherent in any approach used to measure interest rate risk and because our loan portfolio will be actively managed in the event of a change in interest rates, simulation results, including those discussed in “—Interest Rate Exposures” immediately below, are not intended as a forecast of the actual effect of a change in market interest rates on our net interest income or results of operations or indicative of management’s expectations of actual results in the event of a fluctuation in market interest rates.
Interest Rate Exposures
The Bank’s net interest income simulation model projects that net interest income over a 12-month horizon will increase on an annual basis by 3.51%, or approximately $12.4 million, assuming an instant increase in interest rates of 100 basis points, by 6.93%, or approximately $24.5 million, assuming an instant increase in interest rates of 200 basis points and decrease by 3.81% or approximately $13.5 million, assuming an instant decrease in interest rates of 100 basis points. Based upon the current interest rate environment as of September 30, 2017, our sensitivity to interest rate risk was as follows:
| Change (in Basis Points) in Interest Rates (12-Month Projection) |
Increase (Decrease) | |||||||||||||||
| Net Interest Income | Economic Value of Equity | |||||||||||||||
| Amount | Percent | Amount | Percent | |||||||||||||
| (In millions) | ||||||||||||||||
| + 200 BP |
$ | 24.5 | 6.93 | % | $ | 365.8 | 18.07 | % | ||||||||
| + 100 BP |
12.4 | 3.51 | 205.7 | 10.16 | ||||||||||||
| —100 BP |
(13.5 | ) | (3.81 | ) | (281.1 | ) | (13.88 | ) | ||||||||
Based upon the current interest rate environment as of September 30, 2017, the following table reflects our sensitivity to a gradual increase or decrease in interest rates over a 12-month period:
| Change (in Basis Points) in Interest Rates (12-Month Projection) |
Increase (Decrease) | |||||||
| Net Interest Income | ||||||||
| Amount | Percent | |||||||
| (In millions) | ||||||||
| + 200 BP |
$ | 24.6 | 6.97 | % | ||||
| + 100 BP |
12.4 | 3.52 | ||||||
| —100 BP |
(13.2 | ) | (3.73 | ) | ||||
| —200 BP |
(28.9 | ) | (8.16 | ) | ||||
Both the NII and EVE simulations include assumptions regarding balances, asset prepayment speeds, deposit repricing and runoff and interest rate relationships among balances that management believes to be reasonable for the various interest rate environments. Differences in actual occurrences from these assumptions, as well as non-parallel changes in the yield curve, may change our market risk exposure.
162
Table of Contents
Derivative Positions
Overview. Our board of directors has authorized the ALCO to utilize financial futures, forward sales, options, interest rate swaps, caps and floors, and other instruments to the extent appropriate, in accordance with regulations and our internal policy. We expect to use interest rate swaps, caps and floors as macro hedges against inherent rate sensitivity in our securities portfolio, our loan portfolio and our liabilities.
Positions for hedging purposes are undertaken primarily as a mitigation of three main areas of risk exposure: (1) mismatches between assets and liabilities; (2) prepayment and other option-type risks embedded in our assets, liabilities and off-balance sheet instruments; and (3) the mismatched commitments for mortgages and funding sources.
We currently intend to engage in only the following types of hedges: (1) those which synthetically alter the maturities or re-pricing characteristics of assets or liabilities to reduce imbalances; (2) those which enable us to transfer the interest rate risk exposure involved in our daily business activities; and (3) those which serve to alter the market risk inherent in our investment portfolio, mortgage pipeline, or liabilities and thus help us to match the effective maturities of the assets and liabilities. Our current interest rate hedges will begin to roll off at the end of 2017 and we do not currently expect to enter into interest rate swaps or like arrangements in the near-term.
The following is a discussion of our primary derivative positions.
Interest Rate Lock Commitments. We enter into certain commitments with customers in connection with residential mortgage loan applications. Such commitments are considered derivatives under current accounting guidance and are required to be recorded at fair value. The change in fair value of these instruments is reflected currently in earnings in mortgage banking revenue.
Forward Sales Commitment. To mitigate the effect of the interest rate risk inherent in providing interest rate lock commitments to customers, we enter into forward sales commitments of mortgage-backed securities (“MBS”) with investors. During the period from commitment date to closing date, we are subject to the risk that market rates of interest may change. In an effort to mitigate such risk, we may establish forward delivery sales commitments under which we agree to deliver certain MBS. These commitments are non-hedging derivatives in accordance with current accounting guidance and recorded at fair value, with changes in fair value reflected currently in earnings in mortgage banking revenue.
Forward Purchase Commitments. If we determine that the amount of our forward sales commitments exceeds the amount necessary to mitigate the interest rate risk in the rate lock commitments, we will seek to enter into forward purchase commitments to purchase MBS on an agreed-upon date and price similar to the terms of forward sales commitments. These commitments are non-hedging derivatives in accordance with current accounting guidance and recorded at fair value, with changes in fair value reflected currently in earnings in mortgage banking revenue.
Interest Rate Swaps/Cap Agreements not Designated as Hedging Derivatives. To attempt to meet the financing needs and interest rate risk management needs of our customers, we enter into interest rate swap, floor or cap agreements related to commercial loans with customers while at the same time entering into an offsetting interest rate agreements with another financial institution in order to minimize our interest rate risk. These interest rate swap agreements are non-hedging derivatives and are recorded at fair value with changes in fair value reflected in earnings in other noninterest income. The fair value of these derivatives is recorded on the consolidated balance sheet in other assets and other liabilities.
Cash Flow Hedges. Cash flow hedge relationships mitigate exposure to the variability of future cash flows or other forecasted transactions. We use interest rate swaps to manage overall cash flow changes related to interest rate risk exposure on benchmark interest rate loans (1-Month LIBOR). In June 2015 and March 2016, we
163
Table of Contents
entered into interest rate swap agreements with notional values totaling $982 million and $350 million, respectively, to manage overall cash flow changes related to interest rate risk exposure on the 1-Month LIBOR rate indexed loans. The following is a detail of our cash flow hedges as of September 30, 2017:
| Effective Date |
Maturity Date | Notional Amount (In Thousands) |
Fixed Rate | Variable Rate | ||||||||||||
| June 15, 2015 |
December 17, 2018 | $ | 382,000 | 1.3250 | % | 1 Month LIBOR | ||||||||||
| June 30, 2015 |
December 31, 2019 | 300,000 | 1.5120 | % | 1 Month LIBOR | |||||||||||
| June 30, 2015 |
December 29, 2017 | 300,000 | 0.9530 | % | 1 Month LIBOR | |||||||||||
| March 8, 2016 |
February 27, 2026 | 175,000 | 1.5995 | % | 1 Month LIBOR | |||||||||||
| March 8, 2016 |
February 27, 2026 | 175,000 | 1.5890 | % | 1 Month LIBOR | |||||||||||
The following summarizes all derivative positions as of September 30, 2017:
| September 30, 2017 | ||||||||||||
| Notional Amount |
Fair Value | |||||||||||
| Other Assets |
Other Liabilities |
|||||||||||
| (In thousands) | ||||||||||||
| Derivatives designated as hedging instruments (cash flow hedges): |
||||||||||||
| Commercial loan interest rate swaps |
$ | 1,332,000 | $ | — | $ | 15,830 | ||||||
| Derivatives not designated as hedging instruments: |
||||||||||||
| Commercial loan interest rate swaps |
718,686 | 2,481 | 2,481 | |||||||||
| Commercial loan interest rate caps |
267,347 | 104 | 104 | |||||||||
| Commercial loan interest rate floors |
265,515 | 48 | 48 | |||||||||
| Mortgage loan held for sale interest rate lock commitments |
10,051 | — | 123 | |||||||||
| Mortgage loan forward sale commitments |
5,384 | — | 6 | |||||||||
| Mortgage loan held for sale floating commitments |
10,754 | — | — | |||||||||
| Foreign exchange contracts |
45,659 | 713 | 696 | |||||||||
|
|
|
|
|
|
|
|||||||
| Total derivatives not designated as hedging instruments |
1,323,396 | 3,346 | 3,458 | |||||||||
|
|
|
|
|
|
|
|||||||
| Total derivatives |
$ | 2,655,396 | $ | 3,346 | $ | 19,288 | ||||||
|
|
|
|
|
|
|
|||||||
Counterparty Credit Risk
Derivative contracts involve the risk of dealing with both bank customers and institutional derivative counterparties and their ability to meet contractual terms. Our policies require that institutional counterparties must be approved by our ALCO and all positions over and above the minimum transfer amounts are secured by marketable securities or cash.
Critical Accounting Policies and Estimates
Our consolidated financial statements are prepared in accordance with GAAP. Application of these principles requires management to make complex and subjective estimates and judgments that affect the amounts reported in the consolidated financial statements and accompanying notes. We base our estimates on historical experience and on various other assumptions that we believe to be reasonable under current circumstances.
These assumptions form the basis for our judgments about the carrying values of assets and liabilities that are not readily available from independent, objective sources. We evaluate our estimates on an ongoing basis. Use of alternative assumptions may have resulted in significantly different estimates.
Actual results may differ from these estimates.
164
Table of Contents
Accounting policies are an integral part of our financial statements. A thorough understanding of these accounting policies is essential when reviewing our reported results of operations and our financial position. The critical accounting policies and estimates discussed below involve additional management judgment due to the complexity and sensitivity of the methods and assumptions used.
Pursuant to the JOBS Act, as an emerging growth company, we can elect to opt out of the extended transition period for adopting any new or revised accounting standards. We have elected not to opt out of such extended transition period, which means that when a standard is issued or revised and it has different application dates for public or private companies, we may adopt the standard for the private company. This may make comparison of our financial statements with any other public company that is neither an emerging growth company, nor an emerging growth company which has opted out of using the extended transition period, difficult or impossible because of the potential differences in accounting standards used.
We have elected to take advantage of the scaled disclosures and other relief under the JOBS Act described above in this prospectus (see “Implications of Being an Emerging Growth Company”), and we may take advantage of some or all of the reduced regulatory and reporting requirements that will be available to us under the JOBS Act, so long as we qualify as an emerging growth company, including, but not limited to, not being required to comply with the auditor attestation requirements of Section 404 of the Sarbanes-Oxley Act, reduced disclosure obligations regarding executive compensation in our periodic reports and proxy statements, and exemptions from the requirements of holding a nonbinding advisory vote on executive compensation and shareholder approval of any golden parachute payments not previously approved.
Business Combinations
We account for transactions that meet the definition of a purchase business combination by recording the assets acquired and liabilities assumed at their fair value upon acquisition. Intangible assets, indemnification contracts and contingent consideration are identified and recognized individually. If the fair value of the assets acquired exceeds the purchase price plus the fair value of the liabilities assumed, a bargain purchase gain is recognized. Conversely, if the purchase price plus the fair value of the liabilities assumed exceeds the fair value of the assets acquired, goodwill is recognized.
Goodwill and Other Intangible Assets
Goodwill is accounted for in accordance with FASB Accounting Standards Codification (“ASC”) Topic 350, and accordingly is not amortized but is evaluated for impairment at least annually, in the fourth quarter or between annual tests if an event occurs or circumstances change that would more likely than not reduce the fair value of a reporting unit below its carrying amount.
Under ASC 350-20, a company is required to assign and then test goodwill for impairment at the reporting unit level. A reporting unit is defined as an operating segment or a component of that operating segment, as defined in ASC 280. Reporting units may vary, depending on the level at which performance of the segment is reviewed. No impairment has been identified in any period presented.
Our other identifiable intangible assets consist primarily of the core deposit premiums and customer relationships arising from our acquisitions. These intangibles were established using the discounted cash flow approach and are being amortized using an accelerated method over the estimated remaining life of each intangible recorded at acquisition. These finite-lived intangible assets are reviewed for impairment when events or changes in circumstances indicate that the asset’s carrying amount may not be recoverable from undiscounted future cash flows or that it may exceed its fair value. No impairment has been identified in any period presented.
Fair Value Measurement
We use estimates of fair value in applying various accounting standards for our consolidated financial statements. Fair value measurements are used in one of four ways: (1) in the consolidated balance sheet with
165
Table of Contents
changes in fair value recorded in the consolidated statements of operations and other comprehensive income (loss); (2) in the consolidated balance sheet for instruments carried at the lower of cost or fair value with impairment charges recorded in the consolidated statements of operations and other comprehensive income (loss); and (3) in the notes to our consolidated financial statements.
Fair value is defined as the price at which an asset may be sold or a liability may be transferred in an orderly transaction between willing and able market participants. In general, our policy in estimating fair values is to first look at observable market prices for identical assets and liabilities in active markets, where available. When these are not available, other inputs are used to model fair value such as prices of similar instruments, yield curves, volatilities, prepayment speeds, default rates and credit spreads (including for our liabilities).
Depending on the availability of observable inputs and prices, different valuation models could produce materially different fair value estimates. The values presented may not represent future fair values and may not be realizable.
Allowance for Credit Losses
The ACL represents management’s estimate of probable credit losses inherent in our loan portfolio and the difference between the recorded investment and the present values of our most recent estimates of expected cash flows for purchased impaired loans where we have identified additional impairment subsequent to the date of acquisition. Determining the amount of the ACL is considered a critical accounting estimate because it requires significant judgment and the use of estimates related to the amount and timing of expected future cash flows on impaired loans, estimated losses based on risk characteristics of loans and consideration of other qualitative factors, all of which may be susceptible to significant change.
The ACL is maintained at a level that management believes is adequate to absorb all probable losses on loans inherent in the loan portfolio as of the reporting date. Events that are not within our control, such as changes in economic factors, could change subsequent to the reporting date and could cause the ACL to be overstated or understated. The amount of the ACL is affected by loan charge-offs, which decrease the ACL; recoveries on loans previously charged off, which increase the ACL; and the provision for credit losses charged to earnings, which increases the ACL. In determining the provision for credit losses, management monitors fluctuations in the ACL resulting from actual charge-offs and recoveries and reviews the size and composition of the loan portfolio in light of current and anticipated economic conditions. See Notes 1 and 3 to the Consolidated Financial Statements for additional disclosure regarding our ACL.
Accounting for Acquired Loans
We account for our acquisitions using the acquisition method of accounting. All identifiable assets acquired, including loans, are recorded at fair value as of their respective acquisition dates. No allowance for credit losses related to the acquired loans is recorded on the acquisition date, as the fair value of the loans acquired incorporates assumptions regarding credit risk. Loans acquired are recorded at fair value, exclusive of the impact of guarantees under any applicable loss sharing agreements with the FDIC. The fair value estimates associated with the loans include estimates related to expected prepayments and the amount and timing of undiscounted expected principal, interest and other cash flows.
Loans acquired in a transfer, including business combinations, with respect to which there is evidence of credit deterioration since origination and it is probable at the date of acquisition that we will not collect all contractually required principal and interest payments, are accounted for under accounting guidance for ACI loans. We have applied this guidance to each of our acquisitions; including our FDIC-assisted acquisition of the Superior franchise and our open market acquisitions of Cadence and Encore. For each acquisition, we have aggregated the ACI loans into pools of loans with common risk characteristics. Over the life of these acquired loans, we continue to estimate cash flows expected to be collected on individual loans or on pools of loans
166
Table of Contents
sharing common risk characteristics. For each pool of loans, we estimate cash flows expected to be collected over the remaining life of the pool’s loans, based on assumptions about yields, prepayments and magnitude and timing of credit losses, and discount those cash flows to present value using effective interest rates to calculate the carrying value. The difference between our carrying value in the loans and our estimates of cumulative lifetime undiscounted expected cash flows represents the accretable yield. The accretable yield represents the amount we expect to recognize as interest income over the remaining life of the loans. The difference between the cash flows that our customers legally owe us under the contractual terms of their loan agreements and our cumulative lifetime expected cash flows represents the nonaccretable difference. The nonaccretable difference of a pool is a measure of the expected credit loss, prepayments and other factors affecting expected cash flows for that pool.
Each quarter, we estimate the expected cash flows for each pool or specifically reviewed loan and evaluate whether the present value of future expected cash flows for each pool or loan has decreased below its carrying value and, if so, we recognize a provision for credit loss in our consolidated statement of operations for that pool or loan and appropriately adjust the amount of accretable yield. The expected cash flows are estimated based on factors which include loan grades established in our ongoing credit review program, past due status, likelihood of default based on observations of specific loans during the credit review process as well as applicable industry data, loss severity based on updated evaluation of cash flow from available collateral, and the contractual terms of the underlying loan agreement. For any pool or loan where the present value of our most recent estimate of future cumulative lifetime cash flows has increased above its recorded investment, we transfer appropriate estimated cash flows from non-accretable difference to accretable yield, which is then recognized in income first in the reversal of any impairment, then on a prospective basis through an increase in the pool’s or individual loan yield over its remaining life. For further discussion of our acquisitions and loan accounting, see Notes 1 and 3 to our consolidated financial statements.
Other Real Estate Owned
Assets acquired through, or in lieu of, loan foreclosure are held for sale and are initially recorded at the fair value of the collateral at the date of foreclosure based on estimates, including some obtained from third parties, less estimated costs to sell, establishing a new cost basis. Subsequent to foreclosure, valuations are periodically performed by management, and the assets are carried at the lower of cost or fair value, less estimated costs to sell. Significant property improvements that enhance the salability of the property are capitalized to the extent that the carrying value does not exceed estimated realizable value. Legal fees, maintenance and other direct costs of foreclosed properties are expensed as incurred. Given the number of properties included in OREO, and the judgment involved in estimating fair value of the properties, accounting for OREO is regarded as a critical accounting policy.
Deferred Tax Asset
ASC 740-30-25 provides accounting guidance for determining when a company is required to record a valuation allowance on its deferred tax assets. A valuation allowance is required for deferred tax assets if, based on available evidence, it is more likely than not that all or some portion of the asset may not be realized due to the inability to generate sufficient taxable income in the period and/or of the character necessary to utilize the benefit of the deferred tax asset. In making this assessment, all sources of future taxable income must be considered, including taxable income in prior carryback years, future reversals of existing taxable temporary differences, tax planning strategies and future taxable income exclusive of reversing taxable temporary differences and carryforwards.
Management assesses the valuation allowance recorded against deferred tax assets at each reporting period. The determination of whether a valuation allowance for deferred tax assets is appropriate is subject to considerable judgment and requires an evaluation of all positive and negative evidence. Management concluded, based on the assessment of all of the positive and negative evidence, it was more likely than not the net deferred
167
Table of Contents
tax asset of $83.7 million and $66.7 at December 31, 2016 and 2015, respectively, will be realized. This conclusion was based primarily on projections of future taxable income and the expected reversal of existing deferred tax liabilities.
Management’s estimate of future taxable income is based on internal projections, various internal assumptions, as well as certain external data all of which management believes to be reasonable although inherently subject to significant judgment. Projected future taxable income is expected to be generated through loan growth at the bank, revenue growth due to cross selling initiatives, the development of new business, and the reduction of expenses through economies of scale all in the context of a macro-economic environment that continues to trend favorably. If actual results differ significantly from the current estimates of future taxable income, even if caused by adverse macroeconomic conditions, a valuation allowance may need to be recorded for some or all our deferred tax asset. Such an increase to the deferred tax asset valuation allowance could have a material adverse effect on our financial condition and results of operations.
Recently Issued Accounting Standards
See Note 1—Summary of Accounting Policies to the consolidated financial statements for information regarding recently issued accounting standards.
Changes in and Disagreements with Accountants on Accounting and Financial Disclosure
KPMG LLP was previously the principal accountants for Cadence Bancorporation. That firm was dismissed on June 20, 2016 and Ernst & Young LLP was subsequently engaged as principal accountants pursuant to an engagement letter dated August 9, 2016. The decision to change accountants was recommended and approved by the Board of Directors.
During the two fiscal years ended December 31, 2015 and the subsequent interim period through June 20, 2016, there were no (i) disagreements with KPMG LLP on any matter of accounting principles or practices, financial statement disclosure or auditing scope or procedures, which disagreements if not resolved to their satisfaction would have caused them to make reference in connection with their opinion to the subject matter of the disagreement or (ii) reportable events within the meaning of Item 304(a)(1)(v) of Regulation S-K.
The audit reports of KPMG LLP on the consolidated financial statements of Cadence Bancorporation and subsidiaries as of and for the years ended December 31, 2015 and 2014 did not contain any adverse opinion or disclaimer of opinion, nor were they qualified or modified as to uncertainty, audit scope or accounting principles.
During the fiscal years ended December 31, 2015 and 2014 and during the period from January 1, 2016 through June 20, 2016, neither we nor anyone on our behalf has consulted with Ernst & Young LLP regarding (i) the application of accounting principles to a specified transaction, either completed or proposed, or the type of audit opinion that might be rendered on our financial statements, and neither a written report was provided to us or oral advice was provided that Ernst & Young LLP concluded was an important factor considered by us in reaching a decision as to the accounting, auditing or financial reporting issue; or (ii) any matter that was the subject of a disagreement within the meaning of Item 304(a)(1)(iv) and the related instructions to Item 304 of Regulation S-X, or any reportable event as that term is defined in Item 304(a)(1)(v) of Regulation S-K.
In accordance with Item 304(a)(3) of Regulation S-K, we have provided KPMG LLP with a copy of the foregoing disclosure and requested that KPMG LLP furnish us with a letter addressed to the SEC stating whether or not KPMG LLP agrees with the above statements. A copy of such letter, dated March 17, 2017, is filed as an exhibit to the registration statement of which this prospectus is a part.
168
Table of Contents
Company Overview
Cadence Bancorporation is a bank holding company and a Delaware corporation headquartered in Houston, Texas, and is the parent company of Cadence Bank. Formed in 2009 by banking industry veterans, we secured $1.0 billion of capital commitments in 2010 and built our franchise on the heels of three successful acquisitions: Cadence Bank, N.A. in March 2011, the franchise of Superior Bank in April 2011 and Encore Bank, N.A. in July 2012. Today, we are a growth-oriented, middle-market focused commercial relationship bank providing a broad range of banking and wealth management services to businesses, high net worth individuals, business owners and retail customers through a network of 65 branches as of September 30, 2017, with branches in Alabama (25), Florida (14), Texas (11), Mississippi (11) and Tennessee (4). We completed our initial public offering and listing on the NYSE in April 2017. As of September 30, 2017, we had $10.5 billion of assets, $8.0 billion of gross loans, $8.5 billion in deposits and $1.3 billion in shareholders’ equity. We generated $87.7 million of net income for the nine months ended September 30, 2017 and $65.8 million of net income for the year ended December 31, 2016.
We are focused on expanding our position in our markets primarily through organic growth, but also through strategic merger and acquisition opportunities. Through our experienced and motivated team of commercial relationship managers and our integrated, client-centric approach to banking, we have successfully grown each of our businesses. We believe our franchise is positioned for continued growth as a result of (i) our attractive geographic footprint, (ii) our focus and ability to provide differentiated, customized service to a wide variety of industries and clients, (iii) our stable and cost efficient deposit funding base, (iv) our veteran board of directors, management team and relationship managers, (v) our capital position and (vi) our credit quality and risk management processes.
Business Segments
We are a full service commercial bank focused on building long-lasting relationships with our customers. We provide a variety of deposit products and lending services to commercial and consumer customers, as well as wealth management, insurance and private banking services. We operate through three operating segments: Banking, Financial Services and Corporate.
Banking Segment
Banking is our primary operating segment and offers a range of deposit products and lending services through our Commercial Banking, Retail Banking and Private Banking business lines. As of September 30, 2017, we had $8.0 billion of gross loans and $8.5 billion of deposits. Since December 31, 2012, our loans and deposits have grown at a 15.8% and 13.6% compound annual growth rate (which we sometimes refer to as “CAGR”), respectively.
| Loan Composition (30-Sep-17) | Deposit Composition (30-Sep-17) | |
|
|
|
Note: Percentages do not equal 100% due to rounding.
169
Table of Contents
The quality of our deposit franchise and access to stable funding are key components of our success. We offer traditional retail deposit products, including checking accounts, savings accounts, money market accounts and other deposit accounts through our branch network and our online, mobile and telephone banking platforms. Additionally, we offer our commercial clients a host of deposit products and treasury and cash management services. Our deposits provide meaningful franchise value as a cost efficient and stable source of funding to support our growth. As of September 30, 2017, we had $8.5 billion of total deposits with a total deposit cost of 0.58% (0.52% excluding brokered deposits) for the third quarter of 2017.
Commercial Banking. Commercial banking is the core foundation of our business, and we believe our client-centric approach and focus on delivering unmatched customer service to our middle-market relationships (characterized as businesses with annual revenues of $10 million to $500 million) sets us apart from our peers. Our relationships are founded on our ability to provide a differentiated customer experience through our ability to deliver an increased level of service, quick decision-making and tailored solutions to our clients. Our team of 55 commercial relationship managers and seven senior executives maintains over 6,300 relationships. We provide a full range of commercial deposit products, treasury and cash management services and traditional and specialized lending products to our customers. As of September 30, 2017, we had $6.1 billion of loans in our Commercial Banking business line representing 76% of our total loan portfolio.
| • | Commercial and Industrial: We have significant expertise in middle-market commercial and industrial lending (“C&I”). Through a team of 39 dedicated and experienced C&I relationship managers, we cover approximately 5,500 customer relationships across a wide variety of industries. Our success is the result of our relationship managers’ product and market expertise and our focus on delivering high quality, customized service to our clients, which has allowed us to grow our C&I loan portfolio at a 19.9% CAGR since December 31, 2012, while maintaining conservative underwriting standards. As of September 30, 2017, we had $4.9 billion of C&I loans, representing 61% of our total loan portfolio. Our C&I nonperforming loans totaled $82 million as of September 30, 2017, of which all but $0.2 million related to our energy portfolio. Included in the $82 million as of September 30, 2017 is a $9.9 million nonperforming energy credit that was reclassified as held-for-sale. Of the energy portfolio nonperforming loans, over 85% at September 30, 2017 were paying in accordance with contractual terms. As of September 30, 2017, less than 2% of our energy loans were noncurrent nonperforming. |
| • | Commercial Real Estate: Commercial real estate (“CRE”) lending provides financing for the office, industrial, retail and multi-family sectors. Our relationship managers take a conservative approach to CRE lending, focusing on what we believe to be high quality credits with low advance rates, strong collateral profiles and attractive cash flow characteristics. As of September 30, 2017, we had $1.2 billion of CRE loans, representing 15% of our total loan portfolio. Our CRE lending is focused on income-producing properties with strong cash flow characteristics. As of September 30, 2017, we had $1.1 billion of income-producing loans representing 94% of our CRE portfolio. Our CRE nonperforming loans totaled $0.5 million as of September 30, 2017, representing 0.04% of our total CRE portfolio. |
170
Table of Contents
| • | Specialized Industry Lending: Through our specialized industry lending business, which is part of our C&I portfolio, we provide unique expertise and differentiated service capabilities to clients in the restaurant industry, healthcare, and technology sectors. The national scope of our lending presence in these industries and their contribution to our local economies provide a unique growth opportunity and geographic diversification of our portfolio. Our team of six dedicated and experienced relationship managers has established deep relationships as a result of their knowledge of the unique financial needs and risks of our clients. We have developed industry-specific underwriting guidelines and concentration limits that have proven successful in managing our exposures and limiting our credit risk. |
| Originated Specialized Industry Portfolio |
Balance as of September 30, 2017 ($MM) |
% of Total Loans | Compound Annual Growth Rate Since 2012 |
|||||||||
| Restaurant industry |
$ | 980 | 12.2 | % | 31.6 | % | ||||||
| Healthcare |
385 | 4.8 | 22.9 | |||||||||
| Technology |
333 | 4.1 | 114.2 | |||||||||
|
|
|
|
|
|
|
|||||||
| Total |
$ | 1,698 | 21.1 | % | 34.8 | % | ||||||
|
|
|
|
|
|
|
|||||||
| Note: | The Technology specialized industry portfolio was established in 2013. Accordingly, the CAGR for Technology in the table above is shown since 2013. |
| • | Energy Lending: Energy lending, which is part of our C&I portfolio, is an important part of our business as energy production and energy related industries are meaningful contributors to the economy in our primary markets. Our team of six energy relationship managers has significant product and customer experience through a range of economic cycles. We have developed strict underwriting standards for each of our sub-portfolios (exploration and production, midstream and services) and we actively monitor our exposures to ensure they fit within our risk tolerance framework and internal concentration limits. Our experience and industry knowledge provide significant advantages over peers and position us to drive attractive returns while appropriately managing concentration risk. As of September 30, 2017, we had $933 million of energy loans, representing 11.6% of our total portfolio. Our energy sector nonperforming loans totaled $82 million as of September 30, 2017 including $68 million E&P, $8 million midstream and $6 million services. As of September 30, 2017, less than 2% of our energy loans were noncurrent nonperforming (over 85% of our nonperforming energy loans were paying in accordance with contractual terms). |
| Energy Portfolio Composition (30-Sep-17) |
|
|
Note: Percentages do not equal 100% due to rounding.
171
Table of Contents
Retail Banking. Our Retail Banking line of business offers a broad range of banking services to consumers and small businesses through our branch network and online and mobile distribution channels. We offer a variety of retail deposit products and lending services, consisting of mortgage loans (first mortgages and home equity lines and loans), small business loans and personal installment loans. We serve over 63,000 households and 14,000 small businesses. As of September 30, 2017, we had $1.9 billion of loans in our Retail Banking business line, representing 24% of our total loan portfolio.
| • | Residential Real Estate: We provide a range of residential real estate products including fixed and adjustable rate loans for purchase or refinance purposes, conforming and jumbo mortgages and home equity products primarily to customers within our geographic footprint. We take a comprehensive and conservative approach to mortgage underwriting resulting in over 80% of our portfolio having original FICO scores of 700 or greater and approximately 74% of our originated first lien portfolio having original loan-to-values of 85% or less. As of September 30, 2017, we had $1.6 billion of residential real estate loans, representing 20% of our total loan portfolio. Our residential real estate nonperforming loans totaled $3.7 million as of September 30, 2017, and were primarily related to residential real estate loans in the acquired portfolio. |
| • | Other Consumer and Small Business Loans: We offer consumer loans to our customers for personal, family and household purposes, including auto, boat and personal installment loans. Additionally, we offer business administration products to assist in the financing needs of small businesses in our footprint. As of September 30, 2017, we had $72 million of other consumer loans and $218 million of small business loans, representing 1% and 3% of our total loan portfolio, respectively. Our small business nonperforming loans totaled $0.8 million as of September 30, 2017 and were primarily related to small business loans in the acquired portfolio. |
Private Banking. Our Private Banking business line offers specialized banking services to affluent and high net worth clients and business owners. Our dedicated team of 15 relationship managers works directly with clients to develop customized banking solutions, through tailored loan and deposit products, based on risk tolerance and financial goals. From December 31, 2012 to September 30, 2017, we have grown our private banking loans at a 33.8% CAGR.
| Private Banking Loan Balance Over Time
|
Note: $ in millions as of December 31 each year, unless otherwise noted.
Financial Services Segment
Our Financial Services segment provides a comprehensive and integrated set of investment, retirement, estate, college and business succession planning, retail brokerage, personal and institutional trust services and insurance services through three product lines: Investment Management, Trust Services and Insurance Services. As of September 30, 2017 we had $5.6 billion of assets under management / administration.
172
Table of Contents
Investment Management. We offer a variety of investment management services to affluent and high net worth individuals and families through our Linscomb & Williams brand, which has been serving clients for over 45 years. Through a team of 11 advisors, we focus on providing customized investment solutions to best fit our clients’ risk tolerance and achieve their financial objectives. Additionally, through our Cadence Investment Services brand, we provide asset management and financial planning services to primarily our retail and small business customer base. As of September 30, 2017, we had $3.3 billion of investment management assets under management.
Trust Services. Our team consists of 30 experienced trust officers and portfolio managers. We offer retirement, personal trusts and estates, portfolio management, institutional trusts and court appointed trust services to high net worth individuals and families. As of September 30, 2017, we had $2.3 billion of trust assets under administration.
Insurance Services. Through our Cadence Insurance Services brand, we offer a variety of business and personal insurance products and have approximately 7,200 policy holders, both retail and commercial customers, including life insurance, disability insurance, long-term care insurance, homeowner’s insurance, property and casualty insurance, key person insurance and buy-sell agreements. Our insurance services business has experienced revenue growth of approximately 5% annually from December 31, 2012 to December 31, 2016, despite declines in the insurance rate environment.
| Assets Under Management / Administration
|
|
|
Note: $ in millions as of December 31 each year, unless otherwise noted.
173
Table of Contents
Corporate Segment
Our Corporate Segment reflects parent-only activities, including debt and capital raising, and intercompany eliminations. Our corporate segment contributes negligibly to our total revenues.
| 2016 Segment Revenue |
3Q17 YTD Segment Revenue | |
|
|
|
| Note: | For the year ended December 31, 2016 and nine months ended September 30, 2017. Excludes corporate segment. Percentages do not equal 100% due to rounding. |
Our Markets
We define our markets broadly as Texas and the southeast United States. Our active banking operations are located principally in five states, which we refer to as our geographic footprint (our “footprint”), where we operate 65 branches as of September 30, 2017 throughout Texas, Alabama, Florida, Mississippi and Tennessee. Historically, our primary regional focus has been Houston, although we operate and continue to expand our operations throughout our footprint. We focus on serving these regional markets, although we also serve specialized industries clients both within our geographic footprint and throughout the United States, as many of our clients in these industries have operations nationwide. As a result of our relationships and our commitment to the markets and customers we serve, we have experienced meaningful market share gains since 2012.
| Branch Footprint |
Deposit Detail as of June 30, 2017 |
|||||||||||||||||||||||||||||
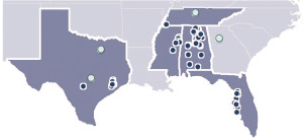
|
Deposits (Sbn) |
# of Branches |
Mkt. Share |
CAGR/Bps D Since 2012 | Estimated Growth |
|||||||||||||||||||||||||
| Deposits | Mkt Share | Population | HHI | |||||||||||||||||||||||||||
| State |
||||||||||||||||||||||||||||||
| TX |
$ | 3.1 | 11 | 0.4 | % | 17.0 | % | 15bps | 1.4 | % | 1.8 | % | ||||||||||||||||||
| AL |
2.7 | 25 | 2.8 | 17.5 | 130 | 0.3 | 1.6 | |||||||||||||||||||||||
| FL |
1.3 | 14 | 0.2 | 14.2 | 8 | 1.3 | 2.0 | |||||||||||||||||||||||
| MS |
0.6 | 11 | 1.2 | 0.6 | (14 | ) | 0.1 | 0.9 | ||||||||||||||||||||||
| TN |
0.1 | 4 | 0.1 | 3.5 | (1 | ) | 0.8 | 2.0 | ||||||||||||||||||||||
|
|
|
|
|
|
|
|
|
|
|
|
|
|
|
|||||||||||||||||
| Total |
$ | 7.9 | 65 | — | % | 14.3 | % | — | 1.2 | % | 1.9 | % | ||||||||||||||||||
|
|
|
|
|
|
|
|
|
|
|
|
|
|
|
|||||||||||||||||
| Top 5 MSA |
||||||||||||||||||||||||||||||
| Houston |
$ | 3.1 | 9 | 1.3 | % | 16.4 | % | 48bps | 1.6 | % | 1.5 | % | ||||||||||||||||||
| Birmingham |
1.8 | 10 | 4.9 | 29.0 | 309 | 0.3 | 2.0 | |||||||||||||||||||||||
| Tampa |
0.8 | 8 | 1.0 | 24.4 | 54 | 1.3 | 2.2 | |||||||||||||||||||||||
| Huntsville |
0.3 | 4 | 4.4 | 7.4 | 68 | 0.9 | 1.0 | |||||||||||||||||||||||
| Sarasota |
0.3 | 3 | 1.7 | 7.2 | 19 | 1.5 | 2.2 | |||||||||||||||||||||||
| Other MSA |
1.4 | 24 | — | 5.9 | — | — | — | |||||||||||||||||||||||
| Non-MSA |
0.1 | 7 | — | — | — | — | — | |||||||||||||||||||||||
|
|
|
|
|
|
|
|
|
|
|
|
|
|
|
|||||||||||||||||
| Total |
$ | 7.9 | 65 | — | % | 15.4 | % | — | 1.2 | % | 1.7 | % | ||||||||||||||||||
|
|
|
|
|
|
|
|
|
|
|
|
|
|
|
|||||||||||||||||
While we are focused on driving growth across all of our markets and products, we believe our Texas presence will be the largest contributor to future asset growth, with funding support from our deposit base in
174
Table of Contents
Texas and the southeast United States. As of September 30, 2017, 52% of our loans and 40% of our deposits were in Texas, and we originated 37% of our loan commitments in Texas for the nine months ended September 30, 2017. Loan commitments originated to borrowers outside of the markets in which we operate (represented by the “Other” category in the graphs below) are primarily in our specialized industries portfolio, within our Commercial Banking business line.
| Loans by Geography (30-Sep-17) |
Deposits by Geography (30-Sep-17) | |
|
|
|
| Note: | Geography of our loans and deposits is measured by the state of the client’s primary residence on file. Percentages do not equal 100% due to rounding. |
Our markets have demographic, economic and competitive dynamics that we believe are favorable to executing our growth strategy. Texas serves as our primary growth market, and we believe its combination of size, attractive business climate, strong growth characteristics and economic diversity provides significant opportunity to continue to build our business. Our Southeast footprint provides a strong presence in markets with stable growth and low-cost deposit funding.
175
Table of Contents
Texas
Large and Growing Population. We believe Texas’ population and growth outlook provide significant consumer and commercial growth opportunities. Texas is the second most populated state in the U.S., and Houston, the largest metropolitan area in which we operate (measured by deposits) and where our business historically has been principally located, is the fifth most populated metropolitan area in the U.S. as of September 2017, according to the U.S. Census Bureau. From 2012 to 2016, Texas had the second fastest population growth among all states in the U.S. at 6.9%, and Houston was the fastest growing metropolitan area among the top 25 largest metropolitan areas in the U.S. with 10.0% growth, according to the U.S. Census Bureau. Additionally, Houston boasts one of the youngest populations among large metropolitan areas according to the Greater Houston Partnership. Texas is estimated to grow 7.1% and Houston is estimated to grow 8.3% from 2018 to 2023, as compared to 3.5% for the broader U.S., according to Nielsen. Texas is also home to four of the six fastest growing metropolitan populations among the top 50 largest metropolitan areas in the U.S. based on 2018-2023 estimated growth rates, according to Nielsen.
| Texas Population Growth (000) |
Houston Population Growth (000) | |
|
|
|
Source: U.S. Census data from Nielsen.
Robust Job Market and Favorable Outlook. From December 2007 to December 2017, Texas has grown nonagricultural employment by 17.8% compared to the national average of 6.5%, according to the U.S. Bureau of Labor Statistics (the “BLS”). As of December 2017, Texas ranked as the second largest state and Houston ranked as the sixth largest metropolitan area for nonagricultural jobs in the U.S., employing more than 12.4 million and 3.0 million people, respectively, according to the BLS. Houston has more jobs than 36 U.S. states, according to the BLS. We believe the job growth outlook for Texas is favorable as a result of an increasingly diversified state economy and stabilizing energy prices. Texas is projected to experience 1.9% annual job growth from 2014 to 2024 compared to 0.6% for the broader U.S. according to the LMCI of the Texas Workforce Commission and the BLS, with much of the growth coming from non-energy related industries like healthcare, hospitality & leisure and business services, among others.
| Houston Total Job Growth |
Growing Non-Energy Jobs (000s) | |

|
|
Source: U.S. Department of Labor and Greater Houston Partnership.
176
Table of Contents
Economically Diverse. Texas has $1.7 trillion of gross state product (“GSP”), as of March 2017, and Houston has over $478 billion of gross domestic product (“GDP”), as of December 2016, ranking Texas as the second largest state economy and Houston as the 4th largest metropolitan area economy in the U.S. according to the U.S. Department of Commerce. Texas’ GSP and Houston’s GDP would rank as the tenth largest and the 23rd largest economies, respectively, among all countries in the world according to the World Bank. Texas’ attractive business climate and high standard of living has made it home to 50 Fortune 500 companies and over 367,000 businesses with less than 1,000 employees according to Fortune Magazine and the U.S. Census Bureau. Houston boasts 20 Fortune 500 headquarters and 41 Fortune 1000 headquarters, the fourth most among metropolitan areas according to Fortune Magazine. The Texas economy has become increasingly diverse with no single industry accounting for more than 14% of Texas GSP and the top 10 industries contributing 79% of the state’s GSP. Additionally, Texas’ extensive trade infrastructure, including 11 deep water ports, has made Texas the leading exporter among all U.S. states for 14 consecutive years and a leading destination for foreign direct investment according to the U.S. Department of Commerce.
| Texas Gross State Product by Industry |
Houston Gross Domestic Product by Industry | |
|
|
| |
| Source: | Texas gross state product by industry per the U.S. Department of Commerce as of March 31, 2017. Houston Gross Domestic Product by Industry per the U.S. Department of Commerce as of December 31, 2015. Percentages do not equal 100% due to rounding. |
Attractive Business Climate. In April 2017, Texas ranked as the best state for business according to Chief Executive Magazine’s annual survey of the U.S.’s top CEOs, the 13th consecutive year Texas has received the designation. We believe Texas’ size, infrastructure, vibrant and growing workforce, quality of life and friendly tax model (low state business tax and no personal income tax) have resulted in significant business growth and attracted numerous corporate relocations.
Southeast Markets (Alabama, Florida, Mississippi, Tennessee)
Access to a Large Population and Stable Economy. Our Southeast markets provide access to over 35.1 million people as of July 2016 and over 546,000 businesses with fewer than 1,000 employees as of 2014 according to the U.S. Census Bureau. These states have shown an average population growth of 4.5% from 2012 to 2016 and are estimated to grow by an average of 4.9% from 2018 to 2023 according to the U.S. Census Bureau and Nielsen. From 2012 to 2016, our Southeastern states’ consolidated gross state product realized an average 4.6% CAGR according to the U.S. Department of Commerce.
High Quality, Low-Cost Deposit Source. Our Southeast markets provided access to over $865 billion of deposits as of June 30, 2017, according to the FDIC. Deposits in these markets have experienced faster growth than deposits in other U.S. states over the last year and have proven to be lower cost compared to the broader industry over the last three years. From June 30, 2015 to June 30, 2017, deposits in our Southeast markets grew 5.6% as compared to 5.5% for other U.S. states, according to the FDIC. The average cost of deposits over the last three years
177
Table of Contents
for all banks with $1 billion to $50 billion in assets headquartered in our Southeast markets was 0.37%, as compared to 0.40% for U.S. banks in that asset range located in other states, according to regulatory filings.
Our Competitive Strengths
Well Positioned in Attractive Markets in Texas and the Southeast
We believe we are well positioned across our footprint as a result of our expertise and commitment to our customers and markets. We are the second largest commercial lender and second largest bank by deposits among domestically-owned banks headquartered in Houston, Texas as of September 30, 2017. Since 2012, we have increased our deposit market share in key metropolitan markets such as Houston, Texas, Birmingham, Alabama and Tampa, Florida, and we believe each of our markets offer unique opportunities to enhance our franchise. Texas’ size, growth profile and thriving economy offer significant opportunities to build new commercial relationships, while our Southeast footprint combines steady growth, economic diversity and attractive deposit characteristics to supplement and complement our Texas franchise.
Proven Business Model Focused on Client Relationships and Differentiated Service
Our business model and approach to clients is simple. We use our breadth of products combined with our customer and market expertise to create a unique banking experience for our clients. We also focus on complementary products and services where we have a specific expertise and the opportunity to build customized banking solutions for our customers’ needs. We have an experienced group of relationship managers who focus on a client-centered, relationship-driven banking model. We attempt to leverage our industry, market and client knowledge and customer relationships rather than competing solely on price and structure. We believe our expertise in energy lending and our specialized industries is comparable to those of large financial institutions, as evidenced by our knowledge and experience in these areas, and provides high quality growth opportunities. Additionally, our experienced management team and board of directors provide support to our relationship managers in establishing, maintaining and nurturing client relationships. Our client-centric approach has promoted our growth by giving us access to select business and lending opportunities to which we believe an institution of our size would not typically have access.
Demonstrated Growth Driven by Texas Franchise and Middle Market C&I focus, including Specialized Industries
Our relationship banking approach and focus on customer service combined with our product and market expertise have allowed us to grow our loan portfolio at a 15.8% CAGR since December 31, 2012. The majority of our loan growth has come from our Texas footprint where we have gained market share and capitalized on a healthy and growing economy. As of September 30, 2017, 52% of our loans were based in Texas, and 37% of our originations for the nine months ended September 30, 2017 were from Texas-based customers. Similarly, our considerable commercial lending expertise has been a significant source of growth, with total C&I accounting for 70.6% of our total loan growth and specialized industry lending, a component of our C&I portfolio, accounting for 31.9% of our total loan growth since December 31, 2012. We have originated an average of $912 million of loan commitments in each quarter since December 31, 2012. We are committed to our business model and our clients, and we believe the quality of our underwriting practices and risk management infrastructure will allow us to continue to grow through a range of economic cycles.
178
Table of Contents
| Total Loans |
C&I Loans | |
|
|
| |
Note: $ in millions as of December 31 each year, unless otherwise noted.
Mid-Sized Bank with Large Bank Skill Set and Talent
Since our inception, we have strived to build a client-centric bank that is supported by a larger bank infrastructure and mentality. Our board, management team and many of our relationship managers joined us from larger institutions, drawn by their entrepreneurial spirit and the opportunity to build a “better” large bank. We have dedicated significant time and resources to ensure that our infrastructure, technology and risk management systems are capable of supporting sustained growth and the evolving needs of our clients. We believe the combination of our personalized service and our large bank capabilities provides a differentiated service offering to our middle market clients.
Balance Sheet Funded with Growing, Low-Cost Deposit Portfolio
We have focused on building a high quality, low cost deposit franchise through a combination of our retail channel and our extensive commercial relationships. As of September 30, 2017, deposits account for 94% of our funding sources. Our deposit base provides an efficient and stable source of funding, as evidenced by our cost of total deposits less brokered deposits of 0.52% for the nine months ended September 30, 2017. Our deposit footprint encompasses markets that we view as demonstrating robust economic conditions with the potential for strong deposit growth. In addition to our branch footprint and broader retail strategy, our ability to access deposit funding from our commercial and public sector relationships as well as our wealth management business provides a wide range of deposit sources to support our organic growth initiatives. In particular, we have experienced meaningful growth in our treasury and cash management products as a result of our ability to develop tailored offerings to support our customers’ needs. We also utilize brokered deposits to manage routine loan, security and deposit flows and maintain a healthy availability for contingent liquidity purposes. We generally target a brokered deposit to total deposit ratio of less than 15% to 20% and as of September 30, 2017, our brokered deposits totaled $824 million, or 9.7% of total deposits. Our deposit portfolio has grown at a 13.6% CAGR since December 31, 2012.
179
Table of Contents
| Note: | $ in millions as of December 31 each year, unless otherwise noted. Percentages do not equal 100% due to rounding. |
Disciplined Underwriting and Well Established Risk Management Framework
As a bank holding company established on the heels of the Great Recession, we understand the importance of a strong risk management infrastructure. Since our formation, we have strived to build a culture focused on risk management that is supported by disciplined credit underwriting and a robust set of policies and procedures. We have a comprehensive approach to enterprise risk management which is focused on credit, strategic, reputational, operational, compliance, liquidity and interest rate risk. Our product and business managers actively monitor the risk profile of their business with formal oversight from our Enterprise Risk Management and Internal Audit teams. Additionally, over the last two years we have been preparing for the operational, regulatory and risk management complexities associated with crossing $10 billion of assets, a milestone which we passed in the third quarter of 2017. We have added 46 risk management and audit specialists across the Bank since 2013 and have invested over $2 million into our risk management infrastructure.
Our credit underwriting methodology is specific to each of our businesses to ensure that we capture the unique risks associated with the various industries we cover and the products we offer. We have a centralized credit authority led by a team of highly experienced credit professionals. We utilize a dual risk rating framework and maintain a comprehensive and tested set of guidelines that allow us to effectively manage exposures and closely monitor risk at the loan level. We have proven our ability to manage and work through high risk, underperforming assets that were part of our initial acquisitions, and we have stabilized our energy portfolio through individual strategies dependent on each credit’s circumstances. We believe our commitment to prudent risk management has allowed us to successfully work through past credit challenges and positions us to maintain strong credit and risk performance as we continue to grow our franchise. Since 2016, we have reduced our nonperforming loans, 93% of which are sourced in our energy portfolio, by 39%. 79% of our nonperforming loans are current as of September 30, 2017.
180
Table of Contents
| Noncurrent Nonperforming Loans1 / Total Loans |
Nonperforming Loans / Total Loans | |
|
|
|
| 1 | Noncurrent nonperforming loans defined as originated loans and acquired non-credit impaired loans that are nonperforming loans +30 past due. $ in millions unless otherwise noted. Nonperforming loans are based on originated loans and acquired non-credit impaired loans. |
Attractive Run-Rate Core Profitability and Return Profile
We strive to consistently deliver outsized loan growth, utilize our relationships to drive fee opportunities and prudently manage our expense base to drive operating leverage. We believe this combination positions us to deliver competitive returns.
| • | We have consistently delivered strong loan growth as a result of the growth in our markets, our motivated team of relationship managers and our intense focus on customer service. We believe these factors will provide ample opportunities to maintain our strong growth trajectory. Since December 31, 2012, our loan portfolio has grown at a 15.8% CAGR. |
| • | Our diversified and complementary noninterest income offering provides an opportunity to leverage our commercial and retail banking relationships to drive stable noninterest income growth. With $5.6 billion of assets under management / administration, we have built an integrated wealth management platform that is led by a team of experienced advisors and offers a comprehensive set of financial planning and trust services. For the nine months ended September 30, 2017, our non-interest income to total revenue ratio was 23.7%, and we grew noninterest income at an 11.3% CAGR from 2013 to 2016. |
181
Table of Contents
| Noninterest Income |
Noninterest Income Distribution (3Q17 YTD) | |
|
|
| |
Note: $ in millions for each year ended December 31, unless otherwise noted.
| • | We are committed to maintaining a culture focused on expense management which has led to consistently improving expense ratios over the last five years despite our growth and crossing over $10 billion in assets. Our focus on optimizing our branch footprint, making prudent investments in technology and leveraging employee capacity has allowed us to reduce our expense base each year since 2013. We have reduced our branch footprint from a high of 117 branches in 2012 to 65 branches as of September 30, 2017, centralizing our branch footprint to primarily focus on high traffic and strategic locations while significantly reducing our occupancy, branch and employee expenses. During that period, we closed or sold 3 branches in Texas, 22 in Alabama, 14 in Florida, 8 in Mississippi, 2 in Georgia and 3 in Tennessee. Additionally, our employee base has become increasingly efficient with revenue per employee growing at a 9.8% CAGR between December 31, 2013 and December 31, 2016. Our improvement in operating efficiency has allowed us to grow assets at a 13.9% CAGR while reducing our noninterest expense at a 4.6% CAGR between December 31, 2013 and December 31, 2016. This has led to an approximate 20 percentage point improvement in our efficiency ratio and a 190 basis point improvement in our noninterest expense to average asset ratio between December 31, 2013 and December 31, 2016.4 |
| Efficiency Ratio |
|
|
| 4 | Efficiency ratio is a non-GAAP financial measure. We define efficiency ratio as noninterest expenses divided by our operating revenue, which is equal to net interest income plus noninterest income. See “Non-GAAP Financial Measures” for additional information. |
182
Table of Contents
| Deposits / Branch ($MM) |
Revenue / Employee $(000) | |
|
|
|
| • | Our focus on commercial lending and the quality of our deposit franchise has resulted in an asset sensitive balance sheet. As of September 30, 2017, 71% of our loans are floating rate and we estimate a 6.9%, or $24.5 million, net interest income benefit in a +200bps immediate interest rate shock scenario. Excluding our current interest rate hedges, which began rolling off at the end of 2017, the net interest income benefit would be 13.2%, or $46.9 million. Although we do not anticipate unwinding the current interest rate hedges prior to maturity, we believe excluding the current interest rate hedges provides clarification as to the organic asset sensitivity of our balance sheet. We do not currently expect to enter into interest rate swap or like arrangements in order to manage interest rate risk in the near-term. |
| • | Through our success in delivering consistent growth while prudently managing expenses, our pre-tax, pre-provision (“PTPP”) earnings increased at a 30.8% CAGR from 2013 to 2016. Additionally, our PTPP earnings for the nine months ended September 30, 2017 represent 34.5% growth over our PTPP earnings for the nine months ended September 30, 2016.5 |
| Pre-Tax, Pre-Provision Earnings |
|
|
Note: $ in millions for each year ended December 31 each year, unless otherwise noted.
| 5 | Pre-tax, pre-provision earnings is a non-GAAP financial measure, defined as loan income before taxes plus provision for credit losses. We believe the most directly comparable GAAP financial measure is income before taxes. See “Non-GAAP Financial Measures” for additional information. |
183
Table of Contents
Respected Veteran Management Team and Board of Directors
We have a seasoned management team with experience managing growth and risk over a number of years and through various economic cycles. Our executive management team has significant experience overseeing commercial and consumer banking, mergers and acquisitions, financial management, systems integrations, operations and technology, credit and regulatory compliance. We believe our executive management team’s reputation and performance history give us an advantage in hiring and retaining experienced bankers and executing on our growth strategy. Further, our board of directors includes highly accomplished industry veterans with broad experience operating and working in the financial services industry. Our management team’s and board of directors’ extensive experience managing large institutions provides invaluable insight and assistance as we navigate the operational and regulatory complexities associated with crossing $10 billion of assets.
Our management team consists of veteran banking executives:
| • | Paul B. Murphy, Jr., our Chairman and Chief Executive Officer, leads our management team. Mr. Murphy brings over 37 years of banking experience, of which nine years were at Allied/First Interstate and 20 years were at Amegy Bank of Texas. At Amegy Bank of Texas, Mr. Murphy helped lead its growth from an institution with $50 million in assets and a single location, to assets of $11 billion and 85 Texas branches by 2010. In 2005, Mr. Murphy led the sale of Amegy Bank of Texas to Zions, generating a return of approximately 36 times and a 16-year IRR in excess of 25% for initial investors. Mr. Murphy was a co-Founder of Amegy Bank of Texas where he served as President from 1996 and Chief Executive Officer from 2000 until 2010. |
| • | Samuel M. Tortorici, our President, has over 31 years of banking experience in various leadership roles in the financial services industry including 24 years at AmSouth Bancorp and Regions Financial. At Regions Financial, Mr. Tortorici most recently served as head of the commercial and industrial lending business spanning the Southeast, Midwest and Texas, and representing $40 billion in loans and deposits. Prior to Regions’ acquisition of AmSouth in 2006, Mr. Tortorici held various leadership positions at AmSouth including Chief Financial Officer. |
| • | Valerie C. Toalson, our Executive Vice President and Chief Financial Officer, has over 31 years of banking experience in finance, accounting, financial and regulatory reporting, treasury and investor relations. Prior to joining our management team, Ms. Toalson served as Executive Vice President and Chief Financial Officer of BankAtlantic Bancorp. Ms. Toalson also held various senior management positions at BOK Financial Corporation/Bank of Oklahoma and served as a financial services audit manager at PricewaterhouseCoopers earlier in her career. |
| • | R. H. “Hank” Holmes, is President and Business Services Executive. Mr. Holmes brings more than 24 years of banking expertise, 18 of which were at Amegy Bank of Texas where his experience included credit, commercial real estate, private banking and special assets. Mr. Holmes was a member of the Amegy Bank of Texas executive management team for 10 years. |
| • | J. Randall Schultz, is Executive Vice President and Specialized Industries Services Executive. Mr. Schultz brings more than 35 years of banking experience, 26 of which were with Bank of America. His professional experience includes credit, international, commercial, corporate and investment banking, and global treasury services. |
Our board of directors includes highly accomplished industry veterans with broad experience in the financial services industry. In addition to Paul B. Murphy, Jr., Chairman and Chief Executive Officer, our board of directors consists of the following individuals:
| • | William B. Harrison, Jr., our Lead Director, and former Chairman and Chief Executive Officer of JPMorgan Chase & Co., Chase Manhattan and Chemical Bank; |
| • | Robert K. Steel, Chief Executive Officer of Perella Weinberg Partners and former Chief Executive Officer of Wachovia Corporation, as well as Under Secretary for Domestic Finance at the U.S. Department of the Treasury; |
184
Table of Contents
| • | Scott Stuart, co-founder of Sageview Capital and previously a partner and investment committee member at Kohlberg Kravis Roberts & Co., L.P. (“KKR”); and |
| • | J. Richard Fredericks, a founding partner of Main Management LLC, and former Ambassador to Switzerland, as well as Senior Managing Director at Montgomery Securities. |
Marc Shapiro is a Senior Advisory Director. Mr. Shapiro was formerly the non-executive Chairman of J.P. Morgan Chase & Co.’s Texas operations, and Vice Chairman for Finance and Risk Management of J.P. Morgan Chase & Co. from 1997 through 2003.
Stanley Levy is an Advisory Director. Mr. Levy is currently Chief Operating Officer of Morgan Group after previously serving as Managing Director of Real Estate & Lodging Investment Banking for the southern region at J.P. Morgan Chase & Co.
We believe the interests of our management team and board of directors are aligned with our stockholders. Following this offering, our management team and board will continue to own membership units of Cadence Bancorp, LLC, the selling stockholder in this offering and our controlling stockholder (substantially all of the assets of which consist of shares of our Class A common stock), and the members of our board of directors will continue to serve as directors of Cadence Bancorp, LLC.
Our Strategy
Our strategy is to build a premier commercial bank primarily through organically growing our client base, but also by pursuing mergers and acquisitions opportunistically. We regularly evaluate our strategic growth options. We focus on middle-market commercial lending (characterized as lending to businesses with annual revenues of $10 million to $500 million) and provide a broad range of banking services to businesses, high net worth individuals, business owners and retail customers. We believe the local economies in our geographic footprint offer us significant growth opportunities that we can capitalize on through our focus on providing more personalized service compared to larger financial institutions, and our ability to realize greater economies of scale compared to smaller community banks.
In addition, our management team possesses significant executive-level leadership experience at Fortune 500 financial services companies, and we believe this experience provides us with an important advantage in executing our business strategy. Our management team and experienced relationship managers have long-standing client relationships and operating experience in the markets we serve, and we believe these attributes will continue to position us to build market share.
Leverage Our Relationships and Service Capabilities to Drive Organic Growth
We have demonstrated robust loan growth in our markets, driven by our client relationships and client development efforts. We believe our loan growth has been a direct result of our people and our strategy, which focuses on a client-centered, service oriented approach. Further, we believe our relationship managers’ entrepreneurial spirit, decision-making autonomy, flexibility and market expertise offers us unique growth opportunities not available to many of our peers. We intend to leverage the quality of our team, our existing relationships and our institutional approach (“delivering the firm”) to building tailored banking solutions to drive deeper relationships and increase penetration in our markets. Additionally, we are dedicated to investing in our team to ensure they continue to meet our high standard of excellence, while attracting and developing early career talent that embodies our entrepreneurial spirit and drives incremental relationships and loan growth.
Grow Our Core Deposit Franchise
The strength of our deposit franchise is derived from the long-standing relationships we have with our clients and the strong ties we have to the markets we serve. Our deposit footprint has provided, and we believe
185
Table of Contents
will continue to provide, primary support for our loan growth. Deposits comprise 94% of our total funding as of September 30, 2017. A key part of our strategy is to continue to enhance our funding sources by expanding the ways in which we reach our customers, including increased adoption of mobile and digital platforms and optimization of our product offerings, treasury management services and client service capabilities. Additionally, we believe our distinctive commercial and public sector relationships will supplement our retail deposit base and will help drive additional deposit growth and funding opportunities to support our loan growth.
Prudently Invest in Our Business to Drive Operating Leverage and Support Our Risk Management Framework
We believe it is critical to prudently invest in our business in order to provide the best possible customer experience and build a scalable infrastructure that can support our growth while driving operating leverage through reduced expenses. We have a history of making successful investments, starting with the acquisition and integration of our three predecessor banks, and carried on through internal infrastructure investments, ongoing talent acquisition, investments in our management team, the implementation of an integrated technology platform and ongoing investments into optimization of our delivery channels. Our past investments have yielded significant benefits to our business, and we believe a focus on investing in our people, our technology and our processes will allow us to drive further operational efficiencies.
Build Our Fee-Based Business through New Business Initiatives and Existing Customer Relationships
We have built a successful base of fee businesses—in both our Banking segment and our Financial Services segment—that provide complementary products and services to our core banking business. Each of our fee-based businesses is run by an experienced team and has infrastructure to support additional growth. We believe our integrated approach to our commercial relationships, along with our growing market position and the expertise and knowledge of our team, will provide significant new business opportunities.
Engage in Opportunistic M&A
We prioritize organic growth but regularly evaluate acquisition opportunities that we believe could produce attractive returns for our stockholders. In particular, we may consider acquisition opportunities that could improve our market position in geographies with attractive demographics and business growth trends (including Texas and the southeast United States), expand our branch network in existing markets, enhance our ratio of loans to deposits, increase our earnings power and/or enhance our suite of products. We believe our acquisition and integration experience provides an advantage in identifying and executing on strategically and financially compelling opportunities that could supplement our organic growth strategy. We may pursue an acquisition or merger, including a material transaction, as part of our strategic growth strategy.
Products and Services
Lending Activities
Our primary strategic objective is to engage in commercial lending to middle-market customers (characterized as businesses with annual revenues of $10 million to $500 million) and provide a full array of commercial mortgage and non-mortgage loans to middle-market commercial businesses, high net worth individuals and business owners. We believe we have a strong team of consumer and commercial bankers to execute on a client-centered, relationship-driven banking model. Our Commercial Banking team, consisting of 62 professionals, focuses on middle-market businesses with an advisory approach that emphasizes understanding the client’s business and offering a broad suite of loan, deposit and treasury management products and services. Our consumer banking team consists of experienced professionals that focus on knowing their individual clients in order to best meet their financial needs, offering a full complement of loan, deposit and online banking solutions. We strive to do business in the areas served by our branches, which are also where our marketing is
186
Table of Contents
focused, and the vast majority of our new loan customers are located in existing market areas. Our bankers have deep expertise and relationships in the industries served by our specialized industries in which we believe we have developed specialized service capabilities, including the restaurant industry, healthcare and technology.
Our loan portfolio includes commercial and industrial loans, residential real estate loans, commercial real estate loans and other consumer loans. The principal risk associated with each category of loans we make is the creditworthiness of the borrower. Borrower creditworthiness is affected by general economic conditions and the attributes of the borrower and the borrower’s market or industry. Attributes of the relevant business market or industry include the competitive environment, customer and supplier availability, the threat of substitutes and barriers to entry and exit.
Commercial and Industrial Loans. As of September 30, 2017, $4.9 billion, or 61%, of our total bank loan portfolio consisted of commercial and industrial loans. Our commercial loans, which are generally made to middle-market businesses, include equipment loans, lines of credit, acquisition finance credit facilities and an array of Small Business Administration product offerings, and typically have maturities of five years or less. At September 30, 2017, an additional $218 million, or 3%, of our total bank loan portfolio consisted of loans to small businesses.
Residential Real Estate Loans. As of September 30, 2017, $1.6 billion, or 20%, of our bank loan portfolio consisted of residential real estate loans. We provide one-to-four family residential real estate loans with terms ranging from 10 to 40 years, with either fixed or adjustable interest rates. We do not originate subprime loans. Loans are typically closed-end first lien loans for purposes of property purchased, or for refinancing existing loans with or without cash out. The majority of our loans are owner occupied, full documentation loans.
Commercial Real Estate Loans. As of September 30, 2017, $1.2 billion, or 15%, of our bank loan portfolio consisted of commercial real estate loans. We offer term financing for the acquisition or refinancing of properties located in our markets in Texas and the southeast United States. Other products that we provide include secured lines of credit, acquisition, development and construction loan facilities and construction financing.
Other Consumer Loans. As of September 30, 2017, $72 million, or 1%, of our bank loan portfolio consisted of other types of consumer loans. We offer consumer loans to our customers for personal, family and household purposes, including home equity loans, auto, boat and personal installment loans.
Shared National Credits. As a commercial focused relationship manager, we often lead or participate in syndicated loan offerings in an effort to selectively grow and diversify our loan portfolio. Our shared national credit (“SNC”) portfolio is spread across our commercial products and is focused on customers where we have a multi-product relationship or we believe we have the opportunity to develop such a relationship. As of September 30, 2017, we have $3.1 billion of outstanding SNCs, representing 38% of our total loans outstanding. We have owned and managed SNC loans since our inception, and our management team, relationship managers and credit risk management team have extensive experience in the underwriting, due diligence and monitoring of SNC credits. We evaluate SNC loans using the same credit standards we apply in underwriting all of our loans.
SNC credit performance remains strong. As of September 30, 2017, our SNC portfolio had $78 million of nonaccrual loans, all of which were energy related. During 2016, regulators revised their definition of nonaccrual for E&P loans as it relates to leverage, including second-lien debt, which we do not participate. As a result, it has affected the nonaccrual status of this portfolio. As of September 30, 2017, over 83% of our SNC nonaccrual loans were current as to their contractual terms.
Deposit Products and Other Funding Sources
We offer our customers a variety of deposit products, including checking accounts, savings accounts, money market accounts and other deposit accounts, through multiple channels, including our extensive network of our
187
Table of Contents
63 full-service branches, 2 drive-thru branches, 69 ATMs, 9 ITMs, free access to approximately 1,200 Publix Presto! ATMs and over 55,000 Allpoint ATMs and our online, mobile and telephone banking platforms as of September 30, 2017. See “—Marketing and Distribution.” As of September 30, 2017, our deposit portfolio was comprised of 24% noninterest-bearing deposits and 76% interest bearing deposits. We intend to continue our efforts to provide funding for our business from customer relationship deposits.
Deposit flows are significantly influenced by general and local economic conditions, changes in prevailing interest rates, internal pricing decisions and competition. Our deposits are primarily obtained from depositors located in areas surrounding our branches, and we believe that we have attractive opportunities to capture additional retail and commercial deposits in our markets. In order to attract and retain deposits, we rely on providing quality service, offering a suite of retail and commercial products and services and introducing new products and services that meet our customers’ needs as they evolve. Recent product offerings in response to customer needs include our “Cadence TotalMoney” personal financial management platform, mobile banking through our “Fluent by Cadence” platform, our remote deposit capture capability and a pilot program (currently in effect at three locations) enabling customers to interact with tellers outside of regular banking hours through interactive drive-thrus. See “—Technology Systems.”
Wealth Management
Through our Linscomb & Williams and Cadence Trust brands, we offer wealth management and other fiduciary and private banking services targeted to affluent clients, including individuals, business owners, families and professional service companies, primarily in the medical and legal industries. In addition to fiduciary and investment management fee income, we believe these services enable us to build new relationships and expand existing relationships to grow our deposits and loans. Through our wealth management line of business, we offer financial planning, retirement services and trust and investment management by a team of 60 seasoned advisors, providing access, for affluent clients as well as mass market clients, to a wide range of certificates of deposits, mutual funds, annuities, individual retirement accounts, money market accounts and other financial products. Although we do not limit our customers to affluent clients and business owners, the focus of our wealth management line of business is on the “mass affluent” ($500,000 to $2 million in investible assets) and “highly affluent” ($2 million to $5 million in investible assets) markets.
Private banking deposits are accepted in our seven private banking offices located Birmingham, Huntsville, Tampa, Houston and San Antonio. Total private banking deposits have grown from $526 million as of December 31, 2013 to $714 million as of September 30, 2017, an increase of 36%.
Insurance
Under our Cadence Insurance Services and Cadence Investment Services brands, we offer directly and through licensed financial consultants, financial advisors and third party partners a variety of business and personal insurance products to retail and commercial customers, including life insurance, disability insurance, long-term care insurance, homeowner’s insurance, property and casualty insurance, key person insurance and buy-sell agreements. Cadence Insurance receives referrals from the Company’s Retail Banking line of business. Our individual customers purchase our insurance products for income replacement, wealth transfer, estate planning and tax planning purposes. We offer a suite of business insurance products to our commercial customers, including business owner, commercial vehicle, property and liability, workers compensation and specialty liability policies. As of September 30, 2017, approximately half of our insurance revenue is derived from individuals and approximately half is derived from commercial customers. Annual insurance fee income totaled approximately $7.7 million for the year ended December 31, 2016.
Financial Products and Services
In addition to traditional banking activities and the other products and services specified above, we provide a broad array of financial services to our customers, including: debit and credit card products, treasury
188
Table of Contents
management services, merchant services, employee and payroll benefits solutions (including payroll cards and bank-at-work benefits) automated clearing house services, lock- box services remote deposit capture services, international trade finance, international trade services, foreign exchange services, and other treasury services.
Technology Systems
We have recently made and continue to make significant investments in our information technology systems for our banking and lending and cash management activities. We believe this is necessary investment in order to offer new products and improve our overall customer experiences, as well as to provide scale for future growth. Our technology investments include investment in the foundational layer of our infrastructure (including security, data and voice network, storage and disaster recovery) with the intent of establishing a technology platform that will allow us to grow with incremental expenditures.
Additionally, our technology investments include investment in the application layer of our technology. We have built a robust technology core for the Treasury Management product suite, including “Allegro”, our single sign on portal for our business customers to access our Treasury Management products. Our business clients can access all activities with Cadence through an online portal with one log on and password. The online portal tools include fraud protection and the ability to view Lockbox receivables. Through the Accounts Payable Lockbox, customers have the ability to receive invoices, route the invoices for approval and decide how we pay. Payment can occur through a variety of options including check, wire, or ACH. Largely as a result of this technology core, our Treasury Management product suite is competitive with small community banks as well as large regional and money center banks. Additionally, we have built the “Fluent by Cadence” platform, our next generation online, mobile and other digital banking solution for consumer and small business banking. By leveraging the same platform as “Allegro”, we are able to centrally service and manage all digital banking activities and provide a seamless experience to our customers as they migrate from a small business to one that requires our Treasury Management services. In addition to the basic features of online banking, Fluent by Cadence offers the ability to deposit checks by taking a picture with a smart phone using the platform’s “FlashDeposit” feature. We also offer our clients access to our “TotalMoney” platform, a personal financial management system that provides our customers information regarding their spending habits, investment results, budgets and net worth.
We have invested in video teller capabilities, which enable our customers to interact with tellers outside of regular banking hours through interactive drive-thrus. The video teller system supports cash withdrawals, cash and check deposits, check cashing, loan payments and account transfers. We believe that expansion of our video teller system may increase the efficiency of our branch operations and reduce costs by increasing the centralization of customer interactions that currently take place at multiple locations. Our investments in technology also include a direct banking option which we are currently testing in various in- and out-of-market locations.
Credit Policy and Procedures
General. Our credit policy requires that key risks be identified and measured, documented and mitigated, to the extent possible, to seek to ensure the soundness of our loan portfolio. Our credit policy also provides guidelines for the underwriting of loans to individuals along with the regulatory requirements to ensure that all loan applications are evaluated subject to our fair lending policy. We require various levels of internal approvals based on the characteristics of our loans, including the size of the exposure, the line of business, and the loan type. There is a credit executive assigned to each line of business who holds the primary responsibility for the approval process outside of the loan approval committees. We believe that the guidelines required by our credit policies enhance internal responsibility and accountability for underwriting decisions and permit us to monitor the performance of credit decision-making. We also have specialized underwriting guidelines for loans in our specialized industries that we believe reflect the unique characteristics of these industries.
Credit Risk Management. In the first half of 2013, we implemented a dual credit risk rating (“DCRR”) system. Using our DCRR system, it is our policy to assign risk ratings to all loan exposures using our internal
189
Table of Contents
credit risk rating system. The assignment of risk ratings is done through the use of scorecards. We use a total of fourteen different scorecards that accommodate various areas of lending. There are eleven different commercial scorecards based on the various commercial credit transactions performed throughout the bank. Additionally, there are three scorecards for mortgage, consumer and small business. Each scorecard contains two main components: probability of default (“PD”) and loss given default (“LGD”). Each component is assessed using a multitude of both qualitative and quantitative scoring elements, which will generate a percentage for each component. The key elements assessed in the scorecard for PD are and financial performance and trends as well as qualitative measures. The key elements for LGD are collateral quality and the structure and terms of the loan. The PD percentage and LGD percentage are combined to give an overall expected loss percentage, which is converted into a credit risk rating for each loan. The elements and their respective weightings will vary depending on the applicable scorecard. Based on these results, we assign each such loan a credit risk rating of 1 through 13, with a 1 representing a “virtually risk free” credit quality and 13 representing “loss.” Loans rated 1 through 8 are loans that we rate internally as “Pass.” Loans rated 9 through 13 are rated internally as “Criticized” with Loans rated 10 through 13 also being considered “Classified” and represent loans for which one or more weaknesses exist and with respect to which we believe we may incur a loss.
Our credit risk management is overseen by our board of directors and our senior credit risk management committee. Our senior credit risk management committee has six standing members, including the Chief Executive Officers of Cadence Bancorp, LLC, Cadence Bancorporation and Cadence Bank, our Chief Credit Administration Executive, who serves as chairman of the committee, and our Chief Credit Underwriting Executive, who serves as vice chairman of the committee. The committee is responsible for reviewing our credit portfolio management information, including credit review reports, concentration reports, asset quality trend reports, delinquencies and charge-offs. The approval of the senior credit risk management committee is required for changes to our credit policy as well as lending authority.
Concentration Limits. Our policies establish concentration limits for our various industry types including commercial and consumer real estate, specialty lending, leveraged lending as well as other regulatory categories. Concentration limits are monitored and reassessed on a periodic basis and reviewed by the Board of Directors on an annual basis.
Credit Approval Process. The approval of our Senior Loan Committee is generally required for loans in an amount greater than $5.0 million. The Senior Loan Committee has eight standing members, including the Chief Executive Officers of Cadence Bancorp, LLC, Cadence Bancorporation and Cadence Bank, our Chief Credit Underwriting Executive, who serves as chairman of the committee, and our Chief Administration Executive, who serves as vice chairman. Two “no” votes will result in declining a credit application.
For loans in an amount greater than $5 million that are risk rated 10 or worse, approval of the Credit Transition Committee is generally required. The Credit Transition Committee has five standing members, including our Chief Credit Administration Executive, who serves as chairman of the committee and our Chief Administration Executive, who serves as vice chairman. Two “no” votes will result in declining a credit application.
Portfolio Monitoring & Reporting. We believe that an important part of our assessment of client risk is the ongoing completion of periodic risk rating reviews. As part of these reviews, we seek to review the risk rating of each facility within a customer relationship and may recommend an upgrade or downgrade to the risk rating. Our policy is to review two times per year all customer relationships (including shared national credits) with an aggregate exposure of greater than $10 million. Our policy is to review annually all customer relationships with an aggregate exposure of greater than $2.5 million. Further, our policy is to review quarterly all customer relationships with an aggregate exposure of $1 million and greater with a risk rating of pass watch and customer relationships with an aggregate exposure of $500 thousand and greater with a criticized risk rating. Certain relationships are exempt from review, including relationships where our exposure is cash-secured. An updated risk rating scorecard is required during each risk review as well as with any credit event that requires credit approval.
190
Table of Contents
Marketing and Distribution
As of September 30, 2017, we conduct our banking business through 65 branches located in Texas and four states in the southeast United States. Our distribution network also includes 69 ATMs, 9 ITMs, fully integrated online banking and a telephone banking service. In addition, our customers have free access to approximately 1,200 Publix Presto! ATMs located throughout Alabama, Florida, Georgia, North Carolina, South Carolina and Tennessee and over 55,000 Allpoint ATMs worldwide. Our ATMs are enabled for several networks, including Visa, Discover, MasterCard, NYCE, Plus, Cirrus, Pulse, American Express and Quest.
We offer a broad suite of financial, wealth management and treasury management products and services to middle-market commercial business, high net worth individuals and business owners. We target growing companies and middle-market businesses, as well as individual consumers throughout Texas and the southeast United States. In order to market our deposit products, we use local print advertising and direct mail and provide sales incentives for our employees. We market our lending products through our experienced relationship managers, who rely on robust calling efforts and relationship banking to develop relationships with customers that result in business growth and product sales. Our compensation plans for our relationship managers include incentives based on achievement of certain loan, deposit, fee, income and other metrics.
Competition
The financial services industry in general and in our markets in Texas and the southeast United States are highly competitive. We compete actively with national, regional and local financial services providers, including banks, thrifts, credit unions, mortgage bankers and finance companies, money market mutual funds and other financial institutions, some of which are not subject to the same degree of regulation and restrictions imposed upon us. See “Risk Factors—Risks Relating to Our Business—We face significant competition to attract and retain customers and clients, which could adversely affect our growth and profitability.”
Competition among providers of financial products and services continues to increase, with consumers having the opportunity to select from a growing variety of traditional and non-traditional alternatives. The primary factors driving commercial and consumer competition for loans and deposits are the interest rates, the fees charged, the levels of customer service and the range of products and services offered. In addition, other competitive factors include the location and hours of our branches.
In addition to the terms of loans and deposits, we compete with other financial institutions with respect to the terms of swaps and letters of credit that we offer our customers and the fraud prevention products and other technological aspects of customers’ accounts that we provide, including compatibility with our commercial customers’ accounting systems. In the future we may compete with respect to the terms of hedges, investment banking opportunities and equity and mezzanine debt offered to our customers.
Employees
As of September 30, 2017, we had approximately 1,191 full-time equivalent employees. None of our employees is represented by any collective bargaining unit or is a party to a collective bargaining agreement. We believe that our relations with our employees are good.
Properties
Our main office is located at 2800 Post Oak Boulevard, Suite 3800, Houston, Texas 77056. In addition to our main office, which is leased, as of September 30, 2017, we operate from 65 branch offices located in Texas, Alabama, Florida, Mississippi and Tennessee, of which 28 are leased, 50 are in free standing facilities, 52 provide for drive-up access, and most are equipped with ATMs. Additionally, throughout our footprint, we operate two operations centers (one leased, one owned), three leased trust offices, four insurance offices (three leased, one owned), three leased mortgage offices, six leased Linscomb & Williams offices, and two leased lending offices; with most of these located within our branch offices.
191
Table of Contents
Legal Proceedings
From time to time we are a party to various litigation matters incidental to the conduct of our business. We are not presently party to any legal proceedings the resolution of which we believe would have a material adverse effect on our business, prospects, financial condition, and liquidity, results of operation, cash flows or capital levels.
192
Table of Contents
Executive Officers
The following table sets forth information as of the date of this prospectus regarding our executive officers. Ages are given as of the date of this prospectus.
| Name |
Age |
Position | ||||
| Paul B. Murphy, Jr. |
58 | Director, Chairman and Chief Executive Officer | ||||
| Samuel M. Tortorici |
52 | President | ||||
| Valerie C. Toalson |
52 | Executive Vice President, Chief Financial Officer | ||||
| R.H. “Hank” Holmes, IV |
46 | Executive Vice President | ||||
| Jerry W. Powell |
68 | Executive Vice President, General Counsel and Secretary | ||||
| J. Randall Schultz |
59 | Executive Vice President | ||||
Paul B. Murphy, Jr. has served as our Chief Executive Officer and as the Chairman of our board of directors since 2010 and has served as Chief Executive Officer of Cadence Bancorp, LLC since 2010. Prior to that, he spent nearly 20 years at Amegy Bank of Texas, helping to steer that institution from $50 million in assets and a single location to assets of $11 billion and 85 branches in the Houston, Dallas and San Antonio metropolitan areas when he left as a Director and Chief Executive Office in 2009. Mr. Murphy managed the sale of Amegy to Zions Bancorporation for $1.7 billion in 2005, with original investors in Amegy realizing a return of approximately 36 times their initial investment. Mr. Murphy serves as a board member of the Houston Endowment, Inc., the Hines Real Estate Investment Trust, Inc., Oceaneering International, Inc., the Houston branch of the Federal Reserve Bank of Dallas, Kinkaid School and The Children’s Museum of Houston. Mr. Murphy earned a bachelor’s degree in banking and finance from Mississippi State University and his MBA from the University of Texas at Austin.
Samuel M. Tortorici has served as the President of Cadence Bancorporation and its predecessor, Cadence Financial Corporation, since 2011 and has served as Chief Executive Officer of Cadence Bank since joining Cadence in 2011. Prior to that, he had a 24-year career at Regions and AmSouth Bancorp, where in his final role he led Regions’ Commercial & Industrial business, comprised of over 500 banking professionals across 16 states, more than $40 billion in loan commitments and deposits with annual revenue in excess of $1 billion. While there, he spearheaded development of a range of commercial industry specialty businesses and held a number of Commercial and General Bank leadership positions with responsibility for sales and services across a variety of banking businesses. Mr. Tortorici serves as Board Chairman of United Way of Central Alabama and is on the executive committee of University of Alabama President’s Cabinet. Mr. Tortorici is a graduate of the University of Alabama.
Valerie C. Toalson has served as the Executive Vice President, Chief Financial Officer of Cadence Bancorporation and its predecessor, Cadence Financial Corporation, and as Executive Vice President, Chief Financial Officer of Cadence Bank since January 2013, when she joined Cadence. Prior to that, she served as Executive Vice President, Chief Financial Officer of BankAtlantic Bancorp and BankAtlantic N.A., and previously held several senior leadership positions at BOK Financial Corporation, including Corporate Controller, Manager of Credit Services, Manager of Process Improvement and Chief Auditor. Ms. Toalson began her career in audit at Price Waterhouse where she received her certified public accounting certificate. Ms. Toalson is an active volunteer in her community and earned a Bachelor of Science in Accounting from Oklahoma State University.
R.H. “Hank” Holmes, IV was appointed as Executive Vice President of the Company in 2016 and as President of Cadence Bank in 2014 and has served as the Business Services Executive and President, Texas Region of Cadence Bank since joining Cadence Bank in 2011. Mr. Holmes brings more than 20 years of banking expertise, 18 of which were at Amegy Bank of Texas where his experience spanned credit, commercial real estate, private banking and special assets. Mr. Holmes serves on the Board of Directors for the University of
193
Table of Contents
Mississippi’s School of Banking and Finance and is a member of the Young Presidents Organization. He earned a bachelor’s degree in managerial finance from the University of Mississippi.
Jerry W. Powell has served as our Executive Vice President, General Counsel and Secretary of Cadence Bancorporation and its predecessor, Cadence Financial Corporation, Cadence Bancorp, LLC and Cadence Bank since 2011. Immediately prior to joining Cadence, Mr. Powell served as special counsel at Jones Walker in the firm’s Financial Services Section. Prior to that, Mr. Powell was the General Counsel for BBVA Compass in the United States and General Counsel of Compass Bank, a position he held for more than 25 years. Before joining Compass he was a lawyer at a general-practice firm in Birmingham, with an emphasis on litigation, creditor’s rights and consumer compliance. Mr. Powell serves as a board member of AIDS Alabama, a member of the President’s Advisory Council of Birmingham-Southern College and Chairman of the Farrah Law Alumni Society at the University of Alabama School of Law. Mr. Powell is a graduate of Birmingham-Southern College with a Bachelor of Arts in Political Science, cum laude, and the University of Alabama School of Law, with honors. Mr. Powell is a member of the American Bar Association and the Alabama Bar Association.
J. Randall Schultz has served as our Executive Vice President of Cadence Bancorporation and its predecessor, Cadence Financial Corporation, since 2016 and as Executive Vice President, Managing Director of Specialized Industries of Cadence Bank since December 2011, when he joined Cadence. Prior to joining Cadence, Mr. Schultz was the founder and Managing Director of Regions Bank’s Restaurant Banking Group, which was formed in April 2009 and grew assets under management to approximately $1.3 billion by 2011. Prior to that, Mr. Schultz was Managing Director of Bank of America’s Restaurant and Beverage Finance Group from 1996 to 2006, which he helped grow from $300 million in assets under management to approximately $7 billion in assets and $200 million in revenue. Mr. Schultz led multiple lines of business on a regional and national basis during his tenure at Bank of America, including commercial banking, corporate and investment banking and global treasury management. Mr. Schultz received his Bachelor of Arts from Mississippi State University and his master’s degree in economics from Johns Hopkins University.
Board of Directors
Our board of directors consists of five members and two advisory members. The following table sets forth information as of the date of this prospectus regarding the members, and advisory members, of our board of directors. Ages are given as of the date of this prospectus.
| Name |
Age |
Position | ||||
| Paul B. Murphy, Jr. |
58 | Director, Chairman and Chief Executive Officer | ||||
| William B. Harrison, Jr. |
74 | Director | ||||
| Robert K. Steel |
66 | Director | ||||
| J. Richard Fredericks |
72 | Director | ||||
| Scott M. Stuart |
58 | Director | ||||
| Marc Shapiro |
70 | Senior Advisory Director | ||||
| Stanley Levy |
54 | Advisory Director | ||||
William B. Harrison, Jr., our Lead Director, has served on the board of directors of Cadence Bancorp, LLC since 2010 and as Chairman since 2010. He is the retired Chief Executive Officer at J.P. Morgan & Co. Inc., a position he held from November 2001 to December 2005. He served as the Chairman and Chief Executive Officer at JPMorgan Chase & Co. from January 2000 to December 2006 and as its President from January to December 2001. Mr. Harrison is a member of the J.P. Morgan International Council. He is also a member of the Advisory Board of the Aurora Capital Group, the Advisory Board of Chilton Investment Company, and the Advisory Board of Spencer Stuart. He serves on the Board of Directors of Lincoln Center for the Performing Arts, the Board of Overseers of Memorial Sloan-Kettering Cancer Center, and the Advisory Board of the Museum of American Finance. Mr. Harrison’s extensive experience as an investment banker and executive at a financial institution qualifies him to serve on our board of directors.
194
Table of Contents
Robert K. Steel has served on the Cadence Bancorp, LLC board of directors since 2010. Since July 2014 he has served as the Chief Executive Officer of Perella Weinberg Partners. Previously, he was New York City’s Deputy Mayor for Economic Development under Mayor Michael Bloomberg. Prior to that, Mr. Steel served as the Chief Executive Officer and President of Wachovia Corp. From 2006 to 2008, Mr. Steel was the Under Secretary for Domestic Finance at the U.S. Department of the Treasury. Previously he served as the Head of Equities Division in Europe, Vice Chairman and a member of the Management Committee at Goldman Sachs. Mr. Steel has served as Chairman of Duke’s Board of Trustees, Senior Fellow at the Harvard Kennedy School of Government, a member of the FDIC Advisory Committee on Economic Inclusion, Chairman of The After-School Corporation and Co-Founder of SeaChange Capital Partners. Mr. Steel currently serves as a board member of the Hospital for Special Surgery, The Morgan Library & Museum and The Rockefeller University, and is a member of the Board of Directors of Lincoln Center for the Performing Arts. Mr. Steel’s substantial experience in leadership and management in the public sector and banking sector qualifies him to serve on our board of directors.
J. Richard Fredericks has served on the Cadence Bancorp, LLC board of directors since 2010. Ambassador J. Richard Fredericks is a Founding Partner and Managing Director at Main Management, LLC, a position he has held since 2002. Previously, he was an Entrepreneur in Residence at Weston Presidio. Prior to that, Mr. Fredericks was the U.S. Ambassador to Switzerland and Liechtenstein from 1999 to 2001. Previously, in 1977, he joined Montgomery Securities as a Partner and later became a Senior Managing Director in Investment Research, covering the banking and financial service area. In 1995, Mr. Fredericks was responsible for investment banking efforts for the financial industry in the areas of commercial banking, thrifts and financial technology at Montgomery Securities. Prior to that, he joined Shuman, Agnew and Company in 1975 as a Partner. Previously, Mr. Fredericks began his career at Dean Witter in 1970 as a Securities Analyst. For 17 consecutive years, Mr. Fredericks was chosen by Institutional Investor Magazine as an “All-American” Research Analyst, covering the commercial banking industry. He is a former director of Janus Capital Group, Inc. and a Member on the Advisory Board of Financial Technology Ventures. Mr. Fredericks also sits on the Trust Fund Board of the Library of Congress. Mr. Fredericks’ significant experience in the brokerage industry, specializing in investment research analysis and investment banking, with a specific focus in the field of commercial banking and finance qualifies him to serve on our board of directors.
Scott M. Stuart has served on the Cadence Bancorp, LLC board of directors since 2010. He is a co-founder and managing partner of Sageview Capital LP, a position he has held since 2005. He is the former lead independent director at EverBank Financial and is currently a director at three private companies: DMT Development Systems Group Inc., Reflexis and United Capital. Prior to founding Sageview, Mr. Stuart was a Partner at KKR serving on their investment committee from 2000 to 2005. He joined KKR’s New York office in 1986 and became Partner in 1994, where he was responsible for the utilities and consumer products industry groups. Prior to joining KKR, Mr. Stuart worked at Lehman Brothers Kuhn Loeb, Inc. in the mergers and acquisitions group. Scott is also a member of the board at Memorial Sloan-Kettering Cancer Center. Mr. Stuart’s considerable experience in finance and knowledge of investments qualifies him to serve on our board of directors.
In addition, the following individuals are advisory directors:
Marc Shapiro is a Senior Advisory Director and has served as an advisory director of Cadence Bancorp, LLC since 2010. Mr. Shapiro was formerly the non-executive Chairman of J.P. Morgan Chase & Co.’s Texas operations and Vice Chairman for Finance and Risk Management of J.P. Morgan Chase & Co. from 1997 through 2003. Mr. Shapiro began his banking career in 1972 at Texas Commerce Bank, and served as Chief Financial Officer beginning in 1977. In 1989, after the bank was purchased by J.P. Morgan Chase, he was named Chief Executive Officer of the statewide organization. Mr. Shapiro is currently a member of the Board of Trustees for Rice University and the Board of Advisors of the James A. Baker III Institute for Public Policy at Rice University. He also currently serves as Chairman of the Board of the Baylor St. Luke’s Medical Center Hospital, and as a member of the Board of Trustees of Baylor College of Medicine and the Board of Visitors of MD Anderson Cancer Center.
195
Table of Contents
Stanley Levy is an Advisory Director, has served as an advisory director of Cadence Bancorp, LLC since 2010. Mr. Levy is currently the Chief Operating Officer of The Morgan Group, Inc., a national multi-family development, construction and property management firm based in Houston, Texas that has built and operated properties in ten states. Prior to joining The Morgan Group, Mr. Levy began his career at JP Morgan Chase & Co., where he worked for 15 years and served as Managing Director of Real Estate & Lodging Investment Banking for the Southern Region. Mr. Levy graduated with honors from The University of Texas with a BBA in Finance. Mr. Levy also serves as a director of Hines Real Estate Investment Trust, Inc. and treasurer of Congregation Beth Israel. Mr. Levy is a Past President of the Board of The Shlenker School in Houston and an active member of the National Multi Housing Council.
Election and Classification of Directors
In accordance with the terms of our charter, our board of directors is divided into three classes, Class I, Class II and Class III, with each class serving a staggered three-year term, and is divided as follows:
| • | the Class I director is Mr. Murphy, and his term expires at the annual meeting of stockholders expected to be held in 2018; |
| • | the Class II directors are Mr. Fredericks and Mr. Steel, and their term expires at the annual meeting of stockholders expected to be held in 2019; and |
| • | the Class III directors are Mr. Harrison and Mr. Stuart, and their term expires at the annual meeting of stockholders expected to be held in 2020. |
At each annual meeting of stockholders, upon the expiration of the term of a class of directors, the successor to each such director in the class will be elected to serve from the time of election and qualification until the third annual meeting following his or her election and until his or her successor is duly elected and qualified, in accordance with our charter. Any additional directorships resulting from an increase in the number of directors will be distributed among the three classes so that, as nearly as possible, each class will consist of one-third of the directors. Advisory members of our board of directors are not elected by shareholders and do not vote on matters determined by vote by our board. They are appointed and may be removed by our board of directors and serve indefinite terms.
Controlled Company
Because Cadence Bancorp, LLC controls a majority of our outstanding voting power, and will continue to do so following the completion of this offering, we are a “controlled company” within the meaning of the corporate governance standards of the NYSE. As a result, although the members of our audit committee are required to be independent, we are not required to have a majority of our board of directors be independent, nor are we required to have a compensation committee or an independent nominating function under the rules of the NYSE.
Director Independence
Under the rules of the NYSE, independent directors must comprise a majority of our board of directors by the one-year anniversary of the time Cadence Bancorp, LLC ceases to own a majority of our voting stock. The rules of the NYSE, as well as those of the SEC, impose several requirements with respect to the independence of our directors. Our board of directors has evaluated the independence of its members based upon the rules of the NYSE and the SEC. Applying these standards, our board of directors has determined that, with the exception of Mr. Murphy, each of our current directors is an independent director, as defined under the rules of the NYSE. The board of directors has determined that Mr. Murphy does not qualify as an independent director because he is an employee of Cadence Bancorporation and Cadence Bancorp, LLC. See “Certain Relationships and Related Party Transactions.”
196
Table of Contents
Compensation Committee Interlocks and Insider Participation
None of the members of our Compensation Committee is or has been an officer or employee of the Company or any of our subsidiaries. In addition, none of our executive officers serves or has served as a member of the board of directors, Compensation Committee or other board committee performing equivalent functions of any entity that has one or more executive officers serving as one of our directors or on our Compensation Committee.
Board Committees
Our board of directors has established standing committees in connection with the discharge of its responsibilities. These committees include the Audit Committee, the Compensation Committee, the Nominating and Corporate Governance Committee and the Risk Committee. The responsibilities of these committees are described below. Our board of directors also may establish such other committees as it deems appropriate, in accordance with applicable law and regulations and our corporate governance documents. The following table summarizes the membership of each of the committees of the board of directors:
| Director Name |
Audit Committee |
Compensation Committee |
Nominating and Governance Committee |
Risk Committee | ||||
| Paul B. Murphy, Jr. |
Member | |||||||
| William B. Harrison, Jr. |
Member | Chairperson | Chairperson | |||||
| Robert K. Steel |
Member | Member | Member | Chairperson | ||||
| J. Richard Fredericks |
Chairperson | Member | Member | Member | ||||
| Scott M. Stuart |
Member | Member |
Audit Committee. The Audit Committee assists the board of directors in fulfilling its responsibilities for general oversight of the integrity of our financial statements, compliance with legal and regulatory requirements, the independent auditors’ qualifications and independence, the performance of our internal audit function and independent auditors and risk assessment and risk management. Among other things, the Audit Committee:
| • | annually reviews the Audit Committee charter and the committee’s performance; |
| • | appoints, evaluates and determines the compensation of our independent auditors; |
| • | reviews and approves the scope of the annual audit, the audit fee, the financial statements, significant accounting policies changes, material weaknesses identified by outside auditors or Internal Audit and risk management issues; |
| • | prepares the Audit Committee report for inclusion in our proxy statement for our annual meeting; |
| • | reviews disclosure controls and procedures, internal controls, internal audit function, and corporate policies with respect to financial information; |
| • | oversees investigations into complaints concerning financial matters, if any; and |
| • | reviews other risks that may have a significant impact on our financial statements. |
The Audit Committee works closely with management as well as our independent auditors. The Audit Committee has the authority to obtain advice and assistance from, and receive appropriate funding to engage outside legal, accounting or other advisors as the Audit Committee deems necessary to carry out its duties. The Audit Committee adopted a written charter that among other things, specifies the scope of its rights and responsibilities. The charter is available on our website at www.cadencebancorporation.com.
The Audit Committee is composed solely of members who satisfy the applicable independence and other requirements of the NYSE for Audit Committees, and each of its members is an “audit committee financial expert.” Mr. Harrison and Mr. Fredericks also qualify as independent directors under the independence
197
Table of Contents
requirements of Rule 10A-3 of the Exchange Act. The Company relied on an exemption pursuant to Rule 10A-3(b)(1)(iv)(A) under the Exchange Act with respect to Mr. Robert Steel’s membership on the Audit Committee upon completion of each of our IPO and our November 2017 offering. Mr. Steel is the Chief Executive Officer of Perella Weinberg Partners Group LP, the parent company of Tudor, Pickering, Holt & Co., one of the underwriters in our IPO, and therefore did not satisfy the independence requirements of Rule 10A-3 at the time each of our IPO and our November 2017 offering was completed.
Compensation Committee. The Compensation Committee is responsible for discharging the Board’s responsibilities relating to compensation of the executives and directors. Among other things, the Compensation Committee:
| • | evaluates human resources and compensation strategies; |
| • | reviews and approves objectives relevant to executive officer compensation; |
| • | evaluates performance and determines the compensation of the Chief Executive Officer in accordance with those objectives; |
| • | approves any changes to non-equity-based benefit plans involving a material financial commitment; |
| • | recommends to the board of directors compensation for directors; |
| • | prepares the Compensation Committee report required by SEC rules to be included in our annual report; and |
| • | evaluates performance in relation to the Compensation Committee charter. |
The Compensation Committee has adopted a written charter that among other things, specifies the scope of its rights and responsibilities. The charter is available on our website at www.cadencebancorporation.com.
Nominating and Corporate Governance Committee. The Nominating and Corporate Governance Committee is responsible for making recommendations to our board of directors regarding candidates for directorships, and the size and composition of our board of directors. In addition, the Nominating and Corporate Governance Committee is responsible for overseeing our corporate governance guidelines and reporting, and making recommendations to our board of directors concerning governance matters. Among other things, the Nominating and Governance Committee:
| • | identifies individuals qualified to be directors consistent with the criteria approved by the board of directors and recommends director nominees to the full board of directors; |
| • | ensures that the Audit and Compensation Committees have the benefit of qualified “independent” directors; |
| • | oversees management continuity planning; |
| • | leads the board of directors in its annual performance review; and |
| • | takes a leadership role in shaping the corporate governance of our organization. |
The Nominating and Corporate Governance Committee has adopted a written charter that among other things, specifies the scope of its rights and responsibilities. The charter is available on our website at www.cadencebancorporation.com.
Risk Committee. The Risk Committee is responsible for overseeing our enterprise-risk management policies, commensurate with our capital structure, risk profile, complexity, size and other risk-related factors. Among other things, the Risk Committee:
| • | monitors our overall risk profile and reviews risk management policies; |
198
Table of Contents
| • | monitors our process to identify, assess and manage risks that could prevent us from achieving our business objectives; |
| • | oversees actions relating to interest rate risk and liquidity risks; |
| • | oversees actions relating to the activities of our enterprise risk management oversight groups; and |
| • | facilitates communication among management, the board of directors and our enterprise risk management oversight groups. |
The Risk Committee has adopted a written charter that among other things, specifies the scope of its rights and responsibilities. The charter is available on our website at www.cadencebancorporation.com.
Code of Business Conduct and Ethics
Our board of directors has adopted a code of business conduct and ethics (the “Code of Ethics”) that applies to all of our directors, officers and employees, including our principal executive officer, principal financial officer, principal accounting officer and persons performing similar functions. The Code of Ethics is available upon written request to Corporate Secretary, Cadence Bancorporation, 2800 Post Oak Boulevard, Suite 3800, Houston, Texas 77056 or on our website at www.cadencebancorporation.com. If we amend or grant any waiver from a provision of our Code of Ethics that applies to our executive officers, we will publicly disclose such amendment or waiver on our website and as required by applicable law, including by filing a Current Report on Form 8-K.
199
Table of Contents
Summary Compensation Table
The following summary compensation table sets forth the total compensation during the fiscal years ended December 31, 2017 and December 31, 2016 of our Chief Executive Officer and our two other most highly compensated executive officers who were serving as executive officers on December 31, 2017. We refer to these officers as our “named executive officers.”
| Name and Principal Position |
Year | Salary ($) |
Bonus ($)(1) |
Stock Awards ($)(2) |
Non-Equity Plan Compensation ($)(3) |
All Other Compensation ($)(4) |
Total ($) |
|||||||||||||||||||||
| Paul B. Murphy, Jr., |
2017 | 675,000 | — | 250,000 | — | 26,529 | 951,529 | |||||||||||||||||||||
| Chief Executive Officer, Cadence Bancorporation |
2016 | 625,000 | 765,625 | 1,137,432 | — | 50,220 | 2,578,277 | |||||||||||||||||||||
| Samuel M. Tortorici, |
2017 | 425,000 | — | 150,000 | 121,245 | 12,374 | 708,619 | |||||||||||||||||||||
| President Cadence Bancorporation and Chief Executive Officer, Cadence Bank |
2016 | 425,000 | 416,500 | 674,742 | — | 12,141 | 1,685,261 | |||||||||||||||||||||
| R.H. “Hank” Holmes, IV, |
2017 | 375,000 | — | 125,000 | 70,726 | 30,827 | 601,553 | |||||||||||||||||||||
| Executive Vice President, Cadence Bancorporation and President, Cadence Bank |
2016 | 350,000 | 389,000 | 519,641 | — | 34,683 | 1,371,767 | |||||||||||||||||||||
| (1) | The amounts in this column reflect the annual bonuses granted to our named executive officers related to fiscal year 2016 under the Executive Incentive Plan. For Mr. Holmes, the amount for 2016 includes loan forgiveness of $54,000. Annual bonuses granted to our named executive officers in respect of fiscal year 2017 had not been determined as of the date of the registration statement of which this prospectus is a part. We expect the amount of such bonuses will be determined no later than February 6, 2018. |
| (2) | Amounts in this column reflect the aggregate grant date fair value of (a) performance-based restricted stock unit awards granted in 2016 under the Cadence Bancorporation 2015 Omnibus Incentive Plan, determined in accordance with FASB ASC Topic 718; (b) Phantom A units granted in 2016 under the Cadence 2013 Long-Term Incentive Plan, determined in accordance with FASB ASC Topic 718; and (c) cash-settled phantom Cadence shares granted in 2017 under the Cadence 2013 Long-Term Incentive Plan, determined in accordance with FASB ASC Topic 718. The discussion of the assumptions used for purposes of valuation of performance-based restricted stock units, the Phantom A units, and cash-settled phantom Cadence shares granted in 2016 and 2017 (as applicable) appears in “Note 18—Equity-based Compensation,” and “Note 1—Summary of Accounting Policies—Long Term Incentive Plan,” in the accompanying 2017 consolidated financial statements. See “—Amended and Restated Cadence Bancorporation 2015 Omnibus Incentive Plan” for a description of the performance-based restricted stock units and “—Cadence Bank 2013 Long-Term Incentive Plan” for a description of the Phantom A units and cash-settled phantom Cadence shares. The aggregate grant date fair value of performance-based restricted stock units granted in 2016 was as follows: Mr. Murphy, $887,432; Mr. Tortorici, $524,742; and Mr. Holmes, $432,141. The maximum grant date fair value for performance-based restricted stock units granted in 2016 if the performance-based restricted stock units vested at their maximum level is as follows: Mr. Murphy, $1,553,006; Mr. Tortorici, $918,299; and Mr. Holmes, $756,246. The aggregate grant date fair value of Phantom A units granted in 2016 was as follows: Mr. Murphy, $250,000; Mr. Tortorici, $150,000; and Mr. Holmes, $87,500. The aggregate grant date fair value of the cash-settled phantom Cadence shares granted in 2017 was as follows: Mr. Murphy, $250,000; Mr. Tortorici, $150,000; and Mr. Holmes, $125,000. |
| (3) | The amounts for fiscal year 2017 reflect long-term cash performance awards granted under the Cadence Bank 2013 Long-Term Incentive Plan in 2014 that vested in 2017. No amounts were payable in 2016 with |
200
Table of Contents
| respect to long-term cash performance awards granted under the Cadence Bank 2013 Long-Term Incentive Plan in 2013. |
| (4) | The amounts in this column for 2017 consisted of the following: |
| Name |
Country Club Allowance ($) |
Auto Allowance ($) |
Split- Dollar Earnings ($) |
401(k) Match ($)(a) |
Life Insurance ($) |
Total ($) |
||||||||||||||||||
| Paul B. Murphy, Jr. |
9,897 | 5,750 | 718 | 8,100 | 2,064 | 26,529 | ||||||||||||||||||
| Samuel M. Tortorici |
— | — | 470 | 10,800 | 1,104 | 12,374 | ||||||||||||||||||
| R.H. “Hank” Holmes, IV |
13,244 | 5,750 | 313 | 10,800 | 720 | 30,827 | ||||||||||||||||||
| (a) | The amount of the 401(k) match provided in fiscal year 2017 does not include the 401(k) true-up amount expected to be paid to Mr. Murphy, as this amount was not calculable as of date of the registration statement of which this prospectus is a part. |
Executive Incentive Plan
Our named executive officers were paid annual bonuses in respect of each of fiscal years 2017 and 2016 at the discretion of the Compensation Committee of the board of directors of Cadence Bank, which we refer to as the “Cadence Bank Compensation Committee,” based on the Cadence Bank Compensation Committee’s evaluation of the executive’s individual performance and that of Cadence Bank during the year.
Employment Agreements with Named Executive Officers
We have entered into employment agreements with each of our named executive officers. The following is a summary of the material terms of each such agreement.
Employment Agreement with Paul B. Murphy, Jr.
On February 1, 2015, we entered into an employment agreement with Mr. Murphy pursuant to which he serves as our Chief Executive Officer, a member of our board of directors, and as Chairman of the board of directors of Cadence Bank. The employment agreement provides for an initial term of one year and automatic annual renewals thereafter unless either party provides notice of non-renewal at least 90 days prior to the renewal date (in which case the term will end on the first anniversary of the renewal date). Under the employment agreement, Mr. Murphy is entitled to an annual base salary of no less than $625,000 and is eligible to receive an annual incentive payment for each fiscal year, with the target incentive opportunity being equal to 100% of his base salary (which opportunity was subsequently increased to 125% of his base salary) and the maximum incentive opportunity being equal to 150% of his base salary. Mr. Murphy is also eligible to receive employee benefits, fringe benefits, and perquisites in accordance with our established policies and to participate in equity or other long-term compensation programs at the discretion of the Compensation Committee of our board of directors. In addition, Mr. Murphy’s employment agreement provides for certain severance benefits in the event of a qualifying termination of employment and certain payments in connection with a “change in control” of the Company. See “—Potential Payments upon a Termination of Employment or a Change in Control.”
Employment Agreement with Samuel M. Tortorici
On February 1, 2015, we entered into an employment agreement with Mr. Tortorici (which was amended and restated on March 14, 2017) pursuant to which he serves as our President and the Chief Executive Officer of Cadence Bank. The employment agreement provides for an initial term of one year and automatic annual renewals thereafter unless either party provides notice of non-renewal at least 90 days prior to the renewal date (in which case the term will end on the first anniversary of the renewal date). Under the employment agreement, Mr. Tortorici is entitled to an annual base salary of no less than $425,000 and is eligible to receive an annual
201
Table of Contents
incentive payment for each fiscal year, with the target incentive opportunity being equal to 100% of his base salary and the maximum incentive opportunity being equal to 150% of his base salary. Mr. Tortorici is also eligible to receive employee benefits, fringe benefits, and perquisites in accordance with our established policies and to participate in equity or other long-term compensation programs at the discretion of the Compensation Committee of our board of directors. In addition, Mr. Tortorici’s employment agreement provides for certain severance benefits in the event of a qualifying termination of employment and certain payments in connection with a “change in control” of the Company. See “—Potential Payments upon a Termination of Employment or a Change in Control.”
Employment Agreement with R.H. “Hank” Holmes, IV
On February 1, 2015, we entered into an employment agreement with Mr. Holmes (which was amended and restated on March 14, 2017) pursuant to which he serves as our Executive Vice President and the President of Cadence Bank. The employment agreement provides for an initial term of one year and automatic annual renewals thereafter unless either party provides notice of non-renewal at least 90 days prior to the renewal date (in which case the term will end on the first anniversary of the renewal date). Under the employment agreement, Mr. Holmes is entitled to an annual base salary of no less than $350,000 and is eligible to receive an annual incentive payment for each fiscal year, with the target incentive opportunity being equal to 100% of his base salary. Mr. Holmes is also eligible to receive employee benefits, fringe benefits, and perquisites in accordance with our established policies and to participate in equity or other long-term compensation programs at the discretion of the Compensation Committee of our board of directors. In addition, Mr. Holmes’s employment agreement provides for certain severance benefits in the event of a qualifying termination of employment and certain payments in connection with a “change in control” of the Company. See “—Potential Payments upon a Termination of Employment or a Change in Control.”
Cadence Bancorp, LLC 2010 Class C Incentive Unit Award Plan
Cadence Bancorp, LLC has established the 2010 Class C Incentive Unit Award Plan, which we refer to as the “2010 Plan,” to provide employees, directors, and offering managers of Cadence Bancorp, LLC as well as its structuring adviser with an opportunity to participate in Cadence Bancorp, LLC’s future income and appreciation and to enhance Cadence Bancorp, LLC’s ability to attract and retain talented individuals to contribute to the sustained progress, growth, and profitability of Cadence Bancorp, LLC.
The 2010 Plan provides for the grant of Class C Incentive Units of Cadence Bancorp, LLC, which we refer to as “Class C units.” Class C units represent non-voting limited liability company interests in Cadence Bancorp, LLC that are intended to be treated as “profits interests” for United States federal income tax purposes, meaning that they generally entitle the holder only to value created by the future appreciation or profits of Cadence Bancorp, LLC.
Equity Awards Granted to Named Executive Officers
Cadence Bancorp, LLC has previously granted Class C units to each of Messrs. Murphy, Tortorici, and Holmes. Class C unit awards granted to our named executive officers generally vest as follows: one-sixth on the first and second anniversaries of the date of grant, and one-third on each of the third and fourth anniversaries of grant, subject, in each case, to continued employment and to accelerated vesting of a portion of the award upon certain terminations of employment. In addition, upon the consummation of a transaction in which the majority of Cadence Bancorp, LLC members cease to own a majority of the voting power in Cadence Bancorp, LLC or in which all or substantially all of the assets of Cadence Bancorp, LLC or its subsidiaries are sold to unaffiliated third parties, 100% of any outstanding unvested Class C units will become vested immediately prior to such transaction.
202
Table of Contents
Cadence Bank 2013 Long-Term Incentive Plan
Cadence Bank has established the 2013 Long-Term Incentive Plan, which we refer to as the “2013 LTIP,” to optimize the profitability and growth of Cadence Bank through long-term incentives that are consistent with Cadence Bank’s goals. The 2013 LTIP aims to link the personal interests of plan participants to those of Cadence Bank, to provide plan participants with an incentive for excellence in individual performance, and to promote teamwork among participants.
The 2013 LTIP is administered by the Cadence Bank Compensation Committee. The Cadence Bank Compensation Committee has the power, among other things, to select who will participate in the 2013 LTIP, determine the sizes, types, and terms and conditions of awards under the 2013 LTIP, construe and interpret the 2013 LTIP and related award agreements, and certify whether award requirements have been met.
The 2013 LTIP provides for the grant of cash-based awards having a value and terms and conditions, including performance measures, if applicable, established by the Cadence Bank Compensation Committee in its sole discretion. Under the 2013 LTIP, upon a “change in control” of Cadence Bancorp, LLC, all outstanding unvested awards granted under the 2013 LTIP will become fully vested, with performance goals deemed to be attained at target levels, and will be payable 36 months after the grant date, subject to continued employment (or, if earlier, upon a termination of employment without cause following a sale of Cadence Bancorp, LLC). A “change in control” under the 2013 LTIP will generally occur upon (1) the consummation of a transaction in which the majority of Cadence Bancorp, LLC members cease to own a majority of the voting power in Cadence Bancorp, LLC or in which all or substantially all of the assets of Cadence Bancorp, LLC or its subsidiaries are sold to unaffiliated third parties, (2) the individuals who constituted the board of directors of Cadence Bank at the time the 2013 LTIP was adopted ceasing to constitute a majority of the board of directors (subject to certain exceptions), or (3) the approval by the members of Cadence Bancorp, LLC of a complete liquidation or dissolution of Cadence Bancorp, LLC.
LTIP Awards Granted to Named Executive Officers
During 2016, each of Messrs. Murphy, Tortorici, and Holmes were granted awards under the 2013 LTIP consisting of (a) a long-term performance cash award, which we refer to as “Long-Term Performance Cash,” which will cliff vest on April 1, 2019, subject to continued employment and the attainment of certain performance goals tied to cumulative core net income; and (b) Phantom A units, which track the fair value of Class A units of Cadence Bancorp, LLC, and which vest on April 1, 2019, subject to continued employment. The value of the Long-Term Performance Cash will be determined based on the extent to which performance goals are satisfied by application of a payout factor to the target value of the award. Phantom A units will be settled in cash based on the fair value of Class A units on the vesting date.
During 2017, each of Messrs. Murphy, Tortorici, and Holmes were granted awards under the 2013 LTIP consisting of (a) a long-term performance cash award, which we refer to as “Long-Term Performance Cash,” which will cliff vest on April 1, 2020, subject to continued employment and the attainment of certain performance goals tied to adjusted GAAP pre-tax, pre-provision earnings; and (b) cash-settled phantom Cadence shares, which track the closing price of our Class A common stock, and which vest on April 1, 2020, subject to continued employment. The value of the Long-Term Performance Cash will be determined based on the extent to which performance goals are satisfied by application of a payout factor to the target value of the award. The cash-settled phantom Cadence shares will be paid based on the value of our Class A common stock on the vesting date.
Amended and Restated Cadence Bancorporation 2015 Omnibus Incentive Plan
The Company has adopted the Amended and Restated Cadence Bancorporation 2015 Omnibus Incentive Plan, which we refer to as the “2015 Omnibus Plan.” The principal purposes of this plan are to focus directors,
203
Table of Contents
officers, and other employees and consultants on business performance that creates shareholder value, to encourage innovative approaches to the business of the Company, and to encourage ownership of our Class A common stock by directors, officers, and other employees and consultants.
The 2015 Omnibus Plan provides for a variety of awards, including “incentive stock options” (within the meaning of Section 422 of the Code), which we refer to as “ISOs,” nonqualified stock options, stock appreciation rights, which we refer to as “SARs,” restricted stock, restricted stock units, performance units, other stock-based awards, or any combination of those awards. The 2015 Omnibus Plan provides that awards may be made under the plan for ten years. We have reserved shares of Class A common stock for issuance under the 2015 Omnibus Plan, subject to adjustment in certain circumstances to prevent dilution or enlargement.
Equity Awards Granted to Named Executive Officers
On November 30, 2016, we made a grant of PBRSUs to certain of our employees, including our named executive officers as follows: Mr. Murphy, 172,500 PBRSUs at target; Mr. Tortorici, 102,000 PBRSUs at target; and Mr. Holmes, 84,000 PBRSUs at target. The PBRSUs granted in 2016 vest based on continued service through the date on which the audit of the Company’s financial statements for the 2018 fiscal year is complete and the fair market value of a share of our Class A common stock as of December 31, 2018, with no shares vesting if the threshold value is not achieved and up to 1.75 times the target number of shares vesting if the maximum value is achieved. In the case of Messrs. Tortorici and Holmes, any amount paid to the executive upon the consummation of a change in control under the executive’s employment agreement prior to settlement of the vested PBRSUs (if any) will reduce the amount of shares of Class A common stock issued in settlement of the vested PBRSUs (based on the fair market value of a share of Class A common stock on the settlement date).
Upon a change in control that does not constitute a “supermajority change in control” (as defined in the applicable award agreement), the PBRSUs will remain outstanding and vest on the later of the date on which the PBRSUs would have otherwise vested and the first anniversary of such change in control, subject to continued service and the achievement of the applicable performance goals. Upon a supermajority change in control, the performance goals with respect to the PBRSUs will be deemed achieved at target.
Cadence Bancorporation Executive Bonus Plan
In connection with the consummation of our IPO, we adopted the Cadence Bancorporation Executive Bonus Plan, which we refer to as our “Bonus Plan.” The Bonus Plan is intended to provide an incentive for superior work and to motivate eligible executives of the Company toward even greater achievement and business results, to tie their goals and interests to those of ours and our stockholders, and to enable us to attract and retain highly qualified executives. Under the Bonus Plan, we may pay bonuses (including discretionary bonuses) to key executives, including executive officers, based upon such terms and conditions as our Board of Directors or Compensation Committee may in its discretion determine; however, bonuses to covered executives under the plan may not exceed $5 million in any given calendar year. The Bonus Plan is administered by our Board of Directors and/or the Compensation Committee. We may amend or terminate the Bonus Plan at any time in our sole discretion. Any amendments to the Bonus Plan will require stockholder approval only to the extent required by applicable law, rule, or regulation.
204
Table of Contents
Outstanding Equity Awards at Fiscal Year-End
The following table provides information regarding outstanding equity awards held by each of our named executive officers on December 31, 2017 (rounded to the nearest whole unit or share, as applicable).
| Option Awards(1) | Stock Awards | |||||||||||||||||||||||||||||||
| Name |
Number of Securities Underlying Unexercised Options Exercisable (#) |
Number of Securities Underlying Unexercised Options Unexercisable (#)(2) |
Option Exercise Price ($)(3) |
Option Expiration Date |
Number of Shares or Units of Stock that Have Not Vested (#) |
Market Value of Shares or Units of Stock that Have Not Vested ($)(4) |
Equity Incentive Plan Awards: Number of Unearned Shares, Units or Other Rights that Have Not Vested (#)(5) |
Equity Incentive Plan Awards: Market or Payout Value of Unearned Shares, Units or Other Rights that Have Not Vested ($)(6) |
||||||||||||||||||||||||
| Paul B. Murphy, Jr. |
30,883 | — | — | |||||||||||||||||||||||||||||
| 248 | (11) | 413,991 | ||||||||||||||||||||||||||||||
| 268 | (12) | 447,110 | ||||||||||||||||||||||||||||||
| 12,500 | (13) | 339,000 | ||||||||||||||||||||||||||||||
| 301,875 | (14) | 8,186,850 | ||||||||||||||||||||||||||||||
| Samuel M. Tortorici |
1,600 | — | (8 | ) | — | |||||||||||||||||||||||||||
| 1,000 | — | (9 | ) | — | ||||||||||||||||||||||||||||
| 1,000 | — | (8 | ) | — | ||||||||||||||||||||||||||||
| 583 | 1,167 | (7) | (10 | ) | — | |||||||||||||||||||||||||||
| 149 | (11) | 248,391 | ||||||||||||||||||||||||||||||
| 161 | (12) | 268,266 | ||||||||||||||||||||||||||||||
| 7,500 | (13) | 203,400 | ||||||||||||||||||||||||||||||
| 178,500 | (14) | 4,840,920 | ||||||||||||||||||||||||||||||
| Rudolph H. Holmes |
750 | — | (8 | ) | — | |||||||||||||||||||||||||||
| 500 | — | (9 | ) | — | ||||||||||||||||||||||||||||
| 250 | (8 | ) | — | |||||||||||||||||||||||||||||
| 583 | 1,167 | (7) | (10 | ) | — | |||||||||||||||||||||||||||
| 87 | (12) | 144,902 | ||||||||||||||||||||||||||||||
| 94 | (13) | 156,489 | ||||||||||||||||||||||||||||||
| 6,250 | (14) | 169,500 | ||||||||||||||||||||||||||||||
| 147,000 | (14) | 3,986,640 | ||||||||||||||||||||||||||||||
| (1) | Amounts listed are Class C units of Cadence Bancorp, LLC issued to the named executive officer under the Cadence Bancorp, LLC 2010 Class C Incentive Unit Award Plan. See “—Cadence Bancorp, LLC 2010 Class C Incentive Unit Award Plan” for more information. |
| (2) | Class C units become vested as follows: one-sixth vest on each of the first and second anniversaries of the grant date and one-third vest on each of the third and fourth anniversaries of the date of grant, subject to continued employment through the applicable vesting date and accelerated vesting on qualifying terminations of employment or on a “change in control” (as that term is defined in the 2010 Plan). |
| (3) | The Class C units granted to Messrs. Murphy, Tortorici, and Holmes participate in distributions attributable to appreciation in the fair market value of Cadence Bancorp, LLC or profits of Cadence Bancorp, LLC after their respective dates of grant. Class C units of Cadence Bancorp, LLC have no expiration date. |
| (4) | The amounts for Phantom A unit grants made in 2015 and 2016 are computed based on a value per Class A unit of $1,670.53 as of December 31, 2017. The amounts for phantom Cadence shares are computed based on a value per share of our Class A common stock of $27.12 as of December 29, 2017 (the last trading day of fiscal year 2017). |
| (5) | Amounts listed are PBRSUs granted under the 2015 Omnibus Plan (with unit and payout amounts computed based on maximum performance). If threshold performance is achieved, a pro rata portion of the target number of PBRSUs will vest based on the amount by which actual performance exceeds target performance. |
| (6) | Amounts computed based on a value per share of Class A common stock of $27.12 as of December 29, 2017 (the last trading day of fiscal year 2017). |
205
Table of Contents
| (7) | These Class C units vested with respect to 292 units on each of March 1, 2016 and March 1, 2017, and will vest with respect to 583 units on each of March 1, 2018 and March 1, 2019 (subject to rounding). |
| (8) | As of December 31, 2017, these Class C units would generally be entitled to participate in distributions to the extent the fair market value of the common equity of Cadence Bancorp, LLC exceeded $921.4 million |
| (9) | As of December 31, 2017, these Class C units would generally be entitled to participate in distributions to the extent the fair market value of the common equity of Cadence Bancorp, LLC exceeded $930 million. |
| (10) | As of December 31, 2017, these Class C units would generally be entitled to participate in distributions to the extent the fair market value of the common equity of Cadence Bancorp, LLC exceeded $1.015 billion. |
| (11) | Amounts listed are Phantom A units, which track the value of Class A units of Cadence Bancorp, LLC, granted to our named executive officers under the Cadence Bank 2013 Long-Term Incentive Plan. See “—Cadence Bank 2013 Long-Term Incentive Plan” for more information. These Phantom A units will vest on April 1, 2018, subject to continued employment through the vesting date and accelerated vesting on a “change in control” (as that term is defined in the 2013 LTIP). |
| (12) | Amounts listed are Phantom A units, which will vest on April 1, 2019, subject to continued employment through the vesting date and accelerated vesting on a “change in control” (as that term is defined in the 2013 LTIP). |
| (13) | Amounts listed are cash-settled phantom Cadence shares, which track the value of our Class A common stock, granted to our named executive officers under the Cadence Bank 2013 Long-Term Incentive Plan. See “—Cadence Bank 2013 Long-Term Incentive Plan” for more information. These cash-settled phantom Cadence shares will vest on April 1, 2020, subject to continued employment through the vesting date and accelerated vesting on a “change in control” (as that term is defined in the 2013 LTIP). |
| (14) | PBRSUs will vest on the date on which the audit of the Company’s financial statements for the 2018 fiscal year is completed, subject to continued service through that date and the fair market value of a share of our Class A common stock on December 31, 2018. See “—Amended and Restated Cadence Bancorporation 2015 Omnibus Incentive Plan” for more information. |
Other Compensation Programs and Practices
Retirement Plans and Benefits
Cadence Bank 401(k) Plan
Our named executive officers are each eligible to participate in our 401(k) plan, which is designed to provide retirement benefits to all eligible full-time and part-time employees. Our 401(k) plan provides employees with the opportunity to save for retirement on a tax-deferred basis, and permits employees to defer between 1% and 50% of eligible compensation, subject to statutory limits. Participants who are at least 50 years old are also entitled to make “catch-up” contributions, subject to certain limitations. Under the 401(k) plan, we are permitted to make both discretionary matching contributions and discretionary profit sharing contributions. Any discretionary matching contributions vest immediately, while any discretionary profit sharing contributions vest in equal installments over five years, subject to continued employment. Employees are fully vested in any contributions they make immediately. During fiscal years 2017 and 2016, we made matching contributions to all participants equal to the participant’s elective deferrals of up to 100% of the first 3% of their eligible earnings and 50% of the next 2% of their eligible earnings. We did not make any discretionary profit sharing contributions during fiscal years 2017 and 2016.
Cadence Bancorporation Deferred Compensation Plan
Mr. Tortorici also participates in the Cadence Bancorporation Deferred Compensation Plan, which we refer to as our “Deferred Compensation Plan,” and which is a nonqualified deferred compensation plan that permits key management officers and employees of the Company and its affiliates to defer income beyond the amounts permitted under the Company’s 401(k) plan. Under the Deferred Compensation Plan, a participant may elect to defer an amount not to exceed 25% of his or her basic compensation (i.e., base salary and any commissions) and up to 100% of his or her bonus, subject to certain limitations, until a fixed future date or his or her retirement. In our sole discretion, we may make additional contributions to participants’ accounts, which need not be uniform among participants. Any such contributions we make may be subject to vesting and forfeiture. We did not make any discretionary contributions during fiscal years 2017 and 2016 to the Deferred Compensation Plan.
206
Table of Contents
We have established a rabbi trust with respect to our Deferred Compensation Plan to which we contribute participants’ deferred amounts and any amounts contributed by us to the participants’ accounts. The Cadence Bancorporation Deferred Compensation Plan does not provide for above-market or preferential earnings.
Potential Payments upon a Termination of Employment or a Change in Control
Below we have described the severance and other change in control benefits to which our named executive officers would be entitled upon a termination of employment and in connection with a change in control.
Termination of Employment without Cause or Resignation with Good Reason
The employment agreements with each of our named executive officers provides for severance benefits if we terminate the executive without “cause” or the executive resigns with “good reason” (as each of those terms is defined in the applicable employment agreement), which circumstances we refer to as a “qualifying termination of employment.” Upon a qualifying termination of employment, the executive will be entitled to the following payments and benefits under his employment agreement:
| • | a lump sum cash payment consisting of accrued but unpaid base salary and unused vacation, which we refer to as the “accrued obligations”; |
| • | a lump sum cash payment consisting of any earned but unpaid annual incentive payment with respect to a completed fiscal year, which we refer to as the “unpaid incentive payment”; |
| • | cash severance equal to the product of (a) the sum of (i) the executive’s annual base salary and (ii) the executive’s target incentive payment for the fiscal year in which the termination occurs, multiplied by (b) two, payable in 24 equal monthly installments; |
| • | certain life insurance and medical benefits for the executive and his dependents for 24 months following the date of termination of employment, which we refer to as the “health and welfare benefits”; and |
| • | to the extent not paid, any other amounts or benefits that the executive is required to be paid or eligible to receive under any other employee benefit plan of the Company or its affiliates, which we refer to as the “other benefits.” |
For purposes of the employment agreements with our named executive officers, “cause” generally means (a) intentional misconduct; (b) fraud, embezzlement, or intentional theft from Cadence (which, for purposes of the employment agreements, means the Company and Cadence Bank); (c) intentional wrongful damage to Cadence’s property; (d) intentional wrongful disclosure of material confidential information, trade secrets, or confidential business processes of Cadence; (e) an act leading to a conviction of (i) a felony or (ii) a misdemeanor involving moral turpitude; (f) willful engagement in illegal conduct or gross misconduct, either of which is demonstrably and not insubstantially injurious to Cadence; or (g) continued refusal to follow lawful directions of the executive’s supervisor (other than any such refusal resulting from incapacity due to physical or mental illness) after a written demand to follow such directions is delivered to the executive by our board of directors or Cadence, as applicable, that specifically identifies the manner in which our board of directors or Cadence, as applicable, believes the executive has refused to follow such directions.
For purposes of the employment agreements with our named executive officers, “good reason” generally means the occurrence of any of the following without the written consent of the executive: (a) a material and adverse change in the executive’s position or a failure of Cadence to provide the executive with the authorities, responsibilities, and reporting relationships consistent with the executive’s position; (b) a material failure of Cadence to provide any compensation and benefits when due pursuant to the terms of the employment agreement; (c) a purported termination of the executive by Cadence other than as provided under the terms and conditions of the employment agreement; (d) a relocation of Cadence’s offices at which the executive is
207
Table of Contents
principally employed to a location more than 50 miles from such location, subject to certain exceptions for business travel; (e) a failure of the Company to require a successor to assume the employment agreement; or (f) Cadence providing a notice of nonrenewal to the executive under the employment agreement.
Termination of Employment with Cause or Resignation without Good Reason
If we terminate the employment of a named executive officer with “cause,” or the executive resigns without “good reason,” the executive will only be entitled to the accrued obligations and the other benefits.
Termination Due to Death or Disability
Under their respective employment agreements, upon a termination of employment due to death or disability, our named executive officers will generally be entitled to:
| • | the accrued obligations; |
| • | a prorated target incentive payment for the fiscal year in which the termination occurs; |
| • | in the case of disability, the health and welfare benefits for 12 months following the termination; and |
| • | the other benefits. |
The payments and benefits to which each named executive officer is entitled upon a termination of employment without cause, with good reason, or due to death or disability (except for the accrued obligations, the unpaid incentive payment, and the other benefits) are subject to his execution, delivery, and non-revocation of a release of claims in favor of the Company and its affiliates and compliance with the restrictive covenants set forth in the employment agreement.
Change in Control
Mr. Murphy
Under his employment agreement, upon a “change in control” of the Company (as that term is defined in the employment agreement), Mr. Murphy is entitled to receive a lump sum cash payment in an amount equal to the product of (a) the sum of (i) the executive’s annual base salary plus (ii) the executive’s target incentive payment for the fiscal year in which the change in control occurs, and (b) three. This payment would be in lieu of any cash severance to which Mr. Murphy would otherwise by entitled upon his termination of employment without cause or resignation for good reason on or following a change in control.
Messrs. Tortorici and Holmes
Under their respective employment agreements, upon a “change in control” of the Company (as that term is defined in the employment agreement) that occurs before June 30, 2019 and provided that any PBRSUs granted to the executive in 2016 have not been settled or forfeited, Messrs. Tortorici and Holmes will be entitled to receive a lump sum cash payment in an amount equal to the product of (a) the sum of (i) the executive’s annual base salary plus (ii) the executive’s target incentive payment for the fiscal year in which the change in control occurs and (b) 1.5. This payment would reduce any cash severance to which the executive would otherwise be entitled upon his termination of employment without cause or resignation for good reason on or within 24 months following a change in control (described below).
In addition, under their respective employment agreements, if Messrs. Tortorici or Holmes experience a qualifying termination of employment within 24 months following a change in control of the Company, the executive will be entitled to the following:
| • | the accrued obligations; |
208
Table of Contents
| • | the unpaid incentive payment; |
| • | a lump sum cash payment equal to the product of (a) the sum of (i) the executive’s annual base salary plus (ii) the executive’s target incentive payment for the fiscal year in which the termination occurs multiplied by (b) 3.0 (in the case of Mr. Tortorici) or 2.5 (in the case of Mr. Holmes); |
| • | the health and welfare benefits; and |
| • | the other benefits. |
The payments and benefits to which each of Messrs. Tortorici and Holmes are entitled on a qualifying termination within 24 months following a change in control (except for the accrued obligations, the unpaid incentive payment, and the other benefits) are subject to his execution, delivery, and non-revocation of a release of claims in favor of the Company and its affiliates and compliance with the restrictive covenants set forth in the employment agreement.
Upon a change in control, our named executive officers will also be entitled to a lump sum distribution of all balances credited to their respective accounts under the Deferred Compensation Plan, which provides that all amounts deferred under the plan will be distributed to participants upon the occurrence of a change in control, regardless of the payment election made by a participant to the contrary. PBRSUs granted under the 2015 Omnibus Plan will be treated upon a change in control in the manner described in “—Amended and Restated Cadence Bancorporation 2015 Omnibus Incentive Plan—Equity Awards Granted to Named Executive Officers.” In addition, as described above, unvested Class C unit awards granted under the 2010 Plan and unvested awards granted under the 2013 LTIP will all become fully vested upon a change in control of Cadence Bancorp, LLC. See “—Cadence Bancorp, LLC 2010 Class C Incentive Unit Award Plan” and “—Cadence Bank 2013 Long-Term Incentive Plan” for more information.
209
Table of Contents
In connection with our IPO, we adopted a directors’ compensation program that provides compensation to our non-employee directors. Under this program, each of our non-employee directors (other than Scott M. Stuart) receives an annual retainer of $100,000 and the Lead Director receives an additional annual retainer of $15,000, payable quarterly in arrears. Mr. Stuart, who is a member of our board of directors and the co-founder of Sageview Capital, a unitholder of Cadence Bancorp, LLC, our controlling stockholder, does not receive compensation for his service as a director. In addition, our advisory directors, Marc Shapiro and Stanley Levy, also do not receive compensation for their services as advisors.
We intend in future years to provide that at least 50% of the annual retainer payable to a non-employee director will be paid in the form of shares of our common stock, based on the fair market value of our common stock on the date the retainer is paid (though the director may elect to receive up to 100% of the annual retainer in the form of shares); however, all compensation paid to our non-employee directors in 2017 was in the form of cash.
Non-employee directors are restricted from transferring, hedging, pledging, or disposing of any shares of our common stock that they receive under the directors’ compensation program for one year following receipt of the shares.
| Name |
Fees Earned or Paid in Cash ($)(1) |
Total ($) |
||||||
| William B. Harrison, Jr.. |
57,500 | 57,500 | ||||||
| J. Richard Fredericks |
50,000 | 50,000 | ||||||
| Robert K. Steel |
50,000 | 50,000 | ||||||
| Scott M. Stuart.. |
— | — | ||||||
| (1) | Reflects prorated payment of annual retainer for fiscal year 2017. Prior to our IPO, none of our non-employee directors earned any compensation for their service on our board of directors. |
210
Table of Contents
Security Ownership of Beneficial Owners, Management and the Selling Stockholder
The following table sets forth the beneficial ownership of our common stock, both immediately prior to and immediately after the completion of this offering by:
| • | each of our directors, each of our executive officers, and all of our directors and executive officers as a group; |
| • | each person known by us to be the beneficial owner of 5% or more of our outstanding common stock; and |
| • | the selling stockholder. |
To our knowledge, each person named in the table has sole voting and investment power with respect to all of the securities shown as beneficially owned by such person, except as otherwise set forth in the notes to the table. The number of securities shown represents the number of securities the person “beneficially owns,” as determined by the rules of the SEC, subject to applicable community property laws. The SEC has defined “beneficial” ownership of a security to mean the possession, directly or indirectly, of voting power and/or investment power. A security holder is also deemed to be, as of any date, the beneficial owner of all securities that such security holder has the right within 60 days after that date to acquire the securities through (1) the exercise of any option, warrant or right, (2) the conversion of a security, (3) the power to revoke a trust, discretionary account or similar arrangement or (4) the automatic termination of a trust, discretionary account or similar arrangement. One or more of our directors may purchase shares in this offering and any such purchased shares are not reflected in the table below.
The percentages in the table below reflect beneficial ownership immediately prior to and immediately after the completion of this offering as determined in accordance with Rule 13d-3 under the Exchange Act and are based on 83,625,000 shares of our common stock outstanding as of the date of this registration statement and immediately after the completion of this offering (including 83,625,000 outstanding shares of Class A common stock and no outstanding shares of Class B non-voting common stock). Unless otherwise noted, the address for each stockholder listed on the table below is: c/o Cadence Bancorporation, 2800 Post Oak Boulevard, Suite 3800, Houston, Texas 77056.
| Beneficial Ownership Before this Offering |
Beneficial Ownership After this Offering(1) |
Beneficial Ownership After Exercise of Underwriters’ Option to Purchase Additional Shares(2) |
||||||||||||||||||||||||||||||||||||||||||||||
| Shares of Class A Common Stock Beneficially Owned |
Shares of Class B Common Stock Beneficially Owned |
Total Shares of Common Stock Beneficially Owned |
Shares of Class A Common Stock Beneficially Owned |
Shares of Class B Common Stock Beneficially Owned |
Total Shares of Common Stock Beneficially Owned |
Shares of Class A Common Stock Beneficially Owned |
Shares of Class B Common Stock Beneficially Owned |
Total Shares of Common Stock Beneficially Owned |
||||||||||||||||||||||||||||||||||||||||
| Number | Number | Number | % | Number | Number | Number | % | Number | Number | Number | % | |||||||||||||||||||||||||||||||||||||
| Name of Beneficial Owner |
||||||||||||||||||||||||||||||||||||||||||||||||
| Greater than 5% stockholders |
||||||||||||||||||||||||||||||||||||||||||||||||
| Cadence Bancorp, LLC(3) |
64,075,000 | — | 64,075,000 | 76.6 | % | 57,075,000 | — | 57,075,000 | 68.3 | % | 56,025,000 | — | 56,025,000 | 67.0 | % | |||||||||||||||||||||||||||||||||
| Directors and Executive Officers |
||||||||||||||||||||||||||||||||||||||||||||||||
| William B. Harrison, Jr.(4) |
40,000 | — | 40,000 | * | 40,000 | — | 40,000 | * | 40,000 | — | 40,000 | * | ||||||||||||||||||||||||||||||||||||
| J. Richard Fredericks(4) |
10,000 | — | 10,000 | * | 10,000 | — | 10,000 | * | 10,000 | — | 10,000 | * | ||||||||||||||||||||||||||||||||||||
| Robert K. Steel(4) |
— | — | — | — | — | — | — | — | — | — | — | — | ||||||||||||||||||||||||||||||||||||
| Scott M. Stuart(4) |
— | — | — | — | — | — | — | — | — | — | — | — | ||||||||||||||||||||||||||||||||||||
| Paul B. Murphy, Jr.(4) |
5,000 | — | 5,000 | * | 5,000 | — | 5,000 | * | 5,000 | — | 5,000 | * | ||||||||||||||||||||||||||||||||||||
| Samuel M. Tortorici(4) |
10,750 | — | 10,750 | * | 10,750 | — | 10,750 | * | 10,750 | — | 10,750 | * | ||||||||||||||||||||||||||||||||||||
| R.H. Holmes, IV(4) |
500 | — | 500 | * | 500 | — | 500 | * | 500 | — | 500 | * | ||||||||||||||||||||||||||||||||||||
| Valerie C. Toalson(4) |
1,033 | — | 1,033 | * | 1,033 | — | 1,033 | * | 1,033 | — | 1,033 | * | ||||||||||||||||||||||||||||||||||||
| Jerry W. Powell(4) |
4,000 | — | 4,000 | * | 4,000 | — | 4,000 | * | 4,000 | — | 4,000 | * | ||||||||||||||||||||||||||||||||||||
| J. Randall Schultz(4) |
— | — | — | — | — | — | — | — | — | — | — | — | ||||||||||||||||||||||||||||||||||||
| All directors and executive officers, as a group (10 persons) |
71,283 | — | 71,283 | * | 71,283 | — | 71,283 | * | 71,283 | — | 71,283 | * | ||||||||||||||||||||||||||||||||||||
211
Table of Contents
| * | Less than 1%. |
| (1) | Assumes that the underwriters will not exercise their overallotment option. |
| (2) | Assumes the sale of an additional 1,050,000 shares upon exercise of the underwriters’ overallotment option to purchase additional shares from the selling stockholder. |
| (3) | The principal address of Cadence Bancorp, LLC is 2800 Post Oak Boulevard, Suite 3800, Houston, Texas 77056. The board of directors of Cadence Bancorp, LLC has the sole voting and dispositive power with respect to the shares of our Class A common stock held by Cadence Bancorp, LLC. The board of directors of Cadence Bancorp, LLC currently has five members, each of whom serve on our board of directors: William B. Harrison, Jr., J. Richard Fredericks, Robert K. Steel, Scott M. Stuart and Paul B. Murphy, Jr. |
| (4) | Messrs. Harrison, Fredericks, Steel, Stuart, Murphy, Tortorici, Fredericks, Powell, Holmes and Schultz and Ms. Toalson are investors in Cadence Bancorp, LLC. See note (3) above. None of the foregoing persons has direct or indirect voting or dispositive power with respect to the shares of Cadence Bancorporation common stock held by Cadence Bancorp, LLC in his or her capacity as an investor in Cadence Bancorp, LLC. |
As of September 30, 2017, the following persons are beneficial owners of 5% or more of the outstanding membership units of Cadence Bancorp, LLC:
| Class A Units Beneficially Owned |
Class B Non- Voting Units Beneficially Owned |
Class C Units Beneficially Owned |
Total Units Beneficially Owned |
|||||||||||||||||
| Number | Number | Number | Number | %(a) | ||||||||||||||||
| Name of Beneficial Owner(b) |
||||||||||||||||||||
| Arbejdsmarkedets Tillaegspension (a Danish Pension Plan) |
46,161 | 153,839 | — | 200,000 | 16.2 | % | ||||||||||||||
| State Teachers Retirement System of Ohio |
46,161 | 152,839 | — | 199,000 | 16.1 | % | ||||||||||||||
| Sageview Capital GenPar, L.P.(c) |
— | 47,320 | 105,313 | 152,633 | 12.4 | % | ||||||||||||||
| The State of Oregon, by and through the Oregon Investment Council on behalf of the Oregon Public Employees Retirement Fund |
46,161 | 53,839 | — | 100,000 | 8.1 | % | ||||||||||||||
| Board of Regents of the University of Texas System |
46,161 | 33,839 | — | 80,000 | 6.5 | % | ||||||||||||||
| California Public Employees’ Retirement System |
46,161 | 33,247 | — | 79,408 | 6.4 | % | ||||||||||||||
| (a) | Percentages of total membership units outstanding are based on 1,234,880 total membership units outstanding as of September 30, 2017. Number of units shown is rounded to the nearest whole unit. |
| (b) | None of the foregoing persons has direct or indirect voting or dispositive power with respect to the shares of Cadence Bancorporation common stock held by Cadence Bancorp, LLC in its capacity as an investor in Cadence Bancorp, LLC. |
| (c) | Includes 105,313 Class C membership units, held by Sageview Capital GenPar, L.P.; 18,235 Class B non-voting membership units held by Sageview Capital Partners (A), L.P., over which Sageview Capital GenPar, L.P. exercises dispositive control; 13,627 Class B non-voting membership units held by Sageview Capital Partners (B), L.P., over which Sageview Capital GenPar, L.P. exercises dispositive control; and 15,458 Class B non-voting membership units held by Sageview Partners (C) Investments, L.P., over which Sageview Capital GenPar, L.P. exercises dispositive control. Scott M. Stuart, a director of Cadence Bancorp, LLC, is a managing partner of Sageview Capital and may be deemed to share beneficial ownership of membership units of Cadence Bancorp, LLC beneficially owned by Sageview Capital GenPar, L.P. Mr. Stuart expressly disclaims any such beneficial ownership. |
212
Table of Contents
As of September 30, 2017, Messrs. Murphy, Steel, Harrison, Stuart, Tortorici, Fredericks, Holmes, Powell and Schultz and Ms. Toalson, the directors and executive officers of the Company, are beneficial owners of membership units of Cadence Bancorp, LLC in the following amounts:
| Class A Units Beneficially Owned |
Class B Non- Voting Units Beneficially Owned |
Class C Units Beneficially Owned |
Total Units Beneficially Owned |
|||||||||||||||||
| Number | Number | Number | Number | %(a) | ||||||||||||||||
| Name of Beneficial Owner |
||||||||||||||||||||
| Paul B. Murphy, Jr.(b) |
250 | — | 30,883 | 31,133 | 2.5 | % | ||||||||||||||
| Robert K. Steel(b) |
5,000 | — | 20,025 | 25,025 | 2.0 | % | ||||||||||||||
| William B. Harrison, Jr.(b) |
3,000 | — | 20,025 | 23,025 | 2.0 | % | ||||||||||||||
| Samuel M. Tortorici |
100 | — | 5,350 | 5,450 | * | |||||||||||||||
| Scott M. Stuart(b)(c) |
100 | 5,000 | — | 5,100 | * | |||||||||||||||
| J. Richard Fredericks(b)(d) |
1,000 | — | 2,395 | 3,395 | * | |||||||||||||||
| R. H. “Hank” Holmes, IV |
— | — | 3,250 | 3,250 | * | |||||||||||||||
| Valerie C. Toalson |
50 | — | 1,500 | 1,550 | * | |||||||||||||||
| J. Randall Schultz |
— | — | 800 | 800 | * | |||||||||||||||
| Jerry W. Powell |
250 | — | 200 | 450 | * | |||||||||||||||
| * | Less than 1% |
| (a) | Percentages of total membership units outstanding are based on 1,234,880 total membership units outstanding as of September 30, 2017. Number of units shown is rounded to the nearest whole unit. |
| (b) | Messrs. Harrison, Fredericks, Steel, Stuart and Murphy, as directors of Cadence Bancorp, LLC, may be deemed to share beneficial ownership of shares of our common stock beneficially owned by Cadence Bancorp, LLC. Such individuals expressly disclaim any such beneficial ownership. |
| (c) | Includes 100 Class A membership units and 3,500 Class B non-voting membership units held by the Scott M. Stuart 2009 Revocable Trust, 1,125 Class B non-voting membership units held by The Stuart 1996 Family Trust and 375 Class B non-voting membership units held by The Stuart 2006 Family Trust. Does not include membership units of Cadence Bancorp, LLC beneficially owned by Sageview Capital GenPar, L.P. in which Mr. Stuart may be deemed to share beneficial ownership. Mr. Stuart expressly disclaims any such beneficial ownership. |
| (d) | Includes 1,000 Class A membership units and 1,544 Class C membership units held by the Fredericks Revocable Trust. |
213
Table of Contents
Description of Certain Indebtedness
The following is a summary of the material terms of certain indebtedness of us and our subsidiaries. The summary is qualified in its entirety by reference to the full text of the notes governing the terms of such indebtedness and the agreements pursuant to which the notes are issued.
Cadence Bancorporation
Senior Notes
On June 16, 2014, the Company issued an aggregate principal amount of $135,000,000 4.875% Senior Notes due 2019 (the “2019 senior notes”) and an aggregate principal amount of $50,000,000 5.375% Senior Notes due 2021 (the “2021 senior notes” and, together with the 2019 senior notes, the “senior notes”). On March 11, 2015, the Company issued additional 2019 senior notes in a principal amount of $10,000,000, which additional 2019 senior notes form a single issue with and have all of the same terms of the 2019 senior notes issued on June 16, 2014.
The 2019 senior notes and the 2021 senior notes each constitute a separate series of senior debt securities of the Company. The 2019 senior notes will mature on June 28, 2019 and the 2021 senior notes will mature on June 28, 2021 (in each case, unless previously redeemed). The senior notes are issued under an Issuing and Paying Agency Agreement, dated June 16, 2014 (the “Company IPAA”) between the Company, as issuer, and U.S. Bank National Association, as Issuing and Paying Agent.
Interest. The 2019 senior notes bear interest at the rate of 4.875% per year and are payable semi-annually in arrears through the maturity date or any early redemption date. The 2021 senior notes bear interest at the rate of 5.375% per year and are payable semi-annually in arrears through the maturity date or any early redemption date.
Optional Redemption. At any time any series of senior notes remains outstanding, the Company may, at its option, upon not fewer than 30 nor greater than 60 days’ notice to holders (which notice may be conditional), redeem some or all of the senior notes of such series at a redemption price equal to par plus a make-whole premium.
Covenants. The Company may not consolidate with or merge into any other person or entity, or convey or transfer its properties and assets substantially as an entirety to any person or entity, unless certain conditions specified in the senior notes are satisfied. In addition, subject to certain exceptions, so long as any of the senior notes are outstanding, the Company shall not, directly or indirectly, sell, assign or grant a security interest in or otherwise dispose of any shares of the voting stock of the Bank, or any securities convertible into or options, warrants or rights to subscribe for or purchase shares of voting stock of the Bank, nor will the Company permit the Bank to issue any shares of, or securities convertible into, or options, warrants or rights to subscribe for or purchase shares of, voting stock of the Bank.
Events of Default. An event of default under any series of senior notes will occur, and the payment of principal of the senior notes of such series may be accelerated, upon the occurrence and continuation of the following events:
| • | default in the payment of interest on the senior notes of such series and continuance of that default for 30 days; |
| • | default in the payment of the principal of, or premium, if any, on, the senior notes of such series when due and payable, whether at their stated maturity or by acceleration, call for redemption or otherwise; |
| • | failure by the Company for 90 days after notice by the holders to perform any of the other covenants or agreements in the senior notes of such series and the Company IPAA; |
| • | an event of default, as defined in any bond, note, debenture or other evidence of indebtedness for borrowed money of the Company or under any mortgage, indenture, trust agreement or other |
214
Table of Contents
| instrument securing, evidencing or providing for any indebtedness for borrowed money of the Company as a result of which indebtedness for borrowed money of the Company in excess of $25 million in aggregate principal amount shall be or become accelerated so as to be due and payable prior to the date on which the same would otherwise become due and payable and such acceleration shall not have been annulled or rescinded within 30 days of the notice of such acceleration to the Company; or |
| • | specified events in bankruptcy, insolvency or reorganization of the Company. |
In each such case, unless the principal of the senior notes of such series already shall have become due and payable, the holders of 100% of the aggregate principal amount of the senior notes of such series, by notice in writing to the Company, may declare the principal amount of the senior notes of such series to be due and payable immediately, and upon any such declaration the same shall become and shall be immediately due and payable.
Subordinated Notes due 2029
On June 16, 2014, the Company issued an aggregate principal amount of $35,000,000 Fixed-to-Floating Rate Subordinated Notes due 2029 (the “2029 subordinated notes”). The 2029 subordinated notes will mature on June 28, 2029 (unless previously redeemed). The Company’s obligation to make payments of principal and interest on the 2029 subordinated notes is subordinate and junior in right of payment to all of the Company’s senior indebtedness, including general creditors and certain other types of indebtedness specified in the terms of the 2029 subordinated notes. The 2029 subordinated notes are issued under the Company IPAA.
Interest. From and including June 16, 2014 to but excluding June 28, 2024 or any early redemption date, the 2029 subordinated notes will bear interest at the rate of 7.250% per year and will be payable semi-annually in arrears. From and including June 28, 2024, the 2029 subordinated notes will bear an interest rate per annum equal to the three-month LIBOR rate plus 4.535% and will be payable quarterly in arrears through the maturity date or any early redemption date.
Optional Redemption. The Company may, at its option, beginning with the interest payment date of June 28, 2024 and on any interest payment date thereafter (or at any time on or after the 30th day prior to the maturity date thereof) redeem the 2029 subordinated notes, in whole or in part, upon not fewer than 30 nor greater than 60 days’ notice to the holders of the 2029 subordinated notes (which notice may be conditional) at a redemption price specified in the 2029 subordinated notes. This option of redemption is subject to the approval of the Federal Reserve. The Federal Reserve generally will not approve such a redemption of any such subordinated notes unless it is satisfied with the capital position of the Company and the Bank after the proposed redemption. Additionally, the Company may, at its option, redeem some or all of the 2029 subordinated notes at any time if it makes a reasonable determination that it is reasonably likely that the 2029 subordinated notes will not be entitled to treatment as “Tier 2” capital (or the then equivalent thereof) for purposes of the capital adequacy guidelines of the Federal Reserve, subject to certain requirements and at a redemption price specified in the terms of the 2029 subordinated notes.
Covenants. The Company may not consolidate with or merge into any other person or entity, or convey or transfer its properties and assets substantially as an entirety to any person or entity, unless certain conditions specified in the 2029 subordinated notes are satisfied.
Events of Default. An event of default under the 2029 subordinated notes will occur, and the payment of principal of the subordinated notes may be accelerated, only upon the occurrence and continuation of certain events of insolvency of the Company that are specified in the 2029 subordinated notes (a “2029 Subordinated Note Event of Default”). In the case of a 2029 Subordinated Note Event of Default, unless the principal of the 2029 subordinated notes already shall have become due and payable, the holders of 100% of the outstanding principal amount of the 2029 subordinated notes may declare the principal amount of the 2029 subordinated notes to be due and payable immediately.
215
Table of Contents
Subordinated Notes due 2025
On March 11, 2015, the Company issued an aggregate principal amount of $40,000,000 Fixed-to-Floating Rate Subordinated Notes due 2025 (the “2025 subordinated notes”). The 2025 subordinated notes will mature on March 11, 2025 (unless previously redeemed). The Company’s obligation to make payments of principal and interest on the 2025 subordinated notes is subordinate and junior in right of payment to all of the Company’s senior indebtedness, including general creditors and certain other types of indebtedness specified in the terms of the 2025 subordinated notes. The 2025 subordinated notes are issued under an Issuing and Paying Agency Agreement, dated March 11, 2015, between the Company, as issuer, and U.S. Bank National Association, as Issuing and Paying Agent.
Interest. From and including March 11, 2015 to but excluding March 11, 2020 or any early redemption date, the 2025 subordinated notes will bear interest at the rate of 6.500% per year and will be payable semi-annually in arrears. From and including March 11, 2020, the 2025 subordinated notes will bear an interest rate per annum equal to the three-month LIBOR rate plus 4.663% and will be payable quarterly in arrears through the maturity date or any early redemption date.
Optional Redemption. The Company may, at its option, beginning with the interest payment date of March 11, 2020 and on any interest payment date thereafter (or at any time on or after the 30th day prior to the maturity date thereof) redeem the 2025 subordinated notes, in whole or in part, upon not fewer than 30 nor greater than 60 days’ notice to the holders of the 2025 subordinated notes (which notice may be conditional) at a redemption price specified in the 2025 subordinated notes. This option of redemption is subject to the approval of the Federal Reserve. The Federal Reserve generally will not approve such a redemption of any such subordinated notes unless it is satisfied with the capital position of the Company and the Bank after the proposed redemption. Additionally, the Company may, at its option, redeem some or all of the 2025 subordinated notes at any time if it makes a reasonable determination that it is reasonably likely that the 2025 subordinated notes will not be entitled to treatment as “Tier 2” capital (or the then equivalent thereof) for purposes of the capital adequacy guidelines of the Federal Reserve, subject to certain requirements and at a redemption price specified in the terms of the 2029 subordinated notes.
Covenants. The Company may not consolidate with or merge into any other person or entity, or convey or transfer its properties and assets substantially as an entirety to any person or entity, unless certain conditions specified in the 2025 subordinated notes are satisfied.
Events of Default. An event of default under the 2025 subordinated notes will occur, and the payment of principal of the subordinated notes may be accelerated, only upon the occurrence and continuation of certain events of insolvency of the Company that are specified in the 2025 subordinated notes (a “2025 Subordinated Note Event of Default”). In the case of a 2025 Subordinated Note Event of Default, unless the principal of the 2025 subordinated notes already shall have become due and payable, the holders of 100% of the outstanding principal amount of the 2025 subordinated notes may declare the principal amount of the 2025 subordinated notes to be due and payable immediately.
Cadence Bank, National Association
Subordinated Notes
On June 16, 2014, the Bank issued an aggregate principal amount of $25,000,000 Fixed-to-Floating Rate Subordinated Notes due 2029 (the “Bank subordinated notes”). The Bank subordinated notes will mature on June 28, 2029 (unless previously redeemed). The Bank’s obligation to make payments of principal and interest on the Bank subordinated notes is subordinate and junior in right of payment to all of the Bank senior indebtedness, including general creditors and certain other types of indebtedness specified in the terms of the Bank subordinated notes. The Bank subordinated notes are issued under an Issuing and Paying Agency Agreement, dated June 16, 2014 (the “Bank IPAA”) between the Bank, as issuer, and U.S. Bank National Association, as Issuing and Paying Agent.
216
Table of Contents
Interest. From and including June 16, 2014 to but excluding June 28, 2024 or any early redemption date, the Bank subordinated notes will bear interest at the rate of 6.250% per year and will be payable semi-annually in arrears. From and including June 28, 2024, the Bank subordinated notes will bear an interest rate per annum equal to the three-month LIBOR rate plus 3.535% and will be payable quarterly in arrears through the maturity date or any early redemption date.
Optional Redemption. The Bank may, at its option, beginning with the interest payment date of June 28, 2024 and on any interest payment date thereafter (or at any time on or after the 30th day prior to the maturity date thereof) redeem the Bank subordinated notes, in whole or in part, upon not fewer than 30 nor greater than 60 days’ notice to the holders of the Bank subordinated notes (which notice may be conditional) at a redemption price specified in the Bank subordinated notes. This option of redemption is subject to the approval of the Federal Reserve and the OCC. The Federal Reserve generally will not approve such a redemption of any such subordinated notes unless it is satisfied with the capital position of the Company and the Bank after the proposed redemption. Additionally, the Bank may, at its option, redeem some or all of the Bank subordinated notes at any time if it makes a reasonable determination that it is reasonably likely that the Bank subordinated notes will not be entitled to treatment as “Tier 2” capital (or the then equivalent thereof) for purposes of the capital adequacy guidelines of the Federal Reserve, subject to certain requirements and at a redemption price specified in the terms of the Bank subordinated notes.
Covenants. The Bank may not consolidate with or merge into any other person or entity, or convey or transfer its properties and assets substantially as an entirety to any person or entity, unless certain conditions specified in the Bank subordinated notes are satisfied.
Events of Default. An event of default under the Bank subordinated notes will occur, and the payment of principal of the subordinated notes may be accelerated, only upon the occurrence and continuation of certain events of insolvency of the Bank that are specified in the Bank subordinated notes (a “Bank Subordinated Note Event of Default”). In the case of a Bank Subordinated Note Event of Default, unless the principal of the Bank subordinated notes already shall have become due and payable, the holders of 100% of the outstanding principal amount of the Bank subordinated notes may declare the principal amount of such series of subordinated notes to be due and payable immediately.
The following is a summary of our capital stock and certain terms of our certificate of incorporation (our “charter”) and bylaws. This discussion summarizes some of the important rights of our stockholders but does not purport to be a complete description of these rights and may not contain all of the information regarding our capital stock that is important to you. These rights can only be determined in full, and the descriptions herein are qualified in their entirety, by reference to federal and state banking laws and regulations, the DGCL, and our charter and bylaws, copies of which are filed with the SEC as exhibits to the registration statement of which this prospectus is a part, and applicable law.
General
Our charter authorizes us to issue up to 300,000,000 shares of Class A common stock, $0.01 par value per share, 300,000,000 shares of Class B non-voting common stock, $0.01 par value per share and 50,000,000 shares of preferred stock, $0.01 par value per share. As of the date of this registration statement, we have 83,625,000 shares of Class A common stock and no shares of Class B non-voting common stock or preferred stock outstanding.
The following description summarizes the material terms of our securities. Because it is only a summary, it may not contain all the information that is important to you.
217
Table of Contents
Capital Stock
Class A Common Stock and Class B Non-Voting Common Stock
All issued and outstanding shares of our common stock are duly authorized, validly issued, fully paid and non-assessable. All authorized but unissued shares of our common stock are available for issuance by our board of directors without any further stockholder action. Our charter provides that, except with respect to voting rights and conversion rights, the Class A common stock and Class B non-voting common stock are treated equally and identically.
Voting Rights. Except as otherwise required by law or as otherwise provided in any certificate of designation for any series of preferred stock, the holders of Class A common stock possess all voting power for the election of our directors and all other matters requiring stockholder action, except with respect to amendments to our charter that alter or change the powers, preferences, rights or other terms of any outstanding preferred stock if the holders of such affected series of preferred stock are entitled to vote on such an amendment. Holders of Class A common stock are entitled to one vote per share on matters to be voted on by stockholders. Holders of Class B non-voting common stock have no voting power, and have no right to participate in any meeting of stockholders or to have notice thereof, except as required by applicable law and except that any action that would significantly and adversely affect the rights of the Class B non-voting common stock with respect to the modification of the terms of the securities or dissolution will require the approval of the Class B non-voting common stock voting separately as a class.
Except as otherwise provided by law, our charter or our bylaws or in respect of the election of directors, all matters to be voted on by our stockholders are required to be approved by a majority of the shares present in person or by proxy at the meeting and entitled to vote on the subject matter. In the case of an election of directors, where a quorum is present a plurality of the votes cast are sufficient to elect each director.
Conversion of Class B Non-Voting Common Stock. Each share of Class B non-voting common stock will be convertible into a share of Class A common stock at the option of the holder; provided, however, that each share of Class B non-voting common stock will not be convertible in the hands of the initial holder and will only be convertible at the time it is transferred to a third party unaffiliated with such initial holder, subject to the transfer restrictions described in the next sentence, if and only to the extent such conversion would not, after giving effect to such conversion, cause the transferee (together with such transferee’s related persons and any persons with which such transferee is acting in concert) to own, control or have the power to vote shares of Class A common stock in excess of the ownership limit described below. Shares of Class B non-voting common stock may only be transferred through one or more of the following alternatives: (1) to an affiliate of a holder or to the Company, (2) in a widely dispersed public offering, (3) in a private sale in which no purchaser would acquire Class A common stock and/or Class B non-voting common stock in an amount that, after the conversion of such Class B non-voting common stock into Class A common stock, is (or represents) 2% or more of a class of our voting securities or (4) to a purchaser acquiring majority control of the Company notwithstanding such transfer.
Conversion of Class A Common Stock Upon LLC Distribution. Each share of Class A common stock owned by Cadence Bancorp, LLC will automatically convert into a share of Class B non-voting common stock upon a distribution or other transfer to a member of Cadence Bancorp, LLC, or upon the liquidation of Cadence Bancorp, LLC, to the extent that such distribution, transfer or liquidation would otherwise result in such member of Cadence Bancorp, LLC, together with its affiliates, owning in excess of 9.9% of our Class A common stock (or any class of our voting securities), excluding for purposes of this calculation any reduction in ownership resulting from transfers by such holder of our voting securities. In addition, Cadence Bancorp, LLC will have the right to cause shares of Class A common stock owned by it to convert into shares of Class B non-voting common stock to the extent that a distribution or other transfer to a member of Cadence Bancorp, LLC, or a liquidation of Cadence Bancorp, LLC, would otherwise result in shares of Class A common stock being received in respect of non-voting units of Cadence Bancorp, LLC.
218
Table of Contents
Dividend Rights. Holders of Class A common stock and Class B non-voting common stock are equally entitled to ratably receive dividends if, as and when declared from time to time by our board of directors at its own discretion out of funds legally available for that purpose, after payment of dividends required to be paid on outstanding preferred stock, if any. Under Delaware law, we can only pay dividends either out of “surplus” or out of the current or the immediately preceding year’s net profits. Surplus is defined as the excess, if any, at any given time, of the total assets of a corporation over its total liabilities and statutory capital. The value of a corporation’s net assets can be measured in a number of ways and may not necessarily equal their book value.
Liquidation Rights. Upon liquidation, dissolution or winding up, the holders of Class A common stock and Class B non-voting common stock will be equally entitled to receive ratably the assets available for distribution to the stockholders after payment of all liabilities and accrued but unpaid dividends and liquidation preferences on any outstanding preferred stock.
Other. Neither the Class A common stock nor the Class B non-voting common stock have any preemptive or conversion rights pursuant to the terms of our charter and bylaws (other than the right of holders of shares of Class B non-voting common stock to convert such shares into shares of Class A common stock and the right of Cadence Bancorp, LLC to convert shares of Class A common stock into shares of Class B non-voting common stock as described in “—Conversion of Class B Non-Voting Common Stock” and “—Conversion of Class A Common Stock Upon LLC Distribution,” respectively, above). There are no redemption or sinking fund provisions applicable to the common stock. All outstanding shares of our common stock are fully paid and non-assessable.
Preferred Stock
Pursuant to our charter, shares of preferred stock are issuable from time to time, in one or more series, with the designations of the series, the voting rights of the shares of the series (if any), the powers, preferences and relative, participation, optional or other special rights (if any), and any qualifications, limitations or restrictions thereof as our board of directors from time to time may adopt by resolution (and without further stockholder approval), subject to certain limitations. Each series will consist of that number of shares as will be stated and expressed in the certificate of designations providing for the issuance of the stock of the series.
Anti-Takeover Effects of Certain Provisions of Delaware Law, Our Charter and Bylaws
Certain provisions of Delaware law and certain provisions that are included in our charter and bylaws summarized below may be deemed to have an anti-takeover effect and may delay, deter or prevent a tender offer or takeover attempt that a stockholder might consider to be in its best interests, including attempts that might result in a premium being paid over the market price for the shares held by stockholders.
Preferred Stock
Our charter contains provisions that permit our board of directors to issue, without any further vote or action by the stockholders, shares of preferred stock in one or more series and, with respect to each such series, to fix the number of shares constituting the series and the designation of the series, the voting rights (if any) of the shares of the series, and the powers, preferences and relative, participation, optional and other special rights, if any, and any qualifications, limitations or restrictions, of the shares of such series.
Classified Board
Our charter provides that our board of directors is divided into three classes, designated Class I, Class II and Class III and that each class will be an equal number of directors, as nearly as possible, consisting of one-third of the total number of directors constituting the entire board of directors. The term of initial Class I directors shall terminate on the date of the 2018 Annual Meeting, the term of the initial Class II directors shall terminate on the
219
Table of Contents
date of the 2019 Annual Meeting, and the term of the initial Class III directors shall terminate on the date of the 2020 Annual Meeting. At each succeeding Annual Meeting of Stockholders beginning in 2018, successors to the class of directors whose term expires at that Annual Meeting will be elected for a three year term.
Removal of Directors
Our charter provides that stockholders may only remove a director for cause by a vote of no less than a majority of the shares present in person or by proxy at the meeting and entitled to vote.
Director Vacancies
Vacancies on our board of directors may be filled by a majority of the remaining directors until the next annual meeting of stockholders, or at a special meeting of stockholders called for that purpose.
No Cumulative Voting
Our charter provides that stockholders do not have the right to cumulative votes in the election of directors.
Special Meetings of Stockholders
Our charter and bylaws provide that, except as otherwise required by law, special meetings of the stockholders may be called only by any officer at the request of a majority of our board of directors, by the chairman of the board of directors or by our Chief Executive Officer.
Advance Notice Procedures for Director Nominations
Our bylaws provide that stockholders seeking to nominate candidates for election as directors at an annual or special meeting of stockholders must provide timely notice thereof in writing. To be timely, a stockholder’s notice generally must be delivered to and received at our principal executive offices before notice of the meeting is issued by the secretary of the Company, with such notice being served not less than 90 nor more than 120 days before the meeting. Although the bylaws do not give the board of directors the power to approve or disapprove stockholder nominations of candidates to be elected at an annual meeting, the bylaws may have the effect of precluding the conduct of certain business at a meeting if the proper procedures are not followed or may discourage or deter a potential acquirer from conducting a solicitation of proxies to elect its own slate of directors or otherwise attempting to obtain control of the Company.
Action by Written Consent
Our charter and bylaws provide that any action to be taken by the stockholders must be effected at a duly called annual or special meeting of stockholders and may not be effected by written consent if less than a majority of our outstanding Class A common stock is owned by Cadence Bancorp, LLC. As long as Cadence Bancorp, LLC owns a majority of Class A common stock, action may be taken by written consent if applicable voting requirements are otherwise satisfied.
Amending our Charter and Bylaws
Our charter may be amended or altered in any manner provided by the DGCL. Our bylaws may be adopted, amended, altered or repealed by stockholders only upon approval of at least two-thirds of the voting power of all the then outstanding shares of the Class A common stock. Additionally, our charter provides that our bylaws may be amended, altered or repealed by the board of directors by a majority vote.
220
Table of Contents
Authorized but Unissued Shares
Our authorized but unissued shares of Class A common stock, Class B non-voting common stock and preferred stock are available for future issuances without stockholder approval and could be utilized for a variety of corporate purposes, including future offerings to raise additional capital, acquisitions and employee benefit plans. The existence of authorized but unissued and unreserved common stock and preferred stock could render more difficult or discourage an attempt to obtain control of us by means of a proxy contest, tender offer, merger or otherwise.
Exclusive Jurisdiction
Our charter provides that the Delaware Court of Chancery shall be the exclusive forum for any derivative action or proceeding brought on our behalf, any action asserting a claim of breach of fiduciary duty and any action asserting a claim pursuant to the DGCL, our charter, our bylaws or under the internal affairs doctrine.
Business Combinations with Interested Stockholders
We do not elect in our charter not to be subject to Section 203 of the DGCL. Subject to certain exceptions, Section 203 of the DGCL prohibits a public Delaware corporation from engaging in a business combination (as defined in such section) with an “interested stockholder” (defined generally as any person who beneficially owns 15% or more of the outstanding voting stock of such corporation or any person affiliated with such person) for a period of three years following the time that such stockholder became an interested stockholder, unless (i) prior to such time the board of directors of such corporation approved either the business combination or the transaction that resulted in the stockholder becoming an interested stockholder; (ii) upon consummation of the transaction that resulted in the stockholder becoming an interested stockholder, the interested stockholder owned at least 85% of the voting stock of such corporation at the time the transaction commenced (excluding for purposes of determining the voting stock of such corporation outstanding (but not the outstanding voting stock owned by the interested stockholder) those shares owned (A) by persons who are directors and also officers of such corporation and (B) by employee stock plans in which employee participants do not have the right to determine confidentially whether shares held subject to the plan will be tendered in a tender or exchange offer); or (iii) on or subsequent to such time the business combination is approved by the board of directors of such corporation and authorized at a meeting of stockholders (and not by written consent) by the affirmative vote of at least 66 2/3% of the outstanding voting stock of such corporation not owned by the interested stockholder.
Controlling Stockholder
Immediately following the completion of this offering, Cadence Bancorp, LLC will own approximately 57,075,000 shares, or 68.3%, of our outstanding Class A common stock (or 67.0%, if the underwriters exercise in full their option to purchase additional shares). As a result, Cadence Bancorp, LLC will own shares sufficient for the majority vote over all matters requiring a stockholder vote, including: the election of directors; mergers, consolidations and acquisitions; the sale of all or substantially all of our assets and other decisions affecting our capital structure; the amendment of our charter and our bylaws; and our winding up and dissolution.
Limitation on Liability and Indemnification of Directors and Officers
The DGCL authorizes corporations to limit or eliminate the personal liability of directors to corporations and their stockholders for monetary damages for breaches of directors’ fiduciary duties. Our charter includes a provision that eliminates the personal liability of directors for monetary damages for breach of fiduciary duty as a director, except:
| • | for breach of duty of loyalty; |
| • | for acts or omissions not in good faith or involving intentional misconduct or knowing violation of law; |
221
Table of Contents
| • | under Section 174 of the DGCL (unlawful dividends or unlawful stock repurchases or redemptions); or |
| • | for transactions from which the director derived an improper personal benefit. |
Our charter and bylaws provide that we must indemnify our directors and officers to the fullest extent authorized by the DGCL. We are expressly authorized to, and do, carry directors’ and officers’ insurance providing coverage for our directors, officers and certain employees for some liabilities. We believe that these indemnification provisions and insurance are useful to attract and retain qualified directors and executive directors.
The limitation on liability and indemnification provisions in our charter and bylaws may discourage stockholders from bringing a lawsuit against directors for breach of their fiduciary duty. These provisions may also have the effect of reducing the likelihood of derivative litigation against directors and officers, even though such an action, if successful, might otherwise benefit us and our stockholders. In addition, your investment may be adversely affected to the extent we pay the costs of settlement and damage awards against directors and officers pursuant to these indemnification provisions.
Registration Rights
For a description of the registration rights agreement that we entered into with Cadence Bancorp, LLC in connection with our IPO, see “Certain Relationships and Related Party Transactions—Registration Rights Agreement.”
Listing and Trading
Our Class A common stock is listed on the NYSE under the symbol “CADE.”
Transfer Agent and Registrar
The transfer agent and registrar for our common stock is Continental Stock Transfer & Trust Company.
222
Table of Contents
Shares Eligible for Future Sale
Future sales of substantial amounts of our Class A common stock in the public market could adversely affect prevailing market prices. Furthermore, since only a limited number of shares will be available for sale shortly after the offering because of contractual and legal restrictions on resale described below, sales of substantial amounts of shares of common stock in the public market after the restrictions lapse could adversely affect the prevailing market price for shares of our common stock as well as our ability to raise equity capital in the future.
As of the date of this registration statement, we have 83,625,000 shares of Class A common stock issued and outstanding. In addition, 672,750 shares of our Class A common stock will be issuable upon the vesting and settlement of outstanding equity awards.
Of these 83,625,000 shares, the shares sold in our IPO and the shares sold in this offering will be freely tradable without further restriction or registration under the Securities Act, except that any shares purchased by our affiliates may generally only be sold in compliance with Rule 144, which is described below. The remaining outstanding shares will be deemed “restricted securities” under the Securities Act. Restricted securities may be sold in the public market only if they qualify for an exemption from registration under Rule 144 or any other applicable exemption.
Lock-Up Agreements
We, our executive officers and directors and the selling stockholder expect to enter into lock-up agreements with the underwriters in connection with this offering. Under these agreements, we and each of these persons may not, without the prior written approval of the representatives and except (i) pursuant to employee stock option plans described in this prospectus and (ii) in connection with business combinations provided that the aggregate number of shares issued in any such business combination or combinations during such 90-day period does not exceed 10% of the outstanding shares of our common stock as of the closing of this offering, though we are permitted to enter into any agreement to issue a number of shares of our common stock in excess of such threshold during such 90-day period,
| • | offer, pledge, sell, contract to sell, sell any option or contract to purchase, purchase any option or contract to sell, grant any option, right or warrant for the sale of, or otherwise dispose of or transfer any shares of our common stock or any securities convertible into or exchangeable or exercisable for our common stock, whether now owned or hereafter acquired or with respect to which such person has or hereafter acquires the power of disposition, or file any registration statement under the Securities Act with respect to any of the foregoing; or |
| • | enter into any swap, hedge or any other agreement or any transaction that transfers, in whole or in part, directly or indirectly, the economic consequence of ownership of the shares of our common stock, whether any such swap, hedge or transaction is to be settled by delivery of shares of our common stock or other securities, in cash or otherwise. |
These restrictions will be in effect for a period of 90 days after the date of the underwriting agreement. At any time and without public notice, the representatives may, in their sole discretion, release all or some of the securities from these lock-up agreements.
These restrictions also apply to securities convertible into or exchangeable or exercisable for or repayable with common stock to the same extent as they apply to our common stock. They also apply to common stock owned now or acquired later by the person executing the agreement or for which the person executing the agreement later acquires the power of disposition.
In addition, we, our executive officers and directors and the selling stockholder entered into lock-up agreements with the underwriters in our November 2017 offering on terms substantially similar to those
223
Table of Contents
described above. The lock-up agreements entered into in connection with our November 2017 offering expire on February 6, 2018. The representatives of the underwriters in our November 2017 offering have released the securities to be sold in this offering from the lock-up agreements with respect to the sale by the selling stockholder of the shares to be sold in this offering and may do so in connection with future offerings prior to the expiration of those lock-up agreements at any time and without public notice.
Amended and Restated Cadence Bancorporation 2015 Omnibus Incentive Plan
We have filed with the SEC a registration statement on Form S-8 covering the shares of common stock reserved for issuance under the Amended and Restated Cadence Bancorporation 2015 Omnibus Incentive Plan. The shares of common stock covered by that registration statement are eligible for sale in the public market, subject to the lock-up agreements described above.
Rule 144
All shares of our common stock held by our “affiliates,” as that term is defined in Rule 144 under the Securities Act, generally may be sold in the public market only in compliance with Rule 144. Rule 144 defines an affiliate as any person who directly or indirectly controls, or is controlled by, or is under common control with, the issuer, which generally includes our directors, executive officers, 10% stockholders and certain other related persons. Upon completion of the offering, we expect that all of the shares retained by the selling stockholder will be held by “affiliates.”
Under Rule 144 under the Securities Act, a person (or persons whose shares are aggregated) who is deemed to be an “affiliate” of ours would be entitled to sell within any three-month period a number of shares that does not exceed the greater of (i) 1% of the then outstanding shares of our common stock, which would be approximately 8,362,500 common shares as of the date of this registration statement, or (ii) an amount equal to the average weekly trading volume of our common stock on the NYSE during the four calendar weeks preceding such sale. Sales under Rule 144 are also subject to a six month holding period and requirements relating to manner of sale, notice and the availability of current public information about us.
Rule 144 also provides that a person who is not deemed to have been an affiliate of ours at any time during the three months preceding a sale, and who has for at least six months beneficially owned shares of our common stock that are restricted securities, will be entitled to freely sell such shares of our common stock without regard to the limitations described above, provided that such sales comply with the current public information requirements of Rule 144 and we were subject to the Exchange Act periodic reporting requirements for at least 90 days immediately before the sale. A person who is not deemed to have been an affiliate of ours at any time during the three months preceding a sale, and who has beneficially owned for at least one year shares of our common stock that are restricted securities, will be entitled to freely sell such shares of our common stock under Rule 144 without regard to the current public information requirements of Rule 144, provided that we were subject to the Exchange Act periodic reporting requirements for at least 90 days immediately before the sale.
Rule 701
In general, under Rule 701 under the Securities Act, an employee, consultant or advisor who purchased shares of our common stock from us in connection with a compensatory stock or option plan or other written agreement prior to our IPO, and who is not deemed to have been our “affiliate” during the immediately preceding 90 days, is eligible to resell those shares in reliance on Rule 144, but without compliance with some of the restrictions, including the holding period restriction, contained in Rule 144. The shares that may be sold in compliance with Rule 701 that are subject to lock-up agreements as described above will not become eligible for sale until expiration or waiver of the restrictions set forth in those agreements.
224
Table of Contents
Registration Rights
Cadence Bancorp, LLC and its permitted transferees (including any of its unitholders who are distributed or otherwise transferred shares of our Class A common stock) have the right, subject to certain conditions, to require us to register its shares of our Class A common stock under the Securities Act for sale into the public markets or other transfer at any time following the expiration of the lock-up periods described above. Cadence Bancorp, LLC and such permitted transferees will also be entitled to piggyback registration rights with respect to any future registration statement that we file for an underwritten public offering of our securities. Upon the effectiveness of such a registration statement, all shares covered by the registration statement will be freely transferable. If these rights are exercised and Cadence Bancorp, LLC sells or otherwise transfers a large number of shares of common stock, the market price of our Class A common stock could decline. In addition, if Cadence Bancorp, LLC distributes or otherwise transfers shares of our common stock to holders of its membership units, those unitholders would benefit from the registration rights under the Registration Rights Agreement. The shares of our Class A common stock held by those unitholders of Cadence Bancorp, LLC would then be able to be resold into the public markets in connection with the exercise of those registration rights or in accordance with the requirements of Rule 144 under the Securities Act, in each case after the expiration of the lockup periods described above. See “Certain Relationships and Related Party Transactions—Registration Rights Agreement” for a more detailed description of these registration rights.
Certain Relationships and Related Party Transactions
In addition to the compensation arrangements with directors and executive officers described in “Executive Compensation” above, the following is a description of each transaction since January 1, 2017, and each proposed transaction in which:
| • | we have been or are to be a participant; |
| • | the amount involved exceeds or will exceed $120,000; and |
| • | any of our directors (including nominees for election as director), executive officers or beneficial holders of more than 5% of our capital stock, or any immediate family member of or person sharing the household with any of these individuals (other than tenants or employees), had or will have a direct or indirect material interest. |
Registration Rights Agreement
In connection with our IPO, we entered into a registration rights agreement with the selling stockholder, pursuant to which we granted Cadence Bancorp, LLC and its permitted transferees (including any of its unitholders who are distributed or otherwise transferred shares of our Class A common stock) registration rights with respect to all of the shares of our Class A common stock. These rights include demand registration rights, shelf registration rights and “piggyback” registration rights, as well as customary indemnification. All fees, costs and expenses related to any registration under the agreement will be borne by us, other than stock transfer taxes and underwriting discounts or commissions. If Cadence Bancorp, LLC distributes or otherwise transfers shares of our common stock to holders of its membership units, certain of those unitholders would benefit from the registration rights under the Registration Rights Agreement. The shares of our Class A common stock held by those unitholders of Cadence Bancorp, LLC would then be able to be resold into the public markets in connection with the exercise of those registration rights or in accordance with the requirements of Rule 144 under the Securities Act, in each case after the expiration of the lockup periods described in “Shares Eligible for Future Sale—Lock-Up Agreements.” In addition, if requested by Cadence Bancorp, LLC, subject to the requirements of any lock-up period then in effect (or waiver thereof), we may file a registration statement to permit Cadence Bancorp, LLC to offer to exchange shares of our common stock that it owns for some or all of the membership units of Cadence Bancorp, LLC held by certain of our current and/or former employees.
Demand Registration Rights. The registration rights agreement grants Cadence Bancorp, LLC and such permitted transferees demand registration rights. We are required, upon the written request of Cadence Bancorp,
225
Table of Contents
LLC or such a permitted transferee, to use our commercially reasonable efforts to effect registration of shares requested to be registered as soon as practicable after receipt of the request, subject to certain exceptions.
Shelf Registration Rights. The registration rights agreement grants Cadence Bancorp, LLC and such permitted transferees shelf registration rights. Under the terms of the registration rights agreement, Cadence Bancorp, LLC or such a permitted transferee may demand that we file a shelf registration statement with respect to those shares requested to be registered. Upon such demand, we are required to use our commercially reasonable efforts to effect such registration.
“Piggyback” Registration Rights. The registration rights agreement grants Cadence Bancorp, LLC and such permitted transferees “piggyback” registration rights. If we register any of our securities either for our own account or for the account of other security holders, the holders of these shares are entitled to include their shares in the registration.
Ordinary Banking Relationships
Certain of our officers and directors, as well as their immediate family members and affiliates, are customers of, or have had transactions with, Cadence Bank or the Company in the ordinary course of business. These transactions include deposits, loans, wealth-management products and other financial services related transactions. Related party transactions are made in the ordinary course of business, on substantially the same terms, including interest rates and collateral (where applicable), as those prevailing at the time for comparable transactions with persons not related to us, and do not involve more than a normal risk of collectability or present other features unfavorable to us. As of the date of this prospectus, no related party loans were categorized as nonaccrual, past due, restructured or potential problem loans. We expect to continue to enter into transactions in the ordinary course of business on similar terms with our officers and directors as well as their immediate family members and affiliates.
Other Related Party Transactions
Mr. Robert Steel, a member of our board of directors, is the Chief Executive Officer of Perella Weinberg Partners Group LP, which in 2016 acquired Tudor, Pickering, Holt & Co., one of the underwriters in our IPO and our November 2017 offering. Tudor, Pickering, Holt & Co. received underwriting discounts and commissions of approximately $200,000 in our IPO and approximately $165,000 in our November 2017 offering.
Policies and Procedures Regarding Related Party Transactions
Transactions among Cadence Bancorp, LLC, Cadence Bancorporation, Cadence Bank and any of their other affiliates are subject to a formal written policy, as well as certain regulatory requirements and restrictions. These requirements and restrictions include Sections 23A and 23B of the Federal Reserve Act (which govern certain transactions between banks and their affiliates) and the Federal Reserve’s Regulation O (which governs certain loans by banks to the executive officers, directors, principle shareholders (and their related interests) of the bank and its affiliates). We have adopted policies to comply with these regulatory requirements and restrictions.
In addition, our board of directors has adopted a written policy governing the approval of related party transactions that complies with all applicable requirements of the SEC and the NYSE concerning related party transactions. Related party transactions are transactions in which we are or will be a participant, the amount involved exceeds or will exceed $120,000 and a related party has or will have a direct or indirect material interest. Related parties of the Company include directors (including immediate family members or persons sharing the household with any of these persons (other than tenants and employees)). Our general counsel, in consultation with management and outside counsel, as appropriate, will review potential related party transactions to determine if they are subject to the policy. If so, the transaction will be referred to the Nominating and Corporate Governance Committee for approval. In determining whether to approve a related party
226
Table of Contents
transaction, the Committee will consider, among other factors, the fairness of the proposed transaction, the direct or indirect nature of the related party’s interest in the transaction, the appearance of an improper conflict of interests for any director or executive officer taking into account the size of the transaction and the financial position of the related party, whether the transaction would impair an outside director’s independence, the acceptability of the transaction to our regulators and the potential violations of other corporate policies. Our Related Party Transactions Policy is available on our website at www.cadencebancorporation.com, as an annex to our Corporate Governance Guidelines.
227
Table of Contents
Banking is a complex, highly regulated industry. Consequently, our growth and earnings performance can be affected, not only by management decisions and general and local economic conditions, but also by the statutes administered by, and the regulations and policies of, various governmental regulatory authorities. These authorities include, but are not limited to, the Federal Reserve, the OCC, the Internal Revenue Service (“IRS”) and state taxing authorities. The effect of these statutes, regulations and policies and any changes to any of them can be significant and cannot be predicted.
The primary goals of the bank regulatory scheme are to maintain a safe and sound banking system and to facilitate the conduct of sound monetary policy. In furtherance of those goals, the U.S. Congress and the individual states have created numerous regulatory agencies and enacted numerous laws, such as the Dodd-Frank Act, that govern banks and the banking industry. The system of supervision and regulation applicable to the Company establishes a comprehensive framework for our operations and is intended primarily for the protection of the DIF, our depositors and the public, rather than our stockholders and creditors.
The Dodd-Frank Act and its implementing regulations impose additional supervisory obligations on banking organizations with $10 billion or more in total consolidated assets. Our total assets were $10.5 billion and Cadence Bank’s total assets were $10.5 billion as of September 30, 2017, the first quarter-end as of which total assets exceeded $10 billion. As a result, after September 30, 2018, which we expect will be the fourth consecutive quarter in which total average consolidated assets exceed $10 billion (and any applicable phase-in period), we and Cadence Bank will, among other requirements:
| • | be required to perform annual stress tests; |
| • | be required to establish a dedicated risk committee of our board of directors responsible for overseeing our enterprise-risk management policies, commensurate with our capital structure, risk profile, complexity, size and other risk-related factors, and including as a member at least one risk management expert; |
| • | calculate our FDIC deposits assessment base using a performance score and loss-severity score system; |
| • | be subject to deposit insurance surcharges under the FDIC’s rule increasing the reserve ratio for the Deposit Insurance Fund (“DIF”) to 1.35%; |
| • | be subject to more frequent regulatory examinations; and |
| • | be subject to examination for compliance with federal consumer protection laws by the CFPB. |
In addition, after September 30, 2018, which we expect will be the fourth consecutive quarter in which total average consolidated assets exceed $10 billion (and any applicable phase-in period), Cadence and Cadence Bank will be affected by the Durbin Amendment to the Dodd-Frank Act regarding limits on debit card interchange fees. The Durbin Amendment gave the Federal Reserve the authority to establish rules regarding interchange fees charged for electronic debit transactions by a payment card issuer that, together with its affiliates, has assets of $10 billion or more and to enforce a statutory requirement that such fees be reasonable and proportional to the actual cost of a transaction to the issuer. The Federal Reserve has adopted rules under this provision that limit the swipe fees that a debit card issuer can charge a merchant for a transaction to the sum of 21 cents and five basis points times the value of the transaction, plus up to one cent for fraud prevention costs.
As of September 30, 2017, our total assets were $10.5 billion and Cadence Bank’s total assets were $10.5 billion. As a result of this, after September 30, 2018, which we expect will be the fourth consecutive quarter in which total average consolidated assets exceed $10 billion (and any applicable phase-in period), deposit insurance assessments and expenses related to regulatory compliance are likely to increase, and interchange fee income will decrease, the cumulative effect of which may be significant, and are on a cumulative basis, currently anticipated to be less than $6.5 million after-tax annually. The ultimate impact of the heightened
228
Table of Contents
scrutiny to which we will be subject is uncertain but we may be adversely affected and may incur increased costs related to regulatory oversight. In preparation for these additional regulations, we have engaged third parties to provide DFAST readiness assessments and roadmaps, and large bank deposit insurance assessment implementation guidance. Over the last couple years, we have made targeted enhancements to our risk management framework, systems and personnel in anticipation of continued growth over $10 billion.
New regulations and statutes are regularly proposed that contain wide-ranging proposals for altering the structures, regulations and competitive relationships of financial institutions operating in the United States. The federal banking agencies have issued a number of significant new regulations as a result of the Dodd-Frank Act and a number of additional regulations are pending or may be proposed. We cannot predict whether or in what form any proposed regulation or statute will be adopted or the extent to which any of our businesses may be affected by any new regulation or statute.
The following is an attempt to summarize some of the relevant laws, rules and regulations governing banks and bank holding companies, but does not purport to be a complete summary of all applicable laws, rules and regulations governing banks. The descriptions are qualified in their entirety by reference to the specific statutes and regulations discussed.
Bank Holding Company Regulation
The Company is a bank holding company registered under the Bank Holding Company Act of 1956 (the “BHC Act”) and is subject to supervision and regulation by the Federal Reserve. Federal laws subject bank holding companies to particular restrictions on the types of activities in which they may engage and to a range of supervisory requirements and activities, including regulatory enforcement actions, for violation of laws and policies.
Activities Closely Related to Banking
The BHC Act prohibits a bank holding company, with certain limited exceptions, from acquiring direct or indirect ownership or control of any voting shares of any company that is not a bank or from engaging in any activities other than those of banking, managing or controlling banks and certain other subsidiaries or furnishing services to or performing services for its subsidiaries. Bank holding companies also may engage in or acquire interests in companies that engage in a limited set of activities that are closely related to banking or managing or controlling banks. If a bank holding company has elected to become a financial holding company (an “FHC”), it may engage in a broader set of activities, including insurance underwriting and broker-dealer services, as well as activities that are jointly determined by the Federal Reserve and the Treasury Department to be financial in nature or incidental to such financial activity. FHCs may also engage in activities that are determined by the Federal Reserve to be complementary to financial activities. To qualify as an FHC, the bank holding company and all subsidiary depository institutions must be well managed and well capitalized. Additionally, each subsidiary depository institution of the bank holding company must have received at least a “Satisfactory” rating on its most recent CRA examination. Failure to meet any of these requirements may result in limitations on activities and acquisitions.
Safe and Sound Banking Practices
Bank holding companies are not permitted to engage in unsafe and unsound banking practices. The Federal Reserve may order a bank holding company to terminate an activity or control of a non-bank subsidiary if such activity or control constitutes a significant risk to the financial safety, soundness or stability of a subsidiary bank and is inconsistent with sound banking principles. Regulation Y also requires a holding company to give the Federal Reserve prior notice of any redemption or repurchase of its own equity securities if the consideration to be paid, together with the consideration paid for any repurchases or redemptions in the preceding year, is equal to 10% or more of the company’s consolidated net worth.
229
Table of Contents
Consistent with the Dodd-Frank Act codification of the Federal Reserve’s policy that bank holding companies must serve as a source of financial strength for their subsidiary banks, the Federal Reserve has stated that, as a matter of prudence, a bank holding company generally should not maintain a rate of distributions to stockholders unless its available net income has been sufficient to fully fund the distributions, and the prospective rate of earnings retention appears consistent with a bank holding company’s capital needs, asset quality and overall financial condition.
In addition, the Federal Reserve Supervisory Letter SR 09-4 provides guidance on the declaration and payment of dividends, capital redemptions and capital repurchases by a bank holding company. Supervisory Letter SR 09-4 provides that, as a general matter, a bank holding company should eliminate, defer or significantly reduce its dividends if: (i) the bank holding company’s net income available to stockholders for the past four quarters, net of dividends previously paid during that period, is not sufficient to fully fund the dividends, (ii) the bank holding company’s prospective rate of earnings retention is not consistent with the bank holding company’s capital needs and overall current and prospective financial condition, or (iii) the bank holding company will not meet, or is in danger of not meeting, its minimum regulatory capital adequacy ratios. Failure to do so could result in a supervisory finding that the bank holding company is operating in an unsafe and unsound manner.
Limitations on the Bank paying dividends could, in turn, affect our ability to pay dividends to our stockholders. For more information concerning the Bank’s ability to pay dividends, see below.
The Federal Reserve has broad authority to prohibit activities of bank holding companies and their non-banking subsidiaries that represent unsafe and unsound banking practices or which constitute violations of laws or regulations. Notably, the Financial Institutions Reform, Recovery and Enforcement Act of 1989 (“FIRREA”) provides that the Federal Reserve can assess civil money penalties for such practices or violations which can be as high as $1 million per day. FIRREA contains expansive provisions regarding the scope of individuals and entities against which such penalties may be assessed.
Annual Reporting and Examinations
The Company is required to file annual and quarterly reports with the Federal Reserve and such additional information as the Federal Reserve may require pursuant to the BHC Act. The Federal Reserve may examine a bank holding company or any of its subsidiaries and charge the company for the cost of such an examination.
Regulatory Capital
Revised regulatory capital rules, adopted in July 2013, implement higher minimum capital requirements for bank holding companies and banks. The rules include a new common equity Tier 1 capital requirement and establish criteria that instruments must meet to be considered common equity Tier 1 capital, additional Tier 1 capital or Tier 2 capital. These enhancements were intended to both improve the quality and increase the quantity of capital required to be held by banking organizations, and to better equip the U.S. banking system to deal with adverse economic conditions. The revised capital rules require banks and bank holding companies to maintain a minimum common equity Tier 1 capital ratio of 4.5%, a total Tier 1 capital ratio of 6%, a total capital ratio of 8%, and a leverage ratio of 4%. Bank holding companies and banks are also required to hold a capital conservation buffer of common equity Tier 1 capital of 2.5% to avoid limitations on capital distributions and discretionary executive compensation payments. The new capital conservation buffer requirement is being phased in at 0.625%, 1.25% and 1.875% of risk-weighted assets in January 2016, January 2017 and January 2018, respectively, and will be fully implemented in January 2019.
In addition to the requirements under the revised regulatory capital rules, bank holding companies must maintain a total risk-based capital ratio of 10% and a total Tier 1 risk-based capital ratio of 6% to be considered “well capitalized” for purposes of certain rules and requirements.
230
Table of Contents
The revised regulatory capital rules also require banks to maintain a common equity Tier 1 capital ratio of 6.5%, a total Tier 1 capital ratio of 8%, a total capital ratio of 10% and a leverage ratio of 5% to be deemed “well capitalized” for purposes of certain rules and prompt corrective action requirements.
The revised regulatory capital rules implement stricter eligibility criteria for regulatory capital instruments that would disallow the inclusion of instruments, such as trust preferred securities, in Tier 1 capital going forward and new constraints on the inclusion of minority interests, mortgage-servicing assets, deferred tax assets and certain investments in the capital of unconsolidated financial institutions. In addition, the rule requires that most regulatory capital deductions be made from common equity Tier 1 capital.
The minimum capital requirements under the revised regulatory capital rules were effective for us on January 1, 2015, whereas the capital conservation buffer and the deductions from common equity Tier 1 capital phase in over time. Phase-in of the capital conservation buffer requirements began on January 1, 2016.
The Federal Reserve may also set higher capital requirements for holding companies whose circumstances warrant it. For example, holding companies experiencing internal growth or making acquisitions are expected to maintain capital positions substantially above the minimum supervisory levels, without significant reliance on intangible assets. At this time, the bank regulatory agencies are more inclined to impose higher capital requirements to meet well-capitalized standards, and future regulatory change could impose higher capital standards as a routine matter. The Company’s regulatory capital ratios and those of the Bank are in excess of the levels established for “well-capitalized” institutions under the rules.
The rules also set forth certain changes in the methods of calculating certain risk-weighted assets, which in turn will affect the calculation of risk based ratios. Under the rules, higher or more sensitive risk weights would be assigned to various categories of assets, including certain credit facilities that finance the acquisition, development or construction of real property, certain exposures or credits that are 90 days past due or on non-accrual, foreign exposures and certain corporate exposures. In addition, the rules include (i) alternative standards of credit worthiness consistent with the Dodd-Frank Act; (ii) greater recognition of collateral and guarantees; and (iii) revised capital treatment for derivatives and repo-style transactions.
In addition, the rules include certain exemptions to address concerns about the regulatory burden on community banks. For example, banking organizations with less than $15 billion in consolidated assets as of December 31, 2009 are permitted to include in Tier 1 capital trust preferred securities and cumulative perpetual preferred stock issued and included in Tier 1 capital prior to May 19, 2010 on a permanent basis, without any phase out. Community banks were also permitted to elect on a one-time basis in their March 31, 2015 quarterly filings to opt-out of the requirement to include most accumulated other comprehensive income (“AOCI”) components in the calculation of common equity Tier 1 capital and, in effect, retain the AOCI treatment under the prior capital rules. Under the rules, we made a one-time, permanent election to continue to exclude accumulated other comprehensive income from capital.
Additionally, on December 14, 2015, the Federal Reserve issued a final rule regarding bank holding companies with non-traditional capital structures, such as LLCs. The rule provides generic examples of certain mechanics or provisions in organizing documents of bank holding companies with non-traditional capital structures, such as Cadence Bancorp, LLC, that may render membership interests (or other form of equity) ineligible as common equity Tier 1 capital. Bank holding companies had until July 1, 2016, to bring relevant capital instruments into compliance with the capital rules, including the guidance in the final rule noted above. Cadence Bancorp, LLC believes that its membership interests are consistent with the capital rules.
In September 2017, the federal bank regulators proposed to revise and simplify the capital treatment for certain deferred tax assets, mortgage servicing assets, investments in non-consolidated financial entities and minority interests for banking organizations, such as the Company and the Bank, that are not subject to the advanced approaches. In November 2017, the federal banking regulators revised the Basel III rules to extend the
231
Table of Contents
current transitional treatment of these items for non-advanced approaches banking organizations until the September 2017 proposal is finalized. The September 2017 proposal would also change the capital treatment of certain commercial real estate loans under the standardized approach, which the Company uses to calculate its capital ratios.
Imposition of Liability for Undercapitalized Subsidiaries
The Federal Deposit Insurance Corporation Improvement Act of 1991 (“FDICIA”) required each federal banking agency to revise its risk-based capital standards to ensure that those standards take adequate account of interest rate risk, concentration of credit risk and the risks of non-traditional activities, as well as reflect the actual performance and expected risk of loss on multi-family mortgages.
As discussed above, in accordance with the law, each federal banking agency has specified, by regulation, the levels at which an insured institution would be considered well capitalized, adequately capitalized, undercapitalized, significantly undercapitalized and critically undercapitalized. As of December 31, 2016, the Bank exceeded the capital levels required to be deemed well capitalized.
Additionally, FDICIA requires bank regulators to take prompt corrective action to resolve problems associated with insured depository institutions. In the event an institution becomes undercapitalized, it must submit a capital restoration plan.
Under these prompt corrective action provisions of FDICIA, if a controlled bank is undercapitalized, then the regulators could require the bank to submit a capital restoration plan. If an institution becomes significantly undercapitalized or critically undercapitalized, additional and significant limitations are placed on the institution. The capital restoration plan of an undercapitalized institution will not be accepted by the regulators unless each company having control of the undercapitalized institution guarantees the subsidiary’s compliance with the capital restoration plan until it becomes adequately capitalized. The Company has control of the bank for the purpose of this statute.
Further, by statute and regulation, a bank holding company must serve as a source of financial and managerial strength to each bank that it controls and, under appropriate circumstances, may be required to commit resources to support each such controlled bank. This support may be required at times when the bank holding company may not have the resources to provide the support. In addition, if the Federal Reserve believes that a bank holding company’s activities, assets or affiliates represent a significant risk to the financial safety, soundness or stability of a controlled bank, then the Federal Reserve could require the bank holding company to terminate the activities, liquidate the assets or divest the affiliates. The regulators may require these and other actions in support of controlled banks even if such actions are not in the best interests of the bank holding company or its stockholders.
Acquisitions by Bank Holding Companies
The BHC Act requires every bank holding company to obtain the prior approval of the Federal Reserve before (1) acquiring more than 5% of any class of voting stock of any bank or other bank holding company, (2) acquiring all or substantially all of the assets of any bank or bank holding company, or (3) merging or consolidating with any other bank holding company. Additionally, the BHC Act provides that the Federal Reserve may not approve any of these transactions if it would result in or tend to create a monopoly or substantially lessen competition or otherwise function as a restraint of trade, unless the anti-competitive effects of the proposed transaction are clearly outweighed by the public interest in meeting the convenience and needs of the community to be served. The Federal Reserve is also required to consider the financial and managerial resources and future prospects of the bank holding companies and banks concerned and the convenience and needs of the community to be served. The Federal Reserve’s consideration of financial resources generally focuses on capital adequacy. As a result of the USA PATRIOT Act of 2001, which is discussed below, the
232
Table of Contents
Federal Reserve is required to consider the record of a bank holding company and its subsidiary bank(s) in combating money laundering activities in its evaluation of bank holding company merger or acquisition transactions. The Dodd-Frank Act also amended the BHC Act to require consideration of the extent to which a proposed acquisition, merger or consolidation would result in greater or more concentrated risks to the stability of the U.S. banking or financial system.
Control Acquisitions
Subject to various exceptions, the BHC Act and the Change in Bank Control Act of 1978, together with related regulations, require Federal Reserve approval prior to any person or company acquiring “control” of a bank holding company, such as the Company. Control is conclusively presumed to exist if a person or company acquires 25% or more of any class of voting securities of the bank holding company. Control is rebuttably presumed to exist if a person or entity acquires 10% or more, but less than 25%, of any class of voting securities and that person or entity, by such acquisition, becomes the single largest holder of that class of voting securities.
Interstate Acquisitions
Under the Riegle-Neal Interstate Banking and Branching Efficiency Act of 1994 (the “Riegle-Neal Act”), a bank holding company may acquire banks in states other than its home state, subject to any state requirement that the bank has been organized and operating for a minimum period of time, not to exceed five years, and the requirement that the bank holding company not control, prior to or following the proposed acquisition, more than 10% of the total amount of deposits of insured depository institutions nationwide or, unless the acquisition is the bank holding company’s initial entry into the state, more than 30% of such deposits in the state (or such lesser or greater amount set by the state). The Riegle-Neal Act also authorizes banks to merge across state lines, thereby creating interstate branches. The Dodd-Frank Act permits a national or state bank, with the approval of its regulator, to open a branch in any state if the law of the state in which the branch is located would permit the establishment of the branch if the bank were a bank chartered in that state. National banks may provide trust services in any state to the same extent as a trust company chartered by that state.
Anti-tying Restrictions
Bank holding companies and their affiliates are prohibited from tying the provision of certain services, such as extensions of credit, to other services offered by a holding company or its affiliates.
Bank Regulation
Cadence Bank
Cadence Bank is a national bank, which is subject to regulation and supervision primarily by the OCC and secondarily by the Federal Reserve and the FDIC. Cadence Bank is subject to requirements and restrictions under federal law, including requirements to maintain reserves against deposits, restrictions on the types and amounts of loans that may be granted and the interest that may be charged thereon and limitations on the types of investments that may be made and the types of services that may be offered. Various consumer laws and regulations also affect the operations of the Bank.
The OCC regularly examines the Bank and records of the Bank. The FDIC may also periodically examine and evaluate insured banks.
Standards for Safety and Soundness
As part of FDICIA’s efforts to promote the safety and soundness of depository institutions and their holding companies, the federal banking regulators are required to have in place regulations specifying operational and
233
Table of Contents
management standards (addressing internal controls, loan documentation, credit underwriting and interest rate risk), asset quality and earnings. As discussed above, the Federal Reserve, the OCC, and the FDIC have extensive authority to police unsafe or unsound practices and violations of applicable laws and regulations by depository institutions and their holding companies. For example, the FDIC may terminate the deposit insurance of any institution that it determines has engaged in an unsafe or unsound practice. The agencies can also assess civil money penalties of up to $1 million per day, issue cease-and-desist or removal orders, seek injunctions and publicly disclose such actions.
The OCC also has restrictions on the payment of dividends by national banks. Cadence Bank may not, without the prior approval of the OCC, declare a dividend if the total amount of dividends declared by it in the current year, including the proposed dividend, exceeds certain levels of net and retained income. In addition, under the National Bank Act, Cadence Bank may not declare a dividend in excess of its “undivided profits.” See below for additional discussion regarding the Bank’s ability to pay dividends.
The present and future dividend policy of Cadence Bank is subject to the discretion of its board of directors. In determining whether to pay dividends to the Company and, if made, the amount of the dividends, the board of directors of Cadence Bank considers many of the same factors discussed above. Cadence Bank cannot guarantee that it will have the financial ability to pay dividends to the Company, or if dividends are paid, that they will be sufficient for Cadence to make distributions to stockholders. Cadence Bank is not obligated to pay dividends.
Restrictions on Transactions with Affiliates
Section 23A of the Federal Reserve Act imposes quantitative and qualitative limits on transactions between a bank and any affiliate and requires certain levels of collateral for extensions of credit to affiliates and certain other transactions involving affiliates. It also limits the amount of advances to third parties that are collateralized by the securities or obligations of the Company. Section 23B requires that certain transactions between the Bank and its affiliates must be on terms substantially the same, or at least as favorable, as those prevailing at the time for comparable transactions with or involving other nonaffiliated companies. In the absence of such comparable transactions, any transaction between the banks and their affiliates must be on terms and under circumstances, including credit standards, which in good faith would be offered to or would apply to nonaffiliated companies.
Capital Adequacy
In addition to the capital rules applicable to both banks and bank holding companies discussed above, under the prompt corrective action regulations, the federal bank regulators are required and authorized to take supervisory actions against undercapitalized banks. For this purpose, a bank is placed in one of five categories based on the bank’s capital (as of the new capital rules discussed above): well capitalized, adequately capitalized, undercapitalized, significantly undercapitalized and critically undercapitalized. Currently, the quantitative requirements for the categories are:
| • | well-capitalized (at least 5% leverage capital, 6.5% common equity Tier 1 risk-based capital, 8% Tier 1 risk-based capital and 10% total risk-based capital); |
| • | adequately capitalized (at least 4% leverage capital, 4.5% common equity Tier 1 risk-based capital, 6% Tier 1 risk-based capital and 8% total risk-based capital); |
| • | undercapitalized (less than 4% leverage capital, 4.5% common equity Tier 1 risk-based capital, 6% Tier 1 risk-based capital and 8% total risk-based capital); |
| • | significantly undercapitalized (less than 3% leverage capital, 3% common equity Tier 1 risk-based capital, 4% Tier 1 risk-based capital and 6% total risk-based capital); and |
| • | critically undercapitalized (less than 2% tangible capital). |
Federal banking regulators are required to take various mandatory supervisory actions and are authorized to take other discretionary actions with respect to institutions in the three undercapitalized categories. The severity
234
Table of Contents
of the action depends upon the capital category in which the institution is placed. Generally, subject to a narrow exception, banking regulators must appoint a receiver or conservator for an institution that is “critically undercapitalized.” The federal banking agencies have specified by regulation the relevant capital level for each category. An institution that is categorized as “undercapitalized,” “significantly undercapitalized,” or “critically undercapitalized” is required to submit an acceptable capital restoration plan to its appropriate federal banking agency, which, for the Bank, is the OCC.
In connection with the acquisition of assets and assumption of deposits and certain other liabilities of Superior Bank, the Company agreed to be bound by the FDIC’s Final Statement of Policy on Qualifications for Failed Bank Acquisitions (the “Policy Statement”). Among other requirements, under the Policy Statement the Bank must maintain a ratio of Tier 1 common equity to total assets of at least 10% for a period of three years following the Superior Bank transaction, and thereafter maintain a capital level sufficient to be “well capitalized” under the prompt corrective action framework described above. The Bank is currently subject to the “well-capitalized” requirement but is no longer subject to the 10% Tier 1 common equity ratio requirement.
Failure to meet capital guidelines could subject the Bank to a variety of enforcement remedies, including issuance of a capital directive, the termination of deposit insurance by the FDIC, a prohibition on accepting brokered deposits and other restrictions on our business.
Deposit Insurance
The FDIC insures the deposits of federally insured banks up to prescribed statutory limits for each depositor, through the DIF and safeguards the safety and soundness of the banking and thrift industries. The Dodd-Frank Act permanently raised the standard maximum deposit insurance amount to $250,000. The amount of FDIC assessments paid by each insured depository institution is based on its relative risk of default as measured by regulatory capital ratios and other supervisory factors.
In connection with the Dodd-Frank Act’s requirement that insurance assessments be based on assets, the FDIC has redefined its deposit insurance premium assessment base to be an institution’s average consolidated total assets minus average tangible equity, and revised its deposit insurance assessment rate schedule in light of this change to the assessment base. The revised rate schedule and other revisions to the assessment rules became effective April 1, 2011. In March 2016, the FDIC adopted a final rule increasing the reserve ratio for the DIF to 1.35% of total insured deposits. The rule imposes a surcharge on the assessments of insured depository institutions with at least $10 billion in assets, beginning the third quarter of 2016 and continuing through the earlier of the quarter that the reserve ratio first reaches or exceeds 1.35% and December 31, 2018. Under the rule, if the reserve ratio does not reach 1.35% by December 31, 2018, the FDIC will impose a shortfall assessment on such insured depository institutions on March 31, 2019.
We are generally unable to control the amount of premiums that we are required to pay for FDIC insurance. At least semi-annually, the FDIC will update its loss and income projections for the DIF and, if needed, will increase or decrease assessment rates, following notice-and-comment rulemaking, if required. If there are additional bank or financial institution failures or if the FDIC otherwise determines to increase assessment rates, the Bank may be required to pay higher FDIC insurance premiums. Any future increases in FDIC insurance premiums may have a material and adverse effect on our earnings.
In addition, all FDIC-insured institutions are required to pay assessments to the FDIC to fund interest payments on bonds issued by the Financing Corporation (“FICO”), an agency of the federal government established to recapitalize the predecessor to the DIF. These assessments, which are included in Deposit Insurance Premiums on the Consolidated Statements of Operations, will continue until the FICO bonds mature between 2017 and 2019.
235
Table of Contents
Consumer Financial Protection Bureau
The Dodd-Frank Act created the CFPB, which is granted broad rulemaking, supervisory and enforcement powers under various federal consumer financial protection laws, including the Equal Credit Opportunity Act, Truth in Lending Act, Real Estate Settlement Procedures Act, Fair Credit Reporting Act, Fair Debt Collection Practices Act, the Consumer Financial Privacy provisions of the Gramm-Leach-Bliley Act and certain other statutes. The CFPB has examination and primary enforcement authority with respect to depository institutions with $10 billion or more in assets. Depository institutions with less than $10 billion in assets, such as our subsidiary depository institutions, are subject to rules promulgated by the CFPB, which may increase their compliance risk and the costs associated with their compliance efforts, but the banks will continue to be examined and supervised by federal banking regulators for consumer compliance purposes. The CFPB has authority to prevent unfair, deceptive or abusive practices in connection with the offering of consumer financial products. As noted above, it is likely that the Company and Cadence Bank will exceed $10 billion in total consolidated assets at some point in 2017. The Company and Cadence Bank will become subject to examination by the CFPB after four consecutive quarters of total assets exceeding $10 billion.
The Dodd-Frank Act authorizes the CFPB to establish certain minimum standards for the origination of residential mortgages, including a determination of the borrower’s ability to repay. In addition, the Dodd-Frank Act allows borrowers to raise certain defenses to foreclosure if they receive any loan other than a “qualified mortgage” as defined by the CFPB. The CFPB has opened inquiries into whether additional rulemaking would be appropriate for overdraft protection programs.
The CFPB has issued a number of regulations related to the origination of mortgages, foreclosures, and overdrafts as well as many other consumer issues. Additionally, the CFPB has proposed, or will be proposing, additional regulations on issues that directly relate to our business. Although it is difficult to predict at this time the extent to which the CFPB’s final rules impact the operations and financial condition of the banks, such rules may have a material impact on the banks’ compliance costs, compliance risk and fee income.
Privacy
Under the Right to Financial Privacy Act of 1978, which imposes a duty to maintain confidentiality of consumer financial records and prescribes procedures for complying with administrative subpoenas of financial records, financial institutions are required to disclose their policies for collecting and protecting confidential information. Customers generally may prevent financial institutions from sharing personal financial information with nonaffiliated third parties except for third parties that market the institutions’ own products and services. Additionally, financial institutions generally may not disclose consumer account numbers to any nonaffiliated third party for use in telemarketing, direct mail marketing or other marketing through electronic mail to consumers.
PATRIOT Act, International Money Laundering Abatement and Financial Anti-Terrorism Act and Bank Secrecy Act
A major focus of governmental policy on financial institutions has been aimed at combating money laundering and terrorist financing. The PATRIOT Act and the International Money Laundering and Financial Anti-Terrorism Act of 2001 substantially broadened the scope of U.S. anti-money-laundering laws and penalties, specifically related to the Bank Secrecy Act, and expanded the extra-territorial jurisdiction of the United States. The U.S. Treasury Department has issued a number of implementing regulations which apply various requirements of the PATRIOT Act to financial institutions such as Cadence Bank. These regulations impose obligations on financial institutions to maintain appropriate policies, procedures and controls to detect, prevent and report money laundering and terrorist financing and to verify the identity of their customers.
Failure of a financial institution and its holding company to maintain and implement adequate programs to combat money laundering and terrorist financing, or to comply with relevant laws and regulations, could have
236
Table of Contents
serious legal, reputational and financial consequences for the institution. Because of the significance of regulatory emphasis on these requirements, Cadence Bank will continue to expend significant staffing, technology and financial resources to maintain programs designed to ensure compliance with applicable laws and regulations and an effective audit function for testing of the banks’ compliance with the Bank Secrecy Act on an ongoing basis.
Community Reinvestment Act
The CRA requires that, in connection with examinations of financial institutions within its jurisdiction, the OCC evaluates the record of each financial institution in meeting the credit needs of its local community, including low and moderate-income neighborhoods. The performance of a financial institution in meeting the credit needs of its community is a factor that must be taken into consideration when the federal banking agencies evaluate applications related to mergers and acquisitions, as well as branch openings and relocations. Additionally, financial institutions must publicly disclose the terms of various CRA-related agreements.
Failure to adequately meet the credit needs of our community in accordance with the CRA could prevent us from pursuing our business strategy. Any CRA rating below “Satisfactory” for the Bank could restrict the Company’s ability to undertake certain activities, including any merger or acquisition that our management and board of directors may otherwise desire to pursue, and may prevent or materially delay the consummation of future mergers or acquisitions or the opening of new branch locations, until the Bank’s rating improves. In addition, as described above, an FHC faces limitations on activities and acquisitions if its subsidiary depository institutions do not have at least a “Satisfactory” CRA rating.
Other Regulations
Interest and other charges that the Bank collects or contracts for are subject to state usury laws and federal laws concerning interest rates. The Bank’s loan operations also are subject to federal laws applicable to credit transactions, such as:
| • | the federal Truth in Lending Act, governing disclosures of credit terms to consumer borrowers; |
| • | the Home Mortgage Disclosure Act, requiring financial institutions to provide information to enable the public and public officials to determine whether a financial institution is fulfilling its obligation to help meet the housing needs of the community it serves; |
| • | the Equal Credit Opportunity Act, prohibiting discrimination on the basis of race, creed or other prohibited factors in extending credit; |
| • | the Fair Credit Reporting Act, governing the use and provision of information to credit reporting agencies; |
| • | the Fair Debt Collection Practices Act, governing the manner in which consumer debts may be collected by collection agencies; and |
| • | the rules and regulations of the various governmental agencies charged with the responsibility of implementing these federal laws. |
In addition, the Bank’s deposit operations are subject to the Electronic Funds Transfer Act and Regulation E issued by the Federal Reserve to implement that act, which govern automatic deposits to and withdrawals from deposit accounts and customers’ rights and liabilities arising from the use of ATMs and other electronic banking services.
Concentrated Commercial Real Estate Lending Regulations
The Federal Reserve and other federal banking regulatory agencies promulgated guidance governing financial institutions with concentrations in commercial real estate lending. The guidance provides that a bank
237
Table of Contents
has a concentration in commercial real estate lending if (i) total reported loans for construction, land development and other land represent 100% or more of total capital or (ii) total reported loans secured by multifamily and non-farm residential properties and loans for construction, land development and other land represent 300% or more of total capital and the bank’s commercial real estate loan portfolio has increased 50% or more during the prior 36 months. If a concentration is present, management must employ heightened risk management practices including board and management oversight and strategic planning, development of underwriting standards, risk assessment and monitoring through market analysis and stress testing, and increasing capital requirements.
Compliance with all of the above laws and regulations add significantly to the cost of operating the Company and the Bank and thus have a negative impact on profitability. We would also note that there has been a tremendous expansion experienced in recent years by certain financial service providers that are not subject to the same rules and regulations as the Company and the Bank. These institutions, because they are not so highly regulated, have a competitive advantage over us and the Bank and may continue to draw large amounts of funds away from traditional banking institutions, with a continuing adverse effect on the banking industry in general.
Effect of Governmental Monetary Policies
The commercial banking business is affected not only by general economic conditions but also by both U.S. fiscal policy and the monetary policies of the Federal Reserve. Some of the instruments of fiscal and monetary policy available to the Federal Reserve include changes in the discount rate on member bank borrowings, the fluctuating availability of borrowings at the “discount window,” open market operations, the imposition of and changes in reserve requirements against member banks’ deposits and assets of foreign branches, the imposition of and changes in reserve requirements against certain borrowings by banks and their affiliates, and the placing of limits on interest rates that member banks may pay on time and savings deposits. Such policies influence to a significant extent the overall growth of bank loans, investments, and deposits and the interest rates charged on loans or paid on time and savings deposits. We cannot predict the nature of future fiscal and monetary policies and the effect of such policies on the future business and our earnings.
238
Table of Contents
Certain Material United States Federal Income Tax Considerations for Non-U.S. Holders
The following is a general discussion of material U.S. federal income tax considerations with respect to the ownership and disposition of shares of our common stock applicable to non-U.S. holders who acquire such shares in this offering. This discussion is based on current provisions of the Internal Revenue Code of 1986, as amended (the “Code”), U.S. Treasury regulations promulgated thereunder, and administrative rulings and court decisions in effect as of the date hereof, all of which are subject to change at any time, possibly with retroactive effect.
For purposes of this discussion, the term “non-U.S. holder” means a beneficial owner of our common stock that is not, for U.S. federal income tax purposes, a partnership or any of the following:
| • | a citizen or resident of the United States; |
| • | a corporation, or other entity taxable as a corporation for U.S. federal income tax purposes, created or organized in the United States or under the laws of the United States, any state thereof or the District of Columbia; |
| • | an estate, the income of which is includible in gross income for U.S. federal income tax purposes regardless of its source; or |
| • | a trust if (1) a court within the United States is able to exercise primary supervision over the administration of the trust and one or more U.S. persons have the authority to control all substantial decisions of the trust, or (2) it has a valid election in effect under applicable U.S. Treasury regulations to be treated as a U.S. person for U.S. federal income tax purposes. |
If an entity or arrangement treated as a partnership for U.S. federal income tax purposes holds shares of our common stock, the tax treatment of a person treated as a partner therein generally will depend on the status of the partner and the activities of the partnership. Persons that for U.S. federal income tax purposes are treated as a partner in a partnership holding shares of our common stock should consult their tax advisors.
This discussion assumes that a non-U.S. holder holds shares of our common stock as a capital asset within the meaning of Section 1221 of the Code (generally, property held for investment). This discussion does not address all aspects of U.S. federal income taxation that may be relevant to a non-U.S. holder in light of that holder’s particular circumstances or that may be applicable to holders subject to special treatment under U.S. federal income tax law (including, for example, financial institutions, dealers in securities, traders in securities that elect mark-to-market treatment, insurance companies, tax-exempt entities, holders who acquired our common stock pursuant to the exercise of employee stock options or otherwise as compensation, entities or arrangements treated as partnerships for U.S. federal income tax purposes, holders liable for the alternative minimum tax, certain former citizens or former long-term residents of the United States, holders who hold our common stock as part of a hedge, straddle, constructive sale or conversion transaction, and holders who own or have owned (directly, indirectly or constructively) five percent or more of our common stock (by vote or value)). In addition, this discussion does not address U.S. federal tax laws other than those pertaining to the U.S. federal income tax, nor does it address any aspects of the unearned income Medicare contribution tax pursuant to the Health Care and Education Reconciliation Act of 2010, or U.S. state, local or non-U.S. taxes. Accordingly, prospective investors should consult with their own tax advisors regarding the U.S. federal, state, local, non-U.S. income and other tax considerations of acquiring, holding and disposing of shares of our common stock.
THIS DISCUSSION IS NOT INTENDED TO CONSTITUTE A COMPLETE DESCRIPTION OF ALL TAX CONSEQUENCES RELATING TO THE OWNERSHIP AND DISPOSITION OF OUR COMMON STOCK. PROSPECTIVE HOLDERS OF OUR COMMON STOCK SHOULD CONSULT WITH THEIR TAX ADVISORS REGARDING THE TAX CONSEQUENCES TO THEM (INCLUDING THE APPLICATION AND EFFECT OF ANY STATE, LOCAL, NON-U.S. INCOME AND OTHER TAX LAWS) OF THE OWNERSHIP AND DISPOSITION OF OUR COMMON STOCK.
239
Table of Contents
Dividends
In general, any distributions we make to a non-U.S. holder with respect to its shares of our common stock that constitute dividends for U.S. federal income tax purposes will be subject to U.S. withholding tax at a rate of 30% of the gross amount (or a reduced rate prescribed by an applicable income tax treaty), unless the dividends are effectively connected with a trade or business carried on by the non-U.S. holder within the United States (and, if an income tax treaty applies, are attributable to a permanent establishment of the non-U.S. holder within the United States). A distribution will constitute a dividend for U.S. federal income tax purposes to the extent of our current or accumulated earnings and profits as determined for U.S. federal income tax purposes. Any distribution not constituting a dividend will be treated as first reducing the adjusted basis in the non-U.S. holder’s shares of our common stock and, to the extent it exceeds the adjusted basis in the non-U.S. holder’s shares of our common stock, as gain from the sale or exchange of such shares.
Dividends effectively connected with a U.S. trade or business (and, if an income tax treaty applies, attributable to a U.S. permanent establishment) of a non-U.S. holder generally will not be subject to U.S. withholding tax if the non-U.S. holder complies with applicable certification and disclosure requirements. Instead, such dividends generally will be subject to U.S. federal income tax on a net income basis, in the same manner as if the non-U.S. holder were a resident of the United States. A non-U.S. holder that is a corporation may be subject to an additional “branch profits tax” at a rate of 30% (or such lower rate as may be specified by an applicable income tax treaty) on its “effectively connected earnings and profits,” subject to certain adjustments.
Gain on Sale or Other Disposition of our Common Stock
In general, a non-U.S. holder will not be subject to U.S. federal income or, subject to the discussion below under the headings “Information Reporting and Backup Withholding” and “Foreign Account Tax Compliance Act,” withholding tax on any gain realized upon the sale or other disposition of our common stock unless:
| • | the gain is effectively connected with a trade or business carried on by the non-U.S. holder within the United States and, if required by an applicable income tax treaty, is attributable to a U.S. permanent establishment of the non-U.S. holder; |
| • | the non-U.S. holder is an individual and is present in the United States for 183 days or more in the taxable year of disposition and certain other conditions are satisfied; or |
| • | we are or have been a U.S. real property holding corporation for U.S. federal income tax purposes and the non-U.S. holder held, directly or indirectly, more than 5% of our common stock at any time within the shorter of the five-year period ending on the date of the disposition and the non-U.S. holder’s holding period and certain other conditions are satisfied. |
Gain that is effectively connected with the conduct of a trade or business in the United States generally will be subject to U.S. federal income tax, net of certain deductions, at regular U.S. federal income tax rates. If the non-U.S. holder is a foreign corporation, the branch profits tax described above also may apply to such effectively connected gain. An individual non-U.S. holder who is subject to U.S. federal income tax because the non-U.S. holder was present in the United States for 183 days or more during the year of sale or other disposition of our common stock will be subject to a flat 30% tax on the gain derived from such sale or other disposition, which may be offset by U.S. source capital losses.
Information Reporting and Backup Withholding
We must report annually to the IRS and to each non-U.S. holder the amount of dividends paid to, and the tax withheld with respect to, each non-U.S. holder. These reporting requirements apply regardless of whether withholding was reduced or eliminated by an applicable tax treaty. Copies of this information also may be made available under the provisions of a specific treaty or agreement with the tax authorities in the country in which the non-U.S. holder resides or is established.
240
Table of Contents
U.S. backup withholding tax (currently, at a rate of 24%) is imposed on certain payments to persons that fail to furnish the information required under the U.S. information reporting rules. Dividends paid to a non-U.S. holder generally will be exempt from backup withholding if the non-U.S. holder provides a properly executed IRS Form W-8BEN, IRS Form W-8BEN-E, or otherwise establishes an exemption.
Under U.S. Treasury regulations, the payment of proceeds from the disposition of our common stock by a non-U.S. holder effected at a U.S. office of a broker generally will be subject to information reporting and backup withholding, unless the beneficial owner, under penalties of perjury, certifies, among other things, its status as not a United States person or otherwise establishes an exemption. The payment of proceeds from the disposition of our common stock by a non-U.S. holder effected at a non-U.S. office of a broker generally will not be subject to backup withholding and information reporting, except as noted below. In the case of proceeds from a disposition of our common stock by a non-U.S. holder effected at a non-U.S. office of a broker that is:
| • | a “United States person” for U.S. federal income tax purposes; |
| • | a “controlled foreign corporation” for U.S. federal income tax purposes; |
| • | a foreign person 50% or more of whose gross income from certain periods is effectively connected with a U.S. trade or business; or |
| • | a foreign partnership if at any time during its tax year (a) one or more of its partners are U.S. persons who, in the aggregate, hold more than 50% of the income or capital interests of the partnership or (b) the foreign partnership is engaged in a U.S. trade or business; |
information reporting will apply unless the broker has documentary evidence in its files that the owner is not a United States person and certain other conditions are satisfied, or the beneficial owner otherwise establishes an exemption (and the broker has no knowledge or reason to know to the contrary). Backup withholding will apply if the sale is subject to information reporting and the broker has actual knowledge that the owner is a “United States person” for U.S. federal income tax purposes.
Backup withholding is not an additional tax. Any amounts withheld under the backup withholding rules from a payment to a non-U.S. holder can be refunded or credited against the non-U.S. holder’s U.S. federal income tax liability, if any, provided that the required information is furnished to the IRS in a timely manner.
Foreign Account Tax Compliance Act
Under Sections 1471 through 1474 of the Code and the Treasury regulations and administrative guidance promulgated thereunder (collectively, “FATCA”), a U.S. federal withholding tax of 30% generally will be imposed on certain payments made to a “foreign financial institution” (as specifically defined under these rules) unless such institution enters into an agreement with the U.S. tax authorities to withhold on certain payments and to collect and provide to the U.S. tax authorities substantial information regarding U.S. account holders of such institution (which includes certain equity and debt holders of such institution, as well as certain account holders that are foreign entities with U.S. owners) or meets other exceptions. Under FATCA, a U.S. federal withholding tax of 30% generally also will be imposed on certain payments made to a non-financial foreign entity unless such entity provides the withholding agent with a certification identifying its direct and indirect U.S. owners or meets other exceptions. Foreign entities located in jurisdictions that have an intergovernmental agreement with the United States governing these withholding and reporting requirements may be subject to different rules. Under certain circumstances, a non-U.S. holder might be eligible for refunds or credits of such taxes. These withholding taxes would be imposed on dividends paid with respect to our common stock to foreign financial institutions or non-financial entities (including in their capacity as agents or custodians for beneficial owners of our common stock) that fail to satisfy the above requirements. Payments of gross proceeds from a sale or other disposition of our common stock could also be subject to FATCA withholding unless such disposition occurs before January 1, 2019. Prospective non-U.S. holders should consult with their tax advisors regarding the possible implications of FATCA on their investment in our common stock.
241
Table of Contents
The Company, the selling stockholder and the underwriters named below have entered into an underwriting agreement with respect to the shares being offered. Subject to certain conditions, each underwriter has severally agreed to purchase the number of shares indicated in the following table. Goldman Sachs & Co. LLC and J.P. Morgan Securities LLC are the representatives of the underwriters.
| Underwriter |
Number of Shares | |||
| Goldman Sachs & Co. LLC |
||||
| J.P. Morgan Securities LLC |
||||
| Keefe, Bruyette & Woods, Inc. |
||||
| Sandler O’Neill & Partners, L.P. |
||||
| Robert W. Baird & Co. Incorporated |
||||
| Raymond James & Associates, Inc. |
||||
| RBC Capital Markets, LLC |
||||
| Stephens Inc. |
||||
|
|
|
|||
| Total |
7,000,000 | |||
The underwriters are committed to take and pay for all of the shares being offered, if any are taken, other than the shares covered by the option described below unless and until this option is exercised.
The selling stockholder has granted the underwriters an option to buy up to an additional 1,050,000 shares to cover sales by the underwriters of a greater number of shares than the total number set forth in the table above. They may exercise that option for 30 days. If any shares are purchased pursuant to this option, the underwriters will severally purchase shares in approximately the same proportion as set forth in the table above.
The following tables show the per share and total underwriting discounts and commissions to be paid to the underwriters. Such amounts are shown assuming both no exercise and full exercise of the underwriters’ option to purchase additional shares.
| No Exercise | Full Exercise | |||||||
| Per Share |
$ | $ | ||||||
| Total |
$ | $ | ||||||
Shares sold by the underwriters to the public will initially be offered at the public offering price set forth on the cover of this prospectus. After the initial offering of the shares, the representatives may change the offering price and the other selling terms. The offering of the shares by the underwriters is subject to receipt and acceptance and subject to the underwriters’ right to reject any order in whole or in part.
The Company, our officers and directors, and the selling stockholder have agreed with the underwriters, subject to certain exceptions, not to dispose of or hedge any of their common stock or securities convertible into or exchangeable for shares of common stock during the period from the date of this prospectus continuing through the date 90 days after the date of this prospectus, except with the prior written consent of the representatives and except (1) pursuant to employee stock option plans described in this prospectus and (2) in connection with business combinations provided that the aggregate number of shares issued in any such business combination or combinations during such 90-day period does not exceed 10% of the outstanding shares of our common stock as of the closing of this offering, though we are permitted to enter into any agreement to issue a number of shares of our common stock in excess of such threshold during such 90-day period. This agreement does not apply to any existing employee benefit plans. See “Shares Eligible for Future Sale” for a discussion of certain transfer restrictions.
In addition, we, our executive officers and directors and the selling stockholder entered into lock-up agreements with the underwriters in our November 2017 offering on terms substantially similar to those described above. The lock-up agreements entered into in connection with our November 2017 offering expire on February 6, 2018. The representatives of the underwriters in our IPO have released the securities to be sold in this
242
Table of Contents
offering from the lock-up agreements with respect to the sale by the selling stockholder of the shares to be sold in this offering and may do so in connection with future offerings prior to the expiration of those lock-up agreements at any time and without public notice.
Our Class A common stock is listed on the NYSE under the symbol “CADE.”
In connection with the offering, the underwriters may purchase and sell shares of common stock in the open market. These transactions may include short sales, stabilizing transactions and purchases to cover positions created by short sales. Short sales involve the sale by the underwriters of a greater number of shares than they are required to purchase in the offering, and a short position represents the amount of such sales that have not been covered by subsequent purchases. A “covered short position” is a short position that is not greater than the amount of additional shares for which the underwriters’ option described above may be exercised. The underwriters may cover any covered short position by either exercising their option to purchase additional shares or purchasing shares in the open market. In determining the source of shares to cover the covered short position, the underwriters will consider, among other things, the price of shares available for purchase in the open market as compared to the price at which they may purchase additional shares pursuant to the option described above. “Naked” short sales are any short sales that create a short position greater than the amount of additional shares for which the option described above may be exercised. The underwriters must cover any such naked short position by purchasing shares in the open market. A naked short position is more likely to be created if the underwriters are concerned that there may be downward pressure on the price of the common stock in the open market after pricing that could adversely affect investors who purchase in the offering. Stabilizing transactions consist of various bids for or purchases of common stock made by the underwriters in the open market prior to the completion of the offering.
The underwriters may also impose a penalty bid. This occurs when a particular underwriter repays to the underwriters a portion of the underwriting discount received by it because the representatives have repurchased shares sold by or for the account of such underwriter in stabilizing or short covering transactions.
Purchases to cover a short position and stabilizing transactions, as well as other purchases by the underwriters for their own accounts, may have the effect of preventing or retarding a decline in the market price of the Company’s stock, and together with the imposition of the penalty bid, may stabilize, maintain or otherwise affect the market price of the common stock. As a result, the price of the common stock may be higher than the price that otherwise might exist in the open market. The underwriters are not required to engage in these activities and may end any of these activities at any time. These transactions may be effected on the applicable stock exchange, in the over-the-counter market or otherwise.
The underwriters do not expect sales to discretionary accounts to exceed 5% of the total number of shares offered.
The Company estimates that its share of the total expenses of the offering, excluding underwriting discounts and commissions, will be approximately $1.2 million. The underwriters have agreed to reimburse the Company for certain of its expenses in connection with this offering.
The Company and the selling stockholder have agreed to indemnify the several underwriters against certain liabilities, including liabilities under the Securities Act.
The underwriters and their respective affiliates are full service financial institutions engaged in various activities, which may include sales and trading, commercial and investment banking, advisory, investment management, investment research, principal investment, hedging, market making, brokerage and other financial and non-financial activities and services. Certain of the underwriters and their respective affiliates have provided, and may in the future provide, a variety of these services to the issuer and to persons and entities with relationships with the issuer, for which they received or will receive customary fees and expenses.
243
Table of Contents
In the ordinary course of their various business activities, the underwriters and their respective affiliates, officers, directors and employees may purchase, sell or hold a broad array of investments and actively traded securities, derivatives, loans, commodities, currencies, credit default swaps and other financial instruments for their own account and for the accounts of their customers, and such investment and trading activities may involve or relate to assets, securities and/or instruments of the issuer (directly, as collateral securing other obligations or otherwise) and/or persons and entities with relationships with the issuer. The underwriters and their respective affiliates may also communicate independent investment recommendations, market color or trading ideas and/or publish or express independent research views in respect of such assets, securities or instruments and may at any time hold, or recommend to clients that they should acquire, long and/or short positions in such assets, securities and instruments.
Selling Restrictions
European Economic Area
In relation to each Member State of the European Economic Area which has implemented the Prospectus Directive (each, a “Relative Member State”) an offer to the public of our common shares may not be made in that Relevant Member State, except that an offer to the public in that Relevant Member State of our common shares may be made at any time under the following exemptions under the Prospectus Directive:
| • | To any legal entity which is a qualified investor as defined in the Prospectus Directive; |
| • | To fewer than 150 natural or legal persons (other than qualified investors as defined in the Prospectus Directive), subject to obtaining the prior consent of the Representatives for any such offer; or |
| • | In any other circumstances falling within Article 3(2) of the Prospectus Directive; |
provided that no such offer of the shares shall require the Company or any underwriter to publish a prospectus pursuant to Article 3 of the Prospectus Directive and each person who initially acquires any shares of our Class A common stock or to whom any offer is made will be deemed to have represented, acknowledged and agreed to and with each of the underwriters and the Company that it is a “qualified investor” within the meaning of the law in that Relevant Member State implementing Article 2(1)(e) of the Prospectus Directive.
In the case of any shares being offered to a financial intermediary as that term is used in Article 3(2) of the Prospectus Directive, each such financial intermediary will be deemed to have represented, acknowledged and agreed that the shares acquired by it in the offer have not been acquired on a non-discretionary basis on behalf of, nor have they been acquired with a view to their offer or resale to, persons in circumstances which may give rise to an offer of any shares to the public other than their offer or resale in a Relevant Member State to qualified investors as so defined or in circumstances in which the prior consent of the representatives has been obtained to each such proposed offer or resale.
For the purposes of this provision, the expression an “offer of shares to the public” in relation to any shares in any Relevant Member State means the communication in any form and by means of sufficient information on the terms of the offer and the shares to be offered so as to enable an investor to decide to purchase shares, as the same may be varied in that Member State by any measure implementing the Prospectus Directive in that Member State, the expression “Prospectus Directive” means Directive 2003/71/EC (as amended, including by Directive 2010/73/EU), and includes any relevant implementing measure in the Relevant Member State.
This European Economic Area selling restriction is in addition to any other selling restrictions set out below.
United Kingdom
In the United Kingdom, this prospectus is only addressed to and directed as qualified investors who are (i) investment professionals falling within Article 19(5) of the Financial Services and Markets Act 2000
244
Table of Contents
(Financial Promotion) Order 2005 (the “Order”); or (ii) high net worth entities and other persons to whom it may lawfully be communicated, falling within Article 49(2)(a) to (d) of the Order (all such persons together being referred to as “relevant persons”). Any investment or investment activity to which this prospectus relates is available only to relevant persons and will only be engaged with relevant persons. Any person who is not a relevant person should not act or relay on this prospectus or any of its contents.
Canada
The shares may be sold in Canada only to purchasers purchasing, or deemed to be purchasing, as principal that are accredited investors, as defined in National Instrument 45-106 Prospectus Exemptions or subsection 73.3(1) of the Securities Act (Ontario), and are permitted clients, as defined in National Instrument 31-103 Registration Requirements, Exemptions, and Ongoing Registrant Obligations. Any resale of the securities must be made in accordance with an exemption from, or in a transaction not subject to, the prospectus requirements of applicable securities laws.
Securities legislation in certain provinces or territories of Canada may provide a purchaser with remedies for rescission or damages if this prospectus (including any amendment thereto) contains a misrepresentation, provided that the remedies for rescission or damages are exercised by the purchaser within the time limit prescribed by the securities legislation of the purchaser’s province or territory. The purchaser should refer to any applicable provisions of the securities legislation of the purchaser’s province or territory of these rights or consult with a legal advisor.
Pursuant to section 3A.3 of National Instrument 33-105 Underwriting Conflicts (“NI 33-105”), the underwriters are not required to comply with the disclosure requirements of NI 33-105 regarding underwriter conflicts of interest in connection with this offering.
Hong Kong
The shares may not be offered or sold in Hong Kong by means of any document other than (i) in circumstances which do not constitute an offer to the public within the meaning of the Companies (Winding Up and Miscellaneous Provisions) Ordinance (Cap. 32 of the Laws of Hong Kong) (“Companies (Winding Up and Miscellaneous Provisions) Ordinance”) or which do not constitute an invitation to the public within the meaning of the Securities and Futures Ordinance (Cap. 571 of the Laws of Hong Kong) (“Securities and Futures Ordinance”), or (ii) to “professional investors” as defined in the Securities and Futures Ordinance and any rules made thereunder, or (iii) in other circumstances which do not result in the document being a “prospectus” as defined in the Companies (Winding Up and Miscellaneous Provisions) Ordinance, and no advertisement, invitation or document relating to the shares may be issued or may be in the possession of any person for the purpose of issue (in each case whether in Hong Kong or elsewhere), which is directed at, or the contents of which are likely to be accessed or read by, the public in Hong Kong (except if permitted to do so under the securities laws of Hong Kong) other than with respect to shares which are or are intended to be disposed of only to persons outside Hong Kong or only to “professional investors” in Hong Kong as defined in the Securities and Futures Ordinance and any rules made thereunder.
Singapore
This prospectus has not been registered as a prospectus with the Monetary Authority of Singapore. Accordingly, this prospectus and any other document or material in connection with the offer or sale, or invitation for subscription or purchase, of the shares may not be circulated or distributed, nor may the shares be offered or sold, or be made the subject of an invitation for subscription or purchase, whether directly or indirectly, to persons in Singapore other than (i) to an institutional investor (as defined under Section 4A of the Securities and Futures Act, Chapter 289 of Singapore (the “SFA”)) under Section 274 of the SFA, (ii) to a relevant person (as defined in Section 275(2) of the SFA) pursuant to Section 275(1) of the SFA, or any person
245
Table of Contents
pursuant to Section 275(1A) of the SFA, and in accordance with the conditions specified in Section 275 of the SFA or (iii) otherwise pursuant to, and in accordance with the conditions of, any other applicable provision of the SFA, in each case subject to conditions set forth in the SFA.
Where the shares are subscribed or purchased under Section 275 of the SFA by a relevant person which is a corporation (which is not an accredited investor (as defined in Section 4A of the SFA)) the sole business of which is to hold investments and the entire share capital of which is owned by one or more individuals, each of whom is an accredited investor, the securities (as defined in Section 239(1) of the SFA) of that corporation shall not be transferable for six months after that corporation has acquired the shares under Section 275 of the SFA except: (1) to an institutional investor under Section 274 of the SFA or to a relevant person (as defined in Section 275(2) of the SFA), (2) where such transfer arises from an offer in that corporation’s securities pursuant to Section 275(1A) of the SFA, (3) where no consideration is or will be given for the transfer, (4) where the transfer is by operation of law, (5) as specified in Section 276(7) of the SFA, or (6) as specified in Regulation 32 of the Securities and Futures (Offers of Investments) (Shares and Debentures) Regulations 2005 of Singapore (“Regulation 32”)
Where the shares are subscribed or purchased under Section 275 of the SFA by a relevant person which is a trust (where the trustee is not an accredited investor (as defined in Section 4A of the SFA)) whose sole purpose is to hold investments and each beneficiary of the trust is an accredited investor, the beneficiaries’ rights and interest (howsoever described) in that trust shall not be transferable for six months after that trust has acquired the shares under Section 275 of the SFA except: (1) to an institutional investor under Section 274 of the SFA or to a relevant person (as defined in Section 275(2) of the SFA), (2) where such transfer arises from an offer that is made on terms that such rights or interest are acquired at a consideration of not less than S$200,000 (or its equivalent in a foreign currency) for each transaction (whether such amount is to be paid for in cash or by exchange of securities or other assets), (3) where no consideration is or will be given for the transfer, (4) where the transfer is by operation of law, (5) as specified in Section 276(7) of the SFA, or (6) as specified in Regulation 32.
Japan
The shares have not been and will not be registered under the Financial Instruments and Exchange Act of Japan (Act No. 25 of 1948, as amended), or the FIEA. The shares may not be offered or sold, directly or indirectly, in Japan or to or for the benefit of any resident of Japan (including any person resident in Japan or any corporation or other entity organized under the laws of Japan) or to others for reoffering or resale, directly or indirectly, in Japan or to or for the benefit of any resident of Japan, except pursuant to an exemption from the registration requirements of the FIEA and otherwise in compliance with any relevant laws and regulations of Japan.
Switzerland
The shares may not be publicly offered in Switzerland and will not be listed on the SIX Swiss Exchange (“SIX”) or on any other stock exchange or regulated trading facility in Switzerland. This document does not constitute a prospectus within the meaning of, and has been prepared without regard to the disclosure standards for issuance prospectuses under art. 652a or art. 1156 of the Swiss Code of Obligations or the disclosure standards for listing prospectuses under art. 27 ff. of the SIX Listing Rules or the listing rules of any other stock exchange or regulated trading facility in Switzerland. Neither this document nor any other offering or marketing material relating to the shares or the offering may be publicly distributed or otherwise made publicly available in Switzerland.
Neither this document nor any other offering or marketing material relating to the offering, the Company, the shares have been or will be filed with or approved by any Swiss regulatory authority. In particular, this document will not be filed with, and the offer of shares will not be supervised by, the Swiss Financial Market
246
Table of Contents
Supervisory Authority, and the offer of shares has not been and will not be authorized under the Swiss Federal Act on Collective Investment Schemes (“CISA”). The investor protection afforded to acquirers of interests in collective investment schemes under the CISA does not extend to acquirers of shares.
United Arab Emirates
The shares have not been, and are not being, publicly offered, sold, promoted or advertised in the United Arab Emirates (including the Dubai International Financial Centre) other than in compliance with the laws of the United Arab Emirates (and the Dubai International Financial Centre) governing the issue, offering and sale of securities. Further, this prospectus does not constitute a public offer of securities in the United Arab Emirates (including the Dubai International Financial Centre) and is not intended to be a public offer. This prospectus has not been approved by or filed with the Central Bank of the United Arab Emirates, the Securities and Commodities Authority or the Dubai Financial Services Authority.
Australia
This prospectus:
| • | does not constitute a product disclosure document or a prospectus under Chapter 6D.2 of the Corporations Act 2001 (Cth) (the “Corporations Act”); |
| • | has not been, and will not be, lodged with the Australian Securities and Investments Commission (“ASIC”), as a disclosure document for the purposes of the Corporations Act and does not purport to include the information required of a disclosure document under Chapter 6D.2 of the Corporations Act; |
| • | does not constitute or involve a recommendation to acquire, an offer or invitation for issue or sale, an offer or invitation to arrange the issue or sale, or an issue or sale, of interests to a “retail client” (as defined in section 761G of the Corporations Act and applicable regulations) in Australia; and |
| • | may only be provided in Australia to select investors who are able to demonstrate that they fall within one or more of the categories of investors, or Exempt Investors, available under section 708 of the Corporations Act. |
The shares may not be directly or indirectly offered for subscription or purchased or sold, and no invitations to subscribe for or buy the shares may be issued, and no draft or definitive offering memorandum, advertisement or other offering material relating to any shares may be distributed in Australia, except where disclosure to investors is not required under Chapter 6D of the Corporations Act or is otherwise in compliance with all applicable Australian laws and regulations. By submitting an application for the shares, you represent and warrant to us that you are an Exempt Investor.
As any offer of shares under this document will be made without disclosure in Australia under Chapter 6D.2 of the Corporations Act, the offer of those securities for resale in Australia within 12 months may, under section 707 of the Corporations Act, require disclosure to investors under Chapter 6D.2 if none of the exemptions in section 708 applies to that resale. By applying for the shares you undertake to us that you will not, for a period of 12 months from the date of issue of the shares, offer, transfer, assign or otherwise alienate those securities to investors in Australia except in circumstances where disclosure to investors is not required under Chapter 6D.2 of the Corporations Act or where a compliant disclosure document is prepared and lodged with ASIC.
Bermuda
Shares may be offered or sold in Bermuda only in compliance with the provisions of the Investment Business Act of 2003 of Bermuda which regulates the sale of securities in Bermuda. Additionally, non-Bermudian persons (including companies) may not carry on or engage in any trade or business in Bermuda unless such persons are permitted to do so under applicable Bermuda legislation.
247
Table of Contents
Saudi Arabia
This document may not be distributed in the Kingdom of Saudi Arabia except to such persons as are permitted under the Offers of Securities Regulations as issued by the board of the Saudi Arabian Capital Market Authority (“CMA”) pursuant to resolution number 2-11-2004 dated 4 October 2004 as amended by resolution number 1-28-2008, as amended (the “CMA Regulations”). The CMA does not make any representation as to the accuracy or completeness of this document and expressly disclaims any liability whatsoever for any loss arising from, or incurred in reliance upon, any part of this document. Prospective purchasers of the securities offered hereby should conduct their own due diligence on the accuracy of the information relating to the securities. If you do not understand the contents of this document, you should consult an authorised financial adviser.
British Virgin Islands
The shares are not being, and may not be offered to the public or to any person in the British Virgin Islands for purchase or subscription by or on behalf of the Company. The shares may be offered to companies incorporated under the BVI Business Companies Act, 2004 (British Virgin Islands) (“BVI Companies”), but only where the offer will be made to, and received by, the relevant BVI Company entirely outside of the British Virgin Islands.
China
This prospectus does not constitute a public offer of shares, whether by sale or subscription, in the People’s Republic of China (the “PRC”). The shares are not being offered or sold directly or indirectly in the PRC to or for the benefit of, legal or natural persons of the PRC.
Further, no legal or natural persons of the PRC may directly or indirectly purchase any of the shares or any beneficial interest therein without obtaining all prior PRC’s governmental approvals that are required, whether statutorily or otherwise. Persons who come into possession of this document are required by the issuer and its representatives to observe these restrictions.
Korea
The shares have not been and will not be registered under the Financial Investments Services and Capital Markets Act of Korea and the decrees and regulations thereunder (the “FSCMA”), and the shares have been and will be offered in Korea as a private placement under the FSCMA. None of the shares may be offered, sold or delivered directly or indirectly, or offered or sold to any person for re-offering or resale, directly or indirectly, in Korea or to any resident of Korea except pursuant to the applicable laws and regulations of Korea, including the FSCMA and the Foreign Exchange Transaction Law of Korea and the decrees and regulations thereunder (the “FETL”). Furthermore, the purchaser of the shares shall comply with all applicable regulatory requirements (including but not limited to requirements under the FETL) in connection with the purchase of the shares. By the purchase of the shares, the relevant holder thereof will be deemed to represent and warrant that if it is in Korea or is a resident of Korea, it purchased the shares pursuant to the applicable laws and regulations of Korea.
Malaysia
No prospectus or other offering material or document in connection with the offer and sale of the shares has been or will be registered with the Securities Commission of Malaysia (“Commission”) for the Commission’s approval pursuant to the Capital Markets and Services Act 2007. Accordingly, this prospectus and any other document or material in connection with the offer or sale, or invitation for subscription or purchase, of the shares may not be circulated or distributed, nor may the shares be offered or sold, or be made the subject of an invitation for subscription or purchase, whether directly or indirectly, to persons in Malaysia other than (i) a closed end fund approved by the Commission; (ii) a holder of a Capital Markets Services Licence; (iii) a person who
248
Table of Contents
acquires the shares, as principal, if the offer is on terms that the shares may only be acquired at a consideration of not less than RM250,000 (or its equivalent in foreign currencies) for each transaction; (iv) an individual whose total net personal assets or total net joint assets with his or her spouse exceeds RM3 million (or its equivalent in foreign currencies), excluding the value of the primary residence of the individual; (v) an individual who has a gross annual income exceeding RM300,000 (or its equivalent in foreign currencies) per annum in the preceding 12 months; (vi) an individual who, jointly with his or her spouse, has a gross annual income of RM400,000 (or its equivalent in foreign currencies), per annum in the preceding 12 months; (vii) a corporation with total net assets exceeding RM10 million (or its equivalent in a foreign currencies) based on the last audited accounts; (viii) a partnership with total net assets exceeding RM10 million (or its equivalent in foreign currencies); (ix) a bank licensee or insurance licensee as defined in the Labuan Financial Services and Securities Act 2010; (x) an Islamic bank licensee or takaful licensee as defined in the Labuan Financial Services and Securities Act 2010; and (xi) any other person as may be specified by the Commission; provided that, in the each of the preceding categories (i) to (xi), the distribution of the shares is made by a holder of a Capital Markets Services Licence who carries on the business of dealing in securities. The distribution in Malaysia of this prospectus is subject to Malaysian laws. This prospectus does not constitute and may not be used for the purpose of public offering or an issue, offer for subscription or purchase, invitation to subscribe for or purchase any securities requiring the registration of a prospectus with the Commission under the Capital Markets and Services Act 2007.
Taiwan
The shares have not been and will not be registered with the Financial Supervisory Commission of Taiwan pursuant to relevant securities laws and regulations and may not be sold, issued or offered within Taiwan through a public offering or in circumstances which constitutes an offer within the meaning of the Securities and Exchange Act of Taiwan that requires a registration or approval of the Financial Supervisory Commission of Taiwan. No person or entity in Taiwan has been authorised to offer, sell, give advice regarding or otherwise intermediate the offering and sale of the shares in Taiwan.
South Africa
Due to restrictions under the securities laws of South Africa, the shares are not offered, and the offer shall not be transferred, sold, renounced or delivered, in South Africa or to a person with an address in South Africa, unless one or other of the following exemptions applies:
| (i) | the offer, transfer, sale, renunciation or delivery is to: |
| (a) | persons whose ordinary business is to deal in securities, as principal or agent; |
| (b) | the South African Public Investment Corporation; |
| (c) | persons or entities regulated by the Reserve Bank of South Africa; |
| (d) | authorised financial service providers under South African law; |
| (e) | financial institutions recognised as such under South African law; |
| (f) | a wholly-owned subsidiary of any person or entity contemplated in (c), (d) or (e), acting as agent in the capacity of an authorised portfolio manager for a pension fund or collective investment scheme (in each case duly registered as such under South African law); or |
| (g) | any combination of the person in (a) to (f); or |
| (ii) | the total contemplated acquisition cost of the securities, for any single addressee acting as principal is equal to or greater than ZAR1,000,000. |
No “offer to the public” (as such term is defined in the South African Companies Act, No. 71 of 2008 (as amended or re-enacted) (the “South African Companies Act”)) in South Africa is being made in connection with
249
Table of Contents
the issue of the shares. Accordingly, this document does not, nor is it intended to, constitute a “registered prospectus” (as that term is defined in the South African Companies Act) prepared and registered under the South African Companies Act and has not been approved by, and/or filed with, the South African Companies and Intellectual Property Commission or any other regulatory authority in South Africa. Any issue or offering of the shares in South Africa constitutes an offer of the shares in South Africa for subscription or sale in South Africa only to persons who fall within the exemption from “offers to the public” set out in section 96(1)(a) of the South African Companies Act. Accordingly, this document must not be acted on or relied on by persons in South Africa who do not fall within section 96(1)(a) of the South African Companies Act (such persons being referred to as “SA Relevant Persons”). Any investment or investment activity to which this document relates is available in South Africa only to SA Relevant Persons and will be engaged in South Africa only with SA Relevant Persons.
250
Table of Contents
Validity of Class A Common Stock
The validity of the securities offered in this offering and other certain legal matters in connection with this offering will be passed upon for us by Wachtell, Lipton, Rosen & Katz, New York, New York. The validity of the securities offered hereby will be passed upon for the underwriters by Sullivan & Cromwell LLP, New York, New York.
251
Table of Contents
The consolidated financial statements of Cadence Bancorporation at December 31, 2016, and for the year then ended, appearing in this prospectus and Registration Statement have been audited by Ernst & Young LLP, independent registered public accounting firm, and at December 31, 2015, and for each of the two years in the period ended December 31, 2015, by KPMG LLP, independent registered public accounting firm, as set forth in their respective reports thereon appearing elsewhere herein, and are included in reliance upon such reports given on the authority of such firms as experts in accounting and auditing.
Where You Can Find More Information
This prospectus, which constitutes a part of a Registration Statement on Form S-1 filed with the SEC, does not contain all of the information set forth in the Registration Statement and the related exhibits and schedules. Some items are omitted in accordance with the rules and regulations of the SEC. Accordingly, we refer you to the complete Registration Statement, including its exhibits and schedules, for further information about us and the shares of Class A common stock to be sold in this offering. Statements or summaries in this prospectus as to the contents of any contract or other document referred to in this prospectus are not necessarily complete and, where that contract or document is filed as an exhibit to the Registration Statement, each statement or summary is qualified in all respects by reference to the exhibit to which the reference relates. You may read and copy the Registration Statement, including the exhibits and schedules to the Registration Statement, at the SEC’s Public Reference Room at 100 F Street, N.E., Room 1580, Washington, D.C. 20549. Information about the operation of the Public Reference Room may be obtained by calling the SEC at 1-800-SEC-0330. Our filings with the SEC, including the Registration Statement, are also available to you for free on the SEC’s Internet website at www.sec.gov.
We are subject to the informational and reporting requirements of the Exchange Act and, in accordance with those requirements, we are required to file reports and proxy and information statements with the SEC. You may inspect and copy these reports and proxy and information statements and other information at the addresses set forth above. We intend to furnish to our stockholders our annual reports containing our audited consolidated financial statements certified by an independent public accounting firm.
We also maintain an Internet website at www.cadencebancorporation.com. Information on or accessible through our website is not part of this prospectus.
252
Table of Contents
Condensed Consolidated Financial Statements (Unaudited) as of September 30, 2017 and 2016
Consolidated Financial Statements as of December 31, 2016 and 2015
F-1
Table of Contents
PART I: FINANCIAL INFORMATION
| ITEM 1. | FINANCIAL STATEMENTS |
CADENCE BANCORPORATION AND SUBSIDIARIES
CONDENSED CONSOLIDATED BALANCE SHEETS
| (In thousands, except share data) | September 30, 2017 |
December 31, 2016 |
||||||
| (unaudited) | ||||||||
| ASSETS |
||||||||
| Cash and due from banks |
$ | 68,248 | $ | 48,017 | ||||
| Interest-bearing deposits with banks |
515,556 | 199,747 | ||||||
| Federal funds sold |
5,578 | 1,161 | ||||||
|
|
|
|
|
|||||
| Total cash and cash equivalents |
589,382 | 248,925 | ||||||
| Securities available-for-sale |
1,198,032 | 1,139,347 | ||||||
| Securities held-to-maturity (estimated fair value of $451 and $463 at September 30, 2017 and December 31, 2016, respectively) |
425 | 425 | ||||||
| Other securities—FRB and FHLB stock |
54,246 | 41,493 | ||||||
| Loans held for sale |
21,835 | 17,822 | ||||||
| Loans |
8,028,938 | 7,432,711 | ||||||
| Less: allowance for credit losses |
(94,765 | ) | (82,268 | ) | ||||
|
|
|
|
|
|||||
| Net loans |
7,934,173 | 7,350,443 | ||||||
| Interest receivable |
42,030 | 39,889 | ||||||
| Premises and equipment, net |
64,425 | 66,676 | ||||||
| Other real estate owned |
18,836 | 18,875 | ||||||
| Cash surrender value of life insurance |
107,393 | 105,834 | ||||||
| Net deferred tax asset |
61,395 | 83,662 | ||||||
| Goodwill |
317,817 | 317,817 | ||||||
| Other intangible assets, net |
11,307 | 14,874 | ||||||
| Other assets |
80,965 | 84,806 | ||||||
|
|
|
|
|
|||||
| Total Assets |
$ | 10,502,261 | $ | 9,530,888 | ||||
|
|
|
|
|
|||||
| LIABILITIES AND SHAREHOLDERS’ EQUITY |
||||||||
| Liabilities: |
||||||||
| Noninterest-bearing deposits |
$ | 2,071,594 | $ | 1,840,955 | ||||
| Interest-bearing deposits |
6,429,508 | 6,175,794 | ||||||
|
|
|
|
|
|||||
| Total deposits |
8,501,102 | 8,016,749 | ||||||
| Securities sold under agreements to repurchase |
3,146 | 3,494 | ||||||
| Federal Home Loan Bank advances |
250,000 | — | ||||||
| Senior debt |
184,557 | 193,788 | ||||||
| Subordinated debt |
98,627 | 98,441 | ||||||
| Junior subordinated debentures |
36,353 | 35,989 | ||||||
| Other liabilities |
87,628 | 101,929 | ||||||
|
|
|
|
|
|||||
| Total liabilities |
9,161,413 | 8,450,390 | ||||||
| Shareholders’ Equity: |
||||||||
| Common Stock $0.01 par value, authorized 300,000,000 shares; 83,625,000 and 75,000,000 shares issued and outstanding at September 30, 2017 and December 31, 2016, respectively |
836 | 750 | ||||||
| Additional paid-in capital |
1,036,585 | 879,665 | ||||||
| Retained earnings |
320,276 | 232,614 | ||||||
| Accumulated other comprehensive loss (“OCI”) |
(16,849 | ) | (32,531 | ) | ||||
|
|
|
|
|
|||||
| Total shareholders’ equity |
1,340,848 | 1,080,498 | ||||||
|
|
|
|
|
|||||
| Total Liabilities and Shareholders’ Equity |
$ | 10,502,261 | $ | 9,530,888 | ||||
|
|
|
|
|
|||||
See accompanying notes to the unaudited condensed consolidated financial statements.
F-2
Table of Contents
CADENCE BANCORPORATION AND SUBSIDIARIES
UNAUDITED CONDENSED CONSOLIDATED STATEMENTS OF INCOME
| Three Months Ended September 30, |
Nine Months Ended September 30, |
|||||||||||||||
| (In thousands, except per share data) | 2017 | 2016 | 2017 | 2016 | ||||||||||||
| INTEREST INCOME |
||||||||||||||||
| Interest and fees on loans |
$ | 90,161 | $ | 77,067 | $ | 261,400 | $ | 226,503 | ||||||||
| Interest and dividends on securities: |
||||||||||||||||
| Taxable |
4,610 | 3,866 | 13,089 | 12,420 | ||||||||||||
| Tax-exempt |
3,280 | 2,386 | 10,079 | 5,623 | ||||||||||||
| Other interest income |
1,452 | 1,335 | 3,929 | 3,636 | ||||||||||||
|
|
|
|
|
|
|
|
|
|||||||||
| Total interest income |
99,503 | 84,654 | 288,497 | 248,182 | ||||||||||||
| INTEREST EXPENSE |
||||||||||||||||
| Interest on time deposits |
5,665 | 4,676 | 15,084 | 12,867 | ||||||||||||
| Interest on other deposits |
7,413 | 4,604 | 19,530 | 13,170 | ||||||||||||
| Interest on borrowed funds |
5,262 | 4,948 | 15,578 | 15,204 | ||||||||||||
|
|
|
|
|
|
|
|
|
|||||||||
| Total interest expense |
18,340 | 14,228 | 50,192 | 41,241 | ||||||||||||
|
|
|
|
|
|
|
|
|
|||||||||
| Net interest income |
81,163 | 70,426 | 238,305 | 206,941 | ||||||||||||
| Provision for credit losses |
1,723 | 29,627 | 14,210 | 54,570 | ||||||||||||
|
|
|
|
|
|
|
|
|
|||||||||
| Net interest income after provision for credit losses |
79,440 | 40,799 | 224,095 | 152,371 | ||||||||||||
| NONINTEREST INCOME |
||||||||||||||||
| Service charges on deposit accounts |
3,920 | 3,555 | 11,519 | 10,179 | ||||||||||||
| Other service fees |
1,174 | 797 | 3,217 | 2,263 | ||||||||||||
| Credit related fees |
3,306 | 2,690 | 8,794 | 7,870 | ||||||||||||
| Trust services revenue |
4,613 | 3,959 | 14,428 | 12,000 | ||||||||||||
| Mortgage banking income |
965 | 1,459 | 3,044 | 3,644 | ||||||||||||
| Investment advisory revenue |
5,283 | 4,733 | 15,260 | 13,990 | ||||||||||||
| Securities gains (losses), net |
1 | 1,386 | (162 | ) | 2,469 | |||||||||||
| Other income |
7,862 | 4,212 | 18,118 | 13,628 | ||||||||||||
|
|
|
|
|
|
|
|
|
|||||||||
| Total noninterest income |
27,124 | 22,791 | 74,218 | 66,043 | ||||||||||||
| NONINTEREST EXPENSE |
||||||||||||||||
| Salaries and employee benefits |
35,007 | 31,086 | 103,956 | 96,929 | ||||||||||||
| Premises and equipment |
7,419 | 7,130 | 21,292 | 20,507 | ||||||||||||
| Intangible asset amortization |
1,136 | 1,607 | 3,567 | 4,977 | ||||||||||||
| Other expense |
12,968 | 15,053 | 38,170 | 42,373 | ||||||||||||
|
|
|
|
|
|
|
|
|
|||||||||
| Total noninterest expense |
56,530 | 54,876 | 166,985 | 164,786 | ||||||||||||
|
|
|
|
|
|
|
|
|
|||||||||
| Income before income taxes |
50,034 | 8,714 | 131,328 | 53,628 | ||||||||||||
| Income tax expense |
17,457 | 2,107 | 43,666 | 16,839 | ||||||||||||
|
|
|
|
|
|
|
|
|
|||||||||
| Net income |
$ | 32,577 | $ | 6,607 | $ | 87,662 | $ | 36,789 | ||||||||
|
|
|
|
|
|
|
|
|
|||||||||
| Weighted average common shares outstanding (Basic) |
83,625,000 | 75,000,000 | 80,212,912 | 75,000,000 | ||||||||||||
| Weighted average common shares outstanding (Diluted) |
83,955,685 | 75,258,375 | 80,558,337 | 75,258,375 | ||||||||||||
| Earnings per common share (Basic) |
$ | 0.39 | $ | 0.09 | $ | 1.09 | $ | 0.49 | ||||||||
|
|
|
|
|
|
|
|
|
|||||||||
| Earnings per common share (Diluted) |
$ | 0.39 | $ | 0.09 | $ | 1.09 | $ | 0.49 | ||||||||
|
|
|
|
|
|
|
|
|
|||||||||
See accompanying notes to the unaudited condensed consolidated financial statements.
F-3
Table of Contents
CADENCE BANCORPORATION AND SUBSIDIARIES
UNAUDITED CONDENSED CONSOLIDATED STATEMENTS OF COMPREHENSIVE INCOME
| Three Months Ended September 30, |
Nine Months Ended September 30, |
|||||||||||||||
| (In thousands) | 2017 | 2016 | 2017 | 2016 | ||||||||||||
| Net income |
$ | 32,577 | $ | 6,607 | $ | 87,662 | $ | 36,789 | ||||||||
| Other comprehensive income (loss), net of tax: |
||||||||||||||||
| Net unrealized gains (losses) on securities available-for-sale: |
||||||||||||||||
| Unrealized gains (losses) arising during the period (net of $(2,153), $3,352, $(8,844), and $(5,081) tax effect, respectively) |
3,745 | (5,741 | ) | 15,308 | 8,704 | |||||||||||
| Reclassification adjustments for (gains) losses realized in net income (net of $0, $511, $(60), and $910 tax effect, respectively) |
(1 | ) | (875 | ) | 102 | (1,559 | ) | |||||||||
|
|
|
|
|
|
|
|
|
|||||||||
| Net unrealized gains (losses) on securities available-for-sale |
3,744 | (6,616 | ) | 15,410 | 7,145 | |||||||||||
| Net unrealized gains (losses) on derivative instruments designated as cash flow hedges: |
||||||||||||||||
| Unrealized gains (losses) arising during the period (net of $(202), $1,679, $(1,427), and $(10,196) tax effect, respectively) |
344 | (2,877 | ) | 2,445 | 17,465 | |||||||||||
| Reclassification adjustments for gains realized in net income (net of $151, $1,086, $1,269, and $3,070 tax effect, respectively) |
(258 | ) | (1,859 | ) | (2,173 | ) | (5,258 | ) | ||||||||
|
|
|
|
|
|
|
|
|
|||||||||
| Net change in unrealized gains (losses) on derivative instruments |
86 | (4,736 | ) | 272 | 12,207 | |||||||||||
|
|
|
|
|
|
|
|
|
|||||||||
| Other comprehensive income (loss), net of tax |
3,830 | (11,352 | ) | 15,682 | 19,352 | |||||||||||
|
|
|
|
|
|
|
|
|
|||||||||
| Comprehensive income (loss) |
$ | 36,407 | $ | (4,745 | ) | $ | 103,344 | $ | 56,141 | |||||||
|
|
|
|
|
|
|
|
|
|||||||||
See accompanying notes to the unaudited condensed consolidated financial statements.
F-4
Table of Contents
CADENCE BANCORPORATION AND SUBSIDIARIES
UNAUDITED CONDENSED STATEMENTS OF CHANGES IN SHAREHOLDERS’ EQUITY
| (In thousands) | Common Stock |
Additional Paid-in Capital |
Retained Earnings |
Accumulated OCI |
Total Shareholders’ Equity |
|||||||||||||||
| Balance, December 31, 2016 |
$ | 750 | $ | 879,665 | $ | 232,614 | $ | (32,531 | ) | $ | 1,080,498 | |||||||||
| Equity-based compensation cost |
— | 1,425 | — | — | 1,425 | |||||||||||||||
| Net income |
— | — | 87,662 | — | 87,662 | |||||||||||||||
| Other comprehensive income |
— | — | — | 15,682 | 15,682 | |||||||||||||||
| Issuance of 8,625,000 common shares, net of issuance costs |
86 | 155,495 | — | — | 155,581 | |||||||||||||||
|
|
|
|
|
|
|
|
|
|
|
|||||||||||
| Balance, September 30, 2017 |
$ | 836 | $ | 1,036,585 | $ | 320,276 | $ | (16,849 | ) | $ | 1,340,848 | |||||||||
|
|
|
|
|
|
|
|
|
|
|
|||||||||||
See accompanying notes to the unaudited condensed consolidated financial statements.
F-5
Table of Contents
CADENCE BANCORPORATION AND SUBSIDIARIES
UNAUDITED CONDENSED CONSOLIDATED STATEMENTS OF CASH FLOWS
| Nine Months Ended September 30, |
||||||||
| (In thousands) | 2017 | 2016 | ||||||
| NET CASH FLOWS PROVIDED BY OPERATING ACTIVITIES |
$ | 149,841 | $ | 71,661 | ||||
|
|
|
|
|
|||||
| CASH FLOWS FROM INVESTING ACTIVITIES |
||||||||
| Purchase of securities available-for-sale |
(278,339 | ) | (743,203 | ) | ||||
| Proceeds from sales of securities available-for-sale |
152,256 | 259,250 | ||||||
| Proceeds from maturities, calls and paydowns of securities available-for-sale |
72,137 | 103,566 | ||||||
| Proceeds from sale of commercial loans held for sale |
— | 328,840 | ||||||
| Increase in loans, net |
(613,993 | ) | (654,485 | ) | ||||
| Purchase of premises and equipment |
(5,734 | ) | (3,700 | ) | ||||
| Proceeds from disposition of foreclosed property |
6,721 | 24,872 | ||||||
| Other, net |
(22,430 | ) | 14,890 | |||||
|
|
|
|
|
|||||
| Net cash used in investing activities |
(689,382 | ) | (669,970 | ) | ||||
| CASH FLOWS FROM FINANCING ACTIVITIES |
||||||||
| Increase in deposits, net |
484,365 | 930,011 | ||||||
| Net change in securities sold under agreements to repurchase |
(348 | ) | (909 | ) | ||||
| Net change in short-term FHLB advances |
250,000 | (370,000 | ) | |||||
| Purchase of senior debt |
(9,600 | ) | (78 | ) | ||||
| Proceeds from issuance of common stock |
155,581 | — | ||||||
|
|
|
|
|
|||||
| Net cash provided by financing activities |
879,998 | 559,024 | ||||||
|
|
|
|
|
|||||
| Net increase (decrease) in cash and cash equivalents |
340,457 | (39,285 | ) | |||||
| Cash and cash equivalents at beginning of period |
248,925 | 467,207 | ||||||
|
|
|
|
|
|||||
| Cash and cash equivalents at end of period |
$ | 589,382 | $ | 427,922 | ||||
|
|
|
|
|
|||||
See accompanying notes to the unaudited condensed consolidated financial statements.
F-6
Table of Contents
CADENCE BANCORPORATION AND SUBSIDIARIES
NOTES TO UNAUDITED CONDENSED CONSOLIDATED FINANCIAL STATEMENTS
Cadence Bancorporation (the “Company”) is a Delaware corporation and a bank holding company whose primary asset is its investment in its wholly owned subsidiary bank, Cadence Bank, N.A., a national banking association (the “Bank”).
Note 1—Summary of Accounting Policies
Basis of Presentation and Consolidation
The accompanying unaudited condensed consolidated financial statements for the Company have been prepared in accordance with instructions to the SEC Form 10-Q and Article 10 of Regulation S-X; therefore, they do not include all information and footnotes necessary for a fair presentation of financial position, results of operations, comprehensive income, and cash flows in conformity with accounting principles generally accepted in the United States of America (“GAAP”). All adjustments consisting of normally recurring accruals that, in the opinion of management, are necessary for a fair presentation of the consolidated financial position and results of operations for the periods covered by this report have been included. These interim financial statements should be read in conjunction with the audited consolidated financial statements and footnote disclosures for the Company previously filed with the SEC in the Company’s prospectus filed with the Securities and Exchange Commission on November 9, 2017 pursuant to Rule 424(b) of the Securities Act. Operating results for the period ended September 30, 2017 are not necessarily indicative of the results that may be expected for the year ending December 31, 2017.
The Company and its subsidiaries follow accounting principles generally accepted in the United States of America, including, where applicable, general practices within the banking industry. The consolidated financial statements include the accounts of the Company and its subsidiaries. Significant intercompany accounts and transactions have been eliminated in consolidation. The assessment of whether or not the Company has a controlling interest (i.e., the primary beneficiary) in a variable-interest entity (“VIE”) is performed on an on-going basis. All equity investments in non-consolidated VIEs are included in “other assets” in the Company’s consolidated balance sheets (Note 20).
Certain amounts reported in prior years have been reclassified to conform to the 2017 presentation. These reclassifications did not materially impact the Company’s consolidated balance sheets or consolidated statements of income.
Stock Split
On March 30, 2017, the Board of Directors approved a 75-for-one stock split of the Company’s common stock. The stock split occurred on April 7, 2017. The effect of the stock split on outstanding shares and earnings per share has been retroactively applied to all periods presented.
Nature of Operations
The Company’s subsidiaries include:
| • | Town & Country Insurance Agency, Inc., dba Cadence Insurance—full service insurance agency |
| • | The Bank |
The Bank operates under a national bank charter and is subject to regulation by the Office of the Comptroller of the Currency (OCC). The Bank provides lending services in Georgia and full banking services in five southern states: Alabama, Florida, Mississippi, Tennessee, and Texas.
F-7
Table of Contents
The Bank’s subsidiaries include:
| • | Linscomb & Williams Inc.—financial advisory firm; and |
| • | Cadence Investment Services, Inc.—provides investment and insurance products, |
The Company and the Bank also have certain other non-operating and immaterial subsidiaries.
Use of Estimates
The preparation of financial statements in conformity with GAAP requires management to make estimates and assumptions that affect the reported amounts of assets and liabilities and disclosure of contingent assets and liabilities at the date of the financial statements and the reported amounts of revenues and expenses during the reporting period. Actual results could differ from those estimates. Material estimates that are susceptible to significant change in the near term are the allowance for credit losses, valuation of and accounting for acquired credit impaired loans, valuation of goodwill, intangible assets and deferred income taxes.
Recently Adopted Accounting Pronouncements
In March 2016, the FASB issued Accounting Standards Update (“ASU”) 2016-09, “Compensation—Stock Compensation (Topic 718): Improvements to Employee Share-Based Payment Accounting.” Under ASU 2016-09, all excess tax benefits and tax deficiencies related to share-based payment awards should be recognized as income tax expense or benefit in the income statement during the period in which they occur. Previously, such amounts were recorded in the pool of excess tax benefits included in additional paid-in capital, if such pool was available. Because excess tax benefits are no longer recognized in additional paid-in capital, the assumed proceeds from applying the treasury stock method when computing earnings per share should exclude the amount of excess tax benefits that would have previously been recognized in additional paid-in capital. Additionally, excess tax benefits should be classified along with other income tax cash flows as an operating activity rather than a financing activity, as was previously the case. ASU 2016-09 also provides that an entity can make an entity-wide accounting policy election to either estimate the number of awards that are expected to vest (current GAAP) or account for forfeitures when they occur. ASU 2016-09 changes the threshold to qualify for equity classification (rather than as a liability) to permit withholding up to the maximum statutory tax rates (rather than the minimum as was previously the case) in the applicable jurisdictions. The adoption at January 1, 2017 of ASU 2016-09 did not have a significant impact on our financial position, results of operations or cash flows.
Pending Accounting Pronouncements
In May 2014, the FASB issued ASU No. 2014-09, “Revenue from Contracts with Customers (Topic 606),” (ASU 2014-09), which is intended to improve and converge the financial reporting requirements for revenue contracts with customers. Previous accounting guidance comprised broad revenue recognition concepts along with numerous industry-specific requirements. The new guidance establishes a five-step model which entities must follow to recognize revenue and removes inconsistencies and weaknesses in existing guidance. The banking industry does not expect significant changes because major sources of revenue are from financial instruments that have been excluded from the scope of the new standard (including loans, derivatives, debt and equity securities, etc.). ASU 2014-09 is effective for annual and interim periods beginning after December 15, 2017, and must be retrospectively applied. Entities will have the option of presenting prior periods as impacted by the new guidance or presenting the cumulative effect of initial application along with supplementary disclosures. We expect that ASU 2014-09 will require us to change how we recognize certain recurring revenue streams within insurance commissions and fees and other categories of noninterest income; however, we do not expect these changes to have a significant impact on our consolidated financial statements. We expect to adopt the standard in the first quarter of 2018 with a cumulative effect adjustment to opening retained earnings, if such adjustment is deemed to be significant.
F-8
Table of Contents
In January 2016, the FASB issued ASU 2016-01, “Financial Instruments—Overall (Subtopic 825-10): Recognition and Measurement of Financial Assets and Financial Liabilities”. ASU 2016-1, among other things, (i) requires equity investments, with certain exceptions, to be measured at fair value with changes in fair value recognized in net income, (ii) simplifies the impairment assessment of equity investments without readily determinable fair values by requiring a qualitative assessment to identify impairment, (iii) eliminates the requirement for public business entities to disclose the methods and significant assumptions used to estimate the fair value that is required to be disclosed for financial instruments measured at amortized cost on the balance sheets, (iv) requires public business entities to use the exit price notion when measuring the fair value of financial instruments for disclosure purposes, (v) requires an entity to present separately in other comprehensive income the portion of the total change in the fair value of a liability resulting from a change in the instrument-specific credit risk when the entity has elected to measure the liability at fair value in accordance with the fair value option for financial instruments, (vi) requires separate presentation of financial assets and financial liabilities by measurement category and form of financial asset on the balance sheets or the accompanying notes to the financial statements and (viii) clarifies that an entity should evaluate the need for a valuation allowance on a deferred tax asset related to available-for-sale. ASU 2016-01 will be effective for fiscal years and interim periods beginning after December 15, 2017. The Company does not expect this guidance will have a material effect on the Company’s consolidated balance sheets and consolidated statements of income.
In February 2016, the FASB issued ASU 2016-02, “Leases”. This ASU requires lessees to recognize lease assets and lease liabilities generated by contracts longer than a year on their balance sheets. The ASU also requires companies to disclose in the footnotes to their financial statements information about the amount, timing, and uncertainty for the payments they make for the lease agreements. ASU 2016-02 will be effective for annual periods and interim periods within those annual periods beginning after December 31, 2018. The Company is evaluating the effect of adopting this new accounting guidance.
In June 2016, the FASB has issued ASU No. 2016-13, “Financial Instruments – Credit Losses (Topic 326): Measurement of Credit Losses on Financial Instruments”. The guidance is intended to improve financial reporting by requiring timelier recording of credit losses on loans and other financial instruments. The guidance will replace the current incurred loss accounting model with an expected loss approach and requires the measurement of all expected credit losses for financial assets held at the reporting date based on historical experience, current conditions, and reasonable and supportable forecasts. The guidance requires enhanced disclosures to help investors and other financial statement users better understand significant estimates and judgments used in estimating credit losses, as well as the credit quality and underwriting standards of an organization’s portfolio. The ASU is effective for fiscal years, and interim periods within those fiscal years, beginning after December 15, 2019. The Company is evaluating the effect of adopting this new accounting guidance.
In August 2016, the FASB issued ASU No. 2016-15, “Statement of Cash Flows (Topic 230): Classification of Certain Cash Receipts and Cash Payments”, in order to reduce current diversity in practice in how certain cash receipts and cash payments are presented and classified in the statement of cash flows. ASU 2016-15 will be effective for fiscal years beginning after December 15, 2017, including interim periods within those fiscal years. Early adoption is permitted, including adoption in an interim period. The amendments should be applied using a retrospective transition method to each period presented. The Company is currently evaluating the impact of the ASU on the Company’s consolidated statement of cash flows. The Company is not expecting to early adopt the ASU.
In January 2017, the FASB issued ASU No. 2017-01, “Business Combinations (Topic 805): Clarifying the Definition of a Business”, which introduces amendments that are intended to clarify the definition of a business to assist companies and other reporting organizations with evaluating whether transactions should be accounted for as acquisitions (or disposals) of assets or businesses. The amendments are intended to narrow the current interpretation of a business. ASU No. 2017-01 will be effective for annual reporting periods beginning after December 15, 2017, including interim reporting periods within those periods. The amendments will be applied prospectively on or after the effective date. Early application of the amendments in this ASU is allowed for transactions, including when a subsidiary or group of assets is deconsolidated/derecognized, in which the
F-9
Table of Contents
acquisition date occurs before the issuance date or effective date of the amendments, only when the transaction has not been reported in financial statements that have been issued or made available for issuance. The Company is currently evaluating the effect of the ASU.
In January 2017, the FASB issued ASU No. 2017-04, “Intangibles-Goodwill and Other (Topic 350): Simplifying the Test for Goodwill Impairment”, which simplifies how an entity is required to test goodwill for impairment by eliminating Step 2 from the goodwill impairment test. Therefore, any carrying amount which exceeds the reporting unit’s fair value (up to the amount of goodwill recorded) will be recognized as an impairment loss. ASU No. 2017-04 will be effective for annual reporting periods beginning after December 15, 2019, including interim reporting periods within those periods. The amendments will be applied prospectively on or after the effective date. Early adoption is permitted for interim or annual goodwill impairment tests performed on testing dates after January 1, 2017. Based on recent goodwill impairments tests, which did not require the application of Step 2, the Company does not expect the adoption of this ASU to have an immediate impact.
In March 2017, the FASB issued ASU No. 2017-08, “Receivables-Nonrefundable Fees and Other Costs (Subtopic 310-20): Premium Amortization on Purchased Callable Debt Securities”, which will shorten the amortization period for callable debt securities held at a premium to the earliest call date instead of the maturity date. The amendments do not require an accounting change for securities held at a discount, which will continue to be amortized to the maturity date. ASU No. 2017-08 will be effective for annual reporting periods beginning after December 15, 2018, including interim reporting periods within those periods. The amendments should be applied using a modified-retrospective transition method as of the beginning of the period of adoption. Early adoption is permitted, including adoption in an interim period. The Company is currently assessing this pronouncement and it is not expected to have a material impact on the Company’s financial condition or results of operations.
In August 2017, the FASB issued ASU 2017-12, “Derivatives and Hedging (Topic 815)—Targeted Improvements to Accounting for Hedging Activities.” ASU 2017-12 amends the hedge accounting recognition and presentation requirements in ASC 815 to improve the transparency and understandability of information conveyed to financial statement users about an entity’s risk management activities to better align the entity’s financial reporting for hedging relationships with those risk management activities and to reduce the complexity of and simplify the application of hedge accounting. ASU 2017-12 will be effective for periods beginning after December 15, 2018 and is not expected to have a significant impact on the Company’s financial condition or results of operations.
F-10
Table of Contents
Note 2—Securities
A summary of amortized cost and estimated fair value of securities available-for-sale and securities held-to-maturity at September 30, 2017 and December 31, 2016 is as follows:
| (In thousands) | Amortized Cost |
Gross Unrealized Gains |
Gross Unrealized Losses |
Estimated Fair Value |
||||||||||||
| September 30, 2017 |
||||||||||||||||
| Securities available-for-sale: |
||||||||||||||||
| U.S. Treasury securities |
$ | 100,615 | $ | — | $ | 2,927 | $ | 97,688 | ||||||||
| Obligations of U.S. government agencies |
83,508 | 760 | 103 | 84,165 | ||||||||||||
| Mortgage-backed securities issued or guaranteed by U.S. agencies (MBS) |
||||||||||||||||
| Residential pass-through: |
||||||||||||||||
| Guaranteed by GNMA |
112,328 | 1,049 | 842 | 112,535 | ||||||||||||
| Issued by FNMA and FHLMC |
383,375 | 2,154 | 1,487 | 384,042 | ||||||||||||
| Other residential mortgage-backed securities |
41,095 | 234 | 761 | 40,568 | ||||||||||||
| Commercial mortgage-backed securities |
64,776 | — | 3,786 | 60,990 | ||||||||||||
|
|
|
|
|
|
|
|
|
|||||||||
| Total MBS |
601,574 | 3,437 | 6,876 | 598,135 | ||||||||||||
| Obligations of states and municipal subdivisions |
420,011 | 3,690 | 11,485 | 412,216 | ||||||||||||
| Other securities |
5,714 | 248 | 134 | 5,828 | ||||||||||||
|
|
|
|
|
|
|
|
|
|||||||||
| Total securities available-for-sale |
$ | 1,211,422 | $ | 8,135 | $ | 21,525 | $ | 1,198,032 | ||||||||
|
|
|
|
|
|
|
|
|
|||||||||
| Securities held-to-maturity: |
||||||||||||||||
| Obligations of states and municipal subdivisions |
$ | 425 | $ | 26 | $ | — | $ | 451 | ||||||||
|
|
|
|
|
|
|
|
|
|||||||||
| (In thousands) | Amortized Cost |
Gross Unrealized Gains |
Gross Unrealized Losses |
Estimated Fair Value |
||||||||||||
| December 31, 2016 |
||||||||||||||||
| Securities available-for-sale: |
||||||||||||||||
| U.S. Treasury securities |
$ | 100,736 | $ | — | $ | 3,951 | $ | 96,785 | ||||||||
| Obligations of U.S. government agencies |
97,340 | 508 | 320 | 97,528 | ||||||||||||
| Mortgage-backed securities issued or guaranteed by U.S. agencies (MBS) |
||||||||||||||||
| Residential pass-through: |
||||||||||||||||
| Guaranteed by GNMA |
152,918 | 1,401 | 1,166 | 153,153 | ||||||||||||
| Issued by FNMA and FHLMC |
267,035 | 1,499 | 3,206 | 265,328 | ||||||||||||
| Other residential mortgage-backed securities |
48,076 | 375 | 890 | 47,561 | ||||||||||||
| Commercial mortgage-backed securities |
66,720 | — | 4,107 | 62,613 | ||||||||||||
|
|
|
|
|
|
|
|
|
|||||||||
| Total MBS |
534,749 | 3,275 | 9,369 | 528,655 | ||||||||||||
| Obligations of states and municipal subdivisions |
438,655 | 870 | 28,713 | 410,812 | ||||||||||||
| Other securities |
5,580 | 149 | 162 | 5,567 | ||||||||||||
|
|
|
|
|
|
|
|
|
|||||||||
| Total securities available-for-sale |
$ | 1,177,060 | $ | 4,802 | $ | 42,515 | $ | 1,139,347 | ||||||||
|
|
|
|
|
|
|
|
|
|||||||||
| Securities held-to-maturity: |
||||||||||||||||
| Obligations of states and municipal subdivisions |
$ | 425 | $ | 38 | $ | — | $ | 463 | ||||||||
|
|
|
|
|
|
|
|
|
|||||||||
F-11
Table of Contents
The scheduled contractual maturities of securities available-for-sale and securities held-to-maturity at September 30, 2017 were as follows:
| Available-for-Sale | Held-to-Maturity | |||||||||||||||
| (In thousands) | Amortized Cost |
Estimated Fair Value |
Amortized Cost |
Estimated Fair Value |
||||||||||||
| Due in one year or less |
$ | — | $ | — | $ | — | $ | — | ||||||||
| Due after one year through five years |
108,620 | 105,798 | 425 | 451 | ||||||||||||
| Due after five years through ten years |
20,818 | 21,133 | — | — | ||||||||||||
| Due after ten years |
474,696 | 467,138 | — | — | ||||||||||||
| Mortgage-backed securities and other securities |
607,288 | 603,963 | — | — | ||||||||||||
|
|
|
|
|
|
|
|
|
|||||||||
| Total |
$ | 1,211,422 | $ | 1,198,032 | $ | 425 | $ | 451 | ||||||||
|
|
|
|
|
|
|
|
|
|||||||||
Proceeds from sales, gross gains and gross losses on sales of securities available for sale for the three and nine months ended September 30, 2017 and 2016 are presented below. There were no other-than-temporary impairment charges included in gross realized losses for the three and nine months ended September 30, 2017 and 2016. The specific identification method is used to reclassify gains and losses out of other comprehensive income at the time of sale.
| For the Three Months Ended September 30, |
For the Nine Months Ended September 30, |
|||||||||||||||
| (In thousands) | 2017 | 2016 | 2017 | 2016 | ||||||||||||
| Gross realized gains |
$ | 1 | $ | 1,724 | $ | 151 | $ | 2,905 | ||||||||
| Gross realized losses |
— | (338 | ) | (313 | ) | (436 | ) | |||||||||
|
|
|
|
|
|
|
|
|
|||||||||
| Realized gains (losses) on sale of securities available for sale, net |
$ | 1 | $ | 1,386 | $ | (162 | ) | $ | 2,469 | |||||||
|
|
|
|
|
|
|
|
|
|||||||||
Securities with a carrying value of $513.4 million and $380.4 million at September 30, 2017 and December 31, 2016, respectively, were pledged to secure public and trust deposits, FHLB borrowings, repurchase agreements and for other purposes as required or permitted by law.
The detail concerning securities classified as available-for-sale with unrealized losses as of September 30, 2017 and December 31, 2016 was as follows:
| Unrealized loss analysis | ||||||||||||||||
| Losses < 12 Months | Losses > 12 Months | |||||||||||||||
| (In thousands) | Estimated Fair Value |
Gross Unrealized Losses |
Estimated Fair Value |
Gross Unrealized Losses |
||||||||||||
| September 30, 2017 |
||||||||||||||||
| U.S. Treasury securities |
$ | — | $ | — | $ | 97,688 | $ | 2,927 | ||||||||
| Obligations of U.S. government agencies |
138 | — | 25,784 | 103 | ||||||||||||
| Mortgage-backed securities |
218,226 | 4,108 | 58,347 | 2,768 | ||||||||||||
| Obligations of states and municipal subdivisions |
140,067 | 4,134 | 93,325 | 7,351 | ||||||||||||
| Other securities |
— | — | 4,313 | 134 | ||||||||||||
|
|
|
|
|
|
|
|
|
|||||||||
| Total |
$ | 358,431 | $ | 8,242 | $ | 279,457 | $ | 13,283 | ||||||||
|
|
|
|
|
|
|
|
|
|||||||||
F-12
Table of Contents
| Unrealized loss analysis | ||||||||||||||||
| Losses < 12 Months | Losses > 12 Months | |||||||||||||||
| (In thousands) | Estimated Fair Value |
Gross Unrealized Losses |
Estimated Fair Value |
Gross Unrealized Losses |
||||||||||||
| December 31, 2016 |
||||||||||||||||
| U.S. Treasury securities |
$ | 96,785 | $ | 3,951 | $ | — | $ | — | ||||||||
| Obligations of U.S. government agencies |
51,463 | 277 | 12,150 | 43 | ||||||||||||
| Mortgage-backed securities |
328,374 | 8,482 | 17,979 | 887 | ||||||||||||
| Obligations of states and municipal subdivisions |
344,708 | 28,713 | — | — | ||||||||||||
| Other securities |
— | — | 4,216 | 162 | ||||||||||||
|
|
|
|
|
|
|
|
|
|||||||||
| Total |
$ | 821,330 | $ | 41,423 | $ | 34,345 | $ | 1,092 | ||||||||
|
|
|
|
|
|
|
|
|
|||||||||
There were no securities classified as held-to-maturity with unrealized losses as of September 30, 2017 and December 31, 2016.
As of September 30, 2017 and December 31, 2016, approximately 53% and 75%, respectively, of the fair value of securities in the investment portfolio reflected an unrealized loss. As of September 30, 2017, there were 61 securities that had been in a loss position for more than twelve months, and 82 securities that had been in a loss position for less than 12 months. None of the unrealized losses relate to the marketability of the securities or the issuer’s ability to honor redemption of the obligations. The Company has adequate liquidity and, therefore, does not plan to sell and, more likely than not, will not be required to sell these securities before recovery of the indicated impairment. Accordingly, the unrealized losses on these securities have been determined to be temporary.
F-13
Table of Contents
Note 3—Loans and Allowance for Credit Losses
The following table presents total loans outstanding by portfolio segment and class of financing receivable as of September 30, 2017 and December 31, 2016. Outstanding balances also include Acquired Noncredit Impaired (“ANCI”) loans, originated loans and Acquired Credit Impaired (“ACI”) loans net of any remaining purchase accounting adjustments. Information about ACI loans is presented separately in the “Acquired Credit-Impaired Loans” section of this Note.
| As of September 30, 2017 | ||||||||||||||||
| (In thousands) | ACI | ANCI | Originated | Total | ||||||||||||
| Commercial and Industrial |
||||||||||||||||
| General C&I(1) |
$ | 26,103 | $ | 51,876 | $ | 2,542,261 | $ | 2,620,240 | ||||||||
| Energy sector |
— | — | 932,981 | 932,981 | ||||||||||||
| Restaurant industry |
— | — | 979,735 | 979,735 | ||||||||||||
| Healthcare |
6,240 | 2,720 | 385,385 | 394,345 | ||||||||||||
|
|
|
|
|
|
|
|
|
|||||||||
| Total commercial and industrial |
32,343 | 54,596 | 4,840,362 | 4,927,301 | ||||||||||||
|
|
|
|
|
|
|
|
|
|||||||||
| Commercial Real Estate |
||||||||||||||||
| Income producing |
82,634 | 14,735 | 1,048,441 | 1,145,810 | ||||||||||||
| Land and development |
— | 1,510 | 71,597 | 73,107 | ||||||||||||
|
|
|
|
|
|
|
|
|
|||||||||
| Total commercial real estate |
82,634 | 16,245 | 1,120,038 | 1,218,917 | ||||||||||||
|
|
|
|
|
|
|
|
|
|||||||||
| Consumer |
||||||||||||||||
| Residential real estate |
157,632 | 117,801 | 1,340,724 | 1,616,157 | ||||||||||||
| Other |
1,397 | 2,948 | 67,981 | 72,326 | ||||||||||||
|
|
|
|
|
|
|
|
|
|||||||||
| Total consumer |
159,029 | 120,749 | 1,408,705 | 1,688,483 | ||||||||||||
|
|
|
|
|
|
|
|
|
|||||||||
| Small Business Lending |
— | 10,702 | 207,575 | 218,277 | ||||||||||||
|
|
|
|
|
|
|
|
|
|||||||||
| Total (Gross of unearned discount and fees) |
274,006 | 202,292 | 7,576,680 | 8,052,978 | ||||||||||||
|
|
|
|
|
|
|
|
|
|||||||||
| Unearned discount and fees |
— | (3,495 | ) | (20,545 | ) | (24,040 | ) | |||||||||
|
|
|
|
|
|
|
|
|
|||||||||
| Total (Net of unearned discount and fees) |
$ | 274,006 | $ | 198,797 | $ | 7,556,135 | $ | 8,028,938 | ||||||||
|
|
|
|
|
|
|
|
|
|||||||||
F-14
Table of Contents
| As of December 31, 2016 | ||||||||||||||||
| (In thousands) | ACI | ANCI | Originated | Total | ||||||||||||
| Commercial and Industrial |
||||||||||||||||
| General C&I(1) |
$ | 31,709 | $ | 47,592 | $ | 2,337,364 | $ | 2,416,665 | ||||||||
| Energy sector |
— | — | 939,369 | 939,369 | ||||||||||||
| Restaurant industry |
— | — | 864,085 | 864,085 | ||||||||||||
| Healthcare |
6,338 | 4,102 | 434,663 | 445,103 | ||||||||||||
|
|
|
|
|
|
|
|
|
|||||||||
| Total commercial and industrial |
38,047 | 51,694 | 4,575,481 | 4,665,222 | ||||||||||||
|
|
|
|
|
|
|
|
|
|||||||||
| Commercial Real Estate |
||||||||||||||||
| Income producing |
96,673 | 18,354 | 886,676 | 1,001,703 | ||||||||||||
| Land and development |
1,497 | 1,952 | 67,555 | 71,004 | ||||||||||||
|
|
|
|
|
|
|
|
|
|||||||||
| Total commercial real estate |
98,170 | 20,306 | 954,231 | 1,072,707 | ||||||||||||
|
|
|
|
|
|
|
|
|
|||||||||
| Consumer |
||||||||||||||||
| Residential real estate |
186,375 | 145,747 | 1,125,048 | 1,457,170 | ||||||||||||
| Other |
1,690 | 7,180 | 59,819 | 68,689 | ||||||||||||
|
|
|
|
|
|
|
|
|
|||||||||
| Total consumer |
188,065 | 152,927 | 1,184,867 | 1,525,859 | ||||||||||||
|
|
|
|
|
|
|
|
|
|||||||||
| Small Business Lending |
— | 9,158 | 184,483 | 193,641 | ||||||||||||
|
|
|
|
|
|
|
|
|
|||||||||
| Total (Gross of unearned discount and fees) |
324,282 | 234,085 | 6,899,062 | 7,457,429 | ||||||||||||
|
|
|
|
|
|
|
|
|
|||||||||
| Unearned discount and fees |
— | (4,301 | ) | (20,417 | ) | (24,718 | ) | |||||||||
|
|
|
|
|
|
|
|
|
|||||||||
| Total (Net of unearned discount and fees) |
$ | 324,282 | $ | 229,784 | $ | 6,878,645 | $ | 7,432,711 | ||||||||
|
|
|
|
|
|
|
|
|
|||||||||
| (1) | This category for ACI loans includes all pooled commercial and industrial loans which may contain certain restaurant, healthcare or services loan types. |
Allowance for Credit Losses (“ACL”)
The ACL is management’s estimate of credit losses inherent in the loan portfolio at the balance sheet date. The Company has an established process to determine the adequacy of the ACL that assesses the losses inherent in our portfolio. While management attributes portions of the ACL to specific portfolio segments, the entire ACL is available to absorb credit losses inherent in the total loan portfolio.
The ACL process involves procedures that appropriately consider the unique risk characteristics of the loan portfolio segments based on management’s assessment of the underlying risks and cash flows. For each portfolio segment, losses are estimated collectively for groups of loans with similar characteristics, individually for impaired loans or, for ACI loans, based on the changes in cash flows expected to be collected on a pool or individual basis.
The level of the ACL is influenced by loan volumes, risk rating migration, historic loss experience influencing loss factors, and other conditions influencing loss expectations, such as economic conditions. The primary indicator of credit quality for the portfolio segments is its internal risk ratings. The assignment of loan risk ratings is the primary responsibility of the lending officer and is subject to independent review by internal credit review, which also performs ongoing, independent review of the risk management process. The risk management process includes underwriting, documentation and collateral control. Credit review is centralized and independent of the lending function. The credit review results are reported to senior management and the Board of Directors.
F-15
Table of Contents
A summary of the activity in the ACL for the three and nine months ended September 30, 2017 and 2016:
| For the Three Months Ended September 30, 2017 | ||||||||||||||||||||
| (In thousands) | Commercial and Industrial |
Commercial Real Estate |
Consumer | Small Business |
Total | |||||||||||||||
| As of June 30, 2017 |
$ | 62,235 | $ | 13,260 | $ | 13,385 | $ | 4,335 | $ | 93,215 | ||||||||||
| Provision for loan losses: |
||||||||||||||||||||
| ACI loans |
278 | (1,195 | ) | (345 | ) | — | (1,262 | ) | ||||||||||||
| ANCI loans |
31 | — | (154 | ) | (69 | ) | (192 | ) | ||||||||||||
| Originated loans |
(432 | ) | 811 | 2,689 | 109 | 3,177 | ||||||||||||||
|
|
|
|
|
|
|
|
|
|
|
|||||||||||
| Total provision |
(123 | ) | (384 | ) | 2,190 | 40 | 1,723 | |||||||||||||
|
|
|
|
|
|
|
|
|
|
|
|||||||||||
| Charge-offs: |
||||||||||||||||||||
| ACI loans |
375 | — | — | — | 375 | |||||||||||||||
| ANCI loans |
65 | — | 9 | — | 74 | |||||||||||||||
| Originated loans |
— | — | 132 | — | 132 | |||||||||||||||
|
|
|
|
|
|
|
|
|
|
|
|||||||||||
| Total charge-offs |
440 | — | 141 | — | 581 | |||||||||||||||
|
|
|
|
|
|
|
|
|
|
|
|||||||||||
| Recoveries: |
||||||||||||||||||||
| ACI loans |
— | 65 | 3 | — | 68 | |||||||||||||||
| ANCI loans |
27 | — | 164 | 65 | 256 | |||||||||||||||
| Originated loans |
44 | 11 | 29 | — | 84 | |||||||||||||||
|
|
|
|
|
|
|
|
|
|
|
|||||||||||
| Total recoveries |
71 | 76 | 196 | 65 | 408 | |||||||||||||||
|
|
|
|
|
|
|
|
|
|
|
|||||||||||
| As of September 30, 2017 |
$ | 61,743 | $ | 12,952 | $ | 15,630 | $ | 4,440 | $ | 94,765 | ||||||||||
|
|
|
|
|
|
|
|
|
|
|
|||||||||||
F-16
Table of Contents
| For the Nine Months Ended September 30, 2017 | ||||||||||||||||||||
| (In thousands) | Commercial and Industrial |
Commercial Real Estate |
Consumer | Small Business |
Total | |||||||||||||||
| As of December 31, 2016 |
$ | 54,688 | $ | 10,103 | $ | 13,265 | $ | 4,212 | $ | 82,268 | ||||||||||
| Provision for loan losses: |
||||||||||||||||||||
| ACI loans |
95 | (877 | ) | (1,416 | ) | — | (2,198 | ) | ||||||||||||
| ANCI loans |
639 | (42 | ) | (146 | ) | (224 | ) | 227 | ||||||||||||
| Originated loans |
8,656 | 3,564 | 3,633 | 328 | 16,181 | |||||||||||||||
|
|
|
|
|
|
|
|
|
|
|
|||||||||||
| Total provision |
9,390 | 2,645 | 2,071 | 104 | 14,210 | |||||||||||||||
|
|
|
|
|
|
|
|
|
|
|
|||||||||||
| Charge-offs: |
||||||||||||||||||||
| ACI loans |
414 | — | — | — | 414 | |||||||||||||||
| ANCI loans |
99 | — | 160 | 47 | 306 | |||||||||||||||
| Originated loans |
2,788 | — | 383 | 120 | 3,291 | |||||||||||||||
|
|
|
|
|
|
|
|
|
|
|
|||||||||||
| Total charge-offs |
3,301 | — | 543 | 167 | 4,011 | |||||||||||||||
|
|
|
|
|
|
|
|
|
|
|
|||||||||||
| Recoveries: |
||||||||||||||||||||
| ACI loans |
246 | 186 | 484 | — | 916 | |||||||||||||||
| ANCI loans |
43 | — | 268 | 247 | 558 | |||||||||||||||
| Originated loans |
677 | 18 | 85 | 44 | 824 | |||||||||||||||
|
|
|
|
|
|
|
|
|
|
|
|||||||||||
| Total recoveries |
966 | 204 | 837 | 291 | 2,298 | |||||||||||||||
|
|
|
|
|
|
|
|
|
|
|
|||||||||||
| As of September 30, 2017 |
$ | 61,743 | $ | 12,952 | $ | 15,630 | $ | 4,440 | $ | 94,765 | ||||||||||
|
|
|
|
|
|
|
|
|
|
|
|||||||||||
| ACL |
||||||||||||||||||||
| ACI loans collectively evaluated for impairment |
$ | — | $ | 1,958 | $ | 6,300 | $ | — | $ | 8,258 | ||||||||||
| ACI loans individually evaluated for impairment |
103 | 6 | 215 | — | 324 | |||||||||||||||
| ANCI loans collectively evaluated for impairment |
883 | 202 | 55 | 256 | 1,396 | |||||||||||||||
| ANCI loans individually evaluated for impairment |
— | — | 38 | 24 | 62 | |||||||||||||||
| Originated loans collectively evaluated for impairment |
49,847 | 10,786 | 9,019 | 4,149 | 73,801 | |||||||||||||||
| Originated loans individually evaluated for impairment |
10,910 | — | 3 | 11 | 10,924 | |||||||||||||||
|
|
|
|
|
|
|
|
|
|
|
|||||||||||
| ACL as of September 30, 2017 |
$ | 61,743 | $ | 12,952 | $ | 15,630 | $ | 4,440 | $ | 94,765 | ||||||||||
|
|
|
|
|
|
|
|
|
|
|
|||||||||||
| Loans |
||||||||||||||||||||
| ACI loan pools collectively evaluated for impairment |
$ | 22,120 | $ | 73,929 | $ | 159,029 | $ | — | $ | 255,078 | ||||||||||
| ACI loans individually evaluated for impairment |
10,223 | 8,705 | — | — | 18,928 | |||||||||||||||
| ANCI loans collectively evaluated for impairment |
54,596 | 16,245 | 119,152 | 10,381 | 200,374 | |||||||||||||||
| ANCI loans individually evaluated for impairment |
— | — | 1,597 | 321 | 1,918 | |||||||||||||||
| Originated loans collectively evaluated for impairment |
4,749,077 | 1,120,038 | 1,408,263 | 206,981 | 7,484,359 | |||||||||||||||
| Originated loans individually evaluated for impairment |
91,285 | — | 442 | 594 | 92,321 | |||||||||||||||
|
|
|
|
|
|
|
|
|
|
|
|||||||||||
| Loans as of September 30, 2017 |
$ | 4,927,301 | $ | 1,218,917 | $ | 1,688,483 | $ | 218,277 | $ | 8,052,978 | ||||||||||
|
|
|
|
|
|
|
|
|
|
|
|||||||||||
F-17
Table of Contents
| For the Three Months Ended September 30, 2016 | ||||||||||||||||||||
| (In thousands) | Commercial and Industrial |
Commercial Real Estate |
Consumer | Small Business |
Total | |||||||||||||||
| As of June 30, 2016 |
$ | 60,135 | $ | 9,804 | $ | 13,323 | $ | 3,885 | $ | 87,147 | ||||||||||
| Provision for loan losses: |
||||||||||||||||||||
| ACI loans |
(39 | ) | (763 | ) | 992 | — | 190 | |||||||||||||
| ANCI loans |
(33 | ) | (237 | ) | 33 | (47 | ) | (284 | ) | |||||||||||
| Originated loans |
29,290 | 57 | 275 | 99 | 29,721 | |||||||||||||||
|
|
|
|
|
|
|
|
|
|
|
|||||||||||
| Total provision |
29,218 | (943 | ) | 1,300 | 52 | 29,627 | ||||||||||||||
|
|
|
|
|
|
|
|
|
|
|
|||||||||||
| Charge-offs: |
||||||||||||||||||||
| ACI loans |
— | — | 1,092 | — | 1,092 | |||||||||||||||
| ANCI loans |
— | — | 144 | — | 144 | |||||||||||||||
| Originated loans |
25,455 | — | 177 | — | 25,632 | |||||||||||||||
|
|
|
|
|
|
|
|
|
|
|
|||||||||||
| Total charge-offs |
25,455 | — | 1,413 | — | 26,868 | |||||||||||||||
|
|
|
|
|
|
|
|
|
|
|
|||||||||||
| Recoveries: |
||||||||||||||||||||
| ACI loans |
8 | 419 | 2 | — | 429 | |||||||||||||||
| ANCI loans |
11 | 100 | 31 | 2 | 144 | |||||||||||||||
| Originated loans |
656 | — | 34 | — | 690 | |||||||||||||||
|
|
|
|
|
|
|
|
|
|
|
|||||||||||
| Total recoveries |
675 | 519 | 67 | 2 | 1,263 | |||||||||||||||
|
|
|
|
|
|
|
|
|
|
|
|||||||||||
| As of September 30, 2016 |
$ | 64,573 | $ | 9,380 | $ | 13,277 | $ | 3,939 | $ | 91,169 | ||||||||||
|
|
|
|
|
|
|
|
|
|
|
|||||||||||
F-18
Table of Contents
| For the Nine Months Ended September 30, 2016 | ||||||||||||||||||||
| (In thousands) | Commercial and Industrial |
Commercial Real Estate |
Consumer | Small Business |
Total | |||||||||||||||
| As of December 31, 2015 |
$ | 55,824 | $ | 8,136 | $ | 13,450 | $ | 2,373 | $ | 79,783 | ||||||||||
| Provision for loan losses: |
||||||||||||||||||||
| ACI loans |
(2,179 | ) | (876 | ) | (149 | ) | — | (3,204 | ) | |||||||||||
| ANCI loans |
(196 | ) | (211 | ) | 188 | (60 | ) | (279 | ) | |||||||||||
| Originated loans |
53,125 | 1,765 | 1,402 | 1,761 | 58,053 | |||||||||||||||
|
|
|
|
|
|
|
|
|
|
|
|||||||||||
| Total provision |
50,750 | 678 | 1,441 | 1,701 | 54,570 | |||||||||||||||
|
|
|
|
|
|
|
|
|
|
|
|||||||||||
| Charge-offs: |
||||||||||||||||||||
| ACI loans |
— | — | 1,092 | — | 1,092 | |||||||||||||||
| ANCI loans |
— | — | 334 | — | 334 | |||||||||||||||
| Originated loans |
43,332 | — | 480 | 142 | 43,954 | |||||||||||||||
|
|
|
|
|
|
|
|
|
|
|
|||||||||||
| Total charge-offs |
43,332 | — | 1,906 | 142 | 45,380 | |||||||||||||||
|
|
|
|
|
|
|
|
|
|
|
|||||||||||
| Recoveries: |
||||||||||||||||||||
| ACI loans |
20 | 466 | 7 | — | 493 | |||||||||||||||
| ANCI loans |
35 | 100 | 102 | 7 | 244 | |||||||||||||||
| Originated loans |
1,276 | — | 183 | — | 1,459 | |||||||||||||||
|
|
|
|
|
|
|
|
|
|
|
|||||||||||
| Total recoveries |
1,331 | 566 | 292 | 7 | 2,196 | |||||||||||||||
|
|
|
|
|
|
|
|
|
|
|
|||||||||||
| As of September 30, 2016 |
$ | 64,573 | $ | 9,380 | $ | 13,277 | $ | 3,939 | $ | 91,169 | ||||||||||
|
|
|
|
|
|
|
|
|
|
|
|||||||||||
| ACL |
||||||||||||||||||||
| ACI loans collectively evaluated for impairment |
$ | 70 | $ | 2,671 | $ | 7,557 | $ | — | $ | 10,298 | ||||||||||
| ACI loans individually evaluated for impairment |
— | 4 | 229 | — | 233 | |||||||||||||||
| ANCI loans collectively evaluated for impairment |
262 | 117 | — | 254 | 633 | |||||||||||||||
| ANCI loans individually evaluated for impairment |
— | — | 61 | — | 61 | |||||||||||||||
| Originated loans collectively evaluated for impairment |
55,451 | 6,588 | 5,430 | 3,685 | 71,154 | |||||||||||||||
| Originated loans individually evaluated for impairment |
8,790 | — | — | — | 8,790 | |||||||||||||||
|
|
|
|
|
|
|
|
|
|
|
|||||||||||
| ACL as of September 30, 2016 |
$ | 64,573 | $ | 9,380 | $ | 13,277 | $ | 3,939 | $ | 91,169 | ||||||||||
|
|
|
|
|
|
|
|
|
|
|
|||||||||||
Loans Held-for-sale
The Company had held-for-sale (“HFS”) loans totaling $21.8 million as of September 30, 2017 consisting of $16.0 million in commercial loans and $5.8 million in mortgage loans. During the third quarter of 2017 the Company transferred a $9.9 million nonperforming energy credit to the HFS category at the lower of cost or market value (“LOCOM”). The sale is expected to close in the fourth quarter of 2017.
Impaired Originated and ANCI Loans Including TDRs
The following includes certain key information about individually impaired originated and ANCI loans as of September 30, 2017 and December 31, 2016 and for the three and nine months ended September 30, 2017 and 2016.
F-19
Table of Contents
Originated and ANCI Loans Identified as Impaired
| As of September 30, 2017 | ||||||||||||||||||||
| (In thousands) | Recorded Investment in Impaired Loans(1) |
Unpaid Principal Balance |
Related Specific Allowance |
Nonaccrual Loans Included in Impaired Loans |
Undisbursed Commitments |
|||||||||||||||
| With no related allowance for credit losses |
||||||||||||||||||||
| Commercial and Industrial |
||||||||||||||||||||
| General C&I |
$ | 193 | $ | 197 | $ | — | $ | 193 | $ | — | ||||||||||
| Energy sector |
67,584 | 77,441 | — | 60,452 | 4,432 | |||||||||||||||
|
|
|
|
|
|
|
|
|
|
|
|||||||||||
| Total commercial and industrial |
67,777 | 77,638 | — | 60,645 | 4,432 | |||||||||||||||
|
|
|
|
|
|
|
|
|
|
|
|||||||||||
| Consumer |
||||||||||||||||||||
| Residential real estate |
1,105 | 1,108 | — | 36 | — | |||||||||||||||
| Other |
160 | 159 | — | — | — | |||||||||||||||
|
|
|
|
|
|
|
|
|
|
|
|||||||||||
| Total consumer |
1,265 | 1,267 | — | 36 | — | |||||||||||||||
|
|
|
|
|
|
|
|
|
|
|
|||||||||||
| Small Business Lending |
255 | 696 | — | 255 | — | |||||||||||||||
|
|
|
|
|
|
|
|
|
|
|
|||||||||||
| Total |
$ | 69,297 | $ | 79,601 | $ | — | $ | 60,936 | $ | 4,432 | ||||||||||
|
|
|
|
|
|
|
|
|
|
|
|||||||||||
| With allowance for credit losses recorded |
||||||||||||||||||||
| Commercial and Industrial |
||||||||||||||||||||
| Energy sector |
$ | 23,695 | $ | 28,539 | $ | 10,910 | $ | 11,574 | $ | 402 | ||||||||||
| Consumer |
||||||||||||||||||||
| Residential real estate |
499 | 497 | 38 | — | — | |||||||||||||||
| Other |
285 | 283 | 3 | — | — | |||||||||||||||
|
|
|
|
|
|
|
|
|
|
|
|||||||||||
| Total consumer |
784 | 780 | 41 | — | — | |||||||||||||||
| Small Business Lending |
662 | 930 | 35 | 65 | — | |||||||||||||||
|
|
|
|
|
|
|
|
|
|
|
|||||||||||
| Total |
$ | 25,141 | $ | 30,249 | $ | 10,986 | $ | 11,639 | $ | 402 | ||||||||||
|
|
|
|
|
|
|
|
|
|
|
|||||||||||
F-20
Table of Contents
| As of December 31, 2016 | ||||||||||||||||||||
| (In thousands) | Recorded Investment in Impaired Loans(1) |
Unpaid Principal Balance |
Related Specific Allowance |
Nonaccrual Loans Included in Impaired Loans |
Undisbursed Commitments |
|||||||||||||||
| With no related allowance for credit losses |
||||||||||||||||||||
| Commercial and Industrial |
||||||||||||||||||||
| General C&I |
$ | 12,334 | $ | 13,426 | $ | — | $ | 6,838 | $ | 1,363 | ||||||||||
| Energy sector |
99,200 | 103,322 | — | 85,149 | 8,465 | |||||||||||||||
|
|
|
|
|
|
|
|
|
|
|
|||||||||||
| Total commercial and industrial |
111,534 | 116,748 | — | 91,987 | 9,828 | |||||||||||||||
|
|
|
|
|
|
|
|
|
|
|
|||||||||||
| Consumer |
||||||||||||||||||||
| Residential real estate |
437 | 435 | — | — | — | |||||||||||||||
| Other |
429 | 427 | — | — | 1 | |||||||||||||||
|
|
|
|
|
|
|
|
|
|
|
|||||||||||
| Total consumer |
866 | 862 | — | — | 1 | |||||||||||||||
|
|
|
|
|
|
|
|
|
|
|
|||||||||||
| Small Business Lending |
299 | 703 | — | 299 | — | |||||||||||||||
|
|
|
|
|
|
|
|
|
|
|
|||||||||||
| Total |
$ | 112,699 | $ | 118,313 | $ | — | $ | 92,286 | $ | 9,829 | ||||||||||
|
|
|
|
|
|
|
|
|
|
|
|||||||||||
| With allowance for credit losses recorded |
||||||||||||||||||||
| Commercial and Industrial |
||||||||||||||||||||
| Energy sector |
$ | 39,319 | $ | 45,243 | $ | 1,598 | $ | 28,228 | $ | 4,788 | ||||||||||
| Consumer |
||||||||||||||||||||
| Residential real estate |
736 | 741 | 37 | 39 | — | |||||||||||||||
| Small Business Lending |
641 | 897 | 40 | 90 | — | |||||||||||||||
|
|
|
|
|
|
|
|
|
|
|
|||||||||||
| Total |
$ | 40,696 | $ | 46,881 | $ | 1,675 | $ | 28,357 | $ | 4,788 | ||||||||||
|
|
|
|
|
|
|
|
|
|
|
|||||||||||
| (1) | The recorded investment of a loan also includes any interest receivable, net unearned discount or fees, and unamortized premium or discount. |
The related amount of interest income recognized for impaired loans was $301 thousand and $926 thousand for the three and nine months ended September 30, 2017, respectively, compared to $206 thousand and $897 thousand for the same periods in 2016.
Generally, cash receipts on nonperforming loans are used to reduce principal rather than recorded as interest income. Past due status is determined based upon contractual terms. A nonaccrual loan may be returned to accrual status when repayment is reasonably assured and there has been demonstrated performance under the terms of the loan or, if applicable, under the terms of the restructured loan. Approximately $0.4 million and $1.4 million of contractual interest paid was recognized on the cash basis for the three and nine months ended September 30, 2017, respectively, compared to $0.2 million and $1.2 million for same periods in 2016.
F-21
Table of Contents
Average Recorded Investment in Impaired Originated and ANCI Loans
| Three Months Ended September 30, | ||||||||||||||||
| 2017 | 2016 | |||||||||||||||
| (In thousands) | Originated | ANCI | Originated | ANCI | ||||||||||||
| Commercial and Industrial |
||||||||||||||||
| General C&I |
$ | 6,506 | $ | — | $ | 8,474 | $ | 568 | ||||||||
| Energy sector |
103,580 | — | 156,768 | — | ||||||||||||
|
|
|
|
|
|
|
|
|
|||||||||
| Total commercial and industrial |
110,086 | — | 165,242 | 568 | ||||||||||||
|
|
|
|
|
|
|
|
|
|||||||||
| Consumer |
||||||||||||||||
| Residential real estate |
— | 1,606 | — | 1,199 | ||||||||||||
| Other |
369 | — | 439 | — | ||||||||||||
|
|
|
|
|
|
|
|
|
|||||||||
| Total consumer |
369 | 1,606 | 439 | 1,199 | ||||||||||||
|
|
|
|
|
|
|
|
|
|||||||||
| Small Business Lending |
649 | 334 | — | 405 | ||||||||||||
|
|
|
|
|
|
|
|
|
|||||||||
| Total |
$ | 111,104 | $ | 1,940 | $ | 165,681 | $ | 2,172 | ||||||||
|
|
|
|
|
|
|
|
|
|||||||||
| Nine Months Ended September 30, | ||||||||||||||||
| 2017 | 2016 | |||||||||||||||
| (In thousands) | Originated | ANCI | Originated | ANCI | ||||||||||||
| Commercial and Industrial |
||||||||||||||||
| General C&I |
$ | 9,480 | $ | — | $ | 11,856 | $ | 432 | ||||||||
| Energy sector |
122,269 | — | 133,150 | — | ||||||||||||
|
|
|
|
|
|
|
|
|
|||||||||
| Total commercial and industrial |
131,749 | — | 145,006 | 432 | ||||||||||||
|
|
|
|
|
|
|
|
|
|||||||||
| Consumer |
||||||||||||||||
| Residential real estate |
— | 1,385 | — | 1,273 | ||||||||||||
| Other |
378 | — | 367 | — | ||||||||||||
|
|
|
|
|
|
|
|
|
|||||||||
| Total consumer |
378 | 1,385 | 367 | 1,273 | ||||||||||||
|
|
|
|
|
|
|
|
|
|||||||||
| Small Business Lending |
600 | 356 | — | 426 | ||||||||||||
|
|
|
|
|
|
|
|
|
|||||||||
| Total |
$ | 132,727 | $ | 1,741 | $ | 145,373 | $ | 2,131 | ||||||||
|
|
|
|
|
|
|
|
|
|||||||||
Included in impaired loans are loans considered to be TDRs. The Company attempts to work with borrowers when necessary to extend or modify loan terms to better align with the borrower’s ability to repay. Extensions and modifications to loans are made in accordance with internal policies and guidelines which conform to regulatory guidance. Each occurrence is unique to the borrower and is evaluated separately. The Bank considers regulatory guidelines when restructuring loans to ensure that prudent lending practices are followed. Qualifying criteria and payment terms are structured by the borrower’s current and prospective ability to comply with the modified terms of the loan.
A modification is classified as a TDR if the borrower is experiencing financial difficulty and it is determined that the Company has granted a concession to the borrower. The Company may determine that a borrower is experiencing financial difficulty if the borrower is currently in default on any of its debt, or if it is probable that a borrower may default in the foreseeable future without the modification. Concessions could include reductions of interest rates, extension of the maturity date at a rate lower than current market rate for a new loan with similar risk, reduction of accrued interest, principal forgiveness, forbearance, or other concessions. The assessments of whether a borrower is experiencing or will likely experience financial difficulty and whether a concession has been granted is highly subjective in nature, and management’s judgment is required when determining whether a modification is classified as a TDR. Current amendments to the accounting guidance preclude a creditor from using the effective interest rate test in the debtor’s guidance on restructuring of payables (ASC 470-60-55-10) when evaluating whether a restructuring constitutes a TDR.
F-22
Table of Contents
All TDRs are reported as impaired. Impaired classification may be removed if the borrower demonstrates compliance with the modified terms and the restructuring agreement specifies an interest rate equal to that which would be provided to a borrower with similar credit at the time of restructuring. The majority of TDRs are classified as impaired loans for the remaining life of the loan. Nonperforming loans and impaired loans are defined differently. Some loans may be included in both categories, whereas other loans may only be included in one category.
Originated and ANCI Loans that were modified into TDRs
| For the Three Months Ended September 30, 2017 | ||||||||||||||||
| During the Period | Default(1) during the Period |
|||||||||||||||
| (In thousands) | Number of TDRs |
Recorded Investment |
Number of TDRs |
Recorded Investment |
||||||||||||
| Consumer |
||||||||||||||||
| Other |
1 | 285 | — | — | ||||||||||||
|
|
|
|
|
|
|
|
|
|||||||||
| Total |
1 | $ | 285 | — | $ | — | ||||||||||
|
|
|
|
|
|
|
|
|
|||||||||
| For the Nine Months Ended September 30, 2017 | ||||||||||||||||
| During the Period | Default(1) during the Period |
|||||||||||||||
| (In thousands) | Number of TDRs |
Recorded Investment |
Number of TDRs |
Recorded Investment |
||||||||||||
| Commercial and Industrial |
||||||||||||||||
| General C&I |
1 | $ | 193 | — | $ | — | ||||||||||
| Consumer |
||||||||||||||||
| Residential real estate |
1 | 462 | — | — | ||||||||||||
| Other |
1 | 285 | — | — | ||||||||||||
|
|
|
|
|
|
|
|
|
|||||||||
| Total consumer |
2 | 747 | — | — | ||||||||||||
|
|
|
|
|
|
|
|
|
|||||||||
| Small Business Lending |
1 | 145 | — | — | ||||||||||||
|
|
|
|
|
|
|
|
|
|||||||||
| Total |
4 | $ | 1,085 | — | $ | — | ||||||||||
|
|
|
|
|
|
|
|
|
|||||||||
| For the Three Months Ended September 30, 2016 | ||||||||||||||||
| During the Period | Default(1) during the Period |
|||||||||||||||
| (In thousands) | Number of TDRs |
Recorded Investment |
Number of TDRs |
Recorded Investment |
||||||||||||
| Commercial and Industrial |
||||||||||||||||
| General C&I |
1 | $ | 7,896 | — | $ | — | ||||||||||
| Energy sector |
3 | 29,107 | — | — | ||||||||||||
|
|
|
|
|
|
|
|
|
|||||||||
| Total commercial and industrial |
4 | 37,003 | — | — | ||||||||||||
|
|
|
|
|
|
|
|
|
|||||||||
| Total |
4 | $ | 37,003 | — | $ | — | ||||||||||
|
|
|
|
|
|
|
|
|
|||||||||
F-23
Table of Contents
| For the Nine Months Ended September 30, 2016 | ||||||||||||||||
| During the Period | Default(1) during the Period |
|||||||||||||||
| (In thousands) | Number of TDRs |
Recorded Investment |
Number of TDRs |
Recorded Investment |
||||||||||||
| Commercial and Industrial |
||||||||||||||||
| General C&I |
1 | $ | 7,896 | — | $ | — | ||||||||||
| Energy sector |
4 | 35,945 | — | — | ||||||||||||
|
|
|
|
|
|
|
|
|
|||||||||
| Total commercial and industrial |
5 | 43,841 | — | — | ||||||||||||
| Consumer |
||||||||||||||||
| Residential real estate |
1 | 336 | — | — | ||||||||||||
| Other |
1 | 184 | — | — | ||||||||||||
|
|
|
|
|
|
|
|
|
|||||||||
| Total consumer |
2 | 520 | — | — | ||||||||||||
|
|
|
|
|
|
|
|
|
|||||||||
| Total |
7 | $ | 44,361 | — | $ | — | ||||||||||
|
|
|
|
|
|
|
|
|
|||||||||
| (1) | Default is defined as the earlier of the troubled debt restructuring being placed on non-accrual status or obtaining 90 day past due status with respect to principal and/or interest payments. |
| For the Three Months Ended September 30, | ||||||||||||||||||||
| 2017 | 2016 | |||||||||||||||||||
| Number of Loans Modified by: | ||||||||||||||||||||
| Rate Concession |
Modified Terms and/ or Other Concessions |
Forbearance Agreement |
Modified Terms and/ or Other Concessions |
Rate Concession |
||||||||||||||||
| Commercial and Industrial |
||||||||||||||||||||
| General C&I |
— | — | — | 1 | — | |||||||||||||||
| Energy sector |
— | — | 1 | 1 | 1 | |||||||||||||||
|
|
|
|
|
|
|
|
|
|
|
|||||||||||
| Total commercial and industrial |
— | — | 1 | 2 | 1 | |||||||||||||||
| Consumer |
||||||||||||||||||||
| Other |
— | 1 | — | — | — | |||||||||||||||
|
|
|
|
|
|
|
|
|
|
|
|||||||||||
| Total |
— | 1 | 1 | 2 | 1 | |||||||||||||||
|
|
|
|
|
|
|
|
|
|
|
|||||||||||
| For the Nine Months Ended September 30, | ||||||||||||||||||||
| 2017 | 2016 | |||||||||||||||||||
| Number of Loans Modified by: | ||||||||||||||||||||
| Rate Concession |
Modified Terms and/ or Other Concessions |
Forbearance Agreement |
Modified Terms and/ or Other Concessions |
Rate Concession |
||||||||||||||||
| Commercial and Industrial |
||||||||||||||||||||
| General C&I |
1 | — | — | 1 | — | |||||||||||||||
| Energy sector |
— | — | 1 | 2 | 1 | |||||||||||||||
|
|
|
|
|
|
|
|
|
|
|
|||||||||||
| Total commercial and industrial |
1 | — | 1 | 3 | 1 | |||||||||||||||
| Consumer |
||||||||||||||||||||
| Residential real estate |
— | 1 | — | 1 | — | |||||||||||||||
| Other |
— | 1 | — | 1 | — | |||||||||||||||
|
|
|
|
|
|
|
|
|
|
|
|||||||||||
| Total consumer |
— | 2 | — | 2 | — | |||||||||||||||
| Small Business Lending |
1 | — | — | — | — | |||||||||||||||
|
|
|
|
|
|
|
|
|
|
|
|||||||||||
| Total |
2 | 2 | 1 | 5 | 1 | |||||||||||||||
|
|
|
|
|
|
|
|
|
|
|
|||||||||||
F-24
Table of Contents
Residential Mortgage Loans in Process of Foreclosure
Included in loans are $3.4 million and $2.1 million of consumer loans secured by single family residential real estate that are in process of foreclosure at September 30, 2017 and December 31, 2016, respectively. Loans in process of foreclosure include those for which formal foreclosure proceedings are in process according to local requirements of the applicable jurisdiction. In addition to the single family residential real estate loans in process of foreclosure, the Company also held $4.8 million and $5.1 million of foreclosed single family residential properties in other real estate owned as of September 30, 2017 and December 31, 2016, respectively.
Credit Exposure in the Originated and ANCI Loan Portfolios
The following provides information regarding the credit exposure by portfolio segment and class of receivable as of September 30, 2017 and December 31, 2016:
Commercial and Industrial credit exposure, based on internal risk rating:
| As of September 30, 2017 | ||||||||||||||||
| (Recorded Investment in thousands) | General C&I | Energy(1) | Restaurant | Healthcare | ||||||||||||
| Originated Loans |
||||||||||||||||
| Pass |
$ | 2,429,596 | $ | 773,680 | $ | 966,231 | $ | 386,360 | ||||||||
| Special mention |
84,846 | — | 4,647 | 45 | ||||||||||||
| Substandard(1) |
34,580 | 150,929 | 10,907 | — | ||||||||||||
| Doubtful |
— | 10,503 | — | — | ||||||||||||
|
|
|
|
|
|
|
|
|
|||||||||
| Total originated loans(1) |
2,549,022 | 935,112 | 981,785 | 386,405 | ||||||||||||
|
|
|
|
|
|
|
|
|
|||||||||
| ANCI Loans |
||||||||||||||||
| Pass |
45,780 | — | — | 2,731 | ||||||||||||
| Substandard |
6,324 | — | — | — | ||||||||||||
|
|
|
|
|
|
|
|
|
|||||||||
| Total ANCI loans |
52,104 | — | — | 2,731 | ||||||||||||
|
|
|
|
|
|
|
|
|
|||||||||
| Total |
$ | 2,601,126 | $ | 935,112 | $ | 981,785 | $ | 389,136 | ||||||||
|
|
|
|
|
|
|
|
|
|||||||||
| (1) | Does not include the $9.9 million nonperforming energy credit that was transferred to the HFS category. |
| As of December 31, 2016 | ||||||||||||||||
| (Recorded Investment in thousands) | General C&I | Energy | Restaurant | Healthcare | ||||||||||||
| Originated Loans |
||||||||||||||||
| Pass |
$ | 2,279,481 | $ | 670,696 | $ | 849,546 | $ | 426,276 | ||||||||
| Special mention |
36,419 | 30,433 | 16,169 | 9,479 | ||||||||||||
| Substandard |
26,968 | 239,457 | — | — | ||||||||||||
| Doubtful |
— | 789 | — | — | ||||||||||||
|
|
|
|
|
|
|
|
|
|||||||||
| Total originated loans |
2,342,868 | 941,375 | 865,715 | 435,755 | ||||||||||||
|
|
|
|
|
|
|
|
|
|||||||||
| ANCI Loans |
||||||||||||||||
| Pass |
47,269 | — | — | 4,114 | ||||||||||||
| Substandard |
521 | — | — | — | ||||||||||||
|
|
|
|
|
|
|
|
|
|||||||||
| Total ANCI loans |
47,790 | — | — | 4,114 | ||||||||||||
|
|
|
|
|
|
|
|
|
|||||||||
| Total |
$ | 2,390,658 | $ | 941,375 | $ | 865,715 | $ | 439,869 | ||||||||
|
|
|
|
|
|
|
|
|
|||||||||
F-25
Table of Contents
Commercial Real Estate credit exposure, based on internal risk rating:
| As of September 30, 2017 | As of December 31, 2016 | |||||||||||||||
| (Recorded Investment in thousands) | Income producing |
Land and development |
Income producing |
Land and development |
||||||||||||
| Originated Loans |
||||||||||||||||
| Pass |
$ | 1,049,645 | $ | 71,814 | $ | 888,608 | $ | 67,742 | ||||||||
| Special mention |
1,368 | 20 | — | 23 | ||||||||||||
|
|
|
|
|
|
|
|
|
|||||||||
| Total originated loans |
1,051,013 | 71,834 | 888,608 | 67,765 | ||||||||||||
|
|
|
|
|
|
|
|
|
|||||||||
| ANCI Loans |
||||||||||||||||
| Pass |
14,767 | 1,232 | 18,410 | 1,618 | ||||||||||||
| Substandard |
26 | 300 | — | 341 | ||||||||||||
|
|
|
|
|
|
|
|
|
|||||||||
| Total ANCI loans |
14,793 | 1,532 | 18,410 | 1,959 | ||||||||||||
|
|
|
|
|
|
|
|
|
|||||||||
| Total |
$ | 1,065,806 | $ | 73,366 | $ | 907,018 | $ | 69,724 | ||||||||
|
|
|
|
|
|
|
|
|
|||||||||
Consumer credit exposure, based on internal risk rating:
| As of September 30, 2017 | As of December 31, 2016 | |||||||||||||||
| (Recorded Investment in thousands) | Residential Real Estate |
Other | Residential Real Estate |
Other | ||||||||||||
| Originated Loans |
||||||||||||||||
| Pass |
$ | 1,343,065 | $ | 67,294 | $ | 1,126,679 | $ | 59,145 | ||||||||
| Special mention |
328 | 621 | 422 | 455 | ||||||||||||
| Substandard |
1,326 | 321 | 1,096 | 415 | ||||||||||||
|
|
|
|
|
|
|
|
|
|||||||||
| Total originated loans |
1,344,719 | 68,236 | 1,128,197 | 60,015 | ||||||||||||
|
|
|
|
|
|
|
|
|
|||||||||
| ANCI Loans |
||||||||||||||||
| Pass |
113,731 | 2,915 | 141,349 | 7,151 | ||||||||||||
| Special mention |
1,892 | 46 | 2,156 | 53 | ||||||||||||
| Substandard |
2,632 | 2 | 2,775 | 4 | ||||||||||||
|
|
|
|
|
|
|
|
|
|||||||||
| Total ANCI loans |
118,255 | 2,963 | 146,280 | 7,208 | ||||||||||||
|
|
|
|
|
|
|
|
|
|||||||||
| Total |
$ | 1,462,974 | $ | 71,199 | $ | 1,274,477 | $ | 67,223 | ||||||||
|
|
|
|
|
|
|
|
|
|||||||||
Small Business credit exposure, based on internal risk rating:
| As of | ||||||||
| (Recorded Investment in thousands) | September 30, 2017 |
December 31, 2016 |
||||||
| Originated Loans |
||||||||
| Pass |
$ | 204,758 | $ | 182,021 | ||||
| Special mention |
2,624 | 1,807 | ||||||
| Substandard |
668 | 1,116 | ||||||
| Doubtful |
32 | — | ||||||
|
|
|
|
|
|||||
| Total originated loans |
208,082 | 184,944 | ||||||
| ANCI Loans |
||||||||
| Pass |
10,136 | 8,407 | ||||||
| Special mention |
40 | 11 | ||||||
| Substandard |
561 | 764 | ||||||
|
|
|
|
|
|||||
| Total ANCI loans |
10,737 | 9,182 | ||||||
|
|
|
|
|
|||||
| Total |
$ | 218,819 | $ | 194,126 | ||||
|
|
|
|
|
|||||
F-26
Table of Contents
The following provides an aging of past due originated and ANCI loans by portfolio segment and class of receivable as of September 30, 2017 and December 31, 2016:
Aging of Past due Originated and ANCI Loans
| As of September 30, 2017 | ||||||||||||||||||||||||||||
| Accruing Loans | Non-Accruing Loans(1) | |||||||||||||||||||||||||||
| (Recorded Investment in thousands) | 30-59 DPD |
60-89 DPD |
90+DPD | 0-29 DPD |
30-59 DPD |
60-89 DPD |
90+DPD | |||||||||||||||||||||
| Originated Loans |
||||||||||||||||||||||||||||
| Commercial and Industrial |
||||||||||||||||||||||||||||
| General C&I |
$ | — | $ | — | $ | — | $ | 193 | $ | — | $ | — | $ | — | ||||||||||||||
| Energy sector(1) |
— | — | — | 59,801 | 5,883 | — | 6,342 | |||||||||||||||||||||
|
|
|
|
|
|
|
|
|
|
|
|
|
|
|
|||||||||||||||
| Total commercial and industrial |
— | — | — | 59,994 | 5,883 | — | 6,342 | |||||||||||||||||||||
|
|
|
|
|
|
|
|
|
|
|
|
|
|
|
|||||||||||||||
| Commercial Real Estate |
||||||||||||||||||||||||||||
| Income producing |
— | — | — | — | — | — | — | |||||||||||||||||||||
| Land and development |
347 | — | — | — | — | — | — | |||||||||||||||||||||
|
|
|
|
|
|
|
|
|
|
|
|
|
|
|
|||||||||||||||
| Total commercial real estate |
347 | — | — | — | — | — | — | |||||||||||||||||||||
|
|
|
|
|
|
|
|
|
|
|
|
|
|
|
|||||||||||||||
| Consumer |
||||||||||||||||||||||||||||
| Residential real estate |
5,115 | 577 | — | 84 | 262 | — | 755 | |||||||||||||||||||||
| Other |
817 | 30 | — | — | — | — | — | |||||||||||||||||||||
|
|
|
|
|
|
|
|
|
|
|
|
|
|
|
|||||||||||||||
| Total consumer |
5,932 | 607 | — | 84 | 262 | — | 755 | |||||||||||||||||||||
|
|
|
|
|
|
|
|
|
|
|
|
|
|
|
|||||||||||||||
| Small Business Lending |
98 | — | 41 | 39 | 119 | 30 | 124 | |||||||||||||||||||||
|
|
|
|
|
|
|
|
|
|
|
|
|
|
|
|||||||||||||||
| Total(1) |
$ | 6,377 | $ | 607 | $ | 41 | $ | 60,117 | $ | 6,264 | $ | 30 | $ | 7,221 | ||||||||||||||
|
|
|
|
|
|
|
|
|
|
|
|
|
|
|
|||||||||||||||
| ANCI Loans |
||||||||||||||||||||||||||||
| Commercial Real Estate |
||||||||||||||||||||||||||||
| Income producing |
$ | 1,048 | $ | — | $ | 26 | $ | — | $ | — | $ | — | $ | — | ||||||||||||||
| Land and development |
— | — | — | 300 | — | — | — | |||||||||||||||||||||
|
|
|
|
|
|
|
|
|
|
|
|
|
|
|
|||||||||||||||
| Total commercial real estate |
1,048 | — | 26 | 300 | — | — | — | |||||||||||||||||||||
|
|
|
|
|
|
|
|
|
|
|
|
|
|
|
|||||||||||||||
| Consumer |
||||||||||||||||||||||||||||
| Residential real estate |
1,468 | 208 | 171 | 629 | 703 | 228 | 1,028 | |||||||||||||||||||||
| Other |
5 | — | — | — | — | — | — | |||||||||||||||||||||
|
|
|
|
|
|
|
|
|
|
|
|
|
|
|
|||||||||||||||
| Total consumer |
1,473 | 208 | 171 | 629 | 703 | 228 | 1,028 | |||||||||||||||||||||
|
|
|
|
|
|
|
|
|
|
|
|
|
|
|
|||||||||||||||
| Small Business Lending |
721 | — | — | 117 | 49 | 255 | 93 | |||||||||||||||||||||
|
|
|
|
|
|
|
|
|
|
|
|
|
|
|
|||||||||||||||
| Total |
$ | 3,242 | $ | 208 | $ | 197 | $ | 1,046 | $ | 752 | $ | 483 | $ | 1,121 | ||||||||||||||
|
|
|
|
|
|
|
|
|
|
|
|
|
|
|
|||||||||||||||
| (1) | Does not include a $9.9 million nonperforming energy credit that was transferred to the HFS category. |
F-27
Table of Contents
| As of December 31, 2016 | ||||||||||||||||||||||||||||
| Accruing Loans | Non-Accruing Loans | |||||||||||||||||||||||||||
| (Recorded Investment in thousands) | 30-59 DPD |
60-89 DPD |
90+DPD | 0-29 DPD |
30-59 DPD |
60-89 DPD |
90+DPD | |||||||||||||||||||||
| Originated Loans |
||||||||||||||||||||||||||||
| Commercial and Industrial |
||||||||||||||||||||||||||||
| General C&I |
$ | 3,930 | $ | — | $ | — | $ | — | $ | 6,839 | $ | — | $ | 250 | ||||||||||||||
| Energy sector |
— | — | — | 112,937 | — | — | 447 | |||||||||||||||||||||
|
|
|
|
|
|
|
|
|
|
|
|
|
|
|
|||||||||||||||
| Total commercial and industrial |
3,930 | — | — | 112,937 | 6,839 | — | 697 | |||||||||||||||||||||
|
|
|
|
|
|
|
|
|
|
|
|
|
|
|
|||||||||||||||
| Commercial Real Estate |
||||||||||||||||||||||||||||
| Income producing |
4 | — | — | — | — | — | — | |||||||||||||||||||||
|
|
|
|
|
|
|
|
|
|
|
|
|
|
|
|||||||||||||||
| Consumer |
||||||||||||||||||||||||||||
| Residential real estate |
1,388 | 239 | 244 | 344 | — | — | 454 | |||||||||||||||||||||
| Other |
534 | — | — | — | — | — | — | |||||||||||||||||||||
|
|
|
|
|
|
|
|
|
|
|
|
|
|
|
|||||||||||||||
| Total consumer |
1,922 | 239 | 244 | 344 | — | — | 454 | |||||||||||||||||||||
|
|
|
|
|
|
|
|
|
|
|
|
|
|
|
|||||||||||||||
| Small Business Lending |
2,003 | 563 | 87 | 80 | 16 | 36 | — | |||||||||||||||||||||
|
|
|
|
|
|
|
|
|
|
|
|
|
|
|
|||||||||||||||
| Total |
$ | 7,859 | $ | 802 | $ | 331 | $ | 113,361 | $ | 6,855 | $ | 36 | $ | 1,151 | ||||||||||||||
|
|
|
|
|
|
|
|
|
|
|
|
|
|
|
|||||||||||||||
| ANCI Loans |
||||||||||||||||||||||||||||
| Commercial and Industrial |
||||||||||||||||||||||||||||
| General C&I |
$ | — | $ | — | $ | — | $ | 125 | $ | — | $ | — | $ | — | ||||||||||||||
|
|
|
|
|
|
|
|
|
|
|
|
|
|
|
|||||||||||||||
| Commercial Real Estate |
||||||||||||||||||||||||||||
| Land and development |
259 | — | — | — | — | 341 | — | |||||||||||||||||||||
|
|
|
|
|
|
|
|
|
|
|
|
|
|
|
|||||||||||||||
| Consumer |
||||||||||||||||||||||||||||
| Residential real estate |
1,522 | 839 | 252 | 1,083 | 30 | — | 1,619 | |||||||||||||||||||||
| Other |
18 | — | 3 | — | — | — | — | |||||||||||||||||||||
|
|
|
|
|
|
|
|
|
|
|
|
|
|
|
|||||||||||||||
| Total consumer |
1,540 | 839 | 255 | 1,083 | 30 | — | 1,619 | |||||||||||||||||||||
|
|
|
|
|
|
|
|
|
|
|
|
|
|
|
|||||||||||||||
| Small Business Lending |
— | — | — | 480 | 62 | — | 131 | |||||||||||||||||||||
|
|
|
|
|
|
|
|
|
|
|
|
|
|
|
|||||||||||||||
| Total |
$ | 1,799 | $ | 839 | $ | 255 | $ | 1,688 | $ | 92 | $ | 341 | $ | 1,750 | ||||||||||||||
|
|
|
|
|
|
|
|
|
|
|
|
|
|
|
|||||||||||||||
Acquired Credit Impaired (“ACI”) Loans
The excess of cash flows expected to be collected over the carrying value of ACI loans is referred to as the accretable yield and is recognized in interest income using an effective yield method over the remaining life of the loan, or pools of loans. The accretable yield is affected by:
| • | Changes in interest rate indices for variable rate ACI loans—Expected future cash flows are based on the variable rates in effect at the time of the regular evaluations of cash flows expected to be collected; |
| • | Changes in prepayment assumptions—Prepayments affect the estimated life of ACI loans which may change the amount of interest income, and possibly principal, expected to be collected; and |
| • | Changes in the expected principal and interest payments over the estimated life—Updates to expected cash flows are driven by the credit outlook and actions taken with borrowers. |
F-28
Table of Contents
Changes in the amount of accretable discount for ACI loans for the nine months ended September 30, 2017 and 2016 were as follows:
Changes in Accretable Yield on ACI Loans
| For the Nine Months Ended September 30, |
||||||||
| (In thousands) | 2017 | 2016 | ||||||
| Balance at beginning of period |
$ | 98,728 | $ | 122,791 | ||||
| Maturities/payoff |
(8,137 | ) | (8,861 | ) | ||||
| Charge-offs |
(98 | ) | (246 | ) | ||||
| Foreclosure |
(1,056 | ) | (857 | ) | ||||
| Accretion |
(17,955 | ) | (24,024 | ) | ||||
| Reclass from nonaccretable difference due to increases in expected cash flow |
10,617 | 12,567 | ||||||
|
|
|
|
|
|||||
| Balance at end of period |
$ | 82,099 | $ | 101,370 | ||||
|
|
|
|
|
|||||
Impaired ACI Loans and Pools Including TDRs
The following includes certain key information about individually impaired ACI loans and pooled ACI loans as of September 30, 2017 and December 31, 2016 and for the three and nine months ended September 30, 2017 and 2016.
ACI Loans / Pools Identified as Impaired
| As of September 30, 2017 | ||||||||||||||||||||
| ACI Loans / Pools Identified as Impaired | ||||||||||||||||||||
| (In thousands) | Recorded Investment in Impaired Loans(1) |
Unpaid Principal Balance |
Related Specific Allowance |
Nonaccrual Loans Included in Impaired Loans |
Undisbursed Commitments |
|||||||||||||||
| Commercial and industrial |
$ | 14,462 | $ | 19,475 | $ | 103 | $ | — | $ | — | ||||||||||
| Commercial real estate |
89,289 | 120,581 | 1,964 | 225 | 522 | |||||||||||||||
| Consumer |
18,302 | 21,232 | 6,515 | — | 14 | |||||||||||||||
|
|
|
|
|
|
|
|
|
|
|
|||||||||||
| Total |
$ | 122,053 | $ | 161,288 | $ | 8,582 | $ | 225 | $ | 536 | ||||||||||
|
|
|
|
|
|
|
|
|
|
|
|||||||||||
| As of December 31, 2016 | ||||||||||||||||||||
| ACI Loans / Pools Identified as Impaired | ||||||||||||||||||||
| (In thousands) | Recorded Investment in Impaired Loans(1) |
Unpaid Principal Balance |
Related Specific Allowance |
Nonaccrual Loans Included in Impaired Loans |
Undisbursed Commitments |
|||||||||||||||
| Commercial and industrial |
$ | 15,552 | $ | 28,256 | $ | 176 | $ | 1,818 | $ | — | ||||||||||
| Commercial real estate |
53,428 | 82,946 | 2,654 | 1,845 | 1,213 | |||||||||||||||
| Consumer |
44,295 | 50,175 | 7,447 | — | 15 | |||||||||||||||
|
|
|
|
|
|
|
|
|
|
|
|||||||||||
| Total |
$ | 113,275 | $ | 161,377 | $ | 10,277 | $ | 3,663 | $ | 1,228 | ||||||||||
|
|
|
|
|
|
|
|
|
|
|
|||||||||||
| (1) | The recorded investment of a loan also includes any interest receivable, net unearned discount or fees, and unamortized premium or discount. |
F-29
Table of Contents
ACI Loans that Were Modified into TDRs
There were no ACI loans modified into a TDR for the three and nine months ended September 30, 2017. In the nine months ended September 30, 2016, there was one ACI loan modified into a TDR with a recorded investment of $954 thousand. There were no ACI TDRs experiencing payment default during the three and nine months ended September 30, 2017 and 2016. Default is defined as the earlier of the troubled debt restructuring being placed on non-accrual status or obtaining 90 day past due status with respect to principal and interest payments.
Credit Exposure in the ACI Portfolio
The following provides information regarding the credit exposure by portfolio segment and class of receivable as of September 30, 2017 and December 31, 2016:
ACI Loans by Risk Rating / Delinquency Stratification
Commercial and Industrial credit exposure on ACI loans, based on internal risk rating:
| As of September 30, 2017 | As of December 31, 2016 | |||||||||||||||
| (Recorded Investment in thousands) | General C&I | Healthcare | General C&I | Healthcare | ||||||||||||
| Pass |
$ | 23,579 | $ | — | $ | 26,634 | $ | 5,648 | ||||||||
| Special mention |
885 | — | 939 | — | ||||||||||||
| Substandard |
2,556 | 6,250 | 5,484 | — | ||||||||||||
| Doubtful |
35 | — | 33 | — | ||||||||||||
|
|
|
|
|
|
|
|
|
|||||||||
| Total |
$ | 27,055 | $ | 6,250 | $ | 33,090 | $ | 5,648 | ||||||||
|
|
|
|
|
|
|
|
|
|||||||||
Commercial Real Estate credit exposure on ACI loans, based on internal risk rating:
| As of September 30, 2017 | As of December 31, 2016 | |||||||||||||||
| (Recorded Investment in thousands) | Income producing |
Land and development |
Income producing |
Land and development |
||||||||||||
| Pass |
$ | 77,523 | $ | 7,310 | $ | 80,463 | $ | 7,254 | ||||||||
| Special mention |
1,579 | 710 | 5,813 | 933 | ||||||||||||
| Substandard |
6,139 | 2,057 | 13,591 | 3,240 | ||||||||||||
|
|
|
|
|
|
|
|
|
|||||||||
| Total |
$ | 85,241 | $ | 10,077 | $ | 99,867 | $ | 11,427 | ||||||||
|
|
|
|
|
|
|
|
|
|||||||||
Consumer credit exposure on ACI loans, based on internal risk rating:
| As of September 30, 2017 | As of December 31, 2016 | |||||||||||||||
| (Recorded Investment in thousands) | Residential Real Estate |
Other | Residential Real Estate |
Other | ||||||||||||
| Pass |
$ | 136,430 | $ | 1,563 | $ | 157,762 | $ | 1,821 | ||||||||
| Special mention |
3,420 | 12 | 3,655 | 14 | ||||||||||||
| Substandard |
20,266 | 220 | 27,586 | 287 | ||||||||||||
|
|
|
|
|
|
|
|
|
|||||||||
| Total |
$ | 160,116 | $ | 1,795 | $ | 189,003 | $ | 2,122 | ||||||||
|
|
|
|
|
|
|
|
|
|||||||||
F-30
Table of Contents
Consumer credit exposure on ACI loans, based on past due status:
| As of September 30, 2017 | As of December 31, 2016 | |||||||||||||||
| (Recorded Investment in thousands) | Residential Real Estate |
Other | Residential Real Estate |
Other | ||||||||||||
| 0 – 29 Days Past Due |
$ | 144,292 | $ | 1,649 | $ | 171,457 | $ | 1,871 | ||||||||
| 30 – 59 Days Past Due |
4,422 | 62 | 4,070 | 134 | ||||||||||||
| 60 – 89 Days Past Due |
2,001 | 32 | 1,939 | 25 | ||||||||||||
| 90 – 119 Days Past Due |
890 | 14 | 622 | 36 | ||||||||||||
| 120 + Days Past Due |
8,511 | 38 | 10,915 | 56 | ||||||||||||
|
|
|
|
|
|
|
|
|
|||||||||
| Total |
$ | 160,116 | $ | 1,795 | $ | 189,003 | $ | 2,122 | ||||||||
|
|
|
|
|
|
|
|
|
|||||||||
Note 4—Goodwill and Other Intangible Assets
The following table summarizes the Company’s goodwill and other intangible assets at September 30, 2017 and December 31, 2016:
| (In thousands) | September 30, 2017 |
December 31, 2016 |
||||||
| Goodwill |
$ | 317,817 | $ | 317,817 | ||||
| Core deposit intangible, net of accumulated amortization of $37,520 and $35,495, respectively |
2,166 | 4,191 | ||||||
| Customer lists, net of accumulated amortization of $17,583 and $16,041, respectively |
9,117 | 10,659 | ||||||
| Trademarks |
24 | 24 | ||||||
|
|
|
|
|
|||||
| Total goodwill and intangible assets |
$ | 329,124 | $ | 332,691 | ||||
|
|
|
|
|
|||||
Note 5—Derivatives
The Company primarily uses derivatives to manage exposure to market risk, including interest rate risk, credit risk and foreign currency risk, and to assist customers with their risk management objectives. Management will designate certain derivatives as hedging instruments in a qualifying hedge accounting relationship. The Company’s remaining derivatives consist of economic hedges that do not qualify for hedge accounting and derivatives held for customer accommodation, or other purposes.
F-31
Table of Contents
The fair value of derivative positions outstanding is included in other assets and other liabilities in the accompanying consolidated balance sheets and in the net change in each of these financial statement line items in the accompanying consolidated statements of cash flows. For derivatives not designated as hedging instruments, gains and losses due to changes in fair value are included in noninterest income and the operating section of the consolidated statement of cash flows. For derivatives designated as hedging instruments, the effective portion of the gain or loss related to the derivative instrument is recognized as a component of other comprehensive income and subsequently reclassified as interest income when the forecasted transaction affects income. The ineffective portion of the gain or loss is recognized immediately as noninterest income. The notional amounts and estimated fair values as of September 30, 2017 and December 31, 2016 were as follows:
| September 30, 2017 | December 31, 2016 | |||||||||||||||||||||||
| Fair Value | Fair Value | |||||||||||||||||||||||
| (In thousands) | Notional Amount |
Other Assets |
Other Liabilities |
Notional Amount |
Other Assets |
Other Liabilities |
||||||||||||||||||
| Derivatives designated as hedging instruments (cash flow hedges): |
||||||||||||||||||||||||
| Commercial loan interest rate swaps |
$ | 1,332,000 | $ | — | $ | 15,830 | $ | 1,332,000 | $ | 1,184 | $ | 17,225 | ||||||||||||
| Derivatives not designated as hedging instruments: |
||||||||||||||||||||||||
| Commercial loan interest rate swaps |
718,686 | 2,481 | 2,481 | 474,923 | 2,877 | 2,877 | ||||||||||||||||||
| Commercial loan interest rate caps |
267,347 | 104 | 104 | 286,959 | 94 | 94 | ||||||||||||||||||
| Commercial loan interest rate floors |
265,515 | 48 | 48 | 51,878 | 118 | 118 | ||||||||||||||||||
| Mortgage loan held for sale interest rate lock commitments |
10,051 | — | 123 | 3,788 | 88 | — | ||||||||||||||||||
| Mortgage loan forward sale commitments |
5,384 | — | 6 | 7,724 | — | 46 | ||||||||||||||||||
| Mortgage loan held for sale floating commitments |
10,754 | — | — | 5,895 | — | — | ||||||||||||||||||
| Foreign exchange contracts |
45,659 | 713 | 696 | — | — | — | ||||||||||||||||||
|
|
|
|
|
|
|
|
|
|
|
|
|
|||||||||||||
| Total derivatives not designated as hedging instruments |
1,323,396 | 3,346 | 3,458 | 831,167 | 3,177 | 3,135 | ||||||||||||||||||
|
|
|
|
|
|
|
|
|
|
|
|
|
|||||||||||||
| Total derivatives |
$ | 2,655,396 | $ | 3,346 | $ | 19,288 | $ | 2,163,167 | $ | 4,361 | $ | 20,360 | ||||||||||||
|
|
|
|
|
|
|
|
|
|
|
|
|
|||||||||||||
The Company is party to collateral support agreements with certain derivative counterparties. Such agreements require that the Company maintain collateral based on the fair values of derivative transactions. In the event of default by the Company, the counterparty would be entitled to the collateral. At September 30, 2017 and December 31, 2016, the Company was required to post $16.4 million and $20.3 million, respectively, in cash or securities as collateral for its derivative transactions, which are included in “interest-bearing deposits in banks” on the Company’s consolidated balance sheets. The Company’s master agreements represent written, legally enforceable bilateral agreements that (1) create a single legal obligation for all individual transactions covered by the master agreement and (2) in the event of default, provide the non-defaulting counterparty the right to accelerate, terminate, and close-out on a net basis all transactions under the agreement and to promptly liquidate or set-off collateral posted by the defaulting counterparty. As permitted by U.S. GAAP, the Company does not offset fair value amounts for the right to reclaim cash collateral or the obligation to return cash collateral against fair value amounts of derivatives executed with the same counterparty under the master agreement.
F-32
Table of Contents
Gain (loss) included in the consolidated statements of income related to derivative instruments for the three and nine months ended September 30, 2017 and 2016 were as follows:
| For the Three Months Ended September 30, | ||||||||||||||||||||||||
| 2017 | 2016 | |||||||||||||||||||||||
| (In thousands) | OCI | Reclassified from AOCI to interest income |
Noninterest income |
OCI | Reclassified from AOCI to interest income |
Noninterest income |
||||||||||||||||||
| Derivatives designated as hedging instruments (cash flow hedges): |
||||||||||||||||||||||||
| Commercial loan interest rate swaps |
$ | 546 | $ | 409 | $ | — | $ | (4,556 | ) | $ | 2,945 | $ | — | |||||||||||
| Derivatives not designated as hedging instruments: |
||||||||||||||||||||||||
| Mortgage loan held for sale interest rate lock commitments |
$ | — | $ | — | $ | (44 | ) | $ | — | $ | — | $ | (29 | ) | ||||||||||
| Foreign exchange contracts |
— | — | 631 | — | — | 328 | ||||||||||||||||||
| For the Nine Months Ended September 30, | ||||||||||||||||||||||||
| 2017 | 2016 | |||||||||||||||||||||||
| (In thousands) | OCI | Reclassified from AOCI to interest income |
Noninterest income |
OCI | Reclassified from AOCI to interest income |
Noninterest income |
||||||||||||||||||
| Derivatives designated as hedging instruments (cash flow hedges): |
||||||||||||||||||||||||
| Commercial loan interest rate swaps |
$ | 3,872 | $ | 3,442 | $ | — | $ | 27,661 | $ | 8,328 | $ | 329 | ||||||||||||
| Derivatives not designated as hedging instruments: |
||||||||||||||||||||||||
| Mortgage loan held for sale interest rate lock commitments |
$ | — | $ | — | $ | 35 | $ | — | $ | — | $ | 93 | ||||||||||||
| Foreign exchange contracts |
— | — | 1,652 | — | — | 924 | ||||||||||||||||||
Interest Rate Swap and Cap Agreements not designated as hedging derivatives
The Company enters into certain interest rate swap, floor and cap agreements on commercial loans that are not designated as hedging instruments. These derivative contracts relate to transactions in which the Company enters into an interest rate swap, floor or cap with a loan customer while at the same time entering into an offsetting interest rate swap or cap with another financial institution. In connection with each swap transaction, the Company agrees to pay interest to the customer on a notional amount at a variable interest rate and receive interest from the customer on a similar notional amount at a fixed interest rate. At the same time, the Company agrees to pay another financial institution the same fixed interest rate on the same notional amount and receive the same variable interest rate on the same notional amount. The interest rate swap transaction allows the Company’s customer to effectively convert a variable rate loan to a fixed rate. The interest rate cap transaction allows the Company’s customer to minimize interest rate risk exposure to rising interest rates. Because the Company acts as an intermediary for its customer, changes in the fair value of the underlying derivative contracts for the most part offset each other and do not significantly impact the Company’s consolidated statements of income. The Company is exposed to credit loss in the event of nonperformance by the parties to the interest rate swap and cap agreements. However, the Company does not anticipate nonperformance by the counterparties. The estimated fair value has been recorded as an asset and a corresponding liability in the accompanying consolidated balance sheets as of September 30, 2017 and December 31, 2016.
F-33
Table of Contents
Cash Flow Hedges
Cash flow hedge relationships mitigate exposure to the variability of future cash flows or other forecasted transactions. The Company uses interest rate swaps to manage overall cash flow changes related to interest rate risk exposure on benchmark interest rate loans. In June 2015 and March 2016, the Company entered into the following interest rate swap agreements to manage overall cash flow changes related to interest rate risk exposure on benchmark interest rate loans.
| Effective Date |
Maturity Date | Notional Amount (In Thousands) |
Fixed Rate | Variable Rate | ||||
| June 15, 2015 |
December 17, 2018 | $382,000 | 1.3250% | 1 Month LIBOR | ||||
| June 30, 2015 |
December 31, 2019 | 300,000 | 1.5120 | 1 Month LIBOR | ||||
| June 30, 2015 |
December 29, 2017 | 300,000 | 0.9530 | 1 Month LIBOR | ||||
| March 8, 2016 |
February 27, 2026 | 175,000 | 1.5995 | 1 Month LIBOR | ||||
| March 8, 2016 |
February 27, 2026 | 175,000 | 1.5890 | 1 Month LIBOR |
Based on our current interest rate forecast, $1.8 million of net payments on our cash flow hedges is estimated to be recorded in net interest income during the next twelve months. Future changes to interest rates may significantly change actual amounts reclassified to income. There were no reclassifications into income during 2017 or 2016 as a result of any discontinuance of cash flow hedges because the forecasted transaction was no longer probable. The maximum length of time over which the Company is hedging a portion of its exposure to the variability in future cash flows for forecasted transactions is approximately nine years as of September 30, 2017.
Note 6—Deposits
Domestic time deposits $250,000 and over were $371.3 million and $318.8 million at September 30, 2017 and December 31, 2016, respectively. There were no foreign time deposits at either September 30, 2017 or December 31, 2016.
Note 7—Borrowed Funds
Repurchase Agreements
Securities sold under agreements to repurchase generally mature within one to seven days from the transaction date. Securities underlying the repurchase agreements remain under the control of the Company.
Information concerning the Company’s securities sold under agreements to repurchase as of September 30, 2017 and December 31, 2016 is summarized as follows:
| (In thousands) | September 30, 2017 |
December 31, 2016 |
||||||
| Balance at period end |
$ | 3,146 | $ | 3,494 | ||||
| Average balance during the period |
3,881 | 5,948 | ||||||
| Average interest rate during the period |
0.19 | % | 0.19 | % | ||||
| Maximum month-end balance during the period |
$ | 6,286 | $ | 8,031 | ||||
Repurchase agreements are treated as collateralized financing obligations and are reflected as a liability in the consolidated balance sheets.
Senior and Subordinated Debt
In June 2014, the Company and the Bank completed an unregistered $245 million multi-tranche debt transaction and in March 2015, the Company completed an unregistered $50 million debt transaction. These
F-34
Table of Contents
transactions enhanced our liquidity and the Bank’s capital levels to support balance sheet growth. Details of the debt transactions are as follows:
| (In thousands) | September 30, 2017 |
December 31, 2016 |
||||||
| Cadence Bancorporation: |
||||||||
| 4.875% senior notes, due June 28, 2019 |
$ | 145,000 | $ | 145,000 | ||||
| 5.375% senior notes, due June 28, 2021 |
50,000 | 50,000 | ||||||
| 7.250% subordinated notes, due June 28, 2029, callable in 2024 |
35,000 | 35,000 | ||||||
| 6.500% subordinated notes, due March 2025, callable in 2020 |
40,000 | 40,000 | ||||||
|
|
|
|
|
|||||
| Total long-term debt—Cadence Bancorporation |
270,000 | 270,000 | ||||||
| Cadence Bank: |
||||||||
| 6.250% subordinated notes, due June 28, 2029, callable in 2024 |
25,000 | 25,000 | ||||||
| Debt issuance cost and unamortized premium |
(1,738 | ) | (2,693 | ) | ||||
| Purchased 4.875% senior notes, due June 28, 2019 |
(10,078 | ) | (78 | ) | ||||
|
|
|
|
|
|||||
| Total long-term debt |
$ | 283,184 | $ | 292,229 | ||||
|
|
|
|
|
|||||
The senior transactions were structured with 4 and 7 year maturities to provide holding company liquidity and to stagger the Company’s debt maturity profile. The $35 million and $25 million subordinated debt transactions were structured with a 15 year maturity, 10 year call options, and fixed-to-floating interest rates in order to maximize regulatory capital treatment. These subordinated debt structures were designed to achieve full Tier 2 capital treatment for 10 years. The $40 million subordinated debt transaction has a 5 year call option.
The Company’s senior notes are unsecured, unsubordinated obligations and are equal in right of payment to all of the Company’s other unsecured debt. The Company’s subordinated notes are unsecured obligations and will be subordinated in right of payment to all of the Company’s senior indebtedness and general creditors and to depositors at the Bank. The Company’s senior notes and subordinated notes are not guaranteed by any subsidiary of the Company, including the Bank.
The Bank’s subordinated notes are unsecured obligations and are subordinated in right of payment to all of the Bank’s senior indebtedness and general creditors and to depositors of the Bank. The Bank’s subordinated notes are not guaranteed by the Company or any subsidiary of the Bank.
Payment of principal on the Company’s and Bank’s subordinated notes may be accelerated by holders of such subordinated notes only in the case of certain insolvency events. There is no right of acceleration under the subordinated notes in the case of default. The Company and/or the Bank may be required to obtain the prior written approval of the Federal Reserve, and, in the case of the Bank, the OCC, before it may repay the subordinated notes issued thereby upon acceleration or otherwise.
F-35
Table of Contents
Junior Subordinated Debentures
In conjunction with the Company’s acquisition of Cadence Financial Corporation and Encore Bank, N.A., the junior subordinated debentures were marked to their fair value as of their respective acquisition dates. The related mark is being amortized over the remaining term of the junior subordinated debentures. The following is a list of junior subordinated debt:
| (In thousands) | September 30, 2017 |
December 31, 2016 |
||||||
| Junior subordinated debentures, 3 month LIBOR plus 2.85%, due 2033 |
$ | 30,000 | $ | 30,000 | ||||
| Junior subordinated debentures, 3 month LIBOR plus 2.95%, due 2033 |
5,155 | 5,155 | ||||||
| Junior subordinated debentures, 3 month LIBOR plus 1.75%, due 2037 |
15,464 | 15,464 | ||||||
|
|
|
|
|
|||||
| Total par value |
$ | 50,619 | $ | 50,619 | ||||
| Purchase accounting adjustment, net of amortization |
(14,266 | ) | (14,630 | ) | ||||
|
|
|
|
|
|||||
| Total junior subordinated debentures |
$ | 36,353 | $ | 35,989 | ||||
|
|
|
|
|
|||||
Advances from FHLB and Borrowings from FRB
FHLB advances are collateralized by deposits with the FHLB, FHLB stock and loans. FHLB advances were $250 million as of September 30, 2017. $100 million of these advances are fixed rate and will mature in October 2017 while $150 million are short-term daily rate credit advances. There were no outstanding FHLB advances as of December 31, 2016. Any advances are collateralized by $1.6 billion of commercial and residential real estate loans pledged under a blanket lien arrangement as of September 30, 2017.
As of September 30, 2017 and December 31, 2016, the FHLB has issued for the benefit of the Bank irrevocable letters of credit totaling $435 million. The Bank has a $35 million irrevocable letter of credit in favor of the State of Alabama SAFE Program to secure certain deposits of the State of Alabama. This letter of credit expires September 27, 2018 upon 45 days’ prior notice of non-renewal; otherwise it automatically extends for a successive one-year term. The Bank also has a $400 million irrevocable letter of credit to secure a large treasury management deposit. This letter of credit expires May 26, 2018 upon 45 days’ prior notice of non-renewal; otherwise it automatically extends for a successive one-year term.
There were no borrowings from the FRB discount window as of September 30, 2017 and December 31, 2016. Any borrowings from the FRB will be collateralized by $810.8 million in commercial loans pledged under a borrower-in-custody arrangement.
Note 8—Other Noninterest Income and Other Noninterest Expense
The detail of the other noninterest income and other noninterest expense captions presented in the consolidated statements of income is as follows:
| Three Months Ended September 30, |
Nine Months Ended September 30, |
|||||||||||||||
| (In thousands) | 2017 | 2016 | 2017 | 2016 | ||||||||||||
| Other Noninterest Income |
||||||||||||||||
| Insurance revenue |
$ | 1,950 | $ | 1,863 | $ | 5,908 | $ | 6,140 | ||||||||
| Bankcard fees |
1,803 | 1,823 | 5,477 | 5,330 | ||||||||||||
| Income from bank owned life insurance policies |
724 | 736 | 2,550 | 2,200 | ||||||||||||
| Other |
3,385 | (210 | ) | 4,183 | (42 | ) | ||||||||||
|
|
|
|
|
|
|
|
|
|||||||||
| Total other noninterest income |
$ | 7,862 | $ | 4,212 | $ | 18,118 | $ | 13,628 | ||||||||
|
|
|
|
|
|
|
|
|
|||||||||
F-36
Table of Contents
| Three Months Ended September 30, |
Nine Months Ended September 30, |
|||||||||||||||
| (In thousands) | 2017 | 2016 | 2017 | 2016 | ||||||||||||
| Other Noninterest Expense |
||||||||||||||||
| Net cost of operation of other real estate owned |
$ | 453 | $ | 1,126 | $ | 1,175 | $ | 1,916 | ||||||||
| Data processing expense |
1,688 | 1,530 | 5,086 | 4,513 | ||||||||||||
| Special asset expenses |
215 | 391 | 824 | 742 | ||||||||||||
| Consulting and professional fees |
2,069 | 2,040 | 4,710 | 4,441 | ||||||||||||
| Loan related expenses |
532 | 1,071 | 1,569 | 2,252 | ||||||||||||
| FDIC Insurance |
889 | 1,912 | 3,336 | 5,711 | ||||||||||||
| Communications |
650 | 535 | 1,980 | 1,915 | ||||||||||||
| Advertising and public relations |
521 | 303 | 1,365 | 1,025 | ||||||||||||
| Legal expenses |
612 | 337 | 1,552 | 2,059 | ||||||||||||
| Branch closure expenses |
50 | 52 | 143 | 191 | ||||||||||||
| Other |
5,289 | 5,756 | 16,430 | 17,608 | ||||||||||||
|
|
|
|
|
|
|
|
|
|||||||||
| Total other noninterest expense |
$ | 12,968 | $ | 15,053 | $ | 38,170 | $ | 42,373 | ||||||||
|
|
|
|
|
|
|
|
|
|||||||||
Note 9—Income Taxes
Income tax expense for the three and nine months ended September 30, 2017 was $17.5 million and $43.7 million, respectively, compared to $2.1 million and $16.8 million for the same periods in 2016. The effective tax rate was 34.9% and 33.3% for the three and nine months ended September 30, 2017, respectively, compared to 24.2% and 31.4% for the same periods in 2016. The increase in the effective tax rate for the three and nine months ended September 30, 2017 compared to the three and nine months ended September 30, 2016 was primarily driven by an increase in income before income taxes.
The effective tax rate is primarily affected by the amount of pre-tax income, tax-exempt interest income, and the increase in cash surrender value of bank-owned life insurance. The effective tax rate is also affected by discrete items that may occur in any given period, but are not consistent from period-to-period, which may impact the comparability of the effective tax rate between periods.
Note 10—Earnings Per Common Share
The following table displays a reconciliation of the information used in calculating basic and diluted net income per common share for the three and nine months ended September 30, 2017 and 2016.
| For the Three Months Ended September 30, |
For the Nine Months Ended September 30, |
|||||||||||||||
| (In thousands, except per share data) | 2017 | 2016 | 2017 | 2016 | ||||||||||||
| Net income |
$ | 32,577 | $ | 6,607 | $ | 87,662 | $ | 36,789 | ||||||||
|
|
|
|
|
|
|
|
|
|||||||||
| Weighted average common shares outstanding (Basic) |
83,625,000 | 75,000,000 | 80,212,912 | 75,000,000 | ||||||||||||
| Weighted average restricted stock units |
330,685 | 258,375 | 345,425 | 258,375 | ||||||||||||
|
|
|
|
|
|
|
|
|
|||||||||
| Weighted average common shares outstanding (Diluted) |
83,955,685 | 75,258,375 | 80,558,337 | 75,258,375 | ||||||||||||
|
|
|
|
|
|
|
|
|
|||||||||
| Earnings per common share (Basic) |
$ | 0.39 | $ | 0.09 | $ | 1.09 | $ | 0.49 | ||||||||
|
|
|
|
|
|
|
|
|
|||||||||
| Earnings per common share (Diluted) |
$ | 0.39 | $ | 0.09 | $ | 1.09 | $ | 0.49 | ||||||||
|
|
|
|
|
|
|
|
|
|||||||||
F-37
Table of Contents
In March 2017, the Board of Directors approved a 75-for-one stock split of the Company’s common stock. The stock split occurred on April 7, 2017. The effect of the stock split on outstanding shares and earnings per share has been retroactively applied to all periods presented.
Note 11—Related Party Transactions
In the normal course of business, loans are made to directors and executive officers and to companies in which they have a significant ownership interest. In the opinion of management, these loans are made on substantially the same terms, including interest rates and collateral, as those prevailing at the time for comparable transactions with other parties, are consistent with sound banking practices, and are within applicable regulatory and lending limitations. The aggregate balances of related party loans and deposits as of September 30, 2017 and December 31, 2016 were insignificant.
Note 12—Regulatory Matters
The Bank is subject to the capital adequacy requirements of the OCC. The Company, as a bank holding company, is subject to the capital adequacy requirements of the Federal Reserve. Failure to meet minimum capital requirements can initiate certain mandatory and possibly additional discretionary actions by regulators that, if undertaken, could have a direct material effect on the Company’s consolidated financial statements. Under capital adequacy guidelines and the regulatory framework for prompt corrective action, the Company and the Bank must meet specific capital guidelines that involve quantitative measures of assets, liabilities and certain off-balance sheet items as calculated under regulatory accounting practices. Capital amounts and classifications are also subject to qualitative judgment by regulators about components, risk weightings, and other related factors.
The risk-based capital requirements of the Federal Reserve and the OCC define capital and establish minimum capital requirements in relation to assets and off-balance sheet exposure, adjusted for credit risk. The risk-based capital standards currently in effect are designed to make regulatory capital requirements sensitive to differences in risk profiles among bank holding companies and banks, to account for off-balance sheet exposure and to minimize disincentives for holding liquid assets. Assets and off-balance sheet items are assigned to broad risk categories, each with appropriate relative risk weights. The resulting capital ratios represent capital as a percentage of total risk-weighted assets and off-balance sheet items.
The Federal Reserve, the FDIC and the OCC have issued guidelines governing the levels of capital that banks must maintain. The bank guidelines for the period as of September 30, 2017 specify capital tiers, which include the following classifications:
| Capital Tiers |
Tier 1 Capital to (Leverage) |
Common Equity Tier 1 to Risk – Weighted Assets (CET1) |
Tier 1 Capital to Risk – Weighted Assets |
Total Capital to Risk – Weighted Assets | ||||
| Well capitalized |
5% or above | 6.5% or above | 8% or above | 10% or above | ||||
| Adequately capitalized |
4% or above | 4.5% or above | 6% or above | 8% or above | ||||
| Undercapitalized |
Less than 4% | Less than 4.5% | Less than 6% | Less than 8% | ||||
| Significantly undercapitalized |
Less than 3% | Less than 3% | Less than 4% | Less than 6% | ||||
| Critically undercapitalized |
Tangible Equity / Total Assets less than 2% | |||||||
The most recent notification from the OCC categorized the Bank as well-capitalized under the regulatory framework for prompt corrective action (the prompt corrective action requirements are not applicable to the Company). The actual capital amounts and ratios for the Company and the bank as of September 30, 2017 and
F-38
Table of Contents
December 31, 2016 are presented in the following table and as shown, are above the thresholds necessary to be considered “well-capitalized”. Management believes there are no conditions or events that would change that classification in the foreseeable future.
| Consolidated Company | Bank | |||||||||||||||
| (In thousands) | Amount | Ratio | Amount | Ratio | ||||||||||||
| September 30, 2017 |
||||||||||||||||
| Tier 1 leverage |
$ | 1,079,726 | 11.1 | % | $ | 1,181,066 | 12.2 | % | ||||||||
| Common equity tier 1 capital (transitional) |
1,042,920 | 10.8 | 1,132,506 | 11.7 | ||||||||||||
| Tier 1 risk-based capital |
1,079,726 | 11.2 | 1,181,066 | 12.2 | ||||||||||||
| Total risk-based capital |
1,273,724 | 13.2 | 1,301,129 | 13.5 | ||||||||||||
| The minimum amounts of capital and ratios established by banking regulators are as follows: |
||||||||||||||||
| Tier 1 leverage |
$ | 388,553 | 4.0 | % | $ | 388,516 | 4.0 | % | ||||||||
| Common equity tier 1 capital (transitional) |
434,801 | 4.5 | 434,726 | 4.5 | ||||||||||||
| Tier 1 risk-based capital |
579,734 | 6.0 | 579,635 | 6.0 | ||||||||||||
| Total risk-based capital |
772,979 | 8.0 | 772,846 | 8.0 | ||||||||||||
| Well capitalized requirement: |
||||||||||||||||
| Tier 1 leverage |
N/A | N/A | $ | 485,645 | 5.0 | % | ||||||||||
| Common equity tier 1 capital (transitional) |
N/A | N/A | 627,938 | 6.5 | ||||||||||||
| Tier 1 risk-based capital |
N/A | N/A | 772,846 | 8.0 | ||||||||||||
| Total risk-based capital |
N/A | N/A | 966,058 | 10.0 | ||||||||||||
| Consolidated Company | Bank | |||||||||||||||
| (In thousands) | Amount | Amount | Amount | Ratio | ||||||||||||
| December 31, 2016 |
||||||||||||||||
| Tier 1 leverage |
$ | 824,676 | 8.9 | % | $ | 1,035,972 | 11.2 | % | ||||||||
| Common equity tier 1 (CET1) |
793,268 | 8.8 | 989,990 | 11.0 | ||||||||||||
| Tier 1 risk-based capital |
824,676 | 9.2 | 1,035,972 | 11.5 | ||||||||||||
| Total risk-based capital |
1,007,011 | 11.2 | 1,144,519 | 12.8 | ||||||||||||
| The minimum amounts of capital and ratios established by banking regulators are as follows: |
||||||||||||||||
| Tier 1 leverage |
$ | 371,052 | 4.0 | % | $ | 370,836 | 4.0 | % | ||||||||
| Common equity tier 1 (CET1) |
403,718 | 4.5 | 403,578 | 4.5 | ||||||||||||
| Tier 1 risk-based capital |
538,290 | 6.0 | 538,105 | 6.0 | ||||||||||||
| Total risk-based capital |
717,720 | 8.0 | 717,473 | 8.0 | ||||||||||||
| Well capitalized requirement: |
||||||||||||||||
| Tier 1 leverage |
N/A | N/A | $ | 463,546 | 5.0 | % | ||||||||||
| Common equity tier 1 (CET1) |
N/A | N/A | 583,248 | 6.5 | ||||||||||||
| Tier 1 risk-based capital |
N/A | N/A | 717,844 | 8.0 | ||||||||||||
| Total risk-based capital |
N/A | N/A | 897,305 | 10.0 | ||||||||||||
Under regulations controlling national banks, the payment of any dividends by a bank without prior approval of the OCC is limited to the current year’s net profits (as defined by the OCC) and retained net profits of the two preceding years. The Federal Reserve, as primary regulator for bank holding companies, has also stated that all common stock dividends should be paid out of current income. As the Company does not generate income on a stand-alone basis, it does not have the capability to pay common stock dividends without receiving dividends from the Bank.
The Bank is required to maintain average reserve balances in the form of cash or deposits with the Federal Reserve Bank. The reserve balance varies depending upon the types and amounts of deposits. At September 30, 2017 and December 31, 2016, the required reserve balance with the Federal Reserve Bank was approximately $59.6 million and $38.3 million, respectively.
F-39
Table of Contents
Note 13—Commitments and Contingent Liabilities
The consolidated financial statements do not reflect various commitments and contingent liabilities which arise in the normal course of banking business and which involve elements of credit risk, interest rate risk, and liquidity risk. The commitments and contingent liabilities are commitments to extend credit, home equity lines, overdraft protection lines, and standby letters of credit. Such financial instruments are recorded when they are funded. A summary of commitments and contingent liabilities at September 30, 2017 is as follows:
| (In thousands) | ||||
| Commitments to extend credit |
$ | 3,035,455 | ||
| Standby letters of credit |
102,145 | |||
| Performance letters of credit |
22,635 | |||
| Commercial letters of credit |
1,797 | |||
Commitments to extend credit and letters of credit include some exposure to credit loss in the event of nonperformance of the customer. Commitments to extend credit are agreements to lend to a customer as long as there is no violation of any condition established in the contract. In addition, the Company has entered certain commitments to grant loans totaling $402.2 million as of September 30, 2017. Standby letters of credit are conditional commitments issued to guarantee the performance of a customer to a third party. The credit policies and procedures for such commitments are the same as those used for lending activities. Because these instruments have fixed maturity dates and because a number expire without being drawn upon, they generally do not present any significant liquidity risk. No significant losses on commitments were incurred during the three and nine months ended September 30, 2017 and 2016. The Company does not anticipate any significant future losses as a result of these transactions.
The Company makes investments in limited partnerships, including certain low income housing partnerships for which tax credits are received. As of September 30, 2017 and December 31, 2016, unfunded capital commitments totaled $23.2 million and $15.1 million, respectively.
The Company and the Bank are defendants in various pending and threatened legal actions arising in the normal course of business. In the opinion of management, based upon the advice of legal counsel, the ultimate disposition of all pending and threatened legal action will not have a material effect on the Company’s consolidated financial statements.
Note 14—Concentrations of Credit
Most of the loans, commitments and letters of credit involve customers or sponsors in the Company’s market areas. Investments in state and municipal securities also involve governmental entities within the Company’s market areas. General concentrations of credit by type of loan are set forth in Note 3 of these consolidated financial statements. The distribution of commitments to extend credit approximates the distribution of loans outstanding. Letters of credit were granted primarily to commercial borrowers.
Note 15—Supplemental Cash Flow Information
| For the Nine Months Ended September 30, |
||||||||
| (In thousands) | 2017 | 2016 | ||||||
| Cash paid during the year for: |
||||||||
| Interest |
$ | 47,048 | $ | 37,267 | ||||
| Income taxes, net of refunds |
29,105 | 22,516 | ||||||
| Non-cash investing activities (at fair value): |
||||||||
| Transfers of loans to other real estate |
$ | 6,922 | $ | 12,243 | ||||
| Transfers of commercial loans to loans held for sale |
9,397 | 309,415 | ||||||
F-40
Table of Contents
Note 16—Disclosure About Fair Values of Financial Instruments
The Company groups its assets and liabilities measured at fair value in three levels, based on the markets in which the assets and liabilities are traded and the reliability of the assumptions used to determine fair value. This hierarchy requires the Company to maximize the use of observable market data, when available, and to minimize the use of unobservable inputs when determining fair value. Each fair value measurement is placed into the proper level based on the lowest level of significant input. These levels are:
| • | Level 1—Valuation is based upon quoted prices for identical instruments traded in active markets. |
| • | Level 2—Valuation is based upon quoted prices for similar instruments in active markets, quoted prices for identical or similar instruments in markets that are not active, and model-based valuation techniques for which all significant assumptions are observable in the market. |
| • | Level 3—Valuation is generated from model-based techniques that use significant assumptions not observable in the market. These unobservable assumptions reflect management’s estimates of assumptions that market participants would use in pricing the asset or liability. Valuation techniques include use of option pricing models, discounted cash flow models, and similar techniques. |
Transfers between fair value levels are recognized at the end of the fiscal quarter in which the associated change in inputs occurs.
Assets and Liabilities Recorded at Fair Value on a Recurring Basis
The table below presents the Company’s assets and liabilities measured at fair value on a recurring basis categorized by the level of inputs used in the valuation of each asset at September 30, 2017 and December 31, 2016:
| (In thousands) | Carrying Value |
(Level 1) | (Level 2) | (Level 3) | ||||||||||||
| September 30, 2017 |
||||||||||||||||
| Investment securities available-for-sale: |
||||||||||||||||
| U.S. Treasury securities |
$ | 97,688 | $ | — | $ | 97,688 | $ | — | ||||||||
| Obligations of U.S. government agencies |
84,165 | — | 84,165 | — | ||||||||||||
| Mortgage-backed securities issued or guaranteed by U.S. agencies (MBS) |
||||||||||||||||
| Residential pass-through: |
||||||||||||||||
| Guaranteed by GNMA |
112,535 | — | 112,535 | — | ||||||||||||
| Issued by FNMA and FHLMC |
384,042 | — | 384,042 | — | ||||||||||||
| Other residential mortgage-backed securities |
40,568 | — | 40,568 | — | ||||||||||||
| Commercial mortgage-backed securities |
60,990 | — | 60,990 | — | ||||||||||||
|
|
|
|
|
|
|
|
|
|||||||||
| Total MBS |
598,135 | — | 598,135 | — | ||||||||||||
| Obligations of states and municipal subdivisions |
412,216 | — | 412,216 | |||||||||||||
| Other securities |
5,828 | 5,828 | — | — | ||||||||||||
|
|
|
|
|
|
|
|
|
|||||||||
| Total investment securities available-for-sale |
1,198,032 | 5,828 | 1,192,204 | — | ||||||||||||
| Derivative assets |
3,346 | — | 3,346 | — | ||||||||||||
| Other assets (Net profits interests) |
16,193 | — | — | 16,193 | ||||||||||||
|
|
|
|
|
|
|
|
|
|||||||||
| Total recurring basis measured assets |
$ | 1,217,571 | $ | 5,828 | $ | 1,195,550 | $ | 16,193 | ||||||||
|
|
|
|
|
|
|
|
|
|||||||||
| Derivative liabilities |
$ | 19,288 | $ | — | $ | 19,288 | $ | — | ||||||||
|
|
|
|
|
|
|
|
|
|||||||||
| Total recurring basis measured liabilities |
$ | 19,288 | $ | — | $ | 19,288 | $ | — | ||||||||
|
|
|
|
|
|
|
|
|
|||||||||
F-41
Table of Contents
| (In thousands) | Carrying Value |
(Level 1) | (Level 2) | (Level 3) | ||||||||||||
| December 31, 2016 |
||||||||||||||||
| Investment securities available-for-sale: |
||||||||||||||||
| U.S. Treasury securities |
$ | 96,785 | $ | — | $ | 96,785 | $ | — | ||||||||
| Obligations of U.S. government agencies |
97,528 | — | 97,528 | — | ||||||||||||
| Mortgage-backed securities issued or guaranteed by U.S. agencies (MBS) |
||||||||||||||||
| Residential pass-through: |
||||||||||||||||
| Guaranteed by GNMA |
153,153 | — | 153,153 | — | ||||||||||||
| Issued by FNMA and FHLMC |
265,328 | — | 265,328 | — | ||||||||||||
| Other residential mortgage-backed securities |
47,561 | — | 47,561 | — | ||||||||||||
| Commercial mortgage-backed securities |
62,613 | — | 62,613 | — | ||||||||||||
|
|
|
|
|
|
|
|
|
|||||||||
| Total MBS |
528,655 | — | 528,655 | — | ||||||||||||
| Obligations of states and municipal subdivisions |
410,812 | — | 410,812 | — | ||||||||||||
| Other securities |
5,567 | 5,567 | — | — | ||||||||||||
|
|
|
|
|
|
|
|
|
|||||||||
| Total investment securities available-for-sale |
1,139,347 | 5,567 | 1,133,780 | — | ||||||||||||
| Derivative assets |
4,361 | — | 4,361 | — | ||||||||||||
| Other assets (Net profits interest) |
19,425 | — | — | 19,425 | ||||||||||||
|
|
|
|
|
|
|
|
|
|||||||||
| Total recurring basis measured assets |
$ | 1,163,133 | $ | 5,567 | $ | 1,138,141 | $ | 19,425 | ||||||||
|
|
|
|
|
|
|
|
|
|||||||||
| Derivative liabilities |
$ | 20,360 | $ | — | $ | 20,360 | $ | — | ||||||||
|
|
|
|
|
|
|
|
|
|||||||||
| Total recurring basis measured liabilities |
$ | 20,360 | $ | — | $ | 20,360 | $ | — | ||||||||
|
|
|
|
|
|
|
|
|
|||||||||
There were no transfers between the Level 1 and Level 2 fair value categories during the three and nine months ended September 30, 2017 and 2016.
Changes in Level 3 Fair Value Measurements
The tables below include a roll-forward of the condensed consolidated balance sheet amounts for the three and nine months ended September 30, 2017 and 2016, including changes in fair value for financial instruments within Level 3 of the valuation hierarchy. Level 3 financial instruments typically include unobservable components, but may also include some observable components that may be validated to external sources. The gains or (losses) in the following table may include changes to fair value due in part to observable factors that may be part of the valuation methodology:
Level 3 Assets Measured at Fair Value on a Recurring Basis
| Other Assets – Net Profits Interests | ||||||||||||||||
| For the Three Months Ended September 30, |
For the Nine Months Ended September 30, |
|||||||||||||||
| (In thousands) | 2017 | 2016 | 2017 | 2016 | ||||||||||||
| Beginning Balance |
$ | 16,405 | $ | 8,489 | $ | 19,425 | $ | — | ||||||||
| Addition of net profits interest to other assets |
— | — | — | 8,489 | ||||||||||||
| Total net gains (losses) included in earnings |
104 | (161 | ) | (2,427 | ) | (161 | ) | |||||||||
| Distributions received |
(316 | ) | (86 | ) | (805 | ) | (86 | ) | ||||||||
|
|
|
|
|
|
|
|
|
|||||||||
| Balance at September 30 |
$ | 16,193 | $ | 8,242 | $ | 16,193 | $ | 8,242 | ||||||||
|
|
|
|
|
|
|
|
|
|||||||||
| Net unrealized gains (losses) included in earnings relating to assets held at the end of the period |
$ | 104 | $ | (161 | ) | $ | (2,427 | ) | $ | (161 | ) | |||||
|
|
|
|
|
|
|
|
|
|||||||||
F-42
Table of Contents
Assets Recorded at Fair Value on a Nonrecurring Basis
From time to time, the Company may be required to measure certain other financial assets at fair value on a nonrecurring basis in accordance with GAAP. These adjustments to fair value usually result from the application of lower of cost or fair value accounting or write-downs of individual assets. For assets measured at fair value on a nonrecurring basis which were still held on the balance sheets at September 30, 2017 and December 31, 2016, the following tables provide the level of valuation assumptions used to determine each adjustment and the related carrying value:
| (In thousands) | Carrying Value |
(Level 1) | (Level 2) | (Level 3) | ||||||||||||
| September 30, 2017 |
||||||||||||||||
| Loans held for sale |
$ | 21,835 | $ | — | $ | 21,835 | $ | — | ||||||||
| Impaired loans, net of specific allowance |
83,453 | — | — | 83,453 | ||||||||||||
| Other real estate |
18,836 | — | — | 18,836 | ||||||||||||
|
|
|
|
|
|
|
|
|
|||||||||
| Total assets measured on a nonrecurring basis |
$ | 124,124 | $ | — | $ | 21,835 | $ | 102,289 | ||||||||
|
|
|
|
|
|
|
|
|
|||||||||
| (In thousands) | Carrying Value |
(Level 1) | (Level 2) | (Level 3) | ||||||||||||
| December 31, 2016 |
||||||||||||||||
| Loans held for sale |
$ | 17,822 | $ | — | $ | 17,822 | $ | — | ||||||||
| Impaired loans, net of specific allowance |
151,720 | — | — | 151,720 | ||||||||||||
| Other real estate |
18,875 | — | — | 18,875 | ||||||||||||
|
|
|
|
|
|
|
|
|
|||||||||
| Total assets measured on a nonrecurring basis |
$ | 188,417 | $ | — | $ | 17,822 | $ | 170,595 | ||||||||
|
|
|
|
|
|
|
|
|
|||||||||
Significant unobservable inputs used in Level 3 fair value measurements for financial assets measured at fair value on a nonrecurring basis at September 30, 2017 and December 31, 2016 are summarized below:
| (In thousands) | Carrying Value |
Valuation Methods |
Unobservable Inputs |
Range | ||||||||
| September 30, 2017 |
||||||||||||
| Impaired loans, net of specific allowance |
$ | 83,453 | Internal appraisals of accounts receivable and inventory | Discount of book value | 50% - 75% | |||||||
| Third-Party Appraisals | Discount of fair value | 0% - 20% | ||||||||||
| Estimated closing costs | 10% | |||||||||||
| Other real estate |
18,836 | Third-Party Appraisals | Discount of fair value | 0% - 20% | ||||||||
| Estimated closing costs | 10% | |||||||||||
| Quantitative Information about Level 3 Fair Value Measurements | ||||||||||||
| (In thousands) | Carrying Value |
Valuation Methods |
Unobservable Inputs |
Range | ||||||||
| December 31, 2016 |
||||||||||||
| Impaired loans, net of specific allowance |
$ | 151,720 | Internal appraisals of accounts receivable and inventory | Discount of book value | 50% - 75% | |||||||
| Third-Party Appraisals | Discount of fair value | 0% - 20% | ||||||||||
| Estimated closing costs | 10% | |||||||||||
| Other real estate |
18,875 | Third-Party Appraisals | Discount of fair value | 0% - 20% | ||||||||
| Estimated closing costs | 10% | |||||||||||
Determination of Fair Values
In accordance with ASC 820-10-35, fair values are based on the price that would be received to sell an asset or paid to transfer a liability in an orderly transaction between market participants at the measurement date. The
F-43
Table of Contents
following describes the assumptions and methodologies used to estimate the fair value of financial instruments recorded at fair value in the consolidated balance sheets and for estimating the fair value of financial instruments for which fair value is disclosed under ASC 825-10-50.
Investment Securities. When quoted prices are available in an active market, securities are classified as Level 1. For securities reported at fair value utilizing Level 2 inputs, the Company obtains fair value measurements from an independent pricing service. These fair value measurements consider observable market data that may include benchmark yield curves, reported trades, broker/dealer quotes, issuer spreads and credit information, among other inputs.
Loans Held for Sale. Loans held for sale are recorded at the lower of aggregate cost or fair value. Fair value is generally based on quoted market prices of similar loans and is considered to be Level 2.
Net Loans. Fair values of loans are estimated using discounted cash flow analyses using various discount spreads to Treasury yields that approximate interest rates currently being offered for loans with similar terms to borrowers of similar credit quality.
Derivative Financial Instruments. Derivative financial instruments are measured at fair value based on modeling that utilizes observable market inputs for various interest rates published by leading third-party financial news and data providers. This is observable data that represents the rates used by market participants for instruments entered into at that date; however, they are not based on actual transactions so they are classified as Level 2.
Other Assets—Net profits interests. The fair value of the net profit interests in oil and gas reserves was estimated using discounted cash flow analyses applied to the expected cash flows from producing developed wells. Expected cash flows are derived from reports prepared by consulting engineers under established professional standards for the industry.
Deposits. The fair values disclosed for demand deposits are, by definition, equal to the amount payable on demand at the reporting date (that is, their carrying amounts). Fair values for CDs are estimated using a discounted cash flow calculation that applies interest rate spreads to current Treasury yields.
FHLB Advances. The fair value of the FHLB advance approximates its book value considering their short-term maturities.
Security Sold Under Agreements to Repurchase. The carrying amount of security repurchase agreements approximates their fair values.
Senior Debt. The fair value of senior debt was estimated by obtaining broker indications that compared the Company’s senior debt to other comparable financial institutions.
Subordinated Debt. The fair value of subordinated debentures was estimated by obtaining broker indications that compared the Company’s subordinated debentures to other comparable financial institutions.
Junior Subordinated Debentures. The fair value of junior subordinated debentures was estimated by obtaining broker indications that compared the Company’s junior subordinated debentures to other comparable financial institutions.
Limitations. The following fair value estimates are determined as of a specific point in time utilizing various assumptions and estimates. The use of assumptions and various valuation techniques, as well as the absence of secondary markets for certain financial instruments, will likely reduce the comparability of fair value disclosures between financial institutions. The fair values for loans involve the use of significant internally-
F-44
Table of Contents
developed pricing assumptions due to market-illiquidity for loans net of unearned income and loans held for sale as of September 30, 2017 and December 31, 2016. These assumptions are considered to reflect inputs that market participants would use in transactions involving these instruments as of the measurement date. This table only includes financial instruments of the Company, and, accordingly, the total of the fair value amounts does not represent, and should not be construed to represent, the underlying value of the Company.
The estimated fair values of the Company’s financial instruments are as follows:
| As of September 30, 2017 | ||||||||||||||||||||
| (In thousands) |
Carrying Amount |
Fair Value | Level 1 | Level 2 | Level 3 | |||||||||||||||
| Financial Assets: |
||||||||||||||||||||
| Cash and due from banks |
$ | 68,248 | $ | 68,248 | $ | 68,248 | $ | — | $ | — | ||||||||||
| Interest-bearing deposits in other banks |
515,556 | 515,556 | 515,556 | — | — | |||||||||||||||
| Federal funds sold |
5,578 | 5,578 | 5,578 | — | — | |||||||||||||||
| Securities available-for-sale |
1,198,032 | 1,198,032 | 5,828 | 1,192,204 | — | |||||||||||||||
| Securities held-to-maturity |
425 | 451 | — | 451 | — | |||||||||||||||
| Loans held for sale |
21,835 | 21,835 | — | 21,835 | — | |||||||||||||||
| Net loans |
7,934,173 | 7,832,079 | — | — | 7,832,079 | |||||||||||||||
| Derivative assets |
3,346 | 3,346 | — | 3,346 | — | |||||||||||||||
| Other assets-net profits interests |
16,193 | 16,193 | — | — | 16,193 | |||||||||||||||
| Financial Liabilities: |
||||||||||||||||||||
| Deposits |
8,501,102 | 8,365,930 | — | 8,365,930 | — | |||||||||||||||
| Advances from FHLB |
250,000 | 250,000 | — | 250,000 | — | |||||||||||||||
| Securities sold under agreements to repurchase |
3,146 | 3,146 | — | 3,146 | — | |||||||||||||||
| Senior debt |
184,557 | 201,178 | — | 201,178 | — | |||||||||||||||
| Subordinated debt |
98,627 | 100,984 | — | 100,984 | — | |||||||||||||||
| Junior subordinated debentures |
36,353 | 49,163 | — | 49,163 | — | |||||||||||||||
| Derivative liabilities |
19,288 | 19,288 | — | 19,288 | — | |||||||||||||||
| As of December 31, 2016 | ||||||||||||||||||||
| (In thousands) | Carrying Amount |
Fair Value | Level 1 | Level 2 | Level 3 | |||||||||||||||
| Financial Assets: |
||||||||||||||||||||
| Cash and due from banks |
$ | 48,017 | $ | 48,017 | $ | 48,017 | $ | — | $ | — | ||||||||||
| Interest-bearing deposits in other banks |
199,747 | 199,747 | 199,747 | — | — | |||||||||||||||
| Federal funds sold |
1,161 | 1,161 | 1,161 | — | — | |||||||||||||||
| Securities available-for-sale |
1,139,347 | 1,139,347 | 5,567 | 1,133,780 | — | |||||||||||||||
| Securities held-to-maturity |
425 | 463 | — | 463 | — | |||||||||||||||
| Loans held for sale |
17,822 | 17,822 | — | 17,822 | — | |||||||||||||||
| Net loans |
7,350,443 | 7,395,003 | — | — | 7,395,003 | |||||||||||||||
| Derivative assets |
4,361 | 4,361 | — | 4,361 | — | |||||||||||||||
| Other assets-net profits interests |
19,425 | 19,818 | — | — | 19,818 | |||||||||||||||
| Financial Liabilities: |
||||||||||||||||||||
| Deposits |
8,016,749 | 7,904,926 | — | 7,904,926 | — | |||||||||||||||
| Securities sold under agreements to repurchase |
4,361 | 4,361 | — | 4,361 | — | |||||||||||||||
| Senior debt |
193,788 | 191,076 | — | 191,076 | — | |||||||||||||||
| Subordinated debt |
98,441 | 97,938 | — | 97,938 | — | |||||||||||||||
| Junior subordinated debentures |
35,989 | 47,409 | — | 47,409 | — | |||||||||||||||
| Derivative liabilities |
20,360 | 20,360 | — | 20,360 | — | |||||||||||||||
F-45
Table of Contents
Note 17—Segment Reporting
The Company determines reportable segments based on the services offered, the significance of the services offered, the significance of those services to the Company’s financial condition and operating results and management’s regular review of the operating results of those services. The Company operates through three operating segments: Banking, Financial Services and Corporate.
The Banking Segment includes the Commercial Banking, Retail Banking and Private Banking lines of business. The Commercial Banking line of business includes a general business services component primarily focusing on commercial & industrial (C&I), community banking, business banking and commercial real estate lending to clients in the geographic footprint in Texas and the southeast United States. In addition, the Commercial Banking line of business includes within C&I a separate component that focuses on select industries (which is referred to as the “specialized industries”) in which the Company believes it has specialized experience and service capabilities, including energy, healthcare, restaurant industry, and technology. The Company serves clients in these specialized industries both within the geographic footprint and throughout the United States as a result of the national orientation of many of these businesses. The Retail Banking line of business offers a broad range of retail banking services including mortgage services through the branch network to serve the needs of consumer and small businesses in the geographic footprint. The Private Banking line of business offers banking services and loan products tailored to the needs of the high-net worth clients in the geographic footprint.
The Financial Services Segment includes the Trust, Retail Brokerage, Investment Services and Insurance businesses. These businesses offer products independently to their own customers as well as to Banking Segment clients. Investment Services operates through the “Linscomb & Williams” name and Insurance operates though the “Cadence Insurance” name. The products offered by the businesses in the Financial Services Segment primarily generate non-banking service fee income. The Corporate Segment reflects parent-only activities and intercompany eliminations.
Business segment results are determined based upon the management reporting system, which assigns balance sheet and income statement items to each of the business segments. The process is designed around the organizational and management structure and, accordingly, the results derived are not necessarily comparable with similar information published by other financial institutions or in accordance with generally accepted accounting principles.
The Company evaluates performance and allocates resources based on profit or loss from operations. There are no material inter-segment sales or transfers. The accounting policies used by each reportable segment are the same as those discussed in Note 1. All costs, except corporate administration and income taxes, have been allocated to the reportable segments. Therefore, combined amounts agree to the consolidated totals.
The following tables present the operating results of the segments as of and for the three and nine months ended September 30, 2017 and 2016:
| As of and for the Three Months Ended September 30, 2017 | ||||||||||||||||
| (In thousands) | Banking | Financial Services |
Corporate | Consolidated | ||||||||||||
| Net interest income |
$ | 87,123 | $ | (2,340 | ) | $ | (3,620 | ) | $ | 81,163 | ||||||
| Provision for credit losses |
1,723 | — | — | 1,723 | ||||||||||||
| Noninterest income |
13,967 | 12,798 | 359 | 27,124 | ||||||||||||
| Noninterest expense |
46,785 | 9,087 | 658 | 56,530 | ||||||||||||
| Income tax expense (benefit) |
18,404 | 480 | (1,427 | ) | 17,457 | |||||||||||
|
|
|
|
|
|
|
|
|
|||||||||
| Net income (loss) |
$ | 34,178 | $ | 891 | $ | (2,492 | ) | $ | 32,577 | |||||||
|
|
|
|
|
|
|
|
|
|||||||||
F-46
Table of Contents
| As of and for the Three Months Ended September 30, 2016 | ||||||||||||||||
| (In thousands) | Banking | Financial Services |
Corporate | Consolidated | ||||||||||||
| Net interest income |
$ | 74,970 | $ | (58 | ) | $ | (4,486 | ) | $ | 70,426 | ||||||
| Provision for credit losses |
29,627 | — | — | 29,627 | ||||||||||||
| Noninterest income |
12,078 | 10,613 | 100 | 22,791 | ||||||||||||
| Noninterest expense |
46,890 | 7,943 | 43 | 54,876 | ||||||||||||
| Income tax expense (benefit) |
3,685 | 914 | (2,492 | ) | 2,107 | |||||||||||
|
|
|
|
|
|
|
|
|
|||||||||
| Net income (loss) |
$ | 6,846 | $ | 1,698 | $ | (1,937 | ) | $ | 6,607 | |||||||
|
|
|
|
|
|
|
|
|
|||||||||
| As of and for the Nine Months Ended September 30, 2017 | ||||||||||||||||
| (In thousands) | Banking | Financial Services |
Corporate | Consolidated | ||||||||||||
| Net interest income |
$ | 252,240 | $ | (873 | ) | $ | (13,062 | ) | $ | 238,305 | ||||||
| Provision for credit losses |
14,210 | — | — | 14,210 | ||||||||||||
| Noninterest income |
37,178 | 36,517 | 523 | 74,218 | ||||||||||||
| Noninterest expense |
139,239 | 26,361 | 1,385 | 166,985 | ||||||||||||
| Income tax expense (benefit) |
47,589 | 3,249 | (7,172 | ) | 43,666 | |||||||||||
|
|
|
|
|
|
|
|
|
|||||||||
| Net income (loss) |
$ | 88,380 | $ | 6,034 | $ | (6,752 | ) | $ | 87,662 | |||||||
|
|
|
|
|
|
|
|
|
|||||||||
| Total assets |
$ | 10,407,827 | $ | 89,735 | $ | 4,699 | $ | 10,502,261 | ||||||||
|
|
|
|
|
|
|
|
|
|||||||||
| As of and for the Nine Months Ended September 30, 2016 | ||||||||||||||||
| (In thousands) | Banking | Financial Services |
Corporate | Consolidated | ||||||||||||
| Net interest income |
$ | 220,577 | $ | (88 | ) | $ | (13,548 | ) | $ | 206,941 | ||||||
| Provision for credit losses |
54,570 | — | — | 54,570 | ||||||||||||
| Noninterest income |
33,664 | 32,232 | 147 | 66,043 | ||||||||||||
| Noninterest expense |
140,276 | 24,349 | 161 | 164,786 | ||||||||||||
| Income tax expense (benefit) |
20,788 | 2,728 | (6,677 | ) | 16,839 | |||||||||||
|
|
|
|
|
|
|
|
|
|||||||||
| Net income (loss) |
$ | 38,607 | $ | 5,067 | $ | (6,885 | ) | $ | 36,789 | |||||||
|
|
|
|
|
|
|
|
|
|||||||||
| Total assets |
$ | 9,355,328 | $ | 82,327 | $ | 6,355 | $ | 9,444,010 | ||||||||
|
|
|
|
|
|
|
|
|
|||||||||
Note 18—Equity-based Compensation
The Company administers a long-term incentive compensation plan that permits the granting of incentive awards in the form of stock options, restricted stock, restricted stock units, performance units, stock appreciation rights, or other stock-based awards. The terms of all awards issued under these plans are determined by the Compensation Committee of the Board of Directors
The Amended and Restated 2015 Omnibus Incentive Plan (the “Plan”), permits the Company to grant to employees and directors various forms of incentive compensation. The principal purposes of this plan are to focus directors, officers and other employees and consultants on business performance that creates shareholder value, to encourage innovative approaches to the business of the Company, and to encourage ownership of the Company’s stock. The Plan authorizes 7,500,000 common share equivalents available for grant, where grants of full value awards (e.g., shares of restricted stock, restricted stock units and performance stock units) count as one share equivalent. The number of remaining share equivalents available for future issuance under the Plan was 6,827,250 at September 30, 2017.
The Company recorded $0.4 million and $1.2 million equity-based compensation expense for the outstanding restricted stock units for the three and nine months ended September 30, 2017, respectively, compared to $0.3 million and $0.9 million for the same periods in 2016. The remaining expense related to unvested restricted stock units is $2.2 million as of September 30, 2017 and will be recognized over the next 17 months.
F-47
Table of Contents
There were 672,750 outstanding non-vested restricted stock units with a grant date fair value of $5.14. There were no grants or forfeitures for the three and nine months ended September 30, 2017.
Note 19—Accumulated Other Comprehensive Income (Loss)
Activity within the balances in accumulated other comprehensive income (loss) is shown in the following tables for the nine months ended September 30, 2017.
| ` | Unrealized gains (losses) on securities available for sale |
Unrealized gains (losses) on defined benefit pension plans |
Unrealized gains (losses) on derivative instruments designated as cash flow hedges |
Accumulated other comprehensive gain (loss) |
||||||||||||
| Balance, December 31, 2016 |
$ | (21,819 | ) | $ | (500 | ) | $ | (10,212 | ) | $ | (32,531 | ) | ||||
| Net change |
15,410 | — | 272 | 15,682 | ||||||||||||
|
|
|
|
|
|
|
|
|
|||||||||
| Balance, September 30, 2017 |
$ | (6,409 | ) | $ | (500 | ) | $ | (9,940 | ) | $ | (16,849 | ) | ||||
|
|
|
|
|
|
|
|
|
|||||||||
Note 20—Variable Interest Entities and Other Investments
Under ASC 810-10-65, the Company is deemed to be the primary beneficiary and required to consolidate a variable interest entity (“VIE”) if it has a variable interest in the VIE that provides it with a controlling financial interest. For such purposes, the determination of whether a controlling financial interest exists is based on whether a single party has both the power to direct the activities of the VIE that most significantly impact the VIE’s economic performance and the obligation to absorb the losses of the VIE or the right to receive benefits from the VIE that could potentially be significant to the VIE. ASC 810-10-65, as amended, requires continual reconsideration of conclusions reached regarding which interest holder is a VIE’s primary beneficiary.
The Bank has invested in several affordable housing projects as a limited partner. The partnerships have qualified to receive annual affordable housing federal tax credits that are recognized as a reduction of current tax expense. The Company has determined that these structures meet the definition of VIE’s under Topic ASC 810 but that consolidation is not required, as the Bank is not the primary beneficiary. At September 30, 2017 and December 31, 2016, the Bank’s maximum exposure to loss associated with these limited partnerships was limited to the Bank’s investment. The Company accounts for these investments and the related tax credits using either the effective yield method or the proportional amortization method, depending upon the date of the investment. Under the effective yield method, the Bank recognizes the tax credits as they are allocated and amortizes the initial costs of the investments to provide a constant effective yield over the period that the tax credits are allocated. Under the proportional amortization method, the Bank amortizes the cost of the investment in proportion to the tax credits and other tax benefits received and recognizes the net investment performance in the income statement as a component of income tax expense. At September 30, 2017 and December 31, 2016, the Company had recorded investments in other assets on its consolidated balance sheets of approximately $8.3 million and $4.2 million, respectively related to these investments. Additionally, the Company invests in other certain limited partnerships accounted for under the cost method totaling $11.6 million and $6.1 million as of September 30, 2017 and December 31, 2016, respectively and the equity method totaling $8.1 million and $3.9 million as of September 30, 2017 and December 31, 2016, respectively.
During 2016, the Bank received net profits interests in oil and gas reserves, in connection with the reorganization under bankruptcy of two loan customers. The Company has determined that these contracts meet the definition of VIE’s under Topic ASC 810, but that consolidation is not required as the Bank is not the primary beneficiary. The net profits interests are financial instruments and recorded at estimated fair value, which was $16.2 million and $19.4 million at September 30, 2017 and December 31, 2016, respectively, representing the maximum exposure to loss as of that date.
F-48
Table of Contents
The Company has established a rabbi trust related to the deferred compensation plan offered to certain of its employees. The Company contributes employee cash compensation deferrals to the trust. The assets of the trust are available to creditors of the Company only in the event the Company becomes insolvent. This trust is considered a VIE because either there is no equity at risk in the trust or because the Company provided the equity interest to its employees in exchange for services rendered. The Company is considered the primary beneficiary of the rabbi trust as it has the ability to select the underlying investments made by the trust, the activities that most significantly impact the economic performance of the rabbi trust. The Company includes the assets of the rabbi trust as a component of other assets and a corresponding liability for the associated benefit obligation in other liabilities in its consolidated balance sheets. At September 30, 2017 and December 31, 2016, the amount of rabbi trust assets and benefit obligation was $3.5 million and $3.0 million, respectively.
Note 21—Subsequent Events
On November 8, 2017, the Company, priced its previously announced secondary public offering of 9,500,000 shares of the Company’s Class A common stock, par value $0.01 per share (the “Class A Common Stock”), by Cadence Bancorp, LLC, the controlling stockholder of the Company (the “Selling Stockholder”). The underwriters will have a 30-day option to purchase an additional 1,425,000 shares of the Class A Common Stock from the Selling Stockholder. The Company itself did not sell any shares of Class A Common Stock and did not receive any proceeds from the offering, and the offering did not change the number of shares of the Company’s Class A Common Stock that are currently outstanding.
F-49
Table of Contents
Report of Independent Registered Public Accounting Firm
The Board of Directors and Shareholder
Cadence Bancorporation
We have audited the accompanying consolidated balance sheet of Cadence Bancorporation and subsidiaries (the Company) as of December 31, 2016, and the related consolidated statements of income, comprehensive income, changes in shareholder’s equity and cash flows for the year then ended. These financial statements are the responsibility of the Company’s management. Our responsibility is to express an opinion on these financial statements based on our audit.
We conducted our audit in accordance with the standards of the Public Company Accounting Oversight Board (United States). Those standards require that we plan and perform the audit to obtain reasonable assurance about whether the financial statements are free of material misstatement. We were not engaged to perform an audit of the Company’s internal control over financial reporting. Our audits included consideration of internal control over financial reporting as a basis for designing audit procedures that are appropriate in the circumstances, but not for the purpose of expressing an opinion on the effectiveness of the Company’s internal control over financial reporting. Accordingly, we express no such opinion. An audit also includes examining, on a test basis, evidence supporting the amounts and disclosures in the financial statements, assessing the accounting principles used and significant estimates made by management, and evaluating the overall financial statement presentation. We believe that our audit provides a reasonable basis for our opinion.
In our opinion, the financial statements referred to above present fairly, in all material respects, the consolidated financial position of Cadence Bancorporation and subsidiaries at December 31, 2016, and the consolidated results of their operations and their cash flows for the year then ended, in conformity with U.S. generally accepted accounting principles.
/s/ Ernst & Young LLP
Birmingham, Alabama
March 15, 2017, except for Note 25,
as to which the date is April 7, 2017
F-50
Table of Contents
Report of Independent Registered Public Accounting Firm
The Board of Directors and Shareholder
Cadence Bancorporation:
We have audited the accompanying consolidated balance sheet of Cadence Bancorporation and subsidiaries as of December 31, 2015, and the related consolidated statements of income, comprehensive income, shareholder’s equity, and cash flows for each of the years in the two-year period ended December 31, 2015. These consolidated financial statements are the responsibility of the Company’s management. Our responsibility is to express an opinion on these consolidated financial statements based on our audits.
We conducted our audits in accordance with the standards of the Public Company Accounting Oversight Board (United States). Those standards require that we plan and perform the audit to obtain reasonable assurance about whether the financial statements are free of material misstatement. An audit includes examining, on a test basis, evidence supporting the amounts and disclosures in the financial statements. An audit also includes assessing the accounting principles used and significant estimates made by management, as well as evaluating the overall financial statement presentation. We believe that our audits provide a reasonable basis for our opinion.
In our opinion, the consolidated financial statements referred to above present fairly, in all material respects, the financial position of Cadence Bancorporation and subsidiaries as of December 31, 2015, and the results of their operations and their cash flows for each of the years in the two-year period ended December 31, 2015, in conformity with U.S. generally accepted accounting principles.
/s/ KPMG LLP
Houston, Texas
March 25, 2016, except as to
notes 1 and 25, which are as of April 7, 2017
F-51
Table of Contents
CADENCE BANCORPORATION AND SUBSIDIARIES
AS OF DECEMBER 31, 2016 AND 2015
| (Amounts in thousands, except share data) | 2016 | 2015 | ||||||
| ASSETS |
||||||||
| Cash and due from banks |
$ | 48,017 | $ | 139,239 | ||||
| Interest-bearing deposits with banks |
199,747 | 316,473 | ||||||
| Federal funds sold |
1,161 | 11,495 | ||||||
|
|
|
|
|
|||||
| Total cash and cash equivalents |
248,925 | 467,207 | ||||||
| Securities available-for-sale |
1,139,347 | 720,810 | ||||||
| Securities held-to-maturity (estimated fair value of $463 and $594 at December 31, 2016 and 2015, respectively) |
425 | 550 | ||||||
| Other securities—FRB and FHLB stock |
41,493 | 56,354 | ||||||
|
|
|
|
|
|||||
| Total securities |
1,181,265 | 777,714 | ||||||
| Loans held for sale |
17,822 | 25,413 | ||||||
| Loans |
7,432,711 | 6,916,520 | ||||||
| Less: allowance for credit losses |
(82,268 | ) | (79,783 | ) | ||||
|
|
|
|
|
|||||
| Net loans |
7,350,443 | 6,836,737 | ||||||
| Interest receivable |
39,889 | 35,329 | ||||||
| Premises and equipment, net |
66,676 | 70,395 | ||||||
| Other real estate owned |
18,875 | 35,984 | ||||||
| Cash surrender value of life insurance |
105,834 | 102,825 | ||||||
| Net deferred tax asset |
83,662 | 66,712 | ||||||
| Goodwill |
317,817 | 317,817 | ||||||
| Other intangible assets, net |
14,874 | 21,406 | ||||||
| Other assets |
84,806 | 53,972 | ||||||
|
|
|
|
|
|||||
| Total Assets |
$ | 9,530,888 | $ | 8,811,511 | ||||
|
|
|
|
|
|||||
| LIABILITIES AND SHAREHOLDER’S EQUITY |
||||||||
| Liabilities: |
||||||||
| Noninterest-bearing deposits |
$ | 1,840,955 | $ | 1,534,433 | ||||
| Interest-bearing deposits |
6,175,794 | 5,452,918 | ||||||
|
|
|
|
|
|||||
| Total deposits |
8,016,749 | 6,987,351 | ||||||
| Securities sold under agreements to repurchase |
3,494 | 5,840 | ||||||
| Federal Home Loan Bank advances |
— | 370,000 | ||||||
| Senior debt |
193,788 | 193,085 | ||||||
| Subordinated debt |
98,441 | 98,171 | ||||||
| Junior subordinated debentures |
35,989 | 35,449 | ||||||
| Other liabilities |
101,929 | 67,407 | ||||||
|
|
|
|
|
|||||
| Total liabilities |
8,450,390 | 7,757,303 | ||||||
|
|
|
|
|
|||||
| Shareholder’s Equity: |
||||||||
| Common Stock $0.01 par value, authorized 300,000,000 shares; 75,000,000 shares issued and outstanding at December 31, 2016 and 2015 |
750 | 750 | ||||||
| Additional paid-in capital |
879,665 | 879,578 | ||||||
| Retained earnings |
232,614 | 166,840 | ||||||
| Accumulated other comprehensive (loss) income (“OCI”) |
(32,531 | ) | 7,040 | |||||
|
|
|
|
|
|||||
| Total shareholder’s equity |
1,080,498 | 1,054,208 | ||||||
|
|
|
|
|
|||||
| Total Liabilities and Shareholder’s Equity |
$ | 9,530,888 | $ | 8,811,511 | ||||
|
|
|
|
|
|||||
See accompanying notes to the consolidated financial statements.
F-52
Table of Contents
CADENCE BANCORPORATION AND SUBSIDIARIES
CONSOLIDATED STATEMENTS OF INCOME
FOR THE YEARS ENDED DECEMBER 31, 2016, 2015 AND 2014
| (Amounts in thousands) | 2016 | 2015 | 2014 | |||||||||
| INTEREST INCOME |
||||||||||||
| Interest and fees on loans |
$ | 305,553 | $ | 272,434 | $ | 271,378 | ||||||
| Interest and dividends on securities: |
||||||||||||
| Taxable |
15,838 | 14,329 | 12,919 | |||||||||
| Tax-exempt |
8,752 | 2,433 | 326 | |||||||||
| Other |
5,107 | 3,871 | 2,623 | |||||||||
|
|
|
|
|
|
|
|||||||
| Total interest and dividend income |
335,250 | 293,067 | 287,246 | |||||||||
|
|
|
|
|
|
|
|||||||
| INTEREST EXPENSE |
||||||||||||
| Interest on time deposits of $100,000 or greater |
9,610 | 7,794 | 5,883 | |||||||||
| Interest on other deposits |
25,836 | 18,027 | 14,190 | |||||||||
| Interest on borrowed funds |
20,365 | 19,468 | 12,085 | |||||||||
|
|
|
|
|
|
|
|||||||
| Total interest expense |
55,811 | 45,289 | 32,158 | |||||||||
|
|
|
|
|
|
|
|||||||
| Net interest income |
279,439 | 247,778 | 255,088 | |||||||||
| Provision for credit losses |
49,348 | 35,984 | 14,118 | |||||||||
|
|
|
|
|
|
|
|||||||
| Net interest income after provision for credit losses |
230,091 | 211,794 | 240,970 | |||||||||
|
|
|
|
|
|
|
|||||||
| NONINTEREST INCOME |
||||||||||||
| Service charges on deposit accounts |
13,793 | 12,464 | 11,674 | |||||||||
| Other service fees |
2,884 | 2,293 | 2,021 | |||||||||
| Credit related fees |
10,729 | 12,495 | 6,161 | |||||||||
| Trust services revenue |
16,109 | 15,800 | 14,496 | |||||||||
| Mortgage banking revenue, net |
4,663 | 4,384 | 4,435 | |||||||||
| Investment advisory revenue |
18,811 | 17,681 | 18,052 | |||||||||
| Securities gains, net |
3,736 | 1,171 | 659 | |||||||||
| Accretion of FDIC indemnification asset |
— | (1,402 | ) | (2,918 | ) | |||||||
| Other income |
17,678 | 15,017 | 20,490 | |||||||||
|
|
|
|
|
|
|
|||||||
| Total noninterest income |
88,403 | 79,903 | 75,070 | |||||||||
|
|
|
|
|
|
|
|||||||
| NONINTEREST EXPENSE |
||||||||||||
| Salaries and employee benefits |
125,068 | 128,267 | 130,617 | |||||||||
| Premises and equipment |
27,982 | 29,781 | 32,721 | |||||||||
| Intangible asset amortization |
6,532 | 8,428 | 10,326 | |||||||||
| Other expense |
60,598 | 65,856 | 71,483 | |||||||||
|
|
|
|
|
|
|
|||||||
| Total noninterest expense |
220,180 | 232,332 | 245,147 | |||||||||
|
|
|
|
|
|
|
|||||||
| Income before income taxes |
98,314 | 59,365 | 70,893 | |||||||||
| Income tax expense |
32,540 | 20,109 | 26,060 | |||||||||
|
|
|
|
|
|
|
|||||||
| Net income |
65,774 | 39,256 | 44,833 | |||||||||
| Less: |
||||||||||||
| Preferred stock dividend |
— | — | 1,370 | |||||||||
| Preferred stock discount accretion |
— | — | 2,273 | |||||||||
|
|
|
|
|
|
|
|||||||
| Net income attributable to common shareholder |
$ | 65,774 | $ | 39,256 | $ | 41,190 | ||||||
|
|
|
|
|
|
|
|||||||
| Weighted average common shares outstanding (Basic) |
75,000,000 | 75,000,000 | 75,000,000 | |||||||||
| Weighted average common shares outstanding (Diluted) |
75,294,600 | 75,116,100 | 75,000,000 | |||||||||
| Earnings per common share (Basic) |
$ | 0.88 | $ | 0.52 | $ | 0.55 | ||||||
|
|
|
|
|
|
|
|||||||
| Earnings per common share (Diluted) |
$ | 0.87 | $ | 0.52 | $ | 0.55 | ||||||
|
|
|
|
|
|
|
|||||||
See accompanying notes to the consolidated financial statements.
F-53
Table of Contents
CADENCE BANCORPORATION AND SUBSIDIARIES
CONSOLIDATED STATEMENTS OF COMPREHENSIVE INCOME
FOR THE YEARS ENDED DECEMBER 31, 2016, 2015 AND 2014
| (Amounts in thousands) | 2016 | 2015 | 2014 | |||||||||
| Net income |
$ | 65,774 | $ | 39,256 | $ | 44,833 | ||||||
| Other comprehensive (loss) income, net of tax: |
||||||||||||
| Net unrealized (losses) gains on securities available-for-sale: |
||||||||||||
| Unrealized (losses) gains arising during the period (net of $14,691, $1,249 and $(2,442) tax effect, respectively) |
(25,361 | ) | (2,024 | ) | 4,081 | |||||||
| Reclassification adjustments for (gains) realized in net income (net of $1,377, $432 and $250 tax effect, respectively) |
(2,359 | ) | (739 | ) | (409 | ) | ||||||
|
|
|
|
|
|
|
|||||||
| Net unrealized (losses) gains on securities available-for-sale |
(27,720 | ) | (2,763 | ) | 3,672 | |||||||
| Net unrealized (losses) gains on derivative instruments designated as cash flow hedges: |
||||||||||||
| Unrealized (losses) gains arising during the period (net of $2,712 and $(2,748) tax effect, respectively) |
(4,732 | ) | 4,705 | — | ||||||||
| Reclassification adjustments for (gains) realized in net income (net of $4,149 and $1,798 tax effect, respectively) |
(7,106 | ) | (3,079 | ) | — | |||||||
|
|
|
|
|
|
|
|||||||
| Net change in unrealized (losses) gains on derivative instruments |
(11,838 | ) | 1,626 | — | ||||||||
| Change in pension liability: |
||||||||||||
| Actuarial (losses) gains arising during the period (net of $81, $(11) and $308 tax effect, respectively) |
(145 | ) | 15 | (502 | ) | |||||||
| Reclassification adjustments for losses realized in net income (net of $(77), $(58) and $(63) tax effect, respectively) |
132 | 97 | 79 | |||||||||
|
|
|
|
|
|
|
|||||||
| Net unrealized (losses) gains on pension liability |
(13 | ) | 112 | (423 | ) | |||||||
|
|
|
|
|
|
|
|||||||
| Other comprehensive (loss) income |
(39,571 | ) | (1,025 | ) | 3,249 | |||||||
|
|
|
|
|
|
|
|||||||
| Less: |
||||||||||||
| Preferred stock dividend |
— | — | 1,370 | |||||||||
| Preferred stock discount accretion |
— | — | 2,273 | |||||||||
|
|
|
|
|
|
|
|||||||
| Comprehensive income attributable to common shareholder |
$ | 26,203 | $ | 38,231 | $ | 44,439 | ||||||
|
|
|
|
|
|
|
|||||||
See accompanying notes to the consolidated financial statements.
F-54
Table of Contents
CADENCE BANCORPORATION AND SUBSIDIARIES
CONSOLIDATED STATEMENTS OF CHANGES IN SHAREHOLDERS’ EQUITY
FOR THE YEARS ENDED DECEMBER 31, 2016, 2015 AND 2014
| (Amounts in thousands) |
Preferred Stock |
Common Stock |
Additional Paid-in Capital |
Retained Earnings |
Accumulated OCI |
Total Shareholder’s Equity |
||||||||||||||||||
| Balance, December 31, 2013 |
$ | 30,641 | $ | 750 | $ | 876,905 | $ | 90,394 | $ | 4,816 | $ | 1,003,506 | ||||||||||||
| Equity-based compensation cost |
— | — | 1,033 | — | — | 1,033 | ||||||||||||||||||
| Preferred stock dividends |
— | — | — | (1,370 | ) | — | (1,370 | ) | ||||||||||||||||
| Redemption of preferred stock |
(32,914 | ) | — | — | — | — | (32,914 | ) | ||||||||||||||||
| Dividend to parent |
— | — | — | (4,000 | ) | — | (4,000 | ) | ||||||||||||||||
| Preferred stock discount accretion |
2,273 | — | — | (2,273 | ) | — | — | |||||||||||||||||
| Net income |
— | — | — | 44,833 | — | 44,833 | ||||||||||||||||||
| Other comprehensive income |
— | — | — | — | 3,249 | 3,249 | ||||||||||||||||||
|
|
|
|
|
|
|
|
|
|
|
|
|
|||||||||||||
| Balance, December 31, 2014 |
— | 750 | 877,938 | 127,584 | 8,065 | 1,014,337 | ||||||||||||||||||
| Equity-based compensation cost |
— | — | 1,640 | — | — | 1,640 | ||||||||||||||||||
| Net income |
— | — | — | 39,256 | — | 39,256 | ||||||||||||||||||
| Other comprehensive loss |
— | — | — | — | (1,025 | ) | (1,025 | ) | ||||||||||||||||
|
|
|
|
|
|
|
|
|
|
|
|
|
|||||||||||||
| Balance, December 31, 2015 |
— | 750 | 879,578 | 166,840 | 7,040 | 1,054,208 | ||||||||||||||||||
| Equity-based compensation cost |
— | — | 87 | — | — | 87 | ||||||||||||||||||
| Net income |
— | — | — | 65,774 | — | 65,774 | ||||||||||||||||||
| Other comprehensive loss |
— | — | — | — | (39,571 | ) | (39,571 | ) | ||||||||||||||||
|
|
|
|
|
|
|
|
|
|
|
|
|
|||||||||||||
| Balance, December 31, 2016 |
$ | — | $ | 750 | $ | 879,665 | $ | 232,614 | $ | (32,531 | ) | $ | 1,080,498 | |||||||||||
|
|
|
|
|
|
|
|
|
|
|
|
|
|||||||||||||
See accompanying notes to the consolidated financial statements.
F-55
Table of Contents
CADENCE BANCORPORATION AND SUBSIDIARIES
CONSOLIDATED STATEMENTS OF CASH FLOWS
FOR THE YEARS ENDED DECEMBER 31, 2016, 2015 AND 2014
| (Amounts in thousands) | 2016 | 2015 | 2014 | |||||||||
| CASH FLOWS FROM OPERATING ACTIVITIES |
||||||||||||
| Net income |
$ | 65,774 | $ | 39,256 | $ | 44,833 | ||||||
| Adjustments to reconcile net income to net cash provided by operations: |
||||||||||||
| Depreciation and amortization |
13,250 | 18,262 | 20,299 | |||||||||
| Deferred income taxes |
5,980 | (2,928 | ) | 11,127 | ||||||||
| Provision for credit losses |
49,348 | 35,984 | 14,118 | |||||||||
| Net accretion/amortization of fair values of assets acquired and liabilities assumed |
(1,000 | ) | (2,000 | ) | (3,077 | ) | ||||||
| Increase in cash value of life insurance, net |
(2,954 | ) | (2,994 | ) | (2,146 | ) | ||||||
| Securities amortization and accretion, net |
5,899 | 3,908 | 2,474 | |||||||||
| Equity-based compensation costs |
87 | 1,640 | 1,033 | |||||||||
| Gain on sale of securities, net |
(3,736 | ) | (1,171 | ) | (659 | ) | ||||||
| Gain on sale of loans, net |
(2,904 | ) | (2,444 | ) | (3,137 | ) | ||||||
| Loss (gain) on foreclosed property, net |
2,114 | 2,489 | (1,663 | ) | ||||||||
| Loss on sale of branches, net |
— | 1,501 | — | |||||||||
| (Increase) decrease in interest receivable |
(4,155 | ) | 6,712 | (4,079 | ) | |||||||
| Proceeds from sale of mortgage loans held for sale |
137,351 | 148,147 | 144,908 | |||||||||
| Origination of mortgage loans held for sale |
(136,774 | ) | (142,762 | ) | (143,524 | ) | ||||||
| (Increase) decrease in other assets |
(11,278 | ) | 1,785 | 7,459 | ||||||||
| Increase in interest payable |
725 | 1,086 | 425 | |||||||||
| Increase in other liabilities |
286 | 3,736 | 4,280 | |||||||||
|
|
|
|
|
|
|
|||||||
| Net cash flows provided by operating activities |
118,013 | 110,207 | 92,671 | |||||||||
| CASH FLOWS FROM INVESTING ACTIVITIES |
||||||||||||
| Purchase of securities available-for-sale |
(1,120,250 | ) | (478,323 | ) | (180,680 | ) | ||||||
| Purchase of other securities, net |
14,861 | (19,040 | ) | (1,936 | ) | |||||||
| Proceeds from sales of securities available-for-sale |
538,960 | 188,755 | 94,740 | |||||||||
| Proceeds from maturities and calls of securities available-for-sale |
134,501 | 114,064 | 69,292 | |||||||||
| Proceeds from maturities and calls of securities held-to-maturity |
125 | 120 | 110 | |||||||||
| Proceeds from sale of commercial loans held for sale |
328,381 | — | — | |||||||||
| Net cash paid in branch sales |
— | (208,439 | ) | — | ||||||||
| Increase in loans, net |
(913,069 | ) | (805,141 | ) | (1,376,463 | ) | ||||||
| Purchase of premises and equipment |
(5,356 | ) | (11,125 | ) | (6,409 | ) | ||||||
| Proceeds from disposition of foreclosed property |
28,489 | 30,904 | 50,809 | |||||||||
|
|
|
|
|
|
|
|||||||
| Net cash used in investing activities |
(993,358 | ) | (1,188,225 | ) | (1,350,537 | ) | ||||||
| CASH FLOWS FROM FINANCING ACTIVITIES |
||||||||||||
| Increase in deposits, net |
1,029,487 | 661,947 | 1,236,722 | |||||||||
| Net change in securities sold under agreements to repurchase |
(2,346 | ) | (6,204 | ) | 410 | |||||||
| Net change in short-term FHLB borrowings |
(370,000 | ) | 370,000 | — | ||||||||
| Advances of other borrowings, net of debt issuance costs |
— | — | 73,860 | |||||||||
| Purchase of senior debt |
(78 | ) | — | — | ||||||||
| Repayments of other borrowings |
— | — | (75,000 | ) | ||||||||
| Issuance of subordinated debt, net of debt issuance costs |
— | 39,253 | 58,836 | |||||||||
| Issuance of senior debt, net of debt issuance costs |
— | 9,813 | 182,007 | |||||||||
| Redemption of preferred stock |
— | — | (32,914 | ) | ||||||||
| Dividends paid on preferred stock |
— | — | (1,370 | ) | ||||||||
| Dividends paid to Parent |
— | — | (4,000 | ) | ||||||||
|
|
|
|
|
|
|
|||||||
| Net cash provided by financing activities |
657,063 | 1,074,809 | 1,438,551 | |||||||||
|
|
|
|
|
|
|
|||||||
| Net (decrease) increase in cash and cash equivalents |
(218,282 | ) | (3,209 | ) | 180,685 | |||||||
| Cash and cash equivalents at beginning of year |
467,207 | 470,416 | 289,731 | |||||||||
|
|
|
|
|
|
|
|||||||
| Cash and cash equivalents at end of year |
$ | 248,925 | $ | 467,207 | $ | 470,416 | ||||||
|
|
|
|
|
|
|
|||||||
See accompanying notes to the consolidated financial statements.
F-56
Table of Contents
CADENCE BANCORPORATION AND SUBSIDIARIES
NOTES TO CONSOLIDATED FINANCIAL STATEMENTS
Cadence Bancorporation (the “Company” or “CBC”) is a bank holding company whose primary asset is its investment in its wholly owned subsidiary bank, Cadence Bank, N.A. (“the Bank”). In July 2015, Cadence Financial Corporation was merged with and into Cadence Bancorporation, a Delaware corporation previously formed by Cadence Financial Corporation, with Cadence Bancorporation surviving the merger as a wholly owned subsidiary of Cadence Bancorp, LLC (“LLC”). For all periods prior to the completion of the reorganization transactions, references to the “Company” or “CBC” refer to Cadence Financial Corporation, a Mississippi corporation, and its consolidated subsidiaries.
Note 1—Summary of Accounting Policies
Basis of Presentation and Consolidation
The Company and its subsidiaries follow accounting principles generally accepted in the United States of America, including, where applicable, general practices within the banking industry. The consolidated financial statements include the accounts of the Company and its subsidiaries. Significant intercompany accounts and transactions have been eliminated in consolidation. The assessment of whether or not the Company has a controlling interest (i.e., the primary beneficiary) in a variable-interest entity (“VIE”) is performed on an on-going basis. All equity investments in non-consolidated VIEs are included in “other assets” in the Company’s consolidated balance sheets (Note 20).
Certain amounts reported in prior years have been reclassified to conform to the 2016 presentation. These reclassifications did not materially impact the Company’s consolidated balance sheets or consolidated statements of income.
In accordance with the Financial Accounting Standards Board (“FASB”) Accounting Standards Codification (“ASC”) Topic 855, “Subsequent Events,” the Company’s Management has evaluated subsequent events for potential recognition or disclosure in the consolidated financial statements through the date of the issuance of these consolidated financial statements. No subsequent events were identified that would have required a change to the consolidated financial statements or disclosure in the notes to the consolidated financial statements, other than as disclosed in Note 25, Subsequent Events.
Stock Split
In March 2017, the Board of Directors approved a 75 for-one stock split of the Company’s common stock. The stock split occurred on April 7, 2017. The effect of the stock split on outstanding shares and earnings per share has been retroactively applied to all periods presented.
Nature of Operations
The Company’s subsidiaries are as follows:
| • | Town & Country Insurance Agency, Inc., dba Cadence Insurance—full service insurance agency |
| • | The Bank |
The Bank operates under a national bank charter and is subject to regulation by the Office of the Comptroller of the Currency (OCC). The Bank provides lending services in Georgia and full banking services in five southern states: Alabama, Florida, Mississippi, Tennessee, and Texas.
F-57
Table of Contents
The Bank’s subsidiaries are as follows:
| • | Linscomb & Williams—financial advisory firm |
| • | Cadence Investment Services, Inc.—provides investment and insurance products |
Branch Sales
In March and October, 2015, the Company sold the assets and transferred the liabilities of eight branches in Florida (6) and Georgia (2) and recognized a loss of $1.5 million. In March 2014, the Company sold the assets and transferred the liabilities of two branches in Tennessee and recognized a loss of $0.8 million.
The following table summarizes the allocation of the sale price to assets sold and liabilities transferred:
| (In thousands) | 2015 | 2014 | ||||||
| Cash on hand |
$ | 1,254 | $ | 412 | ||||
| Loans |
42,477 | 3,636 | ||||||
| Premises and equipment |
3,095 | 244 | ||||||
| Other assets |
113 | 406 | ||||||
|
|
|
|
|
|||||
| Total assets sold |
46,939 | 4,698 | ||||||
| Deposits |
253,823 | 29,886 | ||||||
| Other liabilities |
301 | 20 | ||||||
|
|
|
|
|
|||||
| Total liabilities transferred |
254,124 | 29,906 | ||||||
|
|
|
|
|
|||||
| Cash paid |
$ | 207,185 | $ | 25,208 | ||||
|
|
|
|
|
|||||
Use of Estimates
The preparation of financial statements in conformity with accounting principles generally accepted in the United States of America (“GAAP”) requires management to make estimates and assumptions that affect the reported amounts of assets and liabilities and disclosure of contingent assets and liabilities at the date of the financial statements and the reported amounts of revenues and expenses during the reporting period. Actual results could differ from those estimates. Material estimates that are susceptible to significant change in the near term are the allowance for credit losses, valuation of and accounting for acquired credit impaired loans, valuation of goodwill, intangible assets and deferred income taxes.
Acquisition Accounting
The Company has determined that the acquisitions completed by the Company of Superior Bank, F.S.B. (“Superior”) in 2011, and Encore Bancshares, Inc. (“Encore”) in 2012, constitute business combinations as defined in ASC Topic 805, “Business Combinations.” Accordingly, as of the date of acquisition, the Company recorded the assets acquired and liabilities assumed at fair value. If the fair value of net assets purchased exceeds the fair value of consideration paid, a bargain purchase gain is recognized at the date of acquisition. Conversely, if the consideration paid exceeds the fair value of the net assets acquired, goodwill is recognized at the acquisition date.
The Company determined initial fair values in accordance with the guidance provided in ASC Topic 820, “Fair Value Measurements and Disclosures.” Fair value was established by discounting the expected future cash flows with a market discount rate for like maturity and risk instruments. The estimation of expected future cash flows requires significant assumptions about appropriate discount rates, expected future cash flows, market conditions and other future events and actual results could differ materially. Fair values are subject to refinement after the closing date of an acquisition as information relative to closing date fair values becomes available. The Company has made the determinations of fair value using the best information available at the time.
F-58
Table of Contents
Securities
Securities are accounted for as follows:
Securities Available-for-Sale
Securities classified as available-for-sale are those securities that are intended to be held for an indefinite period of time, but not necessarily to maturity. Any decision to sell a security classified as available-for-sale would be based on various factors, including movements in interest rates, liquidity needs, security risk assessments, changes in the mix of assets and liabilities and other similar factors. These securities are carried at their estimated fair value, and the net unrealized gain or loss is reported as accumulated other comprehensive income, net of tax, until realized. Premiums and discounts are recognized in interest income using the effective interest method.
Realized gains and losses on the sale of securities available-for-sale are determined by specific identification using the adjusted cost on a trade date basis and are included in securities gains (losses), net.
Securities Held-to-Maturity
Securities classified as held-to-maturity are those securities for which there is a positive intent and ability to hold to maturity. These securities are carried at cost, adjusted for amortization of premium and accretion of discount, computed by the interest method.
Trading Account Securities
Trading account securities are securities that are held for the purpose of selling them at a profit. The Company had no trading account securities as of December 31, 2016 or 2015.
FHLB and FRB Stock
The Company has ownership in Federal Home Loan Bank “FHLB” and Federal Reserve Bank “FRB” stock which do not have a readily determinable fair value and no quoted market values, as ownership is restricted to member institutions, and all transactions take place at par value with the FHLB or FRB as the only purchaser. Therefore, the Company accounts for these investments as long-term assets and carries them at cost. Management’s determination as to whether these investments are impaired is based on management’s assessment of the ultimate recoverability of the par value (cost) rather than recognizing temporary declines in fair value. In order to become a member of the Federal Reserve System, regulations require that the Company hold a certain amount of FRB capital stock. Additionally, investment in FHLB stock is required for membership in the FHLB system and in relation to the level of FHLB outstanding borrowings.
Derivative Financial Instruments and Hedging Activities
Derivative instruments are accounted for under the requirements of ASC Topic 815, “Derivatives and Hedging.” ASC Topic 815 requires companies to recognize all of their derivative instruments as either assets or liabilities in the consolidated balance sheets at fair value.
The fair value of derivative positions outstanding is included in other assets and other liabilities in the accompanying consolidated balance sheets and in the net change in each of these financial statement line items in the accompanying consolidated statements of cash flows. The Company does not speculate using derivative instruments.
Interest Rate Lock Commitments
In the ordinary course of business, the Company enters into certain commitments with customers in connection with residential mortgage loan applications. Such commitments are considered derivatives under
F-59
Table of Contents
current accounting guidance and are required to be recorded at fair value. The change in fair value of these instruments is reflected currently in the mortgage banking revenue of the consolidated statements of income.
Forward Sales Commitments
The Company enters into forward sales commitments of mortgage-backed securities (“MBS”) with investors to mitigate the effect of the interest rate risk inherent in providing interest rate lock commitments to customers. During the period from commitment date to closing date, the Company is subject to the risk that market rates of interest may change. In an effort to mitigate such risk, forward delivery sales commitments, under which the Company agrees to deliver certain MBS, are established. These commitments are non-hedging derivatives in accordance with current accounting guidance and recorded at fair value, with changes in fair value reflected currently in the mortgage banking revenue of the consolidated statements of income.
Forward Purchase Commitments
If the Company determines that the amount of its forward sales commitments exceeds the amount necessary to mitigate the interest rate risk in the interest rate lock commitments, it will enter into forward purchase commitments to purchase MBS on an agreed-upon date and price similar to the terms of forward sales commitments. These commitments are non-hedging derivatives in accordance with current accounting guidance and recorded at fair value, with changes in fair value reflected currently in mortgage banking revenue.
Interest Rate Swap, Floor and Cap Agreements Not Designated as Hedging Derivatives
The Company enters into interest rate swap, floor and cap agreements on commercial loans with customers to meet the financing needs and interest rate risk management needs of its customers. At the same time, the Company enters into an offsetting interest rate swap, floor or cap agreement with a financial institution in order to minimize the Company’s interest rate risk. These interest rate swap and cap agreements are non-hedging derivatives and are recorded at fair value with changes in fair value reflected in noninterest income. The fair value of these derivatives is recorded on the consolidated balance sheets in other assets and other liabilities.
Interest Rate Swap Agreements Designated as Cash Flow Hedges
Cash flow hedge relationships mitigate exposure to the variability of future cash flows or other forecasted transactions. The Company uses interest rate swaps to manage overall cash flow changes related to interest rate risk exposure on benchmark interest rate loans. The effective portion of the gain or loss related to the derivative instrument is recognized as a component of other comprehensive income and subsequently reclassified into interest income when the forecasted transaction affects income. The ineffective portion of the gain or loss is recognized immediately as noninterest income. The Company assesses the effectiveness of the hedging derivative by comparing the change in fair value of the respective derivative instrument and the change in fair value of an effective hypothetical derivative instrument.
Foreign Currency Contracts
The Company enters into certain foreign currency exchange contracts on behalf of its clients to facilitate their risk management strategies, while at the same time entering into offsetting foreign currency exchange contracts in order to minimize the Company’s foreign currency exchange risk. The contracts are short term in nature, and any gain or loss incurred at settlement is recorded as other noninterest income or other noninterest expense. The fair value of these contracts is reported in other assets and other liabilities. The Company does not apply hedge accounting to these contracts.
Counterparty Credit Risk
Derivative contracts involve the risk of dealing with both bank customers and institutional derivative counterparties and their ability to meet contractual terms. Under Company policy, institutional counterparties
F-60
Table of Contents
must be approved by the Company’s Asset/Liability Management Committee. The Company’s credit exposure on derivatives is limited to the net fair value for each counterparty.
Refer to Note 6 for further discussion and details of derivative financial instruments and hedging activities.
Transfers of Financial Assets
Transfers of financials assets are accounted for as sales when control over the transferred assets is surrendered. Control is generally considered to have been surrendered when 1) the transferred assets are legally isolated from the Company or its consolidated affiliates, even in bankruptcy or other receivership, 2) the transferee has the right to pledge or exchange the assets with no conditions that constrain the transferee and provide more than a trivial benefit to the Company, and 3) the Company does not maintain the obligation or unilateral ability to reclaim or repurchase the assets. If these sale criteria are met, the transferred assets are removed from the Company’s balance sheet and a gain or loss on sale is recognized. If not met, the transfer is recorded as a secured borrowing, and the assets remain on the Company’s balance sheet, the proceeds from the transaction are recognized as a liability, and gain or loss on sale is deferred until the sale criterion are achieved. All transfers of financial assets in the reported periods have qualified and been recorded as sales.
Loans Held for Sale
Mortgage Loans Held for Sale
Mortgage loans originated and intended for sale in the secondary market are carried at the lower of cost or estimated fair value in the aggregate. Generally, loans in this category are sold within thirty days. These loans are primarily sold with the mortgage servicing rights released. Fees on mortgage loans sold individually in the secondary market, including origination fees, service release premiums, processing and administrative fees, and application fees, are recognized as mortgage banking revenue in the period in which the loans are sold. These loans are underwritten to the standards of upstream correspondents and are held on the Company’s consolidated balance sheets until the loans are sold. Buyers generally have recourse to return a purchased loan to the Company under limited circumstances. Recourse conditions may include early payment default, breach of representations or warranties, and documentation deficiencies. During 2016, 2015 and 2014, an insignificant number of loans were returned to the Company.
Commercial Loans Held for Sale
The Company transfers certain commercial loans to held for sale when management has the intent to sell the loan or a portion of the loan in the near term. These held for sale loans are recorded at the lower of cost or estimated fair value. At the time of transfer, write-downs on the loans are recorded as charge-offs and a new cost basis is established. Any subsequent lower of cost or market adjustment is determined on an individual loan basis and is recognized as a valuation allowance with any charges included in other noninterest expense. Gains and losses on the sale of these loans are included in other noninterest income when realized.
A summary of the loans held for sale at December 31, 2016 and 2015 is as follows:
| For the Year Ended December 31, |
||||||||
| (In thousands) | 2016 | 2015 | ||||||
| Mortgage loans held for sale |
$ | 8,369 | $ | 6,099 | ||||
| Commercial loans held for sale |
9,453 | 19,314 | ||||||
|
|
|
|
|
|||||
| Loans held for sale |
$ | 17,822 | $ | 25,413 | ||||
|
|
|
|
|
|||||
F-61
Table of Contents
Loans (Excluding Acquired Credit Impaired Loans)
Loans include loans that are originated by the Company and acquired loans that are not considered impaired at acquisition. Loans originated by the Company are carried at the principal amount outstanding adjusted for the allowance for credit losses, net deferred origination fees, and unamortized discounts and premiums. Interest income is recognized based on the principal balance outstanding and the stated rate of the loan. Loan origination fees and certain direct origination costs are capitalized and recognized as an adjustment of the yield on the related loan. Loans acquired through acquisition are initially recorded at fair value. Discounts created when the loans were recorded at their estimated fair values at acquisition are accreted over the remaining term of the loan as an adjustment to the related loan’s yield.
Commercial loans, including small business loans, are generally placed on nonaccrual status when principal or interest is past due ninety days or more unless the loan is well secured and in the process of collection, or when the loan is specifically determined to be impaired. Consumer loans, including residential first and second lien loans secured by real estate, are generally placed on nonaccrual status when they are 120 or more days past due.
The accrual of interest, as well as the amortization/accretion of any remaining unamortized net deferred fees or costs and discount or premium, is generally discontinued at the time the loan is placed on nonaccrual status. All accrued but uncollected interest for loans that are placed on nonaccrual status is reversed through interest income. Cash receipts received on nonaccrual loans are generally applied against principal until the loan has been collected in full, after which time any additional cash receipts are recognized as interest income (i.e., cost recovery method). However, interest may be accounted for under the cash-basis method as long as the remaining recorded investment in the loan is deemed fully collectible.
Non-impaired loans are evaluated for potential charge-off in accordance with the parameters discussed below or when the loan is placed on non-accrual status, whichever is earlier. Loans within the commercial portfolio (except for acquired credit impaired) are generally evaluated for charge-off at 90 days past due, unless both well-secured and in the process of collection. Closed and open-end residential mortgage and consumer loans (except for acquired credit impaired) are evaluated for charge-off no later than 120 days past due. Any outstanding loan balance in excess of the fair value of the collateral less costs to sell is charged-off no later than 180 days past due for loans secured by real estate. For non-real estate secured loans, in lieu of charging off the entire loan balance, loans may be written down to the fair value of the collateral less costs to sell if repossession of collateral is assured and in process.
A loan is considered to be impaired when it appears probable that the entire amount contractually due will not be collected. Factors considered in determining impairment include payment status, collateral values, and the probability of collecting scheduled payments of principal and interest when due. The measurement of impaired loans is based on the present value of expected future cash flows discounted at the loan’s effective interest rate or the loan’s observable market price, or based on the fair value of the collateral if the loan is collateral dependent.
Included in impaired loans are loans considered troubled debt restructurings (“TDRs”). The Company attempts to work with borrowers when necessary to extend or modify loan terms to better align with the borrower’s ability to repay. Extensions and modifications to loans are made in accordance with internal policies and guidelines which conform to regulatory guidance. A modification is classified as a TDR if the borrower is experiencing financial difficulty and it is determined that the Company has granted a concession to the borrower. The Company may determine that a borrower is experiencing financial difficulty if the borrower is currently in default on any of its debt, or if it is probable that a borrower may default in the foreseeable future without the modification. Concessions could include reductions of interest rates, extension of the maturity date at a rate lower than current market rate for a new loan with similar risk, reduction of accrued interest, principal forgiveness, forbearance, or other concessions. The assessments of whether a borrower is experiencing or will likely experience financial difficulty and whether a concession has been granted is highly subjective in nature, and management’s judgment is required when determining whether a modification is classified as a TDR. Current amendments to the accounting guidance preclude a creditor from using the effective interest rate test in the
F-62
Table of Contents
debtor’s guidance on restructuring of payables (paragraph 470-60-55-10) when evaluating whether a restructuring constitutes a TDR.
Allowance for Credit Losses
The allowance for credit losses (“ACL”) is established through charges to income in the form of a provision for credit losses. The ACL is maintained at a level that management believes is adequate to absorb all probable losses on loans inherent in the loan portfolio as of the reporting date. Events that are not within the Company’s control, such as changes in economic factors, could change subsequent to the reporting date and could cause the ACL to be overstated or understated. The amount of the ACL is affected by loan charge-offs, which decrease the ACL; recoveries on loans previously charged off, which increase the ACL; and the provision for credit losses charged to income, which increases the ACL. In determining the provision for credit losses, management monitors fluctuations in the ACL resulting from actual charge-offs and recoveries and reviews the size and composition of the loan portfolio in light of current and anticipated economic conditions.
The ACL is comprised of the following four components:
| • | Specific reserves are recorded on loans reviewed individually for impairment. Generally, all loans that are individually identified as impaired are reviewed on a quarterly basis in order to determine whether a specific reserve is required. A loan is considered impaired when, based on current information, it is probable that we will not receive all amounts due in accordance with the contractual terms of the loan agreement. Once a loan has been identified as impaired, management measures impairment in accordance with ASC Topic 310, “Receivables.” The measurement of impaired loans is based on the present value of expected future cash flows discounted at the loan’s effective interest rate or the loan’s observable market price, or based on the fair value of the collateral if the loan is collateral dependent. When management’s measured value of the impaired loan is less than the recorded investment in the loan, the amount of the impairment is recorded as a specific reserve. These specific reserves are determined on an individual loan basis based on management’s current evaluation of the loss exposure for each credit, given the payment status, the financial condition of the borrower and any guarantors and the value of any underlying collateral. Loans that are individually identified as impaired are excluded from the general reserve calculation described below. Changes in specific reserves from period to period are the result of changes in the circumstances of individual loans such as charge-offs, payments received, changes in collateral values or other factors. |
| • | For loans not considered to be impaired, a general reserve is maintained for each loan segment in the loan portfolio. Due to the growth of the credit portfolio into new geographic areas and into new commercial segmentations and the lack of seasoning of the portfolio, the Company recognizes there is limited historical loss information to adequately estimate loss rate bands based primarily on historical loss data. Therefore, external loss data was acquired from the research arm of a nationally recognized risk rating agency to act as a proxy for loss rates within the ACL model until sufficient loss history can be accumulated from the Company’s loss experience in these segments. These loss rate bands were developed specifically for the Company’s customer risk profile and portfolio mix. The Company monitors actual loss experience for each loan segment for adjustments required to the loss rates utilized. |
| • | In assessing the overall risk of the credit portfolio, the ACL Committee also considers the following qualitative factors that may indicate additional credit losses within the current credit portfolio. Management discretion dictates how these factors should affect certain segments (or the entire portfolio) according to a number of basis points to be added to (or subtracted from) loan loss rates. By their nature, qualitative adjustments attempt to quantify and standardize factors that serve as “leading indicators” of credit deterioration or improvement. These primary adjustment factors include, but are not limited to the following: |
| • | Lending policies, procedures, practices or philosophy, including underwriting standards and collection, charge-off and recovery practices |
F-63
Table of Contents
| • | Changes in national and service market economic and business conditions that could affect the level of default rates or the level of losses once a default has occurred within the Bank’s existing loan portfolio |
| • | Changes in the nature or size of the portfolio |
| • | Changes in portfolio collateral values |
| • | Changes in the experience, ability, and depth of lending management and other relevant staff |
| • | Volume and/or severity of past due and classified credits or trends in the volume of losses, non-accrual credits, impaired credits and other credit modifications |
| • | Quality of the institution’s credit review system and processes and the degree of oversight by bank management and the board of directors |
| • | Concentrations of credit such as industry and lines of business |
| • | Competition and legal and regulatory requirements or other external factors. |
| • | In connection with acquisitions (see Accounting for Acquired Loans and FDIC Loss Share Receivable below), the Company acquired certain loans considered impaired and accounts for these loans under the provisions of ASC Topic 310-30, Loans and Debt Securities Acquired with Deteriorated Credit Quality, which require the initial recognition of these loans at the present value of amounts expected to be received. The ACL previously associated with these loans does not carry over to the books of the acquiring entity. Any decreases in expected cash flows subsequent to acquisition are recorded in the ACL. For any increases in cash flows expected to be collected, the Company adjusts the amount of accretable yield recognized on a prospective basis over the loan’s or pool’s remaining life. The Company also accounts for certain acquired loans considered performing at the time of acquisition by analogy to ASC 310-30. These loans are acquired at a discount, attributable in part to credit quality, for which the Company believes based on the characteristics of the loans that accounting under ASC 310-30 is appropriate. |
Management presents the quarterly review of the ACL to the Bank’s Board of Directors, indicating any recommendations as to adjustments in the ACL. This evaluation is inherently subjective as it requires estimates that are susceptible to significant revision as more information becomes available or as events change.
The reserve for unfunded commitments is determined by assessing three distinct pieces: unfunded commitment volatility in the portfolio (excluding commitments related to letters of credit), adverse letters of credit, and adverse lines of credit. Unfunded commitment volatility is calculated on a trailing eight quarter basis; the resulting expected funding amount is then reserved for based on the current combined reserve rate of the originated and ANCI loans. Adverse lines and letters of credit are assessed individually based on funding and loss expectations as of the period end. The reserve for unfunded commitments is recorded in other liabilities and other noninterest expense separate from the allowance and provision for credit losses. As of December 31, 2016 and 2015 the reserve for unfunded commitments totaled $1.6 million and $0.8 million, respectively.
Accounting for Acquired Loans and FDIC Loss Share Receivable
Acquired Loans
The Company accounts for its acquisitions under ASC Topic 805, which requires the use of the acquisition method of accounting. All identifiable assets acquired, including loans, are recorded at fair value. No ACL related to the acquired loans is recorded on the acquisition date as the fair value of the loans acquired incorporates assumptions regarding credit risk. Loans acquired are recorded at fair value in accordance with the fair value methodology prescribed in ASC Topic 820, exclusive of the shared-loss agreements with the Federal Deposit Insurance Corporation (“FDIC”) (see “FDIC Indemnification Asset” below). The fair value estimates associated with the loans include estimates related to the amount and timing of undiscounted expected principal, interest and other cash flows, as well as the appropriate discount rate. At the time of acquisition, the Company
F-64
Table of Contents
estimated the fair value of the total acquired loan portfolio by segregating the portfolio into loan pools with similar characteristics and certain specifically-reviewed non-homogeneous loans. The similar characteristics used to establish the pools included:
| • | Risk rating, |
| • | The loan type based on regulatory reporting guidelines; namely whether the loan was a residential, construction, consumer, or commercial loan, and |
| • | The nature of collateral. |
From these pools, the Company used certain loan information, including outstanding principal balance, estimated probability of default and loss given default, weighted average maturity, weighted average term to re-price (if a variable rate loan), estimated prepayment rates, and weighted average interest rate to estimate the expected cash flow for each loan pool. For the specifically-reviewed loans expected cash flows were determined for each loan based on current performance and collateral values, if the loan is collateral dependent.
The Company accounts for and evaluates acquired credit impaired (“ACI”) loans in accordance with the provisions of ASC Topic 310-30. When ACI loans exhibit evidence of credit deterioration since origination and it is probable at the date of acquisition that the Company will not collect all principal and interest payments in accordance with the terms of the loan agreement, the expected shortfall in future cash flows, as compared to the contractual amount due, is recognized as a non-accretable discount. Any excess of expected cash flows over the acquisition date fair value is known as the accretable discount, and is recognized as accretion income over the life of each pool or individual loan. ACI loans that meet the criteria for non-accrual of interest at the time of acquisition may be considered performing upon acquisition, regardless of whether the customer is contractually delinquent, if the timing and expected cash flows on such loans can be reasonably estimated and if collection of the new carrying value of such loans is expected. However, if the timing or amount of the expected cash flows cannot be reasonably estimated an ACI loan may be placed in nonaccruing status. Expected cash flows over the acquisition date fair value are periodically re-estimated utilizing the same cash flow methodology used at the time of acquisition and subsequent decreases to the expected cash flows will generally result in a provision for loan losses charge to the Company’s consolidated statements of income. Conversely, subsequent increases in expected cash flows result in a transfer from the non-accretable discount to the accretable discount, which would have a positive impact on accretion income prospectively. These cash flow evaluations are inherently subjective as they require material estimates, all of which may be susceptible to significant change.
FDIC Indemnification Asset
An FDIC indemnification asset results from the loss sharing agreement in an FDIC-assisted transaction and is measured separately from the related covered assets as they are not contractually embedded in those assets and are not transferable should the Company choose to dispose of the covered assets. The FDIC indemnification asset represents the estimated fair value of expected reimbursements from the FDIC for losses on covered loans and other real estate owned (“OREO”).
As indemnified assets are resolved and the Company is reimbursed by the FDIC for the value of the resolved portion of the FDIC indemnification asset, the Company reduces the carrying value of the FDIC indemnification asset. As of December 31, 2012, the Company had submitted claims in excess of the first threshold of $347 million established at acquisition and was reimbursed the 80% of the covered losses by the FDIC up to this initial threshold. Subsequent claims between $347 million and $504 million are not reimbursable under the loss share agreement. The Company’s claims did not exceed the second threshold of $504 million, over which losses are reimbursed at 80%. On January 5, 2016, a settlement agreement was finalized with the FDIC to terminate the loss share agreement at a nominal cost and the Company had no FDIC indemnification asset recorded as of December 31, 2016 and 2015.
F-65
Table of Contents
Premises and Equipment
Premises and equipment are stated at cost, less accumulated depreciation and amortization. Depreciation and amortization are determined using the straight-line method at rates calculated to depreciate or amortize the cost of assets over their estimated useful lives.
Maintenance and repairs of property and equipment are charged to expense, and major improvements that extend the useful life of the asset are capitalized. Upon retirement, sale, or other disposition of property and equipment, the cost and accumulated depreciation are eliminated from the accounts, and any gains or losses are included in income.
The Company leases various premises and equipment under operating leases. The leases have varying terms, with most containing renewal or first-right-of-refusal options for multi-year periods and annual increases in base rates. Leasehold improvements are depreciated over the lesser of the estimated useful life or the lease term.
Other Real Estate
OREO consists of properties acquired through foreclosure and unutilized bank-owned properties. These properties, as held for sale properties, are recorded at fair value, less estimated costs to sell, on the date of foreclosure establishing a new cost basis for the property. Subsequent to the foreclosure date the OREO is maintained at the lower of cost or fair value. Any write-down to fair value required at the time of foreclosure is charged to the ACL. Subsequent gains or losses on other real estate resulting from the sale of the property or additional valuation allowances required due to further declines in fair value are reported in other noninterest expense. The amount of loans in the process of foreclosure for single-family residential properties was $0.6 million and $0.8 million as of December 31, 2016 and 2015, respectively. The amount of foreclosed residential real estate properties held as a result of obtaining physical possession was $5.3 million and $13.8 million as of December 31, 2016 and 2015, respectively.
Net Profits Interests
The Bank owns net profits interests in oil and gas reserves received in connection with the reorganization under bankruptcy of two loan customers. These interests are considered financial interests and are recorded at estimated fair value using discounted cash flow analyses applied to the expected cash flows from the producing developed wells. Because the expected cash flows are based on the current and projected prices for oil and gas, the fair value is subject to change based on these commodity markets. Any adjustments to the fair value will be recorded in other noninterest income. The amount in other assets was $19.4 million as of December 31, 2016. There were no net profits interests prior to 2016. See note 19, Disclosure About Fair Value of Financial Instruments, for more information.
Goodwill and Other Intangible Assets
Goodwill is accounted for in accordance with ASC Topic 350, and accordingly is not amortized but is evaluated for impairment at least annually in the fourth quarter or more frequently if an event occurs or circumstances change that would more likely than not reduce the fair value of a reporting unit below its carrying amount. As part of its testing, the Company may elect to first assess qualitative factors to determine whether it is more likely than not that the fair value of a reporting unit is less than its carrying amount. If the results of the qualitative assessment indicate that more likely than not a reporting unit’s fair value is less than its carrying amount, the Company determines the fair value of the respective reporting unit (through the application of various quantitative valuation methodologies) relative to its carrying amount to determine whether quantitative indicators of potential impairment are present (i.e., Step 1). The Company may also elect to bypass the qualitative assessment and begin with Step 1. If the results of Step 1 indicate that the fair value of the reporting unit may be below its carrying amount, the Company determines the fair value of the reporting unit’s assets and liabilities, considering deferred taxes, and then measures impairment loss by comparing the implied fair value of goodwill with the carrying amount of that goodwill (i.e., Step 2).
F-66
Table of Contents
A reporting unit is defined as an operating segment or a component of that operating segment, as defined in ASC 280. Reporting units may vary, depending on the level at which performance of the segment is reviewed. No impairment was identified in any reporting unit in 2016, 2015 or 2014.
Other identifiable intangible assets consist primarily of the core deposit premiums and customer relationships arising from acquisitions. These intangibles were established using the discounted cash flow approach and are being amortized using an accelerated method over the estimated remaining life of each intangible recorded at acquisition. These finite-lived intangible assets are reviewed for impairment when events or changes in circumstances indicate that the asset’s carrying amount may not be recoverable from undiscounted future cash flows or that it may exceed its fair value.
Income Taxes
The Company and its significant subsidiaries are subject to income taxes in federal, state and local jurisdictions, and such corporations account for income taxes under the asset and liability method in accordance with ASC Topic 740. Deferred tax assets and liabilities are recognized for the future tax consequences attributable to differences between the financial statement carrying amounts of existing assets and liabilities and their respective tax bases and net operating loss and tax credit carryforwards. Deferred tax assets and liabilities are measured using enacted tax rates expected to apply to taxable income in the years in which those temporary differences are expected to be recovered or settled.
The recognition of a net deferred tax asset is dependent upon a “more likely than not” expectation of realization of the net deferred tax asset, based upon the analysis of available evidence. The net deferred tax asset recoverability is calculated using a consistent approach, which considers the relative impact of negative and positive evidence, including review of historical financial performance, and all sources of future taxable income, such as projections of future taxable income exclusive of future reversals of temporary differences and carryforwards, tax planning strategies, and any carryback availability. A valuation allowance is required to sufficiently reduce the net deferred tax asset to the amount that is expected to be realized on a “more likely than not” basis. Changes in the valuation allowance are generally recorded through income.
Cash Surrender Value of Life Insurance
The Company invests in bank-owned life insurance (“BOLI”), which involves the purchasing of life insurance on selected employees. The Company is the owner of the policies and, accordingly, the cash surrender value of the policies is included in total assets, and increases in cash surrender values are reported as income in the consolidated statements of income. The cash value accumulation on BOLI is permanently tax deferred if the policy is held to the insured person’s death and certain other conditions are met.
Revenue Recognition
Service Charges on Deposit Accounts
Service charges on deposit accounts consist of non-sufficient funds fees, account analysis fees, and other service charges on deposits which consist primarily of monthly account fees. Non-sufficient funds fees are recognized at the time the account overdraft occurs in accordance with regulatory guidelines. Account analysis fees consist of fees charged to certain commercial demand deposit accounts based upon account activity (and reduced by a credit which is based upon cash levels in the account).
Insurance Commissions and Fees
Commission revenue is recognized as of the effective date of the insurance policy, the date the customer is billed, or the date the commission is received, whichever is later. The Company also receives contingent commissions from insurance companies as additional incentive for achieving specified premium volume goals and/or the loss experience of the insurance placed. The Company recognizes contingent commissions from insurance companies when determinable, which is generally when such commissions are received or when data is received from the insurance companies that allow the reasonable estimation of these amounts. Commission
F-67
Table of Contents
adjustments are recorded, including policy cancellations and override commissions, when the adjustments become reasonably estimable, which is generally in the period in which they occur.
Assets Under Administration and Asset Management Fees
The Company does not include assets held in fiduciary or agency capacities in the consolidated balance sheets, as such items are not assets of the Company. Fees from asset management activities are recorded on the accrual basis, over the period in which the service is provided. Fees are a function of the market value of assets administered and managed, the volume of transactions, and fees for other services rendered, as set forth in the underlying client agreement. This revenue recognition involves the use of estimates and assumptions, including components that are calculated based on estimated asset valuations and transaction volumes.
Credit Related Fees
Credit related fees primarily include fees assessed on the unused portion of commercial lines of credit (“unused commitment fees”) and syndication agent fees. Unused commitment fees are recognized when earned. Syndication agent fees are generally recognized when the transaction is complete.
Bankcard Fees
Bankcard fees include primarily bankcard interchange revenue, which is recorded as revenue when earned.
Per Share Amounts
Basic earnings per common share represents income available to common shareholders divided by the weighted average number of common shares outstanding during the period. Diluted earnings per common share is calculated by dividing net income available to common shareholders by the weighted-average number of common shares outstanding during the period, plus the effect of outstanding equity-based compensation awards if dilutive.
Comprehensive Income
Accounting principles generally require that recognized revenue, expenses, gains, and losses be included in net income. Although certain changes in assets and liabilities, such as unrealized gains and losses on available for sale securities, pension liability and cash flow hedges, are reported as a separate component of the shareholder’s equity section of the consolidated balance sheets, such items, along with net income, are components of comprehensive income.
Employee Benefits
The Company offers a 401(k) defined contribution benefit plan to its employees. The plan provides for a 100% match of employee contributions up to three percent of employee compensation and a 50% match of employee contributions on the next two percent of employee compensation. All contributions and related earnings are 100% vested.
Employees of the legacy Cadence Bank hired prior to January 1, 2001 participate in a noncontributory defined benefit pension plan. The plan calls for benefits to be paid to eligible employees at retirement based primarily upon years of service and compensation. Contributions to the plan reflect benefits attributed to employees’ services to date, as well as services expected to be provided in the future. The annual pension cost charged to expense is actuarially determined in accordance with the provisions of ASC Topic 715, “Compensation-Retirement Benefits.” The plan was amended effective January 1, 2001, to close participation in the plan, and employees hired subsequent to December 31, 2000, are not eligible to participate.
The Company has a supplemental retirement plan that originated from an acquired bank for certain directors and officers of that acquired bank. The annual cost charged to expense and the estimated present values of the projected payments are actuarially determined in accordance with the provisions of ASC Topic 715.
F-68
Table of Contents
Prior to its acquisition by LLC, the Company entered into agreements with certain senior officers to establish an unqualified supplemental retirement plan. The plan allows for fixed payment amounts to begin on a monthly basis at age 65. The annual cost charged to expense and the estimated present value of the projected payments was determined in accordance with the provisions of ASC Topic 715. The present value of projected payments is recorded as a liability, in accordance with ASC Subtopic 710-30 in the Company’s consolidated balance sheets.
The Company provides a voluntary deferred compensation plan for certain of its executive and senior officers. Under this plan, the participants may defer up to 25% of their base compensation and 100% of certain incentive compensation. The Company may, but is not obligated to, contribute to the plan. Amounts contributed to this plan are credited to a separate account for each participant and are subject to a risk of loss in the event of the Company’s insolvency. The Company made no contributions to this plan in 2016, 2015 or 2014.
Equity-Based Compensation and Equity Incentive Plan
The Company maintains an equity incentive plan that provides for the granting of various forms of incentive equity-based compensation. The Company values these units at the grant date fair value and recognizes expense over the requisite service period. The Company’s equity–based compensation costs are recorded as a component of salaries and employee benefits in the consolidated statements of income.
Compensation costs are recognized for restricted stock units (“RSU“s) issued to employees based on the fair value of these awards at the date of grant. A Monte-Carlo simulation was used to value the RSUs by generating the possible future value of the Company’s common stock price at the settlement date and the number of shares earned. The fair value of the RSUs is then estimated by averaging the value for all paths and discounting the results using a risk-free rate.
Long Term Incentive Plan
The Company offers a long-term incentive plan to certain employees that provides for cash compensation, half of which are based on the value of the shares of LLC as determined on at least a quarterly basis. The awards are generally subject to a 36 month vesting period and the attainment of certain three-year profitability levels. The Company adjusts the accrual related to this plan on at least a quarterly basis, based on the phantom shares awarded, and the fair value of LLC’s stock. Expense under this plan was $4.4 million, $1.6 million and $0.9 million as of December 31, 2016, 2015 and 2014, respectively.
Cash Flows
For purposes of reporting cash flows, cash and cash equivalents include cash on hand and amounts due from banks, interest-bearing deposits with banks, and federal funds sold. Generally, federal funds are sold for one to seven day periods.
Cash flows from loans, either originated or acquired, are classified at the time according to management’s intent to either sell or hold the loan for the foreseeable future. When management’s intent is to hold the loan for the foreseeable future, the cash flows of that loan are presented as investing cash flows.
Off-Balance Sheet Financial Instruments
In the ordinary course of business, the Company enters into off-balance sheet financial instruments consisting of commitments to extend credit, credit card lines, standby letters of credit and commitments to purchase securities. Such financial instruments are recorded in the consolidated financial statements when they are exercised.
F-69
Table of Contents
Fair Value of Financial Instruments
Fair value estimates are made at a specific point in time, based on relevant market information and other information about the financial instrument. These estimates do not reflect any premium or discount that could result from offering for sale, at one time, the entire holdings of a particular financial instrument. Because no market exists for a portion of the financial instruments, fair value estimates are also based on judgments regarding estimated cash flows, current economic conditions, risk characteristics of various financial instruments, and other factors. These estimates are subjective in nature and involve uncertainties and matters of significant judgment and, therefore, cannot be determined with precision. Changes in assumptions could significantly affect the estimates.
Management employs independent third-party pricing services to provide fair value estimates for the Company’s investment securities available for sale and held to maturity. Fair values for investment securities and certain derivative financial instruments are typically the prices supplied by a third-party pricing service or an unrelated counterparty, which utilize quoted market prices, broker/dealer quotations for identical or similar securities, and/or inputs that are observable in the market, either directly or indirectly, for substantially similar securities. Level 1 securities are typically exchange quoted prices. Level 2 securities are typically matrix priced by a third-party pricing service to calculate the fair value. Such fair value measurements consider observable data, such as relevant broker/dealer quotes, market spreads, cash flows, yield curves, live trading levels, trade execution data, market consensus prepayments speeds, credit information, and the respective terms and conditions for debt instruments. Level 3 instruments’ value is determined using pricing models, discounted cash flow models and similar techniques, and may also include the use of market prices of assets or liabilities that are not directly comparable to the subject asset or liability. These methods of valuation may result in a significant portion of the fair value being derived from unobservable assumptions that reflect the Company’s own estimates for assumptions that market participants would use in pricing the asset or liability.
Management uses various validation procedures to validate the prices received from pricing services and quotations received from dealers are reasonable for each relevant financial instrument, including reference to relevant broker/dealer quotes or other market quotes and a review of valuations and trade activity of comparable securities. Consideration is given to the nature of the quotes (e.g., indicative or firm) and the relationship of recently evidenced market activity to the prices provided by the third-party pricing service.
Understanding the third-party pricing service’s valuation methods, assumptions and inputs used by the firm is an important part of the process of determining that reasonable and reliable fair values are being obtained. Management evaluates quantitative and qualitative information provided by the third-party pricing services to assess whether they continue to exhibit the high level of expertise and internal controls that management relies upon.
Fair value estimates are based on existing financial instruments on the consolidated balance sheets, without attempting to estimate the value of anticipated future business and the value of assets and liabilities that are not considered financial instruments. Significant assets and liabilities that are not considered financial instruments include deferred income taxes, premises and equipment, goodwill and other intangible assets. In addition, the income tax ramifications related to the realization of the unrealized gains and losses on available for sale investment securities can have a significant effect on fair value estimates and have not been considered in any of the estimates.
For further information about fair value measurements refer to Note 19.
Recently Adopted Accounting Pronouncements
In July 2013, the FASB issued ASU No. 2013-11 Income Taxes (Topic 740), “Presentation of an Unrecognized Tax Benefit When a Net Operating Loss Carryforward, a Similar Tax Loss, or a Tax Credit Carryforward Exists”. This ASU provides guidance on financial statement presentation of an unrecognized tax benefit when a net operating loss carryforward, a similar tax loss, or a tax credit carryforward exists. Income tax accounting guidance did not explicitly address how to present unrecognized tax benefits when a company also
F-70
Table of Contents
has net operating losses or tax credit carryforwards. Previously, most companies presented these unrecognized benefits as a liability (i.e., gross presentation), but some presented the liability as a reduction of their net operating losses or tax credit carryforwards (i.e., net presentation). To address this diversity in practice, the FASB issued ASU 2013-11, requiring unrecognized tax benefits to be offset against a deferred tax asset for a net operating loss carryforward, similar tax loss, or tax credit carryforward except when either (1) a net operating loss carryforward, a similar tax loss, or a tax credit carryforward is not available as of the reporting date under the governing tax law to settle taxes that would result from the disallowance of the tax position, or (2) the entity does not intend to use the deferred tax asset for this purpose (provided that the tax law permits a choice). If either of these conditions exists, an entity should present an unrecognized tax benefit in the financial statements as a liability and should not net the unrecognized tax benefit with a deferred tax asset. The Company adopted the provisions of ASU 2013-11 effective January 1, 2015 and this adoption did not have an impact on its consolidated balance sheets.
In January 2014, the FASB issued ASU No. 2014-01, “Investments-Equity Method and Joint Ventures (Topic 323): Accounting for Investments in Qualified Affordable Housing Projects,” ASU 2014-01, which enables companies that invest in affordable housing projects that qualify for the low-income housing tax credit (“LIHTC”) to elect to use the proportional amortization method if certain conditions are met. Under the proportional amortization method, the initial investment cost of the project is amortized in proportion to the amount of tax credits and benefits received, with the results of the investment presented on a net basis as a component of income tax expense (benefit). The Company adopted ASU 2014-01 on January 1, 2015 and the adoption did not have a material effect on the consolidated financial statements of the Company.
In January 2014, the FASB issued ASU No. 2014-04, “Receivables –Troubled Debt Restructurings by Creditors (Subtopic 310-40): Reclassification of Residential Real Estate Collateralized Consumer Mortgage Loans upon Foreclosure,” (ASU 2014-04), which clarifies when an in-substance foreclosure or repossession of residential real estate property occurs, requiring a creditor to reclassify the loan to other real estate. According to ASU 2014-04, a consumer mortgage loan should be reclassified to other real estate either upon the creditor obtaining legal title to the real estate collateral or when the borrower voluntarily conveys all interest in the real estate property to the creditor through a deed in lieu of foreclosure or similar legal agreement. ASU 2014-04 also clarifies that a creditor should not delay reclassification when a borrower has a legal right of redemption. The Company adopted the provisions of ASU 2014-04 on January 1, 2015 and the adoption did not have a material effect on the on the consolidated financial statements of the Company.
In August 2014, the FASB issued ASU 2014-14, “Classification of Certain Government-Guaranteed Mortgage Loans upon Foreclosure” (Subtopic 310-40) to give greater consistency in the classification of government-guaranteed loans upon foreclosure. ASU 2014-14 applies to all loans that contain a government guarantee that is not separable from the loan or for which the creditor has both the intent and ability to recover a fixed amount under the guarantee by conveying the property to the guarantor. Upon foreclosure, the creditor should reclassify the mortgage loan to another receivable that is separate from loans and should measure the receivable at the amount of the loan balance expected to be recovered from the guarantor. ASU 2014-14 was effective for the Company for interim and annual periods beginning after December 15, 2014. The adoption of ASC 2014-14 on January 1, 2015 did not have a material effect on the on the consolidated financial statements of the Company.
In February 2015, the FASB issued ASU No. 2015-02, “Consolidation—Amendments to the Consolidation Analysis”, which eliminates the consolidation model created specifically for limited partnerships and creates a single model for evaluating consolidation of legal entities. The Company adopted the amendment, effective January 1, 2016, through retrospective application; however, there was no resulting change to amounts reported in prior periods.
In April 2015, the FASB issued ASU 2015-03, “Interest—Imputation of Interest”, to simplify presentation of debt issuance costs by requiring that debt issuance costs related to a recognized debt liability be presented in the balance sheets as a direct deduction from the carrying amount of that debt liability, consistent with debt discounts. The amendments in this update are effective for public business entities for fiscal years beginning after
F-71
Table of Contents
December 15, 2015, and interim periods within those fiscal periods. Early adoption of the amendments in this update is permitted for financial statements that have not been previously issued. The company adopted ASU 2015-03 as of December 31, 2015. The adoption of this new accounting guidance resulted in a reclassification of deferred financing costs from “Other assets” to “Senior debt” and “Subordinated debt” on our consolidated balance sheets for the current and all prior periods. There was no impact on our consolidated statements of income or consolidated statements of cash flows.
Pending Accounting Pronouncements
In May 2014, the FASB issued ASU No. 2014-09, “Revenue from Contracts with Customers (Topic 606),” (ASU 2014-09), which is intended to improve and converge the financial reporting requirements for revenue contracts with customers. Previous accounting guidance comprised broad revenue recognition concepts along with numerous industry-specific requirements. The new guidance establishes a five-step model which entities must follow to recognize revenue and removes inconsistencies and weaknesses in existing guidance. The banking industry does not expect significant changes because major sources of revenue are from financial instruments that have been excluded from the scope of the new standard, (including loans, derivatives, debt and equity securities, etc.). However, the new standard affects other fees charged by banks, such as asset management fees, credit card interchange fees, deposit account fees, etc. Adoption may be made on a full retrospective basis with practical expedients, or on a modified retrospective basis with a cumulative effect adjustment. Early adoption will be permitted as of the original effective date in ASU 2014-09, which is annual reporting periods beginning after December 15, 2017, including interim reporting periods within those annual reporting periods. ASU 2014-09 is effective for annual and interim periods beginning after December 15, 2017, and must be retrospectively applied. Entities will have the option of presenting prior periods as impacted by the new guidance or presenting the cumulative effect of initial application along with supplementary disclosures. The Company is currently evaluating the impact of adopting ASU 2014-09, including the transition method.
In January 2016, the FASB issued ASU 2016-01, “Financial Instruments—Overall (Subtopic 825-10): Recognition and Measurement of Financial Assets and Financial Liabilities”. ASU 2016-1, among other things, (i) requires equity investments, with certain exceptions, to be measured at fair value with changes in fair value recognized in net income, (ii) simplifies the impairment assessment of equity investments without readily determinable fair values by requiring a qualitative assessment to identify impairment, (iii) eliminates the requirement for public business entities to disclose the methods and significant assumptions used to estimate the fair value that is required to be disclosed for financial instruments measured at amortized cost on the balance sheets, (iv) requires public business entities to use the exit price notion when measuring the fair value of financial instruments for disclosure purposes, (v) requires an entity to present separately in other comprehensive income the portion of the total change in the fair value of a liability resulting from a change in the instrument-specific credit risk when the entity has elected to measure the liability at fair value in accordance with the fair value option for financial instruments, (vi) requires separate presentation of financial assets and financial liabilities by measurement category and form of financial asset on the balance sheets or the accompanying notes to the financial statements and (viii) clarifies that an entity should evaluate the need for a valuation allowance on a deferred tax asset related to available-for-sale. ASU 2016-01 will be effective for fiscal years and interim periods beginning after December 15, 2017. Early adoption is permitted for the own credit provision. The Company does not expect this guidance will have a material effect on the Company’s consolidated balance sheets and consolidated statements of income.
In February 2016, the FASB issued ASU 2016-02, “Leases”. This ASU requires lessees to recognize lease assets and lease liabilities generated by contracts longer than a year on their balance sheets. The ASU also requires companies to disclose in the footnotes to their financial statements information about the amount, timing, and uncertainty for the payments they make for the lease agreements. ASU 2016-02 will be effective for annual periods and interim periods within those annual periods beginning after December 31, 2018. The Company is evaluating the effect of adopting this new accounting guidance.
In March 2016, the FASB issued ASU 2016-09, “Compensation—Stock Compensation (Topic 718): Improvements to Employee Share-Based Payment Accounting.” Under ASU 2016-09 all excess tax benefits and
F-72
Table of Contents
tax deficiencies related to share-based payment awards should be recognized as income tax expense or benefit in the income statement during the period in which they occur. Previously, such amounts were recorded in the pool of excess tax benefits included in additional paid-in capital, if such pool was available. Because excess tax benefits are no longer recognized in additional paid-in capital, the assumed proceeds from applying the treasury stock method when computing earnings per share should exclude the amount of excess tax benefits that would have previously been recognized in additional paid-in capital. Additionally, excess tax benefits should be classified along with other income tax cash flows as an operating activity rather than a financing activity, as was previously the case. ASU 2016-09 also provides that an entity can make an entity-wide accounting policy election to either estimate the number of awards that are expected to vest (current GAAP) or account for forfeitures when they occur. ASU 2016-09 changes the threshold to qualify for equity classification (rather than as a liability) to permit withholding up to the maximum statutory tax rates (rather than the minimum as was previously the case) in the applicable jurisdictions. ASU 2016-09 will be effective on January 1, 2017 and is not expected to have a significant impact on our financial position, results of operations or cash flows.
In June 2016, he FASB has issued ASU No. 2016-13, “Financial Instruments—Credit Losses (Topic 326): Measurement of Credit Losses on Financial Instruments”. The guidance is intended to improve financial reporting by requiring timelier recording of credit losses on loans and other financial instruments. The guidance will replace the current incurred loss accounting model with an expected loss approach and requires the measurement of all expected credit losses for financial assets held at the reporting date based on historical experience, current conditions, and reasonable and supportable forecasts. The guidance requires enhanced disclosures to help investors and other financial statement users better understand significant estimates and judgments used in estimating credit losses, as well as the credit quality and underwriting standards of an organization’s portfolio. The ASU is effective for fiscal years, and interim periods within those fiscal years, beginning after December 15, 2019. The Company is evaluating the effect of adopting this new accounting guidance.
In August 2016, the FASB issued ASU No. 2016-15, “Statement of Cash Flows (Topic 230): Classification of Certain Cash Receipts and Cash Payments”, in order to reduce current diversity in practice in how certain cash receipts and cash payments are presented and classified in the statement of cash flows. ASU 2016-15 will be effective for fiscal years beginning after December 15, 2017, including interim periods within those fiscal years. Early adoption is permitted, including adoption in an interim period. The amendments should be applied using a retrospective transition method to each period presented. The Company is currently evaluating the impact of the ASU on the Company’s consolidated statement of cash flows. The Company is not expecting to early adopt the ASU.
In January 2017, the FASB issued ASU No. 2017-01, “Business Combinations (Topic 805): Clarifying the Definition of a Business”, which introduces amendments that are intended to clarify the definition of a business to assist companies and other reporting organizations with evaluating whether transactions should be accounted for as acquisitions (or disposals) of assets or businesses. The amendments are intended to narrow the current interpretation of a business. ASU No. 2017-01 will be effective for annual reporting periods beginning after December 15, 2017, including interim reporting periods within those periods. The amendments will be applied prospectively on or after the effective date. Early application of the amendments in this ASU is allowed for transactions, including when a subsidiary or group of assets is deconsolidated/derecognized, in which the acquisition date occurs before the issuance date or effective date of the amendments, only when the transaction has not been reported in financial statements that have been issued or made available for issuance. The Company is currently evaluating the effect of the ASU.
In January 2017, the FASB issued ASU No. 2017-04, “Intangibles-Goodwill and Other (Topic 350): Simplifying the Test for Goodwill Impairment”, which simplifies how an entity is required to test goodwill for impairment by eliminating Step 2 from the goodwill impairment test. Therefore, any carrying amount which exceeds the reporting unit’s fair value (up to the amount of goodwill recorded) will be recognized as an impairment loss. ASU No. 2017-04 will be effective for annual reporting periods beginning after December 15, 2019, including interim reporting periods within those periods. The amendments will be applied prospectively on
F-73
Table of Contents
or after the effective date. Early adoption is permitted for interim or annual goodwill impairment tests performed on testing dates after January 1, 2017. Based on recent goodwill impairments tests, which did not require the application of Step 2, the Company does not expect the adoption of this ASU to have an immediate impact.
Note 2—Securities
A summary of amortized cost and estimated fair value of securities available-for-sale and securities held-to-maturity at December 31, 2016 and 2015 is as follows:
| (In thousands) | Amortized Cost |
Gross Unrealized Gains |
Gross Unrealized Losses |
Estimated Fair Value |
||||||||||||
| December 31, 2016 |
||||||||||||||||
| Securities available-for-sale: |
||||||||||||||||
| U.S. treasury securities |
$ | 100,736 | $ | — | $ | 3,951 | $ | 96,785 | ||||||||
| Obligations of U.S. government agencies |
97,340 | 508 | 320 | 97,528 | ||||||||||||
| Mortgage-backed securities issued or guaranteed by U.S. agencies (MBS) |
||||||||||||||||
| Residential pass-through: |
||||||||||||||||
| Guaranteed by GNMA |
152,918 | 1,401 | 1,166 | 153,153 | ||||||||||||
| Issued by FNMA and FHLMC |
267,035 | 1,499 | 3,206 | 265,328 | ||||||||||||
| Other residential mortgage-backed securities |
48,076 | 375 | 890 | 47,561 | ||||||||||||
| Commercial mortgage-backed securities |
66,720 | — | 4,107 | 62,613 | ||||||||||||
|
|
|
|
|
|
|
|
|
|||||||||
| Total MBS |
534,749 | 3,275 | 9,369 | 528,655 | ||||||||||||
| Obligations of states and municipal subdivisions |
438,655 | 870 | 28,713 | 410,812 | ||||||||||||
| Other securities |
5,580 | 149 | 162 | 5,567 | ||||||||||||
|
|
|
|
|
|
|
|
|
|||||||||
| Total securities available-for-sale |
$ | 1,177,060 | $ | 4,802 | $ | 42,515 | $ | 1,139,347 | ||||||||
|
|
|
|
|
|
|
|
|
|||||||||
| Securities held-to-maturity: |
||||||||||||||||
| Obligations of states and municipal subdivisions |
$ | 425 | $ | 38 | $ | — | $ | 463 | ||||||||
|
|
|
|
|
|
|
|
|
|||||||||
| (In thousands) | Amortized Cost |
Gross Unrealized Gains |
Gross Unrealized Losses |
Estimated Fair Value |
||||||||||||
| December 31, 2015 |
||||||||||||||||
| Securities available-for-sale: |
||||||||||||||||
| Obligations of U.S. government agencies |
$ | 89,983 | $ | 919 | $ | 109 | $ | 90,793 | ||||||||
| Mortgage-backed securities issued or guaranteed by U.S. agencies (MBS) |
||||||||||||||||
| Residential pass-through: |
||||||||||||||||
| Guaranteed by GNMA |
278,560 | 2,457 | 827 | 280,190 | ||||||||||||
| Issued by FNMA and FHLMC |
120,597 | 2,045 | 935 | 121,707 | ||||||||||||
| Other residential mortgage-backed securities |
75,861 | 738 | 1,022 | 75,577 | ||||||||||||
| Commercial mortgage-backed securities |
24,977 | — | 168 | 24,809 | ||||||||||||
|
|
|
|
|
|
|
|
|
|||||||||
| Total MBS |
499,995 | 5,240 | 2,952 | 502,283 | ||||||||||||
| Obligations of states and municipal subdivisions |
119,295 | 3,212 | 187 | 122,320 | ||||||||||||
| Other securities |
5,454 | 54 | 94 | 5,414 | ||||||||||||
|
|
|
|
|
|
|
|
|
|||||||||
| Total securities available-for-sale |
$ | 714,727 | $ | 9,425 | $ | 3,342 | $ | 720,810 | ||||||||
|
|
|
|
|
|
|
|
|
|||||||||
| Securities held-to-maturity: |
||||||||||||||||
| Obligations of states and municipal subdivisions |
$ | 550 | $ | 44 | $ | — | $ | 594 | ||||||||
|
|
|
|
|
|
|
|
|
|||||||||
F-74
Table of Contents
The scheduled contractual maturities of securities available-for-sale and securities held-to-maturity at December 31, 2016 were as follows:
| Available-for-Sale | Held-to-Maturity | |||||||||||||||
| (In thousands) | Amortized Cost |
Estimated Fair Value |
Amortized Cost |
Estimated Fair Value |
||||||||||||
| Due in one year or less |
$ | 3,776 | $ | 3,816 | $ | — | $ | — | ||||||||
| Due after one year through five years |
110,173 | 106,436 | 425 | 463 | ||||||||||||
| Due after five years through ten years |
12,669 | 12,763 | — | — | ||||||||||||
| Due after ten years |
510,113 | 482,110 | — | — | ||||||||||||
| Mortgage-backed securities and other securities |
540,329 | 534,222 | — | — | ||||||||||||
|
|
|
|
|
|
|
|
|
|||||||||
| Total |
$ | 1,177,060 | $ | 1,139,347 | $ | 425 | $ | 463 | ||||||||
|
|
|
|
|
|
|
|
|
|||||||||
Proceeds from sales, gross gains, and gross losses on sales of securities available for sale for the year ended December 31, 2016, 2015 and 2014 are presented below. There were no other-than-temporary impairment charges included in gross realized losses for the years ended December 31, 2016, 2015 and 2014. The specific identification method is used to reclassify gains and losses out of other comprehensive income at the time of sale.
| For the Year Ended December 31, |
||||||||||||
| (In thousands) | 2016 | 2015 | 2014 | |||||||||
| Gross realized gains |
$ | 4,172 | $ | 1,444 | $ | 677 | ||||||
| Gross realized losses |
(436 | ) | (273 | ) | (18 | ) | ||||||
|
|
|
|
|
|
|
|||||||
| Realized gains on sale of securities available for sale, net |
$ | 3,736 | $ | 1,171 | $ | 659 | ||||||
|
|
|
|
|
|
|
|||||||
Securities with a carrying value of $380.4 million and $368.3 million at December 31, 2016 and 2015, respectively, were pledged to secure public and trust deposits, FHLB borrowings, repurchase agreements and for other purposes as required or permitted by law.
The details concerning securities classified as available-for-sale with unrealized losses as of December 31, 2016 and 2015 was as follows:
| Losses < 12 Months | Losses > 12 Months | |||||||||||||||
| (In thousands) | Estimated Fair Value |
Gross Unrealized Losses |
Estimated Fair Value |
Gross Unrealized Losses |
||||||||||||
| December 31, 2016 |
||||||||||||||||
| U.S. Treasury securities |
$ | 96,785 | $ | 3,951 | $ | — | $ | — | ||||||||
| Obligations of U.S. government agencies |
51,463 | 277 | 12,150 | 43 | ||||||||||||
| Mortgage-backed securities |
328,374 | 8,482 | 17,979 | 887 | ||||||||||||
| Obligations of state and municipal subdivision |
344,708 | 28,713 | — | — | ||||||||||||
| Other securities |
— | — | 4,216 | 162 | ||||||||||||
|
|
|
|
|
|
|
|
|
|||||||||
| Total |
$ | 821,330 | $ | 41,423 | $ | 34,345 | $ | 1,092 | ||||||||
|
|
|
|
|
|
|
|
|
|||||||||
| December 31, 2015 |
||||||||||||||||
| Obligations of U.S. government agencies |
$ | 7,850 | $ | 109 | $ | — | $ | — | ||||||||
| Mortgage-backed securities |
199,548 | 1,520 | 39,624 | 1,432 | ||||||||||||
| Obligations of state and municipal subdivision |
12,656 | 187 | — | — | ||||||||||||
| Other securities |
— | — | 4,190 | 94 | ||||||||||||
|
|
|
|
|
|
|
|
|
|||||||||
| Total |
$ | 220,054 | $ | 1,816 | $ | 43,814 | $ | 1,526 | ||||||||
|
|
|
|
|
|
|
|
|
|||||||||
F-75
Table of Contents
There were no securities classified as held-to-maturity with unrealized losses as of December 31, 2016 and 2015.
As of December 31, 2016 and 2015, approximately 75% and 37%, respectively of the fair value of securities in the investment portfolio reflected an unrealized loss. As of December 31, 2016, there were 9 securities that had been in a loss position for more than twelve months, and 203 securities that had been in a loss position for less than 12 months. None of the unrealized losses relate to the marketability of the securities or the issuer’s ability to honor redemption of the obligations. The Company has adequate liquidity and, therefore, does not plan to sell and, more likely than not, will not be required to sell these securities before recovery of the indicated impairment. Accordingly, the unrealized losses on these securities have been determined to be temporary.
Note 3—Loans and Allowance for Credit Losses
The following table presents total loans outstanding by portfolio segment and class of financing receivable as of December 31, 2016 and 2015. Outstanding balances also include Acquired Noncredit Impaired (“ANCI”) loans, originated loans and Acquired Credit Impaired (“ACI”) loans net of any remaining purchase accounting adjustments and all acquired loans covered under a loss sharing agreement with the FDIC. Information about ACI loans is presented separately in the “Acquired Credit-Impaired Loans” section of this Note.
| As of December 31, 2016 | ||||||||||||||||
| (In thousands) | ACI | ANCI | Originated | Total | ||||||||||||
| Commercial and Industrial |
||||||||||||||||
| General C&I(1) |
$ | 31,709 | $ | 47,592 | $ | 2,337,364 | $ | 2,416,665 | ||||||||
| Energy sector |
— | — | 939,369 | 939,369 | ||||||||||||
| Restaurant industry |
— | — | 864,085 | 864,085 | ||||||||||||
| Healthcare |
6,338 | 4,102 | 434,663 | 445,103 | ||||||||||||
|
|
|
|
|
|
|
|
|
|||||||||
| Total commercial and industrial |
38,047 | 51,694 | 4,575,481 | 4,665,222 | ||||||||||||
|
|
|
|
|
|
|
|
|
|||||||||
| Commercial Real Estate |
||||||||||||||||
| Income producing |
96,673 | 18,354 | 886,676 | 1,001,703 | ||||||||||||
| Land and development |
1,497 | 1,952 | 67,555 | 71,004 | ||||||||||||
|
|
|
|
|
|
|
|
|
|||||||||
| Total commercial real estate |
98,170 | 20,306 | 954,231 | 1,072,707 | ||||||||||||
|
|
|
|
|
|
|
|
|
|||||||||
| Consumer |
||||||||||||||||
| Residential real estate |
186,375 | 145,747 | 1,125,048 | 1,457,170 | ||||||||||||
| Other |
1,690 | 7,180 | 59,819 | 68,689 | ||||||||||||
|
|
|
|
|
|
|
|
|
|||||||||
| Total consumer |
188,065 | 152,927 | 1,184,867 | 1,525,859 | ||||||||||||
|
|
|
|
|
|
|
|
|
|||||||||
| Small Business Lending |
— | 9,158 | 184,483 | 193,641 | ||||||||||||
|
|
|
|
|
|
|
|
|
|||||||||
| Total (Gross of unearned discount and fees) |
324,282 | 234,085 | 6,899,062 | 7,457,429 | ||||||||||||
|
|
|
|
|
|
|
|
|
|||||||||
| Unearned discount and fees |
— | (4,301 | ) | (20,417 | ) | (24,718 | ) | |||||||||
|
|
|
|
|
|
|
|
|
|||||||||
| Total (Net of unearned discount and fees) |
$ | 324,282 | $ | 229,784 | $ | 6,878,645 | $ | 7,432,711 | ||||||||
|
|
|
|
|
|
|
|
|
|||||||||
F-76
Table of Contents
| As of December 31, 2015 | ||||||||||||||||
| (In thousands) | ACI | ANCI | Originated | Total | ||||||||||||
| Commercial and Industrial |
||||||||||||||||
| General C&I(1) |
$ | 55,278 | $ | 55,320 | $ | 2,272,750 | $ | 2,383,348 | ||||||||
| Energy sector |
— | — | 1,067,990 | 1,067,990 | ||||||||||||
| Restaurant industry |
— | — | 626,197 | 626,197 | ||||||||||||
| Healthcare |
6,715 | 8,396 | 446,792 | 461,903 | ||||||||||||
|
|
|
|
|
|
|
|
|
|||||||||
| Total commercial and industrial |
61,993 | 63,716 | 4,413,729 | 4,539,438 | ||||||||||||
|
|
|
|
|
|
|
|
|
|||||||||
| Commercial Real Estate |
||||||||||||||||
| Income producing |
129,914 | 27,185 | 674,263 | 831,362 | ||||||||||||
| Land and development |
4,581 | 2,726 | 57,239 | 64,546 | ||||||||||||
|
|
|
|
|
|
|
|
|
|||||||||
| Total commercial real estate |
134,495 | 29,911 | 731,502 | 895,908 | ||||||||||||
|
|
|
|
|
|
|
|
|
|||||||||
| Consumer |
||||||||||||||||
| Residential real estate |
235,131 | 190,794 | 830,925 | 1,256,850 | ||||||||||||
| Other |
2,525 | 5,947 | 84,821 | 93,293 | ||||||||||||
|
|
|
|
|
|
|
|
|
|||||||||
| Total consumer |
237,656 | 196,741 | 915,746 | 1,350,143 | ||||||||||||
|
|
|
|
|
|
|
|
|
|||||||||
| Small Business Lending |
— | 11,295 | 140,047 | 151,342 | ||||||||||||
|
|
|
|
|
|
|
|
|
|||||||||
| Total (Gross of unearned discount and fees) |
434,144 | 301,663 | 6,201,024 | 6,936,831 | ||||||||||||
|
|
|
|
|
|
|
|
|
|||||||||
| Unearned discount and fees |
— | (5,752 | ) | (14,559 | ) | (20,311 | ) | |||||||||
|
|
|
|
|
|
|
|
|
|||||||||
| Total (Net of unearned discount and fees) |
$ | 434,144 | $ | 295,911 | $ | 6,186,465 | $ | 6,916,520 | ||||||||
|
|
|
|
|
|
|
|
|
|||||||||
| Covered By FDIC Loss Sharing Agreements (2) |
$ | 147,236 | $ | 41,916 | $ | — | $ | 189,152 | ||||||||
|
|
|
|
|
|
|
|
|
|||||||||
| (1) | This category for ACI loans includes all pooled commercial and industrial loans which may contain certain energy, restaurant, healthcare or services loan types. |
| (2) | As of December 31, 2012, the Company had submitted claims in excess of the first threshold of $347 million and had been reimbursed the 80% of the covered losses by the FDIC up to this initial threshold. Subsequent claims between $347 million and $504 million are not reimbursable under the loss share agreement. On January 5, 2016, a settlement agreement was finalized with the FDIC to end the loss share agreement at a nominal cost and the Company had no FDIC indemnification asset recorded as of December 31, 2016 and 2015. |
Allowance for Credit Losses (“ACL”)
The ACL is management’s estimate of credit losses inherent in the loan portfolio at the balance sheet date. The Company has an established process to determine the adequacy of the ACL that assesses the losses inherent in our portfolio (See Note 1). While management attributes portions of the ACL to specific portfolio segments, the entire ACL is available to absorb credit losses inherent in the total loan portfolio.
The ACL process involves procedures that appropriately consider the unique risk characteristics of the loan portfolio segments based on management’s assessment of the underlying risks and cash flows. For each portfolio segment, losses are estimated collectively for groups of loans with similar characteristics, individually for impaired loans or, for ACI loans, based on the changes in cash flows expected to be collected on a pool or individual basis.
The level of the ACL is influenced by loan volumes, risk rating migration, historic loss experience influencing loss factors, and other conditions influencing loss expectations, such as economic conditions. The primary indicator of credit quality for the portfolio segments is its internal risk ratings. The assignment of loan risk ratings is the primary responsibility of the lending officer and is subject to independent review by internal credit review, which also performs ongoing, independent review of the risk management process. The risk
F-77
Table of Contents
management process includes underwriting, documentation and collateral control. Credit review is centralized and independent of the lending function. The credit review results are reported to senior management and the Board of Directors.
The following is a summary description of the risk ratings and a table summarizing the amount of loans by risk rating in each loan portfolio segment:
| • | Pass. Loans within this risk rating are further categorized as follows: |
| • | Virtually Risk Free—Well-collateralized by cash equivalent instruments held by the Bank or supported by an abundance of repayment sources including liquidity currently sufficient to retire the loan. |
| • | Exceptional—Exceptional credits possess very low risk of loss. These loans are generally cash secured or are supported by larger corporate borrowers (with sufficient financial resources to qualify for an upper level investment rating from S&P or Moody’s). |
| • | Superior—Superior credits possess a low risk of loss. Superior borrowers possess liquid financial statements supported by superior financial strength and stability, including superior cash flow generation ability and significant levels of liquid assets combined with low to moderate levels of leverage. |
| • | Strong—Strong credits possess excellent credit quality supported by excellent, diverse sources of repayment including strong (full cycle) cash flow, persistently excellent liquidity and other assets comprising a strong net worth position that can be converted into liquid assets within the next twelve months. |
| • | Above Average—Above average credits are desirable because of their above average credit quality, and are supported by comfortable (full cycle) cash flow coverage, meaningful (currently existing) financial liquidity and moderate financial leverage maintained by financially sound borrowers. |
| • | Good—Good credits possess a minor weakness that causes them to possess slightly lower than average credit quality even though they also possess attributes (one or more strengths that can be built on) that make them preferable to satisfactory loans. |
| • | Satisfactory—Satisfactory credits generally meet the minimum requirements for an acceptable loan in a broad sense but their overall risk profile causes their credit quality to fall within the bottom quartile of all newly approved loans. |
| • | Pass Watch—A “watch” credit is a pass loan for which an additional policy exception may have arisen subsequent to its booking or has been previously extended to a borrower and now shows signs of weakness in the overall base of financial resources available to repay the loan. However, demonstrated mitigating factors exist that contribute to the reduction of the risk of delinquency or loss. |
| • | Special Mention—A “special mention” loan has identified potential weaknesses that are of sufficient materiality to require management’s close attention. If left uncorrected, these potential weaknesses may result in deterioration of the repayment prospects for the loan or in the Bank’s credit position at some future date. Special mention assets contain greater than acceptable risk to warrant increases in credit exposure and are thus considered non-pass rated credits. |
| • | Substandard High—A “substandard high” loan is inadequately protected by the current sound net worth and paying capacity of the obligor or the collateral pledged, if any. Loans classified as substandard high possess well-defined weaknesses that are expected to jeopardize their liquidation but the weaknesses have not progressed to a point where payments on the loan have become consistently late or where repayment is not expected to be protracted relative to contractual terms. Loans in this category are generally in accrual status. |
| • | Substandard Low—A “substandard low” loan is inadequately protected by the current sound net worth and paying capacity of the obligor or the collateral pledged, if any. Loans classified as substandard low |
F-78
Table of Contents
| possess well-defined weaknesses that are expected to jeopardize their liquidation and have progressed to a point where payments on the loan have become consistently late or possess other significant delays for orderly repayment. Loans in this category generally are in nonaccrual status. |
| • | Doubtful—Loans classified as “doubtful” possess all of the weaknesses inherent in loans classified as substandard with the added characteristic that the weaknesses make collection or liquidation in full highly questionable or improbable based on currently existing facts, conditions and values. Loans rated as doubtful are not rated as loss because certain events may occur that could salvage the debt. Loans in this category are required to be on nonaccrual. |
| • | Loss—Loans classified “loss” are considered uncollectable and of such little value that their continuance as bankable assets is not warranted. This classification does not mean that the asset has absolutely no recovery or salvage value, but rather that it is not practical or desirable to defer writing off this worthless loan even though partial recovery may be affected in the future. Loans may reside in this classification for administrative purposes for a period not to exceed the earlier of thirty (30) days or calendar quarter-end. |
F-79
Table of Contents
A summary of the activity in the ACL for the years ended December 31, 2016, 2015 and 2014 is as follows:
| For the Year Ended December 31, 2016 | ||||||||||||||||||||
| (In thousands) | Commercial and Industrial |
Commercial Real Estate |
Consumer | Small Business |
Total | |||||||||||||||
| As of December 31, 2015 |
$ | 55,824 | $ | 8,136 | $ | 13,450 | $ | 2,373 | $ | 79,783 | ||||||||||
| Provision for loan losses: |
||||||||||||||||||||
| ACI loans |
(2,073 | ) | (904 | ) | (491 | ) | — | (3,468 | ) | |||||||||||
| ANCI loans |
(169 | ) | (85 | ) | 225 | (10 | ) | (39 | ) | |||||||||||
| Originated loans |
46,024 | 2,378 | 1,772 | 2,681 | 52,855 | |||||||||||||||
|
|
|
|
|
|
|
|
|
|
|
|||||||||||
| Total provision |
43,782 | 1,389 | 1,506 | 2,671 | 49,348 | |||||||||||||||
|
|
|
|
|
|
|
|
|
|
|
|||||||||||
| Charge-offs: |
||||||||||||||||||||
| ACI loans |
— | — | 1,092 | — | 1,092 | |||||||||||||||
| ANCI loans |
— | — | 367 | — | 367 | |||||||||||||||
| Originated loans |
46,367 | — | 635 | 841 | 47,843 | |||||||||||||||
|
|
|
|
|
|
|
|
|
|
|
|||||||||||
| Total charge-offs |
46,367 | — | 2,094 | 841 | 49,302 | |||||||||||||||
|
|
|
|
|
|
|
|
|
|
|
|||||||||||
| Recoveries: |
||||||||||||||||||||
| ACI loans |
20 | 474 | 10 | — | 504 | |||||||||||||||
| ANCI loans |
43 | 101 | 168 | 9 | 321 | |||||||||||||||
| Originated loans |
1,386 | 3 | 225 | — | 1,614 | |||||||||||||||
|
|
|
|
|
|
|
|
|
|
|
|||||||||||
| Total recoveries |
1,449 | 578 | 403 | 9 | 2,439 | |||||||||||||||
|
|
|
|
|
|
|
|
|
|
|
|||||||||||
| As of December 31, 2016 |
$ | 54,688 | $ | 10,103 | $ | 13,265 | $ | 4,212 | $ | 82,268 | ||||||||||
|
|
|
|
|
|
|
|
|
|
|
|||||||||||
| ACL |
||||||||||||||||||||
| ACI loans collectively evaluated for impairment |
$ | 176 | $ | 2,652 | $ | 7,215 | $ | — | $ | 10,043 | ||||||||||
| ACI loans individually evaluated for impairment |
— | 3 | 232 | — | 235 | |||||||||||||||
| ANCI loans collectively evaluated for impairment |
299 | 243 | 94 | 272 | 908 | |||||||||||||||
| ANCI loans individually evaluated for impairment |
— | — | 37 | 33 | 70 | |||||||||||||||
| Originated loans collectively evaluated for impairment |
52,615 | 7,205 | 5,687 | 3,900 | 69,407 | |||||||||||||||
| Originated loans individually evaluated for impairment |
1,598 | — | — | 7 | 1,605 | |||||||||||||||
|
|
|
|
|
|
|
|
|
|
|
|||||||||||
| ACL as of December 31, 2016 |
$ | 54,688 | $ | 10,103 | $ | 13,265 | $ | 4,212 | $ | 82,268 | ||||||||||
|
|
|
|
|
|
|
|
|
|
|
|||||||||||
| Loans |
||||||||||||||||||||
| ACI loan pools collectively evaluated for impairment |
$ | 26,276 | $ | 87,825 | $ | 187,668 | $ | — | $ | 301,769 | ||||||||||
| ACI loans individually evaluated for impairment |
11,772 | 10,345 | 396 | — | 22,513 | |||||||||||||||
| ANCI loans collectively evaluated for impairment |
51,694 | 20,306 | 151,759 | 8,769 | 232,528 | |||||||||||||||
| ANCI loans individually evaluated for impairment |
— | — | 1,168 | 389 | 1,557 | |||||||||||||||
| Originated loans collectively evaluated for impairment |
4,424,822 | 954,231 | 1,184,442 | 183,933 | 6,747,428 | |||||||||||||||
| Originated loans individually evaluated for impairment |
150,658 | — | 426 | 550 | 151,634 | |||||||||||||||
|
|
|
|
|
|
|
|
|
|
|
|||||||||||
| Loans as of December 31, 2016 |
$ | 4,665,222 | $ | 1,072,707 | $ | 1,525,859 | $ | 193,641 | $ | 7,457,429 | ||||||||||
|
|
|
|
|
|
|
|
|
|
|
|||||||||||
F-80
Table of Contents
| For the Year Ended December 31, 2015 | ||||||||||||||||||||
| (In thousands) | Commercial and Industrial |
Commercial Real Estate |
Consumer | Small Business |
Total | |||||||||||||||
| As of December 31, 2014 |
$ | 28,930 | $ | 7,050 | $ | 15,552 | $ | 1,988 | $ | 53,520 | ||||||||||
| Provision for loan losses: |
||||||||||||||||||||
| ACI loans |
(1,536 | ) | (966 | ) | (3,398 | ) | — | (5,900 | ) | |||||||||||
| ANCI loans |
31 | 193 | 17 | 144 | 385 | |||||||||||||||
| Originated loans |
36,860 | 1,791 | 1,969 | 879 | 41,499 | |||||||||||||||
|
|
|
|
|
|
|
|
|
|
|
|||||||||||
| Total provision |
35,355 | 1,018 | (1,412 | ) | 1,023 | 35,984 | ||||||||||||||
|
|
|
|
|
|
|
|
|
|
|
|||||||||||
| Charge-offs: |
||||||||||||||||||||
| ACI loans |
9 | 123 | 26 | — | 158 | |||||||||||||||
| ANCI loans |
— | 25 | 329 | 647 | 1,001 | |||||||||||||||
| Originated loans |
8,516 | 123 | 936 | — | 9,575 | |||||||||||||||
|
|
|
|
|
|
|
|
|
|
|
|||||||||||
| Total charge-offs |
8,525 | 271 | 1,291 | 647 | 10,734 | |||||||||||||||
|
|
|
|
|
|
|
|
|
|
|
|||||||||||
| Recoveries: |
||||||||||||||||||||
| ACI loans |
16 | 331 | 242 | — | 589 | |||||||||||||||
| ANCI loans |
48 | 8 | 141 | 9 | 206 | |||||||||||||||
| Originated loans |
— | — | 218 | — | 218 | |||||||||||||||
|
|
|
|
|
|
|
|
|
|
|
|||||||||||
| Total recoveries |
64 | 339 | 601 | 9 | 1,013 | |||||||||||||||
|
|
|
|
|
|
|
|
|
|
|
|||||||||||
| As of December 31, 2015 |
$ | 55,824 | $ | 8,136 | $ | 13,450 | $ | 2,373 | $ | 79,783 | ||||||||||
|
|
|
|
|
|
|
|
|
|
|
|||||||||||
| ACL |
||||||||||||||||||||
| ACI loans collectively evaluated for impairment |
$ | 2,062 | $ | 3,084 | $ | 8,688 | $ | — | $ | 13,834 | ||||||||||
| ACI loans individually evaluated for impairment |
168 | — | 332 | — | 500 | |||||||||||||||
| ANCI loans collectively evaluated for impairment |
425 | 227 | 65 | 285 | 1,002 | |||||||||||||||
| ANCI loans individually evaluated for impairment |
— | — | 40 | 21 | 61 | |||||||||||||||
| Originated loans collectively evaluated for impairment |
48,666 | 4,825 | 4,325 | 2,067 | 59,883 | |||||||||||||||
| Originated loans individually evaluated for impairment |
4,503 | — | — | — | 4,503 | |||||||||||||||
|
|
|
|
|
|
|
|
|
|
|
|||||||||||
| ACL as of December 31, 2015 |
$ | 55,824 | $ | 8,136 | $ | 13,450 | $ | 2,373 | $ | 79,783 | ||||||||||
|
|
|
|
|
|
|
|
|
|
|
|||||||||||
| Loans |
||||||||||||||||||||
| ACI loan pools collectively evaluated for impairment |
$ | 41,175 | $ | 105,605 | $ | 235,474 | $ | — | $ | 382,254 | ||||||||||
| ACI loans individually evaluated for impairment |
20,818 | 28,890 | 2,182 | — | 51,890 | |||||||||||||||
| ANCI loans collectively evaluated for impairment |
63,716 | 29,911 | 195,307 | 10,836 | 299,770 | |||||||||||||||
| ANCI loans individually evaluated for impairment |
— | — | 1,434 | 459 | 1,893 | |||||||||||||||
| Originated loans collectively evaluated for impairment |
4,339,618 | 731,502 | 915,442 | 140,047 | 6,126,609 | |||||||||||||||
| Originated loans individually evaluated for impairment |
74,111 | — | 304 | — | 74,415 | |||||||||||||||
|
|
|
|
|
|
|
|
|
|
|
|||||||||||
| Loans as of December 31, 2015 |
$ | 4,539,438 | $ | 895,908 | $ | 1,350,143 | $ | 151,342 | $ | 6,936,831 | ||||||||||
|
|
|
|
|
|
|
|
|
|
|
|||||||||||
F-81
Table of Contents
| For the Year Ended December 31, 2014 | ||||||||||||||||||||
| (In thousands) | Commercial and Industrial |
Commercial Real Estate |
Consumer | Small Business |
Total | |||||||||||||||
| As of December 31, 2013 |
$ | 15,856 | $ | 12,307 | $ | 15,459 | $ | 647 | $ | 44,269 | ||||||||||
| Provision for loan losses: |
||||||||||||||||||||
| ACI loans |
(1,931 | ) | (2,901 | ) | (1,191 | ) | — | (6,023 | ) | |||||||||||
| ANCI loans |
(854 | ) | (148 | ) | 1,838 | 830 | 1,666 | |||||||||||||
| Originated loans |
15,557 | 679 | 1,450 | 789 | 18,475 | |||||||||||||||
|
|
|
|
|
|
|
|
|
|
|
|||||||||||
| Total provision |
12,772 | (2,370 | ) | 2,097 | 1,619 | 14,118 | ||||||||||||||
|
|
|
|
|
|
|
|
|
|
|
|||||||||||
| Charge-offs: |
||||||||||||||||||||
| ACI loans |
— | 4,668 | 385 | — | 5,053 | |||||||||||||||
| ANCI loans |
190 | — | 2,266 | 293 | 2,749 | |||||||||||||||
| Originated loans |
843 | — | 662 | — | 1,505 | |||||||||||||||
|
|
|
|
|
|
|
|
|
|
|
|||||||||||
| Total charge-offs |
1,033 | 4,668 | 3,313 | 293 | 9,307 | |||||||||||||||
|
|
|
|
|
|
|
|
|
|
|
|||||||||||
| Recoveries: |
||||||||||||||||||||
| ACI loans |
1,333 | 1,719 | 612 | — | 3,664 | |||||||||||||||
| ANCI loans |
2 | 62 | 388 | 15 | 467 | |||||||||||||||
| Originated loans |
— | — | 309 | — | 309 | |||||||||||||||
|
|
|
|
|
|
|
|
|
|
|
|||||||||||
| Total recoveries |
1,335 | 1,781 | 1,309 | 15 | 4,440 | |||||||||||||||
|
|
|
|
|
|
|
|
|
|
|
|||||||||||
| As of December 31, 2014 |
$ | 28,930 | $ | 7,050 | $ | 15,552 | $ | 1,988 | $ | 53,520 | ||||||||||
|
|
|
|
|
|
|
|
|
|
|
|||||||||||
| ACL |
||||||||||||||||||||
| ACI loans collectively evaluated for impairment |
$ | 2,528 | $ | 3,577 | $ | 11,812 | $ | — | $ | 17,917 | ||||||||||
| ACI loans individually evaluated for impairment |
1,229 | 266 | 391 | — | 1,886 | |||||||||||||||
| ANCI loans collectively evaluated for impairment |
348 | 51 | 259 | 205 | 863 | |||||||||||||||
| ANCI loans individually evaluated for impairment |
— | — | 18 | 594 | 612 | |||||||||||||||
| Originated loans collectively evaluated for impairment |
21,685 | 3,156 | 3,065 | 1,189 | 29,095 | |||||||||||||||
| Originated loans individually evaluated for impairment |
3,140 | — | 7 | — | 3,147 | |||||||||||||||
|
|
|
|
|
|
|
|
|
|
|
|||||||||||
| ACL as of December 31, 2014 |
$ | 28,930 | $ | 7,050 | $ | 15,552 | $ | 1,988 | $ | 53,520 | ||||||||||
|
|
|
|
|
|
|
|
|
|
|
|||||||||||
F-82
Table of Contents
Impaired Originated and ANCI Loans Including TDRs
The following includes certain key information about individually impaired originated and ANCI loans as of and for the years ended December 31, 2016 and 2015.
Originated and ANCI Loans Identified as Impaired
| As of December 31, 2016 | ||||||||||||||||||||
| (In thousands) | Recorded Investment in Impaired Loans(1) |
Unpaid Principal Balance |
Related Specific Allowance |
Nonaccrual Loans Included in Impaired Loans |
Undisbursed Commitments |
|||||||||||||||
| With no related allowance for credit losses |
||||||||||||||||||||
| Commercial and Industrial |
||||||||||||||||||||
| General C&I |
$ | 12,334 | $ | 13,426 | $ | — | $ | 6,838 | $ | 1,363 | ||||||||||
| Energy sector |
99,200 | 103,322 | — | 85,149 | 8,465 | |||||||||||||||
|
|
|
|
|
|
|
|
|
|
|
|||||||||||
| Total commercial and industrial |
111,534 | 116,748 | — | 91,987 | 9,828 | |||||||||||||||
|
|
|
|
|
|
|
|
|
|
|
|||||||||||
| Consumer |
||||||||||||||||||||
| Residential real estate |
437 | 435 | — | — | — | |||||||||||||||
| Other |
429 | 427 | — | — | 1 | |||||||||||||||
|
|
|
|
|
|
|
|
|
|
|
|||||||||||
| Total consumer |
866 | 862 | — | — | 1 | |||||||||||||||
|
|
|
|
|
|
|
|
|
|
|
|||||||||||
| Small Business Lending |
299 | 703 | — | 299 | — | |||||||||||||||
|
|
|
|
|
|
|
|
|
|
|
|||||||||||
| Total |
$ | 112,699 | $ | 118,313 | $ | — | $ | 92,286 | $ | 9,829 | ||||||||||
|
|
|
|
|
|
|
|
|
|
|
|||||||||||
| With allowance for credit losses recorded |
||||||||||||||||||||
| Commercial and Industrial |
||||||||||||||||||||
| Energy sector |
$ | 39,319 | $ | 45,243 | $ | 1,598 | $ | 28,228 | $ | 4,788 | ||||||||||
| Consumer |
||||||||||||||||||||
| Residential real estate |
736 | 741 | 37 | 39 | — | |||||||||||||||
| Small Business Lending |
641 | 897 | 40 | 90 | — | |||||||||||||||
|
|
|
|
|
|
|
|
|
|
|
|||||||||||
| Total |
$ | 40,696 | $ | 46,881 | $ | 1,675 | $ | 28,357 | $ | 4,788 | ||||||||||
|
|
|
|
|
|
|
|
|
|
|
|||||||||||
F-83
Table of Contents
| As of December 31, 2015 | ||||||||||||||||||||
| (In thousands) | Recorded Investment in Impaired Loans(1) |
Unpaid Principal Balance |
Related Specific Allowance |
Nonaccrual Loans Included in Impaired Loans |
Undisbursed Commitments |
|||||||||||||||
| With no related allowance for credit losses |
||||||||||||||||||||
| Commercial and Industrial |
||||||||||||||||||||
| General C&I |
$ | 10,120 | $ | 10,073 | $ | — | $ | 630 | $ | 3,727 | ||||||||||
| Energy sector |
31,107 | 37,175 | — | 31,062 | 10,253 | |||||||||||||||
|
|
|
|
|
|
|
|
|
|
|
|||||||||||
| Total commercial and industrial |
41,227 | 47,248 | — | 31,692 | 13,980 | |||||||||||||||
|
|
|
|
|
|
|
|
|
|
|
|||||||||||
| Consumer |
||||||||||||||||||||
| Residential real estate |
758 | 761 | — | 84 | — | |||||||||||||||
| Other |
306 | 304 | — | — | — | |||||||||||||||
|
|
|
|
|
|
|
|
|
|
|
|||||||||||
| Total consumer |
1,064 | 1,065 | — | 84 | — | |||||||||||||||
|
|
|
|
|
|
|
|
|
|
|
|||||||||||
| Small Business Lending |
— | — | — | — | — | |||||||||||||||
|
|
|
|
|
|
|
|
|
|
|
|||||||||||
| Total |
$ | 42,291 | $ | 48,313 | $ | — | $ | 31,776 | $ | 13,980 | ||||||||||
|
|
|
|
|
|
|
|
|
|
|
|||||||||||
| With allowance for credit losses recorded |
||||||||||||||||||||
| Commercial and Industrial |
||||||||||||||||||||
| General C&I |
$ | 6,202 | $ | 6,202 | $ | 124 | $ | 6,202 | $ | 10,071 | ||||||||||
| Energy sector |
26,952 | 30,097 | 4,379 | 16,653 | 9,215 | |||||||||||||||
|
|
|
|
|
|
|
|
|
|
|
|||||||||||
| Total commercial and industrial |
33,154 | 36,299 | 4,503 | 22,855 | 19,286 | |||||||||||||||
|
|
|
|
|
|
|
|
|
|
|
|||||||||||
| Consumer |
||||||||||||||||||||
| Residential real estate |
680 | 678 | 40 | — | — | |||||||||||||||
| Small Business Lending |
459 | 1,063 | 21 | 459 | — | |||||||||||||||
|
|
|
|
|
|
|
|
|
|
|
|||||||||||
| Total |
$ | 34,293 | $ | 38,040 | $ | 4,564 | $ | 23,314 | $ | 19,286 | ||||||||||
|
|
|
|
|
|
|
|
|
|
|
|||||||||||
| (1) | The recorded investment of a loan also includes any interest receivable, net unearned discount or fees, and unamortized premium or discount. |
F-84
Table of Contents
Average Recorded Investment in Impaired Originated and ANCI Loans
| December 31, | ||||||||||||||||||||||||
| 2016 | 2015 | 2014 | ||||||||||||||||||||||
| (In thousands) | Originated | ANCI | Originated | ANCI | Originated | ANCI | ||||||||||||||||||
| Commercial and Industrial |
||||||||||||||||||||||||
| General C&I |
$ | 10,859 | $ | 432 | $ | 6,347 | $ | — | $ | — | $ | — | ||||||||||||
| Energy sector |
150,898 | — | 20,105 | — | 6,684 | — | ||||||||||||||||||
|
|
|
|
|
|
|
|
|
|
|
|
|
|||||||||||||
| Total commercial and industrial |
161,757 | 432 | 26,452 | — | 6,684 | — | ||||||||||||||||||
|
|
|
|
|
|
|
|
|
|
|
|
|
|||||||||||||
| Commercial Real Estate |
||||||||||||||||||||||||
| Income producing |
— | — | — | — | 10 | — | ||||||||||||||||||
|
|
|
|
|
|
|
|
|
|
|
|
|
|||||||||||||
| Total commercial real estate |
— | — | — | — | 10 | — | ||||||||||||||||||
|
|
|
|
|
|
|
|
|
|
|
|
|
|||||||||||||
| Consumer |
||||||||||||||||||||||||
| Residential real estate |
— | 1,206 | 39 | 1,528 | 101 | 1,162 | ||||||||||||||||||
| Other |
398 | — | 273 | — | — | — | ||||||||||||||||||
|
|
|
|
|
|
|
|
|
|
|
|
|
|||||||||||||
| Total consumer |
398 | 1,206 | 312 | 1,528 | 101 | 1,162 | ||||||||||||||||||
|
|
|
|
|
|
|
|
|
|
|
|
|
|||||||||||||
| Small Business Lending |
138 | 409 | 27 | 696 | — | 1,264 | ||||||||||||||||||
|
|
|
|
|
|
|
|
|
|
|
|
|
|||||||||||||
| Total |
$ | 162,293 | $ | 2,047 | $ | 26,791 | $ | 2,224 | $ | 6,795 | $ | 2,426 | ||||||||||||
|
|
|
|
|
|
|
|
|
|
|
|
|
|||||||||||||
Included in impaired loans are loans considered TDRs. The Company attempts to work with borrowers when necessary to extend or modify loan terms to better align with the borrower’s ability to repay. Extensions and modifications to loans are made in accordance with internal policies and guidelines which conform to regulatory guidance. Each occurrence is unique to the borrower and is evaluated separately. The Bank considers regulatory guidelines when restructuring loans to ensure that prudent lending practices are followed. Qualifying criteria and payment terms are structured by the borrower’s current and prospective ability to comply with the modified terms of the loan.
A modification is classified as a TDR if the borrower is experiencing financial difficulty and it is determined that the Company has granted a concession to the borrower. The Company may determine that a borrower is experiencing financial difficulty if the borrower is currently in default on any of its debt, or if it is probable that a borrower may default in the foreseeable future without the modification. Concessions could include reductions of interest rates, extension of the maturity date at a rate lower than current market rate for a new loan with similar risk, reduction of accrued interest, principal forgiveness, forbearance, or other concessions. The assessments of whether a borrower is experiencing or will likely experience financial difficulty and whether a concession has been granted is highly subjective in nature, and management’s judgment is required when determining whether a modification is classified as a TDR. Current amendments to the accounting guidance preclude a creditor from using the effective interest rate test in the debtor’s guidance on restructuring of payables (paragraph 470-60-55-10) when evaluating whether a restructuring constitutes a TDR.
All TDRs are reported as impaired. Impaired classification may be removed if the borrower demonstrates compliance with the modified terms and the restructuring agreement specifies an interest rate equal to that which would be provided to a borrower with similar credit at the time of restructuring. The majority of TDRs are classified as impaired loans for the remaining life of the loan. Nonperforming loans and impaired loans are defined differently. Some loans may be included in both categories, whereas other loans may only be included in one category.
F-85
Table of Contents
Originated and ANCI Loans that were modified into TDRs
| For the Year Ended December 31, 2016 | ||||||||||||||||
| During the Period | Default(1) during the Period |
|||||||||||||||
| (In thousands) | Number of TDRs |
Recorded Investment |
Number of TDRs |
Recorded Investment |
||||||||||||
| Commercial and Industrial |
||||||||||||||||
| General C&I |
1 | $ | 5,496 | — | $ | — | ||||||||||
| Energy sector |
5 | 38,113 | — | — | ||||||||||||
|
|
|
|
|
|
|
|
|
|||||||||
| Total commercial and industrial |
6 | 43,609 | — | — | ||||||||||||
|
|
|
|
|
|||||||||||||
| Consumer |
||||||||||||||||
| Residential real estate |
1 | 334 | — | — | ||||||||||||
| Other |
1 | 200 | — | — | ||||||||||||
|
|
|
|
|
|||||||||||||
| Total consumer |
2 | 534 | — | — | ||||||||||||
| Small Business Lending |
1 | 552 | — | — | ||||||||||||
|
|
|
|
|
|
|
|
|
|||||||||
| Total |
9 | $ | 44,695 | — | $ | — | ||||||||||
|
|
|
|
|
|
|
|
|
|||||||||
| For the Year Ended December 31, 2015 | ||||||||||||||||
| During the Period | Default(1) during the Period |
|||||||||||||||
| (In thousands) | Number of TDRs |
Recorded Investment |
Number of TDRs |
Recorded Investment |
||||||||||||
| Commercial and Industrial |
||||||||||||||||
| General C&I |
3 | $ | 9,840 | — | $ | — | ||||||||||
| Energy sector |
2 | 16,619 | — | — | ||||||||||||
|
|
|
|
|
|
|
|
|
|||||||||
| Total commercial and industrial |
5 | 26,459 | — | — | ||||||||||||
|
|
|
|
|
|
|
|
|
|||||||||
| Consumer |
||||||||||||||||
| Residential real estate |
5 | 273 | — | — | ||||||||||||
| Other |
1 | 306 | — | — | ||||||||||||
|
|
|
|
|
|
|
|
|
|||||||||
| Total consumer |
6 | 579 | — | — | ||||||||||||
|
|
|
|
|
|
|
|
|
|||||||||
| Small Business Lending |
— | — | 2 | 459 | ||||||||||||
|
|
|
|
|
|
|
|
|
|||||||||
| Total |
11 | $ | 27,038 | 2 | $ | 459 | ||||||||||
|
|
|
|
|
|
|
|
|
|||||||||
| For the Year Ended December 31, 2014 | ||||||||||||||||
| During the Period | Default(1) during the Period |
|||||||||||||||
| (In thousands) | Number of TDRs |
Recorded Investment |
Number of TDRs |
Recorded Investment |
||||||||||||
| Commercial and Industrial |
||||||||||||||||
| General C&I |
— | $ | — | — | $ | — | ||||||||||
| Energy sector |
1 | 2,773 | — | — | ||||||||||||
|
|
|
|
|
|
|
|
|
|||||||||
| Total commercial and industrial |
1 | 2,773 | — | — | ||||||||||||
|
|
|
|
|
|
|
|
|
|||||||||
| Consumer |
||||||||||||||||
| Residential real estate |
7 | 1,256 | 1 | 101 | ||||||||||||
| Other |
— | — | — | — | ||||||||||||
|
|
|
|
|
|
|
|
|
|||||||||
| Total consumer |
7 | 1,256 | 1 | 101 | ||||||||||||
|
|
|
|
|
|
|
|
|
|||||||||
| Small Business Lending |
1 | 176 | 2 | 1,078 | ||||||||||||
|
|
|
|
|
|
|
|
|
|||||||||
| Total |
9 | $ | 4,205 | 3 | $ | 1,179 | ||||||||||
|
|
|
|
|
|
|
|
|
|||||||||
F-86
Table of Contents
| (1) | Default is defined as the earlier of the troubled debt restructuring being placed on non-accrual status or obtaining 90 day past due status with respect to principal and/or interest payments. |
| For the Year Ended December 31, 2016 | ||||||||||||
| Number of Loans Modified by: | ||||||||||||
| Forbearance Agreement |
Rate Concession |
Modified Terms and/ or Other Concessions |
||||||||||
| Commercial and Industrial |
||||||||||||
| General C&I |
— | — | 1 | |||||||||
| Energy sector |
2 | 1 | 2 | |||||||||
|
|
|
|
|
|
|
|||||||
| Total commercial and industrial |
2 | 1 | 3 | |||||||||
|
|
|
|
|
|
|
|||||||
| Consumer |
||||||||||||
| Residential real estate |
— | — | 1 | |||||||||
| Other |
— | — | 1 | |||||||||
|
|
|
|
|
|
|
|||||||
| Total consumer |
— | — | 2 | |||||||||
| Small Business Lending |
— | 1 | — | |||||||||
|
|
|
|
|
|
|
|||||||
| Total |
2 | 2 | 5 | |||||||||
|
|
|
|
|
|
|
|||||||
| For the Year Ended December 31, 2015 |
||||||||
| Number of Loans Modified by: | ||||||||
| Rate Concession |
Modified Terms and/ or Other Concessions |
|||||||
| Commercial and Industrial |
||||||||
| General C&I |
— | 3 | ||||||
| Energy sector |
— | 2 | ||||||
|
|
|
|
|
|||||
| Total commercial and industrial |
— | 5 | ||||||
|
|
|
|
|
|||||
| Consumer |
||||||||
| Residential real estate |
5 | — | ||||||
| Other |
— | 1 | ||||||
|
|
|
|
|
|||||
| Total consumer |
5 | 1 | ||||||
|
|
|
|
|
|||||
| Total |
5 | 6 | ||||||
|
|
|
|
|
|||||
| For the Year Ended December 31, 2014 | ||||||||||||
| Number of Loans Modified by: | ||||||||||||
| Forbearance Agreement |
Rate Concession |
Modified Terms and/ or Other Concessions |
||||||||||
| Commercial and Industrial |
||||||||||||
| Energy sector |
— | 1 | — | |||||||||
|
|
|
|
|
|
|
|||||||
| Consumer |
||||||||||||
| Residential real estate |
5 | 1 | 1 | |||||||||
|
|
|
|
|
|
|
|||||||
| Small Business Lending |
1 | — | — | |||||||||
|
|
|
|
|
|
|
|||||||
| Total |
6 | 2 | 1 | |||||||||
|
|
|
|
|
|
|
|||||||
F-87
Table of Contents
Credit Exposure in the Originated and ANCI Loan Portfolios
The following provides information regarding the credit exposure by portfolio segment and class of receivable as of December 31, 2016 and 2015:
Commercial Real Estate credit exposure, based on internal risk rating:
| As of December 31, 2016 | As of December 31, 2015 | |||||||||||||||
| (Recorded Investment in thousands) | Income producing |
Land and development |
Income producing |
Land and development |
||||||||||||
| Originated Loans |
||||||||||||||||
| Pass |
$ | 888,608 | $ | 67,742 | $ | 660,489 | $ | 72,375 | ||||||||
| Special mention |
— | 23 | — | — | ||||||||||||
| Substandard |
— | — | 84 | — | ||||||||||||
|
|
|
|
|
|
|
|
|
|||||||||
| Total originated loans |
888,608 | 67,765 | 660,573 | 72,375 | ||||||||||||
|
|
|
|
|
|
|
|
|
|||||||||
| ANCI Loans |
||||||||||||||||
| Pass |
18,410 | 1,618 | 27,242 | 2,391 | ||||||||||||
| Special mention |
— | — | — | 148 | ||||||||||||
| Substandard |
— | 341 | — | 191 | ||||||||||||
|
|
|
|
|
|
|
|
|
|||||||||
| Total ANCI loans |
18,410 | 1,959 | 27,242 | 2,730 | ||||||||||||
|
|
|
|
|
|
|
|
|
|||||||||
| Total |
$ | 907,018 | $ | 69,724 | $ | 687,815 | $ | 75,105 | ||||||||
|
|
|
|
|
|
|
|
|
|||||||||
Commercial and Industrial credit exposure, based on internal risk rating:
| As of December 31, 2016 | ||||||||||||||||
| (Recorded Investment in thousands) | General C&I | Energy | Restaurant | Healthcare | ||||||||||||
| Originated Loans |
||||||||||||||||
| Pass |
$ | 2,279,481 | $ | 670,696 | $ | 849,546 | $ | 426,276 | ||||||||
| Special mention |
36,419 | 30,433 | 16,169 | 9,479 | ||||||||||||
| Substandard |
26,968 | 239,457 | — | — | ||||||||||||
| Doubtful |
— | 789 | — | — | ||||||||||||
|
|
|
|
|
|
|
|
|
|||||||||
| Total originated loans |
2,342,868 | 941,375 | 865,715 | 435,755 | ||||||||||||
|
|
|
|
|
|
|
|
|
|||||||||
| ANCI Loans |
||||||||||||||||
| Pass |
47,269 | — | — | 4,114 | ||||||||||||
| Special Mention |
— | — | — | — | ||||||||||||
| Substandard |
521 | — | — | — | ||||||||||||
|
|
|
|
|
|
|
|
|
|||||||||
| Total ANCI loans |
47,790 | — | — | 4,114 | ||||||||||||
|
|
|
|
|
|
|
|
|
|||||||||
| Total |
$ | 2,390,658 | $ | 941,375 | $ | 865,715 | $ | 439,869 | ||||||||
|
|
|
|
|
|
|
|
|
|||||||||
F-88
Table of Contents
| As of December 31, 2015 | ||||||||||||||||
| (Recorded Investment in thousands) | General C&I | Energy | Restaurant | Healthcare | ||||||||||||
| Originated Loans |
||||||||||||||||
| Pass |
$ | 2,221,218 | $ | 724,011 | $ | 601,996 | $ | 442,117 | ||||||||
| Special mention |
14,056 | 104,781 | 25,313 | 212 | ||||||||||||
| Substandard |
42,705 | 241,032 | — | 5,097 | ||||||||||||
|
|
|
|
|
|
|
|
|
|||||||||
| Total originated loans |
2,277,979 | 1,069,824 | 627,309 | 447,426 | ||||||||||||
|
|
|
|
|
|
|
|
|
|||||||||
| ANCI Loans |
||||||||||||||||
| Pass |
53,233 | — | — | 8,389 | ||||||||||||
| Special Mention |
500 | — | — | — | ||||||||||||
| Substandard |
1,855 | — | — | 23 | ||||||||||||
|
|
|
|
|
|
|
|
|
|||||||||
| Total ANCI loans |
55,588 | — | — | 8,412 | ||||||||||||
|
|
|
|
|
|
|
|
|
|||||||||
| Total |
$ | 2,333,567 | $ | 1,069,824 | $ | 627,309 | $ | 455,838 | ||||||||
|
|
|
|
|
|
|
|
|
|||||||||
Consumer credit exposure, based on internal risk rating:
| As of December 31, 2016 | As of December 31, 2015 | |||||||||||||||
| (Recorded Investment in thousands) | Residential Real Estate |
Other | Residential Real Estate |
Other | ||||||||||||
| Originated Loans |
||||||||||||||||
| Pass |
$ | 1,126,679 | $ | 59,145 | $ | 830,883 | $ | 82,976 | ||||||||
| Special mention |
422 | 455 | 1,921 | 1,146 | ||||||||||||
| Substandard |
1,096 | 415 | 358 | 963 | ||||||||||||
|
|
|
|
|
|
|
|
|
|||||||||
| Total originated loans |
1,128,197 | 60,015 | 833,162 | 85,085 | ||||||||||||
|
|
|
|
|
|
|
|
|
|||||||||
| ANCI Loans |
||||||||||||||||
| Pass |
141,349 | 7,151 | 186,278 | 5,923 | ||||||||||||
| Special mention |
2,156 | 53 | 2,197 | 39 | ||||||||||||
| Substandard |
2,775 | 4 | 2,979 | 14 | ||||||||||||
|
|
|
|
|
|
|
|
|
|||||||||
| Total ANCI loans |
146,280 | 7,208 | 191,454 | 5,976 | ||||||||||||
|
|
|
|
|
|
|
|
|
|||||||||
| Total |
$ | 1,274,477 | $ | 67,223 | $ | 1,024,616 | $ | 91,061 | ||||||||
|
|
|
|
|
|
|
|
|
|||||||||
Small Business credit exposure, based on internal risk rating:
| As of December 31, | ||||||||
| (Recorded Investment in thousands) | 2016 | 2015 | ||||||
| Originated Loans |
||||||||
| Pass |
$ | 182,021 | $ | 138,306 | ||||
| Special mention |
1,807 | 1,310 | ||||||
| Substandard |
1,116 | 762 | ||||||
|
|
|
|
|
|||||
| Total originated loans |
184,944 | 140,378 | ||||||
|
|
|
|
|
|||||
| ANCI Loans |
||||||||
| Pass |
8,407 | 10,368 | ||||||
| Special mention |
11 | 8 | ||||||
| Substandard |
764 | 945 | ||||||
|
|
|
|
|
|||||
| Total ANCI loans |
9,182 | 11,321 | ||||||
|
|
|
|
|
|||||
| Total |
$ | 194,126 | $ | 151,699 | ||||
|
|
|
|
|
|||||
F-89
Table of Contents
The following provides an aging of past due originated and ANCI loans by portfolio segment and class of receivable as of December 31, 2016 and 2015:
Aging of Past due Originated and ANCI Loans
| As of December 31, 2016 | ||||||||||||||||||||||||||||
| Accruing Loans | Non-Accruing Loans | |||||||||||||||||||||||||||
| (Recorded Investment in thousands) | 30-59 DPD |
60-89 DPD |
90+DPD | 0-29 DPD | 30-59 DPD |
60-89 DPD |
90+DPD | |||||||||||||||||||||
| Originated Loans |
||||||||||||||||||||||||||||
| Commercial and Industrial |
||||||||||||||||||||||||||||
| General C&I |
$ | 3,930 | $ | — | $ | — | $ | — | $ | 6,839 | $ | — | $ | 250 | ||||||||||||||
| Energy sector |
— | — | — | 112,937 | — | — | 447 | |||||||||||||||||||||
|
|
|
|
|
|
|
|
|
|
|
|
|
|
|
|||||||||||||||
| Total commercial and industrial |
3,930 | — | — | 112,937 | 6,839 | — | 697 | |||||||||||||||||||||
|
|
|
|
|
|
|
|
|
|
|
|
|
|
|
|||||||||||||||
| Commercial Real Estate |
||||||||||||||||||||||||||||
| Income producing |
4 | — | — | — | — | — | — | |||||||||||||||||||||
|
|
|
|
|
|
|
|
|
|
|
|
|
|
|
|||||||||||||||
| Consumer |
||||||||||||||||||||||||||||
| Residential real estate |
1,388 | 239 | 244 | 344 | — | — | 454 | |||||||||||||||||||||
| Other |
534 | — | — | — | — | — | — | |||||||||||||||||||||
|
|
|
|
|
|
|
|
|
|
|
|
|
|
|
|||||||||||||||
| Total consumer |
1,922 | 239 | 244 | 344 | — | — | 454 | |||||||||||||||||||||
|
|
|
|
|
|
|
|
|
|
|
|
|
|
|
|||||||||||||||
| Small Business Lending |
2,003 | 563 | 87 | 80 | 16 | 36 | — | |||||||||||||||||||||
|
|
|
|
|
|
|
|
|
|
|
|
|
|
|
|||||||||||||||
| Total |
$ | 7,859 | $ | 802 | $ | 331 | $ | 113,361 | $ | 6,855 | $ | 36 | $ | 1,151 | ||||||||||||||
|
|
|
|
|
|
|
|
|
|
|
|
|
|
|
|||||||||||||||
| ANCI Loans |
||||||||||||||||||||||||||||
| Commercial and Industrial |
||||||||||||||||||||||||||||
| General C&I |
$ | — | $ | — | $ | — | $ | 125 | $ | — | $ | — | $ | — | ||||||||||||||
| Commercial Real Estate |
||||||||||||||||||||||||||||
| Land and development |
259 | — | — | — | — | 341 | — | |||||||||||||||||||||
| Consumer |
||||||||||||||||||||||||||||
| Residential real estate |
1,522 | 839 | 252 | 1,083 | 30 | — | 1,619 | |||||||||||||||||||||
| Other |
18 | — | 3 | — | — | — | — | |||||||||||||||||||||
|
|
|
|
|
|
|
|
|
|
|
|
|
|
|
|||||||||||||||
| Total consumer |
1,540 | 839 | 255 | 1,083 | 30 | — | 1,619 | |||||||||||||||||||||
|
|
|
|
|
|
|
|
|
|
|
|
|
|
|
|||||||||||||||
| Small Business Lending |
— | — | — | 480 | 62 | — | 131 | |||||||||||||||||||||
|
|
|
|
|
|
|
|
|
|
|
|
|
|
|
|||||||||||||||
| Total |
$ | 1,799 | $ | 839 | $ | 255 | $ | 1,688 | $ | 92 | $ | 341 | $ | 1,750 | ||||||||||||||
|
|
|
|
|
|
|
|
|
|
|
|
|
|
|
|||||||||||||||
F-90
Table of Contents
| As of December 31, 2015 | ||||||||||||||||||||||||||||
| Accruing Loans | Non-Accruing Loans | |||||||||||||||||||||||||||
| (Recorded Investment in thousands) | 30-59 DPD |
60-89 DPD |
90+DPD | 0-29 DPD |
30-59 DPD |
60-89 DPD |
90+DPD | |||||||||||||||||||||
| Originated Loans |
||||||||||||||||||||||||||||
| Commercial and Industrial |
||||||||||||||||||||||||||||
| General C&I |
$ | 12,947 | $ | — | $ | — | $ | 6,203 | $ | — | $ | — | $ | 1,012 | ||||||||||||||
| Energy sector |
— | — | — | 44,256 | 3,503 | — | — | |||||||||||||||||||||
| Healthcare |
300 | — | — | |||||||||||||||||||||||||
|
|
|
|
|
|
|
|
|
|
|
|
|
|
|
|||||||||||||||
| Total commercial and industrial |
12,947 | — | 300 | 50,459 | 3,503 | — | 1,012 | |||||||||||||||||||||
|
|
|
|
|
|
|
|
|
|
|
|
|
|
|
|||||||||||||||
| Commercial Real Estate |
||||||||||||||||||||||||||||
| Income producing |
— | — | — | — | — | — | 66 | |||||||||||||||||||||
| Land and development |
8 | — | — | — | — | — | — | |||||||||||||||||||||
|
|
|
|
|
|
|
|
|
|
|
|
|
|
|
|||||||||||||||
| Total commercial real estate |
8 | — | — | — | — | — | 66 | |||||||||||||||||||||
|
|
|
|
|
|
|
|
|
|
|
|
|
|
|
|||||||||||||||
| Consumer |
||||||||||||||||||||||||||||
| Residential real estate |
598 | 423 | 67 | — | — | — | 108 | |||||||||||||||||||||
| Other |
94 | 20 | 11 | — | — | — | — | |||||||||||||||||||||
|
|
|
|
|
|
|
|
|
|
|
|
|
|
|
|||||||||||||||
| Total consumer |
692 | 443 | 78 | — | — | — | 108 | |||||||||||||||||||||
|
|
|
|
|
|
|
|
|
|
|
|
|
|
|
|||||||||||||||
| Small Business Lending |
225 | 45 | — | 11 | — | — | 79 | |||||||||||||||||||||
|
|
|
|
|
|
|
|
|
|
|
|
|
|
|
|||||||||||||||
| Total |
$ | 13,872 | $ | 488 | $ | 378 | $ | 50,470 | $ | 3,503 | $ | — | $ | 1,265 | ||||||||||||||
|
|
|
|
|
|
|
|
|
|
|
|
|
|
|
|||||||||||||||
| ANCI Loans |
||||||||||||||||||||||||||||
| Commercial and Industrial |
||||||||||||||||||||||||||||
| General C&I |
$ | 47 | $ | 33 | $ | — | $ | 50 | $ | — | $ | — | $ | — | ||||||||||||||
| Healthcare |
23 | — | — | — | — | — | — | |||||||||||||||||||||
|
|
|
|
|
|
|
|
|
|
|
|
|
|
|
|||||||||||||||
| Total commercial and industrial |
70 | 33 | — | 50 | — | — | — | |||||||||||||||||||||
|
|
|
|
|
|
|
|
|
|
|
|
|
|
|
|||||||||||||||
| Commercial Real Estate |
||||||||||||||||||||||||||||
| Land and development |
— | — | 148 | — | — | — | — | |||||||||||||||||||||
| Consumer |
||||||||||||||||||||||||||||
| Residential real estate |
1,079 | 307 | 919 | 539 | 411 | 90 | 1,688 | |||||||||||||||||||||
| Other |
20 | 1 | 1 | — | 9 | — | — | |||||||||||||||||||||
|
|
|
|
|
|
|
|
|
|
|
|
|
|
|
|||||||||||||||
| Total consumer |
1,099 | 308 | 920 | 539 | 420 | 90 | 1,688 | |||||||||||||||||||||
|
|
|
|
|
|
|
|
|
|
|
|
|
|
|
|||||||||||||||
| Small Business Lending |
113 | 417 | — | 523 | — | 70 | 151 | |||||||||||||||||||||
|
|
|
|
|
|
|
|
|
|
|
|
|
|
|
|||||||||||||||
| Total |
$ | 1,282 | $ | 758 | $ | 1,068 | $ | 1,112 | $ | 420 | $ | 160 | $ | 1,839 | ||||||||||||||
|
|
|
|
|
|
|
|
|
|
|
|
|
|
|
|||||||||||||||
Acquired Credit Impaired (“ACI”) Loans
The excess of cash flows expected to be collected over the carrying value of ACI loans is referred to as the accretable yield and is recognized in interest income using an effective yield method over the remaining life of the loan, or pools of loans. The accretable yield is affected by:
| • | Changes in interest rate indices for variable rate ACI loans—Expected future cash flows are based on the variable rates in effect at the time of the regular evaluations of cash flows expected to be collected; |
| • | Changes in prepayment assumptions—Prepayments affect the estimated life of ACI loans which may change the amount of interest income, and possibly principal, expected to be collected; and |
| • | Changes in the expected principal and interest payments over the estimated life—Updates to expected cash flows are driven by the credit outlook and actions taken with borrowers. |
F-91
Table of Contents
Changes in the amount of accretable discount for ACI loans for the years ended December 31, 2016 and 2015 were as follows:
Changes in Accretable Yield on ACI Loans
| For the Years Ended December 31, | ||||||||||||
| (In thousands) | 2016 | 2015 | 2014 | |||||||||
| Balance at beginning of year |
$ | 122,791 | $ | 163,631 | $ | 242,966 | ||||||
| Maturities/payoff |
(11,563 | ) | (24,196 | ) | (25,882 | ) | ||||||
| Charge-offs |
(286 | ) | (183 | ) | (1,054 | ) | ||||||
| Foreclosure |
(1,041 | ) | (1,290 | ) | (3,923 | ) | ||||||
| Accretion |
(30,870 | ) | (46,042 | ) | (66,801 | ) | ||||||
| Reclass from nonaccretable difference due to increases in expected cash flow |
19,697 | 30,871 | 18,325 | |||||||||
|
|
|
|
|
|
|
|||||||
| Balance at end of year |
$ | 98,728 | $ | 122,791 | $ | 163,631 | ||||||
|
|
|
|
|
|
|
|||||||
Impaired ACI Loans and Pools Including TDRs
The following includes certain key information about individually impaired ACI loans and pooled ACI loans as of and for the years ended December 31, 2016 and 2015.
ACI Loans / Pools Identified as Impaired
| As of December 31, 2016 | ||||||||||||||||||||
| ACI Loans / Pools Identified as Impaired | ||||||||||||||||||||
| (In thousands) | Recorded Investment in Impaired Loans(1) |
Unpaid Principal Balance |
Related Specific Allowance |
Nonaccrual Loans Included in Impaired Loans |
Undisbursed Commitments |
|||||||||||||||
| Commercial and Industrial |
||||||||||||||||||||
| General C&I |
$ | 9,904 | $ | 22,403 | $ | 16 | $ | 1,818 | $ | — | ||||||||||
| Healthcare |
5,648 | 5,853 | 160 | — | — | |||||||||||||||
|
|
|
|
|
|
|
|||||||||||||||
| Total commercial and industrial |
15,552 | 28,256 | 176 | 1,818 | — | |||||||||||||||
|
|
|
|
|
|
|
|
|
|
|
|||||||||||
| Commercial Real Estate |
||||||||||||||||||||
| Income producing |
42,361 | 60,378 | 1,312 | 1,571 | 609 | |||||||||||||||
| Land and development |
11,067 | 22,568 | 1,342 | 274 | 604 | |||||||||||||||
|
|
|
|
|
|
|
|
|
|
|
|||||||||||
| Total commercial real estate |
53,428 | 82,946 | 2,654 | 1,845 | 1,213 | |||||||||||||||
|
|
|
|
|
|
|
|
|
|
|
|||||||||||
| Consumer |
||||||||||||||||||||
| Residential real estate |
42,174 | 46,946 | 7,046 | — | 5 | |||||||||||||||
| Other |
2,121 | 3,229 | 401 | — | 10 | |||||||||||||||
|
|
|
|
|
|
|
|
|
|
|
|||||||||||
| Total consumer |
44,295 | 50,175 | 7,447 | — | 15 | |||||||||||||||
|
|
|
|
|
|
|
|
|
|
|
|||||||||||
| Total |
$ | 113,275 | $ | 161,377 | $ | 10,277 | $ | 3,663 | $ | 1,228 | ||||||||||
|
|
|
|
|
|
|
|
|
|
|
|||||||||||
F-92
Table of Contents
| As of December 31, 2015 | ||||||||||||||||||||
| ACI Loans / Pools Identified as Impaired | ||||||||||||||||||||
| (In thousands) | Recorded Investment in Impaired Loans(1) |
Unpaid Principal Balance |
Related Specific Allowance |
Nonaccrual Loans Included in Impaired Loans |
Undisbursed Commitments |
|||||||||||||||
| Commercial and Industrial |
||||||||||||||||||||
| General C&I |
$ | 20,179 | $ | 31,551 | $ | 1,641 | $ | 8,210 | $ | 345 | ||||||||||
| Healthcare |
6,054 | 6,222 | 589 | — | — | |||||||||||||||
|
|
|
|
|
|
|
|
|
|
|
|||||||||||
| Total commercial and industrial |
26,233 | 37,773 | 2,230 | 8,210 | 345 | |||||||||||||||
|
|
|
|
|
|
|
|
|
|
|
|||||||||||
| Commercial Real Estate |
||||||||||||||||||||
| Income producing |
49,858 | 66,632 | 1,883 | 2,631 | 2,075 | |||||||||||||||
| Land and development |
6,779 | 32,361 | 1,201 | 225 | 609 | |||||||||||||||
|
|
|
|
|
|
|
|
|
|
|
|||||||||||
| Total commercial real estate |
56,637 | 98,993 | 3,084 | 2,856 | 2,684 | |||||||||||||||
|
|
|
|
|
|
|
|
|
|
|
|||||||||||
| Consumer |
||||||||||||||||||||
| Residential real estate |
207,641 | 227,511 | 8,492 | — | 11 | |||||||||||||||
| Other |
3,041 | 4,269 | 528 | — | 49 | |||||||||||||||
|
|
|
|
|
|
|
|
|
|
|
|||||||||||
| Total consumer |
210,682 | 231,780 | 9,020 | — | 60 | |||||||||||||||
|
|
|
|
|
|
|
|
|
|
|
|||||||||||
| Total |
$ | 293,552 | $ | 368,546 | $ | 14,334 | $ | 11,066 | $ | 3,089 | ||||||||||
|
|
|
|
|
|
|
|
|
|
|
|||||||||||
| (1) | The recorded investment of a loan also includes any interest receivable, net unearned discount or fees, and unamortized premium or discount. |
ACI Loans that Were Modified into TDRs
In each of the years ended December 31, 2016, 2015 and 2014, there was one ACI loan modified in TDR each with a recorded investment of $954 thousand, $625 thousand and $1,854 thousand, respectively. Each of these loans were income producing commercial real estate. There were no TDRs experiencing payment default during the years ended December 31, 2016, 2015 and 2014. Default is defined as the earlier of the troubled debt restructuring being placed on non-accrual status or obtaining 90 day past due status with respect to principal and interest payments.
Credit Exposure in the ACI Portfolio
The following provides information regarding the credit exposure by portfolio segment and class of receivable as of December 31, 2016 and 2015:
ACI Loans by Risk Rating / Delinquency Stratification
Commercial Real Estate credit exposure on ACI loans, based on internal risk rating:
| As of December 31, 2016 | As of December 31, 2015 | |||||||||||||||
| (Recorded Investment in thousands) | Income producing |
Land and development |
Income producing |
Land and development |
||||||||||||
| Pass |
$ | 80,463 | $ | 7,254 | $ | 101,297 | $ | 8,658 | ||||||||
| Special mention |
5,813 | 933 | 2,699 | 1,171 | ||||||||||||
| Substandard |
13,591 | 3,240 | 29,129 | 4,163 | ||||||||||||
| Doubtful |
— | — | — | — | ||||||||||||
|
|
|
|
|
|
|
|
|
|||||||||
| Total |
$ | 99,867 | $ | 11,427 | $ | 133,125 | $ | 13,992 | ||||||||
|
|
|
|
|
|
|
|
|
|||||||||
F-93
Table of Contents
Commercial and Industrial credit exposure on ACI loans, based on internal risk rating:
| As of December 31, 2016 | As of December 31, 2015 | |||||||||||||||
| (Recorded Investment in thousands) | General C&I |
Healthcare | General C&I |
Healthcare | ||||||||||||
| Pass |
$ | 26,634 | $ | 5,648 | $ | 40,087 | $ | 6,054 | ||||||||
| Special mention |
939 | — | 2,004 | — | ||||||||||||
| Substandard |
5,484 | — | 15,726 | — | ||||||||||||
| Doubtful |
33 | — | 29 | — | ||||||||||||
|
|
|
|
|
|
|
|
|
|||||||||
| Total |
$ | 33,090 | $ | 5,648 | $ | 57,846 | $ | 6,054 | ||||||||
|
|
|
|
|
|
|
|
|
|||||||||
Consumer credit exposure, based on internal risk rating:
| As of December 31, 2016 | As of December 31, 2015 | |||||||||||||||
| (Recorded Investment in thousands) | Residential Real Estate |
Other | Residential Real Estate |
Other | ||||||||||||
| Pass |
$ | 157,762 | $ | 1,821 | $ | 206,193 | $ | 2,519 | ||||||||
| Special mention |
3,655 | 14 | 1,162 | 16 | ||||||||||||
| Substandard |
27,586 | 287 | 33,209 | 478 | ||||||||||||
|
|
|
|
|
|
|
|
|
|||||||||
| Total |
$ | 189,003 | $ | 2,122 | $ | 240,564 | $ | 3,013 | ||||||||
|
|
|
|
|
|
|
|
|
|||||||||
Consumer credit exposure on ACI loans, based on past due status:
| As of December 31, 2016 | As of December 31, 2015 | |||||||||||||||
| (Recorded Investment in thousands) | Residential Real Estate |
Other | Residential Real Estate |
Other | ||||||||||||
| 0 – 29 Days Past Due |
$ | 171,457 | $ | 1,871 | $ | 218,317 | $ | 2,583 | ||||||||
| 30 – 59 Days Past Due |
4,070 | 134 | 3,957 | 127 | ||||||||||||
| 60 – 89 Days Past Due |
1,939 | 25 | 2,561 | 59 | ||||||||||||
| 90 – 119 Days Past Due |
622 | 36 | 650 | 1 | ||||||||||||
| 120 + Days Past Due |
10,915 | 56 | 15,079 | 243 | ||||||||||||
|
|
|
|
|
|
|
|
|
|||||||||
| Total |
$ | 189,003 | $ | 2,122 | $ | 240,564 | $ | 3,013 | ||||||||
|
|
|
|
|
|
|
|
|
|||||||||
Note 4—Premises and Equipment
Premises and equipment are stated at cost, less accumulated depreciation and amortization, as follows:
| (In thousands) | Estimated Useful Life in Years |
December 31, | ||||||||||
| 2016 | 2015 | |||||||||||
| Premises: |
||||||||||||
| Land |
— | $ | 16,875 | $ | 16,875 | |||||||
| Buildings, construction and improvements (1) |
2-40 | 52,263 | 51,084 | |||||||||
|
|
|
|
|
|||||||||
| 69,138 | 67,959 | |||||||||||
| Equipment |
3-10 | 31,984 | 30,798 | |||||||||
|
|
|
|
|
|||||||||
| 101,122 | 98,757 | |||||||||||
| Less: Accumulated depreciation and amortization |
(34,446 | ) | (28,362 | ) | ||||||||
|
|
|
|
|
|||||||||
| Total premises |
$ | 66,676 | $ | 70,395 | ||||||||
|
|
|
|
|
|||||||||
| (1) | Leasehold improvements are depreciated over the lesser of the estimated useful life or the lease term. |
F-94
Table of Contents
The amount charged to operating expenses for depreciation was approximately $6.7 million, $7.2 million and $9.0 million for 2016, 2015 and 2014, respectively.
Included in other assets is net software cost totaling $3.4 million and $2.4 million as of December 31, 2016 and 2015, respectively. The amount charged to operating expenses for software amortization was $1.7 million, $1.8 million and $1.4 million for the years ended December 31, 2016, 2015 and 2014, respectively.
The Company leases various premises and equipment under operating leases. The leases have varying terms, with most containing renewal or first-right-of-refusal options for multi-year periods and annual increases in base rates.
The following is a schedule by year of future minimum lease payments under operating leases, as of December 31, 2016:
| Year |
Property | Equipment | Total | |||||||||
| (In thousands) | ||||||||||||
| 2017 |
$ | 9,470 | $ | 323 | $ | 9,793 | ||||||
| 2018 |
9,181 | 248 | 9,429 | |||||||||
| 2019 |
8,858 | 96 | 8,954 | |||||||||
| 2020 |
7,879 | — | 7,879 | |||||||||
| 2021 |
7,152 | — | 7,152 | |||||||||
| Thereafter |
13,625 | — | 13,625 | |||||||||
|
|
|
|
|
|
|
|||||||
| Total minimum lease payments |
$ | 56,165 | $ | 667 | $ | 56,832 | ||||||
|
|
|
|
|
|
|
|||||||
Rental expense for premises and equipment, net of rental income, for the years ended December 31, 2016, 2015 and 2014, was approximately $11.1 million, $13.4 million and $14.0 million, respectively. The major portion of equipment rental expense is related to office equipment and is paid on a month-to-month basis.
Note 5—Goodwill and Other Intangible Assets
The following table summarizes the Company’s goodwill and other intangible assets at December 31, 2016 and 2015:
| (In thousands) | December 31, | |||||||
| 2016 | 2015 | |||||||
| Goodwill |
$ | 317,817 | $ | 317,817 | ||||
| Core deposit intangible, net of accumulated amortization of $35,495 and $31,573 respectively |
4,191 | 8,113 | ||||||
| Customer lists, net of accumulated amortization of $16,041 and $13,431, respectively |
10,659 | 13,269 | ||||||
| Trademarks |
24 | 24 | ||||||
|
|
|
|
|
|||||
| Total goodwill and intangible assets |
$ | 332,691 | $ | 339,223 | ||||
|
|
|
|
|
|||||
The amortization expense relating to other intangible assets was $6.5 million, $8.4 million and $10.3 million for 2016, 2015 and 2014, respectively.
F-95
Table of Contents
Estimated other intangible assets amortization expense for the next five years and thereafter is:
| Year |
Amount | |||
| (In thousands) | ||||
| 2017 |
$ | 4,652 | ||
| 2018 |
3,287 | |||
| 2019 |
995 | |||
| 2020 |
875 | |||
| 2021 |
805 | |||
| Thereafter |
4,236 | |||
|
|
|
|||
| Total |
$ | 14,850 | ||
|
|
|
|||
Note 6—Derivatives
The Company primarily uses derivatives to manage exposure to market risk, including interest rate risk, credit risk and foreign currency risk, and to assist customers with their risk management objectives. Management will designate certain derivatives as hedging instruments in a qualifying hedge accounting relationship. The Company’s remaining derivatives consist of economic hedges that do not qualify for hedge accounting and derivatives held for customer accommodation, or other purposes.
The fair value of derivative positions outstanding is included in other assets and other liabilities in the accompanying consolidated balance sheets and in the net change in each of these financial statement line items in the accompanying consolidated statements of cash flows. For derivatives not designated as hedging instruments, gains and losses due to changes in fair value are included in noninterest income and the operating section of the consolidated statement of cash flows. For derivatives designated as hedging instruments, the effective portion of the gain or loss related to the derivative instrument is recognized as a component of other comprehensive income and subsequently reclassified as interest income when the forecasted transaction affects income. The ineffective portion of the gain or loss is recognized immediately as noninterest income. The notional amounts and estimated fair values as of December 31, 2016 and 2015 were as follows:
| December 31, 2016 | December 31, 2015 | |||||||||||||||||||||||
| Fair Value | Fair Value | |||||||||||||||||||||||
| (In thousands) | Notional Amount |
Other Assets |
Other Liabilities |
Notional Amount |
Other Assets |
Other Liabilities |
||||||||||||||||||
| Derivatives designated as hedging instruments (cash flow hedges): |
||||||||||||||||||||||||
| Commercial loan interest rate swaps |
$ | 1,332,000 | $ | 1,184 | $ | 17,225 | $ | 982,000 | $ | 2,916 | $ | 278 | ||||||||||||
| Derivatives not designated as hedging instruments: |
||||||||||||||||||||||||
| Commercial loan interest rate swaps |
$ | 474,923 | $ | 2,877 | $ | 2,877 | $ | 473,446 | $ | 4,340 | $ | 4,340 | ||||||||||||
| Commercial loan interest rate caps |
286,959 | 94 | 94 | 308,812 | 48 | 48 | ||||||||||||||||||
| Commercial loan interest rate floors |
51,878 | 118 | 118 | — | — | — | ||||||||||||||||||
| Mortgage loan held for sale interest rate lock commitments |
3,788 | 88 | — | 9,024 | 64 | — | ||||||||||||||||||
| Mortgage loan forward sale commitments |
7,724 | — | 46 | 5,021 | 4 | — | ||||||||||||||||||
| Mortgage loan held for sale floating commitments |
5,895 | — | — | 17,390 | — | — | ||||||||||||||||||
| Foreign exchange contracts |
— | — | — | 36,672 | 366 | 312 | ||||||||||||||||||
|
|
|
|
|
|
|
|
|
|
|
|
|
|||||||||||||
| Total derivatives not designated as hedging instruments |
831,167 | 3,177 | 3,135 | 850,365 | 4,822 | 4,700 | ||||||||||||||||||
|
|
|
|
|
|
|
|
|
|
|
|
|
|||||||||||||
| Total derivatives |
$ | 2,163,167 | $ | 4,361 | $ | 20,360 | $ | 1,832,365 | $ | 7,738 | $ | 4,978 | ||||||||||||
|
|
|
|
|
|
|
|
|
|
|
|
|
|||||||||||||
F-96
Table of Contents
The Company is party to collateral support agreements with certain derivative counterparties. Such agreements require that the Company maintain collateral based on the fair values of derivative transactions. In the event of default by the Company, the counterparty would be entitled to the collateral. At December 31, 2016 and 2015, the Company was required to post $20.3 million and $3.4 million, respectively, in cash or securities as collateral for its derivative transactions, which are included in “interest-bearing deposits in banks” on the Company’s consolidated balance sheets. The Company’s master agreements represent written, legally enforceable bilateral agreements that (1) create a single legal obligation for all individual transactions covered by the master agreement and (2) in the event of default, provide the non-defaulting counterparty the right to accelerate, terminate, and close-out on a net basis all transactions under the agreement and to promptly liquidate or set-off collateral posted by the defaulting counterparty. As permitted by U.S. GAAP, the Company does not offset fair value amounts for the right to reclaim cash collateral or the obligation to return cash collateral against fair value amounts of derivatives executed with the same counterparty under the master agreement.
Gain (loss) included in the consolidated statements of income related to derivative instruments for the years ended December 31, 2016, 2015 and 2014 were as follows:
| For the Year Ended December 31, 2016 | ||||||||||||
| (In thousands) | OCI | Reclassified from AOCI to interest income |
Noninterest income |
|||||||||
| Derivatives designated as hedging instruments (cash flow hedges): |
||||||||||||
| Commercial loan interest rate swaps |
$ | (7,444 | ) | $ | 11,255 | $ | 166 | |||||
| Derivatives not designated as hedging instruments: |
||||||||||||
| Mortgage loan held for sale interest rate lock commitments |
$ | — | $ | — | $ | 24 | ||||||
| Mortgage loan forward sale commitments |
— | — | — | |||||||||
| Foreign exchange contracts |
— | — | 1,264 | |||||||||
| For the Year Ended December 31, 2015 | ||||||||||||
| (In thousands) | OCI | Reclassified from AOCI to interest income |
Noninterest income |
|||||||||
| Derivatives designated as hedging instruments (cash flow hedges): |
||||||||||||
| Commercial loan interest rate swaps |
$ | 7,454 | $ | 4,877 | $ | (329 | ) | |||||
| Derivatives not designated as hedging instruments: |
||||||||||||
| Mortgage loan held for sale interest rate lock commitments |
$ | — | $ | — | $ | (66 | ) | |||||
| Mortgage loan forward sale commitments |
— | — | 86 | |||||||||
| Foreign exchange contracts |
— | — | 965 | |||||||||
| For the Year Ended December 31, 2014 | ||||||||||||
| (In thousands) | OCI | Reclassified from AOCI to interest income |
Noninterest income |
|||||||||
| Derivatives not designated as hedging instruments: |
||||||||||||
| Mortgage loan held for sale interest rate lock commitments |
$ | — | $ | — | $ | 52 | ||||||
| Mortgage loan forward sale commitments |
— | — | (105 | ) | ||||||||
| Foreign exchange contracts |
— | — | 604 | |||||||||
F-97
Table of Contents
Interest Rate Swap and Cap Agreements not designated as hedging derivatives
The Company enters into certain interest rate swap, floor and cap agreements on commercial loans that are not designated as hedging instruments. These derivative contracts relate to transactions in which the Company enters into an interest rate swap, floor or cap with a loan customer while at the same time entering into an offsetting interest rate swap or cap with another financial institution. In connection with each swap transaction, the Company agrees to pay interest to the customer on a notional amount at a variable interest rate and receive interest from the customer on a similar notional amount at a fixed interest rate. At the same time, the Company agrees to pay another financial institution the same fixed interest rate on the same notional amount and receive the same variable interest rate on the same notional amount. The interest rate swap transaction allows the Company’s customer to effectively convert a variable rate loan to a fixed rate. The interest rate cap transaction allows the Company’s customer to minimize interest rate risk exposure to rising interest rates. Because the Company acts as an intermediary for its customer, changes in the fair value of the underlying derivative contracts for the most part offset each other and do not significantly impact the Company’s consolidated statements of income. The Company is exposed to credit loss in the event of nonperformance by the parties to the interest rate swap and cap agreements. However, the Company does not anticipate nonperformance by the counterparties. The estimated fair value has been recorded as an asset and a corresponding liability in the accompanying consolidated balance sheets as of December 31, 2016 and 2015.
Cash Flow Hedges
Cash flow hedge relationships mitigate exposure to the variability of future cash flows or other forecasted transactions. The Company uses interest rate swaps to manage overall cash flow changes related to interest rate risk exposure on benchmark interest rate loans. In June 2015 and March 2016, the Company entered into interest rate swap agreements to manage overall cash flow changes related to interest rate risk exposure on benchmark interest rate loans.
| Effective Date |
Maturity Date | Notional Amount (In Thousands) |
Fixed Rate | Variable Rate | ||||||
| June 15, 2015 |
December 17, 2018 | $ | 382,000 | 1.3250% | 1 Month LIBOR | |||||
| June 30, 2015 |
December 31, 2019 | 300,000 | 1.5120% | 1 Month LIBOR | ||||||
| June 30, 2015 |
December 29, 2017 | 300,000 | 0.9530% | 1 Month LIBOR | ||||||
| March 8, 2016 |
February 27, 2026 | 175,000 | 1.5995% | 1 Month LIBOR | ||||||
| March 8, 2016 |
February 27, 2026 | 175,000 | 1.5890% | 1 Month LIBOR | ||||||
Based on our current interest rate forecast, $8.0 million of deferred net gains on derivatives in OCI at December 31, 2016, is estimated to be reclassified into net interest income during the next twelve months due to the receipt of interest payments. Future changes to interest rates may significantly change actual amounts reclassified to income. There were no reclassifications into income during 2016 or 2015 as a result of any discontinuance of cash flow hedges because the forecasted transaction was no longer probable. The maximum length of time over which the Company is hedging a portion of its exposure to the variability in future cash flows for forecasted transactions is approximately nine years as of December 31, 2016.
Note 7—Deposits
Domestic time deposits $250,000 and over were $318.8 million and $299.4 million at December 31, 2016 and 2015, respectively. There were no foreign time deposits at either December 31, 2016 or 2015.
F-98
Table of Contents
At December 31, 2016, the scheduled maturities of time deposits included in interest-bearing deposits were as follows.
| Year |
Amount (in thousands) |
|||
| 2017 |
$ | 812,045 | ||
| 2018 |
283,975 | |||
| 2019 |
303,020 | |||
| 2020 |
35,112 | |||
| 2021 |
19,512 | |||
| Thereafter |
31 | |||
|
|
|
|||
| Total |
$ | 1,453,695 | ||
|
|
|
|||
Note 8—Borrowed Funds
Repurchase Agreements
Securities sold under agreements to repurchase generally mature within one to seven days from the transaction date. Securities underlying the repurchase agreements remain under the control of the Company.
Information concerning the Company’s securities sold under agreements to repurchase as of December 31, 2016 and 2015 is summarized as follows:
| As of December 31, | ||||||||
| (In thousands) | 2016 | 2015 | ||||||
| Balance at period end |
$ | 3,494 | $ | 5,840 | ||||
| Average balance during the year |
5,948 | 7,486 | ||||||
| Average interest rate during the year |
0.19 | % | 0.15 | % | ||||
| Maximum month-end balance during the period |
$ | 8,031 | $ | 10,838 | ||||
Repurchase agreements are treated as collateralized financing obligations and are reflected as a liability in the consolidated balance sheets.
Senior and Subordinated Debt
On March 21, 2014, the Company entered into a loan agreement with an unaffiliated third party to borrow up to $75 million, less applicable debt issuance costs. Interest was payable at a variable rate of LIBOR plus five percent, due monthly. The Company received $75 million dollars and $60 million of the cash proceeds was contributed to the Bank as equity in March, 2014. This debt was repaid in the second quarter of 2014, and new debt was issued, as discussed below.
F-99
Table of Contents
In June 2014, the Company and the Bank completed an unregistered $245 million multi-tranche debt transaction and in March 2015, the Company completed an unregistered $50 million debt transaction ($10 million senior; $40 million subordinated). These transactions enhanced our liquidity and the Bank’s capital levels to support balance sheet growth. Details of the debt transactions are as follows:
| As of December 31, | ||||||||
| (in thousands) | 2016 | 2015 | ||||||
| Cadence Bancorporation: |
||||||||
| 4.875% senior notes, due June 28, 2019 |
$ | 145,000 | $ | 145,000 | ||||
| 5.375% senior notes, due June 28, 2021 |
50,000 | 50,000 | ||||||
| 7.250% subordinated notes, due June 28, 2029, callable in 2024 |
35,000 | 35,000 | ||||||
| 6.500% subordinated notes, due March 2025 , callable in 2020 |
40,000 | 40,000 | ||||||
|
|
|
|
|
|||||
| Total long-term debt—Cadence Bancorporation |
270,000 | 270,000 | ||||||
| Cadence Bank: |
||||||||
| 6.250% subordinated notes, due June 28, 2029, callable in 2024 |
25,000 | 25,000 | ||||||
| Debt issuance cost and unamortized premium |
(2,771 | ) | (3,744 | ) | ||||
|
|
|
|
|
|||||
| Total long-term debt |
$ | 292,229 | $ | 291,256 | ||||
|
|
|
|
|
|||||
The senior transactions were structured with 4 and 7 year maturities to provide holding company liquidity and to stagger the Company’s debt maturity profile. The $35 million and $25 million subordinated debt transactions were structured with a 15 year maturity, 10 year call options, and fixed-to-floating interest rates in order to maximize regulatory capital treatment. These subordinated debt structures were designed to achieve full Tier 2 capital treatment for 10 years. The $40 million subordinated debt transaction has a 5 year call option.
The Company’s senior notes are unsecured, unsubordinated obligations and are equal in right of payment to all of the Company’s other unsecured debt. The Company’s subordinated notes are unsecured obligations and will be subordinated in right of payment to all of the Company’s senior indebtedness and general creditors and to depositors at the Bank. The Company’s senior notes and subordinated notes are not guaranteed by any subsidiary of the Company, including the Bank.
The Bank’s subordinated notes are unsecured obligations and are subordinated in right of payment to all of the Bank’s senior indebtedness and general creditors and to depositors of the Bank. The Bank’s subordinated notes are not guaranteed by the Company or any subsidiary of the Bank.
Payment of principal on the Company’s and Bank’s subordinated notes may be accelerated by holders of such subordinated notes only in the case of certain insolvency events. There is no right of acceleration under the subordinated notes in the case of default. The Company and/or the Bank may be required to obtain the prior written approval of the Federal Reserve, and, in the case of the Bank, the OCC, before it may repay the subordinated notes issued thereby upon acceleration or otherwise.
F-100
Table of Contents
Junior Subordinated Debentures
In conjunction with the Company’s acquisition of CBC and Encore, the junior subordinated debentures were marked to their fair value as of their respective acquisition dates. The related mark is being amortized over the remaining term of the junior subordinated debentures. The following is a list of junior subordinated debt:
| As of December 31, | ||||||||
| (In thousands) | 2016 | 2015 | ||||||
| Junior subordinated debentures, 3 month LIBOR plus 2.85%, due 2033 |
$ | 30,000 | $ | 30,000 | ||||
| Junior subordinated debentures, 3 month LIBOR plus 2.95%, due 2033 |
5,155 | 5,155 | ||||||
| Junior subordinated debentures, 3 month LIBOR plus 1.75%, due 2037 |
15,464 | 15,464 | ||||||
|
|
|
|
|
|||||
| Total par value |
$ | 50,619 | $ | 50,619 | ||||
| Purchase accounting adjustment, net of amortization |
(14,630 | ) | (15,170 | ) | ||||
|
|
|
|
|
|||||
| Total junior subordinated debentures |
$ | 35,989 | $ | 35,449 | ||||
|
|
|
|
|
|||||
Advances from FHLB and Borrowings from FRB
FHLB advances are collateralized by deposits with the FHLB, FHLB stock and loans. FHLB advances were $370 million as of December 31, 2015, all of which matured and repaid in January 2016. There were no outstanding FHLB advances as of December 31, 2016. Any advances will be collateralized by $2.1 billion of commercial and residential real estate loans pledged under a blanket lien arrangement as of December 31, 2016.
As of December 31, 2016, the FHLB has issued for the benefit of the Bank an irrevocable letter of credit. The Bank has a $35 million irrevocable letter of credit in favor of the State of Alabama SAFE Program to secure certain deposits of the State of Alabama. This letter of credit expires September 27, 2017 upon 45 days’ prior notice of non-renewal; otherwise it automatically extends for a successive one-year term.
There were no borrowings from the FRB discount window as of December 31, 2016 and 2015. Any borrowings from the FRB will be collateralized by $708 million in commercial loans pledged under a borrower-in-custody arrangement.
Note 9—Preferred Stock
As part of the Encore acquisition by LLC all of the outstanding preferred stock was assumed by the Company and recorded at its fair value. The related mark was being amortized over the expected remaining life of the instrument. On September 27, 2011 (“Issuance Date”), Encore issued 32,914 shares of Senior Non-Cumulative Perpetual Preferred Stock, Series B, par value $1.00 per share, with a liquidation value of $1,000 per share (“Series B Preferred Stock”) to the Secretary of the Treasury through the Small Business Lending Fund for $32.9 million in cash. Non-cumulative dividends on the Series B Preferred Stock are paid quarterly and will accrue on the liquidation preference at a rate based on changes in the level of Qualified Small Business Lending of the Bank. The Series B Preferred Stock has no maturity date and ranks senior to common stock with respect to the payment of dividends and distributions and amounts payable upon liquidation, dissolution and winding up of the Company. The Series B Preferred Stock generally is non-voting, except in on certain limited circumstances matters that could impact the rights and preferences of the Series B Preferred Stock.
The Series B Preferred Stock was redeemed by the Company in full in August of 2014 at par, which was approximately $32.9 million as of the date of redemption.
F-101
Table of Contents
Note 10—Other Noninterest Income and Other Noninterest Expense
The detail of the other noninterest income and other noninterest expense captions presented in the consolidated statements of income is as follows:
| Year Ended December 31, | ||||||||||||
| (Dollars in thousands) | 2016 | 2015 | 2014 | |||||||||
| Other Noninterest Income |
||||||||||||
| Insurance revenue |
$ | 7,717 | $ | 7,107 | $ | 7,237 | ||||||
| Bankcard fees |
7,270 | 7,213 | 7,667 | |||||||||
| Income from bank owned life insurance policies |
2,954 | 2,994 | 3,343 | |||||||||
| Loss on sale of branches, net |
— | (1,501 | ) | (763 | ) | |||||||
| Other |
(263 | ) | (796 | ) | 3,006 | |||||||
|
|
|
|
|
|
|
|||||||
| Total other noninterest income |
$ | 17,678 | $ | 15,017 | $ | 20,490 | ||||||
|
|
|
|
|
|
|
|||||||
| Year Ended December 31, | ||||||||||||
| (Dollars in thousands) | 2016 | 2015 | 2014 | |||||||||
| Other Noninterest Expense |
||||||||||||
| Net cost of operation of other real estate owned |
$ | 3,033 | $ | 5,238 | $ | 1,806 | ||||||
| Data processing |
6,280 | 6,092 | 6,052 | |||||||||
| Special asset expenses |
1,788 | 3,000 | 5,852 | |||||||||
| Consulting and professional fees |
6,728 | 5,671 | 6,278 | |||||||||
| Loan related expenses |
3,114 | 3,745 | 5,166 | |||||||||
| FDIC insurance |
7,228 | 5,027 | 4,747 | |||||||||
| Communications |
2,656 | 3,249 | 3,768 | |||||||||
| Advertising and public relations |
1,369 | 2,295 | 3,353 | |||||||||
| Legal expenses |
2,721 | 3,159 | 2,501 | |||||||||
| Branch closure expenses |
238 | 2,074 | 5,222 | |||||||||
| Other |
25,443 | 26,306 | 26,738 | |||||||||
|
|
|
|
|
|
|
|||||||
| Total other noninterest expense |
$ | 60,598 | $ | 65,856 | $ | 71,483 | ||||||
|
|
|
|
|
|
|
|||||||
Note 11—Income Taxes
The components of the consolidated income tax expense are as follows:
| (In thousands) | 2016 | 2015 | 2014 | |||||||||
| Current: |
||||||||||||
| Federal |
$ | 24,394 | $ | 22,024 | $ | 13,732 | ||||||
| State |
2,166 | 1,013 | 1,201 | |||||||||
|
|
|
|
|
|
|
|||||||
| Total current expense |
26,560 | 23,037 | 14,933 | |||||||||
|
|
|
|
|
|
|
|||||||
| Deferred: |
||||||||||||
| Federal |
5,439 | (3,266 | ) | 10,528 | ||||||||
| State |
541 | 338 | 599 | |||||||||
|
|
|
|
|
|
|
|||||||
| Total deferred expense (benefit) |
5,980 | (2,928 | ) | 11,127 | ||||||||
|
|
|
|
|
|
|
|||||||
| Total income tax expense |
$ | 32,540 | $ | 20,109 | $ | 26,060 | ||||||
|
|
|
|
|
|
|
|||||||
F-102
Table of Contents
A reconciliation of total income tax expense for 2016, 2015 and 2014 to amounts determined by applying the statutory Federal income tax rate of 35% to income before taxes is as follows:
| (In thousands) | 2016 | 2015 | 2014 | |||||||||
| Computed income tax expense at statutory rate |
$ | 34,410 | $ | 20,778 | $ | 24,813 | ||||||
| Tax exempt interest, net |
(2,744 | ) | (842 | ) | (137 | ) | ||||||
| BOLI income |
(1,023 | ) | (1,037 | ) | (1,160 | ) | ||||||
| State tax expense |
1,760 | 878 | 1,170 | |||||||||
| Tax credits |
(266 | ) | (243 | ) | (189 | ) | ||||||
| Management compensation |
210 | 353 | 362 | |||||||||
| Other, net |
193 | 222 | 1,201 | |||||||||
|
|
|
|
|
|
|
|||||||
| Income tax expense |
$ | 32,540 | $ | 20,109 | $ | 26,060 | ||||||
|
|
|
|
|
|
|
|||||||
The significant components of the Company’s deferred tax assets and liabilities as of December 31, 2016 and 2015 are as follows:
| As of December 31, | ||||||||
| (In thousands) | 2016 | 2015 | ||||||
| Deferred income tax assets: |
||||||||
| Allowance for credit losses |
$ | 30,710 | $ | 29,558 | ||||
| Nonaccrual interest |
7,410 | 4,710 | ||||||
| Deferred compensation |
3,681 | 3,463 | ||||||
| Accrued compensation |
7,962 | 6,626 | ||||||
| Net operating loss carryforwards |
16,154 | 20,380 | ||||||
| Alternative minimum tax credit carryover |
978 | 978 | ||||||
| Unrealized loss on securities, net |
13,829 | — | ||||||
| Unrealized loss on derivative instruments |
5,911 | — | ||||||
| Other |
9,320 | 11,159 | ||||||
| Excess of tax basis in assets acquired: |
||||||||
| Loans |
8,673 | 12,145 | ||||||
| Other real estate owned |
1,342 | 1,335 | ||||||
| Other |
4 | 37 | ||||||
|
|
|
|
|
|||||
| Total deferred income tax assets |
105,974 | 90,391 | ||||||
|
|
|
|
|
|||||
| Deferred income tax liabilities: |
||||||||
| Difference in book and tax basis of intangibles |
4,268 | 6,013 | ||||||
| Unrealized gain on securities, net |
— | 2,237 | ||||||
| Unrealized gain on derivative instruments |
— | 950 | ||||||
| Other |
4,564 | 4,005 | ||||||
| Excess of book basis in assets acquired and tax liabilities assumed over book carrying value: |
||||||||
| Intangibles |
7,798 | 4,433 | ||||||
| Other |
5,682 | 6,041 | ||||||
|
|
|
|
|
|||||
| Total deferred income tax liabilities |
22,312 | 23,679 | ||||||
|
|
|
|
|
|||||
| Net deferred income tax asset |
$ | 83,662 | $ | 66,712 | ||||
|
|
|
|
|
|||||
ASC Topic 740, “Income Taxes,” requires that deferred tax assets be reduced if it is more likely than not that some portion or all of the deferred tax asset will not be realized. Management’s determination of the realizability of deferred tax assets is based on its evaluation of all available evidence both positive and negative, and its expectation regarding various future events, including the reversal of deferred tax liabilities, projected future taxable income and tax planning strategies. Positive evidence supporting the realization of the Company’s deferred tax assets at December 31, 2016, includes generation of taxable income since 2012, the Company’s strong capital position, as well as sufficient amounts of projected future taxable income, of the appropriate
F-103
Table of Contents
character, to support the realization of the $83.7 million at December 31, 2016. In order to fully realize the deferred tax asset, the Company will need to generate future taxable income of $159.5 million before the end of the statutory net operating loss carryforward period. Based on the assessment of all positive and negative evidence at December 31, 2016 and 2015, management has concluded that it is more likely than not that the results of future operations will generate sufficient taxable income realize the deferred tax assets.
Management’s estimate of future taxable income is based on internal projections, various internal assumptions, as well as certain external data all of which management believes to be reasonable although inherently subject to significant judgment. Projected future taxable income is primarily expected to be generated through loan growth at the bank, investment strategies and revenue from successful cross initiatives and the control of expenses through operating effectiveness, all in the context of a macro-economic environment that continues to trend favorably. If actual results differ significantly from the current estimates of future taxable income, a valuation allowance may need to be recorded for some portion or all of the net deferred tax asset. Such an increase to the deferred tax asset valuation allowance could have a material adverse effect on the Company’s consolidated balance sheets and consolidated statements of income.
The acquisitions of CFC and Encore resulted in an ”ownership change” as defined for U.S. federal income tax purposes under Section 382 of the Internal Revenue Code. As a result of the operation of Section 382, the Company is not able to fully utilize a portion of our U.S. federal and state tax net operating losses and certain built-in losses that have not been recognized for tax purposes. An ownership change under Section 382 generally occurs when a change in the aggregate percentage ownership of the stock of the corporation held by five percent stockholders increases by more than fifty percentage points over a rolling three-year period. A corporation experiencing an ownership change generally is subject to an annual limitation on its utilization of pre-change losses and certain post-change recognized built-in losses equal to the value of the stock of the corporation immediately before the ownership change, multiplied by the long-term tax-exempt rate (subject to certain adjustments). The annual limitation is increased each year to the extent that there is an unused limitation in a prior year. Since U.S. federal net operating losses generally may be carried forward for up to 20 years, the annual limitation also effectively provides a cap on the cumulative amount of pre-change losses and certain post-change recognized built-in losses that may be utilized. Pre-change losses and certain post-change recognized built-in losses in excess of the cap are effectively unable to be used to reduce future taxable income. The Company has estimated the amount of pre-change losses and certain post-change losses that are not expected to be utilized and has reduced the deferred tax asset at the acquisition date to reflect this limitation.
The acquisition of Superior Bank was an asset acquisition and is not subject to the limitations of Section 382.
As of December 31, 2016, the Company has federal net operating loss carryforwards of $44.2 million which will begin to expire in 2031. The Company has state net operating loss carryforwards of $16.9 million which will begin to expire in 2022. In addition, the Company has an AMT credit carryforward of $978,000 as of December 31, 2016, which has no expiration.
The Company and its subsidiaries are subject to U.S. federal income tax as well as various state and local income taxes. The Company has concluded all U.S. federal income tax matters for years before 2013. With certain limited exceptions, the Company has concluded all state income tax matters for years before 2012.
The Company applies the guidance in ASC 740-10, “Accounting for Uncertainty in Income Taxes.” ASC 740-10 provides guidance for how uncertain tax positions should be recognized, measured, presented, and disclosed in the financial statements. ASC 740-10 requires the evaluation of tax positions taken or expected to be taken in the course of preparing the Company’s tax returns to determine whether the tax positions are “more likely than not” to be sustained by the applicable tax authority based on technical merits of the position. Tax benefits from tax positions not deemed to meet the “more likely than not” threshold should not be recognized in the year of determination.
F-104
Table of Contents
A reconciliation of the beginning and ending amount of unrecognized income tax benefits is as follows (unrecognized state income tax benefits are not adjusted for the federal income tax impact):
| Years Ended December 31, |
||||||||||||
| (In thousands) | 2016 | 2015 | 2014 | |||||||||
| Unrecognized income tax benefits, January 1 |
$ | — | $ | — | $ | — | ||||||
| Increases for tax positions related to: |
— | — | — | |||||||||
| Prior years |
422 | — | — | |||||||||
| Current year |
522 | — | — | |||||||||
| Decreases for tax positions related to: |
— | — | — | |||||||||
| Prior years |
— | — | — | |||||||||
| Current year |
— | — | — | |||||||||
| Settlement with taxing authorities |
— | — | — | |||||||||
| Expiration of applicable statutes of limitations |
— | — | — | |||||||||
|
|
|
|
|
|
|
|||||||
| Unrecognized income tax benefits, December 31 |
$ | 944 | $ | — | $ | — | ||||||
|
|
|
|
|
|
|
|||||||
As of December 31, 2016, the balance of unrecognized tax benefits, if recognized, that would reduce the effective tax rate is $614,000. It is reasonably possible that the above unrecognized tax benefits could be reduced by $123,000 within the next twelve months.
The Company classifies interest and penalties on uncertain tax positions as a component of noninterest expense. The Company’s accrued interest and penalties on unrecognized tax benefits was $90,000 as of December 31, 2016. Accrued interest and penalties are included in other liabilities.
Note 12—Earnings Per Common Share
The following table displays a reconciliation of the information used in calculating basic and diluted net income per common share for the years ended December 31, 2016, 2015 and 2014.
| Years Ended December 31, | ||||||||||||
| (In thousands, except per share data) | 2016 | 2015 | 2014 | |||||||||
| Net income |
$ | 65,774 | $ | 39,256 | $ | 44,833 | ||||||
| Dividends and accretion of discount on preferred stock |
— | — | 3,643 | |||||||||
|
|
|
|
|
|
|
|||||||
| Earnings available to common shareholder |
$ | 65,774 | $ | 39,256 | $ | 41,190 | ||||||
|
|
|
|
|
|
|
|||||||
| Weighted average common shares outstanding (Basic) |
75,000,000 | 75,000,000 | 75,000,000 | |||||||||
| Weighted average restricted stock units |
294,600 | 116,100 | — | |||||||||
|
|
|
|
|
|
|
|||||||
| Weighted average common shares outstanding (Diluted) |
75,294,600 | 75,116,100 | 75,000,000 | |||||||||
|
|
|
|
|
|
|
|||||||
| Earnings per common share (Basic) |
$ | 0.88 | $ | 0.52 | $ | 0.55 | ||||||
|
|
|
|
|
|
|
|||||||
| Earnings per common share (Diluted) |
$ | 0.87 | $ | 0.52 | $ | 0.55 | ||||||
|
|
|
|
|
|
|
|||||||
In March 2017, the Board of Directors approved a 75 for-one stock split of the Company’s common stock. The stock split occurred on April 7, 2017. The effect of the stock split on outstanding shares and earnings per share has been retroactively applied to all periods presented.
F-105
Table of Contents
Note 13—Employee Benefits
Defined Benefit Pension Plan
The Company accounts for its defined benefit pension plan in accordance with ASC Topic 715. This guidance requires companies to recognize the funded status of a defined benefit plan (measured as the difference between the fair value of plan assets and the projected benefit obligation) on the balance sheets and to recognize in other comprehensive income any gains or losses and prior service costs or benefits not included as components of periodic benefit cost. In accordance with purchase accounting rules, the plan’s prior unrecognized service cost and prior unrecognized loss were eliminated as of the acquisition date; thus, there are no prior service cost or loss amortization amounts reflected in the 2016, 2015 and 2014 consolidated statements of income. Participation in the defined benefit pension plan was frozen effective April 30, 2011.
The following table sets forth the defined benefit pension plan’s funded status as of December 31, 2016 and 2015 and amounts recognized in the Company’s consolidated financial statements for the years ended December 31, 2016, 2015 and 2014:
| (In thousands) | 2016 | 2015 | ||||||
| Change in benefit obligation: |
||||||||
| Benefit obligation at beginning of period |
$ | 6,176 | $ | 7,025 | ||||
| Service cost |
100 | 100 | ||||||
| Interest cost |
221 | 232 | ||||||
| Actuarial loss (gain) |
233 | (200 | ) | |||||
| Administrative expenses paid |
(59 | ) | (45 | ) | ||||
| Benefits paid |
(79 | ) | (70 | ) | ||||
| Settlements |
(807 | ) | (866 | ) | ||||
|
|
|
|
|
|||||
| Benefit obligation at end of year |
5,785 | 6,176 | ||||||
|
|
|
|
|
|||||
| Change in plan assets: |
||||||||
| Fair value of plan assets at beginning of period |
4,464 | 5,402 | ||||||
| Return on plan assets |
240 | 43 | ||||||
| Employer contributions |
930 | — | ||||||
| Administrative expenses paid |
(59 | ) | (45 | ) | ||||
| Benefits paid |
(79 | ) | (70 | ) | ||||
| Settlements |
(807 | ) | (866 | ) | ||||
|
|
|
|
|
|||||
| Fair value of plan assets at end of year |
4,689 | 4,464 | ||||||
|
|
|
|
|
|||||
| Funded status |
$ | (1,096 | ) | $ | (1,712 | ) | ||
|
|
|
|
|
|||||
F-106
Table of Contents
| (In thousands) | 2016 | 2015 | 2014 | |||||||||
| Components of net periodic benefit cost: |
||||||||||||
| Service cost |
$ | 100 | $ | 100 | $ | 100 | ||||||
| Interest cost |
221 | 232 | 268 | |||||||||
| Expected return on plan assets |
(234 | ) | (278 | ) | (305 | ) | ||||||
| Net loss amortization |
53 | 61 | — | |||||||||
| Cost of settlements |
156 | 155 | 142 | |||||||||
|
|
|
|
|
|
|
|||||||
| Net periodic benefit cost |
$ | 296 | $ | 270 | $ | 205 | ||||||
|
|
|
|
|
|
|
|||||||
| Amount recognized in accumulated other comprehensive income: |
||||||||||||
| Amortization of net actuarial loss |
$ | 53 | $ | 61 | $ | — | ||||||
| Net actuarial loss |
(226 | ) | (35 | ) | (810 | ) | ||||||
| Adjustment for settlement |
(156 | ) | (155 | ) | (142 | ) | ||||||
|
|
|
|
|
|
|
|||||||
| (17 | ) | 181 | (668 | ) | ||||||||
| Tax effect |
4 | (69 | ) | 245 | ||||||||
|
|
|
|
|
|
|
|||||||
| Net |
$ | (13 | ) | $ | 112 | $ | (423 | ) | ||||
|
|
|
|
|
|
|
|||||||
Weighted average assumptions used to determine benefit obligations and net periodic pension cost at December 31:
| 2016 | 2015 | 2014 | ||||||||||
| Discount rate |
3.52 | % | 3.76 | % | 3.50 | % | ||||||
| Compensation increase rate |
N/A | N/A | N/A | |||||||||
| Census date |
1/1/2017 | 1/1/2016 | 1/1/2015 | |||||||||
| Expected return on plan assets |
5.50 | % | 5.50 | % | 5.50 | % | ||||||
Of the above amount recognized in accumulated other comprehensive income, $64 thousand is expected to be recognized as a component of net periodic benefit cost in 2017.
Retiree benefit payments, which reflect expected future service, are anticipated to be paid as follows:
| Year |
Amount (In thousands) |
|||
| 2017 |
$ | 820 | ||
| 2018 |
490 | |||
| 2019 |
456 | |||
| 2020 |
594 | |||
| 2021 |
907 | |||
| 2022-2026 |
1,826 | |||
|
|
|
|||
| Total |
$ | 5,093 | ||
|
|
|
|||
In determining the expected return on plan assets, the Company considers the relative weighting of plan assets, the historical performance of total plan assets, individual asset classes, and economic and other indicators of future performance. In addition, the Company may consult with and consider the opinions of financial and other professionals in developing appropriate return benchmarks.
F-107
Table of Contents
The Company’s defined benefit pension plan fair values and weighted-average asset allocations at December 31, 2016 and 2015, by asset category, were as follows:
| 2016 | 2015 | |||||||||||||||
| (In thousands) | Fair Value of Plan Assets |
Asset Allocations |
Fair Value of Plan Assets |
Asset Allocations |
||||||||||||
| Asset Category: |
||||||||||||||||
| Equity securities |
$ | 1,912 | 41 | % | $ | 1,849 | 41 | % | ||||||||
| Fixed income securities |
2,594 | 55 | % | 2,165 | 49 | % | ||||||||||
| Other securities |
183 | 4 | % | 440 | 10 | % | ||||||||||
| Cash and cash equivalents |
— | — | 10 | — | ||||||||||||
|
|
|
|
|
|
|
|
|
|||||||||
| Total |
$ | 4,689 | 100 | % | $ | 4,464 | 100 | % | ||||||||
|
|
|
|
|
|
|
|
|
|||||||||
The primary investment objective of the Company’s defined benefit pension plan is to maximize total return while accepting and managing a moderate to average degree of risk. The assets are invested based upon a moderate growth asset allocation model, which seeks to provide long-term growth of capital with a moderate level of current income and a somewhat higher level of principal volatility. For 2016, the assets were allocated in a target mix of 55% fixed income, 41% equity, and 4% other. The fixed income class is divided between a short-term government bond fund, a core fixed income bond fund and a high-yield bond fund. The equity class is diversified among large, mid and small cap growth and value stock funds with an emphasis being placed on large cap. There is also an exposure in the international equity market. This diversification among all of the equity sectors is an effort to reduce risk and attempt to generate higher returns. As a result of market conditions, the target percentages may not be achieved at any one point in time.
The investments are managed by the Trust Division of the Company within the established guidelines. It is the intent of management to give the investment managers flexibility within the overall parameters designated in the investment model selected by the Bank’s Trust Company Investment Committee for the plan.
The fair values of all plan assets as of December 31, 2016 and 2015, were measured using quoted prices in active markets for identical assets and liabilities (Level 1 inputs, as defined by ASC Topic 820, “Fair Value Measurements and Disclosures”).
The Company does not have a minimum cash contribution for 2017. In 2016, the Company contributed $930 thousand, which was more than the minimum required contribution of $300 thousand related to 2015.
Other Plans
Contributions to the 401(k) plan totaled $3.4 million and $3.5 million in 2016 and 2015, respectively.
The accrued liability for the supplemental retirement plan that originated from an acquired bank, accounted for under ASC Topic 715, approximates the projected benefit obligation. The accrued liability for this plan was $1.9 million at December 31, 2016 and 2015 and the amount recognized in compensation expense for the years ended December 31, 2016, 2015 and 2014 was $322 thousand, $104 thousand and $284 thousand, respectively.
The accrued liabilities for the unqualified supplemental retirement and voluntary deferred compensation plans were $3.2 million and $3.0 million, respectively. The amounts recognized in compensation expense for the years ended December 31, 2016, 2015, and 2014 were $186 thousand, $102 thousand and $351 thousand, respectively. Compensation expense for the voluntary deferred compensation plan is impacted by the changes in market values of plan assets.
F-108
Table of Contents
Projected benefit payments under these plans are anticipated to be paid as follows:
| Year |
Amount (In thousands) |
|||
| 2017 |
$ | 164 | ||
| 2018 |
172 | |||
| 2019 |
376 | |||
| 2020 |
376 | |||
| 2021 |
384 | |||
| 2022-2026 |
2,290 | |||
|
|
|
|||
| Total |
$ | 3,762 | ||
|
|
|
|||
Note 14—Related Party Transactions
In the normal course of business, loans are made to directors and executive officers and to companies in which they have a significant ownership interest. In the opinion of management, these loans are made on substantially the same terms, including interest rates and collateral, as those prevailing at the time for comparable transactions with other parties, are consistent with sound banking practices, and are within applicable regulatory and lending limitations. The aggregate balances of related party loans and deposits as of December 31, 2016 and 2015 were insignificant.
Note 15—Regulatory Matters
The Bank is subject to the capital adequacy requirements of the OCC. The Company, as a bank holding company, is subject to the capital adequacy requirements of the Federal Reserve. Failure to meet minimum capital requirements can initiate certain mandatory and possibly additional discretionary actions by regulators that, if undertaken, could have a direct material effect on the Company’s consolidated financial statements. Under capital adequacy guidelines and the regulatory framework for prompt corrective action, the Company and the Bank must meet specific capital guidelines that involve quantitative measures of assets, liabilities and certain off-balance sheet items as calculated under regulatory accounting practices. Capital amounts and classifications are also subject to qualitative judgment by regulators about components, risk weightings, and other related factors.
The risk-based capital requirements of the Federal Reserve and the OCC define capital and establish minimum capital requirements in relation to assets and off-balance sheet exposure, adjusted for credit risk. The risk-based capital standards currently in effect are designed to make regulatory capital requirements sensitive to differences in risk profiles among bank holding companies and banks, to account for off-balance sheet exposure and to minimize disincentives for holding liquid assets. Assets and off-balance sheet items are assigned to broad risk categories, each with appropriate relative risk weights. The resulting capital ratios represent capital as a percentage of total risk-weighted assets and off-balance sheet items.
F-109
Table of Contents
The Federal Reserve, the FDIC and the OCC have issued guidelines governing the levels of capital that banks must maintain. The bank guidelines for the period as of December 31, 2016 specify capital tiers, which include the following classifications:
| Capital Tiers |
Tier 1 Capital to Average Assets (Leverage) |
Common Equity Tier 1 to Risk—Weighted Assets (CET1) |
Tier 1 Capital to Risk—Weighted Assets |
Total Capital to Risk—Weighted Assets | ||||
| Well capitalized |
5% or above | 6.5% or above | 8% or above | 10% or above | ||||
| Adequately capitalized |
4% or above | 4.5% or above | 6% or above | 8% or above | ||||
| Undercapitalized |
Less than 4% | Less than 4.5% | Less than 6% | Less than 8% | ||||
| Significantly undercapitalized |
Less than 3% | Less than 3% | Less than 4% | Less than 6% | ||||
| Critically undercapitalized |
Tangible Equity / Total Assets less than 2% | |||||||
The most recent notification from the OCC categorized the Bank as well-capitalized under the regulatory framework for prompt corrective action (the prompt corrective action requirements are not applicable to the Company). The actual capital amounts and ratios for the Company and the bank as of December 31, 2016 and 2015 are presented in the following table and as shown, are above the thresholds necessary to be considered “well-capitalized”. Management believes there are no conditions or events that would change that classification.
| Consolidated Company | Bank | |||||||||||||||
| (Dollars in thousands) | Amount | Amount | Amount | Ratio | ||||||||||||
| December 31, 2016 |
||||||||||||||||
| Tier 1 leverage |
$ | 824,676 | 8.9 | % | $ | 1,035,972 | 11.2 | % | ||||||||
| Common equity tier 1 (CET1) |
793,268 | 8.8 | % | 989,990 | 11.0 | % | ||||||||||
| Tier 1 risk-based capital |
824,676 | 9.2 | % | 1,035,972 | 11.5 | % | ||||||||||
| Total risk-based capital |
1,007,011 | 11.2 | % | 1,144,519 | 12.8 | % | ||||||||||
| The minimum amounts of capital and ratios established by banking regulators are as follows: |
||||||||||||||||
| Tier 1 leverage |
$ | 371,052 | 4.0 | % | $ | 370,836 | 4.0 | % | ||||||||
| Common equity tier 1 (CET1) |
403,718 | 4.5 | % | 403,578 | 4.5 | % | ||||||||||
| Tier 1 risk-based capital |
538,290 | 6.0 | % | 538,105 | 6.0 | % | ||||||||||
| Total risk-based capital |
717,720 | 8.0 | % | 717,473 | 8.0 | % | ||||||||||
| Well capitalized requirement: |
||||||||||||||||
| Tier 1 leverage |
N/A | N/A | $ | 463,546 | 5.0 | % | ||||||||||
| Common equity tier 1 (CET1) |
N/A | N/A | 583,248 | 6.5 | % | |||||||||||
| Tier 1 risk-based capital |
N/A | N/A | 717,844 | 8.0 | % | |||||||||||
| Total risk-based capital |
N/A | N/A | 897,305 | 10.0 | % | |||||||||||
F-110
Table of Contents
| Consolidated Company | Bank | |||||||||||||||
| (Dollars in thousands) | Amount | Amount | Amount | Ratio | ||||||||||||
| December 31, 2015 |
||||||||||||||||
| Tier 1 leverage |
$ | 749,224 | 9.2 | % | $ | 963,296 | 11.9 | % | ||||||||
| Common equity tier 1 (CET1) |
723,753 | 8.7 | % | 922,610 | 11.1 | % | ||||||||||
| Tier 1 risk-based capital |
749,224 | 9.0 | % | 963,296 | 11.6 | % | ||||||||||
| Total risk-based capital |
927,988 | 11.1 | % | 1,068,487 | 12.9 | % | ||||||||||
| The minimum amounts of capital and ratios established by banking regulators are as follows: |
||||||||||||||||
| Tier 1 leverage |
$ | 325,656 | 4.0 | % | $ | 324,857 | 4.0 | % | ||||||||
| Common equity tier 1 (CET1) |
375,218 | 4.5 | % | 374,271 | 4.5 | % | ||||||||||
| Tier 1 risk-based capital |
500,291 | 6.0 | % | 499,028 | 6.0 | % | ||||||||||
| Total risk-based capital |
667,054 | 8.0 | % | 665,371 | 8.0 | % | ||||||||||
| Well capitalized requirement: |
||||||||||||||||
| Tier 1 leverage |
N/A | N/A | $ | 406,071 | 5.0 | % | ||||||||||
| Common equity tier 1 (CET1) |
N/A | N/A | 540,614 | 6.5 | % | |||||||||||
| Tier 1 risk-based capital |
N/A | N/A | 665,371 | 8.0 | % | |||||||||||
| Total risk-based capital |
N/A | N/A | 831,714 | 10.0 | % | |||||||||||
Under regulations controlling national banks, the payment of any dividends by a bank without prior approval of the OCC is limited to the current year’s net profits (as defined by the OCC) and retained net profits of the two preceding years. The Federal Reserve, as primary regulator for bank holding companies, has also stated that all common stock dividends should be paid out of current income. As the Company does not generate income on a stand-alone basis, it does not have the capability to pay common stock dividends without receiving dividends from the Bank.
The Bank is required to maintain average reserve balances in the form of cash or deposits with the Federal Reserve Bank. The reserve balance varies depending upon the types and amounts of deposits. At December 31, 2016 and 2015, the required reserve balance with the Federal Reserve Bank was approximately $38.3 million and $29.0 million, respectively.
Note 16—Commitments and Contingent Liabilities
The consolidated financial statements do not reflect various commitments and contingent liabilities which arise in the normal course of banking business and which involve elements of credit risk, interest rate risk, and liquidity risk. The commitments and contingent liabilities are commitments to extend credit, home equity lines, overdraft protection lines, and standby letters of credit. Such financial instruments are recorded when they are funded. A summary of commitments and contingent liabilities at December 31, 2016 and 2015 is as follows:
| December 31, | ||||||||
| (In thousands) | 2016 | 2015 | ||||||
| Commitments to extend credit |
$ | 2,643,501 | $ | 2,650,356 | ||||
| Standby letters of credit |
120,532 | 96,932 | ||||||
| Performance letters of credit |
29,270 | 40,505 | ||||||
Commitments to extend credit and letters of credit include some exposure to credit loss in the event of nonperformance of the customer. Commitments to extend credit are agreements to lend to a customer as long as there is no violation of any condition established in the contract. Standby letters of credit are conditional commitments issued to guarantee the performance of a customer to a third party. The credit policies and procedures for such commitments are the same as those used for lending activities. Because these instruments have fixed maturity dates and because a number expire without being drawn upon, they generally do not present any significant liquidity risk. No significant losses on commitments were incurred during the years ended December 31, 2016 or 2015. The Company does not anticipate any significant future losses as a result of these transactions.
F-111
Table of Contents
The Company makes investments in limited partnerships, including certain low income housing partnerships for which tax credits are received. As of December 31, 2016 and 2015, unfunded capital commitments totaled $15.1 million and $14.0 million, respectively.
The Company and the Bank are defendants in various pending and threatened legal actions arising in the normal course of business. In the opinion of management, based upon the advice of legal counsel, the ultimate disposition of all pending and threatened legal action will not have a material effect on the Company’s consolidated financial statements.
Note 17—Concentrations of Credit
Most of the loans, commitments and letters of credit have been granted to customers in the Company’s market areas. Investments in state and municipal securities also involve governmental entities within the Company’s market areas. General concentrations of credit by type of loan are set forth in Note 3 of these consolidated financial statements. The distribution of commitments to extend credit approximates the distribution of loans outstanding. Letters of credit were granted primarily to commercial borrowers.
Note 18—Supplemental Cash Flow Information
| For the Years Ended December 31, |
||||||||||||
| (In thousands) | 2016 | 2015 | 2014 | |||||||||
| Cash paid during the year for: |
||||||||||||
| Interest |
$ | 55,086 | $ | 44,333 | $ | 31,732 | ||||||
| Income taxes, net of refunds |
23,025 | 22,139 | 7,097 | |||||||||
| Non-cash investing activities: |
||||||||||||
| Transfers of loans to other real estate |
$ | 13,494 | $ | 11,800 | $ | 39,732 | ||||||
| Transfers of commercial loans to loans held for sale |
318,868 | 19,400 | — | |||||||||
| Transfers of property to other real estate |
— | 1,591 | 7,563 | |||||||||
| Transfers of loans to other assets (net profits interests) |
19,104 | — | — | |||||||||
Note 19—Disclosure About Fair Values of Financial Instruments
The Company groups its assets and liabilities measured at fair value in three levels, based on the markets in which the assets and liabilities are traded and the reliability of the assumptions used to determine fair value. This hierarchy requires the Company to maximize the use of observable market data, when available, and to minimize the use of unobservable inputs when determining fair value. Each fair value measurement is placed into the proper level based on the lowest level of significant input. These levels are:
| • | Level 1—Valuation is based upon quoted prices for identical instruments traded in active markets. |
| • | Level 2—Valuation is based upon quoted prices for similar instruments in active markets, quoted prices for identical or similar instruments in markets that are not active, and model-based valuation techniques for which all significant assumptions are observable in the market. |
| • | Level 3—Valuation is generated from model-based techniques that use significant assumptions not observable in the market. These unobservable assumptions reflect management’s estimates of assumptions that market participants would use in pricing the asset or liability. Valuation techniques include use of option pricing models, discounted cash flow models, and similar techniques. |
F-112
Table of Contents
Transfers between fair value levels are recognized at the end of the fiscal quarter in which the associated change in inputs occurs.
Assets and Liabilities Recorded at Fair Value on a Recurring Basis
The table below presents the Company’s assets and liabilities measured at fair value on a recurring basis categorized by the level of inputs used in the valuation of each asset at December 31, 2016 and 2015:
| (In thousands) | Carrying Value |
(Level 1) | (Level 2) | (Level 3) | ||||||||||||
| December 31, 2016 |
||||||||||||||||
| Investment securities available-for-sale: |
||||||||||||||||
| U.S. Treasury securities |
$ | 96,785 | $ | — | $ | 96,785 | $ | — | ||||||||
| Obligations of U.S. government agencies |
97,528 | — | 97,528 | — | ||||||||||||
| Mortgage-backed securities issued or guaranteed by U.S. agencies (MBS) Residential pass-through: |
||||||||||||||||
| Guaranteed by GNMA |
153,153 | — | 153,153 | — | ||||||||||||
| Issued by FNMA and FHLMC |
265,328 | — | 265,328 | — | ||||||||||||
| Other residential mortgage-backed securities |
47,561 | — | 47,561 | — | ||||||||||||
| Commercial mortgage-backed securities |
62,613 | — | 62,613 | — | ||||||||||||
|
|
|
|
|
|
|
|
|
|||||||||
| Total MBS |
528,655 | — | 528,655 | — | ||||||||||||
| Obligations of states and municipal subdivisions |
410,812 | — | 410,812 | — | ||||||||||||
| Other securities |
5,567 | 5,567 | — | — | ||||||||||||
|
|
|
|
|
|
|
|
|
|||||||||
| Total investment securities available-for-sale |
1,139,347 | 5,567 | 1,133,780 | — | ||||||||||||
| Derivative assets |
4,361 | — | 4,361 | — | ||||||||||||
| Other assets—net profits interests |
19,425 | — | — | 19,425 | ||||||||||||
|
|
|
|
|
|
|
|
|
|||||||||
| Total recurring basis measured assets |
$ | 1,163,133 | $ | 5,567 | $ | 1,138,141 | $ | 19,425 | ||||||||
|
|
|
|
|
|
|
|
|
|||||||||
| Derivative liabilities |
$ | 20,360 | $ | — | $ | 20,360 | $ | — | ||||||||
|
|
|
|
|
|
|
|
|
|||||||||
| Total recurring basis measured liabilities |
$ | 20,360 | $ | — | $ | 20,360 | $ | — | ||||||||
|
|
|
|
|
|
|
|
|
|||||||||
F-113
Table of Contents
| (In thousands) | Carrying Value |
(Level 1) | (Level 2) | (Level 3) | ||||||||||||
| December 31, 2015 |
||||||||||||||||
| Investment securities available-for-sale: |
||||||||||||||||
| Obligations of U.S. government agencies |
$ | 90,793 | $ | — | $ | 90,793 | $ | — | ||||||||
| Mortgage-backed securities issued or guaranteed by U.S. agencies (MBS) Residential pass-through: |
||||||||||||||||
| Guaranteed by GNMA |
280,190 | — | 280,190 | — | ||||||||||||
| Issued by FNMA and FHLMC |
121,707 | — | 121,707 | — | ||||||||||||
| Other residential mortgage-backed securities |
75,577 | — | 75,577 | — | ||||||||||||
| Commercial mortgage-backed securities |
24,809 | — | 24,809 | — | ||||||||||||
|
|
|
|
|
|
|
|
|
|||||||||
| Total MBS |
502,283 | — | 502,283 | — | ||||||||||||
| Obligations of states and municipal subdivisions |
122,320 | — | 122,320 | |||||||||||||
| Other securities |
5,414 | 5,414 | — | — | ||||||||||||
|
|
|
|
|
|
|
|
|
|||||||||
| Total investment securities available-for-sale |
720,810 | 5,414 | 715,396 | — | ||||||||||||
| Derivative assets |
7,738 | — | 7,738 | — | ||||||||||||
|
|
|
|
|
|
|
|
|
|||||||||
| Total recurring basis measured assets |
$ | 728,548 | $ | 5,414 | $ | 723,134 | $ | — | ||||||||
|
|
|
|
|
|
|
|
|
|||||||||
| Derivative liabilities |
$ | 4,978 | $ | — | $ | 4,978 | $ | — | ||||||||
|
|
|
|
|
|
|
|
|
|||||||||
| Total recurring basis measured liabilities |
$ | 4,978 | $ | — | $ | 4,978 | $ | — | ||||||||
|
|
|
|
|
|
|
|
|
|||||||||
During 2016 and 2015, there were no transfers between the Level 1 and Level 2 fair value categories.
Assets Recorded at Fair Value on a Nonrecurring Basis
From time to time, the Company may be required to measure certain other financial assets at fair value on a nonrecurring basis in accordance with GAAP. These adjustments to fair value usually result from the application of lower of cost or fair value accounting or write-downs of individual assets. For assets measured at fair value on a nonrecurring basis which were still held on the balance sheets at December 31, 2016 and 2015, the following tables provide the level of valuation assumptions used to determine each adjustment and the related carrying value:
| (In thousands) | Carrying Value |
(Level 1) | (Level 2) | (Level 3) | ||||||||||||
| December 31, 2016 |
||||||||||||||||
| Loans held for sale |
$ | 17,822 | $ | — | $ | 17,822 | $ | — | ||||||||
| Impaired loans, net of specific allowance |
151,720 | — | — | 151,720 | ||||||||||||
| Other real estate |
18,875 | — | — | 18,875 | ||||||||||||
|
|
|
|
|
|
|
|
|
|||||||||
| Total assets measured on a non-recurring basis |
$ | 188,417 | $ | — | $ | 17,822 | $ | 170,595 | ||||||||
|
|
|
|
|
|
|
|
|
|||||||||
| (In thousands) | Carrying Value |
(Level 1) | (Level 2) | (Level 3) | ||||||||||||
| December 31, 2015 |
||||||||||||||||
| Loans held for sale |
$ | 25,413 | $ | — | $ | 25,413 | $ | — | ||||||||
| Impaired loans, net of specific allowance |
72,020 | — | — | 72,020 | ||||||||||||
| Other real estate |
35,984 | — | — | 35,984 | ||||||||||||
|
|
|
|
|
|
|
|
|
|||||||||
| Total assets measured on a non-recurring basis |
$ | 133,417 | $ | — | $ | 25,413 | $ | 108,004 | ||||||||
|
|
|
|
|
|
|
|
|
|||||||||
F-114
Table of Contents
Significant unobservable inputs used in Level 3 fair value measurements for financial assets measured at fair value on a nonrecurring basis at December 31, 2016 and 2015 are summarized below:
| Quantitative Information about Level 3 Fair Value Measurements | ||||||||||||
| (In thousands) | Carrying Value |
Valuation Methods |
Unobservable Inputs |
Range | ||||||||
| December 31, 2016 |
||||||||||||
| Impaired loans, net of specific allowance |
$ | 151,720 | Internal appraisals of accounts receivable and inventory | Discount of book value | 50%-75% | |||||||
| Third-Party Appraisals | Discount of fair value | 0%-20% | ||||||||||
| Estimated closing costs | 10% | |||||||||||
| Other real estate |
18,875 | Third-Party Appraisals | Discount of fair value | 0%-20% | ||||||||
| Estimated closing costs | 10% | |||||||||||
| Quantitative Information about Level 3 Fair Value Measurements | ||||||||||||
| (In thousands) | Carrying Value |
Valuation Methods |
Unobservable Inputs |
Range | ||||||||
| December 31, 2015 |
||||||||||||
| Impaired loans, net of specific allowance |
$ | 72,020 | Internal appraisals of accounts receivable and inventory | Discount of book value | 50%-75% | |||||||
| Third-Party Appraisals | Discount of fair value | 0%-20% | ||||||||||
| Estimated closing costs | 10% | |||||||||||
| Other real estate |
35,984 | Third-Party Appraisals | Discount of fair value | 0%-20% | ||||||||
| Estimated closing costs | 10% | |||||||||||
Determination of Fair Values
In accordance with ASC 820-10-35, fair values are based on the price that would be received to sell an asset or paid to transfer a liability in an orderly transaction between market participants at the measurement date. The following describes the assumptions and methodologies used to estimate the fair value of financial instruments recorded at fair value in the consolidated balance sheets and for estimating the fair value of financial instruments for which fair value is disclosed under ASC 825-10-50.
Investment Securities. When quoted prices are available in an active market, securities are classified as Level 1. For securities reported at fair value utilizing Level 2 inputs, the Company obtains fair value measurements from an independent pricing service. These fair value measurements consider observable market data that may include benchmark yield curves, reported trades, broker/dealer quotes, issuer spreads and credit information, among other inputs.
Loans Held for Sale. Loans held for sale are recorded at the lower of aggregate cost or fair value. Fair value is generally based on quoted market prices of similar loans and is considered to be Level 2.
Net Loans. Fair values of loans are estimated using discounted cash flow analyses using various discount spreads to Treasury yields that approximate interest rates currently being offered for loans with similar terms to borrowers of similar credit quality.
Derivative Financial Instruments. Derivative financial instruments are measured at fair value based on modeling that utilizes observable market inputs for various interest rates published by leading third-party financial news and data providers. This is observable data that represents the rates used by market participants for instruments entered into at that date; however, they are not based on actual transactions so they are classified as Level 2.
F-115
Table of Contents
Other Assets—Net profits interests. The fair value of the net profit interest in oil and gas reserves was estimated using discounted cash flow analyses applied to the expected cash flows from producing developed wells. Expected cash flows are derived from reports prepared by consulting engineers under established professional standards for the industry.
Deposits. The fair values disclosed for demand deposits are, by definition, equal to the amount payable on demand at the reporting date (that is, their carrying amounts). Fair values for CDs are estimated using a discounted cash flow calculation that applies interest rate spreads to current Treasury yields.
FHLB Advances. The fair value of the FHLB advance approximates its book value considering their short-term maturities.
Security Sold Under Agreements to Repurchase. The carrying amount of security repurchase agreements approximates their fair values.
Senior Debt. The fair value of senior debt was estimated by obtaining broker indications that compared the Company’s senior debt to other comparable financial institutions.
Subordinated Debt. The fair value of subordinated debentures was estimated by obtaining broker indications that compared the Company’s subordinated debentures to other comparable financial institutions.
Junior Subordinated Debentures. The fair value of junior subordinated debentures was estimated by obtaining broker indications that compared the Company’s junior subordinated debentures to other comparable financial institutions.
Limitations . The following fair value estimates are determined as of a specific point in time utilizing various assumptions and estimates. The use of assumptions and various valuation techniques, as well as the absence of secondary markets for certain financial instruments, will likely reduce the comparability of fair value disclosures between financial institutions. The fair values for loans involve the use of significant internally-developed pricing assumptions due to market-illiquidity for loans net of unearned income and loans held for sale as of December 31, 2016 and 2015. These assumptions are considered to reflect inputs that market participants would use in transactions involving these instruments as of the measurement date. This table only includes financial instruments of the Company, and, accordingly, the total of the fair value amounts does not represent, and should not be construed to represent, the underlying value of the Company.
F-116
Table of Contents
The estimated fair values of the Company’s financial instruments are as follows:
| December 31, 2016 | ||||||||||||||||||||
| (In thousands) | Carrying Amount |
Fair Value | Level 1 | Level 2 | Level 3 | |||||||||||||||
| Financial Assets: |
||||||||||||||||||||
| Cash and due from banks |
$ | 48,017 | $ | 48,017 | $ | 48,017 | $ | — | $ | — | ||||||||||
| Interest-bearing deposits in other banks |
199,747 | 199,747 | 199,747 | — | — | |||||||||||||||
| Federal funds sold |
1,161 | 1,161 | 1,161 | — | — | |||||||||||||||
| Securities available-for-sale |
1,139,347 | 1,139,347 | 5,567 | 1,133,780 | — | |||||||||||||||
| Securities held-to-maturity |
425 | 463 | — | 463 | — | |||||||||||||||
| Loans held for sale |
17,822 | 17,822 | — | 17,822 | — | |||||||||||||||
| Net loans |
7,350,443 | 7,395,003 | — | — | 7,395,003 | |||||||||||||||
| Derivative assets |
3,539 | 3,539 | — | 3,539 | — | |||||||||||||||
| Other assets |
19,425 | 19,818 | — | — | 19,818 | |||||||||||||||
| Financial Liabilities: |
||||||||||||||||||||
| Deposits |
8,016,749 | 7,904,926 | — | 7,904,926 | — | |||||||||||||||
| Securities sold under agreements to repurchase |
3,494 | 3,494 | — | 3,494 | — | |||||||||||||||
| Senior debt |
193,788 | 191,076 | — | 191,076 | — | |||||||||||||||
| Subordinated debt |
98,441 | 97,938 | — | 97,938 | — | |||||||||||||||
| Junior subordinated debentures |
35,989 | 47,409 | — | 47,409 | — | |||||||||||||||
| Derivative liabilities |
20,360 | 20,360 | — | 20,360 | — | |||||||||||||||
| December 31, 2015 | ||||||||||||||||||||
| (In thousands) | Carrying Amount |
Fair Value | Level 1 | Level 2 | Level 3 | |||||||||||||||
| Financial Assets: |
||||||||||||||||||||
| Cash and due from banks |
$ | 139,239 | $ | 139,239 | $ | 139,239 | $ | — | $ | — | ||||||||||
| Interest-bearing deposits in other banks |
316,473 | 316,473 | 316,473 | — | — | |||||||||||||||
| Federal funds sold |
11,495 | 11,495 | 11,495 | — | — | |||||||||||||||
| Securities available-for-sale |
720,810 | 720,810 | 5,414 | 715,396 | — | |||||||||||||||
| Securities held-to-maturity |
550 | 594 | — | 594 | — | |||||||||||||||
| Loans held for sale |
25,413 | 25,413 | — | 25,413 | — | |||||||||||||||
| Net loans |
6,836,737 | 6,920,225 | — | — | 6,920,225 | |||||||||||||||
| Derivative assets |
7,738 | 7,738 | — | 7,738 | — | |||||||||||||||
| Financial Liabilities: |
||||||||||||||||||||
| Deposits |
6,987,351 | 6,984,506 | — | 6,984,506 | — | |||||||||||||||
| Advances from FHLB |
370,000 | 370,000 | — | 370,000 | — | |||||||||||||||
| Securities sold under agreements to repurchase |
5,840 | 5,840 | — | 5,840 | — | |||||||||||||||
| Senior debt |
193,085 | 186,387 | — | 186,387 | — | |||||||||||||||
| Subordinated debt |
98,171 | 94,970 | — | 94,970 | — | |||||||||||||||
| Junior subordinated debentures |
35,449 | 45,872 | — | 45,872 | — | |||||||||||||||
| Derivative liabilities |
4,978 | 4,978 | — | 4,978 | — | |||||||||||||||
Note 20—Variable Interest Entities and Other Investments
Under ASC 810-10-65, the Company is deemed to be the primary beneficiary and required to consolidate a variable interest entity (“VIE”) if it has a variable interest in the VIE that provides it with a controlling financial interest. For such purposes, the determination of whether a controlling financial interest exists is based on whether a single party has both the power to direct the activities of the VIE that most significantly impact the
F-117
Table of Contents
VIE’s economic performance and the obligation to absorb the losses of the VIE or the right to receive benefits from the VIE that could potentially be significant to the VIE. ASC 810-10-65, as amended, requires continual reconsideration of conclusions reached regarding which interest holder is a VIE’s primary beneficiary.
The Bank has invested in several affordable housing projects as a limited partner. The partnerships have qualified to receive annual affordable housing federal tax credits that are recognized as a reduction of current tax expense. The Company has determined that these structures meet the definition of VIE’s under Topic ASC 810 but that consolidation is not required, as the Bank is not the primary beneficiary. At December 31, 2016 and 2015, the Bank’s maximum exposure to loss associated with these limited partnerships was limited to the Bank’s investment. Cadence accounts for these investments and the related tax credits using either the effective yield method or the proportional method, depending upon the date of the investment. Under this method, the Bank recognizes the tax credits as they are allocated and amortizes the initial costs of the investments to provide a constant effective yield over the period that the tax credits are allocated. At December 31, 2016 and 2015, the Company had recorded investments in other assets on its consolidated balance sheets of approximately $4.2 million and $4.7 million, respectively related to these investments. Additionally, the Company invests in other certain limited partnerships accounted for under the cost method totaling $6.1 million and $5.0 million as of December 31, 2016 and 2015, respectively and the equity method totaling $3.9 million and $2.1 million as of December 31, 2016 and 2015, respectively.
During 2016, the Bank received net profits interests in oil and gas reserves, in connection with the reorganization under bankruptcy of two loan customers. The Company has determined that these contracts meet the definition of VIE’s under Topic ASC 810, but that consolidation is not required as the Bank is not the primary beneficiary. The net profits interests are financial instruments and recorded at estimated fair value, which was $19.4 million at December 31, 2016, representing the maximum exposure to loss as of that date.
The Company has established a rabbi trust related to the deferred compensation plan offered to certain of its employees. The Company contributes employee cash compensation deferrals to the trust. The assets of the trust are available to creditors of the Company only in the event the Company becomes insolvent. This trust is considered a VIE because either there is no equity at risk in the trust or because the Company provided the equity interest to its employees in exchange for services rendered. The Company is considered the primary beneficiary of the rabbi trust as it has the ability to select the underlying investments made by the trust, the activities that most significantly impact the economic performance of the rabbi trust. The Company includes the assets of the rabbi trust as a component of other assets and a corresponding liability for the associated benefit obligation in other liabilities in its consolidated balance sheets. At December 31, 2016 and December 31, 2015, the amount of rabbi trust assets and benefit obligation was $3.0 million and $2.9 million, respectively.
Note 21—Segment Reporting
The Company determines reportable segments based on the services offered, the significance of the services offered, the significance of those services to the Company’s financial condition and operating results and management’s regular review of the operating results of those services. The Company operates through three operating segments: Banking, Financial Services and Corporate.
The Banking Segment includes the Commercial Banking, Retail Banking and Private Banking lines of business. The Commercial Banking line of business includes a general business services component primarily focusing on commercial & industrial (C&I), community banking, business banking and commercial real estate lending to clients in the geographic footprint in Texas and the southeast United States. In addition, the Commercial Banking line of business includes within C&I a separate component that focuses on select industries (which is referred to as the “specialized industries”) in which the Company believes it has specialized experience and service capabilities, including energy, healthcare, franchise restaurant and technology. The Company serve clients in these specialized industries both within the geographic footprint and throughout the United States as a result of the national orientation of many of these businesses. The Retail Banking line of business offers a broad range of retail banking services including mortgage services through the branch network to serve the needs of
F-118
Table of Contents
consumer and small businesses in the geographic footprint. The Private Banking line of business offers banking services and loan products tailored to the needs of the high-net worth clients in the geographic footprint.
The Financial Services Segment includes the Trust, Retail Brokerage, Investment Services and Insurance businesses. These businesses offer products independently to their own customers as well as to Banking Segment clients. Investment Services operates through the “Linscomb & Williams” name and Insurance operates though the “Cadence Insurance” name. The products offered by the businesses in the Financial Services Segment primarily generate non-banking service fee income. The Corporate Segment reflects parent-only activities and intercompany eliminations.
Business segment results are determined based upon the management reporting system, which assigns balance sheet and income statement items to each of the business segments. The process is designed around the organizational and management structure and, accordingly, the results derived are not necessarily comparable with similar information published by other financial institutions or in accordance with generally accepted accounting principles.
The Company evaluates performance and allocates resources based on profit or loss from operations. There are no material inter-segment sales or transfers. The accounting policies used by each reportable segment are the same as those discussed in Note 1. All costs, except corporate administration and income taxes, have been allocated to the reportable segments. Therefore, combined amounts agree to the consolidated totals.
The following tables present the operating results of the segments as of and for the years ended December 31, 2016, 2015 and 2014:
| As of and for the year ended December 31, 2016 | ||||||||||||||||
| (In thousands) | Banking | Financial Services |
Corporate | Consolidated | ||||||||||||
| Net interest income |
$ | 297,701 | $ | (201 | ) | $ | (18,061 | ) | $ | 279,439 | ||||||
| Provision for credit losses |
49,348 | — | — | 49,348 | ||||||||||||
| Noninterest income |
45,499 | 42,727 | 177 | 88,403 | ||||||||||||
| Noninterest expense |
186,874 | 32,334 | 972 | 220,180 | ||||||||||||
| Income tax expense (benefit) |
37,442 | 3,567 | (8,469 | ) | 32,540 | |||||||||||
|
|
|
|
|
|
|
|
|
|||||||||
| Net income |
$ | 69,536 | $ | 6,625 | $ | (10,387 | ) | $ | 65,774 | |||||||
|
|
|
|
|
|
|
|
|
|||||||||
| Total assets |
$ | 9,459,250 | $ | 64,257 | $ | 7,381 | $ | 9,530,888 | ||||||||
|
|
|
|
|
|
|
|
|
|||||||||
| As of and for the year ended December 31, 2015 | ||||||||||||||||
| (In thousands) | Banking | Financial Services |
Corporate | Consolidated | ||||||||||||
| Net interest income |
$ | 265,451 | $ | (36 | ) | $ | (17,636 | ) | $ | 247,779 | ||||||
| Provision for credit losses |
35,984 | — | — | 35,984 | ||||||||||||
| Noninterest income |
38,696 | 40,964 | 242 | 79,902 | ||||||||||||
| Noninterest expense |
200,544 | 31,393 | 395 | 232,332 | ||||||||||||
| Income tax expense (benefit) |
23,673 | 3,337 | (6,901 | ) | 20,109 | |||||||||||
|
|
|
|
|
|
|
|
|
|||||||||
| Net income |
$ | 43,946 | $ | 6,198 | $ | (10,888 | ) | $ | 39,256 | |||||||
|
|
|
|
|
|
|
|
|
|||||||||
| Total assets |
$ | 8,744,287 | $ | 59,471 | $ | 7,753 | $ | 8,811,511 | ||||||||
|
|
|
|
|
|
|
|
|
|||||||||
F-119
Table of Contents
| As of and for the year ended December 31, 2014 | ||||||||||||||||
| (In thousands) | Banking | Financial Services |
Corporate | Consolidated | ||||||||||||
| Net interest income |
$ | 266,226 | $ | (37 | ) | $ | (11,101 | ) | $ | 255,088 | ||||||
| Provision for credit losses |
14,118 | — | — | 14,118 | ||||||||||||
| Noninterest income |
34,603 | 40,199 | 268 | 75,070 | ||||||||||||
| Noninterest expense |
213,173 | 32,008 | (34 | ) | 245,147 | |||||||||||
| Income tax expense (benefit) |
25,739 | 2,854 | (2,533 | ) | 26,060 | |||||||||||
|
|
|
|
|
|
|
|
|
|||||||||
| Net income |
$ | 47,799 | $ | 5,300 | $ | (8,266 | ) | $ | 44,833 | |||||||
|
|
|
|
|
|
|
|
|
|||||||||
Note 22—Equity-based Compensation
The Company administers a long-term incentive compensation plan that permits the granting of incentive awards in the form of stock options, restricted stock, restricted stock units, performance units, stock appreciation rights, or other stock-based awards. The terms of all awards issued under these plans are determined by the Compensation Committee of the Board of Directors
The 2015 Omnibus Incentive Plan (the ”Plan”), permits the Company to grant to employees and directors various forms of incentive compensation. The principal purposes of this plan are to focus directors, officers and other employees and consultants on business performance that creates shareholder value, to encourage innovative approaches to the business of the Company, and to encourage ownership of the Company’s stock. The Plan authorizes 7,500,000 common share equivalents available for grant, where grants of full value awards (e.g., shares of restricted stock, restricted stock units and performance stock units) count as one share equivalent. The number of remaining share equivalents available for future issuance under the Plan was 6,827,250 at December 31, 2016.
On July 21, 2015, the Company granted 258,375 restricted stock units to select executives. These grants contained performance conditions which, for accounting purposes, were deemed improbable of being achieved during the fourth quarter of 2016. On November 30, 2016, these grants were cancelled and replaced with 395,250 restricted stock units with a market condition. Also granted at the time of the modification were 277,500 restricted stock units to new grantees. The grantees do not have rights as stockholders, including the right to dividends, until the restricted stock units are vested. The fair value of these restricted stock units was estimated based upon the possible future value of the Company’s common stock using a Monte-Carlo simulation, which included the following assumptions as of the grant date:
| Fair value of common stock (non-marketable, per share) |
$ | 14.83 | ||
| Time to settlement date |
2.08 years | |||
| Volatility |
30.0 | % | ||
| Risk-free rate |
1.1 | % |
While the grant specifies a stated target number of units, the determination of the actual settlement in shares will be based on the achievement of a market condition related to the Company’s share value as of December 31, 2018. The actual units vested can be in the range of zero to 1.75 times the units granted based on a share value ranging from $21.76 to $27.55.
The Company reversed $631 thousand of equity-based compensation expense related to the amended restricted stock units and recorded $117 thousand equity-based compensation expense for the outstanding restricted stock units for the year ended December 31, 2016. The Company had equity-based compensation of $631 thousand related to the restricted stock units for the year ended December 31, 2015. The remaining expense related to unvested restricted stock units is $3.0 million as of December 31, 2016 and will be recognized over the next 26 months.
F-120
Table of Contents
The following table summarizes the activity related to restricted stock unit awards for the years ended December 31, 2016 and 2015:
| For the Year Ended December 31, | ||||||||||||||||
| 2016 | 2015 | |||||||||||||||
| Number of Shares |
Fair Value per Unit at Award Date |
Number of Shares |
Fair Value per Unit at Award Date |
|||||||||||||
| Non-vested at beginning of period |
258,375 | $ | 13.43 | — | $ | — | ||||||||||
| Units deemed improbable to vest |
(258,375 | ) | 13.43 | — | — | |||||||||||
| Amended grants |
395,250 | 5.14 | — | — | ||||||||||||
| New units |
277,500 | 5.14 | 258,375 | 13.43 | ||||||||||||
|
|
|
|
|
|
|
|
|
|||||||||
| Non-vested at end of period |
672,750 | $ | 5.14 | 258,375 | $ | 13.43 | ||||||||||
|
|
|
|
|
|
|
|
|
|||||||||
Note 23—Condensed Financial Information of Cadence Bancorporation (Parent Only)
Condensed Balance Sheets
December 31, 2016 and 2015
| (In thousands) | 2016 | 2015 | ||||||
| ASSETS |
||||||||
| Interest-bearing deposits with banks |
$ | 50,330 | $ | 47,756 | ||||
| Investment in consolidated bank subsidiary |
1,315,336 | 1,291,053 | ||||||
| Investment in consolidated nonbank subsidiaries |
14,881 | 14,225 | ||||||
| Other assets |
7,381 | 7,753 | ||||||
|
|
|
|
|
|||||
| Total Assets |
$ | 1,387,928 | $ | 1,360,787 | ||||
|
|
|
|
|
|||||
| LIABILITIES AND SHAREHOLDER’S EQUITY |
||||||||
| Liabilities: |
||||||||
| Interest payable |
$ | 810 | $ | 912 | ||||
| Senior debt |
193,788 | 193,085 | ||||||
| Subordinated debt |
73,788 | 73,573 | ||||||
| Junior subordinated debentures |
35,989 | 35,449 | ||||||
| Other liabilities |
3,055 | 3,560 | ||||||
|
|
|
|
|
|||||
| Total liabilities |
307,430 | 306,579 | ||||||
|
|
|
|
|
|||||
| Shareholder’s Equity: |
||||||||
| Common Stock |
10 | 10 | ||||||
| Additional Paid-in Capital |
880,405 | 880,318 | ||||||
| Retained earnings |
232,614 | 166,840 | ||||||
| Accumulated other comprehensive (loss) income (“OCI”) |
(32,531 | ) | 7,040 | |||||
|
|
|
|
|
|||||
| Total Shareholder’s Equity |
1,080,498 | 1,054,208 | ||||||
|
|
|
|
|
|||||
| Total Liabilities and Shareholder’s Equity |
$ | 1,387,928 | $ | 1,360,787 | ||||
|
|
|
|
|
|||||
F-121
Table of Contents
Condensed Statements of Income
For the Years Ended December 31, 2016, 2015 and 2014
| (In thousands) | 2016 | 2015 | 2014 | |||||||||
| INCOME |
||||||||||||
| Dividends from bank subsidiary |
$ | 13,500 | $ | 8,500 | $ | 817 | ||||||
| Dividends from nonbank subsidiary |
— | 500 | 1,000 | |||||||||
| Interest income |
25 | 21 | 15 | |||||||||
| Other income |
176 | 22 | 565 | |||||||||
|
|
|
|
|
|
|
|||||||
| Total income |
13,701 | 9,043 | 2,397 | |||||||||
|
|
|
|
|
|
|
|||||||
| EXPENSES |
||||||||||||
| Interest expense |
18,060 | 17,635 | 11,101 | |||||||||
| Other expenses |
2,092 | 271 | 296 | |||||||||
|
|
|
|
|
|
|
|||||||
| Total expenses |
20,152 | 17,906 | 11,397 | |||||||||
|
|
|
|
|
|
|
|||||||
| Loss before income taxes and equity in undistributed income of subsidiaries |
(6,451 | ) | (8,863 | ) | (9,000 | ) | ||||||
| Equity in undistributed income of subsidiaries |
64,424 | 41,132 | 49,277 | |||||||||
|
|
|
|
|
|
|
|||||||
| Net income before income taxes |
57,973 | 32,269 | 40,277 | |||||||||
| Income tax benefit |
(7,801 | ) | (6,987 | ) | (4,556 | ) | ||||||
|
|
|
|
|
|
|
|||||||
| Net income |
65,774 | 39,256 | 44,833 | |||||||||
|
|
|
|
|
|
|
|||||||
| Dividends and accretion of discount on preferred stock |
— | — | 3,643 | |||||||||
|
|
|
|
|
|
|
|||||||
| Net income available to common shareholders |
$ | 65,774 | $ | 39,256 | $ | 41,190 | ||||||
|
|
|
|
|
|
|
|||||||
F-122
Table of Contents
Condensed Statements of Cash Flows
| (In thousands) |
2016 | 2015 | 2014 | |||||||||
| CASH FLOWS FROM OPERATING ACTIVITIES |
||||||||||||
| Net income |
$ | 65,774 | $ | 39,256 | $ | 44,833 | ||||||
| Adjustments to reconcile net income to net cash provided (used) in operations: |
||||||||||||
| Deferred income taxes |
(1,598 | ) | (531 | ) | (415 | ) | ||||||
| Equity in undistributed income of subsidiaries |
(64,424 | ) | (41,132 | ) | (49,277 | ) | ||||||
| Decrease in interest receivable |
— | — | 6 | |||||||||
| Decrease (increase) in other assets |
3,043 | 2,539 | (3,891 | ) | ||||||||
| (Decrease) increase in interest payable |
(102 | ) | 804 | 98 | ||||||||
| (Decrease) increase in other liabilities |
(504 | ) | (747 | ) | 2,318 | |||||||
|
|
|
|
|
|
|
|||||||
| Net cash provided by (used in) operating activities |
2,189 | 189 | (6,328 | ) | ||||||||
| CASH FLOWS FROM INVESTING ACTIVITIES |
||||||||||||
| Capital contributions to Bank subsidiary |
— | (20,000 | ) | (155,000 | ) | |||||||
| Decrease (increase) in limited partnership investments |
463 | (157 | ) | (298 | ) | |||||||
|
|
|
|
|
|
|
|||||||
| Net cash provided by (used in) investing activities |
463 | (20,157 | ) | (155,298 | ) | |||||||
| CASH FLOWS FROM FINANCING ACTIVITIES |
||||||||||||
| Dividends paid to parent |
— | — | (4,000 | ) | ||||||||
| Dividends paid on preferred stock |
— | — | (1,370 | ) | ||||||||
| Advances of other borrowings, net of debt issuance costs |
— | — | 73,860 | |||||||||
| Repayments of other borrowings |
— | — | (75,000 | ) | ||||||||
| Issuance of subordinated debt, net of debt issuance costs |
— | 39,253 | 34,434 | |||||||||
| Issuance of senior debt, net of debt issuance costs |
— | 9,813 | 182,459 | |||||||||
| Purchase of senior debt |
(78 | ) | — | — | ||||||||
| Redemption of preferred stock |
— | — | (32,914 | ) | ||||||||
|
|
|
|
|
|
|
|||||||
| Net cash (used in) provided by financing activities |
(78 | ) | 49,066 | 177,469 | ||||||||
|
|
|
|
|
|
|
|||||||
| Net increase in cash and cash equivalents |
2,574 | 29,098 | 15,843 | |||||||||
| Cash and cash equivalents at beginning of year |
47,756 | 18,658 | 2,815 | |||||||||
|
|
|
|
|
|
|
|||||||
| Cash and cash equivalents at end of year |
$ | 50,330 | $ | 47,756 | $ | 18,658 | ||||||
|
|
|
|
|
|
|
|||||||
F-123
Table of Contents
Note 24—Accumulated Other Comprehensive Income (Loss)
Activity within the balances in accumulated other comprehensive income (loss) is shown in the following tables for the years ended December 31, 2016, 2015 and 2014.
| (In thousands) | Unrealized gains (losses) on securities available for sale |
Unrealized gains (losses) on derivative instruments designated as cash flow hedges |
Unrealized gains (losses) on defined benefit pension plans |
Accumulated other comprehensive gain (loss) |
||||||||||||
| Balance, December 31, 2013 |
$ | 4,992 | $ | — | $ | (176 | ) | $ | 4,816 | |||||||
| Net change |
3,672 | — | (423 | ) | 3,249 | |||||||||||
|
|
|
|
|
|
|
|
|
|||||||||
| Balance, December 31, 2014 |
8,664 | — | (599 | ) | 8,065 | |||||||||||
| Net change |
(2,763 | ) | 1,626 | 112 | (1,025 | ) | ||||||||||
|
|
|
|
|
|
|
|
|
|||||||||
| Balance, December 31, 2015 |
5,901 | 1,626 | (487 | ) | 7,040 | |||||||||||
| Net change |
(27,720 | ) | (11,838 | ) | (13 | ) | (39,571 | ) | ||||||||
|
|
|
|
|
|
|
|
|
|||||||||
| Balance, December 31, 2016 |
$ | (21,819 | ) | $ | (10,212 | ) | $ | (500 | ) | $ | (32,531 | ) | ||||
|
|
|
|
|
|
|
|
|
|||||||||
Note 25—Subsequent Events
On January 18, 2017, the Company purchased $10.0 million face amount of the 4.875% Senior Note due June 28, 2019 at a discount of 400 basis points or $ 9.6 million.
In March 2017, the Board of Directors approved a 75 for-one stock split of the Company’s common stock. The stock split occurred on April 7, 2017. The effect of the stock split on outstanding shares and earnings per share has been retroactively applied to all periods presented.
F-124
Table of Contents
7,000,000 Shares
Class A Common Stock
Joint Book-Running Managers
| Goldman Sachs & Co. LLC | J.P. Morgan |
| Keefe, Bruyette & Woods | Sandler O’Neill + Partners, L.P. | |
| A Stifel Company |
Co-Managers
| Baird | Raymond James | RBC Capital Markets | Stephens Inc. |
Table of Contents
Part II
Information Not Required In Prospectus
Item 13. Other Expenses of Issuance and Distribution.
Estimated expenses, other than underwriting discounts and commissions, of the sale of our Class A common stock, are as follows:
| SEC registration fee |
$ | 28,273 | ||
| FINRA filing fee |
$ | 30,500 | ||
| Transfer agent and registrar fees and expenses |
$ | 4,500 | ||
| Printing fees and expenses |
$ | 200,000 | ||
| Legal fees and expenses |
$ | 350,000 | ||
| Accounting expenses |
$ | 600,000 | ||
| Miscellaneous expenses |
$ | 25,000 | ||
|
|
|
|||
| Total |
$ | 1,238,273 | ||
|
|
|
Item 14. Indemnification of Directors and Officers.
Limitation of personal liability of directors and indemnification
Section 102(b)(7) of the DGCL permits a corporation to provide in its certificate of incorporation that a director of the corporation shall not be personally liable to the corporation or its stockholders for monetary damages for breach of fiduciary duty as a director, except for liability (1) for any breach of the director’s duty of loyalty to the corporation or its stockholders, (2) for acts or omissions not in good faith or which involve intentional misconduct or a knowing violation of law, (3) under Section 174 of the DGCL (regarding, among other things, the payment of unlawful dividends or unlawful stock purchases or redemptions), or (4) for any transaction from which the director derived an improper personal benefit. Our certificate of incorporation provides for such limitation of liability.
Section 145(a) of the DGCL empowers a corporation to indemnify any director, officer, employee or agent, or former director, officer, employee or agent, who was or is a party or is threatened to be made a party to any threatened, pending or completed action, suit or proceeding, whether civil, criminal, administrative or investigative (other than an action by or in the right of the corporation), by reason of such person’s service as a director, officer, employee or agent of the corporation, or such person’s service, at the corporation’s request, as a director, officer, employee or agent of another corporation or enterprise, against expenses (including attorneys’ fees), judgments, fines and amounts paid in settlement actually and reasonably incurred by such person in connection with such action, suit or proceeding; provided that such director or officer acted in good faith and in a manner reasonably believed to be in or not opposed to the best interests of the corporation; and, with respect to any criminal action or proceeding, provided that such director or officer had no reasonable cause to believe his conduct was unlawful.
Section 145(b) of the DGCL empowers a corporation to indemnify any person who was or is a party or is threatened to be made a party to any threatened, pending or completed action or suit by or in the right of the corporation to procure a judgment in its favor by reason of the fact that such person is or was a director, officer, employee or agent of the corporation, or is or was serving at the request of the corporation as a director, officer, employee or agent of another enterprise, against expenses (including attorneys’ fees) actually and reasonably incurred in connection with the defense or settlement of such action or suit; provided that such director or officer acted in good faith and in a manner he or she reasonably believed to be in or not opposed to the best interests of
II-1
Table of Contents
the corporation, except that no indemnification may be made in respect of any claim, issue or matter as to which such director or officer shall have been adjudged to be liable to the corporation unless and only to the extent that the Delaware Court of Chancery or the court in which such action or suit was brought shall determine upon application that, despite the adjudication of liability but in view of all the circumstances of the case, such director or officer is fairly and reasonably entitled to indemnity for such expenses that the court shall deem proper. Notwithstanding the preceding sentence, except as otherwise provided in the bylaws, we are required to indemnify any such person in connection with a proceeding (or part thereof) commenced by such person only if the commencement of such proceeding (or part thereof) by any such person was authorized by the board of directors.
In addition, our certificate of incorporation provides that we must indemnify our directors and officers to the fullest extent authorized by law. We are also expressly required to advance certain expenses to our directors and officers and carry directors’ and officers’ insurance providing indemnification for our directors and officers for some liabilities. We believe that these indemnification provisions and the directors’ and officers’ insurance are useful to attract and retain qualified directors and executive officers.
The proposed form of Underwriting Agreement filed as Exhibit 1.1 to this Registration Statement provides for indemnification of directors and officers of the Registrant by the underwriters against certain liabilities.
Item 15. Recent Sales of Unregistered Securities.
Within the past three years, the Company has sold the following securities which were not registered under the Securities Act:
4.875% Senior Notes Due 2019
On March 11, 2015, the Company issued additional 2019 senior notes in a principal amount of $10,000,000, which additional 2019 senior notes form a single issue with and have all of the same terms of the 2019 senior notes, in a private placement to institutional investors exempt from registration under Section 4(2) of the Securities Act, including the safe harbors established in Regulation D. Net proceeds after commissions payable to the placement agents in the offering were $10,000,000.
Fixed-to-Floating Rate Subordinated Notes Due 2029
On March 11, 2015, the Company issued an aggregate principal amount of $40,000,000 Fixed-to-Floating Rate Subordinated Notes due 2025 in a private placement to institutional investors exempt from registration under Section 4(2) of the Securities Act, including the safe harbors established in Regulation D. Net proceeds after commissions payable to the placement agents in the offering were $39,000,000.
Restricted Stock Units
We have granted certain of our employees and directors 931,125 restricted stock units under the Amended and Restated Cadence Bancorporation 2015 Omnibus Incentive Plan, of which 672,750 restricted stock units are outstanding as of the date of this registration statement. These grants were made in reliance upon exemptions from registration requirements under Section 4(a)(2) of the Securities Act and pursuant to Rule 701 promulgated under the Securities Act.
Item 16. Exhibits and Financial Statement Schedules.
| (a) | Exhibits: The list of exhibits set forth under “Exhibit Index” at the end of this Registration Statement is incorporated herein by reference. |
II-2
Table of Contents
Item 17. Undertakings.
The undersigned Registrant hereby undertakes to provide to the underwriters at the closing specified in the underwriting agreement certificates in such denominations and registered in such names as required by the underwriters to permit prompt delivery to each purchaser.
Insofar as indemnification for liabilities arising under the Securities Act may be permitted to directors, officers and controlling persons of the Registrant pursuant to the foregoing provisions, or otherwise, the Registrant has been advised that, in the opinion of the SEC, such indemnification is against public policy as expressed in the Securities Act and is, therefore, unenforceable. In the event that a claim for indemnification against such liabilities (other than the payment by the Registrant of expenses incurred or paid by a director, officer or controlling person of the Registrant in the successful defense of any action, suit or proceeding) is asserted by such director, officer or controlling person in connection with the securities being registered, the Registrant will, unless in the opinion of its counsel the matter has been settled by controlling precedent, submit to a court of appropriate jurisdiction the question whether such indemnification by it is against public policy as expressed in the Securities Act and will be governed by the final adjudication of such issue.
The Registrant hereby further undertakes that:
| (1) | For purposes of determining any liability under the Securities Act, the information omitted from the form of prospectus filed as part of this Registration Statement in reliance upon Rule 430A and contained in a form of prospectus filed by the Registrant pursuant to Rule 424(b)(1) or (4) or 497(h) under the Securities Act shall be deemed to be part of this Registration Statement as of the time it was declared effective; and |
| (2) | For purposes of determining any liability under the Securities Act, each post-effective amendment that contains a form of prospectus shall be deemed to be a new registration statement relating to the securities offered therein, and the offering of such securities at that time shall be deemed to be the initial bona fide offering thereof. |
II-3
Table of Contents
Exhibit Index
II-4
Table of Contents
| † | Indicates a management contract or compensatory plan. |
| * | Previously filed. |
II-5
Table of Contents
Signatures and Powers of Attorney
Pursuant to the requirements of the Securities Act of 1933, the Registrant has duly caused this Registration Statement to be signed on its behalf by the undersigned, thereunto duly authorized in Houston, Texas on the 7th day of February, 2018.
| CADENCE BANCORPORATION | ||
| By: |
/s/ Paul B. Murphy, Jr. | |
| Paul B. Murphy, Jr. | ||
| Chairman and Chief Executive Officer | ||
Pursuant to the requirements of the Securities Act of 1933, as amended, this Registration Statement has been signed by the following persons in the capacities and on the dates indicated.
|
Signature |
Title |
Date | ||||
| By: |
/s/ Paul B. Murphy, Jr. Paul B. Murphy, Jr. |
Chairman and Chief Executive Officer (Principal Executive Officer) |
February 7, 2018 | |||
| By: |
/s/ Valerie C. Toalson Valerie C. Toalson |
Executive Vice President and Chief Financial Officer (Principal Financial and Accounting Officer) |
February 7, 2018 | |||
| By: |
* William B. Harrison, Jr. |
Director | February 7, 2018 | |||
| By: |
* Robert K. Steel |
Director | February 7, 2018 | |||
| By: |
* J. Richard Fredericks |
Director | February 7, 2018 | |||
| By: |
* Scott M. Stuart |
Director | February 7, 2018 | |||
| *By: |
/s/ Valerie C. Toalson Power of Attorney |
|||||
II-6