Attached files
UNITED STATES
SECURITIES AND EXCHANGE COMMISSION
Washington, D.C. 20549
__________________________________________________
FORM 10-K
__________________________________________________
(Mark One)
x | ANNUAL REPORT PURSUANT TO SECTION 13 OR 15(d) OF THE SECURITIES EXCHANGE ACT OF 1934. |
For the fiscal year ended December 31, 2017
OR
o | TRANSITION REPORT PURSUANT TO SECTION 13 OR 15(d) OF THE SECURITIES EXCHANGE ACT OF 1934 |
For the transition period from to
Commission file number: 001-14901
__________________________________________________
CNX Resources Corporation
(Exact name of registrant as specified in its charter)
Delaware | 51-0337383 | |
(State or other jurisdiction of incorporation or organization) | (I.R.S. Employer Identification No.) | |
CNX Center
1000 CONSOL Energy Drive Suite 400
Canonsburg, PA 15317-6506
(724) 485-4000
(Address, including zip code, and telephone number, including area code, of registrant’s principal executive offices)
__________________________________________________
Securities registered pursuant to Section 12(b) of the Act:
Title of each class | Name of exchange on which registered | |||
Common Stock ($.01 par value) | New York Stock Exchange | |||
Preferred Share Purchase Rights | New York Stock Exchange | |||
Securities registered pursuant to Section 12(g) of the Act: None
Indicate by check mark if the registrant is a well-known seasoned issuer, as defined in Rule 405 of the Securities Act. Yes x No o
Indicate by check mark if the registrant is not required to file reports pursuant to Section 13 or Section 15(d) of the Act. Yes o No x
Indicate by check mark whether the registrant: (1) has filed all reports required to be filed by Section 13 or 15(d) of the Securities Exchange Act of 1934 during the preceding 12 months (or for such shorter period that the registrant was required to file such reports), and (2) has been subject to such filing requirements for the past 90 days. Yes x No o
Indicate by check mark whether the registrant has submitted electronically and posted on its corporate Web site, if any, every Interactive Data File required to be submitted and posted pursuant to Rule 405 of Regulation S-T (§232.405 of this chapter) during the preceding 12 months (or for such shorter period that the registrant was required to submit and post such files). Yes x No o
Indicate by check mark if disclosure of delinquent filers pursuant to Item 405 of Regulation S-K (§229.405) is not contained herein, and will not be contained, to the best of registrant's knowledge, in definitive proxy or information statements incorporated by reference in Part III of this Form 10-K or any amendment to this Form 10-K. o
Indicate by check mark whether the registrant is a large accelerated filer, an accelerated filer, a non-accelerated filer, or a smaller reporting company. See the definitions of “large accelerated filer,” “accelerated filer” and “smaller reporting company” in Rule 12b-2 of the Exchange Act. (Check one):
Large accelerated filer x Accelerated filer o Non-accelerated filer o Smaller Reporting Company o
Emerging Growth Company o If an emerging growth company, indicate by check mark if the registrant has elected not to use the extended transition period for complying with any new or revised financial accounting standards provided pursuant to Section 13(a) of the Exchange Act. o
Indicate by check mark whether the registrant is a shell company (as defined in Rule 12b-2 of the Exchange Act). Yes o No x
The aggregate market value of voting stock held by nonaffiliates of the registrant as of June 30, 2017, the last business day of the registrant's most recently completed second fiscal quarter, based on the closing price of the common stock on the New York Stock Exchange on such date was $1,685,654,421.
The number of shares outstanding of the registrant's common stock as of January 22, 2018 is 223,758,284 shares.
DOCUMENTS INCORPORATED BY REFERENCE:
Portions of CNX's Proxy Statement for the Annual Meeting of Shareholders to be held on May 9, 2018, are incorporated by reference in Items 10, 11, 12, 13 and 14 of Part III.
TABLE OF CONTENTS | ||
Page | ||
PART I | ||
ITEM 1. | Business | |
ITEM 1A. | Risk Factors | |
ITEM 1B. | Unresolved Staff Comments | |
ITEM 2. | Properties | |
ITEM 3. | Legal Proceedings | |
ITEM 4. | Mine Safety and Health Administration Safety Data | |
PART II | ||
ITEM 5. | Market for Registrant's Common Equity and Related Stockholder Matters and Issuer Purchases of Equity Securities | |
ITEM 6. | Selected Financial Data | |
ITEM 7. | Management's Discussion and Analysis of Financial Condition and Results of Operations | |
ITEM 7A. | Quantitative and Qualitative Disclosures About Market Risk | |
ITEM 8. | Financial Statements and Supplementary Data | |
ITEM 9. | Changes in and Disagreements with Accountants on Accounting and Financial Disclosures | |
ITEM 9A. | Controls and Procedures | |
ITEM 9B. | Other Information | |
PART III | ||
ITEM 10. | Directors and Executive Officers of the Registrant | |
ITEM 11. | Executive Compensation | |
ITEM 12. | Security Ownership of Certain Beneficial Owners and Management and Related Stockholder Matters | |
ITEM 13. | Certain Relationships and Related Transactions and Director Independence | |
ITEM 14. | Principal Accounting Fees and Services | |
PART IV | ||
ITEM 15. | Exhibits and Financial Statement Schedules | |
ITEM 16. | Form 10-K Summary | |
SIGNATURES | ||
2
GLOSSARY OF CERTAIN OIL AND GAS TERMS
The following are certain terms and abbreviations commonly used in the oil and gas industry and included within this Form 10-K:
Bbl - One stock tank barrel, or 42 U.S. gallons liquid volume, used in reference to oil or other liquid hydrocarbons.
Bcf - One billion cubic feet of natural gas.
Bcfe - One billion cubic feet of natural gas equivalents, with one barrel of oil being equivalent to 6,000 cubic feet of gas.
Btu - One British Thermal unit.
Mbbls - One thousand barrels of oil or other liquid hydrocarbons.
Mcf - One thousand cubic feet of natural gas.
Mcfe - One thousand cubic feet of natural gas equivalents, with one barrel of oil being equivalent to 6,000 cubic feet of gas.
MMbtu - One million British Thermal units.
MMcfe - One million cubic feet of natural gas equivalents, with one barrel of oil being equivalent to 6,000 cubic feet of gas.
NGL - Natural gas liquids - those hydrocarbons in natural gas that are separated from the gas as liquids through the proces.
net - “net” natural gas or “net” acres are determined by adding the fractional ownership working interests the Company has in gross wells or acres.
proved reserves - quantities of oil, natural gas, and NGLs which, by analysis of geological and engineering data, can be estimated with reasonable certainty to be economically producible from a given date forward, from known reservoirs, and under existing economic conditions, operating methods and government regulations prior to the time at which contracts providing the right to operate expire, unless evidence indicates that renewal is reasonably certain, regardless of whether deterministic or probabilistic methods are used for the estimation.
proved developed reserves (PDPs) - proved reserves which can be expected to be recovered through existing wells with existing equipment and operating methods.
proved undeveloped reserves (PUDs) - proved reserves that can be estimated with reasonable certainty to be recovered from new wells on undrilled proved acreage or from existing wells where a relatively major expenditure is required for completion.
reservoir - a porous and permeable underground formation containing a natural accumulation of producible natural gas and/or oil that is confined by impermeable rock or water barriers and is separate from other reservoirs.
Tcfe - One trillion cubic feet of natural gas equivalents, with one barrel of oil being equivalent to 6,000 cubic feet of gas.
3
FORWARD-LOOKING STATEMENTS
We are including the following cautionary statement in this Annual Report on Form 10-K to make applicable and take advantage of the safe harbor provisions of the Private Securities Litigation Reform Act of 1995 for any forward-looking statements made by, or on behalf of us. With the exception of historical matters, the matters discussed in this Annual Report on Form 10-K are forward-looking statements (as defined in Section 21E of the Securities Exchange Act of 1934, as amended (the Exchange Act)) that involve risks and uncertainties that could cause actual results to differ materially from projected results. Accordingly, investors should not place undue reliance on forward-looking statements as a prediction of actual results. The forward-looking statements may include projections and estimates concerning the timing and success of specific projects and our future production, revenues, income and capital spending. When we use the words “believe,” “intend,” “expect,” “may,” “should,” “anticipate,” “could,” “estimate,” “plan,” “predict,” “project,” "will," or their negatives, or other similar expressions, the statements which include those words are usually forward-looking statements. When we describe strategy that involves risks or uncertainties, we are making forward-looking statements. The forward-looking statements in this Annual Report on Form 10-K speak only as of the date of this Annual Report on Form 10-K; we disclaim any obligation to update these statements unless required by securities law, and we caution you not to rely on them unduly. We have based these forward-looking statements on our current expectations and assumptions about future events. While our management considers these expectations and assumptions to be reasonable, they are inherently subject to significant business, economic, competitive, regulatory and other risks, contingencies and uncertainties, most of which are difficult to predict and many of which are beyond our control. These risks, contingencies and uncertainties relate to, among other matters, the following:
• | prices for natural gas and natural gas liquids are volatile and can fluctuate widely based upon a number of factors beyond our control including oversupply relative to the demand for our products, weather and the price and availability of alternative fuels; |
• | our dependence on gathering, processing and transportation facilities and other midstream facilities owned by CNX Midstream Partners LP (NYSE: CNXM) (CNXM) and others; |
• | uncertainties in estimating our economically recoverable natural gas reserves, and inaccuracies in our estimates; |
• | the high-risk nature of drilling natural gas wells; |
• | our identified drilling locations are scheduled out over multiple years, making them susceptible to uncertainties that could materially alter the occurrence or timing of their drilling; |
• | the impact of potential, as well as any adopted environmental regulations including any relating to greenhouse gas emissions on our operating costs as well as on the market for natural gas and for our securities; |
• | environmental regulations introduce uncertainty that could adversely impact the market for natural gas with potential short and long-term liabilities; |
• | the risks inherent in natural gas operations, including our reliance upon third-party contractors, being subject to unexpected disruptions, including geological conditions, equipment failure, timing of completion of significant construction or repair of equipment, fires, explosions, accidents and weather conditions that could impact financial results; |
• | decreases in the availability of, or increases in the price of, required personnel, services, equipment, parts and raw materials to support our operations; |
• | if natural gas prices remain depressed or drilling efforts are unsuccessful, we may be required to record writedowns of our proved natural gas properties; |
• | a loss of our competitive position because of the competitive nature of the natural gas industry or overcapacity in this industry impairing our profitability; |
• | deterioration in the economic conditions in any of the industries in which our customers operate, a domestic or worldwide financial downturn, or negative credit market conditions; |
• | hedging activities may prevent us from benefiting from price increases and may expose us to other risks; |
• | our inability to collect payments from customers if their creditworthiness declines or if they fail to honor their contracts; |
• | existing and future government laws, regulations and other legal requirements that govern our business may increase our costs of doing business and may restrict our operations; |
• | significant costs and liabilities may be incurred as a result of pipeline and related facility integrity management program testing and any related pipeline repair or preventative or remedial measures; |
• | our ability to find adequate water sources for our use in natural gas drilling, or our ability to dispose of or recycle water used or removed from strata in connection with our gas operations at a reasonable cost and within applicable environmental rules; |
• | the outcomes of various legal proceedings, including those which are more fully described in our reports filed under the Exchange Act; |
• | acquisitions and divestitures we anticipate may not occur or produce anticipated benefits; |
4
• | risks associated with our debt; |
• | failure to find or acquire economically recoverable natural gas reserves to replace our current natural gas reserves; |
• | a decrease in our borrowing base, which could decrease for a variety of reasons including lower natural gas prices, declines in natural gas proved reserves, and lending requirements or regulations; |
• | we may operate a portion of our business with one or more joint venture partners or in circumstances where we are not the operator, which may restrict our operational and corporate flexibility and we may not realize the benefits we expect to realize from a joint venture; |
• | changes in federal or state income tax laws; |
• | challenges associated with strategic determinations, including the allocation of capital and other resources to strategic opportunities; |
• | our development and exploration projects, as well as CNXM’s midstream system development, require substantial capital expenditures; |
• | terrorist attacks or cyber-attacks could have a material adverse effect on our business, financial condition or results of operations; |
• | construction of new gathering, compression, dehydration, treating or other midstream assets by CNXM may not result in revenue increases and may be subject to regulatory, environmental, political, legal and economic risks; |
• | our success depends on key members of our management and our ability to attract and retain experienced technical and other professional personnel; |
• | we may not achieve some or all of the expected benefits of the separation of CONSOL Energy; |
• | CONSOL Energy may fail to perform under various transaction agreements that were executed as part of the separation; |
• | CONSOL Energy may not be able to satisfy its indemnification obligations in the future and such indemnities may not be sufficient to hold us harmless from the full amount of liabilities for which CONSOL Energy will be allocated responsibility; |
• | the separation of CONSOL Energy could result in substantial tax liability; and |
• | other factors discussed in this 2017 Form 10-K under “Risk Factors,” as updated by any subsequent Forms 10-Q, which are on file at the Securities and Exchange Commission. |
.
5
PART I
ITEM 1. | Business |
General
CNX Resources Corporation, (CNX or the Company) is one of the largest independent oil and natural gas companies in the United States and is focused on the exploration, development, production, gathering, processing and acquisition of natural gas properties in the Appalachian Basin. Our operations are centered on unconventional shale formations, primarily the Marcellus Shale and Utica Shale.
CNX was incorporated in Delaware in 1991 under the name CONSOL Energy Inc. (CONSOL Energy), but its predecessors had been mining coal, primarily in the Appalachian Basin, since 1864. CNX entered the natural gas business in the 1980s initially to increase the safety and efficiency of its Virginia coal mines by capturing methane from coal seams prior to mining, which makes the mining process safer and more efficient. The natural gas business grew from the coalbed methane production in Virginia into other unconventional production, including hydraulic fracturing in the Marcellus Shale and Utica Shale in the Appalachian Basin. This growth was accelerated with the 2010 asset acquisition of the Appalachian Exploration & Production business of Dominion Resources, Inc.
On November 28, 2017, CNX completed the tax-free spin-off of its coal business resulting in two independent, publicly traded companies: CONSOL Energy, a coal company, formerly known as CONSOL Mining Corporation; and CNX, a natural gas exploration and production company. As a result of the separation of the two companies, CONSOL Energy and its subsidiaries now hold the coal assets previously held by CNX, including its Pennsylvania Mining Complex, Baltimore Marine Terminal, its direct and indirect ownership interest in CONSOL Coal Resources LP, formerly known as CNXC Coal Resources LP, and other related coal assets previously held by CNX. To effect the separation, CNX's shareholders received one share of CONSOL Energy common stock for every eight shares of CNX's common stock held as of the close of business on November 15, 2017, the record date for the separation and distribution. The coal company, previously reported as the Company's Pennsylvania Mining Operations division, has been reclassified in the Audited Consolidated Financial Statements in Item 8 of this Annual Report on Form 10-K (the Form 10-K) to discontinued operations for all periods presented.
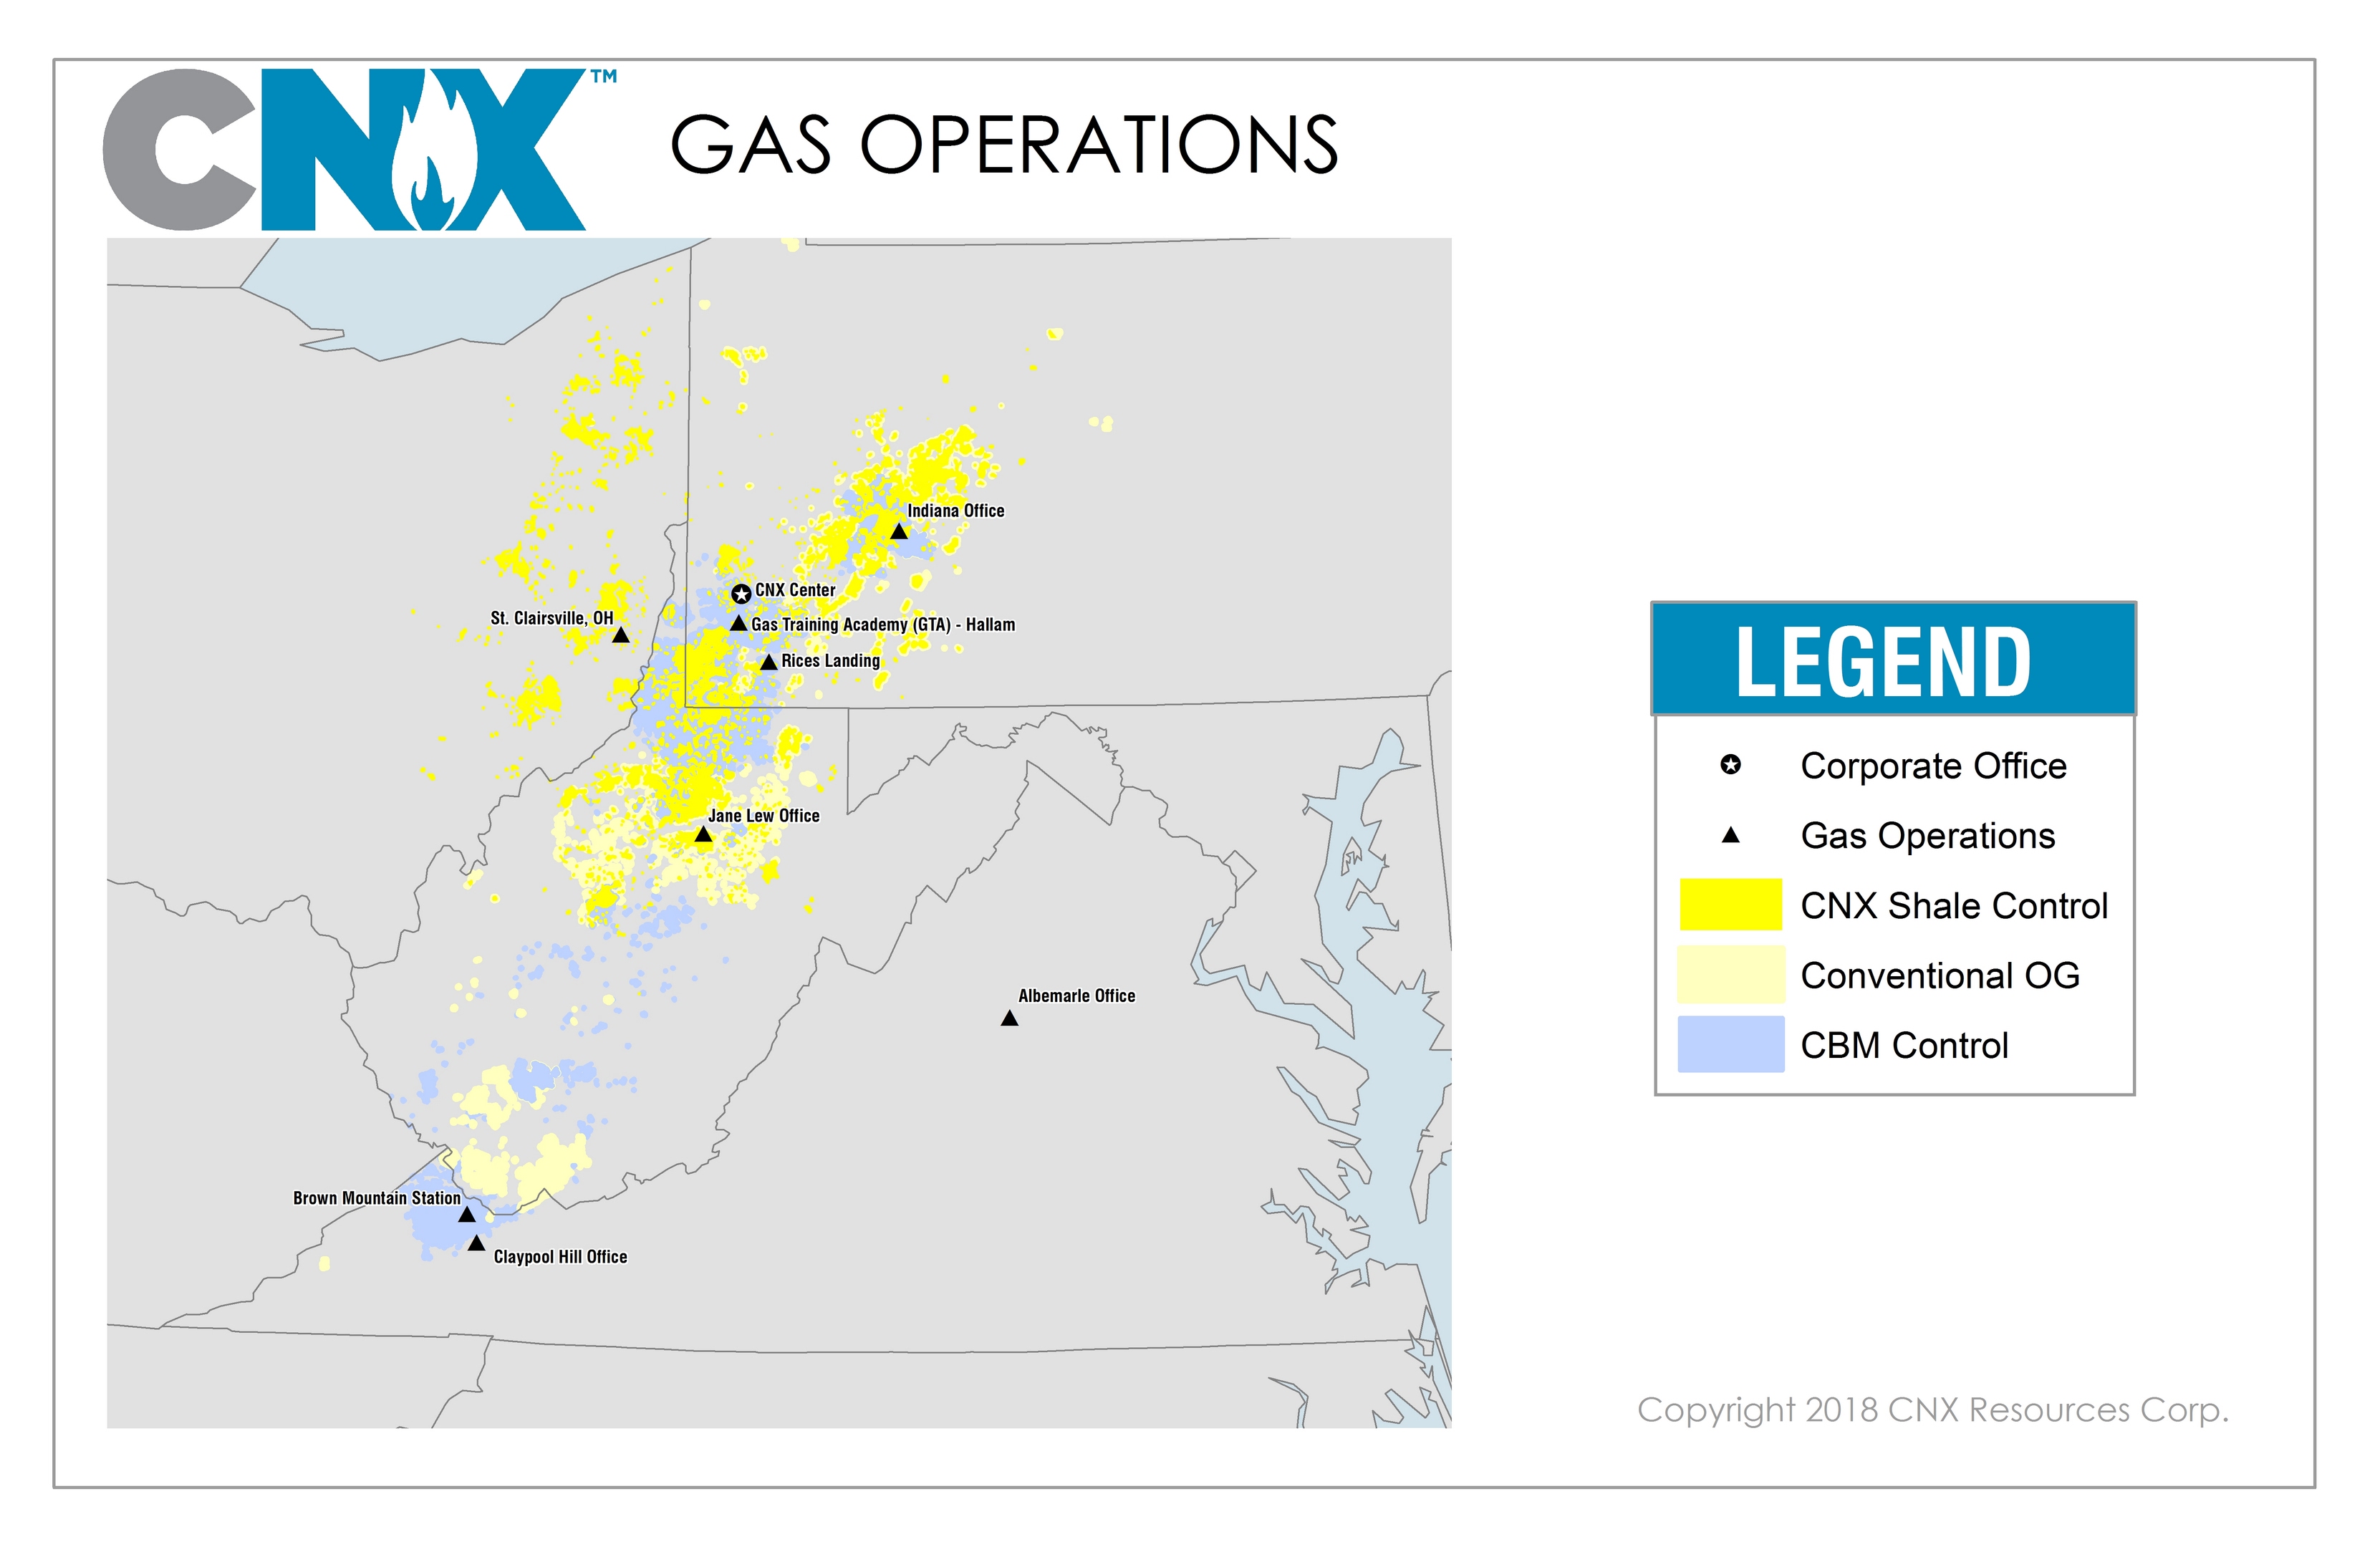
CNX operates, develops and explores for natural gas primarily in Appalachia (Pennsylvania, West Virginia, Ohio, and Virginia). Our primary focus is the continued development of our Marcellus Shale acreage and delineation and development of our unique Utica Shale acreage and stacked pay opportunity set. We believe that our concentrated operating area, our legacy surface acreage position, our regional operating expertise, our extensive data set from development, as well as from non-operated participation wells and our held-by-production acreage position provides us a significant operating advantage over our competitors. Over the past ten years, CNX's natural gas business has grown by approximately 625% to produce a total of 407.2 net Bcfe in 2017.
Our land holdings in the Marcellus Shale and Utica Shale plays cover large areas, provide multi-year drilling opportunities and, collectively, have sustainable lower risk growth profiles. We currently control approximately 530,000 net acres in the Marcellus Shale and approximately 652,000 net acres that have Utica Shale potential in Ohio, West Virginia, and Pennsylvania. We also have approximately 2.2 million net acres in our coalbed methane play.
Highlights of our 2017 production include the following:
• | Total average production of 1,115,523 Mcfe per day; |
• | 90% Natural Gas, 10% Liquids; and |
• | 59% Marcellus, 20% Utica, 16% coalbed methane, and 5% other. |
At December 31, 2017, our proved natural gas, NGL, condensate and oil reserves (collectively, "natural gas reserves") had the following characteristics:
• | 7.6 Tcfe of proved reserves; |
• | 93.9% natural gas; |
• | 58.2% proved developed; |
• | 95.5% operated; and |
• | A reserve life ratio of 18.62 years (based on 2017 production). |
6
The following map provides the location of CNX's E&P operations by region:
CNX defines itself through its core values which serve as the compass for our road map and guide every aspect of our business as we strive to achieve our corporate mission:
• | Responsibility: Be a safe and compliant operator; be a trusted community partner and respected corporate citizen; act with pride and integrity; |
• | Ownership: Be accountable for our actions and learn from our outcomes, both positive and negative; be calculated risk-takers and seek creative ways to solve problems; and |
• | Excellence: Be prudent capital allocators; be a lean, efficient, nimble organization; be a disciplined, reliable, performance-driven company. |
These values are the foundation of CNX's identity and are the basis for how management defines continued success. We believe CNX's rich resource base, coupled with these core values, allows management to create value for the long-term. The electric power industry generates approximately two-thirds of its output by burning fossil fuels. Because of this we believe that the use of natural gas will continue for many years as one of the principal fuel sources for electricity in the United States. Additionally, we believe that as worldwide economies grow, the demand for electricity from fossil fuels will grow as well, which could result in the expansion of worldwide demand for our natural gas. Natural gas is also the dominant choice for primary heating fuel in the domestic residential sector. CNG (compressed natural gas)-powered vehicles are already in use in many major cities, saving money on fuel and reducing emission levels, while the demand for CNG is expected to grow further through additional fleet conversion to this cleaner-burning fuel. Finally, plentiful natural gas feedstock is creating emerging opportunities for chemicals and plastics manufacturing (in addition to the other uses previously noted) in the United States and abroad as the United States becomes a net exporter of the fuel.
CNX's Strategy
CNX's strategy is to increase shareholder value through the development and growth of its existing natural gas assets and selective acquisition of natural gas and natural gas liquid acreage leases within its footprint. Our mission is to empower our team to embrace and drive innovative change that creates long-term value for our shareholders, while enhancing our communities and
7
delivering energy solutions for today and tomorrow. We also will continue to focus on monetization of non-core assets to accelerate value creation and to minimize the shortfall between operating cash flows and our growth capital requirements.
We expect natural gas to become a more significant contributor to the domestic electric generation mix, while fueling industrial growth in the U.S. economy. With the recent growth of natural gas exports to Mexico and Canada and the United States becoming a net exporter of natural gas in 2016, we expect new markets to open up in the coming years. We feel that our significant increases in natural gas production, our reductions in drilling and operating costs and our vast acreage position will allow CNX to take advantage of these markets.
CNX's Capital Expenditure Budget
In 2018, CNX expects capital expenditures of approximately $790-$880 million. The 2018 budget includes $515-$580 million of drilling and completion ("D&C") capital and approximately $275-$300 million of capital associated with land, midstream, and water infrastructure. The 2018 D&C capital budget is allocated approximately 65% to the Marcellus Shale and 35% to the Utica Shale.
DETAIL OPERATIONS
Our operations are located throughout Appalachia and include the following plays:
Marcellus Shale
We have the rights to extract natural gas in Pennsylvania, West Virginia, and Ohio from approximately 530,000 net Marcellus Shale acres at December 31, 2017.
The Upper Devonian Shale formation, which includes both the Burkett Shale and Rhinestreet Shale, lies above the Marcellus Shale formation in southwestern Pennsylvania and northern West Virginia. The Company holds a large number of acres that have Upper Devonian potential; however, these acres have not been disclosed separately as they generally coincide with our Marcellus acreage.
In December 2016, CNX terminated the 50-50 Joint Venture that was formed in 2011, with Noble Energy, Inc., for the exploration, development, and operation of primarily Marcellus Shale properties in Pennsylvania and West Virginia. As a result of the termination, each party now owns and operates a 100% interest in its properties and wells in two separate operating areas; and each party will now have independent control and flexibility with respect to the scope and timing of future development over its operating area. In June 2017, Noble Energy announced that it has closed on a transaction divesting its upstream assets in northern West Virginia and southern Pennsylvania to HG Energy II Appalachia, LLC, a portfolio company of Quantum Energy Partners.
On January 3, 2018, the Company acquired the remaining 50% membership interest in CONE Gathering LLC (which has since been renamed CNX Gathering LLC), which holds the general partner interest and incentive distribution rights in CNXM, the entity that constructs and operates the gathering system for most of our Marcellus shale production. See "Midstream Gas Services" for a more detailed explanation.
Utica Shale
We have the rights to extract natural gas in Pennsylvania, West Virginia, and Ohio from approximately 652,000 net Utica Shale acres at December 31, 2017. Approximately 341,000 Utica acres coincide with Marcellus Shale acreage in Pennsylvania, West Virginia, and Ohio.
Coalbed Methane (CBM)
We have the rights to extract CBM in Virginia from approximately 267,000 net CBM acres in Central Appalachia. We produce CBM natural gas primarily from the Pocahontas #3 seam.
We also have the rights to extract CBM in West Virginia, southwestern Pennsylvania, and Ohio from approximately 906,000 net CBM acres. In central Pennsylvania we have the right to extract CBM from approximately 260,000 net CBM acres. In addition, we control approximately 584,000 net CBM acres in Illinois, Kentucky, Indiana, and Tennessee. We also have the right to extract CBM on approximately139,000 net acres in the San Juan Basin in New Mexico. We have no current plans to drill CBM wells in these areas in 2018.
8
Other Gas
We have the rights to extract natural gas from other shale and shallow oil and gas positions primarily in Illinois, Indiana, Kentucky, New York, Ohio, Pennsylvania, Virginia, and West Virginia from approximately 1,360,000 net acres at December 31, 2017. The majority of our shallow oil and gas leasehold position is held by production and all of it is extensively overlain by existing third-party gas gathering and transmission infrastructure.
Summary of Properties as of December 31, 2017
Marcellus | Utica | CBM | Other Gas | ||||||||||||
Segment | Segment | Segment | Segment | Total | |||||||||||
Estimated Net Proved Reserves (MMcfe) | 4,396,130 | 1,372,261 | 1,353,366 | 459,855 | 7,581,612 | ||||||||||
Percent Developed | 51 | % | 54 | % | 72 | % | 100 | % | 58 | % | |||||
Net Producing Wells (including oil and gob wells) | 316 | 76 | 4,454 | 8,019 | 12,865 | ||||||||||
Net Acreage Position: | |||||||||||||||
Net Proved Developed Acres | 34,010 | 14,943 | 259,638 | 235,346 | 543,937 | ||||||||||
Net Proved Undeveloped Acres | 28,435 | 8,449 | 3,819 | — | 40,703 | ||||||||||
Net Unproved Acres(1) | 467,365 | 286,943 | 1,893,140 | 1,169,567 | 3,817,015 | ||||||||||
Total Net Acres(2) | 529,810 | 310,335 | 2,156,597 | 1,404,913 | 4,401,655 | ||||||||||
(1) | Net acres include acreage attributable to our working interests in the properties. Additional adjustments (either increases or decreases) may be required as we further develop title to and further confirm our rights with respect to our various properties in anticipation of development. We believe that our assumptions and methodology in this regard are reasonable. |
(2) | Acreage amounts are only included under the target strata CNX expects to produce with the exception of certain CBM acres governed by separate leases, although the reported acres may include rights to multiple gas seams (e.g. we have rights to Marcellus segment that are disclosed under the Utica segment and we have rights to Utica segment that are disclosed under the Marcellus segment). We have reviewed our drilling plans, our acreage rights and used our best judgment to reflect the acres in the strata we expect to primarily produce. As more information is obtained or circumstances change, the acreage classification may change. |
Producing Wells and Acreage
Most of our development wells and proved acreage are located in Virginia, West Virginia, Ohio and Pennsylvania. Some leases are beyond their primary term, but these leases are extended in accordance with their terms as long as certain drilling commitments or other term commitments are satisfied.
The following table sets forth, at December 31, 2017, the number of producing wells, developed acreage and undeveloped acreage:
Gross | Net(1) | |||||
Producing Gas Wells (including gob wells) | 17,013 | 12,853 | ||||
Producing Oil Wells | 171 | 12 | ||||
Net Acreage Position: | ||||||
Proved Developed Acreage | 551,900 | 543,937 | ||||
Proved Undeveloped Acreage | 41,066 | 40,703 | ||||
Unproved Acreage | 4,434,714 | 3,817,015 | ||||
Total Acreage | 5,027,680 | 4,401,655 | ||||
(1) | Net acres include acreage attributable to our working interests in the properties. Additional adjustments (either increases or decreases) may be required as we further develop title to and further confirm our rights with respect to our various properties in anticipation of development. We believe that our assumptions and methodology in this regard are reasonable. |
9
The following table represents the terms under which we hold these acres:
Gross Unproved Acres | Net Unproved Acres | Net Proved Undeveloped Acres | |||||||
Held by production/fee | 4,278,446 | 3,736,526 | 25,688 | ||||||
Expiration within 2 years | 94,486 | 43,118 | 8,447 | ||||||
Expiration beyond 2 years | 61,782 | 37,371 | 6,568 | ||||||
Total Acreage | 4,434,714 | 3,817,015 | 40,703 | ||||||
The leases reflected above as Gross and Net Unproved Acres with expiration dates are included in our current drill plan or active land program. Leases with expiration dates within two years represent approximately 1% of our total net unproved acres and leases with expiration dates beyond two years represent approximately 1% of our total net unproved acres. In each case, we deemed this acreage to not be material to our overall acreage position. Additionally, based on our current drill plans and lease management we do not anticipate any material impact to our consolidated financial statements from the expiration of such leases.
Development Wells (Net)
During the years ended December 31, 2017, 2016 and 2015, we drilled 90.0, 36.0 and 132.8 net development wells, respectively. Gob wells and wells drilled by operators other than our primary joint venture partners at that time are excluded from net development wells. In 2017, there were 3.9 net development wells and 1.8 exploratory wells drilled but uncompleted. There were no dry development wells in 2017, 2016, or 2015. As of December 31, 2017, there are 13.0 gross completed developmental wells ready to be turned in-line. The following table illustrates the net wells drilled by well classification type:
For the Year | |||||||||
Ended December 31, | |||||||||
2017 | 2016 | 2015 | |||||||
Marcellus segment | 9.0 | — | 44.0 | ||||||
Utica segment | 17.0 | 13.0 | 15.8 | ||||||
CBM segment | 64.0 | 23.0 | 73.0 | ||||||
Other Gas segment | — | — | — | ||||||
Total Development Wells (Net) | 90.0 | 36.0 | 132.8 | ||||||
Exploratory Wells (Net)
There were 4.0 net exploratory wells drilled during the year ended December 31, 2017. There were no exploratory wells drilled during the year ended December 31, 2016 and 2.5 net exploratory wells drilled during the year ended December 31, 2015. As of December 31, 2017, there are 1.8 net exploratory wells in process. The following table illustrates the exploratory wells drilled by well classification type:
For the Year Ended December 31, | ||||||||||||||||||||||||||||
2017 | 2016 | 2015 | ||||||||||||||||||||||||||
Producing | Dry | Still Eval. | Producing | Dry | Still Eval. | Producing | Dry | Still Eval. | ||||||||||||||||||||
Marcellus segment | — | — | — | — | — | — | — | — | — | |||||||||||||||||||
Utica segment | 2.2 | — | 1.8 | — | — | — | 2.5 | — | — | |||||||||||||||||||
CBM segment | — | — | — | — | — | — | — | — | — | |||||||||||||||||||
Other Gas segment | — | — | — | — | — | — | — | — | — | — | ||||||||||||||||||
Total Exploratory Wells (Net) | 2.2 | — | 1.8 | — | — | — | 2.5 | — | — | |||||||||||||||||||
10
Reserves
The following table shows our estimated proved developed and proved undeveloped reserves. Reserve information is net of royalty interest. Proved developed and proved undeveloped reserves are reserves that could be commercially recovered under current economic conditions, operating methods and government regulations. Proved developed and proved undeveloped reserves are defined by the Securities and Exchange Commission (SEC).
Net Reserves | |||||||||
(Million cubic feet equivalent) | |||||||||
as of December 31, | |||||||||
2017 | 2016 | 2015 | |||||||
Proved developed reserves | 4,409,065 | 3,683,302 | 3,697,152 | ||||||
Proved undeveloped reserves | 3,172,547 | 2,568,346 | 1,945,837 | ||||||
Total proved developed and undeveloped reserves(1) | 7,581,612 | 6,251,648 | 5,642,989 | ||||||
___________
(1) | For additional information on our reserves, see Other Supplemental Information–Supplemental Gas Data (unaudited) to the Consolidated Financial Statements in Item 8 of this Form 10-K. |
Discounted Future Net Cash Flows
The following table shows our estimated future net cash flows and total standardized measure of discounted future net cash flows at 10%:
Discounted Future | ||||||||||||
Net Cash Flows | ||||||||||||
(Dollars in millions) | ||||||||||||
2017 | 2016 | 2015 | ||||||||||
Future net cash flows | $ | 7,841 | $ | 2,419 | $ | 2,500 | ||||||
Total PV-10 measure of pre-tax discounted future net cash flows (1) | $ | 4,140 | $ | 1,559 | $ | 1,659 | ||||||
Total standardized measure of after tax discounted future net cash flows | $ | 3,131 | $ | 955 | $ | 1,019 | ||||||
____________
(1) | We calculate our present value at 10% (PV-10) in accordance with the following table. Management believes that the presentation of the non-Generally Accepted Accounting Principles (GAAP) financial measure of PV-10 provides useful information to investors because it is widely used by professional analysts and sophisticated investors in evaluating oil and gas companies. Because many factors that are unique to each individual company impact the amount of future income taxes estimated to be paid, the use of a pre-tax measure is valuable when comparing companies based on reserves. PV-10 is not a measure of the financial or operating performance under GAAP. PV-10 should not be considered as an alternative to the standardized measure as defined under GAAP. We have included a reconciliation of the most directly comparable GAAP measure-after-tax discounted future net cash flows. |
11
Reconciliation of PV-10 to Standardized Measure
As of December 31, | ||||||||||||
2017 | 2016 | 2015 | ||||||||||
(Dollars in millions) | ||||||||||||
Future cash inflows | $ | 19,262 | $ | 11,303 | $ | 11,838 | ||||||
Future production costs | (7,234 | ) | (5,851 | ) | (6,585 | ) | ||||||
Future development costs (including abandonments) | (1,711 | ) | (1,550 | ) | (1,220 | ) | ||||||
Future net cash flows (pre-tax) | 10,317 | 3,902 | 4,033 | |||||||||
10% discount factor | (6,177 | ) | (2,343 | ) | (2,374 | ) | ||||||
PV-10 (Non-GAAP measure) | 4,140 | 1,559 | 1,659 | |||||||||
Undiscounted income taxes | (2,476 | ) | (1,483 | ) | (1,534 | ) | ||||||
10% discount factor | 1,467 | 879 | 894 | |||||||||
Discounted income taxes | (1,009 | ) | (604 | ) | (640 | ) | ||||||
Standardized GAAP measure | $ | 3,131 | $ | 955 | $ | 1,019 | ||||||
Gas Production
The following table sets forth net sales volumes produced for the periods indicated:
For the Year | |||||||||
Ended December 31, | |||||||||
2017 | 2016 | 2015 | |||||||
Natural Gas | |||||||||
Sales Volume (MMcf) | |||||||||
Marcellus | 209,687 | 186,812 | 149,332 | ||||||
Utica | 70,708 | 71,277 | 38,344 | ||||||
CBM | 65,373 | 68,971 | 74,910 | ||||||
Other | 19,125 | 21,693 | 24,701 | ||||||
Total | 364,893 | 348,753 | 287,287 | ||||||
NGL | |||||||||
Sales Volume (Mbbls) | |||||||||
Marcellus | 4,604 | 3,922 | 3,175 | ||||||
Utica | 1,851 | 2,787 | 2,354 | ||||||
Other | 1 | 1 | 1 | ||||||
Total | 6,456 | 6,710 | 5,530 | ||||||
Oil and Condensate | |||||||||
Sales Volume (Mbbls) | |||||||||
Marcellus | 346 | 360 | 650 | ||||||
Utica | 204 | 470 | 627 | ||||||
Other | 39 | 65 | 88 | ||||||
Total | 589 | 895 | 1,365 | ||||||
Total Sales Volume (MMcfe) | |||||||||
Marcellus | 239,387 | 212,504 | 172,280 | ||||||
Utica | 83,038 | 90,820 | 56,229 | ||||||
CBM | 65,373 | 68,971 | 74,910 | ||||||
Other | 19,368 | 22,092 | 25,238 | ||||||
Total | 407,166 | 394,387 | 328,657 | ||||||
*Oil, NGLs, and Condensate are converted to Mcfe at the rate of one barrel equals six Mcf based upon the approximate relative energy content of oil and natural gas.
CNX expects 2018 annual natural gas production volumes of 520-550 Bcfe, or an approximately 31% annual increase, compared to 2017 volumes, based on the midpoint of guidance.
12
Average Sales Price and Average Lifting Cost
The following table sets forth the total average sales price and the total average lifting cost for all of our natural gas and NGL production for the periods indicated. Total lifting cost is the cost of raising gas to the gathering system and does not include depreciation, depletion or amortization. See Part II Item 7 Management's Discussion and Analysis of Financial Condition and Results of Operations in this Form 10-K for a breakdown by segment.
For the Year | ||||||||||||
Ended December 31, | ||||||||||||
2017 | 2016 | 2015 | ||||||||||
Average Sales Price - Gas (Mcf) | $ | 2.59 | $ | 1.92 | $ | 2.17 | ||||||
(Loss) Gain on Commodity Derivative Instruments - Cash Settlement- Gas (Mcf) | $ | (0.11 | ) | $ | 0.70 | $ | 0.68 | |||||
Average Sales Price - NGLs (Mcfe)* | $ | 4.03 | $ | 2.42 | $ | 2.05 | ||||||
Average Sales Price - Oil (Mcfe)* | $ | 7.56 | $ | 6.15 | $ | 7.99 | ||||||
Average Sales Price - Condensate (Mcfe)* | $ | 6.59 | $ | 4.58 | $ | 4.42 | ||||||
Total Average Sales Price (per Mcfe) Including Effect of Derivative Instruments | $ | 2.66 | $ | 2.63 | $ | 2.81 | ||||||
Total Average Sales Price (per Mcfe) Excluding Effect of Derivative Instruments | $ | 2.76 | $ | 2.01 | $ | 2.22 | ||||||
Average Lifting Costs Excluding Ad Valorem and Severance Taxes (per Mcfe) | $ | 0.22 | $ | 0.24 | $ | 0.37 | ||||||
Average Sales Price - NGLs (Bbl) | $ | 24.18 | $ | 14.52 | $ | 12.30 | ||||||
Average Sales Price - Oil (Bbl) | $ | 45.36 | $ | 36.90 | $ | 47.94 | ||||||
Average Sales Price - Condensate (Bbl) | $ | 39.54 | $ | 27.48 | $ | 26.52 | ||||||
*Oil, NGLs, and Condensate are converted to Mcfe at the rate of one barrel equals six Mcf based upon the approximate relative energy content of oil and natural gas.
Sales of NGLs, condensates and oil enhance our reported natural gas equivalent sales price. Across all volumes, when excluding the impact of hedging, sales of liquids added $0.17 per Mcfe, $0.09 per Mcfe, and $0.05 per Mcfe for 2017, 2016, and 2015, respectively, to average gas sales prices. CNX expects to continue to realize a liquids uplift benefit as additional wells are brought online in the liquid-rich areas of the Marcellus shale. We continue to sell the majority of our NGLs through the large midstream companies that process our natural gas. This approach allows us to take advantage of the processors’ transportation efficiencies and diversified markets. Certain of CNX’s processing contracts provide for the ability to take our NGLs “in-kind” and market them directly if desired. The processed purity products are ultimately sold to industrial, commercial, and petrochemical markets.
We enter into physical natural gas sales transactions with various counterparties for terms varying in length. Reserves and production estimates are believed to be sufficient to satisfy these obligations. In the past, we have delivered quantities required under these contracts. We also enter into various natural gas swap transactions. These gas swap transactions exist parallel to the underlying physical transactions and represented approximately 312.2 Bcf of our produced gas sales volumes for the year ended December 31, 2017 at an average price of $2.60 per Mcf. The notional volumes associated with these gas swaps represented approximately 264.9 Bcf of our produced gas sales volumes for the year ended December 31, 2016 at an average price of $3.04 per Mcf. As of January 15, 2018, we expect these transactions will represent approximately 388.6 Bcf of our estimated 2018 production at an average price of $2.77 per Mcf, 273.0 Bcf of our estimated 2019 production at an average price of $2.74 per Mcf, 198.3 Bcf of our estimated 2020 production at an average price of $2.78 per Mcf, approximately 166.5 Bcf of our estimated 2021 production at an average price of $2.62 per Mcf, and approximately 153.4 Bcf of our estimated 2022 production at an average price of $2.83 per Mcf.
The hedging strategy and information regarding derivative instruments used are outlined in Part II, Item 7A Qualitative and Quantitative Disclosures About Market Risk and in Note 17 - Derivative Instruments in the Notes to the Audited Consolidated Financial Statements in Item 8 of this Form 10-K.
13
Midstream Gas Services
CNX has traditionally designed, built and operated natural gas gathering systems to move gas from the wellhead to interstate pipelines or other local sales points. In addition, CNX has acquired extensive gathering assets. CNX now owns or operates approximately 5,000 miles of natural gas gathering pipelines as well as 250,000 horsepower of compression, of which, approximately 75% is wholly owned with the balance being leased. Along with this compression capacity, CNX owns and operates a number of natural gas processing facilities. This infrastructure is capable of delivering approximately 750 billion cubic feet per year of pipeline quality gas.
On January 3, 2018, CNX closed its previously announced acquisition of Noble Energy’s (Noble) 50% membership interest in CONE Gathering LLC (CONE or CONE Gathering), which holds the general partner interest and incentive distribution rights in CONE Midstream Partners LP. In conjunction with the closing, CONE Midstream Partners LP was renamed CNX Midstream Partners LP (CNX Midstream or CNXM) and CONE Gathering LLC was renamed CNX Gathering LLC (CNX Gathering) (See Note 21 - Subsequent Event in the Notes to the Audited Consolidated Financial Statements in Item 8 of this Form 10-K for more information). Also on January 3, 2018, the Company’s board of directors authorized CNX Midstream to enter into an amendment to its gas gathering agreement with CNX Gas Company LLC, a wholly-owned subsidiary of CNX.
CNX Gathering develops, operates and owns substantially all of CNX’s Marcellus Shale gathering systems. Prior to its acquisition of Noble’s interest, CNX operated this equity affiliate. Subsequent to the acquisition, CNX is the single sponsor of CNXM, and beginning in the first quarter of 2018 CNX Gathering will be fully consolidated into the Company’s financial statements. We believe that the network of right-of-ways, vast surface holdings, experience in building and operating gathering systems in the Appalachian basin, and increased control and flexibility will give CNX Gathering an advantage in building the midstream assets required to execute our Marcellus Shale development plan.
In the Utica Shale, we and our joint venture partner, Hess, primarily contract with third-parties for gathering services.
CNX has developed a diversified portfolio of firm transportation capacity options to support its production growth plan. CNX plans to selectively acquire firm capacity on an as-needed basis, while minimizing transportation costs and long-term financial obligations. In the near term, if appropriate, CNX also plans to optimize and/or release firm transportation to others. CNX also benefits from the strategic location of our primary production areas in southwestern Pennsylvania, northern West Virginia, and eastern Ohio. These areas are currently served by a large concentration of major pipelines that provide us with the capacity to move our production to the major gas markets, and it is expected that recently-approved and pending pipeline projects will increase the take-away capacity from our region. In addition to firm transportation capacity, CNX has developed a processing portfolio to support the projected volumes from its wet production areas and has operational and contractual flexibility to potentially convert a portion of currently processed wet gas volumes to be marketed as dry gas volumes.
CNX has the advantage of having gas production from CBM, which can be lower Btu than pipeline specification, as well as higher Btu Marcellus and Utica shale production. These types of gas can be complementary by reducing and in some cases eliminating the need for the costly processing of CBM. In addition, our lower Btu CBM and dry Marcellus and Utica production offer an opportunity to blend ethane back into the gas stream when pricing or capacity in ethane markets dictate. In developing a diversified approach to managing ethane, CNX has entered into ethane supply agreements and regularly assesses future outlet opportunities with ethane customers and midstream companies. These different gas types allow us more flexibility in bringing Marcellus and Utica shale wells on-line at qualities that meet interstate pipeline specifications.
Natural Gas Competition
The United States natural gas industry is highly competitive. CNX competes with other large producers, as well as a myriad of smaller producers and marketers. CNX also competes for pipeline and other services to deliver its products to customers. According to data from the Natural Gas Supply Association and the Energy Information Agency (EIA), the five largest U.S. producers of natural gas produced about 14% of dry natural gas production during the first nine months of 2017. The EIA reported 552,506 producing natural gas wells in the United States at December 31, 2016 (the latest year for which government statistics are available), which is approximately four percent lower than 2015.
CNX expects natural gas to be a significant contributor to the domestic electric generation mix in the long-term, as well as to fuel industrial growth in the U.S. economy. According to the EIA, based on preliminary results, natural gas represented 32% of U.S. electricity generation during 2017 compared with 34% in 2016. With the recent growth of natural gas exports to Mexico, increased liquefied natural gas exports, and declining pipeline imports from Canada, the U.S. became a net exporter of gas in 2016 and is projected by the EIA to be a net exporter of gas for 2017 and 2018. CNX also expects the high level of U.S. gas exports to continue in the future. In addition, there is potential for natural gas to become a significant contributor to the transportation market.
14
The EIA expects overall demand for U.S. natural gas to be 4.3% higher in 2018 compared with 2017. Our increasing gas production will allow CNX to participate in these growing markets.
CNX gas operations are primarily located in the eastern United States. The gas market is highly fragmented and not dominated by any single producer. We believe that competition within our market is based primarily on natural gas commodity trading fundamentals and pipeline transportation availability to the various markets.
Continued demand for CNX's natural gas and the prices that CNX obtains are affected by natural gas use in the production of electricity, pipeline capacity, U.S. manufacturing and the overall strength of the economy, environmental and government regulation, technological developments, the availability and price of competing alternative fuel supplies, and national and regional supply/demand dynamics.
Other Operations
CNX provides other services, including both land and water services, to both our own operations and to others.
Non-Core Mineral Assets and Surface Properties
CNX owns significant natural gas assets that are not in our short or medium term development plans. We continually explore the monetization of these non-core assets by means of sale, lease, contribution to joint ventures, or a combination of the foregoing in order to bring the value of these assets forward for the benefit of our shareholders. We also control a significant amount of surface acreage. This surface acreage is valuable to us in the development of the gathering system for our Marcellus Shale and Utica Shale production. We also derive value from this surface control by granting rights of way or development rights to third-parties when we are able to derive appropriate value for our shareholders.
Water Division
CNX Water Assets LLC, doing business as CONVEY Water Systems LLC, is a wholly-owned subsidiary of CNX and supplies turnkey solutions for water sourcing, delivery and disposal for our natural gas operations, and supplies solutions for water sourcing as well as delivery and disposal for third-parties. In coordination with our midstream operations, CONVEY Water Systems works to develop solutions that coincide with our midstream operations to offer gas gathering and water delivery solutions in one package to third-parties.
Employee and Labor Relations
At December 31, 2017, CNX had 561 employees, none of which are subject to a collective bargaining agreement.
Industry Segments
Financial information concerning industry segments, as defined by accounting principles generally accepted in the United States, for the years ended December 31, 2017, 2016 and 2015 is included in Note 19 - Segment Information in the Notes to the Audited Consolidated Financial Statements in Item 8 of this Form 10-K and incorporated herein.
Financial Information about Geographic Areas
All of the Company's assets and operations are located in the continental United States.
15
Laws and Regulations
Overview
Our natural gas operations are subject to various types of federal, state and local laws and regulations. Regulations relating to our operations include permitting, bonding and other licensing requirements; water withdrawal and procurement for well stimulation purposes; well drilling, casing and hydraulic fracturing; stormwater management; well production; well plugging; venting or flaring of natural gas; pipeline compression and transmission of natural gas and liquids; reclamation and restoration of properties after natural gas operations are completed; handling, storage, transportation and disposal of materials used or generated by natural gas operations; the calculation, reporting and disbursement of taxes; gathering of natural gas production in certain circumstances; air quality standards; protection of wetlands; crossing of waterways; endangered plant and wildlife protection; use of public roads; and employee health and safety. Numerous governmental permits, authorizations and approvals under these laws and regulations are required for natural gas operations. Lastly, the electric power generation industry is subject to extensive regulation regarding the environmental impact of its power generation activities, which could affect demand for our natural gas.
We endeavor to conduct our natural gas operations in compliance with all applicable federal, state and local laws and regulations. However, because of extensive and comprehensive regulatory requirements against a backdrop of variable geologic and seasonal conditions, permit exceedances and violations during natural gas operations can and do occur. The possibility exists that new legislation or regulations may be adopted which would have a significant impact on our natural gas operations or our customers' ability to use our natural gas and may require us or our customers to change their operations significantly or incur substantial costs.
In July 2010, U.S. Congress enacted the Dodd-Frank Wall Street Reform and Consumer Protection Act (the Dodd-Frank Act), which established federal oversight and regulation of the over-the-counter derivative market and entities, such as the Company, that participate in that market. The Dodd-Frank Act requires the Commodities Futures Trading Commission (CFTC), the SEC and other regulatory agencies to promulgate rules and regulations implementing this legislation. As of the filing date of this Annual Report on Form 10-K, the CFTC has finalized certain regulations that impose regulatory obligations on all market participants, including the Company, while other regulations remain to be finalized or implemented. Because certain CFTC rules relevant to natural gas hedging activities have yet to be promulgated, it is not possible at this time to predict the extent of the impact of the regulations on the Company’s hedging program or regulatory compliance obligations. The Company has experienced, and expects to continue to experience, increased compliance costs in connection with changes to current market practices as participants continue to adapt to a changing regulatory environment.
Environmental Laws
CNX has established protocols for ongoing assessments to identify potential environmental exposures. These assessments evaluate compliance with laws and regulations and other industry and internal best management practices, and include evaluation of compliance by waste management facilities and other third-party service providers.
Clean Air Act and Related Regulations. The federal Clean Air Act (CAA) and corresponding state laws and regulations regulate air emissions primarily through permitting and/or emissions control requirements. This affects natural gas production and processing operations. The federal CAA and corresponding state laws and regulations regulate air emissions primarily through permitting and/or emissions control requirements. This affects natural gas production and processing operations. Various activities in our operations are subject to regulation, including pipeline compression, venting and flaring of natural gas, hydraulic fracturing and completion processes, and fugitive emissions. We obtain permits, typically from state or local authorities, to conduct these activities. Additionally, we are required to obtain pre-approval for construction or modification of certain facilities, to meet stringent air permit requirements, or to use specific equipment, technologies or best management practices to control emissions. Further, some states and the federal government have proposed that emissions from certain sources should be aggregated to provide for regulation and permitting of a single, major source. Federal and state governmental agencies continue to investigate the potential for emissions from oil and natural gas activities, and further regulation could increase our cost or restrict our ability to produce.
We are required to obtain pre-approval for construction or modification of certain facilities, to meet stringent air permit requirements, or to use specific equipment, technologies or best management practices to control emissions. On August 16, 2012, the U.S. Environmental Protection Agency (EPA) published final revisions to the New Source Performance Standards (NSPS) to regulate emissions of volatile organic compounds (VOCs) and sulfur dioxide (SO2) from various oil and gas exploration, production, processing and transportation facilities. Additionally, revisions were made to the National Emission Standards for Hazardous Air Pollutants (NESHAPS) to further regulate emissions from the oil and natural gas production sector and the transmission and storage of natural gas. Section 111 of the CAA authorized the EPA to develop technology based standards which apply to specific
16
categories of stationary sources. On June 3, 2016, the EPA finalized updates to the final New Source Performance Standards (NSPS) that created new standards for the regulation of methane and VOC emission sources. The rule includes requirements for new fugitive emission and leak detection testing and reporting requirements. Also on June 3, 2016, the EPA published the final Source Determination Rule which clarified the use of the term “adjacent” in determining Title V air permitting requirements as they apply to the oil and natural gas industry for major sources of air emissions. On August 1, 2016 these updates to the NSPS were challenged in the D.C. Circuit Court of Appeals by industry and state associations and a request for administrative reconsideration was also filed. Additionally, 15 states filed suit and asked the Court of Appeals to review the need for the changes.
The CAA requires the EPA to set National Ambient Air Quality Standards (NAAQS) for certain pollutants and the CAA identifies two types of NAAQS. Primary standards provide public health protection, including protecting the health of "sensitive" populations such as asthmatics, children, and the elderly. Secondary standards provide public welfare protection, including protection against decreased visibility and damage to animals, crops, vegetation, and buildings. On October 1, 2015, the EPA finalized the NAAQS for ozone pollution and reduced the limit to 70 parts per billion (ppb) from the previous 75 ppb standard. The final rule could have a large impact on the oil and gas industry as states would be required to update their permitting standards to meet these potentially unachievable limits. Six states have now filed a petition for review in the Court of Appeals for the D.C. Circuit.
On July 6, 2011, the EPA finalized a rule known as the Cross-State Air Pollution Rule (CSAPR). CSAPR regulates cross-border emissions of criteria air pollutants such as SO2 and NOX, as well as byproducts, fine particulate matter (PM2.5) and ozone by requiring states to limit emissions from sources that "contribute significantly" to noncompliance with air quality standards for the criteria air pollutants. If the ambient levels of criteria air pollutants are above the thresholds set by the EPA, a region is considered to be in "nonattainment" for that pollutant and the EPA applies more stringent control standards for sources of air emissions located in the region. In April 2014, the Supreme Court reversed a decision of the D.C. Circuit Court of Appeals that vacated the rule. Following remand and briefing the D.C. Circuit Court of appeals, in October 2014, granted a motion to lift a stay of the rule and allow the EPA to modify the CSAPR compliance deadline by three-years, setting the stage for issuance of the proposed rule. Implementation of CSAPR Phase 1 began in 2015, with Phase 2 scheduled to begin in 2017. On September 7, 2016, the EPA finalized an update to the CSAPR for the 2008 ozone NAAQS by issuing the final CSAPR Update. Starting in May 2017, this rule will reduce summertime (May - September) NOX emissions from power plants in 22 states in the eastern United States.
On January 8, 2014, the EPA re-proposed NSPS for CO2 for new fossil fuel fired power plants and rescinded the rules that were proposed on April 12, 2012. On September 20, 2013, the EPA issued a new proposal to control carbon emissions from new power plants. Under the Clean Power Plan (CPP) proposal, the EPA would establish separate NSPS for CO2 emissions for natural gas-fired turbines and coal-fired units. However, in April 2017, the U.S. Court of Appeals for the D.C. Circuit granted the EPA’s motion to hold a pending appeal in abeyance while the EPA undertakes a review of the proposal. The proposed “Carbon Pollution Standard for New Power Plants” replaces the earlier proposal released by the EPA in 2012. On August 3, 2015, the EPA finalized the Carbon Pollution Standards to cut carbon emissions from new, modified and reconstructed power plants, which would have become effective on October 23, 2015.
Climate Change. Climate change continues to be a legislative and regulatory focus. There are a number of proposed and final laws and regulations that limit greenhouse gas emissions, and regulations that restrict emissions could increase our costs should the requirements necessitate the installation new equipment or the purchase of emission allowances. Additional regulation could also lead to permitting delays and additional monitoring and administrative requirements, as well as to impacts on electricity generating operations.
On November 30, 2016, the EPA finalized amendments to the Petroleum and Natural Gas Systems source category (Subpart W) of the Greenhouse Gas Reporting Program (GHGRP). This final rule adds new monitoring methods for detecting leaks from oil and gas equipment in the petroleum and natural gas systems source category consistent with the leak detection methods in the NSPS. The action also adds emission factors for leaking equipment to be used in conjunction with these monitoring methods to calculate and report greenhouse gas (GHG) emissions resulting from equipment leaks. The NSPS final rule would add reporting of GHG emissions from certain gathering and boosting systems, completions and workovers of oil wells using hydraulic fracturing, and blowdowns of natural gas transmission pipelines.
Clean Water Act. The federal Clean Water Act (CWA) and corresponding state laws affect our natural gas operations by regulating discharges into surface waters. Permits requiring regular monitoring and compliance with effluent limitations and reporting requirements govern the discharge of pollutants into regulated waters. The CWA and corresponding state laws include requirements for: improvement of designated "impaired waters" (i.e., not meeting state water quality standards) through the use of effluent limitations; anti-degradation regulations which protect state designated "high quality/exceptional use" streams by restricting or prohibiting discharges; stormwater controls; and requirements to dispose of produced wastes and other oil and gas wastes at approved disposal facilities. These requirements impact the development of infrastructure, well-drilling, and hydraulic
17
fracturing operations. The CWA and similar state laws provide for civil, criminal and administrative penalties for unauthorized discharges of pollutants or reportable quantities of oil and/or other hazardous substances. The Spill Prevention, Control and Countermeasure (SPCC) requirements of the CWA apply to operations that use or produce fluids of threshold quantities and require the implementation of plans to prevent and contain spills. These requirements (or changes to current regulations) may cause CNX to incur significant additional costs that could adversely affect our operating results, financial condition and cash flows.
CNX utilizes pipelines extensively for its natural gas and water businesses. Mitigation permits from the Army Corps of Engineers (ACOE) are typically required for certain impacts these pipelines cause to streams and wetlands, including the crossing of such streams and wetlands. Any expansion of the scope of regulation of pipeline development to include previously non-jurisdictional streams, wetlands and waters, could adversely affect our operating results, financial condition and cash flows.
Endangered Species Act. The Endangered Species Act and related state regulation protect plant and animal species that are threatened or endangered. New or additional species that may be identified as requiring protection or consideration may lead to delays in permits and/or other restrictions.
Safety of Gas Transmission and Gathering Pipelines. On April 8, 2016, The U.S. Department of Transportation (DOT) Pipeline and Hazardous Materials Safety Administration (PHMSA) published in the Federal Register a Notice of Proposed Rule Making (NPRM) that would significantly modify existing regulations related to reporting, impact, design, construction, maintenance, operations and integrity management of gas transmission and gathering pipelines. The proposed rule addresses four congressional mandates and six recommendations by the National Transportation Safety Board. The proposed rule broadens the scope of safety coverage both by adding new assessment and repair criteria for gas transmission pipelines, and by expanding these protocols to include pipelines not formerly regulated by the federal standards. This means extending regulatory requirements to transmission and gathering pipelines of eight inches and greater in rural class 1 areas, which could increase time frames and cost to complete projects. It is unclear what action may be taken on this proposal in the new administration. Additionally, certain states, such as West Virginia, also maintain jurisdiction over intrastate natural gas lines.
Resource Conservation and Recovery Act. The federal Resource Conservation and Recovery Act (RCRA) and corresponding state laws and regulations affect natural gas operations by imposing requirements for the management, treatment, storage and disposal of hazardous and non-hazardous wastes, including wastes generated by natural gas operations. Facilities at which hazardous wastes have been treated, stored or disposed of are subject to corrective action orders issued by the EPA that could adversely affect our financial results, financial condition and cash flows. On December 28, 2016 the EPA entered into a consent order to resolve outstanding litigation brought by environmental and citizen groups regarding the applicability of RCRA to wastes from oil and gas development activities. The consent order requires the EPA to revise the applicability determination by March 15, 2019.
Federal Regulation of the Sale and Transportation of Natural Gas
Regulations and orders issued by the Federal Energy Regulatory Commission (FERC) impact our natural gas business to a certain degree. Although the FERC does not directly regulate our natural gas production activities, the FERC has stated that it intends for certain of its orders to foster increased competition within all phases of the natural gas industry. Additionally, the FERC has jurisdiction over the transportation of natural gas in interstate commerce, and regulates the terms, conditions of service, and rates for the interstate transportation of our natural gas production. The FERC possesses regulatory oversight over natural gas markets, including anti-market manipulation regulation. The FERC has the ability to assess civil penalties, order disgorgement of profits and recommend criminal penalties for violations of the Natural Gas Act or the FERC’s regulations and policies thereunder.
Section 1(b) of the Natural Gas Act exempts natural gas gathering facilities from regulation by the FERC. However, the distinction between federally unregulated gathering facilities and FERC-regulated transmission facilities is a fact-based determination, and the classification of facilities is the subject of ongoing litigation. We own certain natural gas pipeline facilities that we believe meet the traditional tests which the FERC has used to establish a pipeline's status as a gatherer not subject to the FERC jurisdiction.
Natural gas prices are currently unregulated, but Congress historically has been active in the area of natural gas regulation. We cannot predict whether new legislation to regulate natural gas sales might be enacted in the future or what effect, if any, any such legislation might have on our operations.
Health and Safety Laws
Occupational Safety and Health Act. Our natural gas operations are subject to regulation under the federal Occupational Safety and Health Act (OSHA) and comparable state laws in some states, all of which regulate health and safety of employees at our natural gas operations. Additionally, OSHA's hazardous communication standard, the EPA community right-to-know
18
regulations under Title III of the federal Superfund Amendment and Reauthorization Act and comparable state laws require that information be maintained about hazardous materials used or produced by our natural gas operations and that this information be provided to employees, state and local governments and the public.
Other State and Local Laws Related to Our Natural Gas Business
Regulation Affecting Gas Operations. Our natural gas operations are also subject to regulation at the state and in some cases, county, municipal and local governmental levels. Such regulation includes requiring permits for the siting and construction of well pads, impoundments, tanks and roads; pooling and unitizations; drilling of wells; bonding requirements; protection of ground water and surface water resources and protection of drinking water supplies; the method of drilling and casing wells; the surface use and restoration of well sites; gas flaring; the plugging and abandoning of wells; the disposal of fluids used in connection with operations; and natural gas operations producing coalbed methane in relation to active mining. A number of states have either enacted new laws or may be considering the adequacy of existing laws affecting gathering rates and/or services. Other state regulation of gathering facilities generally includes various safety, environmental and in some circumstances, nondiscriminatory take requirements but does not generally entail rate regulation. Thus, natural gas gathering may receive greater regulatory scrutiny of state agencies in the future. Our gathering operations could be adversely affected should they be subject in the future to increased state regulation of rates or services, although we do not believe that they would be affected by such regulation any differently than other natural gas producers or gatherers. However, these regulatory burdens may affect profitability, and we are unable to predict the future cost or impact of complying with such regulations.
Regulation of Horizontal Drilling. State regulations for horizontal well drilling and well site construction have been proposed and finalized. In September 2015, Pennsylvania published a final rulemaking on the revisions to the Environmental Protection Performance Standards at Oil and Gas Well Sites (Chapters 78 and 78a). Chapter 78 rules affecting conventional drillers were eliminated under SB279, and may be readdressed by the Pennsylvania Department of Environmental Protection in 2018. Chapter 78a rules are the subject of pending litigation, with oral argument before the Pennsylvania Supreme Court in October 2017. Ohio passed Horizontal Well Site Construction Rules which became effective in July 2015. Ohio is also in the process of reviewing and possibly adopting additional horizontal development rules. Additionally, West Virginia adopted Rules Governing Horizontal Well Development.
Ownership of Mineral Rights. CNX acquires ownership or leasehold rights to oil and gas properties prior to conducting operations on those properties. The legal requirements of such ownership or leasehold rights generally are established by state statutory or common law. As is customary in the natural gas industry, we have generally conducted only a summary review of the title to oil and gas rights that are not yet in our development plans, but which we believe we control. This summary review is conducted at the time of acquisition or as part of a review of our land records. However, our ownership of certain oil and gas rights, particularly some of the rights we acquired in 2010, as part of an acquisition, may be less developed. As we continue to conduct our standard review of land records and confirm title in anticipation of development, we expect that adjustments to our ownership position (either increases or decreases) will be required.
Prior to the commencement of development operations on natural gas and coalbed methane properties, we conduct a thorough title examination and perform curative work with respect to significant title defects. We generally will not commence operations on a property until we have cured any material title defects on such property. We are typically responsible for the cost of curing any title defects. In addition, the acquisition of the necessary rights to affect such a cure may not be feasible in some cases. Our discovering title defects which we are unable to cure may adversely impact our ability to develop those properties and we may have to reduce our estimated gas reserves including our proved undeveloped reserves. In accordance with the foregoing, we have completed title work on substantially all of our natural gas and coalbed methane properties that are currently producing, and believe that we have satisfactory title to our producing properties in accordance with standards generally accepted in the industry.
Available Information
CNX maintains a website at www.cnx.com. CNX makes available, free of charge, on this website our annual reports on Form 10-K, quarterly reports on Form 10-Q, current reports on Form 8-K and amendments to those reports filed or furnished pursuant to Section 13(a) or 15(d) of the Exchange Act, as soon as reasonably practicable after such reports are available, electronically filed with, or furnished to the SEC, and are also available at the SEC's website www.sec.gov. Apart from SEC filings, we also use our website to publish information which may be important to investors, such as presentations to analysts.
19
Executive Officers of the Registrant
Incorporated by reference into this Part I is the information set forth in Part III, Item 10 under the caption “Executive Officers of CNX” (included herein pursuant to Item 401(b) of Regulation S-K).
ITEM 1A. | Risk Factors |
Investment in our securities is subject to various risks, including risks and uncertainties inherent in our business. The following sets forth factors related to our business, operations, financial position or future financial performance or cash flows which could cause an investment in our securities to decline and result in a loss.
Prices for natural gas and natural gas liquids are volatile and can fluctuate widely based upon a number of factors beyond our control, including oversupply relative to the demand for our products, weather and the price and availability of alternative fuels. An extended decline in the prices we receive for our natural gas and natural gas liquids will adversely affect our business, operating results, financial condition and cash flows.
Our financial results are significantly affected by the prices we receive for our natural gas and natural gas liquids. Natural gas, natural gas liquids, oil and condensate prices are very volatile and can fluctuate widely based upon supply from energy producers relative to demand for these products and other factors beyond our control. The disposition in 2017 of our entire coal operations has increased our exposure to fluctuations in the price of natural gas, natural gas liquids, oil and condensate.
In particular, while demand for natural gas has recovered to pre-recession levels, the U.S. natural gas industry continues to face concerns of oversupply due to the success of Marcellus and other new shale plays. The oversupply of natural gas in 2012 resulted in domestic prices hovering around ten year lows, and drilling continued in these plays, despite these lower gas prices, to meet drilling commitments. Although gas prices recovered somewhat during 2013 and the first quarter of 2014, they again significantly declined in the latter part of 2014 and have remained at depressed levels since 2015.
Our producing properties are geographically concentrated in the Appalachian Basin, which exacerbates the impact of regional supply and demand factors on our business, including the pricing of our gas. The success of the Marcellus Shale and Utica plays has resulted in growth in natural gas production in this region, with production per day in Pennsylvania, West Virginia and Ohio more than tripling since 2011. Not all of the natural gas produced in this region can be consumed by regional demand and must therefore be exported to other regions through pipelines. This export causes gas purchased and sold locally to be priced at a discount to many other market hubs, such as the benchmark Louisiana Henry Hub price. This discount, or negative basis, to the Henry Hub price is forecasted to continue in future years. While we expect many of the planned interstate pipeline projects to reduce this discount, it could widen further if these projects to move gas out of the basin are delayed for any reason, such as permitting issues or environmental lawsuits.
An extended period of lower natural gas prices can negatively affect us in several other ways. These include reduced cash flow, which decreases funds available for capital expenditures to replace reserves or increase production. For example, the low natural gas prices continuing from 2014 through 2015, resulted in our decreasing 2016 and 2017 capital expenditures and the drilling of new shale wells. Also, our access to other sources of capital, such as equity or long-term debt markets, could be severely limited or unavailable.
Our drilling plans also include some activity in areas of shale formations that may also contain natural gas liquids, condensate and/or oil. The prices for natural gas liquids, condensate and oil are also volatile for reasons similar to those described above regarding natural gas. As a result of increasing supply, condensate and oil prices have exhibited great volatility. In addition, similar to the oversupply of natural gas, increased drilling activity by third-parties in formations containing natural gas liquids has led to a decline of over 30% since 2014 in the uplift we receive, on an Mcfe equivalent basis when excluding hedging impact, from natural gas liquids. Our results of operation may be adversely affected by a continued depressed level of, or further downward fluctuations in, natural gas liquids, condensate and oil prices.
Apart from issues with respect to the supply of products we produce, demand can fluctuate widely due to a number of matters beyond our control, including:
• | weather conditions in our markets which affect the demand for natural gas; |
• | changes in the consumption pattern of industrial consumers, electricity generators and residential users of electricity and natural gas; |
• | with respect to natural gas, the price and availability of alternative fuel sources used by electricity generators; |
20
• | technological advances affecting energy consumption; |
• | the costs, availability and capacity of transportation infrastructure; |
• | proximity and capacity of natural gas pipelines and other transportation facilities; and |
• | the impact of domestic and foreign governmental laws and regulations, including environmental and climate change regulations and delays in the receipt of, failure to receive, failure to maintain or revocation of necessary governmental permits. |
Our business depends on gathering, processing and transportation facilities and other midstream facilities owned by CNXM and others. The disruption of, capacity constraints in, or proximity to pipeline systems could limit sales of our natural gas and natural gas liquids, and any decrease in availability of third-party pipelines or other midstream facilities interconnected to third parties’ or CNXM’s gathering systems could adversely affect our operations or our investment in CNXM.
We gather, process and transport our natural gas to market by utilizing pipelines and facilities owned by others, including CNXM. If pipeline or facility capacity is limited, or if pipeline or facility capacity is unexpectedly disrupted for any reason, our natural gas sales and/or sales of natural gas liquids could be reduced, which could negatively affect our profitability. If we cannot access processing pipeline transportation facilities, we may have to reduce our production of natural gas. If our sales of natural gas or natural gas liquids are reduced because of transportation or processing constraints, our revenues will be reduced and our unit costs will also increase. If pipeline quality standards change, we might be required to install additional processing equipment which could increase our costs. The pipeline could also curtail our flows until the natural gas delivered to their pipeline is in compliance. Any reduction in our production of natural gas or increase in our costs could materially adversely affect our business, financial condition, results of operations and cash flows.
Further, a significant portion of our natural gas is sold on or through a single pipeline, Texas Eastern Transmission, which could experience capacity issues, operational disruptions and unexpected downtime. Any reduction in capacity on the Texas Eastern pipeline could result in curtailments and reduce our production of natural gas. A reduction in capacity could also reduce the demand for our natural gas, which would reduce the price we receive for our production.
Additionally, we have various third-party firm transportation, natural gas processing, gathering and other agreements in place, many of which have minimum volume delivery commitments. We are obligated to pay fees on minimum volumes to our service providers regardless of actual volume throughput. Reductions in our drilling program may result in insufficient production to utilize our full firm transportation and processing capacity. If we have insufficient production to meet the minimum volumes, our cash flow from operations will be reduced, which may require us to reduce or delay our planned investments and capital expenditures or seek alternative means of financing, all of which may have a material adverse effect our business, financial condition, results of operations and cash flows.
Our investment in midstream infrastructure through CNXM is intended to connect our wells to other existing gathering and transmission pipelines. Our infrastructure development and maintenance programs, through CNXM, can involve significant risks, including those relating to timing, cost overruns and operational efficiency, which risks can be further affected by other issues. For example, approximately 41% of our 2017 production flowed through CNXM’s Majorsville and McQuay Stations. An operational issue at either of those stations would materially impact CNX’s production, cash flow and results of operation. CNXM’s assets connect to other pipelines or facilities owned and operated by unaffiliated third parties. The continuing operation of third-party pipelines, processing and fractionation plants, compressor stations and other midstream facilities is not within our or CNXM’s control. These third-party pipelines, processing and fractionation plants, compressor stations and other midstream facilities may become unavailable because of testing, turnarounds, line repair, maintenance, changes to operating conditions, delivery or receipt parameters, unavailability of firm transportation, lack of operating capacity, force majeure events, regulatory requirements and curtailments of receipt or deliveries due to insufficient capacity or because of damage from severe weather conditions or other operational issues.
We face uncertainties in estimating our economically recoverable natural gas reserves, and inaccuracies in our estimates could result in lower than expected revenues, higher than expected costs and decreased profitability.
Natural gas reserves are economically recoverable when the price at which they are expected to be sold exceeds their expected cost of production and sales. Natural gas reserves require subjective estimates of underground accumulations of natural gas assumptions concerning natural gas prices, production levels, reserve estimates and operating and development costs. As a result, estimated quantities of proved natural gas reserves and projections of future production rates and the timing of development expenditures may be incorrect. For example, a significant amount of our proved undeveloped reserves extensions and discoveries during the last three years were due to the addition of wells on our Marcellus Shale acreage more than one offset location away from existing production with reliable technology, which may be more susceptible to positive and negative changes in reserve estimates than our proved developed reserves. Over time, material changes to reserve estimates may be made, taking into account the results of actual drilling, testing and production. Also, we make certain assumptions regarding natural gas prices, production
21
levels, and operating and development costs that may prove incorrect. Any significant variance from these assumptions to actual figures could greatly affect our estimates of our natural gas reserves, the economically recoverable quantities of natural gas attributable to any particular group of properties, the classifications of natural gas reserves based on risk of recovery and estimates of the future net cash flows. Numerous changes over time to the assumptions on which our reserve estimates are based, as described above, often result in the actual quantities of natural gas we ultimately recover being different from reserve estimates. The present value of future net cash flows from our proved reserves is not necessarily the same as the current market value of our estimated natural gas reserves. We base the estimated discounted future net cash flows from our proved natural gas reserves on historical average prices and costs. However, actual future net cash flows from our natural gas properties also will be affected by factors such as:
• | geological conditions; |
• | changes in governmental regulations and taxation; |
• | the amount and timing of actual production; |
• | future prices and our hedging position; |
• | future operating costs; and |
• | capital costs of drilling, completion and gathering assets. |
The timing of both our production and our incurrence of expenses in connection with the development and production of natural gas properties will affect the timing of actual future net cash flows from proved reserves and thus their actual present value. In addition, the 10% discount factor we use when calculating discounted future net cash flows may not be the most appropriate discount factor based on interest rates in effect from time to time and risks associated with us or the oil and natural gas industry in general. If natural gas prices decline by $0.10 per Mcf, then the pre-tax present value using a 10% discount rate of our proved natural gas reserves as of December 31, 2017 would decrease from $4.1 billion to $3.9 billion.
Each of the factors which impacts reserve estimation may in fact vary considerably from the assumptions used in estimating the reserves. For these reasons, estimates of natural gas reserves may vary substantially. Actual production, revenues and expenditures with respect to our natural gas reserves will likely vary from estimates, and these variances may be material. As a result, our estimates may not accurately reflect our actual natural gas reserves.
Drilling natural gas wells is a high-risk activity.
Our growth is materially dependent upon the success of our drilling program. Drilling for natural gas and oil involves numerous risks, including the risk that an encountered well does not produce in sufficient quantities to make the well economically viable. The cost of drilling, completing and operating wells is substantial and uncertain, and drilling operations may be curtailed, delayed or canceled as a result of a variety of factors beyond our control, including those discussed in “Our operations are subject to operating risks...” set forth below.
Our future drilling activities may not be successful, and if they are unsuccessful, such failure will have an adverse effect on our future results of operations and financial condition. Our overall drilling success rate or our drilling success rate within a particular geographic area may decline. We may be unable to drill identified or budgeted wells within our expected time frame, or at all. We may be unable to drill a particular well because, in some cases, we identify a drilling location before we have leased all of the interests required to drill the well in that location. Similarly, our drilling schedule may vary from our capital budget. The final determination with respect to the drilling of any scheduled or budgeted wells will be dependent on a number of factors, including:
• | the results of delineation efforts and the acquisition, review and analysis of seismic data; |
• | the availability of sufficient capital resources to us and any other participants in a well for the drilling of the well; |
• | whether we are able to acquire on a timely basis all of the leasehold interests and obtain all of the permits required to drill the wells; |
• | economic and industry conditions at the time of drilling, including prevailing and anticipated prices for natural gas and oil and the availability of drilling rigs and crews; and |
our financial resources and results.
Our business strategy focuses on horizontal drilling and production in the Marcellus and Utica Shale plays in the Appalachian Basin. Drilling horizontal wells is technologically difficult and involves risks relating to our ability to fracture stimulate the planned number of stages and to successfully run casing the length of the well bore and involves a higher risk of failure. Additionally, drilling a horizontal well involves higher costs, which results in the risks of our drilling program being spread over a smaller number of wells, and that, in order to be economic, each horizontal well will need to produce at a higher level in order
22
to cover the higher drilling costs. Similarly, the average lateral length of the horizontal wells we drill has generally been increasing. Longer-lateral wells are typically more expensive and require more time for preparation and permitting. In addition, we use multi-well pads instead of single-well sites. The use of multi-well pad drilling increases some operational risks because problems affecting the pad or a single well could adversely affect production from all of the wells on the pad. Pad drilling can also make our overall production, and therefore our revenue and cash flows, more volatile, because production from multiple wells on a pad will typically commence simultaneously. While we believe that we will be better served by drilling horizontal wells using multi-well pads, the risk component involved in such drilling will be increased in some respects, with the result that we might find it more difficult to achieve economic success in our drilling program.
Our identified drilling locations are scheduled out over multiple years, making them susceptible to uncertainties that could materially alter the occurrence or timing of their drilling.
Our management team has specifically identified and scheduled certain drilling locations as an estimation of our future multi-year drilling activities on our existing acreage. These drilling locations represent a significant part of our growth strategy. Our ability to drill and develop these locations depends on a number of uncertainties, including natural gas and oil prices, the availability and cost of capital, drilling and production costs, the acquisition on acceptable terms of any leasehold interests we do not control necessary to complete the drilling unit, availability of drilling services and equipment, drilling results, lease expirations, transportation constraints, regulatory and zoning approvals and other factors. Because of these uncertain factors, we do not know if the numerous drilling locations we have identified will ever be drilled. We will require significant additional capital over a prolonged period in order to pursue the development of these locations, and we may not be able to raise or generate the capital required to do so. Any drilling activities we are able to conduct on these locations may not be successful or result in our ability to add additional proved reserves or may result in a downward revision of our estimated proved reserves, which could have a materially adverse effect on our business and results of operations.
Regulation of greenhouse gas emissions may increase our operating costs and reduce the value of our natural gas assets and such regulation, as well as uncertainty concerning such regulation, could adversely impact the market for natural gas, as well as for our securities.
While climate change legislation in the U.S. is unlikely in the next several years, the issue of global climate change continues to attract considerable public and scientific attention with underlying concern about the impacts of human activity, especially the emissions of greenhouse gases (GHGs) such as carbon dioxide and methane.
The EPA, under the Climate Action Plan, has elected to regulate GHGs under the Clean Air Act (CAA) to limit emissions of carbon dioxide (CO2) from natural gas-fired power plants. On September 20, 2013, the EPA re-proposed New Source Performance Standards (NSPS) for CO2 from new power plants and on June 2, 2014, the EPA re-proposed NSPS for CO2 from existing and modified/reconstructed power plants, which rescinded the rules that were originally proposed in 2012. On August 3, 2015, the EPA finalized the Carbon Pollution Standards to cut carbon emissions from new, modified and reconstructed power plants, which became effective on October 23, 2015. In another proposed rulemaking related to CO2 emissions, on June 2, 2014, the EPA proposed the Clean Power Plan Rule to cut carbon emissions from existing power plants. Under this proposed rule, the EPA would create emission guidelines for states to follow in developing plans to address greenhouse gas emissions from existing fossil fuel-fired electric generating units. Specifically, the EPA is proposing state-specific rate-based goals for CO2 emissions from the power sector, as well as guidelines for states to follow in developing plans to achieve the state-specific goals. On August 3, 2015, the EPA finalized the Clean Power Plan Rule to cut carbon pollution from existing power plants, which became effective on December 22, 2015. Numerous petitions challenging the Clean Power Plan Rule have been consolidated into one case, West Virginia v. EPA. While the litigation is still ongoing at the circuit court level, a mid-litigation application to the Supreme Court resulted in a stay of the Clean Power Plan Rule. On September 27, 2016, an en banc panel of the U.S. Court of Appeals for the D.C. Circuit heard oral arguments in the case. In April 2017, the D.C. Circuit granted the EPA’s motion to hold the case in abeyance while the EPA undertakes its review of the regulations.
The EPA has adopted regulations under existing provisions of the federal Clean Air Act that establish Prevention of Significant Deterioration, or PSD, construction and Title V operating permits for large stationary sources. Facilities requiring PSD permits may also be required to meet “best available control technology” (BACT) standards. Rulemaking related to GHG could alter or delay our ability to obtain new and/or modified source permits.
As part of the Obama administration’s initiative to reduce methane emissions from the oil and natural gas industry, the EPA adopted rules to control volatile organic compound emissions from certain oil and gas equipment and operations. In June 2017, the EPA issued a 90-day stay of certain requirements under the methane rule. The stay was vacated in July 2017 by the U.S. Court of Appeals for the D.C. Circuit. In the interim, in July 2017 the EPA issued a proposed rule that would stay the methane rule for two years, but this rule is not yet final, is subject to public notice and comment and may be subject to legal challenges.
23
Additionally, applicability of CNX and CNXM facilities under the CAA, as well as state sponsored permitting programs are subject to regulatory uncertainty and therefore present risk, including hitting production objectives, and cost for controls and compliance. Some states in which we operate are contemplating measures to reduce emissions of GHGs, primarily through the planned development of GHG emission inventories and potential cap-and-trade programs. Most of these types programs require major source of emissions or major producers of fuels to acquire and surrender emission allowances, with the number of allowances available being reduced each year until a target goal is achieved. The cost of these allowances could increase over time. While new laws and regulations that are aimed at reducing GHG emissions will increase demand for natural gas, they may also result in increased costs for permitting, equipping, monitoring and reporting GHGs.
Environmental regulations introduce uncertainty that could adversely impact the market for natural gas with potential short and long-term liabilities.
We and CNXM are subject to various stringent federal, state and local laws and regulations relating to the discharge of materials into, and protection of, the environment. Numerous governmental authorities, such as the EPA and analogous state agencies, have the power to enforce compliance with these laws and regulations and the permits issued under them, oftentimes requiring difficult and costly response actions. These laws and regulations may impose numerous obligations that are applicable to our, CNXM’s and our respective customers' operations. Failure to comply with these laws, regulations and permits may result in joint and several or strict liability or the assessment of administrative, civil and criminal penalties, the imposition of remedial obligations, and/or the issuance of injunctions limiting or preventing some or all of our operations. Private parties, including the owners of the properties through which CNXM’s gathering systems pass, may also have the right to pursue legal actions to enforce compliance, as well as to seek damages for non-compliance, with environmental laws and regulations or for personal injury or property damage. We may not be able to recover all or any of these costs from insurance. There is no assurance that changes in or additions to public policy regarding the protection of the environment will not have a significant impact on our operations and profitability.
Our operations, and those of CNXM, also pose risks of environmental liability due to leakage, migration, releases or spills from our operations to surface or subsurface soils, surface water or groundwater. Certain environmental laws impose strict as well as joint and several liability for costs required to investigate, remediate, and restore sites where hazardous substances, hydrocarbons or solid wastes have been stored or released. We may also be subject to fines and penalties for such releases. We may be required to remediate contaminated properties currently or formerly operated by us regardless of whether such contamination resulted from the conduct of others or from consequences of our own actions that were in compliance with all applicable laws at the time those actions were taken. In addition, claims for damages to persons or property, including natural resources, may result from the environmental, health and safety impacts of our operations.
The Federal Endangered Species Act (ESA) and similar state laws protect species endangered or threatened with extinction. Protection of endangered and threatened species may cause us to modify gas well pad siting or pipeline right of ways, or develop and implement species-specific protection and enhancement plans to avoid or minimize impacts to endangered species or their habitats. Further consideration for listing species within our operating region is expected, and CNX considers this uncertainty, as well as the cost to comply with stringent mitigation requirements a risk to cost and operational timing.
CNX utilizes pipelines extensively for its natural gas and water businesses. Stream encroachment and crossing permits from the Army Corps of Engineers (ACOE) are often required for certain impacts these pipelines cause to streams and wetlands. On April 21, 2014 the EPA published a proposed rule called “Definition of ‘Waters of the United States’ (WoUS) Under the Clean Water Act.” The proposal would expand the scope of the CWA to include previously non-jurisdictional streams, wetlands, and waters, making these areas jurisdictional inter-coastal waters of the U.S. In February 2015 the EPA and ACOE issued a memorandum of understanding to withdraw the WoUS Interpretive Rule. The EPA published the latest version of the WoUS rule (the Clean Water Rule) on June 29, 2015, which was to become effective on August 28, 2015. However, on August 27, 2015, the District Court of North Dakota blocked implementation of the rule in 13 states. On October 9, 2015, the Court of Appeals for the Sixth Circuit blocked implementation of the rule nationwide. The Trump administration has proposed replacing the October 2015 definition with the prior definition. Additionally, in January 2017, the U.S. Supreme Court agreed to decide whether the federal court of appeals or federal district courts have jurisdiction. Oral argument was heard in October 2017, and a decision is expected in calendar year 2018. If the EPA moves forward with implementation of the 2015 rule, or if states make any similar changes to their regulatory programs, this could lead to additional mitigation costs for us and CNXM, and severely limit our and CNXM’s operations.
Other regulations applicable to the natural gas industry are under constant review for amendment or expansion at both the federal and state levels. Any future changes may increase the costs of producing natural gas and other hydrocarbons, which would adversely impact our cash flows and results of operations. For example, hydraulic fracturing is an important and common
24
practice that is used to stimulate production of hydrocarbons from tight unconventional shale formations. The process involves the injection of water, sand and chemicals under pressure into formations to fracture the surrounding rock and stimulate production. The process is typically regulated by state oil and gas agencies. The disposal of produced water and other wastes in underground injection disposal wells is regulated by the EPA under the federal Safe Drinking Water Act or by various states in which we conduct operations under counterpart state laws and regulations. The imposition of new environmental initiatives and regulations could include restrictions on our ability to conduct hydraulic fracturing operations or to dispose of waste resulting from such operations.
Our operations are subject to operating risks, including our reliance upon third-party contractors, which could increase our operating expenses and decrease our production levels which could adversely affect our results of operations. Our operations are also subject to hazards and any losses or liabilities we suffer from hazards, which occur in our operations may not be fully covered by our insurance policies.
Our exploration for and production of natural gas and CNXM’s gathering, compression and transportation operations involve numerous operating risks. The cost of drilling, completing and operating our shale gas wells, shallow oil and gas wells and coalbed methane (CBM) wells is often uncertain, and a number of factors can delay or prevent drilling operations, decrease production and/or increase the cost of our natural gas operations at particular sites for varying lengths of time thereby adversely affecting our operating results. The operating risks that may have a significant impact on our natural gas operations include:
• | unexpected drilling conditions; |
• | title problems; |
• | pressure or irregularities in geologic formations; |
• | equipment failures or repairs; |
• | fires, ruptures, landslides, mine subsidence, explosions or other accidents; |
• | adverse weather conditions; |
• | reductions in natural gas prices; |
• | pressure or irregularities in formations; |
• | security breaches or terroristic acts; |
• | damage to pipelines, compressor stations, pump stations, related equipment and surrounding properties caused by design, installation, construction materials or operational flaws, natural disasters, acts of terrorism and acts of third parties; |
• | lack of adequate capacity for treatment or disposal of waste water generated in drilling, completion and production operations; |
• | environmental conditions, including contamination from surface spillage of fluids used in well drilling, completion or operation including fracturing fluids used in hydraulic fracturing of wells, leaks of natural gas or condensate or losses of natural gas or condensate as a result of the malfunction of, or other disruptions associated with, equipment or facilities or other contamination of groundwater or the environment resulting from our use of such fluids; |
• | delays in the issuance of permits at the state or local level and the resolution of regulatory concerns; and |
• | lack of availability or high cost of drilling rigs, other field services, personnel and equipment. |
The realization of any of these risks could adversely affect our ability to conduct our operations, materially increase our costs, or result in substantial loss to us as a result of claims for:
• | personal injury or loss of life; |
• | damage to and destruction of property, natural resources and equipment, including our properties and our natural gas production or transportation facilities; |
• | pollution and other environmental damage to our properties or the properties of others; |
• | potential legal liability and monetary losses; |
• | damage to our reputation within the industry or with customers; |
• | regulatory investigations and penalties; |
• | suspension of our operations; and |
• | repair and remediation costs. |
The occurrence of any of these events in our gas operations which prevents delivery of natural gas to a customer and which is not excusable as a force majeure event under our supply agreement, could result in economic penalties, suspension or cancellation of shipments or ultimately termination of the supply agreement.
Although we and CNXM maintain insurance for a number of risks and hazards, we may not be insured or fully insured against the losses or liabilities that could arise from a significant accident in our operations. We may elect not to obtain insurance
25
for any or all of these risks if we believe that the cost of available insurance is excessive relative to the risks presented. In addition, pollution and environmental risks generally are not fully insurable. The occurrence of an event that is not fully covered by insurance could have a material adverse effect on our business, financial condition, results of operations and cash flows.
We attempt to mitigate the risks involved with increased natural gas production activity by entering into “take or pay” contracts with well service providers which commit them to provide field services to us at specified levels and commit us to pay for field services at specified levels even if we do not use those services. However, these types of contracts expose us to economic risk during a downturn in demand or during periods of oversupply. For example, in 2017 due to the oversupply of gas in our markets, we made payments under these types of contracts of approximately $40 million for field services that we did not use. Having to pay for services we do not use decreases our cash flow and increases our costs.
We may not be able to obtain required personnel, services, equipment, parts and raw materials in a timely manner, in sufficient quantities or at reasonable costs to support our operations.
We rely on a supply of third-party contractors to provide key services and equipment for our operations. We contract with third parties for well services, related equipment, and qualified experienced field personnel to drill wells, construct pipelines and conduct field operations. We also utilize third-party contractors to provide land acquisition and related services to support our land operational needs. The demand for these services, this equipment and for qualified and experienced field personnel to drill wells, construct pipelines and conduct field operations, geologists, geophysicists, engineers, and other professionals in the oil and natural gas industry can fluctuate significantly, often in correlation with natural gas and oil prices, causing periodic shortages. Weather may also play a role with respect to the relative availability of certain materials. Historically, there have been shortages of drilling and workover rigs, pipe, compressors and other equipment as demand for rigs and equipment has increased along with the number of wells being drilled. The costs and delivery times of equipment and supplies are substantially greater in periods of peak demand, including increased demand for plays outside of our area of geographic focus. Accordingly, we cannot assure that we will be able to obtain necessary services, drilling equipment and supplies in a timely manner or on satisfactory terms, and we may experience shortages of, or increases in the costs of, drilling equipment, crews and associated supplies, equipment and field services in the future.
Any of the above shortages may lead to escalating prices for drilling equipment, land services, crews and associated supplies, equipment and services. Shortages may lead to poor service and inefficient drilling operations and increase the possibility of accidents due to the hiring of inexperienced personnel and overuse of equipment by contractors. Additionally, a decrease in the availability of these services, equipment and personnel could lead to a decrease in our natural gas production, increase our costs of natural gas production, and decrease our anticipated profitability. Such shortages could delay or cause us to incur significant expenditures that are not provided for in our capital budget, which events could materially and adversely impact our business, financial condition, results of operations, or cash flows.
If natural gas prices remain depressed or drilling efforts are unsuccessful, we may be required to record writedowns of our proved natural gas properties.
Lower natural gas prices or wells that produce less than expected quantities of natural gas may reduce the amount of natural gas that we can produce economically. This may result in our having to make substantial downward adjustments to our estimated proved reserves. If this occurs, or if our estimates of development costs increase, production data factors change or our exploration results deteriorate, accounting rules may require us to write down, as a non-cash charge to earnings, the carrying value of our natural gas properties. We are required to perform impairment tests on our assets whenever events or changes in circumstances lead to a reduction of the estimated useful life or estimated future cash flows that would indicate that the carrying amount may not be recoverable or whenever management's plans change with respect to those assets. For example, in the second quarter of 2015, we had an impairment charge of approximately $829 million for certain of our natural gas assets, primarily shallow oil and gas assets. We may incur impairment charges in the future, which could have an adverse effect on our results of operations in the period taken.
Competition within the natural gas industry may adversely affect our ability to sell our products and midstream services. Increased competition or a loss of our competitive position could adversely affect our sales of, or our prices for, our products, which could impair our profitability.
The natural gas and midstream industries are intensely competitive with companies from various regions of the United States. Many of the companies with which we and CNXM compete are larger and have greater financial, technological, human and other resources. If we are unable to compete, our company, our operating results and financial position may be adversely affected. In addition, larger companies may be able to pay more to acquire new natural gas properties for future exploration, limiting our ability to replace the natural gas we produce or to grow our production. The highly competitive environment in which
26
we operate may negatively impact our ability to acquire additional properties at prices or upon terms we view as favorable. The competitive environment can also make it more challenging to discover new natural gas resources, evaluate and select suitable properties and to consummate these transactions. Any reduction in our ability to compete in current or future natural gas markets could have a material adverse effect on our business, financial condition, results of operations and cash flows.
Additionally, CNXM’s ability to increase throughput on its midstream systems and any related revenue from third-parties is subject to capacity availability on their existing systems, its ability to expand its existing systems, contractual limitations to its existing customers and competition from third parties, primarily operators of other natural gas gathering systems. The fact that a substantial majority of the capacity of CNXM’s midstream systems will be necessary to service the production of CNX and one third-party customer and we and that third-party will receive priority of service for the provision of CNXM midstream services over other third-parties, may result in CNXM not having the capacity to provide services to other third-party customers. In addition, potential third-party customers who are significant producers of natural gas and condensate may develop their own midstream systems in lieu of using CNXM’s systems. All of these competitive pressures could have a material adverse effect on CNXM’s business, results of operations, financial condition, cash flows and ability to make cash distributions and therefore, could have a material adverse effect on our investment in CNXM.
Deterioration in the economic conditions in any of the industries in which our customers operate, a domestic or worldwide financial downturn, or negative credit market conditions may have a materially adverse effect on our liquidity, results of operations, business and financial condition that we cannot predict.
Economic conditions in a number of industries in which our customers operate, such as electric power generation, have experienced substantial deterioration in and the past, resulting in reduced demand for natural gas. In addition, liquidity is essential to our business and developing our assets. Renewed or continued weakness in the economic conditions of any of the industries we serve or that are served by our customers could adversely affect our business, financial condition, results of operation and liquidity in a number of ways. For example:
• | demand for natural gas and electricity in the United States is impacted by industrial production, which if weakened would negatively impact the revenues, margins and profitability of our natural gas business; |
• | the tightening of credit or lack of credit availability to our customers could adversely affect our ability to collect our trade receivables; |
• | our ability to access the capital markets may be restricted at a time when we would like, or need, to raise capital for our business including for exploration and/or development of our natural gas reserves; and |
• | a decline in our creditworthiness may require us to post letters of credit, cash collateral, or surety bonds to secure certain obligations, all of which would have an adverse effect on our liquidity. |
Our hedging activities may prevent us from benefiting from price increases and may expose us to other risks.
To manage our exposure to fluctuations in the price of natural gas, we enter into hedging arrangements with respect to a portion of our expected production. As of January 15, 2018, we expect these transactions will represent approximately 388.6 Bcf of our estimated 2018 production at an average price of $2.77 per Mcf, 273.0 Bcf of our estimated 2019 production at an average price of $2.74 per Mcf, 198.3 Bcf of our estimated 2020 production at an average price of $2.78 per Mcf, approximately 166.5 Bcf of our estimated 2021 production at an average price of $2.62 per Mcf, and approximately 153.4 Bcf of our estimated 2022 production at an average price of $2.83 per Mcf. To the extent that we engage in hedging activities, we may be prevented from realizing the near-term benefits of price increases above the levels of the hedges. If we choose not to engage in, or reduce our use of hedging arrangements in the future, we may be more adversely affected by changes in natural gas prices than our competitors who engage in hedging arrangements to a greater extent than we do.
In addition, such transactions may expose us to the risk of financial loss in certain circumstances, including instances in which:
• | our production is less than expected; |
• | the counterparties to our contracts fail to perform the contracts; |
• | the creditworthiness of our counterparties or their guarantors is substantially impaired; and |
• | counterparties have credit limits that may constrain our ability to hedge additional volumes. |
Our ability to collect payments from our customers could be impaired if their creditworthiness declines or if they fail to honor their contracts with us.
Our ability to receive payment for natural gas sold and delivered depends on the continued creditworthiness of our customers. Many utilities have sold their power plants to non-regulated affiliates or third-parties that may be less creditworthy,
27
thereby increasing the risk we bear with respect to potential payment default. These new power plant owners may have credit ratings that are below investment grade. If the creditworthiness of our customers or their ability to pay declines significantly, our business could be adversely affected. Our inability to collect payment from counterparties to our sales contracts may have a materially adverse effect on our business, financial condition, results of operations and cash flows.
Existing and future government laws, regulations and other legal requirements that govern our business may increase our costs of doing business and may restrict our operations.
There are numerous governmental regulations applicable to the natural gas industry that are not directly related to environmental regulation, many of which are under constant review for amendment or expansion at the federal and state level. Any future changes may affect, among other things, the pricing or marketing of natural gas production.
Currently, CNXM’s gathering operations are exempt from regulation by the Federal Energy Regulatory Commission (FERC) under the Natural Gas Act (NGA). Although FERC has not made any formal determinations with respect to any of CNXM’s facilities considered to be gathering facilities, CNXM believes that the natural gas pipelines in its gathering systems meet the traditional tests FERC has used to establish that a natural gas pipeline is a gathering pipeline not subject to FERC jurisdiction. However, this this issue has been the subject of substantial litigation, and if FERC were to consider the status of an individual facility and determine that the facility or services provided by it are not exempt from FERC regulation under the NGA, the rates for, and terms and conditions of, services provided by such facility would become subject to regulation by FERC. Such regulation could decrease revenue, increase operating costs, and, depending upon the facility in question, could adversely affect results of operations and cash flows for CNXM.
Additionally, some states have begun to adopt more stringent regulation and oversight of natural gas gathering lines than is currently required by federal standards. Pennsylvania, under Act 127, authorized the Public Utility Commission (PUC) oversight of Class I gathering lines, as well as requiring standards and fees associated with Class II and Class III pipelines. The state of Ohio also moved to regulate natural gas gathering lines in a similar manner pursuant to Ohio Senate Bill 315 (SB315). SB315 expanded the Ohio PUC's authority over rural natural gas gathering lines. These changes in interpretation and regulation affect our midstream activities, requiring changes in reporting, as well as increased costs.
We may incur significant costs and liabilities as a result of pipeline and related facility integrity management program testing and any related pipeline repair or preventative or remedial measures.
PHMSA has adopted regulations requiring pipeline operators to develop integrity management programs for transportation pipelines and related facilities located where a leak or rupture could do the most harm, i.e., in “high consequence areas.” The regulations require operators to:
• | perform ongoing assessments of pipeline and related facility integrity; |
• | identify and characterize applicable threats to pipeline segments that could impact a high consequence area; |
• | improve data collection, integration and analysis; |
• | repair and remediate the pipeline as necessary; and |
• | implement preventive and mitigating actions. |
The 2011 Pipeline Safety Act, among other things, increased the maximum civil penalty for pipeline safety violations and directed the Secretary of Transportation to promulgate rules or standards relating to expanded integrity management requirements, automatic or remote-controlled valve use, excess flow valve use, leak detection system installation, and testing to confirm the material strength of pipe operating above 30% of specified minimum yield strength in high consequence areas. In 2017, PHMSA adopted new rules increasing the maximum administrative civil penalties for violation of the pipeline safety laws and regulations to $209,002 per violation per day, with a maximum of $2,909,022 for a related series of violations. Should our or CNXM's operations fail to comply with PHMSA or comparable state regulations, we could be subject to substantial penalties and fines. PHMSA has also published notices and advanced notices of proposed rulemaking to solicit comments on the need for changes to its safety regulations, including whether to extend the integrity management program requirements to additional types of facilities, such as gathering pipelines and related facilities. In January 2017, in the final week of the Obama Administration, PHMSA released a pre-publication copy of its final hazardous liquid pipeline safety regulations that would significantly extend the integrity management requirements to previously exempt pipelines and would impose additional obligations on hazardous liquid pipeline operators that are already subject to the integrity management requirements, including periodic integrity assessments and leak detection for pipelines outside of high consequence areas, inspections of pipelines after extreme weather events, expanded reporting, and more stringent integrity management repair and data collection requirements. Due to the change in Presidential administrations, PHMSA’s final hazardous liquid pipeline safety rule was never published in the Federal Register and has not yet taken effect. PHMSA is expected to finalize its hazardous liquid pipeline safety rule this year. PHMSA’s proposed rule would
28
also require annual reporting of safety-related conditions and incident reports for all hazardous liquid gathering lines and gravity lines, including pipelines that are currently exempt from PHMSA regulations. PHMSA issued a separate regulatory proposal in July 2015 that would impose pipeline incident prevention and response measures on natural gas and hazardous liquid pipeline operators. Additionally, in April 2016, PHMSA published in the Federal Register a Notice of Proposed Rule Making (“NPRM”) that would significantly modify existing regulations related to reporting, impact, design, construction, maintenance, operations and integrity management of gas transmission and gathering pipelines. The proposed rule addresses four congressional mandates and six recommendations by the National Transportation Safety Board to broaden the scope of safety coverage by adding new assessment and repair criteria for gas transmission pipelines, and by expanding these protocols to include pipelines not formerly regulated by the federal standards. This includes extending regulatory requirements to transmission and gathering pipelines of eight inches and greater in rural Class I areas. Compliance with the rule, as proposed, may prove challenging and costly for operators of older pipelines due to the difficulty of locating historic records. As proposed, compliance with the rule could have a material adverse effect on our or CNXM's operations. However, the ultimate impact of the rule on the us and CNXM remains uncertain until the rulemaking is finalized. PHMSA is expected to finalize its natural gas pipeline safety rule this year. The adoption of regulations that apply more comprehensive or stringent safety standards could require us to install new or modified safety controls, pursue new capital projects, or conduct maintenance programs on an accelerated basis, all of which could require us to incur increased operational costs that could be significant. While we cannot predict the outcome of legislative or regulatory initiatives, such legislative and regulatory changes could have a material effect on our cash flow.
Our shale gas drilling and production operations require both adequate sources of water to use in the fracturing process, as well as the ability to dispose of or recycle the water after hydraulic fracturing. Our CBM gas drilling and production operations also require the removal and disposal of water from the coal seams from which we produce gas. If we cannot find adequate sources of water for our use or we are unable to dispose of or recycle the water at a reasonable cost and within applicable environmental rules, our ability to produce natural gas economically and in commercial quantities could be impaired.
As part of our drilling and production in shale formations, we use hydraulic fracturing processes. These processes require access to adequate sources of water, which may not be available in proximity to our operations or at certain times of the year. To ensure that we have adequate water available for our operations, we may be required to invest substantial amounts of capital in water pipelines which are used for relatively short periods of time. Alternatively, we may be required to truck water, and we may not be able to contract for sufficient water hauling trucks to meet our needs.
Further, we must remove the portion of the water that flows back to the well bore, as well as drilling fluids and other wastes associated with the exploration, development or production of natural gas. This water can be either disposed of or recycled for use in other hydraulic fracturing operations. In the event we are forced to dispose of water rather than recycle water, our costs may increase. In addition, in our CBM drilling and production, coal seams frequently contain water that must be removed and disposed of in order for the natural gas to detach from the coal and flow to the well bore.
Our inability to obtain sufficient amounts of water with respect to our shale operations, or the inability to dispose of or recycle water and other wastes used in our shale and our CBM operations, could increase our costs and delay our operations, which will adversely impact our cash flow and results of operations.
CNX and its subsidiaries are subject to various legal proceedings, which may have an adverse effect on our business.
We are party to a number of legal proceedings in the normal course of business activities. Defending these actions, especially purported class actions, can be costly, and can distract management. For example, we are a defendant in three pending purported class action lawsuits dealing with claimants’ alleged entitlements to, and accounting for, natural gas royalties. There is also the possibility that we may become involved in future suits, including, for example, those being brought by coastal communities against oil, coal and other fossil fuel producers relating to climate change, which are beginning to gain prevalence in the courts. There is the potential that the costs of defending litigation in an individual matter or the aggregation of many matters could have an adverse effect on our cash flows, results of operations or financial position. See Note 18- Commitments and Contingent Liabilities in the Notes to the Audited Consolidated Financial Statements in Item 8 of this Form 10-K for further discussion of pending legal proceedings.
We do not control the timing of divestitures that we plan to engage in and they may not provide anticipated benefits. Additionally, we may be unable to acquire additional properties in the future and any acquired properties may not provide the anticipated benefits.
Our business and financing plans include divesting certain assets over time. However, we do not control the timing of divestitures and delays in completing divestitures may reduce the benefits we may receive from them, such as elimination of management distraction by selling non-core assets and the receipt of cash proceeds that contribute to our liquidity. Additionally, if assets are held jointly with another party, we may not be permitted to dispose of these assets without the consent of our joint
29
venture partner. Also, there can be no assurance that the assets we divest will produce anticipated proceeds. In addition, the terms of divestitures may cause a substantial portion of the benefits we anticipate receiving from them to be subject to future matters that we do not control.
In the future we may make acquisitions of assets or businesses that complement or expand our current business. No assurance can be given that we will be able to identify suitable acquisition opportunities, negotiate acceptable terms, obtain financing for acquisitions on acceptable terms or successfully acquire the identified targets. The success of any completed acquisition will depend on our ability to effectively integrate the acquired business into our existing operations. The process of integrating acquired businesses or assets may involve unforeseen difficulties and may require a disproportionate amount of our managerial and financial resources. Our failure to make acquisitions in the future and successfully integrate the acquired businesses or assets into our existing operations could have a material adverse effect on our financial condition and results of operations
The provisions of our debt agreements and those of CNXM, and the risks associated therewith could adversely affect our business, financial condition, liquidity and results of operations.
As of December 31, 2017, our total long-term indebtedness was approximately $ 2.22 billion of which approximately $1.71 billion was under our 5.875% senior unsecured notes due 2022 plus $4 million of unamortized bond premium, $500 million was under our 8.000% senior unsecured notes due 2023 less $5 million of unamortized bond discount, and $20 million of capitalized leases due through 2021. The degree to which we are leveraged could have important consequences, including, but not limited to:
• | increasing our vulnerability to general adverse economic and industry conditions; |
• | requiring us to dedicate a substantial portion of our cash flow from operations to the payment of interest and principal due under our outstanding debt, which will limit our ability to obtain additional financing to fund future working capital, capital expenditures, acquisitions, development of our gas and coal reserves or other general corporate requirements; |
• | limiting our flexibility in planning for, or reacting to, changes in our business and in the coal and natural gas industries; |
• | placing us at a competitive disadvantage compared to our competitors with lower leverage and better access to capital resources; and |
• | limiting our ability to implement our business strategy. |
Our senior secured credit facility and the indentures governing our 5.875% and 8.000% senior unsecured notes limit the incurrence of additional indebtedness unless specified tests or exceptions are met. In addition, our senior secured credit agreement and the indentures governing our 5.875% and 8.000% senior unsecured notes subject us to financial and/or other restrictive covenants. Under our senior secured credit agreement, we must comply with certain financial covenants on a quarterly basis including a minimum interest coverage ratio, and a minimum current ratio, as defined therein. Our senior secured credit agreement and the indentures governing our 5.875% and 8.000% senior unsecured notes impose a number of restrictions upon us, such as restrictions on granting liens on our assets, making investments, paying dividends, stock repurchases, selling assets and engaging in acquisitions. Failure by us to comply with these covenants could result in an event of default that, if not cured or waived, could have a material adverse effect on us. Further, CNXM’s existing $250.0 million revolving credit facility subjects it to certain financial and/or other restrictive covenants and other restrictions similar to those in our senior secured credit agreement and indentures.
If our or CNXM’s cash flows and capital resources are insufficient to fund our respective debt service obligations, we may be forced to sell assets, seek additional capital or seek to restructure or refinance our indebtedness. These alternative measures may not be successful and may not permit us to meet our scheduled debt service obligations. In the absence of such operating results and resources, we could face substantial liquidity problems and might be required to sell material assets or operations to attempt to meet our debt service and other obligations. Our senior secured credit agreement and the indentures governing our 5.875% and 8.000% senior unsecured notes restrict our ability to sell assets and use the proceeds from the sales. We may not be able to consummate those sales or to obtain the proceeds which we could realize from them and these proceeds may not be adequate to meet any debt service obligations then due.
Failure to find or acquire economically recoverable natural gas reserves to replace our current natural gas reserves will cause our natural gas reserves and production to decline, which would adversely affect our business, financial condition, results of operations, liquidity and cash flows.
Producing natural gas reservoirs generally are characterized by declining production rates that vary depending upon reservoir characteristics and other factors. Because total estimated proved reserves include our proved undeveloped reserves at December 31, 2017, production is expected to decline even if those proved undeveloped reserves are developed and the wells produce as expected. The rate of decline will change if production from our existing wells declines in a different manner than we have estimated and can change under other circumstances. Thus, our future natural gas reserves and production and, therefore,
30
our cash flow and income are highly dependent on our success in efficiently developing and exploiting our current reserves and economically finding or acquiring additional economically recoverable reserves. We may not be able to develop, find or acquire additional economically recoverable reserves to replace our current and future production at acceptable costs.
In addition, the level of natural gas and condensate volumes handled through the CNXM midstream systems depends on the level of production from natural gas wells dedicated to such midstream systems, which may be less than expected and which will naturally decline over time. In order to maintain or increase throughput levels on CNXM’s midstream systems, CNXM must obtain production from new wells completed by us and any third-party customers on acreage dedicated to the CNXM midstream systems or execute agreements with other third parties in CNXM’s areas of operation. CNXM has no control over producers’ levels of development and completion activity in its areas of operations, the amount of reserves associated with wells connected to CNXM’s systems or the rate at which production from a well declines.
Our lenders use the loan value of our proved natural gas reserves to determine the borrowing base under our $1.5 billion senior secured credit facility. Our borrowing base could decrease for a variety of reasons including lower natural gas prices, declines in natural gas proved reserves, and lending requirements or regulations. Significant reductions in our borrowing base below $1.5 billion could have a material adverse effect on our results of operations, financial condition and liquidity.
Our ability to borrow and have letters of credit issued under our $1.5 billion senior secured credit facility is generally limited to a borrowing base. Our borrowing base is determined by the required number of lenders in good faith calculating a loan value of the Company’s proved natural gas reserves. The borrowing base under our senior secured credit facility is currently $2.0 billion. Our borrowing base is redetermined by the lenders twice per year, and the next scheduled borrowing base redetermination is expected to occur in May 2018. The various matters which we describe in other risk factors that can decrease our proved natural gas reserves including lower natural gas prices, operating difficulties, and failure to replace our proved reserves could decrease our borrowing base. Please read: “Risk Factors - We face uncertainties in estimating our economically recoverable natural gas and coal reserves, and inaccuracies in our estimates could result in lower than expected revenues, higher than expected costs and decreased profitability” and - “Unless we replace our natural gas reserves, our natural gas reserves and production will decline, which would adversely affect our business, financial condition, results of operations and cash flows.” Our borrowing base could also decrease as a result of new lending requirements or regulations or the issuance of new indebtedness. If our borrowing base declined significantly below $1.5 billion, we may be unable to implement our drilling and development plans, make acquisitions or otherwise carry out our business plan which could have a material adverse effect on our financial condition and results of operations. We also could be required to repay any outstanding indebtedness in excess of the redetermined borrowing base. We could face substantial liquidity problems, might not be able to access the equity or debt capital markets and might be required to sell material assets or operations to attempt to meet our debt service and other obligations. We may not be able to consummate those sales or to obtain the proceeds which we could realize from them and those proceeds may not be adequate to meet any debt service obligations then due.
We may operate a portion of our business with one or more joint venture partners or in circumstances where we are not the operator, which may restrict our operational and corporate flexibility; actions taken by the other partner or third-party operator may materially impact our financial position and results of operations; and we may not realize the benefits we expect to realize from a joint venture.
As is common in the industry we may operate one or more of our properties with a joint venture partner, or contract with a third-party to control operations. These relationships could require us to share operational and other control, such that we may no longer have the flexibility to control completely the development of these properties. If we do not timely meet our financial commitments in such circumstances, our rights to participate may be adversely affected. If a joint venture partner is unable or fails to pay its portion of development costs or if a third-party operator does not operate in accordance with our expectations, our costs of operations could be increased. We could also incur liability as a result of actions taken by a joint venture partner or third-party operator. Disputes between us and the other party may result in litigation or arbitration that would increase our expenses, delay or terminate projects and distract our officers and directors from focusing their time and effort on our business.
Changes in federal or state income tax laws, particularly in the area of intangible drilling costs, could cause our financial position and profitability to deteriorate.
The passage of legislation or any other similar changes in U.S. federal income tax law could eliminate or postpone certain tax deductions that are currently available with respect to natural gas exploration and development. Any such change could negatively affect our financial condition and results of operations. For instance, recent tax law changes effective as of the beginning of 2018 will limit the ability of corporations to take certain interest deductions and have eliminated a corporation’s ability to take deductions for income attributable to domestic production activities.
31
Additionally, legislation has been proposed from time to time in the states in which we operate - primarily Pennsylvania, Ohio and West Virginia - that would impose severance taxes or increased severance taxes on the production from our wells. The proposed tax rates have varied but would represent a greater financial burden on the economics of the wells we drill in these states.
Strategic determinations, including the allocation of capital and other resources to strategic opportunities, are challenging, and our failure to appropriately allocate capital and resources among our strategic opportunities may adversely affect our financial condition.
Our future growth prospects are dependent upon our ability to identify optimal strategies for investing our capital resources to produce superior rates of return. In developing our business plan, we consider allocating capital and other resources to various aspects of our businesses including well development (primarily drilling), reserve acquisitions, exploratory activity, corporate items and other alternatives. We also consider our likely sources of capital, including cash generated from operations and borrowings under our credit facilities. Notwithstanding the determinations made in the development of our business plan, business opportunities not previously identified periodically come to our attention, including possible acquisitions and dispositions. If we fail to identify optimal business strategies, or fail to optimize our capital investment and capital raising opportunities and the use of our other resources in furtherance of our business strategies, our financial condition and future growth may be adversely affected. Moreover, economic or other circumstances may change from those contemplated by our business plan, and our failure to recognize or respond to those changes may limit our ability to achieve our objectives.
Our development and exploration projects, as well as CNXM’s midstream system development, require substantial capital expenditures and if we fail to generate sufficient cash flow, or obtain required capital or financing on satisfactory terms, our natural gas reserves may decline and financial results may suffer.
As part of our strategic determinations, we expect to continue to make substantial capital expenditures in the development and acquisition of natural gas reserves. Further, CNXM will need to make substantial capital expenditures to fund its share of growth capital expenditures associated with its Anchor Systems, as well as to fund its share of expenditures associated with its 5% controlling interests in each of the Growth Systems and Additional Systems or to purchase or construct new midstream systems. If CNXM is unable to make sufficient or effective capital expenditures, it will be unable to maintain and grow its business.
CNXM's gathering agreement with us, CNXM's largest customer, as amended, includes minimum well commitments; however, that gas gathering agreement and the gas gathering agreements with third-parties impose obligations on CNXM to invest capital which is not fully protected against volumetric risks associated with lower-than-forecast volumes flowing through its gathering systems. To the extent CNXM’s customers are not contractually obligated to develop their properties in the areas covered by CNXM’s acreage dedications, and determine that it is more attractive to direct their capital spending and resources to other areas, such decreases in development of reserves by CNXM customers could result in reduced volumes serviced by CNXM and a commensurate decline in revenues and cash flows.
We cannot assure you that we or CNXM will have sufficient cash from operations, borrowing capacity under each company’s respective credit facilities or the ability to raise additional funds in the capital markets to meet our capital requirements. If cash flow generated by our operations or available borrowings under either company’s credit facilities are not sufficient to meet our capital requirements, or we are unable to obtain additional financing, we could be required to curtail the pace of the development of our natural gas properties and midstream activities, which in turn could lead to a decline in our reserves and production, and could adversely affect our business, financial condition and results of operations.
Terrorist attacks or cyber-attacks could have a material adverse effect on our business, financial condition or results of operations.
Terrorist attacks or cyber-attacks may significantly affect the energy industry, and economic conditions, including our operations and our customers, as well as general economic conditions, consumer confidence and spending and market liquidity. Strategic targets, such as energy-related assets, may be at greater risk of future attacks than other targets in the United States. A cyber incident could result in information theft, data corruption, operational disruption and/or financial loss. Our insurance may not protect us against such occurrences. Consequently, it is possible that any of these occurrences, or a combination of them, could have a material adverse effect on our business, financial condition and results of operations.
The oil and natural gas industry has become increasingly dependent upon digital technologies, including information systems, infrastructure and cloud applications and services, to operate our businesses, process and record financial and operating data, communicate with our employees and business partners, analyze seismic and drilling information, estimate quantities of natural gas reserves, and perform other activities related to our businesses. Our business partners, including vendors, service providers, and financial institutions, are also dependent on digital technology.
32
As dependence on digital technologies has increased, cyber incidents, including deliberate attacks or unintentional events, have also increased. A cyber-attack could include gaining unauthorized access to digital systems for purposes of misappropriating assets or sensitive information, corrupting data, or causing operational disruption, or result in denial-of-service on websites. SCADA (supervisory control and data acquisition) based systems are potentially vulnerable to targeted cyber-attacks due to their critical role in operations.
Our technologies, systems, networks, and those of our business partners may become the target of cyber-attacks or information security breaches that could result in the unauthorized release, gathering, monitoring, misuse, loss or destruction of proprietary and other information, or other disruption of our business operations. In addition, certain cyber incidents, such as surveillance, may remain undetected for an extended period.
Deliberate attacks on our assets, or security breaches in our systems or infrastructure, the systems or infrastructure of third-parties or the cloud could lead to corruption or loss of our proprietary data and potentially sensitive data, delays in production or delivery, difficulty in completing and settling transactions, challenges in maintaining our books and records, environmental damage, communication interruptions, other operational disruptions and third-party liability, including the following:
• | a cyber-attack on a vendor or service provider could result in supply chain disruptions which could delay or halt development of additional infrastructure, effectively delaying the start of cash flows from the project; |
• | a cyber-attack on our facilities may result in equipment damage or failure; |
• | a cyber-attack on midstream or downstream pipelines could prevent our product from being delivered, resulting in a loss of revenues; |
• | a cyber-attack on a communications network or power grid could cause operational disruption resulting in loss of revenues; |
• | a deliberate corruption of our financial or operational data could result in events of non-compliance which could lead to regulatory fines or penalties; and |
• | business interruptions could result in expensive remediation efforts, distraction of management, damage to our reputation, or a negative impact on the price of our units. |
Our implementation of various controls and processes, including globally incorporating a risk-based cyber security framework, to monitor and mitigate security threats and to increase security for our information, facilities and infrastructure is costly and labor intensive. Moreover, there can be no assurance that such measures will be sufficient to prevent security breaches from occurring. As cyber threats continue to evolve, we may be required to expend significant additional resources to continue to modify or enhance our protective measures or to investigate and remediate any information security vulnerabilities.
Construction of new gathering, compression, dehydration, treating or other midstream assets by CNXM may not result in revenue increases and may be subject to regulatory, environmental, political, legal and economic risks, which could adversely affect CNXM‘s cash flows, results of operations and our financial condition.
The construction of additions or modifications to CNXM’s existing systems involves numerous regulatory, environmental, political and legal uncertainties beyond its control and may require the expenditure of significant amounts of capital. Financing may not be available on economically acceptable terms or at all. If these projects are undertaken, they may not be completed on schedule, at the budgeted cost or at all.
Revenues may not increase immediately (or at all) upon the expenditure of funds on a particular project. For instance, if a processing facility is built, the construction may occur over an extended period of time, and CNXM may not receive any material increases in revenues until the project is completed. Additionally, facilities may be constructed to capture anticipated future production growth in an area in which such growth does not materialize. As a result, new gathering, compression, dehydration, treating or other midstream assets may not be able to attract enough throughput to achieve the expected investment return, which could adversely affect CNXM’s business, financial condition, results of operations, cash flows and ability to make cash distributions.
The construction of additions to CNXM’s existing assets may require it to obtain new rights-of-way prior to constructing new pipelines or facilities, which may not be obtained in a timely fashion or in a way that allows CNXM to connect new natural gas supplies to existing gathering pipelines or capitalize on other attractive expansion opportunities. Additionally, it may become more expensive to obtain new rights-of-way or to expand or renew existing rights-of-way. If the cost of renewing or obtaining new rights-of-way increases, cash flows could be adversely affected.
33
Our success depends on key members of our management and our ability to attract and retain experienced technical and other professional personnel.
Our future success depends to a large extent on the services of our key employees. The loss of one or more of these individuals could have a material adverse effect on our business. Furthermore, competition for experienced technical and other professional personnel remains strong. If we cannot retain our current personnel or attract additional experienced personnel, our ability to compete could be adversely affected. Also, the loss of experienced personnel could lead to a loss of technical expertise.
We may not achieve some or all of the expected benefits of the separation of CONSOL Energy, and failure to realize such benefits in a timely manner may materially adversely affect our business.
We may not be able to achieve the full strategic and financial benefits expected to result from the separation of our coal business, now operated by CONSOL Energy Inc., or such benefits may be delayed or not occur at all. The separation is expected to provide the following benefits, among others: (i) position management of each company to more effectively pursue its own focused, industry-specific strategy, creating additional operational flexibility and enabling our management team to focus on strengthening our core business, operations and other needs, and to pursue distinct and targeted opportunities for long-term growth and profitability; (ii) permit each company to efficiently allocate its capital to meet the unique needs of its own business, allowing each company to intensify its focus on its distinct business priorities and facilitate each business having a more appropriate capital aligned with its target capital levels and those of its peers, which is expected to increase access to capital; (iii) better position each company to recruit and retain executives and other employees with expertise more directly applicable to the needs of its business; allow each company more consistent application of incentive structures and targets, due to the common nature of the underlying businesses; clearer articulation of talent requirements for potential employees and understanding of the prerequisites and opportunities associated with each business; and (iv) improve understanding of each business in the capital markets and allow for a stronger, more focused investor base for each business; creation of two independent equity structures, enabling each business to use its own business-focused stock as consideration in acquisitions and equity compensation programs and creating a more efficient and valuable transaction currency and compensation tool.
We may not achieve these and other anticipated benefits for a variety of reasons, including, among others: (i) we may be more susceptible to market fluctuations and other adverse events than if CONSOL Energy were still a part of the company because our business is less diversified than it was prior to the completion of the separation; and (ii) as a smaller, independent company, we may be more susceptible to fluctuations in the prices of natural gas, without having the coal business to mitigate such volatility. If we fail to achieve some or all of the benefits expected to result from the separation, or if such benefits are delayed, it could have a material adverse effect on our competitive position, business, financial condition, results of operations and cash flows.
CONSOL Energy may fail to perform under various transaction agreements that were executed as part of the separation.
In connection with the separation, CNX and CONSOL Energy entered into a Separation and Distribution Agreement and also entered into various other agreements, including a Transition Services Agreement, a Tax Matters Agreement, an Employee Matters Agreement, an Intellectual Property Matters Agreement, intellectual property license agreements, a real estate sublease, and Master Cooperation and Safety Agreements. The Separation and Distribution Agreement, the Tax Matters Agreement and the Employee Matters Agreement, together with the documents and agreements by which the internal reorganization of the Company prior to the separation was effected, determined the allocation of assets and liabilities between the companies following the separation for those respective areas and included any necessary indemnifications related to liabilities and obligations in connection therewith. The Transition Services Agreement provides for the performance of certain services by each company for the benefit of the other for a period of time after the separation. We will rely on CONSOL Energy to satisfy its performance and payment obligations under these agreements. If CONSOL Energy is unable or unwilling to satisfy its obligations under these agreements, including its indemnification obligations, we could incur operational difficulties and/or losses.
In connection with the separation, CONSOL Energy has agreed to indemnify us for certain liabilities and we have agreed to indemnify CONSOL Energy for certain liabilities. If we are required to pay under these indemnities to CONSOL Energy, our financial results could be negatively impacted. The CONSOL Energy indemnity may not be sufficient to hold us harmless from the full amount of liabilities for which CONSOL Energy has been allocated responsibility, and CONSOL Energy may not be able to satisfy its indemnification obligations in the future.
Pursuant to the Separation and Distribution Agreement and certain other agreements with CONSOL Energy, CONSOL Energy has agreed to indemnify us for certain liabilities, and we have agreed to indemnify CONSOL Energy for certain liabilities, in each case for uncapped amounts. More specifically, CONSOL Energy assumed all liabilities related to their current and our former coal business, including liabilities having a book value of $955 million and liabilities that may arise due to the failure of purchasers of coal assets that we had previously disposed. Additionally, we remain liable as a guarantor on certain liabilities that
34
were assumed by CONSOL Energy in connection with the separation. The estimated value of these guarantees was approximately $192 Million at the time of the separation. Although CONSOL Energy agreed to indemnify us to the extent that we are called upon to pay any of these liabilities, there is no assurance that CONSOL Energy will satisfy its obligations to indemnify us in these situations. For example we could be liable for liabilities assumed by Murray Energy and its subsidiaries (Murray Energy) in connection with the disposition of certain mines to Murray Energy in 2013 in the event that both Murray Energy and CONSOL Energy are unable to satisfy those liabilities.
Indemnities that we may be required to provide CONSOL Energy are not subject to any cap, may be significant and could negatively impact our business. Third-parties could also seek to hold us responsible for any of the liabilities that CONSOL Energy has agreed to retain. Any amounts we are required to pay pursuant to these indemnification obligations and other liabilities could require us to divert cash that would otherwise have been used in furtherance of our operating business. Further, the indemnity from CONSOL Energy may not be sufficient to protect us against the full amount of such liabilities, and CONSOL Energy may not be able to fully satisfy its indemnification obligations. Moreover, even if we ultimately succeed in recovering from CONSOL Energy any amounts for which we are held liable, we may be temporarily required to bear such losses. Each of these risks could negatively affect our business, results of operations and financial condition.
The separation of CONSOL Energy could result in substantial tax liability.
Under current U.S. federal income tax law, even if the distribution, together with certain related transactions, otherwise qualifies for tax-free treatment under Sections 355 and 368(a)(1)(D) of the Internal Revenue Code, the distribution may nevertheless be rendered taxable to us and our shareholders as a result of certain post-distribution transactions, including certain acquisitions of shares or assets of CNX or CONSOL Energy. The possibility of rendering the distribution taxable as a result of such transactions may limit our ability to pursue certain equity issuances, strategic transactions or other transactions that would otherwise maximize the value of our business. Under the Tax Matters Agreement that we entered into with CONSOL Energy, CONSOL Energy may be required to indemnify us against any additional taxes and related amounts resulting from (i) an acquisition of all or a portion of the equity securities or assets of CONSOL Energy, whether by merger or otherwise (and regardless of whether CONSOL Energy participated in or otherwise facilitated the acquisition), (ii) issuing equity securities beyond certain thresholds, (iii) repurchasing shares of CONSOL Energy stock other than in certain open-market transactions, (iv) ceasing to actively conduct certain of its businesses, (v) other actions or failures to act by CONSOL Energy or (vi) any of CONSOL Energy’s representations, covenants or undertakings contained in any of the separation-related agreements and documents or in any documents relating to the IRS private letter ruling and/or the opinions of tax advisors being incorrect or violated. However, the indemnity from CONSOL Energy may not be sufficient to protect us against the full amount of such additional taxes or related liabilities, and CONSOL Energy may not be able to fully satisfy its indemnification obligations. Moreover, even if we ultimately succeed in recovering from CONSOL Energy any amounts for which we are held liable, we may be temporarily required to bear such losses. Each of these risks could negatively affect CNX’s business, results of operations and financial condition.
ITEM 1B. | Unresolved Staff Comments |
None.
ITEM 2. | Properties |
See Detail Operations in Item 1 of this 10-K for a description of CNX's properties.
ITEM 3. | Legal Proceedings |
Note 18–Commitments and Contingent Liabilities in the Notes to the Audited Consolidated Financial Statements in Item 8 of this Form 10-K is incorporated herein by reference.
ITEM 4. | Mine Safety and Health Administration Safety Data |
Information concerning mine safety violations or other regulatory matters required by Section 1503(a) of the Dodd-Frank Wall Street Reform and Consumer Protection Act and Item 104 of Regulation S-K is included in Exhibit 95 to this annual report.
35
PART II
ITEM 5. | Market for Registrant's Common Equity and Related Stockholder Matters and Issuer Purchases of Equity Securities |
The Company's common stock is listed on the New York Stock Exchange under the symbol CNX. The following table sets forth, for the periods indicated, the range of high and low sales prices per share of our common stock as reported on the New York Stock Exchange and the cash dividends declared on the common stock for the periods indicated:
High | Low | Dividends | |||||||||||
Year Period Ended December 31, 2017 | |||||||||||||
Quarter Ended March 31, 2017 | $ | 17.11 | $ | 12.77 | $ | — | |||||||
Quarter Ended June 30, 2017 | $ | 15.16 | $ | 11.73 | $ | — | |||||||
Quarter Ended September 30, 2017 | $ | 14.88 | $ | 12.03 | $ | — | |||||||
Quarter Ended December 31, 2017 | $ | 16.11 | $ | 13.00 | $ | — | |||||||
Year Period Ended December 31, 2016 | |||||||||||||
Quarter Ended March 31, 2016 | $ | 10.75 | $ | 3.93 | $ | 0.0100 | |||||||
Quarter Ended June 30, 2016 | $ | 14.20 | $ | 9.12 | $ | — | |||||||
Quarter Ended September 30, 2016 | $ | 17.11 | $ | 13.01 | $ | — | |||||||
Quarter Ended December 31, 2016 | $ | 19.34 | $ | 13.97 | $ | — | |||||||
As of December 31, 2017, there were 120 holders of record of our common stock.
The following performance graph compares the yearly percentage change in the cumulative total shareholder return on the common stock of CNX to the cumulative shareholder return for the same period of a peer group and the Standard & Poor's 500 Stock Index. The peer group has changed from last year as a result of the spin-off of the coal business (See Note 2 - Discontinued Operations in the Notes to the Audited Consolidated Financial Statements in Item 8 of this Form 10-K for additional information). The current peer group is comprised of CNX, Antero Resources Corporation, Cabot Oil & Gas Corporation, Chesapeake Energy Corporation, Energen Corporation, EQT Corporation, Gulfport Energy Corporation, PDC Energy, Inc., Range Resources Corporation, SM Energy Company, Southwestern Energy Co., Whiting Petroleum Corporation, and WPX Energy, Inc. The graph assumes that the value of the investment in CNX common stock and each index was $100 at December 31, 2012. The graph also assumes that all dividends were reinvested and that the investments were held through December 31, 2017.
2012 | 2013 | 2014 | 2015 | 2016 | 2017 | |||||||||||||
CNX Resources Corporation | 100.0 | 119.9 | 107.4 | 25.7 | 59.3 | 55.0 | ||||||||||||
Peer Group | 100.0 | 129.1 | 88.3 | 38.8 | 53.1 | 40.4 | ||||||||||||
S&P 500 Stock Index | 100.0 | 129.6 | 144.4 | 143.4 | 157.0 | 187.4 | ||||||||||||
Previous Peer Group | 100.0 | 116.4 | 105.1 | 44.8 | 65.9 | 119.0 | ||||||||||||
36
Cumulative Total Shareholder Return Among CNX Resources Corporation, Peer Group and S&P 500 Stock Index
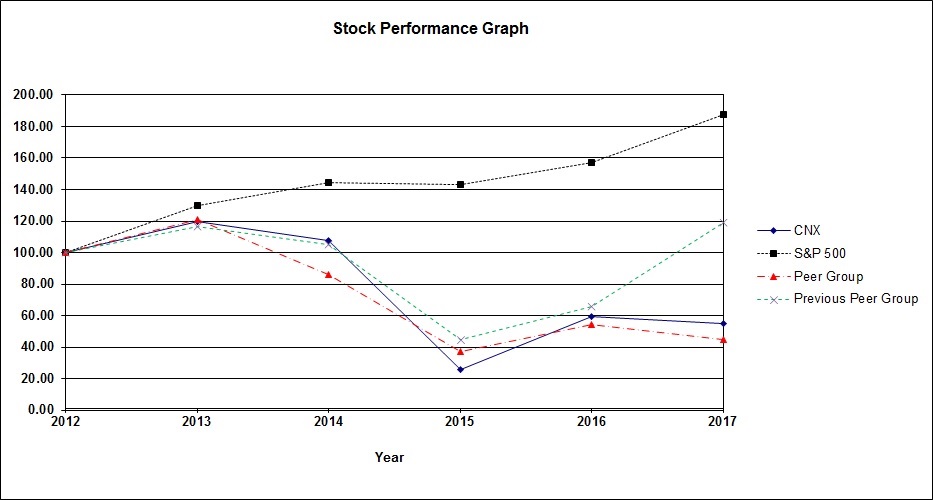
The above information is being furnished pursuant to Regulation S-K, Item 201 (e) (Performance Graph).
The declaration and payment of dividends by CNX is subject to the discretion of CNXs Board of Directors, and no assurance can be given that CNX will pay dividends in the future. CNX suspended its quarterly dividend following the sale of the Buchanan Mine on March 31, 2016 to further reflect the Company's increased emphasis on growth. CNX’s Board of Directors determines whether dividends will be paid quarterly. The determination to pay dividends will depend upon, among other things, general business conditions, CNX’s financial results, contractual and legal restrictions regarding the payment of dividends by CNX, planned investments by CNX and such other factors as the Board of Directors deems relevant. The Company's credit facility limits CNX's ability to pay dividends in excess of an annual rate of $0.50 per share when the Company's leverage ratio exceeds 3.50 to 1.00 and subject to an aggregate amount up to the then cumulative credit calculation. The total leverage ratio was 4.08 to 1.00 and the cumulative credit was approximately $389 million at December 31, 2017. The credit facility does not permit dividend payments in the event of default. The indentures to the 2022 and 2023 notes limit dividends to $0.50 per share annually unless several conditions are met. These conditions include no defaults, ability to incur additional debt and other payment limitations under the indentures. There were no defaults in the year ended December 31, 2017.
See Part III, Item 12. “Security Ownership of Certain Beneficial Owners and Management and Related Stockholder Matters” for information relating to CNX's equity compensation plans.
37
ITEM 6. | Selected Financial Data |
The following table presents our selected consolidated financial and operating data for, and as of the end of, each of the periods indicated. The selected consolidated financial data for, and as of the end of, each of the years ended December 31, 2017, 2016, 2015, 2014 and 2013 are derived from our audited Consolidated Financial Statements. Certain reclassifications of prior year data have been made to conform to the year ended December 31, 2017 presentation. The selected consolidated financial and operating data are not necessarily indicative of the results that may be expected for any future period. The selected consolidated financial and operating data should be read in conjunction with Item 7 “Management's Discussion and Analysis of Financial Condition and Results of Operations” and the financial statements and related notes included in this Annual Report.
(Dollars in thousands, except per share data) | For the Years Ended December 31, | |||||||||||||||||||
2017 | 2016 | 2015 | 2014 | 2013 | ||||||||||||||||
Revenue and Other Operating Income from Continuing Operations | $ | 1,455,131 | $ | 759,968 | $ | 1,198,737 | $ | 1,080,351 | $ | 730,917 | ||||||||||
Income (Loss) from Continuing Operations | $ | 295,039 | $ | (550,945 | ) | $ | (650,198 | ) | $ | (269,625 | ) | $ | (442,539 | ) | ||||||
Net Income (Loss) | $ | 380,747 | $ | (848,102 | ) | $ | (374,885 | ) | $ | 163,090 | $ | 660,442 | ||||||||
Earnings per share: | ||||||||||||||||||||
Basic: | ||||||||||||||||||||
Income (Loss) from Continuing Operations | $ | 1.29 | $ | (2.40 | ) | $ | (2.84 | ) | $ | (1.17 | ) | $ | (1.93 | ) | ||||||
Income (Loss) from Discontinued Operations | 0.37 | (1.30 | ) | 1.20 | 1.88 | 4.82 | ||||||||||||||
Net Income (Loss) | $ | 1.66 | $ | (3.70 | ) | $ | (1.64 | ) | $ | 0.71 | $ | 2.89 | ||||||||
Dilutive: | ||||||||||||||||||||
Income (Loss) from Continuing Operations | $ | 1.28 | $ | (2.40 | ) | $ | (2.84 | ) | $ | (1.17 | ) | $ | (1.92 | ) | ||||||
Income (Loss) from Discontinued Operations | 0.37 | (1.30 | ) | 1.20 | 1.87 | 4.79 | ||||||||||||||
Net Income (Loss) | $ | 1.65 | $ | (3.70 | ) | $ | (1.64 | ) | $ | 0.70 | $ | 2.87 | ||||||||
Assets from Continuing Operations | $ | 6,931,913 | $ | 6,682,770 | $ | 7,302,119 | $ | 7,968,069 | $ | 7,991,623 | ||||||||||
Assets from Discontinued Operations | — | 2,496,921 | 3,627,783 | 3,686,576 | 3,156,312 | |||||||||||||||
Total Assets | $ | 6,931,913 | $ | 9,179,691 | $ | 10,929,902 | $ | 11,654,645 | $ | 11,147,935 | ||||||||||
Long-Term Debt from Continuing Operations (including current portion) | $ | 2,214,484 | $ | 2,456,354 | $ | 2,460,633 | $ | 3,129,433 | $ | 3,030,165 | ||||||||||
Long-Term Debt from Discontinued Operations (including current portion) | — | 317,715 | 294,222 | 120,128 | 110,420 | |||||||||||||||
Total Long-Term Debt (including current portion) | $ | 2,214,484 | $ | 2,774,069 | $ | 2,754,855 | $ | 3,249,561 | $ | 3,140,585 | ||||||||||
Cash Dividends Declared Per Share of Common Stock | $ | — | $ | 0.010 | $ | 0.145 | $ | 0.250 | $ | 0.375 | ||||||||||
See Item 1A, “Risk Factors” and Item 7, “Management’s Discussion and Analysis of Financial Condition and Results of Operations” for a discussion of an adjustment to operating income for all periods and other matters that affect the comparability of the selected financial data as well as uncertainties that might affect the Company’s future financial condition.
OTHER OPERATING DATA
(unaudited)
Years Ended December 31, | ||||||||||||||||||||
2017 | 2016 | 2015 | 2014 | 2013 | ||||||||||||||||
Gas: | ||||||||||||||||||||
Net sales volumes produced (in Bcfe) | 407.2 | 394.4 | 328.7 | 235.7 | 172.4 | |||||||||||||||
Average sales price ($ per Mcfe) (A) | $ | 2.66 | $ | 2.63 | $ | 2.81 | $ | 4.37 | $ | 4.30 | ||||||||||
Average cost ($ per Mcfe) | $ | 2.23 | $ | 2.32 | $ | 2.62 | $ | 3.13 | $ | 3.42 | ||||||||||
Proved reserves (in Bcfe) (B) | 7,582 | 6,252 | 5,643 | 6,828 | 5,731 | |||||||||||||||
____________
(A) | Represents average net sales price including the effect of derivative transactions. |
(B) | Represents proved developed and undeveloped gas reserves at period end. |
38
ITEM 7. | Management's Discussion and Analysis of Financial Condition and Results of Operations |
General
2017 Highlights
• | Record total gas production of 407.2 Bcfe in 2017, 3.2% higher than 2016. |
• | Record Marcellus Shale production of 239.4 Bcfe in 2017, 12.7% higher than 2016. |
• | Increased proved reserves to 7.6 Tcfe, 20.6% higher than 2016. |
• | On November 28, 2017, CNX completed the tax-free spin-off of its coal business resulting in two independent, publicly traded companies: CONSOL Energy, a coal company, formerly known as CONSOL Mining Corporation; and CNX, a natural gas exploration and production company. As a result of the separation of the two companies, CONSOL Energy and its subsidiaries now hold the coal assets previously held by CNX, including its Pennsylvania Mining Complex, Baltimore Marine Terminal, its direct and indirect ownership interest in CONSOL Coal Resources LP, formerly known as CNXC Coal Resources LP, and other related coal assets previously held by CNX. CNX's shareholders received one share of CONSOL Energy common stock for every eight shares of CNX’s common stock held as of the close of business on November 15, 2017, the record date for the separation and distribution. The coal company, previously reported as the Company's Pennsylvania Mining Operations division, has been reclassified in the Audited Consolidated Financial Statements in Item 8 of this Form 10-K to discontinued operations for all periods presented. |
• | Gas production costs continue to decline - for the year ended December 31, 2017, total gas production costs were $2.23 per Mcfe, a 3.9% decline from the prior year. |
• | Repurchased $103 million of common stock on the open market. |
2018 Outlook:
• | Our 2018 annual gas production is expected to increase to approximately 520-550 Bcfe. |
• | Our 2018 E&P capital investment is expected to be approximately $790-$880 million.. |
39
Results of Operations: Year Ended December 31, 2017 Compared with the Year Ended December 31, 2016
Net Income (Loss)
CNX reported net income of $381 million, or a earnings per diluted share of $1.65, for the year ended December 31, 2017, compared to a net loss of $848 million, or a loss per diluted shared of $3.70, for the year ended December 31, 2016.
For the Years Ended December 31, | |||||||||||
(Dollars in thousands) | 2017 | 2016 | Variance | ||||||||
Income (Loss) from Continuing Operations | $ | 295,039 | $ | (550,945 | ) | $ | 845,984 | ||||
Income (Loss) from Discontinued Operations | 85,708 | (297,157 | ) | 382,865 | |||||||
Net Income (Loss) | $ | 380,747 | $ | (848,102 | ) | $ | 1,228,849 | ||||
CNX's principal activity is to produce pipeline quality natural gas for sale primarily to gas wholesalers. The Company's reportable segments are Marcellus Shale, Utica Shale, Coalbed Methane, and Other Gas.
CNX had income from continuing operations before income tax of $119 million for the year ended December 31, 2017, compared to a loss from continuing operations before income tax of $585 million for the year ended December 31, 2016. Included in 2017 was an unrealized gain on commodity derivative instruments of $248 million and a gain on sale of assets of $188 million. Included in 2016 was an unrealized loss on commodity derivative instruments of $386 million, partially offset by a gain on sale of assets of $14 million. See Note 3 - Acquisitions and Dispositions in the Notes to the Audited Consolidated Financial Statements in Item 8 of this Form 10-K for additional information.
The following table presents a breakout of net liquid and natural gas sales information to assist in the understanding of the Company’s natural gas production and sales portfolio.
For the Years Ended December 31, | |||||||||||||||
in thousands (unless noted) | 2017 | 2016 | Variance | Percent Change | |||||||||||
LIQUIDS | |||||||||||||||
NGLs: | |||||||||||||||
Sales Volume (MMcfe) | 38,736 | 40,260 | (1,524 | ) | (3.8 | )% | |||||||||
Sales Volume (Mbbls) | 6,456 | 6,710 | (254 | ) | (3.8 | )% | |||||||||
Gross Price ($/Bbl) | $ | 24.18 | $ | 14.52 | $ | 9.66 | 66.5 | % | |||||||
Gross Revenue | $ | 156,132 | $ | 97,580 | $ | 58,552 | 60.0 | % | |||||||
Oil: | |||||||||||||||
Sales Volume (MMcfe) | 421 | 410 | 11 | 2.7 | % | ||||||||||
Sales Volume (Mbbls) | 70 | 68 | 2 | 2.9 | % | ||||||||||
Gross Price ($/Bbl) | $ | 45.36 | $ | 36.90 | $ | 8.46 | 22.9 | % | |||||||
Gross Revenue | $ | 3,179 | $ | 2,521 | $ | 658 | 26.1 | % | |||||||
Condensate: | |||||||||||||||
Sales Volume (MMcfe) | 3,116 | 4,964 | (1,848 | ) | (37.2 | )% | |||||||||
Sales Volume (Mbbls) | 519 | 828 | (309 | ) | (37.3 | )% | |||||||||
Gross Price ($/Bbl) | $ | 39.54 | $ | 27.48 | $ | 12.06 | 43.9 | % | |||||||
Gross Revenue | $ | 20,531 | $ | 22,748 | $ | (2,217 | ) | (9.7 | )% | ||||||
GAS | |||||||||||||||
Sales Volume (MMcf) | 364,893 | 348,753 | 16,140 | 4.6 | % | ||||||||||
Sales Price ($/Mcf) | $ | 2.59 | $ | 1.92 | $ | 0.67 | 34.9 | % | |||||||
Gross Revenue | $ | 945,382 | $ | 670,823 | $ | 274,559 | 40.9 | % | |||||||
Hedging Impact ($/Mcf) | $ | (0.11 | ) | $ | 0.70 | $ | (0.81 | ) | (115.7 | )% | |||||
(Loss) Gain on Commodity Derivative Instruments - Cash Settlement | $ | (41,174 | ) | $ | 245,212 | $ | (286,386 | ) | (116.8 | )% | |||||
40
Natural gas, NGLs, and oil sales were $1,125 million for the year ended December 31, 2017, compared to $793 million for the year ended December 31, 2016. The increase was primarily due to the 34.9% increase in the average gas sales price per Mcf without the impact of derivative instruments and the 3.2% increase in total sales volumes.
Sales volumes, average sales price (including the effects of derivatives instruments), and average costs for all active operations were as follows:
For the Years Ended December 31, | ||||||||||||||
2017 | 2016 | Variance | Percent Change | |||||||||||
Sales Volumes (Bcfe) | 407.2 | 394.4 | 12.8 | 3.2 | % | |||||||||
Average Sales Price (per Mcfe) | $ | 2.66 | $ | 2.63 | $ | 0.03 | 1.1 | % | ||||||
Average Costs (per Mcfe) | 2.23 | 2.32 | (0.09 | ) | (3.9 | )% | ||||||||
Average Margin | $ | 0.43 | $ | 0.31 | $ | 0.12 | 38.7 | % | ||||||
The increase in average sales price was primarily the result of a $0.67 per Mcf increase in general natural gas market prices in the Appalachian basin during the current period, as well as an overall increase in natural gas liquids pricing. The increase was offset, in part, by a $0.81 per Mcf decrease in the realized (loss) gain on commodity derivative instruments related to the Company's hedging program.
Changes in the average costs per Mcfe were primarily related to the following items:
• | Depreciation, depletion, and amortization decreased on a per-unit basis primarily due to a reduction in Marcellus rates as a result of an increase in the Company's Marcellus reserves. See Note 7 - Property, Plant, and Equipment in the Notes to the Audited Consolidated Financial Statements in Item 8 of this Form 10-K for additional details. |
• | Lease operating expense decreased on a per unit basis in the period-to-period comparison due to a decrease in well tending costs and salt water disposal costs, as well as a decrease in both Company operated and joint venture operated repairs and maintenance costs. |
Certain costs and expenses such as selling, general and administrative, other expense, gain on sale of assets, loss on debt extinguishment, interest expense and income taxes are unallocated expenses and therefore are excluded from the per unit costs above as well as segment reporting. Below is a summary of these costs and expenses:
Selling, General and Administrative
Selling, general and administrative (SG&A) costs include costs such as overhead, including employee wages and benefit costs, short-term incentive compensation, costs of maintaining our headquarters, audit and other professional fees, and legal compliance expenses. SG&A costs also include noncash equity-based compensation expense.
SG&A costs were $93 million for the year ended December 31, 2017, compared to $105 million for the year ended December 31, 2016. SG&A costs decreased due to a decrease in employee wages and benefits costs in the current year related to a reduction in headcount as well as a decrease in equity-based compensation expense.
41
Other Expense
For the Years Ended December 31, | ||||||||||||||
(in millions) | 2017 | 2016 | Variance | Percent Change | ||||||||||
Other Income | ||||||||||||||
Royalty Income | $ | 10 | $ | 10 | $ | — | — | % | ||||||
Right of Way Sales | 2 | 15 | (13 | ) | (86.7 | )% | ||||||||
Interest Income | 9 | — | 9 | 100.0 | % | |||||||||
Other | 6 | 4 | 2 | 50.0 | % | |||||||||
Total Other Income | $ | 27 | $ | 29 | $ | (2 | ) | (6.9 | )% | |||||
Other Expense | ||||||||||||||
Bank Fees | $ | 13 | $ | 13 | $ | — | — | % | ||||||
Other Corporate Expense | 12 | 16 | (4 | ) | (25.0 | )% | ||||||||
Other Land Rental Expense | 6 | 5 | 1 | 20.0 | % | |||||||||
Total Other Expense | $ | 31 | $ | 34 | $ | (3 | ) | (8.8 | )% | |||||
Total Other Expense | $ | 4 | $ | 5 | $ | (1 | ) | (20.0 | )% | |||||
Gain on Sale of Assets
CNX recognized a gain on sale of assets of $188 million in the year ended December 31, 2017 compared to a gain of $14 million in the year ended December 31, 2016. The $174 million increase was primarily due to the sale of approximately 35,900 net undeveloped acres in Ohio, Pennsylvania, and West Virginia in the current period. No individually significant transactions occurred in the year ended December 31, 2016. See Note 3 - Acquisitions and Dispositions in the Notes to the Audited Consolidated Financial Statements in Item 8 of this Form 10-K for additional information.
Loss on Debt Extinguishment
Loss on debt extinguishment of $2 million was recognized in the year ended December 31, 2017 due to the redemption of the 8.25% senior notes due in April 2020, the redemption of the 6.375% senior notes due in March 2021 and the purchase of a portion of the 5.875% senior notes due in April 2022. See Note 10 - Long Term Debt in the Notes to the Audited Consolidated Financial Statements in Item 8 of this Form 10-K for additional information.
Interest Expense
Interest expense of $161 million was recognized in the year ended December 31, 2017, compared to $182 million in the year ended December 31, 2016. The $21 million decrease was primarily due to the redemption of the 2020 and 2021 senior notes and the payoff of a portion of the 2022 senior notes during the year ended December 31, 2017.
Income Taxes
The effective income tax rate for continuing operations was (148.9)% for the year ended December 31, 2017, compared to 6.0% for the year ended December 31, 2016. During the year ended December 31, 2017, CNX recognized favorable benefits of $279 million related to the impacts of income tax reform.
During the year ended December 31, 2016, CNX settled a Federal audit of the years 2010-2013 and received a favorable private letter ruling from the IRS related to bonus depreciation. Overall, the Company received approximately $21 million in refunds during 2016. Some of the factors contributing to the refunds received during 2016 put pressure on deferred tax assets related to alternative minimum tax credits. As management could not demonstrate sufficient positive evidence to ensure realizability of these assets, the Company recorded a valuation allowance of $167 million at December 31, 2016 on alternative minimum tax credits as well as an additional $38 million valuation allowance against state deferred tax assets and federal charitable contribution and foreign tax credit carry-forwards.
42
On December 22, 2017, the United States enacted the Tax Cuts and Jobs Act (the "Act") which, among other things, lowered the U.S. Federal tax rate from 35% to 21%, repealed the corporate alternative minimum tax, and provided for a refund of previously accrued alternative minimum tax credits. The Company recorded a net tax benefit to reflect the impact of the Act as of December 31, 2017, as it is required to reflect the change in the period in which the law is enacted. Largely, the benefits recorded in the current period related to tax reform are in recognition of the revaluation of deferred tax assets and liabilities, a benefit of $115 million, and the benefit for reversal of valuation allowance previously recorded against alternative minimum tax credits which are now refundable, a benefit of $154 million. At December 31, 2017, the Company has not finalized its accounting for the tax effects of the Act. However, as described in Note 5 - Income Taxes in the Notes to the Audited Consolidated Financial Statements in Item 8 of this Form 10-K, CNX has made a reasonable estimate of the tax effects of the Act, including the impact on existing deferred tax balances. The Company is still analyzing certain aspects of the Act, which could potentially affect the measurement of the Company's income tax balances.
See Note 5 - Income Taxes in the Notes to the Audited Consolidated Financial Statements in Item 8 of this Form 10-K for additional information.
For the Years Ended December 31, | ||||||||||||||
2017 | 2016 | Variance | Percent Change | |||||||||||
Total Company Earnings (Loss) Before Income Tax | $ | 119 | $ | (585 | ) | $ | 704 | (120.3 | )% | |||||
Income Tax Benefit | $ | (176 | ) | $ | (34 | ) | $ | (142 | ) | 417.6 | % | |||
Effective Income Tax Rate | (148.9 | )% | 6.0 | % | (154.9 | )% | ||||||||
43
TOTAL OPERATING SEGMENT ANALYSIS for the year ended December 31, 2017 compared to the year ended December 31, 2016:
CNX operating segments had earnings before income tax of $191 million for the year ended December 31, 2017 compared to a loss before income tax of $308 million for the year ended December 31, 2016. Variances by individual operating segment are discussed below.
For the Year Ended | Difference to Year Ended | ||||||||||||||||||||||||||||||||||||||
December 31, 2017 | December 31, 2016 | ||||||||||||||||||||||||||||||||||||||
(in millions) | Marcellus | Utica | CBM | Other Gas | Total | Marcellus | Utica | CBM | Other Gas | Total | |||||||||||||||||||||||||||||
Natural Gas, NGLs and Oil Sales | $ | 646 | $ | 217 | $ | 209 | $ | 53 | $ | 1,125 | $ | 231 | $ | 54 | $ | 34 | $ | 13 | $ | 332 | |||||||||||||||||||
(Loss) Gain on Commodity Derivative Instruments | (30 | ) | 1 | (10 | ) | 246 | 207 | (177 | ) | (28 | ) | (62 | ) | 615 | 348 | ||||||||||||||||||||||||
Purchased Gas Sales | — | — | — | 54 | 54 | — | — | — | 11 | 11 | |||||||||||||||||||||||||||||
Other Operating Income | — | — | — | 69 | 69 | — | — | — | 4 | 4 | |||||||||||||||||||||||||||||
Total Revenue and Other Operating Income | 616 | 218 | 199 | 422 | 1,455 | 54 | 26 | (28 | ) | 643 | 695 | ||||||||||||||||||||||||||||
Lease Operating Expense | 32 | 19 | 25 | 13 | 89 | (2 | ) | (3 | ) | — | (2 | ) | (7 | ) | |||||||||||||||||||||||||
Production, Ad Valorem, and Other Fees | 15 | 5 | 7 | 2 | 29 | (2 | ) | — | 1 | (1 | ) | (2 | ) | ||||||||||||||||||||||||||
Transportation, Gathering and Compression | 256 | 45 | 64 | 18 | 383 | 28 | (6 | ) | (8 | ) | (5 | ) | 9 | ||||||||||||||||||||||||||
Depreciation, Depletion and Amortization | 222 | 84 | 83 | 23 | 412 | 11 | (2 | ) | (3 | ) | (14 | ) | (8 | ) | |||||||||||||||||||||||||
Impairment of Exploration and Production Properties | — | — | — | 138 | 138 | — | — | — | 138 | 138 | |||||||||||||||||||||||||||||
Exploration and Production Related Other Costs | — | — | — | 48 | 48 | — | — | — | 33 | 33 | |||||||||||||||||||||||||||||
Purchased Gas Costs | — | — | — | 53 | 53 | — | — | — | 10 | 10 | |||||||||||||||||||||||||||||
Other Operating Expense | — | — | — | 112 | 112 | — | — | — | 23 | 23 | |||||||||||||||||||||||||||||
Total Operating Costs and Expenses | 525 | 153 | 179 | 407 | 1,264 | 35 | (11 | ) | (10 | ) | 182 | 196 | |||||||||||||||||||||||||||
Earnings (Loss) Before Income Tax | $ | 91 | $ | 65 | $ | 20 | $ | 15 | $ | 191 | $ | 19 | $ | 37 | $ | (18 | ) | $ | 461 | $ | 499 | ||||||||||||||||||
44
MARCELLUS SEGMENT
The Marcellus segment had earnings before income tax of $91 million for the year ended December 31, 2017 compared to earnings before income tax of $72 million for the year ended December 31, 2016.
For the Years Ended December 31, | ||||||||||||||
2017 | 2016 | Variance | Percent Change | |||||||||||
Marcellus Gas Sales Volumes (Bcf) | 209.7 | 186.8 | 22.9 | 12.3 | % | |||||||||
NGLs Sales Volumes (Bcfe)* | 27.6 | 23.5 | 4.1 | 17.4 | % | |||||||||
Condensate Sales Volumes (Bcfe)* | 2.1 | 2.2 | (0.1 | ) | (4.5 | )% | ||||||||
Total Marcellus Sales Volumes (Bcfe)* | 239.4 | 212.5 | 26.9 | 12.7 | % | |||||||||
Average Sales Price - Gas (per Mcf) | $ | 2.50 | $ | 1.87 | $ | 0.63 | 33.7 | % | ||||||
(Loss) Gain on Commodity Derivative Instruments - Cash Settlement- Gas (per Mcf) | $ | (0.14 | ) | $ | 0.79 | $ | (0.93 | ) | (117.7 | )% | ||||
Average Sales Price - NGLs (per Mcfe)* | $ | 3.96 | $ | 2.38 | $ | 1.58 | 66.4 | % | ||||||
Average Sales Price - Condensate (per Mcfe)* | $ | 6.44 | $ | 4.32 | $ | 2.12 | 49.1 | % | ||||||
Total Average Marcellus Sales Price (per Mcfe) | $ | 2.57 | $ | 2.64 | $ | (0.07 | ) | (2.7 | )% | |||||
Average Marcellus Lease Operating Expenses (per Mcfe) | 0.13 | 0.16 | (0.03 | ) | (18.8 | )% | ||||||||
Average Marcellus Production, Ad Valorem, and Other Fees (per Mcfe) | 0.07 | 0.08 | (0.01 | ) | (12.5 | )% | ||||||||
Average Marcellus Transportation, Gathering and Compression Costs (per Mcfe) | 1.07 | 1.07 | — | — | % | |||||||||
Average Marcellus Depreciation, Depletion and Amortization Costs (per Mcfe) | 0.92 | 0.99 | (0.07 | ) | (7.1 | )% | ||||||||
Total Average Marcellus Costs (per Mcfe) | $ | 2.19 | $ | 2.30 | $ | (0.11 | ) | (4.8 | )% | |||||
Average Margin for Marcellus (per Mcfe) | $ | 0.38 | $ | 0.34 | $ | 0.04 | 11.8 | % | ||||||
* NGLs and Condensate are converted to Mcfe at the rate of one barrel equals six Mcf based upon the approximate relative energy content of oil and natural gas, which is not indicative of the relationship of oil, NGLs, condensate, and natural gas prices.
The Marcellus segment had natural gas, NGLs and oil sales of $646 million for the year ended December 31, 2017 compared to $415 million for the year ended December 31, 2016. The $231 million increase is primarily due to the 33.7% increase in the average gas sales price as well as the 12.7% increase in total Marcellus sales volumes in the period-to-period comparison. The increase in sales volumes was primarily due to the termination of the Marcellus Joint Venture with Noble Energy in the fourth quarter of 2016, which resulted in each party owning and operating a 100% interest in certain wells in two separate operating areas (see Note 7 - Property, Plant and Equipment in the Notes to the Audited Consolidated Financial Statements in Item 8 of this Form 10-K for additional details) as well as additional wells being turned in line in the current period.
The decrease in the total average Marcellus sales price was primarily the result of changes in the fair value of commodity derivative instruments resulting from the Company's hedging program. The notional amounts associated with these financial hedges represented approximately 177.6 Bcf of the Company's produced Marcellus gas sales volumes for the year ended December 31, 2017 at an average loss of $0.17 per Mcf. For the year ended December 31, 2016, these financial hedges represented approximately 160.8 Bcf at an average gain of $0.92 per Mcf. The $0.93 per Mcf change in the fair value of the commodity derivative instruments was offset, in part, by the $0.63 per Mcf increase in gas market prices, along with a $0.12 per Mcfe increase in the uplift from NGLs and condensate sales volumes, when excluding the impact of hedging.
Total operating costs and expenses for the Marcellus segment were $525 million for the year ended December 31, 2017 compared to $490 million for the year ended December 31, 2016. The increase in total dollars and decrease in unit costs for the Marcellus segment were due primarily to the following items:
•Marcellus lease operating expense was $32 million for the year ended December 31, 2017 compared to $34 million for the year ended December 31, 2016. The decrease in total dollars was primarily due to a reduction in salt water disposal costs and equipment rental expense in the current period. The decrease in unit costs was primarily due to the 12.7% increase in total Marcellus sales volumes, along with the decrease in total dollars described above.
45
•Marcellus production, ad valorem, and other fees were $15 million for the year ended December 31, 2017 compared to $17 million for the year ended December 31, 2016. The decrease in total dollars was primarily due to a change in production mix by state as a result of the termination of the Marcellus joint venture with Noble Energy, offset, in part, by the increase in average gas sales price. The decrease in unit costs was due to the decrease in total dollars described above, as well as the 12.7% increase in total Marcellus sales volumes.
•Marcellus transportation, gathering and compression costs were $256 million for the year ended December 31, 2017 compared to $228 million for the year ended December 31, 2016. The $28 million increase in total dollars was primarily related to an increase in the CNXM gathering fee due to the increase in total Marcellus sales volumes (See Note 20 - Related Party Transactions of the Notes to the Audited Consolidated Financial Statements in Item 8 of this Form 10-K for additional information), and an increase in processing fees associated with NGLs primarily due to the 17.4% increase in NGL sales volumes.
•Depreciation, depletion and amortization costs attributable to the Marcellus segment were $222 million for the year ended December 31, 2017 compared to $211 million for the year ended December 31, 2016. These amounts included depletion on a unit of production basis of $0.91 per Mcf and $0.98 per Mcf, respectively. The remaining depreciation, depletion and amortization costs were either recorded on a straight-line basis or related to gas well closing.
UTICA SEGMENT
The Utica segment had earnings before income tax of $65 million for the year ended December 31, 2017 compared to earnings before income tax of $28 million for the year ended December 31, 2016.
For the Years Ended December 31, | ||||||||||||||
2017 | 2016 | Variance | Percent Change | |||||||||||
Utica Gas Sales Volumes (Bcf) | 70.7 | 71.3 | (0.6 | ) | (0.8 | )% | ||||||||
NGLs Sales Volumes (Bcfe)* | 11.1 | 16.7 | (5.6 | ) | (33.5 | )% | ||||||||
Oil Sales Volumes (Bcfe)* | 0.2 | — | 0.2 | 100.0 | % | |||||||||
Condensate Sales Volumes (Bcfe)* | 1.0 | 2.8 | (1.8 | ) | (64.3 | )% | ||||||||
Total Utica Sales Volumes (Bcfe)* | 83.0 | 90.8 | (7.8 | ) | (8.6 | )% | ||||||||
Average Sales Price - Gas (per Mcf) | $ | 2.29 | $ | 1.52 | $ | 0.77 | 50.7 | % | ||||||
Gain on Commodity Derivative Instruments - Cash Settlement- Gas (per Mcf) | $ | 0.02 | $ | 0.41 | $ | (0.39 | ) | (95.1 | )% | |||||
Average Sales Price - NGLs (per Mcfe)* | $ | 4.20 | $ | 2.49 | $ | 1.71 | 68.7 | % | ||||||
Average Sales Price - Oil (per Mcfe)* | $ | 7.31 | $ | — | $ | 7.31 | 100.0 | % | ||||||
Average Sales Price - Condensate (per Mcfe)* | $ | 6.88 | $ | 4.78 | $ | 2.10 | 43.9 | % | ||||||
Total Average Utica Sales Price (per Mcfe) | $ | 2.63 | $ | 2.12 | $ | 0.51 | 24.1 | % | ||||||
Average Utica Lease Operating Expenses (per Mcfe) | 0.23 | 0.25 | (0.02 | ) | (8.0 | )% | ||||||||
Average Utica Production, Ad Valorem, and Other Fees (per Mcfe) | 0.06 | 0.05 | 0.01 | 20.0 | % | |||||||||
Average Utica Transportation, Gathering and Compression Costs (per Mcfe) | 0.54 | 0.57 | (0.03 | ) | (5.3 | )% | ||||||||
Average Utica Depreciation, Depletion and Amortization Costs (per Mcfe) | 1.02 | 0.94 | 0.08 | 8.5 | % | |||||||||
Total Average Utica Costs (per Mcfe) | $ | 1.85 | $ | 1.81 | $ | 0.04 | 2.2 | % | ||||||
Average Margin for Utica (per Mcfe) | $ | 0.78 | $ | 0.31 | $ | 0.47 | 151.6 | % | ||||||
*NGLs and Condensate are converted to Mcfe at the rate of one barrel equals six mcf based upon the approximate relative energy content of oil and natural gas, which is not indicative of the relationship of oil, NGLs, condensate, and natural gas prices.
The Utica segment had natural gas, NGLs and oil sales of $217 million for the year ended December 31, 2017 compared to $163 million for the year ended December 31, 2016. The $54 million increase was primarily due to the 50.7% increase in average gas sales price, offset, in part, by the 8.6% decrease in total Utica sales volumes. The 7.8 Bcfe decrease in total Utica sales volumes primarily related to normal well declines in the wet gas joint venture production areas offset in part by increased production in the 100% CNX controlled dry Utica production areas resulting from the Company’s 2017 capital investments.
46
The increase in the total average Utica sales price was primarily due to the $0.77 increase in average gas sales price, offset, in part, by the $0.39 per Mcf decrease in the gain on commodity derivative instruments in the current period. The notional amounts associated with these financial hedges represented approximately 39.8 Bcf of the Company's produced Utica gas sales volumes for the year ended December 31, 2017 at an average gain of $0.04 per Mcf. For the year ended December 31, 2016, these financial hedges represented approximately 31.6 Bcf at an average gain of $0.93 per Mcf.
Total operating costs and expenses for the Utica segment were $153 million for the year ended December 31, 2017 compared to $164 million for the year ended December 31, 2016. The decrease in total dollars and increase in unit costs for the Utica segment are due to the following items:
•Utica lease operating expense decreased to $19 million for the year ended December 31, 2017, compared to $22 million for the year ended December 31, 2016. The decrease in total dollars was due to a reduction in repairs and maintenance costs and lower production volumes. The decrease in unit costs was due to the decrease in repairs and maintenance costs and a shift in production mix to lower cost dry Utica production.
•Utica production, ad valorem, and other fees were $5 million for each of the years ended December 31, 2017 and December 31, 2016. The increase in unit costs was due the decrease in total Utica sales volumes
•Utica transportation, gathering and compression costs were $45 million for the year ended December 31, 2017 compared to $51 million for the year ended December 31, 2016. The $6 million decrease in total dollars was primarily related to decreased gathering and processing fees associated with the decreased Utica NGLs and gas sales volumes. The decrease in unit costs was due to the decrease in total Utica sales volumes, predominantly in the wet areas that require additional processing offset, in part, by the increase in the lower cost dry Utica production.
•Depreciation, depletion and amortization costs attributable to the Utica segment were $84 million for the year ended December 31, 2017 compared to $86 million for the year ended December 31, 2016. These amounts included depletion on a unit of production basis of $1.01 per Mcf and $0.93 per Mcf, respectively. The remaining depreciation, depletion and amortization costs were either recorded on a straight-line basis or related to gas well closing.
COALBED METHANE (CBM) SEGMENT
The CBM segment had earnings before income tax of $20 million for the year ended December 31, 2017 compared to earnings before income tax of $38 million for the year ended December 31, 2016.
For the Years Ended December 31, | ||||||||||||||
2017 | 2016 | Variance | Percent Change | |||||||||||
CBM Gas Sales Volumes (Bcf) | 65.4 | 69.0 | (3.6 | ) | (5.2 | )% | ||||||||
Average Sales Price - Gas (per Mcf) | $ | 3.19 | $ | 2.53 | $ | 0.66 | 26.1 | % | ||||||
(Loss) Gain on Commodity Derivative Instruments - Cash Settlement- Gas (per Mcf) | $ | (0.15 | ) | $ | 0.76 | $ | (0.91 | ) | (119.7 | )% | ||||
Total Average CBM Sales Price (per Mcf) | $ | 3.05 | $ | 3.29 | $ | (0.24 | ) | (7.3 | )% | |||||
Average CBM Lease Operating Expenses (per Mcf) | 0.39 | 0.36 | 0.03 | 8.3 | % | |||||||||
Average CBM Production, Ad Valorem, and Other Fees (per Mcf) | 0.11 | 0.09 | 0.02 | 22.2 | % | |||||||||
Average CBM Transportation, Gathering and Compression Costs (per Mcf) | 0.98 | 1.04 | (0.06 | ) | (5.8 | )% | ||||||||
Average CBM Depreciation, Depletion and Amortization Costs (per Mcf) | 1.26 | 1.25 | 0.01 | 0.8 | % | |||||||||
Total Average CBM Costs (per Mcf) | $ | 2.74 | $ | 2.74 | $ | — | — | % | ||||||
Average Margin for CBM (per Mcf) | $ | 0.31 | $ | 0.55 | $ | (0.24 | ) | (43.6 | )% | |||||
The CBM segment had natural gas sales of $209 million for the year ended December 31, 2017 compared to $175 million for the year ended December 31, 2016. The $34 million increase was due to a 26.1% increase in the average gas sales price, offset, in part, by the 5.2% decrease in CBM gas sales volumes. The decrease in CBM sales volumes was primarily due to normal well declines and less drilling activity.
47
The total average CBM sales price decreased $0.24 per Mcf due primarily to changes in fair value of the commodity derivative instruments resulting from the Company's hedging program. The notional amounts associated with these financial hedges represented approximately 56.3 Bcf of the Company's produced CBM sales volumes for the year ended December 31, 2017 at an average loss of $0.17 per Mcf. For the year ended December 31, 2016, these financial hedges represented approximately 55.0 Bcf at an average gain of $0.95 per Mcf. The $0.91 per Mcf change in fair value of the commodity derivative instruments was offset, in part, by a $0.66 per Mcf increase in market prices.
Total operating costs and expenses for the CBM segment were $179 million for the year ended December 31, 2017 compared to $189 million for the year ended December 31, 2016. The decrease in total dollars was due to the following items:
•CBM lease operating expense remained consistent at $25 million for the years ended December 31, 2017 and December 31, 2016. The increase in unit costs was due to the decrease in CBM gas sales volumes.
•CBM production, ad valorem, and other fees were $7 million for the year ended December 31, 2017 compared to $6 million for the year ended December 31, 2016. The $1 million increase was due to an increase in severance tax expense resulting from the increase in the average gas sales price, partially offset by the decrease in production volumes. Unit costs were negatively impacted by the increase in total average gas sales price which was offset, in part, by the decrease in CBM gas sales volumes.
•CBM transportation, gathering and compression costs were $64 million for the year ended December 31, 2017 compared to $72 million for the year ended December 31, 2016. The $8 million decrease was primarily related to a decrease in repairs and maintenance expense and power fees resulting from cost cutting measures implemented by management as well as a decrease in utilized firm transportation expense resulting from the decrease in CBM gas sales volumes. Unit costs were also positively impacted by the decrease in total dollars which was offset, in part, by the decrease in CBM gas sales volumes.
•Depreciation, depletion and amortization costs attributable to the CBM segment were $83 million for the year ended December 31, 2017 compared to $86 million for the year ended December 31, 2016. These amounts included depletion on a unit of production basis of $0.78 per Mcf and $0.82 per Mcf, respectively. The remaining depreciation, depletion and amortization costs were either recorded on a straight-line basis or related to gas well closing.
48
OTHER GAS SEGMENT
The Other Gas segment had earnings before income tax of $15 million for the year ended December 31, 2017 compared to a loss before income tax of $446 million for the year ended December 31, 2016.
For the Years Ended December 31, | ||||||||||||||
2017 | 2016 | Variance | Percent Change | |||||||||||
Other Gas Sales Volumes (Bcf) | 19.2 | 21.7 | (2.5 | ) | (11.5 | )% | ||||||||
Oil Sales Volumes (Bcfe)* | 0.2 | 0.4 | (0.2 | ) | (50.0 | )% | ||||||||
Total Other Sales Volumes (Bcfe)* | 19.4 | 22.1 | (2.7 | ) | (12.2 | )% | ||||||||
Average Sales Price - Gas (per Mcf) | $ | 2.69 | $ | 1.79 | $ | 0.90 | 50.3 | % | ||||||
(Loss) Gain on Commodity Derivative Instruments - Cash Settlement- Gas (per Mcf) | $ | (0.14 | ) | $ | 0.75 | $ | (0.89 | ) | (118.7 | )% | ||||
Average Sales Price - Oil (per Mcfe)* | $ | 7.75 | $ | 6.23 | $ | 1.52 | 24.4 | % | ||||||
Total Average Other Sales Price (per Mcfe) | $ | 2.62 | $ | 2.61 | $ | 0.01 | 0.4 | % | ||||||
Average Other Lease Operating Expenses (per Mcfe) | 0.63 | 0.69 | (0.06 | ) | (8.7 | )% | ||||||||
Average Other Production, Ad Valorem, and Other Fees (per Mcfe) | 0.12 | 0.12 | — | — | % | |||||||||
Average Other Transportation, Gathering and Compression Costs (per Mcfe) | 0.90 | 1.07 | (0.17 | ) | (15.9 | )% | ||||||||
Average Other Depreciation, Depletion and Amortization Costs (per Mcfe) | 1.05 | 1.49 | (0.44 | ) | (29.5 | )% | ||||||||
Total Average Other Costs (per Mcfe) | $ | 2.70 | $ | 3.37 | $ | (0.67 | ) | (19.9 | )% | |||||
Average Margin for Other (per Mcfe) | $ | (0.08 | ) | $ | (0.76 | ) | $ | 0.68 | 89.5 | % | ||||
*Oil is converted to Mcfe at the rate of one barrel equals six mcf based upon the approximate relative energy content of oil and natural gas, which is not indicative of the relationship of oil and natural gas prices.
The Other Gas segment includes activity not assigned to the Marcellus, Utica, or CBM segments. This segment also includes purchased gas activity, unrealized gain or loss on commodity derivative instruments, exploration and production related other costs, impairment of exploration and production properties and other operational activity not assigned to a specific segment.
Other Gas sales volumes are primarily related to shallow oil and gas production. Natural gas, NGLs and oil sales related to the Other Gas segment were $53 million for the year ended December 31, 2017 compared to $40 million for the year ended December 31, 2016. The increase in natural gas and oil sales resulted from the $0.90 per Mcf increase in average gas sales price. Total exploration and production costs related to these other sales were $56 million for the year ended December 31, 2017 compared to $78 million for the year ended December 31, 2016. The decrease was primarily due to a decrease in depreciation, depletion and amortization costs as a result of certain assets becoming fully depreciated in the current period as well as the sale of Knox Energy in the second quarter of 2017 (See Note 3 - Acquisitions and Dispositions in the Notes to the Audited Consolidated Financial Statements in Item 8 of this Form 10-K for additional information).
The Other Gas segment recognized an unrealized gain on commodity derivative instruments of $248 million as well as cash settlements paid of $2 million for the year ended December 31, 2017. For the year ended December 31, 2016, the Company recognized an unrealized loss on commodity derivative instruments of $386 million as well as cash settlements received of $17 million. The unrealized gain/loss on commodity derivative instruments represents changes in the fair value of all of the Company's existing commodity hedges on a mark-to-market basis.
Purchased gas volumes represent volumes of gas purchased at market prices from third-parties and then resold in order to fulfill contracts with certain customers. Purchased gas sales revenues were $54 million for the year ended December 31, 2017 compared to $43 million for the year ended December 31, 2016. Purchased gas costs were $53 million for the year ended December 31, 2017 compared to $43 million for the year ended December 31, 2016. The period-to-period increase in purchased gas sales revenue was primarily due to the increase in market prices, as well as the increase in purchased gas sales volumes.
49
For the Years Ended December 31, | ||||||||||||||
2017 | 2016 | Variance | Percent Change | |||||||||||
Purchased Gas Sales Volumes (in billion cubic feet) | 22.0 | 21.7 | 0.3 | 1.4 | % | |||||||||
Average Sales Price (per Mcf) | $ | 2.44 | $ | 1.99 | $ | 0.45 | 22.6 | % | ||||||
Average Cost (per Mcf) | $ | 2.39 | $ | 1.97 | $ | 0.42 | 21.3 | % | ||||||
Other operating income was $69 million for the year ended December 31, 2017 compared to $65 million for the year ended December 31, 2016. The $4 million increase was primarily due to the following items:
For the Years Ended December 31, | ||||||||||||||
(in millions) | 2017 | 2016 | Variance | Percent Change | ||||||||||
Water Income | $ | 5 | $ | 1 | $ | 4 | 400.0 | % | ||||||
Gathering Income | 11 | 11 | — | — | % | |||||||||
Equity in Earnings of Affiliates | 50 | 53 | (3 | ) | (5.7 | )% | ||||||||
Other | 3 | — | 3 | 100.0 | % | |||||||||
Total Other Operating Income | $ | 69 | $ | 65 | $ | 4 | 6.2 | % | ||||||
• | Water Income increased $4 million due to increased sales of freshwater to third parties for hydraulic fracturing. |
• | Equity in Earnings of Affiliates decreased $3 million primarily due to a decrease in earnings from Buchanan Generation, LLC. |
Impairment of Exploration and Production Properties of $138 million for the year ended December 31, 2017 related to an impairment in the carrying value of Knox Energy in the first quarter of 2017. See Note 1 - Significant Accounting Policies in the Notes to the Audited Consolidated Financial Statements in Item 8 of this Form 10-K for additional information. No such impairments occurred in the prior year.
Exploration and production related other costs were $48 million for the year ended December 31, 2017 compared to $15 million for the year ended December 31, 2016. The $33 million increase in costs is primarily related to the following items:
For the Years Ended December 31, | ||||||||||||||
(in millions) | 2017 | 2016 | Variance | Percent Change | ||||||||||
Lease Expiration Costs | $ | 40 | $ | 7 | $ | 33 | 471.4 | % | ||||||
Land Rentals | 4 | 4 | — | — | % | |||||||||
Permitting Expense | 1 | 2 | (1 | ) | (50.0 | )% | ||||||||
Other | 3 | 2 | 1 | 50.0 | % | |||||||||
Total Exploration and Production Related Other Costs | $ | 48 | $ | 15 | $ | 33 | 220.0 | % | ||||||
• | Lease Expiration Costs relate to leases where the primary term expired or will expire within the next 12 months. The $33 million increase in the period-to-period comparison is due to an increase in the number of leases that were allowed to expire in the year ended December 31, 2017, or will expire within the next 12 months, because they were no longer in the Company's future drilling plan. Additionally, approximately $10 million of the $33 million increase is associated with leases which have ceased production. |
50
Other operating expense was $112 million for the year ended December 31, 2017 compared to $89 million for the year ended December 31, 2016. The $23 million increase in the period-to-period comparison was made up of the following items:
For the Years Ended December 31, | ||||||||||||||
2017 | 2016 | Variance | Percent Change | |||||||||||
Idle Rig Expense | $ | 41 | $ | 33 | $ | 8 | 24.2 | % | ||||||
Unutilized Firm Transportation and Processing Fees | 50 | 37 | 13 | 35.1 | % | |||||||||
Litigation Settlements | 3 | 1 | 2 | 200.0 | % | |||||||||
Severance Expense | 1 | 1 | — | — | % | |||||||||
Insurance Expense | 3 | 3 | — | — | % | |||||||||
Other | 14 | 14 | — | — | % | |||||||||
Total Other Operating Expense | $ | 112 | $ | 89 | $ | 23 | 25.8 | % | ||||||
• | Idle Rig Expense increased $8 million due to the temporary idling of some of the Company's natural gas rigs. Additionally, the total idle rig expense increased in the period-to-period comparison due to a settlement that was reached with a former joint-venture partner that resulted in CNX recording additional expense. |
• | Unutilized Firm Transportation and Processing Fees represent pipeline transportation capacity obtained to enable gas production to flow uninterrupted as sales volumes increase, as well as additional processing capacity for NGLs. The increase in the period-to-period comparison was primarily due to the decrease in the utilization of capacity. The Company attempts to minimize this expense by releasing (selling) unutilized firm transportation capacity to other parties when possible and when beneficial. The revenue received when this capacity is released (sold) is included in Gathering Income in other operating income above. |
51
Results of Operations: Year Ended December 31, 2016 Compared with the Year Ended December 31, 2015
Net Loss
CNX reported a net loss of $848 million, or a loss per diluted share of $3.70, for the year ended December 31, 2016, compared to a net loss of $375 million, or a loss of $1.64 per diluted share, for the year ended December 31, 2015.
For the Years Ended December 31, | |||||||||||
(Dollars in thousands) | 2016 | 2015 | Variance | ||||||||
Loss from Continuing Operations | $ | (550,945 | ) | $ | (650,198 | ) | $ | 99,253 | |||
(Loss) Income from Discontinued Operations, net | (297,157 | ) | 275,313 | (572,470 | ) | ||||||
Net Loss | $ | (848,102 | ) | $ | (374,885 | ) | $ | (473,217 | ) | ||
CNX's principal activity is to produce pipeline quality natural gas for sale primarily to gas wholesalers. The Company's reportable segments are Marcellus Shale, Utica Shale, Coalbed Methane, and Other Gas.
CNX had a loss from continuing operations before income tax of $585 million for the year ended December 31, 2016, compared to a loss from continuing operations before income tax of $931 million for the year ended December 31, 2015. Included in the 2016 net loss before income tax was an unrealized loss on commodity derivative instruments of $386 million and a gain on sale of assets of $14 million. Included in the 2015 loss before income tax was a loss of $829 million primarily related to the impairment of the carrying value of CNX's shallow oil and natural gas assets due to depressed NYMEX forward strip prices (see Note 1 - Significant Accounting Policies in the Notes to the Audited Consolidated Financial Statements in Item 8 of this Form 10-K for additional information). The impairment loss was partially offset by an unrealized gain on commodity derivative instruments of $197 million and a gain on sale of assets of $61 million. See Note 3 - Acquisitions and Dispositions in the Notes to the Audited Consolidated Financial Statements in Item 8 of this Form 10-K for additional information.
The following table presents a breakout of net liquid and natural gas sales information to assist in the understanding of the Company’s natural gas production and sales portfolio.
For the Years Ended December 31, | |||||||||||||||
in thousands (unless noted) | 2016 | 2015 | Variance | Percent Change | |||||||||||
LIQUIDS | |||||||||||||||
NGLs: | |||||||||||||||
Sales Volume (MMcfe) | 40,260 | 33,180 | 7,080 | 21.3 | % | ||||||||||
Sales Volume (Mbbls) | 6,710 | 5,530 | 1,180 | 21.3 | % | ||||||||||
Gross Price ($/Bbl) | $ | 14.52 | $ | 12.30 | $ | 2.22 | 18.0 | % | |||||||
Gross Revenue | $ | 97,580 | $ | 68,057 | $ | 29,523 | 43.4 | % | |||||||
Oil: | |||||||||||||||
Sales Volume (MMcfe) | 410 | 592 | (182 | ) | (30.7 | )% | |||||||||
Sales Volume (Mbbls) | 68 | 99 | (31 | ) | (31.3 | )% | |||||||||
Gross Price ($/Bbl) | $ | 36.90 | $ | 47.94 | $ | (11.04 | ) | (23.0 | )% | ||||||
Gross Revenue | $ | 2,521 | $ | 4,736 | $ | (2,215 | ) | (46.8 | )% | ||||||
Condensate: | |||||||||||||||
Sales Volume (MMcfe) | 4,964 | 7,598 | (2,634 | ) | (34.7 | )% | |||||||||
Sales Volume (Mbbls) | 827 | 1,266 | (439 | ) | (34.7 | )% | |||||||||
Gross Price ($/Bbl) | $ | 27.48 | $ | 26.52 | $ | 0.96 | 3.6 | % | |||||||
Gross Revenue | $ | 22,748 | $ | 33,586 | $ | (10,838 | ) | (32.3 | )% | ||||||
GAS | |||||||||||||||
Sales Volume (MMcf) | 348,753 | 287,287 | 61,466 | 21.4 | % | ||||||||||
Sales Price ($/Mcf) | $ | 1.92 | $ | 2.17 | $ | (0.25 | ) | (11.5 | )% | ||||||
Gross Revenue | $ | 670,823 | $ | 622,080 | $ | 48,743 | 7.8 | % | |||||||
Hedging Impact ($/Mcf) | $ | 0.70 | $ | 0.68 | $ | 0.02 | 2.9 | % | |||||||
Gain on Commodity Derivative Instruments - Cash Settlement | $ | 245,212 | $ | 196,348 | $ | 48,864 | 24.9 | % | |||||||
52
Natural gas, NGLs, and oil sales were $793 million for the year ended December 31, 2016, compared to $727 million for the year ended December 31, 2015. The increase was primarily due to the 20.0% increase in total sales volumes, offset in part by the 11.5% decrease in the average gas sales price per Mcf without the impact of derivative instruments. The decrease in average sales price was the result of the overall decrease in general market prices.
Sales volumes, average sales price (including the effects of derivative instruments), and average costs for all active operations were as follows:
For the Years Ended December 31, | ||||||||||||||
2016 | 2015 | Variance | Percent Change | |||||||||||
Sales Volumes (Bcfe) | 394.4 | 328.7 | 65.7 | 20.0 | % | |||||||||
Average Sales Price (per Mcfe) | $ | 2.63 | $ | 2.81 | $ | (0.18 | ) | (6.4 | )% | |||||
Average Costs (per Mcfe) | 2.32 | 2.62 | (0.30 | ) | (11.5 | )% | ||||||||
Average Margin | $ | 0.31 | $ | 0.19 | $ | 0.12 | 63.2 | % | ||||||
The decrease in average sales price was primarily the result of a $0.25 Mcf decrease in general market prices in the Appalachian basin during the current period, as well as an overall decrease in natural gas liquids pricing. The increase was offset, in part, by a $0.02 Mcf increase in the realized gain on commodity derivative instruments related to the Company's hedging program.
Changes in the average costs per Mcfe were primarily related to the following items:
• | Depreciation, depletion, and amortization decreased on a per-unit basis primarily due to a reduction in Marcellus rates as a result of an increase in the Company's Marcellus reserves. See Note 7 - Property, Plant, and Equipment in the Notes to the Audited Consolidated Financial Statements in Item 8 of this Form 10-K for additional details. |
• | Lease operating expense decreased on a per unit basis in the period-to-period comparison due to a decrease in well tending costs and salt water disposal costs, as well as a decrease in both Company operated and joint venture operated repairs and maintenance costs. |
• | Transportation, gathering, and compression expense decreased on a per unit basis in the period-to-period comparison due to the overall increase in sales volumes, the shift towards dry Utica Shale production which has lower gathering costs, and a decrease in pipeline and facility maintenance expense. |
Certain costs and expenses such as selling, general and administrative, other expense, gain on sale of assets, loss on debt extinguishment, interest expense and income taxes are unallocated expenses and therefore are excluded from the per unit costs above as well as segment reporting. Below is a summary of these costs and expenses:
Selling, General and Administrative
SG&A costs include costs such as overhead, including employee wages and benefit costs, short-term incentive compensation, costs of maintaining our headquarters, audit and other professional fees, and legal compliance expenses. SG&A costs also includes noncash equity-based compensation expense.
SG&A costs were $105 million for the year ended December 31, 2016, compared to $102 million for the year ended December 31, 2015. SG&A costs increased due to an increase in short-term incentive compensation expense offset, in part, by a decrease in employee wages and benefit costs due to the Company reorganization that occurred in the second half of 2015 and first quarter of 2016, which resulted in an overall decrease in employees.
53
Other Expense
For the Years Ended December 31, | ||||||||||||||
(in millions) | 2016 | 2015 | Variance | Percent Change | ||||||||||
Other Income | ||||||||||||||
Royalty Income | $ | 10 | $ | — | $ | 10 | 100.0 | % | ||||||
Right of Way Sales | 15 | 6 | 9 | 150.0 | % | |||||||||
Interest Income | — | 2 | (2 | ) | (100.0 | )% | ||||||||
Other | 4 | 4 | — | — | % | |||||||||
Total Other Income | $ | 29 | $ | 12 | $ | 17 | 141.7 | % | ||||||
Other Expense | ||||||||||||||
Bank Fees | $ | 13 | $ | 13 | $ | — | — | % | ||||||
Severance | 1 | 6 | (5 | ) | (83.3 | )% | ||||||||
Other Corporate Expense | 15 | 17 | (2 | ) | (11.8 | )% | ||||||||
Other Land Rental Expense | 5 | 14 | (9 | ) | (64.3 | )% | ||||||||
Total Other Expense | $ | 34 | $ | 50 | $ | (16 | ) | (32.0 | )% | |||||
Total Other Expense | $ | 5 | $ | 38 | $ | (33 | ) | (86.8 | )% | |||||
Gain on Sale of Assets
CNX recognized a gain on sale of assets of $14 million in the year ended December 31, 2016 compared to a gain of $61 million in the year ended December 31, 2015. The $47 million decrease was primarily due to sale of CNX's interest in its Western Allegheny Energy joint venture that occurred in the year ended December 31, 2015. No individually significant transactions occurred in the year ended December 31, 2016. See Note 3 - Acquisitions and Dispositions in the Notes to the Audited Consolidated Financial Statements in Item 8 of this Form 10-K for additional information.
Loss on Debt Extinguishment
Loss on debt extinguishment of $68 million was recognized in the year ended December 31, 2015 due to the purchase of a portion of the 8.25% senior notes due in April 2020 and the 6.375% senior notes due in March 2021.
Interest Expense
Interest expense of $182 million was recognized in the year ended December 31, 2016, compared to $199 million in the year ended December 31, 2015. The $17 million decrease was primarily due to the Company's revolving credit facility having no outstanding borrowings during the year ended December 31, 2016, compared to $952 million of outstanding borrowings at December 31, 2015. This decrease was also due to the partial payoff of the 2020 and 2021 bonds during the year ended December 31, 2015.
Income Taxes
The effective income tax rate for continuing operations was 6.0% for the year ended December 31, 2016, compared to 30.2% for the year ended December 31, 2015. During the year ended December 31, 2016, CNX settled a Federal audit of the years 2010-2013 and received a favorable private letter ruling from the IRS related to bonus depreciation. Overall, the Company received approximately $21 million in refunds during 2016. Some of the factors contributing to the refunds received during 2016 put pressure on deferred tax assets related to alternative minimum tax credits. Although these credits never expire, management could not demonstrate sufficient positive evidence to ensure realizability of these assets in the foreseeable future and as a result, the Company recorded a valuation allowance of $167 million at December 31, 2016. An additional $38 million valuation allowance was recorded at December 31, 2016 against state deferred tax assets, as well as federal charitable contributions and foreign tax credit carry-forwards.
54
See Note 5 - Income Taxes in the Notes to the Audited Consolidated Financial Statements in Item 8 of this Form 10-K for additional information.
For the Years Ended December 31, | ||||||||||||||
2016 | 2015 | Variance | Percent Change | |||||||||||
Total Company Loss Before Income Tax | $ | (585 | ) | $ | (931 | ) | $ | 346 | (37.2 | )% | ||||
Income Tax Benefit | $ | (34 | ) | $ | (280 | ) | $ | 246 | (87.7 | )% | ||||
Effective Income Tax Rate | 6.0 | % | 30.2 | % | (24.2 | )% | ||||||||
TOTAL OPERATING SEGMENT ANALYSIS for the year ended December 31, 2016 compared to the year ended December 31, 2015:
CNX operating segments had a loss before income tax of $308 million for the year ended December 31, 2016 compared to a loss before income tax of $585 million for the year ended December 31, 2015. Variances by individual operating segment are discussed below.
For the Year Ended | Difference to Year Ended | ||||||||||||||||||||||||||||||||||||||
December 31, 2016 | December 31, 2015 | ||||||||||||||||||||||||||||||||||||||
(in millions) | Marcellus | Utica | CBM | Other Gas | Total | Marcellus | Utica | CBM | Other Gas | Total | |||||||||||||||||||||||||||||
Natural Gas, NGLs and Oil Sales | $ | 415 | $ | 163 | $ | 175 | $ | 40 | $ | 793 | $ | 36 | $ | 70 | $ | (27 | ) | $ | (13 | ) | $ | 66 | |||||||||||||||||
Gain (Loss) on Commodity Derivative Instruments | 147 | 29 | 52 | (369 | ) | (141 | ) | 46 | 23 | (15 | ) | (588 | ) | (534 | ) | ||||||||||||||||||||||||
Purchased Gas Sales | — | — | — | 43 | 43 | — | — | — | 29 | 29 | |||||||||||||||||||||||||||||
Other Operating Income | — | — | — | 65 | 65 | — | — | — | — | — | |||||||||||||||||||||||||||||
Total Revenue and Other Operating Income | 562 | 192 | 227 | (221 | ) | 760 | 82 | 93 | (42 | ) | (572 | ) | (439 | ) | |||||||||||||||||||||||||
Lease Operating Expense | 34 | 22 | 25 | 15 | 96 | (10 | ) | — | (8 | ) | (8 | ) | (26 | ) | |||||||||||||||||||||||||
Production, Ad Valorem, and Other Fees | 17 | 5 | 6 | 3 | 31 | (1 | ) | 3 | (1 | ) | — | 1 | |||||||||||||||||||||||||||
Transportation, Gathering and Compression | 228 | 51 | 72 | 23 | 374 | 28 | 16 | (13 | ) | — | 31 | ||||||||||||||||||||||||||||
Depreciation, Depletion and Amortization | 211 | 86 | 86 | 37 | 420 | 49 | 27 | 2 | (30 | ) | 48 | ||||||||||||||||||||||||||||
Impairment of Exploration and Production Properties | — | — | — | — | — | — | — | — | (829 | ) | (829 | ) | |||||||||||||||||||||||||||
Exploration and Production Related Other Costs | — | — | — | 15 | 15 | — | — | — | 5 | 5 | |||||||||||||||||||||||||||||
Purchased Gas Costs | — | — | — | 43 | 43 | — | — | — | 32 | 32 | |||||||||||||||||||||||||||||
Other Operating Expense | — | — | — | 89 | 89 | — | — | — | 22 | 22 | |||||||||||||||||||||||||||||
Total Operating Costs and Expenses | 490 | 164 | 189 | 225 | 1,068 | 66 | 46 | (20 | ) | (808 | ) | (716 | ) | ||||||||||||||||||||||||||
Earnings (Loss) Before Income Tax | $ | 72 | $ | 28 | $ | 38 | $ | (446 | ) | $ | (308 | ) | $ | 16 | $ | 47 | $ | (22 | ) | $ | 236 | $ | 277 | ||||||||||||||||
55
MARCELLUS SEGMENT
The Marcellus segment had earnings before income tax of $72 million for the year ended December 31, 2016 compared to earnings before income tax of $56 million for the year ended December 31, 2015.
For the Years Ended December 31, | ||||||||||||||
2016 | 2015 | Variance | Percent Change | |||||||||||
Marcellus Gas Sales Volumes (Bcf) | 186.8 | 149.4 | 37.4 | 25.0 | % | |||||||||
NGLs Sales Volumes (Bcfe)* | 23.5 | 19.0 | 4.5 | 23.7 | % | |||||||||
Condensate Sales Volumes (Bcfe)* | 2.2 | 3.9 | (1.7 | ) | (43.6 | )% | ||||||||
Total Marcellus Sales Volumes (Bcfe)* | 212.5 | 172.3 | 40.2 | 23.3 | % | |||||||||
Average Sales Price - Gas (per Mcf) | $ | 1.87 | $ | 2.09 | $ | (0.22 | ) | (10.5 | )% | |||||
Gain on Commodity Derivative Instruments - Cash Settlement- Gas (per Mcf) | $ | 0.79 | $ | 0.67 | $ | 0.12 | 17.9 | % | ||||||
Average Sales Price - NGLs (per Mcfe)* | $ | 2.38 | $ | 2.54 | $ | (0.16 | ) | (6.3 | )% | |||||
Average Sales Price - Condensate (per Mcfe)* | $ | 4.32 | $ | 5.02 | $ | (0.70 | ) | (13.9 | )% | |||||
Total Average Marcellus Sales Price (per Mcfe) | $ | 2.64 | $ | 2.79 | $ | (0.15 | ) | (5.4 | )% | |||||
Average Marcellus Lease Operating Expenses (per Mcfe) | 0.16 | 0.26 | (0.10 | ) | (38.5 | )% | ||||||||
Average Marcellus Production, Ad Valorem, and Other Fees (per Mcfe) | 0.08 | 0.10 | (0.02 | ) | (20.0 | )% | ||||||||
Average Marcellus Transportation, Gathering and Compression Costs (per Mcfe) | 1.07 | 1.16 | (0.09 | ) | (7.8 | )% | ||||||||
Average Marcellus Depreciation, Depletion and Amortization Costs (per Mcfe) | 0.99 | 0.94 | 0.05 | 5.3 | % | |||||||||
Total Average Marcellus Costs (per Mcfe) | $ | 2.30 | $ | 2.46 | $ | (0.16 | ) | (6.5 | )% | |||||
Average Margin for Marcellus (per Mcfe) | $ | 0.34 | $ | 0.33 | $ | 0.01 | 3.0 | % | ||||||
* NGLs and Condensate are converted to Mcfe at the rate of one barrel equals six Mcf based upon the approximate relative energy content of oil and natural gas, which is not indicative of the relationship of oil, NGLs, condensate, and natural gas prices.
The Marcellus segment had natural gas, NGLs and oil sales of $415 million for the year ended December 31, 2016 compared to $379 million for the year ended December 31, 2015. The $36 million increase was primarily due to a 23.3% increase in total Marcellus sales volumes, partially offset by a 10.5% decrease in the average gas sales price in the period-to-period comparison. The increase in total sales volumes was primarily due to additional wells coming on-line in the current year, as well as the termination of the Marcellus Joint Venture that CNX had with Noble Energy in 2016. See Note 7 - Property, Plant and Equipment in the Notes to the Audited Consolidated Financial Statements in Item 8 of this Form 10-K for additional details. The joint venture termination was effective October 1st, 2016 and resulted in additional production for the fourth quarter of 2016, as well as the applicable sales and production costs.
The decrease in the total average Marcellus sales price was primarily the result of the $0.22 per Mcf decrease in gas market prices, along with a $0.03 per Mcf decrease in the uplift from NGLs and condensate sales volumes, when excluding the impact of hedging. These decreases were offset, in part, by a $0.12 per Mcf increase in the gain on commodity derivative instruments resulting from the Company's hedging program. The increase in the gain was due to an increase in volumes hedged and lower market prices. The notional amounts associated with these financial hedges represented approximately 160.8 Bcf of the Company's produced Marcellus gas sales volumes for the year ended December 31, 2016 at an average gain of $0.92 per Mcf. For the year ended December 31, 2015, these financial hedges represented approximately 90.3 Bcf at an average gain of $1.09 per Mcf.
Total operating costs and expenses for the Marcellus segment were $490 million for the year ended December 31, 2016 compared to $424 million for the year ended December 31, 2015. The increase in total dollars and decrease in unit costs for the Marcellus segment are due to the following items:
•Marcellus lease operating expense was $34 million for the year ended December 31, 2016 compared to $44 million for the year ended December 31, 2015. The decrease in total dollars was primarily due to a reduction in employee related costs, well tending costs and repairs and maintenance expense in the current period. The reduction in employee related costs was primarily due to the company reorganization that occurred in the second half of 2015 and the first quarter of 2016. The decrease in unit costs
56
was primarily due to the 23.3% increase in total Marcellus sales volumes, along with the decreased total dollars described above. The decreases were offset, in part, by an increase in salt water disposal costs in the period-to-period comparison.
•Marcellus production, ad valorem, and other fees were $17 million for the year ended December 31, 2016 compared to $18 million for the year ended December 31, 2015. The decrease in total dollars was primarily due to the decrease in total average Marcellus sales price, offset, in part, by the increase in total Marcellus sales volumes.
•Marcellus transportation, gathering and compression costs were $228 million for the year ended December 31, 2016 compared to $200 million for the year ended December 31, 2015. The $28 million increase in total dollars was primarily related to an increase in the CNXM gathering fee due to the increase in total Marcellus sales volumes (see Note 20 - Related Party Transactions in the Notes to the Audited Consolidated Financial Statements in Item 8 of this Form 10-K for additional information), an increase in processing fees associated with natural gas liquids primarily due to the 23.7% increase in NGLs sales volumes, and an increase in utilized firm transportation expense. The decrease in unit costs was due to the increase in total Marcellus sales volumes, offset, in part, by the increase in total dollars.
•Depreciation, depletion and amortization costs attributable to the Marcellus segment were $211 million for the year ended December 31, 2016 compared to $162 million for the year ended December 31, 2015 driven primarily by the overall increase in production. These amounts included depreciation on a unit of production basis of $0.98 per Mcf and $0.92 per Mcf, respectively. The remaining depreciation, depletion and amortization costs were either recorded on a straight-line basis or related to gas well closing.
UTICA SEGMENT
The Utica segment had earnings before income tax of $28 million for the year ended December 31, 2016 compared to a loss before income tax of $19 million for the year ended December 31, 2015.
For the Years Ended December 31, | ||||||||||||||
2016 | 2015 | Variance | Percent Change | |||||||||||
Utica Gas Sales Volumes (Bcf) | 71.3 | 38.3 | 33.0 | 86.2 | % | |||||||||
NGLs Sales Volumes (Bcfe)* | 16.7 | 14.1 | 2.6 | 18.4 | % | |||||||||
Oil Sales Volumes (Bcfe)* | — | 0.1 | (0.1 | ) | (100.0 | )% | ||||||||
Condensate Sales Volumes (Bcfe)* | 2.8 | 3.7 | (0.9 | ) | (24.3 | )% | ||||||||
Total Utica Sales Volumes (Bcfe)* | 90.8 | 56.2 | 34.6 | 61.6 | % | |||||||||
Average Sales Price - Gas (per Mcf) | $ | 1.52 | $ | 1.52 | $ | — | — | % | ||||||
Gain on Commodity Derivative Instruments - Cash Settlement- Gas (per Mcf) | $ | 0.41 | $ | 0.17 | $ | 0.24 | 141.2 | % | ||||||
Average Sales Price - NGLs (per Mcfe)* | $ | 2.49 | $ | 1.39 | $ | 1.10 | 79.1 | % | ||||||
Average Sales Price - Oil (per Mcfe)* | $ | — | $ | 6.58 | $ | (6.58 | ) | (100.0 | )% | |||||
Average Sales Price - Condensate (per Mcfe)* | $ | 4.78 | $ | 3.79 | $ | 0.99 | 26.1 | % | ||||||
Total Average Utica Sales Price (per Mcfe) | $ | 2.12 | $ | 1.75 | $ | 0.37 | 21.1 | % | ||||||
Average Utica Lease Operating Expenses (per Mcfe) | 0.25 | 0.39 | (0.14 | ) | (35.9 | )% | ||||||||
Average Utica Production, Ad Valorem, and Other Fees (per Mcfe) | 0.05 | 0.04 | 0.01 | 25.0 | % | |||||||||
Average Utica Transportation, Gathering and Compression Costs (per Mcfe) | 0.57 | 0.61 | (0.04 | ) | (6.6 | )% | ||||||||
Average Utica Depreciation, Depletion and Amortization Costs (per Mcfe) | 0.94 | 1.06 | (0.12 | ) | (11.3 | )% | ||||||||
Total Average Utica Costs (per Mcfe) | $ | 1.81 | $ | 2.10 | $ | (0.29 | ) | (13.8 | )% | |||||
Average Margin for Utica (per Mcfe) | $ | 0.31 | $ | (0.35 | ) | $ | 0.66 | 188.6 | % | |||||
*NGLs and Condensate are converted to Mcfe at the rate of one barrel equals six mcf based upon the approximate relative energy content of oil and natural gas, which is not indicative of the relationship of oil, NGLs, condensate, and natural gas prices.
The Utica segment had natural gas, NGLs and oil sales of $163 million for the year ended December 31, 2016 compared to $93 million for the year ended December 31, 2015. The $70 million increase was primarily due to the 61.6% increase in total
57
Utica sales volumes. The 34.6 Bcfe increase in total Utica sales volumes was due to additional wells coming on-line, primarily in dry Utica areas, in 2016.
The increase in the total average Utica sales price was primarily due to a $0.24 per Mcf increase in the gain on commodity derivative instruments in 2016, as well as a $0.16 per Mcf increase in the uplift from NGLs and condensate sales volumes. The increase in the hedging gain was due to an increase in the volumes hedged that were designated as Utica volumes. Financial hedges represented approximately 31.6 Bcf of the Company's produced Utica gas sales volumes for the year ended December 31, 2016 at an average gain of $0.93 per Mcf. For the year ended December 31, 2015, these financial hedges represented approximately 5.9 Bcf at an average gain of $1.08 per Mcf.
Total operating costs and expenses for the Utica segment were $164 million for the year ended December 31, 2016 compared to $118 million for the year ended December 31, 2015. The increase in total dollars and decrease in unit costs for the Utica segment was due to the following items:
•Utica lease operating expense remained flat at $22 million for each of the years ended December 31, 2016 and December 31, 2015. The decrease in unit costs was primarily due to the 61.6% increase in total Utica sales volumes.
•Utica production, ad valorem, and other fees were $5 million for the year ended December 31, 2016 compared to $2 million for the year ended December 31, 2015. The increase in total dollars was primarily due to the 61.6% increase in total Utica sales volumes. The increase in unit costs was also due to a credit received from a joint venture partner in the 2015 period, related to an over-billing of ad valorem taxes.
•Utica transportation, gathering and compression costs were $51 million for the year ended December 31, 2016 compared to $35 million for the year ended December 31, 2015. The $16 million increase in total dollars was primarily related to increased gathering and processing fees associated with the increased Utica NGLs and gas sales volumes. The decrease in unit costs was due to the increase in total Utica sales volumes, predominantly dry Utica, which was offset, in part, by the increase in total dollars.
•Depreciation, depletion and amortization costs attributable to the Utica segment were $86 million for the year ended December 31, 2016 compared to $59 million for the year ended December 31, 2015 driven primarily by the overall increase in production. These amounts included depreciation on a unit of production basis of $0.93 per Mcf and $1.05 per Mcf, respectively. The remaining depreciation, depletion and amortization costs were either recorded on a straight-line basis or related to gas well closing.
COALBED METHANE (CBM) SEGMENT
The CBM segment had earnings before income tax of $38 million for the year ended December 31, 2016 compared to earnings before income tax of $60 million for the year ended December 31, 2015.
For the Years Ended December 31, | ||||||||||||||
2016 | 2015 | Variance | Percent Change | |||||||||||
CBM Gas Sales Volumes (Bcf) | 69.0 | 74.9 | (5.9 | ) | (7.9 | )% | ||||||||
Average Sales Price - Gas (per Mcf) | $ | 2.53 | $ | 2.70 | $ | (0.17 | ) | (6.3 | )% | |||||
Gain on Commodity Derivative Instruments - Cash Settlement- Gas (per Mcf) | $ | 0.76 | $ | 0.90 | $ | (0.14 | ) | (15.6 | )% | |||||
Total Average CBM Sales Price (per Mcf) | $ | 3.29 | $ | 3.60 | $ | (0.31 | ) | (8.6 | )% | |||||
Average CBM Lease Operating Expenses (per Mcf) | 0.36 | 0.44 | (0.08 | ) | (18.2 | )% | ||||||||
Average CBM Production, Ad Valorem, and Other Fees (per Mcf) | 0.09 | 0.10 | (0.01 | ) | (10.0 | )% | ||||||||
Average CBM Transportation, Gathering and Compression Costs (per Mcf) | 1.04 | 1.13 | (0.09 | ) | (8.0 | )% | ||||||||
Average CBM Depreciation, Depletion and Amortization Costs (per Mcf) | 1.25 | 1.13 | 0.12 | 10.6 | % | |||||||||
Total Average CBM Costs (per Mcf) | $ | 2.74 | $ | 2.80 | $ | (0.06 | ) | (2.1 | )% | |||||
Average Margin for CBM (per Mcf) | $ | 0.55 | $ | 0.80 | $ | (0.25 | ) | (31.3 | )% | |||||
The CBM segment had natural gas sales of $175 million for the year ended December 31, 2016 compared to $202 million for the year ended December 31, 2015. The $27 million decrease was primarily due to a 6.3% decrease in the average gas sales
58
price, as well as a 7.9% decrease in CBM gas sales volumes. The decrease in CBM sales volumes was primarily due to normal well declines and less drilling activity.
The total average CBM sales price decreased $0.31 per Mcf due primarily to a $0.17 per Mcf decrease in gas market prices, as well as a $0.14 per Mcf decrease in the gain on commodity derivative instruments resulting from the Company's hedging program. The notional amounts associated with these financial hedges represented approximately 55.0 Bcf of the Company's produced CBM sales volumes for the year ended December 31, 2016 at an average gain of $0.95 per Mcf. For the year ended December 31, 2015, these financial hedges represented approximately 57.5 Bcf at an average gain of $1.17 per Mcf.
Total operating costs and expenses for the CBM segment were $189 million for the year ended December 31, 2016 compared to $209 million for the year ended December 31, 2015. The decrease in total dollars and decrease in unit costs for the CBM segment were due to the following items:
•CBM lease operating expense was $25 million for the year ended December 31, 2016 compared to $33 million for the year ended December 31, 2015. The decrease in total dollars was primarily related to a decrease in contractual services related to well tending, a decrease in repairs and maintenance expense, a decrease in employee related costs, and a decrease in salt water disposal costs. The decrease in unit costs was due to the decrease in total dollars, partially offset by the decrease in CBM gas sales volumes.
•CBM production, ad valorem, and other fees were $6 million for the year ended December 31, 2016 compared to $7 million for the year ended December 31, 2015. The $1 million decrease was due to a decrease in severance tax expense resulting from the decrease in both gas sales volumes and average sales price. Unit costs were positively impacted by the decrease in total average CBM sales price which was offset, in part, by the decrease in CBM gas sales volumes.
•CBM transportation, gathering and compression costs were $72 million for the year ended December 31, 2016 compared to $85 million for the year ended December 31, 2015. The $13 million decrease was primarily related to a decrease in repairs and maintenance, power and utilized firm transportation expense resulting from the decrease in CBM gas sales volumes. Unit costs were also positively impacted by the decrease in total dollars which was offset, in part, by the decrease in CBM gas sales volumes.
•Depreciation, depletion and amortization costs attributable to the CBM segment were $86 million for the year ended December 31, 2016 compared to $84 million for the year ended December 31, 2015. These amounts included depletion on a unit of production basis of $0.82 per Mcf and $0.73 per Mcf, respectively. The remaining depreciation, depletion and amortization costs were either recorded on a straight-line basis or related to gas well closing.
59
OTHER GAS SEGMENT
The Other Gas segment had a loss before income tax of $446 million for the year ended December 31, 2016 compared to a loss before income tax of $682 million for the year ended December 31, 2015.
For the Years Ended December 31, | ||||||||||||||
2016 | 2015 | Variance | Percent Change | |||||||||||
Other Gas Sales Volumes (Bcf) | 21.7 | 24.7 | (3.0 | ) | (12.1 | )% | ||||||||
Oil Sales Volumes (Bcfe)* | 0.4 | 0.5 | (0.1 | ) | (20.0 | )% | ||||||||
Total Other Sales Volumes (Bcfe)* | 22.1 | 25.2 | (3.1 | ) | (12.3 | )% | ||||||||
Average Sales Price - Gas (per Mcf) | $ | 1.79 | $ | 2.03 | $ | (0.24 | ) | (11.8 | )% | |||||
Gain on Commodity Derivative Instruments - Cash Settlement- Gas (per Mcf) | $ | 0.75 | $ | 0.88 | $ | (0.13 | ) | (14.8 | )% | |||||
Average Sales Price - Oil (per Mcfe)* | $ | 6.23 | $ | 8.15 | $ | (1.92 | ) | (23.6 | )% | |||||
Total Average Other Sales Price (per Mcfe) | $ | 2.61 | $ | 3.03 | $ | (0.42 | ) | (13.9 | )% | |||||
Average Other Lease Operating Expenses (per Mcfe) | 0.69 | 0.90 | (0.21 | ) | (23.3 | )% | ||||||||
Average Other Production, Ad Valorem, and Other Fees (per Mcfe) | 0.12 | 0.14 | (0.02 | ) | (14.3 | )% | ||||||||
Average Other Transportation, Gathering and Compression Costs (per Mcfe) | 1.07 | 0.96 | 0.11 | 11.5 | % | |||||||||
Average Other Depreciation, Depletion and Amortization Costs (per Mcfe) | 1.49 | 2.34 | (0.85 | ) | (36.3 | )% | ||||||||
Total Average Other Costs (per Mcfe) | $ | 3.37 | $ | 4.34 | $ | (0.97 | ) | (22.4 | )% | |||||
Average Margin for Other (per Mcfe) | $ | (0.76 | ) | $ | (1.31 | ) | $ | 0.55 | 42.0 | % | ||||
*Oil is converted to Mcfe at the rate of one barrel equals six Mcf based upon the approximate relative energy content of oil and natural gas, which is not indicative of the relationship of oil and natural gas prices.
The Other Gas segment includes activity not assigned to the Marcellus, Utica, or CBM segments. This segment also includes purchased gas activity, unrealized gain or loss on commodity derivative instruments, exploration and production related other costs, impairment of exploration and production properties and other operational activity not assigned to a specific segment.
Other Gas sales volumes are primarily related to shallow oil and gas production. Natural gas, NGLs and oil sales related to the Other Gas segment were $40 million for the year ended December 31, 2016 compared to $53 million for the year ended December 31, 2015. The decrease in natural gas and oil sales primarily related to the $0.24 per Mcf decrease in average gas sales price as well as the 12.1% decrease in Other Gas sales volumes. Total exploration and production costs related to these other sales were $78 million for the year ended December 31, 2016 compared to $116 million for the year ended December 31, 2015. The decrease was primarily due to a decrease in depreciation, depletion and amortization related costs related to the adjustment to the Company's shallow oil and gas rates after an impairment in the carrying value was recognized in the second quarter of 2015 (see Note 1 - Significant Accounting Policies in the Notes to the Audited Consolidated Financial Statements in Item 8 of this Form 10-K for additional information), as well as a decrease in lease operating expense due to a decrease in employee related costs.
The Other Gas segment recognized an unrealized loss on commodity derivative instruments of $386 million as well as cash settlements received of $17 million for the year ended December 31, 2016. For the year ended December 31, 2015, the Company recognized an unrealized gain on commodity derivative instruments of $197 million as well as cash settlements received of $22 million. The unrealized loss/gain on commodity derivative instruments represented changes in the fair value of all of the Company's existing commodity hedges on a mark-to-market basis.
Purchased gas volumes represent volumes of gas purchased at market prices from third-parties and then resold in order to fulfill contracts with certain customers. Purchased gas sales were $43 million for the year ended December 31, 2016 compared to $14 million for the year ended December 31, 2015. Purchased gas costs were $43 million for the year ended December 31, 2016 compared to $11 million for the year ended December 31, 2015. The period-to-period increase in purchased gas sales was due to the increase in purchased gas sales, offset, in part, by the decrease in market prices.
60
For the Years Ended December 31, | ||||||||||||||
2016 | 2015 | Variance | Percent Change | |||||||||||
Purchased Gas Sales Volumes (in billion cubic feet) | 21.7 | 6.8 | 14.9 | 219.1 | % | |||||||||
Average Sales Price (per Mcf) | $ | 1.99 | $ | 2.14 | $ | (0.15 | ) | (7.0 | )% | |||||
Average Cost (per Mcf) | $ | 1.97 | $ | 1.59 | $ | 0.38 | 23.9 | % | ||||||
Other operating income was $65 million for each of the years ended December 31, 2016 and December 31, 2015. Other operating income consisted of the following items:
For the Years Ended December 31, | ||||||||||||||
(in millions) | 2016 | 2015 | Variance | Percent Change | ||||||||||
Equity in Earnings of Affiliates | $ | 53 | $ | 55 | $ | (2 | ) | (3.6 | )% | |||||
Gathering Income | 11 | 10 | 1 | 10.0 | % | |||||||||
Water Income | 1 | — | 1 | 100.0 | % | |||||||||
Total Other Operating Income | $ | 65 | $ | 65 | $ | — | — | % | ||||||
Impairment of exploration and production properties of $829 million for the year ended December 31, 2015 related to the write down of the Company's shallow oil and gas asset values in June 2015. See Note 1- Significant Accounting Policies in the Notes to the Audited Consolidated Financial Statements in Item 8 of this Form 10-K for additional information. No such write downs occurred in the year ended December 31, 2016.
Exploration and production related other costs were $15 million for the year ended December 31, 2016 compared to $10 million for the year ended December 31, 2015. The $5 million increase is due to the following items:
For the Years Ended December 31, | ||||||||||||||
(in millions) | 2016 | 2015 | Variance | Percent Change | ||||||||||
Lease Expiration Costs | $ | 7 | $ | 4 | $ | 3 | 75.0 | % | ||||||
Permitting Expense | 2 | 1 | 1 | 100.0 | % | |||||||||
Land Rentals | 4 | 5 | (1 | ) | (20.0 | )% | ||||||||
Other | 2 | — | 2 | 100.0 | % | |||||||||
Total Exploration and Production Related Other Costs | $ | 15 | $ | 10 | $ | 5 | 50.0 | % | ||||||
• | Lease Expiration Costs increased by $3 million in the period-to-period comparison, primarily due to an increase in the number of leases allowed to expire in the year ended December 31, 2016 as compared to the year ended December 31, 2015. |
61
Other operating expense was $89 million for the year ended December 31, 2016 compared to $67 million for the year ended December 31, 2015. The $22 million increase in the period-to-period comparison was made up of the following items:
For the Years Ended December 31, | ||||||||||||||
(in millions) | 2016 | 2015 | Variance | Percent Change | ||||||||||
Idle Rig Expense | $ | 33 | $ | 19 | $ | 14 | 73.7 | % | ||||||
Unutilized Firm Transportation and Processing Fees | 37 | 33 | 4 | 12.1 | % | |||||||||
Insurance Expense | 3 | 3 | — | — | % | |||||||||
Litigation Settlements | 1 | 2 | (1 | ) | (50.0 | )% | ||||||||
Severance Expense | 1 | 5 | (4 | ) | (80.0 | )% | ||||||||
Other | 14 | 5 | 9 | 180.0 | % | |||||||||
Total Other Operating Expense | $ | 89 | $ | 67 | $ | 22 | 32.8 | % | ||||||
• | Idle Rig Expense is related to temporary idling of some of the Company's natural gas rigs. The total idle rig expense increased in the period-to-period comparison due to unfavorable market conditions in the first half of the year ended December 31, 2016. |
• | Unutilized Firm Transportation and Processing Fees represent pipeline transportation capacity obtained to enable gas production to flow uninterrupted as sales volumes increase, as well as additional processing capacity for NGLs. The increase in the period-to-period comparison was primarily due to the decrease in the utilization of capacity. The Company attempts to minimize this expense by releasing (selling) unutilized firm transportation capacity to other parties when possible and when beneficial. The revenue received when this capacity is released (sold) is included in Gathering Income in other operating income above. |
• | Severance Expense decreased $4 million in the period-to-period comparison primarily due to the Company reorganization that occurred in the third quarter of 2015. The Company also had a first quarter 2016 reorganization that was less significant. |
62
Critical Accounting Policies
The preparation of financial statements in conformity with accounting principles generally accepted in the United States of America requires management to make judgments, estimates and assumptions that affect reported amounts of assets and liabilities, revenues and expenses, and related disclosure of contingent assets and liabilities in the Consolidated Financial Statements and at the date of the financial statements. See Note 1-Significant Accounting Policies in the Notes to the Audited Consolidated Financial Statements in Item 8 of this Form 10-K for further discussion. We base our estimates on historical experience and on various other assumptions that we believe are reasonable under the circumstances, the results of which form the basis for making the judgments about the carrying values of assets and liabilities that are not readily apparent from other sources. We evaluate our estimates on an on-going basis. Actual results could differ from those estimates upon subsequent resolution of identified matters. Management believes that the estimates utilized are reasonable. The following critical accounting policies are materially impacted by judgments, assumptions and estimates used in the preparation of the Consolidated Financial Statements.
Salaried Pension
Liabilities and expenses for pension are determined using actuarial methodologies and incorporate significant assumptions, including the interest rate used to discount the future estimated liability and several assumptions relating to the employee workforce (salary increases, retirement age, and mortality).
The interest rate used to discount future estimated liabilities is determined using a Company-specific yield curve model (above-mean) developed with the assistance of an external actuary. The Company-specific yield curve uses a subset of the expanded bond universe to determine the Company-specific discount rate. Bonds used in the yield curve are rated AA by Moody’s or Standard & Poor’s as of the measurement date. The yield curve model parallels the plans’ projected cash flows.
Asset Retirement Obligations
Accounting for Asset Retirement Obligations requires that the fair value of an asset retirement obligation be recognized in the period in which it is incurred if a reasonable estimate of fair value can be made. The present value of the estimated asset retirement costs is capitalized as part of the carrying amount of the long-lived asset. Asset retirement obligations primarily relate to the closure of gas wells and the reclamation of land upon exhaustion of gas reserves. Changes in the variables used to calculate the liabilities can have a significant effect on the gas well closing liability. The amounts of assets and liabilities recorded are dependent upon a number of variables, including the estimated future retirement costs, estimated proved reserves, assumptions involving profit margins, inflation rates and the assumed credit-adjusted risk-free interest rate.
The Company believes that the accounting estimates related to asset retirement obligations are “critical accounting estimates” because the Company must assess the expected amount and timing of asset retirement obligations. In addition, the Company must determine the estimated present value of future liabilities. Future results of operations for any particular quarterly or annual period could be materially affected by changes in the Company’s assumptions.
Income Taxes
Deferred tax assets and liabilities are recognized using enacted tax rates for the estimated future tax effects of temporary differences between the book and tax basis of recorded assets and liabilities. Deferred tax assets are reduced by a valuation allowance if it is more likely than not that some portion of the deferred tax asset will not be realized. All available evidence, both positive and negative, must be considered in determining the need for a valuation allowance. At December 31, 2017, CNX has deferred tax assets in excess of deferred tax liabilities of approximately $92 million. At December 31, 2017, CNX had a valuation allowance of $137 million on deferred tax assets.
CNX evaluates all tax positions taken on the state and federal tax filings to determine if the position is more likely than not to be sustained upon examination. For positions that meet the more likely than not to be sustained criteria, an evaluation to determine the largest amount of benefit, determined on a cumulative probability basis that is more likely than not to be realized upon ultimate settlement is determined. A previously recognized tax position is reversed when it is subsequently determined that a tax position no longer meets the more likely than not threshold to be sustained. The evaluation of the sustainability of a tax position and the probable amount that is more likely than not is based on judgment, historical experience and on various other assumptions that we believe are reasonable under the circumstances. The results of these estimates, that are not readily apparent from other sources, form the basis for recognizing an uncertain tax liability. Actual results could differ from those estimates upon subsequent resolution of identified matters. CNX has $38 million of uncertain tax liabilities at December 31, 2017.
63
The Company believes that accounting estimates related to income taxes are “critical accounting estimates” because the Company must assess the likelihood that deferred tax assets will be recovered from future taxable income and exercise judgment regarding the amount of financial statement benefit to record for uncertain tax positions. When evaluating whether or not a valuation allowance must be established on deferred tax assets, the Company exercises judgment in determining whether it is more likely than not (a likelihood of more than 50%) that some portion or all of the deferred tax assets will not be realized. The Company considers all available evidence, both positive and negative, to determine whether, based on the weight of the evidence, a valuation allowance is needed, including carrybacks, tax planning strategies, reversal of deferred tax assets and liabilities and forecasted future taxable income. In making the determination related to uncertain tax positions, the Company considers the amounts and probabilities of the outcomes that could be realized upon ultimate settlement of an uncertain tax position using the facts, circumstances and information available at the reporting date to establish the appropriate amount of financial statement benefit. To the extent that an uncertain tax position or valuation allowance is established or increased or decreased during a period, the Company must include an expense or benefit within tax expense in the income statement. Future results of operations for any particular quarterly or annual period could be materially affected by changes in the Company’s assumptions.
Stock-Based Compensation
The fair value of each restricted stock unit awarded is equivalent to the closing market price of a share of the Company's stock on the date of the grant. The fair value of each performance share unit is determined by a Monte Carlo simulation method. The fair value of each option is determined using the Black-Scholes option pricing model. All outstanding performance stock options are fully vested.
The Company believes that the accounting estimates related to share-based compensation are “critical accounting estimates” because they may change from period to period based on changes in assumptions about factors affecting the ultimate payout of awards, including the number of awards to ultimately vest and the market price and volatility of the Company’s common stock. Future results of operations for any particular quarterly or annual period could be materially affected by changes in the Company’s assumptions. See Note 13 - Stock-Based Compensation in the Notes to the Audited Consolidated Financial Statements in Item 8 of this Form 10-K for additional information regarding the Company’s share-based compensation.
Contingencies
CNX is currently involved in certain legal proceedings. The Company has accrued our estimate of the probable costs for the resolution of these claims. This estimate has been developed in consultation with legal counsel involved in the defense of these matters and is based upon the nature of the lawsuit, progress of the case in court, view of legal counsel, prior experience in similar matters, and management's intended response. Future results of operations for any particular quarter or annual period could be materially affected by changes in our assumptions or the outcome of these proceedings. Legal fees associated with defending these various lawsuits and claims are expensed when incurred.
The Company believes that the accounting estimates related to contingencies are “critical accounting estimates” because the Company must assess the probability of loss related to contingencies. In addition, the Company must determine the estimated present value of future liabilities. Future results of operations for any particular quarterly or annual period could be materially affected by changes in the Company’s assumptions. See Note 18 - Commitments and Contingent Liabilities in the Notes to the Audited Consolidated Financial Statements in Item 8 of this Form 10-K for more information.
Derivative Instruments
CNX enters into financial derivative instruments to manage exposure to natural gas and oil price volatility. We measure every derivative instrument at fair value and record them on the balance sheet as either an asset or liability. Changes in fair value of derivatives are recorded currently in earnings unless special hedge accounting criteria are met. For derivatives designated as fair value hedges, the changes in fair value of both the derivative instrument and the hedged item are recorded in earnings. Prior to December 31, 2014, the effective portions of changes in fair value of derivatives designated as cash flow hedges were reported in other comprehensive income or loss and reclassified into earnings in the same period or periods which the forecasted transaction affected earnings. The ineffective portions of hedges were recognized in earnings in the current year.
The Company believes that the accounting estimates related to derivative instruments are “critical accounting estimates” because the Company’s financial condition and results of operations can be significantly impacted by changes in the market value of the Company’s derivative instruments due to the volatility of natural gas prices. Future results of operations for any particular quarterly or annual period could be materially affected by changes in the Company’s assumptions.
64
Natural Gas, NGL, Condensate and Oil Reserve ("Natural Gas Reserve") Values
Proved oil and gas reserves, as defined by SEC Regulation S-X Rule 4-10, are those quantities of oil and gas which, by analysis of geoscience and engineering data, can be estimated with reasonable certainty to be economically producible from a given date forward, from known reservoirs and under existing economic conditions, operating methods and government regulations prior to the time at which contracts providing the right to operate expire, unless evidence indicates that renewal is reasonably certain, regardless of whether deterministic or probabilistic methods are used for the estimation.
There are numerous uncertainties inherent in estimating quantities and values of economically recoverable natural gas reserves, including many factors beyond our control. As a result, estimates of economically recoverable natural gas reserves are by their nature uncertain. Information about our reserves consists of estimates based on engineering, economic and geological data assembled and analyzed by our staff. Our natural gas reserves are reviewed by independent experts each year. Some of the factors and assumptions which impact economically recoverable reserve estimates include:
• | geological conditions; |
• | historical production from the area compared with production from other producing areas; |
• | the assumed effects of regulations and taxes by governmental agencies; |
• | assumptions governing future prices; and |
• | future operating costs. |
Each of these factors may in fact vary considerably from the assumptions used in estimating reserves. For these reasons, estimates of the economically recoverable quantities of gas attributable to a particular group of properties, and classifications of these reserves based on risk of recovery and estimates of future net cash flows, may vary substantially. Actual production, revenues and expenditures with respect to our reserves will likely vary from estimates, and these variances may be material. See "Risk Factors" in Item 1A of this report for a discussion of the uncertainties in estimating our reserves.
The Company believes that the accounting estimate related to oil and gas reserves is a “critical accounting estimate” because the Company must periodically reevaluate proved reserves along with estimates of future production rates, production costs and the estimated timing of development expenditures. Future results of operations and strength of the balance sheet for any particular quarterly or annual period could be materially affected by changes in the Company’s assumptions. See "Impairment of Long-lived Assets" below for additional information regarding the Company’s oil and gas reserves.
Impairment of Long-lived Assets:
The carrying values of the Company's proved oil and gas properties are reviewed for impairment whenever events or changes in circumstances indicate that a property’s carrying amount may not be recoverable. Impairment tests require that the Company first compare future undiscounted cash flows by asset group to their respective carrying values. If the carrying amount exceeds the estimated undiscounted future cash flows, a reduction of the carrying amount of the natural gas properties to their estimated fair values is required, which is determined based on discounted cash flow techniques using a market-specific weighted average cost of capital. During the year ended December 31, 2015, certain of the Company’s proved properties, primarily shallow oil and gas assets, failed the undiscounted cash flow portion of the test. After performing the discounted cash flow portion of the test, CNX recorded an impairment of $824,742 in the Impairment of Exploration and Production Properties in the Consolidated Statements of Income. See Note 1 - Significant Accounting Policies in the Notes to the Audited Consolidated Financial Statements in Item 8 of this Form 10-K for more information.
In February 2017, the Company approved a plan to sell subsidiaries Knox Energy LLC and Coalfield Pipeline Company (collectively, "Knox"). As part of the required evaluation under the held for sale guidance, Knox's book value was evaluated and it was determined that the approximate fair value less costs to sell Knox was less than the carrying value of the net assets to be sold. The resulting impairment of $137,865 was included in Impairment of Exploration and Production Properties in the Consolidated Statements of Income. See Note 1 - Significant Accounting Policies in the Notes to the Audited Consolidated Financial Statements in Item 8 of this Form 10-K for more information.
There were no other impairments related to proved properties in the years ended December 31, 2017, 2016 or 2015.
CNX evaluates capitalized costs of unproved gas properties for recoverability on a prospective basis. Indicators of potential impairment include potential shifts in business strategy, overall economic factors and historical experience. If it is determined that the properties will not yield proved reserves, the related costs are expensed in the period the determination is made. For the year ended December 31, 2015, unproved property impairments related to the determination that the properties will not yield proved
65
reserves were $4,163 and are included in Impairment of Exploration and Production Properties in the Consolidated Statements of Income. See Note 1 - Significant Accounting Policies in the Notes to the Audited Consolidated Financial Statements in Item 8 of this Form 10-K for more information.
There were no other impairments related to unproved properties in the years ended December 31, 2017, 2016 or 2015.
Liquidity and Capital Resources
CNX generally has satisfied its working capital requirements and funded its capital expenditures and debt service obligations with cash generated from operations and proceeds from borrowings. On June 18, 2014, CNX entered into a five year Credit Agreement for a $2.0 billion senior secured revolving credit facility, which expires on June 18, 2019. The facility is secured by substantially all of the assets of CNX and certain of its subsidiaries. In November 2017, the facility was amended to allow for the spin-off of the Company's coal business. At that time, the lenders' commitments to the facility were reduced from $2.0 billion to $1.5 billion and the borrowing base remained unchanged from $2.0 billion, including a $650 million letters of credit aggregate sub-limit. CNX can request an additional $500 million increase in the aggregate borrowing limit amount. Fees and interest rate spreads are based on the percentage of facility utilization, measured quarterly. Availability under the facility is limited to a borrowing base, which is determined by the lenders syndication agent and approved by the required number of lenders in good faith by calculating a value of CNX's proved gas reserves. The facility includes a minimum interest coverage ratio covenant of no less than 2.50 to 1.00, measured quarterly. The interest coverage ratio is calculated as the ratio of Adjusted EBITDA to cash interest expense of CNX and certain of its subsidiaries. The interest coverage ratio was 4.01 to 1.00 at December 31, 2017. Adjusted EBITDA, as used in the covenant calculation, excludes non-cash compensation expenses, non-recurring transaction expenses, extraordinary gains and losses, gains and losses on discontinued operations, gains and losses on debt extinguishment and includes cash distributions received from affiliates, plus pro-rata earnings from material acquisitions. The facility also includes a minimum current ratio covenant of no less than 1.00 to 1.00, measured quarterly. The minimum current ratio is calculated as the ratio of current assets, plus revolver availability, to current liabilities excluding borrowings under the revolver. The current ratio was 4.78 to 1.00 at December 31, 2017. Affirmative and negative covenants in the facility limit the Company's ability to dispose of assets, make investments, purchase or redeem CNX common stock, pay dividends, merge with another corporation and amend, modify or restate the senior unsecured notes. The credit facility allows unlimited investments in joint ventures for the development and operation of natural gas gathering systems. At December 31, 2017, the facility had no borrowings outstanding and $239 million letters of credit outstanding, leaving $1,261 million of unused capacity. From time to time, CNX is required to post financial assurances to satisfy contractual and other requirements generated in the normal course of business. Some of these assurances are posted to comply with federal, state or other government agencies' statutes and regulations. CNX sometimes uses letters of credit to satisfy these requirements and these letters of credit reduce the Company's borrowing facility capacity.
The April 2016 facility amendment requires that the Company must: (i) prepay outstanding loans under the revolving credit facility to the extent that cash on hand exceeds $150 million for two consecutive business days; (ii) mortgage 85% of its proved reserves and 80% of its proved developed producing reserves, in each case, which are included in the borrowing base; (iii) maintain applicable deposit, securities and commodities accounts with the lenders or affiliates thereof; and (iv) enter into control agreements with respect to such applicable accounts. In addition, the Company pledged the equity interest it holds in CNX Gathering, LLC, and CNX Midstream Partners, LP as collateral to secure loans under the credit agreement.
Uncertainty in the financial markets brings additional potential risks to CNX. These risks include declines in the Company's stock price, less availability and higher costs of additional credit, potential counterparty defaults, and commercial bank failures. Financial market disruptions may impact the Company's collection of trade receivables. As a result, CNX regularly monitors the creditworthiness of its customers and counterparties and manages credit exposure through payment terms, credit limits, prepayments and security. CNX believes that its current group of customers is financially sound and represents no abnormal business risk.
CNX believes that cash generated from operations, asset sales and the Company's borrowing capacity will be sufficient to meet the Company's working capital requirements, anticipated capital expenditures (other than major acquisitions), scheduled debt payments, anticipated dividend payments and to provide required letters of credit. Nevertheless, the ability of CNX to satisfy its working capital requirements, to service its debt obligations, to fund planned capital expenditures, or to pay dividends will depend upon future operating performance, which will be affected by prevailing economic conditions in the natural gas industry and other financial and business factors, some of which are beyond CNX's control.
In order to manage the market risk exposure of volatile natural gas prices in the future, CNX enters into various physical natural gas supply transactions with both gas marketers and end users for terms varying in length. CNX has also entered into various natural gas and NGL swap and option transactions, which exist parallel to the underlying physical transactions. The fair value of these contracts was a net asset of $60 million at December 31, 2017 and a net liability of $188 million at December 31, 2016. The Company has not experienced any issues of non-performance by derivative counterparties.
66
CNX frequently evaluates potential acquisitions. CNX has funded acquisitions with cash generated from operations and a variety of other sources, depending on the size of the transaction, including debt and equity financing. There can be no assurance that additional capital resources, including debt and equity financing, will be available to CNX on terms which CNX finds acceptable, or at all.
Cash Flows (in millions)
For the Years Ended December 31, | |||||||||||
2017 | 2016 | Change | |||||||||
Cash provided by operating activities | $ | 649 | $ | 464 | $ | 185 | |||||
Cash (used in) provided by investing activities | $ | (222 | ) | $ | 487 | $ | (709 | ) | |||
Cash provided by (used in) financing activities | $ | 36 | $ | (970 | ) | $ | 1,006 | ||||
Cash provided by operating activities changed in the period-to-period comparison primarily due to the following items:
• | Net income (loss) increased $1,229 million in the period-to-period comparison. |
• | Adjustments to reconcile net income (loss) to cash provided by operating activities primarily consisted of a $634 million net change in commodity derivative instruments, a $219 million change in deferred income taxes, and a $174 million change in the gain on the sale of assets. These adjustments were offset, in part, by a $138 million impairment in the carrying value of Knox Energy (see Note 1 - Significant Accounting Policies in the Notes to the Audited Consolidated Financial Statements in Item 8 of this Form 10-K for more information) and a $19 million change in discontinued operations primarily related to the spin-off of its coal business (see Note 2 - Discontinued Operations in the Notes to the Audited Consolidated Financial Statements in Item 8 of this Form 10-K for more information). |
Cash (used in) provided by investing activities changed in the period-to-period comparison primarily due to the following items:
• | Capital expenditures increased $460 million in the period-to-period comparison primarily due to increased expenditures in both the Marcellus and Utica Shale plays resulting from increased drilling and completions activity. |
• | Proceeds from the sale of assets increased $154 million primarily due to proceeds of $322 million related to the sale of approximately 35,900 net undeveloped acres in Ohio, Pennsylvania, and West Virginia, proceeds of $24 million related to the sale of approximately 22,000 acres in Colorado and proceeds of $19 million related to the sale of Knox Energy in the current period (See Note 3 - Acquisitions and Dispositions in the Notes to the Audited Consolidated Financial Statements in Item 8 of this Form 10-K for more information). In the year ended December 31, 2016, proceeds of $213 million were received related to the separation of the Marcellus Shale joint venture with Noble Energy. |
• | Net Distributions from (Investments in) Equity Affiliates decreased $31 million in the period-to-period comparison primarily due to distributions of $25 million received from CNXM and distributions of $14 million from CNX Gathering LLC in the year ended December 31, 2017. During the year ended December 31, 2016, $70 million was received in connection with equity affiliate CNXM acquiring an additional 25% interest in CNX Midstream DevCo I LP, commonly referred to as the "Anchor Systems." See Note 20 - Related Party Transactions in the Notes to the Audited Consolidated Financial Statements in Item 8 of this Form 10-K for additional information. |
• | Discontinued Operations changed $372 million primarily related to the spin-off of CONSOL Energy, Inc. (See Note 2 - Discontinued Operations in the Notes to the Audited Consolidated Financial Statements in Item 8 of this Form 10-K for additional information). |
Cash provided by (used in) financing activities changed in the period-to-period comparison primarily due to the following items:
• | In the year ended December 31, 2016, CNX made payments on the senior secured credit facility of $952 million. No such payments were made in the year ended December 31, 2017. |
• | In the year ended December 31, 2017, CNX received proceeds of $425 million related to the spin-off of its coal business. See Note 2 - Discontinued Operations in the Notes to the Audited Consolidated Financial Statements in Item 8 of this Form 10-K for additional information. |
• | In the year ended December 31, 2017, CNX had net payments of $144 million related to the partial extinguishment of the 2022 bonds, $74 million related to the extinguishment of the 2020 bonds and $21 million related to the extinguishment of the 2021 bonds. See Note 10 - Long-Term Debt in the Notes to the Audited Consolidated Financial Statements in Item 8 of this Form 10-K for additional information. |
67
• | In the year ended December 31, 2017, CNX repurchased $103 million of its common stock on the open market. No repurchases were made in the year ended December 31, 2016. |
The following is a summary of the Company's significant contractual obligations at December 31, 2017 (in thousands):
Payments due by Year | |||||||||||||||||||
Less Than 1 Year | 1-3 Years | 3-5 Years | More Than 5 Years | Total | |||||||||||||||
Purchase Order Firm Commitments | $ | 45,562 | $ | 7,347 | $ | 394 | $ | — | $ | 53,303 | |||||||||
Gas Firm Transportation and Processing | 135,741 | 257,426 | 237,231 | 513,744 | 1,144,142 | ||||||||||||||
Long-Term Debt | 263 | (174 | ) | 1,704,963 | 499,773 | 2,204,825 | |||||||||||||
Interest on Long-Term Debt | 140,217 | 280,418 | 234,489 | 19,999 | 675,123 | ||||||||||||||
Capital (Finance) Lease Obligations | 6,848 | 13,877 | 6,471 | — | 27,196 | ||||||||||||||
Interest on Capital (Finance) Lease Obligations | 1,714 | 2,024 | 236 | — | 3,974 | ||||||||||||||
Operating Lease Obligations | 7,497 | 11,899 | 10,816 | 41,433 | 71,645 | ||||||||||||||
Long-Term Liabilities—Employee Related (a) | 332 | 573 | 569 | 579 | 2,053 | ||||||||||||||
Other Long-Term Liabilities (b) | 183,915 | 45,111 | 10,626 | 178,768 | 418,420 | ||||||||||||||
Total Contractual Obligations (c) | $ | 522,089 | $ | 618,501 | $ | 2,205,795 | $ | 1,254,296 | $ | 4,600,681 | |||||||||
_________________________
(a) | Employee related long-term liabilities includes work-related injuries and illnesses. Estimated salaried retirement contributions required to meet minimum funding standards under ERISA are excluded from the pay-out table due to the uncertainty regarding amounts to be contributed. CNX does not expect to contribute to the pension in 2017. |
(b) | Other long-term liabilities include gas well closure and other long-term liability costs. |
(c) | The significant obligation table does not include obligations to taxing authorities due to the uncertainty surrounding the ultimate settlement of amounts and timing of these obligations. |
Debt
At December 31, 2017, CNX had total long-term debt and capital lease obligations of $2,232 million outstanding, including the current portion of long-term debt of $7 million. This long-term debt consisted of:
• | An aggregate principal amount of $1,706 million of 5.875% senior unsecured notes due in April 2022 plus $3 million of unamortized bond premium. Interest on the notes is payable April 15 and October 15 of each year. Payment of the principal and interest on the notes is guaranteed by most of CNX's subsidiaries. |
• | An aggregate principal amount of $500 million of 8.00% senior unsecured notes due in April 2023 less $5 million of unamortized bond discount. Interest on the notes is payable April 1 and October 1 of each year. Payment of the principal and interest on the notes is guaranteed by most of CNX's subsidiaries. |
• | An aggregate principal amount of $0.5 million on a note maturing in March 2018. |
• | An aggregate principal amount of $27 million of capital leases with a weighted average interest rate of 7.01% per annum. |
At December 31, 2017, CNX had no borrowings outstanding and approximately $239 million of letters of credit outstanding under the $1.5 billion senior secured revolving credit facility.
68
Total Equity and Dividends
CNX had total equity of $3,900 million at December 31, 2017 compared to $3,941 million at December 31, 2016. See the Consolidated Statements of Stockholders' Equity in Item 8 of this Form 10-K for additional details.
The declaration and payment of dividends by CNX is subject to the discretion of CNX's Board of Directors, and no assurance can be given that CNX will pay dividends in the future. CNX's Board of Directors determines whether dividends will be paid quarterly. CNX suspended its quarterly dividend in March 2016 to further reflect the Company's increased emphasis on growth. The determination to pay dividends in the future will depend upon, among other things, general business conditions, CNX's financial results, contractual and legal restrictions regarding the payment of dividends by CNX, planned investments by CNX, and such other factors as the Board of Directors deems relevant. The Company's credit facility limits CNX's ability to pay dividends in excess of an annual rate of $0.50 per share when the Company's leverage ratio exceeds 3.50 to 1.00 and subject to an aggregate amount up to a cumulative credit calculation set forth in the facility. The total leverage ratio was 4.08 to 1.00 and the cumulative credit was approximately $389 million at December 31, 2017. The credit facility does not permit dividend payments in the event of default. The indentures to the 2022 and 2023 notes limit dividends to $0.50 per share annually unless several conditions are met. These conditions include no defaults, ability to incur additional debt and other payment limitations under the indentures. There were no defaults in the year ended December 31, 2017.
On January 23, 2018 the Board of Directors of CNX Midstream GP LLC, the general partner of CNX Midstream Partners LP, announced the declaration of a cash distribution of $0.3133 per unit with respect to the fourth quarter of 2017. The distribution will be made on February 14, 2018 to unitholders of record as of the close of business on February 5, 2018. The distribution, which equates to an annual rate of $1.2532 per unit, represents an increase of 3.6% over the prior quarter, and an increase of 15% over the distribution paid with respect to the fourth quarter of 2016.
Off-Balance Sheet Transactions
CNX does not maintain off-balance sheet transactions, arrangements, obligations or other relationships with unconsolidated entities or others that are reasonably likely to have a material current or future effect on the Company’s financial condition, changes in financial condition, revenues or expenses, results of operations, liquidity, capital expenditures or capital resources which are not disclosed in the Notes to the Audited Consolidated Financial Statements. CNX uses a combination of surety bonds, corporate guarantees and letters of credit to secure the Company's financial obligations for employee-related, environmental, performance and various other items which are not reflected on the Consolidated Balance Sheet at December 31, 2017. Management believes these items will expire without being funded. See Note 18 - Commitments and Contingencies in the Notes to the Audited Consolidated Financial Statements in Item 8 of this Form 10-K for additional details of the various financial guarantees that have been issued by CNX.
Recent Accounting Pronouncements
In May 2017, the Financial Accounting Standards Board (FASB) issued Update 2017-09 - Compensation - Stock Compensation (Topic 718): Scope of Modification Accounting, which reduces diversity in practice and cost and complexity when applying the guidance in this Topic to a change to the terms or conditions of a share-based payment award. The amendments in this Update provide guidance about which changes to the terms or conditions of a share-based payment award require an entity to apply modification accounting in Topic 718. The amendments in the Update are effective for fiscal years beginning after December 15, 2017, including interim periods within those fiscal years, and should be applied prospectively to an award modification on or after the adoption date. Early adoption is permitted. The adoption of this guidance is not expected to have a material impact on the Company's financial statements.
In March 2017, the FASB issued Update 2017-07 - Compensation - Retirement Benefits (Topic 715): Improving the Presentation of Net Periodic Pension Cost and Net Periodic Postretirement Benefit Cost, which improves the presentation of net periodic pension cost and net periodic postretirement benefit cost. The amendments in the Update require that an employer report the service cost component in the same line item as other compensation costs arising from services rendered by the pertinent employees during the period. The other components of net benefit cost are required to be presented separately from the service cost component and outside a subtotal of income from operations, if one is presented. Because CNX does not present an income from operations subtotal, that requirement is not applicable. Additionally, the Company's service cost component is deemed immaterial, and therefore, the other components of net benefit cost will not be presented separately. For public entities, the amendments in the Update are effective for fiscal years beginning after December 15, 2017, including interim periods within those fiscal years. Early adoption is permitted as of the beginning of a fiscal year for which financial statements have not been issued. The adoption of this guidance is not expected to have an impact on the Company's financial statements.
69
In August 2016, the FASB issued Update 2016-15 - Statement of Cash Flows (Topic 230): Classification of Certain Cash Receipts and Cash Payments, which addresses eight specific cash flow issues with the objective of reducing the existing diversity in practice. The amendments relate to debt prepayment or debt extinguishment costs, settlement of zero-coupon debt instruments or other debt instruments with coupon interest rates that are insignificant in relation to the effective interest rate of the borrowing, contingent consideration payments made after a business combination, proceeds from the settlement of insurance claims, proceeds from the settlement of corporate-owned life insurance policies, distributions received from equity method investees, and beneficial interests in securitization transactions. The Update also states that, in the absence of specific guidance for cash receipts and payments that have aspects of more than one class of cash flows, an entity should classify each separately identifiable source or use within the cash receipts and payments on the basis of their nature in financing, investing, or operating activities. In situations in which cash receipts or payments cannot be separated by source or use, the appropriate classification should depend on the activity that is likely to be the predominant source or use of cash flows for the item. The amendments in the Update will be applied using a retrospective transition method to each period presented and, for public entities, are effective for fiscal years beginning after December 15, 2017 and interim periods within those fiscal years.The adoption of this guidance is not expected to have an impact on the Company's financial statements.
In May 2014, the FASB issued Update 2014-09, Revenue from Contracts with Customers. The standard requires an entity to recognize revenue in a manner that depicts the transfer of goods or services to customers at an amount that reflects the consideration to which the entity expects to be entitled in exchange for those goods or services. In August 2015, the FASB issued ASU No. 2015-14 Revenue from Contracts with Customers - Deferral of the Effective Date which approved a one year deferral of ASU No. 2014-09 for annual reporting periods beginning after December 15, 2017. During the fourth quarter of 2017, the Company substantially completed its detailed review of the impact of the standard on each of its contracts. The Company adopted the ASUs using the modified retrospective method of adoption on January 1, 2018 and did not require an adjustment to the opening balance of equity. The Company does not expect the standard to have a significant impact on its results of operations, liquidity or financial position in 2018. The Company implemented processes to ensure new contracts are reviewed for the appropriate accounting treatment and generate the disclosures required under the new standard. Additional disclosures will be required to describe the nature, amount, timing and uncertainty of revenue and cash flows from contracts with customers including disaggregation of revenue and remaining performance obligations, beginning with our Form 10-Q for the three months ended March 31, 2018.
In February 2016, the FASB issued Update 2016-02 - Leases (Topic 842), which increases transparency and comparability among organizations by recognizing lease assets and lease liabilities on the balance sheet and disclosing key information about leasing arrangements. Update 2016-02 does retain a distinction between finance leases and operating leases, which is substantially similar to the classification criteria for distinguishing between capital leases and operating leases in the previous lease guidance. Retaining this distinction allows the recognition, measurement and presentation of expenses and cash flows arising from a lease to not significantly change from previous GAAP. For leases with a term of 12 months or less, a lessee is permitted to make an accounting policy election by class of underlying asset not to recognize lease assets and lease liabilities, but to recognize lease expense on a straight-line basis over the lease term. For both financing and operating leases, the right-to-use asset and lease liability will be initially measured at the present value of the lease payments in the statement of financial position.The accounting applied by a lessor is largely unchanged from that applied under previous GAAP. For public business entities, the amendments in this Update are effective for fiscal years beginning after December 15, 2018, including interim periods within those fiscal years. Early application is permitted. In transition, lessees and lessors are required to recognize and measure leases at the beginning of the earliest period presented using a modified retrospective approach. CNX is currently reviewing all existing leases and agreements that are covered by this standard and will continue to evaluate the impact on the financial statements and related disclosures.
70
ITEM 7A. | QUANTITATIVE AND QUALITATIVE DISCLOSURES ABOUT MARKET RISK |
In addition to the risks inherent in operations, CNX is exposed to financial, market, political and economic risks. The following discussion provides additional detail regarding CNX's exposure to the risks of changing commodity prices, interest rates and foreign exchange rates.
CNX is exposed to market price risk in the normal course of selling natural gas. CNX uses fixed-price contracts, options and derivative commodity instruments to minimize exposure to market price volatility in the sale of natural gas and NGLs. Under our risk management policy, it is not our intent to engage in derivative activities for speculative purposes.
CNX has established risk management policies and procedures to strengthen the internal control environment of the marketing of commodities produced from its asset base. All of the derivative instruments without other risk assessment procedures are held for purposes other than trading. They are used primarily to mitigate uncertainty, volatility and cover underlying exposures. The Company's market risk strategy incorporates fundamental risk management tools to assess market price risk and establish a framework in which management can maintain a portfolio of transactions within pre-defined risk parameters.
CNX believes that the use of derivative instruments, along with our risk assessment procedures and internal controls, mitigates our exposure to material risks. However, the use of derivative instruments without other risk assessment procedures could materially affect the Company's results of operations depending on market prices. Nevertheless, we believe that use of these instruments will not have a material adverse effect on our financial position or liquidity.
For a summary of accounting policies related to derivative instruments, see Note 1—Significant Accounting Policies in the Notes to the Audited Consolidated Financial Statements in Item 8 of this Form 10-K.
At December 31, 2017, our open derivative instruments were in a net asset position with a fair value of $60 million, and at December 31, 2016 our open derivative instruments were in a net liability position with a fair value of $188 million. A sensitivity analysis has been performed to determine the incremental effect on future earnings related to open derivative instruments at December 31, 2017 and 2016. A hypothetical 10 percent increase in future natural gas prices would have decreased the fair value by $323 million and $255 million at December 31, 2017 and 2016, respectively. A hypothetical 10 percent decrease in future natural gas prices would have increased the fair value by $321 million and $251 million at December 31, 2017 and 2016, respectively.
The Company's interest expense is sensitive to changes in the general level of interest rates in the United States. At December 31, 2017 and 2016, CNX had $2,214 million and $2,456 million, respectively, aggregate principal amount of debt outstanding under fixed-rate instruments, including unamortized debt issuance costs of $18 million and $23 million, respectively, and no debt outstanding under variable-rate instruments. The Company's primary exposure to market risk for changes in interest rates relates to the revolving credit facility, under which there were no borrowings at December 31, 2017 or 2016, so a hypothetical 100 basis-point increase in the average rate for the Company's revolving credit facility would not impact pre-tax future earnings.
All of the Company's transactions are denominated in U.S. dollars, and, as a result, it does not have material exposure to currency exchange-rate risks.
71
Natural Gas Hedging Volumes
As of January 15, 2018, the Company's hedged volumes for the periods indicated are as follows:
For the Three Months Ended | |||||||||||||||||||
March 31, | June 30, | September 30, | December 31, | Total Year | |||||||||||||||
2018 Fixed Price Volumes | |||||||||||||||||||
Hedged Bcf | 98.4 | 95.8 | 96.8 | 97.6 | 388.6 | ||||||||||||||
Weighted Average Hedge Price per Mcf | $ | 2.79 | $ | 2.77 | $ | 2.77 | $ | 2.77 | $ | 2.77 | |||||||||
2019 Fixed Price Volumes | |||||||||||||||||||
Hedged Bcf | 67.3 | 68.1 | 68.8 | 68.8 | 273.0 | ||||||||||||||
Weighted Average Hedge Price per Mcf | $ | 2.74 | $ | 2.74 | $ | 2.74 | $ | 2.74 | $ | 2.74 | |||||||||
2020 Fixed Price Volumes | |||||||||||||||||||
Hedged Bcf | 49.9 | 49.3 | 49.9 | 49.9 | 198.3* | ||||||||||||||
Weighted Average Hedge Price per Mcf | $ | 2.85 | $ | 2.77 | $ | 2.77 | $ | 2.75 | $ | 2.78 | |||||||||
2021 Fixed Price Volumes | |||||||||||||||||||
Hedged Bcf | 41.0 | 41.5 | 42.0 | 42.0 | 166.5 | ||||||||||||||
Weighted Average Hedge Price per Mcf | $ | 2.62 | $ | 2.62 | $ | 2.62 | $ | 2.62 | $ | 2.62 | |||||||||
2022 Fixed Price Volumes | |||||||||||||||||||
Hedged Bcf | 37.8 | 38.2 | 38.7 | 38.7 | 153.4 | ||||||||||||||
Weighted Average Hedge Price per Mcf | $ | 2.83 | $ | 2.83 | $ | 2.83 | $ | 2.83 | $ | 2.83 | |||||||||
*Quarterly volumes do not add to annual volumes in as much as a discrete condition in individual quarters, where basis hedge volumes exceed NYMEX hedge volumes, does not exist for the year taken as a whole.
72
ITEM 8. | FINANCIAL STATEMENTS AND SUPPLEMENTARY DATA |
INDEX TO CONSOLIDATED FINANCIAL STATEMENTS | ||
Page | ||
Report of Independent Registered Public Accounting Firm | ||
Consolidated Statements of Income for the Years Ended December 31, 2017, 2016 and 2015 | ||
Consolidated Statements of Stockholders' Equity for the Years Ended December 31, 2017, 2016 and 2015 | ||
Consolidated Statements of Cash Flows for the Years Ended December 31, 2017, 2016, 2015 | ||
Notes to the Audited Consolidated Financial Statements | ||
73
Report of Independent Registered Public Accounting Firm
To the Stockholders and the Board of Directors of CNX Resources Corporation and Subsidiaries
Opinion on the Financial Statements
We have audited the accompanying consolidated balance sheets of CNX Resources Corporation and Subsidiaries (the Company) as of December 31, 2017 and 2016, and the related consolidated statements of income, comprehensive income, stockholders' equity and cash flows for each of the three years in the period ended December 31, 2017, and the related notes and financial statement schedule listed in the Index at Item 15 (a) (collectively referred to as the “financial statements”). In our opinion, the financial statements present fairly, in all material respects, the consolidated financial position of the Company at December 31, 2017 and 2016, and the consolidated results of its operations and its cash flows for each of the three years in the period ended December 31, 2017, in conformity with U.S. generally accepted accounting principles.
We also have audited, in accordance with the standards of the Public Company Accounting Oversight Board (United States) (PCAOB), the Company's internal control over financial reporting as of December 31, 2017, based on criteria established in Internal Control-Integrated Framework issued by the Committee of Sponsoring Organizations of the Treadway Commission (2013 framework) and our report dated February 7, 2018 expressed an unqualified opinion thereon.
Basis for Opinion
These financial statements are the responsibility of the Company's management. Our responsibility is to express an opinion on the Company’s financial statements based on our audits. We are a public accounting firm registered with the PCAOB and are required to be independent with respect to the Company in accordance with the U.S. federal securities laws and the applicable rules and regulations of the Securities and Exchange Commission and the PCAOB.
We conducted our audits in accordance with the standards of the PCAOB. Those standards require that we plan and perform the audit to obtain reasonable assurance about whether the financial statements are free of material misstatement, whether due to error or fraud. Our audits included performing procedures to assess the risks of material misstatement of the financial statements, whether due to error or fraud, and performing procedures that respond to those risks. Such procedures included examining, on a test basis, evidence regarding the amounts and disclosures in the financial statements. Our audits also included evaluating the accounting principles used and significant estimates made by management, as well as evaluating the overall presentation of the financial statements. We believe that our audits provide a reasonable basis for our opinion.
/s/ Ernst & Young LLP
We have served as the Company’s auditor since 2008.
Pittsburgh, Pennsylvania
February 7, 2018
74
CNX RESOURCES CORPORATION AND SUBSIDIARIES
CONSOLIDATED STATEMENTS OF INCOME
(Dollars in thousands, except per share data) | For the Years Ended December 31, | ||||||||||
2017 | 2016 | 2015 | |||||||||
Revenue and Other Operating Income: | |||||||||||
Natural Gas, NGLs and Oil Sales | $ | 1,125,224 | $ | 793,248 | $ | 726,921 | |||||
Gain (Loss) on Commodity Derivative Instruments | 206,930 | (141,021 | ) | 392,942 | |||||||
Purchased Gas Sales | 53,795 | 43,256 | 14,450 | ||||||||
Other Operating Income | 69,182 | 64,485 | 64,424 | ||||||||
Total Revenue and Other Operating Income | 1,455,131 | 759,968 | 1,198,737 | ||||||||
Costs and Expenses: | |||||||||||
Operating Expense | |||||||||||
Lease Operating Expense | 88,932 | 96,434 | 121,847 | ||||||||
Transportation, Gathering and Compression | 382,865 | 374,350 | 343,403 | ||||||||
Production, Ad Valorem, and Other Fees | 29,267 | 31,049 | 30,438 | ||||||||
Depreciation, Depletion and Amortization | 412,036 | 419,939 | 371,783 | ||||||||
Exploration and Production Related Other Costs | 48,074 | 14,522 | 10,119 | ||||||||
Purchased Gas Costs | 52,597 | 42,717 | 10,721 | ||||||||
Impairment of Exploration and Production Properties | 137,865 | — | 828,905 | ||||||||
Selling, General and Administrative Costs | 93,211 | 104,843 | 102,270 | ||||||||
Other Operating Expense | 112,369 | 88,754 | 65,858 | ||||||||
Total Operating Expense | 1,357,216 | 1,172,608 | 1,885,344 | ||||||||
Other (Income) Expense | |||||||||||
Other Expense | 3,825 | 4,783 | 38,226 | ||||||||
Gain on Sale of Assets | (188,063 | ) | (14,270 | ) | (61,148 | ) | |||||
Loss on Debt Extinguishment | 2,129 | — | 67,751 | ||||||||
Interest Expense | 161,443 | 182,195 | 199,121 | ||||||||
Total Other (Income) Expense | (20,666 | ) | 172,708 | 243,950 | |||||||
Total Costs and Expenses | 1,336,550 | 1,345,316 | 2,129,294 | ||||||||
Income (Loss) from Continuing Operations Before Income Tax | 118,581 | (585,348 | ) | (930,557 | ) | ||||||
Income Tax Benefit | (176,458 | ) | (34,403 | ) | (280,359 | ) | |||||
Income (Loss) from Continuing Operations | 295,039 | (550,945 | ) | (650,198 | ) | ||||||
Income (Loss) from Discontinued Operations, net | 85,708 | (297,157 | ) | 275,313 | |||||||
Net Income (Loss) | $ | 380,747 | $ | (848,102 | ) | $ | (374,885 | ) | |||
The accompanying notes are an integral part of these financial statements.
75
CNX RESOURCES CORPORATION AND SUBSIDIARIES
CONSOLIDATED STATEMENTS OF INCOME
(CONTINUED)
For the Years Ended December 31, | |||||||||||
(Dollars in thousands, except per share data) | 2017 | 2016 | 2015 | ||||||||
Earnings (Loss) Per Share | |||||||||||
Basic | |||||||||||
Income (Loss) from Continuing Operations | $ | 1.29 | $ | (2.40 | ) | $ | (2.84 | ) | |||
Income (Loss) from Discontinued Operations | 0.37 | (1.30 | ) | 1.20 | |||||||
Total Basic Earnings (Loss) Per Share | $ | 1.66 | $ | (3.70 | ) | $ | (1.64 | ) | |||
Dilutive | |||||||||||
Income (Loss) from Continuing Operations | $ | 1.28 | $ | (2.40 | ) | $ | (2.84 | ) | |||
Income (Loss) from Discontinued Operations | 0.37 | (1.30 | ) | 1.20 | |||||||
Total Dilutive Earnings (Loss) Per Share | $ | 1.65 | $ | (3.70 | ) | $ | (1.64 | ) | |||
Dividends Declared Per Share | $ | — | $ | 0.01 | $ | 0.145 | |||||
CNX RESOURCES CORPORATION AND SUBSIDIARIES
CONSOLIDATED STATEMENTS OF COMPREHENSIVE INCOME
(Dollars in thousands)
For the Years Ended December 31, | |||||||||||
2017 | 2016 | 2015 | |||||||||
Net Income (Loss) | $ | 380,747 | $ | (848,102 | ) | $ | (374,885 | ) | |||
Other Comprehensive Income (Loss): | |||||||||||
Actuarially Determined Long-Term Liability Adjustments (Net of tax: ($7,365), $16,281, 53,252) | 12,228 | (33,226 | ) | (86,447 | ) | ||||||
Reclassification of Cash Flow Hedges from Other Comprehensive Income to Earnings (Net of tax: $-, $25,011, $45,054) | — | (43,470 | ) | (78,051 | ) | ||||||
Other Comprehensive Income (Loss) | 12,228 | (76,696 | ) | (164,498 | ) | ||||||
Comprehensive Income (Loss) | $ | 392,975 | $ | (924,798 | ) | $ | (539,383 | ) | |||
The accompanying notes are an integral part of these financial statements.
76
CNX RESOURCES CORPORATION AND SUBSIDIARIES
CONSOLIDATED BALANCE SHEETS
(Dollars in thousands)
December 31, 2017 | December 31, 2016 | ||||||
ASSETS | |||||||
Current Assets: | |||||||
Cash and Cash Equivalents | $ | 509,167 | $ | 46,299 | |||
Accounts and Notes Receivable: | |||||||
Trade | 156,817 | 124,514 | |||||
Other Receivables | 48,908 | 51,145 | |||||
Supplies Inventories | 10,742 | 15,301 | |||||
Recoverable Income Taxes | 31,523 | 114,481 | |||||
Prepaid Expenses | 95,347 | 75,576 | |||||
Current Assets of Discontinued Operations (Note 2) | — | 198,823 | |||||
Total Current Assets | 852,504 | 626,139 | |||||
Property, Plant and Equipment (Note 7): | |||||||
Property, Plant and Equipment | 9,316,495 | 9,183,959 | |||||
Less—Accumulated Depreciation, Depletion and Amortization | 3,526,742 | 3,214,984 | |||||
Property, Plant and Equipment of Discontinued Operations, Net (Note 2) | — | 2,171,464 | |||||
Total Property, Plant and Equipment—Net | 5,789,753 | 8,140,439 | |||||
Other Assets: | |||||||
Investment in Affiliates | 197,921 | 190,964 | |||||
Other | 91,735 | 95,515 | |||||
Other Assets of Discontinued Operations (Note 2) | — | 126,634 | |||||
Total Other Assets | 289,656 | 413,113 | |||||
TOTAL ASSETS | $ | 6,931,913 | $ | 9,179,691 | |||
The accompanying notes are an integral part of these financial statements.
77
CNX RESOURCES CORPORATION AND SUBSIDIARIES
CONSOLIDATED BALANCE SHEETS
(Dollars in thousands, except per share data)
December 31, 2017 | December 31, 2016 | ||||||
LIABILITIES AND EQUITY | |||||||
Current Liabilities: | |||||||
Accounts Payable | $ | 211,161 | $ | 157,102 | |||
Current Portion of Long-Term Debt (Note 10 and Note 11) | 7,111 | 7,924 | |||||
Other Accrued Liabilities (Note 9) | 223,407 | 389,641 | |||||
Current Liabilities of Discontinued Operations (Note 2) | — | 385,347 | |||||
Total Current Liabilities | 441,679 | 940,014 | |||||
Long-Term Debt: | |||||||
Long-Term Debt (Note 10) | 2,187,026 | 2,421,168 | |||||
Capital Lease Obligations (Note 11) | 20,347 | 27,262 | |||||
Long-Term Debt of Discontinued Operations (Note 2) | — | 313,639 | |||||
Total Long-Term Debt | 2,207,373 | 2,762,069 | |||||
Deferred Credits and Other Liabilities: | |||||||
Deferred Income Taxes (Note 5) | 44,373 | 105,096 | |||||
Asset Retirement Obligations (Note 6) | 198,768 | 195,704 | |||||
Salary Retirement (Note 12) | 34,748 | 32,546 | |||||
Other | 105,073 | 138,059 | |||||
Deferred Credits and Other Liabilities of Discontinued Operations (Note 2) | — | 1,065,315 | |||||
Total Deferred Credits and Other Liabilities | 382,962 | 1,536,720 | |||||
TOTAL LIABILITIES | 3,032,014 | 5,238,803 | |||||
Stockholders’ Equity: | |||||||
Common Stock, $0.01 Par Value; 500,000,000 Shares Authorized, 223,743,322 Issued and Outstanding at December 31, 2017; 229,443,008 Issued and Outstanding at December 31, 2016 | 2,241 | 2,298 | |||||
Capital in Excess of Par Value | 2,450,323 | 2,460,864 | |||||
Preferred Stock, 15,000,000 Shares Authorized, None Issued and Outstanding | — | — | |||||
Retained Earnings | 1,455,811 | 1,727,789 | |||||
Accumulated Other Comprehensive Loss | (8,476 | ) | (392,556 | ) | |||
Total CNX Resources Corporation Stockholders’ Equity | 3,899,899 | 3,798,395 | |||||
Noncontrolling Interest | — | 142,493 | |||||
TOTAL EQUITY | 3,899,899 | 3,940,888 | |||||
TOTAL LIABILITIES AND EQUITY | $ | 6,931,913 | $ | 9,179,691 | |||
The accompanying notes are an integral part of these financial statements.
78
CNX RESOURCES CORPORATION AND SUBSIDIARIES
CONSOLIDATED STATEMENTS OF STOCKHOLDERS’ EQUITY
(Dollars in thousands, except per share data)
Common Stock | Capital in Excess of Par Value | Retained Earnings (Deficit) | Accumulated Other Comprehensive Income (Loss) | Total CNX Resources Stockholders’ Equity | Non- Controlling Interest | Total Equity | |||||||||||||||||||||
December 31, 2014 | 2,306 | 2,424,102 | 3,054,150 | (151,100 | ) | 5,329,458 | — | 5,329,458 | |||||||||||||||||||
Net (Loss) Income | — | — | (374,885 | ) | — | (374,885 | ) | 10,410 | (364,475 | ) | |||||||||||||||||
Gas Cash Flow Hedge (Net of $45,054 Tax) | — | — | — | (78,051 | ) | (78,051 | ) | — | (78,051 | ) | |||||||||||||||||
Actuarially Determined Long-Term Liability Adjustments (Net of $53,252 Tax) | — | — | — | (86,447 | ) | (86,447 | ) | — | (86,447 | ) | |||||||||||||||||
Comprehensive (Loss) Income | — | — | (374,885 | ) | (164,498 | ) | (539,383 | ) | 10,410 | (528,973 | ) | ||||||||||||||||
Shares Withheld for Taxes | — | — | (12,181 | ) | — | (12,181 | ) | — | (12,181 | ) | |||||||||||||||||
Issuance of Common Stock | 10 | 8,278 | — | — | 8,288 | — | 8,288 | ||||||||||||||||||||
Retirement of Common Stock (2,213,100 shares) | (22 | ) | (17,683 | ) | (53,969 | ) | — | (71,674 | ) | — | (71,674 | ) | |||||||||||||||
Tax Cost from Stock-Based Compensation | — | (3,706 | ) | — | — | (3,706 | ) | — | (3,706 | ) | |||||||||||||||||
Amortization of Stock-Based Compensation Awards | — | 24,506 | — | — | 24,506 | — | 24,506 | ||||||||||||||||||||
Distributions to Noncontrolling Interest | — | — | — | — | — | (5,060 | ) | (5,060 | ) | ||||||||||||||||||
Proceeds from Sale of MLP Interest | — | — | — | — | — | 148,399 | 148,399 | ||||||||||||||||||||
Dividends ($0.145 per share) | — | — | (33,281 | ) | — | (33,281 | ) | — | (33,281 | ) | |||||||||||||||||
December 31, 2015 | 2,294 | 2,435,497 | 2,579,834 | (315,598 | ) | 4,702,027 | 153,749 | 4,855,776 | |||||||||||||||||||
Net (Loss) Income | — | — | (848,102 | ) | — | (848,102 | ) | 8,954 | (839,148 | ) | |||||||||||||||||
Gas Cash Flow Hedge (Net of $25,011 Tax) | — | — | — | (43,470 | ) | (43,470 | ) | — | (43,470 | ) | |||||||||||||||||
Actuarially Determined Long-Term Liability Adjustments (Net of $16,281 Tax) | — | — | — | (33,488 | ) | (33,488 | ) | 262 | (33,226 | ) | |||||||||||||||||
Comprehensive (Loss) Income | — | — | (848,102 | ) | (76,958 | ) | (925,060 | ) | 9,216 | (915,844 | ) | ||||||||||||||||
Issuance of Common Stock | 4 | — | — | — | 4 | — | 4 | ||||||||||||||||||||
Shares Withheld for Taxes | — | — | (1,649 | ) | — | (1,649 | ) | — | (1,649 | ) | |||||||||||||||||
Tax Cost From Stock-Based Compensation | — | (4,931 | ) | — | — | (4,931 | ) | — | (4,931 | ) | |||||||||||||||||
Amortization of Stock-Based Compensation Awards | — | 30,298 | — | — | 30,298 | 1,185 | 31,483 | ||||||||||||||||||||
Distributions to Noncontrolling Interest | — | — | — | — | — | (21,657 | ) | (21,657 | ) | ||||||||||||||||||
Dividends ($0.01 per share) | — | — | (2,294 | ) | — | (2,294 | ) | — | (2,294 | ) | |||||||||||||||||
December 31, 2016 | $ | 2,298 | $ | 2,460,864 | $ | 1,727,789 | $ | (392,556 | ) | $ | 3,798,395 | $ | 142,493 | $ | 3,940,888 | ||||||||||||
Net Income | — | — | 380,747 | — | 380,747 | — | 380,747 | ||||||||||||||||||||
Actuarially Determined Long-Term Liability Adjustments (Net of ($7,365) Tax) | — | — | — | 12,228 | 12,228 | — | 12,228 | ||||||||||||||||||||
Comprehensive Income | — | — | 380,747 | 12,228 | 392,975 | — | 392,975 | ||||||||||||||||||||
Issuance of Common Stock | 7 | 1,002 | — | — | 1,009 | — | 1,009 | ||||||||||||||||||||
Purchase and Retirement of Common Stock (6,410,900 shares) | (64 | ) | (51,223 | ) | (51,922 | ) | — | (103,209 | ) | — | (103,209 | ) | |||||||||||||||
Distribution of CONSOL Energy, Inc | — | 22,697 | (594,122 | ) | 371,852 | (199,573 | ) | (142,493 | ) | (342,066 | ) | ||||||||||||||||
Shares Withheld for Taxes | — | — | (6,681 | ) | — | (6,681 | ) | — | (6,681 | ) | |||||||||||||||||
Amortization of Stock-Based Compensation Awards | — | 16,983 | — | — | 16,983 | — | 16,983 | ||||||||||||||||||||
December 31, 2017 | $ | 2,241 | $ | 2,450,323 | $ | 1,455,811 | $ | (8,476 | ) | $ | 3,899,899 | $ | — | $ | 3,899,899 | ||||||||||||
The accompanying notes are an integral part of these financial statements.
79
CNX RESOURCES CORPORATION AND SUBSIDIARIES
CONSOLIDATED STATEMENTS OF CASH FLOWS
(Dollars in thousands) | For the Years Ended December 31, | ||||||||||
2017 | 2016 | 2015 | |||||||||
Cash Flows from Operating Activities: | |||||||||||
Net Income (Loss) | $ | 380,747 | $ | (848,102 | ) | $ | (374,885 | ) | |||
Adjustments to Reconcile Net Income (Loss) to Net Cash Provided By Continuing Operating Activities: | |||||||||||
Net (Income) Loss from Discontinued Operations | (85,708 | ) | 297,157 | (275,313 | ) | ||||||
Depreciation, Depletion and Amortization | 412,036 | 419,939 | 371,783 | ||||||||
Impairment of Exploration and Production Properties | 137,865 | — | 828,905 | ||||||||
Stock-Based Compensation | 16,983 | 19,316 | 14,314 | ||||||||
Gain on Sale of Assets | (188,063 | ) | (14,270 | ) | (61,148 | ) | |||||
Loss on Debt Extinguishment | 2,129 | — | 67,751 | ||||||||
(Gain) Loss on Commodity Derivative Instruments | (206,930 | ) | 141,021 | (392,942 | ) | ||||||
Net Cash (Paid) Received in Settlement of Commodity Derivative Instruments | (41,174 | ) | 245,212 | 196,348 | |||||||
Deferred Income Taxes | (142,829 | ) | 75,892 | (275,541 | ) | ||||||
Return on Equity Investment | — | 22,268 | 35,466 | ||||||||
Equity in Earnings of Affiliates | (49,830 | ) | (53,078 | ) | (54,897 | ) | |||||
Changes in Operating Assets: | |||||||||||
Accounts and Notes Receivable | (32,792 | ) | (46,434 | ) | 101,107 | ||||||
Supplies Inventories | 4,254 | (1,486 | ) | 933 | |||||||
Recoverable Income Tax | 76,196 | (91,313 | ) | 69,404 | |||||||
Prepaid Expenses | 631 | 76,668 | 128,402 | ||||||||
Changes in Other Assets | 22,018 | (2,473 | ) | 63,656 | |||||||
Changes in Operating Liabilities: | |||||||||||
Accounts Payable | 45,669 | (17,227 | ) | (131,825 | ) | ||||||
Accrued Interest | (2,955 | ) | (1,144 | ) | 26,486 | ||||||
Other Operating Liabilities | 37,712 | (48,315 | ) | (161,181 | ) | ||||||
Changes in Other Liabilities | (7,778 | ) | 78,140 | 46,173 | |||||||
Other | 54,887 | 15,461 | 12,609 | ||||||||
Net Cash Provided by Continuing Operating Activities | 433,068 | 267,232 | 235,605 | ||||||||
Net Cash Provided by Discontinued Operating Activities | 215,619 | 197,026 | 275,991 | ||||||||
Net Cash Provided by Operating Activities | 648,687 | 464,258 | 511,596 | ||||||||
Cash Flows from Investing Activities: | |||||||||||
Capital Expenditures | (632,846 | ) | (172,739 | ) | (840,349 | ) | |||||
Proceeds from Noble Exchange Settlement | — | 213,295 | — | ||||||||
Proceeds from Sales of Assets | 414,185 | 46,989 | 86,737 | ||||||||
Net Distributions from (Investments in) Equity Affiliates | 42,873 | 73,743 | (72,288 | ) | |||||||
Net Cash (Used in) Provided by Continuing Investing Activities | (175,788 | ) | 161,288 | (825,900 | ) | ||||||
Net Cash (Used in) Provided by Discontinued Investing Activities | (46,133 | ) | 326,083 | (170,317 | ) | ||||||
Net Cash (Used in) Provided by Investing Activities | (221,921 | ) | 487,371 | (996,217 | ) | ||||||
Cash Flows from Financing Activities: | |||||||||||
(Payments on) Proceeds from Short-Term Borrowings | — | (952,000 | ) | 952,000 | |||||||
Payments on Miscellaneous Borrowings | (8,037 | ) | (7,802 | ) | (3,645 | ) | |||||
Payments on Long-Term Notes, including Redemption Premium | (239,716 | ) | — | (1,263,719 | ) | ||||||
Proceeds from Spin-Off of CONSOL Energy Inc. | 425,000 | — | — | ||||||||
Proceeds from Issuance of Long-Term Notes | — | — | 492,760 | ||||||||
Tax Benefit from Stock-Based Compensation | — | — | 208 | ||||||||
Dividends Paid | — | (2,294 | ) | (33,281 | ) | ||||||
Proceeds from Issuance of Common Stock | 1,009 | 4 | 8,288 | ||||||||
Shares Withheld for Taxes | (6,681 | ) | (1,649 | ) | (12,181 | ) | |||||
Purchases of Common Stock | (103,209 | ) | — | (71,674 | ) | ||||||
Debt Issuance and Financing Fees | (361 | ) | — | (6,250 | ) | ||||||
Net Cash Provided by (Used in) Continuing Financing Activities | 68,005 | (963,741 | ) | 62,506 | |||||||
Net Cash (Used in) Provided by Discontinued Financing Activities | (31,903 | ) | (6,663 | ) | 311,270 | ||||||
Net Cash Provided by (Used in) Financing Activities | 36,102 | (970,404 | ) | 373,776 | |||||||
Net Increase (Decrease) in Cash and Cash Equivalents | 462,868 | (18,775 | ) | (110,845 | ) | ||||||
Cash and Cash Equivalents at Beginning of Period | 46,299 | 65,074 | 175,919 | ||||||||
Cash and Cash Equivalents at End of Period | $ | 509,167 | $ | 46,299 | $ | 65,074 | |||||
The accompanying notes are an integral part of these financial statements.
80
CNX RESOURCES CORPORATION AND SUBSIDIARIES
NOTES TO AUDITED CONSOLIDATED FINANCIAL STATEMENTS
(Dollars in thousands, except per share data)
NOTE 1—SIGNIFICANT ACCOUNTING POLICIES:
A summary of the significant accounting policies of CNX Resources Corporation and subsidiaries ("CNX " or "the Company") is presented below. These, together with the other notes that follow, are an integral part of the Consolidated Financial Statements.
Basis of Consolidation:
The Consolidated Financial Statements include the accounts of CNX Resources Corporation, and its wholly owned and majority-owned and/or controlled subsidiaries, including certain variable interest entities that the Company is required to consolidate pursuant to the Consolidation topic of the Financial Accounting Standards Board (FASB) Accounting Standards Codification. The portion of these entities that is not owned by the Company is presented as non-controlling interest. Investments in business entities in which CNX does not have control, but has the ability to exercise significant influence over the operating and financial policies, are accounted for under the equity method. All significant intercompany transactions and accounts have been eliminated in consolidation. Investments in oil and natural gas producing entities are accounted for under the proportionate consolidation method.
Discontinued Operations:
Businesses divested are classified in the Consolidated Financial Statements as either discontinued operations or held for sale when the provision of Accounting Standards Codification (ASC) Topic 205 or ASC Topic 360 are met. For businesses classified as discontinued operations, the balance sheet amounts and results of operations are reclassified from their historical presentation to assets and liabilities of discontinued operations on the Consolidated Balance Sheets and to discontinued operations on the Consolidated Statements of Income and Cash Flows for all periods presented. The gains or losses associated with these divested businesses are recorded in discontinued operations on the Consolidated Statements of Income. The disclosures outside of Note 2- Discontinued Operations, for all periods presented, in the accompanying notes generally do not include the assets, liabilities, or operating results of businesses classified as discontinued operations.
Use of Estimates:
The preparation of financial statements in conformity with accounting principles generally accepted in the United States of America requires management to make estimates and assumptions that affect the reported amounts of assets, liabilities, revenues and expenses, as well as various disclosures. Actual results could differ from those estimates. The most significant estimates included in the preparation of the consolidated financial statements are related to salary retirement benefits, stock-based compensation, asset retirement obligations, deferred income tax assets and liabilities, contingencies and the values of natural gas, NGLs, condensate and oil (collectively "natural gas") reserves.
Cash and Cash Equivalents:
Cash and cash equivalents include cash on hand and on deposit at banking institutions as well as all highly liquid short-term securities with original maturities of three months or less.
Trade Accounts Receivable:
Trade accounts receivable are recorded at the invoiced amount and do not bear interest. CNX reserves for specific accounts receivable when it is probable that all or a part of an outstanding balance will not be collected, such as customer bankruptcies. Collectability is determined based on terms of sale, credit status of customers and various other circumstances. CNX regularly reviews collectability and establishes or adjusts the allowance as necessary using the specific identification method. Account balances are charged off against the allowance after all means of collection have been exhausted and the potential for recovery is considered remote. Reserves for uncollectable amounts were not material in the periods presented. In addition, there were no material financing receivables with a contractual maturity greater than one year at December 31, 2017 or 2016.
81
Inventories:
Inventories are stated at the lower of cost or net realizable value. The cost of supplies inventory is determined by the average cost method and includes operating and maintenance supplies to be used in the Company's operations.
Property, Plant and Equipment:
CNX uses the successful efforts method of accounting for natural gas producing activities. Costs of property acquisitions, successful exploratory, development wells and related support equipment and facilities are capitalized. Periodic valuation provisions for impairment of capitalized costs of unproved mineral interests are expensed. Costs of unsuccessful exploratory wells are expensed when such wells are determined to be non-productive, or if the determination cannot be made after finding sufficient quantities of reserves to continue evaluating the viability of the project. The costs of producing properties and mineral interests are amortized using the units-of-production method. Wells and related equipment and intangible drilling costs are also amortized on a units-of-production method. Units-of-production amortization rates are revised at least once per year, or more frequently if events and circumstances indicate an adjustment is necessary. Such revisions are accounted for prospectively as changes in accounting estimates.
Property, plant and equipment is recorded at cost upon acquisition. Expenditures which extend the useful lives of existing plant and equipment are capitalized. Interest costs applicable to major asset additions are capitalized during the construction period. Planned major maintenance costs which do not extend the useful lives of existing plant and equipment are expensed as incurred.
Gas advance royalties are royalties that are paid in advance for the right to use an owners land for the exploration and production of oil, NGLs and natural gas. These advance royalties are evaluated periodically, or at a minimum once per year, for impairment issues or whenever events or changes in circumstances indicate that the carrying amount may not be recoverable. Any revisions are accounted for prospectively as changes in accounting estimates.
Depreciation of plant and equipment is calculated on the straight-line method over their estimated useful lives or lease terms, generally as follows:
Years | ||
Buildings and improvements | 10 to 45 | |
Machinery and equipment | 3 to 25 | |
Gathering and transmission | 30 to 40 | |
Leasehold improvements | Life of Lease | |
Costs for purchased software are capitalized and amortized using the straight-line method over the estimated useful life which does not exceed seven years.
Impairment of Long-lived Assets:
Impairment of long-lived assets is recorded when indicators of impairment are present and the undiscounted cash flows estimated to be generated by those assets are less than the assets' carrying value. The carrying value of the assets is then reduced to its estimated fair value which is usually measured based on an estimate of future discounted cash flows. Impairment of equity investments is recorded when indicators of impairment are present and the estimated fair value of the investment is less than the assets' carrying value.
In February 2017, the Company approved a plan to sell its subsidiaries Knox Energy LLC and Coalfield Pipeline Company (collectively, “Knox”). Knox met all of the criteria to be classified as held for sale in February 2017. As part of the required evaluation under the held for sale guidance, during the first quarter, Knox’s book value was evaluated and it was determined that the approximate fair value less costs to sell Knox was less than the carrying value of the net assets to be sold. The resulting impairment of $137,865 was included in Impairment of Exploration and Production Properties within the the Consolidated Statements of Income during the year ended December 31, 2017. The sale of Knox closed in the second quarter of 2017 (See Note 3 - Acquisitions and Dispositions for more information). The disposal of Knox did not represent a strategic shift that would have had a major effect on the Company’s operations and financial results and was, therefore, not classified as a discontinued operation in accordance with Topic 205, Presentation of Financial Statements, and Topic 360, Property, Plant and Equipment.
82
Impairment of Proved Properties:
CNX performs a quantitative impairment test, whenever events or changes in circumstances indicate that a property’s carrying amount may not be recoverable, over proved properties using the published NYMEX forward prices, timing, methods and other assumptions consistent with historical periods. Impairment tests require that the Company first compare future undiscounted cash flows by asset group to their respective carrying values. If the carrying amount exceeds the estimated undiscounted future cash flows, a reduction of the carrying amount of the natural gas properties to their estimated fair values is required, which is determined based on discounted cash flow techniques using a market-specific weighted average cost of capital.
During the year ended December 31, 2015, certain of the Company’s proved properties, primarily shallow oil and gas assets, failed the undiscounted cash flow portion of the test. After performing the discounted cash flow portion of the test, CNX recorded an impairment of $824,742, included in Impairment of Exploration and Production Properties in the Consolidated Statements of Income. Valuation of the impaired assets is a Level 3 measurement as it incorporates significant unobservable inputs, such as future production levels and operating costs, within the discounted cash flow analysis. The impairment related to approximately 95% of the Company’s shallow oil and gas assets in West Virginia and Pennsylvania.
There were no other impairments related to proved properties in the years ended December 31, 2017, 2016 or 2015.
Impairment of Unproved Properties:
CNX evaluates capitalized costs of unproved gas properties for recoverability on a prospective basis. Indicators of potential impairment include potential shifts in business strategy, overall economic factors and historical experience. If it is determined that the properties will not yield proved reserves, the related costs are expensed in the period the determination is made. For the year ended December 31, 2015, unproved property impairments relating to the determination that the properties will not yield proved reserves were $4,163 and are included in Impairment of Exploration and Production Properties in the Consolidated Statements of Income. Valuation of the impaired assets is a Level 3 measurement as it incorporates significant unobservable inputs, such as future production levels and operating costs, within the discounted cash flow analysis. This impairment primarily related to the court ruling in June 2015 in the state of New York that officially bans hydraulic fracturing.
Exploration expense, which is associated primarily with lease expirations, was $48,074, $14,522 and $10,119 for the years ended December 31, 2017, 2016 and 2015, respectively, and is included in Exploration and Production Related Other Costs in the Consolidated Statements of Income.
There were no other impairments related to unproved properties in the years ended December 31, 2017, 2016 or 2015.
Income Taxes:
Deferred tax assets and liabilities are recognized for the expected future tax consequences of events that have been recognized in the Company's financial statements or tax returns. The provision for income taxes represents income taxes paid or payable for the current year and the change in deferred taxes, excluding the effects of acquisitions during the year. Deferred taxes result from differences between the financial and tax bases of the Company's assets and liabilities and are adjusted for changes in tax rates and tax laws when changes are enacted. Valuation allowances are recorded to reduce deferred tax assets when it is more likely than not that a deferred tax benefit will not be realized.
CNX evaluates all tax positions taken on the state and federal tax filings to determine if the position is more likely than not to be sustained upon examination. For positions that do not meet the more likely than not to be sustained criteria, the Company determines, on a cumulative probability basis, the largest amount of benefit that is more likely than not to be realized upon ultimate settlement. A previously recognized tax position is reversed when it is subsequently determined that a tax position no longer meets the more likely than not threshold to be sustained. The evaluation of the sustainability of a tax position and the probable amount that is more likely than not is based on judgment, historical experience and on various other assumptions that the Company believes are reasonable under the circumstances. The results of these estimates, that are not readily apparent from other sources, form the basis for recognizing an uncertain tax position liability. Actual results could differ from those estimates upon subsequent resolution of identified matters.
83
Asset Retirement Obligations:
CNX accrues for dismantling and removing costs of gas-related facilities and related surface reclamation using the accounting treatment prescribed by the Asset Retirement and Environmental Obligations Topic of the FASB Accounting Standards Codification. This topic requires the fair value of an asset retirement obligation be recognized in the period in which it is incurred if a reasonable estimate of fair value can be made. Estimates are regularly reviewed by management and are revised for changes in future estimated costs and regulatory requirements. The present value of the estimated asset retirement costs is capitalized as part of the carrying amount of the long-lived asset. Amortization of the capitalized asset retirement cost is generally determined on a units-of-production basis. Accretion of the asset retirement obligation is recognized over time and generally will escalate over the life of the producing asset, typically as production declines. Accretion is included in Deprecation, Depletion and Amortization on the Consolidated Statements of Income.
Retirement Plan:
CNX has a non-contributory defined benefit retirement plan. The benefits for this plan are based primarily on years of service and employees' pay. This plan is accounted for using the guidance outlined in the Compensation - Retirement Benefits Topic of the FASB Accounting Standards Codification. The cost of these retiree benefits are recognized over the employees' service periods. CNX uses actuarial methods and assumptions in the valuation of defined benefit obligations and the determination of expense. Differences between actual and expected results or changes in the value of obligations and plan assets are recognized through Other Comprehensive Income.
Investment Plan:
CNX has an investment plan that is available to most employees. Throughout the years ended December 31, 2017 and 2016, the Company's matching contribution was 6% of eligible compensation contributed by eligible employees. In 2015, the Company contributed an additional 3% of eligible compensation into the 401(k) plan accounts for employees hired or rehired on or after October 1, 2014 or who were under age 40 or had less than 10 years of service with the Company as of September 30, 2014. This additional contribution was eliminated on January 1, 2016. The Company may also make discretionary contributions to the Plan ranging from 1% to 6% (1% to 4% prior to January 1, 2016) of eligible compensation for eligible employees (as defined by the Plan). Discretionary contributions made by the Company were $2,761 for the year ended December 31, 2016. There were no such discretionary contributions made by the Company for the years ended December 31, 2017 and 2015. Total payments and costs were $2,866, $5,858 and $6,329 for the years ended December 31, 2017, 2016 and 2015, respectively, including the discretionary contribution mentioned above.
Revenue Recognition:
Revenues are recognized when title passes to the customers. For natural gas, NGL and oil sales, this occurs at the contractual point of delivery. For land and research and development, revenue is recognized generally as the service is provided to the customer.
CNX sells natural gas to accommodate the delivery points of its customers. In general, this gas is purchased at market price and re-sold on the same day at market price less a small transaction fee. These matching buy/sell transactions include a legal right of offset of obligations and have been simultaneously entered into with the counterparty. These transactions qualify for netting under the Nonmonetary Transactions Topic of the FASB Accounting Standards Codification and are, therefore, recorded net within the Consolidated Statements of Income in the Purchased Gas Sales line.
CNX purchases natural gas produced by third-parties at market prices less a fee. The gas purchased from third-parties is then resold to end users or gas marketers at current market prices. These revenues and expenses are recorded gross as Purchased Gas Sales and Purchase Gas Costs, respectively, in the Consolidated Statements of Income. Purchased gas sales are recognized when title passes to the customer. Purchased gas costs are recognized when title passes to CNX from the third-party.
Contingencies:
From time to time, CNX, or its subsidiaries, are subject to various lawsuits and claims with respect to such matters as personal injury, wrongful death, damage to property, exposure to hazardous substances, governmental regulations (including environmental remediation), employment and contract disputes, and other claims and actions, arising out of the normal course of business. Liabilities are recorded when it is probable that obligations have been incurred and the amounts can be reasonably estimated. Estimates are developed through consultation with legal counsel involved in the defense of these matters and are based upon the nature of the lawsuit, progress of the case in court, view of legal counsel, prior experience in similar matters and management's intended response. Environmental liabilities are not discounted or reduced by possible recoveries from third-parties. Legal fees associated with defending these various lawsuits and claims are expensed when incurred.
84
Stock-Based Compensation:
Stock-based compensation expense for all stock-based compensation awards is based on the grant date fair value estimated in accordance with the provisions of the Stock Compensation Topic of the FASB Accounting Standards Codification. CNX recognizes these compensation costs on a straight-line basis over the requisite service period of the award, which is generally the award's vesting term. See Note 13–Stock-Based Compensation for more information.
Earnings per Share:
Basic earnings per share are computed by dividing net income attributable to CNX shareholders by the weighted average shares outstanding during the reporting period. Dilutive earnings per share are computed similarly to basic earnings per share, except that the weighted average shares outstanding are increased to include additional shares from stock options, performance stock options, restricted stock units and performance share units, if dilutive. The number of additional shares is calculated by assuming that outstanding stock options and performance share options were exercised, that outstanding restricted stock units and performance share units were released, and that the proceeds from such activities were used to acquire shares of common stock at the average market price during the reporting period.
The table below sets forth the share-based awards that have been excluded from the computation of the diluted earnings per share because their effect would be anti-dilutive:
For the Years Ended | ||||||||
December 31, | ||||||||
2017 | 2016 | 2015 | ||||||
Anti-Dilutive Options | 2,773,423 | 6,208,813 | 3,621,002 | |||||
Anti-Dilutive Restricted Stock Units | 18,598 | 663,003 | 1,375,659 | |||||
Anti-Dilutive Performance Share Units | — | 2,400,326 | 113,531 | |||||
Anti-Dilutive Performance Share Options | 927,268 | 802,804 | 802,804 | |||||
3,719,289 | 10,074,946 | 5,912,996 | ||||||
The computations for basic and dilutive earnings per share are as follows:
For the Years Ended | |||||||||||
December 31, | |||||||||||
2017 | 2016 | 2015 | |||||||||
Numerator: | |||||||||||
Income (Loss) from Continuing Operations | $ | 295,039 | $ | (550,945 | ) | $ | (650,198 | ) | |||
Income (Loss) from Discontinued Operations | 85,708 | (297,157 | ) | 275,313 | |||||||
Net Income (Loss) | $ | 380,747 | $ | (848,102 | ) | $ | (374,885 | ) | |||
Denominator: | |||||||||||
Weighted-average shares of common stock outstanding | 228,835,112 | 229,387,403 | 229,186,125 | ||||||||
Effect of dilutive shares | 2,116,700 | — | — | ||||||||
Weighted-average diluted shares of common stock outstanding | 230,951,812 | 229,387,403 | 229,186,125 | ||||||||
Earnings (Loss) Per Share: | |||||||||||
Basic (Continuing Operations) | $ | 1.29 | $ | (2.40 | ) | $ | (2.84 | ) | |||
Basic (Discontinued Operations) | 0.37 | (1.30 | ) | 1.20 | |||||||
Total Basic | $ | 1.66 | $ | (3.70 | ) | $ | (1.64 | ) | |||
Dilutive (Continuing Operations) | $ | 1.28 | $ | (2.40 | ) | $ | (2.84 | ) | |||
Dilutive (Discontinued Operations) | 0.37 | (1.30 | ) | 1.20 | |||||||
Total Dilutive | $ | 1.65 | $ | (3.70 | ) | $ | (1.64 | ) | |||
85
Shares of common stock outstanding were as follows:
2017 | 2016 | 2015 | ||||||
Balance, Beginning of Year | 229,443,008 | 229,054,236 | 230,265,463 | |||||
Issuance Related to Stock-Based Compensation (1) | 711,214 | 388,772 | 1,001,873 | |||||
Retirement of Common Stock (2) | (6,410,900 | ) | — | (2,213,100 | ) | |||
Balance, End of Year | 223,743,322 | 229,443,008 | 229,054,236 | |||||
(1) See Note 13 - Stock-Based Compensation for additional information.
(2) See Note 4 - Stock Repurchase for additional information.
Other Comprehensive Loss:
Changes in Accumulated Other Comprehensive Loss by component, net of tax, were as follows:
Balance at December 31, 2016 | $ | (392,556 | ) | ||
Other Comprehensive Loss before Reclassifications | (541 | ) | |||
Amounts Reclassified from Accumulated Other Comprehensive Loss | 12,769 | ||||
Distribution of CONSOL Energy, Inc. | 371,852 | ||||
Balance at December 31, 2017 | $ | (8,476 | ) | ||
The following table shows the reclassification of adjustments out of Accumulated Other Comprehensive Loss:
For the Years Ended December 31, | |||||||||||||||||
2017 | 2016 | 2015 | |||||||||||||||
Derivative Instruments (Note 17) | |||||||||||||||||
Natural Gas Price Swaps and Options | $ | — | $ | (68,481 | ) | $ | (123,105 | ) | |||||||||
Tax Expense | — | 25,011 | 45,054 | ||||||||||||||
Net of Tax | $ | — | $ | (43,470 | ) | $ | (78,051 | ) | |||||||||
Actuarially Determined Long-Term Liability Adjustments* (Note 12) | |||||||||||||||||
Amortization of Prior Service Costs | $ | (2,775 | ) | $ | (590 | ) | $ | (336,993 | ) | ||||||||
Recognized Net Actuarial Loss | 23,043 | 23,857 | 119,222 | ||||||||||||||
Curtailment Loss | — | — | 5 | ||||||||||||||
Settlement Loss | — | 22,196 | 19,053 | ||||||||||||||
Total | 20,268 | 45,463 | (198,713 | ) | |||||||||||||
Tax (Benefit) Expense | (7,499 | ) | (16,959 | ) | 74,687 | ||||||||||||
Net of Tax | $ | 12,769 | $ | 28,504 | $ | (124,026 | ) | ||||||||||
*Excludes amounts related to the remeasurement of the Actuarially Determined Long-Term Liabilities for the years ended December 31, 2016 and December 31, 2015. The table above only shows the reclassifications out of Accumulated Other Comprehensive Loss that relate to continuing operations.
Accounting for Derivative Instruments:
CNX enters into financial derivative instruments to manage its exposure to commodity price volatility. The derivatives are accounted for as an asset or a liability in the accompanying Consolidated Balance Sheets at their fair value using Level 2 inputs, which is further defined in Note 16 - Fair Value of Financial Instruments. Changes in the fair values of derivatives are recorded in earnings unless special hedge accounting criteria are met.
CNX de-designated all of its cash flow hedges on December 31, 2014 and accounts for all existing and future natural gas and NGL commodity hedges on a mark-to-market basis, and records changes in fair value in current period earnings. In connection with this de-designation, CNX froze the balances recorded in Accumulated Other Comprehensive Income at December 31, 2014
86
and reclassified balances to earnings as the underlying physical transactions occurred. As of December 31, 2016, all gains that had been previously deferred in OCI were recognized in earnings.
All of the Company's derivative instruments are subject to master netting arrangements with its counterparties, none of which currently require CNX to post collateral for any of its hedges. However, as stated in the counterparty master agreements, if the Company's obligations with one of its counterparties cease to be secured on the same basis as similar obligations with the other lenders under the credit facility, CNX would be required to post collateral for hedges that are in a liability position in excess of defined thresholds. Each of the Company's counterparty master agreements allows, in the event of default, the ability to elect early termination of outstanding contracts. If early termination is elected, CNX and the applicable counterparty would net settle all open hedge positions.
CNX is exposed to credit risk in the event of non-performance by counterparties, whose creditworthiness is subject to continuing review. Historically, CNX has not experienced any issues of non-performance by derivative counterparties.
Recent Accounting Pronouncements:
In May 2017, the FASB issued Update 2017-09 - Compensation - Stock Compensation (Topic 718): Scope of Modification Accounting, which reduces diversity in practice and cost and complexity when applying the guidance in this Topic to a change to the terms or conditions of a share-based payment award. The amendments in this Update provide guidance about which changes to the terms or conditions of a share-based payment award require an entity to apply modification accounting in Topic 718. The amendments in the Update are effective for fiscal years beginning after December 15, 2017, including interim periods within those fiscal years, and should be applied prospectively to an award modification on or after the adoption date. Early adoption is permitted. The adoption of this guidance is not expected to have a material impact on the Company's financial statements.
In March 2017, the FASB issued Update 2017-07 - Compensation - Retirement Benefits (Topic 715): Improving the Presentation of Net Periodic Pension Cost and Net Periodic Postretirement Benefit Cost, which improves the presentation of net periodic pension cost and net periodic postretirement benefit cost. The amendments in the Update require that an employer report the service cost component in the same line item as other compensation costs arising from services rendered by the pertinent employees during the period. The other components of net benefit cost are required to be presented separately from the service cost component and outside a subtotal of income from operations, if one is presented. Because CNX does not present an income from operations subtotal, that requirement is not applicable. Additionally, the Company's service cost component is deemed immaterial, and therefore, the other components of net benefit cost will not be presented separately. For public entities, the amendments in the Update are effective for fiscal years beginning after December 15, 2017, including interim periods within those fiscal years. Early adoption is permitted as of the beginning of a fiscal year for which financial statements have not been issued. The adoption of this guidance is not expected to have an impact on the Company's financial statements.
In August 2016, the FASB issued Update 2016-15 - Statement of Cash Flows (Topic 230): Classification of Certain Cash Receipts and Cash Payments, which addresses eight specific cash flow issues with the objective of reducing the existing diversity in practice. The amendments relate to debt prepayment or debt extinguishment costs, settlement of zero-coupon debt instruments or other debt instruments with coupon interest rates that are insignificant in relation to the effective interest rate of the borrowing, contingent consideration payments made after a business combination, proceeds from the settlement of insurance claims, proceeds from the settlement of corporate-owned life insurance policies, distributions received from equity method investees, and beneficial interests in securitization transactions. The Update also states that, in the absence of specific guidance for cash receipts and payments that have aspects of more than one class of cash flows, an entity should classify each separately identifiable source or use within the cash receipts and payments on the basis of their nature in financing, investing, or operating activities. In situations in which cash receipts or payments cannot be separated by source or use, the appropriate classification should depend on the activity that is likely to be the predominant source or use of cash flows for the item. The amendments in the Update will be applied using a retrospective transition method to each period presented and, for public entities, are effective for fiscal years beginning after December 15, 2017 and interim periods within those fiscal years.The adoption of this guidance is not expected to have an impact on the Company's financial statements.
In May 2014, the FASB issued Update 2014-09, Revenue from Contracts with Customers. The standard requires an entity to recognize revenue in a manner that depicts the transfer of goods or services to customers at an amount that reflects the consideration to which the entity expects to be entitled in exchange for those goods or services. In August 2015, the FASB issued ASU No. 2015-14 Revenue from Contracts with Customers - Deferral of the Effective Date which approved a one year deferral of ASU No. 2014-09 for annual reporting periods beginning after December 15, 2017. During the fourth quarter of 2017, the Company substantially completed its detailed review of the impact of the standard on each of its contracts. The Company adopted the ASUs using the modified retrospective method of adoption on January 1, 2018 and did not require an adjustment to the opening balance of equity. The Company does not expect the standard to have a significant impact on its results of operations, liquidity or
87
financial position in 2018. The Company implemented processes to ensure new contracts are reviewed for the appropriate accounting treatment and generate the disclosures required under the new standard. Additional disclosures will be required to describe the nature, amount, timing and uncertainty of revenue and cash flows from contracts with customers including disaggregation of revenue and remaining performance obligations, beginning with our Form 10-Q for the three months ended March 31, 2018.
In February 2016, the FASB issued Update 2016-02 - Leases (Topic 842), which increases transparency and comparability among organizations by recognizing lease assets and lease liabilities on the balance sheet and disclosing key information about leasing arrangements. Update 2016-02 does retain a distinction between finance leases and operating leases, which is substantially similar to the classification criteria for distinguishing between capital leases and operating leases in the previous lease guidance. Retaining this distinction allows the recognition, measurement and presentation of expenses and cash flows arising from a lease to not significantly change from previous GAAP. For leases with a term of 12 months or less, a lessee is permitted to make an accounting policy election by class of underlying asset not to recognize lease assets and lease liabilities, but to recognize lease expense on a straight-line basis over the lease term. For both financing and operating leases, the right-to-use asset and lease liability will be initially measured at the present value of the lease payments in the statement of financial position.The accounting applied by a lessor is largely unchanged from that applied under previous GAAP. For public business entities, the amendments in this Update are effective for fiscal years beginning after December 15, 2018, including interim periods within those fiscal years. Early application is permitted. In transition, lessees and lessors are required to recognize and measure leases at the beginning of the earliest period presented using a modified retrospective approach. CNX is currently reviewing all existing leases and agreements that are covered by this standard and is evaluating the impact on the financial statements and related disclosures.
Reclassifications:
Certain amounts in prior periods have been reclassified to conform with the report classifications of the year ended December 31, 2017, with no effect on previously reported net income or stockholder's equity.
Subsequent Events:
The Company has evaluated all subsequent events through the date the financial statements were issued. No material recognized or non-recognizable subsequent events were identified other than those disclosed in Note 21 - Subsequent Event.
NOTE 2—DISCONTINUED OPERATIONS:
On November 28, 2017, CNX announced that it had completed the tax-free spin-off of its coal business resulting in two independent, publicly traded companies, a coal company, CONSOL Energy, formerly known as CONSOL Mining Corporation and CNX, a natural gas exploration and production company. Following the Separation, CONSOL Energy and its subsidiaries hold the coal assets previously held by CNX, including its Pennsylvania Mining Complex, Baltimore Marine Terminal, its direct and indirect ownership interest in CONSOL Coal Resources LP, formerly known as CNXC Coal Resources LP and other related coal assets previously held by CNX. As of the close of business on November 15, 2017, CNX's shareholders received one share of CONSOL Energy common stock for every eight shares of CNX’s common stock held as of the Record Date. The coal company has been reclassified to discontinued operations for all periods presented.
In August 2016, CNX completed the sale of the Miller Creek and Fola Mining Complexes. In the transaction, the buyer acquired the Miller Creek and Fola assets and assumed the Miller Creek and Fola mine closing and reclamation liabilities. In order to equalize the value exchange, CNX paid $28,271 of cash at closing, which included property taxes associated with the properties sold and other closing costs (a portion of which will be held in escrow for purposes of obtaining the surety bonds required for the permits to transfer). This amount was included in Net Cash Provided by Discontinued Investing Activities on the Consolidated Statements of Cash Flows for the year ended December 31, 2016. CNX will also pay a total of $13,700 in remaining installments over the next three years, ending in January 2020. The net loss on the sale of $53,130, excluding the related impairment charge discussed below, was included in Loss from Discontinued Operations, net on the Consolidated Statements of Income. Prior to the closing, the Miller Creek and Fola Mining Complexes were classified as held for sale in discontinued operations and in accordance with the accounting guidance for Property, Plant and Equipment, assets held for sale are required to be measured at the lower of carrying value or fair value less costs to sell. Upon meeting the assets held for sale criteria, the Company determined the carrying value of the Miller Creek and Fola Mining Complexes exceeded the fair value less costs to sell. As a result, an impairment charge of $355,681 was recorded during the year ended December 31, 2016. This impairment was included in Loss from Discontinued Operations, net on the Consolidated Statements of Income.
In March 2016, CNX completed the sale of its membership interests in CONSOL Buchanan Mining Company, LLC (BMC), which owned and operated the Buchanan Mine located in Mavisdale, Virginia; various assets relating to the Amonate Mining
88
Complex located in Amonate, Virginia; Russell County, Virginia coal reserves and Pangburn Shaner Fallowfield coal reserves located in Southwestern, Pennsylvania to Coronado IV LLC ("Coronado"). Various CNX assets were excluded from the sale including coalbed methane, natural gas and minerals other than coal, current assets of BMC, certain coal seams and certain surface rights and properties. Coronado assumed only specified liabilities and various CNX liabilities were excluded and not assumed. The excluded liabilities included BMC’s indebtedness, trade payables and liabilities arising prior to closing, as well as the liabilities of the subsidiaries other than BMC which were parties to the sale. In addition, the buyer agreed to pay CNX for Buchanan Mine coal sold outside the U.S. and Canada during the five years following closing a royalty of 20% of any excess of the gross sales price per ton over the following amounts: (1) year one, $75.00 per ton; (2) year two, $78.75 per ton; (3) year three, $82.69 per ton; (4) year four, $86.82 per ton; (5) year five, $91.16 per ton. Total royalty income recognized under this agreement was $10,073 and $9,575 for the years ended December 31, 2017 and 2016, respectively. In connection with the separation and distribution agreement with CONSOL Energy (See Note 20 - Related Party) the royalty related to Buchanan Mine was retained by CNX and any related income is included in Other Expense on the Consolidated Statements of Income. Cash proceeds of $402,799 were received at closing and are included in Net Cash Provided by Discontinued Investing Activities on the Consolidated Statements of Cash Flows for the year ended December 31, 2016. The net loss on the sale was $38,364 and was included in Loss from Discontinued Operations, net on the Consolidated Statements of Income for the year ended December 31, 2016.
For all periods presented in the accompanying Consolidated Statements of Income, BMC along with the various other assets and the Miller Creek and Fola Mining Complexes are classified as discontinued operations.
The following table details selected financial information for the divested business included within discontinued operations:
For the Years Ended December 31, | |||||||||||
2017 | 2016 | 2015 | |||||||||
Coal Sales | $ | 1,127,907 | $ | 1,199,950 | $ | 1,687,237 | |||||
Freight-Outside Coal | 66,297 | 47,790 | 25,597 | ||||||||
Miscellaneous Other Income | 73,645 | 74,382 | 67,969 | ||||||||
Gain on Sale of Assets | — | 269,124 | 13,362 | ||||||||
Total Revenue and Other Income | $ | 1,267,849 | $ | 1,591,246 | $ | 1,794,165 | |||||
Total Costs | 1,147,254 | 1,652,921 | 1,362,508 | ||||||||
Income (Loss) From Operations Before Income Taxes | $ | 120,595 | $ | (61,675 | ) | $ | 431,657 | ||||
Impairment on Assets Held for Sale | — | 355,681 | — | ||||||||
Income Tax Expense (Benefit) | 23,984 | (129,153 | ) | 145,934 | |||||||
Less: Net Income Attributable to Noncontrolling interest | 10,903 | 8,954 | 10,410 | ||||||||
Income (Loss) From Discontinued Operations, net | $ | 85,708 | $ | (297,157 | ) | $ | 275,313 | ||||
89
The major classes of assets and liabilities of discontinued operations:
December 31, 2016 | |||
Assets: | |||
Cash and Cash Equivalents | $ | 14,176 | |
Accounts Receivable - Trade | 95,790 | ||
Other Receivables | 18,756 | ||
Inventories | 50,160 | ||
Prepaid Expense | 17,571 | ||
Other Current Assets | 2,370 | ||
Total Current Assets | $ | 198,823 | |
Property, Plant and Equipment, Net | 2,171,464 | ||
Other Assets | 126,634 | ||
Total Assets of Discontinued Operations | $ | 2,496,921 | |
Liabilities: | |||
Accounts Payable | $ | 84,550 | |
Other Current Liabilities | 300,797 | ||
Total Current Liabilities | $ | 385,347 | |
Long Term Debt | 313,639 | ||
Postretirement Benefits Other Than Pensions | 659,474 | ||
Pneumoconiosis Benefits | 108,073 | ||
Mine Closing | 218,631 | ||
Gas Well Closing | 27,648 | ||
Workers' Compensation | 65,932 | ||
Salary Retirement | 79,997 | ||
Other liabilities | (94,440 | ) | |
Total Liabilities of Discontinued Operations | $ | 1,764,301 | |
NOTE 3—ACQUISITIONS AND DISPOSITIONS:
In September 2017, CNX closed on the sale of approximately 22,000 acres of surface land in Colorado. CNX received net cash proceeds of $23,703 which is included in the cash flows from investing activities. The net gain on the sale was $18,758 and was included in the Gain on Sale of Assets in the Consolidated Statements of Income.
In a two part closing in July and September 2017, CNX executed the sale of approximately 7,500 net undeveloped acres of the Marcellus Shale in Allegheny and Westmoreland counties, Pennsylvania. CNX received total cash proceeds of $36,649 which is included in the cash flows from investing activities. The net gain on the sale of these assets was $15,251 and was included in the Gain on Sale of Assets in the Consolidated Statements of Income.
In June 2017, CNX closed on the sale of approximately 11,100 net undeveloped acres of the Marcellus and Utica Shale in Allegheny, Washington, and Westmoreland counties, Pennsylvania. CNX received total cash proceeds of $83,500 which is included in cash flows from investing activities. The net gain on the sale of these assets was $58,541 and was included in the Gain on Sale of Assets in the Consolidated Statements of Income.
In June 2017, the Company finalized the sale of 12 producing wells, 15 drilled but uncompleted wells (DUCs), and approximately 11,000 net developed and undeveloped Marcellus and Utica acres in Doddridge and Wetzel counties in West Virginia that were previously classified as held for sale. CNX received total cash proceeds of $125,507 which is included in cash flows from investing activities, as well as undeveloped acreage. The net loss on the sale was $9,430 and was included in the Gain on Sale of Assets in the Consolidated Statements of Income.
In May 2017, CNX finalized the sale of approximately 6,300 net undeveloped acres of the Utica-Point Pleasant Shale in Jefferson, Belmont and Guernsey counties, Ohio that were previously classified as held for sale. CNX received total cash proceeds of $76,585 which is included in cash flows from investing activities. The net gain on the sale of these assets was $72,346 and was included in the Gain on Sale of Assets in the Consolidated Statements of Income.
90
In April 2017, CNX finalized the sale of its Knox Energy LLC and Coalfield Pipeline Company subsidiaries that were previously classified as held for sale. At closing, CNX received net cash proceeds of $19,055 which is included in cash flows from investing activities. The net gain on the sale of these assets was $606 and was included in the Gain on Sale of Assets in the Consolidated Statements of Income. In February 2017, Knox met all of the criteria to be classified as held for sale. As part of the required evaluation under the held for sale guidance, during the first quarter, Knox’s book value was evaluated and it was determined that the approximate fair value less costs to sell Knox was less than the carrying value of the net assets to be sold. The resulting impairment of $137,865 was included in Impairment of Exploration and Production Properties within the the Consolidated Statements of Income during the year ended December 31, 2017.
In September 2015, CNX sold its 49% interest in Western Allegheny Energy (WAE), a joint venture with Rosebud Mining Company engaged in coal mining activities in Pennsylvania. At closing, the Company received $76,297 in cash and a $2,136 reduction in certain liabilities. During the third quarter of 2015, CNX also received a cash distribution of $10,780 from WAE. The net gain on the sale was $48,468 and was included in the Gain on Sale of Assets in the Consolidated Statements of Income.
NOTE 4— STOCK REPURCHASE:
In September 2017, CNX's Board of Directors approved a one-year stock repurchase program of up to $200,000 that terminated on November 1, 2017. On October 30, 2017, the Board approved an increase to the aggregate amount of the repurchase plan to $450,000. The repurchases may be effected from time-to-time through open market purchases, privately negotiated transactions, Rule 10b5-1 plans, accelerated stock repurchases, block trades, derivative contracts or otherwise in compliance with Rule 10b-18. The timing of any repurchases will be based on a number of factors, including available liquidity, the Company's stock price, the Company's financial outlook, and alternative investment options. The share repurchase program does not obligate the Company to repurchase any dollar amount or number of shares and the Board may modify, suspend, or discontinue its authorization of the program at any time. The Board of Directors will continue to evaluate the size of the stock repurchase program based on CNX's free cash flow position, leverage ratio, and capital plans. During the year ended December 31, 2017, 6,410,900 shares were repurchased and retired at an average price of $16.08 per share for a total cost of $103,209.
NOTE 5—INCOME TAXES:
Income tax benefit provided on earnings from continuing operations consisted of:
For The Years Ended December 31, | |||||||||||
2017 | 2016 | 2015 | |||||||||
Current: | |||||||||||
U.S. Federal | $ | (31,791 | ) | $ | (101,596 | ) | $ | 839 | |||
U.S. State | (1,838 | ) | (8,699 | ) | (5,657 | ) | |||||
(33,629 | ) | (110,295 | ) | (4,818 | ) | ||||||
Deferred: | |||||||||||
U.S. Federal | (166,112 | ) | 80,207 | (308,797 | ) | ||||||
U.S. State | 23,283 | (4,315 | ) | 33,256 | |||||||
(142,829 | ) | 75,892 | (275,541 | ) | |||||||
Total Income Tax Benefit | $ | (176,458 | ) | $ | (34,403 | ) | $ | (280,359 | ) | ||
The components of the net deferred taxes are as follows:
91
December 31, | |||||||
2017 | 2016 | ||||||
Deferred Tax Assets: | |||||||
Alternative minimum tax | 188,080 | 219,872 | |||||
Net operating loss - State | 107,756 | 74,310 | |||||
Net operating loss - Federal | 99,524 | 144,450 | |||||
Foreign tax credit | 44,402 | 39,850 | |||||
Gas well closing | 16,648 | 20,512 | |||||
Salary retirement | 9,404 | 16,928 | |||||
Capital lease | 2,020 | 3,210 | |||||
Gas derivatives | — | 72,105 | |||||
Other | 33,697 | 48,961 | |||||
Total Deferred Tax Assets | 501,531 | 640,198 | |||||
Valuation Allowance | (136,576 | ) | (282,778 | ) | |||
Net Deferred Tax Assets | 364,955 | 357,420 | |||||
Deferred Tax Liabilities: | |||||||
Property, plant and equipment | (385,366 | ) | (450,695 | ) | |||
Gas derivatives | (15,248 | ) | — | ||||
Advance gas royalties | (3,648 | ) | (5,824 | ) | |||
Equity Partnerships | (1,251 | ) | (2,237 | ) | |||
Other | (3,815 | ) | (3,760 | ) | |||
Total Deferred Tax Liabilities | (409,328 | ) | (462,516 | ) | |||
Net Deferred Tax Liability | $ | (44,373 | ) | $ | (105,096 | ) | |
Deferred taxes are recorded for certain tax benefits, including net operating losses and tax credit carry-forwards, provided that management assesses the utilization of those assets to be more likely than not. A valuation allowance is required when it is more likely than not that all or a portion of a deferred tax asset will not be realized. All available evidence, both positive and negative, must be considered in determining the need for a valuation allowance. For the years ended December 31, 2017 and 2016, positive evidence considered included financial earnings generated over the past three years for certain subsidiaries, reversals of financial to tax temporary differences and the implementation of and/or ability to employ various tax planning strategies. Negative evidence included financial and tax losses generated in prior periods, the inability to achieve forecasted results for those periods and the impact of expected future financial results from normal operations on the utilization of tax credits. CNX continues to report, on an after federal tax basis, a deferred tax asset related to state operating losses of $107,756 with a related valuation allowance of $61,560 at December 31, 2017. The deferred tax asset related to state operating losses, on an after tax adjusted basis, was $74,310 with a related valuation allowance of $60,488 at December 31, 2016. A review of positive and negative evidence regarding these state tax benefits concluded that the valuation allowances for various CNX subsidiaries was warranted. These net operating losses expire at various times between 2018 and 2037. A valuation allowance on foreign tax credits of $44,402 and $39,850 has also been recorded at December 31, 2017 and 2016, respectively. The foreign tax credits expire at various times between 2021 and 2023. A valuation allowance on deferred equity compensation for covered individuals as provided by Section 162(m) of $5,957 was recorded for 2017. No such valuation allowance was recorded for 2016. A valuation allowance on charitable contribution carry-forwards of $3,156 and $5,051 has been recorded for 2017 and 2016, respectively. The Company's charitable contributions carry-forwards expire at various times between 2018 and 2022.
As of December 31, 2017, the Company has a deferred tax asset related to federal net operating losses of $99,524, which expire at various times between 2034 and 2037. In connection with the restructuring and separation of the Company's coal business in November 2017, certain net operating loss carry-forwards were required to be written off under the Tax Cuts and Jobs Act (the "Act") passed on December 22, 2017. As a result, the Company has written off the deferred tax assets associated with these net operating losses, a reduction of $24,942 to the total deferred tax asset for net operating losses.
The deferred tax assets attributable to the state tax effect of future deductible temporary differences for certain CNX subsidiaries with histories of financial and tax losses were also reviewed for positive and negative evidence regarding the realization of the associated deferred tax assets. A valuation allowance of $9,088 and $10,591 on an after federal tax adjusted basis has also been recorded for 2017 and 2016, respectively.
92
As of December 31, 2017, the Company has a deferred tax asset relating to federal alternative minimum tax credits of $188,080, a decrease of $31,792 from the prior year that resulted from the monetization of alternative minimum tax credits on the Company's 2016 Federal income tax return as well as estimated monetization anticipated for 2017. During 2017, the valuation allowance relating to federal alternative minimum tax credits decreased by $154,384 to $12,413 at December 31, 2017. Under the Act, passed on December 22, 2017, the corporate alternative minimum tax was repealed. The Act also provided that existing alternative minimum tax credits are refundable beginning in 2018. As a result, it is now more likely than not that the benefit of CNX's alternative minimum tax credits will be realized. Accordingly, the previously recorded valuation allowance has been released. It should be noted that the Company does have a valuation allowance of $12,413 at December 31, 2017 reflecting the anticipated government sequestration of a portion of monetized alternative minimum tax credits. This amount represents 6.6% of the Company's total alternative minimum tax credits.
Management will continue to assess the potential for realized deferred tax assets based upon income forecast data and the feasibility of future tax planning strategies and may record adjustments to valuation allowances against deferred tax assets in future periods, as appropriate, that could materially impact net income.
The following is a reconciliation, stated as a percentage of pretax income, of the United States statutory federal income tax rate to CNX's effective tax rate:
For the Years Ended December 31, | ||||||||||||||||||||
2017 | 2016 | 2015 | ||||||||||||||||||
Amount | Percent | Amount | Percent | Amount | Percent | |||||||||||||||
Statutory U.S. federal income tax rate | $ | 41,503 | 35.0 | % | $ | (204,872 | ) | 35.0 | % | $ | (325,695 | ) | 35.0 | % | ||||||
Uncertain tax positions | 27,359 | 23.1 | 1,351 | (0.2 | ) | — | — | |||||||||||||
Effect of spin on Federal NOL's | 24,942 | 21.0 | — | — | — | — | ||||||||||||||
Accrual to tax return reconciliation | (1,147 | ) | (1.0 | ) | (4,564 | ) | 0.8 | (6,312 | ) | 0.7 | ||||||||||
IRS and state tax examination settlements | — | — | (13,463 | ) | 2.3 | (36 | ) | — | ||||||||||||
Net effect of state income taxes | 15,538 | 13.1 | (20,954 | ) | 3.6 | (15,400 | ) | 1.7 | ||||||||||||
Effect of change in state valuation allowance | (430 | ) | (0.4 | ) | 18,999 | (3.2 | ) | 39,492 | (4.2 | ) | ||||||||||
Effect of change in federal valuation allowance | (145,772 | ) | (122.9 | ) | 184,227 | (31.5 | ) | 25,903 | (2.8 | ) | ||||||||||
Other deferred adjustments | 7,616 | 6.4 | — | — | — | — | ||||||||||||||
Effect of federal rate reduction | (131,784 | ) | (111.1 | ) | — | — | — | — | ||||||||||||
Effect of federal tax credits | (19,081 | ) | (16.1 | ) | — | — | — | — | ||||||||||||
Other | 4,798 | 4.0 | 4,873 | (0.8 | ) | 1,689 | (0.2 | ) | ||||||||||||
Income Tax Benefit / Effective Rate | $ | (176,458 | ) | (148.9 | )% | $ | (34,403 | ) | 6.0 | % | $ | (280,359 | ) | 30.2 | % | |||||
On December 22, 2017, the United States enacted the Tax Cuts and Jobs Act which made significant changes that affect CNX. CNX believes that those changes will positively impact its future after-tax earnings, primarily due to the lower U.S. Federal tax rate and the repeal of the corporate alternative minimum tax. Beginning January 1, 2018, CNX will be taxed at a 21% federal corporate tax rate. The Company has reflected the impact of this rate on its deferred tax assets and liabilities at December 31, 2017, as it is required to reflect the change in the period in which the law is enacted. The impact of this change was a net benefit of $115,291 in the income tax provision for the period ended December 31, 2017.
The Act also repealed the corporate alternative minimum tax for tax years beginning after January 1, 2018 and provided that prior alternative minimum tax credits would be refundable. As discussed above, CNX has credits that are expected to be refunded between 2018 and 2021 as a result of the Act and monetization opportunities under current law in 2017. The Company's effective tax rate reflects the release of previously recorded valuation allowances against alternative minimum tax credit carry-forwards of $154,385, including other immaterial changes to valuation, as those credits will now be able to be monetized, net of anticipated sequestration, under the Act.
The Act is a comprehensive tax reform bill containing a number of other provisions that either currently or in the future could impact CNX. The effect of certain limitations effective for the tax year 2018 and forward, specifically related to the deductibility of executive compensation, have been evaluated.
The net benefits for the Act as recorded as provisional amounts as of December 31, 2017, represent the Company's best estimate using information available to the Company as of February 7, 2018. The Company anticipates U.S. regulatory agencies
93
will issue further regulations over the next year which may alter this estimate. The Company is still evaluating, among other things, the application of limitations for executive compensation related to contracts existing prior to November 2, 2017, and provisions in the Act addressing the deductibility of interest expense after January 1, 2018. The Company will refine its estimates to incorporate new or better information as it comes available through the filing date of its 2017 U.S. income tax returns in the fourth quarter of 2018.
A reconciliation of the beginning and ending gross amounts of unrecognized tax benefits is as follows:
For the Years Ended | |||||||
December 31, | |||||||
2017 | 2016 | ||||||
Balance at beginning of period | $ | 9,103 | $ | 12,702 | |||
Increase in unrecognized tax benefits resulting from tax positions taken during current period | 21,902 | 666 | |||||
Increase in unrecognized tax benefits resulting from tax positions taken during prior periods | 7,474 | — | |||||
Reduction in unrecognized tax benefits as a result of the lapse of the applicable statute of limitations | (666 | ) | — | ||||
Reduction of unrecognized tax benefits as a result of a settlement with taxing authorities | — | (4,265 | ) | ||||
Balance at end of period | $ | 37,813 | $ | 9,103 | |||
If these unrecognized tax benefits were recognized, $29,376 and $666 would affect CNX's effective income tax rate for 2017 and 2016, respectively.
CNX and its subsidiaries file income tax returns in the United States and returns within various states and Canadian jurisdictions. With few exceptions, the Company is no longer subject to United States federal, state, local or non-U.S. income tax examinations by tax authorities for the years before 2016.
In 2017, CNX recognized an increase in unrecognized tax benefits of $28,710 for tax benefits resulting from a tax position taken on our federal tax return for the Marginal Well Credit and Consideration of Interest on Depletion in 2016 and plan to take on our 2017 return.
CNX recognizes interest accrued related to unrecognized tax benefits in its interest expense. As of December 31, 2017 and 2016, the Company had an accrued liability of $644 and $306, respectively, for interest related to uncertain tax positions. Interest expense of $337 and $253 was recorded in the Company's Consolidated Statements of Income for the years ended December 31, 2017 and 2016, respectively. During the years ended December 31, 2017 and 2016, CNX paid no interest related to income tax deficiencies.
CNX recognizes penalties accrued related to uncertain tax positions in its income tax expense. As of December 31, 2017 and 2016, CNX had no accrued liabilities for tax penalties.
NOTE 6—ASSET RETIREMENT OBLIGATIONS:
The reconciliation of changes in the asset retirement obligations at December 31, 2017 and 2016 is as follows:
As of December 31, | ||||||||
2017 | 2016 | |||||||
Balance at beginning of period | $ | 201,006 | $ | 145,778 | ||||
Accretion expense | 5,760 | 3,755 | ||||||
Payments | (6,875 | ) | (4,241 | ) | ||||
Revisions in estimated cash flows | 5,356 | 56,398 | ||||||
Other | (1,177 | ) | (684 | ) | ||||
Balance at end of period | $ | 204,070 | $ | 201,006 | ||||
94
NOTE 7—PROPERTY, PLANT AND EQUIPMENT:
December 31, | |||||||
Property, Plant and Equipment | 2017 | 2016 | |||||
Intangible drilling cost | $ | 3,849,689 | $ | 3,583,599 | |||
Proved gas properties | 1,999,891 | 2,016,916 | |||||
Gas gathering equipment | 1,182,234 | 1,138,299 | |||||
Unproved gas properties | 919,733 | 1,116,282 | |||||
Gas wells and related equipment | 834,120 | 800,617 | |||||
Surface land and other equipment | 309,602 | 323,908 | |||||
Other gas assets | 221,226 | 204,338 | |||||
Total Property, Plant and Equipment | $ | 9,316,495 | $ | 9,183,959 | |||
Less: Accumulated Depreciation, Depletion and Amortization | 3,526,742 | 3,214,984 | |||||
Total Property, Plant and Equipment - Net | $ | 5,789,753 | $ | 5,968,975 | |||
The following assets would be amortized using the units-of-production method. Amounts reflect properties where drilling operations have not yet commenced and therefore, are not being amortized for the years ended December 31, 2017 and 2016, respectively.
December 31, | |||||||
2017 | 2016 | ||||||
Unproved gas properties | $ | 919,733 | $ | 1,116,282 | |||
Gas Advance Royalties | 13,220 | 13,762 | |||||
Total | $ | 932,953 | $ | 1,130,044 | |||
As of December 31, 2017 and 2016, plant and equipment includes gross assets under capital lease of $73,688 and $73,892, respectively. Included in Gas gathering equipment is a capital lease for the Jewell Ridge Pipeline of $66,919 at December 31, 2017 and 2016. CNX also maintains a capital lease for vehicles of $6,769 and $6,973 at December 31, 2017 and 2016, respectively, which is included in Other gas assets. Accumulated amortization for capital leases was $54,431 and $48,814 at December 31, 2017 and 2016, respectively. Amortization expense for capital leases is included in Depreciation, Depletion and Amortization in the Consolidated Statements of Income. See Note 11–Leases for further discussion of capital leases.
Industry Participation Agreements
CNX had two significant industry participation agreements (referred to as "joint ventures" or "JVs") that provided drilling and completion carries for the Company's retained interests.
CNX is party to a joint development agreement with Hess Ohio Developments, LLC (Hess) with respect to approximately 125 thousand net Utica Shale acres in Ohio in which each party has a 50% undivided interest. Under the agreement, as amended, Hess was obligated to pay a total of approximately $335,000 in the form of a 50% drilling carry of certain CNX working interest obligations as the acreage is developed. As of December 31, 2016, Hess' entire carry obligation has been met.
CNX was party to a joint development agreement with Noble Energy, Inc. (Noble) with respect to approximately 700 thousand net Marcellus Shale oil and gas acres in West Virginia and Pennsylvania, in which each party owned a 50% undivided interest. In October 2016, CNX entered into an Exchange Agreement with Noble Energy, which terminated the joint development agreement related to the jointly owned gas assets held in connection with the joint venture with Noble and divided such jointly owned gas assets among CNX and Noble Energy. The transactions contemplated by the Exchange Agreement were closed on December 1, 2016 with an effective date of October 1, 2016. As part of the exchange: each party now owns and operates a 100% interest in properties and wells in two separate operating areas; each party has independent control and flexibility with respect to the scope and timing of future development over its operating area; and all acreage operated by CNX and Noble Energy, Inc. in their respective operating areas will remain fully dedicated to CNX Midstream Partners LP (see Note 20 - Related Party). The exchange was accounted for as a mineral conveyance, thus no gain or loss was recorded in connection with the transaction. In June 2017, Noble Energy announced that it has closed on a transaction divesting its upstream assets in northern West Virginia and southern Pennsylvania to HG Energy II Appalachia, LLC, a portfolio company of Quantum Energy Partners.
95
NOTE 8—SHORT-TERM NOTES PAYABLE:
CNX's senior secured credit agreement expires on June 18, 2019. In November 2017, the facility was amended to allow for the spin-off of the Company's coal business (See Note 2 - Discontinued Operations). At that time, the lenders' commitments to the facility were reduced from $2,000,000 to $1,500,000, and the borrowing base remained unchanged at $2,000,000, including a $650,000 letters of credit aggregate sub-limit. CNX can also request an additional $500,000 increase in the aggregate borrowing limit amount.
The facility is secured by substantially all of the assets of CNX Resources Corporation and certain of its subsidiaries. Fees and interest rate spreads are based on the percentage of facility utilization, measured quarterly. Availability under the facility is limited to a borrowing base, which is determined by the lenders syndication agent and approved by the required number of lenders in good faith by calculating a value of CNX's proved natural gas reserves.
The facility contains a number of affirmative and negative covenants that limit the Company's ability to dispose of assets, make investments, purchase or redeem CNX common stock, pay dividends, merge with another corporation and amend, modify or restate the senior unsecured notes. The April 2016 facility amendment requires that the Company must: (i) prepay outstanding loans under the revolving credit facility to the extent that cash on hand exceeds $150,000 for two consecutive business days; (ii) mortgage 85% of its proved reserves and 80% of its proved developed producing reserves, in each case, which are included in the borrowing base; (iii) maintain applicable deposit, securities and commodities accounts with the lenders or affiliates thereof; and (iv) enter into control agreements with respect to such applicable accounts. In addition, the Company pledged the equity interest it holds in CNX Gathering, LLC and CNX Midstream Partners, LP as collateral to secure loans under the credit agreement. Further, the credit facility allows unlimited investments in joint ventures for the development and operation of natural gas gathering systems.
The facility also requires that CNX maintains a minimum interest coverage ratio of no less than 2.50 to 1.00, which is calculated as the ratio of Adjusted EBITDA to cash interest expense of CNX and certain of its subsidiaries, measured quarterly. CNX must also maintain a minimum current ratio of no less than 1.00 to 1.00, which is calculated as the ratio of current assets, plus revolver availability, to current liabilities, excluding borrowings under the revolver, measured quarterly. At December 31, 2017, the interest coverage ratio was 4.01 to 1.00 and the current ratio was 4.78 to 1.00.
At December 31, 2017, the $1,500,000 facility had no borrowings outstanding and $239,072 of letters of credit outstanding, leaving $1,260,928 of unused capacity. At December 31, 2016, the $2,000,000 facility had no borrowings outstanding and $325,676 of letters of credit outstanding, leaving $1,674,324 of unused capacity.
NOTE 9—OTHER ACCRUED LIABILITIES:
December 31, | ||||||||
2017 | 2016 | |||||||
Royalties | $ | 60,008 | $ | 42,425 | ||||
Gas derivatives | 41,291 | 231,573 | ||||||
Accrued interest | 32,172 | 35,127 | ||||||
Transportation charges | 13,004 | 9,856 | ||||||
Short-term incentive compensation | 12,062 | 13,424 | ||||||
Deferred revenue | 11,559 | 7,691 | ||||||
Accrued other taxes | 9,779 | 9,261 | ||||||
Accrued payroll & benefits | 6,615 | 7,322 | ||||||
Other | 30,083 | 26,155 | ||||||
Current portion of long-term liabilities: | ||||||||
Asset retirement obligations | 5,302 | 5,302 | ||||||
Salary retirement | 1,532 | 1,505 | ||||||
Total Other Accrued Liabilities | $ | 223,407 | $ | 389,641 | ||||
96
NOTE 10—LONG-TERM DEBT:
December 31, | |||||||
2017 | 2016 | ||||||
Debt: | |||||||
Senior Notes due April 2022 at 5.875% (Principal of $1,705,682 and $1,850,000 plus Unamortized Premium of $3,544 and $4,731, respectively) | $ | 1,709,226 | $ | 1,854,731 | |||
Senior Notes due April 2023 at 8.00% (Principal of $500,000 less Unamortized Discount of $4,751 and $5,656, respectively) | 495,249 | 494,344 | |||||
Senior Notes due April 2020 at 8.25%, Issued at Par Value | — | 74,470 | |||||
Senior Notes due March 2021 at 6.375%, Issued at Par Value | — | 20,611 | |||||
Other Note Maturing in 2018 (Principal of $358 and $1,789 less Unamortized Discount of $8 and $117, respectively) | 350 | 1,672 | |||||
Less: Unamortized Debt Issuance Costs | 17,536 | 23,356 | |||||
2,187,289 | 2,422,472 | ||||||
Less: Amounts Due in One Year* | 263 | 1,304 | |||||
Long-Term Debt | $ | 2,187,026 | $ | 2,421,168 | |||
*Excludes current portion of Capital Lease Obligations of $6,848 and $6,620 at December 31, 2017 and 2016, respectively.
Annual undiscounted maturities on long-term debt during the next five years and thereafter are as follows:
Year ended December 31, | Amount | ||
2018 | $ | 358 | |
2019 | — | ||
2020 | — | ||
2021 | — | ||
2022 | 1,705,682 | ||
Thereafter | 500,000 | ||
Total Long-Term Debt Maturities | $ | 2,206,040 | |
During the year ended December 31, 2017, CNX called the remaining $74,470 balance on its 8.25% senior notes due in April 2020 and the remaining $20,611 balance on its 6.375% senior notes due in March 2021. The call price was $101.375 for the 8.25% senior notes due in April 2020 and $102.125 for the 6.375% senior notes due in March 2021. Additionally, CNX purchased $144,318 of its outstanding 5.875% senior notes due in April 2022 . As part of these transactions, a loss of $2,129 was included in Loss on Debt Extinguishment on the Consolidated Statements of Income for the year ended December 31, 2017.
During the year ended December 31, 2015, CNX purchased $940,330 of its outstanding 8.25% senior notes due in April 2020 and $229,389 of its outstanding 6.375% senior notes due in March 2021. As part of these transactions, a loss of $67,751 was included in Loss on Debt Extinguishment on the Consolidated Statements of Income for the year ended December 31, 2015.
97
NOTE 11—LEASES:
CNX uses various leased facilities and equipment in its operations. Future minimum lease payments under capital and operating leases, together with the present value of the net minimum capital lease payments, at December 31, 2017 are as follows:
Capital | Operating | |||||||
Leases | Leases | |||||||
Year Ended December 31, | ||||||||
2018 | $ | 8,562 | $ | 7,497 | ||||
2019 | 8,362 | 6,334 | ||||||
2020 | 7,539 | 5,565 | ||||||
2021 | 6,706 | 5,438 | ||||||
2022 | — | 5,378 | ||||||
Thereafter | — | 41,433 | ||||||
Total minimum lease payments | $ | 31,169 | $ | 71,645 | ||||
Less amount representing interest (3.00% – 7.36%) | 3,974 | |||||||
Present value of minimum lease payments | 27,195 | |||||||
Less amount due in one year | 6,848 | |||||||
Total long-term capital lease obligation | $ | 20,347 | ||||||
Rental expense under operating leases was $16,797, $20,772, and $26,360 for the years ended December 31, 2017, 2016 and 2015, respectively.
NOTE 12—PENSION:
CNX has a non-contributory defined benefit retirement plan. According to the Defined Benefit Plans Topic of the Financial Accounting Standards Board (FASB) Accounting Standards Codification, if the lump sum distributions made during a plan year, which for CNX is January 1 to December 31, exceed the total of the projected service cost and interest cost for the plan year, settlement accounting is required. Lump sum payments exceeded this threshold during the year ended December 31, 2015. Accordingly, CNX recognized settlement expense of $3,132 for the year ended December 31, 2015 in Other Expense in the Consolidated Statements of Income. Lump sum payments did not exceed this threshold during the years ended December 31, 2017 or 2016.
98
The reconciliation of changes in the benefit obligation, plan assets and funded status of the pension benefits is as follows:
December 31, | ||||||||
2017 | 2016 | |||||||
Change in benefit obligation: | ||||||||
Benefit obligation at beginning of period | $ | 34,051 | $ | 33,196 | ||||
Service cost | 375 | 367 | ||||||
Interest cost | 1,201 | 1,250 | ||||||
Actuarial loss | 2,127 | 651 | ||||||
Benefits and other payments | (1,474 | ) | (1,413 | ) | ||||
Benefit obligation at end of period | $ | 36,280 | $ | 34,051 | ||||
Change in plan assets: | ||||||||
Fair value of plan assets at beginning of period | $ | — | $ | — | ||||
Company contributions | 1,474 | 1,413 | ||||||
Benefits and other payments | (1,474 | ) | (1,413 | ) | ||||
Fair value of plan assets at end of period | $ | — | $ | — | ||||
Funded status: | ||||||||
Current liabilities | $ | (1,532 | ) | $ | (1,505 | ) | ||
Noncurrent liabilities | (34,748 | ) | (32,546 | ) | ||||
Net obligation recognized | $ | (36,280 | ) | $ | (34,051 | ) | ||
Amounts recognized in accumulated other comprehensive loss consist of: | ||||||||
Net actuarial loss | $ | 14,374 | $ | 13,772 | ||||
Prior service credit | (626 | ) | (988 | ) | ||||
Net amount recognized (before tax effect) | $ | 13,748 | $ | 12,784 | ||||
The components of the net periodic benefit cost are as follows:
For the Years Ended December 31, | |||||||||||
2017 | 2016 | 2015 | |||||||||
Components of net periodic benefit cost: | |||||||||||
Service cost | $ | 375 | $ | 367 | $ | 475 | |||||
Interest cost | 1,201 | 1,250 | 1,526 | ||||||||
Amortization of prior service credits | (362 | ) | (362 | ) | (362 | ) | |||||
Recognized net actuarial loss | 1,525 | 1,505 | 2,252 | ||||||||
Settlement loss | — | — | 3,132 | ||||||||
Net periodic benefit cost | $ | 2,739 | $ | 2,760 | $ | 7,023 | |||||
Amounts included in accumulated other comprehensive loss which are expected to be recognized in 2018 net periodic benefit cost:
Pension | ||||
Benefits | ||||
Prior service credit recognition | $ | (362 | ) | |
Actuarial loss recognition | $ | 1,492 | ||
CNX utilizes a corridor approach to amortize actuarial gains and losses that have been accumulated under the pension plan. Cumulative gains and losses that are in excess of 10% of the greater of either the projected benefit obligation (PBO) or the market-related value of plan assets are amortized over the expected remaining future lifetime of all plan participants for the pension plan.
99
The following table provides information related to the pension plan with an accumulated benefit obligation in excess of plan assets:
As of December 31, | ||||||||
2017 | 2016 | |||||||
Projected benefit obligation | $ | 36,280 | $ | 34,051 | ||||
Accumulated benefit obligation | $ | 35,264 | $ | 32,838 | ||||
Fair value of plan assets | $ | — | $ | — | ||||
Assumptions:
The weighted-average assumptions used to determine benefit obligations are as follows:
For the Year Ended | ||||||
As of December 31, | ||||||
2017 | 2016 | |||||
Discount rate | 3.70 | % | 4.26 | % | ||
Rate of compensation increase | 4.05 | % | 3.90 | % | ||
The discount rates are determined using a Company-specific yield curve model (above-mean) developed with the assistance of an external actuary. The Company-specific yield curve models (above-mean) use a subset of the expanded bond universe to determine the Company-specific discount rate. Bonds used in the yield curve are rated AA by Moody's or Standard & Poor's as of the measurement date. The yield curve models parallel the plans' projected cash flows, and the underlying cash flows of the bonds included in the models exceed the cash flows needed to satisfy the Company plans.
The weighted-average assumptions used to determine net periodic benefit cost are as follows:
For the Years ended December 31, | ||||||||
2017 | 2016 | 2015 | ||||||
Discount rate | 4.26 | % | 4.55 | % | 4.07 | % | ||
Rate of compensation increase | 3.90 | % | 3.80 | % | 3.80 | % | ||
Cash Flows:
CNX expects to pay benefits of $1,532 from the non-qualified pension plan in 2018.
The following benefit payments, which reflect expected future service, are expected to be paid:
Pension | ||||
Year ended December 31, | Benefits | |||
2018 | $ | 1,532 | ||
2019 | $ | 1,596 | ||
2020 | $ | 1,679 | ||
2021 | $ | 1,757 | ||
2022 | $ | 1,842 | ||
Year 2023-2027 | $ | 10,456 | ||
100
NOTE 13—STOCK-BASED COMPENSATION:
CNX adopted the Equity Incentive Plan (the Equity Incentive Plan) on April 7, 1999. The Equity Incentive Plan provides for grants of stock-based awards to key employees and to non-employee directors. Amendments to the Equity Incentive Plan have been adopted and approved by the Board of Directors and the Company's Shareholders since the commencement of the Equity Incentive Plan. Most recently, in May 2016, the Company's Shareholders adopted and approved a 10,550,000 increase to the total number of shares available for issuance, which brought the total number of shares of common stock that can be covered by grants, after adjustment, in accordance with the terms of the Equity Incentive Plan, for the separation of the coal business from the gas business on November 28, 2017, to 48,915,944. At December 31, 2017, 7,411,143 shares of common stock remained available for grant under the plan. The Equity Incentive Plan provides that the aggregate number of shares available for issuance will be reduced by one share for each share relating to stock options and by 1.62 for each share relating to Performance Share Units (PSUs) or Restricted Stock Units (RSUs). No award of stock options may be exercised under the Equity Incentive Plan after the tenth anniversary of the grant date of the award.
For those shares expected to vest, CNX recognizes stock-based compensation costs on a straight-line basis over the requisite service period of the award, which is generally the vesting term. Options and RSUs vest over a three-year term. PSUs granted in 2015 vest over a three-year term while PSUs granted in 2016 and 2017 vest over a five-year term at 20% per year subject to performance conditions. If an employee leaves the Company, all unvested shares are forfeited. The vesting of all awards will accelerate in the event of death and disability and may accelerate upon a change in control of CNX. The total stock-based compensation expense recognized during the years ended December 31, 2017, 2016 and 2015 was $16,983, $19,316 and $14,314, respectively. The related deferred tax benefit totaled $6,114, $7,272 and $5,210, for the years ended December 31, 2017, 2016 and 2015, respectively.
As of December 31, 2017, CNX has $28,712 of unrecognized compensation cost related to all nonvested stock-based compensation awards, which is expected to be recognized over a weighted-average period of 2.75 years. When stock options are exercised and restricted and performance stock unit awards become vested, the issuances are made from CNX's common stock shares.
Pursuant to the terms of the CNX Equity Plan and the outstanding awards, in the event of certain changes in the outstanding common stock of CNX or its capital structure, including by reason of a spin-off, the administrator of the CNX Equity Plan is required to appropriately adjust the number, exercise price, kind of shares, performance goals or other terms and conditions of Awards granted thereunder. In connection with the Separation, the Board of Directors of CNX has determined that it is appropriate that the outstanding awards be equitably adjusted pursuant to the terms of the CNX Equity Plan and/or converted into awards issued under the CONSOL Energy Inc. (CEIX) Equity Incentive Plan, such that the intrinsic value of the outstanding awards immediately following the separation remains the same as the intrinsic value of such awards immediately prior to the separation. It was agreed upon that a simple average of the volume weighted average price (VWAP) per share for each of the three trading days prior to the distribution of CONSOL Energy, Inc will be divided by the simple average of the VWAP for each of the 3 trading days subsequent to the distribution date of CNX or CEIX will be used to ensure intrinsic value was preserved for conversion of CONSOL Energy units to CNX or CEIX units. Each type of award is summarized below:
•CONSOL Energy's stock options held by both CNX and CEIX employees and former employees were adjusted to provide holders 1.15504 options to purchase CNX common stock for every option of CONSOL Energy stock held.
•CONSOL Energy's restricted stock and performance share units awarded to CNX employees under the Performance Share Program were adjusted to provide holders 1.15504 restricted shares or performance share units of CNX stock for every one restricted share or performance share unit of CONSOL Energy stock.
•CONSOL Energy's restricted stock and performance share units awarded to CEIX employees were adjusted to provide holders .71890 restricted shares or performance share units of CEIX stock for every one restricted share or performance share unit of CONSOL Energy stock.
The separation resulted in a modification of the equity plans but did not have a material impact on the financial statements as of December 31, 2017.
In March 2016, the Financial Accounting Standards Board (FASB) issued an Accounting Standards Update on stock compensation that was intended to simplify and improve the accounting and statement of cash flow presentation for income taxes at settlement, forfeitures, and net settlements for withholding tax. The guidance is effective for public entities for fiscal years beginning after December 15, 2016. In accordance with this Update, $4,867 of additional income tax expense was recognized in the Consolidated Statements of Income for the year ended December 31, 2017. Also in accordance with this Update, the value of shares withheld for employee tax withholding purposes of $6,681 and $1,649 for the years ended December 31, 2017 and 2016 were reclassified between Net Cash Provided by Operating Activities and Net Cash Used in Financing Activities of the Consolidated
101
Statements of Cash Flows. As permitted by this Update, the Company has elected to account for forfeitures of stock compensation as they occur. The cumulative effect of the policy election to recognize forfeitures as they occur was nominal.
Stock Options:
CNX examined its historical pattern of option exercises in an effort to determine if there were any discernable activity patterns based on certain employee populations. From this analysis, CNX identified two distinct employee populations and used the Black-Scholes option pricing model to value the options for each of the employee populations. The expected term computation presented in the table below is based upon a weighted average of the historical exercise patterns and post-vesting termination behavior of the two populations. The risk-free interest rate was determined for each vesting tranche of an award based upon the calculated yield on U.S. Treasury obligations for the expected term of the award. A combination of historical and implied volatility is used to determine expected volatility and future stock price trends. The total fair value of options granted during the years ended December 31, 2017 and 2016 was $353 and $19,305, respectively, based on the following assumptions and weighted average fair values:
December 31, | December 31, | ||||||
2017 | 2016 | ||||||
Weighted average fair value of grants | $ | 6.19 | $ | 5.73 | |||
Risk-free interest rate | 1.66 | % | 1.13 | % | |||
Expected dividend yield | — | % | 0.27 | % | |||
Expected forfeiture rate | — | % | 2.00 | % | |||
Expected volatility | 50.85 | % | 61.09 | % | |||
Expected term in years | 3.71 | 4.90 | |||||
CNX did not grant stock option awards during the year ended December 31, 2015.
A summary of the status of stock options granted is presented below:
Weighted | ||||||||||||
Average | ||||||||||||
Weighted | Remaining | Aggregate | ||||||||||
Average | Contractual | Intrinsic | ||||||||||
Exercise | Term (in | Value (in | ||||||||||
Shares | Price | years) | thousands) | |||||||||
Balance at December 31, 2016 | 6,208,813 | $43.12 | ||||||||||
Granted | 56,947 | $15.69 | ||||||||||
Exercised | (126,221 | ) | $7.94 | |||||||||
Forfeited/Expired | (778,413 | ) | $30.77 | |||||||||
Awards granted in conversion, as a result of the separation | 831,189 | $21.50 | ||||||||||
Balance at December 31, 2017 | 6,192,315 | $21.51 | 5.60 | $ | — | |||||||
Vested | 4,332,383 | $27.81 | 4.42 | $ | — | |||||||
Exercisable at December 31, 2017 | 4,187,408 | $28.38 | 4.33 | $ | — | |||||||
At December 31, 2017, there are 5,756,074 employee stock options outstanding under the Equity Incentive Plan. Non-employee director stock options vest one year after the grant date. There are 436,241 stock options outstanding under these grants.
The aggregate intrinsic value in the table above represents the total pretax intrinsic value (the difference between CNX's closing stock price on the last trading day of the year ended December 31, 2017 and the option's exercise price, multiplied by the number of in-the-money options) that would have been received by the option holders had all option holders exercised their options on December 31, 2017. This amount varies based on the fair market value of CNX's stock.The total intrinsic value of options exercised for the years ended December 31, 2017, 2016 and 2015 was $1,067, $0 and $2,744, respectively.
Cash received from option exercises for the years ended December 31, 2017, 2016 and 2015 was $1,002, $0, and $8,281, respectively. The tax impact from option exercises totaled $205, $0, and $208 for the years ended December 31, 2017, 2016 and 2015, respectively.
102
Restricted Stock Units:
Under the Equity Incentive Plan, CNX grants certain employees and non-employee directors RSU awards, which entitle the holder to receive shares of common stock as the award vests. Non-employee director RSUs vest at the end of one year. Compensation expense is recognized over the vesting period of the units, described above. The total fair value of RSUs granted during the years ended December 31, 2017, 2016 and 2015 was $14,328, $493 and $26,550, respectively. The total fair value of restricted stock units vested during the years ended December 31, 2017, 2016 and 2015 was $12,805, $19,095 and $20,793, respectively. The following table represents the nonvested restricted stock units and their corresponding fair value (based upon the closing share price) at the date of grant:
Number of | Weighted Average | ||||
Shares | Grant Date Fair Value | ||||
Nonvested at December 31, 2016 | 663,003 | $31.97 | |||
Granted | 863,483 | $16.59 | |||
Vested | (408,117 | ) | $31.38 | ||
Forfeited | (54,823 | ) | $20.67 | ||
RSUs surrendered as a result of the separation | (253,959 | ) | $21.14 | ||
RSUs granted in conversion, as a result of the separation | 127,875 | $16.02 | |||
Nonvested at December 31, 2017 | 937,462 | $16.01 | |||
Performance Share Units:
Under the Equity Incentive Plan, CNX grants certain employees performance share unit awards, which entitle the holder to shares of common stock subject to the achievement of certain market and performance goals. Compensation expense is recognized over the performance measurement period of the units in accordance with the provisions of the Stock Compensation Topic of the FASB Accounting Standards Codification for awards with market and performance vesting conditions. The total fair value of performance share units granted during the years ended December 31, 2017, 2016 and 2015 was $9,789, $24,283 and $18,771, respectively. The total fair value of performance share units vested during the years ended December 31, 2017, 2016 and 2015 was $17,646, $0 and $20,083, respectively. The following table represents the nonvested performance share units and their corresponding fair value (based upon the closing share price) on the date of grant:
Number of | Weighted Average | ||||
Shares | Grant Date Fair Value | ||||
Nonvested at December 31, 2016 | 1,424,551 | $26.41 | |||
Granted | 447,691 | $21.87 | |||
PSUs issued as a result of 200% payout | 187,062 | $25.80 | |||
Vested | (560,960 | ) | $31.46 | ||
Forfeited | (16,124 | ) | $20.65 | ||
PSUs surrendered as a result of the separation | (379,893 | ) | $24.04 | ||
PSUs granted in conversion, as a result of the separation | 170,715 | $25.53 | |||
Nonvested at December 31, 2017 | 1,273,042 | $25.53 | |||
Performance Options:
Under the Equity Incentive Plan in 2010, CNX granted certain employees performance options, which entitled the holder to shares of common stock subject to the achievement of certain performance goals. Compensation expense was recognized over the vesting period of the options. The Black-Scholes option valuation model was used to value each tranche separately. No performance options were granted in 2017, 2016, or 2015. A summary of the status of performance options is presented below:
103
Weighted | |||||||||||||
Average | |||||||||||||
Weighted | Remaining | Aggregate | |||||||||||
Average | Contractual | Intrinsic | |||||||||||
Exercise | Term (in | Value (in | |||||||||||
Shares | Price | years) | thousands) | ||||||||||
Balance at December 31, 2016 | 802,804 | $45.05 | |||||||||||
Granted | — | — | |||||||||||
Exercised | — | — | |||||||||||
Forfeited/Expired | — | — | |||||||||||
Options granted in conversion, as a result of the separation | 124,464 | 0.04 | $39.00 | ||||||||||
Balance at December 31, 2017 | 927,268 | $39.00 | 2.42 | $ | — | ||||||||
Vested | 927,268 | $39.00 | 2.42 | $ | — | ||||||||
Exercisable at December 31, 2017 | 927,268 | $39.00 | 2.42 | $ | — | ||||||||
NOTE 14—SUPPLEMENTAL CASH FLOW INFORMATION:
The following are non-cash transactions that impact the investing and financing activities of CNX. For non-cash transactions that relate to the separation, as well as, acquisitions and dispositions, see Note 2 - Discontinued Operations and Note - 3 Acquisitions and Dispositions.
CNX obtains capital lease arrangements for company-used vehicles. For the years ended December 31, 2017, 2016 amounts were nominal and for the year ended December 31, 2015, CNX entered into non-cash capital lease arrangements of $4,241.
As of December 31, 2017, 2016 and 2015, CNX purchased goods and services related to capital projects in the amount of $2,379, $5,501 and $25,827, respectively, which are included in accounts payable.
The following table shows cash paid (received) during the year for:
For the Years Ended December 31, | ||||||||||||
2017 | 2016 | 2015 | ||||||||||
Interest (net of amounts capitalized) | $ | 152,047 | $ | 186,924 | $ | 207,094 | ||||||
Income taxes | $ | (121,773 | ) | $ | (18,032 | ) | $ | (59,584 | ) | |||
NOTE 15—CONCENTRATION OF CREDIT RISK AND MAJOR CUSTOMERS:
CNX markets natural gas primarily to gas wholesalers in the United States. Concentration of credit risk is summarized below:
December 31, | ||||||||
2017 | 2016 | |||||||
Gas Wholesalers | $ | 126,387 | $ | 95,826 | ||||
NGL, Condensate & Processing Facilities | 29,841 | 27,468 | ||||||
Other | 589 | 1,220 | ||||||
Total Accounts Receivable Trade | $ | 156,817 | $ | 124,514 | ||||
During the year ended December 31, 2017 sales to Direct Energy Business Marketing LLC were $153,565 and sales to NJR Energy Services Company were $147,595, each of which comprises over 10% of sales.
During the year ended December 31, 2016, sales to NJR Energy Services Company were $106,280, which comprised over 10% of the Company's revenues.
During the year ended December 31, 2015, sales to NJR Energy Services Company were $131,299, which comprised over 10% of the Company's revenues.
104
NOTE 16—FAIR VALUE OF FINANCIAL INSTRUMENTS:
CNX determines the fair value of assets and liabilities based on the exchange price that would be received for an asset or paid to transfer a liability (an exit price) in the principal or most advantageous market for the asset or liability in an orderly transaction between market participants. The fair values are based on assumptions that market participants would use when pricing an asset or liability, including assumptions about risk and the risks inherent in valuation techniques and the inputs to valuations. The fair value hierarchy is based on whether the inputs to valuation techniques are observable or unobservable. Observable inputs reflect market data obtained from independent sources (including NYMEX forward curves, LIBOR-based discount rates and basis forward curves), while unobservable inputs reflect the Company's own assumptions of what market participants would use.
The fair value hierarchy includes three levels of inputs that may be used to measure fair value as described below:
Level One - Quoted prices for identical instruments in active markets.
Level Two - The fair value of the assets and liabilities included in Level 2 are based on standard industry income approach models that use significant observable inputs, including NYMEX forward curves, LIBOR-based discount rates and basis forward curves.
Level Three - Unobservable inputs significant to the fair value measurement supported by little or no market activity.
In those cases when the inputs used to measure fair value meet the definition of more than one level of the fair value hierarchy, the lowest level input that is significant to the fair value measurement in its totality determines the applicable level in the fair value hierarchy.
The financial instrument measured at fair value on a recurring basis is summarized below:
Fair Value Measurements at December 31, 2017 | Fair Value Measurements at December 31, 2016 | ||||||||||||||||||||||
Description | Level 1 | Level 2 | Level 3 | Level 1 | Level 2 | Level 3 | |||||||||||||||||
Gas Derivatives | $ | — | $ | 59,949 | $ | — | $ | — | $ | (188,156 | ) | $ | — | ||||||||||
Put Option | $ | — | $ | (3,500 | ) | $ | — | $ | — | $ | — | $ | — | ||||||||||
The following methods and assumptions were used to estimate the fair value for which the fair value option was not elected:
Cash and cash equivalents: The carrying amount reported in the Consolidated Balance Sheets for cash and cash equivalents approximates its fair value due to the short-term maturity of these instruments.
Long-term debt: The fair value of long-term debt is measured using unadjusted quoted market prices or estimated using discounted cash flow analyses. The discounted cash flow analyses are based on current market rates for instruments with similar cash flows.
The carrying amounts and fair values of financial instruments for which the fair value option was not elected are as follows:
December 31, 2017 | December 31, 2016 | ||||||||||||||
Carrying Amount | Fair Value | Carrying Amount | Fair Value | ||||||||||||
Cash and Cash Equivalents | $ | 509,167 | $ | 509,167 | $ | 46,299 | $ | 46,299 | |||||||
Long-Term Debt | $ | 2,204,825 | $ | 2,281,282 | $ | 2,445,828 | $ | 2,422,247 | |||||||
Cash and cash equivalents represent highly-liquid instruments and constitute Level 1 fair value measurements. Certain of the Company’s debt is actively traded on a public market and, as a result, constitute Level 1 fair value measurements. The portion of the Company’s debt obligations that is not actively traded is valued through reference to the applicable underlying benchmark rate and, as a result, constitute Level 2 fair value measurements.
105
NOTE 17—DERIVATIVE INSTRUMENTS:
CNX enters into financial derivative instruments to manage its exposure to commodity price volatility. These natural gas and NGL commodity hedges are accounted for on a mark-to-market basis with changes in fair value recorded in current period earnings.
CNX is exposed to credit risk in the event of non-performance by counterparties. The creditworthiness of counterparties is subject to continuing review. The Company has not experienced any issues of non-performance by derivative counterparties.
None of the Company's counterparty master agreements currently require CNX to post collateral for any of its positions. However, as stated in the counterparty master agreements, if the Company's obligations with one of its counterparties cease to be secured on the same basis as similar obligations with the other lenders under the credit facility, CNX would have to post collateral for instruments in a liability position in excess of defined thresholds. All of the Company's derivative instruments are subject to master netting arrangements with its counterparties. CNX recognizes all financial derivative instruments as either assets or liabilities at fair value on the Consolidated Balance Sheets on a gross basis.
Each of the Company's counterparty master agreements allows, in the event of default, the ability to elect early termination of outstanding contracts. If early termination is elected, CNX and the applicable counterparty would net settle all open hedge positions.
The total notional amounts of production of the Company's derivative instruments at December 31, 2017 and December 31, 2016 were as follows:
December 31, | Forecasted to | ||||||
2017 | 2016 | Settle Through | |||||
Natural Gas Commodity Swaps (Bcf) | 1,067.2 | 744.7 | 2022 | ||||
Natural Gas Basis Swaps (Bcf) | 688.1 | 482.0 | 2022 | ||||
Propane Commodity Swaps (Mbbls) | — | 126.0 | — | ||||
The gross fair value of the Company's derivative instruments at December 31, 2017 and December 31, 2016 were as follows:
Asset Derivative Instruments | Liability Derivative Instruments | |||||||||||||||
December 31, | December 31, | |||||||||||||||
2017 | 2016 | 2017 | 2016 | |||||||||||||
Commodity Swaps: | ||||||||||||||||
Prepaid Expense | $ | 62,369 | $ | 16 | Other Accrued Liabilities | $ | 5,985 | $ | 209,980 | |||||||
Other Assets | 59,281 | 29,596 | Other Liabilities | 42,419 | 67,139 | |||||||||||
Total Asset | $ | 121,650 | $ | 29,612 | Total Liability | $ | 48,404 | $ | 277,119 | |||||||
Basis Only Swaps: | ||||||||||||||||
Prepaid Expense | $ | 14,965 | $ | 56,916 | Other Accrued Liabilities | $ | 35,306 | $ | 21,593 | |||||||
Other Assets | 24,223 | 35,603 | Other Liabilities | 17,179 | 11,575 | |||||||||||
Total Asset | $ | 39,188 | $ | 92,519 | Total Liability | $ | 52,485 | $ | 33,168 | |||||||
106
The effect of derivative instruments on the Company's Consolidated Statements of Income was as follows:
For the Years Ended December 31, | |||||||||||
2017 | 2016 | 2015 | |||||||||
Cash (Paid) Received in Settlement of Commodity Derivative Instruments: | |||||||||||
Commodity Swaps: | |||||||||||
Natural Gas | $ | (34,928 | ) | $ | 225,797 | $ | 193,976 | ||||
Propane | (1,216 | ) | (650 | ) | — | ||||||
Natural Gas Basis Swaps | (5,030 | ) | 20,065 | 2,372 | |||||||
Total Cash (Paid) Received in Settlement of Commodity Derivative Instruments | (41,174 | ) | 245,212 | 196,348 | |||||||
Unrealized Gain (Loss) on Commodity Derivative Instruments: | |||||||||||
Commodity Swaps: | |||||||||||
Natural Gas | 319,605 | (520,170 | ) | 81,142 | |||||||
Propane | 1,147 | (1,148 | ) | — | |||||||
Natural Gas Basis Swaps | (72,648 | ) | 66,604 | (7,653 | ) | ||||||
Reclassified from Accumulated OCI | — | 68,481 | 123,105 | ||||||||
Total Unrealized Gain (Loss) on Commodity Derivative Instruments | 248,104 | (386,233 | ) | 196,594 | |||||||
Gain (Loss) on Commodity Derivative Instruments: | |||||||||||
Commodity Swaps: | |||||||||||
Natural Gas | $ | 284,677 | $ | (294,373 | ) | $ | 275,118 | ||||
Propane | (69 | ) | (1,798 | ) | — | ||||||
Natural Gas Basis Swaps | (77,678 | ) | 86,669 | (5,281 | ) | ||||||
Reclassified from Accumulated OCI | — | 68,481 | 123,105 | ||||||||
Total Gain (Loss) on Commodity Derivative Instruments | $ | 206,930 | $ | (141,021 | ) | $ | 392,942 | ||||
Changes in Accumulated OCI, net of tax, attributable to cash flow hedges that were de-designated December 31, 2014 were as follows:
For the Years Ended December 31, | |||||||||
2016 | 2015 | ||||||||
Beginning Balance – Accumulated OCI | $ | 43,470 | $ | 121,521 | |||||
Gain Reclassified from Accumulated OCI (Net of tax: $25,011, $45,054) | (43,470 | ) | (78,051 | ) | |||||
Ending Balance – Accumulated OCI | $ | — | $ | 43,470 | |||||
The Company also enters into fixed price natural gas sales agreements that are satisfied by physical delivery. These physical commodity contracts qualify for the normal purchases and sales exception and are not subject to derivative instrument accounting.
107
NOTE 18—COMMITMENTS AND CONTINGENT LIABILITIES:
CNX and its subsidiaries are subject to various lawsuits and claims with respect to such matters as personal injury, wrongful death, damage to property, exposure to hazardous substances, governmental regulations including environmental remediation, employment and contract disputes and other claims and actions arising out of the normal course of business. CNX accrues the estimated loss for these lawsuits and claims when the loss is probable and can be estimated. The Company's current estimated accruals related to these pending claims, individually and in the aggregate, are immaterial to the financial position, results of operations or cash flows of CNX. It is possible that the aggregate loss in the future with respect to these lawsuits and claims could ultimately be material to the financial position, results of operations or cash flows of CNX; however, such amounts cannot be reasonably estimated. The amount claimed against CNX is disclosed below when an amount is expressly stated in the lawsuit or claim, which is not often the case.
The following lawsuits and claims include those for which a loss is probable and an accrual has been recognized:
Hale Litigation: This class action lawsuit was filed on September 23, 2010 in the U.S. District Court in Abingdon, Virginia. The putative class consists of force-pooled unleased gas owners whose ownership of the coalbed methane (CBM) gas was declared to be in conflict with rights of others. The lawsuit seeks a judicial declaration of ownership of the CBM and damages based on allegations CNX Gas Company failed to either pay royalties due to conflicting claimants or deemed lessors or paid them less than required because of the alleged practice of improper below market sales and/or taking alleged improper post-production deductions. On September 30, 2013, the District Judge entered an Order certifying the class, and CNX Gas Company appealed the Order to the U.S. Fourth Circuit Court of Appeals. On August 19, 2014, the Fourth Circuit agreed with CNX Gas Company, reversed the Order certifying the class and remanded the case to the trial court for further proceedings consistent with the decision. On April 23, 2015, Plaintiffs filed a Renewed Motion for Class Certification, which CNX opposed. On March 29, 2017, the Court issued an Order certifying four issues for class treatment: (1) allegedly excessive deductions; (2) royalties based on purported improperly low prices; (3) deduction of severance taxes; and (4) Plaintiffs' request for an accounting. On April 13, 2017, CNX filed a Petition for Allowance of Appeal with the Fourth Circuit, and on May 22, 2017 the Petition was denied. CNX and plaintiffs’ counsel have reached an agreement in principal to settle the certified class claims, subject to court approval. The Company has established an accrual to cover its estimated liability for this case. This accrual is immaterial to the overall financial position of CNX and is included in Other Accrued Liabilities on the Consolidated Balance Sheets.
Addison Litigation: This class action lawsuit was filed on April 28, 2010 in the U.S. District Court in Abingdon, Virginia. The putative class consists of gas lessors whose gas ownership is in conflict. The lawsuit seeks a judicial declaration of ownership of the CBM and damages based on the allegations that CNX Gas Company failed to either pay royalties due to these conflicting claimant lessors or paid them less than required because of the alleged practice of improper below market sales and/or taking alleged improper post-production deductions. On September 30, 2013, the District Judge entered an Order certifying the class, and CNX Gas Company appealed the Order to the U.S. Fourth Circuit Court of Appeals. On August 19, 2014, the Fourth Circuit agreed with CNX Gas Company, reversed the Order certifying the class and remanded the case to the trial court for further proceedings consistent with the decision. On April 23, 2015, Plaintiffs filed a Renewed Motion for Class Certification, which CNX opposed. On March 29, 2017, the Court issued an Order denying class certification in this matter. CNX and plaintiff’s counsel have reached an agreement in principal to settle this lawsuit. The Company has established an accrual to cover its estimated liability for this case. This accrual is immaterial to the overall financial position of CNX and is included in Other Accrued Liabilities on the Consolidated Balance Sheets.
At December 31, 2017, CNX has provided the following financial guarantees, unconditional purchase obligations and letters of credit to certain third parties as described by major category in the following table. These amounts represent the maximum potential of total future payments that the Company could be required to make under these instruments. These amounts have not been reduced for potential recoveries under recourse or collateralization provisions. Generally, recoveries under reclamation bonds would be limited to the extent of the work performed at the time of the default. No amounts related to these unconditional purchase obligations and letters of credit are recorded as liabilities in the financial statements. CNX management believes that these commitments will expire without being funded, and therefore will not have a material adverse effect on financial condition.
108
Amount of Commitment Expiration Per Period | |||||||||||||||||||
Total Amounts Committed | Less Than 1 Year | 1-3 Years | 3-5 Years | Beyond 5 Years | |||||||||||||||
Letters of Credit: | |||||||||||||||||||
Firm Transportation | $ | 239,052 | $ | 231,992 | $ | 7,060 | $ | — | $ | — | |||||||||
Other | 20 | 20 | — | — | — | ||||||||||||||
Total Letters of Credit | 239,072 | 232,012 | 7,060 | — | — | ||||||||||||||
Surety Bonds: | |||||||||||||||||||
Employee-Related | 1,850 | 1,850 | — | — | — | ||||||||||||||
Environmental | 5,438 | 4,178 | 1,260 | — | — | ||||||||||||||
Other | 12,485 | 10,823 | 1,662 | — | — | ||||||||||||||
Total Surety Bonds | 19,773 | 16,851 | 2,922 | — | — | ||||||||||||||
Guarantees: | |||||||||||||||||||
CONSOL Energy | 192,490 | 59,809 | 69,059 | 41,047 | 22,575 | ||||||||||||||
Total Guarantees | 192,490 | 59,809 | 69,059 | 41,047 | 22,575 | ||||||||||||||
Total Commitments | $ | 451,335 | $ | 308,672 | $ | 79,041 | $ | 41,047 | $ | 22,575 | |||||||||
Included in the above table are commitments and guarantees entered into in conjunction with the spin-off of the Company's coal business (See Note 2 - Discontinued Operations). Although CONSOL Energy agreed to indemnify us to the extent that we are called upon to pay any of these liabilities, there is no assurance that CONSOL Energy will satisfy its obligations to indemnify us in these situations.
CNX enters into long-term unconditional purchase obligations to procure major equipment purchases, natural gas firm transportation, gas drilling services and other operating goods and services. These purchase obligations are not recorded on the Consolidated Balance Sheets. As of December 31, 2017, the purchase obligations for each of the next five years and beyond were as follows:
Obligations Due | Amount | ||
Less than 1 year | $ | 181,303 | |
1 - 3 years | 264,773 | ||
3 - 5 years | 237,625 | ||
More than 5 years | 513,744 | ||
Total Purchase Obligations | $ | 1,197,445 | |
109
NOTE 19—SEGMENT INFORMATION:
The principal activity of CNX, which includes four reportable segments, is to produce pipeline quality natural gas for sale primarily to gas wholesalers. The Company's reportable segments are Marcellus Shale, Utica Shale, Coalbed Methane, and Other Gas. The Other Gas segment is primarily related to shallow oil and gas production which is not significant to the Company. It also includes the Company's purchased gas activities, unrealized gain or loss on commodity derivative instruments, exploration and production related other costs, impairment of exploration and production properties, as well as various other operating activities not allocated to each individual segment.
The Company's unallocated expenses include selling, general and administrative activities, other expense, gain on sale of assets, loss on debt extinguishment, interest expense and income taxes.
Prior to the spin-off of the coal company in November 2017 (See Note 2 - Discontinued Operations), CNX had a Coal division. The Coal division had three reportable segments; PA Operations, Virginia (VA) Operations and Other Coal. The VA Operations segment included the Buchanan Mine and the Other Coal segment was primarily comprised of the assets and operations of the Miller Creek and Fola Complexes, as well as coal terminal operations, closed and idle mine activities, selling, general and administrative activities and various other non-operated activities.
In the preparation of the following information, intersegment sales have been recorded at amounts approximating market. Operating profit for each segment is based on sales less identifiable operating and non-operating expenses. Assets are reflected at the Total Operating level and are not allocated between each individual segment. These assets are not allocated to each individual segment due to the diverse asset base controlled by CNX, whereby each individual asset may service more than one segment. An allocation of such asset base would not be meaningful or representative on a segment by segment basis.
Industry segment results for the year ended December 31, 2017 are:
Marcellus Shale | Utica Shale | Coalbed Methane | Other Gas | Total Operating | Unallocated | Consolidated | ||||||||||||||||||||||
Natural Gas, NGLs and Oil Sales | $ | 646,188 | $ | 217,020 | $ | 208,677 | $ | 53,339 | $ | 1,125,224 | $ | — | $ | 1,125,224 | (A) | |||||||||||||
(Loss) Gain on Commodity Derivative Instruments | (30,336 | ) | 1,367 | (9,589 | ) | 245,488 | 206,930 | — | 206,930 | |||||||||||||||||||
Purchased Gas Sales | — | — | — | 53,795 | 53,795 | — | 53,795 | |||||||||||||||||||||
Other Operating Income | — | — | — | 69,182 | 69,182 | — | 69,182 | (B) | ||||||||||||||||||||
Total Revenue and Other Operating Income | $ | 615,852 | $ | 218,387 | $ | 199,088 | $ | 421,804 | $ | 1,455,131 | $ | — | $ | 1,455,131 | ||||||||||||||
Earnings (Loss) From Continuing Operations Before Income Tax | $ | 91,436 | $ | 64,741 | $ | 20,346 | $ | 14,603 | $ | 191,126 | $ | (72,545 | ) | $ | 118,581 | |||||||||||||
Segment Assets | $ | 6,122,746 | $ | 809,167 | $ | 6,931,913 | (C) | |||||||||||||||||||||
Depreciation, Depletion and Amortization | $ | 412,036 | $ | — | $ | 412,036 | ||||||||||||||||||||||
Capital Expenditures | $ | 632,846 | $ | — | $ | 632,846 | ||||||||||||||||||||||
(A) | Included in Total Operating are sales of $153,565 to Direct Energy Business Marketing LLC and $147,595 to NJR Energy Services Company, each of which comprises over 10% of sales. |
(B) | Includes equity in earnings of unconsolidated affiliates of $49,830. |
(C) | Includes investments in unconsolidated equity affiliates of $197,921. |
110
Industry segment results for the year ended December 31, 2016 are:
Marcellus Shale | Utica Shale | Coalbed Methane | Other Gas | Total Operating | Unallocated | Consolidated | ||||||||||||||||||||||
Natural Gas, NGLs and Oil Sales | $ | 414,484 | $ | 163,112 | $ | 174,323 | $ | 41,329 | $ | 793,248 | $ | — | $ | 793,248 | (D) | |||||||||||||
Gain (Loss) on Commodity Derivative Instruments | 147,282 | 29,285 | 52,396 | (369,984 | ) | (141,021 | ) | — | (141,021 | ) | ||||||||||||||||||
Purchased Gas Sales | — | — | — | 43,256 | 43,256 | — | 43,256 | |||||||||||||||||||||
Other Operating Income | — | — | — | 64,485 | 64,485 | — | 64,485 | (E) | ||||||||||||||||||||
Intersegment Transfers | — | — | 424 | (424 | ) | — | — | — | ||||||||||||||||||||
Total Revenue and Other Operating Income | $ | 561,766 | $ | 192,397 | $ | 227,143 | $ | (221,338 | ) | $ | 759,968 | $ | — | $ | 759,968 | |||||||||||||
Earnings (Loss) From Continuing Operations Before Income Tax | $ | 72,141 | $ | 28,390 | $ | 37,999 | $ | (446,327 | ) | $ | (307,797 | ) | $ | (277,551 | ) | $ | (585,348 | ) | ||||||||||
Segment Assets | $ | 6,238,156 | $ | 2,941,535 | $ | 9,179,691 | (F) | |||||||||||||||||||||
Depreciation, Depletion and Amortization | $ | 419,939 | $ | — | $ | 419,939 | ||||||||||||||||||||||
Capital Expenditures | $ | 172,739 | $ | — | $ | 172,739 | ||||||||||||||||||||||
(D) | Included in Total Operating are sales of $106,280 to NJR Energy Services Company, which comprises over 10% of sales. |
(E) | Includes equity in earnings of unconsolidated affiliates of $53,078. |
(F) | Includes investments in unconsolidated equity affiliates of $190,964. |
Industry segment results for the year ended December 31, 2015 are:
Marcellus Shale | Utica Shale | Coalbed Methane | Other Gas | Total Operating | Unallocated | Consolidated | ||||||||||||||||||||||
Natural Gas, NGLs and Oil Sales | $ | 379,453 | $ | 92,223 | $ | 200,645 | $ | 54,600 | $ | 726,921 | $ | — | $ | 726,921 | (G) | |||||||||||||
Gain on Commodity Derivative Instruments | 100,785 | 6,430 | 67,281 | 218,446 | 392,942 | — | 392,942 | |||||||||||||||||||||
Purchased Gas Sales | — | — | — | 14,450 | 14,450 | — | 14,450 | |||||||||||||||||||||
Other Operating Income | — | — | — | 64,424 | 64,424 | — | 64,424 | (H) | ||||||||||||||||||||
Intersegment Transfers | — | — | 1,538 | (1,538 | ) | — | — | — | ||||||||||||||||||||
Total Revenue and Other Operating Income | $ | 480,238 | $ | 98,653 | $ | 269,464 | $ | 350,382 | $ | 1,198,737 | $ | — | $ | 1,198,737 | ||||||||||||||
Earnings (Loss) From Continuing Operations Before Income Tax | $ | 56,116 | $ | (19,428 | ) | $ | 59,662 | $ | (680,687 | ) | $ | (584,337 | ) | $ | (346,220 | ) | $ | (930,557 | ) | |||||||||
Segment Assets | $ | 6,894,810 | $ | 4,035,092 | $ | 10,929,902 | (I) | |||||||||||||||||||||
Depreciation, Depletion and Amortization | $ | 371,783 | $ | — | $ | 371,783 | ||||||||||||||||||||||
Capital Expenditures | $ | 840,349 | $ | — | $ | 840,349 | ||||||||||||||||||||||
(G) | Included in Total Operating are sales of $131,299 to NJR Energy Services Company, which comprises over 10% of sales. |
(H) | Includes equity in earnings of unconsolidated affiliates of $54,897. |
(I) | Includes investments in unconsolidated equity affiliates of $237,330. |
111
Reconciliation of Segment Information to Consolidated Amounts:
Revenue and Other Operating Income:
For the Years Ended December 31, | ||||||||||||
2017 | 2016 | 2015 | ||||||||||
Total Segment Sales from External Customers | $ | 1,179,019 | $ | 836,504 | $ | 741,371 | ||||||
Gain (Loss) on Commodity Derivative Instruments | 206,930 | (141,021 | ) | 392,942 | ||||||||
Other Income | 69,182 | 64,485 | 64,424 | |||||||||
Total Consolidated Revenue and Other Operating Income | $ | 1,455,131 | $ | 759,968 | $ | 1,198,737 | ||||||
Earnings (Loss) From Continuing Operations Before Income Tax:
For the Years Ended December 31, | ||||||||||||
2017 | 2016 | 2015 | ||||||||||
Segment Income (Loss) Before Income Taxes for Reportable Business Segments | $ | 191,126 | $ | (307,797 | ) | $ | (584,337 | ) | ||||
Segment Loss Before Income Taxes for All Other Business Segments | (97,036 | ) | (109,626 | ) | (140,496 | ) | ||||||
Gain on Sale of Assets | 188,063 | 14,270 | 61,148 | |||||||||
Interest Expense | (161,443 | ) | (182,195 | ) | (199,121 | ) | ||||||
Loss on Debt Extinguishment | (2,129 | ) | — | (67,751 | ) | |||||||
Earnings (Loss) From Continuing Operations Before Income Tax | $ | 118,581 | $ | (585,348 | ) | $ | (930,557 | ) | ||||
Total Assets:
December 31, | ||||||||
2017 | 2016 | |||||||
Segment Assets for Total Reportable Business Segments | $ | 6,122,746 | $ | 6,238,156 | ||||
Segment Assets for All Other Business Segments | 268,569 | 283,917 | ||||||
Items Excluded from Segment Assets: | ||||||||
Cash and Other Investments | 509,075 | 46,216 | ||||||
Recoverable Income Taxes | 31,523 | 114,481 | ||||||
Discontinued Operations | — | 2,496,921 | ||||||
Total Consolidated Assets | $ | 6,931,913 | $ | 9,179,691 | ||||
112
NOTE 20—RELATED PARTY TRANSACTIONS
CNX Gathering LLC and CNX Midstream Partners LP
CNX Midstream Partners LP ("CNXM" or the "Partnership"), formerly known as CONE Midstream Partners LP (see Note 21 - Subsequent Event), is a master limited partnership formed in May 2014 by CNX Resources Corporation and Noble Energy, Inc., an unrelated third party, primarily to own, operate, develop and acquire natural gas gathering and other midstream energy assets to service their production in the Marcellus Shale in Pennsylvania and West Virginia. The Partnership's assets include natural gas gathering pipelines and compression and dehydration facilities, as well as condensate gathering, collection, separation and stabilization facilities. The Partnership's general partner is CNX Midstream GP LLC, formerly known as CONE Midstream GP LLC, a wholly owned subsidiary of CNX Gathering LLC (“CNX Gathering”), formerly known as CONE Gathering LLC. CNX Gathering, a Delaware limited liability company, is a joint venture formed by CNX and Noble Energy in September 2011.
At December 31, 2017, CNX accounted for its ownership interests in each of the Partnership and CNX Gathering under the equity method of accounting. CNX Gathering is a variable interest entity for which the Company has the ability to exert significant influence, but not control, over the operating and financing policies of. The Partnership is a variable interest entity for which CNX Gathering, through it's ownership and control of the Partnership's general partner, has the power to direct the activities that most significantly impact the Partnership's economic performance. In addition, through its general partner interest and incentive distribution rights in the Partnership, CNX Gathering has the obligation to absorb the Partnership's losses and the right to receive benefits from the Partnership in accordance with those interests. Therefore, CNX Gathering has a controlling financial interest in the Partnership, is the primary beneficiary of the Partnership and consolidates it accordingly. Rule 3-09 of Regulation S-X provides that if a 50%-or-less-owned person accounted for by the equity method meets the first or third condition of the significant subsidiary tests set forth in Rule 1-02(w) of Regulation S-X, substituting 20% for 10%, separate financial statements for that 50%-or-less-owned person shall be filed. The significance tests are calculated as of the end of each of the Partnership's fiscal years with respect to each fiscal year. Pursuant to Rule 3-09 CNX Gathering LLC has met the significant subsidiary test as of December 31, 2017 and 2016, and for the three years ended December 31, 2017, and therefore the required financial statements are included as an exhibit to this Annual Report on Form 10-K.
In November 2016, the Partnership acquired from CNX Gathering an additional 25% ownership interest in CNX Midstream DevCo I LP, formerly known as CONE Midstream Devco 1 LP, commonly referred to as the "Anchor Systems." The transaction included a total purchase consideration of $248,000, comprised of $140,000 in cash and issuance of approximately 2,600,000 common limited partnership units to each of CNX and Noble Energy. Following the acquisition, CNX Gathering continues to have a 2% general partner interest in the Partnership, while each Sponsor’s limited partner interest increased to 33.5%. At December 31, 2017, CNX continues to own a 50% membership interest in CNX Gathering, which owns a 95% noncontrolling interest in CNX Midstream Devco II LP and CNX Midstream Devco III LP.
In November 2017 the subordination period with respect to the Partnership’s subordinated units expired, and all of the 29,163,121 outstanding subordinated units, of which CNX owned half, automatically converted into common units on a one-for-one basis.
The following is a summary of the Company's Investment in Affiliates balances included within the Consolidated Balance Sheets associated with CNX Gathering and the Partnership, respectively:
CNX Gathering LLC | CNX Midstream Partners LP | Total | |||||||||
Balance at December 31, 2015 | $ | 202,570 | $ | 11,047 | $ | 213,617 | |||||
Equity in Earnings | 17,112 | 31,148 | 48,260 | ||||||||
Additional Contributions | 4,621 | — | 4,621 | ||||||||
Distribution of Earnings | (8,224 | ) | (19,066 | ) | (27,290 | ) | |||||
Funds Received on Dropdown Transaction | (70,000 | ) | — | (70,000 | ) | ||||||
Basis Differential | 4,996 | (4,996 | ) | — | |||||||
Balance at December 31, 2016 | $ | 151,075 | $ | 18,133 | $ | 169,208 | |||||
Equity in Earnings | 9,823 | 38,523 | 48,346 | ||||||||
Distribution of Earnings | (17,254 | ) | (24,929 | ) | (42,183 | ) | |||||
Asset Transfer | (2,527 | ) | 2,527 | — | |||||||
Balance at December 31, 2017 | $ | 141,117 | $ | 34,254 | $ | 175,371 | |||||
113
The following transactions were included within Other Income and Transportation, Gathering and Compression within the Consolidated Statements of Income:
For the Years Ended December 31, | |||||||||||
2017 | 2016 | 2015 | |||||||||
Other Income: | |||||||||||
Equity in Earnings of Affiliates - CNX Gathering | $ | 9,823 | $ | 17,112 | $ | 20,916 | |||||
Equity in Earnings of Affiliates - CNX Midstream Partners LP | $ | 38,523 | $ | 31,148 | $ | 22,883 | |||||
Transportation, Gathering and Compression: | |||||||||||
Gathering Services - CNX Gathering | $ | 914 | $ | 706 | $ | 1,077 | |||||
Gathering Services - CNX Midstream Partners LP | $ | 136,068 | $ | 122,256 | $ | 104,291 | |||||
At December 31, 2017 and 2016, CNX had a net payable of $9,982 and $5,815, respectively, due to both CNX Midstream Partners and CNX Gathering primarily for accrued but unpaid gathering services.
CONSOL Energy Inc.
In connection with the spin-off of its coal business, as discussed in Note 2 - Discontinued Operations, CNX and CONSOL Energy entered into several agreements that govern the relationship of the parties following the Distribution, including the following:
•Separation and Distribution Agreement;
•Transition Services Agreement;
•Tax Matters Agreement;
•Employee Matters Agreement;
•Intellectual Property Matters Agreement;
•CNX Resources Corporation to CONSOL Energy Inc. Trademark License Agreement;
•CONSOL Energy Inc. to CNX Resources Corporation Trademark License Agreement; and
•First Amendment to Amended and Restated Omnibus Agreement (“Omnibus Amendment”).
There were also one-time transaction costs related to the spin-off of approximately $40,545 for the year ended December 31, 2017, that will be split equally by the two companies per the Separation and Distribution agreement. These costs consisted of consulting and professional fees associated with preparing for and executing the spin-off, as well as other items that were included within total costs of discontinued operations.
As of December 31, 2017, CNX had a receivable from CONSOL Energy of $12,540 recorded in Total Current Assets on the Consolidated Balance Sheets. CNX also had recorded obligations to CONSOL Energy of $15,415, of which $4,500 was recorded in Total Current Liabilities and $10,915 was included in Total Deferred Credits and Other Liabilities on the Consolidated Balance Sheets at December 31, 2017. These items relate to the reimbursement of the one-time transaction costs as well as other reimbursements per the terms of the separation and distribution agreement.
All significant intercompany transactions between CNX and CONSOL Energy have been included in the Consolidated Financial Statements and are considered to have been effectively settled for cash at the time the transaction was recorded. The total net effect of these transactions between CNX and CONSOL Energy is reflected in the Consolidated Statements of Cash Flows as a financing activity. In the Consolidated Statements of Stockholders' Equity, the distribution of CONSOL Energy Inc. is the net of the variety of intercompany transactions including, but not limited too, collection of trade receivables, payment of trade payables and accrued liabilities, settlement of charges for allocated selling, general and administrative costs and payment of taxes by CNX on CONSOL Energy's behalf.
114
NOTE 21—SUBSEQUENT EVENTS
On January 3rd, 2018 CNX Resources Corporation closed on an agreement to purchase Noble Energy, Inc.'s 50% membership interest in CONE Gathering LLC for $305,000 in cash and the mutual release of all outstanding claims. [CNX Gathering holds all of the interests in CONE Midstream GP, LLC, which in turn holds the general partnership interest in CNXM] and all of the incentive distribution rights in CNXM. As a result of this transaction, CNX owns 100% of CNX Gathering, making CNXM a single-sponsor master limited partnership. In conjunction with the closing, CNXM changed its name from CONE Midstream Partners, LP. Beginning in the first quarter of 2018, CNX Gathering will be fully consolidated into the Company's financial statements.
Throughout the month of January 2018, CNX repurchased and canceled $384,707 aggregate principal amount of the Company's 5.875% senior notes due in April 2022. The weighted average repurchase price was 103.78%.
On February 7, 2018, CNX entered into a Purchase and Sale Agreement (the “Purchase Agreement”), with CNXM, CNX Gathering, CNX Midstream DevCo I LP, a Delaware limited partnership (“DevCo I LP”), CNX Midstream DevCo III LP, a Delaware limited partnership (“DevCo III LP”), and, for certain purposes, CNX Midstream DevCo I GP LLC, a Delaware limited liability company, CNX Midstream DevCo III GP LLC, a Delaware limited liability company, and CNX Midstream Operating Company LLC, a Delaware limited liability company.
CNX Gathering owns a 95% noncontrolling interest in DevCo III LP, which owns the gathering system and related assets commonly referred to as the Shirley-Penns System (the “Shirley-Penns System”), while CNXM owns the remaining 5% controlling interest in DevCo III LP. Pursuant to the terms of the Purchase Agreement, DevCo III LP will transfer its interest in the Shirley-Penns System on a pro rata basis to CNX Gathering and CNXM in accordance with each transferee’s respective ownership interest in DevCo III LP, and following such transfer, CNX Gathering will sell its aggregate interest in the Shirley-Penns System to DevCo I LP in exchange for cash consideration in the amount of $265,000 million (the “Acquisition”). CNXM expects to fund the Acquisition with cash on hand and through debt financing, subject to market conditions. The Acquisition is expected to close in the first quarter of 2018, subject to customary closing conditions (the “Closing”). Following the Closing, CNXM will own (through one or more intermediate entities) a 100% controlling interest in the Shirley-Penns System.
In addition, in connection with the Closing, CNXM expects to amend its gathering agreement with CNX Gas Company, to require CNX Gas to make a minimum volume commitment for the Shirley-Penns System for the period from January 1, 2018 through December 31, 2031 and to establish certain gathering fees, deficiency payments and excess delivery credits related thereto.
The foregoing description of the Purchase Agreement is not complete and is qualified in its entirety by reference to the full text of the Purchase Agreement, which is filed as Exhibit 10.75 to this Annual Report on Form 10-K and incorporated herein by reference.
Supplemental Gas Data (unaudited):
The following information was prepared in accordance with the FASB's Accounting Standards Update No. 2010-03, “Extractive Activities-Oil and Gas (Topic 932).”
Capitalized Costs:
As of December 31, | ||||||||
2017 | 2016 | |||||||
Intangible drilling costs | 3,849,689 | 3,583,599 | ||||||
Proved gas properties | 1,999,891 | 2,016,916 | ||||||
Gas gathering assets | 1,182,234 | 1,138,299 | ||||||
Unproved gas properties | 919,733 | 1,116,282 | ||||||
Gas wells and related equipment | 834,120 | 800,617 | ||||||
Gas well plugging | 181,038 | 176,961 | ||||||
Total Property, Plant and Equipment | $ | 8,966,705 | $ | 8,832,674 | ||||
Accumulated Depreciation, Depletion and Amortization | (3,408,606 | ) | (3,099,751 | ) | ||||
Net Capitalized Costs | $ | 5,558,099 | $ | 5,732,923 | ||||
115
Costs incurred for property acquisition, exploration and development (*):
For the Years Ended December 31, | ||||||||||||
2017 | 2016 | 2015 | ||||||||||
Property acquisitions | ||||||||||||
Proved properties | $ | 15,850 | $ | — | $ | — | ||||||
Unproved properties | 32,038 | 1,537 | 76,676 | |||||||||
Development | 544,809 | 138,813 | 666,315 | |||||||||
Exploration | 48,020 | 32,259 | 95,371 | |||||||||
Total | $ | 640,717 | $ | 172,609 | $ | 838,362 | ||||||
__________
(*) | Includes costs incurred whether capitalized or expensed. |
Results of Operations for Producing Activities:
For the Years Ended December 31, | ||||||||||||
2017 | 2016 | 2015 | ||||||||||
Natural Gas, NGLs and Oil Sales | $ | 1,125,224 | $ | 793,248 | $ | 726,921 | ||||||
Gain (Loss) on Commodity Derivative Instruments | 206,930 | (141,021 | ) | 392,942 | ||||||||
Purchased Gas Sales | 53,795 | 43,256 | 14,450 | |||||||||
Total Revenue | 1,385,949 | 695,483 | 1,134,313 | |||||||||
Lease Operating Expense | 88,932 | 96,434 | 121,847 | |||||||||
Production, Ad Valorem, and Other Fees | 29,267 | 31,049 | 30,438 | |||||||||
Transportation, Gathering and Compression | 382,865 | 374,350 | 343,403 | |||||||||
Purchased Gas Costs | 52,597 | 42,717 | 10,721 | |||||||||
Impairment of Exploration and Production Properties | 137,865 | — | 828,905 | |||||||||
Exploration Costs | 48,074 | 14,522 | 10,119 | |||||||||
DD&A | 412,036 | 419,939 | 371,783 | |||||||||
Total Costs | 1,151,636 | 979,011 | 1,717,216 | |||||||||
Pre-tax Operating Income / (Loss) | 234,313 | (283,528 | ) | (582,903 | ) | |||||||
Income Tax Benefit | (348,676 | ) | (69,929 | ) | (251,490 | ) | ||||||
Results of Operations for Producing Activities excluding Corporate and Interest Costs | $ | 582,989 | $ | (213,599 | ) | $ | (331,413 | ) | ||||
The following is production, average sales price and average production costs, excluding ad valorem and severance taxes, per unit of production:
116
For the Years Ended December 31, | ||||||||||||
2017 | 2016 | 2015 | ||||||||||
Production (MMcfe) | 407,166 | 394,387 | 328,657 | |||||||||
Total average sales price before effects of financial settlements (per Mcfe) | $ | 2.76 | $ | 2.01 | $ | 2.22 | ||||||
Average effects of financial settlements (per Mcfe) | $ | (0.10 | ) | $ | 0.62 | $ | 0.59 | |||||
Total average sales price including effects of financial settlements (per Mcfe) | $ | 2.66 | $ | 2.63 | $ | 2.81 | ||||||
Average lifting costs, excluding ad valorem and severance taxes (per Mcfe) | $ | 0.22 | $ | 0.24 | $ | 0.37 | ||||||
During the years ended December 31, 2017, 2016 and 2015, the Company drilled 90.0, 36.0, and 132.8 net development wells, respectively. There were no net dry development wells in 2017, 2016, or 2015.
During the year ended December 31, 2017, the Company drilled 4.0 net exploratory wells. During the years ended December 31, 2016 and 2015, we drilled 0.0 and 2.5 net exploratory wells, respectively. There were no net dry exploratory wells in 2017, 2016, or 2015.
At December 31, 2017, there were 3.9 net development wells and 1.8 exploratory wells that are drilled but uncompleted. Additionally there are 13.0 net developmental wells that have been completed and are awaiting final tie-in to production.
CNX is committed to provide 712.3 Bcf of gas under existing sales contracts or agreements over the course of the next four years. The Company expects to produce sufficient quantities from existing proved developed reserves to satisfy these commitments.
Most of the Company's development wells and proved acreage are located in Virginia, West Virginia, Ohio and Pennsylvania. Some leases are beyond their primary term, but these leases are extended in accordance with their terms as long as certain drilling commitments or other term commitments are satisfied. The following table sets forth, at December 31, 2017, the number of producing wells, developed acreage and undeveloped acreage:
Gross | Net(1) | |||||
Producing Gas Wells (including gob wells) | 17,013 | 12,853 | ||||
Producing Oil Wells | 171 | 12 | ||||
Acreage Position: | ||||||
Proved Developed Acreage | 551,900 | 543,937 | ||||
Proved Undeveloped Acreage | 41,066 | 40,703 | ||||
Unproved Acreage | 4,434,714 | 3,817,015 | ||||
Total Acreage | 5,027,680 | 4,401,655 | ||||
____________
(1) | Net acres include acreage attributable to the Company's working interests of the properties. Additional adjustments (either increases or decreases) may be required as the Company further develops title to and further confirms its rights with respect to its various properties in anticipation of development. The Company believes that its assumptions and methodology in this regard are reasonable. |
Proved Oil and Gas Reserves Quantities:
Annually, the preparation of natural gas reserves estimates are completed in accordance with CNX prescribed internal control procedures, which include verification of input data into a gas reserves forecasting and economic evaluation software, as well as
117
multi-functional management review. The input data verification includes reviews of the price and cost assumptions used in the economic model to determine the reserves. Also, the production volumes are reconciled between the system used to calculate the reserves and other accounting/measurement systems. The technical employee responsible for overseeing the preparation of the reserve estimates is a petroleum engineer with over 10 years of experience in the oil and gas industry. The Company's 2017 gas reserves results, which are reported in the Supplemental Gas Data year ended December 31, 2017 Form 10-K, were audited by Netherland, Sewell & Associates, Inc. The technical person primarily responsible for overseeing the audit of the Company's reserves is a registered professional engineer in the state of Texas with over 15 years of experience in the oil and gas industry. The gas reserves estimates are as follows:
Condensate | Consolidated | |||||||||||
Natural Gas | NGLs | & Crude Oil | Operations | |||||||||
(MMcf) | (Mbbls) | (Mbbls) | (MMcfe) | |||||||||
Balance December 31, 2014 (a) | 6,317,600 | 77,790 | 7,213 | 6,827,616 | ||||||||
Revisions (b) | 1,055,225 | 45,711 | 6,569 | 1,368,909 | ||||||||
Price Changes | (2,866,123 | ) | (45,675 | ) | (3,208 | ) | (3,159,421 | ) | ||||
Extensions and Discoveries (c) | 840,800 | 13,916 | 1,707 | 934,542 | ||||||||
Production | (287,287 | ) | (5,530 | ) | (1,365 | ) | (328,657 | ) | ||||
Balance December 31, 2015 (a) | 5,060,215 | 86,212 | 10,916 | 5,642,989 | ||||||||
Revisions (d) | 11,559 | (19,078 | ) | 510 | (99,849 | ) | ||||||
Price Changes | (179,914 | ) | (1,647 | ) | (34 | ) | (190,009 | ) | ||||
Extensions and Discoveries (e) | 643,688 | 10,960 | 1,783 | 720,146 | ||||||||
Production | (348,753 | ) | (6,710 | ) | (896 | ) | (394,387 | ) | ||||
Purchases of Reserves In-Place (f) | 1,352,759 | 13,177 | 1,970 | 1,443,642 | ||||||||
Sales of Reserves In-Place (f) | (711,155 | ) | (22,382 | ) | (4,240 | ) | (870,884 | ) | ||||
Balance December 31, 2016 (a) | 5,828,399 | 60,532 | 10,009 | 6,251,648 | ||||||||
Revisions (g) | (202,735 | ) | 1,162 | (5,834 | ) | (232,321 | ) | |||||
Price Changes | 173,738 | 1,188 | (159 | ) | 181,470 | |||||||
Extensions and Discoveries (e) | 1,769,029 | 17,887 | 1,800 | 1,887,153 | ||||||||
Production | (364,893 | ) | (6,456 | ) | (589 | ) | (407,166 | ) | ||||
Sales of Reserves In-Place | (81,780 | ) | (2,622 | ) | (277 | ) | (99,172 | ) | ||||
Balance December 31, 2017 (a) | 7,121,758 | 71,691 | 4,950 | 7,581,612 | ||||||||
Proved developed resources: | ||||||||||||
December 31, 2015 | 3,310,894 | 59,196 | 5,180 | 3,697,152 | ||||||||
December 31, 2016 | 3,478,464 | 30,666 | 3,474 | 3,683,302 | ||||||||
December 31, 2017 | 4,051,526 | 56,022 | 3,567 | 4,409,065 | ||||||||
Proved undeveloped resources: | ||||||||||||
December 31, 2015 | 1,749,320 | 27,016 | 5,736 | 1,945,837 | ||||||||
December 31, 2016 | 2,349,934 | 29,866 | 6,536 | 2,568,346 | ||||||||
December 31, 2017 | 3,070,232 | 15,669 | 1,383 | 3,172,547 | ||||||||
__________
(a) | Proved developed and proved undeveloped gas reserves are defined by SEC Rule 4.10(a) of Regulation S-X. Generally, these reserves would be commercially recovered under current economic conditions, operating methods and government regulations. CNX cautions that there are many inherent uncertainties in estimating proved reserve quantities, projecting future production rates and timing of development expenditures. Proved oil and gas reserves are estimated quantities of natural gas which geological and engineering data demonstrate with reasonable certainty to be recoverable in future years from known reservoirs under existing economic and operating conditions and government regulations. Proved developed reserves are reserves expected to be recovered through existing wells, with existing equipment and operating methods. |
(b) | The upward revisions in 2015 of 1,369 Bcfe were due to 611 Bcfe increase in both performance and operating cost reductions for developed properties, a 1,200 Bcfe increase for undeveloped properties due to operating cost reductions and expected increases in well performance. These upward revisions in 2015 were offset by a 442 Bcfe downward revision for undeveloped properties that were removed from our operational plans due to "high-grading" and selecting our highest rate of return properties for future development. |
118
(c) | Extensions and Discoveries in 2015 are due mainly to the high grading of locations which resulted in the addition of wells on the Company's Marcellus and Utica Shale acreage more than one offset location away with continued use of reliable technology. |
(d) | The net downward revision of 99.8 Bcfe was the result of 255 Bcfe downward revision for wells that were removed from both internal and JV partner development plans, 113 Bcfe downward revision related to economics for producing properties offset by 268 Bcfe of improved analog performance. |
(e) | Extensions and Discoveries in 2016 and 2017 are due to the addition of wells on the Company's Marcellus and Utica Shale acreage more than one offset location away with continued use of reliable technology. |
(f) | Purchases and Sales of Reserves In-Place in 2016 is the result of the Company's fourth quarter realignment of the Marcellus Shale properties as part of dissolving our joint venture with Noble Energy. |
(g) | The downward revisions for 2017 is due to corporate planning changes by our JV partner in Ohio Utica which resulted in all PUD's being removed, causing a 458 Bcfe downward revision, offset, in part by improved well performance due to the enhanced RCS completions and improved operating costs. |
For the Year | |||
Ended | |||
December 31, | |||
2017 | |||
Proved Undeveloped Reserves (MMcfe) | |||
Beginning proved undeveloped reserves | 2,568,346 | ||
Undeveloped reserves transferred to developed(a) | (735,076 | ) | |
Price Revisions | 5,066 | ||
Revisions Due to Plan Changes (b) | (472,118 | ) | |
Revisions Due to Changes Due to Well Performance (b) | 107,421 | ||
Extension and discoveries (c) | 1,698,908 | ||
Ending proved undeveloped reserves(d) | 3,172,547 | ||
_________
(a) | During 2017, various exploration and development drilling and evaluations were completed. Approximately, $247,459 of capital was spent in the year ended December 31, 2017 related to undeveloped reserves that were transferred to developed. |
(b) The downward revisions for 2017 is due to corporate planning changes by our JV partner in Ohio Utica which resulted in PUD's being removed.
(c) | Extensions and discoveries are due mainly to the addition of wells on our Marcellus and Utica Shale acreage more than one offset location away with continued use of reliable technology. |
(d) | Included in proved undeveloped reserves at December 31, 2017 are approximately 301,063 MMcfe of reserves that have been reported for more than five years. These reserves specifically relate to GOB (a rubble zone formed in the cavity created by the extraction of coal) production due to a complex fracture being generated in the overburden strata above the mined seam. Mining operations take a significant amount of time and our GOB forecasts are consistent with the future plans of the Buchanan Mine that was sold in March 2016 to Coronado IV LLC (See Note 2 - Discontinued Operations for more information) with the rights to this gas being retained by the Company. Evidence also exists that supports the continual operation of the mine beyond the current plan, unless there was an extreme circumstance resulting from an external factor. These reasons constitute the specific circumstances that exist to continue recognizing these reserves for CNX. |
At December 31, 2017 there were no wells pending the determination of proved reserves.
The following table represents the capitalized exploratory well cost activity as indicated:
December 31, | ||||||||||||
2017 | 2016 | 2015 | ||||||||||
Costs reclassified to wells, equipment and facilities based on the determination of proved reserves | $ | 40,149 | $ | 40,917 | $ | 17,179 | ||||||
Costs expensed due to determination of dry hole or abandonment of project | $ | — | $ | — | $ | — | ||||||
CNX proved natural gas reserves are located in the United States.
119
Standardized Measure of Discounted Future Net Cash Flows:
The following information has been prepared in accordance with the provisions of the Financial Accounting Standards Board's Accounting Standards Update No. 2010-03, “Extractive Activities-Oil and Gas (Topic 932).” This topic requires the standardized measure of discounted future net cash flows to be based on the average, first-day-of-the-month price for the year. Because prices used in the calculation are average prices for that year, the standardized measure could vary significantly from year to year based on the market conditions that occurred.
The projections should not be viewed as realistic estimates of future cash flows, nor should the “standardized measure” be interpreted as representing current value to CNX. Material revisions to estimates of proved reserves may occur in the future; development and production of the reserves may not occur in the periods assumed; actual prices realized are expected to vary significantly from those used; and actual costs may vary. CNX investment and operating decisions are not based on the information presented, but on a wide range of reserve estimates that include probable as well as proved reserves and on different price and cost assumptions.
The standardized measure is intended to provide a better means for comparing the value of CNX proved reserves at a given time with those of other gas producing companies than is provided by a comparison of raw proved reserve quantities.
December 31, | ||||||||||||
2017 | 2016 | 2015 | ||||||||||
Future Cash Flows (a) | ||||||||||||
Revenues | $ | 19,261,578 | $ | 11,303,409 | $ | 11,837,732 | ||||||
Production costs | (7,234,303 | ) | (5,850,941 | ) | (6,584,947 | ) | ||||||
Development costs | (1,710,585 | ) | (1,550,294 | ) | (1,220,010 | ) | ||||||
Income tax expense | (2,475,981 | ) | (1,482,826 | ) | (1,532,454 | ) | ||||||
Future Net Cash Flows | 7,840,709 | 2,419,348 | 2,500,321 | |||||||||
Discounted to present value at a 10% annual rate | (4,709,311 | ) | (1,464,231 | ) | (1,481,017 | ) | ||||||
Total standardized measure of discounted net cash flows | $ | 3,131,398 | $ | 955,117 | $ | 1,019,304 | ||||||
(a) | For 2017, the reserves were computed using unweighted arithmetic averages of the closing prices on the first day of each month during 2017, adjusted for energy content and a regional price differential. For 2017, this adjusted natural gas price was $2.44 per mcf, the adjusted oil price was $38.65 per barrel and the adjusted NGL price was $23.61 per barrel. |
For 2016, the reserves were computed using unweighted arithmetic averages of the closing prices on the first day of each month during 2016, adjusted for energy content and a regional price differential. For 2016, this adjusted natural gas price was $1.73 per mcf, the adjusted oil price was $25.04 per barrel and the adjusted NGL price was $15.77 per barrel.
For 2015, the reserves were computed using unweighted arithmetic averages of the closing prices on the first day of each month during 2015, adjusted for energy content and a regional price differential. For 2015, this adjusted natural gas price was $2.02 per mcf, the adjusted oil price was $25.29 per barrel and the adjusted NGL price was $15.59 per barrel.
120
The following are the principal sources of change in the standardized measure of discounted future net cash flows for consolidated operations during:
December 31, | ||||||||||||
2017 | 2016 | 2015 | ||||||||||
Balance at beginning of period | $ | 955,117 | $ | 1,019,304 | $ | 2,984,158 | ||||||
Net changes in sales prices and production costs | 1,983,475 | (172,812 | ) | (4,151,684 | ) | |||||||
Sales net of production costs | (831,131 | ) | (150,819 | ) | (589,533 | ) | ||||||
Net change due to revisions in quantity estimates | (145,496 | ) | (35,502 | ) | 408,006 | |||||||
Net change due to extensions, discoveries and improved recovery | 588,574 | (54,628 | ) | 157,016 | ||||||||
Development costs incurred during the period | 544,809 | 138,813 | 666,315 | |||||||||
Difference in previously estimated development costs compared to actual costs incurred during the period | (129,427 | ) | (39,821 | ) | 8,911 | |||||||
Purchase of Reserves In-Place | — | 238,819 | — | |||||||||
Sales of Reserves In-Place | (55,277 | ) | (137,998 | ) | — | |||||||
Changes in estimated future development costs | (233,017 | ) | (158,000 | ) | 374,982 | |||||||
Net change in future income taxes | (404,582 | ) | 36,513 | 1,259,744 | ||||||||
Timing and Other | 712,764 | 125,529 | (354,778 | ) | ||||||||
Accretion | 145,589 | 145,719 | 256,167 | |||||||||
Total discounted cash flow at end of period | $ | 3,131,398 | $ | 955,117 | $ | 1,019,304 | ||||||
Supplemental Quarterly Information (unaudited):
(Dollars in thousands, except per share data)
Three Months Ended | ||||||||||||||||
March 31, | June 30, | September 30, | December 31, | |||||||||||||
2017 | 2017 | 2017 | 2017 | |||||||||||||
Sales (A) | $ | 304,278 | $ | 354,409 | $ | 267,009 | $ | 460,253 | ||||||||
Costs and Expenses (B) | $ | 162,148 | $ | 166,330 | $ | 171,606 | $ | 214,020 | ||||||||
(Loss) Income from Continuing Operations (C) | $ | (75,234 | ) | $ | 122,384 | $ | (34,254 | ) | $ | 282,143 | ||||||
Income (Loss) from Discontinued Operations | $ | 36,268 | $ | 47,126 | $ | 7,813 | $ | (5,499 | ) | |||||||
Net (Loss) Income | $ | (38,966 | ) | $ | 169,510 | $ | (26,441 | ) | $ | 276,644 | ||||||
Earnings Per Share | ||||||||||||||||
Basic: | ||||||||||||||||
(Loss) Income from Continuing Operations | $ | (0.33 | ) | $ | 0.53 | $ | (0.15 | ) | $ | 1.24 | ||||||
Income (Loss) from Discontinued Operations | $ | 0.16 | $ | 0.21 | $ | 0.04 | $ | (0.04 | ) | |||||||
Net (Loss) Income | $ | (0.17 | ) | $ | 0.74 | $ | (0.11 | ) | $ | 1.20 | ||||||
Dilutive: | ||||||||||||||||
(Loss) Income from Continuing Operations | $ | (0.33 | ) | $ | 0.53 | $ | (0.15 | ) | $ | 1.23 | ||||||
Income (Loss) from Discontinued Operations | $ | 0.16 | $ | 0.20 | $ | 0.04 | $ | (0.03 | ) | |||||||
Net (Loss) Income | $ | (0.17 | ) | $ | 0.73 | $ | (0.11 | ) | $ | 1.20 | ||||||
121
Three Months Ended | ||||||||||||||||
March 31, | June 30, | September 30, | December 31, | |||||||||||||
2016 | 2016 | 2016 | 2016 | |||||||||||||
Sales (A) | $ | 244,935 | $ | (23,518 | ) | $ | 416,192 | $ | 57,874 | |||||||
Costs and Expenses (B) | $ | 162,910 | $ | 153,971 | $ | 160,811 | $ | 170,134 | ||||||||
(Loss) Income from Continuing Operations | $ | (50,219 | ) | $ | (256,535 | ) | $ | 56,264 | $ | (300,455 | ) | |||||
Loss from Discontinued Operations | $ | (47,353 | ) | $ | (213,293 | ) | $ | (30,919 | ) | $ | (5,592 | ) | ||||
Net (Loss) Income | $ | (97,572 | ) | $ | (469,828 | ) | $ | 25,345 | $ | (306,047 | ) | |||||
Earnings Per Share | ||||||||||||||||
Basic: | ||||||||||||||||
(Loss) Income from Continuing Operations | $ | (0.22 | ) | $ | (1.12 | ) | $ | 0.25 | $ | (1.31 | ) | |||||
Loss from Discontinued Operations | $ | (0.21 | ) | $ | (0.93 | ) | $ | (0.14 | ) | $ | (0.02 | ) | ||||
Net (Loss) Income | $ | (0.43 | ) | $ | (2.05 | ) | $ | 0.11 | $ | (1.33 | ) | |||||
Dilutive: | ||||||||||||||||
(Loss) Income from Continuing Operations | $ | (0.22 | ) | $ | (1.12 | ) | $ | 0.24 | $ | (1.30 | ) | |||||
Loss from Discontinued Operations | $ | (0.21 | ) | $ | (0.93 | ) | $ | (0.13 | ) | $ | (0.03 | ) | ||||
Net (Loss) Income | $ | (0.43 | ) | $ | (2.05 | ) | $ | 0.11 | $ | (1.33 | ) | |||||
(A) Includes natural gas, NGLs, and oil sales; gain (loss) on commodity derivative instruments; and purchased gas sales.
(B) Includes exploration and production costs and other operating expense; excludes DD&A, selling, general and administrative, loss on debt extinguishment, interest expense and other expense.
(C) Includes an impairment of $137,865 that was recorded during the three months ended March 31, 2017 related to CNX's exploration and production properties. See Note 1 - Significant Accounting Policies in Item 8 of this Form 10-K for additional information.
122
ITEM 9. | CHANGES IN AND DISAGREEMENTS WITH ACCOUNTANTS ON ACCOUNTING AND FINANCIAL DISCLOSURES |
None.
ITEM 9A. | CONTROLS AND PROCEDURES |
Disclosure controls and procedures. CNX, under the supervision and with the participation of its management, including CNX’s principal executive officer and principal financial officer, evaluated the effectiveness of the Company’s “disclosure controls and procedures,” as such term is defined in Rule 13a-15(e) under the Securities Act of 1934, as amended (the “Exchange Act”), as of the end of the period covered by this Annual Report on Form 10-K. Based on that evaluation, CNX’s principal executive officer and principal financial officer have concluded that the Company’s disclosure controls and procedures are effective as of December 31, 2017 to ensure that information required to be disclosed by CNX in reports that it files or submits under the Exchange Act is recorded, processed, summarized and reported within the time periods specified in Securities and Exchange Commission rules and forms, and includes controls and procedures designed to ensure that information required to be disclosed by CNX in such reports is accumulated and communicated to CNX’s management, including CNX’s principal executive officer and principal financial officer, as appropriate, to allow timely decisions regarding required disclosure.
Management's Annual Report on Internal Control Over Financial Reporting. CNX's management is responsible for establishing and maintaining adequate internal control over financial reporting. CNX's internal control over financial reporting is a process designed to provide reasonable assurance regarding the reliability of financial reporting and the preparation of financial statements for external purposes in accordance with generally accepted accounting principles.
CNX's internal control over financial reporting includes policies and procedures that (1) pertain to the maintenance of records that, in reasonable detail, accurately and fairly reflect transactions and dispositions of assets; (2) provide reasonable assurances that transactions are recorded as necessary to permit preparation of financial statements in accordance with generally accepted accounting principles, and that receipts and expenditures are being made only in accordance with authorizations of management and the directors of CNX; and (3) provide reasonable assurance regarding prevention or timely detection of unauthorized acquisition, use or disposition of CNX's assets that could have a material effect on our financial statements.
Because of its inherent limitations, internal control over financial reporting may not prevent or detect misstatements. Also, projections of any evaluation of effectiveness to future periods are subject to the risk that controls may become inadequate because of changes in conditions, or that the degree of compliance with the policies or procedures may deteriorate.
Management assessed the effectiveness of CNX's internal control over financial reporting as of December 31, 2017. In making this assessment, management used the criteria set forth by the Committee of Sponsoring Organizations of the Treadway Commission (2013 framework) (COSO) in Internal Control-Integrated Framework. Based on managements assessment and those criteria, management has concluded that CNX maintained effective internal control over financial reporting as of December 31, 2017.
The effectiveness of CNX's internal control over financial reporting as of December 31, 2017 has been audited by Ernst & Young, LLP, an independent registered public accounting firm, as stated in their report set forth in the Report of Independent Registered Public Accounting Firm in Part II, Item 9A of this Annual Report on Form 10-K.
Changes in internal controls over financial reporting. There were no changes in the Company's internal controls over financial reporting that occurred during the fourth quarter of the fiscal year covered by this Annual Report on Form 10-K that have materially affected, or are reasonably likely to materially affect, the Company’s internal control over financial reporting.
123
Report of Independent Registered Public Accounting Firm
To the Stockholders and the Board of Directors of CNX Resources Corporation and Subsidiaries
Opinion on Internal Control over Financial Reporting
We have audited CNX Resources Corporation and Subsidiaries’ internal control over financial reporting as of December 31, 2017, based on criteria established in Internal Control-Integrated Framework issued by the Committee of Sponsoring Organizations of the Treadway Commission (2013 framework) (the COSO criteria). In our opinion, CNX Resources Corporation and Subsidiaries (the Company) maintained, in all material respects, effective internal control over financial reporting as of December 31, 2017, based on the COSO criteria.
We also have audited, in accordance with the standards of the Public Company Accounting Oversight Board (United States) (PCAOB), the consolidated balance sheets of CNX Resources Corporation and Subsidiaries as of December 31, 2017 and 2016, and the related consolidated statements of income, comprehensive income, stockholders' equity and cash flows for each of the three years in the period ended December 31, 2017 of the Company and our report dated February 7, 2018 expressed an unqualified opinion thereon.
Basis for Opinion
The Company’s management is responsible for maintaining effective internal control over financial reporting and for its assessment of the effectiveness of internal control over financial reporting included in the accompanying Management’s Annual Report on Internal Control Over Financial Reporting. Our responsibility is to express an opinion on the Company’s internal control over financial reporting based on our audit. We are a public accounting firm registered with the PCAOB and are required to be independent with respect to the Company in accordance with the U.S. federal securities laws and the applicable rules and regulations of the Securities and Exchange Commission and the PCAOB.
We conducted our audit in accordance with the standards of the PCAOB. Those standards require that we plan and perform the audit to obtain reasonable assurance about whether effective internal control over financial reporting was maintained in all material respects.
Our audit included obtaining an understanding of internal control over financial reporting, assessing the risk that a material weakness exists, testing and evaluating the design and operating effectiveness of internal control based on the assessed risk, and performing such other procedures as we considered necessary in the circumstances. We believe that our audit provides a reasonable basis for our opinion.
Definition and Limitations of Internal Control Over Financial Reporting
A company’s internal control over financial reporting is a process designed to provide reasonable assurance regarding the reliability of financial reporting and the preparation of financial statements for external purposes in accordance with generally accepted accounting principles. A company’s internal control over financial reporting includes those policies and procedures that (1) pertain to the maintenance of records that, in reasonable detail, accurately and fairly reflect the transactions and dispositions of the assets of the company; (2) provide reasonable assurance that transactions are recorded as necessary to permit preparation of financial statements in accordance with generally accepted accounting principles, and that receipts and expenditures of the company are being made only in accordance with authorizations of management and directors of the company; and (3) provide reasonable assurance regarding prevention or timely detection of unauthorized acquisition, use, or disposition of the company’s assets that could have a material effect on the financial statements.
Because of its inherent limitations, internal control over financial reporting may not prevent or detect misstatements. Also, projections of any evaluation of effectiveness to future periods are subject to the risk that controls may become inadequate because of changes in conditions, or that the degree of compliance with the policies or procedures may deteriorate.
/s/ Ernst & Young LLP
Pittsburgh, Pennsylvania
February 7, 2018
124
ITEM 9B. | OTHER INFORMATION |
NONE
PART III
ITEM 10. | DIRECTORS, EXECUTIVE OFFICERS AND CORPORATE GOVERNANCE |
The information required by this Item is incorporated herein by reference from the information under the captions “PROPOSAL NO. 1-ELECTION OF DIRECTORS-Biographies of Nominees,” “BOARD OF DIRECTORS AND COMPENSATION INFORMATION and “SECTION 16(a) BENEFICIAL OWNERSHIP REPORTING COMPLIANCE” in the Proxy Statement for the annual meeting of shareholders to be held on May 9, 2018 (the “Proxy Statement”).
Executive Officers of CNX
The following is a list, as of February 1, 2018, of CNX executive officers, their ages and their positions and offices held with CNX.
Name | Age | Position | ||
Nicholas J. DeIuliis | 49 | President and Chief Executive Officer | ||
Stephen W. Johnson | 59 | Executive Vice President - Chief Administrative Officer | ||
Donald W. Rush | 35 | Executive Vice President and Chief Financial Officer | ||
Timothy C. Dugan | 56 | Executive Vice President and Chief Operating Officer - Exploration and Production | ||
Nicholas J. DeIuliis is a Director and the President and Chief Executive Officer of CNX Resources Corporation. Prior to the separation of CONSOL Energy Inc. into two separate companies, Mr. DeIuliis had more than 25 years of experience with the Company and in that time has held the positions of Chief Executive Officer since May 7, 2015, President since February 23, 2011, and previously served as the Chief Operating Officer, Senior Vice President - Strategic Planning, and earlier in his career various engineering positions. On January 3, 2018, Mr. DeIuliis was appointed Chairman of the Board and Chief Executive Officer of the general partner of CNX Midstream Partners LP (formerly known as CONE Midstream Partners, LP). He was a Director, President and Chief Executive Officer of CNX Gas Corporation from its creation in 2005 through 2009. Mr. DeIuliis was a Director and Chairman of the Board of the general partner of CONSOL Coal Resources LP (formerly known as CNX Coal Resources LP) from March 16, 2015 until November 28, 2017. Mr. DeIuliis is a member of the Board of Directors of the University of Pittsburgh Cancer Institute, the Center for Responsible Shale Development and the Allegheny Conference on Community Development. Mr. DeIuliis is a registered engineer in the Commonwealth of Pennsylvania and a member of the Pennsylvania bar.
Stephen W. Johnson has served as the Executive Vice President and Chief Administrative Officer of CNX Resources Corporation since April 13, 2015. Mr. Johnson held the same position at the formerly named CONSOL Energy Inc. prior to its separation into two separate companies. Before being appointed to his current position, Mr. Johnson served as Executive Vice President - Diversified Business Units and Chief Legal and Corporate Affairs Officer, and as Senior Vice President and General Counsel of both CONSOL Energy and CNX Gas Corporation. On May 30, 2014, Mr. Johnson became a Director of the general partner of CNX Midstream Partners LP (formerly known as CONE Midstream Partners LP). Mr. Johnson was a Director of the general partner of CONSOL Coal Resources LP (formerly known as CNX Coal Resources LP) from March 16, 2015 until November 28, 2017. Mr. Johnson has spent numerous years in the natural resources industry, including 12 years with CNX Resources Corporation, CONSOL Energy Inc. and CNX Gas Corporation and a number of years prior to that representing natural resources companies in private legal practice. Mr. Johnson is the Chairman of the Board of Concordia Lutheran Ministries, a nonprofit continuing care retirement community, and the former Chairman of NEED, a nonprofit minority college access program.
Donald W. Rush has served as the Executive Vice President and Chief Financial Officer of CNX Resources Corporation since July 11, 2017. Mr. Rush held the same position at the formerly named CONSOL Energy Inc. prior to its separation into two separate companies. He previously served as Vice President of Energy Marketing where he oversaw the Company's commercial functions, including mergers and acquisitions, gas marketing and transportation, in addition to holding other strategy and planning, business development and engineering positions during his 12 years with the Company. He successfully guided the Company through every significant transaction during its transition into a pure play natural gas exploration and production company, including the sale of the Company's five West Virginia coal mines in 2013 and the separation of the Company’s Marcellus Shale joint venture with Noble Energy Inc. in 2016. On January 3, 2018, Mr. Rush was appointed as a Director named Chief Financial Officer of the
125
general partner of CNX Midstream Partners LP (formerly known as CONE Midstream Partners, LP). Mr. Rush holds a B.S in civil engineering from the University of Pittsburgh and an M.B.A from Carnegie Mellon University’s Tepper School of Business.
Timothy C. Dugan has served as an Executive Vice President since September 20, 2016, and Chief Operating Officer of CNX Resources Corporation since January 28, 2014. Mr. Dugan held the same position at the formerly named CONSOL Energy Inc. prior to its separation into two separate companies. Before being appointed to his current position, he was President and Chief Operating Officer of CNX Gas Corporation from May 2014 to December 2014 when he became President and Chief Executive Officer. In January 2018, Mr. Dugan was appointed Director and named Chief Operating Officer of the general partner of CNX Midstream Partners LP (formerly known as CONE Midstream Partners, LP) on January 3, 2018, and January 12, 2018, respectively. Prior to joining CNX, Mr. Dugan was Vice President - Appalachia South Business Unit at Chesapeake Energy Corporation, a [include simple business description for Chesapeake]. During his seven years with Chesapeake Energy, he held several titles, including Senior Asset Manager and District Manager. Mr. Dugan began his petroleum and natural gas engineering career in 1984 with Cabot Oil & Gas Corporation as a General Foreman and Field Consultant, and he held other industry related positions with progressing responsibility at various oil and gas companies. Mr. Dugan is a member of the Society of Petroleum Engineers.
CNX has a written Code of Business Conduct that applies to CNX's Chief Executive Officer (Principal Executive Officer), Chief Financial Officer (Principal Financial Officer) and others. The Code of Business Conduct is available on CNX's website at www.cnx.com. Any amendments to, or waivers from, a provision of our code of employee business conduct and ethics that applies to our principal executive officer, our principal financial and accounting officer and that relates to any element of the code of ethics enumerated in paragraph (b) of Item 406 of Regulation S-K shall be disclosed by posting such information on our website at www.cnx.com.
By certification dated June 6, 2017, CNX's Chief Executive Officer certified to the New York Stock Exchange (NYSE) that he was not aware of any violation by the Company of the NYSE corporate governance listing standards. In addition, the required Sarbanes-Oxley Act, Section 302 certifications regarding the quality of our public disclosures were filed by CONSOL Energy as exhibits to this Form 10-K.
ITEM 11. | EXECUTIVE COMPENSATION |
The information required by this Item is incorporated by reference from the information under the captions “BOARD OF DIRECTORS AND COMPENSATION INFORMATION and “EXECUTIVE COMPENSATION INFORMATION” (excluding the Compensation Committee Report) in the Proxy Statement.
ITEM 12. | SECURITY OWNERSHIP OF CERTAIN BENEFICIAL OWNERS AND MANAGEMENT AND RELATED STOCKHOLDER MATTERS |
The information required by this Item is incorporated by reference from the information under the captions “BENEFICIAL OWNERSHIP OF SECURITIES” and “SECURITIES AUTHORIZED FOR ISSUANCE UNDER CNX EQUITY COMPENSATION PLAN” in the Proxy Statement.
ITEM 13. | CERTAIN RELATIONSHIPS AND RELATED TRANSACTIONS AND DIRECTOR INDEPENDENCE |
The information requested by this Item is incorporated by reference from the information under the caption “PROPOSAL NO. 1-ELECTION OF DIRECTORS - Related Party Policy and Procedures and PROPOSAL NO. 1 - ELECTION OF DIRECTORS - Determination of Director Independence in the Proxy Statement.
ITEM 14. | PRINCIPAL ACCOUNTING FEES AND SERVICES |
The information required by this Item is incorporated by reference from the information under the caption “ACCOUNTANTS AND AUDIT COMMITTEE-INDEPENDENT REGISTERED PUBLIC ACCOUNTING FIRM” in the Proxy Statement.
126
PART IV
ITEM 15. | EXHIBIT INDEX |
In reviewing any agreements incorporated by reference in this Form 10-K or filed with this 10-K, please remember that such agreements are included to provide information regarding their terms. They are not intended to be a source of financial, business or operational information about CNX or any of its subsidiaries or affiliates. The representations, warranties and covenants contained in these agreements are made solely for purposes of the agreements and are made as of specific dates; are solely for the benefit of the parties; may be subject to qualifications and limitations agreed upon by the parties in connection with negotiating the terms of the agreements, including being made for the purpose of allocating contractual risk between the parties instead of establishing matters as facts; and may be subject to standards of materiality applicable to the contracting parties that differ from those applicable to investors or security holders. Investors and security holders should not rely on the representations, warranties and covenants or any description thereof as characterizations of the actual state of facts or condition of CNX or any of its subsidiaries or affiliates or, in connection with acquisition agreements, of the assets to be acquired. Moreover, information concerning the subject matter of the representations, warranties and covenants may change after the date of the agreements. Accordingly, these representations and warranties alone may not describe the actual state of affairs as of the date they were made or at any other time.
(A)(1) | Financial Statements Contained in Item 8 hereof. | |
(A)(2) | Financial Statement Schedule-Schedule II Valuation and qualifying accounts. | |
Asset Acquisition Agreement dated August 17, 2011 between CNX Gas Company LLC and Noble Energy, Inc., incorporated by reference to Exhibit 2.1 to Form 8-K (file no. 001-14901) filed on August 18, 2011. | ||
Joint Development Agreement by and among CNX Gas Company LLC and Noble Energy, Inc. dated as of September 30, 2011, incorporated by reference to Exhibit 2.2 to Form 10-Q (file no. 001-14901) for the quarter ended September 30, 2011, filed on October 31, 2011. | ||
Stock Purchase Agreement, dated October 25, 2013, among CONSOL Energy Inc., Consolidation Coal Company, Ohio Valley Resources, Inc., and, as to certain provisions of the Purchase Agreement, Murray Energy Corporation, incorporated by reference to Exhibit 2.1 to Form 8-K (file no. 001-14901) filed on December 11, 2013. | ||
Membership Interest and Asset Purchase Agreement dated February 26, 2016 among CONSOL Energy Inc., CONSOL Mining Holding Company LLC, CONSOL Buchanan Mining Company LLC, CONSOL Amonate Mining Company LLC CONSOL Mining Company LLC, CNX Land LLC, CNX Marine Terminals Inc., CNX RCPC LLC, CONSOL Pennsylvania Coal Company LLC and CONSOL Amonate Facility LLC and Coronado IV LLC which is incorporated by reference to Exhibit 2.1 to Form 8-K (file no. 001-14901) filed on February 29, 2016. | ||
Exchange Agreement dated October 29, 2016, by and between CNX Gas Company LLC and Noble Energy, Inc. including Appendix I (Definitions) thereto, incorporated by reference to Exhibit 2.1 to Form 8-K (file no. 001-14901) filed on October 31, 2016. | ||
2.6 | First Amendment to Exchange Agreement dated as of December 1, 2016, by and between CNX Gas Company LLC and Noble Energy, Inc. Exhibits and Schedules identified in the First Amendment to Exchange Agreement are not being filed but will be furnished supplementally to the Securities and Exchange Commission upon request. | |
Separation and Distribution Agreement, dated as of November 28, 2017, by and between the Company and CONSOL Mining Corporation, incorporated by reference to Exhibit 2.1 to Form 8-K (file no. 001-14901) filed on December 4, 2017. | ||
Tax Matters Agreement, dated as of November 28, 2017, by and between the Company and CONSOL Mining Corporation, incorporated by reference to Exhibit 2.2 to Form 8-K (file no. 001-14901) filed on December 4, 2017. | ||
Employee Matters Agreement, dated as of November 28, 2017, by and between the Company and CONSOL Mining Corporation, incorporated by reference to Exhibit 2.3 to Form 8-K (file no. 001-14901) filed on December 4, 2017. | ||
Intellectual Property Matters Agreement, dated as of November 28, 2017, by and between the Company and CONSOL Mining Corporation, incorporated by reference to Exhibit 2.4 to Form 8-K (file no. 001-14901) filed on December 4, 2017. | ||
Restated Certificate of Incorporation of CONSOL Energy Inc., incorporated by reference to Exhibit 3.1 to Form 8-K (file no. 001-14901) filed on May 8, 2006. | ||
Certificate of Amendment to the Restated Certificate of Incorporation of the Company, incorporated by reference to Exhibit 3.1 to Form 8-K (file no. 001-14901) filed on December 4, 2017. | ||
Amended and Restated Bylaws of the Company, incorporated by reference to Exhibit 3.2 to Form 8-K (file no. 001-14901) filed on December 4, 2017. | ||
127
Supplemental Indenture, dated as of April 30, 2010, among Dominion Exploration & Production, Inc., Dominion Reserves, Inc., Dominion Coalbed Methane, Inc., Dominion Appalachian Development, LLC, Dominion Appalachian Development Properties, LLC, CONSOL Energy Inc. and The Bank of Nova Scotia Trust Company of New York, as trustee, with respect to the 8.25% Senior Notes due 2020, incorporated by reference to Exhibit 4.6 to Form 8-K/A (file no. 001-14901) filed on August 6, 2010. | ||
Supplemental Indenture No. 2, dated as of June 16, 2010, among Cardinal States Gathering Company, CNX Gas Company LLC, CNX Gas Corporation, Coalfield Pipeline Company, Knox Energy, LLC, MOB Corporation, CONSOL Energy Inc. and The Bank of Nova Scotia Trust Company of New York, as trustee, with respect to the 8.25% Senior Notes due 2020, incorporated by reference to Exhibit 4.7 to Form 8-K/A (file no. 001-14901) filed on August 6, 2010. | ||
Supplemental Indenture No. 3, dated as of August 24, 2011, to Indenture dated as of April 1, 2010 among CONSOL Energy Inc., certain subsidiaries of CONSOL Energy Inc. and The Bank of Nova Scotia Trust Company of New York, as trustee, with respect to the 8.25% Senior Notes due 2020, incorporated by reference to Exhibit 4.2 to Form 8-K (file no. 001-14901) filed on August 29, 2011. | ||
Supplemental Indenture No. 4, dated as of September 10, 2013, to Indenture dated as of April 1, 2010, by and among CONSOL Energy Inc., certain subsidiaries of CONSOL Energy Inc. and Wells Fargo Bank, National Association, as successor trustee to The Bank of Nova Scotia Trust Company of New York, with respect to the 8.25% Senior Notes due 2020, incorporated by reference to Exhibit 4.2 of Form 10-Q (file no. 001-14901) filed on November 1, 2013. | ||
Supplemental Indenture No. 5, dated as of March 23, 2015, to the Indenture dated as of April 1, 2010 by and among CONSOL Energy Inc., the Subsidiary Guarantors listed on the signature pages thereof and Wells Fargo Bank, National Association, a national banking association, as successor trustee, with respect to the 8.25% Senior Notes due 2020, incorporated by reference to Exhibit 4.4 of Form 10-Q (file no. 001-14901) filed on May 5, 2015. | ||
Indenture, dated as of March 9, 2011, among CONSOL Energy Inc., the Subsidiaries named therein and The Bank of Nova Scotia Trust Company of New York, as trustee, with respect to the 6.375% Senior Notes due 2021, incorporated by reference to Exhibit 4.1 to Form 8-K (file no. 001-14901) filed on March 11, 2011. | ||
Supplemental Indenture No. 1, dated as of August 24, 2011, to Indenture dated as of March 9, 2011 among CONSOL Energy Inc., certain subsidiaries of CONSOL Energy Inc. and The Bank of Nova Scotia Trust Company of New York, as trustee, with respect to the 6.375% Senior Notes due 2021, incorporated by reference to Exhibit 4.3 to Form 8-K (file no. 001-14901) filed on August 29, 2011. | ||
Supplemental Indenture No. 2, dated as of September 10, 2013, to Indenture dated as of March 9, 2011, by and among CONSOL Energy Inc., certain subsidiaries of CONSOL Energy Inc. and Wells Fargo Bank, National Association, as successor trustee to The Bank of Nova Scotia Trust Company of New York, with respect to the 6.375 % Senior Notes due 2021, incorporated by reference to Exhibit 4.3 of Form 10-Q (file no. 001-14901) filed on November 1, 2013. | ||
Supplemental Indenture No. 3, dated as of March 23, 2015, to the Indenture dated as of March 9, 2011 by and among CONSOL Energy Inc., the Subsidiary Guarantors listed on the signature pages thereof and Wells Fargo Bank, National Association, a national banking association, as successor trustee, with respect to the 6.375% Senior Notes due 2021, incorporated by reference to Exhibit 4.3 of Form 10-Q (file no. 001-14901) filed on May 5, 2015. | ||
Indenture, dated as of April 16, 2014, among CONSOL Energy Inc., the Subsidiary Guarantors named therein and Wells Fargo Bank, National Association, a national banking association, as trustee, with respect to the 5.875% Senior Notes due 2022, incorporated by reference to Exhibit 4.1 to Form 8-K (file no. 001-14901) filed on April 16, 2014. | ||
Indenture, dated as of March 30, 2015, among CONSOL Energy Inc., the subsidiary guarantors party thereto and Well Fargo, National Association, as Trustee, incorporated by reference to Exhibit 4.1 to Form 8-K (file no. 001-14901) filed on March 30, 2015. | ||
Registration Rights Agreement, dated as of April 16, 2014, by and among CONSOL Energy Inc., the guarantors signatory thereto and J.P. Morgan Securities LLC and Credit Suisse Securities (USA) LLC, as representatives of the several initial purchasers, incorporated by reference to Exhibit 4.2 to Form 8-K (file no. 001-14901) filed on April 16, 2014. | ||
Registration Rights Agreement, dated as of August 12, 2014, by and among CONSOL Energy Inc., the guarantors signatory thereto and Goldman, Sachs & Co., as the initial purchasers, incorporated by reference to Exhibit 4.2 to Form 8-K (file no. 001-14901) filed on August 12, 2014. | ||
Registration Rights Agreement, dated as of March 30, 2015, among CONSOL Energy Inc., the subsidiary guarantors party thereto and Goldman, Sachs & Co. as the initial purchaser named therein, incorporated by reference to Exhibit 4.2 to Form 8-K (file no. 001-14901) filed on March 30, 2015. | ||
Agreement of Resignation, Appointment and Acceptance, dated July 22, 2013, by and among CONSOL Energy Inc., certain subsidiaries of CONSOL Energy Inc. signatory thereto, Wells Fargo Bank, National Association, as Successor Trustee to The Bank of Nova Scotia Trust Company of New York, and The Bank of Nova Scotia Trust Company of New York, as Resigning Trustee (related to the Indenture dated as of April 1, 2010 with respect to the 8.00% Senior Notes due 2017, the Indenture dated as of April 1, 2010 with respect to the 8.25% Senior Notes due 2020, and the Indenture dated as of March 9, 2011 with respect to the 6.375% Senior Notes due 2021), incorporated by reference to Exhibit 4.4 of Form 10-Q (file no. 001-14901) filed on November 1, 2013. | ||
128
Purchase and Sale Agreement, dated as of April 30, 2003, by and among CONSOL Energy Inc., CONSOL Sales Company, CONSOL of Kentucky Inc., CONSOL Pennsylvania Coal Company, Consolidation Coal Company, Island Creek Coal Company, Windsor Coal Company, McElroy Coal Company, Keystone Coal Mining Corporation, Eighty-Four Mining Company, CNX Gas Company LLC, CNX Marine Terminals Inc. and CNX Funding Corporation, incorporated by reference to Exhibit 10.30 to Form 10-Q (file no. 001-14901) for the quarter ended June 30, 2003, filed on August 13, 2003. | ||
Purchase and Sale Agreement dated July 19, 2016, among CONSOL of Kentucky Inc., Island Creek Coal Company, Laurel Run Mining Company, and CNX Land LLC and Southeastern Land, LLC, incorporated by reference to Exhibit 2.1 to Form 8-K (file no. 001-14901) filed on July 25, 2016. | ||
Purchase and Sale Agreement dated July 19, 2016, among AMVEST West Virginia Coal, L.L.C., Braxton-Clay Land & Mineral, Inc., Nicholas-Clay Land & Mineral, Inc., Peters Creek Mineral Services, Inc., Terry Eagle Limited Partnership, Terry Eagle Coal Company, L.L.C., Fola Coal Company, L.L.C., Little Eagle Coal Company, L.L.C., and Vaughan Railroad Company and Southeastern Land, LLC, incorporated by reference to Exhibit 2.2 to Form 8-K (file no. 001-14901) filed on July 25, 2016. | ||
Contribution Agreement dated as of November 15, 2016, by and among CONE Gathering LLC, CONE Midstream GP LLC, CONE Midstream Partners LP, CONE Midstream Operating Company LLC and certain other signatories thereto, incorporated by reference to Exhibit 10.1 to Form 8-K (file no. 001-14901) filed on November 16, 2016. | ||
Amended and Restated Credit Agreement, dated as of April 12, 2011, by and among CONSOL Energy Inc., the Guarantors Party thereto, the Lenders Party thereto, PNC Bank, National Association, as the Administrative Agent, Bank of America, N.A., as the Syndication Agent, The Bank of Nova Scotia, The Royal Bank of Scotland PLC and Sovereign Bank, as the Co-Documentation Agents, and PNC Capital Markets LLC and Merrill Lynch, Pierce, Fenner & Smith Incorporated, as Joint Lead Arrangers, incorporated by reference to Exhibit 10.1 to Form 8-K (file no. 001-14901) filed on April 18, 2011. | ||
Amendment No. 1 to Credit Agreement, dated as of December 5, 2013, to the Amended and Restated Credit Agreement, dated as of April 12, 2011, by and among CONSOL Energy Inc., the lenders and agents party thereto and PNC Bank, National Association, as administrative agent, incorporated by reference to Exhibit 10.1 to Form 8-K (file no. 001-14901) filed on December 11, 2013. | ||
Amended and Restated Credit Agreement, dated as of June 18, 2014, by and among CONSOL Energy Inc., the lenders and agents party thereto and PNC Bank, National Association, as administrative agent, incorporated by reference to Exhibit 10.1 to Form 8-K/A (file no. 001-14901) filed on June 25, 2014. | ||
Amendment No. 1, dated as of May 22, 2015, to the Amended and Restated Credit Agreement, dated as of June 18, 2014, by and among CONSOL Energy Inc., the subsidiary guarantors party thereto and certain lenders and PNC Bank, National Association as administrative agent, incorporated by reference to Exhibit 10.1 to Form 8-K (file no. 001-14901) filed on May 26, 2015. | ||
Amendment No. 2, dated as of April 20, 2016, to the Amended and Restated Credit Agreement, dated as of June 18, 2014, and the Amended and Restated Security Agreement, dated as of June 18, 2014, by and among CONSOL Energy Inc., the subsidiary guarantors party thereto, certain lenders and PNC Bank, National Association as administrative agent and as collateral agent, incorporated by reference to Exhibit 10.1 to the Form 8-K (file no. 001-14901) filed on April 26, 2016. | ||
Amendment No. 3 and Borrowing Base Redetermination, dated as of October 25, 2017, to the Amended and Restated Credit Agreement, dated as of June 18, 2014, by and among CONSOL Energy Inc., the subsidiary guarantors party thereto, certain lenders and PNC Bank, National Association as administrative agent, incorporated by reference to Exhibit 10.1 to Form 8-K (file no. 001-14901) filed on October 31, 2017. | ||
Amendment No. 4, dated as of November 27, 2017, to the Amended and Restated Credit Agreement, dated as of June 18, 2014, by and among CONSOL Energy Inc., the subsidiary guarantors party thereto, certain lenders and PNC Bank, National Association as administrative agent, incorporated by reference to Exhibit 10.1 to Form 8-K (file no. 001-14901) filed on December 1, 2017. | ||
Resignation, Consent and Appointment Agreement entered into as of September 12, 2016, by and among Bank of America, N.A., as the resigning Syndication Agent under that certain Amended and Restated Credit Agreement, dated as of June 18, 2014, JPMorgan Chase Bank, N.A., as the successor Syndication Agent, and CONSOL Energy Inc., a Delaware corporation, as the Borrower, incorporated by reference to Exhibit 10.3 to the Form 10-Q (file no. 001-14901) for the quarter ended September 30, 2016, filed on November 1, 2016. | ||
Amended and Restated Collateral Trust Agreement, dated as of May 7, 2010, by and among CONSOL Energy Inc. and its Designated Subsidiaries, Wilmington Trust Company, as Corporate Trustee and David A. Vanaskey, as Individual Trustee, incorporated by reference to Exhibit 2.2 to Form 8-K (file no. 001-14901) filed on May 13, 2010. | ||
Amended and Restated Pledge Agreement, dated as of May 7, 2010, made and entered into by each of the pledgors listed on the signature pages thereto and each other persons and entities that become bound thereto from time to time by joinder, assumption, or otherwise and Wilmington Trust Company, as Collateral Trustee, incorporated by reference to Exhibit 2.3 to Form 8-K (file no. 001-14901) filed on May 13, 2010. | ||
129
Amended and Restated Security Agreement, dated as of May 7, 2010, by and among CONSOL Energy Inc., each of the parties listed on the signature pages thereto and each other persons and entities that become bound thereto from time to time by joinder, assumption, or otherwise and Wilmington Trust Company, as Collateral Trustee, incorporated by reference to Exhibit 2.4 to Form 8-K (file no. 001-14901) filed on May 13, 2010. | ||
Patent, Trademark and Copyright Security Agreement, dated as of June 27, 2007, by and among each of the pledgors listed on the signature pages thereto and each of the other persons and entities that become bound thereby from time to time by joinder, assumption, or otherwise and Wilmington Trust Company, as Collateral Trustee, incorporated by reference to Exhibit 10.20 to Form 10-K for the year ended December 31, 2010 (file no. 001-14901), filed on February 10, 2011. | ||
First Amendment to Amended and Restated Patent, Trademark and Copyright Security Agreement, dated as of May 7, 2010, by and among each of the pledgors listed on the signature pages thereto and each other persons and entities that become bound thereto from time to time by joinder, assumption, or otherwise and Wilmington Trust Company, as Collateral Trustee, incorporated by reference to Exhibit 2.5 to Form 8-K (file no. 001-14901) filed on May 13, 2010. | ||
Patent, Trademark and Copyright Assignment and Assumption, dated as of April 12, 2011, between Wilmington Trust Company as assignor and PNC Bank, National Association as assignee, incorporated by reference to Exhibit 2.1 to Form 8-K (file no. 001-14901) filed on April 18, 2011. | ||
Guaranty and Suretyship Agreement, dated as of April 30, 2003, by CONSOL Energy Inc., as guarantor in favor of CNX Funding Corporation, incorporated by reference to Exhibit 10.6 to Form 10-Q (file no. 001-14901) for the quarter ended March 31, 2011, filed on May 3, 2011. | ||
Amended and Restated Continuing Agreement of Guaranty and Suretyship, dated as of May 7, 2010, jointly and severally given by each of the undersigned thereto and each of the other persons which become Guarantors thereunder from time to time in favor of PNC Bank, National Association, in its capacity as the administrative agent for the Lenders, in connection with that certain Amended and Restated Credit Agreement, as defined therein, incorporated by reference to Exhibit 10.22 to Form 10-K for the year ended December 31, 2010 (file no. 001-14901), filed on February 10, 2011. | ||
CNX Gas Continuing Agreement of Guaranty and Suretyship, dated as of April 12, 2011, by CNX Gas Corporation and certain of its subsidiaries, incorporated by reference to Exhibit 10.2 to Form 8-K (file no. 001-14901) filed on April 18, 2011. | ||
Successor Agent Agreement, dated as of April 12, 2011, by and among among Wilmington Trust Company and David A. Varansky as existing agents, PNC Bank, National Association as Collateral Trustee and CONSOL Energy Inc. and certain of its subsidiaries, incorporated by reference to Exhibit 2.2 to Form 8-K (file no. 001-14901) filed on April 18, 2011. | ||
Amended and Restated Credit Agreement, dated as of April 12, 2011, by and among CNX Gas Corporation, the Guarantors Party thereto, the Lenders Party thereto, PNC Bank, National Association, as the Administrative Agent, Bank of America, N.A., as the Syndication Agent, The Bank of Nova Scotia, The Royal Bank of Scotland PLC and Wells Fargo Bank, N.A., as the Co-Documentation Agents, and PNC Capital Markets LLC and Merrill Lynch, Pierce, Fenner & Smith Incorporated, as Bookrunners and Joint Lead Arrangers, incorporated by reference to Exhibit 10.3 to Form 8-K (file no. 001-14901) filed on April 18, 2011. | ||
Amendment No. 1 to Credit Agreement, dated as of December 14, 2011, by and among CNX Gas Corporation, the lenders and agents party thereto and PNC Bank, National Association, as Administrative Agent, incorporated by reference to Exhibit 10.29 to Form 10-K for the year ended December 31, 2012 (file no. 01-14901), filed on February 7, 2013. | ||
Amendment No. 2 to Credit Agreement, dated as of March 12, 2013, to the Amended and Restated Credit Agreement, dated as of April 12, 2011, as amended by Amendment No. 1, dated December 14, 2011, by and among CNX Gas Corporation, the lenders and agents party thereto and PNC Bank, National Association, as administrative agent, incorporated by reference to Exhibit 10.1 of Form 10-Q (file no. 001-14901) for the quarter ended March 31, 2013, filed on May 7, 2013. | ||
Collateral Trust Agreement, dated as of May 7, 2010, by and among CNX Gas Corporation, its Designated Subsidiaries, Wilmington Trust Company, as Corporate Trustee and David A. Vanaskey, as Individual Trustee, incorporated by reference to Exhibit 2.1 to the CNX Gas Corporation Form 8-K (file no. 001-32723) filed on May 13, 2010. | ||
Pledge Agreement, dated as of May 7, 2010, by each of the pledgors listed on the signature pages thereto and each of the other persons and entities that become bound thereby from time to time by joinder, assumption or otherwise and Wilmington Trust Company, as Collateral Trustee, incorporated by reference to Exhibit 2.2 to the CNX Gas Corporation Form 8-K (file no. 001-32723) filed on May 13, 2010. | ||
Security Agreement, dated as of May 7, 2010, by and among CNX Gas Corporation and each of the undersigned parties thereto and each of the other persons and entities that become bound thereby from time to time by joinder, assumption or otherwise and Wilmington Trust Company, as Collateral Trustee, incorporated by reference to Exhibit 2.3 to the CNX Gas Corporation Form 8-K (file no. 001-32723) filed on May 13, 2010. | ||
CONSOL Amended and Restated Continuing Agreement of Guaranty and Suretyship, dated as of April 12, 2011, by CONSOL Energy and certain of its subsidiaries, incorporated by reference to Exhibit 10.4 to Form 8-K (file no. 001-14901) filed on April 18, 2011. | ||
130
Amended and Restated Continuing Agreement of Guaranty and Suretyship, dated as of April 12, 2011, among CNX Gas Company LLC and certain of its subsidiaries, incorporated by reference to Exhibit 10.5 to Form 8-K (file no. 001-14901) filed on April 18, 2011. | ||
Successor Agent Agreement, dated as of April 12, 2011, by and among Wilmington Trust Company and David A. Vanaskey as existing agents, PNC Bank, National Association as Collateral Trustee and CNX Gas Corporation and certain of its subsidiaries, incorporated by reference to Exhibit 2.3 to Form 8-K (file no. 001-14901) filed on April 18, 2011. | ||
Closing Agreement by and between CNX Gas Company LLC and Noble Energy, Inc. dated as of September 30, 2011, incorporated by reference to Exhibit 10.2 to Form 10-Q (file no. 001-14901) for the quarter ended September 30, 2011, filed on October 31, 2011. | ||
Stipulation and Agreement of Compromise and Settlement, dated May 8, 2013, between and among (i) plaintiffs Harold L. Hurwitz and James R. Gummel, on their own behalf and on behalf of the Class (as defined therein) and (ii) defendants CNX Gas Corporation, CONSOL Energy Inc. and certain individual defendants, incorporated by reference to Exhibit 10.1 of Form 10-Q (file no. 001-14901) for the quarter ended June 30, 2013, filed on August 5, 2013. | ||
Amendment No. 1, dated April 19, 2013, to the Asset Acquisition Agreement, dated August 17, 2011, between CNX Gas Company LLC and Noble Energy, Inc, incorporated by reference to Exhibit 10.2 of Form 10-Q (file no. 001-14901) for the quarter ended June 30, 2013, filed on August 5, 2013. | ||
Purchase Agreement, dated as of April 10, 2014, among CONSOL Energy Inc., the subsidiary guarantors party thereto and J.P. Morgan Securities LLC and Credit Suisse Securities (USA) LLC, as representatives of the several initial purchasers named therein, incorporated by reference to Exhibit 1.1 to Form 8-K (file no. 001-14901) filed on April 16, 2014. | ||
Transition Services Agreement, dated as of November 28, 2017, by and between the Company and CONSOL Mining Corporation, incorporated by reference to Exhibit 10.1 to Form 8-K (file no. 001-14901) filed on December 4, 2017 | ||
CNX Resources Corporation to CONSOL Energy Inc. Trademark License Agreement dated as of November 28, 2017, by and between the Company and CONSOL Energy Inc., incorporated by reference to Exhibit 10.2 to Form 8-K (file no. 001-14901) filed on December 4, 2017 | ||
CONSOL Energy Inc. to CNX Resources Corporation Trademark License Agreement, dated as of November 28, 2017, by and between the Company and CONSOL Energy Inc., incorporated by reference to Exhibit 10.3 to Form 8-K (file no. 001-14901) filed on December 4, 2017 | ||
Amended and Restated Employment Agreement, dated March 21, 2014, between CONSOL Energy Inc. and J. Brett Harvey incorporated by reference to Exhibit 10.1 to Form 8-K (file no. 001-14901) filed on March 26, 2014. | ||
Letter Agreement, dated August 24, 2007, by and between CONSOL Energy Inc. and Nicholas J. DeIuliis, incorporated by reference to Exhibit 10.1 to Form 8-K (file no. 001-14901) filed on August 24, 2007. | ||
Change in Control Agreement by and between CONSOL Energy Inc. and Nicholas J. DeIuliis, incorporated by reference to Exhibit 10.7 to Form 10-K for the year ended December 31, 2008 (file no. 001-14901), filed on February 17, 2009. | ||
Amended and Restated Change in Control Severance Agreement, dated as of October 9, 2015, between CONSOL Energy Inc., and David M. Khani, incorporated by reference to Exhibit 10.1 to Form 10-Q (file no. 001-14901) for the quarter ended September 30, 2015, filed on November 3, 2015. | ||
Change in Control Agreement by and among CNX Gas Corporation, CONSOL Energy Inc. and Stephen W. Johnson, incorporated by reference to Exhibit 10.4 to Form 10-K for the year ended December 31, 2008 of CNX Gas Corporation (file no. 001-32723) filed on February 17, 2009. | ||
Amended and Restated Change in Control Severance Agreement, dated as of February 7, 2017, between CNX Coal Resources GP LLC, and James A. Brock, incorporated by reference Exhibit 10.61 to Form 10-K (file no. 001-14901) for year-end December 31, 2016 filed on February 8, 2017. | ||
Amended and Restated Change in Control Severance Agreement, dated as of August 24, 2015, between CONSOL Energy Inc., and Timothy Dugan, incorporated by reference to Exhibit 10.3 to Form 10-Q (file no. 001-14901) for the quarter ended September 30, 2015, filed on November 3, 2015. | ||
Form of Indemnification Agreement for Directors and Executive Officers of CONSOL Energy Inc., incorporated by reference to Exhibit 10.6 to Form 10-Q (file no. 001-14901) for the quarter ended June 30, 2009, filed on August 3, 2009. | ||
Form of Indemnification Agreement for Directors and Executive Officers of CNX Gas Corporation, incorporated by reference to Exhibit 10.7 to Form 10-Q (file no. 001-14901) for the quarter ended June 30, 2009, filed on August 3, 2009. | ||
CNX Resources Corporation Equity Incentive Plan, as amended and restated effective January 26, 2018, filed herewith. | ||
Amended and Restated CNX Resources Corporation Executive Annual Incentive Plan, filed herewith. | ||
Form of Non-Qualified Stock Option Award Agreement For Employees, incorporated by reference to Exhibit 10.26 to the Registration Statement on Form S-4 (file no. 333-149442) filed on February 28, 2008. | ||
131
Form of Non-Qualified Stock Option Award Agreement for Employees (February 17, 2009 and through 2012), incorporated by reference to Exhibit 10.28 to Form S-4 (file no. 333-157894) filed on June 26, 2009. | ||
Form of Non-Qualified Performance Stock Option Agreement for Employees, incorporated by reference to Exhibit 10.1 to Form 8-K (file no. 001-14901) filed on June 21, 2010. | ||
Form of Non-Qualified Stock Option Award for Employees (January 27, 2016), incorporated by reference to Exhibit 10.72 to Form 10-K (file no. 001-14901) for the year ended December 31, 2015, filed on February 5, 2016. | ||
Form of Employee Nonqualified Stock Option Agreement (May 26, 2016), incorporated by reference to Exhibit 10.4 to Form 10-Q (file no. 001-14901) for the quarter ended June 30, 2016, filed on July 29, 2016. | ||
Form of Restricted Stock Unit Award for Employees (February 17, 2009 through 2014), incorporated by reference to Exhibit 10.31 to Amendment No. 1 to Form S-4 (file no. 333-157894) filed on June 26, 2009. | ||
Form of 5-Year Restricted Stock Unit Award Agreement for Employees, incorporated by reference to Exhibit 10.4 to Form 10-Q (file no. 001-14901) for the quarter ended March 31, 2014, filed on May 6, 2014. | ||
Form of Restricted Stock Unit Award Agreement for Directors, incorporated by reference to Exhibit 10.30 to the Registration Statement on Form S-4 (file no. 333-149442) filed on February 28, 2008. | ||
Form of Restricted Stock Unit Award Agreement for Employees (for 2015 awards), incorporated by reference to Exhibit 10.67 to Form 10-K for the year ended December 31, 2014 (file no. 001-14901), filed on February 6, 2015. | ||
Form of Restricted Stock Unit Award Agreement for Employees (With Deferral Election) (for 2017 awards). | ||
Form of Performance Share Unit Award Agreement (for 2014 awards), incorporated by reference to Exhibit 10.3 to Form 10-Q (file no. 001-14901) for the quarter ended March 31, 2014, filed on May 6, 2014. | ||
Form of Performance Share Unit Award Agreement (for 2015 awards), incorporated by reference to Exhibit 10.69 to Form 10-K for the year ended December 31, 2014 (file no. 001-14901), filed on February 6, 2015. | ||
Form of Performance Share Unit Award Agreement (for 2016 awards), incorporated by reference to Exhibit 10.79 to Form 10-K (file no. 001-14901) for the year ended December 31, 2015, filed on February 5, 2016. | ||
Form of Performance Share Unit Award Agreement (for 2017 awards). | ||
Summary of Non-Employee Director Compensation, incorporated by reference to Exhibit 10.69 to Form 10-K (file no. 001-14901) for the year ended December 31, 2013, filed on February 7, 2014. | ||
Directors Deferred Compensation Plan (1999 Plan), incorporated by reference to Exhibit 10.1 to Form 10-Q (file no. 001-14901) for the quarter ended March 31, 2008, filed on April 30, 2008. | ||
Directors' Deferred Fee Plan (2004 Plan) (Amended and Restated on December 4, 2007), incorporated by reference to Exhibit 10.3 to Form 10-Q (file no. 001-14901) for the quarter ended March 31, 2008, filed on April 30, 2008. | ||
Hypothetical Investment Election Form Relating to Directors' Deferred Fee Plan (2004 Plan), incorporated by reference to Exhibit 10.50 to Form 10-K for the year ended December 31, 2007 (file no. 001-14901), filed on February 19, 2008. | ||
Form of Director Deferred Stock Unit Grant Agreement, incorporated by reference to Exhibit 10.95 to the Form 8-K (file no. 001-14901) filed on May 8, 2006. | ||
Trust Agreement (Amended and Restated on March 20, 2008) (1999 Directors Deferred Compensation Plan), incorporated by reference to Exhibit 10.2 to Form 10-Q (file no. 001-14901) for the quarter ended March 31, 2008, filed on April 30, 2008. | ||
Trust Agreement (Amended and Restated on March 20, 2008) (Directors' Deferred Fee Plan (2004 Plan)), incorporated by reference to Exhibit 10.4 to Form 10-Q (file no. 001-14901) for the quarter ended March 31, 2008, filed on April 30, 2008. | ||
Amended and Restated Retirement Restoration Plan of CNX Resources Corporation, as amended and restated effective December 2, 2008, as amended and restated effective November 28, 2017, filed herewith. | ||
Amended and Restated Supplemental Retirement Plan of CNX Resources Corporation effective January 1, 2007, as amended and restated effective November 28, 2017, filed herewith. | ||
CNX Resources Corporation Defined Contribution Restoration Plan, effective January 1, 2012, as amended and restated effective November 28, 2017, filed herewith. | ||
Executive Compensation Clawback Policy of CONSOL Energy Inc., dated as of January 28, 2014, incorporated by reference to Exhibit 10.11 of Form 10-Q (file no. 001-14901) for the quarter ended March 31, 2014, filed on May 6, 2014. | ||
Purchase and Sale Agreement, dated as of February 7, 2018, by and among CNX Midstream Partners LP, CNX Midstream DevCo I LP, CNX Midstream DevCo III LP, CNX Gathering LLC, and, for certain purposes, CNX Midstream DevCo I GP LLC, CNX Midstream DevCo III GP LLC and CNX Midstream Operating Company LLC. | ||
Computation of Ratio of Earnings to Fixed Charges. | ||
Subsidiaries of CNX Resources Corporation. | ||
Consent of Ernst & Young LLP | ||
Consent of Netherland Sewell & Associates, Inc. | ||
132
Certification of Chief Executive Officer pursuant to Section 302 of the Sarbanes-Oxley Act of 2002 | ||
Certification of Chief Financial Officer pursuant to Section 302 of the Sarbanes-Oxley Act of 2002 | ||
Certification of Chief Executive Officer pursuant to 18 U.S.C. Section 1350, as adopted pursuant to Section 906 of the Sarbanes-Oxley Act of 2002 | ||
Certification of Chief Financial Officer pursuant to 18 U.S.C. Section 1350, as adopted pursuant to Section 906 of the Sarbanes-Oxley Act of 2002 | ||
Mine Safety Disclosure Exhibit | ||
Engineers' Audit Letter | ||
Financial Statements of CNX Gathering LLC | ||
101 | Interactive Data File (Form 10-K for the year ended December 31, 2017 furnished in XBRL). | |
* Denotes the management contracts and compensatory arrangements in which any director or any named executive officer participates
Supplemental Information
No annual report or proxy material has been sent to shareholders of CNX at the time of filing of this Form 10-K. An annual report will be sent to shareholders and to the commission subsequent to the filing of this Form 10-K.
In accordance with SEC Release 33-8238, Exhibits 32.1 and 32.2 are being furnished and not filed.
ITEM 16. FORM 10-K SUMMARY
NONE
133
SIGNATURES
Pursuant to the requirements of Section 13 or 15(d) of the Securities Exchange Act of 1934, the registrant has duly caused this report to be signed on its behalf by the undersigned, thereunto duly authorized, as of the 7th day of February, 2018.
CNX RESOURCES CORPORATION | |||
By: | /s/ NICHOLAS J. DEIULIIS | ||
Nicholas J. DeIuliis | |||
Director, Chief Executive Officer and President | |||
(Duly Authorized Officer and Principal Executive Officer) | |||
Pursuant to the requirements of the Securities Exchange Act of 1934, this report has been signed as of the 8th day of February, 2017, by the following persons on behalf of the registrant in the capacities indicated:
Signature | Title | |
/s/ NICHOLAS J. DEIULIIS | Director, Chief Executive Officer and President | |
Nicholas J. DeIuliis | (Duly Authorized Officer and Principal Executive Officer) | |
/s/ DONALD W. RUSH | Chief Financial Officer and Executive Vice President | |
Donald W. Rush | (Duly Authorized Officer and Principal Financial Officer) | |
/s/ JASON L. MUMFORD | Controller | |
Jason L. Mumford | (Duly Authorized Officer and Principal Accounting Officer) | |
/s/ WILLIAM N. THORNDIKE JR. | Director and Chairman of the Board | |
William N. Thorndike Jr. | ||
/s/ J. PALMER CLARKSON | Director | |
J. Palmer Clarkson | ||
/s/ WILLIAM E. DAVIS | Director | |
William E. Davis | ||
/s/ MAUREEN E. LALLY-GREEN | Director | |
Maureen E. Lally-Green | ||
/s/ BERNARD LANIGAN JR. | Director | |
Bernard Lanigan Jr. | ||
134
SCHEDULE II
CNX RESOURCES CORPORATION AND SUBSIDIARIES
Valuation and Qualifying Accounts
(Dollars in thousands)
Additions | Deductions | |||||||||||||||||||
Balance at | Release of | Balance at | ||||||||||||||||||
Beginning | Charged to | Valuation | Charged to | End | ||||||||||||||||
of Period | Expense | Allowance | Expense | of Period | ||||||||||||||||
Year Ended December 31, 2017 | ||||||||||||||||||||
State operating loss carry-forwards | $ | 60,488 | $ | — | $ | 1,072 | $ | — | $ | 61,560 | ||||||||||
Deferred deductible temporary differences | 10,590 | — | (1,502 | ) | — | 9,088 | ||||||||||||||
Charitable Contributions | 5,052 | — | (1,896 | ) | — | 3,156 | ||||||||||||||
162(m) Officers Compensation | — | — | 5,957 | — | 5,957 | |||||||||||||||
AMT Credit | 166,798 | — | (154,385 | ) | — | 12,413 | ||||||||||||||
Foreign Tax Credits | 39,850 | 4,552 | — | — | 44,402 | |||||||||||||||
Total | $ | 282,778 | $ | 4,552 | $ | (150,754 | ) | $ | — | $ | 136,576 | |||||||||
Year Ended December 31, 2016 | ||||||||||||||||||||
State operating loss carry-forwards | $ | 42,983 | $ | 17,505 | $ | — | $ | — | $ | 60,488 | ||||||||||
Deferred deductible temporary differences | 9,420 | 1,170 | — | — | 10,590 | |||||||||||||||
Charitable Contributions | — | 5,052 | — | — | 5,052 | |||||||||||||||
AMT Credit | — | 166,798 | — | — | 166,798 | |||||||||||||||
Foreign Tax Credits | 25,903 | 13,947 | — | — | 39,850 | |||||||||||||||
Total | $ | 78,306 | $ | 204,472 | $ | — | $ | — | $ | 282,778 | ||||||||||
Year Ended December 31, 2015 | ||||||||||||||||||||
State operating loss carry-forwards | $ | 6,080 | $ | 31,578 | $ | 5,325 | $ | — | $ | 42,983 | ||||||||||
Deferred deductible temporary differences | 16 | 7,914 | 1,490 | — | 9,420 | |||||||||||||||
Foreign Tax Credits | — | 25,903 | — | — | 25,903 | |||||||||||||||
Total | $ | 6,096 | $ | 65,395 | $ | 6,815 | $ | — | $ | 78,306 | ||||||||||
135