Attached files
| file | filename |
|---|---|
| EX-99.2 - EX-99.2 - AMICUS THERAPEUTICS, INC. | a18-5536_1ex99d2.htm |
| EX-99.1 - EX-99.1 - AMICUS THERAPEUTICS, INC. | a18-5536_1ex99d1.htm |
| 8-K - 8-K - AMICUS THERAPEUTICS, INC. | a18-5536_18k.htm |
|
|
Amicus Pompe Overview & Pompe Data Highlights at 14th Annual WorldSymposium™ February 5-9, 2018 San Diego, CA |
|
|
Pompe Disease Overview Dr. Priya Kishnani 14th Annual WORLDSymposium™ February 5-9, 2018 San Diego, CA |
|
|
Disclosure Information WORLDSymposium™ 2018 Dr. Priya Kishnani Pompe Overview & Pompe Data Highlights at 14th Annual WorldSymposium™ I have the following financial relationships to disclose: Grant/Research support from: Genzyme Honoraria from: Amicus Therapeutics, Genzyme - and - I will not discuss an off label use and/or investigational use in my presentation. |
|
|
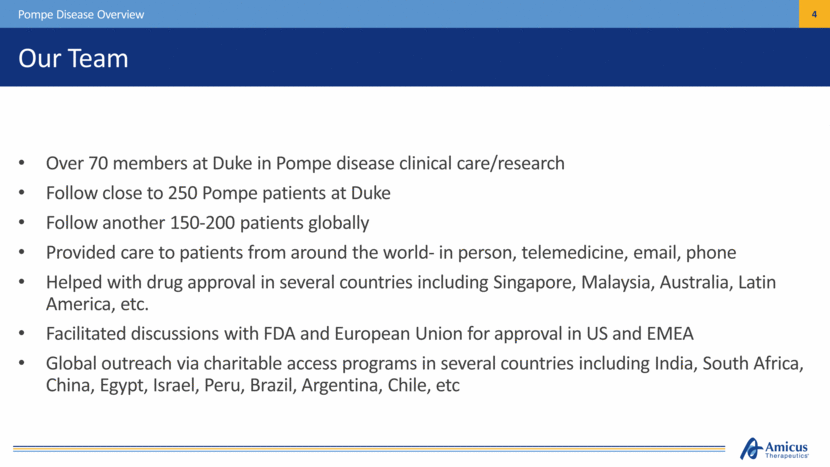
Our Team Over 70 members at Duke in Pompe disease clinical care/research Follow close to 250 Pompe patients at Duke Follow another 150-200 patients globally Provided care to patients from around the world- in person, telemedicine, email, phone Helped with drug approval in several countries including Singapore, Malaysia, Australia, Latin America, etc. Facilitated discussions with FDA and European Union for approval in US and EMEA Global outreach via charitable access programs in several countries including India, South Africa, China, Egypt, Israel, Peru, Brazil, Argentina, Chile, etc Pompe Disease Overview |
|
|
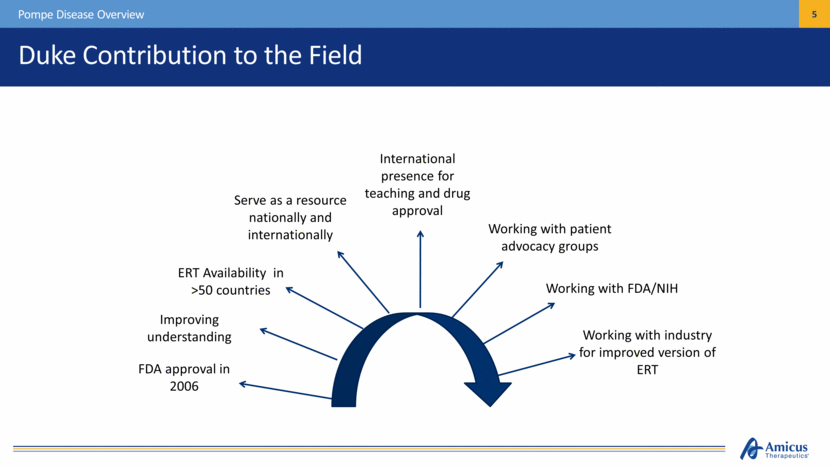
FDA approval in 2006 ERT Availability in >50 countries Serve as a resource nationally and internationally International presence for teaching and drug approval Working with patient advocacy groups Working with industry for improved version of ERT Working with FDA/NIH Improving understanding Duke Contribution to the Field Pompe Disease Overview |
|
|
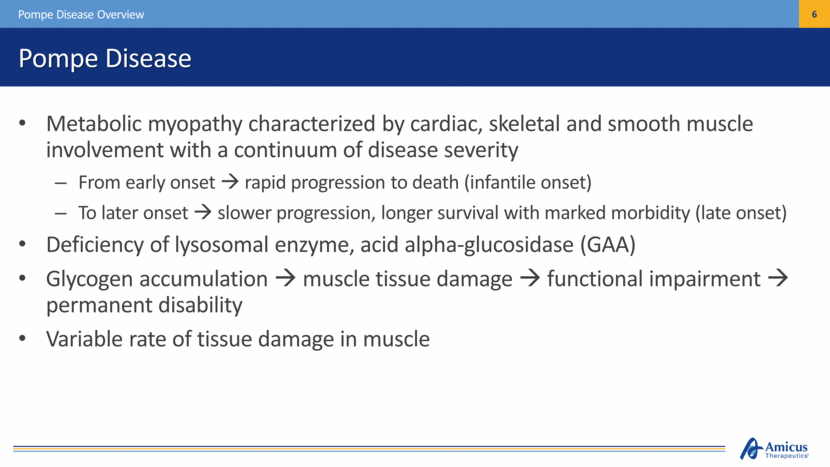
Pompe Disease Metabolic myopathy characterized by cardiac, skeletal and smooth muscle involvement with a continuum of disease severity From early onset rapid progression to death (infantile onset) To later onset slower progression, longer survival with marked morbidity (late onset) Deficiency of lysosomal enzyme, acid alpha-glucosidase (GAA) Glycogen accumulation muscle tissue damage functional impairment permanent disability Variable rate of tissue damage in muscle Pompe Disease Overview |
|
|
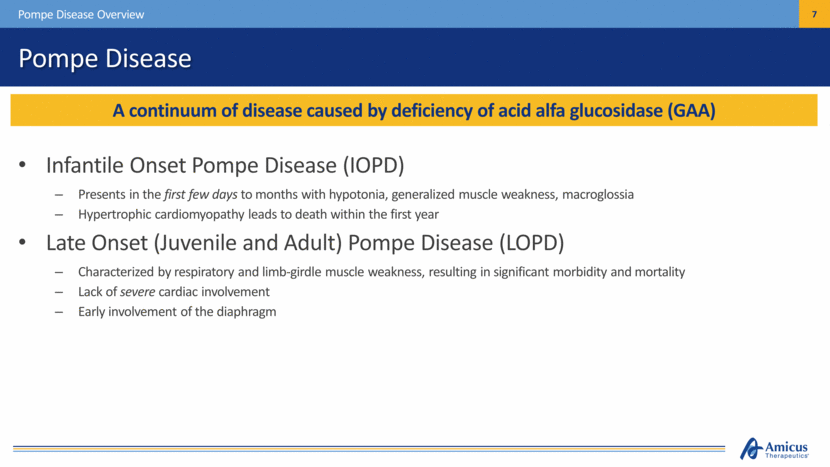
Pompe Disease Infantile Onset Pompe Disease (IOPD) Presents in the first few days to months with hypotonia, generalized muscle weakness, macroglossia Hypertrophic cardiomyopathy leads to death within the first year Late Onset (Juvenile and Adult) Pompe Disease (LOPD) Characterized by respiratory and limb-girdle muscle weakness, resulting in significant morbidity and mortality Lack of severe cardiac involvement Early involvement of the diaphragm A continuum of disease caused by deficiency of acid alfa glucosidase (GAA) Pompe Disease Overview |
|
|
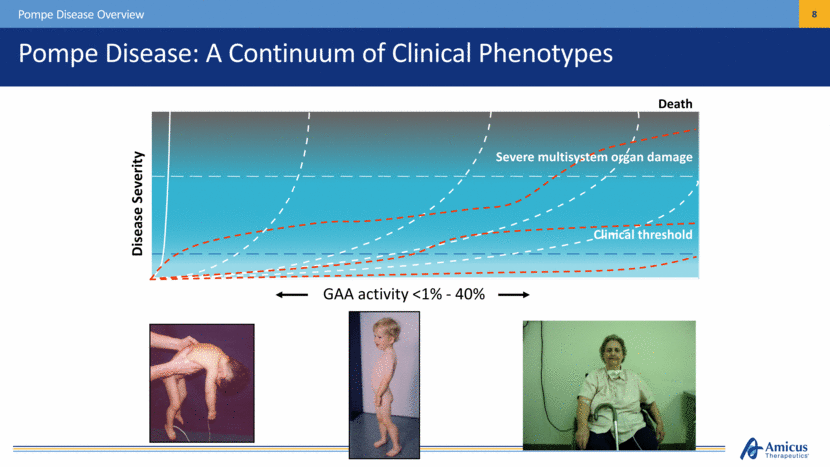
Death Disease Severity Pompe Disease: A Continuum of Clinical Phenotypes Pompe Disease Overview Severe multisystem organ damage Clinical threshold GAA activity <1% - 40% |
|
|
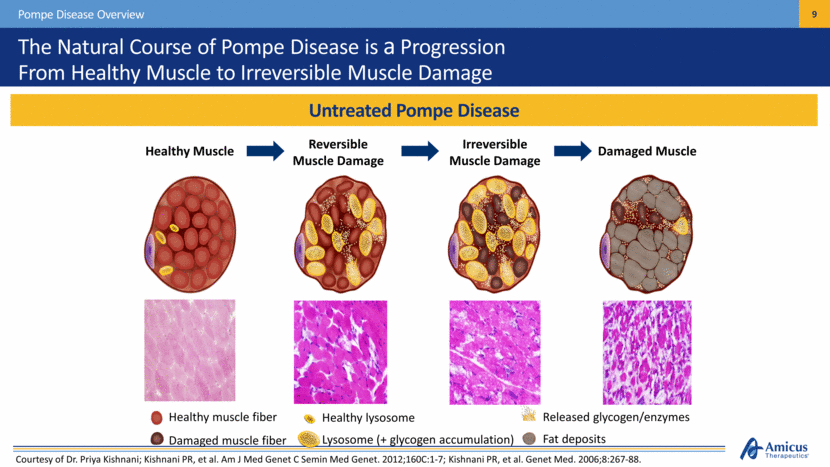
Healthy lysosome Lysosome (+ glycogen accumulation) Healthy muscle fiber Damaged muscle fiber Released glycogen/enzymes Fat deposits The Natural Course of Pompe Disease is a Progression From Healthy Muscle to Irreversible Muscle Damage Untreated Pompe Disease Pompe Disease Overview Damaged Muscle Reversible Muscle Damage Irreversible Muscle Damage Healthy Muscle Courtesy of Dr. Priya Kishnani; Kishnani PR, et al. Am J Med Genet C Semin Med Genet. 2012;160C:1-7; Kishnani PR, et al. Genet Med. 2006;8:267-88. . |
|
|
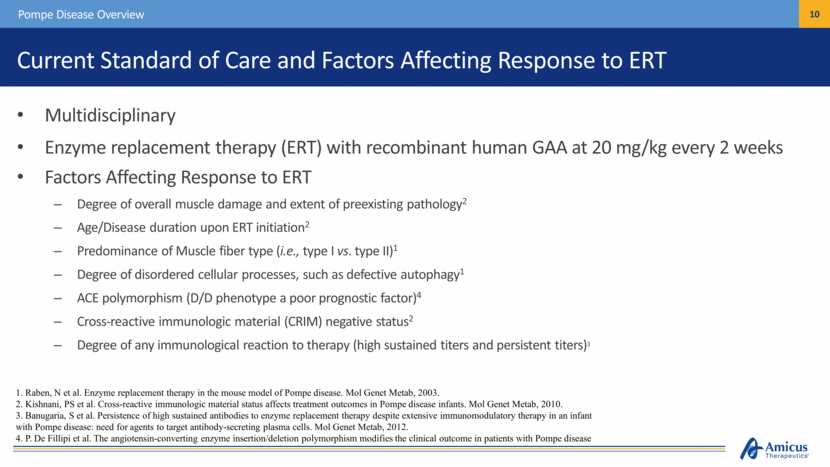
Current Standard of Care and Factors Affecting Response to ERT Multidisciplinary Enzyme replacement therapy (ERT) with recombinant human GAA at 20 mg/kg every 2 weeks Factors Affecting Response to ERT Degree of overall muscle damage and extent of preexisting pathology2 Age/Disease duration upon ERT initiation2 Predominance of Muscle fiber type (i.e., type I vs. type II)1 Degree of disordered cellular processes, such as defective autophagy1 ACE polymorphism (D/D phenotype a poor prognostic factor)4 Cross-reactive immunologic material (CRIM) negative status2 Degree of any immunological reaction to therapy (high sustained titers and persistent titers)3 Pompe Disease Overview 1. Raben, N et al. Enzyme replacement therapy in the mouse model of Pompe disease. Mol Genet Metab, 2003. 2. Kishnani, PS et al. Cross-reactive immunologic material status affects treatment outcomes in Pompe disease infants. Mol Genet Metab, 2010. 3. Banugaria, S et al. Persistence of high sustained antibodies to enzyme replacement therapy despite extensive immunomodulatory therapy in an infant with Pompe disease: need for agents to target antibody-secreting plasma cells. Mol Genet Metab, 2012. 4. P. De Fillipi et al. The angiotensin-converting enzyme insertion/deletion polymorphism modifies the clinical outcome in patients with Pompe disease |
|
|
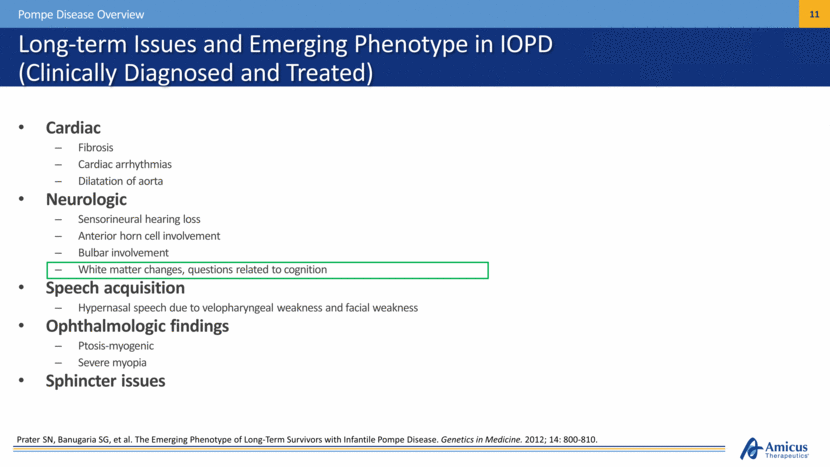
Long-term Issues and Emerging Phenotype in IOPD (Clinically Diagnosed and Treated) Cardiac Fibrosis Cardiac arrhythmias Dilatation of aorta Neurologic Sensorineural hearing loss Anterior horn cell involvement Bulbar involvement White matter changes, questions related to cognition Speech acquisition Hypernasal speech due to velopharyngeal weakness and facial weakness Ophthalmologic findings Ptosis-myogenic Severe myopia Sphincter issues Pompe Disease Overview Prater SN, Banugaria SG, et al. The Emerging Phenotype of Long-Term Survivors with Infantile Pompe Disease. Genetics in Medicine. 2012; 14: 800-810. |
|
|
Issues in Late Onset Pompe Disease Diagnosed late, very clinically heterogenous Response to current ERT typically noted in first 12-18 months, then a stabilization/decline Inefficient targeting of current ERT especially in skeletal muscle (poor M6P receptor in skeletal muscle) Immune response can occur Long duration of infusion Pompe Disease Overview |
|
|
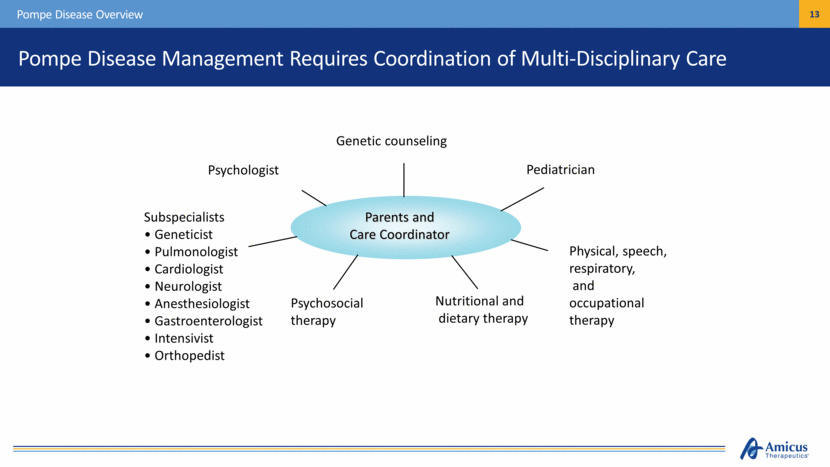
Pompe Disease Management Requires Coordination of Multi-Disciplinary Care Pompe Disease Overview Parents and Care Coordinator Genetic counseling Pediatrician Psychologist Subspecialists Geneticist Pulmonologist Cardiologist Neurologist Anesthesiologist Gastroenterologist Intensivist Orthopedist Psychosocial therapy Nutritional and dietary therapy Physical, speech, respiratory, and occupational therapy |
|
|
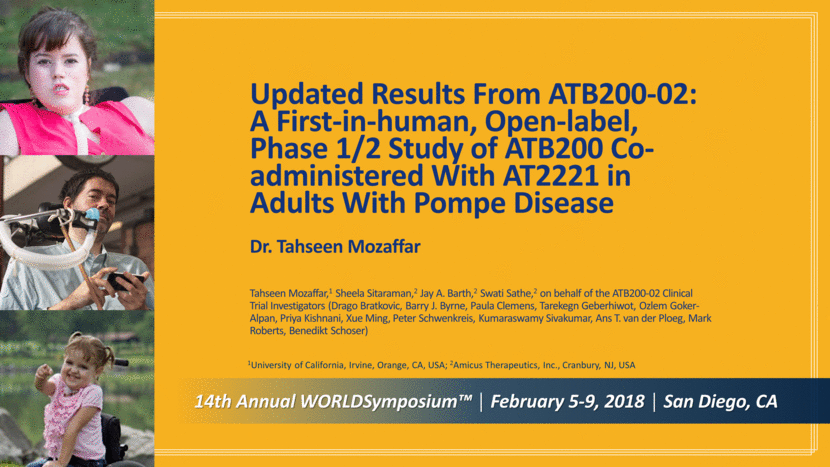
14th Annual WORLDSymposium™ February 5-9, 2018 San Diego, CA Updated Results From ATB200-02: A First-in-human, Open-label, Phase 1/2 Study of ATB200 Co-administered With AT2221 in Adults With Pompe Disease Dr. Tahseen Mozaffar Tahseen Mozaffar,1 Sheela Sitaraman,2 Jay A. Barth,2 Swati Sathe,2 on behalf of the ATB200-02 Clinical Trial Investigators (Drago Bratkovic, Barry J. Byrne, Paula Clemens, Tarekegn Geberhiwot, Ozlem Goker-Alpan, Priya Kishnani, Xue Ming, Peter Schwenkreis, Kumaraswamy Sivakumar, Ans T. van der Ploeg, Mark Roberts, Benedikt Schoser) 1University of California, Irvine, Orange, CA, USA; 2Amicus Therapeutics, Inc., Cranbury, NJ, USA |
|
|
Disclosure Information I have the following financial relationships to disclose: Consultant for Amicus Therapeutics, Inc. Consultant and member of speaker bureau for Genzyme I will discuss the following off-label use and/or investigational use in my presentation: Data from a phase 1/2 trial of ATB200/AT2221 in patients with Pompe disease ATB200 and AT2221 are investigational drugs that have not been approved for use in the United States WORLDSymposium™ 2018 Dr. Tahseen Mozaffar Pompe Overview & Pompe Data Highlights at 14th Annual WorldSymposium™ |
|
|
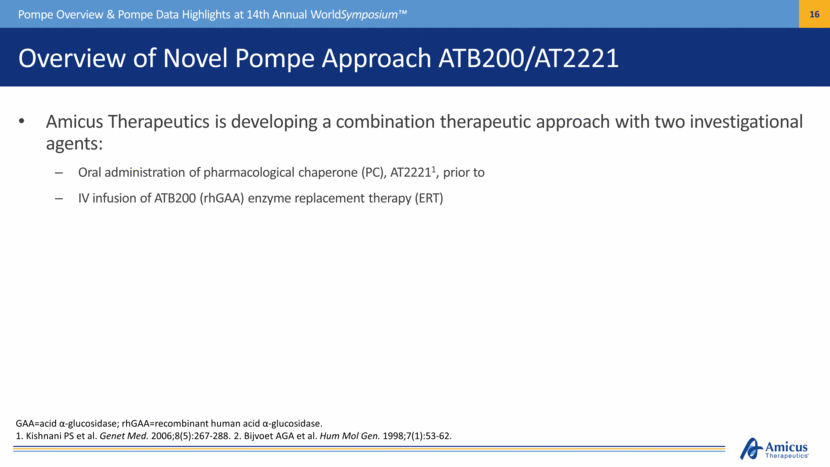
Overview of Novel Pompe Approach ATB200/AT2221 Amicus Therapeutics is developing a combination therapeutic approach with two investigational agents: Oral administration of pharmacological chaperone (PC), AT22211, prior to IV infusion of ATB200 (rhGAA) enzyme replacement therapy (ERT) Pompe Overview & Pompe Data Highlights at 14th Annual WorldSymposium™ GAA=acid -glucosidase; rhGAA=recombinant human acid -glucosidase. 1. Kishnani PS et al. Genet Med. 2006;8(5):267-288. 2. Bijvoet AGA et al. Hum Mol Gen. 1998;7(1):53-62. |
|
|
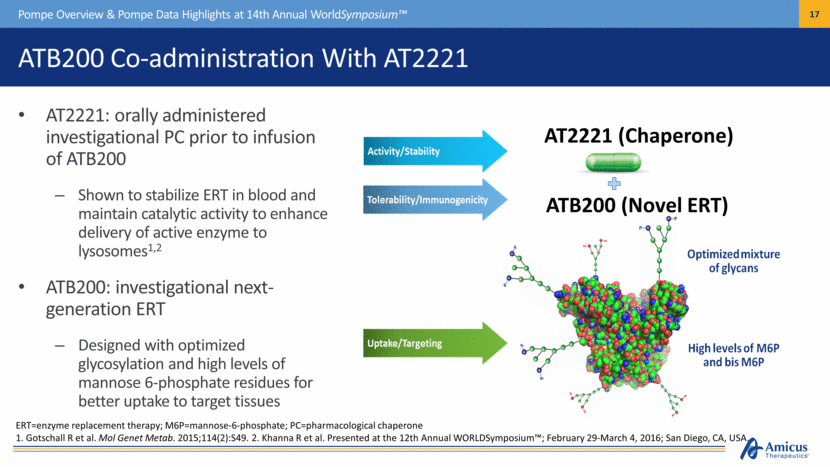
ATB200 Co-administration With AT2221 AT2221: orally administered investigational PC prior to infusion of ATB200 Shown to stabilize ERT in blood and maintain catalytic activity to enhance delivery of active enzyme to lysosomes1,2 ATB200: investigational next-generation ERT Designed with optimized glycosylation and high levels of mannose 6-phosphate residues for better uptake to target tissues Pompe Overview & Pompe Data Highlights at 14th Annual WorldSymposium™ ERT=enzyme replacement therapy; M6P=mannose-6-phosphate; PC=pharmacological chaperone 1. Gotschall R et al. Mol Genet Metab. 2015;114(2):S49. 2. Khanna R et al. Presented at the 12th Annual WORLDSymposium™; February 29-March 4, 2016; San Diego, CA, USA. AT2221 (Chaperone) ATB200 (Novel ERT) |
|
|
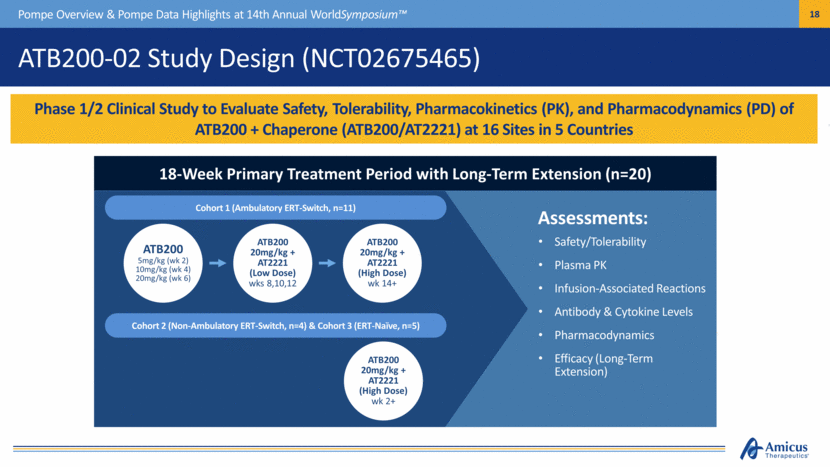
ATB200-02 Study Design (NCT02675465) Phase 1/2 Clinical Study to Evaluate Safety, Tolerability, Pharmacokinetics (PK), and Pharmacodynamics (PD) of ATB200 + Chaperone (ATB200/AT2221) at 16 Sites in 5 Countries Pompe Overview & Pompe Data Highlights at 14th Annual WorldSymposium™ 18-Week Primary Treatment Period with Long-Term Extension (n=20) ATB200 5mg/kg (wk 2) 10mg/kg (wk 4) 20mg/kg (wk 6) ATB200 20mg/kg + AT2221 (Low Dose) wks 8,10,12 ATB200 20mg/kg + AT2221 (High Dose) wk 14+ Cohort 1 (Ambulatory ERT-Switch, n=11) Cohort 2 (Non-Ambulatory ERT-Switch, n=4) & Cohort 3 (ERT-Naïve, n=5) ATB200 20mg/kg + AT2221 (High Dose) wk 2+ Safety/Tolerability Plasma PK Infusion-Associated Reactions Antibody & Cytokine Levels Pharmacodynamics Efficacy (Long-Term Extension) Assessments: |
|
|
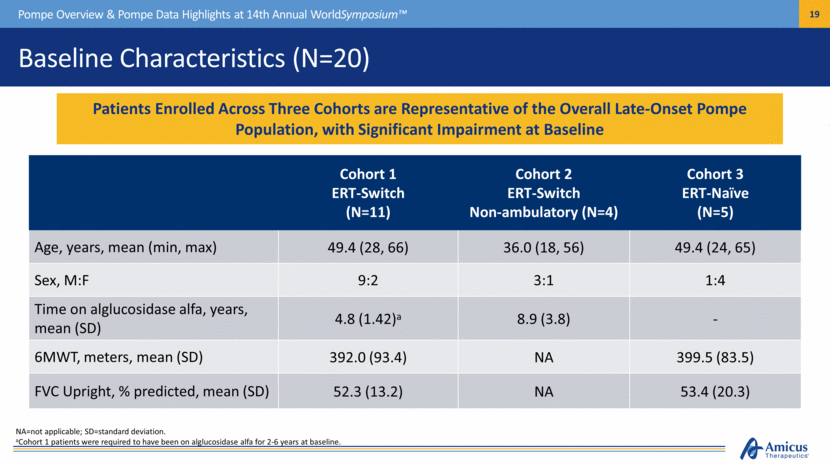
NA=not applicable; SD=standard deviation. aCohort 1 patients were required to have been on alglucosidase alfa for 2-6 years at baseline. Baseline Characteristics (N=20) Pompe Overview & Pompe Data Highlights at 14th Annual WorldSymposium™ Cohort 1 ERT-Switch (N=11) Cohort 2 ERT-Switch Non-ambulatory (N=4) Cohort 3 ERT-Naïve (N=5) Age, years, mean (min, max) 49.4 (28, 66) 36.0 (18, 56) 49.4 (24, 65) Sex, M:F 9:2 3:1 1:4 Time on alglucosidase alfa, years, mean (SD) 4.8 (1.42)a 8.9 (3.8) - 6MWT, meters, mean (SD) 392.0 (93.4) NA 399.5 (83.5) FVC Upright, % predicted, mean (SD) 52.3 (13.2) NA 53.4 (20.3) Patients Enrolled Across Three Cohorts are Representative of the Overall Late-Onset Pompe Population, with Significant Impairment at Baseline |
|
|
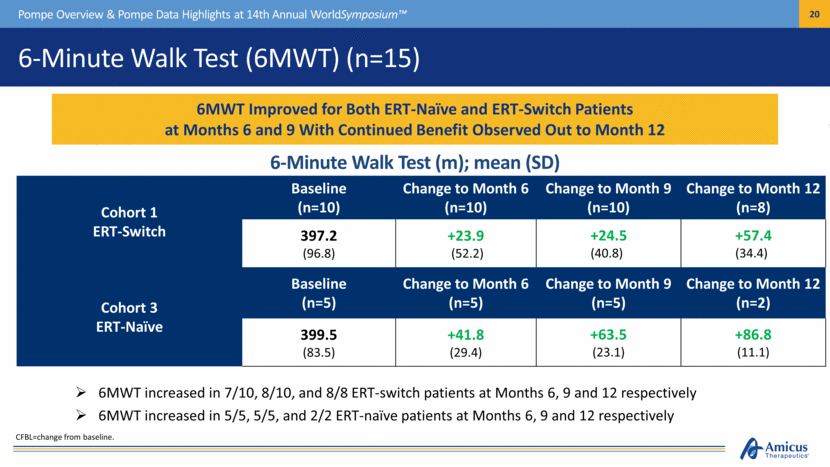
6-Minute Walk Test (6MWT) (n=15) Pompe Overview & Pompe Data Highlights at 14th Annual WorldSymposium™ Cohort 1 ERT-Switch Baseline (n=10) Change to Month 6 (n=10) Change to Month 9 (n=10) Change to Month 12 (n=8) 397.2 (96.8) +23.9 (52.2) +24.5 (40.8) +57.4 (34.4) Cohort 3 ERT-Naïve Baseline (n=5) Change to Month 6 (n=5) Change to Month 9 (n=5) Change to Month 12 (n=2) 399.5 (83.5) +41.8 (29.4) +63.5 (23.1) +86.8 (11.1) 6MWT increased in 7/10, 8/10, and 8/8 ERT-switch patients at Months 6, 9 and 12 respectively 6MWT increased in 5/5, 5/5, and 2/2 ERT-naïve patients at Months 6, 9 and 12 respectively 6MWT Improved for Both ERT-Naïve and ERT-Switch Patients at Months 6 and 9 With Continued Benefit Observed Out to Month 12 CFBL=change from baseline. 6-Minute Walk Test (m); mean (SD) |
|
|
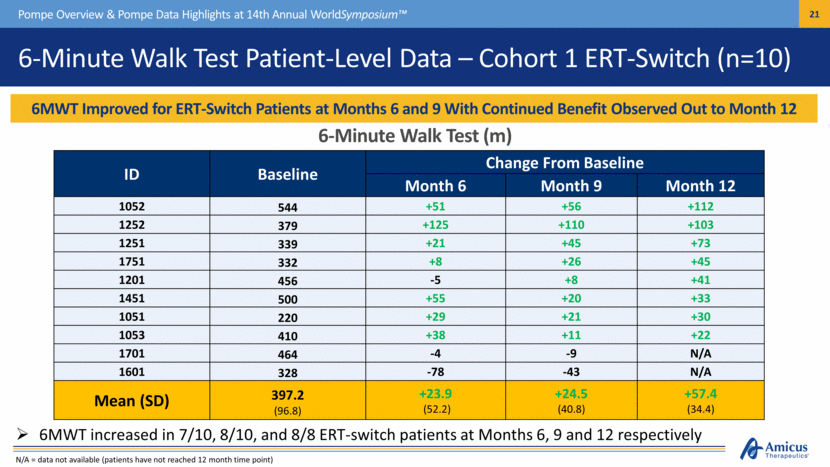
6-Minute Walk Test Patient-Level Data – Cohort 1 ERT-Switch (n=10) 6MWT Improved for ERT-Switch Patients at Months 6 and 9 With Continued Benefit Observed Out to Month 12 Pompe Overview & Pompe Data Highlights at 14th Annual WorldSymposium™ 6-Minute Walk Test (m) ID Baseline Change From Baseline Month 6 Month 9 Month 12 1052 544 +51 +56 +112 1252 379 +125 +110 +103 1251 339 +21 +45 +73 1751 332 +8 +26 +45 1201 456 -5 +8 +41 1451 500 +55 +20 +33 1051 220 +29 +21 +30 1053 410 +38 +11 +22 1701 464 -4 -9 N/A 1601 328 -78 -43 N/A Mean (SD) 397.2 (96.8) +23.9 (52.2) +24.5 (40.8) +57.4 (34.4) 6MWT increased in 7/10, 8/10, and 8/8 ERT-switch patients at Months 6, 9 and 12 respectively N/A = data not available (patients have not reached 12 month time point) |
|
|
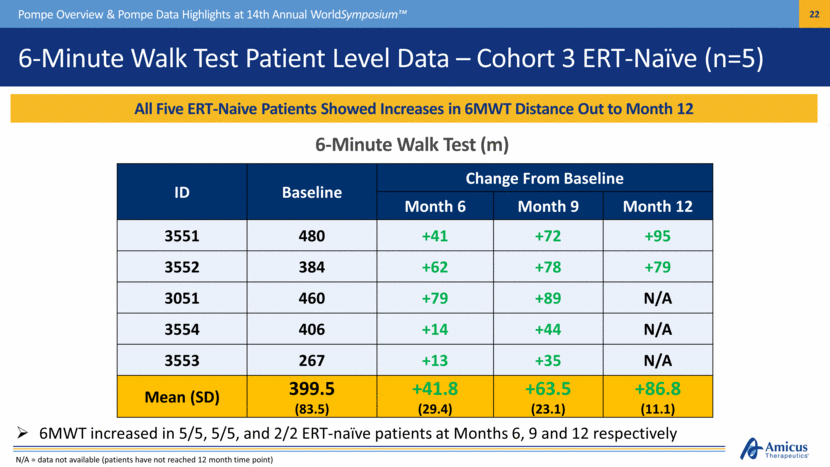
6-Minute Walk Test Patient Level Data – Cohort 3 ERT-Naïve (n=5) All Five ERT-Naive Patients Showed Increases in 6MWT Distance Out to Month 12 Pompe Overview & Pompe Data Highlights at 14th Annual WorldSymposium™ 6-Minute Walk Test (m) ID Baseline Change From Baseline Month 6 Month 9 Month 12 3551 480 +41 +72 +95 3552 384 +62 +78 +79 3051 460 +79 +89 N/A 3554 406 +14 +44 N/A 3553 267 +13 +35 N/A Mean (SD) 399.5 (83.5) +41.8 (29.4) +63.5 (23.1) +86.8 (11.1) 6MWT increased in 5/5, 5/5, and 2/2 ERT-naïve patients at Months 6, 9 and 12 respectively N/A = data not available (patients have not reached 12 month time point) |
|
|
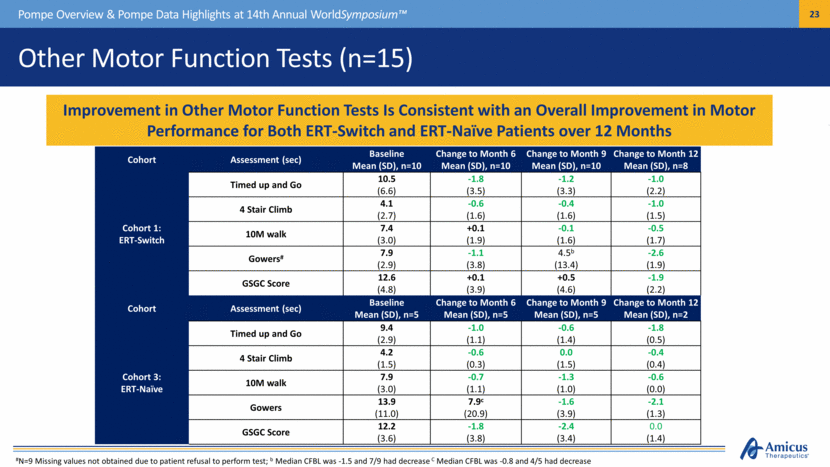
Other Motor Function Tests (n=15) Pompe Overview & Pompe Data Highlights at 14th Annual WorldSymposium™ Improvement in Other Motor Function Tests Is Consistent with an Overall Improvement in Motor Performance for Both ERT-Switch and ERT-Naïve Patients over 12 Months Cohort Assessment (sec) Baseline Mean (SD), n=10 Change to Month 6 Mean (SD), n=10 Change to Month 9 Mean (SD), n=10 Change to Month 12 Mean (SD), n=8 Cohort 1: ERT-Switch Timed up and Go 10.5 (6.6) -1.8 (3.5) -1.2 (3.3) -1.0 (2.2) 4 Stair Climb 4.1 (2.7) -0.6 (1.6) -0.4 (1.6) -1.0 (1.5) 10M walk 7.4 (3.0) +0.1 (1.9) -0.1 (1.6) -0.5 (1.7) Gowers# 7.9 (2.9) -1.1 (3.8) 4.5b (13.4) -2.6 (1.9) GSGC Score 12.6 (4.8) +0.1 (3.9) +0.5 (4.6) -1.9 (2.2) Cohort Assessment (sec) Baseline Mean (SD), n=5 Change to Month 6 Mean (SD), n=5 Change to Month 9 Mean (SD), n=5 Change to Month 12 Mean (SD), n=2 Cohort 3: ERT-Naïve Timed up and Go 9.4 (2.9) -1.0 (1.1) -0.6 (1.4) -1.8 (0.5) 4 Stair Climb 4.2 (1.5) -0.6 (0.3) 0.0 (1.5) -0.4 (0.4) 10M walk 7.9 (3.0) -0.7 (1.1) -1.3 (1.0) -0.6 (0.0) Gowers 13.9 (11.0) 7.9c (20.9) -1.6 (3.9) -2.1 (1.3) GSGC Score 12.2 (3.6) -1.8 (3.8) -2.4 (3.4) 0.0 (1.4) #N=9 Missing values not obtained due to patient refusal to perform test; b Median CFBL was -1.5 and 7/9 had decrease C Median CFBL was -0.8 and 4/5 had decrease |
|
|
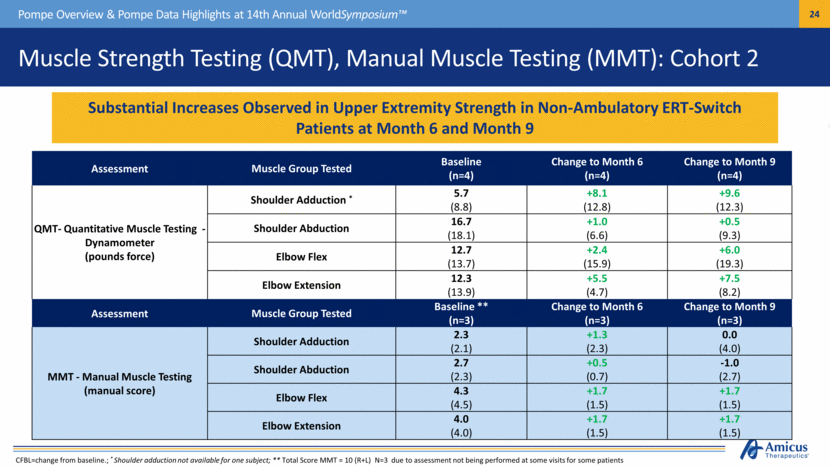
Muscle Strength Testing (QMT), Manual Muscle Testing (MMT): Cohort 2 Pompe Overview & Pompe Data Highlights at 14th Annual WorldSymposium™ Substantial Increases Observed in Upper Extremity Strength in Non-Ambulatory ERT-Switch Patients at Month 6 and Month 9 CFBL=change from baseline.; * Shoulder adduction not available for one subject; ** Total Score MMT = 10 (R+L) N=3 due to assessment not being performed at some visits for some patients Assessment Muscle Group Tested Baseline (n=4) Change to Month 6 (n=4) Change to Month 9 (n=4) QMT- Quantitative Muscle Testing Dynamometer (pounds force) Shoulder Adduction * 5.7 (8.8) +8.1 (12.8) +9.6 (12.3) Shoulder Abduction 16.7 (18.1) +1.0 (6.6) +0.5 (9.3) Elbow Flex 12.7 (13.7) +2.4 (15.9) +6.0 (19.3) Elbow Extension 12.3 (13.9) +5.5 (4.7) +7.5 (8.2) Assessment Muscle Group Tested Baseline ** (n=3) Change to Month 6 (n=3) Change to Month 9 (n=3) MMT - Manual Muscle Testing (manual score) Shoulder Adduction 2.3 (2.1) +1.3 (2.3) 0.0 (4.0) Shoulder Abduction 2.7 (2.3) +0.5 (0.7) -1.0 (2.7) Elbow Flex 4.3 (4.5) +1.7 (1.5) +1.7 (1.5) Elbow Extension 4.0 (4.0) +1.7 (1.5) +1.7 (1.5) |
|
|
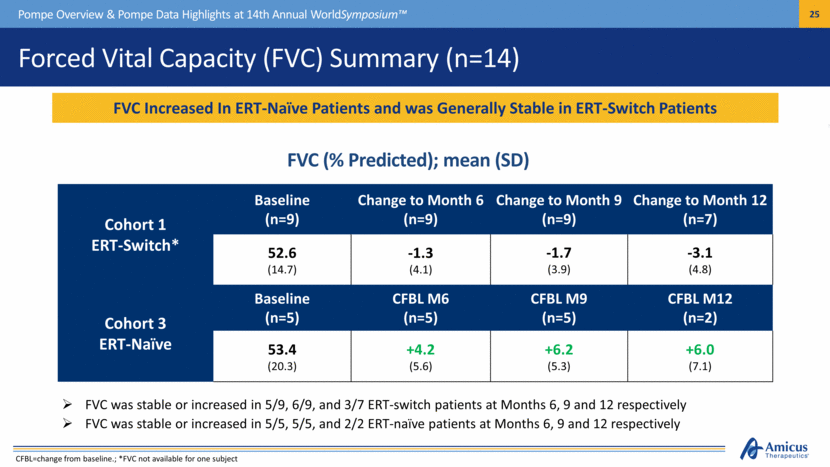
Forced Vital Capacity (FVC) Summary (n=14) Pompe Overview & Pompe Data Highlights at 14th Annual WorldSymposium™ Cohort 1 ERT-Switch* Baseline (n=9) Change to Month 6 (n=9) Change to Month 9 (n=9) Change to Month 12 (n=7) 52.6 (14.7) -1.3 (4.1) -1.7 (3.9) -3.1 (4.8) Cohort 3 ERT-Naïve Baseline (n=5) CFBL M6 (n=5) CFBL M9 (n=5) CFBL M12 (n=2) 53.4 (20.3) +4.2 (5.6) +6.2 (5.3) +6.0 (7.1) FVC was stable or increased in 5/9, 6/9, and 3/7 ERT-switch patients at Months 6, 9 and 12 respectively FVC was stable or increased in 5/5, 5/5, and 2/2 ERT-naïve patients at Months 6, 9 and 12 respectively FVC Increased In ERT-Naïve Patients and was Generally Stable in ERT-Switch Patients FVC (% Predicted); mean (SD) CFBL=change from baseline.; *FVC not available for one subject |
|
|
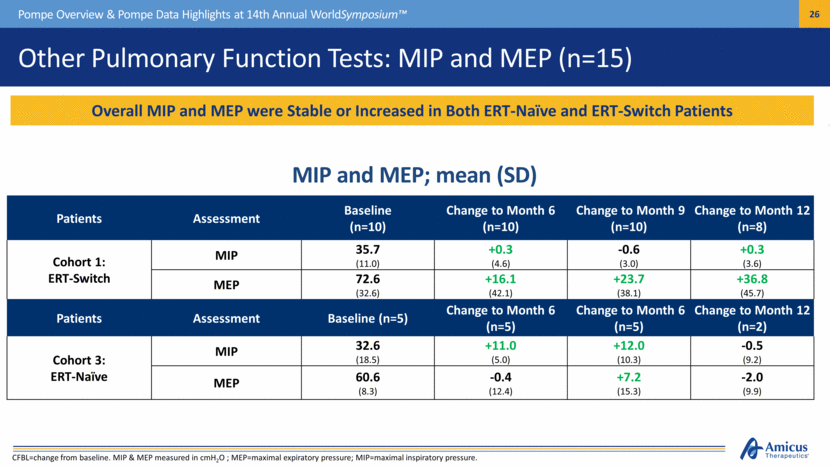
Other Pulmonary Function Tests: MIP and MEP (n=15) Patients Assessment Baseline (n=10) Change to Month 6 (n=10) Change to Month 9 (n=10) Change to Month 12 (n=8) Cohort 1: ERT-Switch MIP 35.7 (11.0) +0.3 (4.6) -0.6 (3.0) +0.3 (3.6) MEP 72.6 (32.6) +16.1 (42.1) +23.7 (38.1) +36.8 (45.7) Patients Assessment Baseline (n=5) Change to Month 6 (n=5) Change to Month 6 (n=5) Change to Month 12 (n=2) Cohort 3: ERT-Naïve MIP 32.6 (18.5) +11.0 (5.0) +12.0 (10.3) -0.5 (9.2) MEP 60.6 (8.3) -0.4 (12.4) +7.2 (15.3) -2.0 (9.9) Pompe Overview & Pompe Data Highlights at 14th Annual WorldSymposium™ Overall MIP and MEP were Stable or Increased in Both ERT-Naïve and ERT-Switch Patients MIP and MEP; mean (SD) CFBL=change from baseline. MIP & MEP measured in cmH2O ; MEP=maximal expiratory pressure; MIP=maximal inspiratory pressure. |
|
|
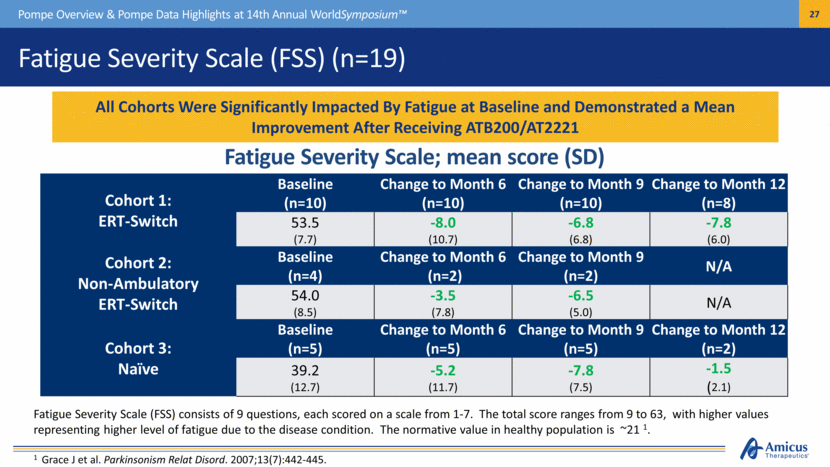
Fatigue Severity Scale (FSS) (n=19) Pompe Overview & Pompe Data Highlights at 14th Annual WorldSymposium™ Cohort 1: ERT-Switch Baseline (n=10) Change to Month 6 (n=10) Change to Month 9 (n=10) Change to Month 12 (n=8) 53.5 (7.7) -8.0 (10.7) -6.8 (6.8) -7.8 (6.0) Cohort 2: Non-Ambulatory ERT-Switch Baseline (n=4) Change to Month 6 (n=2) Change to Month 9 (n=2) N/A 54.0 (8.5) -3.5 (7.8) -6.5 (5.0) N/A Cohort 3: Naïve Baseline (n=5) Change to Month 6 (n=5) Change to Month 9 (n=5) Change to Month 12 (n=2) 39.2 (12.7) -5.2 (11.7) -7.8 (7.5) -1.5 (2.1) All Cohorts Were Significantly Impacted By Fatigue at Baseline and Demonstrated a Mean Improvement After Receiving ATB200/AT2221 Fatigue Severity Scale; mean score (SD) Fatigue Severity Scale (FSS) consists of 9 questions, each scored on a scale from 1-7. The total score ranges from 9 to 63, with higher values representing higher level of fatigue due to the disease condition. The normative value in healthy population is ~21 1. 1 Grace J et al. Parkinsonism Relat Disord. 2007;13(7):442-445. |
|
|
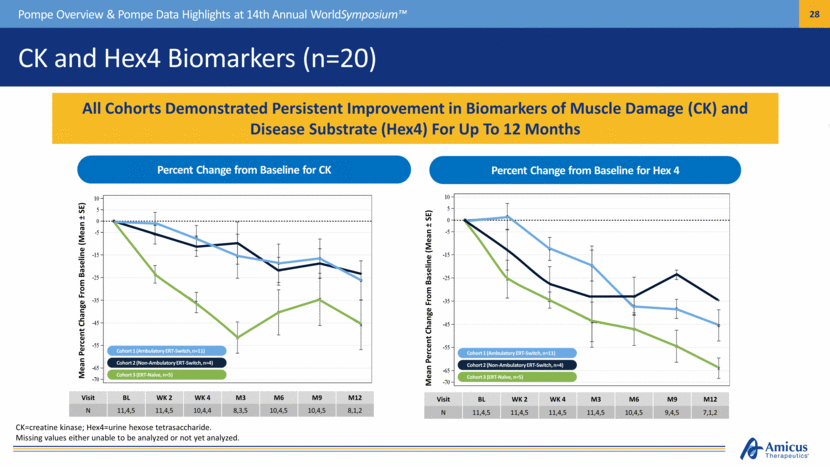
CK and Hex4 Biomarkers (n=20) Pompe Overview & Pompe Data Highlights at 14th Annual WorldSymposium™ Mean Percent Change From Baseline (Mean ± SE) Visit BL WK 2 WK 4 M3 M6 M9 M12 N 11,4,5 11,4,5 10,4,4 8,3,5 10,4,5 10,4,5 8,1,2 Mean Percent Change From Baseline (Mean ± SE) All Cohorts Demonstrated Persistent Improvement in Biomarkers of Muscle Damage (CK) and Disease Substrate (Hex4) For Up To 12 Months Visit BL WK 2 WK 4 M3 M6 M9 M12 N 11,4,5 11,4,5 11,4,5 11,4,5 10,4,5 9,4,5 7,1,2 Percent Change from Baseline for CK Percent Change from Baseline for Hex 4 Cohort 1 (Ambulatory ERT-Switch, n=11) Cohort 2 (Non-Ambulatory ERT-Switch, n=4) Cohort 3 (ERT-Naïve, n=5) Cohort 1 (Ambulatory ERT-Switch, n=11) Cohort 2 (Non-Ambulatory ERT-Switch, n=4) Cohort 3 (ERT-Naïve, n=5) CK=creatine kinase; Hex4=urine hexose tetrasaccharide. Missing values either unable to be analyzed or not yet analyzed. |
|
|
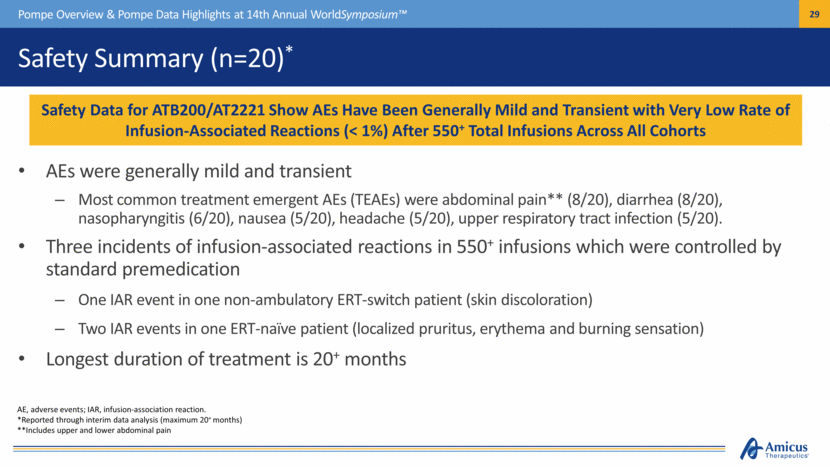
AE, adverse events; IAR, infusion-association reaction. *Reported through interim data analysis (maximum 20+ months) **Includes upper and lower abdominal pain Safety Summary (n=20)* AEs were generally mild and transient Most common treatment emergent AEs (TEAEs) were abdominal pain** (8/20), diarrhea (8/20), nasopharyngitis (6/20), nausea (5/20), headache (5/20), upper respiratory tract infection (5/20). Three incidents of infusion-associated reactions in 550+ infusions which were controlled by standard premedication One IAR event in one non-ambulatory ERT-switch patient (skin discoloration) Two IAR events in one ERT-naïve patient (localized pruritus, erythema and burning sensation) Longest duration of treatment is 20+ months Pompe Overview & Pompe Data Highlights at 14th Annual WorldSymposium™ Safety Data for ATB200/AT2221 Show AEs Have Been Generally Mild and Transient with Very Low Rate of Infusion Associated Reactions (< 1%) After 550+ Total Infusions Across All Cohorts |
|
|
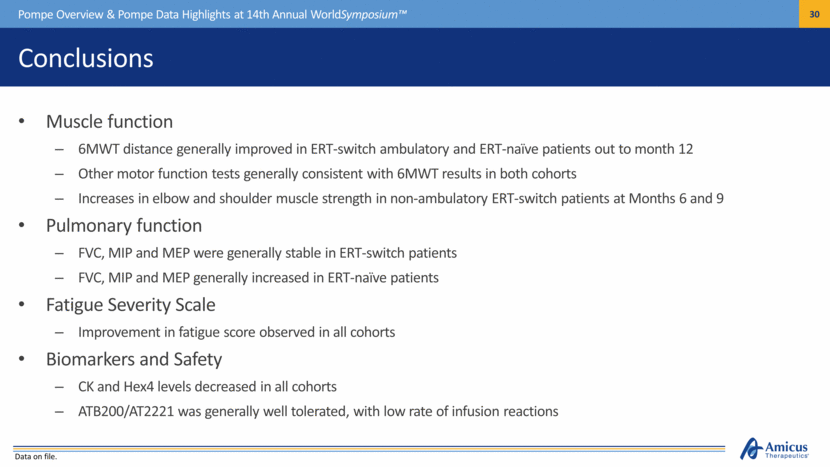
Conclusions Muscle function 6MWT distance generally improved in ERT-switch ambulatory and ERT-naïve patients out to month 12 Other motor function tests generally consistent with 6MWT results in both cohorts Increases in elbow and shoulder muscle strength in non-ambulatory ERT-switch patients at Months 6 and 9 Pulmonary function FVC, MIP and MEP were generally stable in ERT-switch patients FVC, MIP and MEP generally increased in ERT-naïve patients Fatigue Severity Scale Improvement in fatigue score observed in all cohorts Biomarkers and Safety CK and Hex4 levels decreased in all cohorts ATB200/AT2221 was generally well tolerated, with low rate of infusion reactions Pompe Overview & Pompe Data Highlights at 14th Annual WorldSymposium™ Data on file. |
|
|
Acknowledgments The authors thank the patients, their families, and Pompe disease patient organizations, as well as the study investigators Third-party medical editing assistance was provided by ApotheCom and was supported by Amicus Therapeutics, Inc. Pompe Overview & Pompe Data Highlights at 14th Annual WorldSymposium™ |
|
|
Thank You |

