Attached files
| file | filename |
|---|---|
| EX-99.1 - EXHIBIT 99.1 - Atkore Inc. | atkr1q18exhibit991.htm |
| 8-K - 8-K - Atkore Inc. | atkr1q18form8-k.htm |

First Quarter 2018 Earnings Presentation
February 6, 2018

This presentation contains forward-looking statements that are subject to known and unknown risks and uncertainties, many of which are beyond our control. All statements other than statements of historical
fact included in this presentation are forward-looking statements. Forward-looking statements appearing throughout this presentation include, without limitation, statements regarding our intentions, beliefs,
assumptions or current expectations concerning, among other things, financial position; results of operations; cash flows; prospects; growth strategies or expectations; customer retention; the outcome (by
judgment or settlement) and costs of legal, administrative or regulatory proceedings, investigations or inspections, including, without limitation, collective, representative or any other litigation; and the impact of
prevailing economic conditions. You can identify forward-looking statements by the fact that they do not relate strictly to historical or current facts. These statements may include words such as “believes,”
“expects,” “may,” “will,” “shall,” “should,” “would,” “could,” “seeks,” “aims,” “projects,” “is optimistic,” “intends,” “plans,” “estimates,” “anticipates” and other comparable terms. We caution you that forward-looking
statements are not guarantees of future performance or outcomes and that actual performance and outcomes, including, without limitation, our actual results of operations, financial condition and liquidity, and
the development of the market in which we operate, may differ materially from those made in or suggested by the forward-looking statements contained in this presentation. In addition, even if our results of
operations, financial condition and cash flows, and the development of the market in which we operate, are consistent with the forward-looking statements contained in this presentation, those results or
developments may not be indicative of results or developments in subsequent periods. A number of important factors, including, without limitation, the risks and uncertainties discussed under the captions “Risk
Factors” and “Management’s Discussion and Analysis of Financial Condition and Results of Operations” in the Quarterly Report on Form 10-Q for the fiscal quarter ended December 29, 2017, filed with the U.S.
Securities and Exchange Commission on February 6, 2017(File No. 001-37793), could cause actual results and outcomes to differ materially from those reflected in the forward-looking statements. Because of
these risks, we caution that you should not place undue reliance on any of our forward-looking statements. New risks and uncertainties arise from time to time, and it is impossible for us to predict those events
or how they may affect us. Further, any forward-looking statement speaks only as of the date on which it is made. We undertake no obligation to revise the forward-looking statements in this presentation after
the date of this presentation.
Market data and industry information used throughout this presentation are based on management’s knowledge of the industry and the good faith estimates of management. We also relied, to the extent
available, upon management’s review of independent industry surveys, forecasts and publications and other publicly available information prepared by a number of third party sources. All of the market data
and industry information used in this presentation involves a number of assumptions and limitations which we believe to be reasonable, and you are cautioned not to give undue weight to such estimates.
Although we believe that these sources are reliable, we cannot guarantee the accuracy or completeness of this information, and we have not independently verified this information. While we believe the
estimated market position, market opportunity and market size information included in this presentation are generally reliable, such information, which is derived in part from management’s estimates and
beliefs, is inherently uncertain and imprecise. Projections, assumptions and estimates of our future performance and the future performance of the industry in which we operate are subject to a high degree of
uncertainty and risk due to a variety of factors, including those described above. These and other factors could cause results to differ materially from those expressed in our estimates and beliefs and in the
estimates prepared by independent parties.
We present Adjusted EBITDA, Adjusted EBITDA margin (Adjusted EBITDA over Net Sales), Net debt (total debt less cash and cash equivalents), Adjusted Net Income Per Share, and Leverage ratio (net debt
or total debt less cash and cash equivalents, over Adjusted EBITDA on trailing twelve month basis) to help us describe our operating and financial performance. Adjusted EBITDA, Adjusted EBITDA margin,
Net debt (total debt less cash and cash equivalents), Adjusted Net Income Per Share, and Leverage ratio are non-GAAP financial measures commonly used in our industry and have certain limitations and
should not be construed as alternatives to net income, net sales and other income data measures (as determined in accordance with generally accepted accounting principles in the United States, or GAAP), or
as better indicators of operating performance. Adjusted EBITDA, Adjusted EBITDA margin, Net debt, Adjusted Net Income Per Share, and Leverage ratio, as defined by us may not be comparable to similar
non-GAAP measures presented by other issuers. Our presentation of such measures should not be construed as an inference that our future results will be unaffected by unusual or non-recurring items. See
the appendix to this presentation for a reconciliation of Adjusted EBITDA to net income, Adjusted EBITDA Margin, Adjusted Net Income Per Share to Net Income Per Share, net debt to total debt, and Leverage
Ratio.
Fiscal Periods - The Company has a fiscal year that ends on September 30th. It is the Company's practice to establish quarterly closings using a 4-5-4 calendar. The Company's fiscal quarters end on the last
Friday in December, March and June.
Cautionary statements
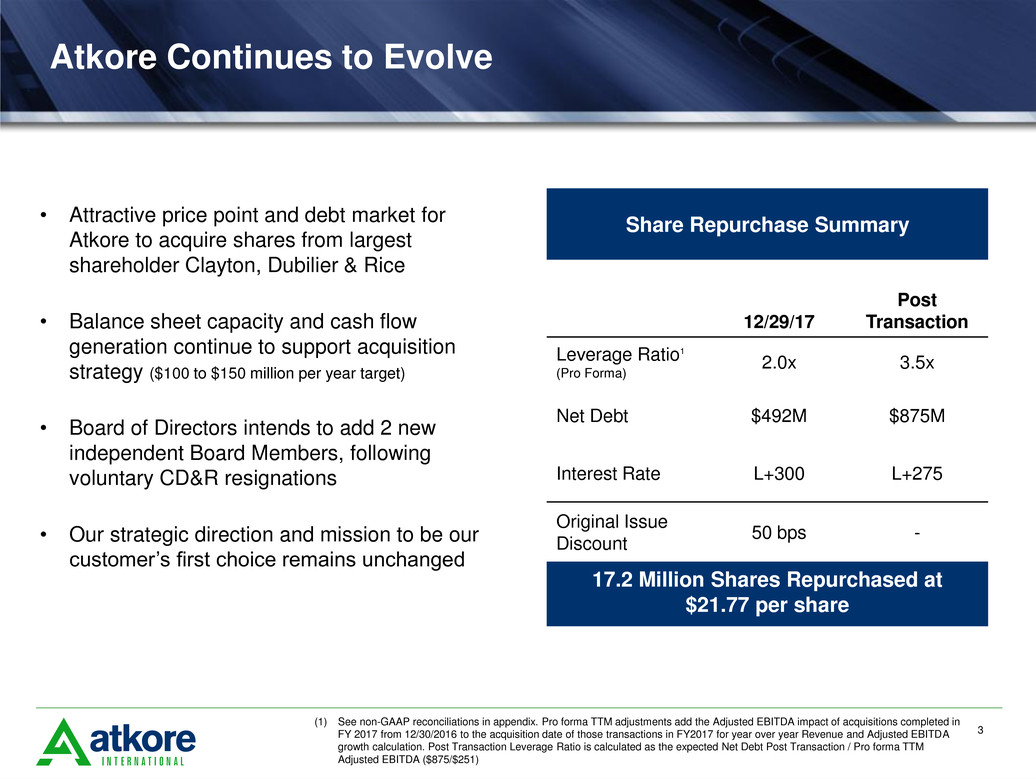
Atkore Continues to Evolve
• Attractive price point and debt market for
Atkore to acquire shares from largest
shareholder Clayton, Dubilier & Rice
• Balance sheet capacity and cash flow
generation continue to support acquisition
strategy ($100 to $150 million per year target)
• Board of Directors intends to add 2 new
independent Board Members, following
voluntary CD&R resignations
• Our strategic direction and mission to be our
customer’s first choice remains unchanged
1
3
Share Repurchase Summary
12/29/17
Post
Transaction
Leverage Ratio1
(Pro Forma)
2.0x 3.5x
Net Debt $492M $875M
Interest Rate L+300 L+275
Original Issue
Discount
50 bps -
17.2 Million Shares Repurchased at
$21.77 per share
(1) See non-GAAP reconciliations in appendix. Pro forma TTM adjustments add the Adjusted EBITDA impact of acquisitions completed in
FY 2017 from 12/30/2016 to the acquisition date of those transactions in FY2017 for year over year Revenue and Adjusted EBITDA
growth calculation. Post Transaction Leverage Ratio is calculated as the expected Net Debt Post Transaction / Pro forma TTM
Adjusted EBITDA ($875/$251)
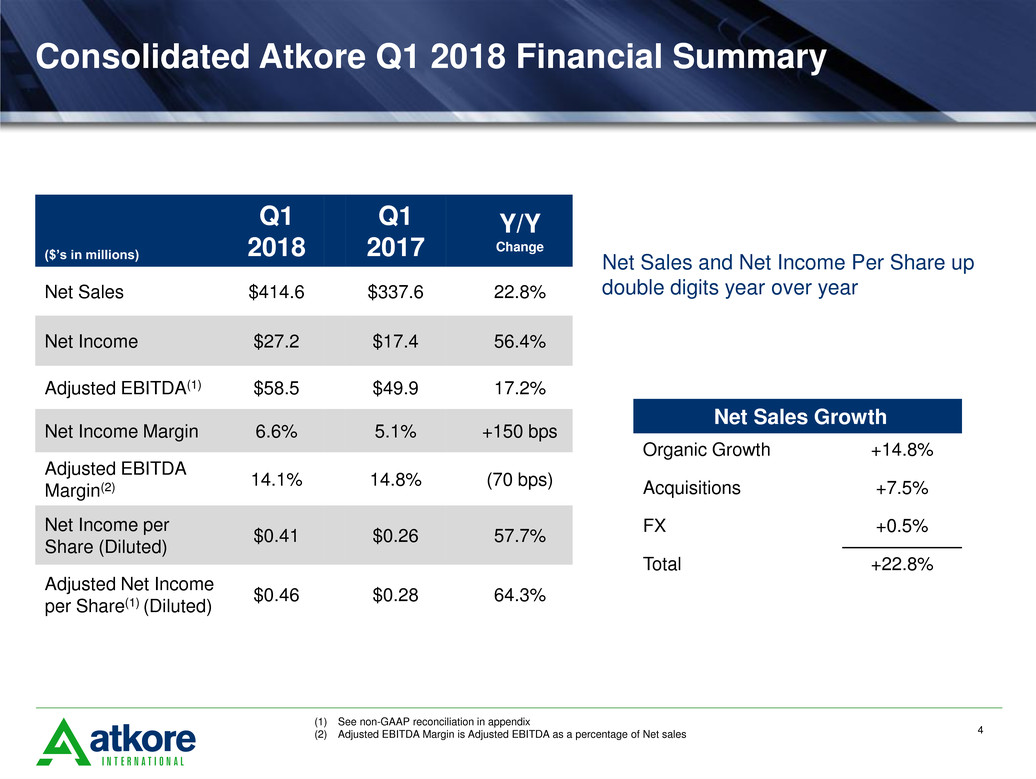
Consolidated Atkore Q1 2018 Financial Summary
($’s in millions)
Q1
2018
Q1
2017
Y/Y
Change
Net Sales $414.6 $337.6 22.8%
Net Income $27.2 $17.4 56.4%
Adjusted EBITDA(1) $58.5 $49.9 17.2%
Net Income Margin 6.6% 5.1% +150 bps
Adjusted EBITDA
Margin(2)
14.1% 14.8% (70 bps)
Net Income per
Share (Diluted)
$0.41 $0.26 57.7%
Adjusted Net Income
per Share(1) (Diluted)
$0.46 $0.28 64.3%
(1) See non-GAAP reconciliation in appendix
(2) Adjusted EBITDA Margin is Adjusted EBITDA as a percentage of Net sales
Net Sales Growth
Organic Growth +14.8%
Acquisitions +7.5%
FX +0.5%
Total +22.8%
Net Sales and Net Income Per Share up
double digits year over year
4
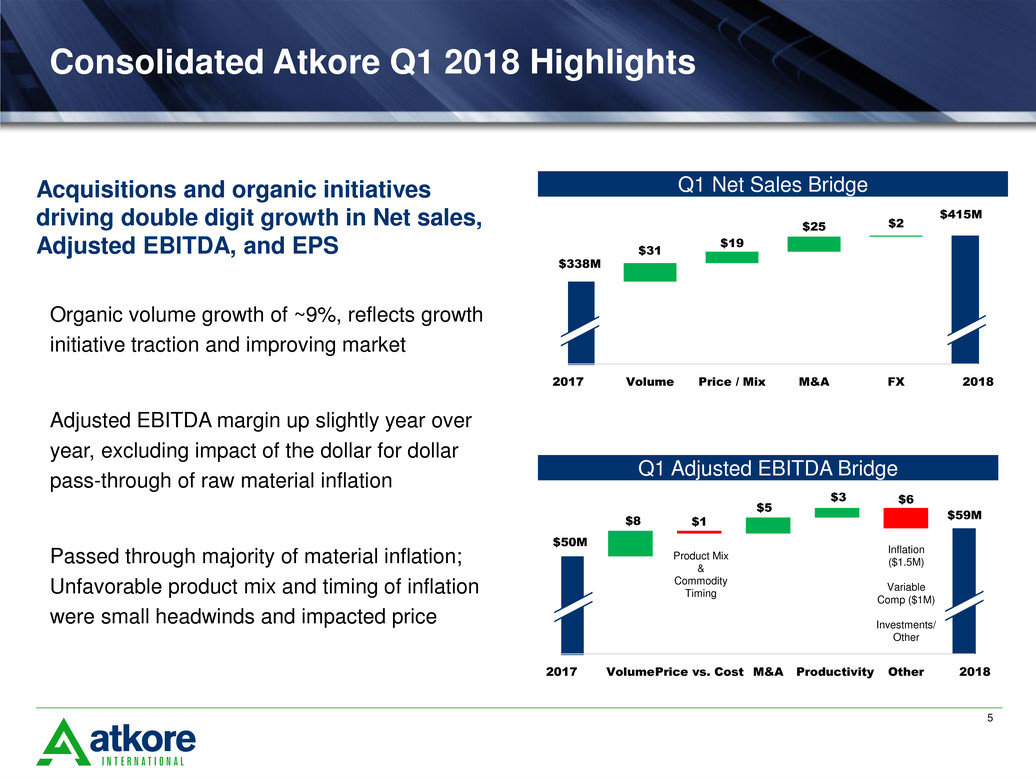
Consolidated Atkore Q1 2018 Highlights
$59M
$1
$6
$50M
$8
$5
$3
2017 VolumePrice vs. Cost M&A Productivity Other 2018
$415M
$338M
$31
$19
$25 $2
2017 Volume Price / Mix M&A FX 2018
Acquisitions and organic initiatives
driving double digit growth in Net sales,
Adjusted EBITDA, and EPS
Organic volume growth of ~9%, reflects growth
initiative traction and improving market
Adjusted EBITDA margin up slightly year over
year, excluding impact of the dollar for dollar
pass-through of raw material inflation
Passed through majority of material inflation;
Unfavorable product mix and timing of inflation
were small headwinds and impacted price
Q1 Net Sales Bridge
Q1 Adjusted EBITDA Bridge
Inflation
($1.5M)
Variable
Comp ($1M)
Investments/
Other
Product Mix
&
Commodity
Timing
5
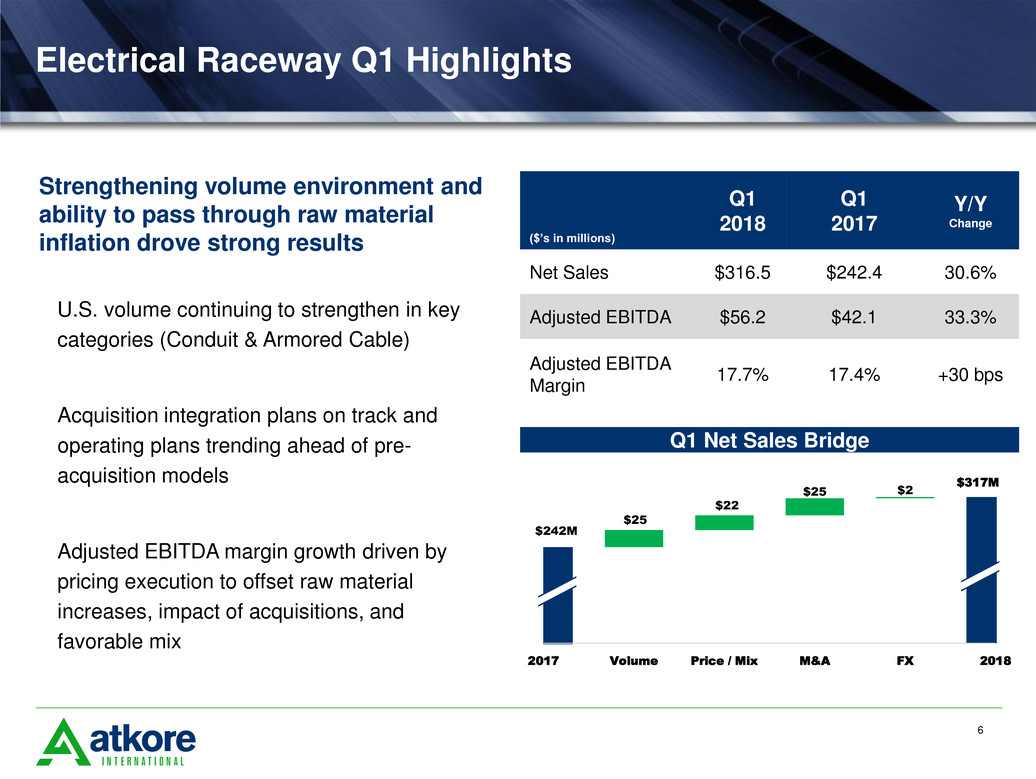
Electrical Raceway Q1 Highlights
U.S. volume continuing to strengthen in key
categories (Conduit & Armored Cable)
Acquisition integration plans on track and
operating plans trending ahead of pre-
acquisition models
Adjusted EBITDA margin growth driven by
pricing execution to offset raw material
increases, impact of acquisitions, and
favorable mix
$317M
$242M
$25
$22
$25 $2
2017 Volume Price / Mix M&A FX 2018
Q1 Net Sales Bridge
Strengthening volume environment and
ability to pass through raw material
inflation drove strong results ($’s in millions)
Q1
2018
Q1
2017
Y/Y
Change
Net Sales $316.5 $242.4 30.6%
Adjusted EBITDA $56.2 $42.1 33.3%
Adjusted EBITDA
Margin
17.7% 17.4% +30 bps
6
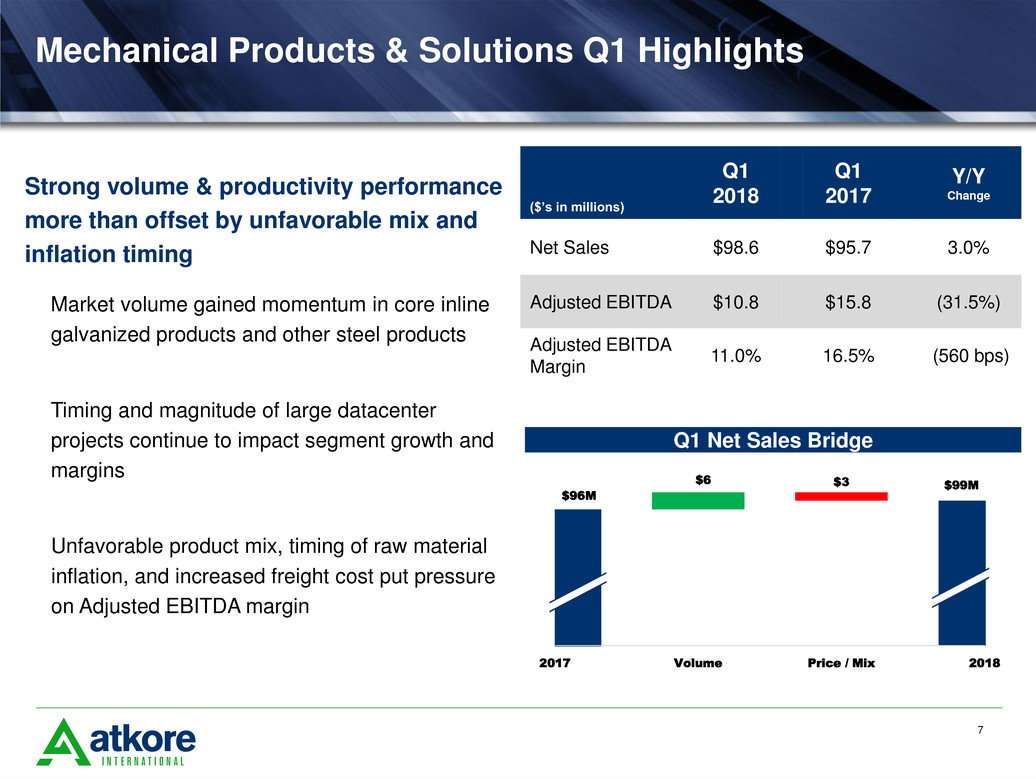
Mechanical Products & Solutions Q1 Highlights
Market volume gained momentum in core inline
galvanized products and other steel products
Timing and magnitude of large datacenter
projects continue to impact segment growth and
margins
Unfavorable product mix, timing of raw material
inflation, and increased freight cost put pressure
on Adjusted EBITDA margin
Strong volume & productivity performance
more than offset by unfavorable mix and
inflation timing
$99M$3
$96M
$6
2017 Volume Price / Mix 2018
($’s in millions)
Q1
2018
Q1
2017
Y/Y
Change
Net Sales $98.6 $95.7 3.0%
Adjusted EBITDA $10.8 $15.8 (31.5%)
Adjusted EBITDA
Margin
11.0% 16.5% (560 bps)
Q1 Net Sales Bridge
7
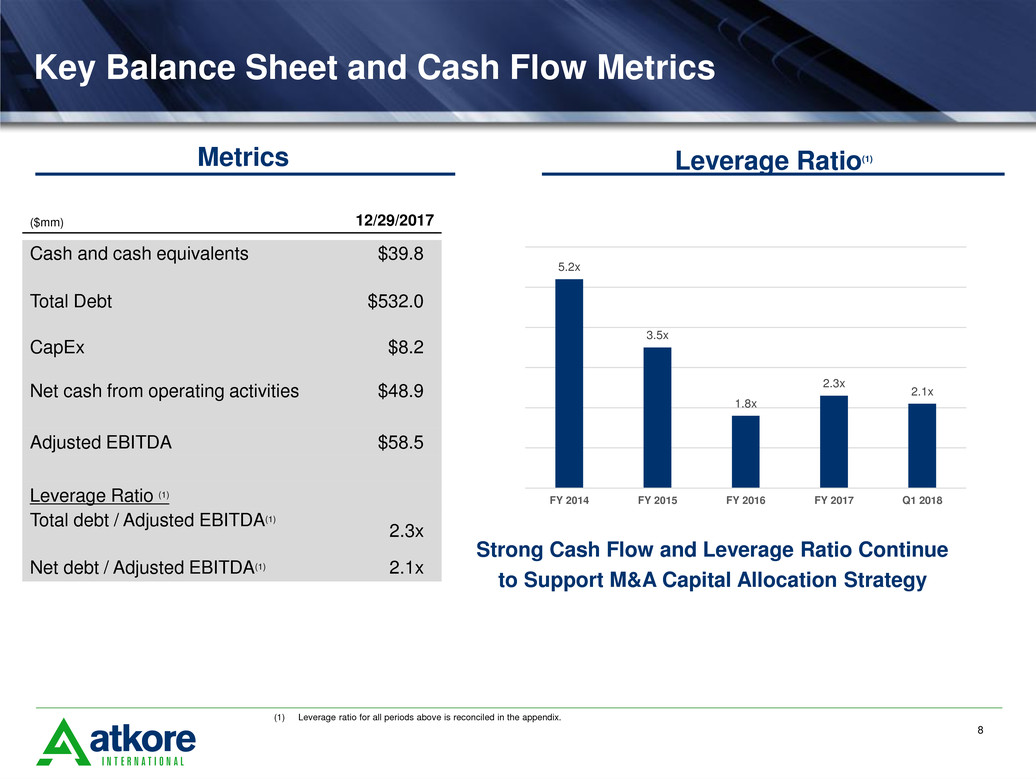
Key Balance Sheet and Cash Flow Metrics
($mm) 12/29/2017
Cash and cash equivalents $39.8
Total Debt $532.0
CapEx $8.2
Net cash from operating activities $48.9
Adjusted EBITDA $58.5
Leverage Ratio (1)
Total debt / Adjusted EBITDA(1)
2.3x
Net debt / Adjusted EBITDA(1) 2.1x
Metrics Leverage Ratio(1)
(1) Leverage ratio for all periods above is reconciled in the appendix.
5.2x
3.5x
1.8x
2.3x
2.1x
FY 2014 FY 2015 FY 2016 FY 2017 Q1 2018
Strong Cash Flow and Leverage Ratio Continue
to Support M&A Capital Allocation Strategy
8
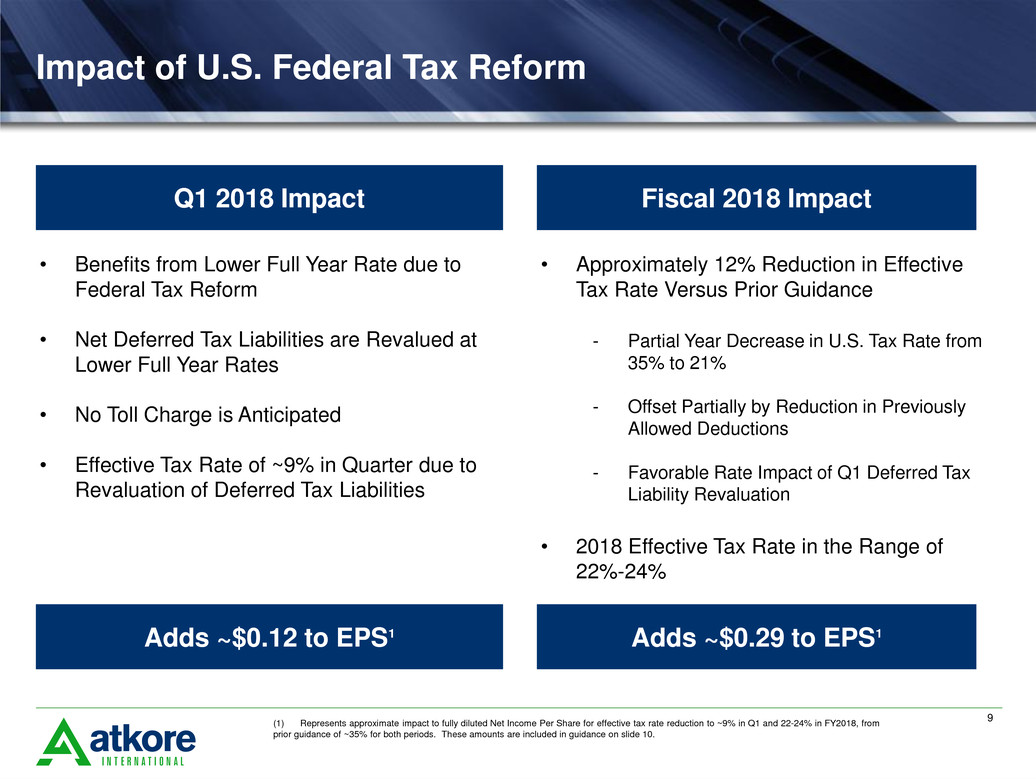
Impact of U.S. Federal Tax Reform
9
• Benefits from Lower Full Year Rate due to
Federal Tax Reform
• Net Deferred Tax Liabilities are Revalued at
Lower Full Year Rates
• No Toll Charge is Anticipated
• Effective Tax Rate of ~9% in Quarter due to
Revaluation of Deferred Tax Liabilities
Q1 2018 Impact Fiscal 2018 Impact
• Approximately 12% Reduction in Effective
Tax Rate Versus Prior Guidance
- Partial Year Decrease in U.S. Tax Rate from
35% to 21%
- Offset Partially by Reduction in Previously
Allowed Deductions
- Favorable Rate Impact of Q1 Deferred Tax
Liability Revaluation
• 2018 Effective Tax Rate in the Range of
22%-24%
Adds ~$0.12 to EPS1 Adds ~$0.29 to EPS1
(1) Represents approximate impact to fully diluted Net Income Per Share for effective tax rate reduction to ~9% in Q1 and 22-24% in FY2018, from
prior guidance of ~35% for both periods. These amounts are included in guidance on slide 10.
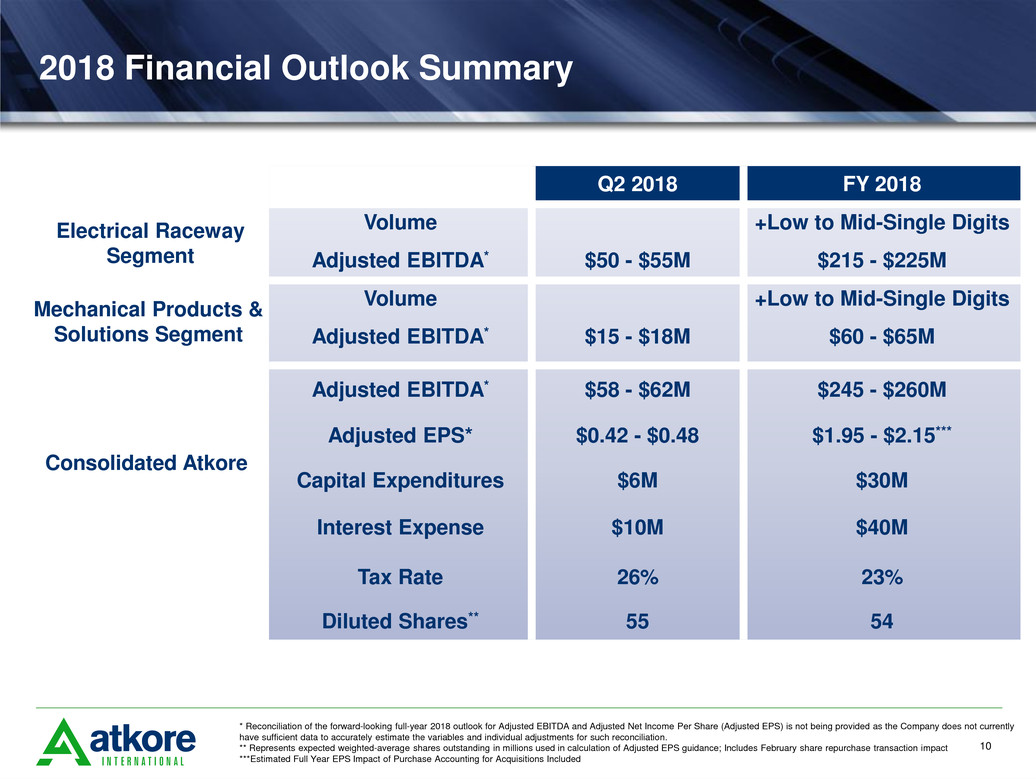
2018 Financial Outlook Summary
Electrical Raceway
Segment
Consolidated Atkore
Mechanical Products &
Solutions Segment
Q2 2018 FY 2018
Volume +Low to Mid-Single Digits
Adjusted EBITDA* $50 - $55M $215 - $225M
Volume +Low to Mid-Single Digits
Adjusted EBITDA* $15 - $18M $60 - $65M
Adjusted EBITDA* $58 - $62M $245 - $260M
Adjusted EPS* $0.42 - $0.48 $1.95 - $2.15***
Capital Expenditures $6M $30M
Interest Expense $10M $40M
Tax Rate 26% 23%
Diluted Shares** 55 54
* Reconciliation of the forward-looking full-year 2018 outlook for Adjusted EBITDA and Adjusted Net Income Per Share (Adjusted EPS) is not being provided as the Company does not currently
have sufficient data to accurately estimate the variables and individual adjustments for such reconciliation.
** Represents expected weighted-average shares outstanding in millions used in calculation of Adjusted EPS guidance; Includes February share repurchase transaction impact
***Estimated Full Year EPS Impact of Purchase Accounting for Acquisitions Included
10

Appendix

Segment Information
12
Three months ended
December 29, 2017 December 30, 2016
(in thousands) Net sales
Adjusted
EBITDA
Adjusted
EBITDA
Margin Net sales
Adjusted
EBITDA
Adjusted
EBITDA
Margin
Electrical Raceway
$ 316,523 $ 56,160 17.7% $ 242,385 $ 42,117 17.4%
Mechanical Products &
Solutions
98,574 $ 10,809 11.0% 95,681 $ 15,781 16.5%
Eliminations
(539) (475)
Consolidated operations
$ 414,558 $ 337,591

Adjusted earnings per share reconciliation
Consolidated Atkore International Group Inc.
13
Three months ended
(in thousands, except per share data) December 29, 2017 December 30, 2016
Net income $ 27,189 $ 17,382
Stock-based compensation 3,564 2,720
Loss on extinguishment of debt — 9,805
Other (a) 507 (10,930)
Pre-tax adjustments to net income 4,071 1,595
Tax effect (1,059) (571)
Adjusted net income $ 30,201 $ 18,406
Weighted-Average Common Shares Outstanding
Basic 63,316 62,642
Diluted 65,989 65,920
Net income per share
Basic $ 0.43 $ 0.28
Diluted $ 0.41 $ 0.26
Adjusted Net income per share
Basic $ 0.48 $ 0.29
Diluted $ 0.46 $ 0.28
(a) Represents other items, such as inventory reserves and adjustments, realized or unrealized gain (loss) on foreign currency transactions and
release of certain indemnified uncertain tax positions.

Net Income to Adjusted EBITDA reconciliation
Consolidated Atkore International Group Inc.
14
TTM Three months ended
(in thousands)
December 29,
2017
December 29,
2017
September 30,
2017 June 30, 2017 March 31, 2017
Net income $ 94,446 $ 27,189 $ 20,857 $ 27,465 $ 18,935
Interest expense, net 23,362 6,594 5,726 5,811 5,231
Income tax expense 38,495 2,516 12,173 11,431 12,375
Depreciation and amortization 58,309 17,210 14,485 13,341 13,273
Restructuring & impairments 1,129 262 556 (101) 412
Stock-based compensation 13,632 3,564 3,420 3,064 3,584
Legal matters 7,551 — 50 — 7,501
Transaction costs 3,863 645 2,235 845 138
Gain on sale of joint venture (5,774) — — — (5,774)
Other 1,191 507 60 177 447
Adjusted EBITDA $ 236,204 $ 58,487 $ 59,562 $ 62,033 $ 56,122
Acquisitions add-back1 14,881
Pro Forma Adjusted EBITDA $ 251,085
(1) Pro Forma adjustments add the Adjusted EBITDA for acquisitions completed in FY2017 not reported in the Adjusted EBITDA line due to
acquisition date
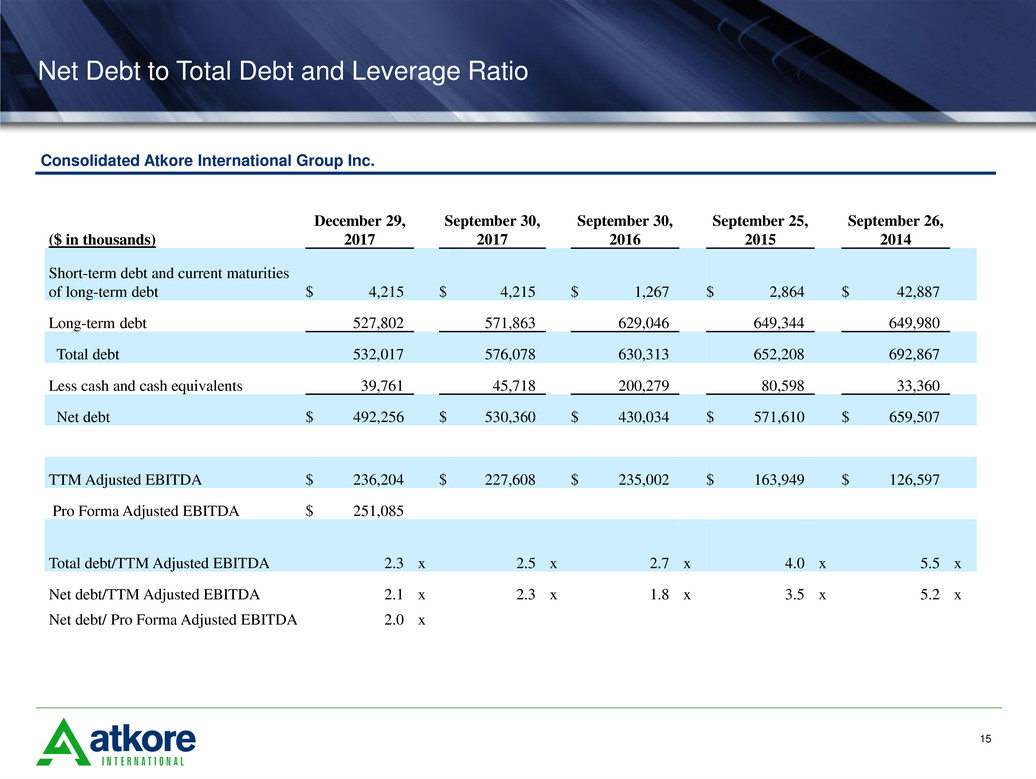
Net Debt to Total Debt and Leverage Ratio
Consolidated Atkore International Group Inc.
15
($ in thousands)
December 29,
2017
September 30,
2017
September 30,
2016
September 25,
2015
September 26,
2014
Short-term debt and current maturities
of long-term debt $ 4,215 $ 4,215 $ 1,267 $ 2,864 $ 42,887
Long-term debt 527,802 571,863 629,046 649,344 649,980
Total debt 532,017 576,078 630,313 652,208 692,867
Less cash and cash equivalents 39,761 45,718 200,279 80,598 33,360
Net debt $ 492,256 $ 530,360 $ 430,034 $ 571,610 $ 659,507
TTM Adjusted EBITDA $ 236,204 $ 227,608 $ 235,002 $ 163,949 $ 126,597
Pro Forma Adjusted EBITDA $ 251,085
Total debt/TTM Adjusted EBITDA 2.3 x 2.5 x 2.7 x 4.0 x 5.5 x
Net debt/TTM Adjusted EBITDA 2.1 x 2.3 x 1.8 x 3.5 x 5.2 x
Net debt/ Pro Forma Adjusted EBITDA 2.0 x
