Attached files
| file | filename |
|---|---|
| 8-K - 8-K - TRICO BANCSHARES / | d416243d8k.htm |
Exhibit 99.1
|
Richard P. Smith – President & CEO John S. Fleshood – Executive Vice President & COO FIG Partners Bank Forum January 31st – February 1st 2018 Trico Bancshares 40 years of service 1975-2015
|
FIG Partners Bank Forum SAFE HARBOR STATEMENT Certain comments included in this presentation may involve forward-looking statements, for which TriCo claims the protection of the “safe harbor” provisions credited by Federal securities laws. Such forward-looking statements are subject to risks and uncertainties which may cause TriCo’s actual results to differ materially from those contemplated by such statements. Additional information concerning certain of these risks and uncertainties are described in TriCo’s Annual Report of Form 10-K for the fiscal year ended December 31, 2016 and TriCo’s Quarterly Reports on Form 10-Q as filed with the SEC in fiscal 2017 and 2018. 2 | January 2018
|
FIG Partners Bank Forum AGENDA Company Overview Recent Activities & Focus Key Revenue Drivers Challenges & Opportunities Financials Questions 3 | January 2018
|
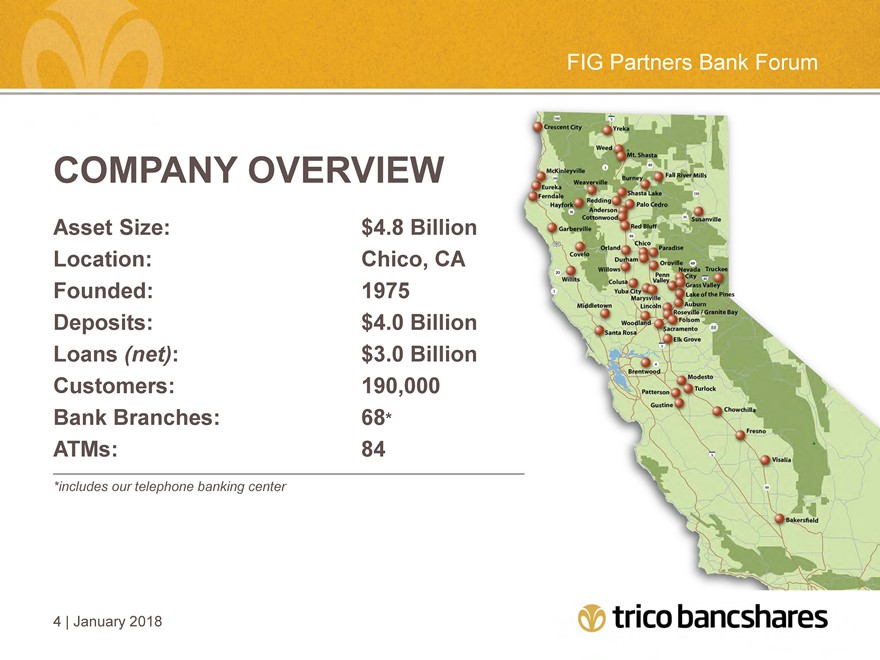
FIG Partners Bank Forum COMPANY OVERVIEW Asset Size: Location: Founded: Deposits: Loans (net): Customers: Bank Branches: ATMs: $4.8 Billion Chico, CA 1975 $4.0 Billion $3.0 Billion 190,000 68* 84 *includes our telephone banking center 4 | January 2018
|
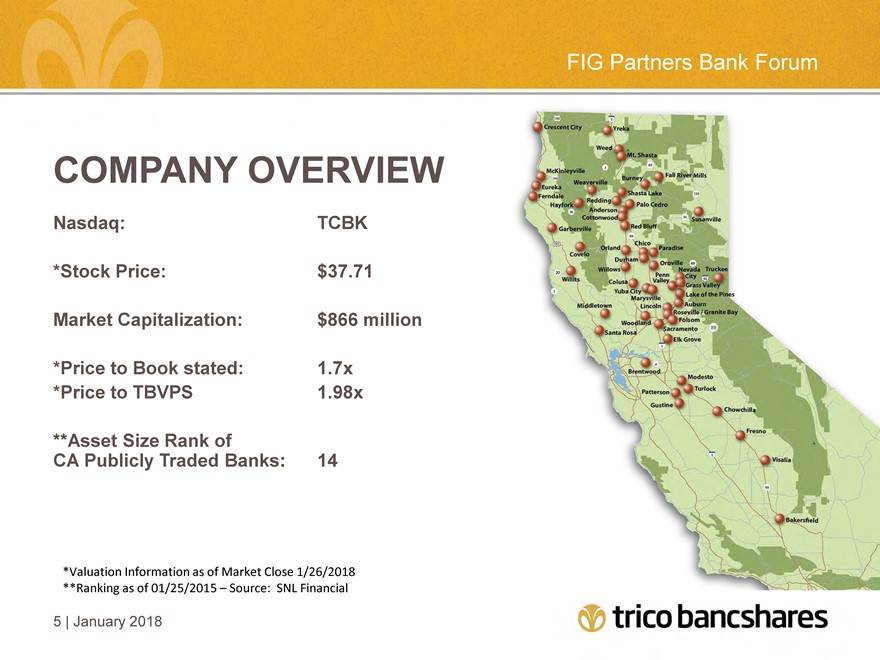
FIG Partners Bank Forum COMPANY OVERVIEW Nasdaq: *Stock Price: Market Capitalization: *Price to Book stated: *Price to TBVPS **Asset Size Rank of CA Publicly Traded Banks: TCBK $37.71 $866 million 1.7x 1.98x 14 *Valuation Information as of Market Close 1/26/2018 **Ranking as of 01/25/2015 – Source: SNL Financial 5 | January 2018
|
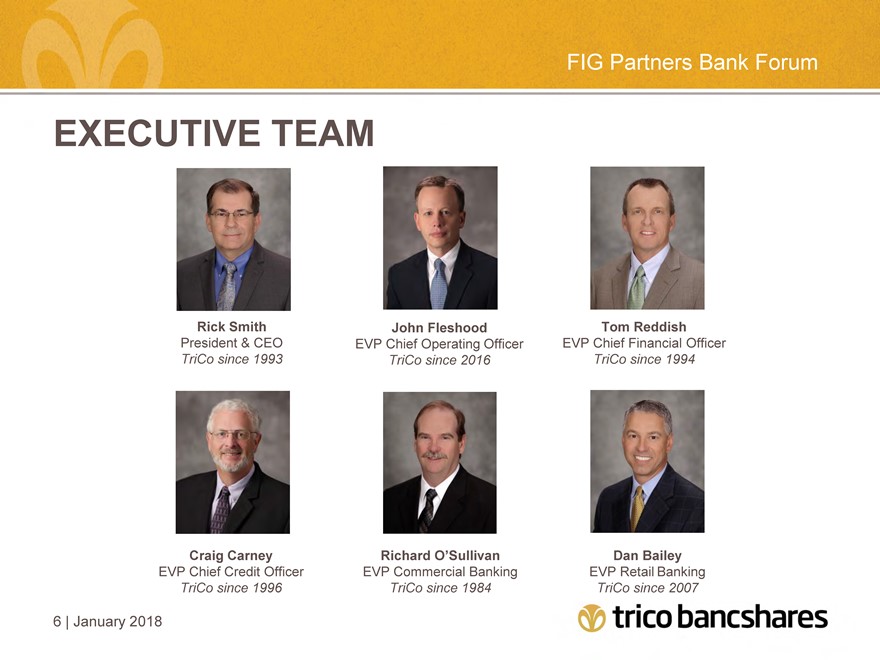
FIG Partners Bank Forum EXECUTIVE TEAM Rick Smith President & CEO TriCo since 1993 John Fleshood EVP Chief Operating Officer TriCo since 2016 Tom Reddish EVP Chief Financial Officer TriCo since 1994 Craig Carney EVP Chief Credit Officer TriCo since 1996 Richard O’Sullivan EVP Commercial Banking TriCo since 1984 Dan Bailey EVP Retail Banking TriCo since 2007 6 | January 2018
|
FIG Partners Bank Forum 2017 ACCOMPLISHMENTS New deposit product line-up implemented in Q1 Strong fee revenue growth – Year-over-year deposit fee income growth of 12.6% Several new technology projects for 2017: Implementing new consumer and mortgage loan origination technologies Loan and operational automation projects Leveraging 2016 core conversion investment into greater operating efficiencies Consistent deposit growth – favorable mix and cost 7 | January 2018
|
FIG Partners Bank Forum POSITIONED FOR TODAY, PREPARED FOR THE FUTURE Strong and growing bank capital Competitive product set to compete with banks both large and small Superior reputation versus large bank competitors Continue to see strong organic growth in current environment Loan growth of 9.3%* Deposit growth of 3.4%* *12/31/2017 vs. 12/31/2016 8 | January 2018
|
FIG Partners Bank Forum POSITIONED FOR TODAY, PREPARED FOR THE FUTURE continued Strong focus on risk management and new regulatory realities Enterprise Risk Strong Focus on CRA HMDA Reporting Fair Lending Experienced project teams, well prepared for continued growth through acquisition 9 | January 2018
|
FIG Partners Bank Forum WHAT IS LONG TERM SUCCESS? Rewarding our shareholders A winning culture with a motivated and talented work force (good people) Significant and growing market share Low cost core deposit base Strong credit culture Diversified revenue sources Efficient operations Strong risk management practices 10 | January 2018
|
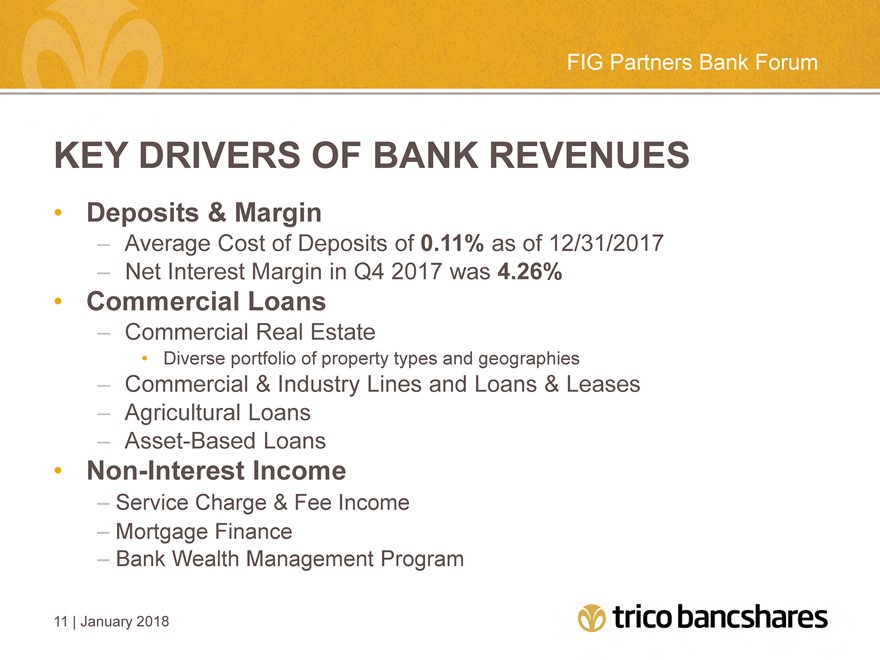
FIG Partners Bank Forum KEY DRIVERS OF BANK REVENUES Deposits & Margin – Average Cost of Deposits of 0.11% as of 12/31/2017 – Net Interest Margin in Q4 2017 was 4.26% Commercial Loans – Commercial Real Estate Diverse portfolio of property types and geographies – Commercial & Industry Lines and Loans & Leases – Agricultural Loans – Asset-Based Loans Non-Interest Income – Service Charge & Fee Income – Mortgage Finance – Bank Wealth Management Program 11 | January 2018
|
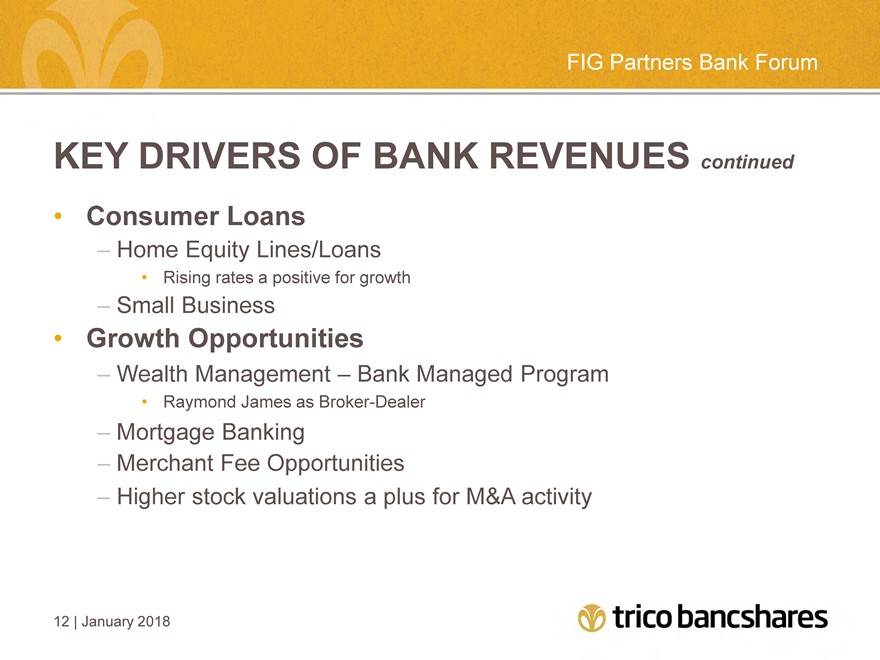
FIG Partners Bank Forum KEY DRIVERS OF BANK REVENUES continued Consumer Loans Home Equity Lines/Loans Rising rates a positive for growth Small Business Growth Opportunities Wealth Management – Bank Managed Program Raymond James as Broker-Dealer Mortgage Banking Merchant Fee Opportunities Higher stock valuations a plus for M&A activity 12 | January 2018
|
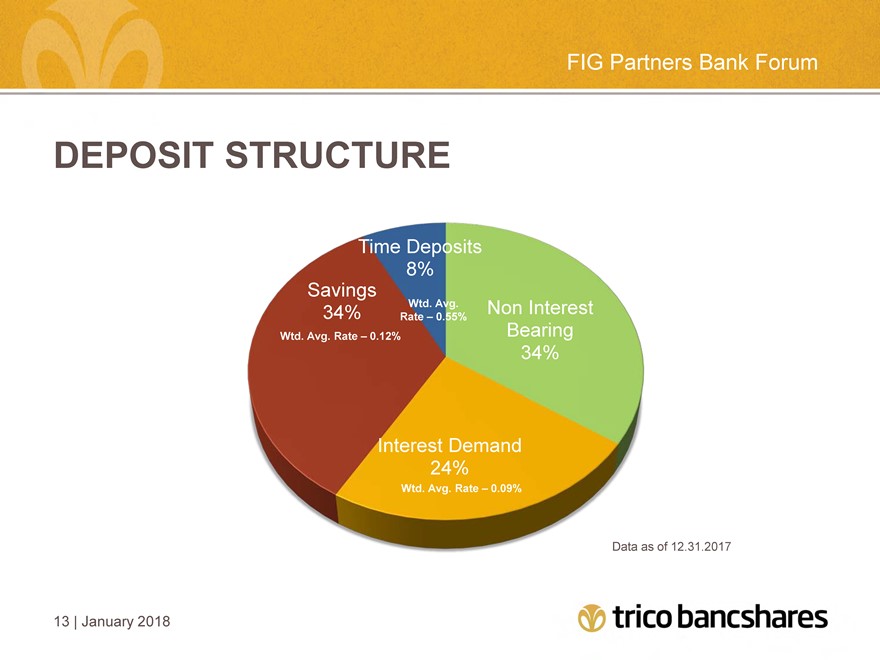
FIG Partners Bank Forum DEPOSIT STRUCTURE Time Deposits 8% Savings 34% Wtd. Avg. Non Interest Rate – 0.55% Wtd. Avg. Rate – 0.12% Bearing 34% Interest Demand 24% Wtd. Avg. Rate – 0.09% Data as of 12.31.2017 13 | January 2018
|
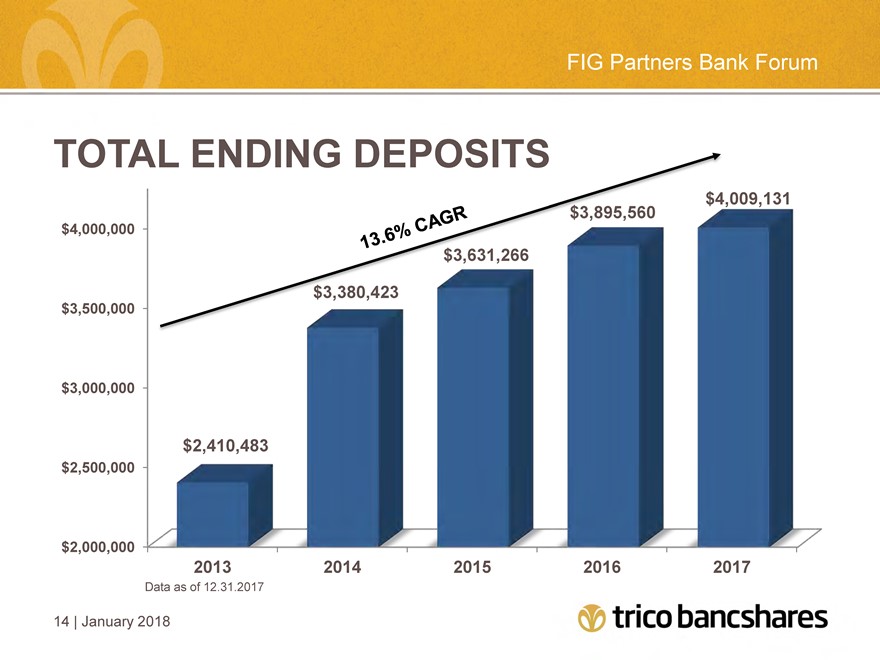
FIG Partners Bank Forum TOTAL ENDING DEPOSITS $4,000,000 $3,500,000 $3,000,000 $2,500,000 $2,000,000 $2,410,483 3,380,423 3,631,266 3,895,560 4,009,131 2013 2014 2015 2016 2017 14 | January 2018
|
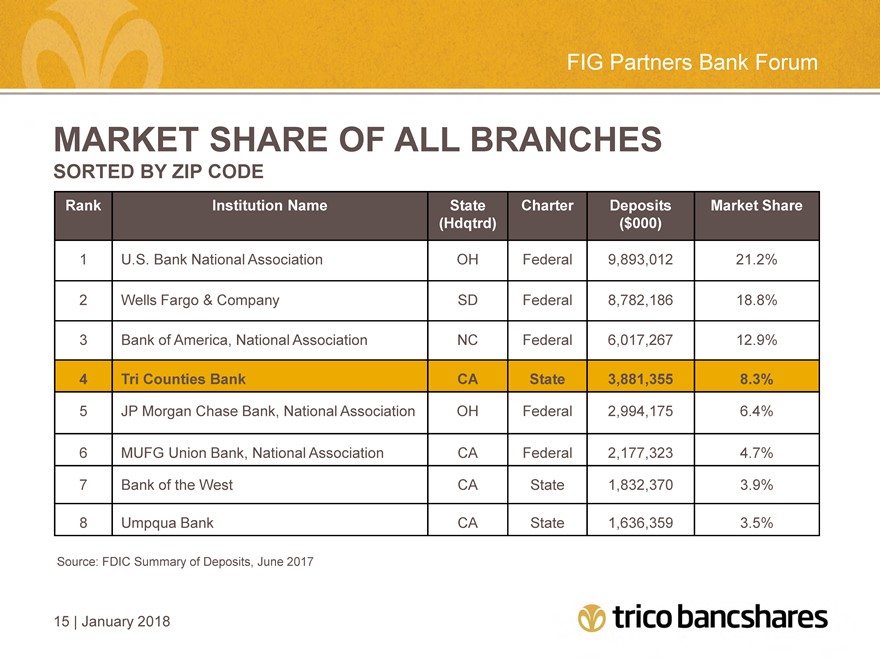
FIG Partners Bank Forum MARKET SHARE OF ALL BRANCHES SORTED BY ZIP CODE Rank Institution Name State Charter Deposits Market Share (Hdqtrd) ($000) 1 U.S. Bank National Association OH Federal 9,893,012 21.2% 2 Wells Fargo & Company SD Federal 8,782,186 18.8% 3 Bank of America, National Association NC Federal 6,017,267 12.9% 4 Tri Counties Bank CA State 3,881,355 8.3% 5 JP Morgan Chase Bank, National Association OH Federal 2,994,175 6.4% 6 MUFG Union Bank, National Association CA Federal 2,177,323 4.7% 7 Bank of the West CA State 1,832,370 3.9% 8 Umpqua Bank CA State 1,636,359 3.5% Source: FDIC Summary of Deposits, June 2017 15 | January 2018
|
FIG Partners Bank Forum NON-INTEREST INCOME Consistently Represents Approximately 25% of Total Bank Revenues Residential Home Mortgage Lending Refinances remain consistent Increasing numbers of purchase transactions and increasing overall activity for home loans Higher rates will slow refinance market in 2018 16 | January 2018
|
FIG Partners Bank Forum NON-INTEREST INCOME continued Wealth Management revenues Higher revenues from service charges and interchange income Cash Management fees continue to increase Merchant Card Services – $1.2 million in 2017 17 | January 2018
|
FIG Partners Bank Forum CONSUMER LOANS Increased demand for consumer loans Home equity values have increased Borrowers using refinance of 1st mortgage to pay down debt Low rate environment led to historically high refi activity $38MM in Q4 2017 HELOC volume resulted in $3MM decrease in outstandings This is compared to $51MM in Q3 2017 volume resulting in $7.1MM in growth Home equity lines/loans increasing in demand and may begin outpacing 1st lien refi volume soon 18 | January 2018
|
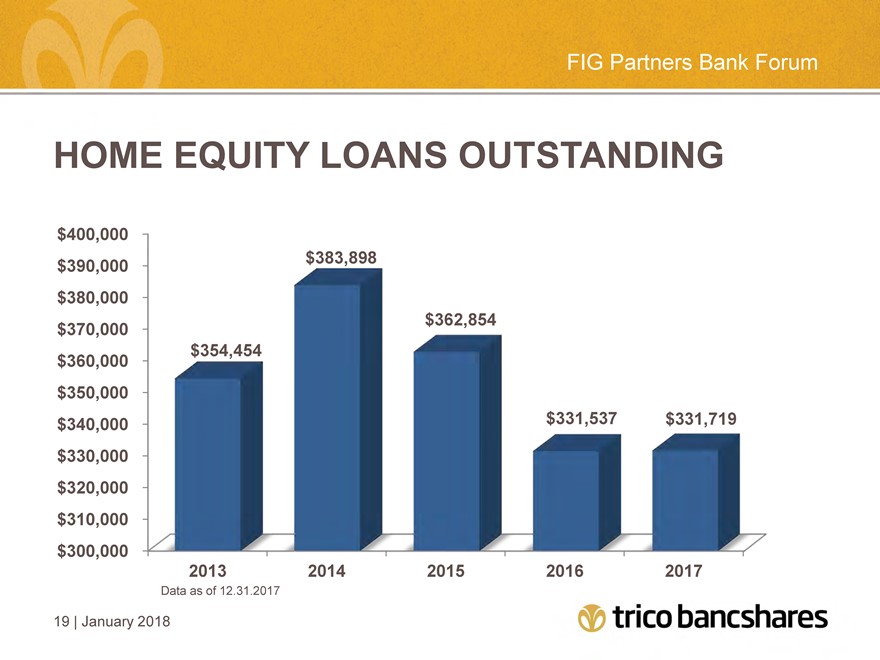
FIG Partners Bank Forum HOME EQUITY LOANS OUTSTANDING $400,000 $390,000 $380,000 $370,000 $360,000 $350,000 $340,000 $330,000 $320,000 $310,000 $300,000 $354,454 $383,898 $362,854 $331,537 $331,719 2013 2014 2015 2016 2017 Data as of 12.31.2017 19 | January 2018
|
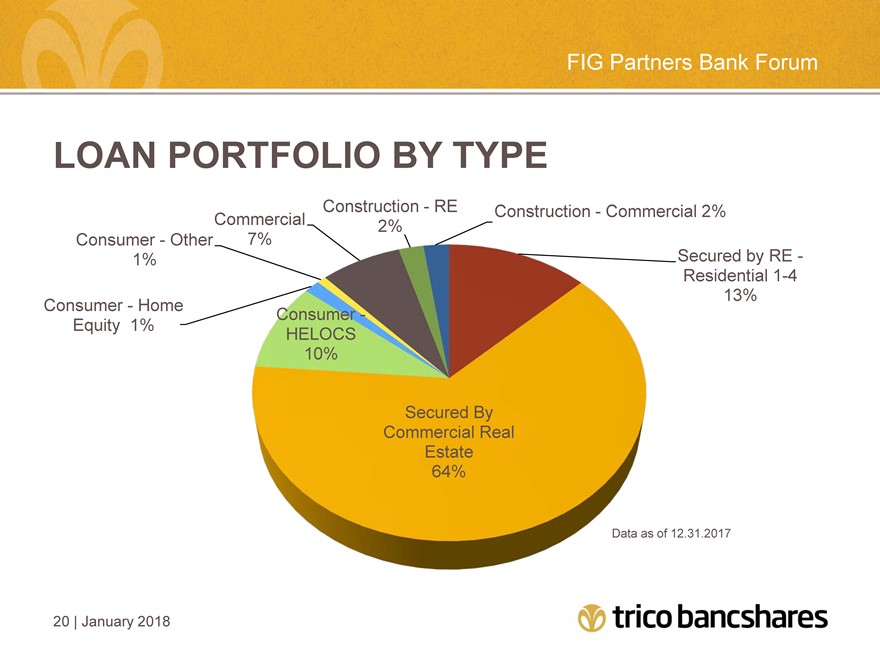
FIG Partners Bank Forum LOAN PORTFOLIO BY TYPE Consumer—Home Equity 1% Consumer—Other 1% Commercial 7% Construction—RE 2% Construction—Commercial 2% Secured by RE -Residential 1-4 13% Consumer -HELOCS 10% Secured By Commercial Real Estate 64% Data as of 12.31.2017 20 | January 2018
|
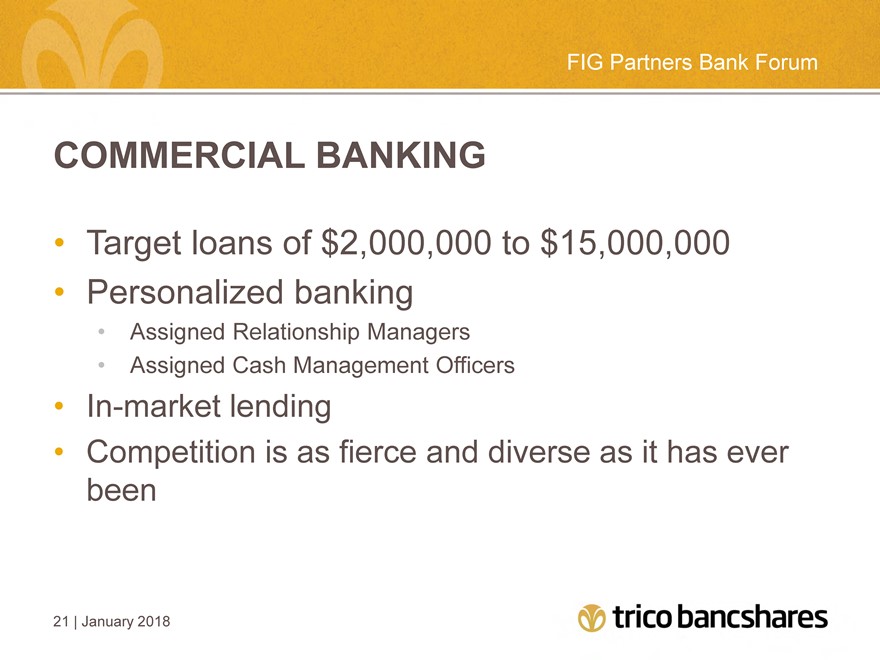
FIG Partners Bank Forum COMMERCIAL BANKING Target loans of $2,000,000 to $15,000,000 Personalized banking Assigned Relationship Managers Assigned Cash Management Officers In-market lending Competition is as fierce and diverse as it has ever been 21 | January 2018
|
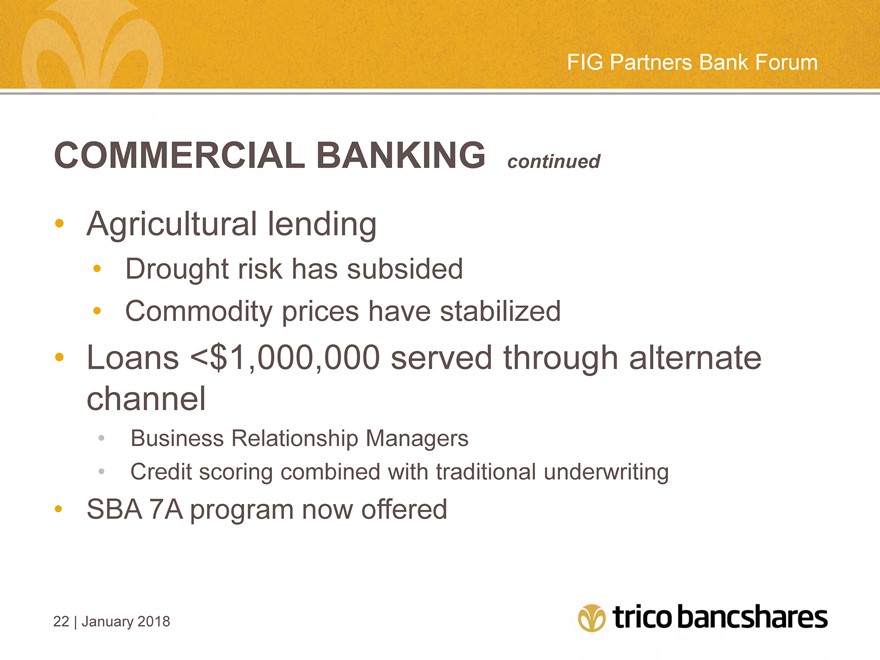
FIG Partners Bank Forum COMMERCIAL BANKING continued Agricultural lending Drought risk has subsided Commodity prices have stabilized Loans <$1,000,000 served through alternate channel Business Relationship Managers Credit scoring combined with traditional underwriting SBA 7A program now offered 22 | January 2018
|
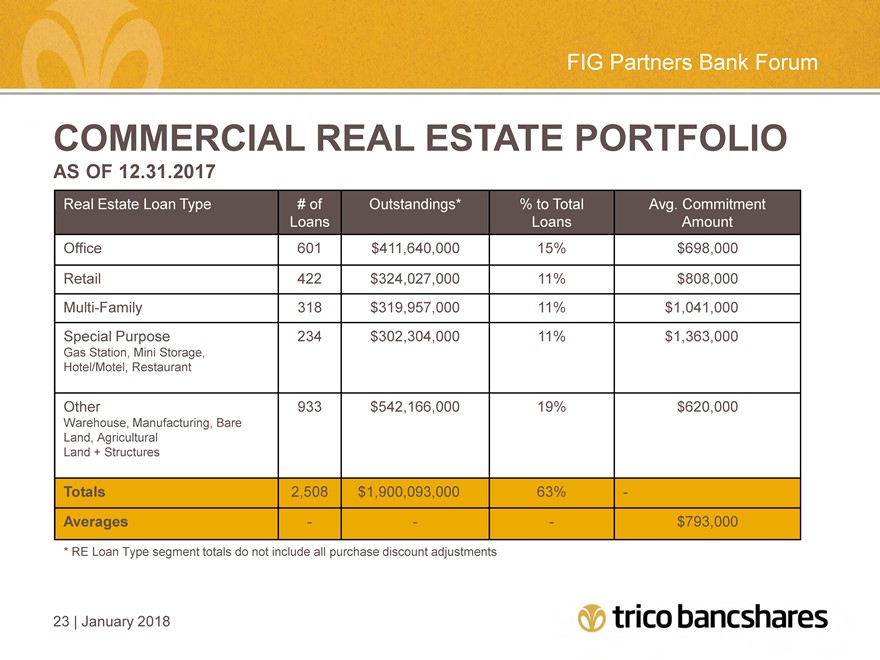
FIG Partners Bank Forum COMMERCIAL REAL ESTATE PORTFOLIO AS OF 12.31.2017 Real Estate Loan Type # of Outstandings* % to Total Avg. Commitment Loans Loans Amount Office 601 $411,640,000 15% $698,000 Retail 422 $324,027,000 11% $808,000 Multi-Family 318 $319,957,000 11% $1,041,000 Special Purpose 234 $302,304,000 11% $1,363,000 Gas Station, Mini Storage, Hotel/Motel, Restaurant Other 933 $542,166,000 19% $620,000 Warehouse, Manufacturing, Bare Land, Agricultural Land + Structures Totals 2,508 $1,900,093,000 63% Averages $793,000 * RE Loan Type segment totals do not include all purchase discount adjustments 23 | January 2018
|
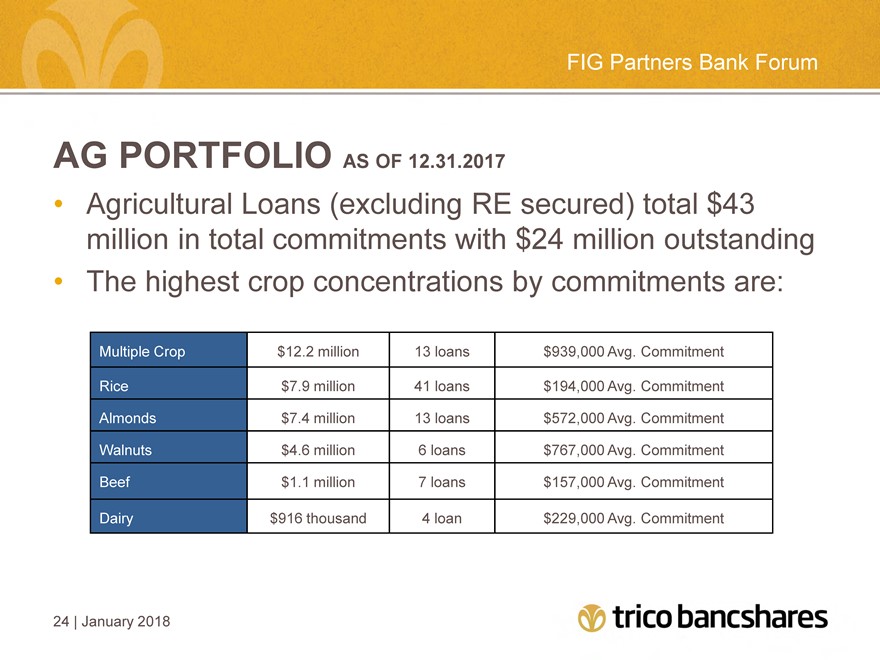
FIG Partners Bank Forum AG PORTFOLIO AS OF 12.31.2017 Agricultural Loans (excluding RE secured) total $43 million in total commitments with $24 million outstanding The highest crop concentrations by commitments are: Multiple Crop $12.2 million 13 loans $ 939,000 Avg. Commitment Rice $7.9 million 41 loans $ 194,000 Avg. Commitment Almonds $7.4 million 13 loans $ 572,000 Avg. Commitment Walnuts $4.6 million 6 loans $ 767,000 Avg. Commitment Beef $1.1 million 7 loans $ 157,000 Avg. Commitment Dairy $916 thousand 4 loan $ 229,000 Avg. Commitment 24 | January 2018
|
FIG Partners Bank Forum CONSTRUCTION AND A&D Construction lending totals approx. $137,557,000 outstanding with $326,977,000 in commitments Residential construction approx. $67,930,000 Commercial construction approx. $69,627,000 Total construction, land development and land acquisition loans represent 4.6% of total loans outstanding Data as of 12.31.2017 25 | January 2018
|
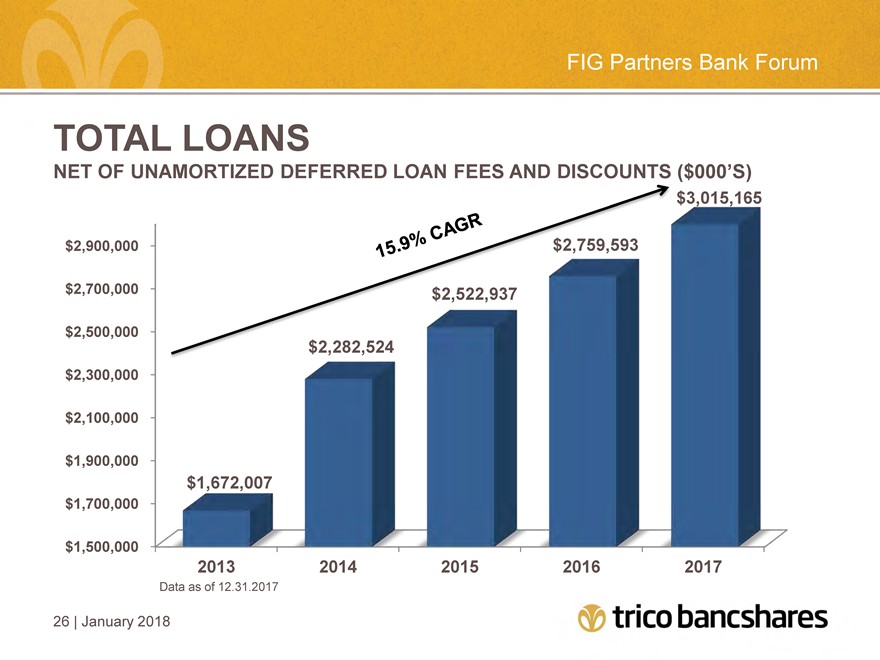
FIG Partners Bank Forum TOTAL LOANS NET OF UNAMORTIZED DEFERRED LOAN FEES AND DISCOUNTS ($000’S) $2,900,000 $2,700,000 $2,500,000 $2,300,000 $2,100,000 $1,900,000 $1,700,000 $1,500,000 $1,672,007 $2,282,524 $2,522,937 $2,759,593 $3,015,165 2013 2014 2015 2016 2017 Data as of 12.31.2017 26 | January 2018
|
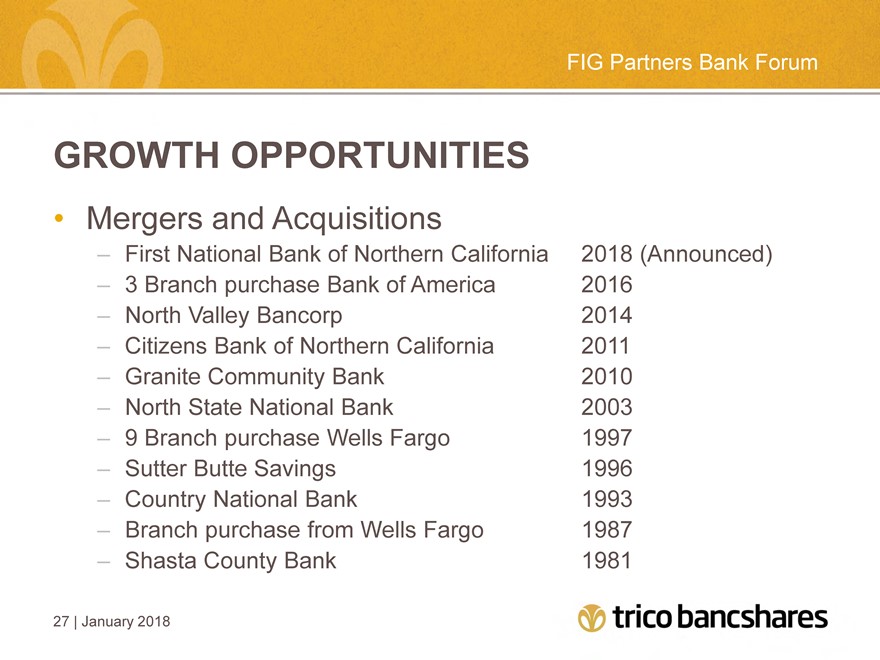
FIG Partners Bank Forum GROWTH OPPORTUNITIES Mergers and Acquisitions – First National Bank of Northern California 2018 (Announced) – 3 Branch purchase Bank of America 2016 – North Valley Bancorp 2014 – Citizens Bank of Northern California 2011 – Granite Community Bank 2010 – North State National Bank 2003 – 9 Branch purchase Wells Fargo 1997 – Sutter Butte Savings 1996 – Country National Bank 1993 – Branch purchase from Wells Fargo 1987 – Shasta County Bank 1981 27 | January 2018
|
FIG Partners Bank Forum WHAT KEEPS US UP AT NIGHT? Deposit Betas Ability to Increase Loan Yields Interest Rate Risk Aggressive Competitors Compliance Regulations The Cost of Compliance with New Regulations Dysfunction in Washington 28 | January 2018
|
FIG Partners Bank Forum CHALLENGES WITHIN BANK STRATEGIES Big Banks Aggressive banking in community bank space Bad reputations Large banks cost saving a new opportunity in rural markets Technology and Banking New technology is expensive New technology will streamline banking ultimately lowering costs Bank Operations and Efficiency Managing multiple delivery channels Enterprise Risk Management Many threats, so little time 29 | January 2018
|
FIG Partners Bank Forum FINANCIALS
|
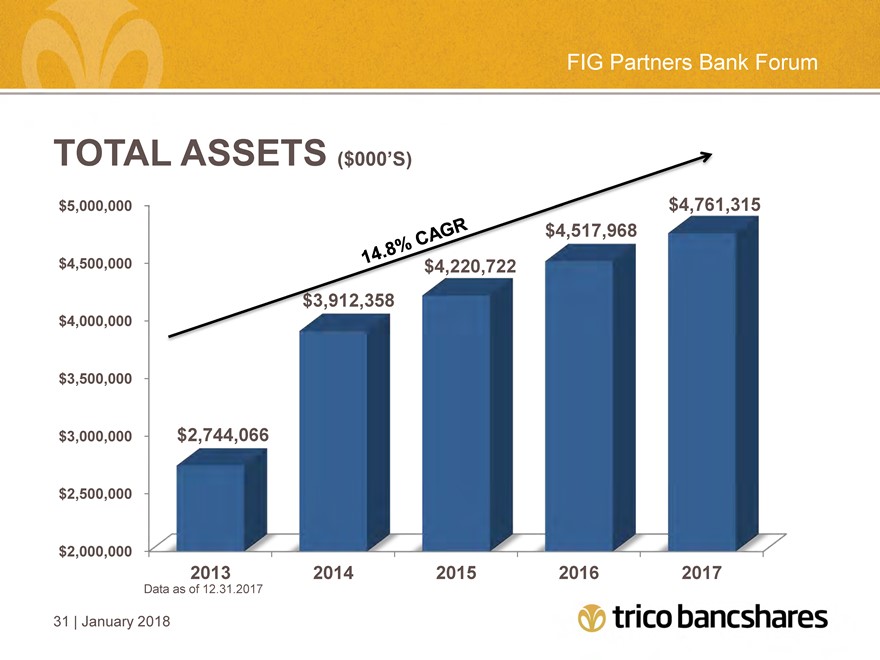
FIG Partners Bank Forum TOTAL ASSETS ($000’S) $5,000,000 $4,500,000 $4,000,000 $3,500,000 $3,000,000 $2,500,000 $2,000,000 $2,744,066 $3,912,358 $4,220,722 $4,517,968 $4,761,315 2013 2014 2015 2016 2017 Data as of 12.31.2017 31 | January 2018
|
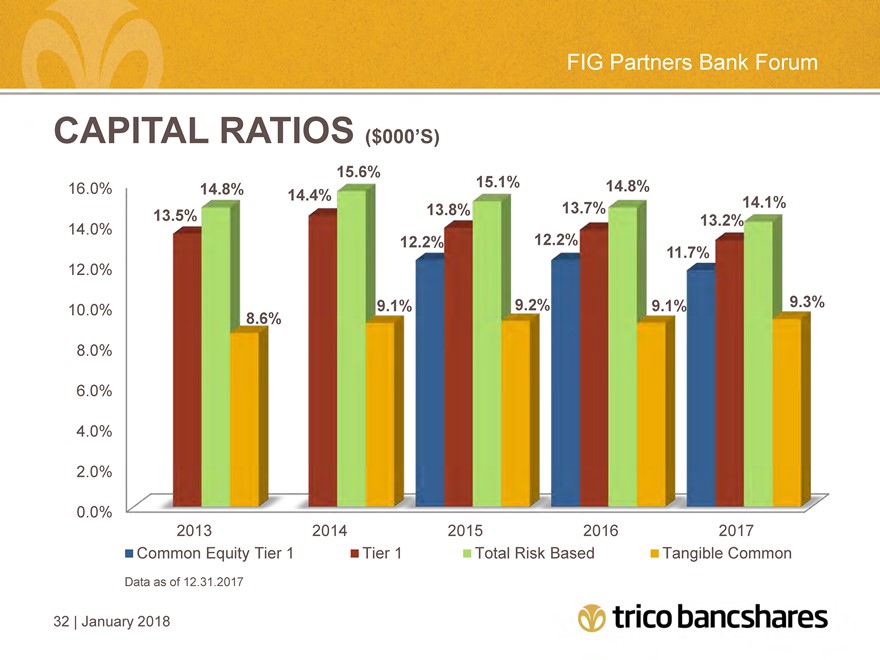
FIG Partners Bank Forum CAPITAL RATIOS ($000’S) 16.0% 14.0% 12.0% 10.0% 8.0% 6.0% 4.0% 2.0% 0.0% 15.6% 14.8% 15.1% 14.8% 14.4% 14.1% 13.5% 13.8% 13.7% 13.2% 12.2% 12.2% 11.7% 8.6% 9.1% 9.2% 9.1% 9.3% 2013 2014 2015 2016 2017 Common Equity Tier 1 Tier 1 Total Risk Based Tangible Common Data as of 12.31.2017 32 | January 2018
|
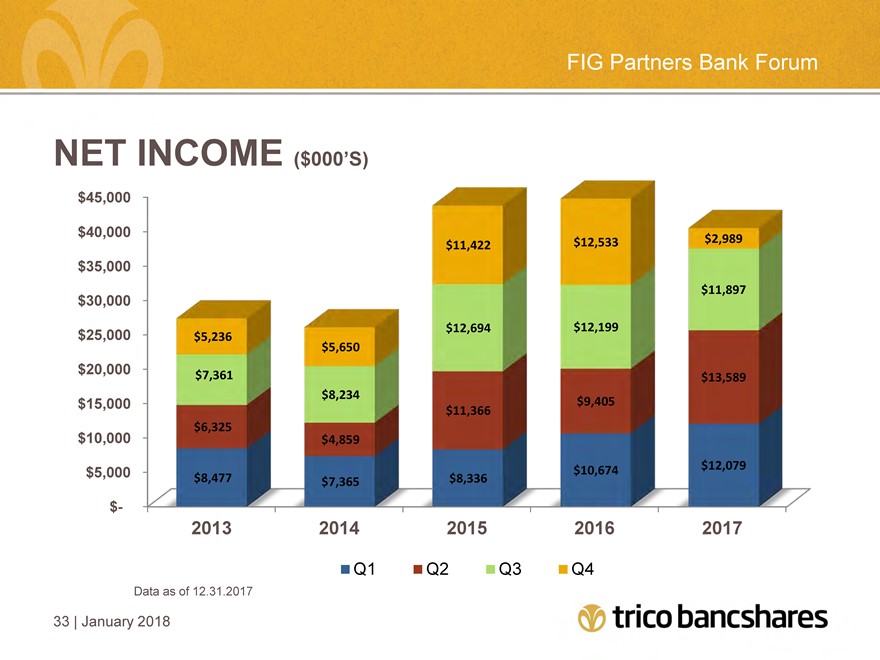
FIG Partners Bank Forum NET INCOME ($000’S) $45,000 $40,000 $35,000 $30,000 $25,000 $20,000 $15,000 $10,000 $5,000 $- $11,422 $12,533 $2,989 $11,897 $12,694 $12,199 $5,236 $5,650 $7,361 $13,589 $8,234 $9,405 $11,366 $6,325 $4,859 $10,674 $12,079 $8,477 $7,365 $8,336 2013 2014 2015 2016 2017 Q1 Q2 Q3 Q4 Data as of 12.31.2017 33 | January 2018
|
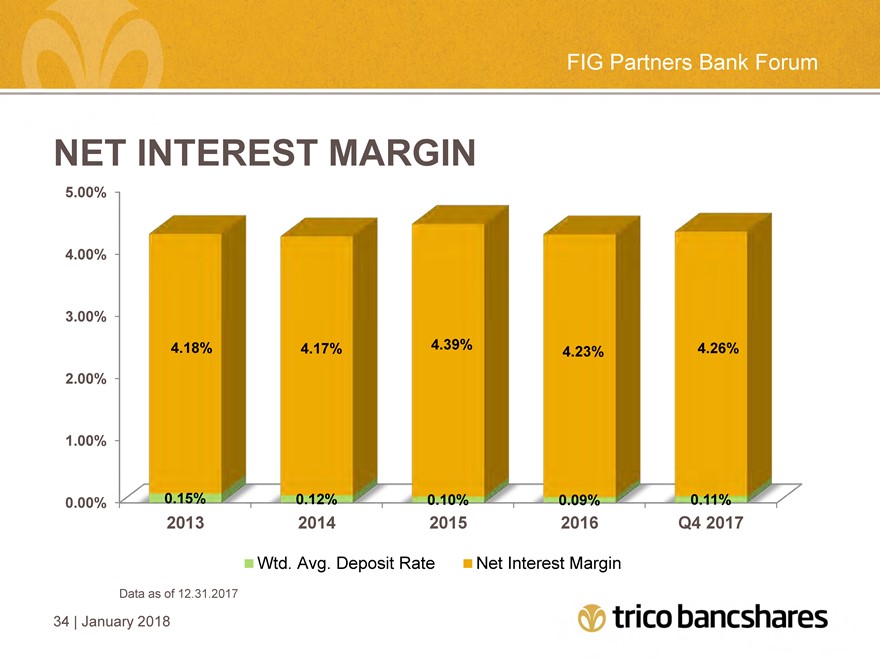
FIG Partners Bank Forum NET INTEREST MARGIN 5.00% 4.00% 3.00% 2.00% 1.00% 0.00% 4.18% 4.17% 4.39% 4.23% 4.26% 0.15% 0.12% 0.10% 0.09% 0.11% 2013 2014 2015 2016 Q4 2017 Wtd. Avg. Deposit Rate Net Interest Margin Data as of 12.31.2017 34 | January 2018
|
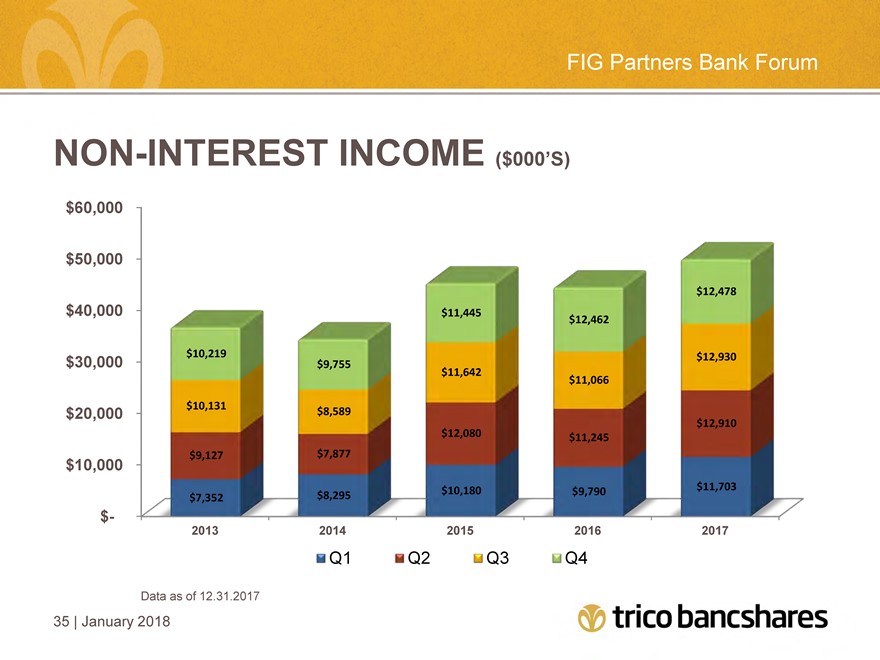
FIG Partners Bank Forum NON-INTEREST INCOME ($000’S) $60,000 $50,000 $40,000 $30,000 $20,000 $10,000 $- $12,478 $11,445 $12,462 $10,219 $12,930 $9,755 $11,642 $11,066 $10,131 $8,589 $12,910 $12,080 $11,245 $9,127 $7,877 $10,180 $9,790 $11,703 $7,352 $8,295 2013 2014 2015 2016 2017 Q1 Q2 Q3 Q4 Data as of 12.31.2017 35 | January 2018
|
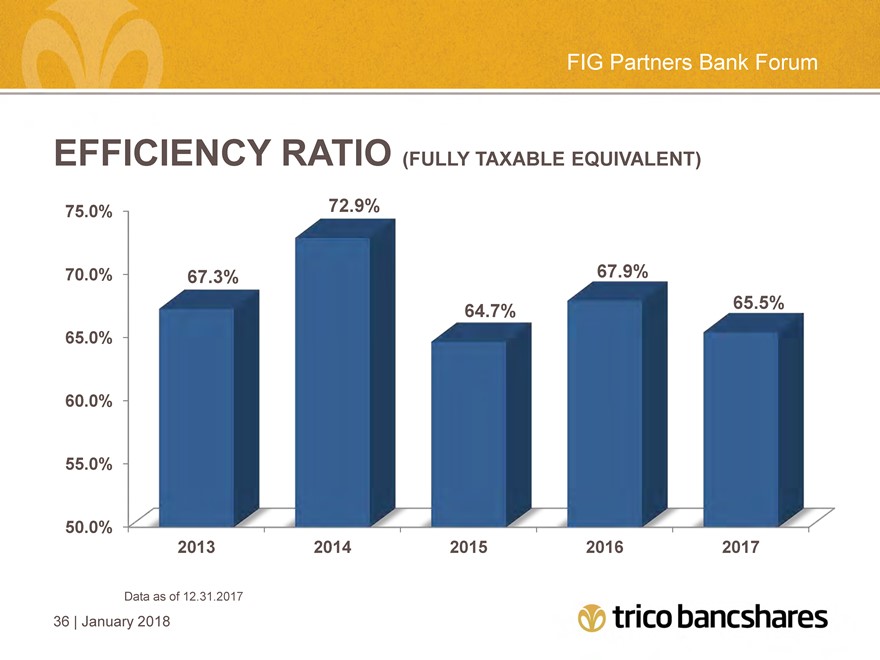
FIG Partners Bank Forum EFFICIENCY RATIO (FULLY TAXABLE EQUIVALENT) 75.0% 70.0% 65.0% 60.0% 55.0% 50.0% 72.9% 67.3% 67.9% 64.7% 65.5% 2013 2014 2015 2016 2017 Data as of 12.31.2017 36 | January 2018
|
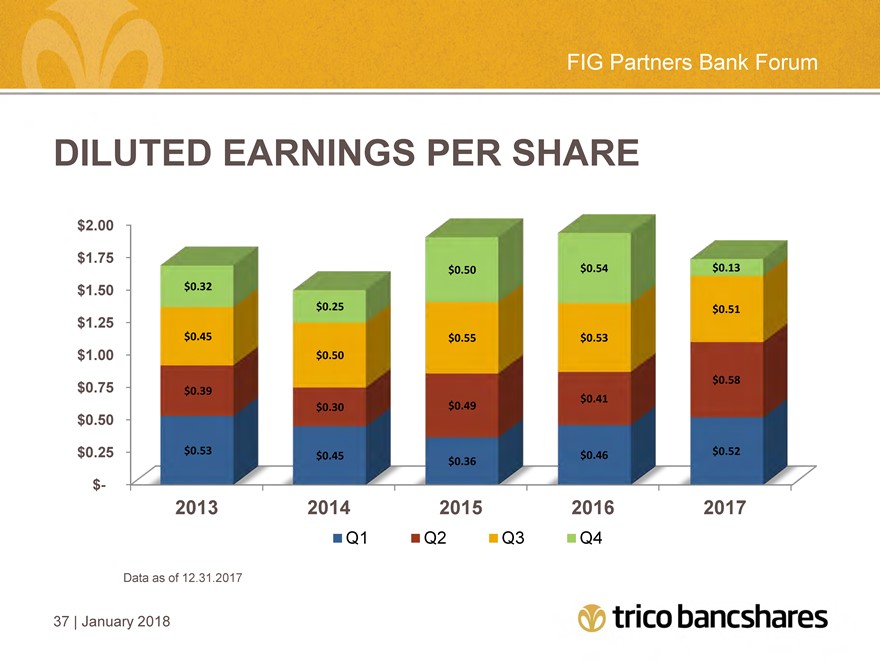
FIG Partners Bank Forum DILUTED EARNINGS PER SHARE $2.00 $1.75 $1.50 $1.25 $1.00 $0.75 $0.50 $0.25 $- $0.50 $0.54 $0.13 $0.32 $0.25 $0.51 $0.45 $0.55 $0.53 $0.50 $0.58 $0.39 $0.41 $0.30 $0.49 $0.53 $0.45 $0.46 $0.52 $0.36 2013 2014 2015 2016 2017 Q1 Q2 Q3 Q4 Data as of 12.31.2017 37 | January 2018
|
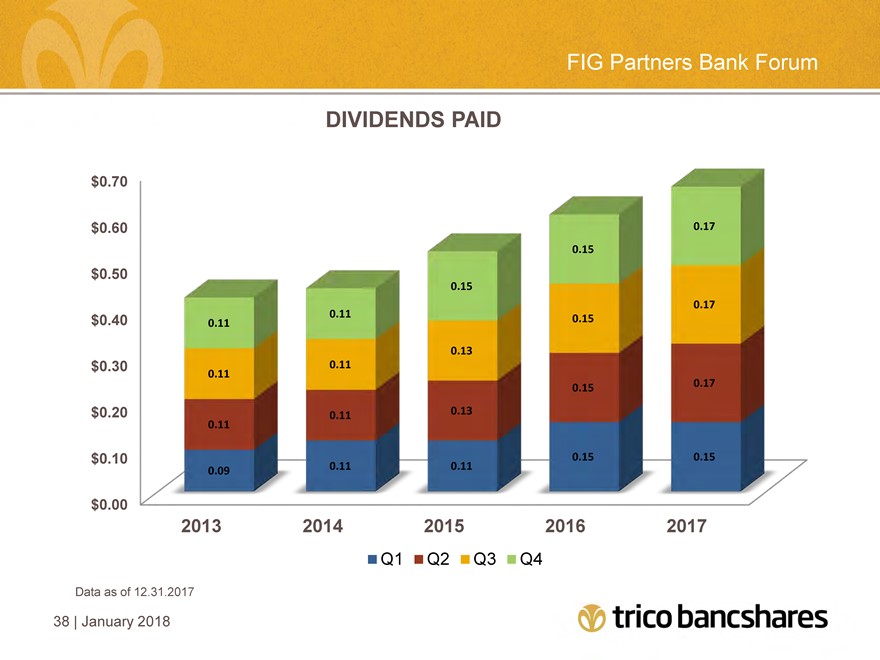
FIG Partners Bank Forum DIVIDENDS PAID $0.70 $0.60 $0.50 $0.40 $0.30 $0.20 $0.10 $0.00 0.17 0.15 0.15 0.17 0.11 0.15 0.11 0.13 0.11 0.11 0.15 0.17 0.11 0.13 0.11 0.15 0.15 0.09 0.11 0.11 2013 2014 2015 2016 2017 Q1 Q2 Q3 Q4 Data as of 12.31.2017 38 | January 2018
|
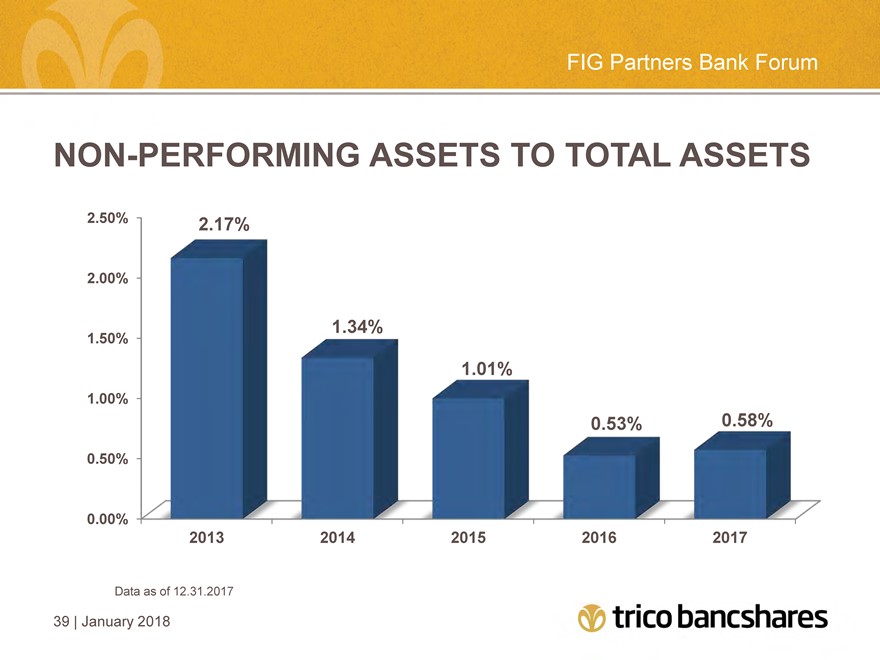
FIG Partners Bank Forum NON-PERFORMING ASSETS TO TOTAL ASSETS 2.50% 2.00% 1.50% 1.00% 0.50% 0.00% 2.17% 1.34% 1.01% 0.53% 0.58% 2013 2014 2015 2016 2017 Data as of 12.31.2017 39 | January 2018
|
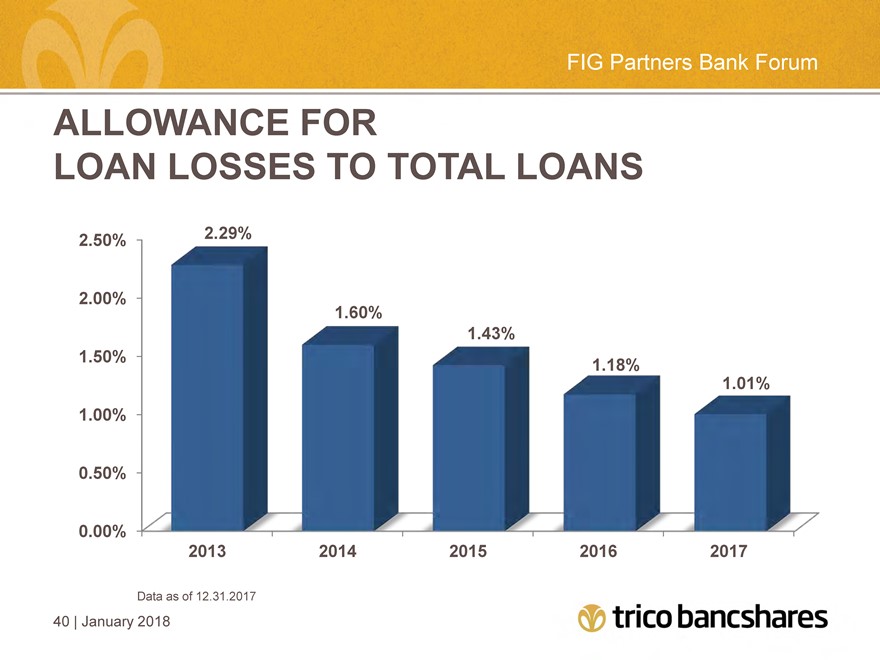
FIG Partners Bank Forum ALLOWANCE FOR LOAN LOSSES TO TOTAL LOANS 2.50% 2.00% 1.50% 1.00% 0.50% 0.00% 2.29% 1.60% 1.43% 1.18% 1.01% 2013 2014 2015 2016 2017 Data as of 12.31.2017 40 | January 2018
|
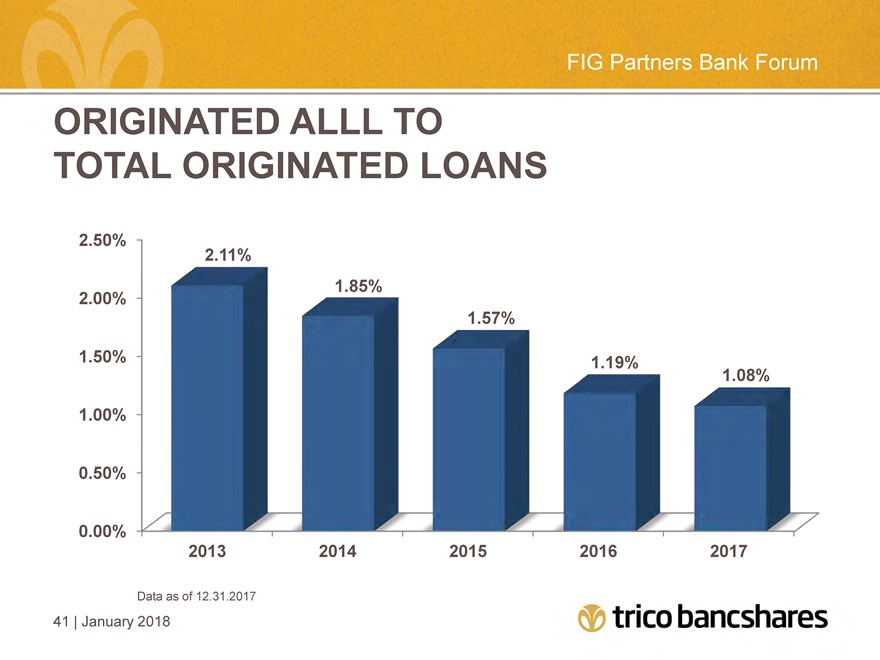
FIG Partners Bank Forum ORIGINATED ALLL TO TOTAL ORIGINATED LOANS 2.50% 2.00% 1.50% 1.00% 0.50% 0.00% 2.11% 1.85% 1.57% 1.19% 1.08% 2013 2014 2015 2016 2017 Data as of 12.31.2017 41 | January 2018
|
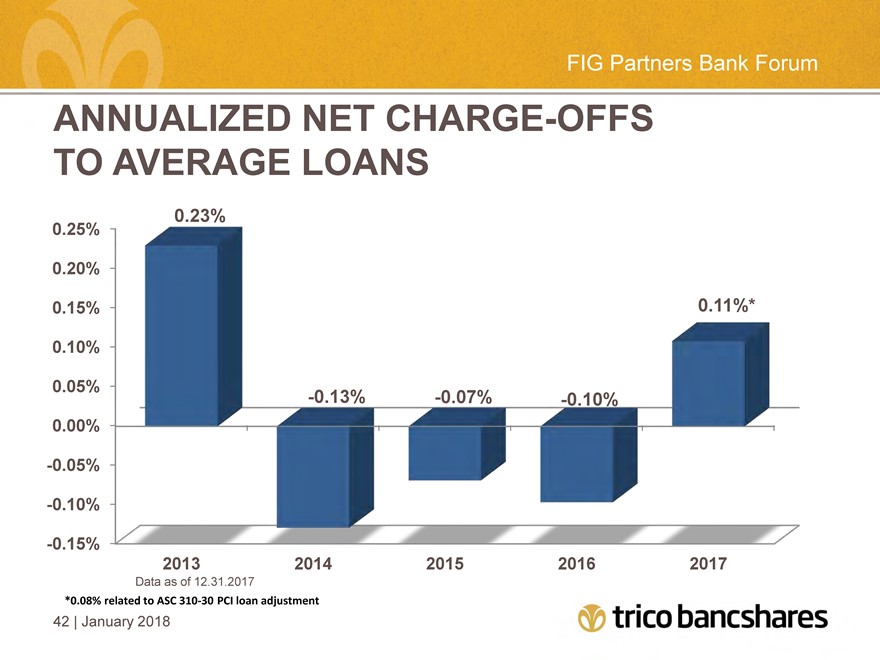
FIG Partners Bank Forum ANNUALIZED NET CHARGE-OFFS TO AVERAGE LOANS 0.25% 0.20% 0.15% 0.10% 0.05% 0.00% 0.05% 0.10% 0.15% 0.23% 0.11%* -0.13% -0.07% -0.10% 2013 2014 2015 2016 2017 Data as of 12.31.2017 *0.08% related to ASC 310-30 PCI loan adjustment 42 | January 2018
|
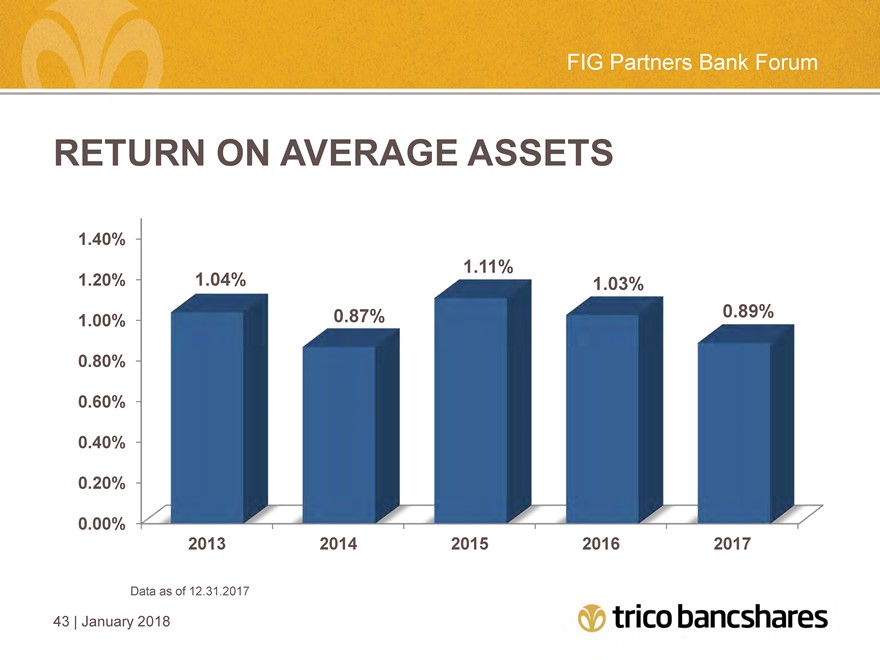
FIG Partners Bank Forum RETURN ON AVERAGE ASSETS 1.40% 1.20% 1.00% 0.80% 0.60% 0.40% 0.20% 0.00% 1.11% 1.04% 1.03% 0.87% 0.89% 2013 2014 2015 2016 2017 Data as of 12.31.2017 43 | January 2018
|
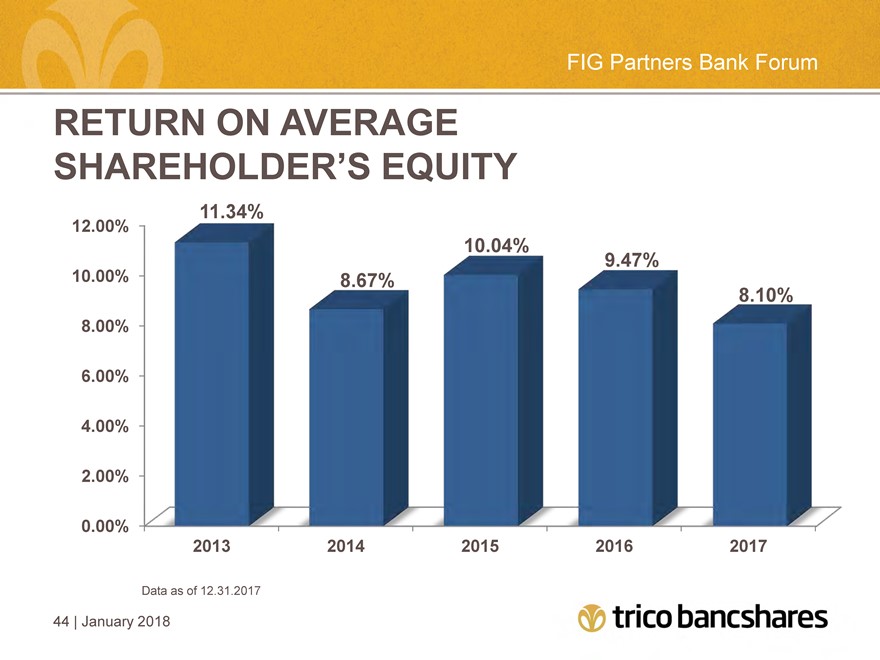
FIG Partners Bank Forum RETURN ON AVERAGE SHAREHOLDER’S EQUITY 12.00% 10.00% 8.00% 6.00% 4.00% 2.00% 0.00% 11.34% 10.04% 8.67% 9.47% 8.10% 2013 2014 2015 2016 2017 Data as of 12.31.2017 44 | January 2018
|
Acquisition of FNB Bancorp
|
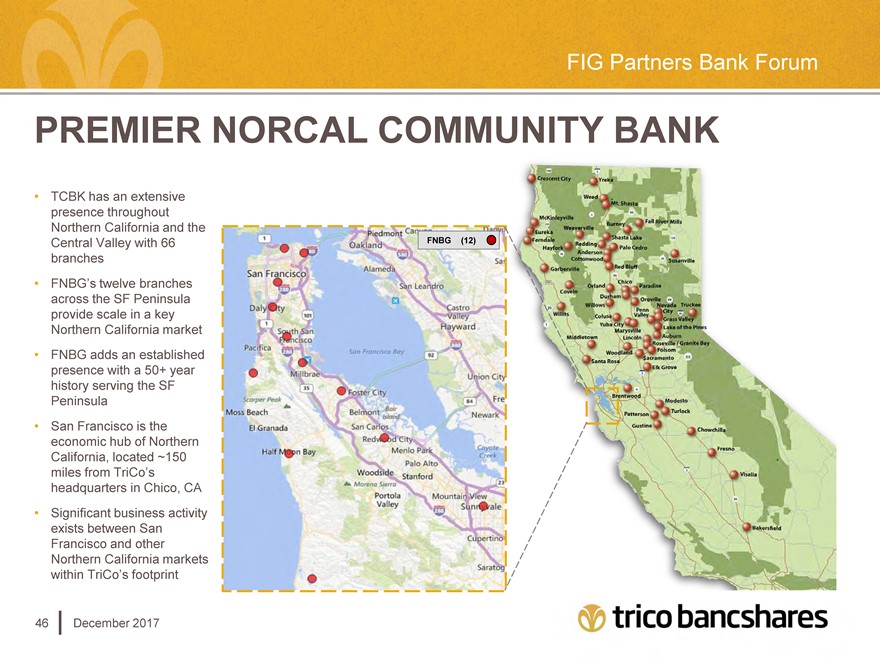
FIG Partners Bank Forum PREMIER NORCAL COMMUNITY BANK TCBK has an extensive presence throughout Northern California and the Central Valley with 66 branches FNBG’s twelve branches across the SF Peninsula provide scale in a key Northern California market FNBG adds an established presence with a 50+ year history serving the SF Peninsula San Francisco is the economic hub of Northern California, located ~150 miles from TriCo’s headquarters in Chico, CA Significant business activity exists between San Francisco and other Northern California markets within TriCo’s footprint 46 December 2017
|
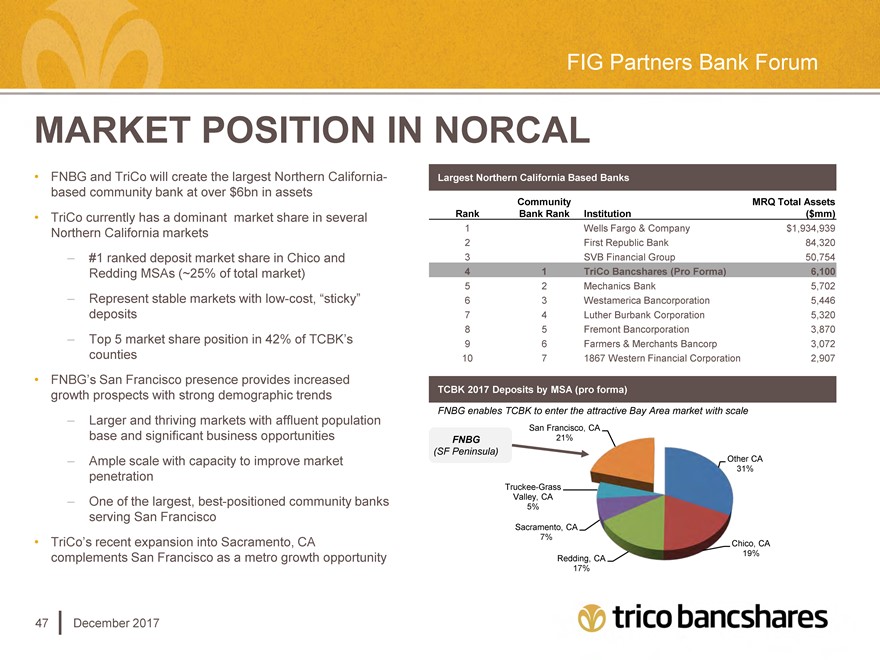
FIG Partners Bank Forum MARKET POSITION IN NORCAL FNBG and TriCo will create the largest Northern California-based community bank at over $6bn in assets TriCo currently has a dominant market share in several Northern California markets – #1 ranked deposit market share in Chico and Redding MSAs (~25% of total market) – Represent stable markets with low-cost, “sticky” deposits – Top 5 market share position in 42% of TCBK’s counties FNBG’s San Francisco presence provides increased growth prospects with strong demographic trends – Larger and thriving markets with affluent population base and significant business opportunities – Ample scale with capacity to improve market penetration – One of the largest, best-positioned community banks serving San Francisco TriCo’s recent expansion into Sacramento, CA complements San Francisco as a metro growth opportunity Largest Northern California Based Banks Community MRQ Total Assets Rank Bank Rank Institution ($mm) 1 Wells Fargo & Company $1,934,939 2 First Republic Bank 84,320 3 SVB Financial Group 50,754 4 1 TriCo Bancshares (Pro Forma) 6,100 5 2 Mechanics Bank 5,702 6 3 Westamerica Bancorporation 5,446 7 4 Luther Burbank Corporation 5,320 8 5 Fremont Bancorporation 3,870 9 6 Farmers & Merchants Bancorp 3,072 10 7 1867 Western Financial Corporation 2,907 TCBK 2017 Deposits by MSA (pro forma) FNBG enables TCBK to enter the attractive Bay Area market with scale San Francisco, CA FNBG 21% (SF Peninsula) Other CA 31% Truckee-Grass Valley, CA 5% Sacramento, CA 7% Chico, CA 19% Redding, CA 17% 47 December 2017
|
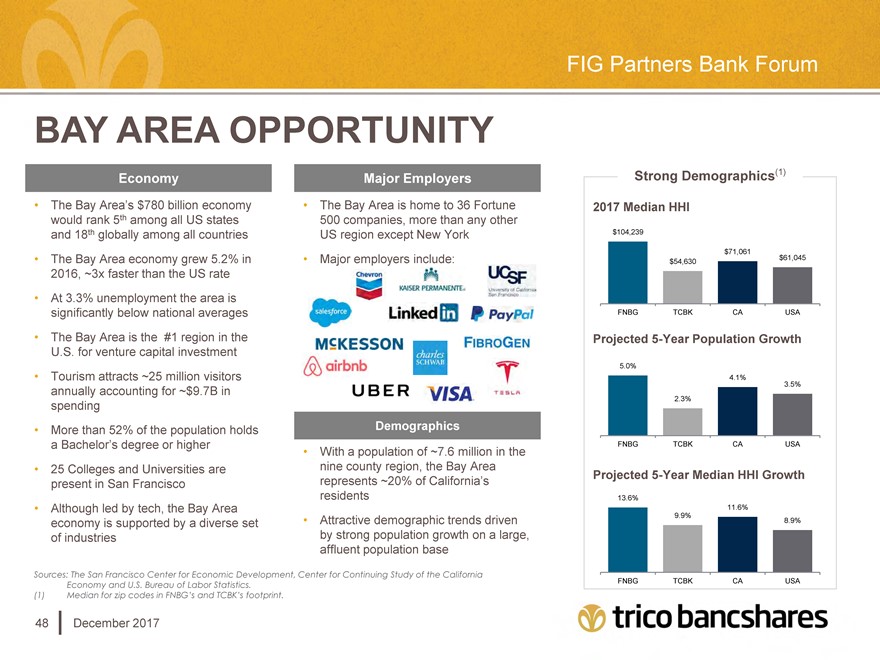
FIG Partners Bank Forum BAY AREA OPPORTUNITY Economy The Bay Area’s $780 billion economy would rank 5th among all US states and 18th globally among all countries The Bay Area economy grew 5.2% in 2016, ~3x faster than the US rate At 3.3% unemployment the area is significantly below national averages The Bay Area is the #1 region in the U.S. for venture capital investment Tourism attracts ~25 million visitors annually accounting for ~$9.7B in spending More than 52% of the population holds a Bachelor’s degree or higher 25 Colleges and Universities are present in San Francisco Although led by tech, the Bay Area economy is supported by a diverse set of industries Major Employers The Bay Area is home to 36 Fortune 500 companies, more than any other US region except New York Major employers include: Demographics With a population of ~7.6 million in the nine county region, the Bay Area represents ~20% of California’s residents Attractive demographic trends driven by strong population growth on a large, affluent population base Sources: The San Francisco Center for Economic Development, Center for Continuing Study of the California Economy and U.S. Bureau of Labor Statistics. (1) Median for zip codes in FNBG’s and TCBK’s footprint. 48 December 2017 Strong Demographics(1) 2017 Median HHI $104,239 $71,061 $61,045 $54,630 FNBG TCBK CA USA Projected 5-Year Population Growth 5.0% 4.1% 3.5% 2.3% FNBG TCBK CA USA Projected 5-Year Median HHI Growth 13.6% 11.6% 9.9% 8.9% FNBG TCBK CA USA
|
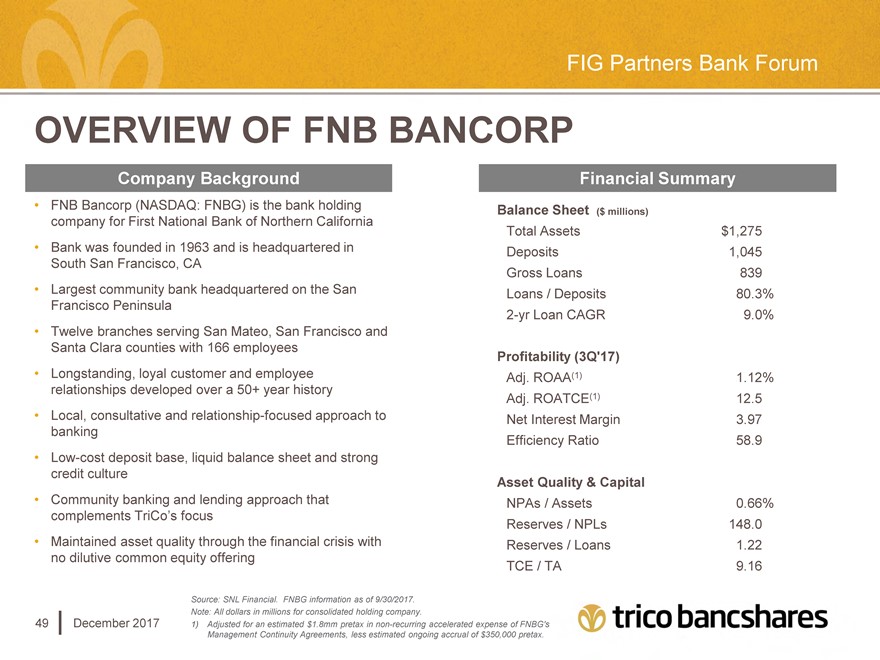
FIG Partners Bank Forum OVERVIEW OF FNB BANCORP Company Background FNB Bancorp (NASDAQ: FNBG) is the bank holding company for First National Bank of Northern California Bank was founded in 1963 and is headquartered in South San Francisco, CA Largest community bank headquartered on the San Francisco Peninsula Twelve branches serving San Mateo, San Francisco and Santa Clara counties with 166 employees Longstanding, loyal customer and employee relationships developed over a 50+ year history Local, consultative and relationship-focused approach to banking Low-cost deposit base, liquid balance sheet and strong credit culture Community banking and lending approach that complements TriCo’s focus Maintained asset quality through the financial crisis with no dilutive common equity offering Financial Summary Balance Sheet ($ millions) Total Assets $1,275 Deposits 1,045 Gross Loans 839 Loans / Deposits 80.3% 2-yr Loan CAGR 9.0% Profitability (3Q’17) Adj. ROAA(1) 1.12% Adj. ROATCE(1) 12.5 Net Interest Margin 3.97 Efficiency Ratio 58.9 Asset Quality & Capital NPAs / Assets 0.66% Reserves / NPLs 148.0 Reserves / Loans 1.22 TCE / TA 9.16 Source: SNL Financial. FNBG information as of 9/30/2017. Note: All dollars in millions for consolidated holding company. 1) Adjusted for an estimated $1.8mm pretax in non-recurring accelerated expense of FNBG’s Management Continuity Agreements, less estimated ongoing accrual of $350,000 pretax. 49 December 2017
|
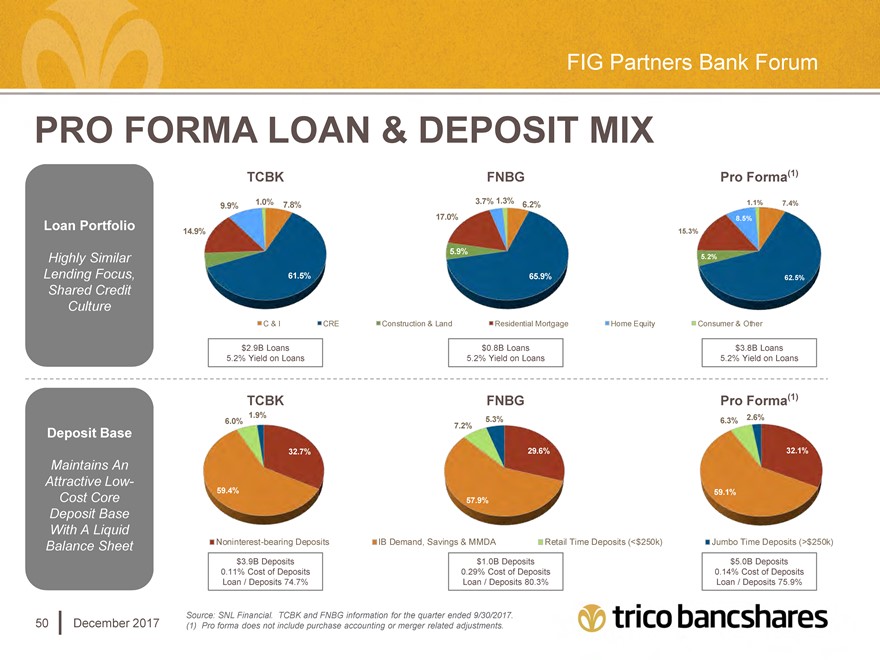
FIG Partners Bank Forum PRO FORMA LOAN & DEPOSIT MIX Loan Portfolio Highly Similar Lending Focus, Shared Credit Culture TCBK FNBG Pro Forma(1) 1.0% 7.8% 3.7% 1.3% 6.2% 1.1% 7.4% 9.9% 17.0% 8.5% 14.9% 15.3% 5.9% 5.2% 5.0% 61.5% 65.9% 62.5% CRE Construction & L Home Equity $2.9B Loans $0.8B Loans $3.8B Loans 5.2% Yield on Loans 5.2% Yield on Loans 5.2% Yield on Loans Deposit Base Maintains An Attractive Low-Cost Core Deposit Base With A Liquid Balance Sheet TCBK FNBG Pro Forma(1) 1.9% 5.3% 2.6% 6.0% 6.3% 7.2% 32.7% 29.6% 32.1% 59.4% 59.1% 57.9% s IB Demand, Sav Time Deposits (<$250k) k) $3.9B Deposits $1.0B Deposits $5.0B Deposits 0.11% Cost of Deposits 0.29% Cost of Deposits 0.14% Cost of Deposits Loan / Deposits 74.7% Loan / Deposits 80.3% Loan / Deposits 75.9% Source: SNL Financial. TCBK and FNBG information for the quarter ended 9/30/2017. (1) Pro forma does not include purchase accounting or merger related adjustments. 50 December 2017
|
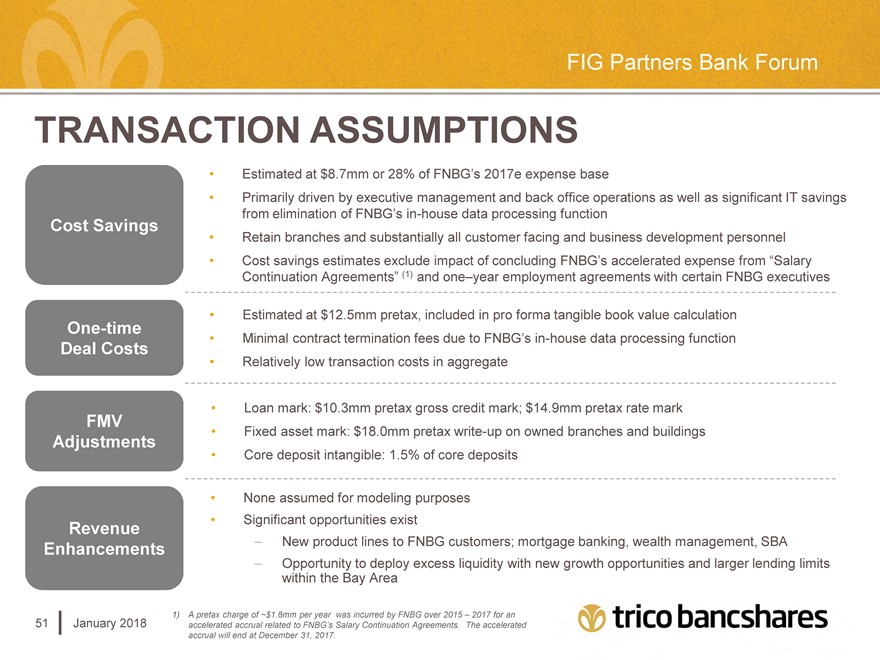
FIG Partners Bank Forum TRANSACTION ASSUMPTIONS Estimated at $8.7mm or 28% of FNBG’s 2017e expense base Primarily driven by executive management and back office operations as well as significant IT savings Cost Savings from elimination of FNBG’s in-house data processing function Retain branches and substantially all customer facing and business development personnel Cost savings estimates exclude impact of concluding FNBG’s accelerated expense from “Salary Continuation Agreements” (1) and one–year employment agreements with certain FNBG executives Estimated at $12.5mm pretax, included in pro forma tangible book value calculation One-time Deal Costs Minimal contract termination fees due to FNBG’s in-house data processing function Relatively low transaction costs in aggregate Loan mark: $10.3mm pretax gross credit mark; $14.9mm pretax rate mark FMV Adjustments Fixed asset mark: $18.0mm pretax write-up on owned branches and buildings Core deposit intangible: 1.5% of core deposits None assumed for modeling purposes Revenue Significant opportunities exist Enhancements New product lines to FNBG customers; mortgage banking, wealth management, SBA Opportunity to deploy excess liquidity with new growth opportunities and larger lending limits within the Bay Area 1) A pretax charge of ~$1.8mm per year was incurred by FNBG over 2015 – 2017 for an accelerated accrual related to FNBG’s Salary Continuation Agreements. The accelerated accrual will end at December 31, 2017. 51 January 2018
|
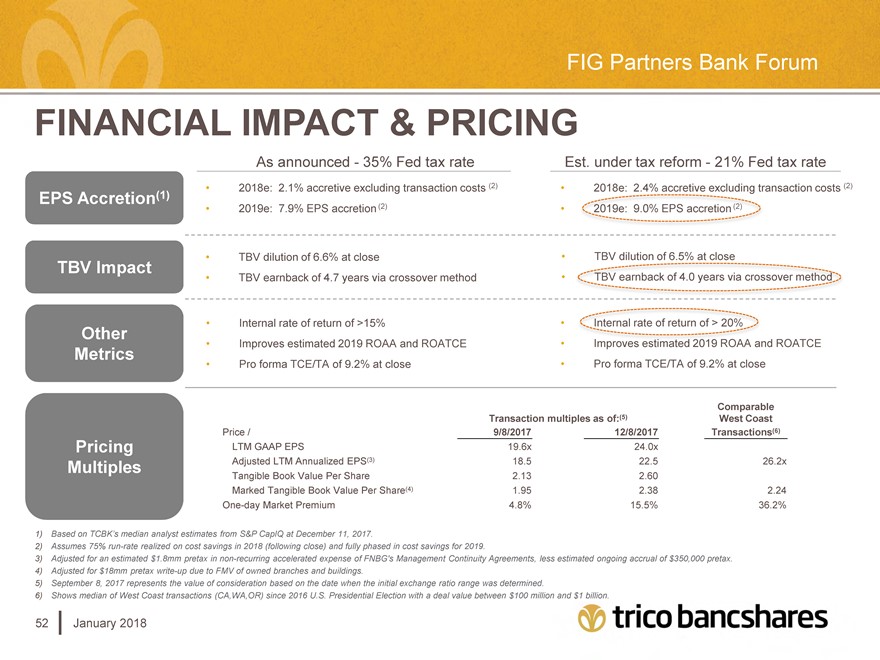
FIG Partners Bank Forum FINANCIAL IMPACT & PRICING EPS Accretion(1) TBV Impact Other Metrics Pricing Multiples As announced—35% Fed tax rate 2018e: 2.1% accretive excluding transaction costs (2) 2019e: 7.9% EPS accretion (2) TBV dilution of 6.6% at close TBV earnback of 4.7 years via crossover method Internal rate of return of >15% Improves estimated 2019 ROAA and ROATCE Pro forma TCE/TA of 9.2% at close Est. under tax reform—21% Fed tax rate 2018e: 2.4% accretive excluding transaction costs (2) TBV dilution of 6.5% at close and ROATCE Pro forma TCE/TA of 9.2% at close Price / LTM GAAP EPS Adjusted LTM Annualized EPS(3) Tangible Book Value Per Share Marked Tangible Book Value Per Share(4) One-day Market Premium Comparable Transaction multiples as of:(5) West Coast 9/8/2017 12/8/2017 Transactions(6) 19.6x 24.0x 18.5 22.5 26.2x 2.13 2.60 1.95 2.38 2.24 4.8% 15.5% 36.2% 1) Based on TCBK’s median analyst estimates from S&P CapIQ at December 11, 2017. 2) Assumes 75% run-rate realized on cost savings in 2018 (following close) and fully phased in cost savings for 2019. 3) Adjusted for an estimated $1.8mm pretax in non-recurring accelerated expense of FNBG’s Management Continuity Agreements, less estimated ongoing accrual of $350,000 pretax. 4) Adjusted for $18mm pretax write-up due to FMV of owned branches and buildings. 5) September 8, 2017 represents the value of consideration based on the date when the initial exchange ratio range was determined. 6) Shows median of West Coast transactions (CA,WA,OR) since 2016 U.S. Presidential Election with a deal value between $100 million and $1 billion. 52 January 2018
|
TRICO BANCSHARES IS COMMITTED TO: Improving the financial success and w being of our shareholders, customers, communities and employees. Tri counties bank CHICO, CALIFORNIA 1975 EST.