Attached files
| file | filename |
|---|---|
| 8-K - FORM 8-K Q4 2017 - KITE REALTY GROUP TRUST | form8k_q42017.htm |
| EX-99.1 - EXHIBIT 99.1 EARNINGS RELEASE - KITE REALTY GROUP TRUST | exhibit99_1xq42017.htm |
Exhibit 99.2 | ||
 |
QUARTERLY FINANCIAL SUPPLEMENTAL – DECEMBER 31, 2017 |  | |
PAGE NO. | TABLE OF CONTENTS | |
3 | Earnings Press Release | |
7 | Corporate Profile | |
8 | Contact Information | |
9 | Important Notes Including Non-GAAP Disclosures | |
11 | Consolidated Balance Sheets | |
12 | Consolidated Statements of Operations for the Three and Twelve Months Ended December 31, 2017 | |
13 | Funds from Operations for the Three and Twelve Months Ended December 31, 2017 | |
14 | Adjusted Funds From Operations and Other Financial Information for the Three and Twelve Months Ended December 31, 2017 | |
15 | Market Capitalization as of December 31, 2017 | |
15 | Ratio of Debt to Total Undepreciated Assets as of December 31, 2017 | |
15 | Ratio of Company Share of Net Debt to EBITDA as of December 31, 2017 | |
16 | Same Property Net Operating Income for the Three and Twelve Months Ended December 31, 2017 | |
17 | Net Operating Income by Quarter | |
18 | Consolidated Joint Venture Summary as of December 31, 2017 | |
19 | Summary of Outstanding Debt as of December 31, 2017 | |
20 | Maturity Schedule of Outstanding Debt as of December 31, 2017 | |
22 | Unsecured Public Debt Covenants | |
23 | Top 10 Retail Tenants by Total Gross Leasable Area | |
24 | Top 25 Tenants by Annualized Base Rent | |
25 | Retail Leasing Spreads | |
26 | Lease Expirations – Operating Portfolio | |
27 | Lease Expirations – Retail Anchor Tenants | |
28 | Lease Expirations – Retail Shops | |
29 | Lease Expirations – Office Tenants and Other | |
30 | Development Projects Under Construction | |
31 | Under Construction Redevelopment, Reposition, and Repurpose Projects | |
32 | Redevelopment, Reposition, and Repurpose Opportunities | |
33 | 2017 Property Dispositions | |
34 | Geographic Diversification – Annualized Base Rent by Region and State | |
35 | Operating Retail Portfolio Summary Report | |
40 | Operating Office Properties and Other | |
41 | Components of Net Asset Value | |
42 | Earnings Guidance – 2018 | |
p. 2 | Kite Realty Group Trust Supplemental Financial and Operating Statistics –12/31/17 |
 |
PRESS RELEASE
Contact Information: |
Dan Sink |
EVP & CFO |
(317) 577-5609 |
dsink@kiterealty.com |
Kite Realty Group Trust Reports Fourth Quarter and Full Year 2017 Operating Results and
Releases 2018 Guidance
Indianapolis, Ind., February 1, 2018 - Kite Realty Group Trust (NYSE: KRG) (the “Company”) announced today its operating results for the fourth quarter and full year ended December 31, 2017, and its 2018 guidance. Financial statements, exhibits, and reconciliations of non-GAAP measures attached to this release include the details of the Company’s results.
Fourth Quarter Highlights
• | Generated net income attributable to common shareholders of $2.3 million, or $0.03 per diluted common share. |
• | Realized Funds From Operations of the Operating Partnership (“FFO”), as defined by NAREIT, of $42.8 million, or $0.50 per diluted common share. |
• | Increased Same-Property Net Operating Income (“NOI”) 1.5% compared to the same period in the prior year. |
• | Realized small shop leased percentage of 90.5% at the end of the year, an increase of 160 basis points over the prior year. |
• | Executed 745,137 square feet of new and renewal leases on 131 individual spaces. |
• | Generated aggregate rent spreads on 102 comparable new and renewal leases of 7.2% on a cash basis and 11.2% on a GAAP basis. |
• | Completed two of the Company’s Redevelopment, Repurpose and Reposition (“3-R”) projects with cumulative costs totaling $8.9 million and a projected annualized return of 10.1%. |
• | Increased quarterly common dividend by 5.0% to $0.3175 per share. |
Full Year Highlights
• | Generated net income attributable to common shareholders of $11.9 million, or $0.14 per diluted common share. |
• | Realized FFO, as defined by NAREIT, of $174.7 million, or $2.04 per diluted common share. |
• | Increased Same-Property NOI 2.9% for the comparable operating portfolio, or 3.2% excluding the impact of the 3-R initiative. |
• | Achieved comparable and non-comparable new lease ABR of $23.46 compared to the portfolio average of $16.32, or a 44% premium. |
• | Executed over 2.3 million square feet of new and renewal leases on 393 individual spaces. |
• | Generated aggregate rent spreads on 298 comparable new and renewal leases of 9.0% on a cash basis and 13.3% on a GAAP basis. |
• | Completed the sale of four assets generating $78 million of gross proceeds: Cove Center in Stuart, Florida; The Shops at Village Walk in Fort Myers, Florida; Clay Marketplace in Birmingham, Alabama; and Wheatland Towne Crossing in Dallas, Texas. |
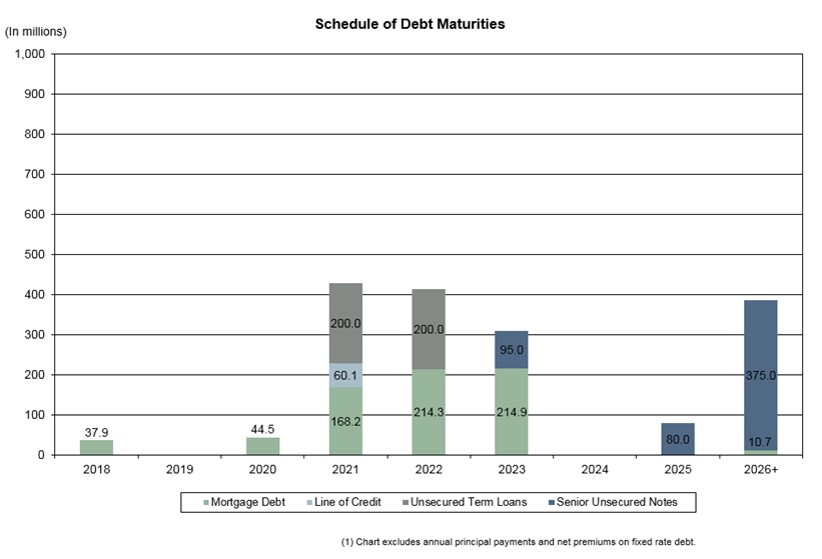
• | Maintained a well-laddered debt maturity schedule, with only $82.4 million of debt maturing through 2020 and a weighted average maturity of 5.5 years across the Company’s debt portfolio. |
• | Completed development project at Parkside Town Commons, Phase II, and the expansion of Holly Springs, Phase II, transitioning both to our operating portfolio at 95.4% and 100% leased, respectively. |
p. 3 | Kite Realty Group Trust Supplemental Financial and Operating Statistics –12/31/17 |
“Our 2017 results demonstrate the successful execution of our strategic plan,” said John Kite, Chairman and Chief Executive Officer. “Operationally, we continue to see strong demand for our well-positioned real estate, as evidenced by our small shops leased at 90.5% and our signing 298 comparable leases at a 13.3% spread on a GAAP basis. From a capital allocation perspective, we continued to execute by completing seven 3-R projects at a 12.3% yield and selling four assets for $78 million in gross proceeds. In 2018, we look forward to furthering our strategic objectives as we remain focused on operating fundamentals, expanding our relationships with strong, competitive retailers, and selling non-core assets to reach our target leverage.”
Financial & Portfolio Results
Financial Results
Net income attributable to common shareholders for the three months ended December 31, 2017, was $2.3 million, compared to $3.4 million for the same period in 2016. For the twelve months ended December 31, 2017, net income attributable to common shareholders was $11.9 million, compared to $1.2 million for the twelve months ended December 31, 2016. Full year 2017 results included a $7.4 million operating property impairment, while full year 2016 results included $2.8 million in transaction costs.
For the three months ended December 31, 2017, FFO, as defined by NAREIT, was $42.8 million, or $0.50 per diluted common share, compared to $42.1 million, or $0.49 per diluted common share, for the same period in the prior year. For the three months ended December 31, 2017, FFO, as adjusted, was $42.8 million, or $0.50 per diluted common share, compared to $42.9 million, or $0.50 per diluted common share, for the same period in the prior year.
For the twelve months ended December 31, 2017, FFO, as defined by NAREIT, was $174.7 million, or $2.04 per diluted common share, compared to $170.6 million, or $2.00 per diluted common share, for the prior year. For the twelve months ended December 31, 2017, FFO, as adjusted, was $174.7 million, or $2.04 per diluted common share, compared to $175.8 million, or $2.06 per diluted common share, for the prior year. Full year 2017 results included the effects of $78 million of asset dispositions during the year.
Portfolio Operations
As of December 31, 2017, the Company owned interests in 117 operating and redevelopment properties totaling approximately 23.3 million square feet and two development projects currently under construction totaling 0.7 million square feet. The owned gross leasable area in the Company’s retail operating portfolio was 94.8% leased as of December 31, 2017, and the Company’s total portfolio was 94.4% leased. We exceeded our small-shop goal of 90% leased, reaching 90.5% at year-end, representing an increase of 160 basis points over last year-end and 80 basis points over the prior quarter.
Same-property NOI, which includes 104 operating properties, increased 1.5% in the fourth quarter compared to the same period in the prior year. The leased percentage of properties included in the same-property pool was 94.6% at December 31, 2017, compared to 95.3% in the same period in the prior year. For the full year, same-property NOI increased 2.9% compared to the same period in the prior year, or 3.2% excluding the impact of the Company’s 3-R initiative.
The Company executed leases on 131 individual spaces totaling 745,137 square feet during the fourth quarter of 2017, including 102 comparable new and renewal leases for 672,970 square feet. Cash rent spreads on comparable new and renewal leases executed in the quarter were 20.0% and 5.3%, respectively, for a blended cash rent spread of 7.2%. The blended leasing spread on a straight-line basis, which includes periodic contractual rent increases over the term of the lease, was 11.2%.
Several noteworthy tenants recently opened, including O2 Fitness at Holly Springs Towne Center (Raleigh, NC), Hobby Lobby at Parkside Town Commons (Raleigh, NC), Aldi at Bolton Plaza (Jacksonville, FL), Ross at Trussville Promenade (Birmingham, AL), and North Italia, Talbots, and Athleta, all at Rampart Commons (Las Vegas, NV).
Development and Redevelopment
As of December 31, 2017, we had two development projects under construction across the street from the University of Notre Dame campus. In the fourth quarter, the Company entered into a joint venture in which we own a 35% non-controlling interest to develop a full-service Embassy Suites hotel at Eddy Street Commons. In addition to the hotel, the development will include new upscale apartments, residential townhomes, condos, retail space, and a community center.
We completed construction on two 3-R projects during the fourth quarter: Bolton Plaza, Phase II (Jacksonville, FL) and Trussville Promenade (Birmingham, AL). The Company invested $8.9 million into these properties for a projected annualized return of 10.1%.
p. 4 | Kite Realty Group Trust Supplemental Financial and Operating Statistics –12/31/17 |
The Company’s 3-R program currently includes seven projects under various stages of construction, with estimated combined costs ranging from $71.0 to $77.0 million and an estimated combined annualized return ranging from 8.0% to 9.0%. During the quarter, the Company commenced construction on one new 3-R project at Beechwood Promenade (Athens, GA), which will include a new 21,668 square foot lease with Michaels and a new outlot for Starbucks.
2018 Earnings Guidance
The Company is introducing guidance for 2018 FFO, as defined by NAREIT, in a range of $1.98 to $2.04 per diluted common share. The 2018 earnings guidance is based on the following key assumptions:
Operations
• | Increase in same-property NOI of 1.0% to 1.5% (including bad debt expense); |
• | Year-end retail portfolio leased rate of 94.5% to 95.5%; |
Investments
• | Dispositions of operating properties of +/- $60 million in the first quarter; |
• | No acquisition or capital markets activity; |
• | The effects of prior-year operating property dispositions of $78 million; |
Other
• | General and administrative expense of $21.5 million to $22.5 million; |
• | GAAP interest expense of $66 million to $67 million; |
• | Non-cash below market lease amortization and straight line rent of $9.0 to $9.5 million; |
• | Gain on sale of non-depreciable assets included in Other Property Related Revenue of $2 million to $3 million; and |
• | Fee Revenue of $2.0 million to $2.5 million. |
The 2018 earnings guidance is based on a number of factors, many of which are outside the Company’s control and all of which are subject to change. The Company may change its guidance during the year if actual or anticipated results vary from these or other assumptions, although the Company undertakes no obligation to do so.
Guidance Range For Full Year 2018 | Low | High | ||||
Consolidated net income per diluted common share | $ | 0.27 | $ | 0.33 | ||
Add: Depreciation, amortization and other | 1.71 | 1.71 | ||||
FFO, as defined by NAREIT, per diluted common share | $ | 1.98 | $ | 2.04 | ||
Earnings Conference Call
The Company will conduct a conference call to discuss its financial results on Friday, February 2, 2018, at 11:00 a.m. Eastern Time. A live webcast of the conference call will be available online on the Company’s corporate website at www.kiterealty.com. The dial-in numbers are (844) 309-0605 for domestic callers and (574) 990-9933 for international callers (passcode 7059307). In addition, a webcast replay link will be available on the corporate website.
About Kite Realty Group Trust
Kite Realty Group Trust is a full-service, vertically integrated real estate investment trust (REIT) engaged primarily in the ownership and operation, acquisition, development and redevelopment of high-quality neighborhood and community shopping centers in select markets in the United States. As of December 31, 2017, we owned interests in 117 operating and redevelopment properties totaling approximately 23.3 million square feet and two development projects currently under construction.
Our strategy is to maximize the cash flow of our operating properties, successfully complete the construction and lease-up of our redevelopment and development portfolio, and identify additional opportunities to acquire or dispose of properties to further strengthen the Company. New investments are focused in the shopping center sector primarily in markets where we believe we can leverage our existing infrastructure and relationships to generate attractive risk-adjusted returns or otherwise in desirable trade areas. Dispositions are generally designed to increase the quality of our portfolio and to strengthen the Company’s balance sheet.
p. 5 | Kite Realty Group Trust Supplemental Financial and Operating Statistics –12/31/17 |
Safe Harbor
Certain statements in this document that are not historical fact may constitute forward-looking statements within the meaning of Section 27A of the Securities Act of 1933 and Section 21E of the Securities Exchange Act of 1934. Such statements are based on assumptions and expectations that may not be realized and are inherently subject to risks, uncertainties and other factors, many of which cannot be predicted with accuracy and some of which might not even be anticipated. Future events and actual results, performance, transactions or achievements, financial or otherwise, may differ materially from the results, performance, transactions or achievements, financial or otherwise, expressed or implied by the forward-looking statements. Risks, uncertainties and other factors that might cause such differences, some of which could be material, include, but are not limited to: national and local economic, business, real estate and other market conditions, particularly in light of low growth in the U.S. economy as well as economic uncertainty caused by fluctuations in the prices of oil and other energy sources; financing risks, including the availability of, and costs associated with, sources of liquidity; the Company’s ability to refinance, or extend the maturity dates of, its indebtedness; the level and volatility of interest rates; the financial stability of tenants, including their ability to pay rent and the risk of tenant bankruptcies; the competitive environment in which the Company operates; acquisition, disposition, development and joint venture risks; property ownership and management risks; the Company’s ability to maintain its status as a real estate investment trust for federal income tax purposes; potential environmental and other liabilities; impairment in the value of real estate property the Company owns; the impact of online retail and the perception that such retail has on the value of shopping center assets; risks related to the geographical concentration of the Company’s properties in Florida, Indiana and Texas; insurance costs and coverage; risks associated with cybersecurity attacks and the loss of confidential information and other business interruptions; and other factors affecting the real estate industry generally. The Company refers you to the documents filed by the Company from time to time with the SEC, specifically the section titled “Risk Factors” in the Company’s and the Operating Partnership’s Annual Report on Form 10-K for the fiscal year ended December 31, 2016, which discuss these and other factors that could adversely affect the Company’s results. The Company undertakes no obligation to publicly update or revise these forward-looking statements, whether as a result of new information, future events or otherwise.
p. 6 | Kite Realty Group Trust Supplemental Financial and Operating Statistics –12/31/17 |
CORPORATE PROFILE | | |
General Description
Kite Realty Group Trust is a full-service, vertically integrated real estate investment trust (REIT) engaged primarily in the ownership and operation, acquisition, development and redevelopment of high-quality neighborhood and community shopping centers in select markets in the United States. As of December 31, 2017, we owned interests in 117 operating and redevelopment properties totaling approximately 23.3 million square feet and two development projects currently under construction.
Our strategy is to maximize the cash flow of our operating properties, successfully complete the construction and lease-up of our redevelopment and development portfolio, and identify additional opportunities to acquire or dispose of properties to further strengthen the Company. New investments are focused in the shopping center sector primarily in markets where we believe we can leverage our existing infrastructure and relationships to generate attractive risk-adjusted returns or otherwise in desirable trade areas. Dispositions are generally designed to increase the quality of our portfolio and to strengthen the Company’s balance sheet.
Company Highlights as of December 31, 2017
# of Properties | Total GLA /NRA1 | Owned GLA /NRA1 | |||||
Operating Retail Properties | 105 | 21,210,664 | 14,990,433 | ||||
Operating Office Properties and Other | 4 | 501,162 | 501,162 | ||||
Redevelopment Properties | 8 | 1,555,268 | 1,163,126 | ||||
Total Operating and Redevelopment Properties | 117 | 23,267,094 | 16,654,721 | ||||
Development Projects | 2 | 682,460 | 160,960 | ||||
Total All Properties | 119 | 23,949,554 | 16,815,681 | ||||
Retail | Office & Other | Total | |||||
Operating Properties – Leased Percentage1 | 94.8% | 82.6% | 94.4% | ||||
States | 20 | ||||||
Stock Listing: New York Stock Exchange symbol: KRG
____________________ | |
1 | Excludes square footage of structures located on land owned by the company and ground leased to tenants. |
p. 7 | Kite Realty Group Trust Supplemental Financial and Operating Statistics –12/31/17 |
CONTACT INFORMATION | | |
Corporate Office
30 South Meridian Street, Suite 1100
Indianapolis, IN 46204
(888) 577-5600
(317) 577-5600
www.kiterealty.com
Investor Relations Contact: | Analyst Coverage: | Analyst Coverage: | ||
Daniel R. Sink | Robert W. Baird & Co. | DA Davidson | ||
EVP & CFO | Mr. RJ Milligan | Mr. James O. Lykins | ||
Kite Realty Group Trust | (813) 273-8252 | (503) 603-3041 | ||
30 South Meridian Street, Suite 1100 | rjmilligan@rwbaird.com | jlykins@dadco.com | ||
Indianapolis, IN 46204 | ||||
(317) 577-5609 | Bank of America/Merrill Lynch | Hilliard Lyons | ||
dsink@kiterealty.com | Mr. Jeffrey Spector/Mr. Craig Schmidt | Ms. Carol L. Kemple | ||
(646) 855-1363/(646) 855-3640 | (502) 588-1839 | |||
Transfer Agent: | jeff.spector@baml.com | ckemple@hilliard.com | ||
craig.schmidt@baml.com | ||||
Broadridge Financial Solutions | KeyBanc Capital Markets | |||
Ms. Kristen Tartaglione | Barclays | Mr. Jordan Sadler/Mr. Todd Thomas | ||
2 Journal Square, 7th Floor | Mr. Ross Smotrich/Ms. Linda Tsai | (917) 368-2280/(917) 368-2286 | ||
Jersey City, NJ 07306 | (212) 526-2306/(212) 526-9937 | tthomas@keybanccm.com | ||
(201) 714-8094 | ross.smotrich@barclays.com | jsadler@keybanccm.com | ||
linda.tsai@barclays.com | ||||
Stock Specialist: | Raymond James | |||
BTIG | Mr. Paul Puryear/Mr. Collin Mings | |||
GTS | Mr. Michael Gorman | (727) 567-2253/(727) 567-2585 | ||
545 Madison Avenue | (212) 738-6138 | paul.puryear@raymondjames.com | ||
15th Floor | mgorman@btig.com | collin.mings@raymondjames.com | ||
New York, NY 10022 | ||||
(212) 715-2830 | Capital One Securities, Inc. | Sandler O’Neill | ||
Mr. Christopher Lucas | Mr. Alexander Goldfarb | |||
(571) 633-8151 | (212) 466-7937 | |||
christopher.lucas@capitalone.com | agoldfarb@sandleroneill.com | |||
Citigroup Global Markets | Wells Fargo Securities, LLC | |||
Mr. Michael Bilerman/Ms. Christy McElroy | Mr. Jeffrey J. Donnelly, CFA /Ms. Tamara Fique | |||
(212) 816-1383/(212) 816-6981 | (617) 603-4262/(443) 263-6568 | |||
michael.bilerman@citigroup.com | jeff.donnelly@wellsfargo.com | |||
christy.mcelroy@citigroup.com | tamara.fique@wellsfargo.com | |||
p. 8 | Kite Realty Group Trust Supplemental Financial and Operating Statistics –12/31/17 |
IMPORTANT NOTES INCLUDING NON-GAAP DISCLOSURES | | |
Interim Information
This Quarterly Financial Supplemental contains historical information of Kite Realty Group Trust (“the Company” or “KRG”) and is intended to supplement the Company’s Annual Report on Form 10-K for the year ended December 31, 2017 to be filed on or about February 23, 2018, which should be read in conjunction with this supplement. The supplemental information is unaudited, although it reflects all adjustments which, in the opinion of management, are necessary for a fair presentation of operating results for the interim periods.
Forward-Looking Statements
This supplemental information package, together with other statements and information publicly disseminated by us, contains certain forward-looking statements within the meaning of Section 27A of the Securities Act of 1933 and Section 21E of the Securities Exchange Act of 1934. Such statements are based on assumptions and expectations that may not be realized and are inherently subject to risks, uncertainties and other factors, many of which cannot be predicted with accuracy and some of which might not even be anticipated. Future events and actual results, performance, transactions or achievements, financial or otherwise, may differ materially from the results, performance, transactions or achievements, financial or otherwise, expressed or implied by the forward-looking statements. Risks, uncertainties and other factors that might cause such differences, some of which could be material, include but are not limited to:
• | national and local economic, business, real estate and other market conditions, particularly in light of low growth in the U.S. economy as well as economic uncertainty caused by fluctuations in the prices of oil and other energy sources; |
• | financing risks, including the availability of, and costs associated with, sources of liquidity; |
• | our ability to refinance, or extend the maturity dates of, our indebtedness; |
• | the level and volatility of interest rates; |
• | the financial stability of tenants, including their ability to pay rent and the risk of tenant bankruptcies; |
• | the competitive environment in which the Company operates; |
• | acquisition, disposition, development and joint venture risks; |
• | property ownership and management risks; |
• | our ability to maintain our status as a real estate investment trust for federal income tax purposes; |
• | potential environmental and other liabilities; |
• | impairment in the value of real estate property the Company owns; |
• | the impact of online retail and the perception that such retail has on the value of shopping center assets; |
• | risks related to the geographical concentration of our properties in Florida, Indiana and Texas; |
• | insurance costs and coverage; |
• | risks associated with cybersecurity attacks and the loss of confidential information and other business disruptions; |
• | other factors affecting the real estate industry generally; and |
• | other risks identified in reports the Company files with the Securities and Exchange Commission (“the SEC”) or in other documents that it publicly disseminates, including, in particular, the section titled “Risk Factors” in our Annual Report on Form |
10-K for the fiscal year ended December 31, 2016, and in our quarterly reports on Form 10-Q.
The Company undertakes no obligation to publicly update or revise these forward-looking statements, whether as a result of new information, future events or otherwise.
Non-GAAP Disclosures
Funds from Operations
Funds from Operations (FFO) is a widely used performance measure for real estate companies and is provided here as a supplemental measure of operating performance. The Company calculates FFO, a non-GAAP financial measure, in accordance with the best practices described in the April 2002 National Policy Bulletin of the National Association of Real Estate Investment Trusts ("NAREIT"). The NAREIT white paper defines FFO as net income (determined in accordance with GAAP), excluding gains (or losses) from sales and impairments of depreciated property, plus depreciation and amortization, and after adjustments for unconsolidated partnerships and joint ventures.
Considering the nature of our business as a real estate owner and operator, the Company believes that FFO is helpful to investors in measuring our operational performance because it excludes various items included in net income that do not relate to or are not indicative of our operating performance, such as gains or losses from sales of depreciated property and depreciation and amortization, which can make periodic and peer analyses of operating performance more difficult. For informational purposes, the Company has also provided FFO adjusted for accelerated amortization of debt issuance costs, transaction costs, a severance charge and a debt extinguishment loss in 2016. The Company believes this supplemental information provides a meaningful measure of our operating performance. The Company believes our presentation of FFO, as adjusted, provides investors with another financial measure that may facilitate comparison of operating performance between periods and among our peer companies. FFO should not be considered as an alternative to net income (determined in accordance with GAAP) as an indicator of our financial performance, is not an alternative to cash flow from operating activities (determined in accordance with GAAP) as a measure of our liquidity, and is not indicative of funds available to satisfy our cash needs, including our ability to make distributions. Our computation of FFO may not be comparable to FFO reported by other REITs that do not define the term in accordance with the current NAREIT definition or that interpret the current NAREIT definition differently than we do. A reconciliation of net income (computed in accordance with GAAP) to FFO is included elsewhere in this Financial Supplement.
p. 9 | Kite Realty Group Trust Supplemental Financial and Operating Statistics –12/31/17 |
IMPORTANT NOTES INCLUDING NON-GAAP DISCLOSURES (CONTINUED) | | |
Adjusted Funds from Operations
Adjusted Funds From Operations (“AFFO”) is a non-GAAP financial measure of operating performance used by many companies in the REIT industry. AFFO modifies FFO, as adjusted for certain cash and non-cash transactions not included in FFO, as adjusted. AFFO should not be considered an alternative to net income as an indication of the company's performance or as an alternative to cash flow as a measure of liquidity or ability to make distributions. Management considers AFFO a useful supplemental measure of the company’s performance. The Company’s computation of AFFO may differ from the methodology for calculating AFFO used by other REITs, and therefore, may not be comparable to such other REITs. A reconciliation of net income (computed in accordance with GAAP) to AFFO is included elsewhere in this Financial Supplement.
Net Operating Income and Same Property Net Operating Income
The Company uses property net operating income (“NOI”), a non-GAAP financial measure, to evaluate the performance of our properties. The Company defines NOI as income from our real estate, including lease termination fees received from tenants, less our property operating expenses. NOI excludes amortization of capitalized tenant improvement costs and leasing commissions and certain corporate level expenses. The Company believes that NOI is helpful to investors as a measure of our operating performance because it excludes various items included in net income that do not relate to or are not indicative of our operating performance, such as depreciation and amortization, interest expense, and impairment, if any.
The Company also uses same property NOI ("Same Property NOI"), a non-GAAP financial measure, to evaluate the performance of our properties. Same Property NOI excludes properties that have not been owned for the full period presented. It also excludes net gains from outlot sales, straight-line rent revenue, bad debt expense and recoveries, lease termination fees, amortization of lease intangibles and significant prior period expense recoveries and adjustments, if any. The Company believes that Same Property NOI is helpful to investors as a measure of our operating performance because it includes only the NOI of properties that have been owned for the full period presented, which eliminates disparities in net income due to the acquisition or disposition of properties during the particular period presented and thus provides a more consistent metric for the comparison of our properties. The year to date results represent the sum of the individual quarters, as reported.
NOI and Same Property NOI should not, however, be considered as alternatives to net income (calculated in accordance with GAAP) as indicators of our financial performance. Our computation of NOI and Same Property NOI may differ from the methodology used by other REITs, and therefore may not be comparable to such other REITs.
When evaluating the properties that are included in the same property pool, the Company has established specific criteria for determining the inclusion of properties acquired or those recently under development. An acquired property is included in the same property pool when there is a full quarter of operations in both years subsequent to the acquisition date. Development and redevelopment properties are included in the same property pool four full quarters after the properties have been transferred to the operating portfolio. A redevelopment property is first excluded from the same property pool when the execution of a redevelopment plan is likely and the Company begins recapturing space from tenants. For the quarter ended December 31, 2017, the Company excluded eight redevelopment properties and the recently completed Northdale Promenade redevelopment from the same property pool that met these criteria and were owned in both comparable periods.
Earnings Before Interest Expense, Income Tax Expense, Depreciation and Amortization (EBITDA)
The Company defines EBITDA, a non-GAAP financial measure, as net income before depreciation and amortization, interest expense and income tax expense of taxable REIT subsidiary. For informational purposes, the Company has also provided Adjusted EBITDA, which the Company defines as EBITDA less (i) EBITDA from unconsolidated entities, (ii) gains on sales of operating properties or impairment charges, (iii) other income and expense, (iv) noncontrolling interest EBITDA and (v) other non-recurring activity or items impacting comparability from period to period. Annualized Adjusted EBITDA is Adjusted EBITDA for the most recent quarter multiplied by four. Net Debt to Adjusted EBITDA is the Company's share of net debt divided by Annualized Adjusted EBITDA. EBITDA, Adjusted EBITDA, Annualized Adjusted EBITDA and Net Debt to Adjusted EBITDA, as calculated by us, are not comparable to EBITDA and EBITDA-related measures reported by other REITs that do not define EBITDA and EBITDA-related measures exactly as we do. EBITDA, Adjusted EBITDA and Annualized Adjusted EBITDA do not represent cash generated from operating activities in accordance with GAAP, and should not be considered alternatives to net income as an indicator of performance or as alternatives to cash flows from operating activities as an indicator of liquidity.
Considering the nature of our business as a real estate owner and operator, the Company believes that EBITDA, Adjusted EBITDA and the ratio of Net Debt to Adjusted EBITDA are helpful to investors in measuring our operational performance because they exclude various items included in net income that do not relate to or are not indicative of our operating performance, such as gains or losses from sales of depreciated property and depreciation and amortization, which can make periodic and peer analyses of operating performance more difficult. For informational purposes, the Company has also provided Annualized Adjusted EBITDA, adjusted as described above. The Company believes this supplemental information provides a meaningful measure of our operating performance. The Company believes presenting EBITDA and the related measures in this manner allows investors and other interested parties to form a more meaningful assessment of our operating results.
p. 10 | Kite Realty Group Trust Supplemental Financial and Operating Statistics –12/31/17 |
CONSOLIDATED BALANCE SHEETS (UNAUDITED) | | |
($ in thousands) | ||||||||
December 31, 2017 | December 31, 2016 | |||||||
Assets: | ||||||||
Investment properties, at cost | $ | 3,957,884 | $ | 3,996,065 | ||||
Less: accumulated depreciation | (664,614 | ) | (560,683 | ) | ||||
3,293,270 | 3,435,382 | |||||||
Cash and cash equivalents | 24,082 | 19,874 | ||||||
Tenant and other receivables, including accrued straight-line rent of $31,747 and $28,703 respectively, net of allowance for uncollectible accounts | 58,328 | 53,087 | ||||||
Restricted cash and escrow deposits | 8,094 | 9,037 | ||||||
Deferred costs and intangibles, net | 112,359 | 129,264 | ||||||
Prepaid and other assets | 16,365 | 9,727 | ||||||
Total Assets | $ | 3,512,498 | $ | 3,656,371 | ||||
Liabilities and Shareholders’ Equity: | ||||||||
Mortgage and other indebtedness, net | $ | 1,699,239 | $ | 1,731,074 | ||||
Accounts payable and accrued expenses | 78,482 | 80,664 | ||||||
Deferred revenue and other liabilities | 96,564 | 112,202 | ||||||
Total Liabilities | 1,874,285 | 1,923,940 | ||||||
Commitments and contingencies | ||||||||
Limited Partners’ interests in the Operating Partnership and other redeemable noncontrolling interests | 72,104 | 88,165 | ||||||
Shareholders’ Equity: | ||||||||
Kite Realty Group Trust Shareholders’ Equity: | ||||||||
Common Shares, $.01 par value, 225,000,000 shares authorized, 83,606,068 and 83,545,398 shares issued and outstanding at December 31, 2017 and December 31, 2016, respectively | 836 | 835 | ||||||
Additional paid in capital | 2,071,418 | 2,062,360 | ||||||
Accumulated other comprehensive income (loss) | 2,990 | (316 | ) | |||||
Accumulated deficit | (509,833 | ) | (419,305 | ) | ||||
Total Kite Realty Group Trust Shareholders’ Equity | 1,565,411 | 1,643,574 | ||||||
Noncontrolling Interests | 698 | 692 | ||||||
Total Equity | 1,566,109 | 1,644,266 | ||||||
Total Liabilities and Equity | $ | 3,512,498 | $ | 3,656,371 | ||||
p. 11 | Kite Realty Group Trust Supplemental Financial and Operating Statistics –12/31/17 |
CONSOLIDATED STATEMENTS OF OPERATIONS (UNAUDITED) | | |
($ in thousands, except per share data) | ||||||||||||||||
Three Months Ended December 31, | Twelve Months Ended December 31, | |||||||||||||||
2017 | 2016 | 2017 | 2016 | |||||||||||||
Revenue: | ||||||||||||||||
Minimum rent | $ | 68,518 | $ | 68,622 | $ | 273,444 | $ | 274,059 | ||||||||
Tenant reimbursements | 18,252 | 17,791 | 73,000 | 70,482 | ||||||||||||
Other property related revenue | 1,772 | 2,461 | 11,998 | 9,581 | ||||||||||||
Fee income | 377 | — | 377 | — | ||||||||||||
Total revenue | 88,919 | 88,874 | 358,819 | 354,122 | ||||||||||||
Expenses: | ||||||||||||||||
Property operating | 12,693 | 12,469 | 49,643 | 47,923 | ||||||||||||
Real estate taxes | 10,796 | 10,511 | 43,180 | 42,838 | ||||||||||||
General, administrative, and other | 5,360 | 5,375 | 21,749 | 20,603 | ||||||||||||
Transaction costs | — | — | — | 2,771 | ||||||||||||
Impairment charge | — | — | 7,411 | — | ||||||||||||
Depreciation and amortization | 40,758 | 42,939 | 172,091 | 174,564 | ||||||||||||
Total expenses | 69,607 | 71,294 | 294,074 | 288,699 | ||||||||||||
Operating income | 19,312 | 17,580 | 64,745 | 65,423 | ||||||||||||
Interest expense | (16,452 | ) | (17,613 | ) | (65,702 | ) | (65,577 | ) | ||||||||
Income tax benefit (expense) of taxable REIT subsidiary | 36 | (51 | ) | 100 | (814 | ) | ||||||||||
Other expense, net | (101 | ) | (75 | ) | (415 | ) | (169 | ) | ||||||||
Income (loss) from continuing operations | 2,795 | (159 | ) | (1,272 | ) | (1,137 | ) | |||||||||
Gains on sales of operating properties | — | 4,059 | 15,160 | 4,253 | ||||||||||||
Net income | 2,795 | 3,900 | 13,888 | 3,116 | ||||||||||||
Net income attributable to noncontrolling interests | (486 | ) | (541 | ) | (2,014 | ) | (1,933 | ) | ||||||||
Net income attributable to Kite Realty Group Trust common shareholders | $ | 2,309 | $ | 3,359 | $ | 11,874 | $ | 1,183 | ||||||||
Income per common share - basic | $ | 0.03 | $ | 0.04 | $ | 0.14 | $ | 0.01 | ||||||||
Income per common share - diluted | $ | 0.03 | $ | 0.04 | $ | 0.14 | $ | 0.01 | ||||||||
Weighted average common shares outstanding - basic | 83,595,677 | 83,545,807 | 83,585,333 | 83,436,511 | ||||||||||||
Weighted average common shares outstanding - diluted | 83,705,764 | 83,571,663 | 83,690,418 | 83,465,500 | ||||||||||||
Cash dividends declared per common share | $ | 0.3175 | $ | 0.3025 | $ | 1.2250 | $ | 1.1650 | ||||||||
p. 12 | Kite Realty Group Trust Supplemental Financial and Operating Statistics –12/31/17 |
FUNDS FROM OPERATIONS1 | | |
($ in thousands, except per share data) | ||||||||||||||||
Three Months Ended December 31, | Twelve Months Ended December 31, | |||||||||||||||
2017 | 2016 | 2017 | 2016 | |||||||||||||
Funds From Operations ("FFO") | ||||||||||||||||
Consolidated net income | $ | 2,795 | $ | 3,900 | $ | 13,888 | $ | 3,116 | ||||||||
Less: net income attributable to noncontrolling interests in properties | (428 | ) | (461 | ) | (1,731 | ) | (1,844 | ) | ||||||||
Less: gains on sales of operating properties | — | (4,059 | ) | (15,160 | ) | (4,253 | ) | |||||||||
Add: impairment charge | — | — | 7,411 | — | ||||||||||||
Add: depreciation and amortization of consolidated entities, net of noncontrolling interests | 40,425 | 42,670 | 170,315 | 173,578 | ||||||||||||
FFO of the Operating Partnership1 | 42,792 | 42,050 | 174,723 | 170,597 | ||||||||||||
Less: Limited Partners' interests in FFO | (971 | ) | (1,164 | ) | (3,966 | ) | (3,872 | ) | ||||||||
FFO attributable to Kite Realty Group Trust common shareholders1 | $ | 41,821 | $ | 40,886 | $ | 170,757 | $ | 166,725 | ||||||||
FFO, as defined by NAREIT, per share of the Operating Partnership - basic | $ | 0.50 | $ | 0.49 | $ | 2.04 | $ | 2.00 | ||||||||
FFO, as defined by NAREIT, per share of the Operating Partnership - diluted | $ | 0.50 | $ | 0.49 | $ | 2.04 | $ | 2.00 | ||||||||
FFO of the Operating Partnership1 | $ | 42,792 | $ | 42,050 | $ | 174,723 | $ | 170,597 | ||||||||
Add: accelerated amortization of debt issuance costs (non-cash) | — | — | — | 1,121 | ||||||||||||
Add: transaction costs | — | — | — | 2,771 | ||||||||||||
Add: severance charge | — | — | — | 500 | ||||||||||||
Add: loss on debt extinguishment | — | 819 | — | 819 | ||||||||||||
FFO, as adjusted, of the Operating Partnership | $ | 42,792 | $ | 42,869 | $ | 174,723 | $ | 175,808 | ||||||||
FFO, as adjusted, per share of the Operating Partnership - basic | $ | 0.50 | $ | 0.50 | $ | 2.04 | $ | 2.06 | ||||||||
FFO, as adjusted, per share of the Operating Partnership - diluted | $ | 0.50 | $ | 0.50 | $ | 2.04 | $ | 2.06 | ||||||||
Weighted average common shares outstanding - basic | 83,595,677 | 83,545,807 | 83,585,333 | 83,436,511 | ||||||||||||
Weighted average common shares outstanding - diluted | 83,705,764 | 83,571,663 | 83,690,418 | 83,465,500 | ||||||||||||
Weighted average common shares and units outstanding - basic | 85,580,898 | 85,488,234 | 85,566,272 | 85,374,910 | ||||||||||||
Weighted average common shares and units outstanding - diluted | 85,690,986 | 85,514,090 | 85,671,358 | 85,403,899 | ||||||||||||
FFO, as defined by NAREIT, per diluted share | ||||||||||||||||
Consolidated net income | $ | 0.03 | $ | 0.05 | $ | 0.16 | $ | 0.04 | ||||||||
Less: net income attributable to noncontrolling interests in properties | (0.01 | ) | (0.01 | ) | (0.03 | ) | (0.02 | ) | ||||||||
Less: gains on sales of operating properties | — | (0.05 | ) | (0.18 | ) | (0.05 | ) | |||||||||
Add: impairment charge | — | — | 0.09 | — | ||||||||||||
Add: depreciation and amortization of consolidated entities, net of noncontrolling interests | 0.48 | 0.50 | 2.00 | 2.03 | ||||||||||||
FFO, as defined by NAREIT, of the Operating Partnership per diluted share1 | $ | 0.50 | $ | 0.49 | $ | 2.04 | $ | 2.00 | ||||||||
Add: accelerated amortization of debt issuance costs | — | — | — | 0.01 | ||||||||||||
Add: transaction costs | — | — | — | 0.03 | ||||||||||||
Add: severance charge | — | — | — | 0.01 | ||||||||||||
Add: loss on debt extinguishment | — | 0.01 | — | 0.01 | ||||||||||||
FFO, as adjusted, of the Operating Partnership per diluted share | $ | 0.50 | $ | 0.50 | $ | 2.04 | $ | 2.06 | ||||||||
____________________ | |
1 | “FFO of the Operating Partnership" measures 100% of the operating performance of the Operating Partnership’s real estate properties. “FFO attributable to Kite Realty Group Trust common shareholders” reflects a reduction for the redeemable noncontrolling weighted average diluted interest in the Operating Partnership. |
p. 13 | Kite Realty Group Trust Supplemental Financial and Operating Statistics –12/31/17 |
ADJUSTED FUNDS FROM OPERATIONS AND OTHER FINANCIAL INFORMATION | | |
($ in thousands) | ||||||||||||||||
Three Months Ended December 31, | Twelve Months Ended December 31, | |||||||||||||||
2017 | 2016 | 2017 | 2016 | |||||||||||||
Reconciliation of FFO, as adjusted, to Adjusted Funds from Operations (AFFO) | ||||||||||||||||
FFO, as adjusted, of the Operating Partnership | $ | 42,792 | $ | 42,869 | $ | 174,723 | $ | 175,808 | ||||||||
Add: | ||||||||||||||||
Depreciation of non-real estate assets | 333 | 273 | 1,783 | 1,036 | ||||||||||||
Amortization of deferred financing costs | 662 | 776 | 2,676 | 3,400 | ||||||||||||
Non-cash compensation expense | 1,292 | 1,126 | 5,024 | 4,466 | ||||||||||||
Less: | ||||||||||||||||
Straight-line rent | 1,103 | 1,141 | 4,696 | 5,453 | ||||||||||||
Market rent amortization income | 1,162 | 1,042 | 3,677 | 6,863 | ||||||||||||
Amortization of debt premium | 713 | 793 | 2,913 | 3,801 | ||||||||||||
Other cash and non-cash adjustments1 | — | 1,430 | 866 | 4,701 | ||||||||||||
Capital expenditures2: | ||||||||||||||||
Maintenance capital expenditures3 | 639 | 586 | 2,863 | 1,588 | ||||||||||||
Revenue enhancing tenant improvements – retail | 1,135 | 1,106 | 12,689 | 7,238 | ||||||||||||
Revenue enhancing tenant improvements – office | — | — | 461 | — | ||||||||||||
External lease commissions | 467 | 628 | 1,893 | 2,083 | ||||||||||||
Total AFFO of the Operating Partnership | $ | 39,860 | $ | 38,318 | $ | 154,148 | $ | 152,983 | ||||||||
Other Financial Information: | ||||||||||||||||
Scheduled debt principal payments | $ | 1,240 | $ | 1,065 | $ | 4,949 | $ | 5,352 | ||||||||
Capitalized interest cost | 761 | 800 | 3,081 | 4,061 | ||||||||||||
Mark to market lease amount in Deferred revenue and other liabilities on consolidated balance sheet | 83,117 | 95,360 | ||||||||||||||
Acreage of undeveloped, vacant land in the operating portfolio4 | 46.9 | |||||||||||||||
December 31, 2017 | December 31, 2016 | |||||||
Investment properties, at cost: | ||||||||
Land, building and improvements4 | $ | 3,873,149 | $ | 3,885,223 | ||||
Furniture, equipment and other | 8,453 | 7,246 | ||||||
Land held for development | 31,142 | 34,171 | ||||||
Construction in progress | 45,140 | 69,425 | ||||||
Total | $ | 3,957,884 | $ | 3,996,065 | ||||
____________________ | |
1 | Reflects a non-cash termination fee for the quarter ended March 31, 2017 and terminated transaction costs and a severance charge for the twelve months ended December 31, 2016. |
2 | Excludes landlord work, tenant improvements and leasing commissions relating to development and redevelopment projects. |
3 | A portion of these capital improvements are reimbursed by tenants and are revenue producing. |
4 | Includes undeveloped vacant land with a book value of $21.0 million at December 31, 2017. |
p. 14 | Kite Realty Group Trust Supplemental Financial and Operating Statistics –12/31/17 |
MARKET CAPITALIZATION AS OF DECEMBER 31, 2017 | | |
($ in thousands) | ||||||||||
Percent of Total Equity | Total Market Capitalization | Percent of Total Market Capitalization | ||||||||
Equity Capitalization: | ||||||||||
Total Common Shares Outstanding | 97.7 | % | 83,606,068 | |||||||
Operating Partnership ("OP") Units Outstanding | 2.3 | % | 1,974,830 | |||||||
Combined Common Shares and OP Units | 100.0 | % | 85,580,898 | |||||||
Market Price of Common Shares | $ | 19.60 | ||||||||
Total Equity Capitalization | 1,677,386 | 50 | % | |||||||
Debt Capitalization: | ||||||||||
Company Consolidated Outstanding Debt | 1,699,239 | |||||||||
Plus: Debt Premium and Issuance Costs, net | 1,411 | |||||||||
Less: Partner Share of Consolidated Joint Venture Debt1 | (13,373 | ) | ||||||||
Company Share of Outstanding Debt | 1,687,277 | |||||||||
Less: Cash, Cash Equivalents, and Restricted Cash | (32,176 | ) | ||||||||
Total Net Debt Capitalization | 1,655,101 | 50 | % | |||||||
Total Enterprise Value | $ | 3,332,487 | 100 | % | ||||||
RATIO OF DEBT TO TOTAL UNDEPRECIATED ASSETS AS OF DECEMBER 31, 2017 | ||||||||||
Consolidated Undepreciated Real Estate Assets | $ | 3,957,884 | ||||||||
Company Share of Unconsolidated Real Estate Assets2 | 6,934 | |||||||||
3,964,818 | ||||||||||
Total Consolidated Debt | 1,699,239 | |||||||||
Plus: Debt Premium and Issuance Costs, net | 1,411 | |||||||||
Less: Cash, Cash Equivalents, and Restricted Cash | (32,176 | ) | ||||||||
$ | 1,668,474 | |||||||||
Ratio of Debt to Total Undepreciated Real Estate Assets | 42.1 | % | ||||||||
RATIO OF COMPANY SHARE OF NET DEBT TO EBITDA AS OF DECEMBER 31, 2017 | ||||||||||
Company Share of Consolidated Debt | $ | 1,687,277 | ||||||||
Less: Cash, Cash Equivalents, and Restricted Cash | (32,176 | ) | ||||||||
1,655,101 | ||||||||||
Q4 2017 EBITDA, Annualized: | ||||||||||
- Consolidated EBITDA | $ | 240,280 | ||||||||
- Unconsolidated EBITDA | 136 | |||||||||
- Minority Interest EBITDA1 | (1,404 | ) | 239,012 | |||||||
Ratio of Company Share of Net Debt to EBITDA | 6.9x | |||||||||
____________________ | |||||
1 | See page 18 for details. | ||||
2 | Included in Prepaid and other assets on Consolidated Balance Sheets. | ||||
p. 15 | Kite Realty Group Trust Supplemental Financial and Operating Statistics –12/31/17 |
SAME PROPERTY NET OPERATING INCOME (NOI) | | |
($ in thousands) | |||||||||||||||||||
Three Months Ended December 31, | Twelve Months Ended December 31, | ||||||||||||||||||
2017 | 2016 | % Change | 2017 | 2016 | % Change | ||||||||||||||
Number of properties for the quarter1 | 104 | 104 | |||||||||||||||||
Leased percentage at period end | 94.6 | % | 95.3 | % | 94.6 | % | 95.3 | % | |||||||||||
Economic Occupancy percentage2 | 93.2 | % | 93.3 | % | 93.6 | % | 93.0 | % | |||||||||||
Minimum rent | $ | 59,124 | $ | 57,940 | $ | 234,739 | $ | 228,652 | |||||||||||
Tenant recoveries | 16,172 | 15,905 | 65,245 | 62,866 | |||||||||||||||
Other income | 1,159 | 1,412 | 1,998 | 2,133 | |||||||||||||||
76,455 | 75,257 | 301,982 | 293,651 | ||||||||||||||||
Property operating expenses | (10,490 | ) | (10,474 | ) | (40,373 | ) | (39,430 | ) | |||||||||||
Real estate taxes | (9,534 | ) | (9,202 | ) | (39,342 | ) | (38,124 | ) | |||||||||||
(20,024 | ) | (19,676 | ) | (79,715 | ) | (77,554 | ) | ||||||||||||
Same Property NOI3 | $ | 56,431 | $ | 55,581 | 1.5% | $ | 222,267 | $ | 216,097 | 2.9% | |||||||||
Same Property NOI - excluding the impact of the 3-R initiative4 | 1.5% | 3.2% | |||||||||||||||||
Reconciliation of Same Property NOI to Most Directly Comparable GAAP Measure: | |||||||||||||||||||
Net operating income - same properties | $ | 56,431 | $ | 55,581 | $ | 222,267 | $ | 216,097 | |||||||||||
Net operating income - non-same activity5 | 9,546 | 10,886 | 46,156 | 49,078 | |||||||||||||||
Provision for bad debts - same properties | (547 | ) | (573 | ) | (2,427 | ) | (1,814 | ) | |||||||||||
Other expense, net | (65 | ) | (126 | ) | (315 | ) | (983 | ) | |||||||||||
General, administrative and other | (5,360 | ) | (5,375 | ) | (21,749 | ) | (20,603 | ) | |||||||||||
Transaction costs | — | — | — | (2,771 | ) | ||||||||||||||
Impairment charge | — | — | (7,411 | ) | — | ||||||||||||||
Depreciation and amortization expense | (40,758 | ) | (42,939 | ) | (172,091 | ) | (174,564 | ) | |||||||||||
Interest expense | (16,452 | ) | (17,613 | ) | (65,702 | ) | (65,577 | ) | |||||||||||
Gains on sales of operating properties | — | 4,059 | 15,160 | 4,253 | |||||||||||||||
Net income attributable to noncontrolling interests | (486 | ) | (541 | ) | (2,014 | ) | (1,933 | ) | |||||||||||
Net income attributable to common shareholders | $ | 2,309 | $ | 3,359 | $ | 11,874 | $ | 1,183 | |||||||||||
____________________ | |
1 | Same Property NOI excludes eight properties in redevelopment, the recently completed Northdale Promenade redevelopment as well as office properties (Thirty South Meridian and Eddy Street Commons). |
2 | Excludes leases that are signed but for which tenants have not yet commenced the payment of cash rent. Calculated as a weighted average based on the timing of cash rent commencement and expiration during the period. |
3 | Same Property NOI excludes net gains from outlot sales, straight-line rent revenue, bad debt expense and recoveries, lease termination fees, amortization of lease intangibles and significant prior period expense recoveries and adjustments, if any. |
4 | See pages 31 and 32 for further detail of the properties included in the 3-R initiative. |
5 | Includes non-cash activity across the portfolio as well as net operating income from properties not included in the same property pool. |
p. 16 | Kite Realty Group Trust Supplemental Financial and Operating Statistics –12/31/17 |
NET OPERATING INCOME BY QUARTER | | |
($ in thousands) | ||||||||||||||||||||
Three Months Ended | ||||||||||||||||||||
December 31, 2017 | September 30, 2017 | June 30, 2017 | March 31, 2017 | December 31, 2016 | ||||||||||||||||
Revenue: | ||||||||||||||||||||
Minimum rent1 | $ | 68,518 | $ | 67,585 | $ | 68,395 | $ | 68,946 | $ | 68,622 | ||||||||||
Tenant reimbursements | 18,252 | 17,657 | 18,521 | 18,570 | 17,791 | |||||||||||||||
Other property related revenue2 | 358 | 1,252 | 5,267 | 1,858 | 1,016 | |||||||||||||||
Overage rent | 780 | 82 | 16 | 266 | 904 | |||||||||||||||
Parking revenue, net3 | 218 | 138 | 137 | 81 | 188 | |||||||||||||||
88,126 | 86,714 | 92,336 | 89,721 | 88,521 | ||||||||||||||||
Expenses: | ||||||||||||||||||||
Property operating - Recoverable4 | 10,018 | 9,533 | 9,386 | 10,376 | 9,986 | |||||||||||||||
Property operating - Non-Recoverable4 | 2,417 | 2,053 | 2,573 | 2,318 | 2,172 | |||||||||||||||
Real estate taxes | 10,638 | 10,675 | 11,095 | 10,198 | 10,469 | |||||||||||||||
23,073 | 22,261 | 23,054 | 22,892 | 22,627 | ||||||||||||||||
Net Operating Income - Properties | 65,053 | 64,453 | 69,282 | 66,829 | 65,894 | |||||||||||||||
Other Expenses: | ||||||||||||||||||||
General, administrative, and other | (5,360 | ) | (5,431 | ) | (5,488 | ) | (5,470 | ) | (5,375 | ) | ||||||||||
Fee income | 377 | — | — | — | — | |||||||||||||||
Impairment charge | — | — | — | (7,411 | ) | — | ||||||||||||||
(4,983 | ) | (5,431 | ) | (5,488 | ) | (12,881 | ) | (5,375 | ) | |||||||||||
Earnings Before Interest, Taxes, Depreciation and Amortization | 60,070 | 59,022 | 63,794 | 53,948 | 60,519 | |||||||||||||||
Depreciation and amortization | (40,758 | ) | (42,793 | ) | (42,710 | ) | (45,830 | ) | (42,939 | ) | ||||||||||
Interest expense | (16,452 | ) | (16,372 | ) | (16,433 | ) | (16,445 | ) | (17,613 | ) | ||||||||||
Income tax benefit (expense) of taxable REIT subsidiary | 36 | 33 | (3 | ) | 33 | (51 | ) | |||||||||||||
Other expense, net | (101 | ) | (94 | ) | (80 | ) | (139 | ) | (75 | ) | ||||||||||
Income (Loss) From Continuing Operations | 2,795 | (204 | ) | 4,568 | (8,433 | ) | (159 | ) | ||||||||||||
Gains on sales of operating properties | — | — | 6,290 | 8,870 | 4,059 | |||||||||||||||
Net income (loss) | 2,795 | (204 | ) | 10,858 | 437 | 3,900 | ||||||||||||||
Less: Net income attributable to noncontrolling interests | (486 | ) | (418 | ) | (678 | ) | (432 | ) | (541 | ) | ||||||||||
Net income (loss) attributable to Kite Realty Group Trust | $ | 2,309 | $ | (622 | ) | $ | 10,180 | $ | 5 | $ | 3,359 | |||||||||
NOI/Revenue | 73.8 | % | 74.3 | % | 75.0 | % | 74.5 | % | 74.4 | % | ||||||||||
Recovery Ratios5 | ||||||||||||||||||||
- Retail Properties | 90.9 | % | 89.9 | % | 93.1 | % | 92.0 | % | 89.2 | % | ||||||||||
- Consolidated | 88.4 | % | 87.4 | % | 90.4 | % | 90.3 | % | 87.0 | % | ||||||||||
____________________ | |
1 | Minimum rent includes $5.0 million in ground lease-related revenue for the three months ended December 31, 2017. |
2 | Other property related revenue for the three months ended December 31, 2017 includes $0.1 million of lease termination income. |
3 | Parking revenue, net represents the net operating results of the Eddy Street Parking Garage and the Union Station Parking Garage. In the three months ended December 31, 2017, this amount was calculated as revenue of $635,000 less real estate taxes and property operating expenses of $159,000 and $258,000, respectively. |
4 | Recoverable expenses include total management fee expense (or recurring G&A expense of $1.3 million) allocable to the property operations in the three months ended December 31, 2017, a portion of which is recoverable. Non-recoverable expenses primarily include bad debt provision, ground rent, professional fees, and operating costs for Lake Lofts at Deerwood. |
5 | “Recovery Ratio” is computed by dividing tenant reimbursements by the sum of recoverable property operating expense and real estate tax expense. |
p. 17 | Kite Realty Group Trust Supplemental Financial and Operating Statistics –12/31/17 |
CONSOLIDATED JOINT VENTURE SUMMARY - DECEMBER 31, 2017 | | |
($ in thousands)
Ownership | ||||||||||||||
Joint Venture Entity | Location (MSA) | Owned GLA | KRG Ownership % | Current KRG Economic Ownership%1 | ||||||||||
Delray Marketplace | Delray, FL | 260,255 | 50% | 98% | ||||||||||
Pan Am Plaza | Indianapolis, IN | — | 85% | 85% | ||||||||||
Crossing at Killingly Commons | Killingly, CT | 208,929 | 55% | 90% | ||||||||||
Territory Portfolio2 | Las Vegas, NV | 847,690 | 78% | 94% | ||||||||||
Balance Sheet | Current Partner Economic Ownership % | |||||||||||||
Joint Venture Entity | Debt Balance | Partner Share of Debt | Redeemable Noncontrolling Interest | |||||||||||
Delray Marketplace | $ | 56,850 | 2% | $ | 1,138 | $ | — | |||||||
Pan Am Plaza | — | 15% | — | — | ||||||||||
Crossing at Killingly Commons | 33,000 | 10% | 3,300 | 10,070 | ||||||||||
Territory Portfolio2 | 148,940 | 6% | 8,935 | 22,461 | ||||||||||
Total | $ | 238,790 | $ | 13,373 | $ | 32,531 | ||||||||
Income Statement | ||||||||||||||
Joint Venture Entity | Quarterly Minority Interest | Annualized Minority Interest | ||||||||||||
Delray Marketplace | $ | — | $ | — | KRG has an 8% cumulative preferred return | |||||||||
Pan Am Plaza | — | — | Project currently in Land Held For Development | |||||||||||
Crossing at Killingly Commons | 132 | 528 | Partner receives a fixed annual preferred payment of 5.5% on $9.6 million | |||||||||||
Territory Portfolio2 | 219 | 876 | Partner receives a fixed annual preferred payment of 4% on $21.9 million | |||||||||||
Total | $ | 351 | $ | 1,404 | ||||||||||
____________________ | |||||||
1 | Economic ownership % represents the Company's share of cash flow. | ||||||
2 | Joint Venture includes six operating properties located in Las Vegas, Nevada. During the quarter, the Company partially redeemed a portion of our partner's ownership interest in the joint venture for $8.1 million that was settled in cash. | ||||||
p. 18 | Kite Realty Group Trust Supplemental Financial and Operating Statistics –12/31/17 |
SUMMARY OF OUTSTANDING DEBT AS OF DECEMBER 31, 2017 | | |
($ in thousands) | ||||||||||||
TOTAL OUTSTANDING DEBT1 | ||||||||||||
Outstanding Amount | Ratio | Weighted Average Interest Rate | Weighted Average Maturity (in years) | |||||||||
Fixed Rate Debt | $ | 1,562,423 | 92 | % | 4.10 | % | 5.6 | |||||
Variable Rate Debt | 138,227 | 8 | % | 3.06 | % | 4.1 | ||||||
Net Debt Premiums and Issuance Costs, Net | (1,411 | ) | N/A | N/A | N/A | |||||||
Total | $ | 1,699,239 | 100 | % | 4.02 | % | 5.5 | |||||
SCHEDULE OF MATURITIES BY YEAR | ||||||||||||||||
Secured Debt | ||||||||||||||||
Scheduled Principal Payments | Term Maturities | Unsecured Debt2 | Total Outstanding Debt | |||||||||||||
2018 | 5,635 | 37,584 | — | 43,219 | ||||||||||||
2019 | 5,975 | — | — | 5,975 | ||||||||||||
2020 | 5,920 | 42,339 | — | 48,259 | ||||||||||||
2021 | 4,625 | 159,875 | 260,100 | 424,600 | ||||||||||||
2022 | 1,113 | 205,208 | 200,000 | 406,321 | ||||||||||||
2023 | 806 | 214,940 | 95,000 | 310,746 | ||||||||||||
2024 | 854 | — | — | 854,000 | ||||||||||||
2025 | 904 | — | 80,000 | 80,904 | ||||||||||||
2026 And Beyond | 4,672 | 100 | 375,000 | 379,772 | ||||||||||||
Net Debt Premiums and Issuance Costs, Net | (1,411 | ) | — | — | (1,411 | ) | ||||||||||
Total | $ | 29,093 | $ | 660,046 | $ | 1,010,100 | $ | 1,699,239 | ||||||||
____________________ | |
1 | Fixed rate debt includes, and variable rate date excludes, the portion of such debt that has been hedged by interest rate derivatives. As of December 31, 2017, $435.5 million in variable rate debt is hedged for a weighted average 1.9 years. |
2 | This presentation reflects the Company's exercise of its option to extend the maturity date by one year to July 28, 2021 for the Company's unsecured credit facility. |
 | |
p. 19 | Kite Realty Group Trust Supplemental Financial and Operating Statistics –12/31/17 |
MATURITY SCHEDULE OF OUTSTANDING DEBT AS OF DECEMBER 31, 2017 | | |
($ in thousands) | |||||||||||||
Property | Lender | Interest Rate1 | Maturity Date | Balance as of December 31, 2017 | % of Total Outstanding | ||||||||
Whitehall Pike | CMBS | 6.71 | % | 7/5/2018 | $ | 4,569 | |||||||
Perimeter Woods | Jackson National Life Insurance | 6.02 | % | 9/1/2018 | 33,330 | ||||||||
2018 Debt Maturities | 37,899 | 2.2 | % | ||||||||||
2019 Debt Maturities | — | — | % | ||||||||||
Fishers Station | Old National Bank | LIBOR + 225 | 1/4/2020 | 6,555 | |||||||||
Lake City Commons/12th Street Plaza/University Town Center II | CMBS | 5.70 | % | 9/1/2020 | 20,700 | ||||||||
Thirty South | Associated Bank | LIBOR + 205 | 12/31/2020 | 17,218 | |||||||||
2020 Debt Maturities | 44,473 | 2.6 | % | ||||||||||
Waxahachie Crossing | CMBS | 5.55 | % | 3/1/2021 | 7,750 | ||||||||
International Speedway Square | CMBS | 5.77 | % | 4/1/2021 | 19,017 | ||||||||
Lima Marketplace | CMBS | 5.80 | % | 4/1/2021 | 8,383 | ||||||||
Bell Oaks Centre | CMBS | 5.59 | % | 4/1/2021 | 6,548 | ||||||||
Northcrest Shopping Center | CMBS | 5.48 | % | 5/1/2021 | 15,780 | ||||||||
University Town Center | CMBS | 5.48 | % | 6/1/2021 | 18,690 | ||||||||
Village at Bay Park | CMBS | 5.58 | % | 6/1/2021 | 9,183 | ||||||||
Silver Springs Pointe | CMBS | 5.03 | % | 7/1/2021 | 8,800 | ||||||||
Lake Mary Plaza | CMBS | 5.10 | % | 7/1/2021 | 5,080 | ||||||||
Unsecured Credit Facility 2,3 | KeyBank (Admin. Agent) | LIBOR + 135 | 7/28/2021 | 60,100 | |||||||||
Unsecured Term Loan3 | KeyBank (Admin. Agent) | LIBOR + 130 | 7/28/2021 | 200,000 | |||||||||
Bayport Commons | CMBS | 5.44 | % | 9/1/2021 | 11,906 | ||||||||
Eddy Street Commons | CMBS | 5.44 | % | 9/1/2021 | 23,131 | ||||||||
Four Property Pool Loan | CMBS | 5.44 | % | 9/1/2021 | 33,967 | ||||||||
2021 Debt Maturities | 428,335 | 25.2 | % | ||||||||||
Centre at Panola, Phase I | CMBS | 6.78 | % | 1/1/2022 | 1,667 | ||||||||
Delray Marketplace4 | Bank of America | LIBOR + 160 | 2/5/2022 | 56,850 | |||||||||
Palm Coast Landing | CMBS | 5.00 | % | 3/1/2022 | 22,274 | ||||||||
Bayonne Crossing | CMBS | 4.33 | % | 4/1/2022 | 44,505 | ||||||||
Saxon Crossing | CMBS | 4.65 | % | 7/1/2022 | 11,400 | ||||||||
Merrimack Village Center | CMBS | 4.36 | % | 7/6/2022 | 5,445 | ||||||||
Shops at Moore | CMBS | 4.29 | % | 9/1/2022 | 21,300 | ||||||||
Shops at Julington Creek | CMBS | 4.60 | % | 9/1/2022 | 4,785 | ||||||||
Centre Point Commons | CMBS | 4.34 | % | 10/1/2022 | 14,410 | ||||||||
Unsecured Term Loan3 | KeyBank (Admin. Agent) | LIBOR + 160 | 10/26/2022 | 200,000 | |||||||||
Miramar Square | CMBS | 4.16 | % | 12/1/2022 | 31,625 | ||||||||
2022 Debt Maturities | 414,261 | 24.4 | % | ||||||||||
See footnotes on next page | |||||||||||||
p. 20 | Kite Realty Group Trust Supplemental Financial and Operating Statistics –12/31/17 |
MATURITY SCHEDULE OF OUTSTANDING DEBT AS OF DECEMBER 31, 2017 (CONTINUED) | | |
($ in thousands) | |||||||||||||
Property | Lender | Interest Rate1 | Maturity Date | Balance as of December 31, 2017 | % of Total Outstanding | ||||||||
Centennial Gateway / Eastgate5 | CMBS | 3.81 | % | 1/1/2023 | $ | 44,385 | |||||||
Crossing at Killingly Commons5 | Huntington Bank | LIBOR + 170 | 1/1/2023 | 33,000 | |||||||||
Centennial Center5 | CMBS | 3.83 | % | 1/6/2023 | 70,455 | ||||||||
Eastern Beltway5 | CMBS | 3.83 | % | 1/6/2023 | 34,100 | ||||||||
The Corner | CMBS | 4.10 | % | 3/1/2023 | 14,750 | ||||||||
Chapel Hill | CMBS | 3.78 | % | 4/1/2023 | 18,250 | ||||||||
Senior Unsecured Note | Various | 4.23 | % | 9/10/2023 | 95,000 | ||||||||
2023 Debt Maturities | 309,940 | 18.2 | % | ||||||||||
Senior Unsecured Note | Various | 4.47 | % | 9/10/2025 | 80,000 | ||||||||
Senior Unsecured Note | Various | 4.00 | % | 10/1/2026 | 300,000 | ||||||||
Senior Unsecured Note | Various | 4.57 | % | 9/10/2027 | 75,000 | ||||||||
Rampart Commons | CMBS | 5.73 | % | 6/10/2030 | 10,742 | ||||||||
2024 And Beyond Debt Maturities | 465,742 | 27.4 | % | ||||||||||
NET PREMIUMS ON ACQUIRED DEBT & ISSUANCE COSTS | (1,411 | ) | |||||||||||
TOTAL DEBT PER CONSOLIDATED BALANCE SHEET | $ | 1,699,239 | |||||||||||
UNCONSOLIDATED DEBT | |||||||||||||
Embassy Suites at University of Notre Dame6 | 1st Source Bank | LIBOR + 250 | 7/1/2024 | — | |||||||||
____________________ | |
1 | At December 29, 2017, one-month LIBOR was 1.56%. |
2 | Assumes Company exercises its option to extend the maturity date by one year |
3 | The Company has 100 unencumbered properties of which 93 are wholly owned and included in the unencumbered property pool of our unsecured facilities. |
4 | Property is held in a joint venture. The loan is guaranteed by Kite Realty Group, LP. See Joint Venture Summary on page 18 for additional detail. |
5 | Property is held in a joint venture. See Joint Venture Summary on page 18 for additional detail. |
6 | Total loan commitment is $33.8 million. Beginning on July 1, 2019 the loan will convert to a fixed rate loan with an interest rate of 5.02%. On August 1, 2020 the loan will begin amortizing. |
p. 21 | Kite Realty Group Trust Supplemental Financial and Operating Statistics –12/31/17 |
UNSECURED PUBLIC DEBT COVENANTS | |
December 31, 2017 | Threshold1 | |||||
Total Debt to Undepreciated Assets | 41.4% | <60% | ||||
Secured Debt to Undepreciated Assets | 16.8% | <40% | ||||
Undepreciated Unencumbered Assets to Unsecured Debt | 259.6% | >150% | ||||
Debt Service Coverage | 3.5 | >1.5x | ||||
Senior Unsecured Debt Ratings: | ||||||
Moody's Investors Service | Baa3/Stable | |||||
Standard & Poor's Rating Services | BBB-/Stable | |||||
Liquidity ($ in thousands) | ||||||
Cash and cash equivalents | $ | 24,082 | ||||
Availability under unsecured credit facility | 373,799 | |||||
$ | 397,881 | |||||
____________________ | ||||
1 | For a complete listing of all Debt Covenants related to the Company's Senior Unsecured Notes, as well as definitions of the terms, refer to the Company's filings with the SEC. | |||
p. 22 | Kite Realty Group Trust Supplemental Financial and Operating Statistics –12/31/17 |
TOP 10 RETAIL TENANTS BY TOTAL GROSS LEASABLE AREA (GLA) | | |
As of December 31, 2017
This table includes the following:
• | Operating retail properties; |
• | Operating office properties; and |
• | Development/Redevelopment property tenants open for business or ground lease tenants who commenced paying rent as of December 31, 2017. |
Tenant | Number of Locations | Total GLA | Number of Leases | Company Owned GLA | Ground Lease GLA | Number of Anchor Owned Locations | Anchor Owned GLA | ||||||||||||||
Wal-Mart Stores, Inc.1 | 15 | 2,578,323 | 6 | 203,742 | 811,956 | 9 | 1,562,625 | ||||||||||||||
Target Corporation | 15 | 2,175,101 | — | — | — | 15 | 2,175,101 | ||||||||||||||
Lowe's Companies, Inc. | 14 | 2,072,666 | 5 | 128,997 | 650,161 | 9 | 1,293,508 | ||||||||||||||
Home Depot Inc. | 6 | 788,167 | 1 | — | 131,858 | 5 | 656,309 | ||||||||||||||
Kohl's Corporation | 9 | 782,386 | 5 | 184,516 | 244,010 | 4 | 353,860 | ||||||||||||||
Publix Super Markets, Inc. | 14 | 670,665 | 14 | 670,665 | — | — | — | ||||||||||||||
The TJX Companies, Inc. 2 | 22 | 656,931 | 22 | 656,931 | — | — | — | ||||||||||||||
Ross Stores, Inc. | 18 | 510,707 | 18 | 510,707 | — | — | — | ||||||||||||||
Bed Bath & Beyond, Inc. 3 | 19 | 493,719 | 19 | 493,719 | — | — | — | ||||||||||||||
Petsmart, Inc. | 19 | 390,843 | 19 | 390,843 | — | — | — | ||||||||||||||
Total | 151 | 11,119,508 | 109 | 3,240,120 | 1,837,985 | 42 | 6,041,403 | ||||||||||||||
____________________ | |
1 | Includes Sam's Club, which is owned by the same parent company. |
2 | Includes TJ Maxx (13), Home Goods (2) and Marshalls (7), all of which are owned by the same parent company. |
3 | Includes Buy Buy Baby (4), Christmas Tree Shops (1) and Cost Plus (3), all of which are owned by the same parent company. |
p. 23 | Kite Realty Group Trust Supplemental Financial and Operating Statistics –12/31/17 |
TOP 25 TENANTS BY ANNUALIZED BASE RENT | | |
As of December 31, 2017
($ in thousands, except per square foot data)
This table includes the following:
• | Operating retail properties; |
• | Operating office properties; and |
• | Development/Redevelopment property tenants open for business or ground lease tenants who commenced paying rent as of December 31, 2017. |
Tenant | Number of Stores | Leased GLA/NRA1 | % of Total GLA/NRA of the Portfolio | Annualized Base Rent2,3 | Annualized Base Rent per Sq. Ft.3 | % of Total Portfolio Annualized Base Rent3 | |||||||||||||
The TJX Companies, Inc.4 | 22 | 656,931 | 2.7 | % | $ | 6,833 | $ | 10.40 | 2.5 | % | |||||||||
Publix Super Markets, Inc. | 14 | 670,665 | 2.7 | % | 6,739 | 10.05 | 2.5 | % | |||||||||||
Petsmart, Inc. | 19 | 390,843 | 1.6 | % | 6,152 | 15.74 | 2.2 | % | |||||||||||
Bed Bath & Beyond, Inc.5 | 19 | 493,719 | 2.0 | % | 6,050 | 12.25 | 2.2 | % | |||||||||||
Ross Stores, Inc. | 18 | 510,707 | 2.1 | % | 5,791 | 11.34 | 2.1 | % | |||||||||||
Lowe's Companies, Inc. | 5 | 128,997 | 0.5 | % | 5,039 | 6.47 | 1.8 | % | |||||||||||
Office Depot (9) / Office Max (6) | 15 | 307,788 | 1.3 | % | 4,242 | 13.78 | 1.6 | % | |||||||||||
Dick's Sporting Goods, Inc.6 | 8 | 390,502 | 1.6 | % | 4,167 | 10.67 | 1.5 | % | |||||||||||
Nordstrom, Inc. | 6 | 197,845 | 0.8 | % | 3,995 | 20.19 | 1.5 | % | |||||||||||
Michaels Stores, Inc. | 14 | 295,066 | 1.2 | % | 3,884 | 13.16 | 1.4 | % | |||||||||||
Ascena Retail Group7 | 33 | 202,482 | 0.8 | % | 3,817 | 18.85 | 1.4 | % | |||||||||||
Wal-Mart Stores, Inc.8 | 6 | 203,742 | 0.8 | % | 3,655 | 3.60 | 1.3 | % | |||||||||||
LA Fitness | 5 | 208,209 | 0.8 | % | 3,447 | 16.56 | 1.3 | % | |||||||||||
Best Buy Co., Inc. | 6 | 213,604 | 0.9 | % | 3,069 | 14.37 | 1.1 | % | |||||||||||
Mattress Firm Holdings Corp (18) / Sleepy's (5) | 23 | 105,001 | 0.4 | % | 2,935 | 27.95 | 1.1 | % | |||||||||||
Kohl's Corporation | 5 | 184,516 | 0.8 | % | 2,927 | 6.83 | 1.1 | % | |||||||||||
Toys "R" Us, Inc.9 | 6 | 179,316 | 0.7 | % | 2,924 | 11.82 | 1.1 | % | |||||||||||
National Amusements | 1 | 80,000 | 0.3 | % | 2,898 | 36.22 | 1.1 | % | |||||||||||
Petco Animal Supplies, Inc. | 12 | 167,455 | 0.7 | % | 2,819 | 16.83 | 1.0 | % | |||||||||||
Ulta Beauty, Inc. | 12 | 127,451 | 0.5 | % | 2,559 | 20.08 | 0.9 | % | |||||||||||
DSW Inc. | 9 | 175,133 | 0.7 | % | 2,491 | 14.22 | 0.9 | % | |||||||||||
Stein Mart, Inc. | 9 | 307,222 | 1.3 | % | 2,378 | 7.74 | 0.9 | % | |||||||||||
Frank Theatres | 2 | 122,224 | 0.5 | % | 2,311 | 18.91 | 0.8 | % | |||||||||||
Hobby Lobby Stores, Inc. | 5 | 271,254 | 1.1 | % | 2,190 | 8.07 | 0.8 | % | |||||||||||
Walgreens Boots Alliance, Inc. | 4 | 67,212 | 0.3 | % | 2,099 | 31.23 | 0.8 | % | |||||||||||
TOTAL | 278 | 6,657,884 | 27.1 | % | $ | 95,412 | $ | 11.36 | 34.9 | % | |||||||||
____________________ | |
1 | Excludes the estimated size of the structures located on land owned by the Company and ground leased to tenants. |
2 | Annualized base rent represents the monthly contractual rent for December 31, 2017 for each applicable tenant multiplied by 12. Annualized base rent does not include tenant reimbursements. |
3 | Annualized base rent and percent of total portfolio includes ground lease rent. |
4 | Includes TJ Maxx (13), Marshalls (7) and HomeGoods (2), all of which are owned by the same parent company. |
5 | Includes Bed Bath and Beyond (11), Buy Buy Baby (4) Christmas Tree Shops (1) and Cost Plus (3), all of which are owned by the same parent company. |
6 | Includes Dick's Sporting Goods (7) and Golf Galaxy (1), both of which are owned by the same parent company. |
7 | Includes Ann Taylor (5), Catherine's (2), Dress Barn (11), Lane Bryant (7), Justice Stores (4) and Maurices (4), all of which are owned by the same parent company. |
8 | Includes Sam's Club, which is owned by the same parent company. |
9 | Includes Babies "R" Us (3), and Toys "R" Us/Babies "R" Us combination stores (3), both of which are owned by the same parent company. |
p. 24 | Kite Realty Group Trust Supplemental Financial and Operating Statistics –12/31/17 |
RETAIL LEASING SPREADS | | |
Comparable Space1,2 | |||||||||||||||||||||||||||||
Category | Total Leases | Total Sq. Ft. | Leases | Sq. Ft. | Prior Rent PSF3 | New Rent PSF4,5 | Cash Rent Spread | GAAP Rent Spread6 | TI, LL Work, Lease Commissions PSF7,8 | ||||||||||||||||||||
New Leases - Q4, 2017 | 48 | 155,805 | 19 | 83,638 | $ | 17.09 | $ | 20.51 | 20.0 | % | 29.7 | % | $ | 74.23 | |||||||||||||||
New Leases - Q3, 2017 | 39 | 92,089 | 18 | 44,091 | $ | 23.58 | $ | 28.04 | 18.9 | % | 24.9 | % | $ | 49.06 | |||||||||||||||
New Leases - Q2, 2017 | 51 | 164,214 | 23 | 71,828 | $ | 21.52 | $ | 25.27 | 17.4 | % | 28.1 | % | $ | 58.67 | |||||||||||||||
New Leases - Q1, 20179 | 32 | 109,513 | 15 | 74,122 | $ | 10.20 | $ | 14.85 | 45.5 | % | 47.5 | % | $ | 34.37 | |||||||||||||||
Renewals - Q4, 2017 | 83 | 589,332 | 83 | 589,332 | $ | 16.47 | $ | 17.34 | 5.3 | % | 8.8 | % | $ | 0.73 | |||||||||||||||
Renewals - Q3, 2017 | 47 | 340,725 | 47 | 340,725 | $ | 16.40 | $ | 17.99 | 9.7 | % | 16.4 | % | $ | 1.63 | |||||||||||||||
Renewals - Q2, 2017 | 45 | 460,103 | 45 | 460,103 | $ | 14.07 | $ | 15.20 | 8.0 | % | 11.3 | % | $ | 2.42 | |||||||||||||||
Renewals - Q1, 201710 | 48 | 399,851 | 48 | 399,851 | $ | 16.13 | $ | 16.89 | 4.7 | % | 9.3 | % | $ | 2.34 | |||||||||||||||
Total - Q4, 2017 | 131 | 745,137 | 102 | 672,970 | $ | 16.55 | $ | 17.74 | 7.2 | % | 11.2 | % | $ | 9.86 | |||||||||||||||
Total - Q3, 2017 | 86 | 432,814 | 65 | 384,816 | $ | 17.22 | $ | 19.14 | 11.1 | % | 17.0 | % | $ | 7.06 | |||||||||||||||
Total - Q2, 2017 | 96 | 624,317 | 68 | 531,931 | $ | 15.08 | $ | 16.56 | 9.8 | % | 13.9 | % | $ | 10.02 | |||||||||||||||
Total - Q1, 201710 | 80 | 509,364 | 63 | 473,973 | $ | 15.20 | $ | 16.57 | 9.0 | % | 13.7 | % | $ | 7.34 | |||||||||||||||
________________ | |
1 | Comparable space leases on this report are included for retail properties only. Leases at our two office properties, Thirty South Meridian and Eddy Street, are included in the totals and ground leases are excluded. |
2 | Comparable leases represent those leases signed for which there was a former tenant within the last 12 months. |
3 | Prior rent represents minimum rent, if any, paid by the prior tenant in the final 12 months of the term. |
4 | All amounts reported at lease execution. |
5 | Contractual rent represents contractual minimum rent per square foot for the first 12 months of the lease. |
6 | The aggregate spread on a straight-line basis over the contractual life of the lease to the comparable lease. |
7 | Includes redevelopment costs for tenant specific landlord work and tenant allowances provided to tenants at properties in the 3-R pipeline. |
8 | Excluding the costs associated with two anchor leases, the Q4, 2017 new lease costs were $50.27 psf. |
9 | Cash rent spread on comparable new leases for Q1, 2017, excluding one anchor lease, was 14.3%. |
10 | Cash renewal spread on comparable leases for Q1, 2017, excluding one strategic anchor renewal, was 5.5%. The aggregate spread excluding the one anchor renewal was 10.3%. |
p. 25 | Kite Realty Group Trust Supplemental Financial and Operating Statistics –12/31/17 |
LEASE EXPIRATIONS – OPERATING PORTFOLIO | | |
As of December 31, 2017
($ in thousands, except per square foot data)
This table includes the following:
• | Operating retail properties; |
• | Operating office properties; and |
• | Development/Redevelopment property tenants open for business or ground lease tenants who commenced paying rent as of December 31, 2017. |
Number of Expiring Leases1 | Expiring GLA/NRA2 | % of Total GLA/NRA Expiring | Expiring Annualized Base Rent3, 4 | % of Total Annualized Base Rent | Expiring Annualized Base Rent per Sq. Ft. | Expiring Ground Lease Revenue | ||||||||||||||||||
2018 | 218 | 967,337 | 6.3 | % | $ | 17,938 | 7.1 | % | $ | 18.54 | $ | 68 | ||||||||||||
2019 | 254 | 1,692,272 | 11.0 | % | 25,225 | 10.0 | % | 14.91 | 653 | |||||||||||||||
2020 | 255 | 2,078,070 | 13.4 | % | 28,458 | 11.3 | % | 13.69 | 1,592 | |||||||||||||||
2021 | 300 | 1,779,909 | 11.5 | % | 29,724 | 11.8 | % | 16.70 | 911 | |||||||||||||||
2022 | 314 | 2,167,081 | 14.0 | % | 36,769 | 14.6 | % | 16.97 | 1,240 | |||||||||||||||
2023 | 227 | 1,915,798 | 12.4 | % | 32,155 | 12.8 | % | 16.78 | 1,979 | |||||||||||||||
2024 | 101 | 902,748 | 5.8 | % | 16,589 | 6.6 | % | 18.38 | 288 | |||||||||||||||
2025 | 82 | 776,566 | 5.0 | % | 13,604 | 5.4 | % | 17.52 | 806 | |||||||||||||||
2026 | 80 | 767,131 | 5.0 | % | 11,292 | 4.5 | % | 14.72 | 1,320 | |||||||||||||||
2027 | 83 | 793,480 | 5.1 | % | 12,671 | 5.0 | % | 15.97 | 358 | |||||||||||||||
Beyond | 92 | 1,613,068 | 10.5 | % | 27,250 | 10.8 | % | 16.89 | 10,678 | |||||||||||||||
2,006 | 15,453,460 | 100.0 | % | $ | 251,674 | 100.0 | % | $ | 16.29 | $ | 19,892 | |||||||||||||
____________________ | |
1 | Lease expiration table reflects rents in place as of December 31, 2017 and does not include option periods; 2018 expirations include 15 month-to-month tenants. This column also excludes ground leases. |
2 | Expiring GLA excludes estimated square footage attributable to non-owned structures on land owned by the Company and ground leased to tenants. |
3 | Annualized base rent represents the monthly contractual rent for December 2017 for each applicable tenant multiplied by 12. Excludes tenant reimbursements and ground lease revenue. |
4 | 55% of our annualized base rent is generated from tenants less than 16,000 square feet. |
p. 26 | Kite Realty Group Trust Supplemental Financial and Operating Statistics –12/31/17 |
LEASE EXPIRATIONS – RETAIL ANCHOR TENANTS1 | | |
As of December 31, 2017
($ in thousands, except per square foot data)
This table includes the following:
• | Operating retail properties; and |
• | Development/Redevelopment property tenants open for business or ground lease tenants who commenced paying rent as of December 31, 2017. |
Number of Expiring Leases2 | Expiring GLA/NRA3 | % of Total GLA/NRA Expiring | Expiring Annualized Base Rent4 | % of Total Annualized Base Rent | Expiring Annualized Base Rent per Sq. Ft. | Expiring Ground Lease Revenue | ||||||||||||||||||
2018 | 18 | 482,006 | 3.1 | % | $ | 5,432 | 2.2 | % | $ | 11.27 | $ | — | ||||||||||||
2019 | 34 | 1,103,859 | 7.1 | % | 10,789 | 4.3 | % | 9.77 | — | |||||||||||||||
2020 | 39 | 1,538,271 | 10.0 | % | 15,534 | 6.2 | % | 10.10 | 1,111 | |||||||||||||||
2021 | 43 | 1,112,245 | 7.2 | % | 12,925 | 5.1 | % | 11.62 | 318 | |||||||||||||||
2022 | 53 | 1,434,297 | 9.3 | % | 18,204 | 7.2 | % | 12.69 | 745 | |||||||||||||||
2023 | 46 | 1,244,074 | 8.1 | % | 17,651 | 7.0 | % | 14.19 | 1,454 | |||||||||||||||
2024 | 21 | 593,523 | 3.8 | % | 9,191 | 3.7 | % | 15.49 | — | |||||||||||||||
2025 | 20 | 511,713 | 3.3 | % | 7,112 | 2.8 | % | 13.90 | 381 | |||||||||||||||
2026 | 16 | 512,101 | 3.3 | % | 4,972 | 2.0 | % | 9.71 | 750 | |||||||||||||||
2027 | 20 | 570,380 | 3.7 | % | 6,839 | 2.7 | % | 11.99 | — | |||||||||||||||
Beyond | 37 | 1,401,881 | 9.1 | % | 21,699 | 8.6 | % | 15.48 | 6,377 | |||||||||||||||
347 | 10,504,350 | 68.0 | % | $ | 130,347 | 51.8 | % | $ | 12.41 | $ | 11,135 | |||||||||||||
____________________ | |
1 | Retail anchor tenants are defined as tenants that occupy 10,000 square feet or more. |
2 | Lease expiration table reflects rents in place as of December 31, 2017 and does not include option periods. |
3 | Expiring GLA excludes square footage for non-owned ground lease structures on land we own and ground leased to tenants. |
4 | Annualized base rent represents the monthly contractual rent for December 2017 for each applicable tenant multiplied by 12. Excludes tenant reimbursements and ground lease revenue. |
p. 27 | Kite Realty Group Trust Supplemental Financial and Operating Statistics –12/31/17 |
LEASE EXPIRATIONS – RETAIL SHOPS | | |
As of December 31, 2017
($ in thousands, except per square foot data)
This table includes the following:
• | Operating retail properties; and |
• | Development/Redevelopment property tenants open for business as of December 31, 2017. |
Number of Expiring Leases1 | Expiring GLA/NRA2 | % of Total GLA/NRA Expiring | Expiring Annualized Base Rent3 | % of Total Annualized Base Rent | Expiring Annualized Base Rent per Sq. Ft. | Expiring Ground Lease Revenue | |||||||||||||||
2018 | 199 | 474,533 | 3.1% | $ | 12,260 | 4.9% | $ | 25.84 | $ | 68 | |||||||||||
2019 | 219 | 583,160 | 3.8% | 14,335 | 5.7% | 24.58 | 653 | ||||||||||||||
2020 | 214 | 526,488 | 3.4% | 12,667 | 5.0% | 24.06 | 481 | ||||||||||||||
2021 | 254 | 658,665 | 4.3% | 16,570 | 6.6% | 25.16 | 593 | ||||||||||||||
2022 | 256 | 667,764 | 4.3% | 17,302 | 6.9% | 25.91 | 495 | ||||||||||||||
2023 | 176 | 521,876 | 3.4% | 13,038 | 5.2% | 24.98 | 525 | ||||||||||||||
2024 | 77 | 234,999 | 1.5% | 6,197 | 2.5% | 26.37 | 288 | ||||||||||||||
2025 | 58 | 178,174 | 1.2% | 5,074 | 2.0% | 28.48 | 425 | ||||||||||||||
2026 | 64 | 255,030 | 1.7% | 6,320 | 2.5% | 24.78 | 570 | ||||||||||||||
2027 | 62 | 213,946 | 1.4% | 5,562 | 2.2% | 26.00 | 358 | ||||||||||||||
Beyond | 55 | 211,187 | 1.4% | 5,550 | 2.2% | 26.28 | 4,301 | ||||||||||||||
1,634 | 4,525,822 | 29.3% | $ | 114,874 | 45.6% | $ | 25.38 | $ | 8,757 | ||||||||||||
____________________ | |
1 | Lease expiration table reflects rents in place as of December 31, 2017, and does not include option periods; 2018 expirations include 15 month-to-month tenants. This column also excludes ground leases. |
2 | Expiring GLA excludes estimated square footage attributable to non-owned structures on land we own and ground leased to tenants. |
3 | Annualized base rent represents the monthly contractual rent for December 2017 for each applicable tenant multiplied by 12. Excludes tenant reimbursements and ground lease revenue. |
p. 28 | Kite Realty Group Trust Supplemental Financial and Operating Statistics –12/31/17 |
LEASE EXPIRATIONS – OFFICE TENANTS AND OTHER | | |
As of December 31, 2017
($ in thousands, except per square foot data)
Number of Expiring Leases1 | Expiring GLA/NRA2 | % of Total GLA/NRA Expiring | Expiring Annualized Base Rent3 | % of Total Annualized Base Rent | Expiring Annualized Base Rent per Sq. Ft. | ||||||||||||
2018 | 1 | 10,798 | 0.1% | $ | 246 | 0.1% | $ | 22.81 | |||||||||
2019 | 1 | 5,253 | —% | 101 | —% | 19.25 | |||||||||||
2020 | 2 | 13,311 | 0.1% | 256 | 0.1% | 19.25 | |||||||||||
2021 | 3 | 8,999 | 0.1% | 229 | 0.1% | 25.49 | |||||||||||
2022 | 5 | 65,020 | 0.4% | 1,263 | 0.5% | 19.43 | |||||||||||
2023 | 5 | 149,848 | 1.0% | 1,466 | 0.6% | 9.79 | |||||||||||
2024 | 3 | 74,226 | 0.5% | 1,201 | 0.5% | 16.19 | |||||||||||
2025 | 4 | 86,679 | 0.6% | 1,418 | 0.6% | 16.36 | |||||||||||
2026 | — | — | —% | — | —% | — | |||||||||||
2027 | 1 | 9,154 | 0.1% | 270 | 0.1% | 29.50 | |||||||||||
Beyond | — | — | —% | — | —% | — | |||||||||||
25 | 423,288 | 2.7% | $ | 6,452 | 2.6% | $ | 15.24 | ||||||||||
____________________ | |
1 | Lease expiration table reflects rents in place as of December 31, 2017 and does not include option periods. This column also excludes ground leases. |
2 | Lease expiration table reflects rents in place as of December 31, 2017 and does not include option periods. This column also excludes ground leases. |
3 | Annualized base rent represents the monthly contractual rent for December 2017 for each applicable tenant multiplied by 12. Excludes tenant reimbursements. |
p. 29 | Kite Realty Group Trust Supplemental Financial and Operating Statistics –12/31/17 |
DEVELOPMENT PROJECTS UNDER CONSTRUCTION | | |
As of December 31, 2017
($ in thousands)
Project | Company Ownership % | MSA | Projected Stabilization Date1 | Projected Owned GLA2 | Projected Total GLA3 | Percent of Owned GLA Occupied4 | Percent of Owned GLA Pre-Leased/ Committed | KRG Share of Total Estimated Project Cost | KRG Share of Cost Incurred as of December 31, 2017 | Major Tenants and Non-owned Anchors | |||||||||
Embassy Suites at the University of Notre Dame | 35% | South Bend | Q4 2018 | 152,460 | 152,460 | NA | NA | $ | 13,895 | $ | 3,840 | Embassy Suites full-service hotel | |||||||
Eddy Street Commons at Notre Dame, IN - Phase II 5 | 100% | South Bend | Q4 2020 | 8,500 | 530,000 | — | % | — | % | 8,447 | 1,247 | Ground lease with multi-family developer on 450 units; 8,500 square feet of owned retail. | |||||||
Total | 160,960 | 682,460 | — | % | — | % | $ | 22,342 | $ | 5,087 | |||||||||
Projected Annualized Development / Redevelopment Cash NOI Summary | |||
Remaining Under Construction Development / Redevelopment Cash NOI (excluding hotel) | $ | 5,322 | |
Remaining Transitional Development / Redevelopment Cash NOI | 2,162 | ||
Total Remaining Annual Cash NOI | $ | 7,484 | |
Summary of Construction In Progress on Consolidated Balance Sheet: | |||
Under Construction Development / Redevelopment CIP | $ | 13,423 | |
Transitional Development / Redevelopment CIP | 289 | ||
Lake Lofts at Deerwood - Jacksonville, FL | 11,714 | ||
Holly Springs Towne Center - Phase III | 5,791 | ||
Various tenant improvements and small projects | 13,923 | ||
Construction In Progress on Consolidated Balance Sheet | $ | 45,140 | |
____________________ | ||||||||||
1 | Stabilization date represents near completion of project construction and substantial occupancy of the property. | |||||||||
2 | Projected Owned GLA represents gross leasable area we project we will own. It excludes square footage that we project will be attributable to non-owned outlot structures on land owned by us and expected to be ground leased to tenants. It also excludes non-owned anchor space. | |||||||||
3 | Projected Total GLA includes Projected Owned GLA, projected square footage attributable to non-owned outlot structures on land that we own, and non-owned anchor space that currently exists or is under construction. | |||||||||
4 | Includes tenants that have taken possession of their space or have begun paying rent. | |||||||||
5 | Total estimated cost of all components of Eddy Street Phase II equals $89.2 million. This consists of KRG estimated project cost ($8.4 million), Tax Increment Financing ($16.1 million), and residential apartments and townhomes to be ground subleased to unrelated third party ($64.7 million). | |||||||||
6 | Total Estimated Project Cost of $13.9 million reflects Kite's pro-rata share of the gross project cost ($45.7 million) after deducting the TIF contribution ($6 million) | |||||||||
p. 30 | Kite Realty Group Trust Supplemental Financial and Operating Statistics –12/31/17 |
UNDER CONSTRUCTION REDEVELOPMENT, REPOSITION, AND REPURPOSE PROJECTS | |
($ in thousands) | ||||||
Property | Location (MSA) | Description | Projected ROI | Projected Cost | Percentage of Cost Spent | Est. Stabilized Period |
Beechwood Promenade* | Athens | Backfilling vacant anchor and shop space with Michaels, and construction of outlot for Starbucks. | 8.5% - 9.5% | $8,000 - $9,000 | 18% | 2H 2018 |
Burnt Store Marketplace* | Punta Gorda | Demolition and rebuild of a 45,000 square foot Publix under a new 20 year lease, as well as additional center upgrades. | 10.5% - 11.5% | $9,000 - $10,000 | 92% | 1H 2018 |
Centennial Center A | Las Vegas | Reposition of two retail buildings totaling 14,000 square feet, as well as Panera Bread outlot. Addition of traffic signal and other significant building/site enhancements. | 10.0% - 11.0% | $4,000 - $5,000 | 51% | 2H 2018 |
City Center* | New York City | Reactivating street-level retail components and enhancing overall shopping experience within multi-level project. | 6.5% - 7.0% | $17,000 - $17,500 | 88% | 1H 2018 |
Fishers Station* | Indianapolis | Demolition and expansion of previous anchor space and replacement with a Kroger ground lease. Center upgrades and new shop space. | 9.5% - 10.5% | $10,500 - $11,500 | 80% | 2H 2018 |
Portofino Shopping Center, Phase II | Houston | Demolition and expansion of vacant space to accommodate Nordstrom Rack; rightsizing of existing Old Navy, and relocation of shop tenants. | 8.0% - 8.5% | $6,500 - $7,000 | 69% | 1H 2018 |
Rampart Commons* | Las Vegas | Relocating, re-tenanting, and renegotiating leases as a part of new development plan. Upgrades to building façades and hardscape throughout the center. | 7.0% - 7.5% | $16,000 - $17,000 | 37% | 2H 2018 |
UNDER CONSTRUCTION REDEVELOPMENT, REPOSITION, REPURPOSE TOTALS | 8.0% - 9.0% | $71,000 - $77,000 | 64% | |||
COMPLETED PROJECTS DURING Q4 2017 | ||||
Property | Location (MSA) | Description | Annual Projected ROI | Cost |
Bolton Plaza, Phase II | Jacksonville | Replaced vacant shop space with Marshalls and a ground lease with Aldi, as well as additional center upgrades. | 10.5% | $5,217 |
Trussville Promenade 1 | Birmingham | Replaced vacant small shops with a 22,000 square foot Ross. | 9.5% | $3,695 |
COMPLETED PROJECTS TOTALS | 10.1% | $8,912 | ||
____________________ | |
1 | Refers to Trussville I |
* | Asterisk represents redevelopment assets removed from the operating portfolio. |
p. 31 | Kite Realty Group Trust Supplemental Financial and Operating Statistics –12/31/17 |
REDEVELOPMENT, REPOSITION, AND REPURPOSE OPPORTUNITIES | | |
($ in thousands) | |||
Property | Type of Project | Location (MSA) | Description |
Courthouse Shadows* | Redevelopment | Naples | Recapture of natural lease expiration; demolition of the site to add mixed use format and outparcel development. |
Hamilton Crossing Centre* | Redevelopment | Indianapolis | Recapture of lease expiration; substantially enhancing merchandising mix and replacing vacant anchor tenant. |
Centennial Center B | Reposition | Las Vegas | General building enhancements to five remaining outparcels. Addition of two restaurants to anchor the small shop building. |
The Corner* | Repurpose | Indianapolis | Creation of a mixed use (retail and multi-family) development to replace an unanchored small shop center. |
Total Targeted Return | 9.0% - 11.0% | ||
Total Expected Cost | $40,000 - $56,000 | ||
____________________ | |
1 | Reposition refers to less substantial asset enhancements based on internal costs. |
* | Asterisk represents redevelopment assets removed from the operating portfolio. |
Note: | These opportunities are merely potential at this time and are subject to various contingencies, many of which are beyond the Company's control. Targeted return is based upon our current expectations of capital expenditures, budgets, anticipated leases and certain other factors relating to such opportunities. The actual return on these investments may not meet our expectations. |
p. 32 | Kite Realty Group Trust Supplemental Financial and Operating Statistics –12/31/17 |
2017 PROPERTY DISPOSITIONS | | |
($ in thousands)
DISPOSITIONS
Property Name | MSA | Date Sold | Sales Price | |||
Cove Center | Stuart, FL | 3/31/2017 | ||||
Clay Marketplace | Birmingham, AL | 5/25/2017 | ||||
The Shops at Village Walk | Fort Myers, FL | 5/25/2017 | ||||
Wheatland Towne Crossing | Dallas, TX | 6/27/2017 | ||||
Total | $ | 77,742 | ||||
p. 33 | Kite Realty Group Trust Supplemental Financial and Operating Statistics –12/31/17 |
GEOGRAPHIC DIVERSIFICATION – ANNUALIZED BASE RENT BY REGION AND STATE | | |
As of December 31, 2017
($ in thousands)
Total Operating Portfolio Excluding Developments and Redevelopments | Developments and Redevelopments2 | Total Operating Portfolio Including Developments and Redevelopments | |||||||||||||||||||||||||||
Region/State | Owned GLA/NRA1 | Annualized Base Rent | Owned GLA/NRA1 | Annualized Base Rent | Number of Properties | Owned GLA/NRA1 | Annualized Base Rent - Ground Leases | Total Annualized Base Rent | Percent of Annualized Base Rent | ||||||||||||||||||||
Florida | |||||||||||||||||||||||||||||
Florida | 4,211,900 | $ | 61,602 | 220,597 | $ | 1,278 | 37 | 4,432,497 | $ | 3,885 | $ | 66,765 | 24.6% | ||||||||||||||||
Southeast | |||||||||||||||||||||||||||||
North Carolina | 1,175,864 | 21,847 | — | — | 9 | 1,175,864 | 3,745 | 25,592 | 9.4% | ||||||||||||||||||||
Georgia | 394,413 | 5,013 | 331,198 | 3,361 | 4 | 725,611 | 511 | 8,885 | 3.3% | ||||||||||||||||||||
Tennessee | 406,444 | 6,113 | — | — | 2 | 406,444 | — | 6,113 | 2.3% | ||||||||||||||||||||
South Carolina | 515,232 | 5,548 | — | — | 3 | 515,232 | — | 5,548 | 2.0% | ||||||||||||||||||||
Alabama | 463,836 | 4,267 | — | — | 1 | 463,836 | 151 | 4,418 | 1.6% | ||||||||||||||||||||
Total Southeast | 2,955,789 | 42,788 | 331,198 | 3,361 | 19 | 3,286,987 | 4,407 | 50,556 | 18.6% | ||||||||||||||||||||
Mid-Central | |||||||||||||||||||||||||||||
Texas | 1,981,230 | 31,331 | — | — | 10 | 1,981,230 | 1,082 | 32,413 | 11.9% | ||||||||||||||||||||
Oklahoma | 822,273 | 11,267 | — | — | 5 | 822,273 | 1,188 | 12,455 | 4.6% | ||||||||||||||||||||
Texas - Other | 107,400 | 591 | — | — | 1 | 107,400 | — | 591 | 0.2% | ||||||||||||||||||||
Total Mid-Central | 2,910,903 | 43,189 | — | — | 16 | 2,910,903 | 2,270 | 45,459 | 16.7% | ||||||||||||||||||||
Midwest | |||||||||||||||||||||||||||||
Indiana - Retail | 2,169,100 | 28,998 | 178,758 | 1,619 | 23 | 2,347,858 | 1,171 | 31,788 | 11.7% | ||||||||||||||||||||
Indiana - Other | 369,556 | 5,017 | 152,460 | — | 3 | 522,016 | — | 5,017 | 1.8% | ||||||||||||||||||||
Illinois | 310,879 | 4,219 | — | — | 3 | 310,879 | — | 4,219 | 1.6% | ||||||||||||||||||||
Ohio | 236,230 | 2,162 | — | — | 1 | 236,230 | — | 2,162 | 0.8% | ||||||||||||||||||||
Wisconsin | 82,238 | 1,170 | — | — | 1 | 82,238 | 381 | 1,551 | 0.6% | ||||||||||||||||||||
Total Midwest | 3,168,003 | 41,566 | 331,218 | 1,619 | 31 | 3,499,221 | 1,552 | 44,737 | 16.5% | ||||||||||||||||||||
West | |||||||||||||||||||||||||||||
Nevada | 844,942 | 18,829 | 79,455 | 1,462 | 7 | 924,397 | 3,963 | 24,254 | 8.9% | ||||||||||||||||||||
Utah | 392,050 | 6,916 | — | — | 2 | 392,050 | 68 | 6,984 | 2.6% | ||||||||||||||||||||
Arizona | 79,902 | 2,357 | — | — | 1 | 79,902 | — | 2,357 | 0.8% | ||||||||||||||||||||
Total West | 1,316,894 | 28,102 | 79,455 | 1,462 | 10 | 1,396,349 | 4,031 | 33,595 | 12.3% | ||||||||||||||||||||
Northeast | |||||||||||||||||||||||||||||
New York | — | — | 361,618 | 9,448 | 1 | 361,618 | — | 9,448 | 3.5% | ||||||||||||||||||||
New Jersey | 245,696 | 5,545 | — | — | 2 | 245,696 | 2,251 | 7,796 | 2.9% | ||||||||||||||||||||
Virginia | 397,835 | 7,302 | — | — | 1 | 397,835 | 294 | 7,596 | 2.8% | ||||||||||||||||||||
Connecticut | 205,683 | 3,250 | — | — | 1 | 205,683 | 1,034 | 4,284 | 1.6% | ||||||||||||||||||||
New Hampshire | 78,892 | 1,162 | — | — | 1 | 78,892 | 168 | 1,330 | 0.5% | ||||||||||||||||||||
Total Northeast | 928,106 | 17,259 | 361,618 | 9,448 | 6 | 1,289,724 | 3,747 | 30,454 | 11.3% | ||||||||||||||||||||
15,491,595 | $ | 234,506 | 1,324,086 | $ | 17,168 | 119 | 16,815,681 | $ | 19,892 | $ | 271,566 | 100.0% | |||||||||||||||||
____________________ | |||||||||||||
1 | Owned GLA/NRA represents gross leasable area or net leasable area owned by the Company. It also excludes the square footage of Union Station Parking Garage. | ||||||||||||
2 | Represents the eight redevelopment and two development projects not in the retail operating portfolio. | ||||||||||||
p. 34 | Kite Realty Group Trust Supplemental Financial and Operating Statistics –12/31/17 |
OPERATING RETAIL PORTFOLIO SUMMARY REPORT | | |
As of December 31, 2017
Property1 | Location (MSA) | Year Built/ Renovated | Owned GLA2 | Leased % | ABR per SqFt | Grocery Anchors4 | Other Retailers4 | |||||||||||||
Total | Anchors | Shops | Total | Anchors | Shops | |||||||||||||||
Alabama | ||||||||||||||||||||
Trussville Promenade | Birmingham | 1999 | 463,836 | 376,010 | 87,826 | 95.2 | % | 100.0 | % | 74.5 | % | $ | 9.67 | Wal-Mart, (Sam's Club) | Regal Cinemas, Marshalls, Big Lots, PetSmart, Dollar Tree, Ross Dress for Less, (Kohl's) | |||||
Arizona | ||||||||||||||||||||
The Corner | Tucson | 2008 | 79,902 | 55,883 | 24,019 | 100.0 | % | 100.0 | % | 100.0 | % | 29.50 | Total Wine & More | Nordstrom Rack, Panera Bread, (Home Depot) | ||||||
Connecticut | ||||||||||||||||||||
Killingly Commons3 | Killingly | 2010 | 205,683 | 148,250 | 57,433 | 96.9 | % | 100.0 | % | 89.0 | % | 16.30 | Stop & Shop Supermarket, (Target) | TJ Maxx, Bed Bath & Beyond, Michaels, Petco, Staples, Lowe's Home Improvement Center | ||||||
Florida | ||||||||||||||||||||
12th Street Plaza | Vero Beach | 1978/2003 | 135,016 | 121,376 | 13,640 | 100.0 | % | 100.0 | % | 100.0 | % | 10.05 | Publix | Stein Mart, Tuesday Morning | ||||||
Bayport Commons | Tampa | 2008 | 97,163 | 71,540 | 25,623 | 64.5 | % | 58.0 | % | 82.6 | % | 18.45 | (Target) | PetSmart, Michaels | ||||||
Bolton Plaza | Jacksonville | 1986/2014 | 154,555 | 136,195 | 18,360 | 100.0 | % | 100.0 | % | 100.0 | % | 9.76 | Aldi | LA Fitness, Academy Sports, Marshalls, Panera Bread | ||||||
Centre Point Commons | Bradenton | 2007 | 119,275 | 93,574 | 25,701 | 100.0 | % | 100.0 | % | 100.0 | % | 17.50 | Best Buy, Dick's Sporting Goods, Office Depot, Panera Bread, (Lowe's Home Improvement Center) | |||||||
Cobblestone Plaza | Ft. Lauderdale | 2011 | 133,220 | 68,169 | 65,051 | 84.9 | % | 70.4 | % | 100.0 | % | 30.78 | Whole Foods | Party City | ||||||
Colonial Square | Fort Myers | 2010 | 186,609 | 150,505 | 36,104 | 69.7 | % | 71.9 | % | 60.6 | % | 13.06 | Kohl's, Hobby Lobby, PetSmart, | |||||||
Delray Marketplace3 | Miami | 2013 | 260,181 | 118,136 | 142,045 | 99.3 | % | 100.0 | % | 98.6 | % | 26.35 | Publix | Frank Theatres, Burt & Max's, Carl's Patio, Ann Taylor Loft, Chicos, White House Black Market | ||||||
Estero Town Commons | Naples | 2006 | 25,696 | — | 25,696 | 80.4 | % | — | % | 80.4 | % | 14.72 | Lowe's Home Improvement Center, Dollar Tree | |||||||
Gainesville Plaza | Gainesville | 1970/2015 | 162,309 | 125,162 | 37,147 | 92.3 | % | 100.0 | % | 66.4 | % | 9.44 | Save a Lot | Ross Dress for Less, Burlington, 2nd and Charles | ||||||
Hunter's Creek Promenade | Orlando | 1994 | 119,729 | 55,999 | 63,730 | 100.0 | % | 100.0 | % | 100.0 | % | 14.67 | Publix | |||||||
Indian River Square | Vero Beach | 1997/2004 | 142,592 | 109,000 | 33,592 | 92.5 | % | 100.0 | % | 68.2 | % | 11.43 | (Target) | Beall's, Office Depot, Dollar Tree | ||||||
International Speedway Square | Daytona | 1999/2013 | 233,424 | 203,405 | 30,019 | 98.3 | % | 100.0 | % | 86.7 | % | 11.30 | Total Wine & More | Bed, Bath & Beyond, Stein Mart, Old Navy, Staples, Michaels, Dick’s Sporting Goods, Shoe Carnival | ||||||
Kings Lake Square | Naples | 1986/2014 | 88,588 | 45,600 | 42,988 | 95.5 | % | 100.0 | % | 90.8 | % | 18.50 | Publix | |||||||
Lake City Commons | Lake City | 2008 | 65,723 | 45,600 | 20,123 | 100.0 | % | 100.0 | % | 100.0 | % | 14.82 | Publix | |||||||
Lake City Commons - Phase II | Lake City | 2011 | 16,291 | 12,131 | 4,160 | 100.0 | % | 100.0 | % | 100.0 | % | 15.62 | Publix | PetSmart | ||||||
Lake Mary Plaza | Orlando | 2009 | 21,370 | 14,880 | 6,490 | 100.0 | % | 100.0 | % | 100.0 | % | 37.49 | Walgreens | |||||||
Lakewood Promenade | Jacksonville | 1948/1998 | 196,739 | 77,840 | 118,899 | 85.8 | % | 100.0 | % | 76.6 | % | 12.42 | Winn Dixie | SteinMart, Starbuck's, Salon Lofts | ||||||
Lithia Crossing | Tampa | 2003/2013 | 90,505 | 53,547 | 36,958 | 98.7 | % | 100.0 | % | 96.8 | % | 15.19 | The Fresh Market | Stein Mart, Chili's, Panera Bread | ||||||
Miramar Square | Ft. Lauderdale | 2008 | 224,737 | 137,505 | 87,232 | 86.6 | % | 85.5 | % | 93.6 | % | 16.07 | Kohl's, Miami Children's Hospital, Dollar General | |||||||
Northdale Promenade | Tampa | 1985/2017 | 173,862 | 118,269 | 55,593 | 99.4 | % | 100.0 | % | 98.1 | % | 12.84 | (Winn Dixie) | TJ Maxx, Ulta Beauty, Beall's, Crunch Fitness, Tuesday Morning | ||||||
Palm Coast Landing at Town Square | Palm Coast | 2010 | 168,352 | 100,822 | 67,530 | 98.6 | % | 100.0 | % | 96.6 | % | 18.91 | (Target) | Michaels, PetSmart, Ross Dress for Less, TJ Maxx, Ulta Beauty | ||||||
Pine Ridge Crossing | Naples | 1993 | 105,962 | 66,435 | 39,527 | 100.0 | % | 100.0 | % | 100.0 | % | 17.92 | Publix, (Target) | Ulta Beauty, (Beall's) | ||||||
Pleasant Hill Commons | Orlando | 2008 | 70,643 | 45,600 | 25,043 | 98.3 | % | 100.0 | % | 95.2 | % | 15.15 | Publix | |||||||
Riverchase Plaza | Naples | 1991/2001 | 78,291 | 48,890 | 29,401 | 100.0 | % | 100.0 | % | 100.0 | % | 16.31 | Publix | |||||||
See footnotes on page 39
p. 35 | Kite Realty Group Trust Supplemental Financial and Operating Statistics –12/31/17 |
OPERATING RETAIL PORTFOLIO SUMMARY REPORT (CONTINUED) | | |
As of December 31, 2017
Property1 | Location (MSA) | Year Built/ Renovated | Owned GLA2 | Leased % | ABR per Sq. ft. | Grocery Anchors4 | Other Retailers4 | |||||||||||||
Total | Anchors | Shops | Total | Anchors | Shops | |||||||||||||||
Saxon Crossing | Orange City | 2009 | 119,907 | 95,304 | 24,603 | 94.2 | % | 100.0 | % | 71.9 | % | $ | 15.00 | (Target) | Hobby Lobby, LA Fitness, (Lowe's Home Improvement Center) | |||||
Shoppes of Eastwood | Orlando | 1997 | 69,076 | 51,512 | 17,564 | 98.1 | % | 100.0 | % | 92.5 | % | 13.53 | Publix | |||||||
Shops at Eagle Creek | Naples | 1983/2013 | 70,768 | 50,187 | 20,581 | 98.4 | % | 100.0 | % | 94.3 | % | 15.81 | The Fresh Market | Staples, (Lowe's Home Improvement Center), Panera Bread | ||||||
Tamiami Crossing | Naples | 2016 | 121,705 | 121,705 | — | 100.0 | % | 100.0 | % | — | % | 12.51 | Aldi, (Wal-Mart) | Marshalls, Michaels, PetSmart, Ross Dress for Less, Stein Mart, Ulta Beauty | ||||||
Tarpon Bay Plaza | Naples | 2007 | 82,528 | 60,139 | 22,389 | 96.6 | % | 100.0 | % | 87.5 | % | 17.80 | (Target) | PetSmart, Cost Plus World Market, Staples, Panera Bread | ||||||
Temple Terrace | Temple Terrace | 2012 | 90,328 | 58,798 | 31,530 | 92.9 | % | 100.0 | % | 79.6 | % | 10.55 | Winn Dixie | Burger King | ||||||
The Landing at Tradition | Port St. Lucie | 2007 | 360,276 | 290,396 | 69,880 | 83.8 | % | 86.1 | % | 74.2 | % | 16.00 | (Target) | TJ Maxx, Ulta Salon, Bed Bath & Beyond, LA Fitness, Michaels, Old Navy, PetSmart, Pier 1, DSW, Five Below | ||||||
The Shops at Julington Creek | Jacksonville | 2011 | 40,219 | 21,038 | 19,181 | 96.5 | % | 100.0 | % | 92.6 | % | 19.43 | The Fresh Market | |||||||
Tradition Village Center | Port St. Lucie | 2006 | 84,084 | 45,600 | 38,484 | 95.5 | % | 100.0 | % | 90.2 | % | 17.08 | Publix | |||||||
Waterford Lakes Village | Orlando | 1997 | 77,971 | 51,703 | 26,268 | 98.4 | % | 100.0 | % | 95.2 | % | 13.13 | Winn Dixie | |||||||
Georgia | ||||||||||||||||||||
Mullins Crossing | Evans | 2005 | 251,712 | 205,716 | 45,996 | 100.0 | % | 100.0 | % | 100.0 | % | 12.73 | (Target) | Ross Dress for Less, Babies "R" Us, Kohls, La-Z Boy, Marshalls, Office Max, Petco, Ulta Beauty, Panera Bread | ||||||
Publix at Acworth | Atlanta | 1996 | 69,640 | 37,888 | 31,752 | 98.3 | % | 100.0 | % | 96.2 | % | 12.52 | Publix | |||||||
The Centre at Panola | Atlanta | 2001 | 73,061 | 51,674 | 21,387 | 100.0 | % | 100.0 | % | 100.0 | % | 13.04 | Publix | |||||||
Illinois | ||||||||||||||||||||
Fox Lake Crossing | Chicago | 2002 | 99,136 | 65,977 | 33,159 | 90.7 | % | 100.0 | % | 72.2 | % | 13.34 | Dominick's Finer Foods | Dollar Tree | ||||||
Naperville Marketplace | Chicago | 2008 | 83,743 | 61,683 | 22,060 | 100.0 | % | 100.0 | % | 100.0 | % | 13.83 | (Caputo's Fresh Market) | TJ Maxx, PetSmart, | ||||||
South Elgin Commons | Chicago | 2011 | 128,000 | 128,000 | — | 100.0 | % | 100.0 | % | — | % | 14.55 | (Target) | LA Fitness, Ross Dress for Less, Toys "R" Us/Babies "R" Us | ||||||
Indiana | ||||||||||||||||||||
54th & College | Indianapolis | 2008 | — | — | — | — | % | — | % | — | % | 0.00 | The Fresh Market | |||||||
Beacon Hill | Crown Point | 2006 | 56,820 | 11,043 | 45,777 | 98.0 | % | 100.0 | % | 97.5 | % | 16.09 | (Strack & Van Till) | (Walgreens), Jimmy John's, Rosati's, Great Clips | ||||||
Bell Oaks Centre | Newburgh | 2008 | 94,958 | 74,122 | 20,836 | 100.0 | % | 100.0 | % | 100.0 | % | 12.17 | Schnuck's Market | |||||||
Boulevard Crossing | Kokomo | 2004 | 124,634 | 74,440 | 50,194 | 94.7 | % | 100.0 | % | 86.7 | % | 14.83 | Petco, TJ Maxx, Ulta Beauty, Shoe Carnival, (Kohl's) | |||||||
Bridgewater Marketplace | Indianapolis | 2008 | 25,975 | — | 25,975 | 86.8 | % | — | % | 86.8 | % | 20.58 | (Walgreens), The Local Eatery, Original Pancake House | |||||||
Castleton Crossing | Indianapolis | 1975/2012 | 286,377 | 247,710 | 38,667 | 100.0 | % | 100.0 | % | 100.0 | % | 11.86 | TJ Maxx/Home Goods, Burlington, Shoe Carnival, Value City Furniture, K&G Menswear, Chipotle, Verizon, Five Below | |||||||
Cool Creek Commons | Indianapolis | 2005 | 124,272 | 53,600 | 70,672 | 93.8 | % | 100.0 | % | 89.2 | % | 18.30 | The Fresh Market | Stein Mart, McAlister's Deli, Beauty Brands, Buffalo Wild Wings, Pet People | ||||||
Depauw University Bookstore and Café | Greencastle | 2012 | 11,974 | — | 11,974 | 100.0 | % | — | % | 100.0 | % | 9.17 | Folletts, Starbucks | |||||||
Eddy Street Commons at Notre Dame | South Bend | 2009 | 87,991 | 20,154 | 67,837 | 96.0 | % | 100.0 | % | 94.8 | % | 25.59 | Hammes Bookstore & Cafe, Chipotle, Urban Outfitters, Five Guy's, Kilwin's, Blaze Pizza | |||||||
Geist Pavilion | Indianapolis | 2006 | 63,910 | 29,700 | 34,210 | 100.0 | % | 100.0 | % | 100.0 | % | 16.98 | Ace Hardware, Goodwill, Ale Emporium, Pure Barre | |||||||
Glendale Town Center | Indianapolis | 1958/2008 | 393,002 | 329,546 | 63,456 | 97.8 | % | 100.0 | % | 86.6 | % | 7.33 | (Target) | Macy’s, Staples, Landmark Theaters, Pei Wei, LensCrafter's, Panera Bread, (Walgreens), (Lowe's Home Improvement Center) | ||||||
Greyhound Commons | Indianapolis | 2005 | 9,152 | — | 9,152 | 100.0 | % | — | % | 100.0 | % | 13.60 | ||||||||
See footnotes on page 39
p. 36 | Kite Realty Group Trust Supplemental Financial and Operating Statistics –12/31/17 |
OPERATING RETAIL PORTFOLIO SUMMARY REPORT (CONTINUED) | | |
As of December 31, 2017
Property1 | Location (MSA) | Year Built/ Renovated | Owned GLA2 | Leased % | ABR per Sqft | Grocery Anchors4 | Other Retailers4 | |||||||||||||
Total | Anchors | Shops | Total | Anchors | Shops | |||||||||||||||
Lima Marketplace | Fort Wayne | 2008 | 100,461 | 71,521 | 28,940 | 94.8 | % | 100.0 | % | 81.8 | % | $ | 14.81 | Aldi, (Wal-Mart) | PetSmart, Office Depot, Aldi, Dollar Tree | |||||
Rangeline Crossing | Indianapolis | 1986/2013 | 100,196 | 47,962 | 52,234 | 99.0 | % | 100.0 | % | 98.2 | % | 22.21 | Earth Fare | Walgreens, Panera Bread, Pet Valu, City BBQ | ||||||
Rivers Edge | Indianapolis | 2011 | 150,428 | 117,890 | 32,538 | 100.0 | % | 100.0 | % | 100.0 | % | 21.92 | Nordstrom Rack, The Container Store, Arhaus Furniture, Bicycle Garage of Indy, Buy Buy Baby, J Crew Mercantile | |||||||
Stoney Creek Commons | Indianapolis | 2000/2013 | 84,330 | 84,330 | — | 64.1 | % | 64.1 | % | — | % | 13.44 | LA Fitness, Goodwill, (Lowe's Home Improvement Center) | |||||||
Traders Point I | Indianapolis | 2005 | 279,646 | 238,721 | 40,925 | 74.7 | % | 71.6 | % | 93.0 | % | 14.99 | Dick's Sporting Goods, AMC Theatre, Bed, Bath & Beyond, Michaels, Old Navy, PetSmart, Books-A-Million | |||||||
Traders Point II | Indianapolis | 2005 | 45,977 | — | 45,977 | 92.2 | % | — | % | 92.2 | % | 26.42 | ||||||||
Whitehall Pike | Bloomington | 1999 | 128,997 | 128,997 | — | 100.0 | % | 100.0 | % | — | % | 7.86 | Lowe's Home Improvement Center | |||||||
Nevada | ||||||||||||||||||||
Cannery Corner3 | Las Vegas | 2008 | 30,738 | — | 30,738 | 94.4 | % | — | % | 94.4 | % | 36.19 | (Sam's Club) | Chipotle, Five Guys, (Lowe's Home Improvement Center) | ||||||
Centennial Center3 | Las Vegas | 2002 | 334,377 | 158,196 | 176,181 | 88.6 | % | 85.3 | % | 91.6 | % | 24.53 | Sam's Club, Wal-Mart | Ross Dress for Less, Big Lots, Famous Footwear, Michaels, Party City, Petco, Rhapsodielle, Home Depot | ||||||
Centennial Gateway3 | Las Vegas | 2005 | 193,085 | 139,913 | 53,172 | 91.8 | % | 92.1 | % | 91.2 | % | 24.19 | Trader Joe's | 24 Hour Fitness, Sportsman's Warehouse, Walgreens | ||||||
Eastern Beltway Center3 | Las Vegas | 1998/2006 | 159,938 | 83,982 | 74,956 | 98.1 | % | 100.0 | % | 96.0 | % | 24.46 | Sam's Club, Wal-Mart | Office Max, Petco, Ross Dress for Less, Skechers, (Home Depot) | ||||||
Eastgate Plaza3 | Las Vegas | 2002 | 96,594 | 53,030 | 43,564 | 79.9 | % | 76.4 | % | 84.1 | % | 23.45 | (Wal-Mart) | 99 Cent Only Store, Party City | ||||||
Lowe's Plaza3 | Las Vegas | 2007 | 30,210 | — | 30,210 | 67.6 | % | — | % | 67.6 | % | 27.89 | Anytime Fitness, Starbucks, (Lowe's Home Improvement Center) | |||||||
New Hampshire | ||||||||||||||||||||
Merrimack Village Center | Merrimack | 2007 | 78,892 | 54,000 | 24,892 | 100.0 | % | 100.0 | % | 100.0 | % | 14.72 | Supervalue/Shaw's | |||||||
New Jersey | ||||||||||||||||||||
Bayonne Crossing | Bayonne | 2011 | 106,137 | 52,219 | 53,918 | 97.0 | % | 100.0 | % | 94.1 | % | 28.28 | Wal-Mart | Michaels, New York Sports Club, Lowe's Home Improvement Center | ||||||
Livingston Shopping Center | Newark | 1997 | 139,559 | 133,125 | 6,434 | 95.4 | % | 100.0 | % | — | % | 19.77 | Cost Plus, Buy Buy Baby, Nordstrom Rack, DSW, TJ Maxx, Ulta Beauty | |||||||
North Carolina | ||||||||||||||||||||
Holly Springs Towne Center - Phase I | Raleigh | 2013 | 207,566 | 109,233 | 98,333 | 92.2 | % | 100.0 | % | 83.4 | % | 16.87 | (Target) | Dick's Sporting Goods, Marshalls, Petco, Ulta Beauty, Michaels | ||||||
Holly Springs Towne Center - Phase II | Raleigh | 2016 | 145,009 | 111,843 | 33,166 | 100.0 | % | 100.0 | % | 100.0 | % | 17.98 | (Target) | Bed Bath & Beyond, DSW, AMC Theatre/Carmike, 02 Fitness | ||||||
Memorial Commons | Goldsboro | 2008 | 111,022 | 73,876 | 37,146 | 100.0 | % | 100.0 | % | 100.0 | % | 13.26 | Harris Teeter/Kroger | Office Depot | ||||||
Northcrest Shopping Center | Charlotte | 2008 | 133,674 | 65,576 | 68,098 | 95.1 | % | 100.0 | % | 90.5 | % | 22.65 | (Target) | REI Co-Op, David's Bridal, Dollar Tree, Old Navy, Five Below | ||||||
Oleander Place | Wilmington | 2012 | 45,530 | 30,144 | 15,386 | 100.0 | % | 100.0 | % | 100.0 | % | 17.03 | Whole Foods | |||||||
Parkside Town Commons - Phase I | Raleigh | 2015 | 55,390 | 22,500 | 32,890 | 100.0 | % | 100.0 | % | 100.0 | % | 24.35 | Harris Teeter/Kroger, (Target) | Petco, Guitar Center | ||||||
Parkside Town Commons - Phase II | Raleigh | 2017 | 291,713 | 191,988 | 99,725 | 97.5 | % | 100.0 | % | 92.5 | % | 19.66 | (Target) | Frank Theatres, Golf Galaxy, Hobby Lobby, Stein Mart, Chuy's, Starbucks, Panera Bread, Levity Live | ||||||
Perimeter Woods | Charlotte | 2008 | 125,646 | 105,262 | 20,384 | 100.0 | % | 100.0 | % | 100.0 | % | 21.10 | Best Buy, Off Broadway Shoes, Office Max, PetSmart, Lowe's Home Improvement Center | |||||||
Toringdon Market | Charlotte | 2004 | 60,314 | 26,072 | 34,242 | 100.0 | % | 100.0 | % | 100.0 | % | 21.49 | Earth Fare | |||||||
See footnotes on page 39
p. 37 | Kite Realty Group Trust Supplemental Financial and Operating Statistics –12/31/17 |
OPERATING RETAIL PORTFOLIO SUMMARY REPORT (CONTINUED) | | |
As of December 31, 2017
Property1 | Location (MSA) | Year Built/ Renovated | Owned GLA2 | Leased % | Other Retailers4 | |||||||||||||||
Total | Anchors | Shops | Total | Anchors | Shops | ABR per Sqft | Grocery Anchor4 | |||||||||||||
Ohio | ||||||||||||||||||||
Eastgate Pavilion | Cincinnati | 1995 | 236,230 | 231,730 | 4,500 | 100.0 | % | 100.0 | % | 100.0 | % | $ | 9.15 | Best Buy, Dick's Sporting Goods, Value City Furniture, Petsmart, DSW, Bed Bath & Beyond | ||||||
Oklahoma | ||||||||||||||||||||
Belle Isle Station | Oklahoma City | 2000 | 164,407 | 92,783 | 71,624 | 98.5 | % | 100.0 | % | 96.5 | % | 17.35 | (Wal-Mart) | Shoe Carnival, Old Navy, Ross Stores, Nordstrom Rack, Babies "R" Us, Ulta Beauty | ||||||
Shops at Moore | Moore | 2010 | 260,530 | 187,916 | 72,614 | 94.7 | % | 100.0 | % | 80.9 | % | 12.16 | Bed Bath and Beyond, Best Buy, Hobby Lobby, Office Depot, PetSmart, Ross Dress for Less, (JC Penny) | |||||||
Silver Springs Pointe | Oklahoma City | 2001 | 48,474 | 20,515 | 27,959 | 79.1 | % | 100.0 | % | 63.7 | % | 15.88 | (Sam's Club), (Wal-Mart) | Kohls, Office Depot, (Home Depot) | ||||||
University Town Center | Norman | 2009 | 158,375 | 77,097 | 81,278 | 91.3 | % | 100.0 | % | 83.0 | % | 18.00 | (Target) | Office Depot, Petco, TJ Maxx, Ulta Beauty | ||||||
University Town Center Phase II | Norman | 2012 | 190,487 | 133,546 | 56,941 | 93.0 | % | 100.0 | % | 76.7 | % | 12.68 | (Target) | Academy Sports, DSW, Home Goods, Michaels, Kohls, Guitar Center | ||||||
South Carolina | ||||||||||||||||||||
Hitchcock Plaza | Augusta-Aiken | 2006 | 252,370 | 214,480 | 37,890 | 88.8 | % | 89.7 | % | 84.2 | % | 10.38 | TJ Maxx, Ross Dress for Less, Academy Sports, Bed Bath and Beyond, Farmers Home Furniture, Old Navy, Petco | |||||||
Publix at Woodruff | Greenville | 1997 | 68,055 | 47,955 | 20,100 | 100.0 | % | 100.0 | % | 100.0 | % | 11.17 | Publix | |||||||
Shoppes at Plaza Green | Greenville | 2000 | 194,807 | 172,136 | 22,671 | 94.7 | % | 94.1 | % | 100.0 | % | 13.33 | Bed Bath & Beyond, Christmas Tree Shops, Sears, Party City, Shoe Carnival, AC Moore, Old Navy | |||||||
Tennessee | ||||||||||||||||||||
Cool Springs Market | Nashville | 1995 | 230,980 | 172,712 | 58,268 | 99.5 | % | 100.0 | % | 97.9 | % | 15.78 | (Kroger) | Dick's Sporting Goods, Marshalls, Buy Buy Baby, DSW, Staples, Jo-Ann Fabric, Panera Bread | ||||||
Hamilton Crossing - Phase II & III | Alcoa | 2008 | 175,464 | 135,737 | 39,727 | 94.8 | % | 100.0 | % | 77.2 | % | 14.95 | Dicks Sporting Goods, Michaels, Old Navy, PetSmart, Ross Dress for Less | |||||||
Texas4 | ||||||||||||||||||||
Chapel Hill Shopping Center | Fort Worth | 2001 | 126,989 | 43,450 | 83,539 | 94.6 | % | 100.0 | % | 91.7 | % | 25.23 | H-E-B Grocery | The Container Store, Cost Plus World Market | ||||||
Colleyville Downs | Dallas | 2014 | 190,895 | 142,073 | 48,822 | 97.8 | % | 100.0 | % | 91.3 | % | 12.99 | Whole Foods | Westlake Hardware, Vineyard's Antique Mall, Goody Goody Liquor, Petco | ||||||
Kingwood Commons | Houston | 1999 | 164,366 | 74,836 | 89,530 | 100.0 | % | 100.0 | % | 100.0 | % | 19.99 | Randall's Food and Drug | Petco, Chico's, Talbots, Ann Taylor | ||||||
Market Street Village/ Pipeline Point | Fort Worth | 1970/2011 | 156,621 | 136,742 | 19,879 | 100.0 | % | 100.0 | % | 100.0 | % | 13.06 | Jo-Ann Fabric, Ross, Office Depot, Buy Buy Baby, Party City | |||||||
Plaza at Cedar Hill | Dallas | 2000/2010 | 302,458 | 244,065 | 58,393 | 100.0 | % | 100.0 | % | 100.0 | % | 13.34 | Sprouts Farmers Market | DSW, Ross Dress for Less, Hobby Lobby, Office Max, Marshalls, Toys “R” Us/Babies “R” Us, Home Goods | ||||||
Plaza Volente | Austin | 2004 | 156,296 | 105,000 | 51,296 | 97.2 | % | 100.0 | % | 91.4 | % | 17.41 | H-E-B Grocery | |||||||
Portofino Shopping Center | Houston | 1999/2010 | 386,647 | 218,909 | 167,738 | 95.5 | % | 100.0 | % | 89.7 | % | 19.73 | (Sam's Club) | DSW, Michaels, PGA Superstore, SteinMart, PetSmart, Old Navy, TJ Maxx, Nordstrom Rack | ||||||
Sunland Towne Centre | El Paso | 1996/2014 | 306,454 | 265,037 | 41,417 | 98.9 | % | 100.0 | % | 91.7 | % | 12.02 | Sprouts Farmers Market | PetSmart, Ross, Bed Bath & Beyond, Specs Fine Wines | ||||||
See footnotes on page 39
p. 38 | Kite Realty Group Trust Supplemental Financial and Operating Statistics –12/31/17 |
OPERATING RETAIL PORTFOLIO SUMMARY REPORT (CONTINUED) | | |
As of December 31, 2017
Property1 | Location (MSA) | Year Built/ Renovated | Owned GLA2 | Leased % | ABR per Sqft | Grocery Anchors | Other Retailers | |||||||||||||
Total | Anchors | Shops | Total | Anchors | Shops | |||||||||||||||
Waxahachie Crossing | Waxahachie | 2010 | 97,127 | 72,191 | 24,936 | 100.0 | % | 100.0 | % | 100.0 | % | $ | 14.76 | Best Buy, PetSmart, Ross Dress for Less, (Home Depot), (JC Penny) | ||||||
Westside Market | Dallas | 2013 | 93,377 | 70,000 | 23,377 | 100.0 | % | 100.0 | % | 100.0 | % | 16.13 | Randall's Tom Thumb | |||||||
Utah | ||||||||||||||||||||
Draper Crossing | Salt Lake City | 2012 | 164,080 | 115,916 | 48,164 | 95.0 | % | 100.0 | % | 82.8 | % | 15.63 | Kroger/Smith's | TJ Maxx, Dollar Tree, Downeast Home | ||||||
Draper Peaks | Salt Lake City | 2012 | 227,970 | 101,464 | 126,506 | 97.6 | % | 100.0 | % | 95.6 | % | 20.14 | Michaels, Office Depot, Petco, Quilted Bear, Ross Dress for Less, (Kohl's) | |||||||
Virginia | ||||||||||||||||||||
Landstown Commons | Virginia Beach | 2007 | 397,835 | 207,300 | 190,535 | 95.1 | % | 100.0 | % | 89.7 | % | 19.31 | Ross Dress for Less, Bed Bath & Beyond, Best Buy, PetSmart, Ulta Beauty, Walgreens, AC Moore, Kirkland's, Five Below, Office Max, (Kohl's) | |||||||
Wisconsin | ||||||||||||||||||||
Village at Bay Park | Ashwaubenon | 2005 | 82,238 | 23,878 | 58,360 | 88.5 | % | 100.0 | % | 83.7 | % | 16.08 | DSW, JC Penney, Kirkland's, Chico's, Dress Barn | |||||||
Total | 14,990,433 | 10,245,806 | 4,743,627 | 94.8 | % | 96.7 | % | 90.5 | % | $ | 16.07 | |||||||||
Total Including 3-R Properties not in the Operating Portfolio - see pages 30-32 | $ | 16.32 | ||||||||||||||||||
____________________ | |
1 | All properties are wholly owned, except as indicated. Unless otherwise noted, each property is owned in fee simple by the Company. |
2 | Percentage of Owned GLA Leased reflects Owned GLA/NRA leased as of December 31, 2017, except for Greyhound Commons and 54th & College. |
3 | See Joint Venture Summary on page 18. |
4 | Tenants within parentheses are non-owned. |
p. 39 | Kite Realty Group Trust Supplemental Financial and Operating Statistics –12/31/17 |
OPERATING OFFICE PROPERTIES AND OTHER | | |
As of December 31, 2017
($ in thousands, except per square foot data)
Property | MSA | Year Built/ Renovated | Acquired, Redeveloped or Developed | Owned NRA | Percentage Of Owned NRA Leased | Annualized Base Rent1 | Percentage of Annualized Office and Other Base Rent | Base Rent Per Leased Sq. Ft. | Major Tenants | ||||||||
Office Properties | |||||||||||||||||
Thirty South Meridian2 | Indianapolis | 1905/2002 | Redeveloped | 287,928 | 70.7 | % | $ | 3,762 | 60.7 | % | $ | 18.47 | Stifel, Kite Realty Group, Lumina Foundation | ||||
Union Station Parking Garage3 | Indianapolis | 1986 | Acquired | N/A | N/A | N/A | N/A | N/A | Denison Parking | ||||||||
Stand-alone Office Components of Retail Properties | |||||||||||||||||
Eddy Street Office (part of Eddy Street Commons)4 | South Bend | 2009 | Developed | 81,628 | 100.0 | % | 1,256 | 20.2 | % | 15.38 | University of Notre Dame Offices | ||||||
Tradition Village Office (part of Tradition Village Square) | Port St. Lucie | 2006 | Acquired | 24,206 | 87.4 | % | 594 | 9.6 | % | 28.05 | |||||||
Total Office Properties | 393,762 | 77.8 | % | $ | 5,611 | 90.5 | % | $ | 18.31 | ||||||||
Lessee of Land on Short Term Renewal | |||||||||||||||||
Burlington | San Antonio | 1992/2000 | Acquired | 107,400 | 100.0 | % | $ | 591 | 9.5 | % | $ | 5.50 | Burlington | ||||
107,400 | 100.0 | % | $ | 591 | 7.7 | % | $ | 5.50 | |||||||||
Total Office and Other | 501,162 | 82.6 | % | $ | 6,202 | 100.0 | % | $ | 14.99 | ||||||||
Multi-Family | |||||||||||||||||
Lake Lofts at Deerwood5 | Jacksonville | 2017 | Developed | — | — | — | — | 130 Apartment Units | |||||||||
____________________ | |
1 | Annualized Base Rent represents the monthly contractual rent for December 2017 for each applicable property, multiplied by 12. |
2 | Annualized Base Rent includes $793,117 from the Company and subsidiaries as of December 31, 2017, which is eliminated for purposes of our consolidated financial statement presentation. |
3 | The garage is managed by a third party. |
4 | The Company also owns the Eddy Street Commons retail shopping center in South Bend, Indiana, along with a parking garage that serves a hotel and the office and retail components of the property. |
5 | Lake Lofts at Deerwood has 82 leases executed as of December 31, 2017. |
p. 40 | Kite Realty Group Trust Supplemental Financial and Operating Statistics –12/31/17 |
COMPONENTS OF NET ASSET VALUE | | |
As of December 31, 2017
($ in thousands)
Cash Net Operating Income (NOI) | Supplemental Page No.: | Other Assets | Supplemental Page No.: | |||||||
GAAP property NOI (incl. Ground Lease Revenue) | $ | 65,053 | 17 | Cash and cash equivalents | $ | 24,082 | 11 | |||
Below-market lease intangibles, net | (1,162 | ) | 14 | Tenant and other receivables (net of SLR) | 26,581 | 11 | ||||
Straight-line rent | (1,103 | ) | 14 | Restricted cash and escrow deposits | 8,094 | 11 | ||||
Other property related revenue | (358 | ) | 17 | Prepaid and other assets1, 7 | 9,821 | 11 | ||||
Ground lease ("GL") revenue | (4,973 | ) | 17, footnote 1 | Undeveloped land in operating portfolio | 21,000 | 14, footnote 4 | ||||
Consolidated Cash Property NOI (excl. GL) | $ | 57,457 | Land held for development | 31,142 | 14 | |||||
Annualized Consolidated Cash Property NOI (excl. ground leases) | $ | 229,828 | CIP not in under construction development/redevelopment2 | 31,428 | 30 | |||||
Total Other Asset Value | $ | 152,148 | ||||||||
Adjustments To Normalize Annualized Cash NOI | Liabilities | |||||||||
Total projected remaining development / transitional redevelopment cash NOI 3, 7 | 7,484 | 30 | Mortgage and other indebtedness | $ | (1,699,239 | ) | 11 | |||
Unconsolidated EBITDA | 136 | 15 | Accounts payable and accrued expenses | (78,482 | ) | 11 | ||||
Pro forma adjustments4 | — | Other liabilities5 | (13,447 | ) | 11, 14 | |||||
General and administrative expense allocable to property management activities included in property expenses ($1,300 in Q4) | 5,200 | 17, footnote 4 | Debt premium and issuance costs, net | (1,411 | ) | 15 | ||||
Total Adjustments | 12,820 | Non-controlling redeemable joint venture interest | (32,531 | ) | 18 | |||||
Projected remaining under construction development/redevelopment6, 7 | (35,940 | ) | 30, 31 | |||||||
Annualized Normalized Portfolio Cash NOI (excl. Ground Leases) | $ | 242,648 | Total Liabilities | $ | (1,861,050 | ) | ||||
Annualized Ground Lease NOI | 19,892 | |||||||||
Total Annualized Portfolio Cash NOI | $ | 262,540 | Common shares and units outstanding | 85,580,898 | 15 | |||||
____________________ | |
1 | Excludes the Company's $2.5 million investment in an unconsolidated joint venture. |
2 | Includes CIP amounts for Lake Lofts at Deerwood, Holly Springs Town Center - Phase III, and miscellaneous tenant improvements and small projects. |
3 | Excludes the projected cash NOI and related cost from the 3-R opportunities outlined on page 32. |
4 | Current quarter cash NOI, annualized, for properties sold during the quarter. |
5 | Deferred revenue and other liabilities of $97 million less mark-to-market lease liability of $83 million. |
6 | Assumes mid-point of projected cost range ($74.0 million) for 3-R projects under construction and remaining cost on page 30 for development projects. |
7 | Excludes NOI, our share of CIP ($4.0 million) included in prepaid and other assets, and costs to complete for Embassy Suites at the University of Notre Dame. |
p. 41 | Kite Realty Group Trust Supplemental Financial and Operating Statistics –12/31/17 |
EARNINGS GUIDANCE - 2018 | | |
2018 Guidance1 | |
FFO per diluted share, as defined by NAREIT | $1.98 - $2.04 |
Key Assumptions | |
Disposition of operating properties in the first quarter | ± $60 million |
Same property NOI growth2 | 1.0% - 1.5% |
Percent leased at year-end - Retail Portfolio | 94.5% - 95.5% |
General and administrative expenses | $21.5 million - $22.5 million |
GAAP interest expense | $66 million - $67 million |
Fee income | $2.0 million - $2.5 million |
Gain on sale of non-depreciable assets included in other property related revenue | $2 million - $3 million |
Non-cash items 3 | $9.0 million - $9.5 million |
____________________ | |
1 | The Company’s 2018 guidance is based on a number of factors, many of which are outside the Company’s control and all of which are subject to change. The Company may change its guidance during the year if actual or anticipated results vary from these assumptions, although the Company undertakes no obligation to do so. |
2 | As defined on same property net operating income table on page 16 and includes bad debt expense. |
3 | Includes below market lease amortization and straight line rent. |
p. 42 | Kite Realty Group Trust Supplemental Financial and Operating Statistics –12/31/17 |