Attached files
| file | filename |
|---|---|
| EX-99.1 - EXHIBIT 99.1 - HOME BANCORP, INC. | tv484353_ex99-1.htm |
| 8-K - FORM 8-K - HOME BANCORP, INC. | tv484353_8k.htm |
Exhibit 99.2

FIG Partners CEO Forum January 31 and February 1, 2018

FORWARD - LOOKING STATEMENTS Certain comments in this presentation contain certain forward looking statements (as defined in the Securities Exchange Act of 1934 and the regulations thereunder) . Forward looking statements are not historical facts but instead represent only the beliefs, expectations or opinions of Home Bancorp, Inc . and its management regarding future events, many of which, by their nature, are inherently uncertain . Forward looking statements may be identified by the use of such words as : “believe”, “expect”, “anticipate”, “intend”, “plan”, “estimate”, or words of similar meaning, or future or conditional terms such as “will”, “would”, “should”, “could”, “may”, “likely”, “probably”, or “possibly . ” Forward looking statements include, but are not limited to, financial projections and estimates and their underlying assumptions ; statements regarding plans, objectives and expectations with respect to future operations, products and services ; and statements regarding future performance . Such statements are subject to certain risks, uncertainties and assumption, many of which are difficult to predict and generally are beyond the control of Home Bancorp, Inc . and its management, that could cause actual results to differ materially from those expressed in, or implied or projected by, forward looking statements . The following factors, among others, could cause actual results to differ materially from the anticipated results or other expectations expressed in the forward looking statements : ( 1 ) economic and competitive conditions which could affect the volume of loan originations, deposit flows and real estate values ; ( 2 ) the levels of noninterest income and expense and the amount of loan losses ; ( 3 ) competitive pressure among depository institutions increasing significantly ; ( 4 ) the low interest rate environment causing reduced interest margins ; ( 5 ) general economic conditions, either nationally or in the markets in which Home Bancorp, Inc . is or will be doing business, being less favorable than expected ; ( 6 ) political and social unrest, including acts of war or terrorism ; ( 7 ) we may not fully realize all the benefits we anticipated in connection with our acquisitions of other institutions or our assumptions made in connection therewith may prove to be inaccurate ; or ( 8 ) legislation or changes in regulatory requirements adversely affecting the business of Home Bancorp, Inc . Home Bancorp, Inc . undertakes no obligation to update these forward looking statements to reflect events or circumstances that occur after the date on which such statements were made . As used in this report, unless the context otherwise requires, the terms “we,” “our,” “us,” or the “Company” refer to Home Bancorp, Inc . and the term the “Bank” refers to Home Bank, N . A . , a national bank and wholly owned subsidiary of the Company . In addition, unless the context otherwise requires, references to the operations of the Company include the operations of the Bank . For a more detailed description of the factors that may affect Home Bancorp’s operating results or the outcomes described in these forward - looking statements, we refer you to our filings with the Securities and Exchange Commission, including our annual report on Form 10 - K for the year ended December 31 , 2016 . Home Bancorp assumes no obligation to update the forward - looking statements made during this presentation . For more information, please visit our website www . home 24 bank . com . Non - GAAP Information This presentation contains financial information determined by methods other than in accordance with generally accepted accounting principles (“GAAP”) . The Company's management uses this non - GAAP financial information in its analysis of the Company's performance . In this news release, information is included which excludes acquired loans, intangible assets, impact of the gain on the sale of a banking center and the impact of merger - related expenses . Management believes the presentation of this non - GAAP financial information provides useful information that is helpful to a full understanding of the Company’s financial position and core operating results . This non - GAAP financial information should not be viewed as a substitute for financial information determined in accordance with GAAP, nor is it necessarily comparable to non - GAAP financial information presented by other companies .

Home Bank (28 locations) St. Martin Bank & Trust (12 locations) Branch Locations Our Company ▪ Headquartered in Lafayette, Louisiana ▪ Founded in 1908 ▪ IPO completed in October 2008 ▪ Ticker symbol: HBCP (NASDAQ Global) ▪ Market Cap = $397MM as of January 25, 2018 ▪ Added to Russell 3000 Index in 2016 ▪ Completed acquisition of St. Martin Bancshares, Inc. on December 6, 2017 ▪ Assets = $2.2 billion as of December 31, 2017 ▪ Ownership (SNL as of January 25, 2018 ): ▪ Institutional = 37% ▪ Insider = 11% ▪ ESOP = 7% 3

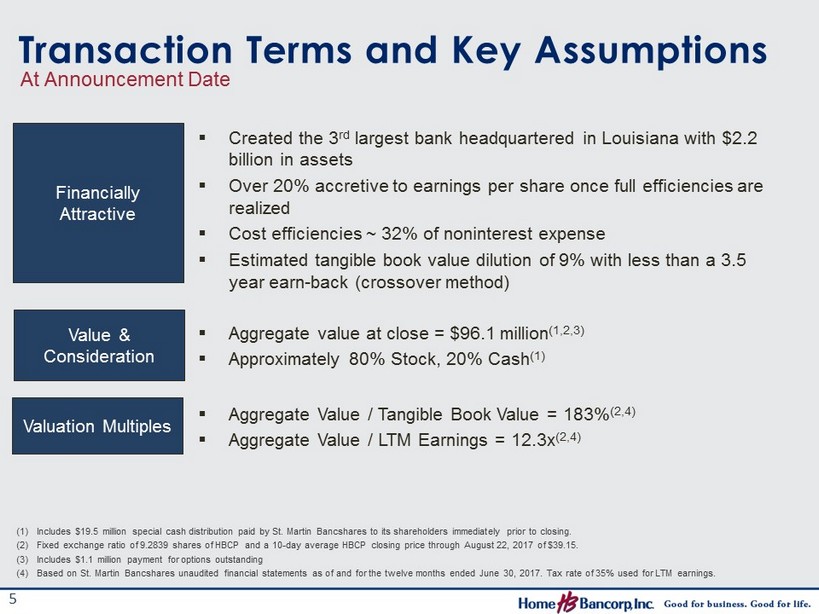
Transaction Terms and Key Assumptions Value & Consideration ▪ Aggregate v alue at close = $96.1 million (1,2,3) ▪ Approximately 80% Stock, 20% Cash (1) Valuation Multiples ▪ Aggregate Value / Tangible Book Value = 183% (2,4) ▪ Aggregate Value / LTM Earnings = 12.3x (2,4) (1) Includes $19.5 million special cash distribution paid by St. Martin Bancshares to its shareholders immediately prior to closi ng. (2) Fixed exchange ratio of 9.2839 shares of HBCP and a 10 - day average HBCP closing price through August 22, 2017 of $39.15. (3) Includes $1.1 million payment for options outstanding (4) Based on St. Martin Bancshares unaudited financial statements as of and for the twelve months ended June 30, 2017. Tax rate o f 3 5% used for LTM earnings. 5 Financially Attractive ▪ Created the 3 rd largest bank headquartered in Louisiana with $2.2 billion in assets ▪ Over 20% accretive to earnings per share once full efficiencies are realized ▪ Cost efficiencies ~ 32% of noninterest expense ▪ Estimated tangible book value dilution of 9% with less than a 3.5 year earn - back (crossover method) At Announcement Date

Loan Composition CRE 35% 1 - 4 Family 28% C&D 12% C&I 11% Home Equity 7% Multifamily 4% Consumer 3% December 31, 2016 Total Loans: $1.2 billion Loans / Assets = 79% December 31, 2017 Total Loans: $1.7 billion Loans / Assets = 75% Acquired $446 million in December 2017 CRE 37% 1 - 4 Family 28% C&I 11% C&D 11% Home Equity 6% Consumer 4% Multifamily 3% 6

Energy & Agricultural Loan Exposure ▪ Outstanding balance = $20.3 million, or 1.2% of loans (Home Bank had an immaterial agricultural exposure prior to St. Martin Bank acquisition) ▪ Unfunded commitments = $11.4 million ▪ 100% of loans performing ▪ Crop distribution: ▪ 81% Rice ▪ 8% Cattle ▪ 7% Sugarcane ▪ 4% Seafood ▪ Collateral distribution ▪ Crop = 81% ▪ Equipment/Other = 10% ▪ Land = 9% ▪ ~ 55% of balances are USDA guaranteed Combined Energy Exposure Agricultural Production Lending ▪ Outstanding balance = $58.8 million, or 4 % of loans ▪ Unfunded commitments = $9.3 million ▪ 96% of loans are performing in accordance with original terms ▪ 4% of loans paying in accordance with restructured terms ▪ Collateral distribution: ▪ Real Estate = 64% ▪ Equipment/Other = 36% ▪ ALLL / Originated direct energy exposure = 2.5% ▪ At acquisition date, St. Martin Bank added $30.1 million of direct energy - related loans with $3.8 million in unfunded commitments 7

NOW 24% Non Interest 24% CDs 22% Money Market 21% Savings 9% Deposit Composition NOW 26% Non Interest 25% CDs 21% Money Market 16% Savings 12% December 31, 2016 Total Deposits: $1.2 billion Deposits / Assets = 80% December 31, 2017 Total Deposits: $1.9 billion Deposits / Assets = 84% Acquired $533 million in December 2017 8

Combined Deposit Market Share (1) Bank 2017 Rank Deposits in Market ($000) Branches Deposit Market Share (%) Iberiabank 1 3,452,508 18 30.0 JP Morgan Chase 2 1,436,065 18 12.5 Home Bank 3 1,084,222 18 9.4 Capital One 4 737,536 6 6.4 MidSouth Bank 5 701,385 14 6.1 Whitney Bank 6 564,074 7 4.9 Lafayette, LA MSA (1) Source: S&P Global Intelligence - Reflects combined deposit market share of Home Bank and St. Martin Bank & Trust as of 6/30/201 7. Assets as of 9/30/2017 State of Louisiana Bank 2017 Rank Deposits in Market ($000) Branches Deposit Market Share (%) Capital One 1 18,463,462 125 17.7 JP Morgan Chase 2 18,171,467 141 17.4 Whitney Bank 3 13,725,530 111 13.1 Iberiabank 4 8,071,712 72 7.7 Regions 5 7,615,154 101 7.3 Origin Bank 6 1,683,323 22 1.6 Home Bank 7 1,668,794 3 6 1.6 9 #3 Asset Size HQ

Disciplined Acquirer since IPO Acquired Bank Date Assets ($ in MM) (at completion) % of TBV (at announcement) # of Branches Consideration Statewide Bank Mar - 2010 $199 FDIC - assisted 6 All Cash Guaranty Savings Bank Jul – 2011 257 95% 5 All Cash Britton & Koontz Bank Feb – 2014 301 90% 8 All Cash Bank of New Orleans Sep – 2015 346 126% 4 All Cash St. Martin Bank & Trust Dec – 2017 597 183% (1) 12 ~80% Stock, 20% Cash (1) 10 (1) Cash is comprised of an aggregate $19.5 million special cash distribution paid by St. Martin Bancshares to its shareholders. 300,000 600,000 900,000 1,200,000 1,500,000 1,800,000 2,100,000 2,400,000 2,700,000 2008 2009 2010 2011 2012 2013 2014 2015 2016 2017 Home Bank Total Assets ($000s) St. Martin Bank & Trust Statewide Bank Britton & Koontz Bank Bank of New Orleans CAGR = 17% Guaranty Savings Bank

Quarterly Financial Highlights 4Q 2016 1Q 2017 2Q 2017 3Q 2017 4Q 2017 GAAP Net Income Basis: Reported Net Income ($000’s) $4,282 $5,006 $4,486 $4,090 $4,198 Diluted EPS $0.60 $0.69 $0.62 $0.56 $0.54 ROA 1.11% 1.28% 1.15% 1.04% 0.94% ROE 9.6% 11.0% 9.6% 8.5% 7.7% ROATCE (1) 10.6% 12.0% 10.5% 9.4% 9.0% Efficiency Ratio 65.6% 58.7% 61.2% 62.1% 56.2% Ending Per Share Stock Price $38.61 $33.75 $42.52 $41.82 $43.22 Non - GAAP Net Income Basis : (2) Adjusted Net Income ($000’s) $4,282 $4,759 $4,778 $4,315 $6,573 Adjusted Diluted EPS $0.60 $0.66 $0.66 $0.59 $ 0.84 Adjusted ROA 1.11% 1.22% 1.22% 1.10% 1.48% Adjusted ROE 9.6% 10.4% 10.2% 9.0% 12.0% Adjusted ROATCE (3) 10.6% 11.5% 11.2% 9.9% 13.9% Adjusted Efficiency Ratio 65.6% 59.9% 59.7% 60.8% 52.5% (1) ROATCE is a Non - GAAP ratio. Ratio reflects GAAP net income to tangible common equity. See appendix. (2) Income and ratios are Non - GAAP and have been adjusted to remove certain income and expense items. See appendix. (3) Ratio reflects Non - GAAP net income to tangible common equity. 11
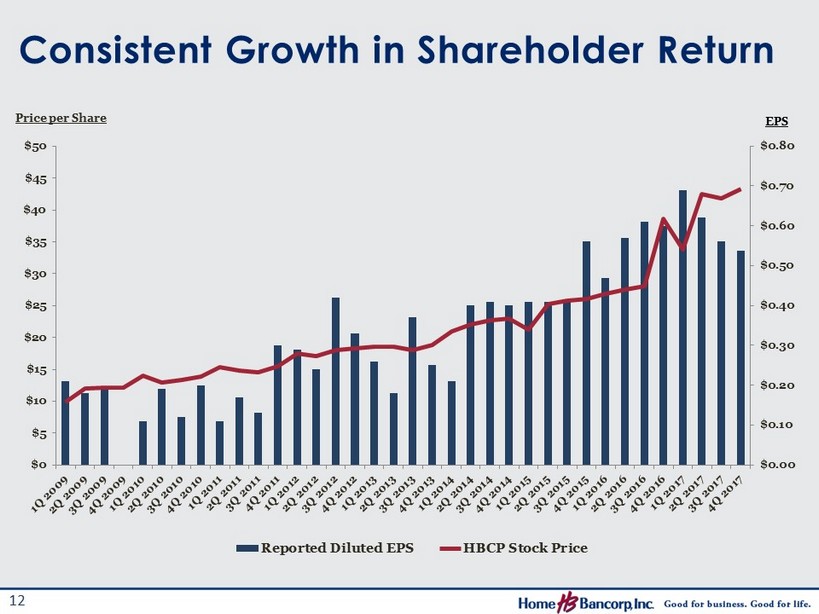
Consistent Growth in Shareholder Return 12 $0.00 $0.10 $0.20 $0.30 $0.40 $0.50 $0.60 $0.70 $0.80 $0 $5 $10 $15 $20 $25 $30 $35 $40 $45 $50 EPS Price per Share Reported Diluted EPS HBCP Stock Price

- 200,000 400,000 600,000 800,000 1,000,000 1,200,000 1,400,000 1,600,000 1,800,000 2008 2009 2010 2011 2012 2013 2014 2015 2016 2017 Loan Balance Outstanding ($000s) Total Loans Originated Statewide GSB B&K BNO SMB Steady Organic Loan Growth Organic Loan CAGR = 12.1% (excludes acquisition accounting adjustments) 13
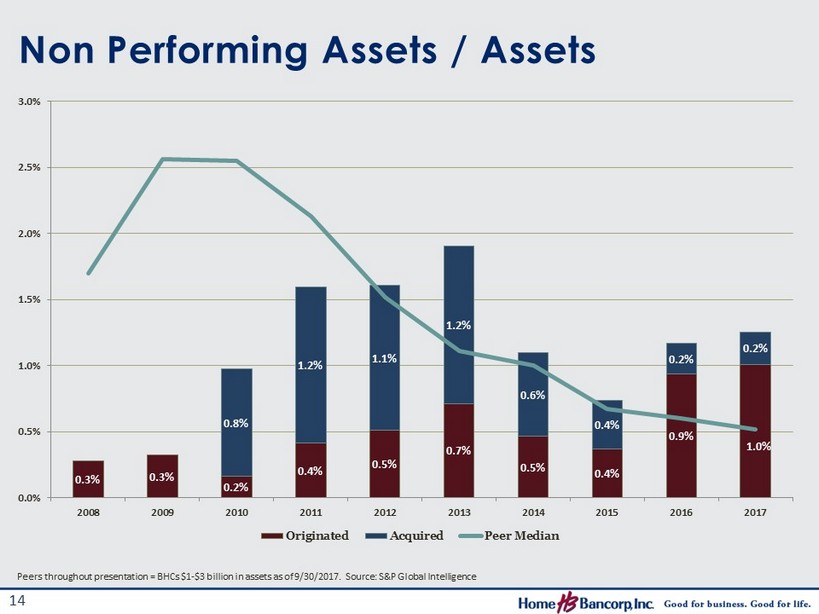
Non Performing Assets / Assets Peers throughout presentation = BHCs $1 - $3 billion in assets as of 9/30/2017. Source: S&P Global Intelligence 14 0.3% 0.3% 0.2% 0.4% 0.5% 0.7% 0.5% 0.4% 0.9% 1.0% 0.8% 1.2% 1.1% 1.2% 0.6% 0.4% 0.2% 0.2% 0.0% 0.5% 1.0% 1.5% 2.0% 2.5% 3.0% 2008 2009 2010 2011 2012 2013 2014 2015 2016 2017 Originated Acquired Peer Median
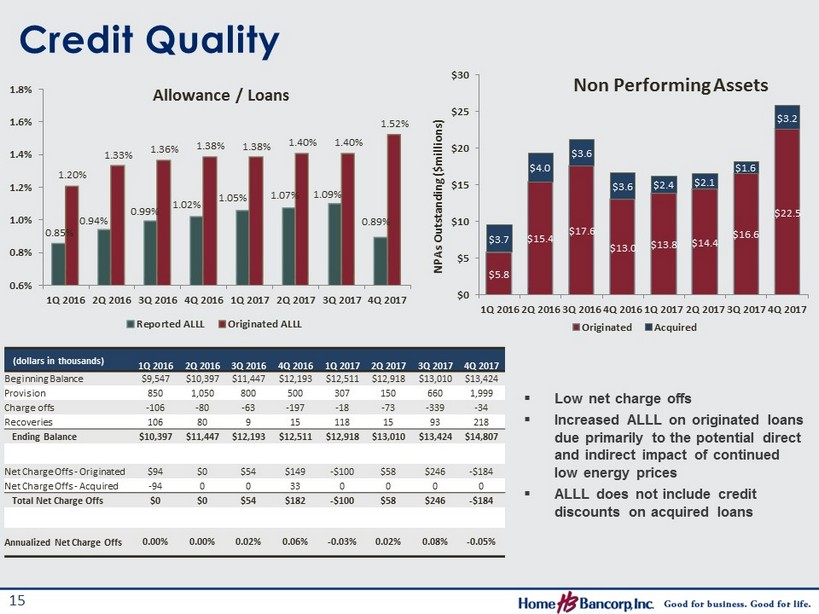
Credit Quality ▪ Low net charge offs ▪ Increased ALLL on originated loans due primarily to the potential direct and indirect impact of continued low energy prices ▪ ALLL does not include credit discounts on acquired loans (dollars in thousands) 1Q 2016 2Q 2016 3Q 2016 4Q 2016 1Q 2017 2Q 2017 3Q 2017 4Q 2017 Beginning Balance $9,547 $10,397 $11,447 $12,193 $12,511 $12,918 $13,010 $13,424 Provision 850 1,050 800 500 307 150 660 1,999 Charge offs - 106 - 80 - 63 - 197 - 18 - 73 - 339 - 34 Recoveries 106 80 9 15 118 15 93 218 Ending Balance $10,397 $11,447 $12,193 $12,511 $12,918 $13,010 $13,424 $14,807 Net Charge Offs - Originated $94 $0 $54 $149 - $100 $58 $246 - $ 184 Net Charge Offs - Acquired - 94 0 0 33 0 0 0 0 Total Net Charge Offs $0 $0 $54 $182 - $100 $58 $246 - $ 184 Annualized Net Charge Offs 0.00% 0.00% 0.02% 0.06% - 0.03% 0.02% 0.08% - 0.05% 15 0.85% 0.94% 0.99% 1.02% 1.05% 1.07% 1.09% 0.89% 1.20% 1.33% 1.36% 1.38% 1.38% 1.40% 1.40% 1.52% 0.6% 0.8% 1.0% 1.2% 1.4% 1.6% 1.8% 1Q 2016 2Q 2016 3Q 2016 4Q 2016 1Q 2017 2Q 2017 3Q 2017 4Q 2017 Allowance / Loans Reported ALLL Originated ALLL $5.8 $15.4 $17.6 $13.0 $13.8 $14.4 $16.6 $22.5 $3.7 $4.0 $3.6 $3.6 $2.4 $2.1 $1.6 $3.2 $0 $5 $10 $15 $20 $25 $30 1Q 2016 2Q 2016 3Q 2016 4Q 2016 1Q 2017 2Q 2017 3Q 2017 4Q 2017 NPAs Outstanding ($millions) Non Performing Assets Originated Acquired

4.48% 3.65% 3.00% 3.25% 3.50% 3.75% 4.00% 4.25% 4.50% 4.75% 5.00% 2008 2009 2010 2011 2012 2013 2014 2015 2016 2017 Home Bank Peer Median 83 basis point spread Net Interest Margin (TE) ▪ Continually higher NIM than peers ▪ 4Q17 loan discount accretion was $1.9MM higher than 3Q17 due to significant paydowns in acquired loan portfolio ▪ Acquired loan yield of 7.97% during 4Q17 ▪ Cost of interest - bearing liabilities during 4Q17 = 0.64% ▪ Stable NIM during current rate cycle ▪ Slightly asset sensitive balance sheet in rising rate environment ▪ Shorter investment portfolio with a 3.2 year effective duration in +100 environment ▪ Reduced exposure to overnight advances through deposit growth ▪ Limited 30 - year fixed mortgages (<3% of total loans) 16

2.77% 2.79% 2.60% 2.70% 2.80% 2.90% 3.00% 3.10% 3.20% 3.30% 3.40% 3.50% 3.60% 2008 2009 2010 2011 2012 2013 2014 2015 2016 2017 NIE / Avg. Assets Peer Median Home Bancorp Average gap = 0.41% Non Interest Income & Expense (1) ▪ Deposit redesign full rollout in 3Q 2017 ▪ Restructured mortgage sales for greater alignment (1) Excludes non core income and expense: see appendix 17 ▪ Leveraged expense base through acquisitions ▪ Continued back office and infrastructure investments provide ability for continued expansion 0.84% 0.62% 0.40% 0.50% 0.60% 0.70% 0.80% 0.90% 1.00% 2008 2009 2010 2011 2012 2013 2014 2015 2016 2017 NII / Avg. Assets Peer Median Home Bancorp
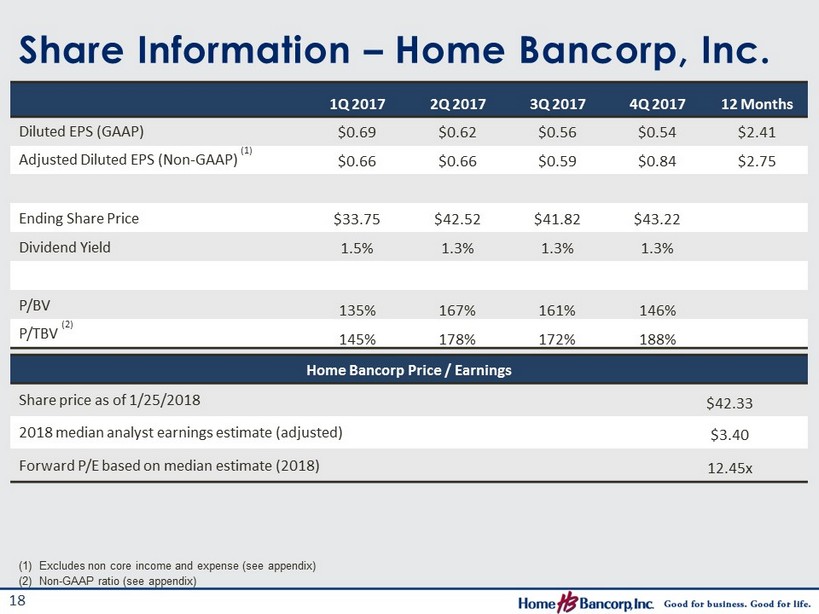
Share Information – Home Bancorp, Inc. 1Q 2017 2Q 2017 3Q 2017 4Q 2017 12 Months Diluted EPS (GAAP) $0.69 $0.62 $0.56 $0.54 $2.41 Adjusted Diluted EPS (Non - GAAP) (1) $0.66 $0.66 $0.59 $0.84 $2.75 Ending Share Price $33.75 $42.52 $41.82 $43.22 Dividend Yield 1.5% 1.3% 1.3% 1.3% P/ BV 135% 167% 161% 146% P/TBV (2) 145% 178% 172% 188% Home Bancorp Price / Earnings Share price as of 1/25/2018 $42.33 2018 median analyst earnings estimate (adjusted) $3.40 Forward P/E based on median estimate (2018) 12.45x (1) Excludes non core income and expense (see appendix) (2) Non - GAAP ratio (see appendix) 18

Appendix Non - GAAP Reconciliation – Home Bancorp, Inc. (dollars in thousands) 4Q 2016 1Q 2017 2Q 2017 3Q 2017 4Q 2017 Total Shareholders' Equity $179,843 $184,720 $188,939 $192,625 $278,826 Less: Intangible assets 12,762 12,577 12,403 12,234 63,094 Non - GAAP tangible shareholders' equity $167,081 $172,143 $176,536 $180,391 $215,732 Total Assets $1,556,732 $1,583,497 $1,574,181 $1,587,362 $2,229,076 Less: Intangible assets 12,762 12,577 12,403 12,234 63,094 Non - GAAP tangible assets $1,543,970 $1,570,920 $1,561,778 $1,575,128 $2,165,982 Originated loans $884,690 $899,500 $905,908 $928,770 $941,922 Acquired loans 343,143 327,428 312,855 298,623 722,468 Total Loans $1,227,833 $1,226,928 $1,218,763 $1,227,393 $1,664,390 Originated allowance for loan losses $12,220 $12,417 $ 12,727 $13,040 $14,303 Acquired allowance for loan losses 291 501 283 384 504 Total allowance for loan losses $12,511 $12,918 $ 13,010 $13,424 $14,807 Common Equity Ratio 11.6% 11.7% 12.0% 12.1% 12.5% Less: Intangibles 0.8 0.7 0.7 0.7 2.5 Non - GAAP tangible common equity ratio 10.8% 11.0% 11.3% 11.4% 10.0% Book Value Per Share $24.47 $25.05 $25.53 $25.99 $29.68 Less: Intangibles 1.74 1.70 1.68 1.65 6.72 Non - GAAP tangible book value per share $22.73 $23.35 $23.85 $24.34 $22.96 Reported net income $4,282 $5,006 $4,486 $4,090 $4,198 Add: Amortization CDI, net tax 126 121 113 110 152 Non - GAAP tangible income $4,408 $5,127 $4,599 $4,200 $4,350 Return on average equity 9.6% 10.9% 9.6% 8.5% 7.7% Add: Intangibles 1.0 1.1 0.9 0.9 1.3 Non - GAAP return on tangible common equity (1) 10.6% 12.0% 10.5% 9.4% 9.0% 19 (1) Return on average tangible common equity is Non - GAAP.
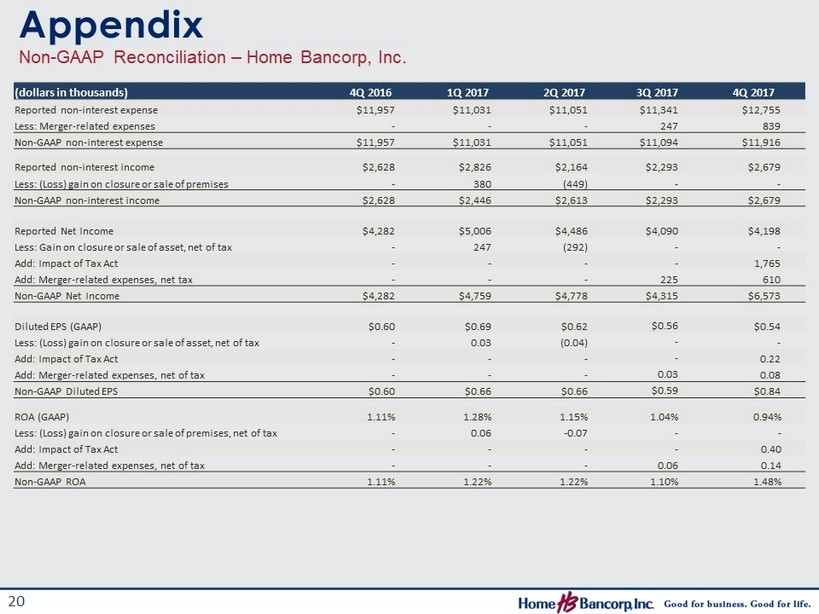
Appendix Non - GAAP Reconciliation – Home Bancorp, Inc. (dollars in thousands) 4Q 2016 1Q 2017 2Q 2017 3Q 2017 4Q 2017 Reported non - interest expense $11,957 $11,031 $11,051 $11,341 $12,755 Less: Merger - related expenses - - - 247 839 Non - GAAP non - interest expense $11,957 $11,031 $11,051 $11,094 $11,916 Reported non - interest income $2,628 $2,826 $2,164 $2,293 $2,679 Less: (Loss) gain on closure or sale of premises - 380 (449) - - Non - GAAP non - interest income $2,628 $2,446 $2,613 $2,293 $2,679 Reported Net Income $4,282 $5,006 $4,486 $4,090 $4,198 Less: Gain on closure or sale of asset, net of tax - 247 (292) - - Add: Impact of Tax Act - - - - 1,765 Add: Merger - related expenses, net tax - - - 225 610 Non - GAAP Net Income $4,282 $4,759 $4,778 $4,315 $6,573 Diluted EPS (GAAP) $0.60 $0.69 $0.62 $0.56 $0.54 Less: (Loss) gain on closure or sale of asset, net of tax - 0.03 (0.04 ) - - Add: Impact of Tax Act - - - - 0.22 Add: Merger - related expenses, net of tax - - - 0.03 0.08 Non - GAAP Diluted EPS $0.60 $0.66 $0.66 $0.59 $ 0.84 ROA (GAAP) 1.11% 1.28% 1.15% 1.04% 0.94% Less: (Loss) gain on closure or sale of premises, net of tax - 0.06 - 0.07 - - Add: Impact of Tax Act - - - - 0.40 Add: Merger - related expenses, net of tax - - - 0.06 0.14 Non - GAAP ROA 1.11% 1.22% 1.22% 1.10% 1.48% 20
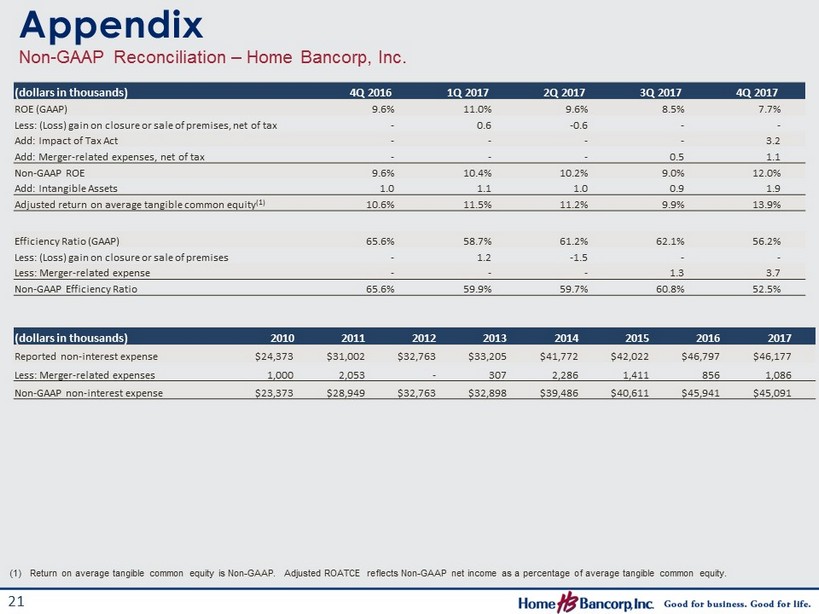
Appendix Non - GAAP Reconciliation – Home Bancorp, Inc. (dollars in thousands) 4Q 2016 1Q 2017 2Q 2017 3Q 2017 4Q 2017 ROE (GAAP) 9.6% 11.0% 9.6% 8.5% 7.7% Less: (Loss) gain on closure or sale of premises, net of tax - 0.6 - 0.6 - - Add: Impact of Tax Act - - - - 3.2 Add: Merger - related expenses, net of tax - - - 0.5 1.1 Non - GAAP ROE 9.6% 10.4% 10.2% 9.0% 12.0% Add: Intangible Assets 1.0 1.1 1.0 0.9 1.9 Adjusted return on average tangible common equity (1) 10.6% 11.5% 11.2% 9.9% 13.9% Efficiency Ratio (GAAP) 65.6% 58.7% 61.2% 62.1% 56.2% Less: (Loss) gain on closure or sale of premises - 1.2 - 1.5 - - Less: Merger - related expense - - - 1.3 3.7 Non - GAAP Efficiency Ratio 65.6% 59.9% 59.7% 60.8% 52.5% 21 (1) Return on average tangible common equity is Non - GAAP. Adjusted ROATCE reflects Non - GAAP net income as a percentage of average t angible common equity. (dollars in thousands) 2010 2011 2012 2013 2014 2015 2016 2017 Reported non - interest expense $24,373 $31,002 $32,763 $33,205 $41,772 $42,022 $46,797 $46,177 Less: Merger - related expenses 1,000 2,053 - 307 2,286 1,411 856 1,086 Non - GAAP non - interest expense $23,373 $28,949 $32,763 $32,898 $39,486 $40,611 $45,941 $45,091
