Attached files
| file | filename |
|---|---|
| EX-99.3 - EX-99.3 - JUNIPER NETWORKS INC | d428443dex993.htm |
| EX-99.1 - EX-99.1 - JUNIPER NETWORKS INC | d428443dex991.htm |
| 8-K - FORM 8-K - JUNIPER NETWORKS INC | d428443d8k.htm |
Exhibit 99.2

Juniper Networks, Inc.
1133 Innovation Way
Sunnyvale, CA 94089
January 30, 2018
CFO Commentary on Fourth Quarter and Fiscal 2017 Preliminary Financial Results
Related Information
The following commentary is provided by management and should be referenced in conjunction with Juniper Networks’ fourth quarter and fiscal year 2017 preliminary financial results press release available on its Investor Relations website at http://investor.juniper.net. These remarks represent management’s current views of the Company’s financial and operational performance and outlook and are provided to give investors and analysts further insight into the Company’s performance in advance of the earnings call webcast.
Q4 2017 Preliminary Financial Results
GAAP
| (in millions, except per share amounts and percentages) | Q4’17 | Q3’17 | Q4’16 | Q/Q Change | Y/Y Change | |||||||||||||||
| Revenue |
$ | 1,239.5 | $ | 1,257.8 | $ | 1,385.6 | (1 | )% | (11 | )% | ||||||||||
| Product |
830.4 | 869.7 | 985.6 | (5 | )% | (16 | )% | |||||||||||||
| Service |
409.1 | 388.1 | 400.0 | 5 | % | 2 | % | |||||||||||||
| Gross margin % |
60.6 | % | 61.4 | % | 61.9 | % | (0.8 | )pts | (1.3 | )pts | ||||||||||
| Research and development |
227.9 | 236.4 | 263.0 | (4 | )% | (13 | )% | |||||||||||||
| Sales and marketing |
233.6 | 232.5 | 254.5 | — | % | (8 | )% | |||||||||||||
| General and administrative |
50.8 | 70.6 | 52.9 | (28 | )% | (4 | )% | |||||||||||||
| Restructuring charges |
36.2 | 2.0 | 0.1 | N/M | N/M | |||||||||||||||
|
|
|
|
|
|
|
|||||||||||||||
| Total operating expenses |
$ | 548.5 | $ | 541.5 | $ | 570.5 | 1 | % | (4 | )% | ||||||||||
|
|
|
|
|
|
|
|||||||||||||||
| Operating margin % |
16.4 | % | 18.4 | % | 20.7 | % | (2.0 | )pts | (4.3 | )pts | ||||||||||
|
|
|
|
|
|
|
|||||||||||||||
| Net (loss) income |
$ | (148.1 | ) | $ | 165.7 | $ | 188.9 | (189 | )% | (178 | )% | |||||||||
|
|
|
|
|
|
|
|||||||||||||||
| Diluted net (loss) income per share |
$ | (0.40 | ) | $ | 0.43 | $ | 0.49 | (193 | )% | (182 | )% | |||||||||
|
|
|
|
|
|
|
|||||||||||||||
N/M - Not meaningful
Non-GAAP
| (in millions, except per share amounts and percentages) | Q1’18 Guidance | Q4’17 | Q3’17 | Q4’16 | Q/Q Change | Y/Y Change | ||||||||||||||||
| Revenue(1) |
$1,050 +/- $30 | $1,239.5 | $1,257.8 | $1,385.6 | (1 | )% | (11 | )% | ||||||||||||||
| Product(1) |
830.4 | 869.7 | 985.6 | (5 | )% | (16 | )% | |||||||||||||||
| Service(1) |
409.1 | 388.1 | 400.0 | 5 | % | 2 | % | |||||||||||||||
| Gross margin % |
58.0% +/- 1% | 61.3 | % | 62.0 | % | 63.2 | % | (0.7 | )pts | (1.9 | )pts | |||||||||||
| Research and development |
208.6 | 217.9 | 225.4 | (4 | )% | (7 | )% | |||||||||||||||
| Sales and marketing |
222.3 | 217.7 | 239.2 | 2 | % | (7 | )% | |||||||||||||||
| General and administrative |
48.1 | 48.4 | 45.0 | (1 | )% | 7 | % | |||||||||||||||
|
|
|
|
|
|
|
|||||||||||||||||
| Total operating expenses |
$485 +/- $5 | $479.0 | $484.0 | $509.6 | (1 | )% | (6 | )% | ||||||||||||||
|
|
|
|
|
|
|
|||||||||||||||||
| Operating margin % |
~ 12% at the midpoint | 22.7 | % | 23.5 | % | 26.5 | % | (0.8 | )pts | (3.8 | )pts | |||||||||||
|
|
|
|
|
|
|
|||||||||||||||||
| Net income |
$199.4 | $211.1 | $254.3 | (6 | )% | (22 | )% | |||||||||||||||
|
|
|
|
|
|
|
|||||||||||||||||
| Diluted EPS |
$0.25 +/- $0.03 | $0.53 | $0.55 | $0.66 | (4 | )% | (20 | )% | ||||||||||||||
|
|
|
|
|
|
|
|||||||||||||||||
| (1) | Revenue numbers are GAAP and Q1’18 guidance is provided under revenue recognition requirements under ASC 605. |
Fiscal 2017 Preliminary Financial Results
GAAP
| (in millions, except per share amounts and percentages) | FY’17 | FY’16 | Y/Y Change | |||||||||
| Revenue |
$ | 5,027.2 | $ | 4,990.1 | 1 | % | ||||||
| Product |
3,446.2 | 3,528.9 | (2 | )% | ||||||||
| Service |
1,581.0 | 1,461.2 | 8 | % | ||||||||
| Gross margin % |
61.1 | % | 62.2 | % | (1.1 | )pts | ||||||
| Research and development |
980.7 | 1,013.7 | (3 | )% | ||||||||
| Sales and marketing |
950.2 | 972.9 | (2 | )% | ||||||||
| General and administrative |
227.5 | 224.9 | 1 | % | ||||||||
| Restructuring charges |
65.6 | 3.3 | N/M | |||||||||
|
|
|
|
|
|||||||||
| Total operating expenses |
$ | 2,224.0 | $ | 2,214.8 | — | % | ||||||
|
|
|
|
|
|||||||||
| Operating margin % |
16.9 | % | 17.8 | % | (0.9 | )pts | ||||||
|
|
|
|
|
|||||||||
| Net income |
$ | 306.2 | $ | 592.7 | (48 | )% | ||||||
|
|
|
|
|
|||||||||
| Diluted EPS |
$ | 0.80 | $ | 1.53 | (48 | )% | ||||||
|
|
|
|
|
|||||||||
N/M - Not meaningful
Non-GAAP
| (in millions, except per share amounts and percentages) | FY’17 | FY’16 | Y/Y Change | |||||||||
| Revenue(1) |
$ | 5,027.2 | $ | 4,990.1 | 1 | % | ||||||
| Product(1) |
3,446.2 | 3,528.9 | (2 | )% | ||||||||
| Service(1) |
1,581.0 | 1,461.2 | 8 | % | ||||||||
| Gross margin % |
62.0 | % | 63.2 | % | (1.2 | )pts | ||||||
| Research and development |
891.7 | 885.0 | 1 | % | ||||||||
| Sales and marketing |
888.7 | 912.8 | (3 | )% | ||||||||
| General and administrative |
187.5 | 187.7 | — | % | ||||||||
|
|
|
|
|
|||||||||
| Total operating expenses |
$ | 1,967.9 | $ | 1,985.5 | (1 | )% | ||||||
|
|
|
|
|
|||||||||
| Operating margin % |
22.8 | % | 23.4 | % | (0.6 | )pts | ||||||
|
|
|
|
|
|||||||||
| Net income |
$ | 809.0 | $ | 810.1 | — | % | ||||||
|
|
|
|
|
|||||||||
| Diluted EPS |
$ | 2.11 | $ | 2.09 | 1 | % | ||||||
|
|
|
|
|
|||||||||
| (1) | Revenue numbers are GAAP |
This CFO Commentary contains non-GAAP financial measures, and the reconciliation between GAAP and non-GAAP financial measures can be found at the end of this document. We are unable to provide a reconciliation of forward-looking non-GAAP guidance measures to corresponding GAAP measures without unreasonable effort due to the overall high variability and low visibility of most of the items that are excluded from our non-GAAP guidance measures. More information on these exclusions can be found under “Q1 2018 Outlook” below.
Q4 2017 Overview
We reported fourth quarter revenue of $1,239 million and non-GAAP earnings per share of $0.53, slightly above the mid-point of our guidance. Gross margin pressure was largely offset by disciplined operating expense management versus our guidance. We continued to see architectural shifts in the Cloud vertical impacting our Routing and Switching businesses, which both declined year-over-year. However, Security saw a third consecutive quarter of sequential growth and revenue improved year-over-year. Services continued to be solid, posting year-over-year and sequential growth, driven by strong renewal and attach rates.
In reviewing our top 10 customers for the quarter, five were Cloud, four were Telecom / Cable, and one was Strategic Enterprise. Of these customers, two were located outside of the U.S.
Product deferred revenue was $334 million, up $11 million or 3% both year-over-year and sequentially.
Non-GAAP operating expenses declined 6% year-over-year and 1% sequentially, reflecting lower variable compensation and our continued focus on managing expenses. Non-GAAP operating expenses were 38.6% of revenue in the fourth quarter.
Cash flow from operations was $214 million for the quarter. During the quarter, we repurchased $330 million worth of shares. We also paid $37 million in dividends.
Revenue
Product & Service
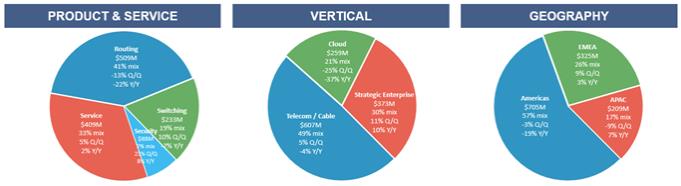
| • | Routing product revenue: $509 million, down 22% year-over-year and down 13% sequentially. The year-over-year decrease was primarily due to Cloud and Telecom / Cable. The sequential decrease was driven by Cloud, partially offset by Telecom / Cable and Strategic Enterprise. Both PTX and MX product families declined year-over-year and sequentially. |
| • | Switching product revenue: $233 million, down 7% year-over-year and up 10% sequentially. The year-over-year decrease was driven by Cloud, partially offset by Strategic Enterprise. Sequentially, the increase was driven by all verticals. Both our QFX and EX family of products declined year-over-year but grew sequentially. |
| • | Security product revenue: $88 million, up 8% year-over-year and up 23% sequentially. Year-over-year, the increase was primarily due to Strategic Enterprise. The sequential increase was driven by Cloud and Strategic Enterprise. Total SRX revenue grew year-over-year and sequentially. |
| • | Service revenue: $409 million, up 2% year-over-year and up 5% sequentially. Year-over-year and sequentially, the increase was driven by strong renewal and attach rates of support contracts. |
Vertical
Cloud: $259 million, down 37% year-over-year and down 25% sequentially. Year-over-year, the decrease was primarily due to Routing and Switching, partially offset by Services. The sequential decrease was primarily due to Routing.
| • | Telecom / Cable: $607 million, down 4% year-over-year and up 5% sequentially. Year-over-year, the decrease was primarily due to Routing. Sequentially, the increase was driven by Routing, Switching and Services. |
| • | Strategic Enterprise: $373 million, up 10% year-over-year and up 11% sequentially. Year-over-year and sequentially, the increase was driven by all technologies and Services. |
Geography
| • | Americas: $705 million, down 19% year-over-year and down 3% sequentially. Year-over-year, the decrease was due to Cloud and Telecom / Cable. Sequentially, the decrease was due to Cloud, partially offset by Telecom / Cable and Strategic Enterprise. |
| • | EMEA: $325 million, up 3% year-over-year and up 9% sequentially. Year-over-year, the increase was primarily due to Strategic Enterprise, partially offset by Cloud. Sequentially, the increase was driven by Strategic Enterprise and Telecom / Cable, partially offset by a decrease in Cloud. The year-over-year increase was due to Spain, Ireland and the United Kingdom. The sequential increase was primarily in Germany. |
| • | APAC: $209 million, up 7% year-over-year and down 9% sequentially. Year-over-year, the increase was driven by Strategic Enterprise and Telecom / Cable, partially offset by Cloud. The sequential decrease was primarily driven by Telecom / Cable. The year-over-year increase was primarily driven by Australia. The sequential decrease was primarily driven by Japan and Southeast Asia. |
Gross Margin
| • | GAAP gross margin: 60.6%, compared to 61.9% from the prior year and 61.4% from last quarter. |
| • | Non-GAAP gross margin: 61.3%, compared to 63.2% from the prior year and 62.0% from last quarter. |
| • | GAAP product gross margin: 59.7%, down 2.7 points from the prior year and down 1.7 points from last quarter. |
| • | Non-GAAP product gross margin: 60.3%, down 3.6 points from the prior year and down 1.5 points from last quarter. |
Year-over-year, the decrease in product gross margin, on a GAAP and non-GAAP basis, was primarily due to product mix, higher costs of certain memory components and lower revenue, partially offset by improvements in our cost structure.
The sequential decrease, on a GAAP and non-GAAP basis, was primarily driven by product mix and partially offset by improvements in our cost structure.
| • | GAAP service gross margin: 62.4%, up 1.8 points from the prior year and up 0.9 points from last quarter. |
| • | Non-GAAP service gross margin: 63.4%, up 1.7 points from the prior year and up 0.9 points from last quarter. |
Year-over-year and sequentially, the increase in service gross margin, on a GAAP and non-GAAP basis, was primarily due to higher revenue and lower variable compensation, partially offset by higher material and delivery costs.
Operating Expenses
| • | GAAP operating expenses: $549 million, a decrease of $22 million, or 4% year-over-year, and an increase of $7 million, or 1% sequentially. |
The year-over-year decrease in operating expenses was primarily due to lower share-based compensation, variable compensation and headcount related costs, partially offset by restructuring costs. The sequential increase was primarily due to higher restructuring charges partially offset by lower headcount related costs and variable compensation.
GAAP operating expenses were 44.3% of revenue, up 3.1 points year-over-year and up 1.2 points quarter-over-quarter.
| • | Non-GAAP operating expenses: $479 million, a decrease of $31 million, or 6% year-over-year, and a decrease of $5 million or 1% sequentially. |
The year-over-year decrease in operating expenses was primarily due to lower variable compensation and headcount related costs.
The sequential decrease in operating expenses was primarily due to lower headcount related costs and lower variable compensation.
Non-GAAP operating expenses were 38.6% of revenue, up 1.8 points year-over-year and up 0.1 points quarter-over-quarter, primarily due to lower revenue.
Operating Margin
| • | GAAP operating margin: 16.4%, a decrease of 4.3 points year-over-year and 2.0 points sequentially. |
| • | Non-GAAP operating margin: 22.7%, a decrease of 3.8 points year-over-year and 0.8 points sequentially. |
Tax Rate
| • | GAAP tax rate: 174.0%, an increase of 147.4 points compared to 26.6% last quarter and 30.6% in Q4’16. |
The sequential and year-over-year increase in the effective tax rate, on a GAAP basis, was primarily due to an estimated one-time transition tax and a remeasurement of deferred taxes based on the new tax rate as a result of the US Tax Cuts and Jobs Act enacted in Q4’17.
| • | Non-GAAP tax rate: 26.3%, a decrease of 0.2 points compared to 26.5% last quarter. |
Diluted Earnings (Loss) Per Share
| • | GAAP diluted (loss) per share: -$0.40, a decrease of $0.89 year-over-year and a decrease of $0.83 sequentially. |
The year-over-year decrease was due to higher taxes as a result of the US Tax Cuts and Jobs Act, lower revenue, and lower gross margins, partially offset by lower operating expenses. The sequential decrease was primarily due to a higher tax rate as a result of the US Tax Cuts and Jobs Act.
| • | Non-GAAP diluted earnings per share: $0.53, a decrease of $0.13 year-over-year and a decrease of $0.02 sequentially. |
The year-over-year and sequential decrease was primarily due to lower revenue and lower gross margin partially offset by lower operating expenses.
Balance Sheet, Cash Flow, Capital Return, and Other Financial Metrics
| (in millions, except days sales outstanding (“DSO”), and headcount) | Q4’17 | Q3’17 | Q2’17 | Q1’17 | Q4’16 | |||||||||||||||
| Cash(1, 2) |
$ | 4,021.0 | $ | 4,199.3 | $ | 4,214.6 | $ | 4,043.7 | $ | 3,657.3 | ||||||||||
| Debt |
2,136.3 | 2,135.7 | 2,135.0 | 2,134.4 | 2,133.7 | |||||||||||||||
| Net cash and investments(3) |
1,884.7 | 2,063.6 | 2,079.6 | 1,909.3 | 1,523.6 | |||||||||||||||
| Operating cash flow(4) |
214.2 | 201.9 | 298.7 | 545.3 | 335.9 | |||||||||||||||
| Capital expenditures |
53.6 | 33.3 | 32.2 | 32.1 | 51.8 | |||||||||||||||
| Depreciation and amortization |
55.0 | 56.3 | 54.8 | 54.2 | 53.9 | |||||||||||||||
| Share repurchases |
329.7 | 140.0 | 125.0 | 125.0 | — | |||||||||||||||
| Dividends |
$ | 36.9 | $ | 37.7 | $ | 37.8 | $ | 38.0 | $ | 38.1 | ||||||||||
| Diluted shares(5) |
371.5 | 382.7 | 385.6 | 388.0 | 385.6 | |||||||||||||||
| DSO |
62 | 52 | 52 | 49 | 68 | |||||||||||||||
| Headcount(6) |
9,381 | 9,694 | 9,661 | 9,694 | 9,832 | |||||||||||||||
| (1) | Includes cash, cash equivalents, and investments. |
| (2) | 9% held onshore as of the end of Q4’17. |
| (3) | Net cash and investments includes, cash, cash equivalents, and investments, net of debt. |
| (4) | In Q1’17, we adopted the new accounting pronouncement on Improvements to Employee Share-Based Payment Accounting, requiring excess tax benefits to be presented as an operating activity in our consolidated statements of cash flow. We applied this provision on a retrospective basis, resulting in the reclassification of certain excess tax benefits from share-based compensation to operating activities from financing activities. In addition, certain other amounts for the prior periods have been reclassified to conform to the current-period presentation. |
| (5) | Non-GAAP diluted shares for Q4’17 was 376.6. |
| (6) | Q1’17 and Q2’17 excludes headcount impacted by restructuring activities. |
Cash Flow
| • | Cash flow from operations: $214 million, down $122 million year-over-year and up $12 million sequentially. The year-over-year decrease was primarily due to the timing of collection from customers and severance payments offset by the timing of payment to suppliers. The sequential increase was primarily due to timing of payment of variable compensation, interest and taxes. |
Days Sales Outstanding
| • | DSO: 62 days, compared to 52 days, an increase of 10 days from the prior quarter, due primarily to an increase in Service invoicing which occurred late in the quarter and resulted in higher deferred Service revenue, and to a lesser extent the timing of product invoicing. |
Capital Return
| • | In the quarter, we repurchased $330 million worth of shares and paid a dividend of $0.10 per share for a total of $37 million. |
Demand Metrics
| • | Total deferred revenue was $1,539 million, up $58 million year-over-year and up $76 million sequentially. |
| • | Product deferred revenue was $334 million, an increase of $11 million both year-over-year and quarter-over-quarter. |
Headcount
| • | Ending headcount was 9,381 a decrease of 451 employees year-over-year and a decrease of 313 employees sequentially. The year-over-year decrease was primarily related to the restructuring of headcount partially offset by an increase in Services employees and employees acquired through an acquisition. The sequential decrease was primarily related to the restructuring of headcount. |
Fiscal 2017 Overview
Our fiscal 2017 saw modest revenue and non-GAAP earnings per share growth of 1%. Routing declined 7% due to ongoing architectural transitions in the Cloud vertical. Switching had a record year, up 12% driven by QFX which grew 25%. Security declined 8% however we saw sequential growth over the last three quarters and a return to year-over-year growth in the fourth quarter. Our Services business remained strong, with 8% growth. Americas declined 1% and EMEA declined 3%, however, APAC grew 13%. Strategic Enterprise posted growth of 4%, Cloud declined 1% and Telecom / Cable was flat.
In reviewing our top 10 customers for the year, four were Cloud, five were Telecom / Cable, and one was a Strategic Enterprise. Of these customers, two were located outside of the U.S.
We continued to focus on disciplined operating expense management with a decline of $18 million or 1% on a non-GAAP basis. Non-GAAP operating expense as a percentage of revenue was 39.1%.
For the year, we had strong cash flow from operations of $1,260 million, up $153 million. We repurchased $720 million worth of shares and paid $150 million in dividends.
Revenue
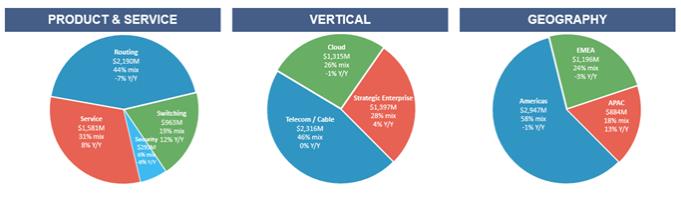
Product & Service
| • | Routing product revenue: $2,190 million, down 7% year-over-year. We saw declines in all verticals, mainly driven by Cloud. Our PTX product family saw growth while MX was down year-over-year. |
| • | Switching product revenue: $963 million, up 12% year-over-year. We saw continued data center strength, driven by Cloud. Our QFX product family had record annual results and grew 25% year-over-year. |
| • | Security product revenue: $293 million, down 8% year-over-year, primarily due to Cloud and Telecom / Cable. The year-over-year decline was primarily driven by the decline in High End SRX. |
| • | Service revenue: $1,581 million, up 8% year-over-year. The increase in service revenue was primarily driven by strong attach rates and renewals of support contracts. |
Geography
| • | Americas: $2,947 million, down 1% year-over-year. The decrease was driven by Telecom /Cable partially offset by Cloud. |
| • | EMEA: $1,196 million, down 3% year-over-year. The decrease was due to declines in Telecom / Cable and Cloud, partially offset by growth in Strategic Enterprise. Germany and the United Kingdom drove the majority of the decrease year-over-year. |
| • | APAC: $884 million, up 13% year-over-year. The increase was driven by Telecom / Cable and Strategic Enterprise partially offset by Cloud. Australia and Malaysia drove the majority of the increase year-over-year. |
Vertical
Cloud: $1,315 million, down 1% year-over-year. The decrease was due to Routing and Security, partially offset by Switching and Services.
| • | Telecom / Cable: $2,316 million, flat year-over-year. Primarily due to higher Services partially offset by a decline in routing. |
| • | Strategic Enterprise: $1,397 million, up 4% year-over-year. Year-over-year, the increase was primarily driven by Switching and Services. |
Gross Margin
| • | GAAP gross margin: 61.1%, compared to 62.2% from the prior year. |
| • | Non-GAAP gross margin: 62%, compared to 63.2% from the prior year. |
| • | GAAP product gross margin: 60.5%, down 1.9 points from a year ago. |
| • | Non-GAAP product gross margin: 61.2%, down 2.1 points from a year ago. |
The decrease in product gross margin, on a GAAP and non-GAAP basis, was due to lower revenue, product mix, higher memory costs, partially offset by improvements in our cost structure.
| • | GAAP service gross margin: 62.4%, up 0.7 points from a year ago. |
| • | Non-GAAP service gross margin: 63.6%, up 0.8 points from a year ago. |
The increase in GAAP and non-GAAP services gross margin was driven by an increase in support revenue partially offset by higher material and delivery costs.
Operating Expenses
| • | GAAP operating expenses: $2,224 million, compared to $2,215 million a year ago, an increase of $9 million. |
The year-over-year increase on a GAAP basis, was primarily due to restructuring and engineering spend partially offset by lower share-based compensation and variable compensation.
GAAP operating expenses were 44.2% of revenue compared to 44.4% in 2016.
| • | Non-GAAP operating expenses: $1,968 million compared to $1,986 million a year ago, a decrease of $18 million. |
The year-over-year decrease on a non-GAAP basis, was primarily due to lower variable compensation, partially offset by increased engineering investment.
On a non-GAAP basis, operating expenses were 39.1% of revenue compared to 39.8% in 2016.
Operating Margin
| • | GAAP operating margin: 16.9%, compared to 17.8% a year ago, a decrease of 0.9 points. |
| • | Non-GAAP operating margin: 22.8%, compared to 23.4% a year ago, a decrease of 0.6 points. |
Tax Rate
| • | GAAP tax rate: 62.3%, up from 28.4% last year. |
The increase in the effective tax rate, on a GAAP basis, was primarily due to an estimated one-time transition tax and a remeasurement of deferred taxes based on the new tax rate as a result of the US Tax Cuts and Jobs Act.
| • | Non-GAAP tax rate: 26.4%, down from 26.7% last year. |
Diluted Earnings Per Share
| • | GAAP diluted earnings per share: $0.80, a decrease of $0.73 year-over-year. |
The year-over-year decrease was due to a higher tax rate primarily due to the Tax Cuts and Jobs Act, which resulted in a $289.5 million estimated tax expense and lower gross margin.
| • | Non-GAAP diluted earnings per share: $2.11, an increase of $0.02 year-over-year. |
The year-over-year increase on a non-GAAP basis was driven by higher revenue, lower operating and other expenses, and lower share count, partially offset by lower gross margin.
Balance Sheet, Cash Flow, and Capital Return
| (in millions) | FY’17 | FY’16 | Y/Y Change | |||||||||
| Cash |
$ | 4,021.0 | $ | 3,657.3 | 10 | % | ||||||
| Net cash and investments |
1,884.7 | 1,523.6 | 24 | % | ||||||||
| Operating cash flow |
1,260.1 | 1,107.2 | 14 | % | ||||||||
| Capital expenditures |
151.2 | 214.7 | (30 | )% | ||||||||
| Depreciation and amortization |
220.3 | 200.7 | 10 | % | ||||||||
| Share repurchases |
719.7 | 312.9 | 130 | % | ||||||||
| Dividends |
$ | 150.4 | $ | 152.5 | (1 | )% | ||||||
Balance Sheet
| • | Cash: $4.0 billion, up from $3.7 billion the prior year primarily as a result of operating cash flow, partially offset by capital return and capital expenditures. |
Cash Flow
| • | Cash flow from operations: Strong cash flow from operations of $1,260 million, up $153 million from the prior year, primarily due to customer collections from significant invoicing that occurred in late Q4’16. |
Capital Return
| • | We repurchased $720 million worth of shares in the year and paid $150 million in dividends. |
| • | Weighted average diluted shares for the year were 384 million, a decrease of 1% year-over-year. |
| • | We exited the year with 365 million shares outstanding, a decline of approximately 16 million shares year-over-year. |
Outlook
These metrics are provided on a non-GAAP basis, except for revenue and share count. Earnings per share is on a fully diluted basis. The outlook assumes that the exchange rate of the U.S. dollar to other currencies will remain relatively stable at current levels.
Our Q1 revenue outlook reflects ongoing deployment delays as we expect our large Cloud customers to continue their architectural transition, which is expected to result in below normal seasonality. This architectural transition is related to the evolution of these customers’ networks to be more modern, cost efficient, and scalable. Despite this outlook, we remain confident in our competitive position and strong relationships with these strategic customers.
While the timing of the architectural transitions we are experiencing is dynamic and somewhat uncertain, we expect revenue to grow on a sequential basis beyond the first quarter and return to year-on-year growth by the end of the year.
We expect gross margins for the quarter to remain under pressure, due to lower volume and product mix, resulting from our customers architectural shifts. There are many factors that impact gross margins, and while it is a dynamic environment, we expect full year margins to improve directionally from Q1’18 levels.
We are undertaking specific efforts to address the pressure on our gross margins. These efforts include value engineering, optimizing our supply chain, pricing management and increasing software and solution sales.
Despite the reset of variable compensation and typical seasonal increase of fringe costs, we expect to manage our operating expenses prudently and to increase operational efficiencies, both in Q1 and throughout the year.
For 2018, we expect our non-GAAP tax rate on worldwide earnings to be approximately 21%. The reduction in the projected tax rate is primarily driven by the change in the U.S. corporate income tax rate under the US Tax Cuts and Jobs Act, partially offset by the net increase in the current tax of certain foreign earnings mandated by the Act.
Following the adoption of the US Tax Cuts and Jobs Act, we plan to repatriate approximately $3 billion. We expect the new territorial tax system to provide us lower cost access to nearly all of our global free cash flow on an ongoing basis.
We intend to use the repatriated cash to invest in the business, support value-enhancing M&A, and fund our return of capital to shareholders.
Our Board of Directors has approved a new $2 billion buyback authorization, including our intent to enter into a $750 million accelerated share repurchase agreement, and declared an 80% increase in our quarterly dividend to $0.18.
Our guidance for the quarter ending March 31, 2018 is as follows:
| • | Revenues will be approximately $1,050 million, plus or minus $30 million. |
| • | Non-GAAP gross margin will be approximately 58.0%, plus or minus 1%. |
| • | Non-GAAP operating expenses will be approximately $485 million, plus or minus $5 million. |
| • | Non-GAAP operating margin will be approximately 12% at the midpoint of revenue guidance. |
| • | Non-GAAP tax rate will be approximately 21%. |
| • | Non-GAAP net income per share will be approximately $0.25, plus or minus $0.03. This assumes a share count of approximately 360 million. |
The guidance above is provided under ASC 605. We will adopt ASC 606 in Q1’18 and we intend to provide an ASC 606 to 605 reconciliation when we report Q1 results.
Forward-Looking Statements
Statements in this CFO Commentary and related conference call concerning Juniper Networks’ business, economic and market outlook, including pricing pressure and product mix; factors that impact our gross margin; our long-term financial model and strategy; the architectural transition of our large customers and resulting impact on the timing of deployments; our product portfolio and success of particular products and product families; our expectations around obtaining revenue and margin growth; our plans to repatriate offshore cash and potential future uses of such cash; our expectations around lower cost access to our global free cash; the timing of deployments by our customers; trends in seasonality; our future financial and operating results, including our financial guidance; our areas of focus and our ability to deliver on growth, operational expense discipline, and shareholder returns; improvements to our cost structure and expense reductions and management; strength of certain of our customer segments; our capital structure; our capital return program, and our overall future prospects are forward looking statements within the meaning of the Private Securities Litigation Reform Act that involve a number of uncertainties and risks. Actual results or events could differ materially from those anticipated in those forward-looking statements as a result of several factors, including: general economic and political conditions globally or regionally; business and economic conditions in the networking industry; changes in overall technology spending by our customers and spending by communication service providers and major customers, including Cloud providers; the network capacity requirements of our customers and, in particular, cloud and telecommunication service providers; contractual terms that may result in the deferral of revenue; increases in and the effect of competition; the timing of orders and their fulfillment; manufacturing and supply chain constraints, changes or disruptions; availability of key product components; ability to establish and maintain relationships with distributors, resellers and other partners; variations in the expected mix of products sold; changes in customer mix; changes in geography mix; customer and industry analyst perceptions of Juniper Networks and its technology, products and future prospects; delays in scheduled product availability; market acceptance of Juniper Networks products and services; rapid technological and market change; adoption of regulations or standards affecting Juniper Networks products, services or the networking industry; the ability to successfully acquire, integrate and manage businesses and technologies; product defects, returns or vulnerabilities; the ability to recruit and retain key personnel; significant effects of tax legislation, including the Tax Cuts and Jobs Act, and judicial or administrative interpretation of tax regulations; currency fluctuations; litigation settlements and resolutions; the potential impact of activities related to the execution of capital return, restructurings and product rationalization; and other factors listed in Juniper Networks’ most recent report on Form 10-K or 10-Q filed with the Securities and Exchange Commission (”SEC”). Note that our estimates as to tax rate and the impact of the Tax Cuts and Jobs Act on our business are based on current tax law, including current interpretations of the Tax Cuts and Jobs Act and could be affected by changing interpretations of the Act, as well as additional legislation and guidance around the Act. All statements made in this CFO Commentary and related conference call are made only as of the date set forth at the beginning of this document. Juniper Networks undertakes no obligation to update the information made in this document or the related conference call in the event facts or circumstances subsequently change after the date of this document.
Use of Non-GAAP Financial Measures
This CFO Commentary contains references to the following non-GAAP financial measures: gross margin; product gross margin; service gross margin; product gross margin as a percentage of product revenue; service gross margin as a percentage of service revenue; gross margin as a percentage of revenue; research and development expense; sales and marketing expense; general and administrative expense; operating expense; operating expense as a percentage of revenue; operating income; operating margin; provision for income tax; income tax rate; net income; and diluted earnings per share. For important commentary on why Juniper Networks considers non-GAAP
information a useful view of the company’s financial results, please see the press release furnished with our Form 8-K filed today with the SEC. With respect to future financial guidance provided on a non-GAAP basis, we have excluded estimates for amortization of intangible assets, share-based compensation expenses, acquisition-related charges, restructuring charges, impairment charges, litigation settlement and resolution charges, gain or loss on equity investments, retroactive impact of certain tax settlements, non-recurring income tax adjustments, valuation allowance on deferred tax assets, and the income tax effect of non-GAAP exclusions, and do not include the impact of any future acquisitions, divestitures, or joint ventures that may occur in the quarter. These measures are not presented in accordance with, nor are they a substitute for U.S. generally accepted accounting principles or GAAP. In addition, these measures may be different from non-GAAP measures used by other companies, limiting their usefulness for comparison purposes. The non-GAAP financial measures used in this CFO Commentary should not be considered in isolation from measures of financial performance prepared in accordance with GAAP. Investors are cautioned that there are material limitations associated with the use of non-GAAP financial measures as an analytical tool. In particular, many of the adjustments to our GAAP financial measures reflect the exclusion of items that are recurring and will be reflected in our financial results for the foreseeable future.
A reconciliation of non-GAAP guidance measures to corresponding GAAP measures is not available on a forward-looking basis due to the high variability and low visibility with respect to the charges which are excluded from these non-GAAP measures. For example, share-based compensation expense is impacted by the Company’s future hiring needs, and restructuring actions, the type and volume of equity awards necessary for such future hiring, and the price at which the Company’s stock will trade in those future periods. Amortization of intangible assets is significantly impacted by the timing and size of any future acquisitions. The items that are being excluded are difficult to predict and a reconciliation could result in disclosure that would be imprecise or potentially misleading. Material changes to any one of these items could have a significant effect on our guidance and future GAAP results. Certain exclusions, such as amortization of intangible assets and share-based compensation expenses, are generally incurred each quarter, but the amounts have historically and may continue to vary significantly from quarter to quarter.
Juniper Networks, Inc.
Preliminary Supplemental Data
(in millions, except percentages)
(unaudited)
Deferred Revenue
| As of | ||||||||
| December 31, 2017 |
December 31, 2016 |
|||||||
| Deferred product revenue: |
||||||||
| Undelivered product commitments and other product deferrals |
$ | 312.6 | $ | 302.4 | ||||
| Distributor inventory and other sell-through items |
68.1 | 74.2 | ||||||
|
|
|
|
|
|||||
| Deferred gross product revenue |
380.7 | 376.6 | ||||||
| Deferred cost of product revenue |
(46.5 | ) | (53.7 | ) | ||||
|
|
|
|
|
|||||
| Deferred product revenue, net |
334.2 | 322.9 | ||||||
| Deferred service revenue |
1,205.1 | 1,158.2 | ||||||
|
|
|
|
|
|||||
| Total |
$ | 1,539.3 | $ | 1,481.1 | ||||
|
|
|
|
|
|||||
| Reported as: |
||||||||
| Current |
$ | 1,030.3 | $ | 1,032.0 | ||||
| Long-term |
509.0 | 449.1 | ||||||
|
|
|
|
|
|||||
| Total |
$ | 1,539.3 | $ | 1,481.1 | ||||
|
|
|
|
|
|||||
Vertical Reporting: Quarterly Revenue Trend
| 2015 | 2016 | 2017 | Q4’16 | Q1’17 | Q2’17 | Q3’17 | Q4’17 | Q/Q Change | Y/Y Change | |||||||||||||||||||||||||||||||||||||||
| Cloud |
$ | 1,021.2 | $ | 1,322.3 | $ | 1,314.9 | $ | 410.8 | $ | 331.6 | $ | 379.6 | $ | 344.9 | $ | 258.8 | $ | (86.1 | ) | (25 | )% | $ | (152.0 | ) | (37 | )% | ||||||||||||||||||||||
| Telecom/Cable |
2,417.1 | 2,324.7 | 2,315.7 | 636.2 | 568.5 | 562.4 | 576.9 | 607.9 | 31.0 | 5 | % | (28.3 | ) | (4 | )% | |||||||||||||||||||||||||||||||||
| Strategic Enterprise |
1,419.5 | 1,343.1 | 1,396.6 | 338.6 | 320.9 | 366.9 | 336.0 | 372.8 | 36.8 | 11 | % | 34.2 | 10 | % | ||||||||||||||||||||||||||||||||||
|
|
|
|
|
|
|
|
|
|
|
|
|
|
|
|
|
|
|
|
|
|
|
|
|
|||||||||||||||||||||||||
| Total revenue |
$ | 4,857.8 | $ | 4,990.1 | $ | 5,027.2 | $ | 1,385.6 | $ | 1,221.0 | $ | 1,308.9 | $ | 1,257.8 | $ | 1,239.5 | $ | (18.3 | ) | (1 | )% | $ | (146.1 | ) | (11 | )% | ||||||||||||||||||||||
|
|
|
|
|
|
|
|
|
|
|
|
|
|
|
|
|
|
|
|
|
|
|
|
|
|||||||||||||||||||||||||
Juniper Networks, Inc.
Preliminary Reconciliations between GAAP and non-GAAP Financial Measures
(in millions, except percentages and per share amounts)
(unaudited)
| Three Months Ended | Twelve Months Ended | |||||||||||||||||||
| December 31, 2017 |
September 30, 2017 |
December 31, 2016 |
December 31, 2017 |
December 31, 2016 |
||||||||||||||||
| GAAP gross margin - Product |
$ | 495.9 | $ | 533.7 | $ | 615.2 | $ | 2,085.3 | $ | 2,202.7 | ||||||||||
| GAAP product gross margin % of product revenue |
59.7 | % | 61.4 | % | 62.4 | % | 60.5 | % | 62.4 | % | ||||||||||
| Share-based compensation expense |
0.8 | 1.5 | 1.5 | 4.6 | 6.4 | |||||||||||||||
| Share-based payroll tax expense |
— | — | — | 0.2 | 0.3 | |||||||||||||||
| Amortization of purchased intangible assets |
3.8 | 3.1 | 2.1 | 13.1 | 11.6 | |||||||||||||||
| Acquisition-related and other charges |
— | — | — | — | 2.8 | |||||||||||||||
| Supplier component remediation (recovery) charges |
— | (1.0 | ) | 10.8 | 6.1 | 10.8 | ||||||||||||||
|
|
|
|
|
|
|
|
|
|
|
|||||||||||
| Non-GAAP gross margin - Product |
$ | 500.5 | $ | 537.3 | $ | 629.6 | $ | 2,109.3 | $ | 2,234.6 | ||||||||||
|
|
|
|
|
|
|
|
|
|
|
|||||||||||
| Non-GAAP product gross margin % of product revenue |
60.3 | % | 61.8 | % | 63.9 | % | 61.2 | % | 63.3 | % | ||||||||||
| GAAP gross margin - Service |
$ | 255.3 | $ | 238.7 | $ | 242.5 | $ | 986.8 | $ | 901.8 | ||||||||||
| GAAP service gross margin % of service revenue |
62.4 | % | 61.5 | % | 60.6 | % | 62.4 | % | 61.7 | % | ||||||||||
| Share-based compensation expense |
4.0 | 3.9 | 4.0 | 17.5 | 15.3 | |||||||||||||||
| Share-based payroll tax expense |
— | — | 0.1 | 1.0 | 0.9 | |||||||||||||||
|
|
|
|
|
|
|
|
|
|
|
|||||||||||
| Non-GAAP gross margin - Service |
$ | 259.3 | $ | 242.6 | $ | 246.6 | $ | 1,005.3 | $ | 918.0 | ||||||||||
|
|
|
|
|
|
|
|
|
|
|
|||||||||||
| Non-GAAP service gross margin % of service revenue |
63.4 | % | 62.5 | % | 61.7 | % | 63.6 | % | 62.8 | % | ||||||||||
| GAAP gross margin |
$ | 751.2 | $ | 772.4 | $ | 857.7 | $ | 3,072.1 | $ | 3,104.5 | ||||||||||
| GAAP gross margin % of revenue |
60.6 | % | 61.4 | % | 61.9 | % | 61.1 | % | 62.2 | % | ||||||||||
| Share-based compensation expense |
4.8 | 5.4 | 5.5 | 22.1 | 21.7 | |||||||||||||||
| Share-based payroll tax expense |
— | — | 0.1 | 1.2 | 1.2 | |||||||||||||||
| Amortization of purchased intangible assets |
3.8 | 3.1 | 2.1 | 13.1 | 11.6 | |||||||||||||||
| Acquisition-related and other charges |
— | — | — | — | 2.8 | |||||||||||||||
| Supplier component remediation (recovery) charges |
— | (1.0 | ) | 10.8 | 6.1 | 10.8 | ||||||||||||||
|
|
|
|
|
|
|
|
|
|
|
|||||||||||
| Non-GAAP gross margin |
$ | 759.8 | $ | 779.9 | $ | 876.2 | $ | 3,114.6 | $ | 3,152.6 | ||||||||||
|
|
|
|
|
|
|
|
|
|
|
|||||||||||
| Non-GAAP gross margin % of revenue |
61.3 | % | 62.0 | % | 63.2 | % | 62.0 | % | 63.2 | % | ||||||||||
| GAAP research and development expense |
$ | 227.9 | $ | 236.4 | $ | 263.0 | $ | 980.7 | $ | 1,013.7 | ||||||||||
| Share-based compensation expense |
(19.2 | ) | (18.5 | ) | (37.5 | ) | (86.6 | ) | (126.5 | ) | ||||||||||
| Share-based payroll tax expense |
(0.1 | ) | — | (0.1 | ) | (2.4 | ) | (2.2 | ) | |||||||||||
|
|
|
|
|
|
|
|
|
|
|
|||||||||||
| Non-GAAP research and development expense |
$ | 208.6 | $ | 217.9 | $ | 225.4 | $ | 891.7 | $ | 885.0 | ||||||||||
|
|
|
|
|
|
|
|
|
|
|
|||||||||||
| GAAP sales and marketing expense |
$ | 233.6 | $ | 232.5 | $ | 254.5 | $ | 950.2 | $ | 972.9 | ||||||||||
| Share-based compensation expense |
(10.3 | ) | (13.7 | ) | (14.5 | ) | (55.6 | ) | (55.2 | ) | ||||||||||
| Share-based payroll tax expense |
(0.1 | ) | (0.2 | ) | (0.1 | ) | (2.3 | ) | (2.1 | ) | ||||||||||
| Amortization of purchased intangible assets |
(0.9 | ) | (0.9 | ) | (0.7 | ) | (3.6 | ) | (2.8 | ) | ||||||||||
|
|
|
|
|
|
|
|
|
|
|
|||||||||||
| Non-GAAP sales and marketing expense |
$ | 222.3 | $ | 217.7 | $ | 239.2 | $ | 888.7 | $ | 912.8 | ||||||||||
|
|
|
|
|
|
|
|
|
|
|
|||||||||||
| GAAP general and administrative expense |
$ | 50.8 | $ | 70.6 | $ | 52.9 | $ | 227.5 | $ | 224.9 | ||||||||||
| Share-based compensation expense |
(2.1 | ) | (7.4 | ) | (6.3 | ) | (23.2 | ) | (23.4 | ) | ||||||||||
| Share-based payroll tax expense |
— | (0.1 | ) | — | (0.7 | ) | (0.3 | ) | ||||||||||||
| Amortization of purchased intangible assets |
(0.2 | ) | (0.1 | ) | (0.5 | ) | (0.8 | ) | (1.8 | ) | ||||||||||
| Acquisition-related and other charges |
(0.4 | ) | (1.4 | ) | (1.1 | ) | (2.1 | ) | (11.7 | ) | ||||||||||
| Litigation settlement charges |
— | (13.2 | ) | — | (13.2 | ) | — | |||||||||||||
|
|
|
|
|
|
|
|
|
|
|
|||||||||||
| Non-GAAP general and administrative expense |
$ | 48.1 | $ | 48.4 | $ | 45.0 | $ | 187.5 | $ | 187.7 | ||||||||||
|
|
|
|
|
|
|
|
|
|
|
|||||||||||
Juniper Networks, Inc.
Preliminary Reconciliations between GAAP and non-GAAP Financial Measures
(in millions, except percentages and per share amounts)
(unaudited)
| Three Months Ended | Twelve Months Ended | |||||||||||||||||||
| December 31, 2017 |
September 30, 2017 |
December 31, 2016 |
December 31, 2017 |
December 31, 2016 |
||||||||||||||||
| GAAP operating expenses |
$ | 548.5 | $ | 541.5 | $ | 570.5 | $ | 2,224.0 | $ | 2,214.8 | ||||||||||
| GAAP operating expenses % of revenue |
44.3 | % | 43.1 | % | 41.2 | % | 44.2 | % | 44.4 | % | ||||||||||
| Share-based compensation expense |
(31.6 | ) | (39.6 | ) | (58.3 | ) | (165.4 | ) | (205.1 | ) | ||||||||||
| Share-based payroll tax expense |
(0.2 | ) | (0.3 | ) | (0.2 | ) | (5.4 | ) | (4.6 | ) | ||||||||||
| Amortization of purchased intangible assets |
(1.1 | ) | (1.0 | ) | (1.2 | ) | (4.4 | ) | (4.6 | ) | ||||||||||
| Restructuring charges |
(36.2 | ) | (2.0 | ) | (0.1 | ) | (65.6 | ) | (3.3 | ) | ||||||||||
| Acquisition-related and other charges |
(0.4 | ) | (1.4 | ) | (1.1 | ) | (2.1 | ) | (11.7 | ) | ||||||||||
| Litigation settlement charges |
— | (13.2 | ) | — | (13.2 | ) | — | |||||||||||||
|
|
|
|
|
|
|
|
|
|
|
|||||||||||
| Non-GAAP operating expenses |
$ | 479.0 | $ | 484.0 | $ | 509.6 | $ | 1,967.9 | $ | 1,985.5 | ||||||||||
|
|
|
|
|
|
|
|
|
|
|
|||||||||||
| Non-GAAP operating expenses % of revenue |
38.6 | % | 38.5 | % | 36.8 | % | 39.1 | % | 39.8 | % | ||||||||||
| GAAP operating income |
$ | 202.7 | $ | 230.9 | $ | 287.2 | $ | 848.1 | $ | 889.7 | ||||||||||
| GAAP operating margin |
16.4 | % | 18.4 | % | 20.7 | % | 16.9 | % | 17.8 | % | ||||||||||
| Share-based compensation expense |
36.4 | 45.0 | 63.8 | 187.5 | 226.8 | |||||||||||||||
| Share-based payroll tax expense |
0.2 | 0.3 | 0.3 | 6.6 | 5.8 | |||||||||||||||
| Amortization of purchased intangible assets |
4.9 | 4.1 | 3.3 | 17.5 | 16.2 | |||||||||||||||
| Restructuring charges |
36.2 | 2.0 | 0.1 | 65.6 | 3.3 | |||||||||||||||
| Acquisition-related and other charges |
0.4 | 1.4 | 1.1 | 2.1 | 14.5 | |||||||||||||||
| Litigation settlement charges |
— | 13.2 | — | 13.2 | — | |||||||||||||||
| Supplier component remediation (recovery) charges |
— | (1.0 | ) | 10.8 | 6.1 | 10.8 | ||||||||||||||
|
|
|
|
|
|
|
|
|
|
|
|||||||||||
| Non-GAAP operating income |
$ | 280.8 | $ | 295.9 | $ | 366.6 | $ | 1,146.7 | $ | 1,167.1 | ||||||||||
|
|
|
|
|
|
|
|
|
|
|
|||||||||||
| Non-GAAP operating margin |
22.7 | % | 23.5 | % | 26.5 | % | 22.8 | % | 23.4 | % | ||||||||||
| GAAP income tax provision |
$ | 348.3 | $ | 60.1 | $ | 83.2 | $ | 505.6 | $ | 234.7 | ||||||||||
| GAAP income tax rate |
174.0 | % | 26.6 | % | 30.6 | % | 62.3 | % | 28.4 | % | ||||||||||
| Estimated tax expense from income tax reform |
(289.5 | ) | — | — | (289.5 | ) | — | |||||||||||||
| Income tax effect of non-GAAP exclusions |
12.3 | 16.0 | 15.6 | 73.9 | 61.0 | |||||||||||||||
|
|
|
|
|
|
|
|
|
|
|
|||||||||||
| Non-GAAP provision for income tax |
$ | 71.1 | $ | 76.1 | $ | 98.8 | $ | 290.0 | $ | 295.7 | ||||||||||
|
|
|
|
|
|
|
|
|
|
|
|||||||||||
| Non-GAAP income tax rate |
26.3 | % | 26.5 | % | 28.0 | % | 26.4 | % | 26.7 | % | ||||||||||
| GAAP net (loss) income |
$ | (148.1 | ) | $ | 165.7 | $ | 188.9 | $ | 306.2 | $ | 592.7 | |||||||||
| Share-based compensation expense |
36.4 | 45.0 | 63.8 | 187.5 | 226.8 | |||||||||||||||
| Share-based payroll tax expense |
0.2 | 0.3 | 0.3 | 6.6 | 5.8 | |||||||||||||||
| Amortization of purchased intangible assets |
4.9 | 4.1 | 3.3 | 17.5 | 16.2 | |||||||||||||||
| Restructuring charges |
36.2 | 2.0 | 0.1 | 65.6 | 3.3 | |||||||||||||||
| Acquisition-related and other charges |
0.4 | 1.4 | 1.1 | 2.1 | 11.8 | |||||||||||||||
| Litigation settlement charges |
— | 13.2 | — | 13.2 | — | |||||||||||||||
| Supplier component remediation (recovery) charges |
— | (1.0 | ) | 10.8 | 6.1 | 10.8 | ||||||||||||||
| (Gain) loss on equity investments |
(7.8 | ) | (3.6 | ) | 1.6 | (11.4 | ) | 3.7 | ||||||||||||
| Estimated tax expense from income tax reform |
289.5 | — | — | 289.5 | — | |||||||||||||||
| Income tax effect of non-GAAP exclusions |
(12.3 | ) | (16.0 | ) | (15.6 | ) | (73.9 | ) | (61.0 | ) | ||||||||||
|
|
|
|
|
|
|
|
|
|
|
|||||||||||
| Non-GAAP net income |
$ | 199.4 | $ | 211.1 | $ | 254.3 | $ | 809.0 | $ | 810.1 | ||||||||||
|
|
|
|
|
|
|
|
|
|
|
|||||||||||
Juniper Networks, Inc.
Preliminary Reconciliations between GAAP and non-GAAP Financial Measures
(in millions, except percentages and per share amounts)
(unaudited)
| Three Months Ended | Twelve Months Ended | |||||||||||||||||||
| December 31, 2017 |
September 30, 2017 |
December 31, 2016 |
December 31, 2017 |
December 31, 2016 |
||||||||||||||||
| GAAP diluted net (loss) income per share |
$ | (0.40 | ) | $ | 0.43 | $ | 0.49 | $ | 0.80 | $ | 1.53 | |||||||||
|
|
|
|
|
|
|
|
|
|
|
|||||||||||
| Non-GAAP diluted net income per share |
$ | 0.53 | $ | 0.55 | $ | 0.66 | $ | 2.11 | $ | 2.09 | ||||||||||
|
|
|
|
|
|
|
|
|
|
|
|||||||||||
| Shares used in computing GAAP diluted net (loss) income per share |
371.5 | 382.7 | 385.6 | 384.2 | 387.8 | |||||||||||||||
|
|
|
|
|
|
|
|
|
|
|
|||||||||||
| Shares used in computing Non-GAAP diluted net income per share |
376.6 | 382.7 | 385.6 | 384.2 | 387.8 | |||||||||||||||
|
|
|
|
|
|
|
|
|
|
|
|||||||||||