Attached files
| file | filename |
|---|---|
| EX-99.1 - NEWS RELEASE - ASHLAND GLOBAL HOLDINGS INC | ex99-1.htm |
| 8-K - ASHLAND GLOBAL HOLDINGS INC | form8k.htm |
EXHIBIT 99.2

First-Quarter Fiscal 2018 Earnings January 29, 2018 / efficacy usability allure integrity profitability

Forward-Looking StatementsThis presentation contains forward-looking statements within the meaning of Section 27A of the Securities Act of 1933, as amended and Section 21E of the Securities Exchange Act of 1934, as amended. Ashland has identified some of these forward-looking statements with words such as “anticipates,” “believes,” “expects,” “estimates,” “is likely,” “predicts,” “projects,” “forecasts,” “objectives,” “may,” “will,” “should,” “plans” and “intends” and the negative of these words or other comparable terminology. Ashland may from time to time make forward-looking statements in its annual reports, quarterly reports and other filings with the SEC, news releases and other written and oral communications. These forward-looking statements are based on Ashland’s expectations and assumptions, as of the date such statements are made, regarding Ashland’s future operating performance and financial condition, as well as the economy and other future events or circumstances. Ashland’s expectations and assumptions include, without limitation, internal forecasts and analyses of current and future market conditions and trends, management plans and strategies, operating efficiencies and economic conditions (such as prices, supply and demand, cost of raw materials, and the ability to recover raw-material cost increases through price increases), and risks and uncertainties associated with the following: the impact of acquisitions and/or divestitures Ashland has made or may make, including the acquisition of Pharmachem (including the possibility that Ashland may not realize the anticipated benefits from such transactions); Ashland’s substantial indebtedness (including the possibility that such indebtedness and related restrictive covenants may adversely affect Ashland’s future cash flows, results of operations, financial condition and its ability to repay debt); the potential that Ashland does not realize all of the expected benefits of the separation of its Valvoline business; the potential that the Tax Cuts and Jobs Act enacted on December 22, 2017 will have a negative impact on Ashland’s financial results, and severe weather, natural disasters, cyber events and legal proceedings and claims (including product recalls, environmental and asbestos matters). Various risks and uncertainties may cause actual results to differ materially from those stated, projected or implied by any forward-looking statements, including, without limitation, risks and uncertainties affecting Ashland that are described in Ashland’s most recent Form 10-K (including Item 1A Risk Factors) filed with the SEC, which is available on Ashland’s website at http://investor.ashland.com or on the SEC’s website at http://www.sec.gov. Ashland believes its expectations and assumptions are reasonable, but there can be no assurance that the expectations reflected herein will be achieved. Unless legally required, Ashland undertakes no obligation to update any forward-looking statements made in this presentation whether as a result of new information, future events or otherwise. Information on Ashland’s website is not incorporated into or a part of this presentation.Regulation G: Adjusted ResultsThe information presented herein regarding certain unaudited adjusted results does not conform to generally accepted accounting principles in the United States (U.S. GAAP) and should not be construed as an alternative to the reported results determined in accordance with U.S. GAAP. Ashland has included this non-GAAP information to assist in understanding the operating performance of the company and its reportable segments. The non-GAAP information provided may not be consistent with the methodologies used by other companies. All non-GAAP information related to previous Ashland filings with the SEC has been reconciled with reported U.S. GAAP results. Although Ashland provides forward-looking guidance for adjusted EBITDA, adjusted EPS and free cash flow, Ashland is not reaffirming or providing forward-looking guidance for U.S. GAAP-reported financial measures or a reconciliation of forward-looking non-GAAP financial measures to the most directly comparable U.S. GAAP measure because it is unable to predict with reasonable certainty the ultimate outcome of certain significant items without unreasonable effort. 2

First Quarter Summary

Ashland Global Holdings Inc.Adjusted Results Summary1 4 HighlightsSales up 20% including 9 ppts from acquisitions/divestitures and 3 ppts from currencyReported net loss of $4 million; loss from continuing operations of $7 million or $0.12 per diluted shareEBITDA increased to $136 millionEPS equaled $0.42 (includes ~$0.04 negative impact from change in the tax rate)Excl. intangible amortization, adjusted EPS would have been $0.71Key DriversAll three reportable segments show organic year-over-year (YOY) improvements in sales and EBITDASG&A growth driven largely by the impact of acquisition/divestiture and currency18% effective tax rate driven primarily by new US corporate tax legislation Ashland’s earnings release dated January 29, 2018, available on Ashland’s website at http://investor.ashland.com, reconciles adjusted amounts to amounts reported under GAAP. Includes approximately 1 million of diluted shares for both periods that were excluded from the U.S. GAAP EPS calculation since there was a loss from continuing operations.
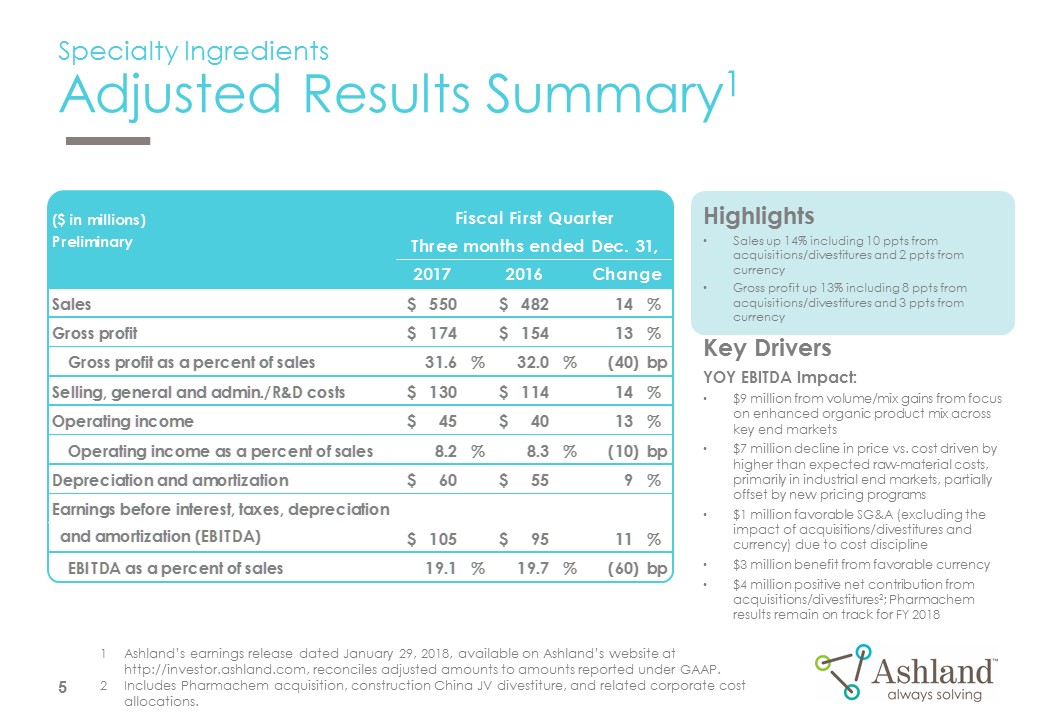
Specialty IngredientsAdjusted Results Summary1 HighlightsSales up 14% including 10 ppts from acquisitions/divestitures and 2 ppts from currencyGross profit up 13% including 8 ppts from acquisitions/divestitures and 3 ppts from currencyKey DriversYOY EBITDA Impact:$9 million from volume/mix gains from focus on enhanced organic product mix across key end markets$7 million decline in price vs. cost driven by higher than expected raw-material costs, primarily in industrial end markets, partially offset by new pricing programs$1 million favorable SG&A (excluding the impact of acquisitions/divestitures and currency) due to cost discipline$3 million benefit from favorable currency$4 million positive net contribution from acquisitions/divestitures2; Pharmachem results remain on track for FY 2018 5 Ashland’s earnings release dated January 29, 2018, available on Ashland’s website at http://investor.ashland.com, reconciles adjusted amounts to amounts reported under GAAP. Includes Pharmachem acquisition, construction China JV divestiture, and related corporate cost allocations.

Specialty IngredientsSales Trends by End Market 6 End Market CommentaryBroad-based growth across end markets driven by targeted product mix enhancementsStrong growth in Personal Care biofunctional ingredientsNew capacity enables robust volumes in key Pharma cellulosic excipientsAdhesives sales flat but increased pricingCoatings growth led by key customer wins and favorable order patternsSeasonally slow quarter for PharmachemGrowth in Nutrition & Other driven by focused asset utilization initiativesCurrency contributed 2 percentage points to sales growth2 Performance SpecialtiesAverage USD / EUR of $1.18 in current quarter compared to $1.08 in prior-year period.

CompositesAdjusted Results Summary1 Ashland‘s earnings release dated January 29, 2018, available on Ashland's website at http://investor.ashland.com, reconciles adjusted amounts to amounts reported under GAAP. 7 HighlightsSales up 32% including 10 ppts from acquisitions and 4 ppts from currencyEBITDA up 10%Key Drivers$4 million of EBITDA growth from volume, mix and margin driven by strong growth in all key end markets, particularly in North America and EuropeContinued pricing discipline through focus on commercial excellence and value selling$4 million unfavorable SG&A due to reallocation of corporate costs
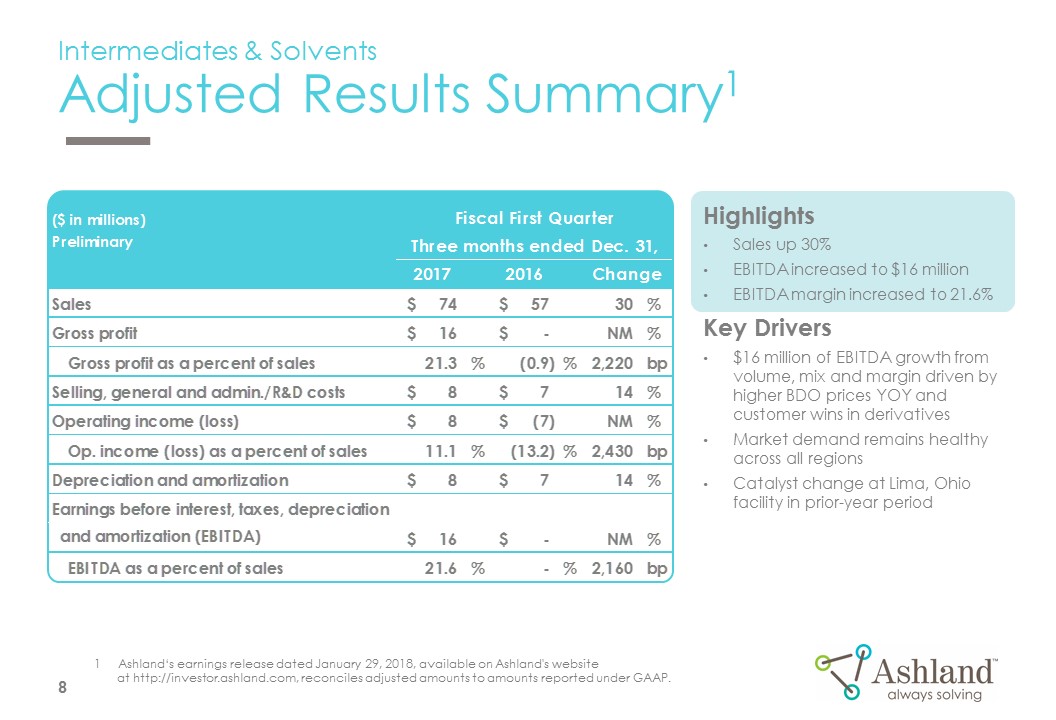
Intermediates & SolventsAdjusted Results Summary1 Ashland‘s earnings release dated January 29, 2018, available on Ashland's website at http://investor.ashland.com, reconciles adjusted amounts to amounts reported under GAAP. 8 HighlightsSales up 30%EBITDA increased to $16 millionEBITDA margin increased to 21.6%Key Drivers$16 million of EBITDA growth from volume, mix and margin driven by higher BDO prices YOY and customer wins in derivativesMarket demand remains healthy across all regionsCatalyst change at Lima, Ohio facility in prior-year period

Outlook Summary

Ashland Global Holdings Inc.Impact of New Tax Law HighlightsReset FY 2018 book effective tax rate (ETR) to a range of 16 – 20%FY 2018 Adjusted EPS outlook based on 18% rateCash tax rate (CTR) expected to be in the current range of 20 – 25%Cash cost of ~$160 million for mandatory repatriation; offset by lower deferred tax liabilities of ~$126 millionFY 2018 targeted cash repatriation of ~$500 million, of which ~$300 million used for debt reduction thus far in fiscal-second quarter 2018Additional InformationLower US corporate tax rate effective for Ashland in FY 2018Other key provisions do not apply until FY 2019 (e.g., interest expense disallowance, 100% expensing of certain capital expenditures, and new international tax rules)Lower US corporate tax rate increases Ashland’s ETR as a result of the reduction to the ETR benefit of our US book lossTransition to territorial tax system will “unlock” our foreign cash going forwardWe plan to provide an update on additional impacts to FY 2019 ETR and CTR later in the year 10

Ashland Global Holdings Inc.Fiscal Year 2018 Outlook 11 Definition of free cash flow: operating cash flow less capital expenditures and other items Ashland has deemed non-operational (if applicable). HighlightsReaffirm all operating segment Adjusted EBITDA outlooksReaffirm FY free cash flow outlook1Update FY Adj. EPS range by $0.30 due to tax rate change
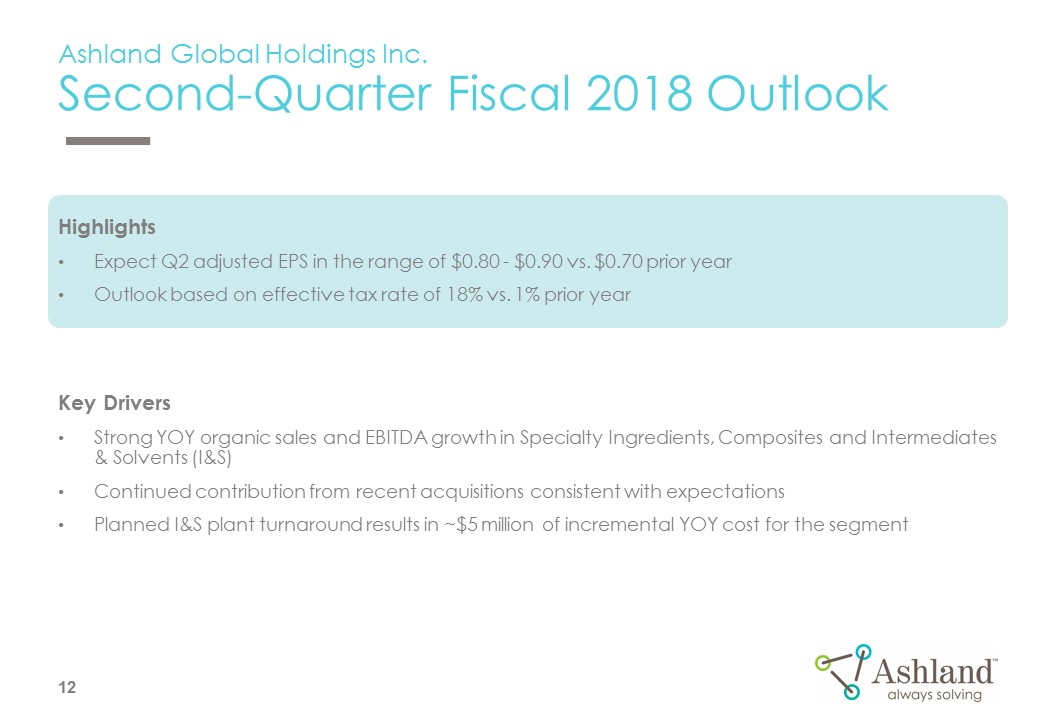
HighlightsExpect Q2 adjusted EPS in the range of $0.80 - $0.90 vs. $0.70 prior yearOutlook based on effective tax rate of 18% vs. 1% prior yearKey DriversStrong YOY organic sales and EBITDA growth in Specialty Ingredients, Composites and Intermediates & Solvents (I&S)Continued contribution from recent acquisitions consistent with expectationsPlanned I&S plant turnaround results in ~$5 million of incremental YOY cost for the segment Ashland Global Holdings Inc.Second-Quarter Fiscal 2018 Outlook 12

Appendix A: Key Items and Balance Sheet
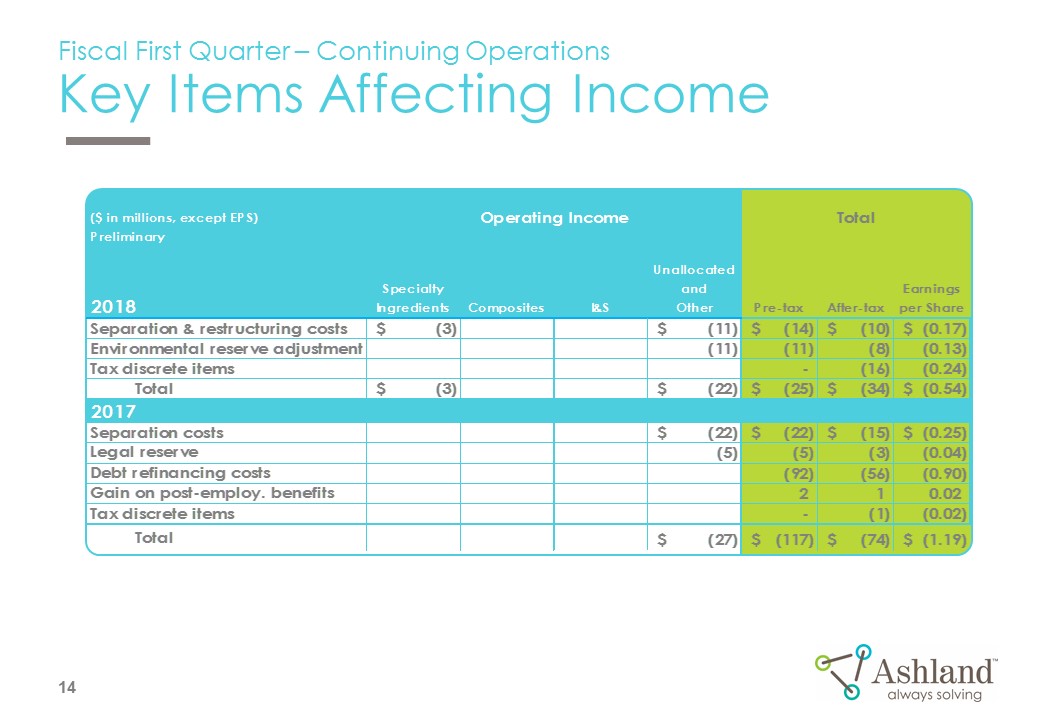
Fiscal First Quarter – Continuing OperationsKey Items Affecting Income 14

Liquidity and Net Debt ($ in millions) 15

Appendix B: Business Profiles 12 Months Ended December 31, 2017

Corporate Profile By business unit By geography 1 For 12 months ended December 31, 2017.2 Ashland includes only U.S. and Canada in its North America designation. North America240% Asia Pacific18% LatinAmerica/Other - 9% Europe 33% SpecialtyIngredients67% Intermediates and Solvents8% Composites25% Sales1 - $3.4 Billion 17

Corporate Profile For 12 months ended December 31, 2017. See Appendix C for reconciliation to amounts reported under GAAP. NYSE Ticker Symbol: ASH Total Employees: ~6,500 Outside North America ~50% Number of Countries in Which Ashland Has Sales: More than 100 SpecialtyIngredients79% Intermediates and Solvents7% Adjusted EBITDA1 - $597 Million 18

Specialty Ingredients Salesby Market2 For 12 Months Ended December 31, 2017Sales: $2.3 billionAdjusted EBITDA: $504 million1Adjusted EBITDA Margin: 22.1%1 Salesby Product Cellulosics 35% PVP17% Adhesives 15% North America 40% AsiaPacific 19% Europe 31% Latin America/Other – 10% Actives – 6% Vinyl Ethers6% Salesby Geography3 19 A global leader of cellulose ethers, vinyl pyrrolidones and biofunctionals Pharmachem3 7% Pharmachem3 7% 1 See Appendix C for reconciliation to amounts reported under GAAP.2 Within the Sales by Market chart above, Industrial Specialties are presented in green and Consumer Specialties are presented in blue.3 Includes Pharmachem’s sales for the period May 17, 2017 through December 31, 2017, the period for which Pharmachem was owned.
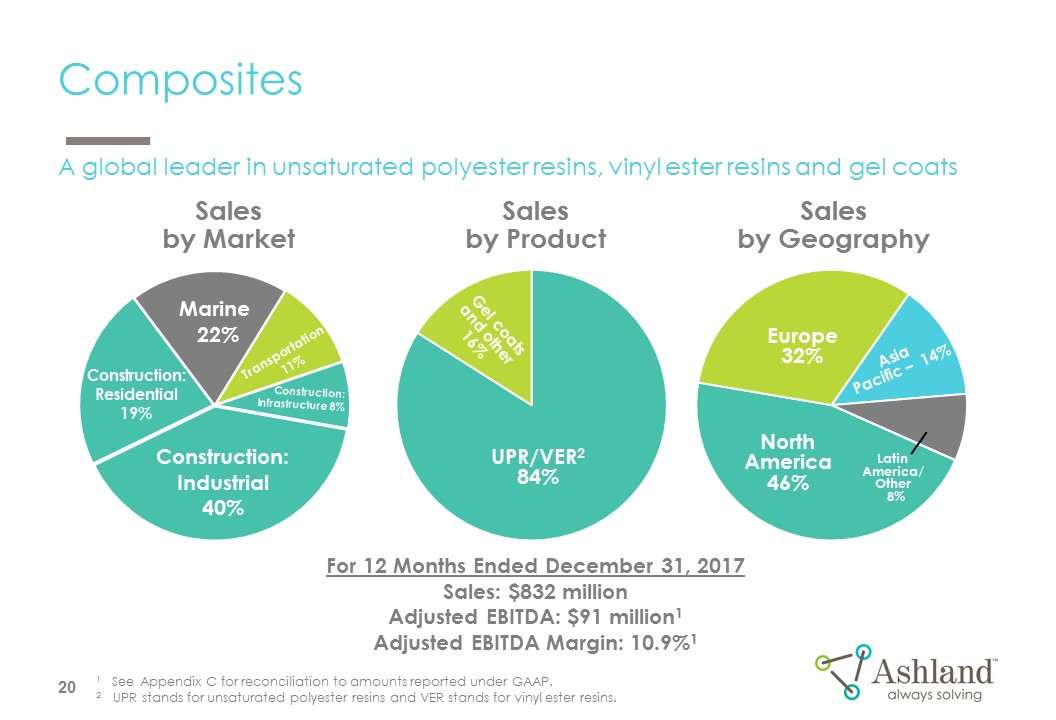
Composites Salesby Geography For 12 Months Ended December 31, 2017Sales: $832 millionAdjusted EBITDA: $91 million1Adjusted EBITDA Margin: 10.9%1 Salesby Product UPR/VER284% Gel coats and other16% Construction: Residential19% Marine 22% Construction:Industrial40% Salesby Market North America46% Asia Pacific – 14% Europe32% Latin America/Other 8% Transportation 11% Construction: Infrastructure 8% 1 See Appendix C for reconciliation to amounts reported under GAAP.2 UPR stands for unsaturated polyester resins and VER stands for vinyl ester resins. 20 A global leader in unsaturated polyester resins, vinyl ester resins and gel coats

Intermediates and Solvents Salesby Geography For 12 Months Ended December 31, 2017Sales: $283 millionAdjusted EBITDA: $41 million1Adjusted EBITDA Margin: 14.5%1 Salesby Product Butanediol39% Derivatives61% GeneralIndustrial 27% Plastics/Polymers32% Salesby Application North America 22% Asia Pacific 18% Europe 57% Latin America/Other 3% 1 See Appendix C for reconciliation to amounts reported under GAAP. 21 A global leader in butanediol and related derivatives Pharma 16% Agriculture7%
Appendix C: Non-GAAP Reconciliation1 Although Ashland provides forward looking guidance for adjusted EBITDA in this presentation, Ashland is not reaffirming or providing forward-looking guidance for U.S. GAAP reported financial measures or a reconciliation of forward-looking non-GAAP financial measures to the most directly comparable U.S. GAAP measure because it is unable to predict with reasonable certainty the ultimate outcome of certain significant items without unreasonable effort.

Ashland Global Holdings Inc. and Consolidated SubsidiariesReconciliation of Non-GAAP Data for 12 Months Ended December 31, 2017 North America2__% Asia Pacific__% LatinAmerica/Other - _% Europe __% AshlandSpecialtyIngredients__% AshlandPerformanceMaterials__% Valvoline__% 1 Quarterly totals may not sum to actual results due to quarterly rounding conventions. Calculation of adjusted EBITDA for each quarter has been reconciled within certain financial filings with the SEC and posted on Ashland's website for each reportable segment. 23

® Registered trademark, Ashland or its subsidiaries, registered in various countries™ Trademark, Ashland or its subsidiaries, registered in various countries