Attached files
| file | filename |
|---|---|
| EX-99.1 - EXHIBIT 99.1 - IBERIABANK CORP | earningsreleaseq42017docum.htm |
| 8-K - 8-K - IBERIABANK CORP | earningsreleaseq42017cover.htm |

4Q17 Earnings
Presentation
J a n u a r y 2 5 , 2 0 1 8
Exhibit 99.2
2
Safe Harbor
To the extent that statements in this PowerPoint presentation relate to future plans, objectives, financial results or performance of IBERIABANK Corporation,
these statements are deemed to be forward-looking statements within the meaning of the Private Securities Litigation Reform Act of 1995. Such statements,
which are based onmanagement’s current information, estimates and assumptions and the current economic environment, are generally identified by the use
of the words “plan”, “believe”, “expect”, “intend”, “anticipate”, “estimate”, “project” or similar expressions. The Company’s actual strategies, results and
financial condition in future periods may differ materially from those currently expected due to various risks and uncertainties. Forward-looking statements
are subject to numerous assumptions, risks and uncertainties that change over time and could cause actual results or financial condition to differ materially
from those expressed in or implied by such statements. Consequently, no forward-looking statement can be guaranteed. Except to the extent required by
applicable law or regulation, the Company undertakes no obligation to revise or update publicly any forward-looking statement for any reason.
This PowerPoint presentation supplements information contained in the Company’s earnings release dated January 25, 2018, and should be read in
conjunction therewith. The earnings release may be accessed on the Company’s web site, www.iberiabank.com, under “Investor Relations” and then
“Financial Information” and then “Press Releases.”
Non-GAAP Financial Measures
This PowerPoint presentation contains financial information determined by methods other than in accordance with GAAP. The Company’s management uses
core non-GAAP financial metrics (“Core”) in their analysis of the Company’s performance to identify core revenues and expenses in a period that directly drive
operating net income in that period. These Core measures typically adjust GAAP performance measures to exclude the effects of the amortization of
intangibles and include the tax benefits associated with revenue items that are tax-exempt, as well as adjust income available to common shareholders for
certain significant activities or transactions that in management’s opinion can distort period-to-period comparisons of the Company’s performance. Reference
is made to “Non-GAAP Financial Measures” and “Caution About Forward Looking Statements” in the earnings release which also apply to certain disclosures in
this PowerPoint presentation.
IMPORTANT ADDITIONAL INFORMATION AND WHERE TO FIND IT
This communication is being made in respect of the proposed merger transaction involving IBERIABANK Corporation (“IBKC”), IBERIABANK and Gibraltar
Private Bank & Trust Company (“Gibraltar”). In connection with the proposed merger, IBKC filed a registration statement on Form S-4 (Registration No. 333-
222200) with the Securities and Exchange Commission (the “SEC”), which included a preliminary proxy statement of Gibraltar and a preliminary prospectus of
IBKC. The Form S-4, as amended, was declared effective by the SEC on January 19, 2018 and the definitive Proxy Statement/Prospectus was first mailed to
stockholders of Gibraltar on or about January 22, 2018. This communication does not constitute an offer to sell or the solicitation of an offer to buy any
securities or a solicitation of any vote or approval. Before making any voting or investment decision, investors and securityholders of Gibraltar are urged to
carefully read the entire registration statement and Proxy Statement/Prospectus regarding the merger and any other relevant documents filed with the
SEC, as well as any amendments or supplements to these documents, because they do and will contain important information about the proposed
transaction.
A copy of the definitive Proxy Statement/Prospectus is, and other filings containing information about IBKC and Gibraltar will be, available without charge at
the SEC’s website at http://www.sec.gov. Alternatively, these documents can be obtained without charge from IBKC’s website at http://www.iberiabank.com.
Safe Harbor And Non-GAAP Financial Measures
3
IBERIABANK –Corporate Profile
Our Franchise Corporate Snapshot
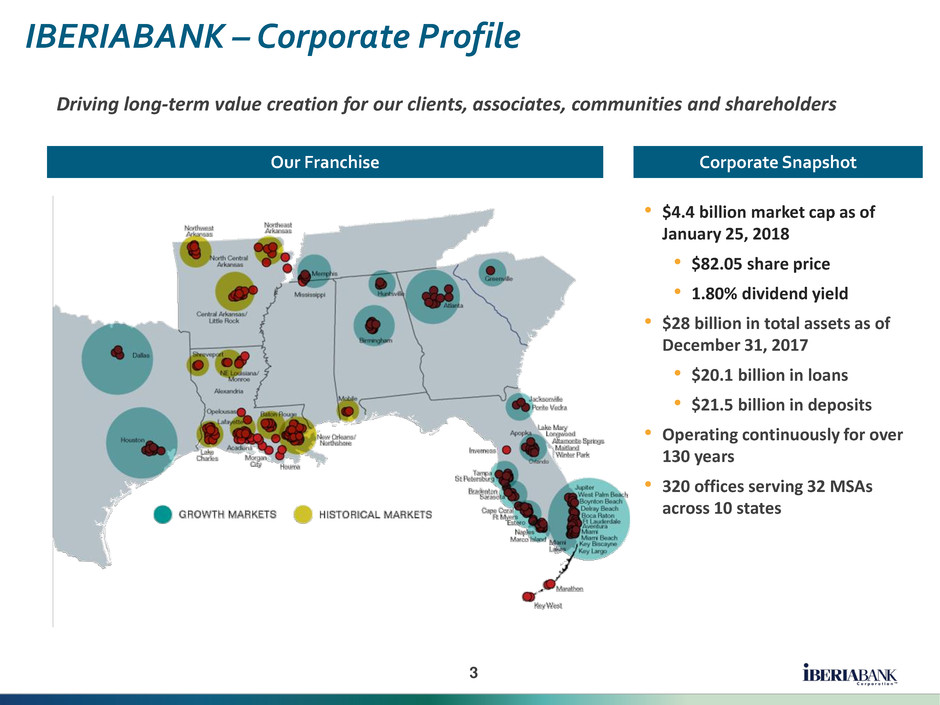
• $4.4 billion market cap as of
January 25, 2018
• $82.05 share price
• 1.80% dividend yield
• $28 billion in total assets as of
December 31, 2017
• $20.1 billion in loans
• $21.5 billion in deposits
• Operating continuously for over
130 years
• 320 offices serving 32 MSAs
across 10 states
Driving long-term value creation for our clients, associates, communities and shareholders

4
Our Focus
IBERIABANK –Corporate Profile
• Relationship-driven commercial and
private banking business
• Market-centric, people-driven approach in
attractive Southeastern markets
• Building long-term A-list client
relationships through service and care
• “Branch-lite” delivery model with focus on
operating efficiency
• Diversification across asset classes,
business lines and geographies
• Provide exceptional value-based client
services
• Great place to work
• Growth that is consistent with high
performance
• Shareholder-focused
• Strong sense of community
Mission Statement
Driving long-term value creation for our clients, associates, communities and shareholders

5
Quarterly Summary 4Q17
Fourth Quarter Highlights:
• Asset-sensitivity materializing with 5 bps increase in reported NIM to 3.69%
• Driving operating leverage with 260 bps improvement in core tangible efficiency
ratio
• Completed Sabadell core systems and branch conversion in October 2017
• Strong asset quality and further reduction to energy portfolio
• Loan and deposit growth in-line with guidance
• One time non-core items primarily driven by a provisional $51 million income tax
expense, or $0.94 per share, related to the revaluation of deferred tax assets in
4Q17
Key Metrics for 4Q17
GAAP
3Q17
GAAP
4Q17
Non-
GAAP
Core 3Q17
Non-
GAAP
Core 4Q17
Earnings Per Common Share $0.49 $0.17 $1.00 $1.33
Return On Average Assets 0.45% 0.15% 0.87% 1.03%
Return on Average Common Equity 2.92% 1.02% 5.99% 7.92%
Return on Tangible Common Equity (TE) -- -- 8.95% 12.73%
Tangible Efficiency Ratio (TE) -- -- 58.20% 55.60%

6
4Q17 Performance vs October 19, 2017 Guidance
Note:
• Provision miss to guidance driven by one credit
• Reported tax rate of 88.8% due to impact of new tax legislation as compared to 32.9% core
tax rate shown above
a
a
r
a
a
a
a
a
a
a
4Q Guidance Result
Consolidated Loan Growth Rate % 6% - 9% Annualized ~6%
Consolidated Deposit Growth Rate % 2% - 4% Annualized ~2%
Provision Expense $8.5MM - $10MM ~$14 MM
Non-Interest Income $52MM - $55MM ~$55 MM
Non-Interest Expense (Core Basis) $168MM - $174MM ~$168 MM
Tax Rate (Core Basis) 33.0% - 33.5% 32.9%
Net Interest Margin 3.55% - 3.60% 3.69%
Merger Related Charges $10MM - $12MM ~$11 MM
Branch Closing Expenses $2MM - $3MM ~$3 MM
Credit Quality Continued Improvement NPAs Flat/NCOs Down
Impact of Future Fed Funds Rate Movement ~4 cent quarterly impact for every 25 bps

7
GAAP EPS
Profitability Trends
Core EPS
Return on Average Assets Return on Common Equity

8
Client Growth
• Total period-end loan growth of $283 million, or 6%
annualized rate
• Loan growth was strongest in New Orleans, Atlanta, and
Tampa markets
• Energy loans are now 3% of total loans
Loan Highlights
Deposits – Period-End GrowthLoans – Period-End Growth
Deposit Highlights
• Period-end total deposits increased $132 million, or 2%
annualized rate
• Non-interest bearing deposits increased $246 million, or
4% annualized, on a period-end basis, and were 29% of
total deposits
• Time deposits decreased $270 million, or 10%, on a linked
quarter

9
• Continued margin expansion and remain asset
sensitive
• Yield on earning assets of 4.22% up 8 bps from
3Q17 while cost of interest bearing liabilities of
0.76% up only 4 bps from 3Q17
• Estimated impact of the next 25 basis point increase
in the Federal Funds Rate would equate to a $0.04
increase in quarterly EPS
Revenues – Net Interest Income
HighlightsNet Interest Income and Margins
Dollars in millions
12-Month Net Interest Income Scenarios

10
• GAAP and core non-interest income
increased by $2 million and $1 million, or
3% and 2%, respectively
• Growth primarily led by treasury
management, trust income and COLI
deferred income
• Offset by mortgage income decline of $2.4
million, or 15% vs prior quarter:
• Loan originations down 13% to $435
million in 4Q17
• Sales volume of $439 million (down
11% versus 3Q17)
Revenues –Non-Interest Income
HighlightsComponents of Non-Interest Income

11
Non-Interest Expense
HighlightsComponents of Core Non-Interest Expense
• Total non-interest expense for the quarter
decreased $18.6 million, or 9%, to $184.4
million
• Core non-interest expenses increased $4.2
million, or 3%, to $167.9 million
• On a core basis, salaries and benefits
expense increased $5.2 million, or 5%, and
included:
• Increased regular compensation
expense of $2.5 million, reflecting full
quarter impact for retained Sabadell
associates
• Increased incentives and other
benefits expense of $2.7 million
• $11.4 million of non-core merger-related
expense in 4Q17; $10.9 million related to
Sabadell acquisition and $0.5 million
related to Gibraltar acquisition

12
Operating Leverage
• Total core revenues were up $19.9
million, or 7%, compared to 3Q17,
while core expenses were up $4.2
million, or 3%, over that period
• Our core tangible efficiency ratio
was 55.6% in 4Q17, a decrease of
260 bps on a linked quarter basis
• Fourth quarter revenues and
expenses include the full quarter
impact of the recent Sabadell
acquisition
• Expect benefit in 2018 from
previously announced expense
initiatives and achievement of
Sabadell synergies
• Closed/Consolidated 12 branches in
4Q17. Additional net five branches
identified and in-process for
closing/consolidation in 1Q18
HighlightsEfficiency Ratio Trends

13
Asset Quality
• Net Charge-Offs of $10.1 million in 4Q17
after completion of Energy risk-off strategy
• Net charge-offs decreased $18.7 million
on a linked quarter basis, and equated
to an annualized 0.20% of average
loans, compared to 0.62% at 3Q17
• Provision expense of $14.4 million in 4Q17
• 22% decrease from 3Q17 primarily due
to decreased concerns with respect to
the potential economic impact of the
hurricanes
• NPAs remained relatively flat at 0.64% at
December 31, 2017 compared to 0.63% at
September 30, 2017
• No significant credit issues have arisen
related to Hurricanes Irma and Harvey
Non-Performing Assets
Highlights Provision & Net Charge-Offs

14
Credit Risk Coverage
• Credit risk reserves include:
• Allowance for credit losses
• Acquired loan discounts (non-
impaired assets)
• Credit reserve coverage of Loans equal to
1.24% at 4Q17, as compared to 0.70% of
allowance to loans
Highlights
Credit Risk Reserves (Non-GAAP) & Loan Coverage
Credit Risk Reserves (Non-GAAP) & NPA Coverage
4Q16 1Q17 2Q17 3Q17 4Q17
Allowance for Loan
Losses 144,719 144,890 146,225 136,628 140,891
Non Impaired
Acquired Loan
Discounts, Net 12,930 11,874 10,879 110,307 94,734
Reserve for Unfunded
Commitments 11,241 11,660 10,462 21,032 13,208
Total Credit Risk
Reserves 168,890 168,424 167,566 267,967 248,833
Credit Risk Reserves as
a % of Loans 1.12% 1.11% 1.08% 1.35% 1.24%

15
Capital Position
Highlights Capital Ratios (Preliminary)
• Capital ratios impacted due to
provisional $51 million income tax
expense, or $0.94 per share,
related to the revaluation of
deferred tax assets in 4Q17
• Declared quarterly common stock
dividend of $0.37 per share,
payable on January 26, 2018
• Under the current Board
authorized share repurchase plan
there are approximately 747,000
shares of common stock
remaining that may be purchased
by the Company
IBERIABANK Corporation 3Q17 4Q17 Change
Common equity Tier 1 (CET 1) ratio 10.93% 10.58% (35 bps)
Tier 1 Leverage 10.17% 9.36% (81 bps)
Tier 1 Risk-Based 11.53% 11.17% (36 bps)
Total Risk-Based 12.77% 12.37% (40 bps)
IBERIABANK and Subsidiaries 3Q17 4Q17 Change
Common equity Tier 1 (CET 1) ratio 11.11 10.87 (24 s)
Tier 1 Leverage 9.81% 9.11% (70 bps)
Tier 1 Risk-Based 11.11% 10.87% (24 bps)
Total Risk-Based 11.83% 11.56% (27 bps)

16
M&A Update
Gibraltar Private Bank & TrustSabadell United Bank
• $1.6 billion in assets with seven branch locations
across Florida and one branch in New York
• Transaction announced on October 19, 2017
• Attractive transaction pricing with net present value
of cost saves greater than total consideration
• $5.7 billion in assets with 26 branch locations
across Southern Florida
• Transaction announced on February 28, 2017
• Transaction closed on July 31, 2017
Summary
Progress Update
Summary
Transaction Update
• Applications filed with appropriate regulatory
agencies
• Gibraltar shareholder vote scheduled for February
22, 2018
• Continue to anticipate transaction closing by the
end of 1Q18
• Conversion of Sabadell branch and operating
systems was successfully completed over the
weekend of October 13-15, 2017
• Finalized and executed on branch closures
related to transaction in October 2017
• Run-rate cost savings expected to be fully
achieved during the first quarter of 2018

17
Tax Cuts and Jobs Act of 2017
• On December 22, 2017, the President of the United States
signed into law the Tax Cuts and Jobs Act providing significant
changes to the current tax laws for both personal and corporate
income taxes
• As a result of the lowering of the Federal marginal corporate
tax rate to 21%, the Company recorded a provisional income
tax expense of $51 million related to the revaluation of its
deferred tax assets
• The Company expects its effective tax rate for 2018 to be in the
range of 21.0% - 22.0%

18
The Company’s guidance is subject to risks, uncertainties, and assumptions which could, individually or in aggregate, cause actual results or financial
condition to differ materially from those anticipated above. Reference is made to “Caution About Forward-Looking Statements” in the earnings release
which also applies to this guidance.
2018 Guidance Update
• Guidance updates include changes resulting from tax reform passed on December 22, 2017:
• Core non-interest expense change reflects increased employee compensation
• Decrease in effective tax rate
• We continue to manage the business for long-term value creation for all shareholders
Average Earning Assets $27.3B ~ $27.7B
Consolidated Loan Growth % 15% ~ 17%
Consolidated Deposit Growth % 17% ~ 21%
Provision Expense $37MM ~ $42MM
Non-Interest Income (Core Basis) $210MM ~ $220MM
Non-Interest Expense (Core Basis) $700MM ~ $710MM
Tax Rate 21.0% ~ 22.0%
Net Interest Margin 3.55% ~ 3.63%
Pre–tax One time Charges $28MM ~ $31MM
Credit Quality Stable
Impact of 12/15/2017 Forward Curve +6bps to NIM Range
2018 Guidance
19
APPENDIX
20
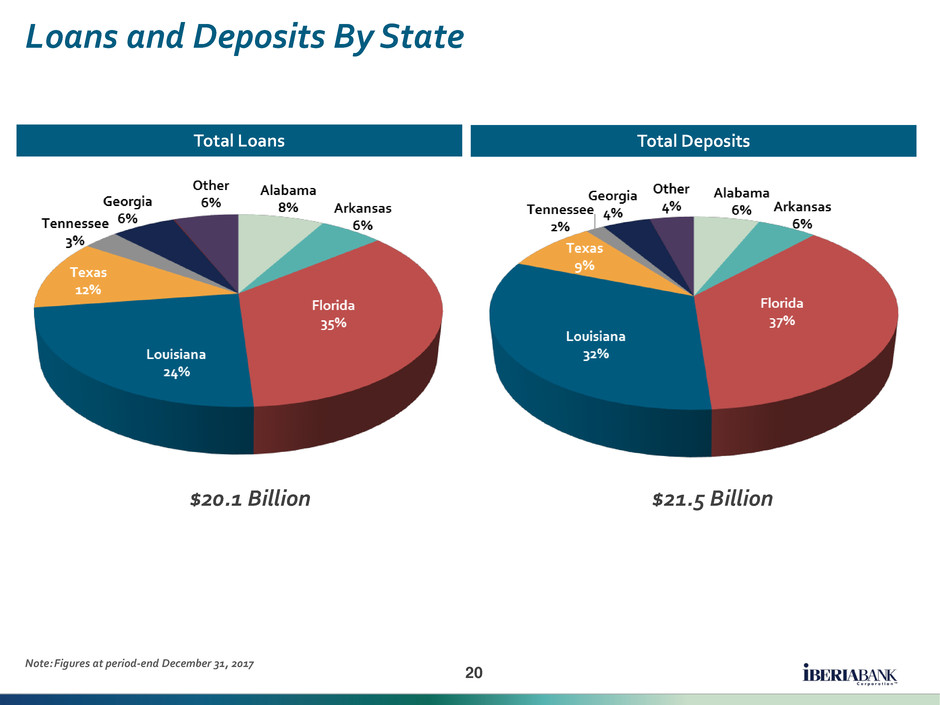
Loans and Deposits By State
Note: Figures at period-end December 31, 2017
$20.1 Billion $21.5 Billion
Total Loans Total Deposits

21
Non-Interest Income And Expense Trend Details
Non-interest Income ($ millions) 3Q 16 4Q 16 1Q 17 2Q 17 3Q 17 4Q 17 $ Change % Change
Service Charges on Deposit Accounts 11.1$ 11.2$ 11.2$ 11.4$ 12.5$ 12.6$ 0.1$ 0%
ATM / Debit Card Fee Income 3.5 3.6 3.6 3.8 3.7 3.8 0.1 3%
BOLI Proceeds and CSV Income 1.3 1.3 1.3 1.2 1.3 1.3 0.0 0%
Mortgage Income 21.8 16.1 14.1 19.7 16.0 13.7 (2.4) -15%
Title Revenue 6.0 5.3 4.7 6.2 5.6 5.4 (0.2) -4%
Broker Commissions 3.8 4.0 2.7 2.8 2.3 2.2 (0.1) -5%
Other Non-interest Income 12.3 11.7 9.7 10.8 11.9 15.8 3.8 33%
Non-interest income excluding non-core income 59.8$ 53.2$ 47.3$ 55.9$ 53.3$ 54.6$ 1.3$ 2%
Gain (Loss) on Sale of Investments, Net - - - 0.1 (0.2) 0.0 0.3 114%
Other Non-core income - - - - - - - 0%
Total Non-interest Income 59.8$ 53.2$ 47.3$ 56.0$ 53.1$ 54.7$ 1.6$ 3%
Non-interest Expense ($ millions) 3Q 16 4Q 16 1Q 17 2Q 17 3Q 17 4Q 17 $ Change % Change
Mortgage Commissions 6.9$ 5.2$ 3.3$ 5.3$ 5.3$ 5.3$ (0.0)$ 0%
Hospitalization Expense 6.6 3.9 5.9 5.2 5.7 6.8 1.1 21%
Other Salaries and Benefits 71.5 71.6 72.6 75.2 84.4 88.5 4.1 5%
Salaries and Employee Benefits 85.0$ 80.7$ 81.8$ 85.7$ 95.4$ 100.6$ 5.2$ 5%
Credit/Loan Related 1.9 3.4 4.5 3.8 7.5 3.2 (4.3) -58%
Occupancy and Equipment 16.5 15.6 16.0 16.1 18.8 18.4 (0.4) -2%
Amortization of Acquisition Intangibles 2.1 2.1 1.8 1.7 4.5 4.6 0.1 3%
All Other Non-interest Expense 32.5 31.8 35.3 34.1 37.5 41.1 3.6 10%
Nonint. Exp. (Ex-Non-Core Exp.) 138.1$ 133.6$ 139.4$ 141.4$ 163.7$ 167.9$ 4.2$ 3%
Compensation-related expense -$ 0.2$ 0.1$ 0.4$ 1.1$ 1.5$ 0.4 33%
Storm-related expense - -$ - - 0.4 0.1 (0.3) -61%
Impairment of Long-lived Assets, net of gains on sales - (0.5) 1.4 (1.3) 3.7 3.2 (0.5) -13%
Loss on early termination of loss share agreements - 17.8 - - - - - 0%
Consulting and Professional - - - 6.0 5.7 - (5.7) -100%
Other Non-interest Expense - 0.5 - - - 0.3 0.3 100%
Merger-related expense - - 0.1 1.0 28.5 11.4 (17.1) -60%
Total Non-interest Expense 138.1$ 151.6$ 141.0$ 147.5$ 203.0$ 184.4$ (18.6)$ -9%
Tangible Efficiency Ratio - excl Non-Core-Exp 60.1% 60.3% 61.6% 57.6% 58.2% 55.6%
4Q17 vs. 3Q17
4Q17 vs. 3Q17
22
GAAP And Non-GAAP Cash Margin
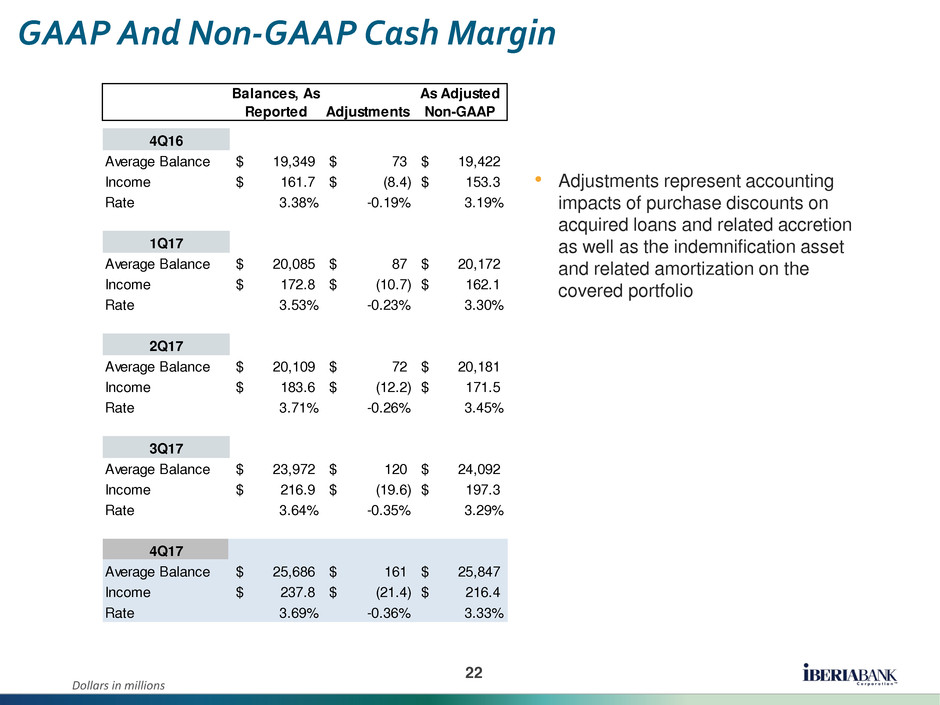
• Adjustments represent accounting
impacts of purchase discounts on
acquired loans and related accretion
as well as the indemnification asset
and related amortization on the
covered portfolio
Dollars in millions
Balances, As
Reported Adjustments
As Adjusted
Non-GAAP
4Q16
Average Balance 19,349$ 73$ 19,422$
Income 161.7$ (8.4)$ 153.3$
Rate 3.38% -0.19% 3.19%
1Q17
Average Balance 20,085$ 87$ 20,172$
Income 172.8$ (10.7)$ 162.1$
Rate 3.53% -0.23% 3.30%
2Q17
Average Balance 20,109$ 72$ 20,181$
Income 183.6$ (12.2)$ 171.5$
Rate 3.71% -0.26% 3.45%
3Q17
Average Balance 23,972$ 120$ 24,092$
Income 216.9$ (19.6)$ 197.3$
Rate 3.64% -0.35% 3.29%
4Q17
Average Balance 25,686$ 161$ 25,847$
Income 237.8$ (21.4)$ 216.4$
Rate 3.69% -0.36% 3.33%
23
Reconciliation Of Non-GAAP Financial Measures
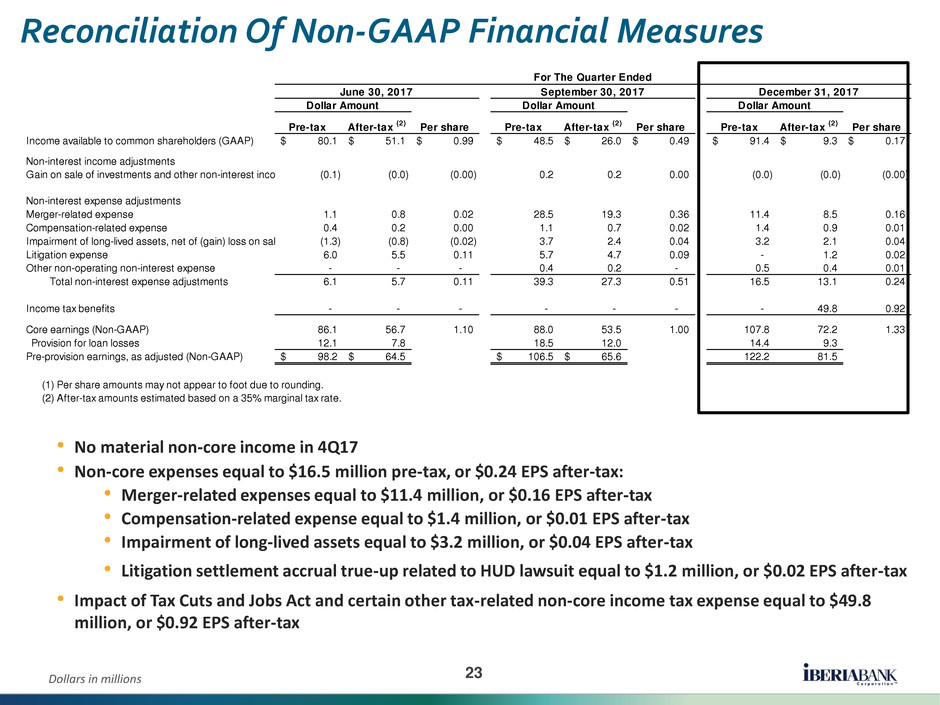
• No material non-core income in 4Q17
• Non-core expenses equal to $16.5 million pre-tax, or $0.24 EPS after-tax:
• Merger-related expenses equal to $11.4 million, or $0.16 EPS after-tax
• Compensation-related expense equal to $1.4 million, or $0.01 EPS after-tax
• Impairment of long-lived assets equal to $3.2 million, or $0.04 EPS after-tax
• Litigation settlement accrual true-up related to HUD lawsuit equal to $1.2 million, or $0.02 EPS after-tax
• Impact of Tax Cuts and Jobs Act and certain other tax-related non-core income tax expense equal to $49.8
million, or $0.92 EPS after-tax
Dollars in millions
Pre-tax After-tax
(2)
Per share Pre-tax After-tax
(2)
Per share Pre-tax After-tax
(2)
Per share
Income available to common shareholders (GAAP) 80.1$ 51.1$ 0.99$ 48.5$ 26.0$ 0.49$ 91.4$ 9.3$ 0.17$
Non-interest income adjustments
Gain on sale of investments and other non-interest income (0.1) (0.0) (0.00) 0.2 0.2 0.00 (0.0) (0.0) (0.00)
Non-interest expense adjustments
Merger-related expense 1.1 0.8 0.02 28.5 19.3 0.36 11.4 8.5 0.16
Compensation-related expense 0.4 0.2 0.00 1.1 0.7 0.02 1.4 0.9 0.01
Impairment of long-lived assets, net of (gain) loss on sale (1.3) (0.8) (0.02) 3.7 2.4 0.04 3.2 2.1 0.04
Litigation expense 6.0 5.5 0.11 5.7 4.7 0.09 - 1.2 0.02
Other non-operating non-interest expense - - - 0.4 0.2 - 0.5 0.4 0.01
Total non-interest expense adjustments 6.1 5.7 0.11 39.3 27.3 0.51 16.5 13.1 0.24
Income tax benefits - - - - - - - 49.8 0.92
Core earnings (Non-GAAP) 86.1 56.7 1.10 88.0 53.5 1.00 107.8 72.2 1.33
Provision for loan losses 12.1 7.8 18.5 12.0 14.4 9.3
Pre-provision earnings, as adjusted (Non-GAAP) 98.2$ 64.5$ 106.5$ 65.6$ 122.2 81.5
(1) Per share amounts may not appear to foot due to rounding.
(2) After-tax amounts estimated based on a 35% marginal tax rate.
Dollar Amount Dollar Amount Dollar Amount
For The Quarter Ended
June 30, 2017 September 30, 2017 December 31, 2017

