Attached files
| file | filename |
|---|---|
| 8-K - 8-K - VALLEY NATIONAL BANCORP | vly8-k2018125earningsrelea.htm |
| EX-99.1 - EXHIBIT 99.1 - VALLEY NATIONAL BANCORP | exhibit99earningsrelease01.htm |

© 2018 Valley National Bank®. Member FDIC. Equal Opportunity Lender. All Rights Reserved.
4Q 2017 Earnings Conference Call Presentation
Exhibit 99.2

Forward Looking Statements
The foregoing contains forward-looking statements within the meaning of the Private Securities Litigation Reform Act of 1995. Such statements are not
historical facts and include expressions about management’s confidence and strategies and management’s expectations about new and existing programs
and products, acquisitions, relationships, opportunities, taxation, technology, market conditions and economic expectations. These statements may be
identified by such forward-looking terminology as “should,” “expect,” “believe,” “view,” “opportunity,” “allow,” “continues,” “reflects,” “typically,” “usually,”
“anticipate,” or similar statements or variations of such terms. Such forward-looking statements involve certain risks and uncertainties. Actual results may
differ materially from such forward-looking statements. Factors that may cause actual results to differ materially from those contemplated by such forward-
looking statements include, but are not limited to: weakness or a decline in the economy, mainly in New Jersey, New York and Florida, as well as an
unexpected decline in commercial real estate values within our market areas; less than expected cost reductions and revenue enhancement from Valley's
cost reduction plans including its earnings enhancement program called "LIFT"; higher or lower than expected income tax expense or tax rates, including
increases or decreases resulting from the impact of the Tax Act and other changes in tax laws, regulations and case law; damage verdicts or settlements or
restrictions related to existing or potential litigations arising from claims of breach of fiduciary responsibility, negligence, fraud, contractual claims,
environmental laws, patent or trade mark infringement, employment related claims, and other matters; the loss of or decrease in lower-cost funding sources
within our deposit base may adversely impact our net interest income and net income; cyber attacks, computer viruses or other malware that may breach
the security of our websites or other systems to obtain unauthorized access to confidential information, destroy data, disable or degrade service, or sabotage
our systems; results of examinations by the OCC, the FRB, the CFPB and other regulatory authorities, including the possibility that any such regulatory
authority may, among other things, require us to increase our allowance for credit losses, write-down assets, require us to reimburse customers, change the
way we do business, or limit or eliminate certain other banking activities; changes in accounting policies or accounting standards, including the new
authoritative accounting guidance (known as the current expected credit loss (CECL) model) which may increase the required level of our allowance for credit
losses after adoption on January 1, 2020; our inability or determination not to pay dividends at current levels, or at all, because of inadequate future
earnings, regulatory restrictions or limitations, changes in our capital requirements or a decision to increase capital by retaining more earnings; higher than
expected loan losses within one or more segments of our loan portfolio; unanticipated loan delinquencies, loss of collateral, decreased service revenues, and
other potential negative effects on our business caused by severe weather or other external events; unexpected significant declines in the loan portfolio due
to the lack of economic expansion, increased competition, large prepayments, changes in regulatory lending guidance or other factors; the failure of other
financial institutions with whom we have trading, clearing, counterparty and other financial relationships; the risk that the businesses of Valley and USAB may
not be combined successfully, or such combination may take longer or be more difficult, time-consuming or costly to accomplish than expected; the diversion
of management's time on issues relating to merger integration; the inability to realize expected cost savings and synergies from the merger of USAB with
Valley in the amounts or in the timeframe anticipated; and the inability to retain USAB’s customers and employees. A detailed discussion of factors that could
affect our results is included in our SEC filings, including the “Risk Factors” section of our Annual Report on Form 10-K for the year ended December 31, 2016
and Quarterly Report on Form 10-Q for the period ended September 30, 2017. We undertake no duty to update any forward-looking statement to conform
the statement to actual results or changes in our expectations. Although we believe that the expectations reflected in the forward-looking statements are
reasonable, we cannot guarantee future results, levels of activity, performance or achievements.
2

Highlights
3 1Refer to the appendix regarding the reconciliation of certain non-GAAP financial measures.
Reported Reported Adjusted1 Adjusted1
4Q17 3Q17 2017 2016 4Q17 3Q17 2017 2016
Return on
Average
Assets
0.44% 0.67% 0.69% 0.76% 0.83% 0.79% 0.82% 0.76%
Efficiency
Ratio
68.3% 69.4% 66.0% 66.0% 57.4% 59.2% 58.9% 61.2%
Diluted
Earnings
Per Share
$0.09 $0.14 $0.58 $0.63 $0.18 $0.17 $0.69 $0.63
Solid Relative Performance in 2017 Despite Substantial Investment and Repositioning
1 2 3 4
Valley initiated Phase
1 of its 3 year, ~$50
million, technology
infrastructure plan
Project LIFT
implementation has
begun; We remain
on track to hit our
targets
Acquisition of
USAmeriBancorp,
Inc. (closed effective
January, 1, 2018)
Completed senior
management
succession plan for
2018
Investing Executing Integrating Repositioning

• Closed USAmeriBank acquisition
on January 1, 2018
• Systems consolidation expected
to occur in the first half of 2Q
2018
• Long track record of successful
conversions
• USAmeriBank timeline consistent
with recent acquisitions
Year Institution Name* Assets* ($mil) Days to Convert
2018 USAmeriBank 4,228 ~125
2015 CNLBank 1,365 90
2014 1st United Bank 1,738 122
2012 State Bank of Long Island 1,578 90
2010 The Park Avenue Bank 509 91
2010 LibertyPoint Bank 210 86
2008 Greater Community Bank 976 40
2005 NorCrown Bank 622 50
2005 Shrewsbury Bank 424 51
2001 Merchants Bank 1,370 103
4
Merger Closing & Integration
*Principal subsidiary bank of the acquired bank holding company. Assets represent total consolidated assets acquired.

$8.8 $9.4
$5.1 $5.2
$3.4 $3.6
3Q 2017 4Q 2017
0.2% 2.1% 14.3%
0%
10%
20%
30%
40%
2017Florida New York New Jersey
5
$734mm
Reduction in short-term borrowings
to $749mm
Deposit & Balance Sheet Funding
Solid Deposit Growth1 ($ in billions)
Deposit Beta by Region for Current Cycle (3Q15 – 4Q17)2
+$841mm
Total deposits from
9/30 /17 to 12/31/17
+19%
Q/Qa
1Growth rates represent the quarter over quarter change, annualized (Q/Qa); 2Represents the change in the monthly average rate for Valley in each respective region as a percentage
of the change in the monthly average effective federal funds rate from September 30, 2015 to December 31, 2017; excludes government deposits.
Noninterest Bearing
+$126mm or 10% Q/Qa
Savings, Now & MM
+$572mm or 26% Q/Qa
Time
+$143mm or 17% Q/Qa
Diversified geographic mix of deposits is
proving to be a successful strategy
Consolidated: 8.4%

$1.0
$1.1
$1.0
$1.3
3.75%
3.85%
3.79%
4.00%
Q1 2017 Q2 2017 Q3 2017 Q4 2017
Origination Volume Yield on New Originations
6
Loans & Loan Growth
Yield & Volume of Loan Originations ($ in billions)
Diversified Loan Portfolio by Product & Region1
2017 loan growth up 6.4%, including sale of
residential mortgage loans
Well-positioned for organic growth in 2018
(proforma USAmeriBank);
• Targeting total loan growth of 8-10%
(7-9% after portfolio sales)
• Florida loan growth of 10-12%
Opportunity to enhance fees in existing
portfolio
1Balance sheet data is as of the December 31, of the year indicated; 2Florida includes the proforma impact of USAmeriBank outstanding loan
balances for both Florida and Alabama as of September 30, 2017.
15.6%
18.9%
10.8%
22.1%
13.0%
15.0%
4.6%
Construction
Owner Occupied CRE
Residential Mortgage Commercial & Industrial
Multifamily
Non-owner Occupied CRE
Consumer
$18.3bn
2017
37% 39% 32%
50% 48%
40%
13% 13%
28%
2016 2017 2017 Proforma
USAB
Florida
New Jersey
New York
2
1
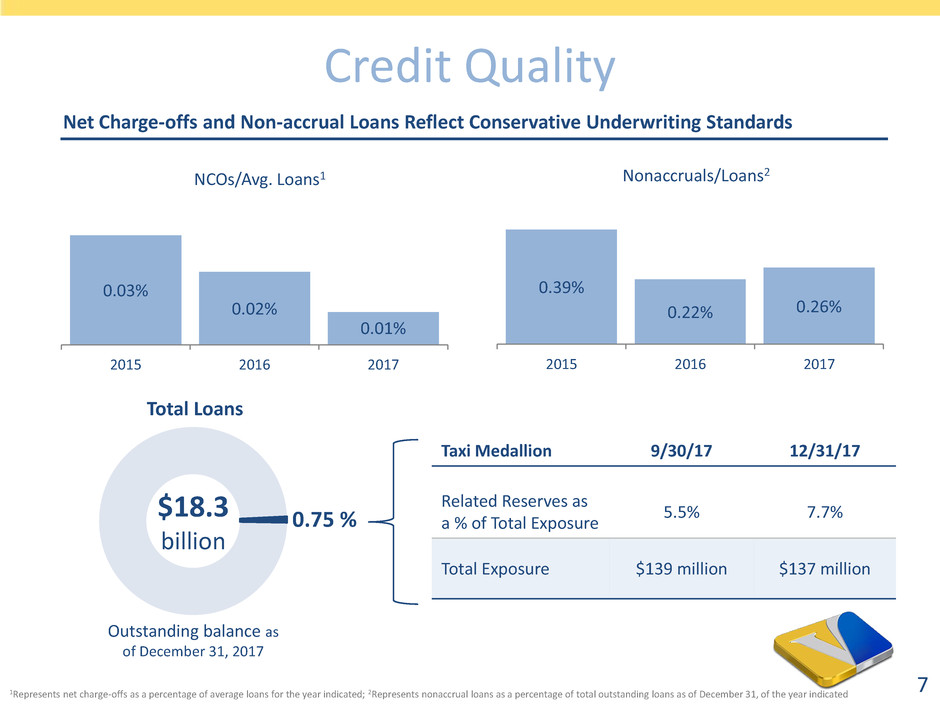
Taxi Medallion 9/30/17 12/31/17
Related Reserves as
a % of Total Exposure
5.5% 7.7%
Total Exposure $139 million $137 million
7
0.75 % $18.3
billion
Total Loans
Credit Quality
Net Charge-offs and Non-accrual Loans Reflect Conservative Underwriting Standards
Outstanding balance as
of December 31, 2017
0.03%
0.02%
0.01%
2015 2016 2017
NCOs/Avg. Loans1
0.39%
0.22% 0.26%
2015 2016 2017
Nonaccruals/Loans2
1Represents net charge-offs as a percentage of average loans for the year indicated; 2Represents nonaccrual loans as a percentage of total outstanding loans as of December 31, of the year indicated
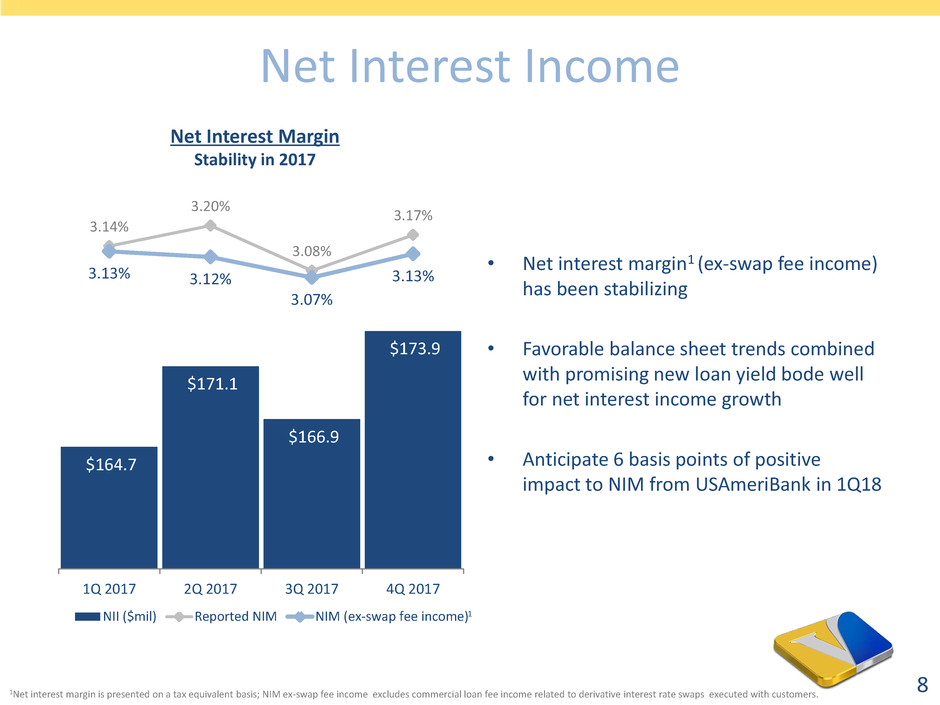
• Net interest margin1 (ex-swap fee income)
has been stabilizing
• Favorable balance sheet trends combined
with promising new loan yield bode well
for net interest income growth
• Anticipate 6 basis points of positive
impact to NIM from USAmeriBank in 1Q18
8
Net Interest Income
$164.7
$171.1
$166.9
$173.9
3.14%
3.20%
3.08%
3.17%
3.13% 3.12%
3.07%
3.13%
1Q 2017 2Q 2017 3Q 2017 4Q 2017
NII ($mil) Reported NIM NIM (ex-swap fee income)
Net Interest Margin
Stability in 2017
1Net interest margin is presented on a tax equivalent basis; NIM ex-swap fee income excludes commercial loan fee income related to derivative interest rate swaps executed with customers.
1

• Transforming Residential Mortgage
gain-on sale business from refinance
driven to home purchase focused
– More predictable origination volume
vs. refinance activity
• 4Q 2017 residential mortgage
application volume was over $450
million
• We believe we are on track to achieve
> $1.5 billion in residential
originations in 2018
9
Noninterest Income Trends
$79,557 $81,195 $82,627
$4,245
$22,030 $20,814
$0.5bn
$0.9bn
$1.0bn
$1.5bn+
2015 2016 2017 2018E
All Other Noninterest Income ($000) Net Gain on Sale of Loans ($000)
Residential Mortgage Originations
Net
Gain on
Sale of
Loans
Proforma
USAmeriBank
Noninterest Income
Emphasis on Home Purchase Gain on Sale
15% Purchase
85% Refinance
54% Purchase
46% Refinance
15% Purchase
85% Refinance
73% Purchase
27% Refinance
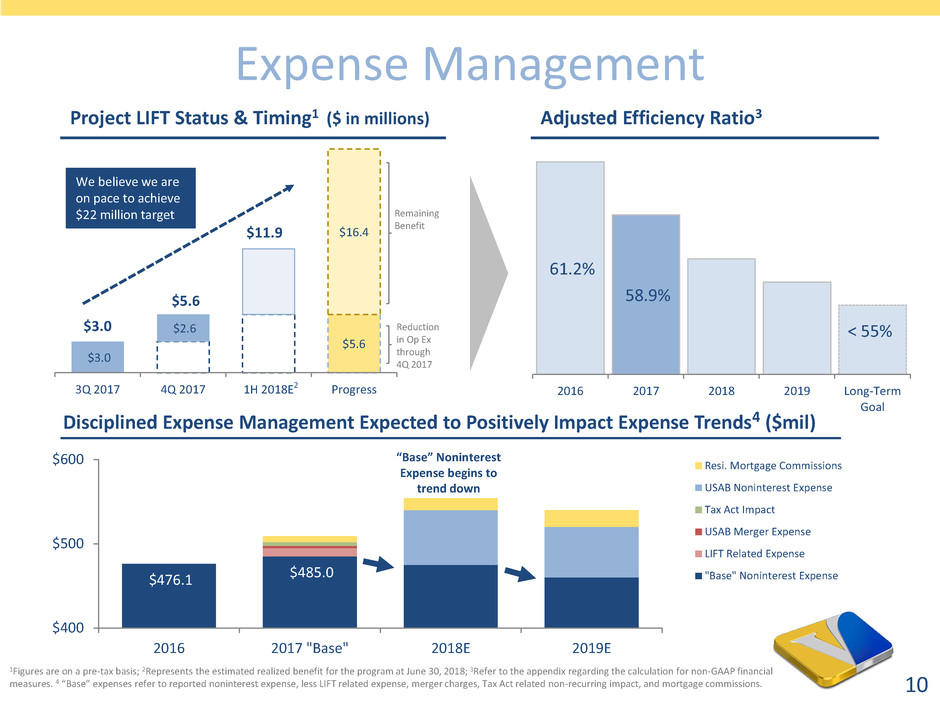
$476.1 $485.0
$400
$500
$600
2016 2017 "Base" 2018E 2019E
Resi. Mortgage Commissions
USAB Noninterest Expense
Tax Act Impact
USAB Merger Expense
LIFT Related Expense
"Base" Noninterest Expense
10
Expense Management
61.2%
58.9%
2016 2017 2018 2019 Long-Term
Goal
Project LIFT Status & Timing1 ($ in millions) Adjusted Efficiency Ratio3
Disciplined Expense Management Expected to Positively Impact Expense Trends4 ($mil)
1Figures are on a pre-tax basis; 2Represents the estimated realized benefit for the program at June 30, 2018; 3Refer to the appendix regarding the calculation for non-GAAP financial
measures. 4 “Base” expenses refer to reported noninterest expense, less LIFT related expense, merger charges, Tax Act related non-recurring impact, and mortgage commissions.
$3.0
$2.6
$11.9
$5.6
$16.4
3Q 2017 4Q 2017 1H 2018E Progress
Remaining
Benefit
Reduction
in Op Ex
through
4Q 2017
We believe we are
on pace to achieve
$22 million target
$5.6
$3.0
“Base” Noninterest
Expense begins to
trend down
2
< 55%

$1,595 $1,590
$733 $733
$210 $210
3Q17 4Q17
• Common Equity Tier 1 Capital Ratio of 9.2%
(flat with previous quarter)
• Go-forward effective tax rate in range of
21%-23%
• Expect to earn-back our capital charge (total
$22.6 million) related to Tax Reform within 2
quarters
• Over the next two years we plan to reinvest
approximately 15% or our annualized
earnings benefit from tax reform on:
– Facilities & Infrastructure
• Reinvestment of additional earnings from tax
reform is included in expense outlook on
page 10
11
Tax Act Implications & Capital
Footnote:
Preferred Stock
Goodwill &
Other Intangible
Assets
Tangible
Common Equity
Shareholders’ Equity ($ in millions)

Non-GAAP Disclosure Reconciliations
12
Three Months Ended Years Ended
December 31, September 30, December 31, December 31, December 31,
($ in thousands, except for share data) 2017 2017 2016 2017 2016
Adjusted net income available to common shareholders:
Net income, as reported $26,098 $39,649 $50,090 $161,907 $168,146
Add: LIFT program expenses (net of tax)* — 5,753 — 5,753 —
Add: Merger related expenses (net of tax)** 1,073 1,200 — 2,274 —
Add: Amortization of tax credit investments (Tax Act Impact Only) 4,271 — — 4,271 —
Add: Income Tax Expense (Tax Act Impact Only) 18,290 — — 18,290 —
Net income, as adjusted $49,732 $46,602 $50,090 $192,495 $168,146
Dividends on preferred stock 3,172 2,683 1,797 9,449 7,188
Net income available to common shareholders, as adjusted $46,560 $43,919 $48,293 $183,046 $160,958
_____________
* LIFT program expenses are primarily within professional and legal fees, and salary and employee benefits expense.
** Merger related expenses are primarily within professional and legal fees.
Three Months Ended Years Ended
December 31, September 30, December 31, December 31, December 31,
($ in thousands, except for share data) 2017 2017 2016 2017 2016
Adjusted per common share data:
Net income available to common shareholders, as adjusted $46,560 $43,919 $48,293 $183,046 $160,958
Average number of shares outstanding 264,332,895 264,058,174 256,422,437 264,038,123 254,841,571
Basic earnings, as adjusted $0.18 $0.17 $0.19 $0.69 $0.63
Average number of diluted shares outstanding 265,288,067 264,936,220 256,952,036 264,889,007 255,268,336
Diluted earnings, as adjusted $0.18 $0.17 $0.19 $0.69 $0.63
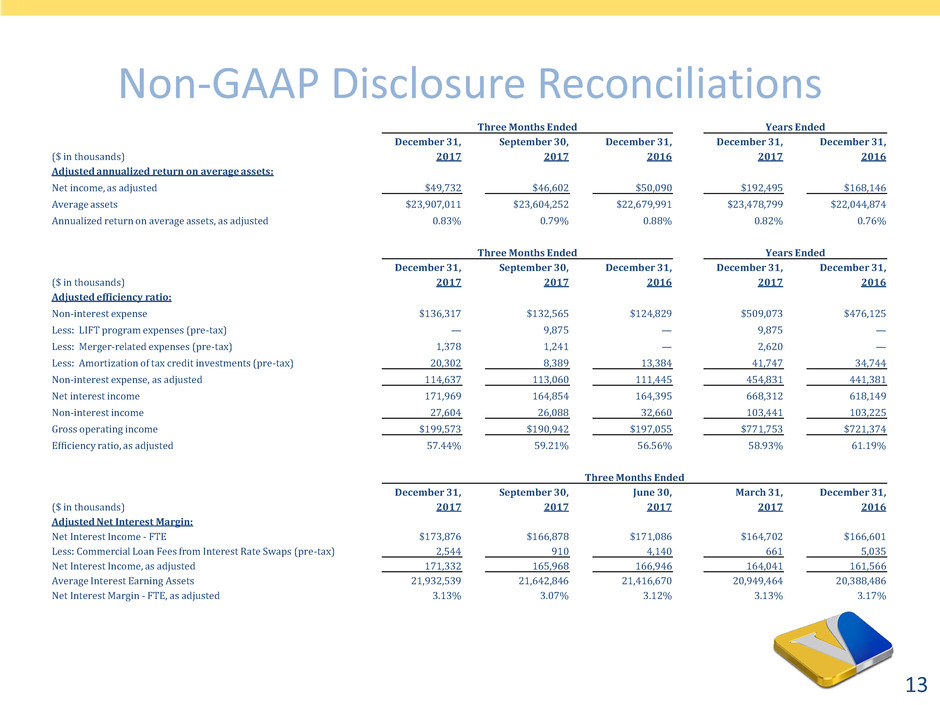
Non-GAAP Disclosure Reconciliations
13
Three Months Ended Years Ended
December 31, September 30, December 31, December 31, December 31,
($ in thousands) 2017 2017 2016 2017 2016
Adjusted annualized return on average assets:
Net income, as adjusted $49,732 $46,602 $50,090 $192,495 $168,146
Average assets $23,907,011 $23,604,252 $22,679,991 $23,478,799 $22,044,874
Annualized return on average assets, as adjusted 0.83% 0.79% 0.88% 0.82% 0.76%
Three Months Ended Years Ended
December 31, September 30, December 31, December 31, December 31,
($ in thousands) 2017 2017 2016 2017 2016
Adjusted efficiency ratio:
Non-interest expense $136,317 $132,565 $124,829 $509,073 $476,125
Less: LIFT program expenses (pre-tax) — 9,875 — 9,875 —
Less: Merger-related expenses (pre-tax) 1,378 1,241 — 2,620 —
Less: Amortization of tax credit investments (pre-tax) 20,302 8,389 13,384 41,747 34,744
Non-interest expense, as adjusted 114,637 113,060 111,445 454,831 441,381
Net interest income 171,969 164,854 164,395 668,312 618,149
Non-interest income 27,604 26,088 32,660 103,441 103,225
Gross operating income $199,573 $190,942 $197,055 $771,753 $721,374
Efficiency ratio, as adjusted 57.44% 59.21% 56.56% 58.93% 61.19%
Three Months Ended
December 31, September 30, June 30, March 31, December 31,
($ in thousands) 2017 2017 2017 2017 2016
Adjusted Net Interest Margin:
Net Interest Income - FTE $173,876 $166,878 $171,086 $164,702 $166,601
Less: Commercial Loan Fees from Interest Rate Swaps (pre-tax) 2,544 910 4,140 661 5,035
Net Interest Income, as adjusted 171,332 165,968 166,946 164,041 161,566
Average Interest Earning Assets 21,932,539 21,642,846 21,416,670 20,949,464 20,388,486
Net Interest Margin - FTE, as adjusted 3.13% 3.07% 3.12% 3.13% 3.17%

For More Information
Log onto our web site: www.valleynationalbank.com
E-mail requests to: rkraemer@valleynationalbank.com
Call Rick Kraemer, Investor Relations Officer, at: (973) 686-4817
Write to: Valley National Bank
1455 Valley Road
Wayne, New Jersey 07470
Attn: Rick Kraemer, Investor Relations Officer
Log onto our website above or www.sec.gov to obtain free copies of documents
filed by Valley with the SEC
14
