Attached files
| file | filename |
|---|---|
| EX-99.1 - EXHIBIT 99.1 - ALLIANCE DATA SYSTEMS CORP | exhibit_99-1.htm |
| 8-K - FORM 8-K - ALLIANCE DATA SYSTEMS CORP | form_8k.htm |
Exhibit 99.2

Alliance Data NYSE: ADS Fourth Quarter and Full Year 2017 ResultsJanuary 25, 2018

11 2 Forward-Looking StatementsThis presentation contains forward-looking statements within the meaning of Section 27A of the Securities Act of 1933 and Section 21E of the Securities Exchange Act of 1934. Forward-looking statements give our expectations or forecasts of future events and can generally be identified by the use of words such as “believe,” “expect,” “anticipate,” “estimate,” “intend,” “project,” “plan,” “likely,” “may,” “should” or other words or phrases of similar import. Similarly, statements that describe our business strategy, outlook, objectives, plans, intentions or goals also are forward-looking statements. Examples of forward-looking statements include, but are not limited to, statements we make regarding our expected operating results, future economic conditions including currency exchange rates, future dividend declarations and the guidance we give with respect to our anticipated financial performance. We believe that our expectations are based on reasonable assumptions. Forward-looking statements, however, are subject to a number of risks and uncertainties that could cause actual results to differ materially from the projections, anticipated results or other expectations expressed in this presentation, and no assurances can be given that our expectations will prove to have been correct. These risks and uncertainties include, but are not limited to, factors set forth in the Risk Factors section in our Annual Report on Form 10-K for the most recently ended fiscal year, which may be updated in Item 1A of, or elsewhere in, our Quarterly Reports on Form 10-Q filed for periods subsequent to such Form 10-K. Our forward-looking statements speak only as of the date made, and we undertake no obligation, other than as required by applicable law, to update or revise any forward-looking statements, whether as a result of new information, subsequent events, anticipated or unanticipated circumstances or otherwise.

Agenda Speakers: Ed Heffernan President and CEO Charles Horn EVP and CFO Fourth Quarter and Full Year Consolidated ResultsSegment Results2017 Full Year2018 Updated Guidance 1 3

Fourth Quarter and 2017 Consolidated Results(MM, except per share) Quarter Ended December 31 , Year Ended December 31, 2017 2016 % Change 2017 2016 % Change Revenue $ 2,106 $ 1,828 +15% $ 7,719 $ 7,138 +8% Net income $ 271 $ 11 nm $ 789 $ 518 +52% EPS $ 4.88 $ 0.18 nm $ 14.10 $ 7.34 +92% Core EPS $ 6.26 $ 4.67 +34% $ 19.35 $ 16.92 +14% Adjusted EBITDA $ 598 $ 566 +6% $ 2,218 $ 2,096 +6% Adjusted EBITDA, net $ 514 $ 507 +1% $ 1,937 $ 1,880 +3% Diluted shares outstanding 55.6 57.9 55.9 58.9 2 4 Net tax benefit from tax reform added approximately $1.02 to EPS and Core EPS for fourth-quarter and full-year 2017.Dividend raised 10 percent to $0.57 in first quarter of 2018.

LoyaltyOne® (MM) Quarter Ended December 31, Year Ended December 31, 2017 2016 % Change 2017 2016 % Change Revenue $ 385 $ 247 +56% $ 1,304 $ 1,338 -3% Adjusted EBITDA $ 80 $ 74 +9% $ 257 $ 314 -18% Non-controlling interest - - nm - -5 nm Adjusted EBITDA, net $ 80 $ 74 +9% $ 257 $ 309 -17% Adjusted EBITDA % 21% 30% -9% 20% 23% -3% 3 5 AIR MILES economics restored.BMO contract renewed.BrandLoyalty’s rollout of a retail loyalty program for Disney EMEA starts in January 2018.

Epsilon® (MM) Faster than expected stabilization and growth in Technology Platform offering.Conversant CRM bounced back to strong double-digit growth in fourth quarter.Strong growth in Europe. Quarter Ended December 31, Year Ended December 31, 2017 2016 % Change 2017 2016 % Change Revenue $ 640 $ 600 +7% $ 2,272 $ 2,155 +5% Adjusted EBITDA $ 159 $ 162 -2% $ 476 $ 480 -1% Adjusted EBITDA % 25% 27% -2% 21% 22% -1% 4 6
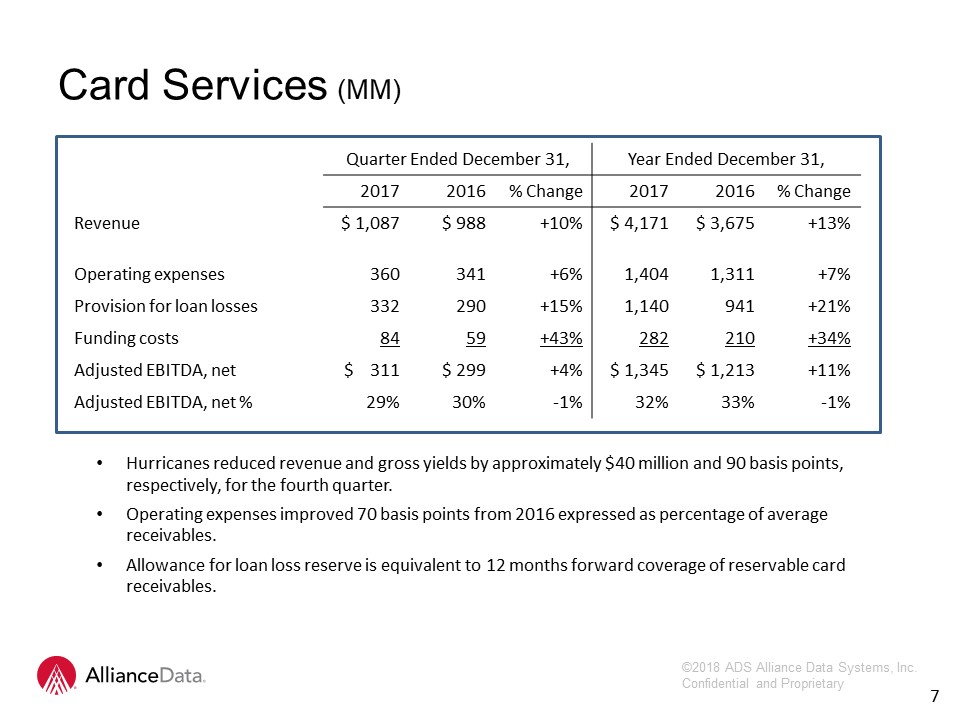
Card Services (MM) Quarter Ended December 31, Year Ended December 31, 2017 2016 % Change 2017 2016 % Change Revenue $ 1,087 $ 988 +10% $ 4,171 $ 3,675 +13% Operating expenses 360 341 +6% 1,404 1,311 +7% Provision for loan losses 332 290 +15% 1,140 941 +21% Funding costs 84 59 +43% 282 210 +34% Adjusted EBITDA, net $ 311 $ 299 +4% $ 1,345 $ 1,213 +11% Adjusted EBITDA, net % 29% 30% -1% 32% 33% -1% 5 Hurricanes reduced revenue and gross yields by approximately $40 million and 90 basis points, respectively, for the fourth quarter.Operating expenses improved 70 basis points from 2016 expressed as percentage of average receivables.Allowance for loan loss reserve is equivalent to 12 months forward coverage of reservable card receivables. 7

Card Services (MM) Tender share gains added over 100 basis points to credit sales growth for year.Divested two non-core portfolios in December reducing average receivables growth by 2 percent for fourth quarter.Hurricanes’ impact increased ending delinquency rates by approximately 20 basis points. Key Metrics: Quarter Ended December 31, Year Ended December 31, 2017 2016 Change 2017 2016 Change Credit sales $ 9,555 $ 9,009 +6% $ 31,002 $ 29,271 +6% Average card receivables $ 17,367 $ 15,306 +13% $ 16,186 $ 14,086 +15% Total gross yield 23.6% 25.1% -1.5% 24.9% 25.5% -0.6% Operating expenses as % of average card receivables 7.8% 8.7% -0.8% 8.4% 9.1% -0.7% Principal loss rates 6.0% 5.5% +0.5% 6.0% 5.1% +0.9% Delinquency rate 5.1% 4.8% +0.3% 5.1% 4.8% +0.3% 6 8

7 9 Revenue ($BN) Adj. EBITDA, net ($MM) Core EPS LoyaltyOne $ 1.30 -3% $ 257 (18%) Epsilon $ 2.27 +5% $ 505 -29 $ 476 +5%(1%) IncentiveComp. restoredv. $0 2016 Card Services $ 4.17 +13% $ 1,345 +11% ADS $ 7.72 +8% $ 1,937 +3% $19.35 +14% 1 Includes $1.02 of net tax benefit. 2017 Full Year 1

8 10 2017 Full Year (+) (▬) LoyaltyOne: AIR MILES Model stabilized (25 percent adj. EBITDA margins) Stabilized, but did not add to ADS growth Renewed BMO relationship (#1 client) Promotional spend (1/3 of issuance) remains weak No client losses Active collectors back to pre-crisis levels BrandLoyalty Strong double-digit growth from 2014 through 2016 Poor 2017 results Considered “air pocket” vs. fundamental issue

2017 Full Year 11 (+) (▬) Epsilon: Strong bounce to +5 percent revenue and +5 percent adj. EBITDA growth excluding restoration of incentive compensation Macro: impact of tight labor market for ‘hot skills’ Technology Platform offering (~25 percent of segment) turned from -13 percent revenue growth in Q4, 2016 to +7 percent revenue growth in Q4, 2017 Better visibility on financial results Digital CRM offering up strong double-digits; dip in Q3 was air pocket Auto offering up double-digits

2017 Full Year 12 (+) (▬) Card Services: Delinquency wedge effectively closed (best predictor of future losses)55 basis points to 10 basis points excluding impact of hurricanes 3rd Party recovery market plummeted – lower recovery rate increased net principal loss rate by 60 basis points 15 percent growth in average receivables Traditional retailers facing pressure; lower core sales pressures receivables growth Record new signings: close to $3BN vintage (Signet, Build.com, Viking Cruises, Guess, Diamonds Int’l, Adorama, IKEA) Double-digit adj. EBITDA net growth despite 90 basis points increase in net principal loss rate

2017 Full Year ConsolidatedRevenue up 8 percent and core EPS up 14 percent (up 8 percent excluding net tax benefit)Leverage modest @ 2.7x while funding approximately $1 billion for buybacks and capital for portfolio growthCredit loss rate stabilizing after two years of increasesADS poised to return to mid-to-high teens core EPS growth in 2018Raising cash dividend 10 percent to $0.57 per share starting Q1, 2018 13

14 2018 Updated Guidance Consolidated 2017 2018 Revenue – prior $ 7.72BN $ 8.70BN +12% ASC 606 accounting reclassification 1 - -0.35BN Revenue – updated $7.72 BN $ 8.35BN +8% Core EPS $ 19.35 $22.50 - $23.00 +16 to 19% 1 ASC 606 revenue recognition, which is effective January 1, 2018, requires a net revenue recognition (gross revenue less of cost of goods) for travel related redemptions at AIR MILES. This new presentation lowers reported revenue but does not impact core EPS.

High single-digit revenue, low double-digit adjusted EBITDA growthMid-single-digit revenue and adjusted EBITDA growthMid-teens revenue and adjusted EBITDA growthMid-teens portfolio growth ($2.5BN)‘15 to ’17 signings ramping ($2.5 BN) plus core ($1.0 BN) less non-core $1.0 BN) = 15 percent growthStable gross yields (~25 percent)Stable delinquency rates – best predictor of future lossesSpread vs prior year: Q1 (55) basis points; Q4 (10) basis points excluding hurricane impact Stable net principal loss rates: 2015 2016 2017 2018FGross 6.9% 7.2%Recoveries (1.8%) (1.2%)Net 4.5% 5.1% 6.0% 6.0%Hurricanes will negatively impact Q1; nominal if any impact to Q2 – Q4 2018 Guidance 15 LoyaltyOne: Epsilon: Card Services:

12 16 Financial MeasuresIn addition to the results presented in accordance with generally accepted accounting principles, or GAAP, the Company may present financial measures that are non-GAAP measures, such as constant currency financial measures, adjusted EBITDA, adjusted EBITDA margin, adjusted EBITDA, net of funding costs and non-controlling interest, core earnings and core earnings per diluted share (core EPS). Constant currency excludes the impact of fluctuations in foreign exchange rates. The Company calculates constant currency by converting our current period local currency financial results using the prior period exchange rates. The Company uses adjusted EBITDA and adjusted EBITDA, net as an integral part of internal reporting to measure the performance and operational strength of reportable segments and to evaluate the performance of senior management. Adjusted EBITDA eliminates the uneven effect across all reportable segments of non-cash depreciation of tangible assets and amortization of intangible assets, including certain intangible assets that were recognized in business combinations, and the non-cash effect of stock compensation expense. Similarly, core earnings and core EPS eliminate non-cash or non-operating items, including, but not limited to, stock compensation expense, amortization of purchased intangibles, amortization of debt issuance and hedging costs, mark-to-market gains or losses on interest rate derivatives, changes to the expiry policy and regulatory settlements. The Company believes that these non-GAAP financial measures, viewed in addition to and not in lieu of the Company’s reported GAAP results, provide useful information to investors regarding the Company’s performance and overall results of operations. Reconciliations to comparable GAAP financial measures are available in the Company’s earnings release, which is posted in both the News and Investors sections on the Company’s website (www.alliancedata.com). No reconciliation is provided with respect to forward-looking annual guidance for 2018 core EPS as the Company cannot reliably predict all necessary components or their impact to reconcile core EPS to GAAP EPS without unreasonable effort. The events necessitating a non-GAAP adjustment are inherently unpredictable and may have a material impact on the Company’s future results. The financial measures presented are consistent with the Company’s historical financial reporting practices. Core earnings and core EPS represent performance measures and are not intended to represent liquidity measures. The non-GAAP financial measures presented herein may not be comparable to similarly titled measures presented by other companies, and are not identical to corresponding measures used in other various agreements or public filings.

Q & A 17