Attached files
| file | filename |
|---|---|
| EX-99.1 - EXHIBIT 99.1 - Franklin Financial Network Inc. | tv483994_ex99-1.htm |
| 8-K - FORM 8-K - Franklin Financial Network Inc. | tv483994_8k.htm |
Exhibit 99.2

Franklin Financial Network, Inc. (NYSE:FSB) Fourth Quarter 2017 Investor Call January 25, 2018
2 Forward - Looking Statements Except for the historical information contained herein, this presentation contains forward - looking statements within the meaning of Section 27A of the Securities Act of 1933, as amended, and Section 21E of the Securities Exchange Act of 1934, as amended. The forward - looking statements include, among other things, statements regarding intent, belief or expectations of the Company and can be identified by the use of words such as "may," "will," "should," "would," "assume," "outlook," "seek," "plan," "believe," "expect," "anticipate," "intend," "estimate," "forecast," and other comparable terms. The Company intends that all such statements be subject to the “safe harbor” provisions of those Acts. Because forward - looking statements involve risks and uncertainties, actual results may differ materially from those expressed or implied. Investors are cautioned not to place undue reliance on these forward - looking statements and are advised to carefully review the discussion of forward - looking statements and risk factors in documents the Company files with the Securities and Exchange Commission. The Company undertakes no obligation to publicly update or revise any forward - looking statements, whether as a result of new information, future events or otherwise.
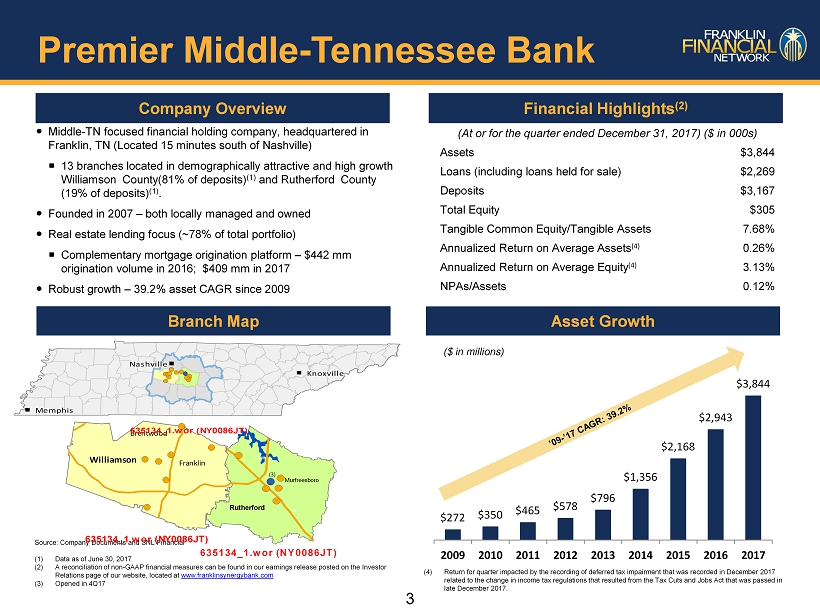
3 Company Overview Financial Highlights (2) Source: Company Documents and SNL Financial (1) Data as of June 30, 2017 (2) A reconciliation of non - GAAP financial measures can be found in our earnings release posted on the Investor Relations page of our website, located at www.franklinsynergybank.com (3) Opened in 4Q17 Asset Growth 635134_1.wor (NY0086JT) 24 840 Murfreesboro Rutherford 635134_1.wor (NY0086JT) Franklin Brentwood Williamson 840 65 40 635134_1.wor (NY0086JT) 635134_1.wor (NY0086JT) Nashville Nashville Nashville Nashville Nashville Nashville Nashville Nashville Nashville Nashville Nashville Nashville Nashville Nashville Nashville Nashville Nashville Nashville Nashville Nashville Nashville Nashville Nashville Nashville Nashville Nashville Nashville Nashville Nashville Nashville Nashville Nashville Nashville Nashville Nashville Nashville Nashville Nashville Nashville Nashville Nashville Nashville Nashville Nashville Nashville Nashville Nashville Nashville Nashville Knoxville Knoxville Knoxville Knoxville Knoxville Knoxville Knoxville Knoxville Knoxville Knoxville Knoxville Knoxville Knoxville Knoxville Knoxville Knoxville Knoxville Knoxville Knoxville Knoxville Knoxville Knoxville Knoxville Knoxville Knoxville Knoxville Knoxville Knoxville Knoxville Knoxville Knoxville Knoxville Knoxville Knoxville Knoxville Knoxville Knoxville Knoxville Knoxville Knoxville Knoxville Knoxville Knoxville Knoxville Knoxville Knoxville Knoxville Knoxville Knoxville Memphis Memphis Memphis Memphis Memphis Memphis Memphis Memphis Memphis Memphis Memphis Memphis Memphis Memphis Memphis Memphis Memphis Memphis Memphis Memphis Memphis Memphis Memphis Memphis Memphis Memphis Memphis Memphis Memphis Memphis Memphis Memphis Memphis Memphis Memphis Memphis Memphis Memphis Memphis Memphis Memphis Memphis Memphis Memphis Memphis Memphis Memphis Memphis Memphis (At or for the quarter ended December 31, 2017) ($ in 000s) Assets $3,844 Loans (including loans held for sale) $2,269 Deposits $3,167 Total Equity $305 Tangible Common Equity/Tangible Assets 7.68% Annualized Return on Average Assets (4) 0.26% Annualized Return on Average Equity (4) 3.13% NPAs/Assets 0.12% Middle - TN focused financial holding company, headquartered in Franklin, TN (Located 15 minutes south of Nashville) 13 branches located in demographically attractive and high growth Williamson County(81% of deposits ) (1) and Rutherford County (19% of deposits ) (1) . Founded in 2007 – both locally managed and owned Real estate lending focus (~ 78% of total portfolio) Complementary mortgage origination platform – $442 mm origination volume in 2016; $409 mm in 2017 Robust growth – 39.2% asset CAGR since 2009 Branch Map ($ in millions) Premier Middle - Tennessee Bank $272 $350 $465 $578 $796 $1,356 $2,168 $2,943 $3,844 2009 2010 2011 2012 2013 2014 2015 2016 2017 (3) (4) Return for quarter impacted by the recording of deferred tax impairment that was recorded in December 2017 related to the change in income tax regulations that resulted from the Tax Cuts and Jobs Act that was passed in late December 2017.
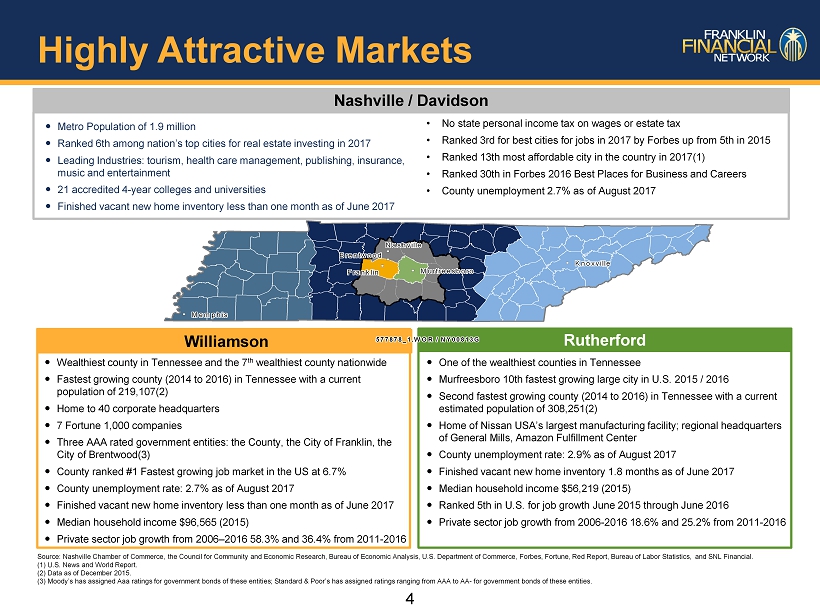
4 Ranked 30 th in Forbes 2016 Best Places for Business and Careers Metro Population of 1.9 million Ranked 6th among nation’s top cities for real estate investing in 2017 Leading Industries: tourism, health care management, publishing, insurance, music and entertainment 21 accredited 4 - year colleges and universities Finished vacant new home inventory less than one month as of June 2017 Source: Nashville Chamber of Commerce, the Council for Community and Economic Research, Bureau of Economic Analysis, U.S. Dep art ment of Commerce, Forbes, Fortune, Red Report, Bureau of Labor Statistics, and SNL Financial. (1) U.S. News and World Report. (2) Data as of December 2015. (3) Moody’s has assigned Aaa ratings for government bonds of these entities; Standard & Poor’s has assigned ratings ranging from AAA to AA - for government b onds of these entities. Nashville / Davidson • No state personal income tax on wages or estate tax • Ranked 3rd for best cities for jobs in 2017 by Forbes up from 5th in 2015 • Ranked 13th most affordable city in the country in 2017(1) • Ranked 30th in Forbes 2016 Best Places for Business and Careers • County unemployment 2.7% as of August 2017 Wealthiest county in Tennessee and the 7 th wealthiest county nationwide Fastest growing county (2014 to 2016) in Tennessee with a current population of 219,107(2) Home to 40 corporate headquarters 7 Fortune 1,000 companies Three AAA rated government entities: the County, the City of Franklin, the City of Brentwood(3) County ranked #1 Fastest growing job market in the US at 6.7% County unemployment rate: 2.7% as of August 2017 Finished vacant new home inventory less than one month as of June 2017 Median household income $96,565 (2015) Private sector job growth from 2006 – 2016 58.3% and 36.4% from 2011 - 2016 Williamson Rutherford One of the wealthiest counties in Tennessee Murfreesboro 10th fastest growing large city in U.S. 2015 / 2016 Second fastest growing county (2014 to 2016) in Tennessee with a current estimated population of 308,251(2) Home of Nissan USA’s largest manufacturing facility; regional headquarters of General Mills, Amazon Fulfillment Center County unemployment rate: 2.9% as of August 2017 Finished vacant new home inventory 1.8 months as of June 2017 Median household income $56,219 (2015) Ranked 5th in U.S. for job growth June 2015 through June 2016 Private sector job growth from 2006 - 2016 18.6% and 25.2% from 2011 - 2016 577878_1.WOR / NY00813G 577878_1.WOR / NY00813G 577878_1.WOR / NY00813G 577878_1.WOR / NY00813G 577878_1.WOR / NY00813G 577878_1.WOR / NY00813G 577878_1.WOR / NY00813G 577878_1.WOR / NY00813G 577878_1.WOR / NY00813G 577878_1.WOR / NY00813G 577878_1.WOR / NY00813G 577878_1.WOR / NY00813G 577878_1.WOR / NY00813G 577878_1.WOR / NY00813G 577878_1.WOR / NY00813G 577878_1.WOR / NY00813G 577878_1.WOR / NY00813G 577878_1.WOR / NY00813G 577878_1.WOR / NY00813G 577878_1.WOR / NY00813G 577878_1.WOR / NY00813G 577878_1.WOR / NY00813G 577878_1.WOR / NY00813G 577878_1.WOR / NY00813G 577878_1.WOR / NY00813G 577878_1.WOR / NY00813G 577878_1.WOR / NY00813G 577878_1.WOR / NY00813G 577878_1.WOR / NY00813G 577878_1.WOR / NY00813G 577878_1.WOR / NY00813G 577878_1.WOR / NY00813G 577878_1.WOR / NY00813G 577878_1.WOR / NY00813G 577878_1.WOR / NY00813G 577878_1.WOR / NY00813G 577878_1.WOR / NY00813G 577878_1.WOR / NY00813G 577878_1.WOR / NY00813G 577878_1.WOR / NY00813G 577878_1.WOR / NY00813G 577878_1.WOR / NY00813G 577878_1.WOR / NY00813G 577878_1.WOR / NY00813G 577878_1.WOR / NY00813G 577878_1.WOR / NY00813G 577878_1.WOR / NY00813G 577878_1.WOR / NY00813G 577878_1.WOR / NY00813G Nashville Nashville Nashville Nashville Nashville Nashville Nashville Nashville Nashville Nashville Nashville Nashville Nashville Nashville Nashville Nashville Nashville Nashville Nashville Nashville Nashville Nashville Nashville Nashville Nashville Nashville Nashville Nashville Nashville Nashville Nashville Nashville Nashville Nashville Nashville Nashville Nashville Nashville Nashville Nashville Nashville Nashville Nashville Nashville Nashville Nashville Nashville Nashville Nashville Brentwood Brentwood Brentwood Brentwood Brentwood Brentwood Brentwood Brentwood Brentwood Brentwood Brentwood Brentwood Brentwood Brentwood Brentwood Brentwood Brentwood Brentwood Brentwood Brentwood Brentwood Brentwood Brentwood Brentwood Brentwood Brentwood Brentwood Brentwood Brentwood Brentwood Brentwood Brentwood Brentwood Brentwood Brentwood Brentwood Brentwood Brentwood Brentwood Brentwood Brentwood Brentwood Brentwood Brentwood Brentwood Brentwood Brentwood Brentwood Brentwood Franklin Franklin Franklin Franklin Franklin Franklin Franklin Franklin Franklin Franklin Franklin Franklin Franklin Franklin Franklin Franklin Franklin Franklin Franklin Franklin Franklin Franklin Franklin Franklin Franklin Franklin Franklin Franklin Franklin Franklin Franklin Franklin Franklin Franklin Franklin Franklin Franklin Franklin Franklin Franklin Franklin Franklin Franklin Franklin Franklin Franklin Franklin Franklin Franklin Murfreesboro Murfreesboro Murfreesboro Murfreesboro Murfreesboro Murfreesboro Murfreesboro Murfreesboro Murfreesboro Murfreesboro Murfreesboro Murfreesboro Murfreesboro Murfreesboro Murfreesboro Murfreesboro Murfreesboro Murfreesboro Murfreesboro Murfreesboro Murfreesboro Murfreesboro Murfreesboro Murfreesboro Murfreesboro Murfreesboro Murfreesboro Murfreesboro Murfreesboro Murfreesboro Murfreesboro Murfreesboro Murfreesboro Murfreesboro Murfreesboro Murfreesboro Murfreesboro Murfreesboro Murfreesboro Murfreesboro Murfreesboro Murfreesboro Murfreesboro Murfreesboro Murfreesboro Murfreesboro Murfreesboro Murfreesboro Murfreesboro Knoxville Knoxville Knoxville Knoxville Knoxville Knoxville Knoxville Knoxville Knoxville Knoxville Knoxville Knoxville Knoxville Knoxville Knoxville Knoxville Knoxville Knoxville Knoxville Knoxville Knoxville Knoxville Knoxville Knoxville Knoxville Knoxville Knoxville Knoxville Knoxville Knoxville Knoxville Knoxville Knoxville Knoxville Knoxville Knoxville Knoxville Knoxville Knoxville Knoxville Knoxville Knoxville Knoxville Knoxville Knoxville Knoxville Knoxville Knoxville Knoxville Memphis Memphis Memphis Memphis Memphis Memphis Memphis Memphis Memphis Memphis Memphis Memphis Memphis Memphis Memphis Memphis Memphis Memphis Memphis Memphis Memphis Memphis Memphis Memphis Memphis Memphis Memphis Memphis Memphis Memphis Memphis Memphis Memphis Memphis Memphis Memphis Memphis Memphis Memphis Memphis Memphis Memphis Memphis Memphis Memphis Memphis Memphis Memphis Memphis Highly Attractive Markets
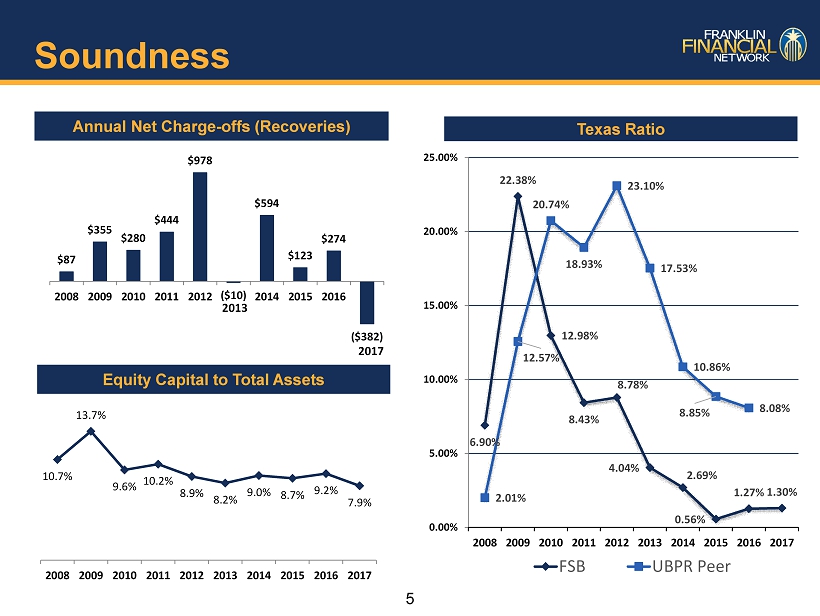
5 Soundness Annual Net Charge - offs (Recoveries) $87 $355 $280 $444 $978 ($10) $594 $123 $274 ($382) 2008 2009 2010 2011 2012 2014 2015 2016 2013 2017 6.90% 22.38% 12.98% 8.43% 8.78% 4.04% 2.69% 0.56% 1.27% 1.30% 2.01% 12.57% 20.74% 18.93% 23.10% 17.53% 10.86% 8.85% 8.08% 0.00% 5.00% 10.00% 15.00% 20.00% 25.00% 2008 2009 2010 2011 2012 2013 2014 2015 2016 2017 FSB UBPR Peer 10.7% 13.7% 9.6% 10.2% 8.9% 8.2% 9.0% 8.7% 9.2% 7.9% 2008 2009 2010 2011 2012 2013 2014 2015 2016 2017 Texas Ratio Equity Capital to Total Assets
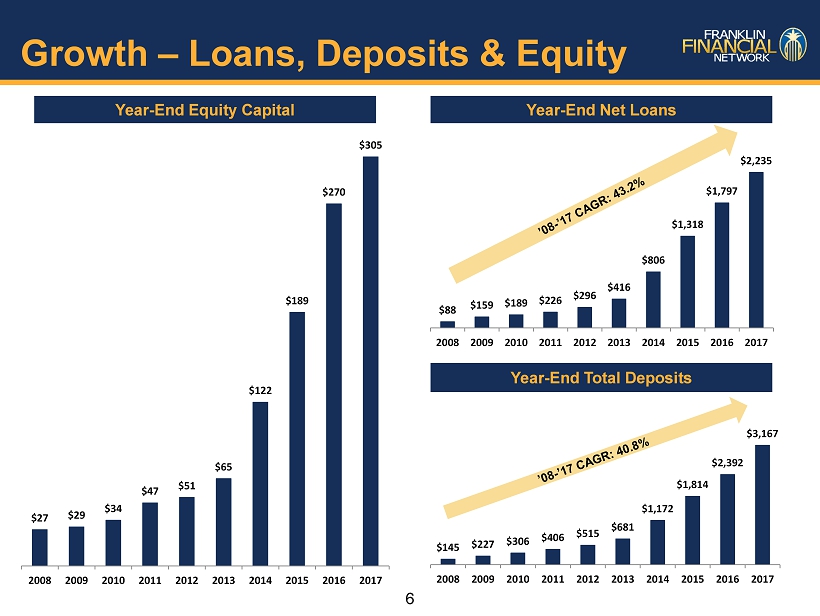
6 Growth – Loans, Deposits & Equity $88 $159 $189 $226 $296 $416 $806 $1,318 $1,797 $2,235 2008 2009 2010 2011 2012 2013 2014 2015 2016 2017 Year - End Total Deposits Year - End Equity Capital $145 $227 $306 $406 $515 $681 $1,172 $1,814 $2,392 $3,167 2008 2009 2010 2011 2012 2013 2014 2015 2016 2017 $27 $29 $34 $47 $51 $65 $122 $189 $270 $305 2008 2009 2010 2011 2012 2013 2014 2015 2016 2017 Year - End Net Loans
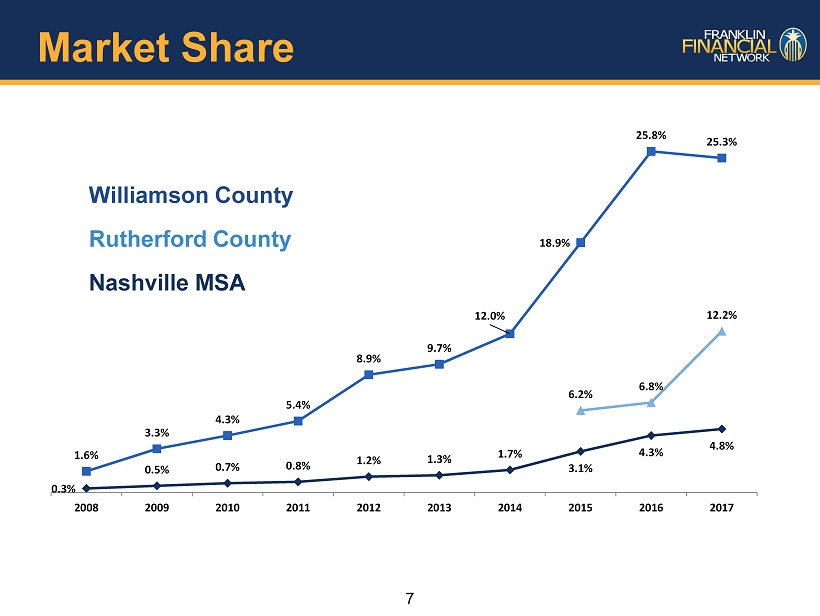
7 Market Share 0.3% 0.5% 0.7% 0.8% 1.2% 1.3% 1.7% 3.1% 4.3% 4.8% 1.6% 3.3% 4.3% 5.4% 8.9% 9.7% 12.0% 18.9% 25.8% 25.3% 6.2% 6.8% 12.2% 2008 2009 2010 2011 2012 2013 2014 2015 2016 2017 Williamson County Rutherford County Nashville MSA
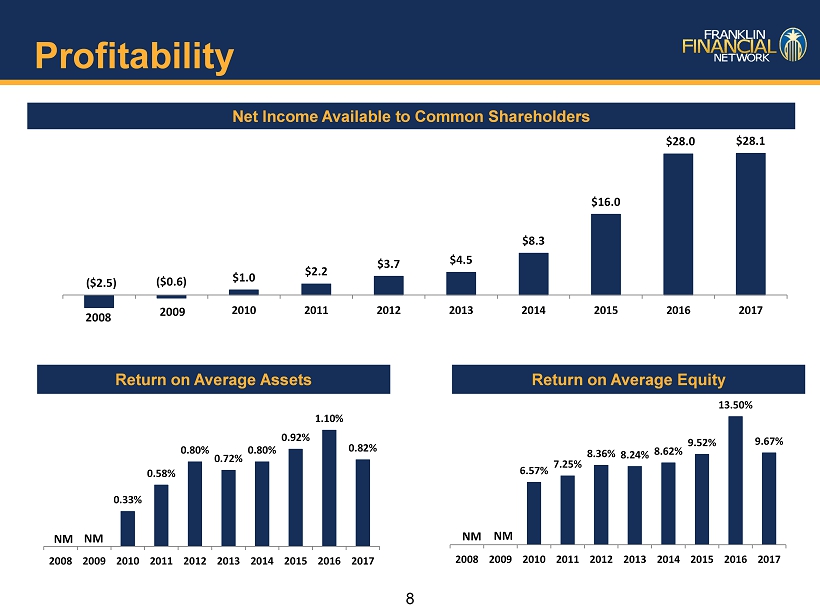
8 Profitability Net Income Available to Common Shareholders ($2.5) ($0.6) $1.0 $2.2 $3.7 $4.5 $8.3 $16.0 $28.0 $28.1 2010 2011 2012 2013 2014 2015 2016 2017 0.33% 0.58% 0.80% 0.72% 0.80% 0.92% 1.10% 0.82% 2008 2009 2010 2011 2012 2013 2014 2015 2016 2017 Return on Average Assets Return on Average Equity 6.57% 7.25% 8.36% 8.24% 8.62% 9.52% 13.50% 9.67% 2008 2009 2010 2011 2012 2013 2014 2015 2016 2017 NM NM 2008 NM 2009 NM
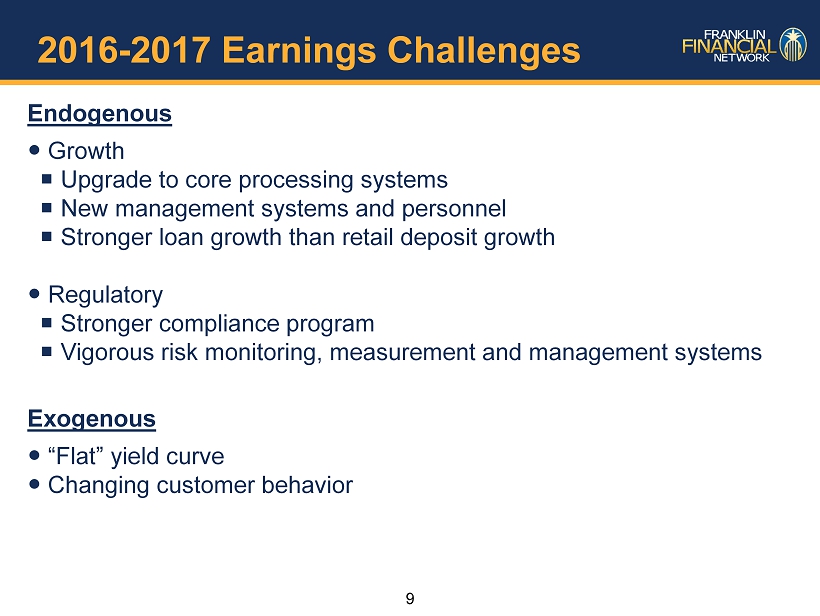
9 2016 - 2017 Earnings Challenges Endogenous Growth Upgrade to core processing systems New management systems and personnel Stronger loan growth than retail deposit growth Regulatory Stronger compliance program Vigorous risk monitoring, measurement and management systems Exogenous “Flat” yield curve Changing customer behavior
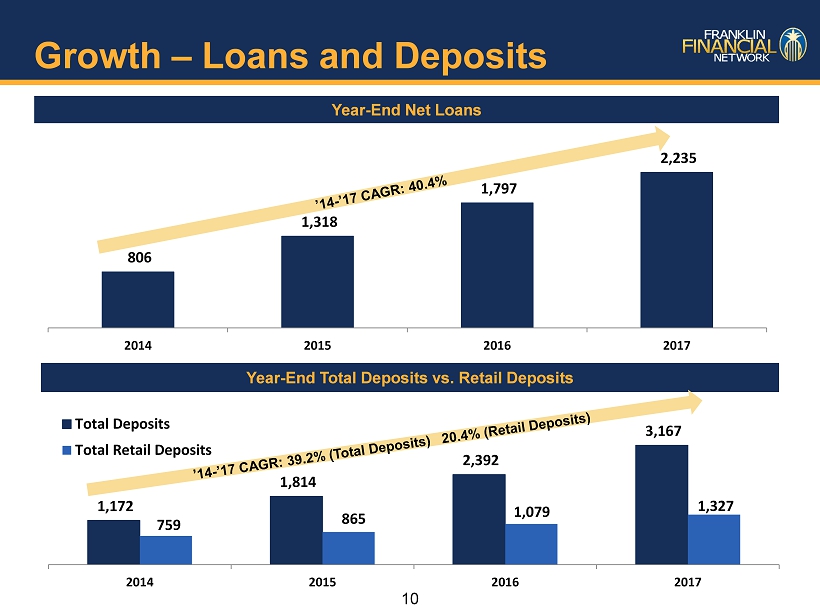
10 Growth – Loans and Deposits 806 1,318 1,797 2,235 2014 2015 2016 2017 Year - End Total Deposits vs. Retail Deposits Year - End Net Loans 1,172 1,814 2,392 3,167 759 865 1,079 1,327 2014 2015 2016 2017 Total Deposits Total Retail Deposits
11 Yield Curve Reality Major FSB line of business: local public funds Strong growth in public funds Profitability matrix: public funds priced in relation to 90 - day Treasury; public funds invested in 3 - 5 year average life, low - risk securities Reality: greater profitability when yield curve is “normal”, as it has been for 9 of last 10 years 2017: Treasury yield curve has flattened throughout the year 4Q17 tactic: shortened investment portfolio to reduce impact on profitability of flat or inverted yield curve
12 Solid Position Entering 2018 Strong foundation established to take advantage of vibrant local economy Systems upgraded to manage continued growth Balance sheet postured for disruptive yield curve changes Received regulatory approvals for new Murfreesboro office and merger with Civic Bank & Trust
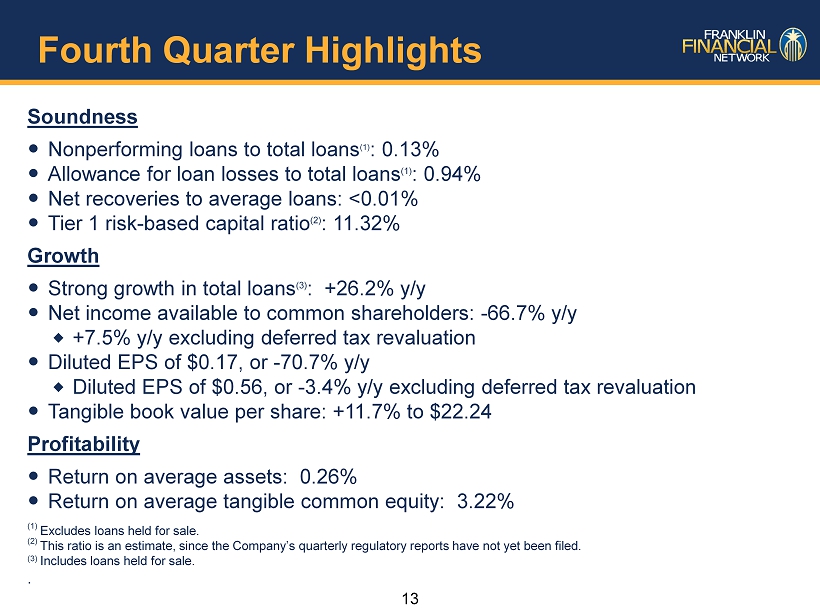
13 Fourth Quarter Highlights Soundness Nonperforming loans to total loans (1) : 0.13% Allowance for loan losses to total loans (1) : 0.94% Net recoveries to average loans: <0.01% Tier 1 risk - based capital ratio (2 ) : 11.32% Growth Strong growth in total loans (3) : +26.2% y/y Net income available to common shareholders: - 66.7% y/y +7.5 % y/y excluding deferred tax revaluation Diluted EPS of $ 0.17, or - 70.7% y/y Diluted EPS of $0.56, or - 3.4% y/y excluding deferred tax revaluation Tangible book value per share: +11.7% to $22.24 Profitability Return on average assets : 0.26% Return on average tangible common equity: 3.22% (1) Excludes loans held for sale . (2) This ratio is an estimate, since the Company’s quarterly regulatory reports have not yet been filed. (3) Includes loans held for sale. .
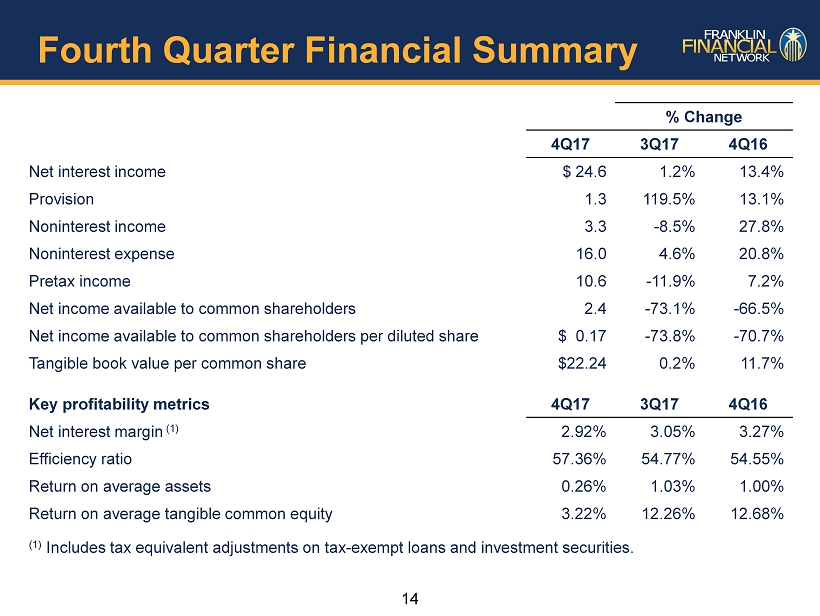
14 Fourth Quarter Financial Summary % Change 4Q17 3Q17 4Q16 Net interest income $ 24.6 1.2% 13.4% Provision 1.3 119.5% 13.1% Noninterest income 3.3 - 8.5% 27.8% Noninterest expense 16.0 4.6% 20.8% Pretax income 10.6 - 11.9% 7.2% Net income available to common shareholders 2.4 - 73.1% - 66.5% Net income available to common shareholders per diluted share $ 0.17 - 73.8% - 70.7% Tangible book value per common share $22.24 0.2% 11.7% Key profitability metrics 4Q17 3Q17 4Q16 Net interest margin (1) 2.92% 3.05% 3.27% Efficiency ratio 57.36% 54.77% 54.55% Return on average assets 0.26% 1.03% 1.00% Return on average tangible common equity 3.22% 12.26% 12.68% (1) Includes tax equivalent adjustments on tax - exempt loans and investment securities.
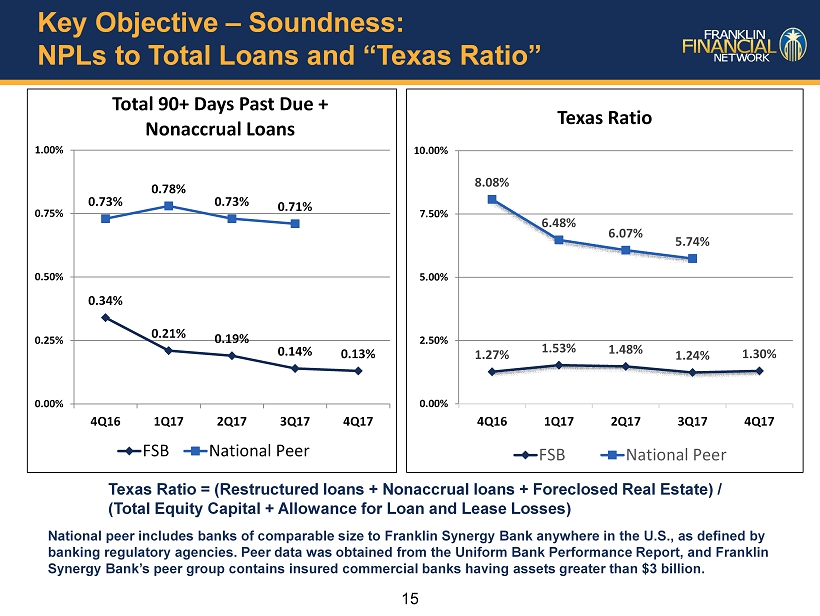
15 Key Objective – Soundness: NPLs to Total Loans and “Texas Ratio” 0.34% 0.21% 0.19% 0.14% 0.13% 0.73% 0.78% 0.73% 0.71% 0.00% 0.25% 0.50% 0.75% 1.00% 4Q16 1Q17 2Q17 3Q17 4Q17 Total 90+ Days Past Due + Nonaccrual Loans FSB National Peer Texas Ratio = (Restructured loans + Nonaccrual loans + Foreclosed Real Estate) / (Total Equity Capital + Allowance for Loan and Lease Losses) 1.27% 1.53% 1.48% 1.24% 1.30% 8.08% 6.48% 6.07% 5.74% 0.00% 2.50% 5.00% 7.50% 10.00% 4Q16 1Q17 2Q17 3Q17 4Q17 Texas Ratio FSB National Peer National peer includes banks of comparable size to Franklin Synergy Bank anywhere in the U.S., as defined by banking regulatory agencies. Peer data was obtained from the Uniform Bank Performance Report, and Franklin Synergy Bank’s peer group contains insured commercial banks having assets greater than $ 3 billion .
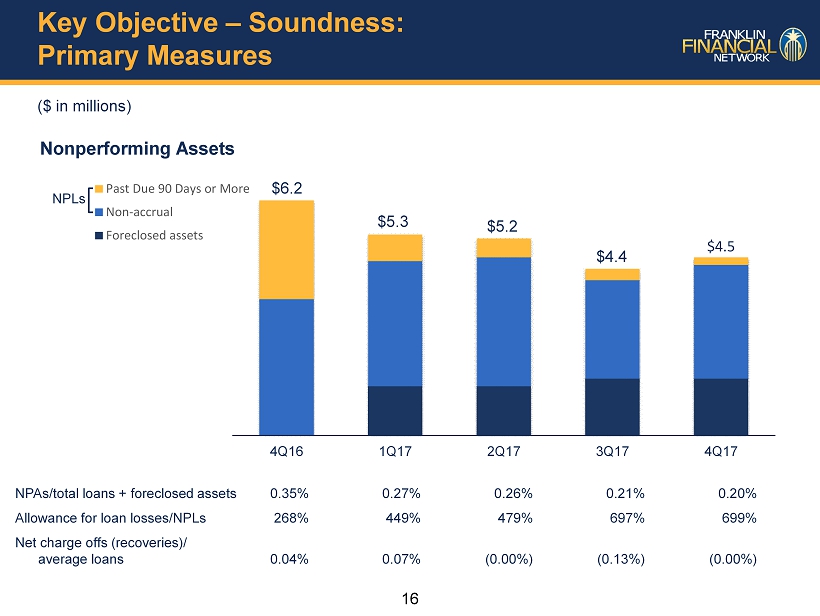
16 Key Objective – Soundness: Primary Measures ($ in millions) Nonperforming Assets 4Q16 1Q17 2Q17 3Q17 4Q17 Past Due 90 Days or More Non-accrual Foreclosed assets $4.5 $6.2 NPLs $4.4 $5.3 $ 5.2 NPAs/total loans + foreclosed assets 0.35% 0.27% 0.26% 0.21% 0.20% Allowance for loan losses/NPLs 268% 449% 479% 697% 699% Net charge offs (recoveries)/ average loans 0.04% 0.07% (0.00%) (0.13%) (0.00%)
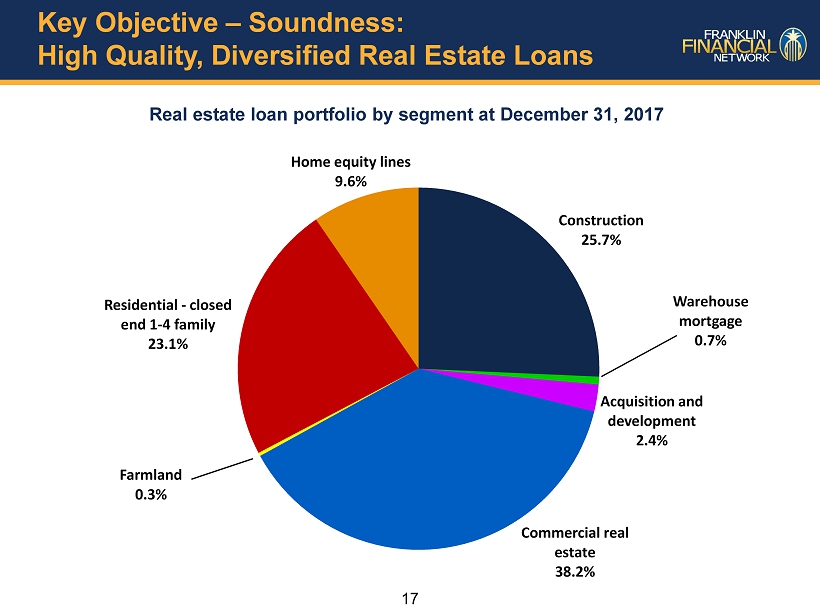
17 Key Objective – Soundness: High Quality, Diversified Real Estate Loans Real estate loan portfolio by segment at December 31, 2017 Construction 25.7% Warehouse mortgage 0.7% Acquisition and development 2.4% Commercial real estate 38.2% Farmland 0.3% Residential - closed end 1 - 4 family 23.1% Home equity lines 9.6%
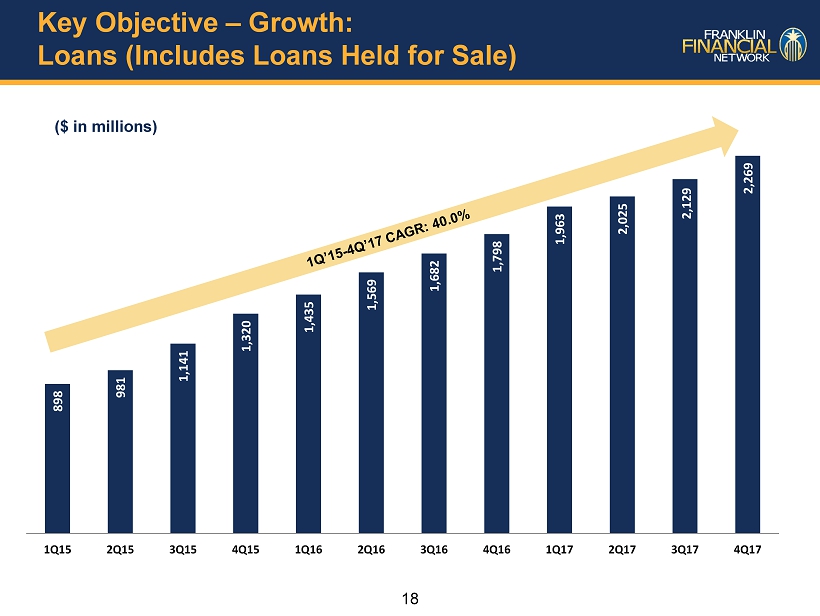
18 Key Objective – Growth: Loans (Includes Loans Held for Sale) 898 981 1,141 1,320 1,435 1,569 1,682 1,798 1,963 2,025 2,129 2,269 1Q15 2Q15 3Q15 4Q15 1Q16 2Q16 3Q16 4Q16 1Q17 2Q17 3Q17 4Q17 ($ in millions)
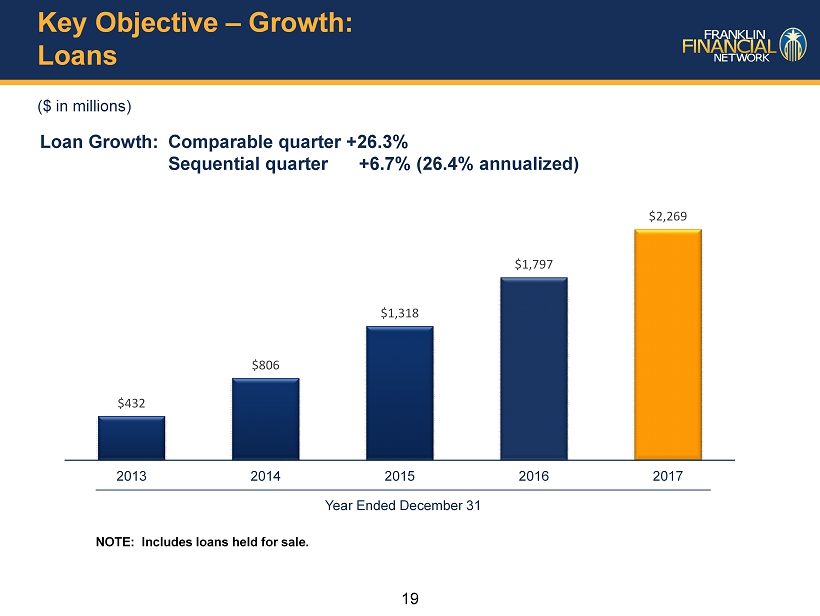
19 Key Objective – Growth: Loans ($ in millions) Loan Growth: Comparable quarter +26.3% Sequential quarter +6.7% (26.4% annualized) $432 $806 $1,318 $1,797 $2,269 2013 2014 2015 2016 2017 Year Ended December 31 NOTE: Includes loans held for sale.
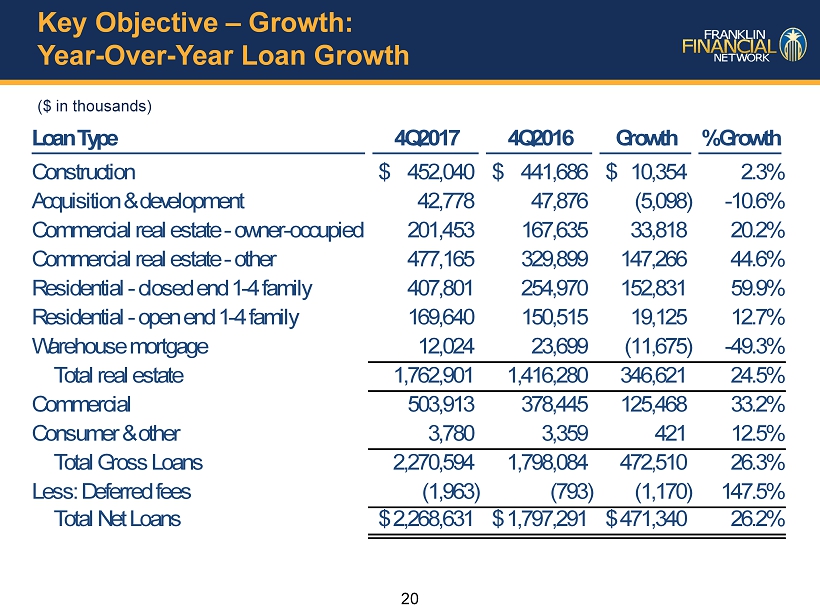
20 Key Objective – Growth: Year - Over - Year Loan Growth Loan Type 4Q2017 4Q2016 Growth % Growth Construction 452,040$ 441,686$ 10,354$ 2.3% Acquisition & development 42,778 47,876 (5,098) -10.6% Commercial real estate - owner-occupied 201,453 167,635 33,818 20.2% Commercial real estate - other 477,165 329,899 147,266 44.6% Residential - closed end 1-4 family 407,801 254,970 152,831 59.9% Residential - open end 1-4 family 169,640 150,515 19,125 12.7% Warehouse mortgage 12,024 23,699 (11,675) -49.3% Total real estate 1,762,901 1,416,280 346,621 24.5% Commercial 503,913 378,445 125,468 33.2% Consumer & other 3,780 3,359 421 12.5% Total Gross Loans 2,270,594 1,798,084 472,510 26.3% Less: Deferred fees (1,963) (793) (1,170) 147.5% Total Net Loans 2,268,631$ 1,797,291$ 471,340$ 26.2% ($ in thousands)
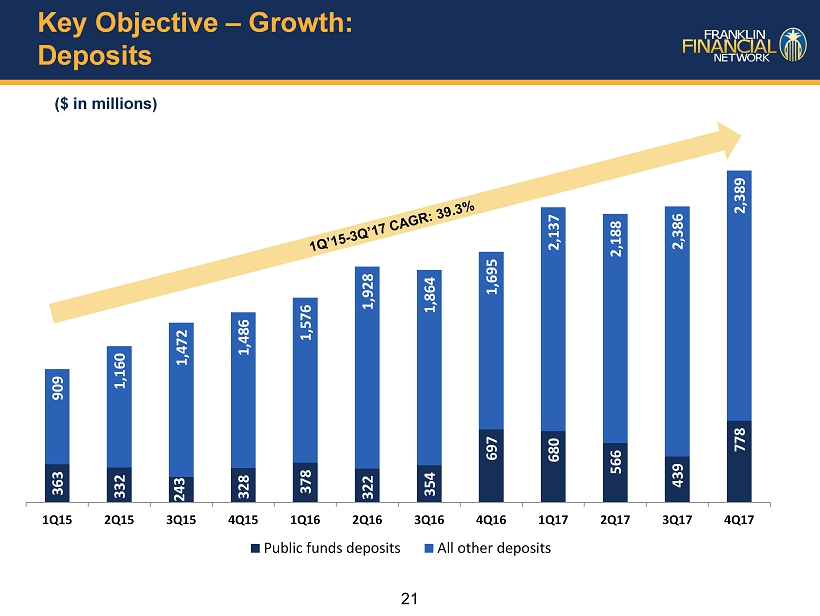
21 Key Objective – Growth: Deposits 363 332 243 328 378 322 354 697 680 566 439 778 909 1,160 1,472 1,486 1,576 1,928 1,864 1,695 2,137 2,188 2,386 2,389 1Q15 2Q15 3Q15 4Q15 1Q16 2Q16 3Q16 4Q16 1Q17 2Q17 3Q17 4Q17 Public funds deposits All other deposits ($ in millions)
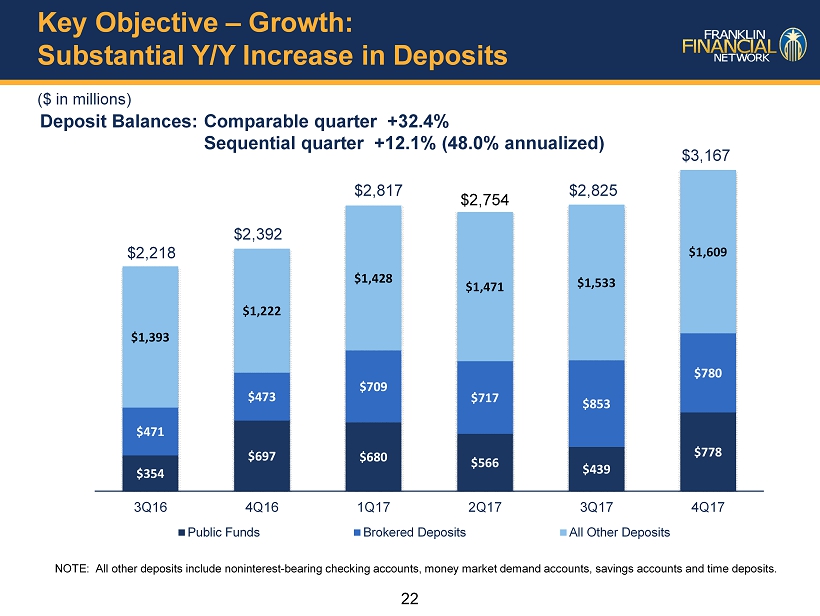
22 Key Objective – Growth: Substantial Y/Y Increase in Deposits ($ in millions) Deposit Balances: Comparable quarter +32.4% Sequential quarter +12.1% (48.0% annualized) $354 $697 $680 $566 $439 $778 $471 $473 $709 $717 $853 $780 $1,393 $1,222 $1,428 $1,471 $1,533 $1,609 3Q16 4Q16 1Q17 2Q17 3Q17 4Q17 Public Funds Brokered Deposits All Other Deposits $2,392 $ 2,825 $2,218 $2,817 $ 2,754 NOTE: All other deposits include noninterest - bearing checking accounts, money market demand accounts, savings accounts and time deposits. $3,167
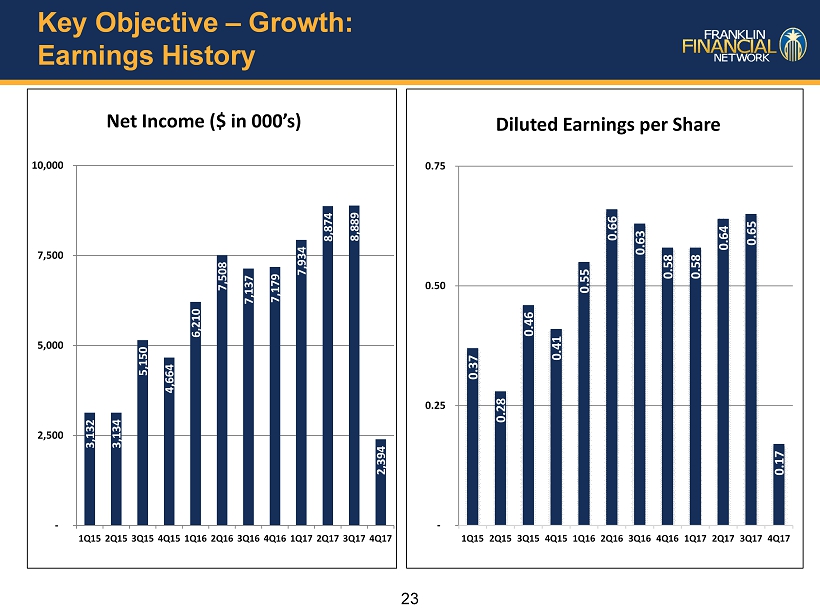
23 Key Objective – Growth: Earnings History 3,132 3,134 5,150 4,664 6,210 7,508 7,137 7,179 7,934 8,874 8,889 2,394 - 2,500 5,000 7,500 10,000 1Q15 2Q15 3Q15 4Q15 1Q16 2Q16 3Q16 4Q16 1Q17 2Q17 3Q17 4Q17 Net Income ($ in 000’s) 0.37 0.28 0.46 0.41 0.55 0.66 0.63 0.58 0.58 0.64 0.65 0.17 - 0.25 0.50 0.75 1Q15 2Q15 3Q15 4Q15 1Q16 2Q16 3Q16 4Q16 1Q17 2Q17 3Q17 4Q17 Diluted Earnings per Share
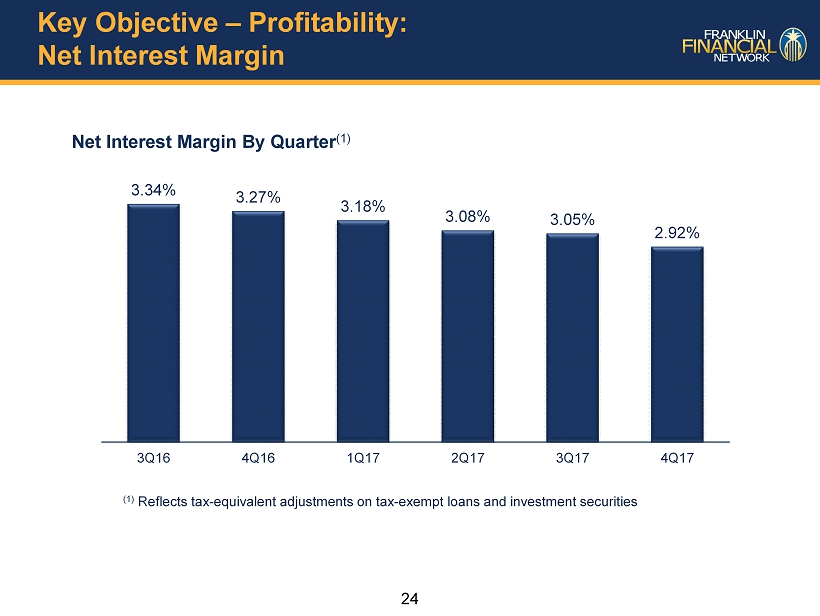
24 Key Objective – Profitability: Net Interest Margin Net Interest Margin By Quarter (1) 3.34% 3.27% 3.18% 3.08% 3.05% 2.92% 3Q16 4Q16 1Q17 2Q17 3Q17 4Q17 (1) Reflects tax - equivalent adjustments on tax - exempt loans and investment securities
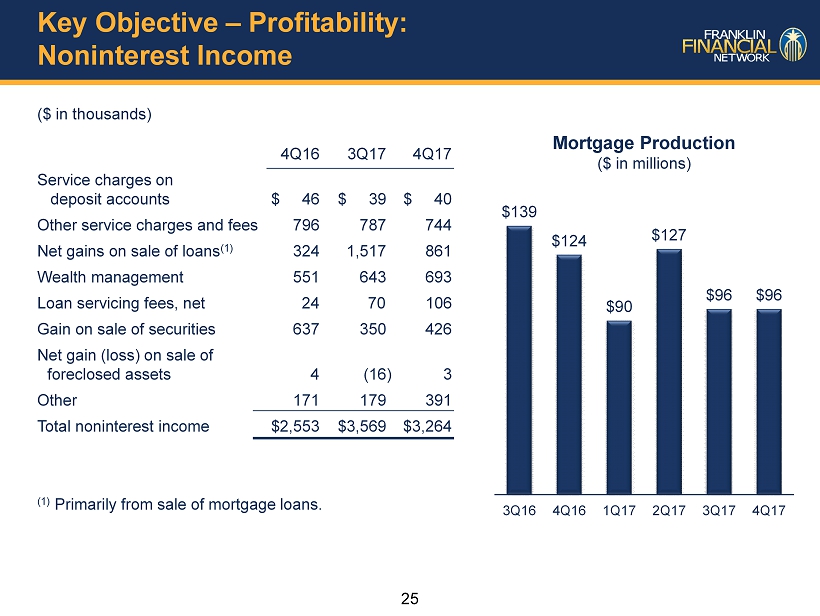
25 Key Objective – Profitability: Noninterest Income ($ in thousands) 4Q16 3Q17 4Q17 Service charges on deposit accounts $ 46 $ 39 $ 40 Other service charges and fees 796 787 744 Net gains on sale of loans (1) 324 1,517 861 Wealth management 551 643 693 Loan servicing fees, net 24 70 106 Gain on sale of securities 637 350 426 Net gain (loss) on sale of foreclosed assets 4 (16) 3 Other 171 179 391 Total noninterest income $2,553 $3,569 $3,264 (1) Primarily from sale of mortgage loans. $139 $124 $90 $127 $96 $96 3Q16 4Q16 1Q17 2Q17 3Q17 4Q17 Mortgage Production ($ in millions)
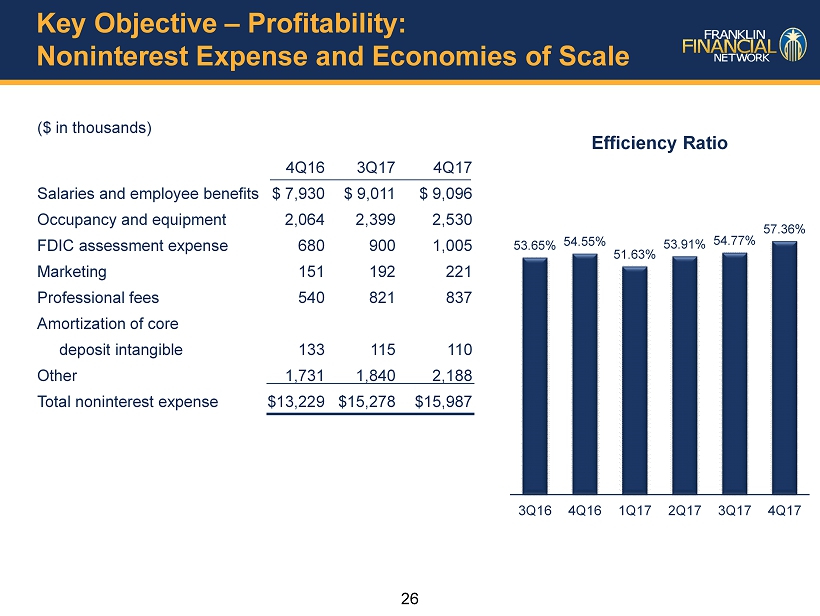
26 Key Objective – Profitability: Noninterest Expense and Economies of Scale ($ in thousands) 4Q16 3Q17 4Q17 Salaries and employee benefits $ 7,930 $ 9,011 $ 9,096 Occupancy and equipment 2,064 2,399 2,530 FDIC assessment expense 680 900 1,005 Marketing 151 192 221 Professional fees 540 821 837 Amortization of core deposit intangible 133 115 110 Other 1,731 1,840 2,188 Total noninterest expense $ 13,229 $ 15,278 $ 15,987 53.65% 54.55% 51.63% 53.91% 54.77% 57.36% 3Q16 4Q16 1Q17 2Q17 3Q17 4Q17 Efficiency Ratio
27 Key Elements of FSB Performance Growth Real Estate Lending Asset Quality Proven, Successful Banking Model