Attached files
| file | filename |
|---|---|
| EX-99.1 - EX-99.1 - INTERNATIONAL BUSINESS MACHINES CORP | a18-3308_2ex99d1.htm |
| 8-K - 8-K - INTERNATIONAL BUSINESS MACHINES CORP | a18-3308_28k.htm |

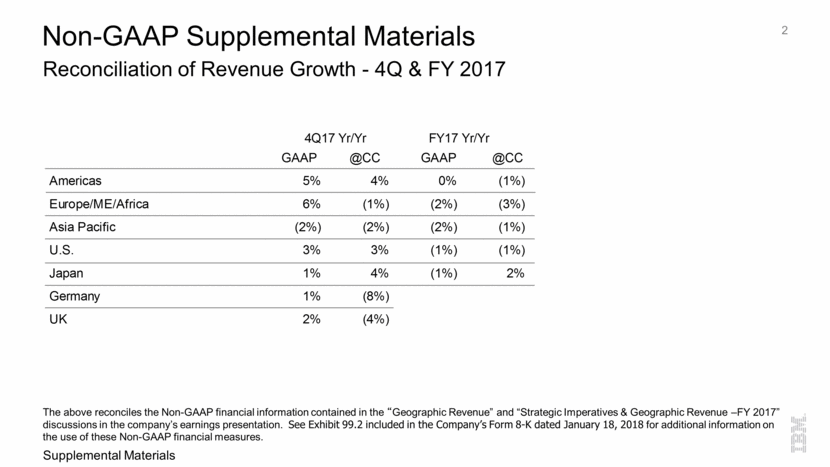
Reconciliation of Revenue Growth - 4Q & FY 2017 2 Non-GAAP Supplemental Materials The above reconciles the Non-GAAP financial information contained in the “Geographic Revenue” and “Strategic Imperatives & Geographic Revenue –FY 2017” discussions in the company’s earnings presentation. See Exhibit 99.2 included in the Company’s Form 8-K dated January 18, 2018 for additional information on the use of these Non-GAAP financial measures. Supplemental Materials GAAP @CC GAAP @CC Americas 5% 4% 0% (1%) Europe/ME/Africa 6% (1%) (2%) (3%) Asia Pacific (2%) (2%) (2%) (1%) U.S. 3% 3% (1%) (1%) Japan 1% 4% (1%) 2% Germany 1% (8%) UK 2% (4%) 4Q17 Yr/Yr FY17 Yr/Yr
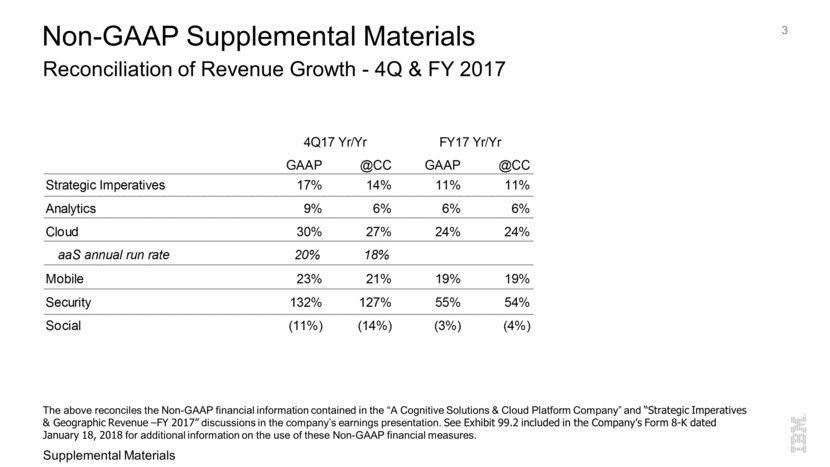
Reconciliation of Revenue Growth - 4Q & FY 2017 3 Non-GAAP Supplemental Materials The above reconciles the Non-GAAP financial information contained in the “A Cognitive Solutions & Cloud Platform Company” and “Strategic Imperatives & Geographic Revenue –FY 2017” discussions in the company’s earnings presentation. See Exhibit 99.2 included in the Company’s Form 8-K dated January 18, 2018 for additional information on the use of these Non-GAAP financial measures. Supplemental Materials GAAP @CC GAAP @CC Strategic Imperatives 17% 14% 11% 11% Analytics 9% 6% 6% 6% Cloud 30% 27% 24% 24% aaS annual run rate 20% 18% Mobile 23% 21% 19% 19% Security 132% 127% 55% 54% Social (11%) (14%) (3%) (4%) 4Q17 Yr/Yr FY17 Yr/Yr
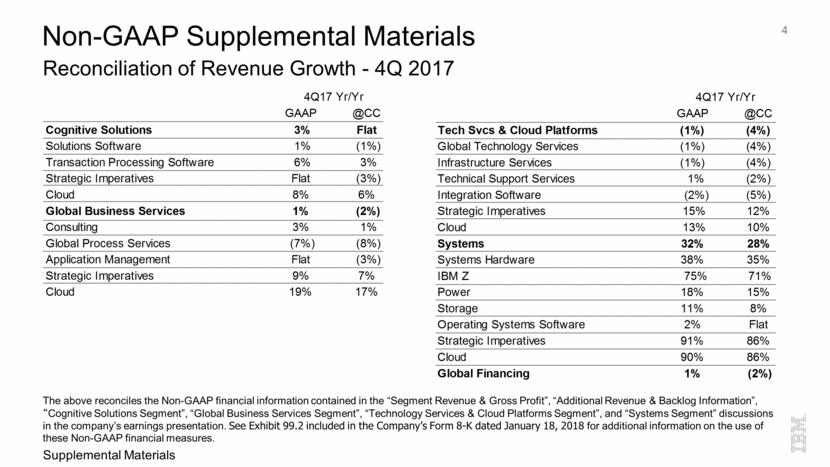
Reconciliation of Revenue Growth - 4Q 2017 4 Non-GAAP Supplemental Materials The above reconciles the Non-GAAP financial information contained in the “Segment Revenue & Gross Profit”, “Additional Revenue & Backlog Information”, “Cognitive Solutions Segment”, “Global Business Services Segment”, “Technology Services & Cloud Platforms Segment”, and “Systems Segment” discussions in the company’s earnings presentation. See Exhibit 99.2 included in the Company’s Form 8-K dated January 18, 2018 for additional information on the use of these Non-GAAP financial measures. Supplemental Materials GAAP @CC Cognitive Solutions 3% Flat Solutions Software 1% (1%) Transaction Processing Software 6% 3% Strategic Imperatives Flat (3%) Cloud 8% 6% Global Business Services 1% (2%) Consulting 3% 1% Global Process Services (7%) (8%) Application Management Flat (3%) Strategic Imperatives 9% 7% Cloud 19% 17% 4Q17 Yr/Yr GAAP @CC Tech Svcs & Cloud Platforms (1%) (4%) Global Technology Services (1%) (4%) Infrastructure Services (1%) (4%) Technical Support Services 1% (2%) Integration Software (2%) (5%) Strategic Imperatives 15% 12% Cloud 13% 10% Systems 32% 28% Systems Hardware 38% 35% IBM Z 75% 71% Power 18% 15% Storage 11% 8% Operating Systems Software 2% Flat Strategic Imperatives 91% 86% Cloud 90% 86% Global Financing 1% (2%) 4Q17 Yr/Yr
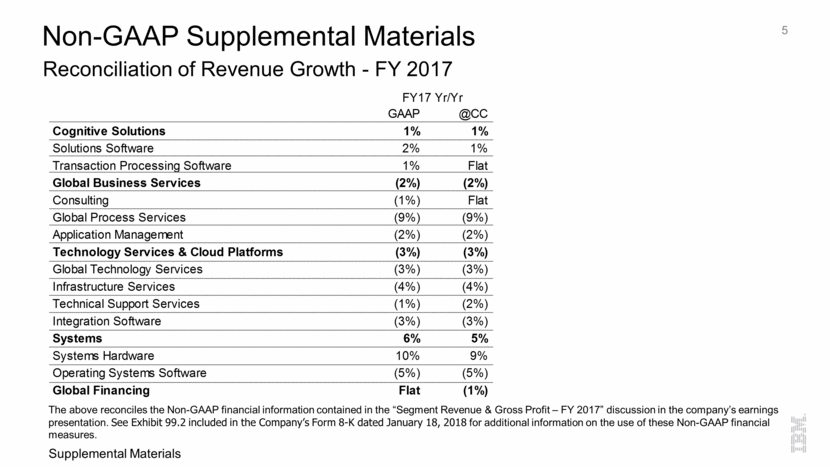
Reconciliation of Revenue Growth - FY 2017 5 Non-GAAP Supplemental Materials The above reconciles the Non-GAAP financial information contained in the “Segment Revenue & Gross Profit – FY 2017” discussion in the company’s earnings presentation. See Exhibit 99.2 included in the Company’s Form 8-K dated January 18, 2018 for additional information on the use of these Non-GAAP financial measures. Supplemental Materials GAAP @CC Cognitive Solutions 1% 1% Solutions Software 2% 1% Transaction Processing Software 1% Flat Global Business Services (2%) (2%) Consulting (1%) Flat Global Process Services (9%) (9%) Application Management (2%) (2%) Technology Services & Cloud Platforms (3%) (3%) Global Technology Services (3%) (3%) Infrastructure Services (4%) (4%) Technical Support Services (1%) (2%) Integration Software (3%) (3%) Systems 6% 5% Systems Hardware 10% 9% Operating Systems Software (5%) (5%) Global Financing Flat (1%) FY17 Yr/Yr
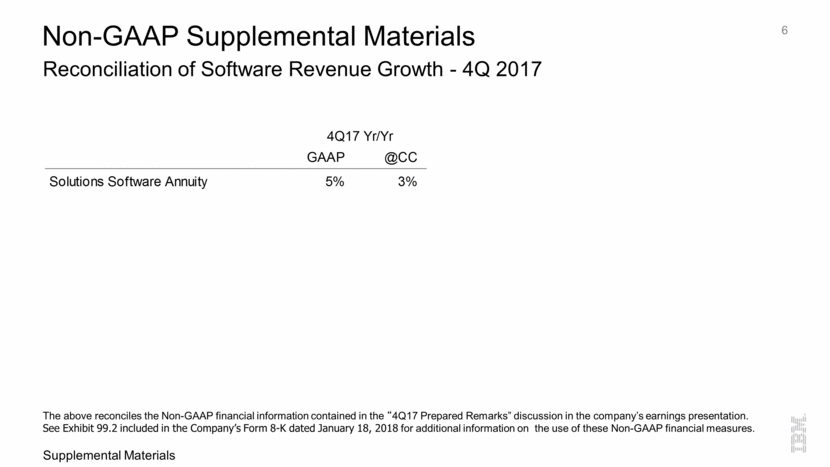
Reconciliation of Software Revenue Growth - 4Q 2017 6 Non-GAAP Supplemental Materials The above reconciles the Non-GAAP financial information contained in the “4Q17 Prepared Remarks” discussion in the company’s earnings presentation. See Exhibit 99.2 included in the Company’s Form 8-K dated January 18, 2018 for additional information on the use of these Non-GAAP financial measures. Supplemental Materials GAAP @CC Solutions Software Annuity 5% 3% 4Q17 Yr/Yr
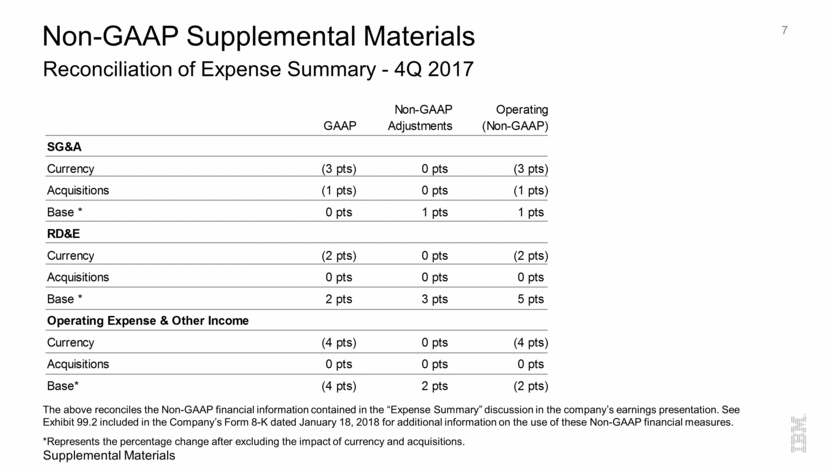
Reconciliation of Expense Summary - 4Q 2017 7 Non-GAAP Supplemental Materials The above reconciles the Non-GAAP financial information contained in the “Expense Summary” discussion in the company’s earnings presentation. See Exhibit 99.2 included in the Company’s Form 8-K dated January 18, 2018 for additional information on the use of these Non-GAAP financial measures. *Represents the percentage change after excluding the impact of currency and acquisitions. Supplemental Materials Non-GAAP Operating GAAP Adjustments (Non-GAAP) SG&A Currency (3 pts) 0 pts (3 pts) Acquisitions (1 pts) 0 pts (1 pts) Base * 0 pts 1 pts 1 pts RD&E Currency (2 pts) 0 pts (2 pts) Acquisitions 0 pts 0 pts 0 pts Base * 2 pts 3 pts 5 pts Operating Expense & Other Income Currency (4 pts) 0 pts (4 pts) Acquisitions 0 pts 0 pts 0 pts Base* (4 pts) 2 pts (2 pts)
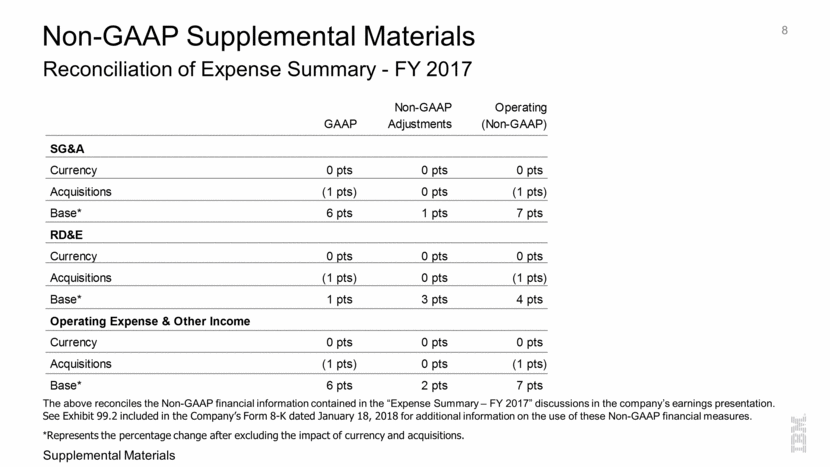
Reconciliation of Expense Summary - FY 2017 8 Non-GAAP Supplemental Materials The above reconciles the Non-GAAP financial information contained in the “Expense Summary – FY 2017” discussions in the company’s earnings presentation. See Exhibit 99.2 included in the Company’s Form 8-K dated January 18, 2018 for additional information on the use of these Non-GAAP financial measures. *Represents the percentage change after excluding the impact of currency and acquisitions. Supplemental Materials Non-GAAP Operating GAAP Adjustments (Non-GAAP) SG&A Currency 0 pts 0 pts 0 pts Acquisitions (1 pts) 0 pts (1 pts) Base* 6 pts 1 pts 7 pts RD&E Currency 0 pts 0 pts 0 pts Acquisitions (1 pts) 0 pts (1 pts) Base* 1 pts 3 pts 4 pts Operating Expense & Other Income Currency 0 pts 0 pts 0 pts Acquisitions (1 pts) 0 pts (1 pts) Base* 6 pts 2 pts 7 pts
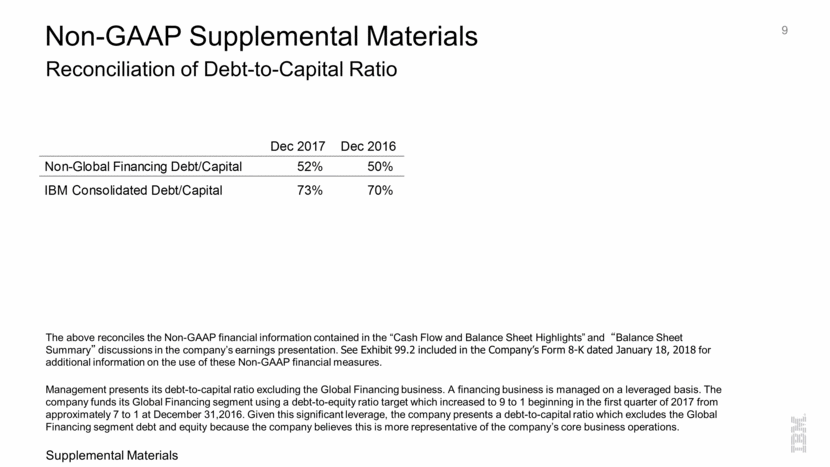
Reconciliation of Debt-to-Capital Ratio 9 Non-GAAP Supplemental Materials Supplemental Materials The above reconciles the Non-GAAP financial information contained in the “Cash Flow and Balance Sheet Highlights” and “Balance Sheet Summary” discussions in the company’s earnings presentation. See Exhibit 99.2 included in the Company’s Form 8-K dated January 18, 2018 for additional information on the use of these Non-GAAP financial measures. Management presents its debt-to-capital ratio excluding the Global Financing business. A financing business is managed on a leveraged basis. The company funds its Global Financing segment using a debt-to-equity ratio target which increased to 9 to 1 beginning in the first quarter of 2017 from approximately 7 to 1 at December 31,2016. Given this significant leverage, the company presents a debt-to-capital ratio which excludes the Global Financing segment debt and equity because the company believes this is more representative of the company’s core business operations. Dec 2017 Dec 2016 Non-Global Financing Debt/Capital 52% 50% IBM Consolidated Debt/Capital 73% 70%
10 ibm.com/investor