Attached files
| file | filename |
|---|---|
| EX-99.1 - EXHIBIT 99.1 - FIRST HORIZON CORP | a4q17financialsupplement.htm |
| 8-K - 8-K - FIRST HORIZON CORP | a4q17financialsupplement8-.htm |

First Horizon National Corporation
Fourth Quarter 2017 Earnings
January 19, 2018
2
Portions of this presentation use non-GAAP financial information. Each of those portions is so noted, and a
reconciliation of that non-GAAP information to comparable GAAP information is provided in a footnote or in the
appendix at the end of this presentation.
This presentation contains forward-looking statements, which may include guidance, involving significant risks and
uncertainties which will be identified by words such as “believe”,“expect”,“anticipate”,“intend”,“estimate”,
“should”,“is likely”,“will”,“going forward” and other expressions that indicate future events and trends and may be
followed by or reference cautionary statements. A number of factors could cause actual results to differ materially
from those in the forward-looking statements. These factors are outlined in our recent earnings and other press
releases and in more detail in the most current 10-Q and 10-K. FHN disclaims any obligation to update any such
forward-looking statements or to publicly announce the result of any revisions to any of the forward-looking
statements to reflect future events or developments.
3
All comparisons are FY 2016 Reported vs FY 2017 Adjusted. Comparisons to FY 2016 adjusted are not meaningful.
1 Adjusted EPS, Adjusted ROA, ROTCE and Adjusted ROTCE are Non-GAAP numbers and are reconciled in the appendix.
Adjusted numbers exclude notable items as outlined on slide 14.
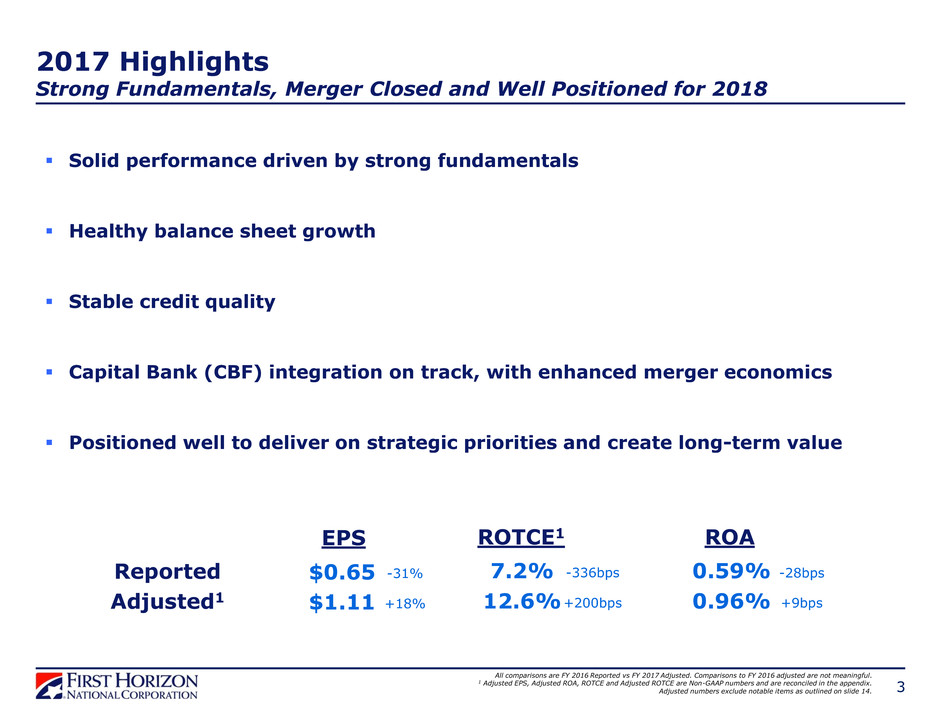
2017 Highlights
Strong Fundamentals, Merger Closed and Well Positioned for 2018
Solid performance driven by strong fundamentals
Healthy balance sheet growth
Stable credit quality
Capital Bank (CBF) integration on track, with enhanced merger economics
Positioned well to deliver on strategic priorities and create long-term value
Reported
Adjusted1
$0.65
$1.11
7.2%
12.6%
0.59%
0.96%
-28bps
+9bps
-336bps
+200bps
-31%
+18%
EPS ROTCE1 ROA
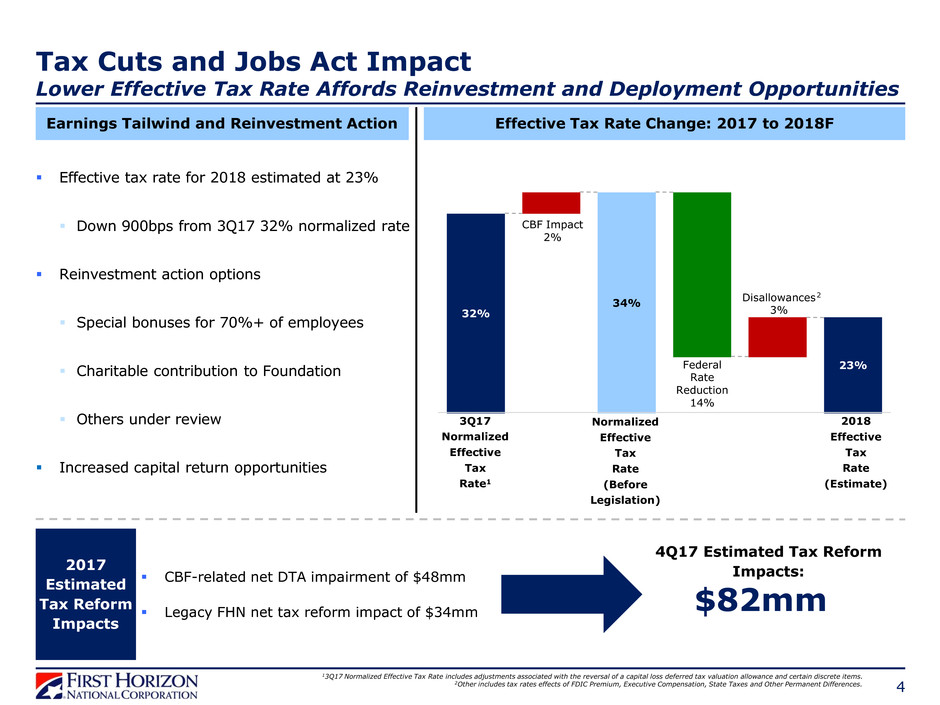
Effective tax rate for 2018 estimated at 23%
Down 900bps from 3Q17 32% normalized rate
Reinvestment action options
Special bonuses for 70%+ of employees
Charitable contribution to Foundation
Others under review
Increased capital return opportunities
Tax Cuts and Jobs Act Impact
Lower Effective Tax Rate Affords Reinvestment and Deployment Opportunities
13Q17 Normalized Effective Tax Rate includes adjustments associated with the reversal of a capital loss deferred tax valuation allowance and certain discrete items.
2Other includes tax rates effects of FDIC Premium, Executive Compensation, State Taxes and Other Permanent Differences. 4
CBF-related net DTA impairment of $48mm
Legacy FHN net tax reform impact of $34mm
2017
Estimated
Tax Reform
Impacts
4Q17 Estimated Tax Reform
Impacts:
$82mm
Earnings Tailwind and Reinvestment Action Effective Tax Rate Change: 2017 to 2018F
32%
CBF Impact
2%
34%
Federal
Rate
Reduction
14%
Disallowances
3%
23%
3Q17
Normalized
Effective
Tax
Rate1
Normalized
Effective
Tax
Rate
(Before
Legislation)
2018
Effective
Tax
Rate
(Estimate)
2
FINANCIAL RESULTS
5
6
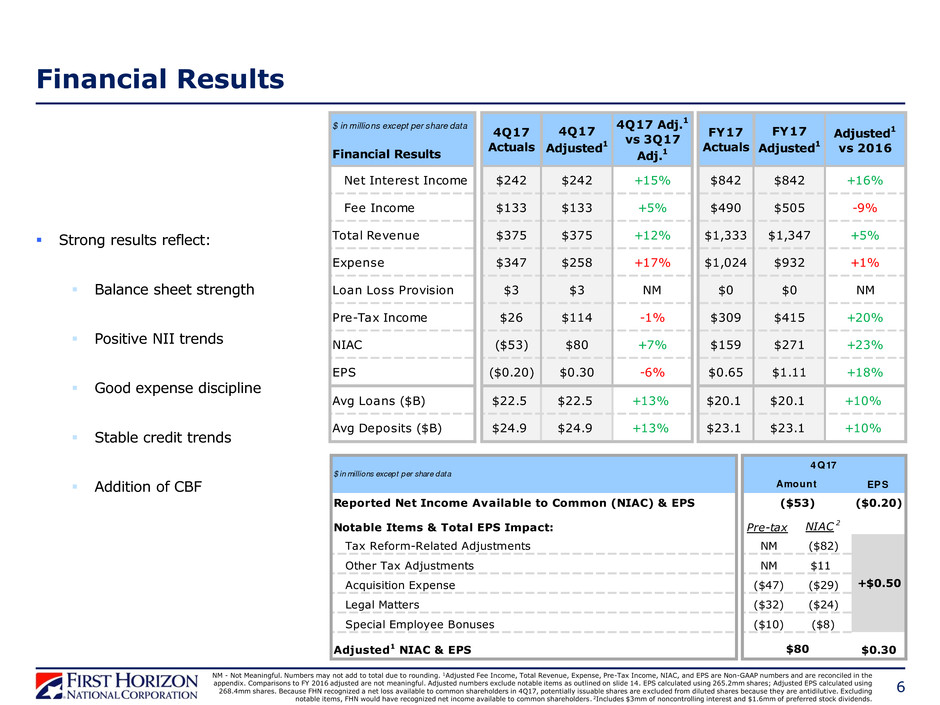
Financial Results
NM - Not Meaningful. Numbers may not add to total due to rounding. 1Adjusted Fee Income, Total Revenue, Expense, Pre-Tax Income, NIAC, and EPS are Non-GAAP numbers and are reconciled in the
appendix. Comparisons to FY 2016 adjusted are not meaningful. Adjusted numbers exclude notable items as outlined on slide 14. EPS calculated using 265.2mm shares; Adjusted EPS calculated using
268.4mm shares. Because FHN recognized a net loss available to common shareholders in 4Q17, potentially issuable shares are excluded from diluted shares because they are antidilutive. Excluding
notable items, FHN would have recognized net income available to common shareholders. 2Includes $3mm of noncontrolling interest and $1.6mm of preferred stock dividends.
EPS
Reported Net Income Available to Common (NIAC) & EPS ($0.20)
Notable Items & Total EPS Impact: Pre-tax NIAC
2
Tax Reform-Related Adjustments NM ($82)
Other Tax Adjustments NM $11
Acquisition Expense ($47) ($29)
Legal Matters ($32) ($24)
Special Employee Bonuses ($10) ($8)
Adjusted1 NIAC & EPS $0.30
+$0.50
$80
$ in millions except per share data
4Q17
Amount
($53)
Net Interest Income $242 $242 +15% $842 $842 +16%
Fee Income $133 $133 +5% $490 $505 -9%
Total Revenue $375 $375 +12% $1,333 $1,347 +5%
Expense $347 $258 +17% $1,024 $932 +1%
Loan Loss Provision $3 $3 NM $0 $0 NM
Pre-Tax Income $26 $114 -1% $309 $415 +20%
NIAC ($53) $80 +7% $159 $271 +23%
EPS ($0.20) $0.30 -6% $0.65 $1.11 +18%
Avg Loans ($B) $22.5 $22.5 +13% $20.1 $20.1 +10%
Avg Deposits ($B) $24.9 $24.9 +13% $23.1 $23.1 +10%
FY17
Adjusted1
Adjusted1
vs 2016
$ in millions except per share data
Financial Results
4Q17
Actuals
FY17
Actuals
4Q17
Adjusted1
4Q17 Adj.1
vs 3Q17
Adj.1
Strong results reflect:
Balance sheet strength
Positive NII trends
Good expense discipline
Stable credit trends
Addition of CBF
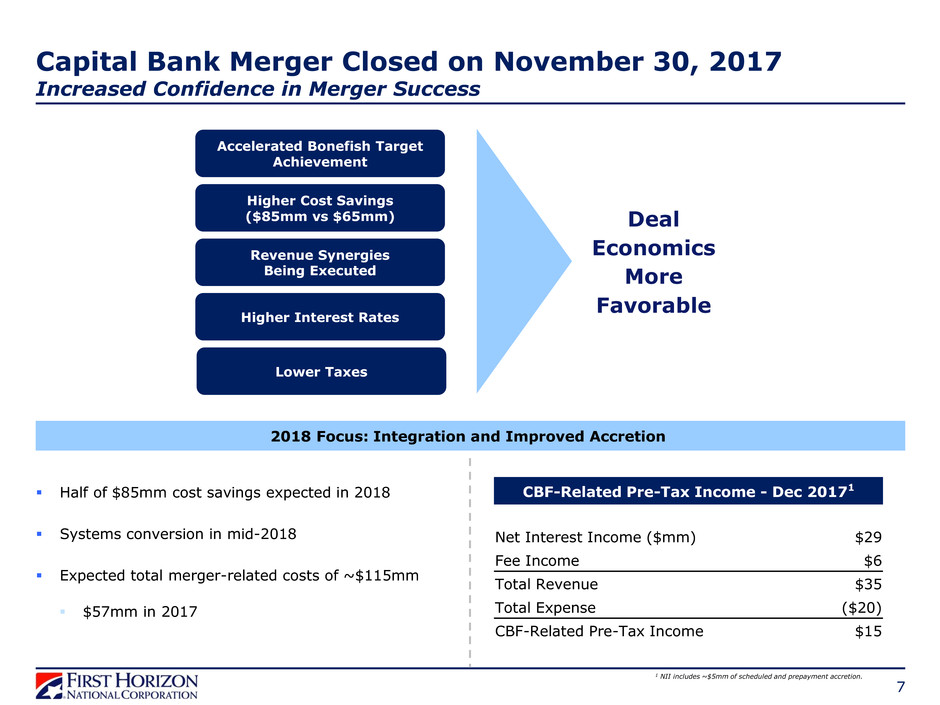
Capital Bank Merger Closed on November 30, 2017
Increased Confidence in Merger Success
1 NII includes ~$5mm of scheduled and prepayment accretion.
7
Accelerated Bonefish Target
Achievement
Higher Cost Savings
($85mm vs $65mm)
Revenue Synergies
Being Executed
Higher Interest Rates
Lower Taxes
Deal
Economics
More
Favorable
Half of $85mm cost savings expected in 2018
Systems conversion in mid-2018
Expected total merger-related costs of ~$115mm
$57mm in 2017
2018 Focus: Integration and Improved Accretion
CBF-Related Pre-Tax Income - Dec 20171
Net Interest Income ($mm) $29
Fee Income $6
Total Revenue $35
Total Expense ($20)
CBF-Related Pre-Tax Income $15

$196 $190
$201 $210
$242
2.70%
2.80%
2.90%
3.00%
3.10%
3.20%
3.30%
$140
$160
$180
$200
$220
$240
$260
4Q16 1Q17 2Q17 3Q17 4Q17
NII (left axis) NIM (right axis)
8
Net Interest Income Sensitivity Impact1
Net Interest Income and Net Interest Margin
Strong NII Growth and Margin Expansion
NII and NIM increases driven by:
Accretion from CBF loans
Increase in short term rates
Total deposits rate paid at 39bps vs 36bps LQ
Total consumer deposits rate paid declined 3bps LQ
Net interest spread up 9bps LQ, reflecting higher loan
yields and steady deposit costs
Estimated accretion of ~$30mm in 2018
NIM Expansion and Loan Growth Drive NII Increase
NII and NIM Linked-Quarter Change Drivers
LQ – 4Q17 vs 3Q17. Numbers may not add to total due to rounding.
1NII sensitivity analysis uses FHN’s balance sheet as of 4Q17. Bps impact assumes increase in Fed Funds rate. 2Core refers to before accretion.
NII up 24%
+0.9%
+1.8%
+3.3%
$11mm
$21mm
$39mm
0%
1%
2%
3%
4%
+25bps +50bps +100bps
NII NIM
3Q17 209.8 3.19%
+$24.2 +2bps
+$3.0 +4bps
+$1.7 +2bps
+$2.2 +3bps
+$1.2 -3bps
4Q17 $242.1 3.27%
($ in millions)
CBF Core²
CBF Scheduled Accretion
CBF Prep yment Accretion
Other
Higher Rates

9
Loan Growth Diversified Across Multiple Businesses
CBF Merger Enhances Regional Banking Loan Portfolio
Regional Banking 4Q17 Average Loan Growth by Lending Area
LQ – Linked Quarter. YOY - Year over Year. Numbers may not add to total due to rounding.
1Period-end loan growth attributable to CBF is reduced by approximately two-thirds in the averaging process because CBF merger closed on November 30.
2Other includes Business Banking, Correspondent, Loans to Mortgage Companies, Energy, and Franchise Finance.
Loan portfolio diversified by various lending areas and
geographic markets
Economic profit and RAROC focus drives loan mix shift
to higher return specialty areas
Continued strong loan growth in expansion markets
and higher-return specialty lending areas
Average commercial loans up 19% YOY and 13% LQ
Regional Banking period-end loans at $26B
$18.4B
$21.1B
+$86mm
+$81mm
+$92mm
+$73mm
-$35mm
-$6mm
+$2mm
+$8mm
+$9mm
+$39mm
+$870mm
+$1,526mm
3Q17 Asset-Based
Lending
Private Client/
Wealth Mgmt
Healthcare Commercial Real
Estate
Consumer Commercial &
Other²
4Q17
Avg. Loan Growth (ex-CBF) Avg. Loan Growth Attributable to CBF¹
4Q17 Average Regional Bank Commercial Loans
Healthcare 4%
Correspondent 3%
Energy 1%
Specialty
Areas
Commercial
Real Estate
15%
Loans to
Mortgage
Companies
12%
Franchise
Finance 4%
Commercial
38% Asset Based
Lending
12%
Corporate 6%
Business Banking
6%

-0.20%
0.00%
0.20%
0.40%
0.60%
-$5
$0
$5
$10
$15
4Q16 1Q17 2Q17 3Q17 4Q17
NCOs $ Provision $ NCO %¹ (Right Axis)
10
Allowance for Loan Losses Net Charge-Offs (NCOs)
Asset Quality
Stable Credit Trends Reflect Strong Underwriting Discipline
Credit quality environment remains stable
Allowance to loans ratio at 69bps
$7B of marked CBF loans not reflected in allowance
Net charge-offs increased $6mm in 4Q17, primarily
driven by a single large credit
Numbers may not add to total due to rounding.
1 Net charge-off % is annualized and as % of average loans.
Asset Quality Highlights
($ in B) ($ in millions)
$20 $19 $20
$20
$28
103bps 106bps 99bps 97bps 69bps
50bps
100bps
150bps
200bps
$10
$15
$20
$25
$30
4Q16 1Q17 2Q17 3Q17 4Q17
Total Period-end Loans ALLL to Loans Ratio
(Right Axis)
$7B in marked
CBF loans
($ in millions) 4Q16 1Q17 2Q17 3Q17 4Q17
Charge-offs ($11) ($8) ($10) ($11) ($17)
Recoveries $12 $9 $7 $8 $9
Net Charge-offs/
(Recoveries)
($1) ($1) $3 $2 $8
Provision/(Credit) $0 ($1) ($2) $0 $3

11
1 ROTCE, ROA, NIM, and NCO / Average Loans are annualized. ROTCE is a Non-GAAP number and reconciled in the appendix.
2 Current period is an estimate; estimate does not include the favorable impact of reclassification from AOCI to retained earnings of ~$58mm
in connection with tax law change per bank regulatory guidance issued on January 18, 2018.
3 Adjusted ROTCE, ROA and Efficiency Ratio are Non-GAAP and are reconciled to the comparative GAAP numbers ROE, ROA and Efficiency Ratio in the appendix
Targeting Bonefish Levels by 2019
Focused on Improving Profitability and Efficiency to
Drive Sustainable Earnings Power
FY 2017
Reported (GAAP)
FY 2017
Adjusted3
Bonefish Targets
Expect to
Achieve in
2019
ROTCE1 7.2% 12.6% 15.0%+
ROA 0.59% 0.96% 1.10 – 1.30%
CET12 8.7% 8.7% 8.0 – 9.0%
NIM 3.12% 3.12% 3.25 – 3.50%
NCO / Average Loans 0.06% 0.06% 0.20 - 0.60%
Fee Income / Revenue 37% 37% 30 - 40%
Efficiency Ratio 77% 69% 60 - 65%
Risk Adjusted Margin
Total Assets Earning Assets
Pre-tax Income
Tax Rate
Annualized Net Charge-Offs
0.20% - 0.60%
% Fee Income
30% - 40%
Efficiency Ratio
60% - 65%
Return on Tangible
Common Equity
15%+
Equity / Assets
Common Equity
Tier 1
8% - 9%
Return on Assets
1.10% - 1.30% Net Interest Margin
3.25% - 3.50%

12
Building the Foundation for Attractive Long-Term Earnings Power
Continue strong business momentum
Grow balance sheet profitably and prudently
Expand banking relationships with emphasis on economic profit
Deliver successfully on merger integration activities
Strive for achievement of Bonefish targets
Successfully Executing on Key Priorities
FHN Is Well Positioned For Attractive Long-Term Earnings Power

APPENDIX
13

2016
Pre-Tax
Amount
2017
Pre/After
Tax Amount1
1Q Branch Impairment ($3.7mm) None
Mortgage Repurchase Reserve Release $31.4mm Mortgage Repurchase Reserve Release $20.0mm
Valuation Adjustment for Derivatives Related
to Prior Sales of Visa Class B Shares
($2.5mm) Acquisition Expense ($6.4mm)
Litigation Accrual ($26.0mm)
Effective tax rate adjustment associated with
reversal of a capital loss deferred tax
valuation allowance1
$19.5mm
Tax Reform-Related Adjustments1 ($82.0mm)
Other Tax Adjustments1 $10.7mm
Acquisition Expense ($46.7mm)
Legal Matters ($32.1mm)
Special Employee Bonuses ($9.9mm)
($14.3mm)
Acquisition Expense ($8.2mm)
Litigation Accrual ($4.5mm)
2Q
3Q
Gain Primarily Related to Recoveries
Associated with Prior Mortgage Servicing
Sales
$4.4mm
Loss on equity securities repurchase
4Q Litigation Accrual ($4.7mm)
Legal Matters ($8.2mm)
Litigation Accrual Reversal $4.3mm
Tax rate adjustments primarily associated
with the reversal of a capital loss deferred tax
valuation allowance and certain discrete
period items1
$13.7mm
14
NOTABLE ITEMS
1 All notable item amounts are calculated on a pre-tax basis with the exception of the tax adjustments in 2Q17, 3Q17, and 4Q17.

15
4Q17 Credit Quality Summary by Portfolio
Numbers may not add to total due to rounding. Data as of 4Q17. NM - Not meaningful.
1Credit card, Permanent Mortgage, and Other. 2Credit card, OTC, and Other Consumer.
3Non-performing loan % excludes held-for-sale loans. 4Net charge-offs are annualized.
5Exercised clean-up calls on jumbo securitizations in 1Q13, 3Q12, 2Q11, and 4Q10, which are now on balance sheet in the Corporate segment.
Corporate5 FHNC
($ in millions)
Commercial
(C&I &
Other)
CRE
HE &
HELOC
Other1 Subtotal
Permanent
Mortgage
Commercial
(C&I &
Other)
HE &
HELOC
Permanent
Mortgage
Other2 Total
Period End Loans $15,639 $4,215 $5,774 $731 $26,359 $53 $418 $594 $229 $6 $27,659
30+ Delinquency % 0.20% 0.11% 0.40% 1.10% 0.26% 3.98% 0.00% 3.06% 2.12% 0.95% 0.33%
Dollars $31 $5 $23 $8 $67 $2 $0 $18 $5 $0 $92
NPL3 % 0.18% 0.03% 0.39% 0.07% 0.20% 4.03% 0.73% 8.23% 10.40% 1.89% 0.47%
Dollars $28 $1 $23 $1 $53 $2 $3 $49 $24 $0 $131
Net Charge-offs4 % 0.29% NM NM 1.83% 0.22% NM NM NM 0.18% 1.90% 0.15%
Doll rs $10 $0 -$1 $3 $12 NM $0 -$3 $0 $0 $8
Allowance $97 $28 $16 $12 $154 NM $1 $21 $13 $0 $190
Allowance / Loans % 0.62% 0.67% 0.28% 1.70% 0.58% NM 0.33% 3.53% 5.70% 1.36% 0.69%
Allowance / Net Charge-offs 2.49x NM NM 1.25x 3.34x NM NM NM 31.54x 0.71x 5.75x
Regional Banking Non-Strategic

16
LQ – Linked Quarter. YOY - Year over Year. Numbers/Percentages may not add to total due to rounding
1 Deposit beta equals change in average interest rate paid divided by change in average Fed funds rate.
Solid Core Deposit Base Provides Funding Advantage
Asset Sensitivity Remains Intact
Total average deposits up 12% YOY, up 13% LQ, represent 84% of total funding
Regional Banking average deposits up 18% YOY, 12% LQ
Overall deposit beta1 since 3Q15 is 25%, 11% excluding market-indexed deposits
Total Average Deposit Rate Overview Average Deposit Composition
($ in billions)
3Q17 4Q17
Consumer Interest 0.22% 0.19%
Commercial Interest 0.69% 0.78%
Market-Indexed 1.16% 1.23%
Non-Interest - -
Total Deposits 0.36% 0.39%
Rate Paid
39% 39% 41% 42% 41
27% 27% 28% 29%
28
21% 20% 17% 16%
16%
13% 14% 14% 13%
15%
$0
$5
$10
$15
$20
$25
$30
4Q16 1Q17 2Q17 3Q17 4Q17
Consumer Interest Non-Interest Market-Indexed Commercial Interest

17
Select C&I and CRE Portfolio Metrics
Data as of 4Q17. Numbers may not add to total due to rounding.
C&I: Loans to Mortgage Companies
CRE: Collateral Type CRE: Geographic Distribution
Office
15%
Other
20%
($ in billions)
Industrial
11%
Retail
20%
Hospitality
10%
Land
1%
Multi-Family
24%
NC
31%
TN
20% FL
13%
Other
15%
SC
9%
GA 7%
4Q17 Average Regional Bank Commercial Loans
Healthcare 4%
Correspondent 3%
Energy 1%
Specialty
Areas
Commercial
Real Estate
15%
Loans to
Mortgage
Companies
12%
Franchise
Finance 4%
Commercial
38% Asset Based
Lending
12%
Corporate 6%
$2.0
$1.5
$2.1
$2.0
$2.1$2.2
$1.3
$1.6
$1.9 $1.9
4Q16 1Q17 2Q17 3Q17 4Q17
Period-end Balance Avg. BalanceBusiness Banking
6%
Other
12%
Office
21%

Reconciliation to GAAP Financials
18
Slides in this presentation use non-GAAP information of adjusted fee income, adjusted revenue, adjusted noninterest expense,
adjusted pre-tax income, adjusted net income available to common, adjusted earnings per share, adjusted fee ratio, and adjusted
efficiency ratio. That information is not presented according to generally accepted accounting principles (GAAP) and is reconciled to
GAAP information below.
Numbers may not add to total due to rounding. NA – not applicable.
1Comparisons to 2016 Adjusted are not meaningful. 2Tax-affected notable items assume an effective tax rate of ~39% in 4Q17, ~32% in 3Q17, ~39% in 2Q17. 3Because FHN recognized a net loss
available to common shareholders in 4Q17, potentially issuable shares are excluded from diluted shares because they are antidilutive. Excluding notable items, FHN would have recognized
net income available to common shareholders. As a result, adjusted shares are presented in order to include the dilutive impact of potentially issuable shares.
($ in millions) Quarter Reported Annual
Adjusted Fee Income, Revenue, & Fee Ratio 4Q17 3Q17 % Change 2017 2016 % Change1
Fee Income (GAAP) $133 $112 $490 $552
Less: Notable Items (GAAP) $0 ($14) ($14) NA
Adjusted Fee Income (Non-GAAP) (a) $133 $127 5% $505 $552 -9%
Plus: Net Interest Income (GAAP) $242 $210 $842 $729
Adjusted Revenue (Non-GAAP) (b) $375 $337 12% $1,347 $1,282 5%
Adjusted Fee Ratio (Non-GAAP) (a/b) 35% 38% 37% NA
Adjusted Noninterest Expense
Noninterest Expense (GAAP) $347 $237 $1,024 $925
Less: Notable Items (GAAP) $89 $16 $91 NA
Adjusted Noninterest Expense (Non-GAAP) (c) $258 $221 17% $932 $925 1%
Adjusted Pre-Tax Income
Pre-Tax Income (GAAP) $26 $85 $309 $345
Plus: Notable Items (GAAP) $89 $31 $106 NA
Adjusted Pre-Tax Income (Non-GAAP) $114 $116 -1% $415 $345 20%
Adjusted Net Income
Net Income (GAAP) ($48) $72 $177 $239
Plus: Tax-Affected Notable Items (GAAP)2 $133 $7 $112 NA
Adjusted Net Income (Non-GAAP) (d) $84 $79 $289 $239
Adjusted Net Income Available to Common / Earnings Per Share
Net Income Available to Common (GAAP) ($53) $67 $159 $221
Plus: Tax-Affected Notable Items (GAAP)2 $133 $7 $112 NA
Adjusted Net Income Available to Common (Non-GAAP) (e) $80 $74 7% $271 $221 23%
Average Common Diluted Shares (GAAP) 265 236 244 235
Adjusted Average Common Diluted Shares (Non-GAAP)3 (f) 268 236 244 NA
Adjusted Earnings Per Share (Non-GAAP) (e/f) $0.30 $0.32 -6% $1.11 $0.94 18%
j st d Efficiency Ratio
Adjusted Noninterest Expense (Non-GAAP) (c) $258 $221 $932 NA
Divided: Adjusted Revenue Excluding Securities Gains (Non-GAAP) $375 $337 $1,346 NA
Adjusted Efficiency Ratio (Non-GAAP) 69% 66% 69% NA

Reconciliation to GAAP Financials
19
Slides in this presentation use non-GAAP information of return on tangible common equity, adjusted return on tangible common
equity, and adjusted return on average assets. That information is not presented according to generally accepted accounting
principles (GAAP) and is reconciled to GAAP information below.
Numbers may not add to total due to rounding.
1 Comparisons to 2016 Adjusted are not meaningful. 2Includes the average annual after-tax impact of $(27.9mm) of notable items recognized in 2Q17 and $7.1mm of notable items recognized in 3Q17.
($ in millions) Reported Annual
Return on Tangible Common Equity (ROTCE) 2017 2016 Change1
Average Total Equity (GAAP) $2,970 $2,691
Less: Average Noncontrolling Interest (GAAP) $295 $295
Less: Preferred Stock (GAAP) $96 $96
Average Common Equity (GAAP) (g) $2,579 $2,300
Less: Average Intangible Assets (GAAP) $376 $215
Average Tangible Common Equity (Non-GAAP) (h) $2,203 $2,086
Net Income Available to Common (GAAP) (i) $159 $221
Return on Average Common Equity (ROE) (GAAP) (i/g) 6.2% 9.6%
Return on Average Tangible Common Equity (ROTCE) (Non-GAAP) (i/h) 7.2% 10.6% (336bps)
Adjusted Return on Tangible Common Equity (ROTCE)
Average Tangible Common Equity (Non-GAAP) (h) $2,203 $2,086
Less: Equity impact for notable items2 $49 NA
Adjusted Average Tangible Common Equity (Non-GAAP) (j) $2,154 $2,086
Adjusted Net Income Available to Common (Non-GAAP) (e) $271 $221
Adjusted Return on Average Tangible Common Equity (ROTCE) (Non-GAAP) (e/j) 12.6% 10.6% 200bps
jus ed Return on Average Assets (ROA)
Adjusted Net Income (Non-GAAP) (d) $289 $239
Divided: Average Total Assets (GAAP) $29,925 $27,427
Adjusted Return on Average Assets (Non-GAAP) 0.96% 0.87% 9bps
