Attached files
| file | filename |
|---|---|
| 8-K - 8-K - Travel & Leisure Co. | a18-3303_28k.htm |
Investor Presentation Regarding Wyndham Worldwide’s Acquisition of La Quinta Holdings’ Fee-Based Franchising & Management Operations January 18, 2018
Certain statements in this presentation constitute “forward-looking statements” within the meaning of Section 27A of the Securities Act of 1933, as amended, and Section 21E of the Securities Exchange Act of 1934, as amended. Any statements that refer to expectations or other characterizations of future events, circumstances or results are forward-looking statements. Such forward-looking statements include projections and statements regarding expected synergies and benefits of the acquisition. Such forward-looking statements involve known and unknown risks, uncertainties and other factors which may cause the actual results, performance or achievements of Wyndham Worldwide, Wyndham Hotel Group and La Quinta Holdings’ fee-based franchising and management operations to be materially different from any future results, performance or achievements expressed or implied by such forward-looking statements. Neither Wyndham Worldwide’s independent auditors, nor La Quinta’s independent auditors, have audited, reviewed, compiled or performed any procedures with respect to the projections included herein for the purpose of their inclusion in this presentation, and accordingly, neither of them expressed an opinion or provided any other form of assurance with respect thereto for the purpose of this presentation. These projections should not be relied upon as being necessarily indicative that such results will be achieved. You are cautioned not to place undue reliance on these forward-looking statements. Important assumptions and other important factors that could cause actual results to differ materially from those in the forward-looking statements are specified in each of Wyndham Worldwide’s and La Quinta’s most recent Form 10-K for the year ended December 31, 2016 filed with the Securities and Exchange Commission on February 17, 2017 and March 1, 2017, respectively, under “Risk Factors” and in Wyndham Worldwide’s and La Quinta’s subsequently filed Quarterly Reports on Form 10-Q and Current Reports on Form 8-K filed with the Securities and Exchange Commission. Except for ongoing obligations of Wyndham Worldwide to disclose material information under the federal securities laws, Wyndham Worldwide does not undertake any obligation to release any revisions to any forward-looking statements, to report events or to report the occurrence of unanticipated events. The information in this presentation should be read in conjunction with the consolidated financial statements and accompanying notes and “Management's Discussion and Analysis of Financial Condition and Results of Operations” in Wyndham Worldwide's and La Quinta’s Form 10-K and in Wyndham Worldwide’s and La Quinta’s subsequently filed Quarterly Reports on Form 10-Q and Current Reports on Form 8-K. Financial information contained in this presentation includes non-GAAP measures, including EBITDA, adjusted EBITDA, adjusted net income, and adjusted earnings per share, which include or exclude certain items. These non-GAAP measures differ from reported GAAP results and are intended to be helpful to investors as an additional tool for further understanding and assessing Wyndham Worldwide’s and La Quinta’s ongoing core operating performance. Exclusion of items in the non-GAAP presentation should not be considered an inference that these items are unusual, infrequent or non-recurring. Reconciliations of the 2017 projected non-GAAP measures are not included herein because the individual components are not known with certainty as individual financial statements for 2017 have not been completed. The non-GAAP financial measures included herein should not be considered superior to, as a substitute for, or as an alternative to, and should be considered in conjunction with, the GAAP measures. The non-GAAP financial measures herein may differ from similar measures used by other companies. Forward-Looking Statements
In connection with the proposed transaction, a preliminary proxy statement and a definitive proxy statement will be filed with the SEC by La Quinta Holdings. The information contained in the preliminary filing will not be complete and may be changed. BEFORE MAKING ANY VOTING OR INVESTMENT DECISIONS, INVESTORS AND SECURITY HOLDERS ARE URGED TO READ THE DEFINITIVE PROXY STATEMENT WHEN IT BECOMES AVAILABLE AND ANY OTHER RELEVANT DOCUMENTS FILED WITH THE SEC BECAUSE THEY WILL CONTAIN IMPORTANT INFORMATION ABOUT THE PROPOSED ACQUISITION. The definitive proxy statement will be mailed to the stockholders of La Quinta seeking their approval of the proposed transaction. La Quinta’s stockholders will also be able to obtain a copy of the definitive proxy statement free of charge by directing a request to: Secretary, La Quinta Holdings Inc., 909 Hidden Ridge, Suite 600, Irving, Texas 75038. In addition, the preliminary proxy statement and definitive proxy statement will be available free of charge at the SEC’s website, www.sec.gov. Wyndham Worldwide, La Quinta and their respective directors, executive officers and certain other employees may be deemed to be participants in the solicitation of proxies from La Quinta stockholders in connection with the proposed transaction. Investors and security holders may obtain more detailed information regarding the names, affiliations and interests of Wyndham Worldwide directors and executive officers by reading Wyndham Worldwide’s proxy statement for its 2017 annual meeting of stockholders, which was filed with the SEC on March 29, 2017. Investors and security holders may obtain more detailed information regarding the names, affiliations and interests of La Quinta directors and executive officers by reading La Quinta’s proxy statement for its 2017 annual meeting of stockholders, which was filed with the SEC on April 7, 2017. Additional information regarding potential participants in such proxy solicitation and a description of their direct and indirect interests, by security holdings or otherwise, will be included in the proxy statement and other relevant materials filed with the SEC in connection with the proposed transaction when they become available. Additional Information
Wyndham Worldwide has agreed to acquire La Quinta Holdings’ hotel franchising and hotel management operations (“La Quinta”) for $1.95 billion in cash Adds nearly 900 hotels to the world’s largest hotel network Strengthens Wyndham Hotel Group’s existing position in midscale lodging Will provide greater distribution and value to La Quinta franchisees Offers significant new growth opportunities for Wyndham Worldwide Expected to generate $55 - $70 million in annual synergies Acquisition scheduled to close in the second quarter of 2018 Executive Summary
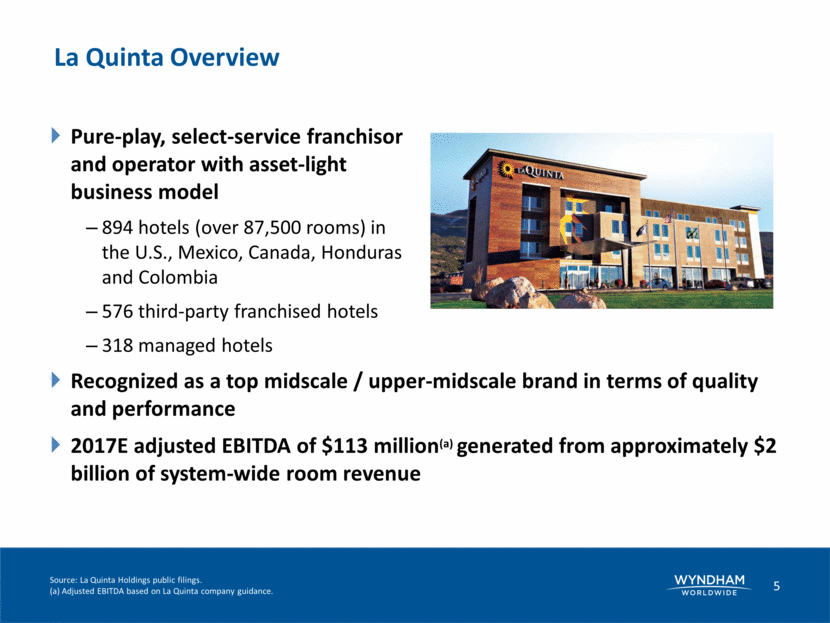
Pure-play, select-service franchisor and operator with asset-light business model 894 hotels (over 87,500 rooms) in the U.S., Mexico, Canada, Honduras and Colombia 576 third-party franchised hotels 318 managed hotels Recognized as a top midscale / upper-midscale brand in terms of quality and performance 2017E adjusted EBITDA of $113 million(a) generated from approximately $2 billion of system-wide room revenue Source: La Quinta Holdings public filings. (a) Adjusted EBITDA based on La Quinta company guidance. La Quinta Overview
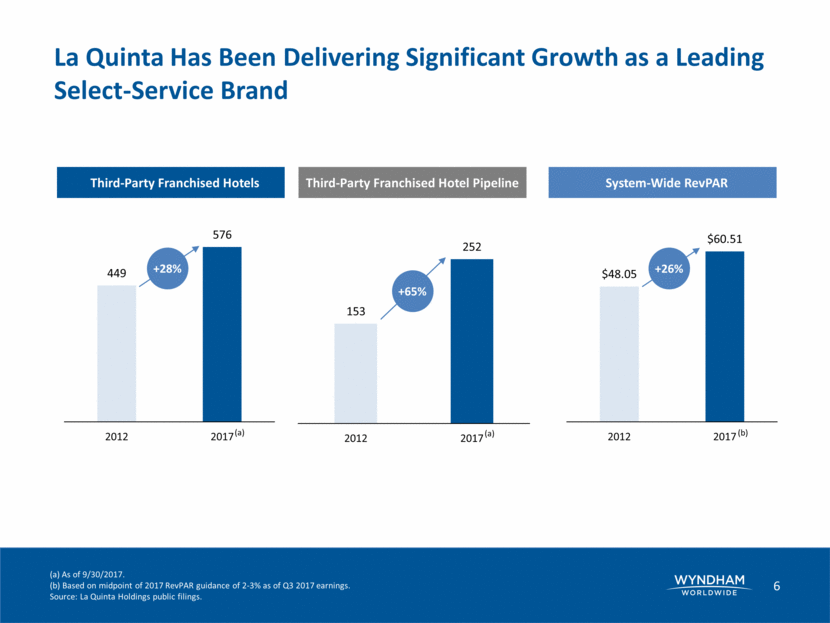
(a) As of 9/30/2017. (b) Based on midpoint of 2017 RevPAR guidance of 2-3% as of Q3 2017 earnings. Source: La Quinta Holdings public filings. La Quinta Has Been Delivering Significant Growth as a Leading Select-Service Brand +26% System-Wide RevPAR +28% Third-Party Franchised Hotels +65% Third-Party Franchised Hotel Pipeline (a) (b) (a) $48.05 $60.51 2012 2017 449 576 2012 2017 153 252 2012 2017
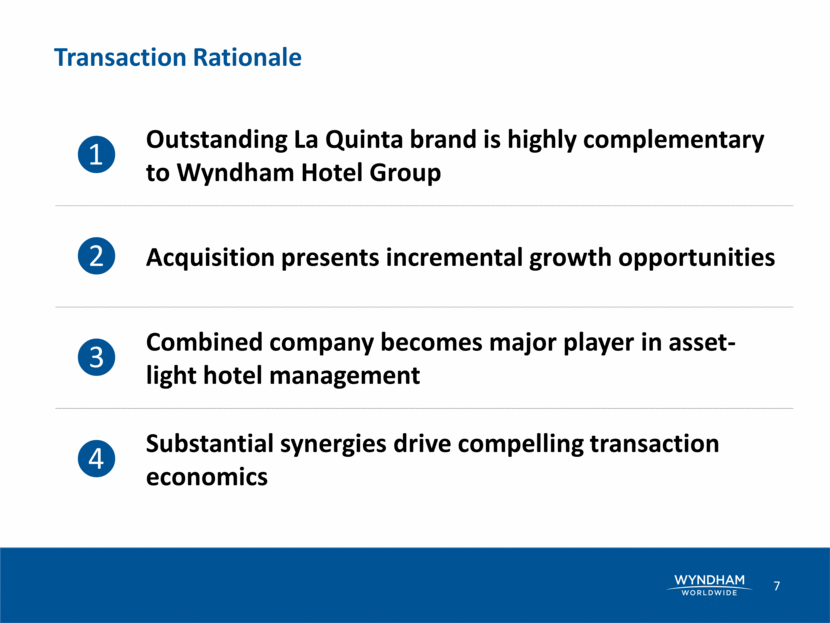
Transaction Rationale 1 Outstanding La Quinta brand is highly complementary to Wyndham Hotel Group 2 Acquisition presents incremental growth opportunities 3 Combined company becomes major player in asset-light hotel management 4 Substantial synergies drive compelling transaction economics
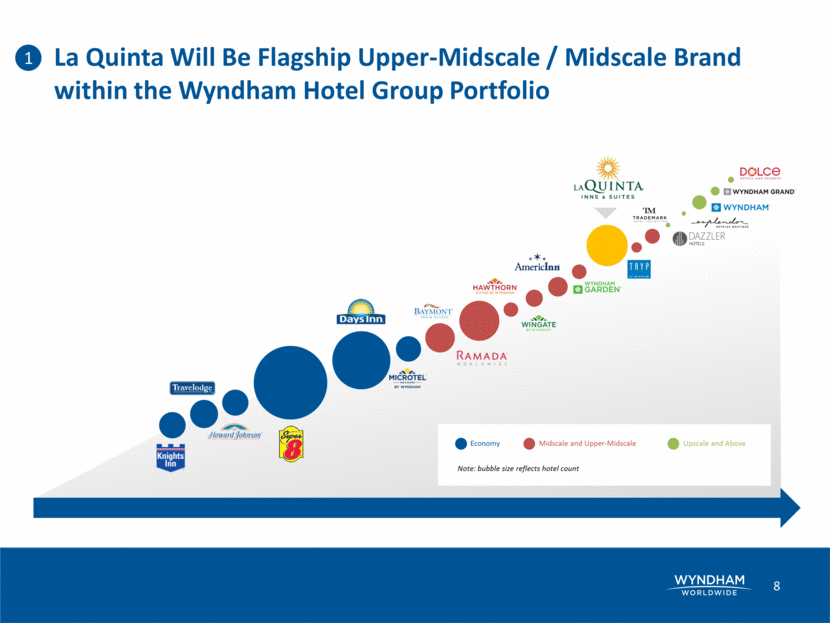
La Quinta Will Be Flagship Upper-Midscale / Midscale Brand within the Wyndham Hotel Group Portfolio Chainscale Economy Midscale and Upper-Midscale Upscale and Above Note: bubble size reflects hotel count 1
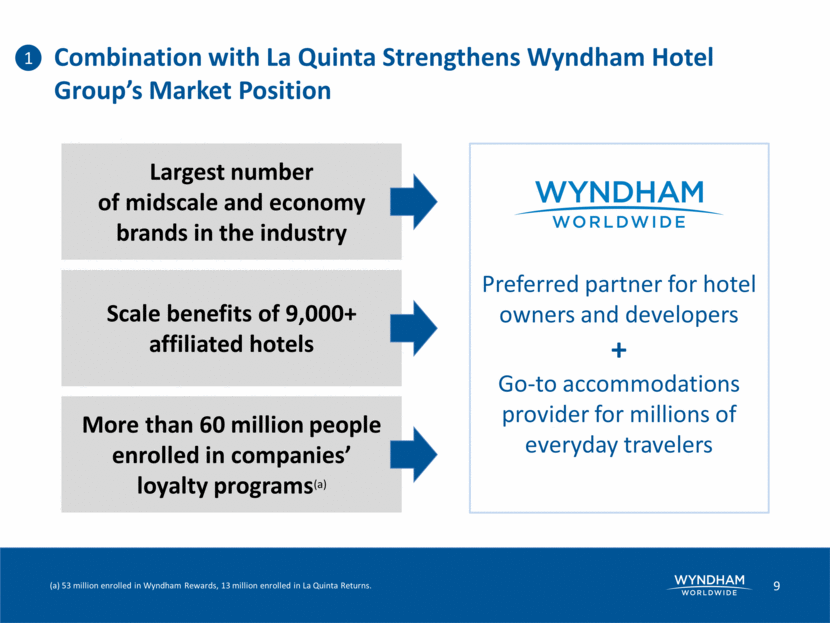
Combination with La Quinta Strengthens Wyndham Hotel Group’s Market Position 1 Scale benefits of 9,000+ affiliated hotels More than 60 million people enrolled in companies’ loyalty programs(a) Largest number of midscale and economy brands in the industry Preferred partner for hotel owners and developers + Go-to accommodations provider for millions of everyday travelers (a) 53 million enrolled in Wyndham Rewards, 13 million enrolled in La Quinta Returns.
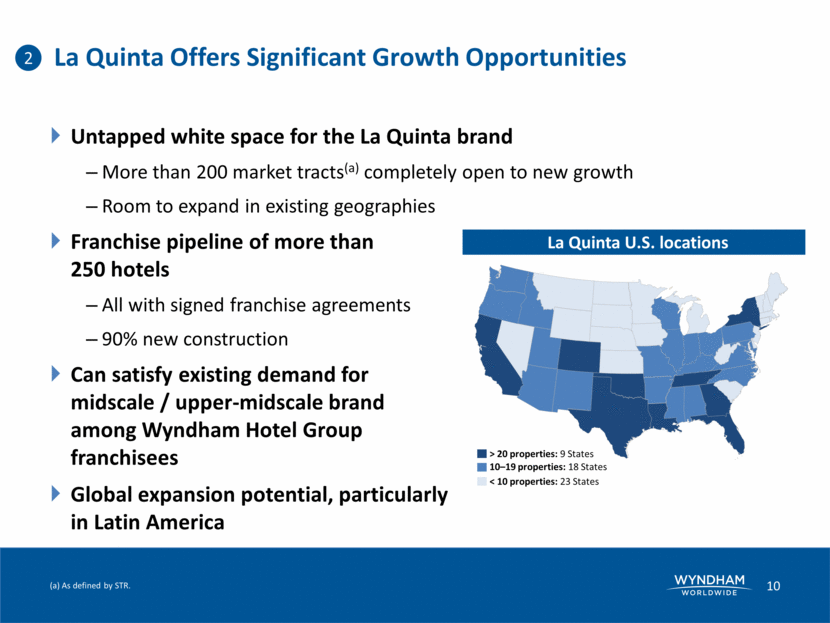
Untapped white space for the La Quinta brand More than 200 market tracts(a) completely open to new growth Room to expand in existing geographies Franchise pipeline of more than 250 hotels All with signed franchise agreements 90% new construction Can satisfy existing demand for midscale / upper-midscale brand among Wyndham Hotel Group franchisees Global expansion potential, particularly in Latin America (a) As defined by STR. La Quinta Offers Significant Growth Opportunities 2 La Quinta U.S. locations > 20 properties: 9 States 10–19 properties: 18 States < 10 properties: 23 States
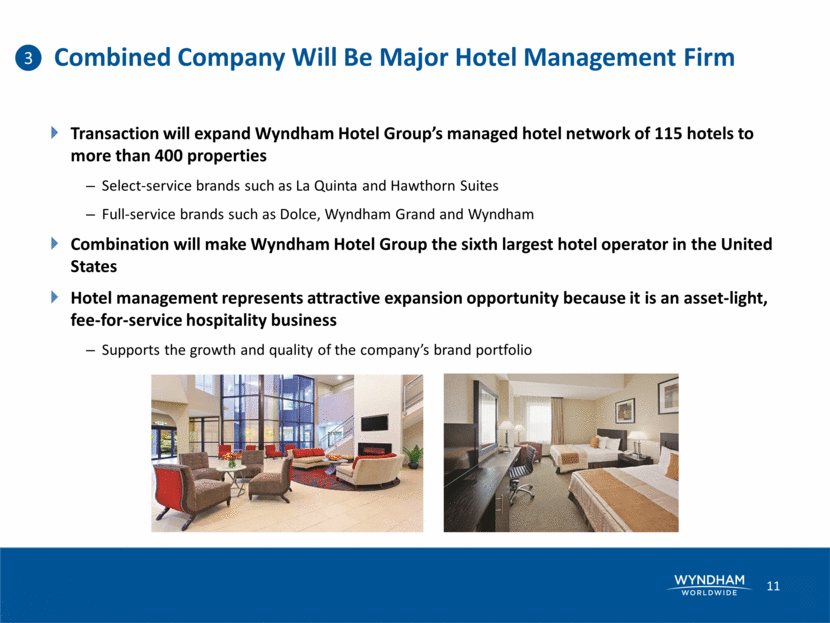
Transaction will expand Wyndham Hotel Group’s managed hotel network of 115 hotels to more than 400 properties Select-service brands such as La Quinta and Hawthorn Suites Full-service brands such as Dolce, Wyndham Grand and Wyndham Combination will make Wyndham Hotel Group the sixth largest hotel operator in the United States Hotel management represents attractive expansion opportunity because it is an asset-light, fee-for-service hospitality business Supports the growth and quality of the company’s brand portfolio Combined Company Will Be Major Hotel Management Firm 3
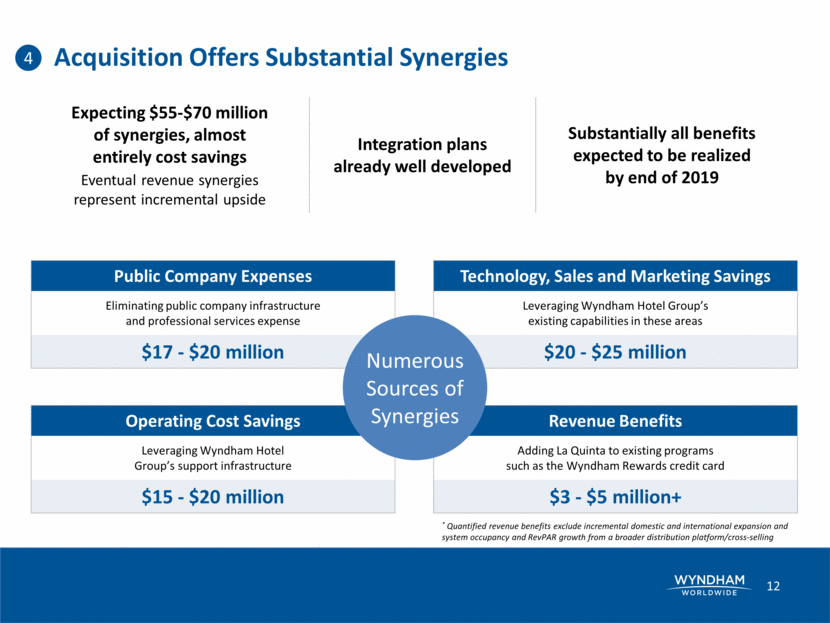
Acquisition Offers Substantial Synergies Public Company Expenses Eliminating public company infrastructure and professional services expense $17 - $20 million Expecting $55-$70 million of synergies, almost entirely cost savings Eventual revenue synergies represent incremental upside Integration plans already well developed Substantially all benefits expected to be realized by end of 2019 Operating Cost Savings Leveraging Wyndham Hotel Group’s support infrastructure $15 - $20 million Technology, Sales and Marketing Savings Leveraging Wyndham Hotel Group’s existing capabilities in these areas $20 - $25 million Revenue Benefits Adding La Quinta to existing programs such as the Wyndham Rewards credit card $3 - $5 million+ Numerous Sources of Synergies 4 * Quantified revenue benefits exclude incremental domestic and international expansion and system occupancy and RevPAR growth from a broader distribution platform/cross-selling
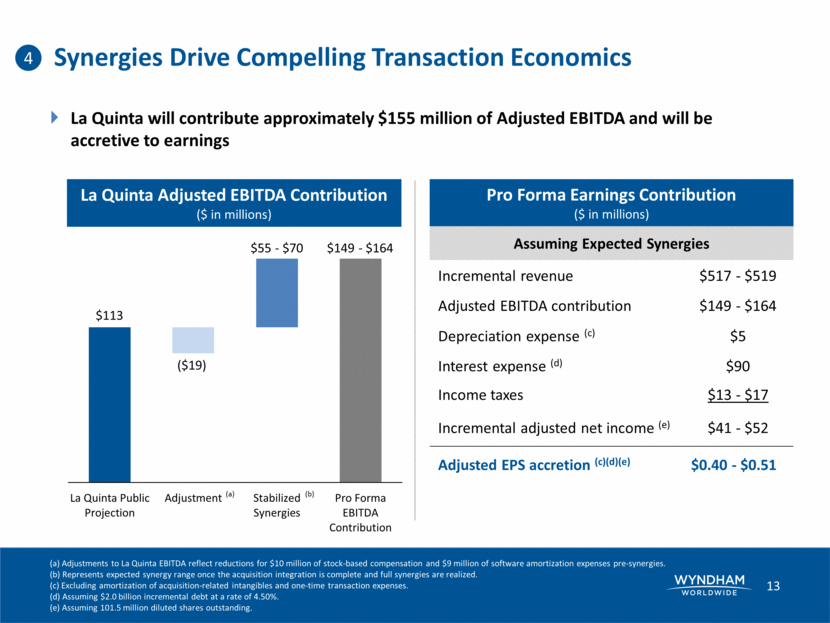
La Quinta will contribute approximately $155 million of Adjusted EBITDA and will be accretive to earnings Synergies Drive Compelling Transaction Economics (a) Adjustments to La Quinta EBITDA reflect reductions for $10 million of stock-based compensation and $9 million of software amortization expenses pre-synergies. (b) Represents expected synergy range once the acquisition integration is complete and full synergies are realized. (c) Excluding amortization of acquisition-related intangibles and one-time transaction expenses. (d) Assuming $2.0 billion incremental debt at a rate of 4.50%. (e) Assuming 101.5 million diluted shares outstanding. La Quinta Adjusted EBITDA Contribution ($ in millions) $113 ($19) $55 - $70 $149 - $164 (a) (b) Pro Forma Earnings Contribution ($ in millions) Assuming Expected Synergies Incremental revenue $517 - $519 Adjusted EBITDA contribution $149 - $164 Depreciation expense (c) $5 Interest expense (d) $90 Income taxes $13 - $17 Incremental adjusted net income (e) $41 - $52 Adjusted EPS accretion (c)(d)(e) $0.40 - $0.51 4
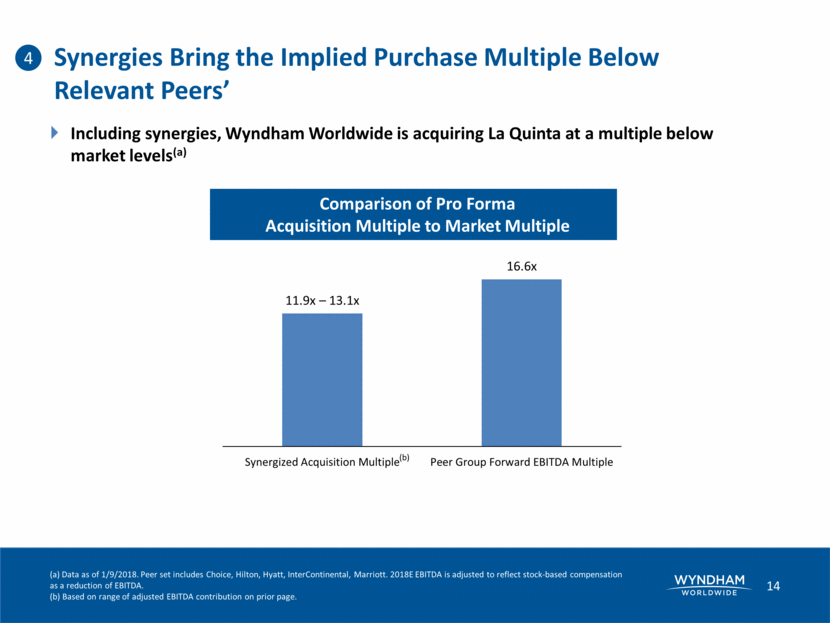
Including synergies, Wyndham Worldwide is acquiring La Quinta at a multiple below market levels(a) Synergies Bring the Implied Purchase Multiple Below Relevant Peers’ Comparison of Pro Forma Acquisition Multiple to Market Multiple 4 (a) Data as of 1/9/2018. Peer set includes Choice, Hilton, Hyatt, InterContinental, Marriott. 2018E EBITDA is adjusted to reflect stock-based compensation as a reduction of EBITDA. (b) Based on range of adjusted EBITDA contribution on prior page. (b)
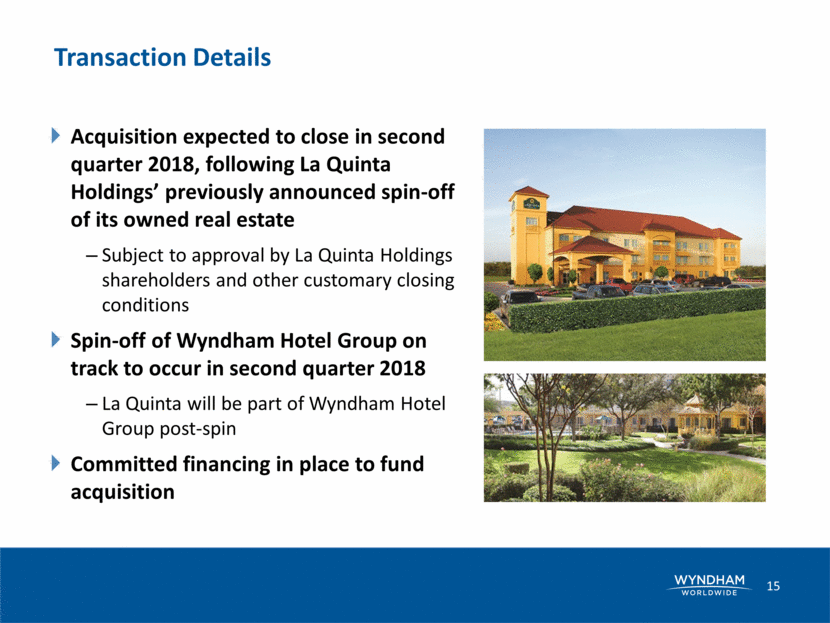
Acquisition expected to close in second quarter 2018, following La Quinta Holdings’ previously announced spin-off of its owned real estate Subject to approval by La Quinta Holdings shareholders and other customary closing conditions Spin-off of Wyndham Hotel Group on track to occur in second quarter 2018 La Quinta will be part of Wyndham Hotel Group post-spin Committed financing in place to fund acquisition Transaction Details
La Quinta is a leading midscale / upper-midscale brand Nearly 900 franchised and managed hotels Outstanding reputation among travelers and hotel developers Significant growth potential in existing and new markets The combination of the two companies provides compelling benefits Builds on Wyndham Worldwide’s extensive portfolio of lodging brands Offers substantial cost savings Transaction expected to be significantly accretive to Wyndham Hotel Group’s 2019 adjusted earnings(a) (a) Adjusted earnings will exclude amortization of intangible assets and one-time transaction expenses. Acquisition Is Strategically and Financially Attractive
Appendix
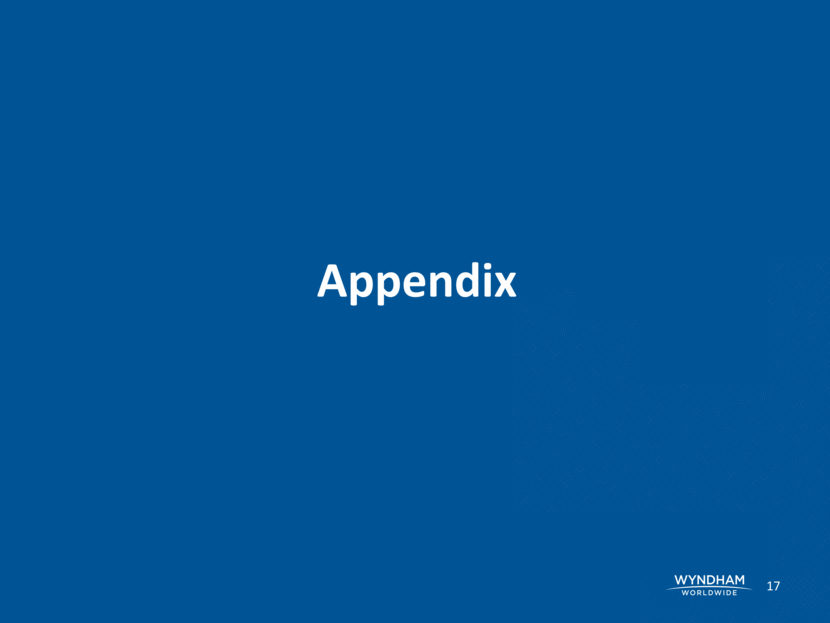
Wyndham Hotel Group La Quinta Combined Rank (a) # of Hotels 8,345 894 9,239 #1 Rooms 720,100 87,500 807,600 #3 Brands 20 1 21 #2 Pipeline (rooms) 146,900 23,700 170,600 2016A RevPAR $36.67 $59.03 $39.14 2017E Adjusted EBITDA $409 million(b) $113 million(b) $566 million(c) Rewards Program Member Enrollments 53 million 13 million Over 60 million Managed Hotels 115 (d) 318 433 Owned Hotels 2 0 2 Midscale / Upper Midscale Chainscale (e) 29% 100% 37% Select Brands Acquisition Strengthens Wyndham’s Industry-Leading Position as Upper-Midscale, Midscale and Economy Hotelier Source: Company filings as of 9/30/2017 unless otherwise noted. Wyndham hotel and room count pro forma for the AmericInn acquisition in October 2017. (a) Rankings based on a comparable set that includes Hilton, Hyatt, InterContinental, Choice, Accor and Marriott. (b) Midpoint of range published 10/25/2017 for Wyndham Hotel Group and midpoint of the “New La Quinta” range from La Quinta’s Q3 2017 investor presentation. (c) Combined EBITDA includes run-rate synergies of $55 to $70 million; La Quinta EBITDA adjusted to reflect $10 million of stock-based compensation and $9 million of software amortization expenses as reductions in EBITDA. (d) Wyndham managed hotels include two company-owned assets. (e) Represents percentage of each company’s existing total portfolio.
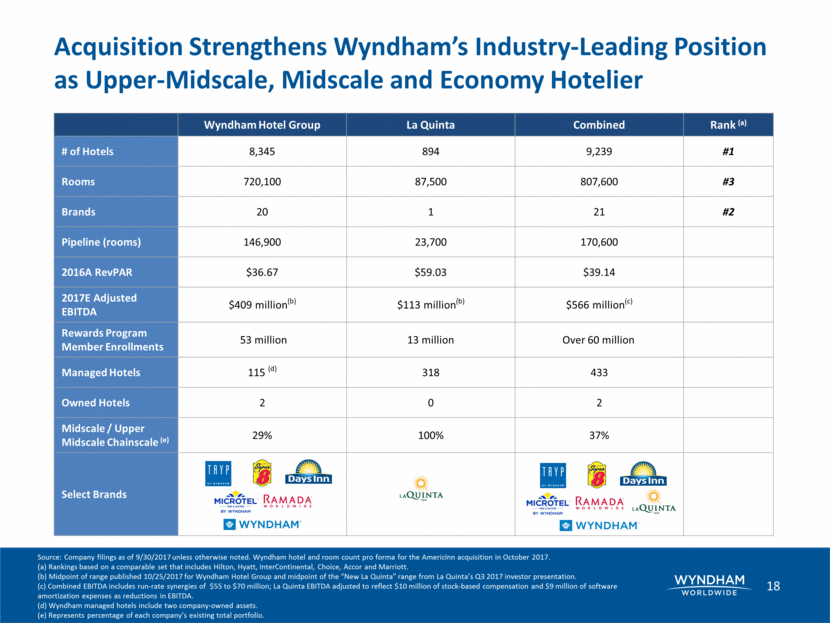
Management fee: 5% of gross revenues 20-year term with extension options CorePoint committed to set aside 3.5% of gross revenue for FF&E reserve Royalty fee: 5% of room revenue Marketing and reservation fund contribution: 4.5% of room revenue 20-year term with “window” after 15 years Management Agreement Franchise Agreement Key Terms of CorePoint Management and Franchise Agreements
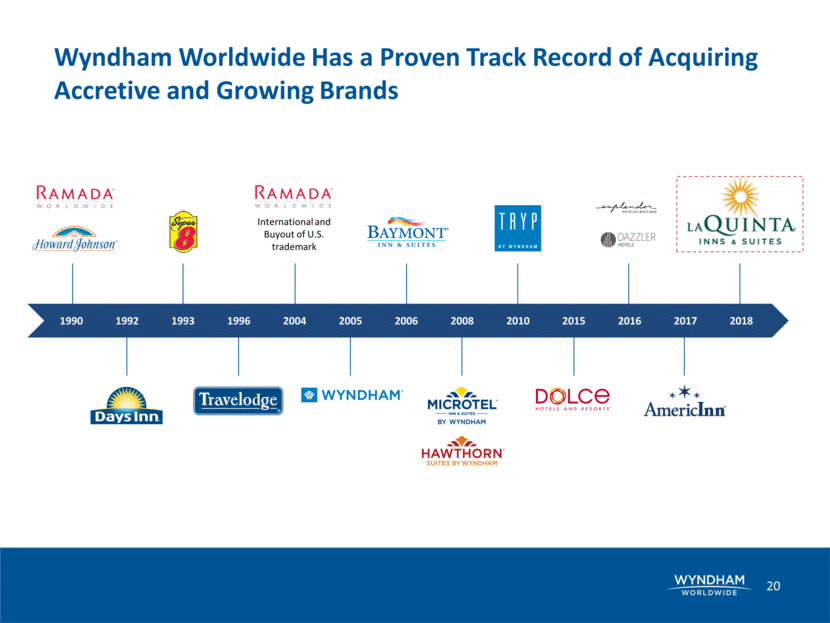
Wyndham Worldwide Has a Proven Track Record of Acquiring Accretive and Growing Brands International and Buyout of U.S. trademark 1990 2018 1992 1993 1996 2004 2005 2006 2008 2017 2010 2015 2016
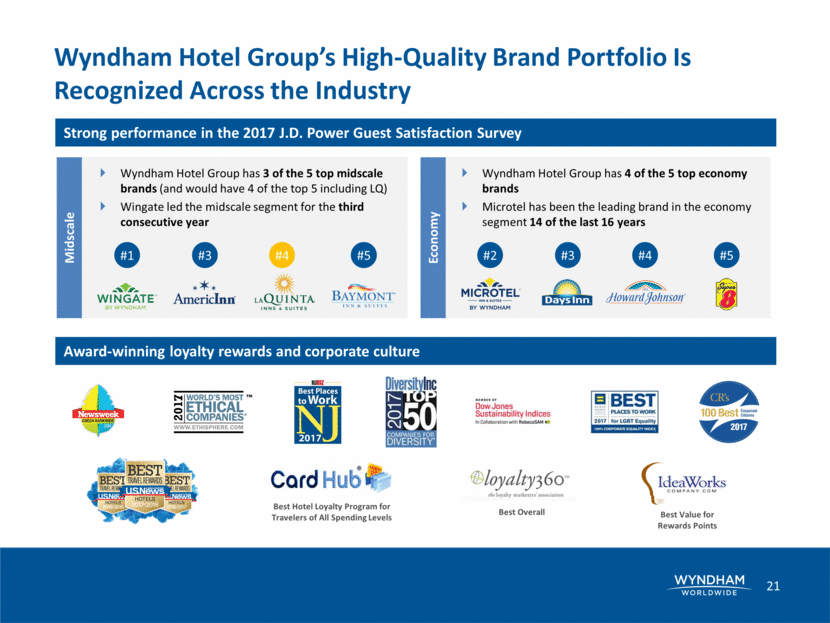
Wyndham Hotel Group’s High-Quality Brand Portfolio Is Recognized Across the Industry Wyndham Hotel Group has 4 of the 5 top economy brands Microtel has been the leading brand in the economy segment 14 of the last 16 years Wyndham Hotel Group has 3 of the 5 top midscale brands (and would have 4 of the top 5 including LQ) Wingate led the midscale segment for the third consecutive year #1 #3 #4 #5 Strong performance in the 2017 J.D. Power Guest Satisfaction Survey Midscale Economy #2 #3 #4 #5 Best Hotel Loyalty Program for Travelers of All Spending Levels Best Overall Best Value for Rewards Points Award-winning loyalty rewards and corporate culture
