Attached files
| file | filename |
|---|---|
| EX-99.1 - EX-99.1 - REGENCY CENTERS CORP | d523966dex991.htm |
| 8-K - 8-K - REGENCY CENTERS CORP | d523966d8k.htm |
Exhibit 99.2

|
January 11, 2018
2018 EARNINGS & VALUATION GUIDANCE
|
Forward-Looking Statements
Forward-looking statements involve risks and uncertainties. Actual future performance, outcomes and results may differ materially from those expressed in forward-looking
statements. Please refer to the documents filed by Regency Centers Corporation (“Regency” or the “Company”) with the Securities and Exchange Commission (“SEC”), specifically the most recent reports on Forms 10-K and 10-Q, which identify important risk factors which could cause actual results to differ from those contained in the forward-looking statements.
Regency Centers 2018 Earnings and Valuation Guidance 1
|
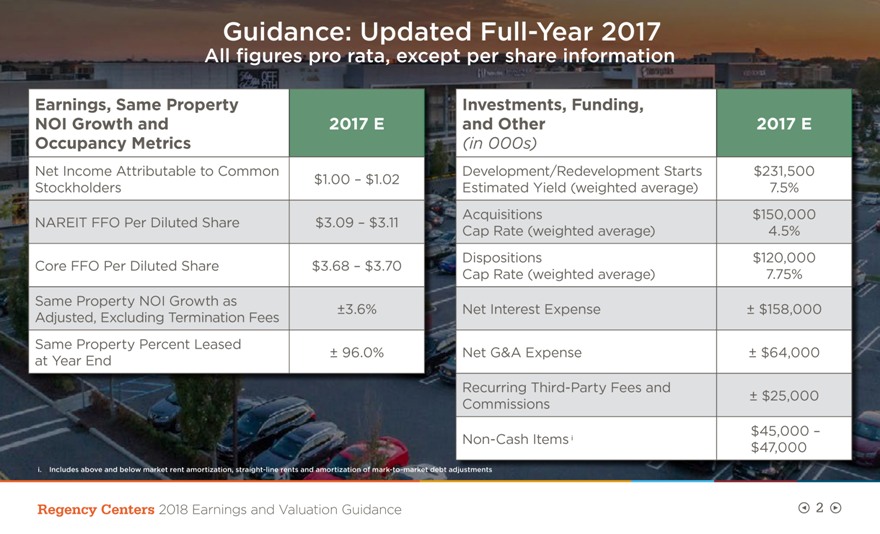
Guidance: Updated Full-Year 2017
All figures pro rata, except per share information
Earnings, Same Property Investments,
Funding,
NOI Growth and 2017 E and Other 2017 E Occupancy Metrics (in 000s)
Net Income Attributable to Common Development/Redevelopment Starts $231,500 $1.00 – $1.02 Stockholders Estimated Yield (weighted average) 7.5% Acquisitions
$150,000 NAREIT FFO Per Diluted Share $3.09 – $3.11 Cap Rate (weighted average) 4.5% Dispositions $120,000 Core FFO Per Diluted Share $3.68 – $3.70 Cap Rate (weighted average) 7.75% Same Property NOI Growth as ±3.6% Net Interest
Expense ± $158,000 Adjusted, Excluding Termination Fees Same Property Percent Leased
± 96.0% Net G&A Expense ± $64,000 at Year End
Recurring Third-Party Fees and
± $25,000 Commissions $45,000 – Non-Cash Itemsi $47,000
i. Includes above and below market rent amortization, straight-line rents and amortization of
mark-to-market debt adjustments
Regency Centers 2018 Earnings and Valuation
Guidance 2
|
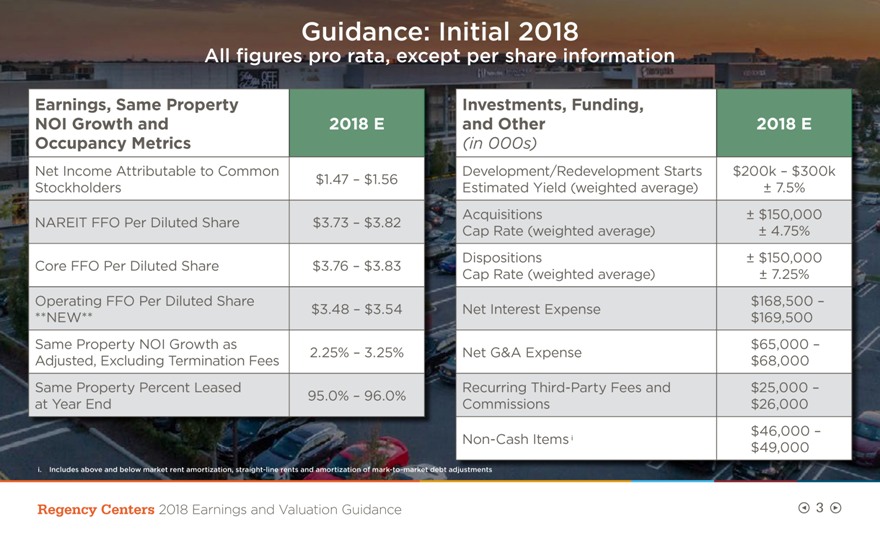
Guidance: Initial 2018
All figures pro rata, except per share information
Earnings, Same Property Investments,
Funding,
NOI Growth and 2018 E and Other 2018 E Occupancy Metrics (in 000s)
Net Income Attributable to Common Development/Redevelopment Starts $200k – $300k $1.47 – $1.56 Stockholders Estimated Yield (weighted average) ±
7.5% Acquisitions ± $150,000 NAREIT FFO Per Diluted Share $3.73 – $3.82 Cap Rate (weighted average) ± 4.75% Dispositions ± $150,000 Core FFO Per Diluted Share $3.76 – $3.83 Cap Rate (weighted average) ± 7.25%
Operating FFO Per Diluted Share $168,500 – $3.48 – $3.54 Net Interest Expense **NEW** $169,500 Same Property NOI Growth as $65,000 – 2.25% – 3.25% Net G&A Expense Adjusted, Excluding Termination Fees $68,000 Same Property
Percent Leased Recurring Third-Party Fees and $25,000 – 95.0% – 96.0% at Year End Commissions $26,000 $46,000 – Non-Cash Itemsi $49,000
i. Includes above and below market rent amortization, straight-line rents and amortization of
mark-to-market debt adjustments
Regency Centers 2018 Earnings and Valuation
Guidance 3
|
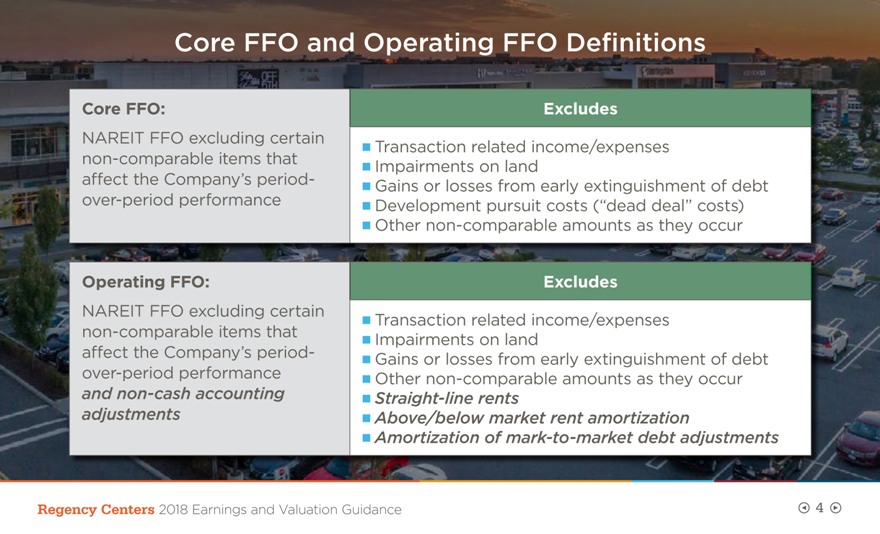
Core FFO and Operating FFO Definitions
Core FFO: Excludes
NAREIT FFO excluding certain
Transaction related income/expenses non-comparable items that Impairments on land affect the Company’s period-
Gains or losses from early extinguishment of debt over-period performance Development pursuit costs (“dead deal” costs) Other
non-comparable amounts as they occur
Operating FFO: Excludes
NAREIT FFO excluding certain
Transaction related income/expenses non-comparable items that Impairments on land affect the Company’s period-
Gains or losses from early extinguishment of debt
over-period performance Other non-comparable amounts as they occur and non-cash accounting Straight-line rents adjustments Above/below market rent amortization
Amortization of mark-to-market debt adjustments
Regency Centers 2018 Earnings and
Valuation Guidance 4
|
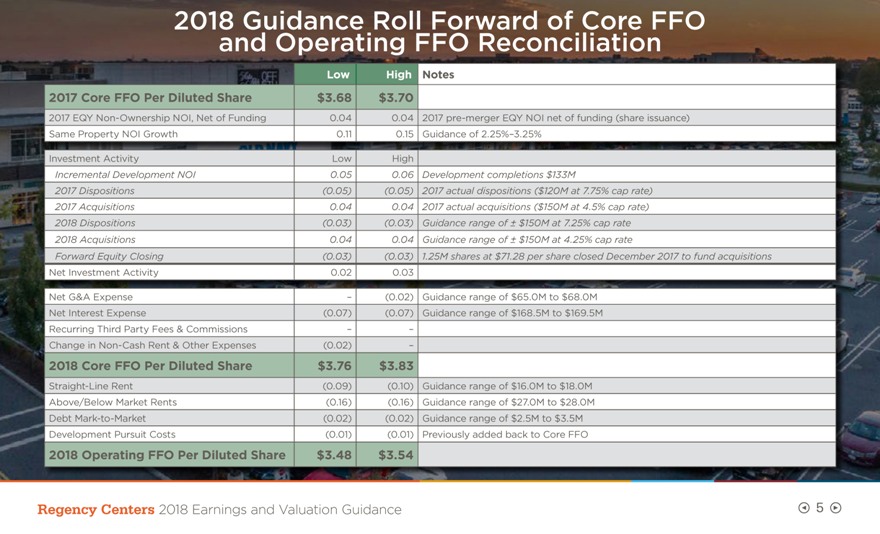
2018 Guidance Roll Forward of Core FFO and Operating
FFO Reconciliation
Low High Notes
2017 Core FFO Per Diluted Share $3.68 $3.70
2017 EQY Non-Ownership NOI, Net of Funding 0.04 0.04 2017 pre-merger EQY NOI net of
funding (share issuance) Same Property NOI Growth 0.11 0.15 Guidance of 2.25%–3.25%
Investment Activity Low High
Incremental Development NOI 0.05 0.06 Development completions $133M
2017 Dispositions (0.05)
(0.05) 2017 actual dispositions ($120M at 7.75% cap rate) 2017 Acquisitions 0.04 0.04 2017 actual acquisitions ($150M at 4.5% cap rate) 2018 Dispositions (0.03) (0.03) Guidance range of ± $150M at 7.25% cap rate 2018 Acquisitions 0.04 0.04
Guidance range of ± $150M at 4.25% cap rate
Forward Equity Closing (0.03) (0.03) 1.25M shares at $71.28 per share closed December 2017 to fund acquisitions
Net Investment Activity 0.02 0.03
Net G&A Expense – (0.02) Guidance
range of $65.0M to $68.0M Net Interest Expense (0.07) (0.07) Guidance range of $168.5M to $169.5M Recurring Third Party Fees & Commissions – –Change in Non-Cash Rent & Other
Expenses (0.02) –
2018 Core FFO Per Diluted Share $3.76 $3.83
Straight-Line Rent (0.09) (0.10) Guidance range of $16.0M to $18.0M Above/Below Market Rents (0.16) (0.16) Guidance range of $27.0M to $28.0M Debt Mark-to-Market (0.02) (0.02) Guidance range of $2.5M to $3.5M Development Pursuit Costs (0.01) (0.01) Previously added back to Core FFO
2018 Operating FFO Per Diluted Share $3.48 $3.54
Regency Centers 2018 Earnings and Valuation
Guidance 5
|
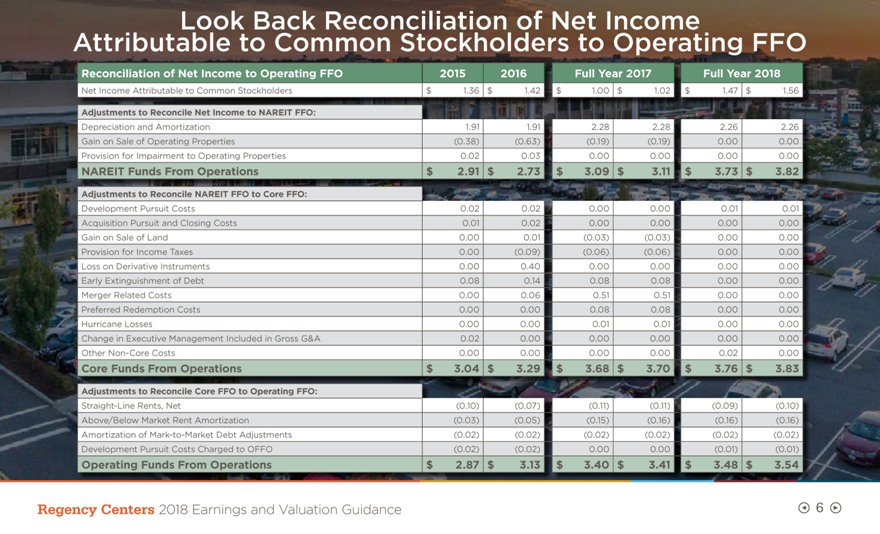
Look Back Reconciliation of Net Income Attributable
to Common Stockholders to Operating FFO
Reconciliation of Net Income to Operating FFO 2015 2016 Full Year 2017 Full Year 2018
Net Income Attributable to Common Stockholders $ 1.36 $ 1.42 $ 1.00 $ 1.02 $ 1.47 $ 1.56
Adjustments to Reconcile Net Income to NAREIT FFO:
Depreciation and
Amortization 1.91 1.91 2.28 2.28 2.26 2.26 Gain on Sale of Operating Properties (0.38) (0.63) (0.19) (0.19) 0.00 0.00 Provision for Impairment to Operating Properties 0.02 0.03 0.00 0.00 0.00 0.00
NAREIT Funds From Operations $ 2.91 $ 2.73 $ 3.09 $ 3.11 $ 3.73 $ 3.82
Adjustments to
Reconcile NAREIT FFO to Core FFO:
Development Pursuit Costs 0.02 0.02 0.00 0.00 0.01 0.01 Acquisition Pursuit and Closing Costs 0.01 0.02 0.00 0.00 0.00 0.00 Gain
on Sale of Land 0.00 0.01 (0.03) (0.03) 0.00 0.00 Provision for Income Taxes 0.00 (0.09) (0.06) (0.06) 0.00 0.00 Loss on Derivative Instruments 0.00 0.40 0.00 0.00 0.00 0.00 Early Extinguishment of Debt 0.08 0.14 0.08 0.08 0.00 0.00 Merger Related
Costs 0.00 0.06 0.51 0.51 0.00 0.00 Preferred Redemption Costs 0.00 0.00 0.08 0.08 0.00 0.00 Hurricane Losses 0.00 0.00 0.01 0.01 0.00 0.00 Change in Executive Management Included in Gross G&A 0.02 0.00 0.00 0.00 0.00 0.00 Other Non-Core Costs 0.00 0.00 0.00 0.00 0.02 0.00
Core Funds From Operations $ 3.04 $ 3.29 $ 3.68 $ 3.70 $ 3.76 $ 3.83
Adjustments to Reconcile Core FFO to Operating FFO:
Straight-Line Rents, Net (0.10) (0.07)
(0.11) (0.11) (0.09) (0.10) Above/Below Market Rent Amortization (0.03) (0.05) (0.15) (0.16) (0.16) (0.16) Amortization of Mark-to-Market Debt Adjustments (0.02) (0.02)
(0.02) (0.02) (0.02) (0.02) Development Pursuit Costs Charged to OFFO (0.02) (0.02) 0.00 0.00 (0.01) (0.01)
Operating Funds From Operations $ 2.87 $ 3.13 $ 3.40 $
3.41 $ 3.48 $ 3.54
Regency Centers 2018 Earnings and Valuation Guidance 6
|
Non-GAAP
Disclosure
The Company uses certain non-GAAP performance measures, in addition to the required GAAP presentations, as it
believes these measures improve the understanding of the Company’s operational results. Regency manages its entire real estate portfolio without regard to ownership structure, although certain decisions impacting properties owned through
partnerships require partner approval. Therefore, the Company believes presenting its pro-rata share of operating results regardless of ownership structure, along with other
non-GAAP measures, makes comparisons of other REITs’ operating results to the Company’s more meaningful. Management continually evaluates the usefulness, relevance, limitations, and calculation of
the Company’s reported non-GAAP performance measures to determine how best to provide relevant information to the public, and thus such reported measures could change. NAREIT FFO is a commonly used
measure of REIT performance, which the National Association of Real Estate Investment Trusts (“NAREIT”) defines as net income, computed in accordance with GAAP, excluding gains and losses from dispositions of depreciable property, net of
tax, excluding operating real estate impairments, plus depreciation and amortization, and after adjustments for unconsolidated partnerships and joint ventures. Regency computes NAREIT FFO for all periods presented in accordance with NAREIT’s
definition. Many companies use different depreciable lives and methods, and real estate values historically fluctuate with market conditions. Since NAREIT FFO excludes depreciation and amortization and gains and losses from depreciable property
dispositions, and impairments, it can provide a performance measure that, when compared year over year, reflects the impact on operations from trends in occupancy rates, rental rates, operating costs, acquisition and development activities, and
financing costs. This provides a perspective of the Company’s financial performance not immediately apparent from net income determined in accordance with GAAP. Thus, NAREIT FFO is a supplemental non-GAAP
financial measure of the Company’s operating performance, which does not represent cash generated from operating activities in accordance with GAAP and therefore, should not be considered a substitute measure of cash flows from operations. Core
FFO and Operating FFO are additional performance measures used by Regency as the computation of NAREIT FFO includes certain non-cash and non-comparable items that affect
the Company’s period-over-period performance. Core FFO excludes from NAREIT FFO: (a) transaction related income or expenses; (b) impairments on land; (c) gains or losses from the early extinguishment of debt; (d) development
pursuit costs; and (e) other non-comparable amounts as they occur. Operating FFO excludes from Core FFO: (a) non-cash components of earnings derived from above
and below market rent amortization, straight-line rents, and amortization of mark-to-market of debt adjustments; and includes (b) development pursuit costs. The
Company provides a reconciliation of Net Income to NAREIT FFO to Core FFO to Operating FFO.
Regency Centers 2018 Earnings and Valuation Guidance 7