Attached files
| file | filename |
|---|---|
| 8-K - 8-K - Quanterix Corp | a18-2700_18k.htm |
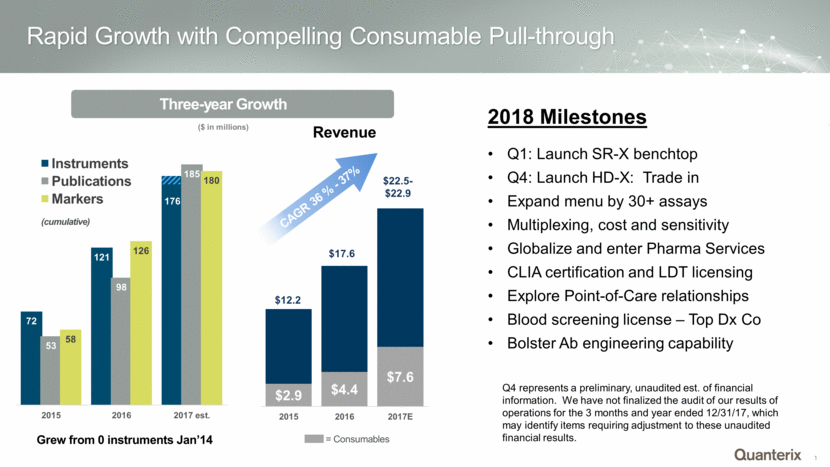
Rapid Growth with Compelling Consumable Pull-through Three-year Growth ($ in millions) Grew from 0 instruments Jan’14 (cumulative) 2018 Milestones Q1: Launch SR-X benchtop Q4: Launch HD-X: Trade in Expand menu by 30+ assays Multiplexing, cost and sensitivity Globalize and enter Pharma Services CLIA certification and LDT licensing Explore Point-of-Care relationships Blood screening license – Top Dx Co Bolster Ab engineering capability 176 $12.2 $17.6 CAGR 36 % - 37% Revenue $22.5-$22.9 = Consumables Q4 represents a preliminary, unaudited est. of financial information. We have not finalized the audit of our results of operations for the 3 months and year ended 12/31/17, which may identify items requiring adjustment to these unaudited financial results. 72 121 53 98 185 58 126 180 2015 2016 2017 est. Instruments Publications Markers

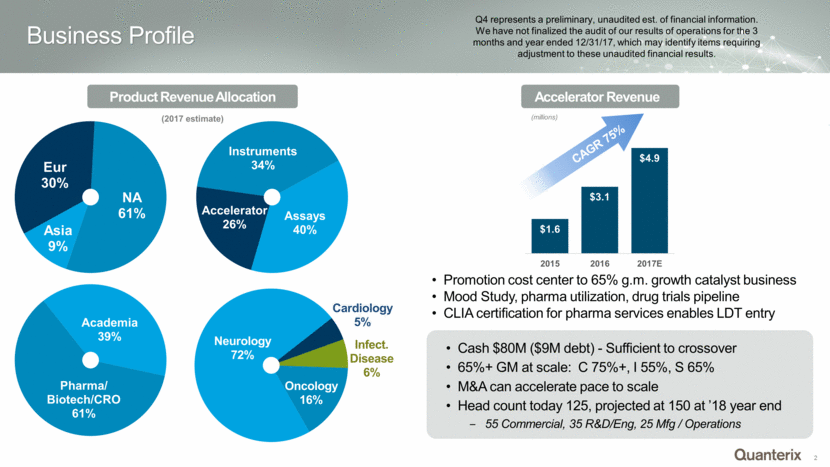
Cash $80M ($9M debt) - Sufficient to crossover 65%+ GM at scale: C 75%+, I 55%, S 65% M&A can accelerate pace to scale Head count today 125, projected at 150 at ’18 year end 55 Commercial, 35 R&D/Eng, 25 Mfg / Operations Business Profile Product Revenue Allocation (2017 estimate) CAGR 75% Accelerator Revenue (millions) Q4 represents a preliminary, unaudited est. of financial information. We have not finalized the audit of our results of operations for the 3 months and year ended 12/31/17, which may identify items requiring adjustment to these unaudited financial results. Promotion cost center to 65% g.m. growth catalyst business Mood Study, pharma utilization, drug trials pipeline CLIA certification for pharma services enables LDT entry $1.6 $3.1 $4.9 2015 2016 2017E

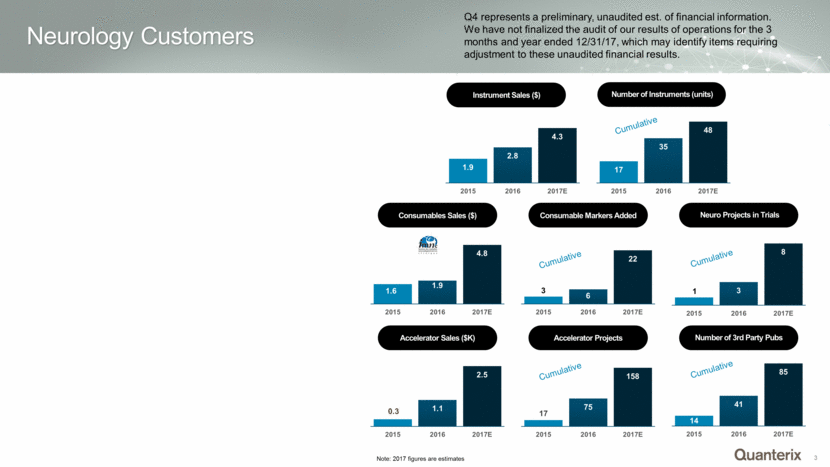
Neurology Customers Cumulative Cumulative Cumulative Cumulative Cumulative Note: 2017 figures are estimates Q4 represents a preliminary, unaudited est. of financial information. We have not finalized the audit of our results of operations for the 3 months and year ended 12/31/17, which may identify items requiring adjustment to these unaudited financial results. 1.9 2.8 4.3 2015 2016 2017E Instrument Sales ($) 1.6 1.9 4.8 2015 2016 2017E Consumables Sales ($) 0.3 1.1 2.5 2015 2016 2017E Accelerator Sales ($K) 17 35 48 2015 2016 2017E Number of Instruments (units) 3 6 22 2015 2016 2017E Consumable Markers Added 17 75 158 2015 2016 2017E Accelerator Projects 14 41 85 2015 2016 2017E Number of 3rd Party Pubs 1 3 8 2015 2016 2017E Neuro Projects in Trials

