Attached files
| file | filename |
|---|---|
| 8-K - Evolent Health, Inc. | form8k.htm |
Exhibit 99.1

Evolent Health Overview January 2018

Safe Harbor Statement Certain statements in this presentation and in other written or oral statements made by us or on our behalf are “forward-looking statements” within the meaning of the Private Securities Litigation Reform Act of 1995 (“PSLRA”). A forward-looking statement is a statement that is not a historical fact and, without limitation, includes any statement that may predict, forecast, indicate or imply future results, performance or achievements, and may contain words like: “believe,” “anticipate,” “expect,” “estimate,” “aim,” “predict,” “potential,” “continue,” “plan,” “project,” “will,” “should,” “shall,” “may,” “might” and other words or phrases with similar meaning in connection with a discussion of future operating or financial performance. In particular, these include statements relating to future actions, trends in our businesses, prospective services, future performance or financial results and the outcome of contingencies, such as legal proceedings. We claim the protection afforded by the safe harbor for forward-looking statements provided by the PSLRA. These statements are only predictions based on our current expectations and projections about future events. Forward-looking statements involve risks and uncertainties that may cause actual results, level of activity, performance or achievements to differ materially from the results contained in the forward-looking statements. Risks and uncertainties that may cause actual results to vary materially, include, among others: certain risks and uncertainties associated with the acquisitions of New Mexico Health Connections and the acquisition of Valence Health, including future core business and premium revenues may be less than expected, the timing and extent of new lives expected to come onto the platform may not occur as expected and the expected results of Evolent may not be impacted as anticipated; the structural change in the market for health care in the United States; uncertainty in the health care regulatory framework; the uncertain impact the results of the 2016 presidential and congressional elections may have on health care laws and regulations; our ability to effectively manage our growth; the significant portion of revenue we derive from our largest partners, and the potential loss, termination or renegotiation of customer contracts; our ability to offer new and innovative products and services; risks related to completed and future acquisitions, investments and alliances, which may be difficult to integrate, divert management resources, result in unanticipated costs or dilute our stockholders; the growth and success of our partners, which is difficult to predict and is subject to factors outside of our control, including premium pricing reductions and the ability to control and, if necessary, reduce health care costs; our ability to attract new partners and deliver results for partners, our ability to identify and complete strategic merger and acquisition opportunities and our ability to invest capital with attractive economics; the increasing number of risk-sharing arrangements we enter into with our partners; our ability to recover the significant upfront costs in our partner relationships; our ability to estimate the size of our target market; our ability to maintain and enhance our reputation and brand recognition; consolidation in the health care industry; competition which could limit our ability to maintain or expand market share within our industry; our ability to partner with providers due to exclusivity provisions in our contracts; restrictions and penalties as a result of privacy and data protection laws; adequate protection of our intellectual property, including trademarks; any alleged infringement, misappropriation or violation of third-party proprietary rights; our use of “open source” software; our ability to protect the confidentiality of our trade secrets, know-how and other proprietary information; our reliance on third parties and licensed technologies; our ability to use, disclose, de-identify or license data and to integrate third-party technologies; data loss or corruption due to failures or errors in our systems and service disruptions at our data centers; online security risks and breaches or failures of our security measures; our reliance on Internet infrastructure, bandwidth providers, data center providers, other third parties and our own systems for providing services to our users; our reliance on third-party vendors to host and maintain our technology platform; our dependency on our key personnel, and our ability to attract, hire, integrate and retain key personnel; the risk of potential future goodwill impairment on our results of operations; our indebtedness and our ability to obtain additional financing; our ability to achieve profitability in the future; the requirements of being a public company; our adjusted results may not be representative of our future performance; the risk of potential future litigation; our holding company structure and dependence on distributions from Evolent Health LLC; our obligations to make payments to certain of our pre-IPO investors for certain tax benefits we may claim in the future; our ability to utilize benefits under the tax receivables agreement described herein; our ability to realize all or a portion of the tax benefits that we currently expect to result from past and future exchanges of Class B common units of Evolent Health LLC for our Class A common stock, and to utilize certain tax attributes of Evolent Health Holdings and an affiliate of TPG; distributions that Evolent Health LLC will be required to make to us and to the other members of Evolent Health LLC; our obligations to make payments under the tax receivables agreement that may be accelerated or may exceed the tax benefits we realize; different interests among our pre-IPO investors, or between us and our pre-IPO investors; the terms of agreements between us and certain of our pre-IPO investors; the potential volatility of our Class A common stock price; the potential decline of our Class A common stock price if a substantial number of shares become available for sale or if a large number of Class B common units are exchanged for shares of Class A common stock; provisions in our second amended and restated certificate of incorporation and amended and restated by-laws and provisions of Delaware law that discourage or prevent strategic transactions, including a takeover of us; the ability of certain of our investors to compete with us without restrictions; provisions in our second amended and restated certificate of incorporation which could limit our stockholders’ ability to obtain a favorable judicial forum for disputes with us or our directors, officers or employees; our intention not to pay cash dividends on our Class A common stock; our ability to remediate the material weakness in our internal control over financial reporting; and our lack of public company operating experience. The risks included here are not exhaustive. Although we believe the expectations reflected in the forward-looking statements are reasonable, we cannot guarantee future results, level of activity, performance or achievements. Our Quarterly Report on Form 10-Q for the quarterly period ended June 30, 2017, and other documents filed with the SEC include additional factors that could affect our businesses and financial performance. Moreover, we operate in a rapidly changing and competitive environment. New risk factors emerge from time to time, and it is not possible for management to predict all such risk factors. Further, it is not possible to assess the effect of all risk factors on our businesses or the extent to which any factor, or combination of factors, may cause actual results to differ materially from those contained in any forward-looking statements. Given these risks and uncertainties, investors should not place undue reliance on forward-looking statements as a prediction of actual results. In addition, we disclaim any obligation to update any forward-looking statements to reflect events or circumstances that occur after the date of this report.We use market data and industry forecasts and projections throughout the presentation. We have obtained the market data from certain publicly available sources of information, including publicly available independent industry publications and other third-party sources. Unless otherwise indicated, statements in this presentation concerning our industry and the markets in which we operate, including our general expectations and competitive position, business opportunity and market size, growth and share, are based on information from independent industry organizations and other third-party sources (including industry publications, surveys and forecasts), data from our internal research and management estimates. Forecasts are based on industry surveys and the preparer’s expertise in the industry and there is no assurance that any of the forecasted amounts will be achieved. We believe the data that third parties have compiled is reliable, but we have not independently verified the accuracy of this information. Any forecasts are based on data (including third-party data), models and experience of various professionals and are based on various assumptions, all of which are subject to change without notice. While we are not aware of any misstatements regarding the industry data presented herein, forecasts, assumptions, expectations, beliefs, estimates and projections involve risks and uncertainties and are subject to change based on various factors, including those described above.
Non-GAAP Financial Measures In addition to disclosing financial results that are determined in accordance with GAAP, we present and discuss Adjusted EBITDA, Adjusted Revenue, Adjusted Transformation Revenue, Adjusted Platform and Operations Revenue, Adjusted Cost of Revenue, Adjusted Services Revenue, True Health New Mexico Adjusted Premium Revenue and Adjusted Inter-company Revenue, which are all non-GAAP financial measures, as supplemental measures to help investors evaluate our fundamental operational performance. Adjusted Revenue, Adjusted Transformation Revenue and Adjusted Platform and Operations Revenue are defined as revenue, transformation revenue, and platform and operations revenue, respectively, adjusted to include revenue, transformation revenue and platform and operations revenue, as applicable, of Evolent Health LLC for periods prior to the offering reorganization, and to exclude the impact of purchase accounting adjustments. Evolent Health, Inc. is a holding company and its principal asset is all of the Class A common units in its operating subsidiary, Evolent Health LLC, which has owned all of its operating assets and substantially all of its business since inception. Prior to the offering reorganization on June 4, 2015, the predecessor of Evolent Health, Inc. accounted for Evolent Health LLC as an equity method investment. The financial results of Evolent Health LLC have been consolidated in the financial statements of Evolent Health, Inc. following the offering reorganization. Management uses Adjusted Revenue, Adjusted Transformation Revenue and Adjusted Platform and Operations Revenue as supplemental performance measures because they reflect a complete view of the operational results. The measures are also useful to investors because they reflect the full view of our operational performance in line with how we generate our long-term forecasts.Adjusted Services Revenues is defined as the sum of Transformation Revenue and Platform and Operations Revenue (in line with our historical financial reporting line items) adjusted to exclude the impact of purchase accounting and certain other adjustments. Adjusted True Health Premium Revenue is defined as premium revenue of our new subsidiary, True Health New Mexico, Inc., adjusted to exclude the impact of purchase accounting and certain other adjustments. Adjusted Inter-Company Revenue is defined as services revenue received by our new subsidiary, True Health New Mexico, Inc., adjusted to exclude the impact of purchase accounting and certain other adjustments. Management uses Adjusted Services Revenues, Adjusted True Health Premium Revenues and Adjusted Inter-Company Revenues as supplemental performance measures because they reflect the top-line results excluding the impact of certain adjustments. These measures are useful to investors because they reflect our operational performance in line with how we generate our forecasts. Adjusted EBITDA is defined as EBITDA (net income [loss] attributable to Evolent Health, Inc. before interest income, interest expense, [provision] benefit for income taxes, depreciation and amortization expenses), adjusted to include net income (loss) of Evolent Health LLC (less interest income [expense], net, depreciation and amortization expenses and other income [expense], net, of Evolent Health LLC) for the periods prior to the offering reorganization on June 4, 2015, and adjusted to exclude goodwill impairment, gain on change in fair value of contingent consideration, income (loss) from affiliates, other income (expense), net, net (income) loss attributable to non-controlling interests, purchase accounting adjustments, stock-based compensation expenses, transaction costs related to acquisitions and business combinations, such as gain on change in fair value of contingent consideration and securities offerings, as well as one-time adjustments. Management uses Adjusted EBITDA as a supplemental performance measure because the removal of transaction costs, one-time or non-cash items (depreciation, amortization and stock-based compensation expenses) allows us to focus on operational performance. We believe that this measure is also useful to investors because it allows further insight into the period over period operational performance in a manner that is comparable to other organizations in our industry and in the market in general.These adjusted measures do not represent and should not be considered as alternatives to GAAP measurements, and our calculations thereof may not be comparable to similarly entitled measures reported by other companies. A reconciliation of these adjusted measures to the comparable GAAP financial measures is presented in the Appendix. We are not providing reconciliations for the forward-looking non-GAAP financial measures included in this presentation due to the inherent difficulty in forecasting and quantifying certain amounts that would be necessary for such reconciliations, including adjustments that could be made, the amount of which, based on historical experience, could be significant.

Presenters Nicky McGraneChief Financial OfficerEvolent Health Frank WilliamsChief Executive Officer and Co-founderEvolent Health
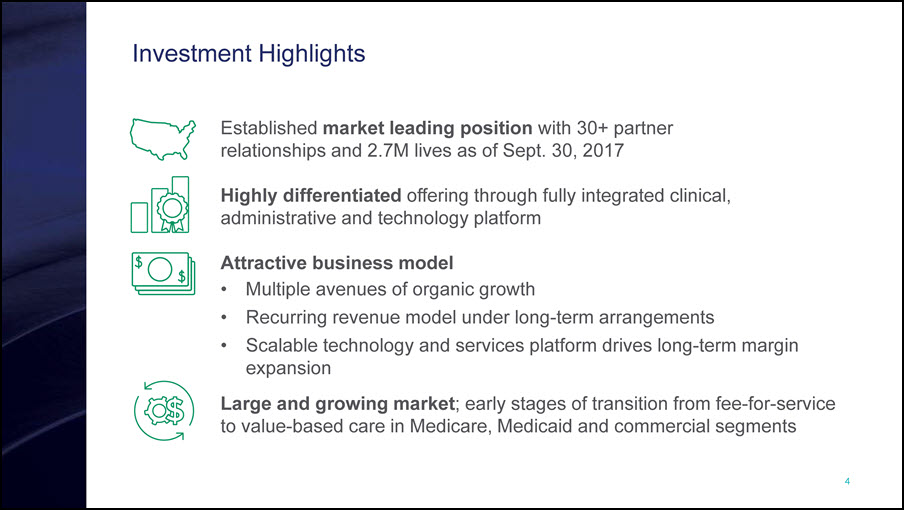
Investment Highlights Established market leading position with 30+ partnerrelationships and 2.7M lives as of Sept. 30, 2017Highly differentiated offering through fully integrated clinical, administrative and technology platform Attractive business modelMultiple avenues of organic growthRecurring revenue model under long-term arrangementsScalable technology and services platform drives long-term margin expansionLarge and growing market; early stages of transition from fee-for-service to value-based care in Medicare, Medicaid and commercial segments
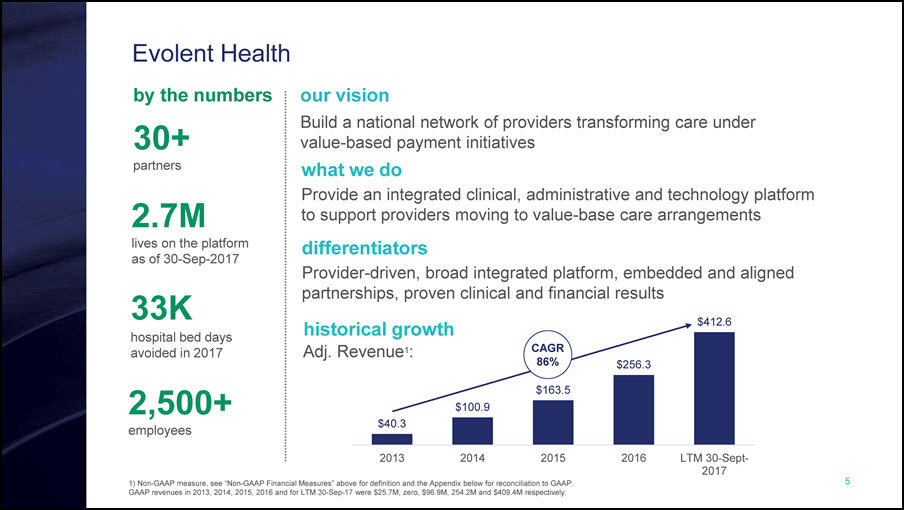
1) Non-GAAP measure, see “Non-GAAP Financial Measures” above for definition and the Appendix below for reconciliation to GAAP. GAAP revenues in 2013, 2014, 2015, 2016 and for LTM 30-Sep-17 were $25.7M, zero, $96.9M, 254.2M and $409.4M respectively. Evolent Health what we do Provide an integrated clinical, administrative and technology platform to support providers moving to value-base care arrangements our vision Build a national network of providers transforming care under value-based payment initiatives by the numbers 33K hospital bed days avoided in 2017 2,500+employees 30+partners 2.7Mlives on the platform as of 30-Sep-2017 CAGR 86% differentiators Provider-driven, broad integrated platform, embedded and aligned partnerships, proven clinical and financial results historical growth Adj. Revenue1:
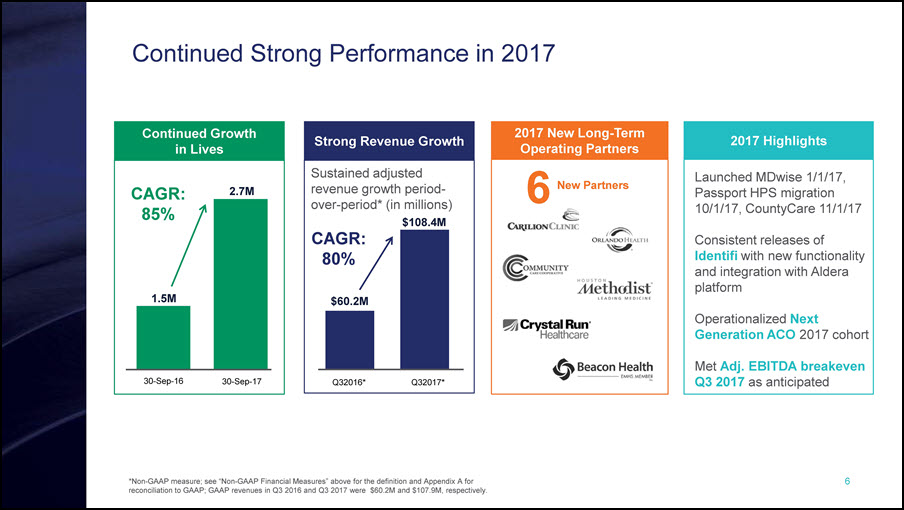
*Non-GAAP measure; see “Non-GAAP Financial Measures” above for the definition and Appendix A for reconciliation to GAAP; GAAP revenues in Q3 2016 and Q3 2017 were $60.2M and $107.9M, respectively. Continued Strong Performance in 2017 2017 Highlights Launched MDwise 1/1/17, Passport HPS migration 10/1/17, CountyCare 11/1/17Consistent releases of Identifi with new functionality and integration with Aldera platformOperationalized Next Generation ACO 2017 cohort Met Adj. EBITDA breakeven Q3 2017 as anticipated Continued Growth in Lives CAGR: 85% 1.5M 2.7M 30-Sep-16 30-Sep-17 Sustained adjusted revenue growth period-over-period* (in millions) Strong Revenue Growth CAGR:80% Q32016* Q32017* $60.2M $108.4M 2017 New Long-TermOperating Partners 6 New Partners
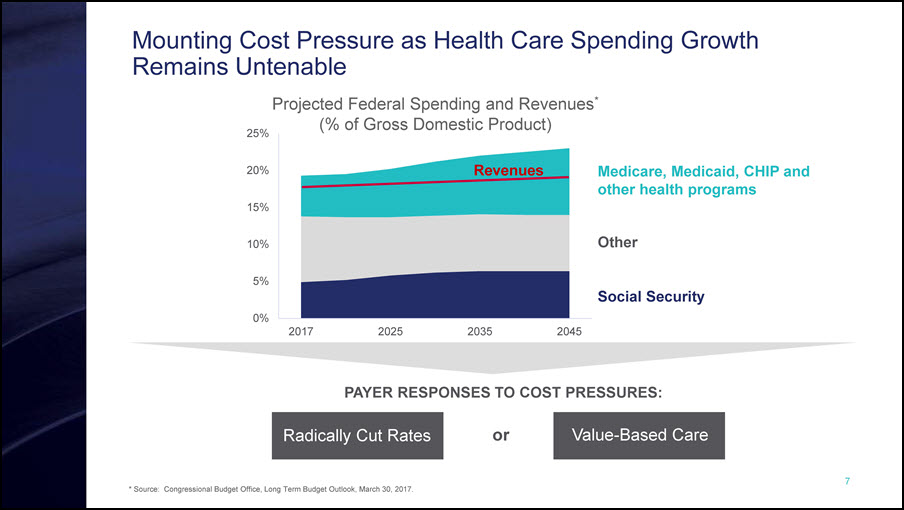
* Source: Congressional Budget Office, Long Term Budget Outlook, March 30, 2017. Mounting Cost Pressure as Health Care Spending Growth Remains Untenable PAYER RESPONSES TO COST PRESSURES: Radically Cut Rates Value-Based Care or Medicare, Medicaid, CHIP and other health programs Social Security Other Projected Federal Spending and Revenues*(% of Gross Domestic Product) Revenues
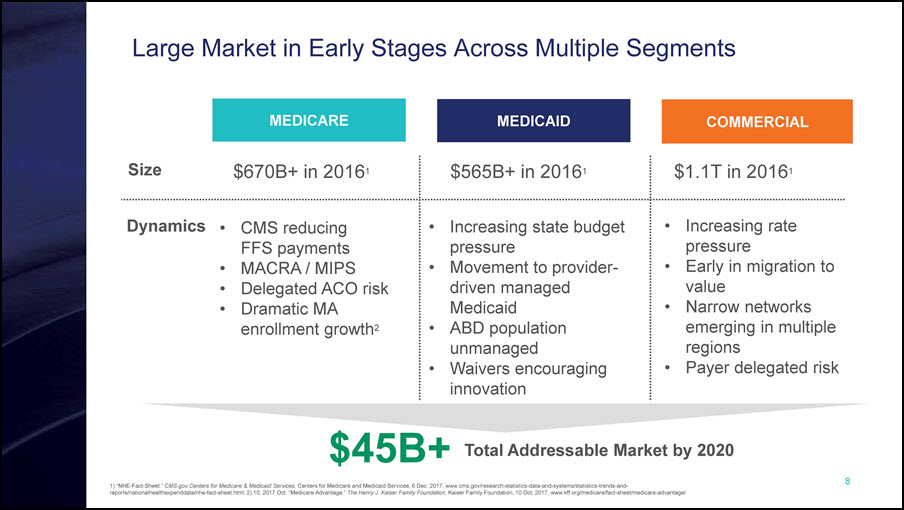
Large Market in Early Stages Across Multiple Segments MEDICAID COMMERCIAL MEDICARE CMS reducing FFS paymentsMACRA / MIPSDelegated ACO riskDramatic MA enrollment growth2 Increasing state budget pressureMovement to provider-driven managed MedicaidABD population unmanagedWaivers encouraging innovation Increasing rate pressureEarly in migration to valueNarrow networks emerging in multiple regionsPayer delegated risk Size Dynamics $670B+ in 20161 $565B+ in 20161 $1.1T in 20161 1) “NHE-Fact-Sheet.” CMS.gov Centers for Medicare & Medicaid Services, Centers for Medicare and Medicaid Services, 6 Dec. 2017, www.cms.gov/research-statistics-data-and-systems/statistics-trends-and-reports/nationalhealthexpenddata/nhe-fact-sheet.html. 2) 10, 2017 Oct. “Medicare Advantage.” The Henry J. Kaiser Family Foundation, Kaiser Family Foundation, 10 Oct. 2017, www.kff.org/medicare/fact-sheet/medicare-advantage/. $45B+ Total Addressable Market by 2020
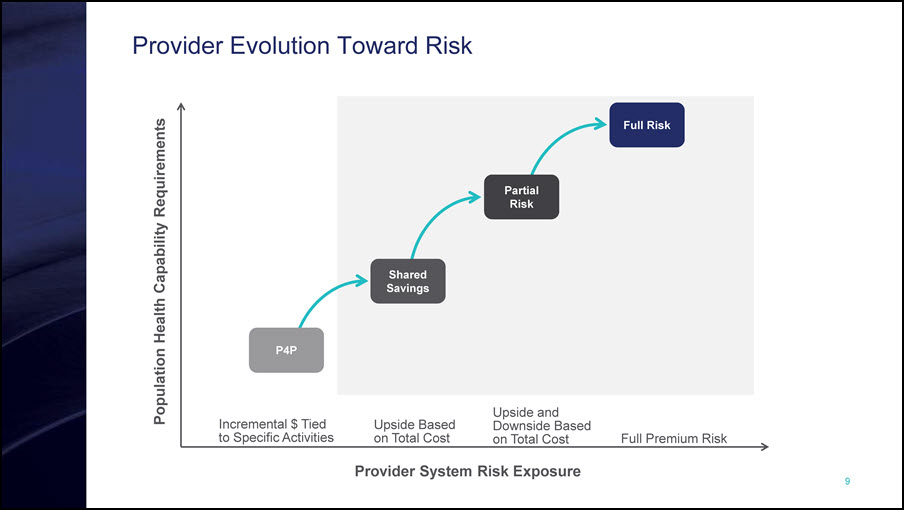
Provider Evolution Toward Risk Full Premium Risk Provider System Risk Exposure Population Health Capability Requirements P4P Partial Risk Full Risk Shared Savings Incremental $ Tied to Specific Activities Upside Based on Total Cost Upside and Downside Based on Total Cost
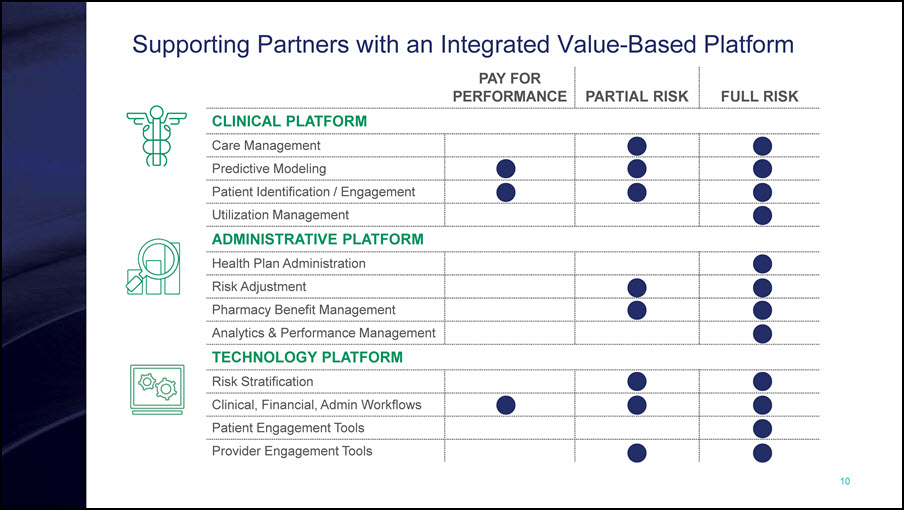
Supporting Partners with an Integrated Value-Based Platform PAY FOR PERFORMANCE PARTIAL RISK FULL RISK CLINICAL PLATFORM Care Management Predictive Modeling Patient Identification / Engagement Utilization Management ADMINISTRATIVE PLATFORM Health Plan Administration Risk Adjustment Pharmacy Benefit Management Analytics & Performance Management TECHNOLOGY PLATFORM Risk Stratification Clinical, Financial, Admin Workflows Patient Engagement Tools Provider Engagement Tools
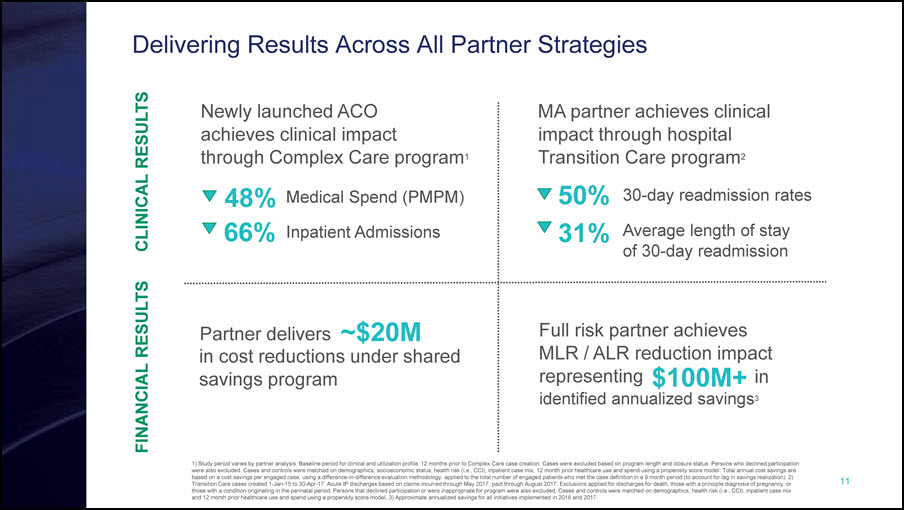
1) Study period varies by partner analysis. Baseline period for clinical and utilization profile: 12 months prior to Complex Care case creation. Cases were excluded based on program length and closure status. Persons who declined participation were also excluded. Cases and controls were matched on demographics, socioeconomic status, health risk (i.e., CCI), inpatient case mix, 12 month prior healthcare use and spend using a propensity score model. Total annual cost savings are based on a cost savings per engaged case, using a difference-in-difference evaluation methodology, applied to the total number of engaged patients who met the case definition in a 9 month period (to account for lag in savings realization). 2) Transition Care cases created 1-Jan-15 to 30-Apr-17. Acute IP discharges based on claims incurred through May 2017, paid through August 2017. Exclusions applied for discharges for death, those with a principle diagnosis of pregnancy, or those with a condition originating in the perinatal period. Persons that declined participation or were inappropriate for program were also excluded. Cases and controls were matched on demographics, health risk (i.e., CCI), inpatient case mix and 12 month prior healthcare use and spend using a propensity score model. 3) Approximate annualized savings for all initiatives implemented in 2016 and 2017. Delivering Results Across All Partner Strategies FINANCIAL RESULTS CLINICAL RESULTS Newly launched ACO achieves clinical impact through Complex Care program1 MA partner achieves clinical impact through hospital Transition Care program2 50% 30-day readmission rates 31% Average length of stay of 30-day readmission 48% Medical Spend (PMPM) 66% Inpatient Admissions Partner delivers in cost reductions under shared savings program ~$20M Full risk partner achieves MLR / ALR reduction impact representing in $100M+ identified annualized savings3
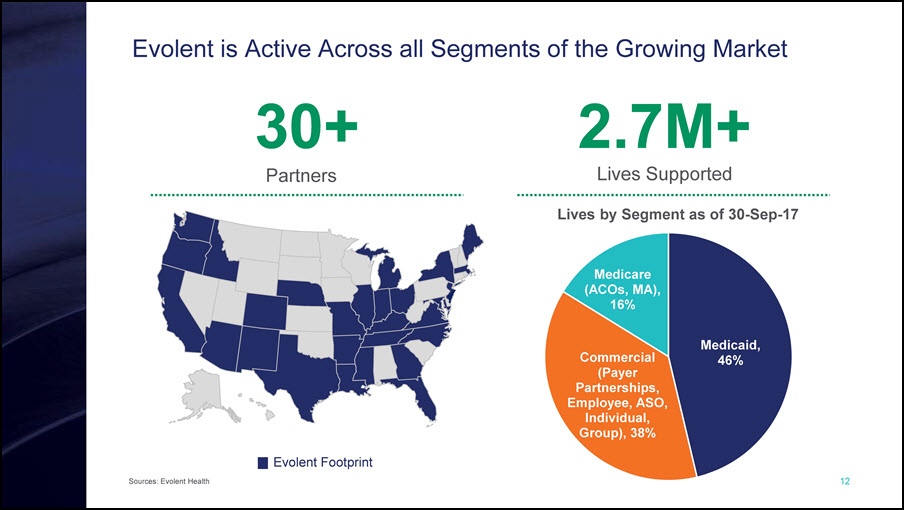
Sources: Evolent Health Evolent is Active Across all Segments of the Growing Market Lives by Segment as of 30-Sep-17 2.7M+Lives Supported 30+ Y Evolent Footprint Partners
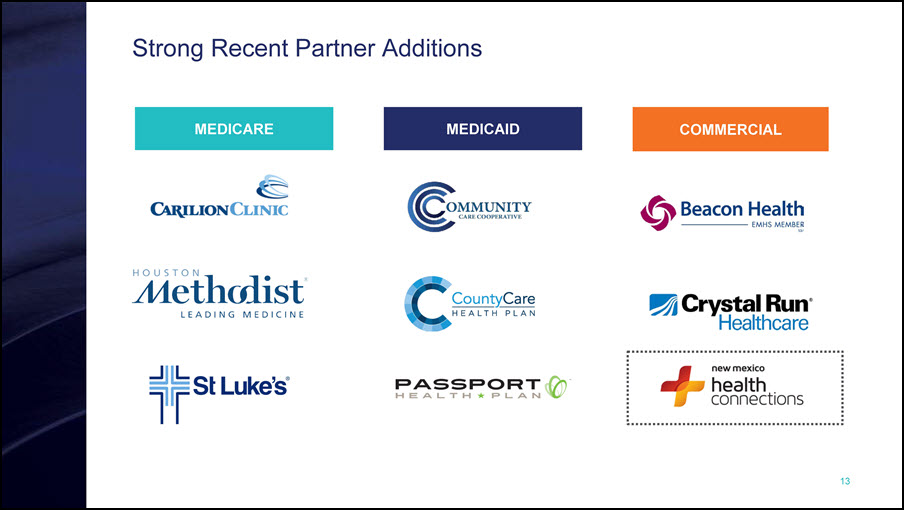
Strong Recent Partner Additions MEDICAID COMMERCIAL MEDICARE

Financial discussion
Financial Highlights Strong Consistent GrowthLarge addressable marketGrowth through expansion in existing and new marketsRecurring Revenue Model with High VisibilityPer Member Per Month (PMPM) contracts Long-term service agreementsScalable ModelScalable platform leveraging existing infrastructureHigh margin flow-through on incremental lives added to platform
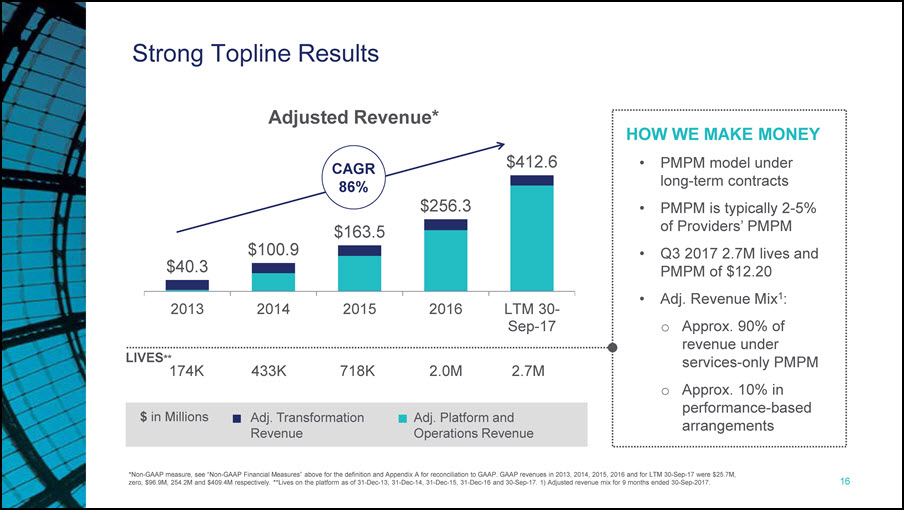
*Non-GAAP measure, see “Non-GAAP Financial Measures” above for the definition and Appendix A for reconciliation to GAAP. GAAP revenues in 2013, 2014, 2015, 2016 and for LTM 30-Sep-17 were $25.7M, zero, $96.9M, 254.2M and $409.4M respectively. **Lives on the platform as of 31-Dec-13, 31-Dec-14, 31-Dec-15, 31-Dec-16 and 30-Sep-17. 1) Adjusted revenue mix for 9 months ended 30-Sep-2017. Strong Topline Results Adj. Transformation Revenue Adj. Platform and Operations Revenue $ in Millions 2.0M 718K 174K LIVES** 2.7M CAGR 86% HOW WE MAKE MONEYPMPM model under long-term contractsPMPM is typically 2-5% of Providers’ PMPMQ3 2017 2.7M lives and PMPM of $12.20Adj. Revenue Mix1:Approx. 90% of revenue under services-only PMPM Approx. 10% in performance-based arrangements Adjusted Revenue* 433K
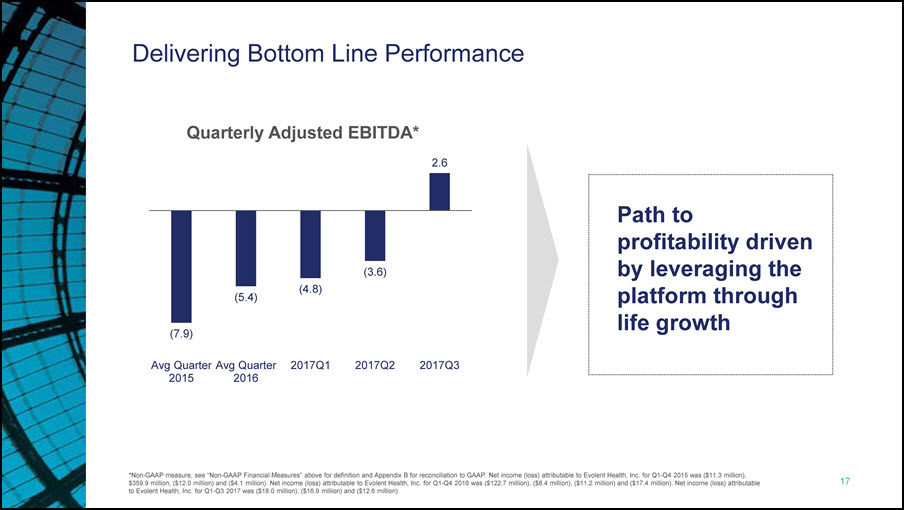
*Non-GAAP measure, see “Non-GAAP Financial Measures” above for definition and Appendix B for reconciliation to GAAP. Net income (loss) attributable to Evolent Health, Inc. for Q1-Q4 2015 was ($11.3 million), $359.9 million, ($12.0 million) and ($4.1 million). Net income (loss) attributable to Evolent Health, Inc. for Q1-Q4 2016 was ($122.7 million), ($8.4 million), ($11.2 million) and ($17.4 million). Net income (loss) attributable to Evolent Health, Inc. for Q1-Q3 2017 was ($18.0 million), ($16.9 million) and ($12.6 million). Delivering Bottom Line Performance Path to profitability driven by leveraging the platform through life growth
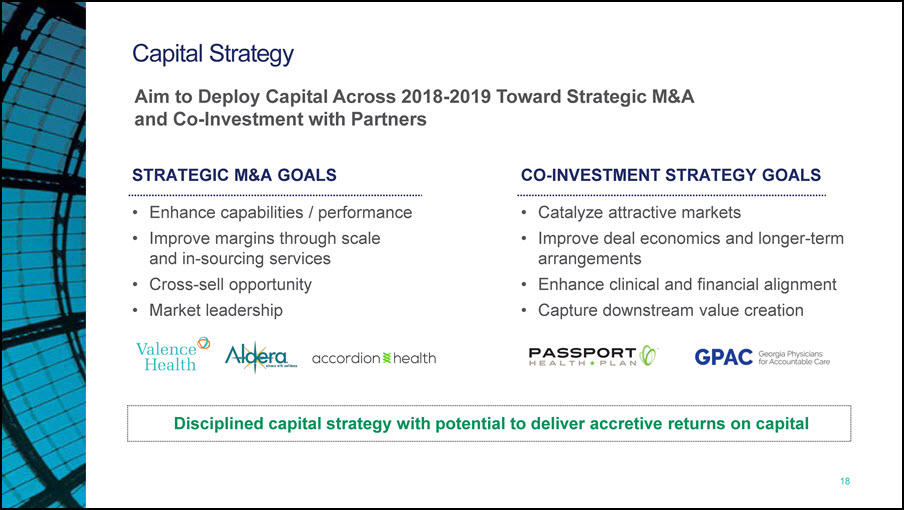
Capital Strategy STRATEGIC M&A GOALSEnhance capabilities / performanceImprove margins through scale and in-sourcing servicesCross-sell opportunityMarket leadership CO-INVESTMENT STRATEGY GOALSCatalyze attractive marketsImprove deal economics and longer-term arrangementsEnhance clinical and financial alignmentCapture downstream value creation Aim to Deploy Capital Across 2018-2019 Toward Strategic M&A and Co-Investment with Partners Disciplined capital strategy with potential to deliver accretive returns on capital
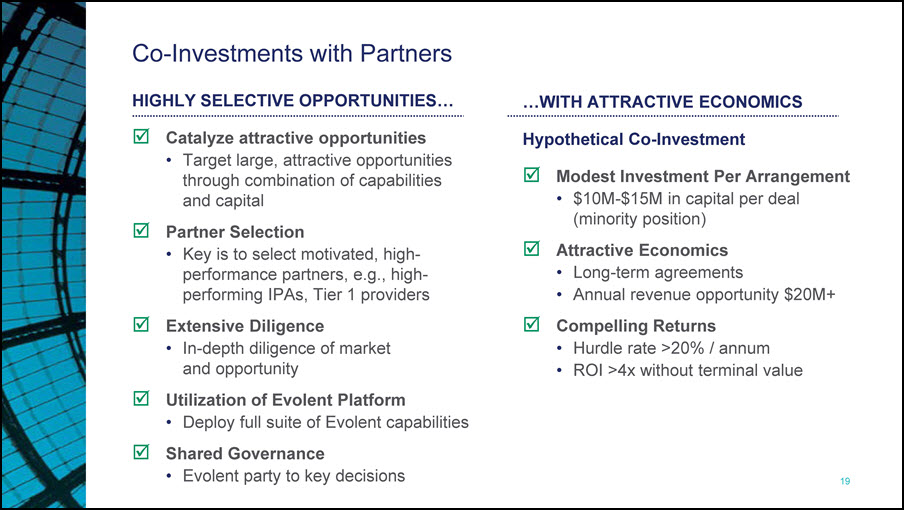
Co-Investments with Partners HIGHLY SELECTIVE OPPORTUNITIES…Catalyze attractive opportunitiesTarget large, attractive opportunities through combination of capabilities and capitalPartner Selection Key is to select motivated, high-performance partners, e.g., high-performing IPAs, Tier 1 providersExtensive DiligenceIn-depth diligence of market and opportunityUtilization of Evolent PlatformDeploy full suite of Evolent capabilitiesShared GovernanceEvolent party to key decisions …WITH ATTRACTIVE ECONOMICSHypothetical Co-InvestmentModest Investment Per Arrangement$10M-$15M in capital per deal (minority position)Attractive EconomicsLong-term agreementsAnnual revenue opportunity $20M+Compelling ReturnsHurdle rate >20% / annumROI >4x without terminal value
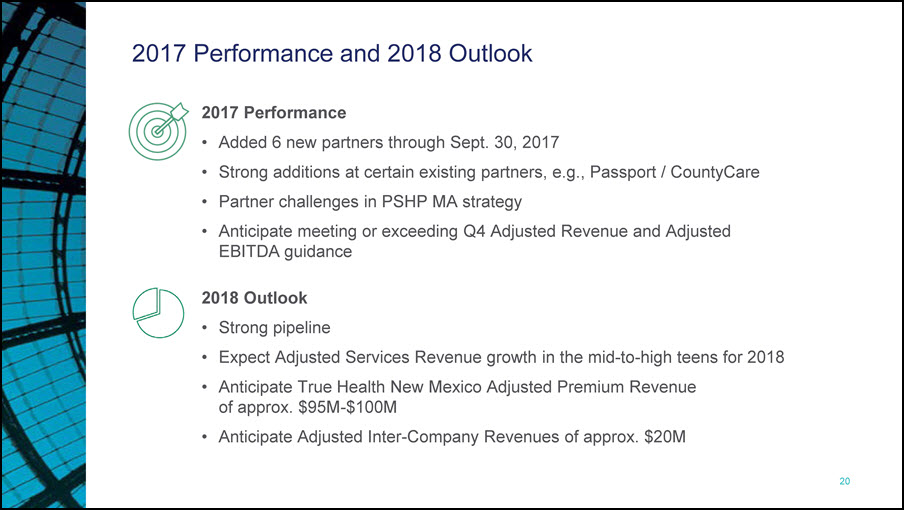
2017 Performance and 2018 Outlook 2017 PerformanceAdded 6 new partners through Sept. 30, 2017Strong additions at certain existing partners, e.g., Passport / CountyCarePartner challenges in PSHP MA strategyAnticipate meeting or exceeding Q4 Adjusted Revenue and Adjusted EBITDA guidance2018 OutlookStrong pipelineExpect Adjusted Services Revenue growth in the mid-to-high teens for 2018Anticipate True Health New Mexico Adjusted Premium Revenue of approx. $95M-$100MAnticipate Adjusted Inter-Company Revenues of approx. $20M
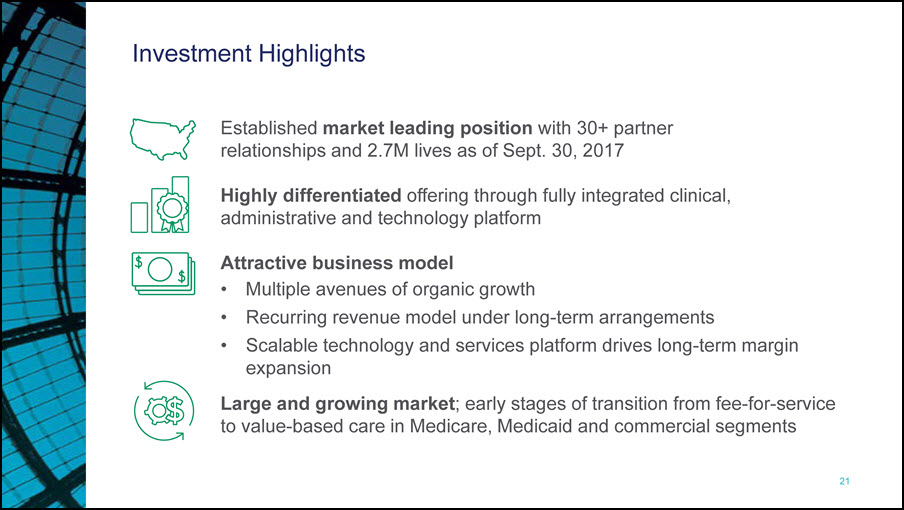
Investment Highlights Established market leading position with 30+ partnerrelationships and 2.7M lives as of Sept. 30, 2017Highly differentiated offering through fully integrated clinical, administrative and technology platform Attractive business modelMultiple avenues of organic growthRecurring revenue model under long-term arrangementsScalable technology and services platform drives long-term margin expansionLarge and growing market; early stages of transition from fee-for-service to value-based care in Medicare, Medicaid and commercial segments

Appendix
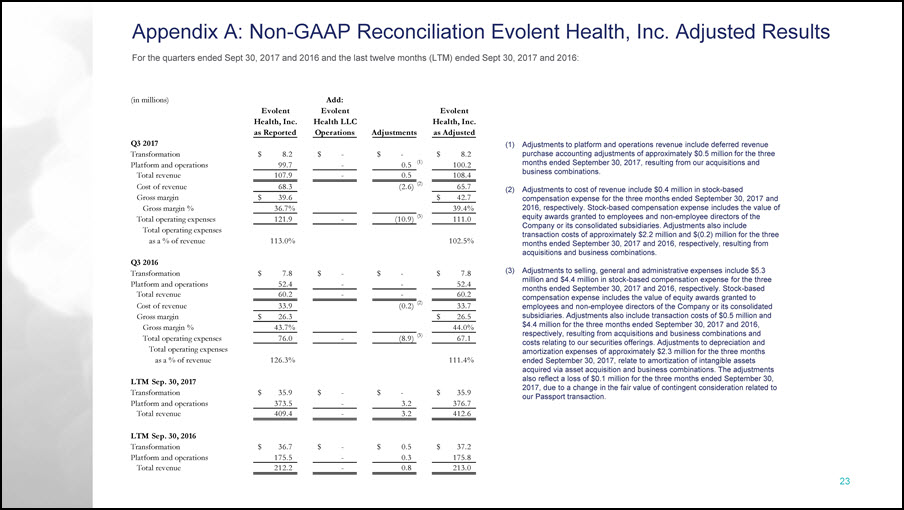
For the quarters ended Sept 30, 2017 and 2016 and the last twelve months (LTM) ended Sept 30, 2017 and 2016: Appendix A: Non-GAAP Reconciliation Evolent Health, Inc. Adjusted Results (1) Adjustments to platform and operations revenue include deferred revenue purchase accounting adjustments of approximately $0.5 million for the three months ended September 30, 2017, resulting from our acquisitions and business combinations. (2) Adjustments to cost of revenue include $0.4 million in stock-based compensation expense for the three months ended September 30, 2017 and 2016, respectively. Stock-based compensation expense includes the value of equity awards granted to employees and non-employee directors of the Company or its consolidated subsidiaries. Adjustments also include transaction costs of approximately $2.2 million and $(0.2) million for the three months ended September 30, 2017 and 2016, respectively, resulting from acquisitions and business combinations. (3) Adjustments to selling, general and administrative expenses include $5.3 million and $4.4 million in stock-based compensation expense for the three months ended September 30, 2017 and 2016, respectively. Stock-based compensation expense includes the value of equity awards granted to employees and non-employee directors of the Company or its consolidated subsidiaries. Adjustments also include transaction costs of $0.5 million and $4.4 million for the three months ended September 30, 2017 and 2016, respectively, resulting from acquisitions and business combinations and costs relating to our securities offerings. Adjustments to depreciation and amortization expenses of approximately $2.3 million for the three months ended September 30, 2017, relate to amortization of intangible assets acquired via asset acquisition and business combinations. The adjustments also reflect a loss of $0.1 million for the three months ended September 30, 2017, due to a change in the fair value of contingent consideration related to our Passport transaction. (in millions) Add: Evolent Evolent Evolent Health, Inc. Health LLC Health, Inc. as Reported Operations Adjustments as Adjusted Q3 2017 Transformation $ 8.2 $ - $ - $ 8.2 Platform and operations 99.7 - 0.5 (1) 100.2 Total revenue 107.9 - 0.5 108.4 Cost of revenue 68.3 (2.6) (2) 65.7 Gross margin $ 39.6 $ 42.7 Gross margin % 36.7% 39.4% Total operating expenses 121.9 - (10.9) (3) 111.0 Total operating expenses as a % of revenue 113.0% 102.5% Q3 2016 Transformation $ 7.8 $ - $ - $ 7.8 Platform and operations 52.4 - - 52.4 Total revenue 60.2 - - 60.2 Cost of revenue 33.9 (0.2) (2) 33.7 Gross margin $ 26.3 $ 26.5 Gross margin % 43.7% 44.0% Total operating expenses 76.0 - (8.9) (3) 67.1 Total operating expenses as a % of revenue 126.3% 111.4% LTM Sep. 30, 2017 Transformation $ 35.9 $ - $ - $ 35.9 Platform and operations 373.5 - 3.2 376.7 Total revenue 409.4 - 3.2 412.6 LTM Sep. 30, 2016 Transformation $ 36.7 $ - $ 0.5 $ 37.2 Platform and operations 175.5 - 0.3 175.8 Total revenue 212.2 - 0.8 213.0
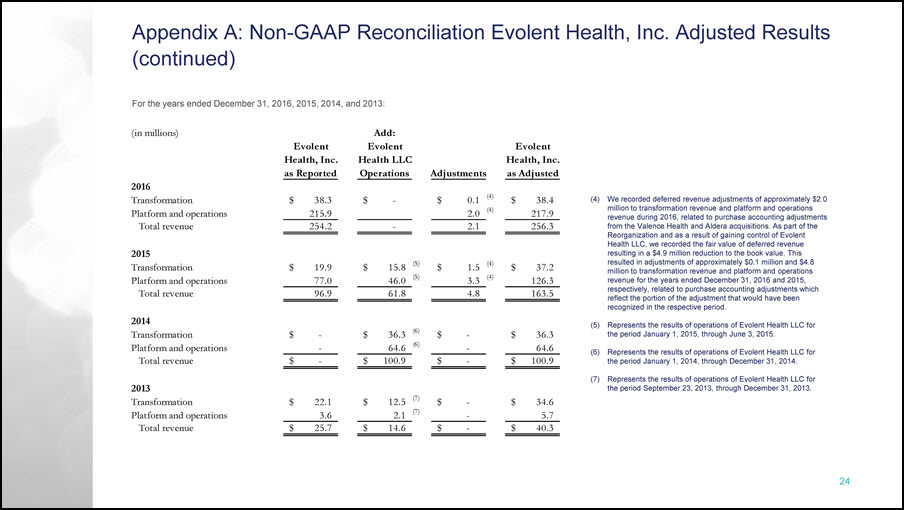
For the years ended December 31, 2016, 2015, 2014, and 2013: Appendix A: Non-GAAP Reconciliation Evolent Health, Inc. Adjusted Results (continued) (4) We recorded deferred revenue adjustments of approximately $2.0 million to transformation revenue and platform and operations revenue during 2016, related to purchase accounting adjustments from the Valence Health and Aldera acquisitions. As part of the Reorganization and as a result of gaining control of Evolent Health LLC, we recorded the fair value of deferred revenue resulting in a $4.9 million reduction to the book value. This resulted in adjustments of approximately $0.1 million and $4.8 million to transformation revenue and platform and operations revenue for the years ended December 31, 2016 and 2015, respectively, related to purchase accounting adjustments which reflect the portion of the adjustment that would have been recognized in the respective period. (5) Represents the results of operations of Evolent Health LLC for the period January 1, 2015, through June 3, 2015. (6) Represents the results of operations of Evolent Health LLC for the period January 1, 2014, through December 31, 2014. (7) Represents the results of operations of Evolent Health LLC for the period September 23, 2013, through December 31, 2013. (in millions) Add: Evolent Evolent Evolent Health, Inc. Health LLC Health, Inc. as Reported Operations Adjustments as Adjusted 2016 Transformation $ 38.3 $ - $ 0.1 (4) $ 38.4 Platform and operations 215.9 2.0 (4) 217.9 Total revenue 254.2 - 2.1 256.3 2015 Transformation $ 19.9 $ 15.8 (5) $ 1.5 (4) $ 37.2 Platform and operations 77.0 46.0 (5) 3.3 (4) 126.3 Total revenue 96.9 61.8 4.8 163.5 2014 Transformation $ - $ 36.3 (6) $ - $ 36.3 Platform and operations - 64.6 (6) - 64.6 Total revenue $ - $ 100.9 $ - $ 100.9 2013 Transformation $ 22.1 $ 12.5 (7) $ - $ 34.6 Platform and operations 3.6 2.1 (7) - 5.7 Total revenue $ 25.7 $ 14.6 $ - $ 40.3
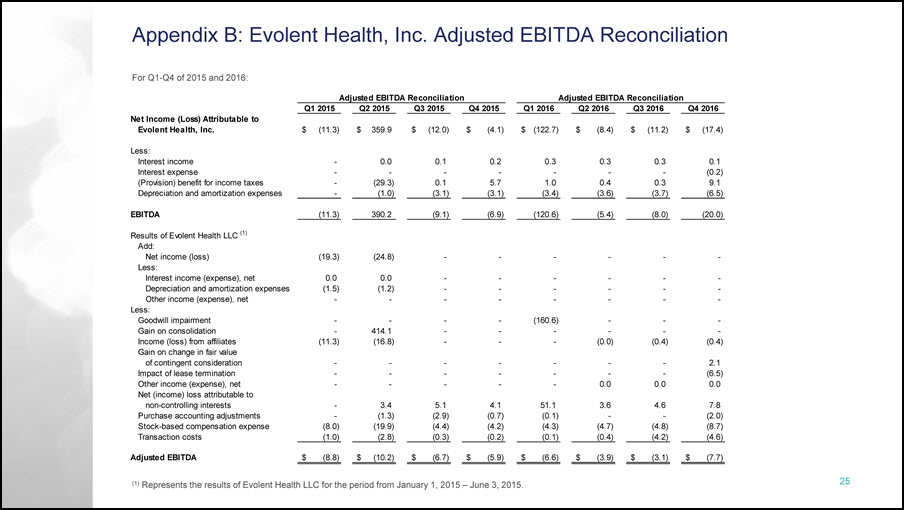
For Q1-Q4 of 2015 and 2016: Appendix B: Evolent Health, Inc. Adjusted EBITDA Reconciliation Adjusted EBITDA Reconciliation Adjusted EBITDA Reconciliation Q1 2015 Q2 2015 Q3 2015 Q4 2015 Q1 2016 Q2 2016 Q3 2016 Q4 2016 Net Income (Loss) Attributable to Evolent Health, Inc. $ (11.3) $ 359.9 $ (12.0) $ (4.1) $ (122.7) $ (8.4) $ (11.2) $ (17.4) Less: Interest income - 0.0 0.1 0.2 0.3 0.3 0.3 0.1 Interest expense - - - - - - - (0.2) (Provision) benefit for income taxes - (29.3) 0.1 5.7 1.0 0.4 0.3 9.1 Depreciation and amortization expenses - (1.0) (3.1) (3.1) (3.4) (3.6) (3.7) (6.5) EBITDA (11.3) 390.2 (9.1) (6.9) (120.6) (5.4) (8.0) (20.0) Results of Evolent Health LLC (1) Add: Net income (loss) (19.3) (24.8) - - - - - - Less: Interest income (expense), net 0.0 0.0 - - - - - - Depreciation and amortization expenses (1.5) (1.2) - - - - - - Other income (expense), net - - - - - - - - Less: Goodwill impairment - - - - (160.6) - - - Gain on consolidation - 414.1 - - - - - - Income (loss) from affiliates (11.3) (16.8) - - - (0.0) (0.4) (0.4) Gain on change in fair value of contingent consideration - - - - - - - 2.1 Impact of lease termination - - - - - - - (6.5) Other income (expense), net - - - - - 0.0 0.0 0.0 Net (income) loss attributable to non-controlling interests - 3.4 5.1 4.1 51.1 3.6 4.6 7.8 Purchase accounting adjustments - (1.3) (2.9) (0.7) (0.1) - - (2.0) Stock-based compensation expense (8.0) (19.9) (4.4) (4.2) (4.3) (4.7) (4.8) (8.7) Transaction costs (1.0) (2.8) (0.3) (0.2) (0.1) (0.4) (4.2) (4.6) Adjusted EBITDA $ (8.8) $ (10.2) $ (6.7) $ (5.9) $ (6.6) $ (3.9) $ (3.1) $ (7.7) (1) Represents the results of Evolent Health LLC for the period from January 1, 2015 – June 3, 2015.
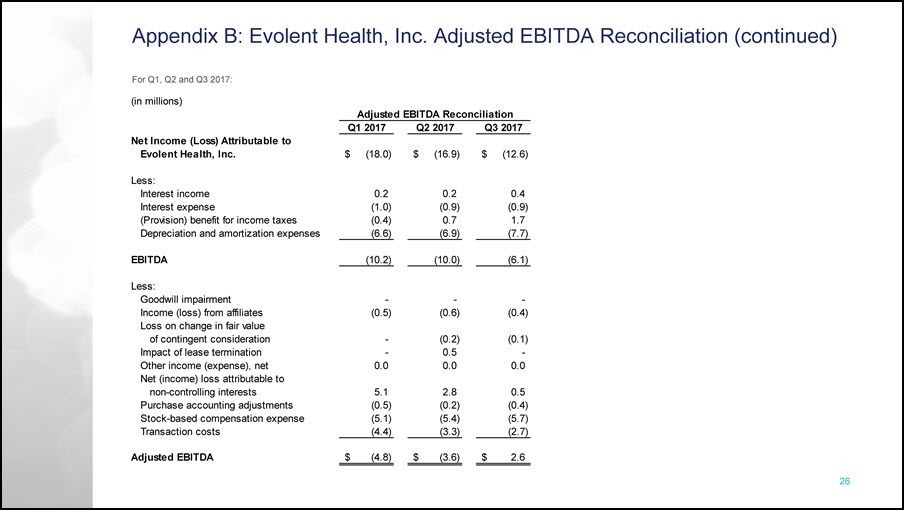
For Q1, Q2 and Q3 2017: Appendix B: Evolent Health, Inc. Adjusted EBITDA Reconciliation (continued) (in millions) Q1 2017 Q2 2017 Q3 2017 Net Income (Loss) Attributable to Evolent Health, Inc. $ (18.0) $ (16.9) $ (12.6) Less: Interest income 0.2 0.2 0.4 Interest expense (1.0) (0.9) (0.9) (Provision) benefit for income taxes (0.4) 0.7 1.7 Depreciation and amortization expenses (6.6) (6.9) (7.7) EBITDA (10.2) (10.0) (6.1) Less: Goodwill impairment - - - Income (loss) from affiliates (0.5) (0.6) (0.4) Loss on change in fair value of contingent consideration - (0.2) (0.1) Impact of lease termination - 0.5 - Other income (expense), net 0.0 0.0 0.0 Net (income) loss attributable to non-controlling interests 5.1 2.8 0.5 Purchase accounting adjustments (0.5) (0.2) (0.4) Stock-based compensation expense (5.1) (5.4) (5.7) Transaction costs (4.4) (3.3) (2.7) Adjusted EBITDA $ (4.8) $ (3.6) $ 2.6 Adjusted EBITDA Reconciliation

800 N Glebe Rd, Suite 500 • Arlington, VA 22203 • evolenthealth.com
evolent
HEALTH